Embed Size (px)
Citation preview
Reminder
• Homework is due on Thursday (posted online)• A note about ‘current events’– stuff you should
cover:• Where is the article from (blog? reliable daily like the
NYT?) What is this publication?• What is their perspective and why are they writing?• Any background information we need to know?
(you may want to decide relay this information while you are presenting the article rather than before)

Know where you are getting your info: Example of Fracking
https://www.foodandwaterwatch.org/water/fracking/
http://www2.epa.gov/hfstudy
http://www.huffingtonpost.com/2013/07/03/epa-fracking-study-pavillion-wyoming_n_3542365.html

Last two weeks
(1) Define Sustainability(2) Three principles of Sustainability(3) Panarchy Cycle(4) Ecosystem Services (5) Trade-offs in managing ecosystems(6) Increased consumption (2 reasons)

This week
(1) Continue discussion of consumption: the relationship between economic growth and environmental degradation
(2) 2 models to measure consumption/sustainability by country
(3) Pollution (2 types)(4) Tipping Points(5) The 4 causes of modern day environmental
problems(6) Environmental Policy!

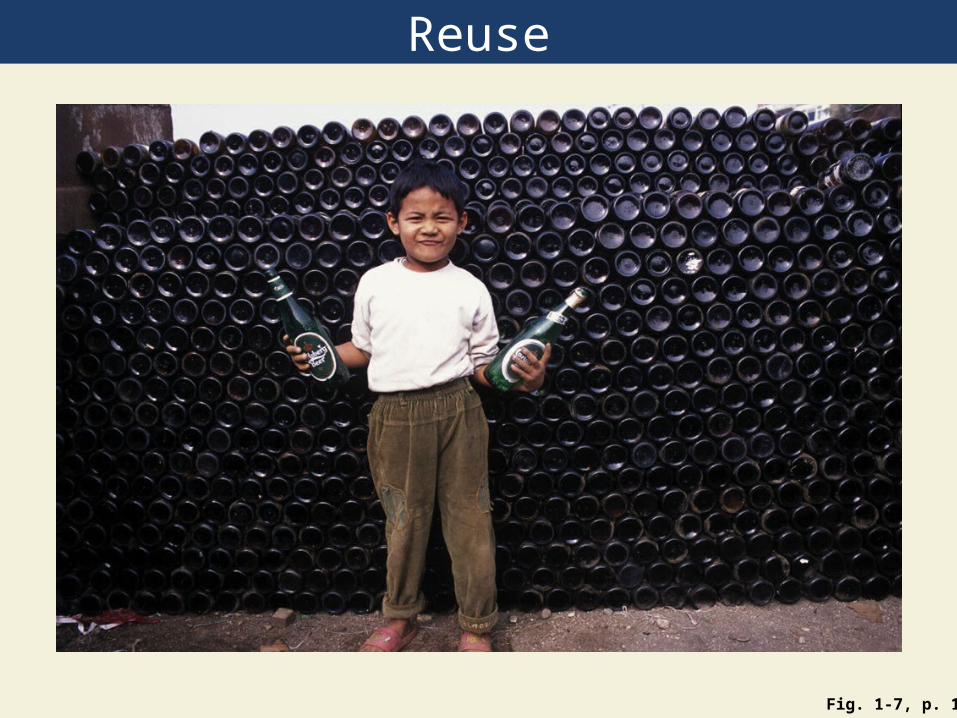
Reuse
Fig. 1-7, p. 11

Reuse
Fig. 1-7, p. 11

Recycle
Fig. 1-8, p. 12
Scientists estimate that we could recycle and reuse 80–90% of the resources that we now use and thus come closer to mimicking the way nature recycles essentially everything. Recycling is important but it involves dealing with wastes we have produced. Ideally, we should focus more on using less, reusing items, and reducing our unnecessary waste of resources.

Countries Differ in Levels of Unsustainability (1)
• Economic growth: increase in output of a nation’s goods and services
• Gross domestic product (GDP): annual market value of all goods and services produced by all businesses, foreign and domestic, operating within a country
• Per capita GDP: one measure of economic growth

How does per capita GDP vary?

How does per capita GDP vary?
Western EU
US and Canada
Oil Producing
Japan and Sing.


Countries by Gross National Income per Capita
Supplement 8, Fig 2

Countries Differ in Levels of Unsustainability (2)
GDP divides countries into 2 separate groups:•More-developed countries: North America, Australia, New Zealand, Japan, most of Europe•Less-developed countries: most countries in Africa, Asia, Latin America
Economic development: using economic growth to raise living standards

Measuring the rate resource consumption/sustainability by country
Measuring the rate resource consumption/sustainability by country Two models to measure rate resource consumption/sustainability by country (1)Ecological Footprint(2)IPAT Model

1. Ecological Footprints: A Model of Unsustainable Use of Resources
• Ecological footprint: the amount of biologically productive land and water needed to provide the people in a region with indefinite supply of renewable resources, and to absorb and recycle wastes and pollution
• Per capita ecological footprint: national ecological footprint divided by the number of people (duh.)

1-2 How Are Our Ecological Footprints Affecting the Earth?
• Concept 1-2 As our ecological footprints grow, we are depleting and degrading more of the earth’s natural capital.
Unsustainable: footprint is larger than biological capacity for replenishment

Current Events
• If you miss your current event due to class being canceled: Reschedule with Meaghan
• If you miss you current event due to personal reasons, you will not be able to make it up without doctors note (or other extenuating circumstances)
• Homework due today in class

1-2 How Are Our Ecological Footprints Affecting the Earth?
• Concept 1-2 As our ecological footprints grow, we are depleting and degrading more of the earth’s natural capital.
How do we raise quality of life without raising ecological fp?
As we raise per capita GDP and income, we raise quality of life

Patterns of Natural Resource Consumption
Fig. 1-12a, p. 15

Patterns of Natural Resource Consumption
Fig. 1-12b, p. 15

Natural Capital Use and Degradation
Fig. 1-13, p. 16

2. IPAT is Another Environmental Impact Model
I = P x A x T
• I = Environmental impact• P = Population• A = Affluence• T = Technology

IPAT Illustrated
Fig. 1-14, p. 17

IPAT Illustrated
Fig. 1-14, p. 17

Case Study: China’s New Affluent Consumers
• Leading consumer of various foods and goods• Wheat, rice, and meat• Coal, fertilizers, steel, and cement
• Second largest consumer of oil• Two-thirds of the most polluted cities are in China• Projections for next decade• Largest consumer and producer of cars
China is becoming much more affluent which ostensibly increases the quality of life but potentially with large environmental costs

We Are Living Unsustainably
• If the entire world had the consumption pattern of more developed nations environmental degradation would be accelerated…
• Environmental degradation: wasting, depleting, and degrading the earth’s natural capital largely through increased consumption across the world (but clearly more developed nations are disproportionally responsible)

Natural Capital Degradation
Fig. 1-9, p. 13

Pollution Comes from a Number of Sources (1)
• Sources of pollution• Point sources: can identify the source of the pollutant
• E.g., smokestack• Nonpoint sources: cannot identify the source of the pollutant
• E.g., pesticides blown into the air

Point-Source Air Pollution
Fig. 1-10, p. 14

Nonpoint Source Water Pollution
Fig. 1-11, p. 14

Ever heard of the great pacific garbage patch?

Microplastic concentrations in 1972–1987 and 1999–2010.
Goldstein M C et al. Biol. Lett. doi:10.1098/rsbl.2012.0298
©2012 by The Royal Society

• http://www.cnn.com/2013/03/11/us/hawaii-japan-tsunami-debris/

Natural Systems Have Tipping Points• Ecological tipping point: an often irreversible shift in
the behavior of a natural system• Environmental degradation has time delays between
our actions now and the deleterious effects later• Long-term climate change• Over-fishing• Species extinction

Tipping Point
Fig. 1-15, p. 19

Multiple Stable States: Some desirable and some not
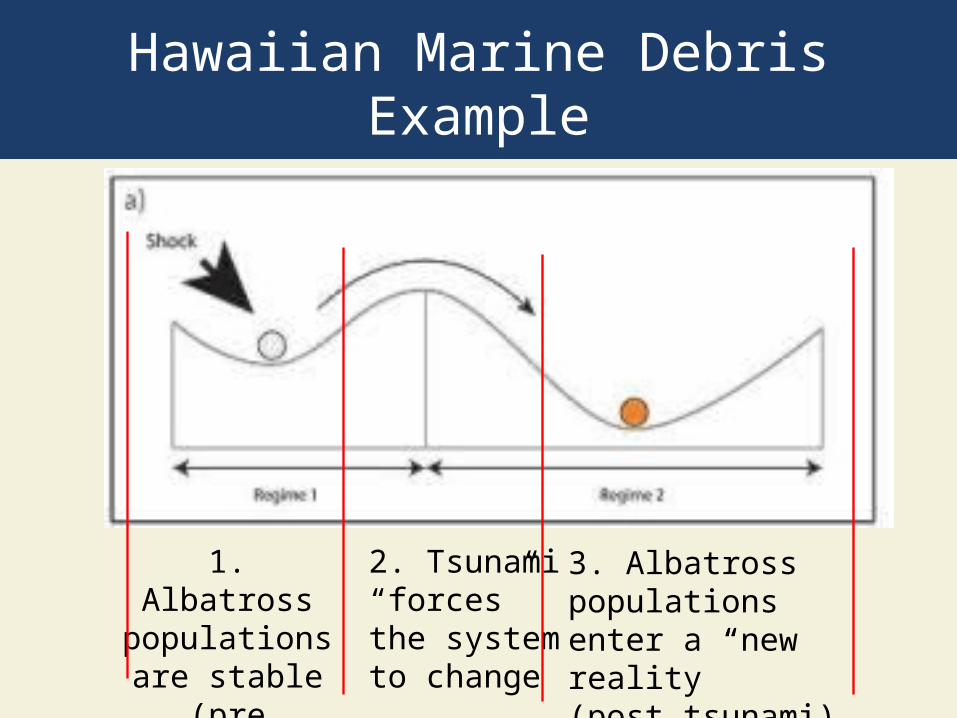
Hawaiian Marine Debris Example
2. Tsunami “forces” the system to change
1. Albatross populations are stable
(pre tsunami)
3. Albatross populations enter a “new reality” (post tsunami)

Experts Have Identified Four Basic Causes of Environmental Problems
1. Population growth
2. Wasteful and unsustainable resource use
3. Poverty
4. Failure to include the harmful environmental costs of goods and services in market prices

Experts Have Identified Four Basic Causes of Environmental Problems1. Population growth2. Wasteful and unsustainable resource use3. Poverty4. Failure to include the harmful environmental costs
of goods and services in market prices

1. Exponential Growth of Human Population
Fig. 1-18, p. 21

Technology Increases Population
Fig. 1-16, p. 19

2. Affluence Has Harmful and Beneficial Environmental Effects
• Harmful environmental impact due to• High levels of consumption• High levels of pollution• Unnecessary waste of resources
• Affluence can provide funding for developing technologies to reduce
• Pollution• Environmental degradation• Resource waste

3. Poverty Has Harmful Environmental and Health Effects
• Population growth affected• Malnutrition • Premature death• Limited access to adequate sanitation facilities and
clean water

Extreme Poverty
Fig. 1-19, p. 22
This boy is searching through an open dump in Rio de Janeiro, Brazil, for items to sell. Many children of poor families who live in makeshift shantytowns in or near such dumps often scavenge most of the day for food and other items to help their families survive.


Harmful Effects of Poverty
Fig. 1-20, p. 22

4. Prices Do Not Include the Value of Natural Capital
• Companies do not pay the environmental cost of resource use
• Goods and services do not include the harmful environmental costs
• Companies receive tax breaks and subsidies• Economy may be stimulated but there may be a
degradation of natural capital

Genuine Progress Indicator
Vector (2010) Nature

Environmentally Sustainable Societies Protect Natural Capital and Live Off Its Income
• Environmentally sustainable society: meets current needs while ensuring that needs of future generations will be met
• Live on natural income of natural capital without diminishing the natural capital

We Can Work Together to Solve Environmental Problems
• Social capital• Encourages
• Openness and communication• Cooperation• Hope
• Discourages• Close-mindedness• Polarization• Confrontation and fear

Individuals Matter
• 5–10% of the population can bring about major social change
• We have only 50-100 years to make the change to sustainability before it’s too late
• Rely on renewable energy• Protect biodiversity• Reduce waste and pollution

Three Big Ideas
• 1. We could rely more on renewable energy from the sun, including indirect forms of solar energy such as wind and flowing water, to meet most of our heating and electricity needs.
• 2. We can protect biodiversity by preventing the degradation of the earth’s species, ecosystems, and natural processes, and by restoring areas we have degraded.

Three Big Ideas
3. We can help to sustain the earth’s natural chemical cycles by reducing our production of wastes and pollution, not overloading natural systems with harmful chemicals, and not removing natural chemicals faster than those chemical cycles can replace them.