Embed Size (px)
Citation preview

REMOTE SENSING APPLICATIONS FOR ENVIRONMENTAL ANALYSIS IN TRANSPORTATION PLANNING: APPLICATION
TO THE WASHINGTON STATE I-405 CORRIDOR
Demin XiongRussell Lee
J. Bo Saulsbury
Oak Ridge NationalLaboratory
Elizabeth L. LanzerAlbert Perez
WashingtonState Department of
Transportation
August 30, 2004WA-RD-593-1
Prepared for the EnvironmentalAffairs Office, Washington State
Department of Transportation as partof the National Consortia on RemoteSensing in Transportation (NCRST)
program, Research and SpecialPrograms Administration, U.S.
Department of Transportation undercontract DTRS56-01-T-0005
Prepared byOAK RIDGE NATIONAL
LABORATORYP.O. Box 2008
Oak Ridge, Tennessee 37831-6285managed by UT-Battelle, LLC for the
U.S. DEPARTMENT OF ENERGYunder contract
DE-AC-05-00OR22725


TECHNICAL REPORT STANDARD TITLE PAGE 1. REPORT NO. 2. GOVERNMENT ACCESSION NO. 3. RECIPIENTS CATALOG NO
WA-RD 593-1
4. TITLE AND SUBTILLE 5. REPORT DATE August 30, 2004 6. PERFORMING ORGANIZATION CODE
Remote Sensing Applications For Environmental Analysis In Transportation Planning: Application To The Washington State I-405 Corridor 7. AUTHOR(S) 8. PERFORMING ORGANIZATION REPORT NO. Demin Xiong, Russell Lee, J. Bo Saulsbury, Elizabeth L. Lanzer, and Albert Perez
9. PERFORMING ORGANIZATION NAME AND ADDRESS 10. WORK UNIT NO. 11. CONTRACT OR GRANT NO.
Oak Ridge National Laboratory P.O. Box 2008 Oak Ridge, Tennessee 37831-6285 USDOT DTRS56-01-T-0005 12. SPONSORING AGENCY NAME AND ADDRESS 13. TYPE OF REPORT AND PERIOD COVERED
14. SPONSORING AGENCY CODE
Washington State Department of Transportation Environmental Office PO Box 47331 Olympia WA 98504-7331 US Department of Transportation Research and Special Programs Administration 400 7th Street, SW Washington DC 20590-0001
15. SUPPLEMENTARY NOTES This research project was part of the National Consortia on Remote Sensing in Transportation (NCRST) program, a collaborative effort between the US Department of Transportation and the National Aeronautics and Space Administration to foster the development of remote sensing applications in transportation. 16. ABSTRACT The project’s major objective is to demonstrate and assess the applicability of commercial remote sensing products and spatial information technologies to environmental analysis in transportation planning, using the I-405 corridor in Washington State as a test case. The project consisted of six major tasks: 1) Undertake field study in two stages, first to collect ground-truth data prior to image analysis, and then to evaluate the image-analysis results against the “real-world.” 2) Compile and evaluate available image data and fuse these data to create the best possible resource for image data analysis. 3) Characterize land use and land cover in the region by using ERDAS’s IMAGINE imaging processing software and customized software procedures for land cover classification on the image data. 4) Integrate the land use and land cover characterization from the previous task with geographic information systems (GIS) and other data to provide land use/land cover and transportation images, and related analysis, to support the NEPA process. 5) Develop estimates and compare the cost, value, and usefulness of information developed using

conventional NEPA-study methods with those developed in this project. 6) Document the procedures, analysis, and findings to institute technology transfer steps for future NEPA analyses. The major products of this project include:
a) A spatial database of image data from a variety of remote sensing sources, and derived and interpreted information in GIS format, including land use and land cover information;
b) Software procedures that access multiple remote sensing and GIS (RS/GIS) data
sources to derive land use and land cover information, and identify and delineate areas where proposed transportation development might cause adverse environmental impacts;
c) Results of a case study of the costs, value, and usefulness of products derived from
conventional data-gathering practices, compared to those developed in this study, based on the assessments of professionals who participated in the actual I-405 corridor Environmental Impact Statement process; and
d) This report, which documents the methods and results of the research, and a companion
guidebook on procedures for developing remote sensing - geographic information system (RS/GIS) products.
17. KEY WORDS 18. DISTRIBUTION STATEMENT Transportation, Remote Sensing, NEPA, Land Use Land Cover Mapping, Environmental Assessment, I-405 Corridor
No restrictions. This document is available to the public through the National Technical Information Service, Springfield, VA 22616.
19. SECURITY CLASSIF. (of this report) 20. SECURITY CLASSIF. (of this page) 21. NO. OF PAGES 22. PRICE None None 95

iii
TABLE OF CONTENTS
EXECUTIVE SUMMARY .................................................................................................. v 1. INTRODUCTION...........................................................................................................1
1.1 Background, Purpose, and Overview of the Research Project............................1 1.2 Washington State I-405 Corridor Study and NEPA Reinvention .........................2 1.3 Overview of this Report........................................................................................3
2. ENVIRONMENTAL ANALYSIS, TRANSPORTATION PLANNING, AND REMOTE SENSING APPLICATIONS......................................................................................4
2.1 National Environmental Policy Act (NEPA) Implications for Environmental Assessment in Transportation Planning...................................................................4 2.2 Environmental Streamlining .................................................................................6 2.3 NCRST-E: The Potential and the Challenges in Using Remotely Sensed Data for Environmental Assessment in Transportation Planning......................................8
3. DATA COLLECTION...................................................................................................12 3.1. Data Requirements ...........................................................................................12 3.2. Remotely Sensed Imagery and GIS Data Sources...........................................16 3.3. Data Preprocessing and Preparation................................................................20
4. IMAGE PROCESSING AND LULC CLASSIFICATION ..............................................21 4.1. Technical Approaches ......................................................................................21 4.2. Land Use and Land Cover Classes ..................................................................22 4.3. Ground Truthing and Field Trips .......................................................................22 4.4. Image Processing for LULC Classification........................................................25
4.4.1. Supervised Classification ...........................................................................26 4.4.2. Texture Analysis.........................................................................................27 4.4.3. The Use of Existing GIS Data Layers.........................................................27 4.4.4. Manual Analysis and Classification Improvement ......................................29
4.5. LULC Classification Results and Evaluation.....................................................29 4.5.1. LULC Classification Results .......................................................................29 4.5.2. LULC Classification Result Evaluation .......................................................30
5. DATA ANALYSIS AND PRESENTATION ..................................................................32 5.1. General Approaches.........................................................................................34 5.2. Data Preparation for Environmental Assessment Disciplines...........................35
5.2.1. Environmental Justice ................................................................................35 5.2.2. Farm Land..................................................................................................36 5.2.3. Fish/Aquatic Habitat ...................................................................................36 5.2.4. Floodplains .................................................................................................36 5.2.5. Land Use....................................................................................................37 5.2.6. Recreation ..................................................................................................37 5.2.7. Shorelines ..................................................................................................38 5.2.8. Surface Water Resources ..........................................................................38 5.2.9. Transportation ............................................................................................39 5.2.10. Upland Vegetation/Habitat/Wildlife...........................................................39 5.2.11. Wetlands ..................................................................................................39
5.3. Statistical Data Generation for Drainage Basins...............................................40 6. VALUE AND USEFULNESS OF RS/GIS PRODUCTS .............................................41
6.1 Assessing the Value and Usefulness of RS/GIS Products ................................41 6.2 Information Attributes.........................................................................................43 6.3 Compiling Information on Costs.........................................................................45

iv
6.4 Developing Information on the Value of the RS/GIS Products ..........................49 6.5 Usefulness of Remote Sensing Products for Environmental Analysis and Transportation Planning .........................................................................................56
7. CONCLUSIONS, CAVEATS, AND RECOMMENDATIONS .......................................61 APPENDICES.................................................................................................................67
Appendix A. EIS Disciplinary Maps and Statistics ...................................................68 Appendix B. Survey Protocol and Form...................................................................85
REFERENCES................................................................................................................92

v
REMOTE SENSING APPLICATIONS FOR ENVIRONMENTAL ANALYSIS IN TRANSPORTATION PLANNING: APPLICATION TO THE
WASHINGTON STATE I-405 CORRIDOR Oak Ridge National Laboratory Demin Xiong
Russell Lee J. Bo Saulsbury
Washington State Department of Transportation Elizabeth Lanzer
Albert Perez
EXECUTIVE SUMMARY This research project is part of the National Consortia on Remote Sensing in Transportation (NCRST) program. The U.S. Department of Transportation’s (U.S. DOT) Research and Special Programs Administration (RSPA) established the NCRST to foster the development of remote sensing applications in transportation. The Washington State Department of Transportation (WSDOT) partnered with the Oak Ridge National Laboratory, ERDAS, Inc., Space Imaging, the U.S. Environmental Protection Agency, Wisconsin DOT, and the Puget Sound Regional Council to initiate this remote sensing project to support state and federal goals of finding faster and better ways of completing the environmental assessment processes required for transportation corridors like Washington State’s I-405 Corridor. The Washington State I-405 Corridor Program considers a package of transportation improvements that will address the corridor’s future transportation needs. The corridor development program includes over 150 individual projects. There are many complex environmental issues in the region, which has some of the most stringent state and local environmental regulations in the nation. The environmental assessment processes, under the National Environmental Policy Act (NEPA), were initiated in1998 and completed in 2002. The project’s major objective is to demonstrate and assess the applicability of commercial remote sensing products and spatial information technologies to environmental analysis in transportation planning, using the I-405 corridor in Washington State as a test case. The project consisted of six major tasks: 1) Undertake field study in two stages, first to collect ground-truth data prior to image analysis, and then to evaluate the image-analysis results against the “real-world.” 2) Compile and evaluate available image data and fuse these data to create the best possible resource for image data analysis. 3) Characterize land use and land cover in the region by using ERDAS’s IMAGINE imaging processing software and customized software procedures for land cover classification on the image data. 4) Integrate the land use and land cover characterization from the previous task with geographic information systems (GIS) and other data to provide land use/land cover and transportation images, and related analysis, to support the NEPA process. 5) Develop estimates and compare the cost, value, and usefulness of information developed using conventional NEPA-study methods with those developed in this project. 6) Document the procedures, analysis, and findings to institute technology transfer steps for future NEPA analyses.

vi
The major products of this project include:
a) A spatial database of image data from a variety of remote sensing sources, and derived and interpreted information in GIS format, including land use and land cover information;
b) Software procedures that access multiple remote sensing and GIS (RS/GIS) data
sources to derive land use and land cover information, and identify and delineate areas where proposed transportation development might cause adverse environmental impacts;
c) Results of a case study of the costs, value, and usefulness of products derived
from conventional data-gathering practices, compared to those developed in this study, based on the assessments of professionals who participated in the actual I-405 corridor Environmental Impact Statement process; and
d) This report, which documents the methods and results of the research, and a
companion guidebook on procedures for developing remote sensing - geographic information system (RS/GIS) products.
The project made use of Landsat 7 Enhanced Thematic Mapper Plus (ETM+) imagery as the primary data source for spectral analysis, complemented with broadly available data such as TIGER files and the U.S. Geological Survey’s Land Use / Land Cover maps, and with orthophotos and digital elevation models (DEM) from work done by associated projects. Supervised image processing methods were used, together with ancillary GIS data and manual interpretation, to provide a preliminary land use / land cover classification that had an overall accuracy of 80%. This preliminary classification was enhanced and integrated with existing data to generate four types of land use / land cover layers: 1) Land Cover Emphasis 2) Land Use Emphasis 3) Wetland Emphasis, and 4) Recreation Emphasis. To facilitate EIS purposes, the derived land use / land cover information was then utilized with existing GIS layers to prepare a set of environmental discipline maps. A guidance document has been prepared as a complement to this report to assist others with the technical methods used for this work. Maps and basic land cover acreage calculations were prepared for use in evaluation “interviews” comparing the actual maps used in I-405 environmental-discipline reports with what the RS/GIS products could provide, either as a replacement or in addition to the conventional mapping. A website with comparison materials and a survey form were posted to gather feedback from stakeholders who had participated in the I-450 corridor work. Feedback was also solicited from DOT staff in other states. The contractor team that prepared the discipline reports submitted reviews for the reports they wrote. There were a total of thirteen responses to the survey. The conventional mapping and the RS/GIS mapping were compared in terms of their: a) attributes – nature of the information itself; b) costs – production expenditures; c) value – relative worth to the purpose; and d) usefulness – comparable, supplementary, or complementary to the conventional mapping. Assessment of attribute comparisons showed that, for most disciplines, the RS/GIS maps included more information types. Cost estimates for discipline report production were collected from the contractor team that prepared the discipline reports. Estimates of the costs to prepare the remote sensing products were also developed. These cost estimates cover significantly different

vii
activities; thus comparison is not straightforward. Overall, the cost of the RS/GIS products for eleven disciplines was $66,400, compared to the total cost of completing these eleven disciplines for the draft EIS, which was over $844,000. The latter include the cost of writing the draft EIS report itself. It would likely not be cost-effective to develop RS/GIS products for only one or two disciplines. The cost of doing so would be almost as great as the cost of the RS/GIS products for all eleven disciplines. On the other hand, the greater the number of environmental disciplines, the more cost-effective this type of analysis can be. Estimating the value of the RS/GIS products varied by the type of respondent and by discipline. The I-405 stakeholders and other state DOT respondents typically valued the RS/GIS data more than did the discipline-report contractor team. The difference between their respective assessments could reflect the EIS preparers' perceptions that RS/GIS products would be a "new way" of performing such tasks and an added, unnecessary expense for them, while the stakeholders and other state DOT respondents could perceive added value in these products beyond simply fulfilling the requirements of a single EIS. The most agreement among the respondents was on the land use (high value) and the transportation (moderate value) disciplines. Evaluating the responses to this question led the project team to suggest refinements to the survey instrument to make clear whether the respondents are providing estimates of the additional, incremental value of the RS/GIS products, as a supplement to conventional maps, or of their total value, as a substitute or replacement for them. Another refinement to the survey would be to obtain information about the value of other benefits of these products, such as their use in future site-specific EIS's or other public use. These suggested refinements and the limited number of respondents limit any quantitative interpretations as to the overall value of the RS/GIS products. However, the narrative comments of the survey respondents indicate a general positive reaction to the contribution that the RS/GIS products make toward visualizing study conditions in most disciplines. Assessment of the usefulness of the RS/GIS products compared to the conventional products was done by assessing the appropriateness of the level of detail and assessing how well the RS/GIS products could replace, improve, or complement the conventional products. Again, the responses vary by discipline and by the role of the respondent in the actual I-405 work. The most agreement on the appropriate level of detail was on land use and transportation. The majority of the responses indicated that the RS/GIS products would not have led to a different assessment of environmental impacts. However, several narrative comments suggested that the RS/GIS products might have helped to better communicate those impacts. Virtually all respondents made it clear that NEPA analysis goes far beyond compiling, displaying, and statistically summarizing spatial data so that even if the RS/GIS products were superior, they would unlikely alter the basic conclusions in the EIS. Clearly, generalizations about the value of RS/GIS products, relative to their costs, cannot be drawn from a single case study. Furthermore, study results should not be generalized to other remote sensing technologies, or to other regions whose environments are greatly different from the I-405 area. Notwithstanding these caveats, most responses were generally positive about the value and usefulness of the RS/GIS products. We hope that the results will be sufficiently enlightening to help WSDOT and other environmental and transportation agencies in their planning for the development and use of some of these methods.

1
REMOTE SENSING APPLICATIONS FOR ENVIRONMENTAL
ANALYSIS IN TRANSPORTATION PLANNING: APPLICATION TO THE WASHINGTON STATE
I-405 CORRIDOR1
1. INTRODUCTION
1.1 Background, Purpose, and Overview of the Research Project
This research project is part of the National Consortia on Remote Sensing in Transportation (NCRST) program. The U.S. Department of Transportation’s (U.S. DOT) Research and Special Programs Administration (RSPA) established the NCRST to foster the development of remote sensing applications in transportation. The NCRST has four thrusts: environmental assessment; infrastructure; transportation flow modeling; and hazards, safety, and disaster assessment. This research project is part of the environmental assessment consortium, NCRST-E. The general purpose of the project was to help bridge the gap between remote sensing technologies and their application in environmental assessment for transportation planning. CH2M HILL (2000) had previously assessed that remote sensing technologies could improve consideration of environmental concerns in transportation decisions. King and O’Hara (no date - a) recognized that if environmental assessments are to make use of remote sensing technologies, then they must be proved to be credible by using broadly acceptable performance measures and benchmarks. This project sought to respond to this challenge by:
a) using remote sensing technologies and available data to develop methods that create maps and related information that could be used to meet requirements for a programmatic transportation corridor environmental impact statement (EIS), as required under the National Environmental Policy Act (NEPA); and
b) undertaking a case study to assess the value and usefulness of such
remote sensing/geographic information system products, compared to a benchmark of conventional map products that were actually used in a Draft Environmental Impact Statement (DEIS).
1 Material in this report draws on draft reports, conference presentations, and other notes written as part of this research study, including Lanzer et al. (2002), Lee et al. (2003), and Xiong et al. (2002a,b).

2
Figure 1.1 – Map of I-405 Corridor
The research study was carried out in the context of the DEIS for the I-405 Corridor study in the State of Washington (FHWA et al., 2001). In particular, the research study focused on developing and implementing methods of using commercially available remote sensing software that facilitate land use and land cover classification.
1.2 Washington State I-405 Corridor Study and NEPA Reinvention
I-405 is a 30-mile freeway that runs in a north-south direction, east of Seattle, Washington. It was constructed in the early 1960’s as a bypass around Seattle. Over the years, I-405 has changed dramatically from a Seattle bypass to the second most traveled corridor in Washington State. By 2020, travel delay in the evening rush hour is expected to increase 250% on I-405, and 350% on local arterials. Between 1970 and 1990, employment in the area increased 200 percent while the population increased 66 percent. More than two-thirds of trips on I-405 begin and end in the corridor itself. By 2020, occurrence of congestion on I-405 is expected increase from 1.5 hours to almost 6 hours per day. The Washington State I-405 Corridor Program is considering a package of transportation improvements that will address the corridor’s future transportation needs. The primary study area extends one to three miles on either side of I-405,
between Tukwila and Lynnwood (Figure 1.1). The corridor development program includes over 150 individual projects. There are many complex environmental issues in the region, which has some of the most stringent state and local environmental regulations in the nation. The watershed provides habitat for salmon species listed on the endangered and threatened species lists, and any remaining undeveloped areas are mostly protected. The I-405 Corridor is a NEPA Reinvention Pilot Project in Washington State funded by the Federal Highway Administration (FHWA). The goal of this project is for the Washington State Department of Transportation (WSDOT), in cooperation with federal, state, local, and tribal

3
governments, to develop a process that will integrate environmental compliance under NEPA into early transportation planning. To support the goals of finding faster and better ways of completing the environmental assessment processes required for transportation corridors, WSDOT partnered with the Oak Ridge National Laboratory, ERDAS, Inc., Space Imaging, the U.S. Environmental Protection Agency, Wisconsin DOT, and the Puget Sound Regional Council to initiate this remote sensing project. The project was funded by the National Aeronautics and Space Administration and the U.S. Department of Transportation joint research Program on Remote Sensing Applications in Transportation.
1.3 Overview of this Report This remote sensing project consisted of six major tasks: 1) Undertake field study in two stages, first to collect ground-truth data prior to image analysis, and then to evaluate the image-analysis results against the “real-world.” 2) Compile and evaluate available image data and fuse these data to create the best possible resource for image data analysis. 3) Characterize land use and land cover in the region by using ERDAS’s IMAGINE geographic imaging software and Oak Ridge National Laboratory’s texture-analysis software for land cover classification on the image data. 4) Integrate the land use and land cover characterization from the previous task, with GIS and other data, to provide land use/land cover and transportation images, and related analysis, to support the NEPA process. 5) Develop estimates and compare the cost, value, and usefulness of information developed using conventional NEPA-study methods with those developed in this project. 6) Document the procedures, analysis, and findings to institute technology transfer steps for future NEPA analyses. This report documents results of this research project. Following this introductory section, which provides the background and objectives of the study and describes the I-405 transportation project, Section 2 discusses environmental assessment and transportation planning, initiatives to streamline this process, and the efforts of the NCRST-E consortium to promote the application of remote sensing methods to support environmental streamlining in transportation. Section 3 describes data collection activity to support the use of remotely sensed imagery (Tasks 1 and 2). Section 4 describes land use-land cover classification methods developed, and their application to environmental assessment in transportation planning (Task 3). Section 5 describes the integration of remotely sensed data with other data, and their presentation in formats suitable for environmental assessments (Task 4). Section 6 describes a case study of the costs and value of using remotely sensed data, in combination with geographic information systems, for environmental assessments under NEPA (Task 5). This document and the companion “Guidance” document (Xiong et al. 2003) fulfill Task 6. The major products of this project include:

4
a) A spatial database of image data from a variety of remote sensing sources, and derived and interpreted information in GIS format, including land use and land cover information;
b) Software procedures that access multiple data sources to derive land use
and land cover information, and identify and delineate areas where proposed transportation development might cause adverse environmental impacts;
c) Results of a case study of the costs, value, and usefulness of products
derived from conventional data-gathering practices, compared to those developed in this study; and
d) This report documenting the methods and results of the research, and a
companion guidebook on procedures for developing remote sensing - geographic information system (RS/GIS) products.
2. ENVIRONMENTAL ANALYSIS, TRANSPORTATION PLANNING, AND REMOTE SENSING APPLICATIONS
To close the knowledge gap about the use of remote sensing technology in transportation, David Ekern (2001), an official at the American Association of State Highway and Transportation Officials (AASHTO), suggested that:
• Remote sensing experts need to understand public transportation agencies, and
• Transportation agencies need to become knowledgeable of remote sensing products.
This research study aimed to address these challenges by developing and assessing products developed using RS/GIS methods, in the specific context of the I-405 corridor study, and by assessing the value of these products to their users. This section provides the context for this research project. Section 2.1 summarizes NEPA and its implications for environmental assessment in transportation planning. Individuals and organizations that either develop or use environmental information to comply with NEPA are the potential users of RS/GIS products. Section 2.2 describes the concept of environmental streamlining. Section 2.3 discusses NCRST-E and some of the projects relevant to this project.
2.1 National Environmental Policy Act (NEPA) Implications for Environmental Assessment in Transportation Planning

5
The U.S. Congress passed the National Environmental Policy Act of 1969 (NEPA) which requires that prior to undertaking major Federal actions that could significantly affect the quality of the environment, the responsible Federal agency shall provide a detailed environmental impact statement on –
(i) the environmental impact of the proposed action, (ii) any adverse environmental effects which cannot be avoided should the
proposal be implemented, (iii) alternatives to the proposed action, (iv) the relationship between local short-term uses of man's environment and
the maintenance and enhancement of long-term productivity, and (v) any irreversible and irretrievable commitments of resources which would
be involved in the proposed action should it be implemented. The selection and environmental assessment of potential routes or corridors is one of the most expensive and time-consuming aspects of early transportation project planning. Alternative routes and designs are evaluated not only on how well transportation objectives are met, but also on the degree to which significant negative environmental and socioeconomic impacts are minimized. NEPA generally requires extensive data collection to obtain information about potentially affected environmental resources, for alternative transportation projects. To be credible, NEPA analyses should use good quality data. Remotely sensed data could contribute to improving the NEPA review process by providing a credible baseline of information to evaluate alternatives early in the process and eliminating unnecessary and costly detailed analysis. Washington State’s I-405 Plan offers an opportunity to fix and enhance environmental resources in the corridor. It is anticipated that many environmental and natural habitat conditions will continue to suffer if left alone without enhancements proposed by the I-405 project. In addition to retrofitting the freeway to open blocked fish passages and to prevent water runoff into sensitive areas, the project will have the opportunity to rehabilitate and create wetlands and streams. As required by NEPA, the I-405 Corridor Program Environmental Impact Statement (EIS) was recently completed. An EIS provides the public and decision-makers with all relevant information related to the impacts of proposed transportation improvements. The I-405 programmatic EIS compared how well transportation alternatives optimized the performance of I-405 (WSDOT 2003). The EIS also identified community and environmental impacts and potential mitigation measures. The Final EIS includes all public comments received during the Draft EIS public comment period. The purpose of the DEIS was to give the public a comprehensive overview of the considered alternatives and to disclose the benefits and impacts of each alternative.

6
2.2 Environmental Streamlining This section discusses the concept of “environmental streamlining” and initiatives at both the federal and state levels to institute environmental streamlining into the environmental assessment and transportation processes. Environmental streamlining is the term used for a strategy for improving the timely delivery of transportation projects together with the protection and enhancement of the environment. A web site describes the U.S. Department of Transportation’s efforts to promote this idea and much of the discussion on federal initiatives in this area are taken from this site: http://www.fhwa.dot.gov/environment/strmlng/index.htm2 With the Transportation Equity Act for the 21st Century, TEA-21, environmental streamlining was enacted into legislation in 1998 for highway and transit projects. Environmental streamlining consists of cooperatively establishing realistic project development time frames among transportation and environmental agencies, and then working together to adhere to those time frames by identifying and resolving common, overlapping, and conflicting requirements among different jurisdictions and agencies. Major transportation projects are affected by dozens of federal, state, and local environmental requirements administered by a multitude of agencies. Thus, improved interagency cooperation is critical to the success of environmental streamlining. Objectives of environmental streamlining are:
• Expedited transportation project delivery, • Integrated review and permitting processes that identify key decision
points and potential conflicts as early as possible, • Full and early participation by all relevant agencies that must review a
highway construction or transit project, that must issue a permit, license, or opinion relating to the project,
• Coordinated time schedules for agencies to act on project decisions, • Dispute resolution procedures to address unresolved project issues, and • Improved NEPA decision making.
Efforts currently underway within the U.S.DOT focus on solidifying interagency partnerships through a series of actions that include pilot efforts, process reinvention, alternative dispute resolution, and a focus on performance evaluation. FHWA has supported two major inquiries into the question of "How long does the environmental process for transportation projects take?" The first, entitled "Evaluating the Performance of Environmental Streamlining: Development of a NEPA Baseline for Measuring Continuous Performance," examined the time required for approval of 100 transportation projects from the 1970s to the 1990s, measured from the start of the environmental process to the completion and
2 Web site addresses were valid during the term of our study (2001-2003) but are subject to change.

7
approval of each project's Final Environmental Impact Statement. For these 100 projects, the average length of time to prepare an EIS pursuant to NEPA was 3.6 years. The study report is available at www.fhwa.dot.gov/environment/strmlng/baseline/index.htm. The "phase II" NEPA Baseline Study examined a number of variables affecting the NEPA EIS process for their impact to the process' delivery time. The results of this investigation are forthcoming. A collection of eight case studies of projects that completed their EISs in less than three years comprises a set of "best practices" that can help improve other projects’ NEPA process. In the State of Washington, the Environmental Permit Streamlining Act (EPSA) was passed in May 2001 to streamline environmental permit decision-making.3 FHWA is a (non-voting) member of the Transportation Permit Efficiency and Accountability Committee (TPEAC), created by the Act to oversee the permit process. The goals of TPEAC are to:
• Reduce the cost of environmental mitigation, • Increase environmental benefit, • Reduce the redesign of transportation projects, • Reduce the time required to obtain permits, and • Increase the number of project permits that receive programmatic
approval.
WSDOT has engaged the natural resource agencies and state decision-makers to work cooperatively to establish common goals, minimize transportation project delays, and develop consistency among the applicable environmental standards. Four projects have been proposed initially by WSDOT to begin the implementation of the EPSA; three of the projects fund the work of TPEAC subcommittees, while the fourth, "Cost Benefit Information", has been selected to develop performance measures for TPEAC process. Progress on three of the projects is as follows:
• Watershed-Based Stormwater Alternative Mitigation Pilot Project - An interdisciplinary, technical team has been selected to: a) complete the draft watershed-based mitigation methods for the SR 522 project, and b) document all results, including applicability to other states/agencies. A summary report has been produced that describes the transportation project, identifies a list of watershed-based mitigation sites suitable for use for the SR 522 project, and compares this watershed-based approach to mitigation against more traditional methods.
3 Discussion of environmental streamlining in Washington State is taken from information on WSDOT (2003) web sites, http://www.wsdot.wa.gov/environmental/regcomp/nepa/nepa_summary.htm and http://www.wsdot.wa.gov/environment/streamlineact/default.htm.

8
• TPEAC One-Stop Subcommittee - This subcommittee is to develop a recommendation for a one-stop permit process. A request for proposals for the selection of consultant services has been issued to assist in this task.
• TPEAC Planning Subcommittee - this assembly of over 20
representatives of local, resource, transportation, and other agencies meets monthly. Products of the subcommittee are likely to include interagency agreements for addressing growth and development between transportation and natural resource agencies.
In March 2003, the Washington State Legislature reauthorized the Environmental Permit Streamlining Act (RCW 47.06) to coordinate and streamline the environmental permitting process for transportation projects. A pilot project, to be chosen soon, will test early-action mitigation processes using a watershed approach. Laymon et al. (2001) noted that although the data and information issue is but a small part of the overall streamlining effort, the U.S. DOT is seeking to determine whether remote sensing technologies could contribute to streamlining the environmental assessment process.
2.3 NCRST-E: The Potential and the Challenges in Using Remotely Sensed Data for Environmental Assessment in Transportation Planning
The NCRST program was initiated in response to Section 51.13 of TEA-21, which stated that, “The Secretary shall establish and carry out a program to validate commercial remote sensing products and spatial information technologies for application to national transportation infrastructure development and construction.” As previously mentioned, there are four thrusts to the NCRST: environmental assessment; infrastructure; transportation flow modeling; and hazards, safety, and disaster assessment. The goals of the environmental assessment consortium (NCRST-E) were to (King and O’Hara):
• “Develop innovative remote sensing technology solutions for assessing the implications of transportation on the natural environment and protecting and enhancing the environment.
• Assess and plan, in particular the capabilities of new high resolution, multi-spectral sensors, and develop the tools necessary to extract information content from remote observations in an efficient manner.
• Streamline and standardize data processing for information necessary to meet federal and state environmental regulations and requirements.
• Increase the awareness and understanding of remote sensing technologies and products through workshops and educational materials.”

9
A National Cooperative Highway Research Program report by CH2M HILL (2000) offered the assessment that remote sensing technologies combined with spectral analysis and GIS modeling could create a powerful screening tool for transportation corridor or regional evaluation. Discussions about the potential use of remote sensing technologies in transportation analysis took place at a conference on Remote Sensing for Transportation held in the year 2000 (TRB 2000). The discussions suggested many opportunities as well as challenges for remote sensing applications in transportation. Summarizing the discussions of a breakout session at the conference, Oman (2000) listed several areas which remote sensing applications could be useful: helping to streamline the NEPA process, watershed assessments; wetlands, water quality, and storm water issues; land use changes; environmental justice; and several others. She also noted that two-way education is essential. According to the discussion, the remote-sensing community needs to understand transportation environmental issues better, and transportation professionals need more information about remote-sensing tools and techniques (an often-repeated theme). King and O’Hara (2002) reviewed several NCRST-E projects and their potential use in environmental assessment and planning. In addition to this study on I-405 in Washington State, they summarized a study of Corridor 7 from Memphis, Tennessee to Atlanta, Georgia. King and O’Hara (2002) discussed land cover classification from Landsat data as a source of information to advise the public of the proposed action. They noted that Landsat data at 30 m resolution is suitable for general land cover classification, but that high resolution multispectral data are better suited for more detailed mapping. O’Hara’s (2001) analysis focused on identifying and mapping wetland features that occur in agricultural areas. He used high-resolution hyperspectral image data and high resolution Light Detection and Ranging (LIDAR) data to identify areas in Randolph County, North Carolina with a high likelihood of being wetlands. Vegetation classifications, neighborhood analysis, digital elevation, hydrologic information, data on hydric soils, and data fusion methods were used to produce indicators of the likelihood of wetland areas. Figure 2.1 shows some results of his analysis. Areas with a high probability of being wetlands are identified in dark orange, and compared to “actual” wetlands identified by blue-circled areas. King and O’Hara (2001) carried out another study involving fieldwork and hyperspectral data collection for wetland mapping in Eddyville, Iowa. Image data were obtained with a compact airborne spectrographic imager (CASI) sensor flown by ITRES Corporation. The impetus for this wetland study was the political problems that emerged from moving too hastily on a big transportation project without adequate environmental information (Abbett et al. 2001).

10
Figure 2.1. Example of Using Soil, Hydrology, Vegetation,
and Elevation Data to Delineate Wetland Areas O’Hara et al. (2002) made use of remote sensing technologies in an environmental assessment of the impacts of relocating segments of the CSX railroad out of significant population growth areas along the environmentally sensitive Mississippi Gulf Coast. They described the use of U.S. Geological Survey Multi-Resolution Land Characteristics 1992 data set and the Mississippi Automated Resource Information System (MARIS) to generate land cover data and maps. Land cover classification maps, following a modified Anderson et al. (1976) classification scheme, were developed using Landsat 5 scenes. Normalized difference vegetation index (NDVI) and Tassel Cap Transform algorithms were used on the data to highlight specific land cover classes (Figure 2.2). A joint U.S. Environmental Protection Agency – University of Florida project developed a model to identify potential greenways and trails in Florida (Durbrow et al. 2000). That project developed the modeling protocol to design landscaping linkages and prioritize ecological hubs. This project identified regionally significant lands that would aid in protecting water resources, wetlands, and other natural areas. Two Technology Assessment Projects (TAPs) associated with NCRST-E specifically investigated the use of remotely sensed data and geospatial technology in environmental assessment and streamlining. In North Carolina, EarthData evaluated opportunities to use remote sensing data to streamline the environmental assessment process. In both cases, the research considered uses of remote sensing technologies that could be useful for detecting environmental features of interest for transportation corridor studies – much like the I-405 case being considered in our study.

11
Figure 2.2. Example of Land Cover Classification in the Mississippi Automated
Resource Information System (MARIS): Rankin County, Mississippi ICF Consulting and Veridian ERIM International worked with Virginia State DOT to investigate streamlining opportunities as part of an assessment of a new highway segment in Virginia. IKONOS images were analyzed for the presence of wetland vegetation. GIS was used to analyze the relationship between the vegetative cover and other features that contribute to there being a wetland. The study concluded that high-resolution images, combined with soils data and other information could be used to predict the presence of wetlands as defined by the Corps of Engineers under Section 404 of the Clean Water Act. The study teams also noted other applications including the identification of impermeable surfaces. Transportation projects are associated with an increase in surface runoff that results from the transportation infrastructure. High-resolution imagery were used to identify and classify impermeable surfaces (King and O’Hara no date) Laymon et al. (2001) provide an excellent review of the NEPA EIS process. They also suggest that remote sensing can be a valuable source of information for the process. Of the twenty-five environmental impact areas that the FHWA recommends addressing in an EIS, Laymon et al. (2001) discuss several environmental-discipline categories as candidates for remote sensing in some capacity:
• Land use – combining published socioeconomic data with land cover classifications, the latter from commercial high resolution multispectral data;
• Farmland – identifying farmland in relation to adjacent land and proposed transportation project alternatives;
• Coastal zone and barrier – using remote sensing to update maps of the highly dynamic, rapidly changing coastal environment;

12
• Floodplain – using LIDAR and IFSAR (Interferometric Synthetic Aperture Radar) technologies to collect topographic information to delineate floodplains;
• Wetlands – acquiring imagery (preferably early in the growing season before canopy closure due to leaf emergence) using multispectral imagery to distinguish water from adjacent terrain and wetland vegetation in combination with soil and elevation data;
• Water body and wildlife – identifying the location and extent of water body modifications;
• Threatened or endangered species – using multispectral remote sensing to identify biomes or assemblages of vegetation species, potential habitats, and their location and potential fragmentation;
• Historic and archaeological preservation – searching for and analyzing Native American ceremonial mounds and canals;
• Relocation impacts – combining imagery with socioeconomic data to identify residences and businesses;
• Water quality – using remote sensing to detect changes in water temperature, productivity, turbidity, and aquatic vegetation; and
• Air quality – remote sensing of particulate aerosols in the atmosphere. Laymon et al. (2001) also pointed out that there is a great challenge to gaining broad acceptance and use of remotely sensed imagery; and that skepticism, unfamiliarity, cost, capital equipment, and human resource needs are impediments to its broader use. Our research project sought to contribute to NCRST-E’s mission of addressing some of these challenges.
3. DATA COLLECTION Data collection can be very expensive given the large amounts of data required for the Environmental Impact Statement (EIS) process. To balance information requirements and costs, sensible decisions must be made on the use of remotely sensed data. In this section, we analyze some of the data requirements for EIS, provide an assessment and description of the data sources selected for our RS/GIS study, and explain the data preprocessing and preparation procedures.
3.1. Data Requirements Under NEPA, an EIS is required to provide relevant information on the impacts of proposed transportation projects, as well as potential mitigation measures. Much of this information is related to land use and/or land cover. In our study, we are particularly interested in the use of data from remote sensing sources. In many cases, the data types used in an EIS can be extracted from remotely sensed data. The USGS has developed a standard classification system for Land Use/Land Cover (LULC) that is compatible with remotely sensed data (Anderson et al.,

13
1976). The USGS LULC classification system has a hierarchical structure with different classification levels. Table 3.1 lists first two levels of the USGS LULC classification. Table 3.1. The Anderson Land Use and Land Cover Classification System
for Use With Remote Sensor Data Level I Level II 1 Urban or Built-up Land 11 Residential.
12 Commercial and Services. 13 Industrial. 14 Transportation, Communications, and Utilities. 15 Industrial and Commercial Complexes. 16 Mixed Urban or Built-up Land. 17 Other Urban or Built-up Land. 2 Agricultural Land 21 Cropland and Pasture.
22 Orchards, Groves, Vineyards, Nurseries, and Ornamental Horticultural Areas. 23 Confined Feeding Operations. 24 Other Agricultural Land. 3 Rangeland 31 Herbaceous Rangeland. 32 Shrub and Brush Rangeland. 33 Mixed Rangeland. 4 Forest Land 41 Deciduous Forest Land. 42 Evergreen Forest Land. 43 Mixed Forest Land. 5 Water 51 Streams and Canals. 52 Lakes. 53 Reservoirs. 54 Bays and Estuaries. 6 Wetland 61 Forested Wetland. 62 Nonforested Wetland. 7 Barren Land 71 Dry Salt Flats. 72 Beaches. 73 Sandy Areas other than Beaches. 74 Bare Exposed Rock. 75 Strip Mines, Quarries, and Grave Pits. 76 Transitional Areas. 77 Mixed Barren Land. 8 Tundra 81 Shrub and Brush Tundra. 82 Herbaceous Tundra. 83 Bare Ground Tundra. 84 Wet Tundra.

14
85 Mixed Tundra. 9 Perennial Snow or Ice 91 Perennial Snowfields. 92 Glaciers. The USGS classification system has been widely adapted for many applications, particularly in the preparation of LULC maps. Nevertheless, requirements for LULC information for EIS are different because in the EIS case, the requirements are stipulated in specific laws and regulations. As shown in Table 3.2, each law or regulation has specific information requirements. Table 3.2: Land Use Land Cover Information Requirements by Laws and Regulations
Law or Regulation
Requirements Agency Land Use/Land Cover Information Needed
Clean Water Act–Section 401
Obtain Water Quality Certification and Short-Term Modification of Water Quality Standards for discharges into state waters.
WDOE Location and acreage of water bodies that would be affected.
Clean Water Act–Section 404
Obtain permits for fill and excavation in waters of the U.S. or adjacent wetlands.
COE Location and acreage of water bodies and wetlands that would be affected.
Department of Transportation Act–Section 4(f)
Review project “when public parks, recreation areas, wildlife and waterfowl refuges, or any significant historic or archaeological sites of national, state, or local significance will be impacted.”
FHA and FTA
Location and acreage of public parks, recreation areas, wildlife and waterfowl refuges that would be affected. Location and number of any significant historic or archaeological sites that would be affected.
Endangered Species Act–Section 7
Consult with FWS and NMFS on potentially affected species and habitat.
FWS, NMFS Location and acreage of “priority habitats” that would be affected.
Executive Order 11988 (Floodplain Management)
Evaluate the potential effects of any actions that may be taken in a floodplain; consider alternatives to avoid adverse effects and incompatible development within floodplains.
EPA Location and acreage of floodplains that would be affected.

15
Law or Regulation
Requirements Agency Land Use/Land Cover Information Needed
Executive Order 11990 (Protection of Wetlands)
Avoid undertaking or providing assistance for new construction located in wetlands unless (1) there is no practicable alternative to such construction, and (2) the proposed action includes all practicable measures to minimize harm to wetlands, which may result from such use.
EPA Location and acreage of wetlands that would be affected.
Executive Order 12898 (Environmental Justice)
Identify and address disproportionately high and adverse human health or environmental effects on minority and low-income populations.
EPA Location and number of minority and low income populations that would be affected.
Floodplain Permit
Obtain permit for work in designated floodplains.
King County, Snohomish County, and local jurisdictions
Location and acreage of floodplains that would be affected.
Hydraulic Project Approval
Obtain approval for work “that affects the bed and flow of state waters.”
WDFW Location and acreage of water bodies that would be affected.
National Environmental Policy Act
Federal agencies must consider the effects of their actions on the environment.
EPA Information from other laws and regulations in this table and as listed by category in Table 1.
National Historic Preservation Act–Section 106
Consult with SHPO and ACHP on potentially affected cultural resources.
SHPO and ACHP
Location and number of any significant historic or archaeological sites that would be affected.
National Pollutant Discharge Elimination System
Obtain Baseline General Permit to Discharge Stormwater Associated with Construction Activity (when disturbing 5 or more acres during construction and resulting in discharge of pollutants into state waters).
WDOE Location and acreage of water bodies that would be affected.
Shoreline Permit Obtain permit for work in shoreline zones.
King County, Snohomish County, and local jurisdictions
Location and acreage of shoreline areas that would be affected.
Washington State Environmental Policy Act
State agencies must consider the effects of their actions on the environment.
WDOE Information from other laws and regulations in this table.
In the EIS process, LULC information is not prepared as a single map, but is used in different environmental-discipline categories. There is a general correspondence between the LULC categories required for EIS and the USGS LULC classes, but important differences exist as well. For instance, “recreational

16
resource” is an EIS category that has no direct correspondence to a category in the USGS classification system, but can be part of the “other urban or built-up land” USGS classification. This is the case for the EIS transportation and utilities categories as well. Theoretically, much of the information required for EIS process can be obtained from remotely sensed data. For a given project, however, we may only select a few types of images in order to make use of the data more effectively. For this reason, it is always necessary to analyze the types of information required and to identify data sources that can meet these requirements. Cowen and Jensen (1998) provided an assessment on the requirements of remotely sensed data for different information acquisition purposes. According to Cowen and Jensen, the minimum requirements for images used for USGS level 1 classifications are that the images must have a spatial resolution of 20-100 meters and must contain multi-spectral bands, such as visual, near infrared (NIR), mid-infrared (MIR) and/or radar. For USGS level 2 classifications, the spatial resolution is 5-20 meters, plus the multispectral bands mentioned earlier. For USGS level 3, the spatial resolution is 1-5 meters. Most LULC categories required for EIS purposes correspond to USGS level 1 classification. Landsat-7’s Enhanced Thematic Mapper Plus (ETM+) with a spatial resolution of 15 meters for panchromatic imagery and 30 meters for multispectral imagery provides a good fit. Higher resolution imagery would be required to distinguish some of the LULC categories such as wetlands, utilities and transportation. For this reason, IKONOS 1 meter panchromatic and 4 meter multispectral imagery, 1 meter digital orthophotos, color orthophotos, and LIDAR digital elevation model (DEM) data were also evaluated for LULC classification purposes as discussed in Section 3.2. Not all the information required for an EIS can be extracted effectively from remotely sensed data (e.g., administrative boundaries, socioeconomic characteristics, and cultural attributes). Because of that, the project also took advantage of existing GIS databases, including U.S. Census population data, county transportation networks, hydrography networks, administrative boundaries, and watershed boundaries.
3.2. Remotely Sensed Imagery and GIS Data Sources A key strategy of the study was to use various kinds of image data, including black-and-white orthophotos, color orthophotos, and Landsat-7’s Enhanced Thematic Mapper Plus (ETM+) to take advantage of their different attributes to achieve synergistic results. The black-and-white digital orthophotos and color orthophotos have a one-meter-or-higher spatial resolution; they were used for ground truthing, verification, and selected feature extraction. Landsat ETM+ data, on the other hand, were used to cover large geographic areas and to provide multispectral information that is particularly useful for discriminating among different LULC types.

17
Landsat ETM+ data: Landsat ETM+ was the major data source for LULC analysis. This selection was based on several factors. The I-405 EIS is a programmatic EIS, not a site-specific EIS, so the requirements for spatial detail can be met with Landsat resolution. The Landsat data are inexpensive and provide large geographic coverage. More importantly, the ETM+ data provide seven spectral bands between with wavelengths between 0.5 and 12.6 micrometers, with a resolution of 30 x 30 meters (60 x 60 meters for band 6) plus a panchromatic band with a resolution of 15 x 15 meters (see Figure 3.1). LandSat7 ETM+ data were acquired from the Washington State Remote Sensing Consortium (WARSC). The data were originally obtained by the Satellite on July 7, 2000 and provided with geometrical terrain-correction.
Figure 3.1. Landsat ETM+ Multispectral Imagery Shows the Intersection of I-
405 and I-90. Graphical Display Generated with Landsat ETM+ Band 4 (Red), Band 3 (Green) and Band 2 (Blue) Sharpened to 15 Meter Resolution
Using the ETM+ Panchromatic Band.

18
Orthophotos and IKONOS Imagery: To complement the Landsat data, this study also collected and evaluated other remote sensing image data. WSDOT contributed a ½ foot color digital orthophoto based on a high precision geodetic control network that extended a mile around the existing highway. Unfortunately, this high-resolution color orthophoto’s limited spatial extent and extreme spatial resolution difference from the Landsat prohibited its use for automated LULC classification. WSDOT also acquired and provided 1) a non-ortho corrected, one meter color aerial photo mosaic produced by NIES Mapping in 1996, and 2) black and white one meter orthophotos produced by the Washington Department of Natural Resources. These images provide ideal structural identification for features such as buildings, roads, and other infrastructures. Nevertheless, because of their fine spatial resolution, it is difficult to use these images for automated LULC classification. Instead, these images were utilized for ground truthing, verification, and selected feature extraction. The project evaluated some of the IKONOS 1-m panchromatic and 4-m multispectral images, provided by Space Imaging, for experimentation and comparison purposes. It was found that both the panchromatic and multispectral IKONOS images are useful for land use and land cover classifications. Unfortunately, the available IKONOS data did not cover any part of the study area, and the demonstration project did not have the funds to acquire IKONOS data in this locale. The I-405 corridor is primarily an area with a mixture of urban and suburban landscapes. Much of the land along the corridor can be identified as urban built-up, using the USGS classification scheme. However, a great portion of the land is covered with trees and grasses, which have spectral signatures similar to agricultural land or forestland. This makes it difficult to identify the true LULC types on the ground and to extract all the information necessary for EIS purposes. For this reason, existing GIS data layers were utilized as additional data sources. Many types of GIS layers can be utilized to enhance LULC classifications or directly provide information for EIS purposes. Below, we focus our attention to those layers that were available for the study area. Actually most of these data layers can be found for many other areas as well. The USGS LULC map: The USGS LULC map provides national coverage and is in the public domain. A major drawback of this map is that its information is somewhat outdated because the series was developed during the 1970’s and 1980’s. This map can be a valuable reference when new LULC maps are generated. In general, regularity exists when LULC changes. For instance, the forestland in the fringe of a city is more likely to be converted into urban land. In contrast, the likelihood of conversion of built-up areas to agriculture land is small. Based on this type of regularity, a preference for classification can be prescribed when the LULC category on the USGS LULC map is known. That is, if a wetland is identified on the USGS map and forestland is identified for the corresponding area on an ETM+ image, the prescribed rule classifies this area as wetlands. Similarly, if a residential area is identified on the USGS map and a built-up urban category is identified on an ETM+ image, then residential land use would be assigned to this area.

19
Census population data: Census population data are needed to development for the environmental justice discipline. Using the census population data, maps of non-white population distributions can be created to evaluate potential efforts on minority population. Census population data are useful in several other circumstances. In urban areas, highly concentrated residential, commercial and industrial land use might have similar image characteristics, which makes it difficult to identify their differences. The use of population and household counts in these areas can provide additional evidence of whether the areas under question have the presence of residential housing. In suburban areas, low-density housing with extensive coverage of trees and grasses can be easily confused with forest or agricultural land. The population data can also be helpful in resolving these differences because the presence of houses would be a clear indication of residential land use. It must be realized, however, the Census population boundaries do not coincide with the LULC boundaries. The use of the population data may turn some of the unpopulated areas into residential areas. The user has to look into the specific situation of a project when population data are utilized in the LULC classification process. Road networks: Road networks themselves constitute a LULC category, which can be merged with a LULC map to form the transportation LULC category. Road networks can be also used as a general background for the study area when environmental disciplinary maps are developed. In addition, a road network layer can be used for the classification of other LULC categories. The presence of a road is highly correlated with human activities. For instance, combining the distance to a road and the population density, we may be able to more precisely define potential residential areas. Similar to the use of the Census population data, however, a user has to evaluate the situation very carefully when road networks are used for the classification of other LULC categories. Wetlands Inventory: Information about wetland locations in a given study area is critical to the EIS process. It is possible to use remotely sensed data to directly derive wetlands information (O’Hara, 2002). Here we focus on the use of existing wetlands data, data such as contained in the U.S. Fish and Wildlife Service’s National Wetlands Inventory. In this project, we used an existing wetlands layer that was created during the EIS process. This data layer can be directly overlaid with the LULC classification results to represent wetland distributions in the study area. Recreational facilities: Information about recreational facilities such as parks, trails, recreation areas, or wildlife refuges is also needed in the EIS process. Some of the forest areas or rivers belong to parks or recreational facilities and are identifiable on imagery. However, in many cases, the boundaries of recreational areas are drawn administratively, which makes it difficult to directly extract recreational boundaries from imagery. For this reason, existing maps of recreational facilities, when exist, must be utilized.

20
3.3. Data Preprocessing and Preparation Because of the use of various types of data, these data have different formats, different coordinate systems, and different spatial resolutions, which make the use of the data extremely difficult. We used following procedures to process and prepare the data. Data format conversion: Format conversion is a simple but important process for data preparation. Before any type of format conversion, it is essential to select a set of standard formats that will allow the representation of different types of data including raster data types (single bands, multiple bands, integer or real values for grid cells) and vector data types (points, lines, and polygons). In this project, we used three types of formats as the standard data formats and any data from other formats were converted into one of these formats. These three standard formats are: 1. The ERDAS IMAGINE .img file format was used for image data. 2. The Environmental Systems Research Institute (ESRI) Arc/Info coverage
format was used for vector data layers and raster data layers.
3. The shapefile format was used for vector data layer. In general, the same data layer in the shapefile format may also be maintained as an Arc/Info coverage to allow effective conversion and overlay between IMAGINE and Arc/Info.
Projection Conversion: After data are converted into the standard file formats, projection conversion is also necessary to reference these data in the same spatial coordinate system. The select of a coordinate system may consider several factors. Most importantly, the selected system must be commonly used and recognizable, e.g., the State Plane Coordinates System. The consideration may also include whether the selected system must have certain properties (equal area or no azimuthal distortion). The selection of a measurement unit and a Datum is also important. The study used State Plane Coordinates (Washington North, NAD83 Feet) as the standard map projection for the study area. Resolution merge: For Landsat imagery and IKONOS data, the panchromatic images and the multispectral images come in different resolutions. In this case, the image sharpening procedure in IMAGINE software were utilized to interpolate lower resolution multi-spectral imagery onto a panchromatic band of a higher resolution. Vector to raster conversion: IMAGINE provides the ability to directly display raster and vector data without converting the vector data layers into raster or image data formats. This is also true for the ArcInfo and ArcView software. IMAGINE also allows direct overlay between the raster and vector layers. Nevertheless, converting a vector layer to a raster layer is necessary when a layer has to be evaluated in a raster environment. For example, calculating distances to a road for each location on a map would need a road map to be prepared in raster layer first. Several layers such as road networks, drainage

21
basin boundaries, and wetland inventory were converted from vector maps to raster layers.
4. IMAGE PROCESSING AND LULC CLASSIFICATION
4.1. Technical Approaches Several technical strategies were considered in formulating approaches for LULC classification. These strategies include: (1) the use of a supervised classification scheme; (2) the use of multi-spectral, multi-resolution and multi-source imagery; and (3) the integration of existing GIS data and remotely sensed data. Each of these strategies is briefly described below. As one of the major strategies, a supervised classification method was utilized for LULC classification. The main idea of this method is that a computer program is first trained with known characteristics of various LULC classes and then the program will use these characteristics as a reference to automatically classify other samples in the area. The major advantage of this method is that known LULC classification in some areas can be utilized to derive LULC information in places where LULC classification is unknown. Image processing with a supervised classification method usually starts with the selection of training samples. After these training samples are selected, image characteristics, such as spectral intensity statistics, and shapes and patterns of given LULC classes, are extracted. The extracted image characteristics are also called image signatures because they uniquely identify different types of classes on the ground. By using these signatures, LULC classes can be identified throughout the entire study area. In general, ground truth data are needed both in selecting training samples and in validating classification results. Therefore, field trips to verify conditions on the ground are a crucial part of image data analysis. The second important strategy is the use of multi-resolution and multi-source imagery. Even when special care is taken in image data selection, an image with a single vantage point, a given spectral region, and a fixed spatial resolution usually has its limitations. In contrast, the combined use of a variety of image data sources can achieve synergistic results. In this regard, the study utilized Landsat ETM+ data to conduct the automated classification for LULC. Digital orthophotos were then referenced in field trip planning and ground-truth verification, and in classification of selected LULC categories such as farmland and streams. The third strategy is to make use of existing GIS data, such as road networks, hydro-networks, and administrative boundaries. These data can be utilized not only as a general reference for a kind of “ground truth” and additional attributes that may not be derived from imagery (e.g., the name of a river), but also for correlation and/or comparison to the remotely sensed data. More importantly, some of the existing data can be directly utilized in the LULC classification process. This is particularly valuable in situations where image spectral

22
information is insufficient to identify different LULC classes. For instance, it is usually difficult to differentiate between forestland and recreational park facilities. Park boundaries in a GIS layer can be referenced to determine whether a wooded area is classified as a park or as forestland.
4.2. Land Use and Land Cover Classes Different LULC classification systems have been developed to facilitate the documentation of LULC information. The USGS LULC classification by Anderson et al. (1976) is one of the systems that has been widely adopted in the remote sensing and GIS communities, because it was designed in consideration of the use of remotely sensed data. The Anderson classification is a hierarchical system (see Table 3.1). Usually only the top two levels of classification (i.e., level I and level II) are needed for a given application. The top classification (level I) consists of nine categories: 1-Urban or built-up land, 2-Agricultural land, 3-Rangeland, 4-Forest land, 5-Water, 6-Wetland, 7-Barren Land, 8-Tundra, and 9-Perennial snow or ice. Each category at the top level is further divided into subcategories (e.g., Urban or built-up land has seven subcategories, including: 11-Residential, 12-Commercial or services, 13-Industrial, 14-Transportation, communication, utilities, 16-Mixed urban or built-up land, and 17-Other urban or built-up land). Because the USGS classification system was particularly designed for use with the remotely sensed data, it was utilized for the automated classification for LULC in the current study. However, there are major differences between the USGS LULC classes and the EIS categories. In particular, there are some LULC categories that are used for EIS purposes, but which are not represented in the Anderson classification. For instance, wildlife habitat and threatened and endangered species are identified as required LULC classes for most EIS work, but are absent in the USGS classification system. The same is true for some other LULC categories (e.g., floodplains; recreational resources; and historic, cultural, and archaeological resources). For this reason, the image classification results were further processed and merged with existing GIS data layers to derive the EIS environmental-discipline categories.
4.3. Ground Truthing and Field Trips To select training samples for LULC classification and to validate LULC classification results, the collection of ground truth data through field trips is an essential part of the LULC classification process. This study conducted two rounds of field studies: one prior to the LULC classification process, and a second round after the classification was completed. The purpose of the first field trip was to gain familiarity with the study area and to obtain training samples for the LULC classes. The purpose of the second field trip was to validate, verify, and if necessary, modify the classification results. Before the field trips, data from different sources were acquired and analyzed. These data include remotely sensed imagery, existing GIS data, and data from other sources. These data, once processed, can be easily displayed, overlaid, and synthesized. Some of the training samples for LULC categories were directly obtained through visual analysis of the in-house data such as water bodies, forestland, and residential areas.
23
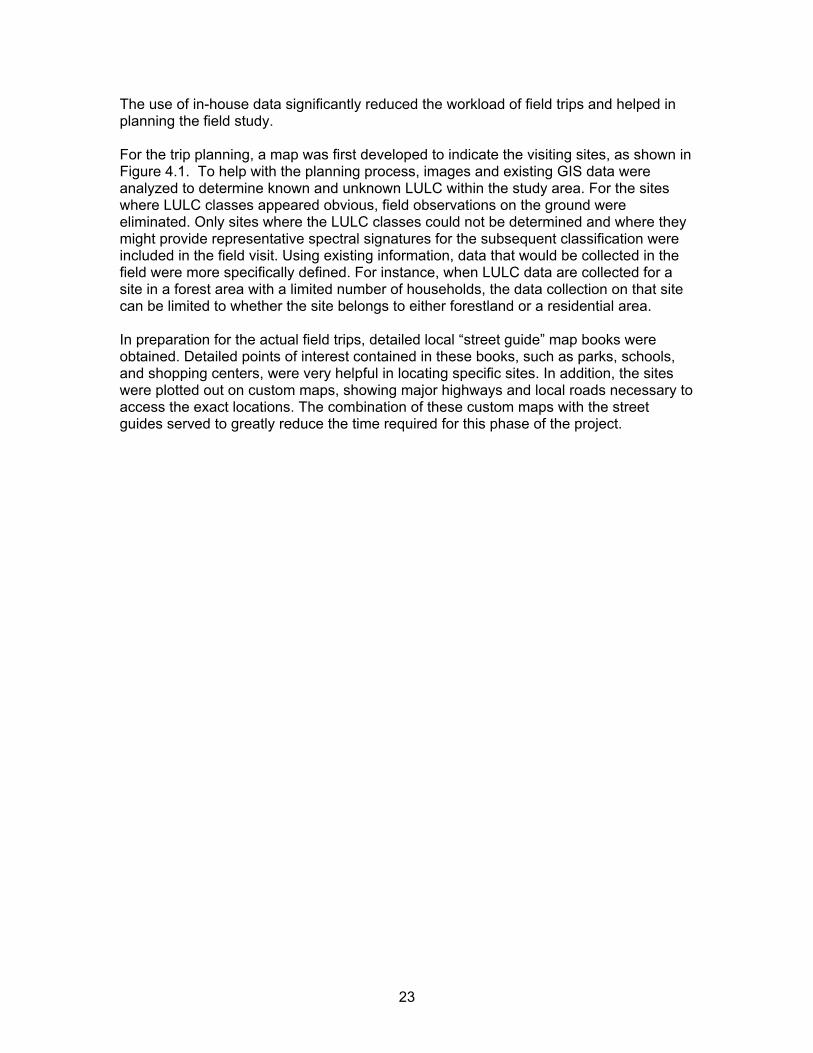
The use of in-house data significantly reduced the workload of field trips and helped in planning the field study. For the trip planning, a map was first developed to indicate the visiting sites, as shown in Figure 4.1. To help with the planning process, images and existing GIS data were analyzed to determine known and unknown LULC within the study area. For the sites where LULC classes appeared obvious, field observations on the ground were eliminated. Only sites where the LULC classes could not be determined and where they might provide representative spectral signatures for the subsequent classification were included in the field visit. Using existing information, data that would be collected in the field were more specifically defined. For instance, when LULC data are collected for a site in a forest area with a limited number of households, the data collection on that site can be limited to whether the site belongs to either forestland or a residential area. In preparation for the actual field trips, detailed local “street guide” map books were obtained. Detailed points of interest contained in these books, such as parks, schools, and shopping centers, were very helpful in locating specific sites. In addition, the sites were plotted out on custom maps, showing major highways and local roads necessary to access the exact locations. The combination of these custom maps with the street guides served to greatly reduce the time required for this phase of the project.

24
Figure 4.1. Study Sites for the First Field Trip.

25
During the field trips, definitions of the Anderson classifications were consulted to ensure consistency among the staff that was collecting the data. Pictures were taken for many of the sites, especially those containing mixed land uses that would be otherwise difficult to describe in concise field notes. Figure 4.2 provides a picture that shows the site labeled 18, where industrial buildings and wetlands co-exist.
Figure 4.2. A Picture that Shows the Co-Existence of Industrial
Buildings and Wetlands.
4.4. Image Processing for LULC Classification To effectively manipulate and analyze imagery and GIS data, the IMAGINE image processing system was selected to perform major image and data processing tasks. IMAGINE, a commercial product by ERDAS, provides a comprehensive set of functions for image processing, analysis, data management, and mapping or visualization. For supervised LULC classification, the image processing procedure was divided into two separate stages: supervised training and supervised classification. After the supervised classification, a post-processing stage was followed to enhance classification results using existing GIS data. Also manual interpretation was carried out to extract selected LULC categories.

26
4.4.1. Supervised Classification The ultimate objective of LULC classification is to establish the LULC patterns for the study area. The Landsat ETM+ data were selected as the major data source for this purpose. After image sharpening, the ETM+ imagery represents a seven-layer overlay with each layer representing a spectral band. The LULC classification was then based on the spectral intensity values of the seven bands on each image pixel, which for the ETM+ is a 15 X15 meter square on the ground. In order to assign a LULC category for each of the pixels, the supervised classification procedure was utilized. Using this procedure, the computer program was first trained with selected LULC samples, and then image pixels were classified into different LULC categories using the supervised classification rules. After the first field trip, a set of training samples was identified on the ETM+ image. In the IMAGINE environment, a training sample is simply defined as a polygon that delineates an area that represents a unique LULC category. Once the area of a training sample is determined, the spectral value on each band of each pixel in this area is analyzed by the IMAGINE software to generate a set of statistics, such as the mean, median, deviation, maximum and minimum spectral values on each band for this sample. These statistics are also called signatures because we can instruct the computer software to utilize these signatures to identify the LULC classes or features they represent. Usually it takes an iterative process to get accurate signatures for a set of LULC classes. During this iterative process, training samples are first identified; then signatures are extracted and applied back to recognize the categories from which the signatures are extracted. The recognition results then are analyzed so that the training samples can be modified or purified. This process continues until the samples can be classified accurately by the extracted signatures. This whole process is called supervised training. Depending on the decision rules, the methods used for supervised classification can be divided into two categories: parametric classification methods and non-parametric classification methods. The parametric classification methods use parametric signatures that are defined by mean vectors of spectral bands and the covariance matrix. The non-parametric classification methods are based on minimum and maximum values of the training sample, which determine whether given pixel values are within the defined signature boundary. Parametric classification methods operate in a continuous decision space, while non-parametric classification methods use finite decision boundaries. For this reason, parametric classification usually classifies all the pixels while non-parametric classification may leave the classes of some pixels unidentified due to overlapped decision boundaries or uncharted classification space. In this study, the Maximum Likelihood method was used to implement the supervised classification. Maximum Likelihood is a parametric classification method that has the advantage of allowing complete classification of an image when proper samples are specified. The real strength of the Maximum Likelihood method lies in the mathematical principles used to derive the parameters of the mean vector and the covariance matrix. Theoretically, the parameters derived with Maximum Likelihood method maximize the probability of obtaining the samples as actually observed. By doing so, the best classification results can be achieved.

27
4.4.2. Texture Analysis While multi-spectral ETM+ data were used for supervised LULC classification, texture analysis was experimented with for classification enhancement. It is well known that in some cases, the textural patterns in a neighborhood can be effectively utilized to identify LULC classes that cannot be identified by image intensity or spectral information on individual pixels. This is particularly true in urban and suburban areas where LULC classes show complex patterns, or when different LULC classes have similar spectral characteristics (e.g., forest versus a fruit farm). IMAGINE’s Texture Analysis Tool was utilized to create two types of texture measures with the ETM+ data: variance and skewness for specific image neighbors. The variance measure is simply the standard deviation of pixel values for a neighborhood window; skewness is the third-order normalized central moment (IMAGINE Field Guide). The texture measurements appeared useful for providing information to discern various LULC classes (e.g., forestland versus agriculture land). However, these texture patterns were not uniformly distributed for any LULC category, which made it difficult to incorporate this information into the automated classification process. For this reason, the study was not able to fully take advantage of the texture information for the LULC classification. Perhaps, this is due to the fact that the study area is in the urban and suburban environments. Many of the land use types are highly fragmented. Therefore regularity in texture patterns is complex and difficult to recognize. While in other situations, such as in rural or forest areas, regularity in texture patterns may be easier to identify and in these cases, textural measurements may become more valuable.
4.4.3. The Use of Existing GIS Data Layers Because of complex spatial patterns of LULC classes in the study area, spectral signatures given by ETM+ alone were insufficient in identifying some of the LULC classes, particularly in the urban built-up category. Therefore, several existing GIS layers were utilized to improve the classification process. These included the USGS LULC map, the Census population data, and the road networks. Although all three types of data were analyzed and tested for LULC classification purposes, only the USGS LULC map was utilized to generate the final classification results for the study area; the population and road layers were not used for reasons detailed below. Aside from facilitating LULC classification, the existing wetlands map, parks boundary map, and transportation networks were utilized by layering them onto the information generated from the LULC classification. The USGS LULC map provides a national coverage and is in the public domain, but its information is somewhat outdated because the series was developed during the 1970’s and 1980’s. To make effective use of the USGS map, our study assumed that LULC conversions followed some generalized trend. For instance, the forestland in the study area is more likely to be converted into urban land. In contrast, the likelihood of conversion of built-up areas to agriculture land is small. Based upon these assumptions, a preference for classification was prescribed when the LULC category on the USGS LULC map was known. For instance, if a wetland was identified on the USGS map and forestland was identified for the corresponding area based on the ETM+ imagery’s

28
spectral characteristics, the prescribed rule classified this area as wetlands. Similarly, if a residential area was identified on the USGS map and a built-up urban category was identified on the ETM+ imagery, residential land use would be assigned to this area. Population data are useful in several circumstances. In urban areas, highly concentrated residential, commercial and industrial land use might have similar image characteristics, which makes it difficult to identify their differences. The use of population and household counts in these areas can provide additional evidence of whether the areas under question have the presence of residential housing. In suburban areas, low-density housing with extensive coverage of trees and grasses can be easily confused with forest or agricultural land. The population data can also be helpful in resolving these differences because the presence of houses would be a clear indication of residential land use. After applying the population data into the classification process, we were able to identify some of the residential areas that were not obvious with the ETM+ imagery. We also found, however, that the use of the data also caused some problems. Fundamentally, the Census population boundaries do not coincide with the LULC boundaries. The use of the population data turned some of the unpopulated areas into residential areas. For this reason, our study did not use the population data in the final classification process. For future reference, it might be possible to use more sophisticated classification rules such as using population density as an extra band to be incorporated into the supervised training process. The road network layer was also tested for LULC classification purposes. The initial consideration was that the presence of a road is highly correlated with human activities. For this reason, we developed a measurement for each pixel that represents the distance between the pixel and a road. Combining the distance factor and the population density, we tried to more precisely define potential residential areas. Although this worked reasonably well, the road network layer had to be dropped due to its dependence on the population data, which had been dropped from use. Therefore, road network data was not utilized in the derivation of the final LULC map. Information about wetlands locations in a given study area is critical to the EIS process. It is possible to use remotely sensed data to directly derive wetlands information (O’Hara, 2001). However, since the current study chose to emphasize data sources that were inexpensive and readily available, we did not acquire high resolution image data. On a regional basis, LANDSAT ETM+ data is suitable for identifying wetlands. However, in a highly urbanized/urbanizing area like the I-405 Corridor, many of the wetlands that are not identified on standard data layers (like the U.S. Fish and Wildlife Service’s National Wetlands Inventory) are smaller than the LANDSAT pixel resolution, and therefore cannot be reliably identified using this method. Instead, we used an existing wetlands GIS data layer that was created for the study area during the EIS process. This data layer was directly overlaid with the LULC classification results in order to illustrate the utility of depicting wetland distribution relative to spatial land use patterns. Information about recreational facilities such as parks, trails, recreation areas, or wildlife refuges is also needed in the EIS process. Although most forest areas identified in the study area belong to parks or recreational facilities, the boundaries of recreational areas are drawn administratively, which leaves no direct discernable evidence on the imagery. For this reason, the map of recreational facilities generated from the DEIS process was utilized for our study. Overlaying the boundaries of recreational facilities on the LULC

29
map derived from the imagery allowed us to identify LULC characteristics within and nearby these facilities.
4.4.4. Manual Analysis and Classification Improvement There were still some problems when the automated classification process was completed. Misclassification occurred for a few LULC categories (e.g., farmland versus forestland, golf courses versus grassland, and the disappearance of some small streams in the area). To fix these problems, the ETM+ imagery and the digital orthophotos were utilized together in a manual interpretation process. ETM+ imagery provided spectral information that was particularly useful for a generalized recognition among vegetation, water bodies, and urban built-ups. At the same time, the one-meter digital orthophotos provided the geometric detail that allowed structural recognition of specific features on the ground (e.g., rivers, streams, buildings, and so on). Displaying the ETM+ imagery and the digital orthophotos on top of each other facilitated visual analysis. Through this analysis, farmland, golf courses, and several river streams were manually extracted using the on-screen digitizing function of ArcView, a commercial GIS product from ESRI.
4.5. LULC Classification Results and Evaluation The LULC classification procedures generated four different LULC layers: LULC layer I that focuses on land cover, LULC layer II that focuses on land use, the LULC layer III that focuses on wetlands, and LULC layer IV that focuses on recreational facilities. The maps created with these LULC layers are provided in Section 5. To validate the results of this study, a second field study was conducted to obtain ground truth information for a set of verification points. This section describes the classification results and the findings of the evaluation of these results.
4.5.1. LULC Classification Results LULC layer I is a direct classification from the sharpened Landsat ETM+, with some manual modifications on farmlands and streams. As the classification focuses more on the biophysical materials on the ground, it can be particularly useful for impervious surface estimation and provide several environmental discipline categories required for the EIS, e.g., Forest land, Farmland, and Water. Following are the LULC categories that are contained in LULC layer I: 1. Forest 2. Grass and shrubs 3. Residential/low density urban built-up 4. Commercial/Industrial/high density urban built-up 5. Water 6. Farmland LULC layer II was created using LULC layer I, the existing USGS LULC map, and the existing transportation network layer. This layer can be used for the EIS disciplinary

30
categories: transportation, shorelines, farmland, and fish, aquatic habitat, and land use. Following are the LULC categories that are contained in LULC layer II: 1. Forest 2. Grass and shrubs 3. Residential 4. Commercial 5. Water 6. Farmland 7. Transportation 8. Industrial 9. Urban built-up, mixed or unclassified LULC layer III was created with the LULC layer I and the wetlands map. From this layer, wetlands and their surrounding LULC types can be referenced. Compared with LULC layer I, the land cover categories within the wetland areas can be identified, which could be useful in the reviewing and/or prioritization of possible impacts on wetlands in the study area. Following are the LULC categories that are contained in LULC layer III: 1. Forest 2. Grass and shrubs 3. Residential/low density urban built-up 4. Commercial/Industrial/high density urban built-up 5. Water 6. Farmland 7. Wetlands, classified as low sensitivity 8. Wetlands, classified as high sensitivity LULC layer IV was created with the LULC layer I and with the park layer added. This layer also shows some golf courses that were manually extracted from the orthophotos and ETM+ imagery. This layer was specifically used for the recreational facility category. Following are the LULC categories that are contained in LULC layer IV: 1. Forest 2. Grass and shrubs 3. Residential/low density urban built-up 4. Commercial/Industrial/high density urban built-up 5. Water 6. Farmland 7. Parks 8. Golf Course
4.5.2. LULC Classification Result Evaluation After LULC classification results were developed, a second field study was conducted to verify and validate these results. To allow unbiased checks of the accuracy of the LULC classifications, a computer program was utilized to generate a set of field sites that were randomly identified in the study area. LULC categories on these field sites were then obtained through the field study and compared with the categories that were obtained

31
through the image analysis process. The difference between the field study and the image analysis is used as a measure of the accuracy of the LULC classification results. To simplify the generation of the field sites for random checking and verification, this project has developed a simple computer program to generate two independent random numbers, which became the coordinate pairs (x, y) for the field sites. The x and y coordinates were constrained by the maximum and minimum coordinate values of the study area. Considering the significant amount of field work involved, we limited the number of random field sites to 95. These are shown in Figure 4.2. These field sites were represented by a shapefile, which can be directly overlaid with the LULC layers and all other image and GIS data layers. Conceptually, each random-check site is a cell that is 15 square meters in size. However, due to problems accessing private land and/or restricted areas on a timely basis, it would have been difficult to determine the exact LULC category of a particular cell. Instead, an extended area (e.g., the natural LULC polygon) around a selected site was evaluated as a whole. When the LULC category at a site could not be determined at our computer workstation or in the field, this site was dropped from the verification process. In addition to the LULC type and code for each site, photographs were taken and annotated maps were generated for many of the sites. Notably, not all the LULC categories were determined in the field. Similar to the first field trip, part of the verification and validation task was first performed at a computer workstation. Specifically, field locations were first examined on screen, in an overlay that included road maps, satellite images, and digital orthophotos. For those sites where reliable information could be obtained from existing sources (e.g., images or GIS data), existing data were referred to and analyzed to generate the LULC categories as the “ground truth”. The field trips were then made to check those sites where LULC classes could not be definitely determined in-house. Comparing the LULC categories based on the ground-truth information and the LULC categories obtained from the automated image classification, a matrix can be constructed to indicate the misclassifications and accuracy rates for each of the LULC categories and for the overall classification. Table 4.1 shows the misclassification matrix and accuracy rates for each of the LULC categories and the overall classification for the LULC Layer I on based on the Level 1 USGS LULC classification. For example, in the row of the table for the urban category, “64” means 64 urban samples were correctly identified as urban; 1 urban sample was misclassified as farmland and 5 were misclassified as forest, among a total of 70 urban samples whose LULC categories were determined with the ground-truth information. The accuracy for urban land use classification therefore is 64 divided by 70, which equals 91.2%. Similarly, for farmland, 2 samples were correctly identified as farmland, 1 misclassified as urban, and 1 misclassified as forest. The accuracy rate is 50.0%. The numbers with bold cases in the diagonal cells of the table indicate the numbers of checking points that were correctly classified. The total number of checking points was 91, and 73 samples were correctly classified so the overall accuracy was 80.2%.

32
Table 4.1. Misclassification Matrix and Classification Accuracy Rates
LULC Categories Based on Automated Classification Urban Farm Forest Water Wet. Total Accuracy Urban 64 1 5 0 0 70 91.2% Farmland 1 2 1 0 0 4 50.0% Forest 4 0 4 0 0 8 50.0% Water 0 0 0 3 0 3 100.0%
Actual LULC Classes
Wetlands 4 0 2 0 0 6 0.0% Overall Accuracy 80.20% The 80.2% overall accuracy of the LULC classification appears reasonable, but the correct classification rates on farmland, forest, and wetlands were low. In particular, none of the wetland samples were classified correctly. The complexity of LULC patterns in an urban/suburban environment is certainly a factor contributing to the misclassification. The limitation of resources that were available was another factor that impacted the results. LULC types such as wetlands, forest, and farmlands may be better identified with hyperspectral or high-resolution multispectral imagery. It has been demonstrated that a combination of hyperspectral, LIDAR, and GIS data can provide a reliable solution to the identification of wetlands (O’Hara, 2001). However, these data were not be affordable for our project. Instead, we mainly exploited existing GIS data layers, e.g., the wetlands inventory, to improve the image classification results and to prepare the EIS-discipline information layers, as discussed in Section 5.
5. DATA ANALYSIS AND PRESENTATION The task of data analysis and presentation was an important and integral part of the study. It transformed information derived from image analysis, and integrated this information with existing GIS layers to prepare a set of environmental discipline layers that are directly useful for EIS purposes. Statistics for LULC categories for the drainage basins in the study area were also created to provide useful references for impact analysis and assessment. This section describes the approaches used for this task, the data preparation process and results, and the statistics generation process and results.

33
ð
ð
ð
ðð
ð
ð
ðð
ð
ð
ð
ð
ð
ð
ð
ð
ð
ð
ð
ð
ð
ð
ð
ð
ð
ð
ð
ð
ð
ð
ð
ðð
ð
ð
ð
ð
ð
ð
ð
ðð
ð
ð
ð
ð
ð
ð
ð
ð
ð
ð
ðð
ð
ðð
ð
ð
ð
ð
ð
ð
ð
ð
ð
ð
ð
ð
ð
ð
ð
ð
ð
ð
ð
ð
ð
ð
ð
ð ð
ð
ð
ð
ð ð
ð
ð
ð
ð
ððð
Figure 4.2. The Random Check Sites.
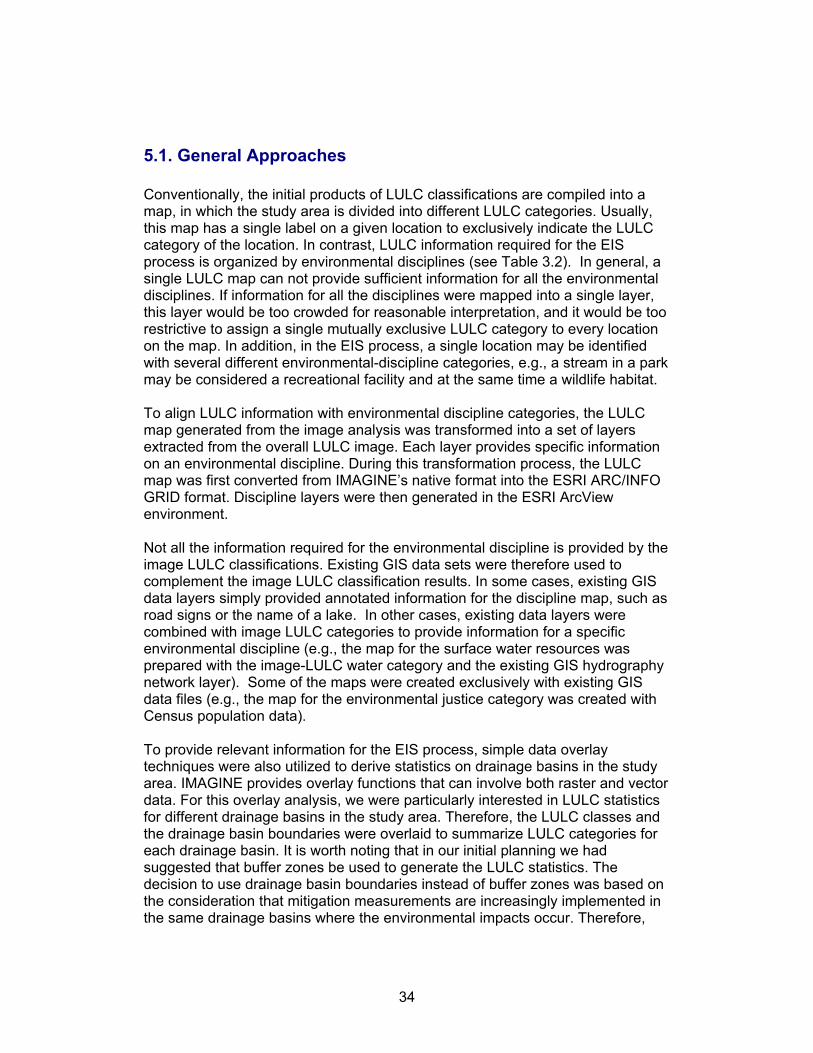
34
5.1. General Approaches Conventionally, the initial products of LULC classifications are compiled into a map, in which the study area is divided into different LULC categories. Usually, this map has a single label on a given location to exclusively indicate the LULC category of the location. In contrast, LULC information required for the EIS process is organized by environmental disciplines (see Table 3.2). In general, a single LULC map can not provide sufficient information for all the environmental disciplines. If information for all the disciplines were mapped into a single layer, this layer would be too crowded for reasonable interpretation, and it would be too restrictive to assign a single mutually exclusive LULC category to every location on the map. In addition, in the EIS process, a single location may be identified with several different environmental-discipline categories, e.g., a stream in a park may be considered a recreational facility and at the same time a wildlife habitat. To align LULC information with environmental discipline categories, the LULC map generated from the image analysis was transformed into a set of layers extracted from the overall LULC image. Each layer provides specific information on an environmental discipline. During this transformation process, the LULC map was first converted from IMAGINE’s native format into the ESRI ARC/INFO GRID format. Discipline layers were then generated in the ESRI ArcView environment. Not all the information required for the environmental discipline is provided by the image LULC classifications. Existing GIS data sets were therefore used to complement the image LULC classification results. In some cases, existing GIS data layers simply provided annotated information for the discipline map, such as road signs or the name of a lake. In other cases, existing data layers were combined with image LULC categories to provide information for a specific environmental discipline (e.g., the map for the surface water resources was prepared with the image-LULC water category and the existing GIS hydrography network layer). Some of the maps were created exclusively with existing GIS data files (e.g., the map for the environmental justice category was created with Census population data). To provide relevant information for the EIS process, simple data overlay techniques were also utilized to derive statistics on drainage basins in the study area. IMAGINE provides overlay functions that can involve both raster and vector data. For this overlay analysis, we were particularly interested in LULC statistics for different drainage basins in the study area. Therefore, the LULC classes and the drainage basin boundaries were overlaid to summarize LULC categories for each drainage basin. It is worth noting that in our initial planning we had suggested that buffer zones be used to generate the LULC statistics. The decision to use drainage basin boundaries instead of buffer zones was based on the consideration that mitigation measurements are increasingly implemented in the same drainage basins where the environmental impacts occur. Therefore,

35
information about specific impacts on a drainage basin is more relevant than information on impacts within a buffer zone. The overall results of this task include a set of data layers that directly correspond to EIS environmental discipline categories, and several tables that were derived to provide LULC statistics.
5.2. Data Preparation for Environmental Assessment Disciplines To provide maps and related information that would be most relevant for a programmatic EIS process, image analysis results and selected GIS data were reprocessed to prepare thematic information for environmental disciplines. The thematic information for each discipline could contain either single or multiple map layers. The thematic information for different disciplines is usually different, but in some cases, the same map layer may be shared among different disciplines. The following environmental disciplines were identified for data preparation and representation: ♦ Environmental Justice ♦ Farm Land ♦ Fish/Aquatic Habitat ♦ Floodplains ♦ Land Use ♦ Recreation ♦ Shorelines ♦ Surface Water Resources ♦ Transportation ♦ Upland Vegetation/Habitat/Wildlife ♦ Wetlands Maps for these disciplines are shown in Appendix A.
5.2.1. Environmental Justice Executive Order 12898 requires that Federal agencies shall identify and address disproportionately adverse human health and environmental effects of its programs. The Federal Highway Administration has issued guidance on how to implement this Order to implement Environmental Justice analysis for proposed highway projects (FHWA Order 6640.23). The map prepared for this discipline (Figure A1.1) represents the location of the potentially-affected minority population in relation to Commercial, Transportation, and Industrial land uses. This map was generated using a combination of Census data and remotely sensed imagery. The minority population data were compiled from the year 2000 Census. The land use categories were identified through automated classification of the imagery based on spectral signatures and texture, supported by field

36
verification and validation. The land use layer was overlain onto a standard map-template that has major roads, lakes, places, and other features.
5.2.2. Farm Land The viability of land in long-term agricultural use and the importance of individual farms are reflected in farmland protection legislation in the State of Washington. The LULC data prepared for Farm Land represent the location of potentially affected farmlands along the corridor. They were generated using a combination of satellite imagery and digital aerial photography. These data were overlain onto a standard map-template that has major roads, lakes, places, and other features. Hillshading was added to the farmlands map using 10m U.S. Geological Survey digital elevation model (DEM) data (Figure A1.2). A map showing Alternative 3 projects (both highway and transit) was also prepared for the study area.
5.2.3. Fish/Aquatic Habitat The data prepared for Fish/Aquatic Habitat provides information on the streams and water bodies in the study area (Figure A1.3). The level of detail was intended to be suitable for a corridor-level environmental review. The data contains the same GIS stream networks as that used for the DEIS. Lakes were extracted from interpretation of Landsat-7 imagery. The locations of dams, fishways, and culverts were identified from the Washington Department of Fish and Wildlife Fish Passage Barrier and Surface Water Diversion Screening (SSHEAR) database. The data layer for Alternative 3 Projects by Basin contains additional information about Alternative 3 projects (both highway and transit) overlain onto the streams-and-basins map. A third data layer, Land Use and Major Streams, was prepared by overlaying major river streams on to a land use map (described in the Land Use section) to indicate the spatial proximity of various land uses to these streams.
5.2.4. Floodplains Floodplains are lowlands that are relatively flat and subject to flooding. The 100-year floodplain is the area adjacent to a stream, river or lake that is subjected to inundation by water with a probability of at least 1% in any given year. The Federal Emergency Management Agency (FEMA) floodway is the channel of a river and adjacent land that must be unobstructed to provide for the discharge of the base-year flood. The data prepared for Floodplains delineates the 100-year floodplain (Figure A1.4). It contains the same floodplain information as that used for the DEIS, but this data is overlain onto a standard map-template that has major roads, lakes, places, and other features. Hillshading was added to the floodplains map using 10m U.S. Geological Survey digital elevation model (DEM) data. An additional

37
map layer was prepared to represent Alternative 3 projects (both highway and transit), overlain onto the RS/GIS floodplain map.
5.2.5. Land Use Land use in the study area is managed through comprehensive plans prepared for each jurisdiction and guided by county planning policies in accordance with the state’s Growth Management Act (GMA). Under the Growth Management Act, cities and counties plan for growth, establish commercial and residential zones, and approve variances to those decisions. Transportation projects managed by WSDOT are built in response to the congestion and public safety issues surrounding a growing state. Highway construction projects reinforce local land use plans by concentrating growth in the urban area, rather than promoting sprawl. The Puget Sound Regional Council (PSRC) has adopted multi-region planning policies provided by GMA. The PSRC has also adopted VISION 2020 – a long-range growth management, economic development, and transportation strategy – and the Metropolitan Transportation Plan to guide the region’s transportation investments in the central Puget Sound region. The data prepared for the EIS Land Use discipline came from automated classification of Landsat-7 imagery based on spectral signatures, supplemented by manual interpretation, field verification, and validation (Figure A1.5). The resulting database was overlain onto a standard map-template that has major roads, lakes, places, and other features. The land use categories used were:
• Forest, • Grass and shrubs, • Residential, • Commercial, • Water, • Farmland, • Transportation, • Industrial, and • Urban built-up, mixed, or unclassified.
The data mainly reflects land-cover information from the remotely sensed imagery, and identifies areas of grass and shrub land cover within what could be classified as residential areas.
5.2.6. Recreation Under federal law, in a project-specific environmental document, a 4(f) review of the impacts of a transportation project on public parks, recreation areas, or wildlife refuges may be required. The data prepared for the study was intended to provide information about the affected recreation environment, suitable for a corridor-level environmental review. The map was generated using a combination of DEIS data and remotely sensed imagery (Figure A1.6). Data on

38
parks that were developed for the DEIS were overlain onto a standard map-template that has major roads, lakes, places, and other features. Hillshading was added to the affected recreation map using 10m U.S. Geological Survey digital elevation model (DEM) data. Parks are local- or state-administrative designations that mainly comprise “grass and shrubs” and “forest” land-cover designations identified from remotely sensed imagery. Some urban built-up or mixed land cover is identified within park boundaries as well. Golf courses were identified through automated classification of the imagery based on spectral signatures, followed by interpretation of aerial photography. A map was also prepared for Alternative 3 projects (both highway and transit) overlain onto the recreational resources map. A third map showed the boundaries of the parks overlain onto the land cover map, to indicate the make-up of the land cover within parks (generally “grass and shrubs”, and “forest”), as well as their proximity to other land cover. A fourth map was showed drainage basin boundaries and the affected recreation environment.
5.2.7. Shorelines Public access to shorelines and shoreline protection, enhancement, and preservation are important goals of local shoreline master plans. Jurisdictional shorelines are designated as such by Washington’s Shoreline Management Act, and are incorporated into local Shoreline Master Programs. Shoreline impact evaluation was conducted for the I-405 study on the basis of whether proposed project improvements would be within 200 feet of a designated shoreline. The data prepared for the Shorelines map combined the GIS data used in the DEIS and the LULC categories that were identified by automated classification of Landsat-7 imagery (Figure A1.7). The resulting data were overlain onto a standard map-template that has major roads, lakes, places, and other features, as well as Alternative 3 projects (both highway and transit)..This map shows the proximity of land uses to jurisdictional shorelines.
5.2.8. Surface Water Resources Surface water is a valuable resource to a community. It supports aquatic species and ecosystems, provides water recreation, and is a source of drinking water. The quantity and the quality of these resources are both important. Water quality is affected by construction, operation and maintenance of roadways; and by commercial, residential and industrial activities. The quantity of impervious surfaces within an individual drainage basin affects runoff and thus water quality. Maps prepared for Surface Water Resources assessment include: (1) stormwater management facilities (Figure A1.8); (2) data layers prepared for other disciplines, e.g., the Surface Water Stream Basins map that was prepared for the Fish and Aquatic Habitat category and the100-Year Flood Plains map that was prepared for the Floodplains category; (3) Soils Potentially Suitable for Stormwater Recharge (showing land cover); and (4) Water Quality Impaired

39
Lakes and Streams (with adjacent land use). The data were compiled from existing GIS data, the LULC layer from image analysis, and a standard map template that has major roads, lakes, places, and other features.
5.2.9. Transportation Transportation performance is obviously a key metric for gauging the desirability of alternative transportation investments. Each Alternative in the I-405 EIS was evaluated based on three primary criteria: mobility improvement, congestion reduction, and safety improvement - when compared to the No Action Alternative. Many different measures are used to assess the performance of each Alternative with respect to each of these criteria. The data prepared for the Transportation map included the same three screenlines (vehicle throughput measurement points) used in the I-405 Corridor Program EIS (Figure A1.9). In addition, urban centers and centers of employment were identified. Urban centers were assumed to correspond to commercial land uses. Centers of employment were identified based on commercial, urban, built-up and mixed land uses. The land use information used came directly from the image analysis results.
5.2.10. Upland Vegetation/Habitat/Wildlife Large transportation projects such as those being considered under the I-405 corridor study could directly impact vegetation, habitat, and wildlife. To make preliminary assessments of these potential impacts, information about the geographic distribution of habitats is critical in identifying locations that could be the sites of such impacts. Data prepared for this purpose include:
• Existing Priority Habitats and Species GIS mapping data, from the Washington Department of Fish and Wildlife, overlaid on forest land and water identified with Landsat-7 imagery (Figure A1.10),
• Wetland data that were derived from a combination of the GIS database
used in the DEIS and LULC information extracted from remotely sensed imagery.
An additional data layer was prepared for Alternative 3 projects (both highway and transit), and was overlain onto the priority-habitats map.
5.2.11. Wetlands Wetlands are lands transitional between terrestrial and aquatic systems where the water table is usually at or near the surface, or the land is covered by shallow water (U.S. Fish and Wildlife Service). Section 404 of the Clean Water Act defines wetlands on the basis of their having a prevalence of hydrophytic vegetation, undrained hydric soils, and certain hydrological indications.

40
Wetland data for this section were generated based on the GIS database used in the DEIS, in combination with LULC information extracted from remotely sensed imagery (Figure A1.11). Wetlands that have been identified by a jurisdiction in the study area as Category I (or similar rating of the highest value) are classified as high priority wetlands that have high biological and hydrological value. Any wetland that contains or that is in close proximity to threatened or endangered species is also classified as a high priority wetland. Wetlands not rated as high priority are classified as lower priority. The resulting data on wetlands were overlain with land cover onto a standard map-template that has major roads, lakes, places, and other features. A second map was prepared that included Alternative 3 projects (both highway and transit).
5.3. Statistical Data Generation for Drainage Basins To provide information for assessment of impacted LULC along the corridor, a set of statistical tables were prepared to summarize the LULC acreage within drainage basins and within the study area. These tables were prepared based on the LULC maps generated from image analysis, and the drainage basin boundary GIS layer used in the DEIS. IMAGINE’s Spatial Modeler was utilized to overlay the LULC maps onto the drainage basin boundaries to generate the statistics for various LULC characteristics. The LULC image analysis data files are in raster data format. The drainage basin boundaries were prepared in an ArcView shapefile, which was in a vector format. IMAGINE’s Spatial Modeler allows a direct overlay of the vector and raster layers; this simplified the overlay process considerably, because no vector- to-raster conversion was necessary. The Spatial Modeler was built along a graphical interface, called Model Maker. With the Model Maker, a user can create spatial models graphically (see the IMAGINE Tour Guide for details). For our purpose, the Model Maker was used to create overlay models. These models took the LULC maps and the drainage basin boundaries as the input to create raster layers that were coded with both the LULC classes and the drainage basin information for each pixel. The content table of the resulting layer then provides the counts of the number of pixels for a complete list of pixel values, each count corresponding to an LULC category within a drainage basin. More detailed procedures are described in the companion User Guide document (Xiong et al, 2003). Four statistical tables were generated in this process. All these tables are listed in Appendix A. The summary of acreage of LULC layer I within drainage basins in the study area is shown in Table A1.1. The summary acreage for LULC layer I within the study area as a whole area is shown in Table A1.2. The summary acreage for LULC layer II within drainage basins in the study area is shown in Table A1.3. The summary acreage for LULC layer II within the study area as a whole is shown in Table A1.4. The summary acreage for LULC layer III within drainage basins in the study area is shown in Table A1.5. The summary of LULC

41
acreage for LULC layer IV within drainage basins in the study area is shown in Table A1.6.
6. VALUE AND USEFULNESS OF RS/GIS PRODUCTS In their paper on “Assessing the Need for Remote Sensing Information to Conduct Environmental Assessment in Transportation,” Laymon et al. (2001, p. 41) suggest that there is not only a need for remote-sensing demonstration projects, but also a need to engage stakeholders, demonstrate the value of remote sensing products, and assess their costs and benefits. This section describes a case study to assess the value of using remotely sensed data for environmental analysis in transportation planning. The I-405 Corridor Program is used as a case study. The case study developed a protocol for obtaining potential users’ assessments of the value and usefulness of RS/GIS products. The protocol consisted of structured “interviews” done through a web site.4 The web site contained RS/GIS products on the I-405 area, as well as maps and other material from the DEIS for the I-405 Corridor Program. The web site also contained a questionnaire that posed questions about the value and usefulness of the RS/GIS products. The respondents to this survey included seven stakeholders involved in the I-405 project, including the Principal Transportation Planner of the lead agency responsible for the DEIS and staff from some of the review agencies; the prime DEIS contractor team that wrote most of the sections of the DEIS document, and one subcontractor; and staff from four state DOTs outside WSDOT. In reporting the results of this survey, we summarize and quote some of their comments without questioning them (especially in Tables 6.3 to 6.6). The respondents’ opinions are important because such impressions will ultimately affect the diffusion and use of remote sensing applications.
6.1 Assessing the Value and Usefulness of RS/GIS Products LULC information is used in descriptions and analyses of the different environmental disciplines that the NEPA process typically addresses. We selected eleven environmental disciplines on the basis of their being amenable to analysis using remotely sensed data (refer to Xiong et al. 2003):
• Environmental justice (Appendix G) • Farmland (3.9) • Fish and aquatic habitat (3.8) • Floodplains (3.10) • Land use (3.13)
4 http://www.wsdot.wa.gov/environment/envinfo/envinfo_i405.htm

42
• Recreational resources (3.17) • Shorelines (3.11) • Surface water resources (3.5) • Transportation (3.12) • Upland vegetation, habitat, and wildlife (3.7) • Wetlands (3.6).
The number in parenthesis after each environmental discipline in the previous list is the section number in the DEIS report for that discipline (FHWA et al. 2001)]. The purpose of the case study was to develop and implement a protocol to assess the incremental value of LULC-related information developed using remotely sensed data, as described in Sections 3 to 5, relative to a baseline set of information representing current practice. Information from the DEIS for the I-405 Corridor Program (FHWA et al. 2001) was used as the baseline. Maps used in the DEIS (FHWA et al. 2001) and in the accompanying technical expertise reports (CH2M HILL 2001a,b; David Evans and Associates, Inc. 2001a,b,c,d,e,f,g,h); Mirai Associates and David Evans and Associates, Inc. 2001) were compared to maps generated from a combination of remotely-sensed imagery and GIS data for each of these categories. The comparisons focused on assessing whether RS/GIS methods could provide complementary or supplementary information, as well as identifying environmental disciplines where these methods might not be as useful or cost-effective. The results of the case study are presented in the following sections that compare conventional and RS/GIS products in terms of their:
a) Attributes, b) Costs, c) Value, and d) Usefulness.
“Attributes” refer to the nature of the information, its sources, and data manipulation. “Costs” refer to the expenditures for the work that produced the products. These costs are mostly labor and associated overhead costs. “Value” refers to the desirability of the products on a measurable scale. The specific protocol developed to obtain estimates of the value of RS/GIS products asks respondents to express their “worth” relative to the total cost of completing the work on the corresponding environmental discipline in the DEIS. The “usefulness” of RS/GIS products refers to their comparability to conventional maps as satisfactory means of conveying spatial information, the appropriateness of the geographic scale and precision, and their possible effect on the findings or conclusions in a DEIS. The intent of the case study was to assess whether such a protocol would be useful for obtaining such information, as well as to gain a sense of the value and usefulness of remotely sensed data for NEPA assessment in transportation corridor planning, when used in combination with geographic information systems and other conventional spatial data technologies. The results in this

43
latter regard are obviously preliminary because of the limited number of respondents in the survey, though the responses are suggestive of what the value and usefulness of these products might be.
6.2 Information Attributes The ways of describing different environmental disciplines vary, as do the data sources, data manipulation, and presentation format. These differences affect the nature of the information presented, as well as the costs of compiling it. The results of the RS/GIS analysis were compared to the comparable information presented in the DEIS, for the eleven disciplines categories listed in Section 6.1, based on information given in Form 1 in Appendix B. Table 6.1 summarizes this information.
Table 6.1: Comparison of Attributes, Data Sources, Data Manipulation, and Presentation Formats of Conventional and RS/GIS Map Products
Environmental Discipline
Conventional Practice Information from RS/GIS
Environmental justice
• % minority population, by Census block
• Population Census • Mapping geocoded Census data • Map with % minority population, by
block or block group, on a standard map template
• % minority population by, Census block
• Population Census and remotely sensed Landsat data
• Classification of remotely sensed data, overlaid onto Census data
• Map with % minority population, by block or block group; and areas with commercial and industrial land uses, on a standard map template
Farmland • Locations of farms
• Information compiled by study team • Geocoded and mapped • Map of farms in the study area
• Locations of farms • Automated classification of Landsat
imagery, supplemented by interpretation of aerial photography
• Classified imagery overlaid onto map template with hillshaded topography
• Map of farms and acreage statistics (e.g. by basin) in the study area
Fish and aquatic habitat
• Streams and river basins • Local (county) data on fish presence
(tabular and GIS); data from Washington Department of Fish and Wildlife
• Converted information into GIS format to supplement previously developed GIS files
• Map of stream locations and river basin boundaries
• Streams and river basins • Local (county) data on fish presence
(tabular and GIS); data from Washington Department of Fish and Wildlife
• Supplemented by interpreted Landsat-7 imagery
• Map of stream locations, land uses in the study area, and river basin boundaries
Floodplains • Locations of floodplains
• Local (county) GIS database, supplemented by manual review of information
• Locations of floodplains • Local (county) GIS database,
supplemented by manual review of information

44
Environmental Discipline
Conventional Practice Information from RS/GIS
• Mapped the previously developed GIS data
• Map of floodplains
• Mapped the previously developed GIS data, overlaid onto hillshaded map template.
• Map of floodplains
Land use • Land uses, with the following categories: forest, open space, agriculture, commercial, industrial, residential, government, right-of-way, mixed, and other
• Local (county) GIS database • Mapped the GIS data • Map of land uses
• Land uses, with the following categories: forest, grass and shrubs, residential, commercial, water, farmland, transportation, industrial, and urban built-up, mixed or unclassified
• Automated classification of Landsat-7 imagery, supplemented by field verification
• Overlaid onto map template • Map of land uses and acreage
Recreational resources
• Map of parks • Local sources • Mapped using a GIS • Map of parks
• Map of parks and acreage of recreational resources
• Combination of data used for the DEIS and remotely sensed imagery, supplemented by interpretation of aerial photography
• Integration of imagery and map template
• Map of parks and acreage statistics
Shorelines • Jurisdictional shorelines • Local shoreline master programs, lists
of shorelines, inspecting aerial photographs
• Designate jurisdictional shorelines in previously developed GIS database on streams and lakes
• Map of shorelines
• Shorelines supplemented by land uses, with the following categories: forest, grass and shrubs, residential, commercial, water, farmland, transportation, industrial, and urban built-up, mixed or unclassified
• Automated classification of Landsat-7 imagery, and data used for the DEIS.
• Overlaid onto map template • Map of shorelines in relation to land
uses
Surface water resources
• Identification of existing rivers, streams and lakes within the study area
• GIS database from the county • Mapped the GIS data • Map of water resources
• Identification of existing rivers, streams and lakes
• WSDOT Outfall database; land cover information from automated classification of Landsat-7 imagery supplemented by field verification; Washington surficial geology data.
• Overlaid GIS database onto map-template
• Map of rivers, streams, and lakes; map of soils potentially suitable for stormwater recharge, combined with land use map
Transportation • Locations of screenlines for
transportation analysis • Sketch map of area • Manually sketched screenlines and
• Locations of screenlines for transportation analysis
• Screenlines manually defined as for the DEIS; urban centers assumed to

45
Environmental Discipline
Conventional Practice Information from RS/GIS
employment centers • Map of screenlines and the
transportation network
be commercial land uses; centers of employment assumed to be commercial, urban, built-up, and mixed land uses.
• Automated classification of Landsat-7 imagery
• Map of screenlines and the transportation network
Upland vegetation, habitat, and wildlife
• Locations of areas with upland habitats, vegetation, and wildlife
• Databases from Washington State Department of Natural Resources, Department of Fish and Wildlife, and the Natural Heritage Data System
• Compiled information and carried out field reconnaissance; geocoded and mapped the information
• Map of upland habitats
• Locations of areas with upland habitats, vegetation, and wildlife
• Same data as used for DEIS supplemented by forest and water land use data
• Automated classification of Landsat-7 imagery overlaid onto data used in DEIS
• Map of upland habitats; and forest, wetlands, and water land cover
Wetlands
• Wetland locations • Database on wetlands developed for
National Wetlands Inventory, supplemented by local reference materials and photographs
• GIS data on wetlands were mapped • Map of wetlands
• Wetland locations in relation to other activities
• GIS data used for DEIS and Landsat-7 imagery
• Automated classification of remotely sensed imagery, with field verification
• Map of wetlands with land uses
6.3 Compiling Information on Costs Costs of RS/GIS Products Oak Ridge National Laboratory (ORNL) did the image processing and LULC classification described in Section 4, and some of the data preparation for the environmental disciplines described in Section 5. WSDOT did much of the data processing, data integration, and statistical data generation described in Section 5. The costs of producing the RS/GIS maps and statistics were the sum of ORNL’s and WSDOT’s costs. Estimating these costs was not straightforward. ORNL’s and WSDOT’s work was part of a larger research project. Only part of the total cost of their study was attributed to developing the RS/GIS products, per se. ORNL did not document the costs of doing the latter separately from the overall study effort. Another complication in estimating the costs of the RS/GIS products is that, as is evident from the previous sections of this report, the remote sensing approach usually does not focus on one discipline at a time. The automated parts of the LULC classification were done simultaneously for all of the categories. Other procedures described in Sections 3 to 5 vary somewhat between the various disciplines. However, ORNL did not separately record its costs for each

46
environmental discipline. Thus, to estimate the cost for one discipline, we used an average cost, dividing ORNL’s estimated cost of producing all of the products divided by the number of disciplines in which LULC maps were used. WSDOT had similar issues in estimating its costs of producing the RS/GIS products. In addition to their usual day-to-day responsibilities apart from this research project, much of the time WSDOT staff spent on the study was for producing the reports for RSPA, conferences, research, reviewing the literature and draft documents, the write-ups describing the web site, contract management, and producing the web site for the cost-value analysis. None of these costs was included in the estimate of the costs of the RS/GIS products. Rather, the costs estimated by ORNL and WSDOT were based on the level of effort that would have been required to produce the maps and statistics alone, including the ground-truthing needed for LULC verification and validation, as if these products had been used in the DEIS. The cost of producing the RS/GIS products did not include the following costs:
• drafting notes, monthly reports, research reports (including this one), • research other what would have been needed for the RS/GIS products,
including this cost-value analysis, • conference participation, web sites, and project management, and • other activities that would not have been required if the task had been
solely to produce the RS/GIS products. Note too that there are cost advantages to using RS/GIS analysis, which our study did not assess:
(a) economies of scale – one of the advantages of RS/GIS analysis is that
LULC classifications can be done virtually simultaneously for several LULC categories, which is not the case when using conventional methods.
(b) geographic scale – with RS/GIS analysis, the additional cost of studying a
larger geographic area does not increase in proportion to the size of the area; rather, the incremental costs usually decrease; and
(c) transferability – LULC classification algorithms identified in one study can
be used elsewhere as starting points for defining algorithms for these other sites.
Costs of Work Done on the Environmental Disciplines for the DEIS We did not attempt to estimate the costs of producing the maps used in the DEIS. The contractors that did this work did not keep track of these costs separate from the overall cost for their work on each environmental discipline. Thus, as discussed in the next section, the value of the RS/GIS products was assessed relative to the total cost of the work done for the corresponding discipline, rather than to the costs of generating the DEIS maps alone.
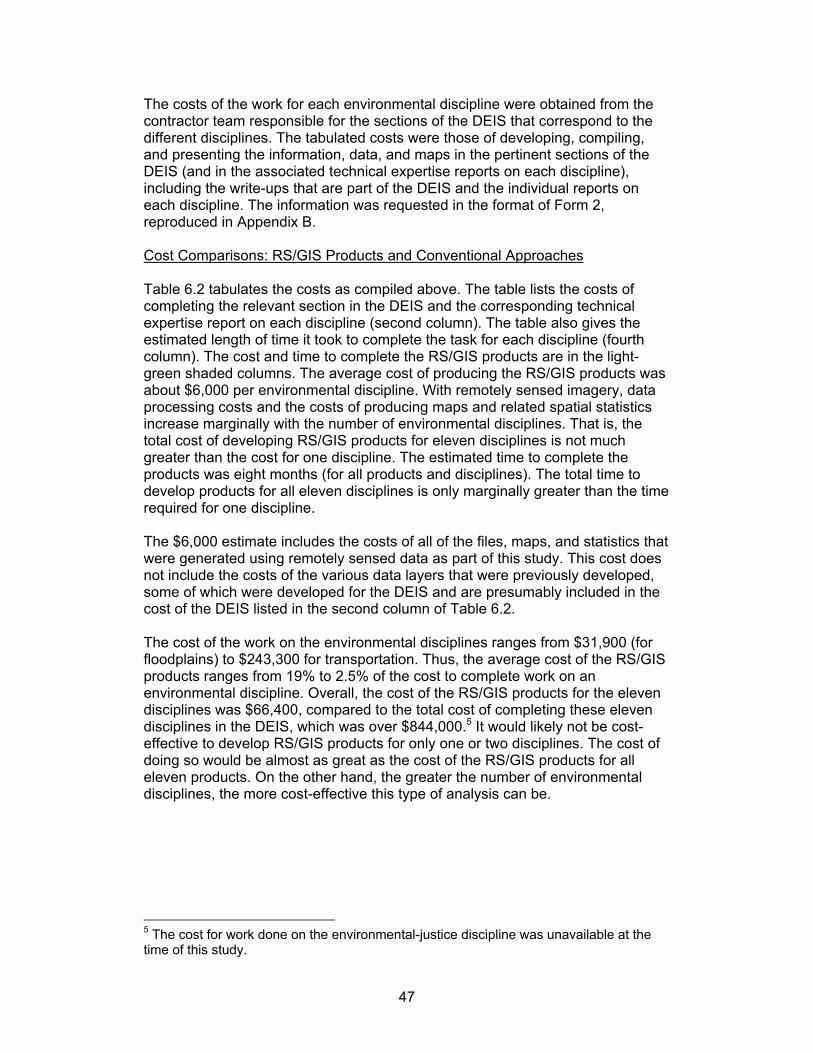
47
The costs of the work for each environmental discipline were obtained from the contractor team responsible for the sections of the DEIS that correspond to the different disciplines. The tabulated costs were those of developing, compiling, and presenting the information, data, and maps in the pertinent sections of the DEIS (and in the associated technical expertise reports on each discipline), including the write-ups that are part of the DEIS and the individual reports on each discipline. The information was requested in the format of Form 2, reproduced in Appendix B. Cost Comparisons: RS/GIS Products and Conventional Approaches Table 6.2 tabulates the costs as compiled above. The table lists the costs of completing the relevant section in the DEIS and the corresponding technical expertise report on each discipline (second column). The table also gives the estimated length of time it took to complete the task for each discipline (fourth column). The cost and time to complete the RS/GIS products are in the light-green shaded columns. The average cost of producing the RS/GIS products was about $6,000 per environmental discipline. With remotely sensed imagery, data processing costs and the costs of producing maps and related spatial statistics increase marginally with the number of environmental disciplines. That is, the total cost of developing RS/GIS products for eleven disciplines is not much greater than the cost for one discipline. The estimated time to complete the products was eight months (for all products and disciplines). The total time to develop products for all eleven disciplines is only marginally greater than the time required for one discipline. The $6,000 estimate includes the costs of all of the files, maps, and statistics that were generated using remotely sensed data as part of this study. This cost does not include the costs of the various data layers that were previously developed, some of which were developed for the DEIS and are presumably included in the cost of the DEIS listed in the second column of Table 6.2. The cost of the work on the environmental disciplines ranges from $31,900 (for floodplains) to $243,300 for transportation. Thus, the average cost of the RS/GIS products ranges from 19% to 2.5% of the cost to complete work on an environmental discipline. Overall, the cost of the RS/GIS products for the eleven disciplines was $66,400, compared to the total cost of completing these eleven disciplines in the DEIS, which was over $844,000.5 It would likely not be cost-effective to develop RS/GIS products for only one or two disciplines. The cost of doing so would be almost as great as the cost of the RS/GIS products for all eleven products. On the other hand, the greater the number of environmental disciplines, the more cost-effective this type of analysis can be.
5 The cost for work done on the environmental-justice discipline was unavailable at the time of this study.

48
Table 6.2: Cost and Time Comparison – Cost and Time of Producing the DEIS Section on the Environmental Discipline and the Corresponding Technical
Expertise Report, Compared to the RS/GIS Products
Environmental Discipline Cost (in thousands of dollars)
Time Span to Complete (in calendar months)
DEIS Section and Technical
Report
RS/GIS Products(1)
DEIS Section and Technical
Report
RS/GIS Products
Environmental justice
n/a(2)
6.0
n/a
8
Farmland
37.0 6.0 6 8
Fish and aquatic habitat
101.6 6.0 24 8
Floodplains
31.9 6.0 6 8
Land use
73.8 6.0 15 8
Recreational resources
67.2 (3) 6.0 6 (4) 8
Shorelines
57.6 6.0 13 8
Surface water resources
75.8 6.0 20 8
Transportation
243.3 6.0 19 8
Upland vegetation, habitat, and wildlife
79.5 6.0 19 8
Wetlands
76.1 6.0 17 8
Total for the disciplines listed above
843.8 66.4 24(5) 8(6)
Notes for Table 6.2: (1) Cost estimate for RS/GIS products for each environmental discipline is the average cost per discipline (i.e., the total cost divided by the number of discipline categories). (2) n/a means that the information was not available at the time of this study. (3) Includes the cost of the 4(f) evaluation. (4) Assumes that the 3 months to complete the 4(f) requirement were within the 6-month period required for assessment of recreational resources. (5) Work on each discipline is assumed to take place simultaneously, so that the total time for all disciplines is estimated to be the greatest amount of time required for one of the disciplines – in this case, 24 months.
6 The cost for work done on the environmental-justice discipline was unavailable at the time of this study.

49
(6) In the RS/GIS approach, all disciplines are processed simultaneously for the most part. Thus, the total amount of time required for all disciplines is about the same as the time taken for one discipline.
Time Comparisons For both the RS/GIS products and DEIS analysis, the estimated length of time to complete the products was based on the actual calendar time span (not person-months, or the length of time if all of the resources had been deployed full time). Many of these tasks are done simultaneously, resources permitting. We would expect that all of the work done on the DEIS using conventional methods could be completed within twenty-four months, the longest time it took to complete work on one discipline (viz., fish and aquatic habitat). The estimated time to complete the work on all of the RS/GIS products was eight months. We developed this estimate by gauging the time we think it would take to complete these products, assuming that this is the only task. We actually took much longer to complete the products, but most of this time was spent on other aspects of the research project including methodology development, survey design and implementation, and report writing. None of these other tasks would need to be done if comparable RS/GIS products were to be developed in the future. Some of the disciplines were addressed more quickly using conventional methods – for example farmlands, floodplains, and recreational areas. In the other cases, the time required to complete work on the disciplines using conventional methods was in the range of one to two years. Thus, the time required to complete the RS/GIS products was well within the overall timeframe required to complete the DEIS. These products could be provided in the early part of the EIS process, with analysis and writing done after the data compilation is done.
6.4 Developing Information on the Value of the RS/GIS Products The Perspective of the Users of the Information: Case Study Protocol The value of the information in the RS/GIS products developed in Sections 3 to 5 was assessed from the perspective of the potential users of the information, within the context of their particular needs. That is, users of this information were asked to assess the value and usefulness of the products. This aspect of the approach is a particularly important feature of this study. The gauge of the value of the RS/GIS products was not be based on remote-sensing experts' assessments of imagery, nor on statistical estimates of the accuracy of classification algorithms, but rather on assessments by those who would be viewing and using the information as part of a NEPA process. There are many different types of users of DEIS-related information. They include project applicants; review and cooperating agencies; other Federal, state, regional, local, and tribal organizations; the DEIS contractor team; and other

50
stakeholders. Given the limitations in administering the survey, there were thirteen respondents. The respondents included seven stakeholders involved in the I-405 project, including the Principal Transportation Planner of the lead agency responsible for the DEIS and staff from some of the review agencies; the prime DEIS contractor that wrote most of the sections of the DEIS document, and one subcontractor; and staff from four state DOTs outside WSDOT. The state DOT staff assessed the value of the information from the standpoint of their using this type of information for their own needs. The sample was obviously of insufficient size to draw general conclusions from their responses. Survey respondents were asked to make their assessments using Form 3, shown in Appendix B. In a paper or web-based format, respondents were given the relevant section of the DEIS, the maps from the DEIS, and the RS/GIS products.7 They were asked to review the information and to complete the form. Since RS/GIS is intended primarily as a supplement or complement, rather than as a substitute, for current practice, respondents were asked to assess the value of the RS/GIS products in terms of their incremental contribution, as reflected in Question 3 of Form 3. The responses to the questions in Form 3 provide information about the value of the RS/GIS products, their usefulness, and suggestions for improving them. Respondents were asked either to assess separately the value of RS/GIS products for each discipline, or in general for all disciplines. The estimated cost, for the work required to complete the section of the DEIS that corresponds to the discipline under consideration (refer to Section 6.3), provides a baseline with which to estimate the value of the RS/GIS products for that discipline. Sources of Possible Respondent Bias Among the respondents, the I-405 stakeholders represent the primary users of this type of information. Thus, their responses should probably carry the most weight. Also, these stakeholders would probably be the least biased among all of the respondents, unless for some reason an individual liked or disliked the DEIS or perhaps the I-405 project in general, which might respectively lead to less or more favorable assessments of the RS/GIS products. Some of the other responses could be biased. As discussed below, the contractor team could perhaps underestimate the value of the RS/GIS products and respondents from other state DOTs could overestimate their value. The contractor team would be potential users of RS/GIS information as part of their work to draft the DEIS. Thus, they could assess the RS/GIS products solely in terms of their task of writing an acceptable document as cost-effectively as possible, given a fixed-price contract. Insights or other benefits from the information could be of secondary importance to them. The contractor team might also have an incentive to indicate that the value of these products is modest relative to their own, already expended, efforts in drafting the DEIS (though this possibility is not to suggest that this consideration was actually a factor in their responses). 7 http://www.wsdot.wa.gov/environment/envinfo/envinfo_i405survey.htm

51
From this standpoint, the other respondents could have been less biased because they did not have their own products and drafts under scrutiny; they were not in a situation where they could be defensive about their own work. These other respondents were stakeholders and from other state DOTs. The latter group, however, were less knowledgeable about the I-405 project and about the cost of the work done for the DEIS. While a contractor team might have been providing the assessments thinking that the cost of the products would have come out of its own budget to do the work, the other state DOTs had no concern about the cost of the I-405 study and could have been overly “generous” in valuing these products. There could also be some “self-selection bias” among these respondents in that those who responded could be more interested in the subject than non-respondents, or possibly even have pre-conceived notions favoring the use of remote sensing technologies. These possible sources of bias should be kept in mind when viewing the survey results. Value of the RS/GIS Products Table 6.3 tabulates the respondents’ assessments of the value of the RS/GIS products developed for this study. Value is measured as a percentage of the total cost of completing work on that discipline for the DEIS, and is also expressed in monetary terms. As a group, the stakeholders reviewed most of the material. Some provided assessments for individual disciplines. Two gave overall assessments after reviewing all of the material. Their responses are summarized collectively in the second column of the table. The DEIS contractor team’s responses covered ten of the eleven disciplines, and their responses are tabulated in the third column. The respondents from other state DOTs assessed only one, or a few, disciplines. Their responses are presented collectively in the last column in the table. Respondents’ assessments of the value of RS/GIS products varied, depending on the environmental discipline. Among the respondents from the stakeholder group who focused on the material for individual disciplines, the value of the RS/GIS material varied, as summarized in Table 6.4. An important consideration is that different stakeholders assessed the material for different disciplines. A respondent could review three disciplines and would generally provide a single assessment of the value of these materials, without distinguishing the value among them (as discussed below, the contractor team provided separate assessments). Another stakeholder respondent would generally, but not always, review the material for a different set of disciplines.

52
Table 6.3: Range of Estimated Value of RS/GIS Products, Relative to the Cost of Completing Work on the Corresponding Environmental Discipline for the DEIS (1)
Environmental Discipline I-405
Stakeholders' Responses (2)
DEIS Contractors’ Responses (2)
Other State DOTs’
Responses Environmental justice
<<1%
n/a (3)
n/a
Farmland
10% - 15% $3.7K - $5.6K
0% $0K
n/a
Fish and aquatic habitat
15% $15.2K
0% $0K
n/a
Floodplains
1% - 15% $0.3K - $4.8K
1% $0.4K
n/a
Land use
5% - 15% $3.7K - $11.1K
5% -10% $3.7K - $7.4K
n/a
Recreational resources
1% $0.7K
0% $0K
n/a
Shorelines
n/a
5% -10% $2.9K - $5.8K
n/a
Surface water resources
n/a
<<1% - 5% <<$0.8K - $3.8K
Uncertain
Transportation
1% $2.4K
<<1% <<$2.4K
1% - 5% $2.4K - $12.2K
Upland vegetation, habitat, and wildlife
10% - 15% $8.0K - $11.9K
1% - 5% $2.0K - $4.0K
n/a
Wetlands
10% - >15% $7.6K - >$11.4K
1% - 5% $0.8K – $3.8K
n/a
Overall assessment (4) (all disciplines)
1% - 10% $8.4K- $84.4K(5)
<$13K- $27.6K(6) No basis for estimating value Depends on review agencies’ assessment
Notes for Table 6.3: (1) Because of the limited number of respondents, the specific RS/GIS methods used in this case study, and the study context itself – the responses reported in this table should not be interpreted as general conclusions about the value of RS/GIS products. (2) Range of values is the range across all individuals in this category of respondents.

53
(3) n/a means estimate “not available” – no estimate was provided (4) Some respondents reviewed all of the material covering all environmental disciplines and provided an overall assessment, rather than for individual disciplines. The values listed for individual disciplines do not add up to the values for the overall assessments. They were from different respondents. (5) Does not include the value of RS/GIS products for the Environmental Justice discipline. (6) Responses for individual categories were provided by one person (except for a second response for the Surface Water category. The range for the contractor team’s Overall Assessment is the sum of the values for the individual categories. _____________ Table 6.4: I-405 Stakeholder Respondents’ Relative Valuing of RS/GIS Products
for Different Environmental Disciplines
Relative Value of RS/GIS Products Environmental Disciplines Most valuable (a relatively high percentage of the cost of the work done for the DEIS, and an estimated monetary value whose range approximates or exceeds the cost of producing the RS/GIS products
• Fish and Aquatic Habitat • Land Use • Upland Vegetation, Habitat,
and Wildlife • Wetlands
Somewhat less valuable (lower percentage of the cost of the work done for the DEIS, and an estimated monetary value whose range is somewhat less than the cost of producing the RS/GIS products
• Farmland • Floodplains
Least valuable (very low percentage of the cost of the work done for the DEIS, and an estimated monetary value whose is well below the cost of producing the RS/GIS products
• Environmental Justice • Recreational Resources • Transportation
Two stakeholder respondents viewed the material for all of the disciplines. One person considered the RS/GIS material to be worth about 1% - 5% of the cost of producing the DEIS, which would be less than the cost of producing the RS/GIS material. The other person considered the material to be worth about 5% - 10% of the cost of the DEIS, which would be less than the cost of the material at the low end of this range, and greater at the high end. As discussed previously, it is unclear whether the respondents intended their assessments to be incremental values, in addition to the value of the DEIS material, or total values.
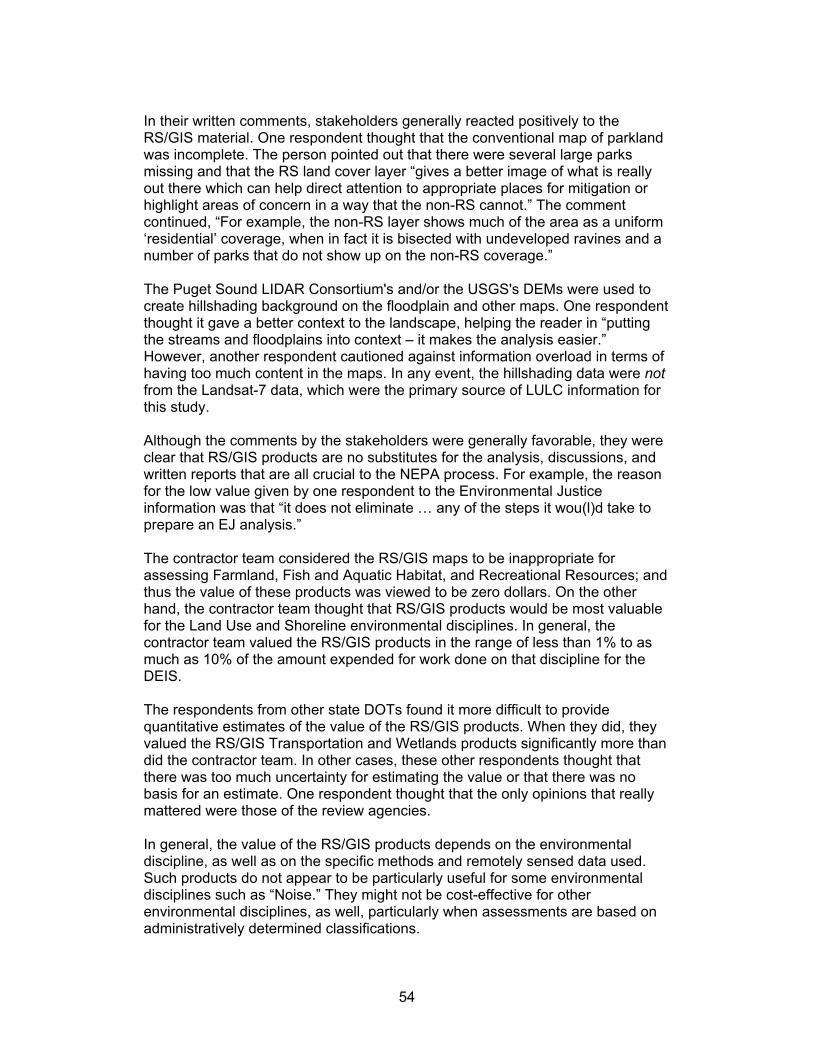
54
In their written comments, stakeholders generally reacted positively to the RS/GIS material. One respondent thought that the conventional map of parkland was incomplete. The person pointed out that there were several large parks missing and that the RS land cover layer “gives a better image of what is really out there which can help direct attention to appropriate places for mitigation or highlight areas of concern in a way that the non-RS cannot.” The comment continued, “For example, the non-RS layer shows much of the area as a uniform ‘residential’ coverage, when in fact it is bisected with undeveloped ravines and a number of parks that do not show up on the non-RS coverage.” The Puget Sound LIDAR Consortium's and/or the USGS's DEMs were used to create hillshading background on the floodplain and other maps. One respondent thought it gave a better context to the landscape, helping the reader in “putting the streams and floodplains into context – it makes the analysis easier.” However, another respondent cautioned against information overload in terms of having too much content in the maps. In any event, the hillshading data were not from the Landsat-7 data, which were the primary source of LULC information for this study. Although the comments by the stakeholders were generally favorable, they were clear that RS/GIS products are no substitutes for the analysis, discussions, and written reports that are all crucial to the NEPA process. For example, the reason for the low value given by one respondent to the Environmental Justice information was that “it does not eliminate … any of the steps it wou(l)d take to prepare an EJ analysis.” The contractor team considered the RS/GIS maps to be inappropriate for assessing Farmland, Fish and Aquatic Habitat, and Recreational Resources; and thus the value of these products was viewed to be zero dollars. On the other hand, the contractor team thought that RS/GIS products would be most valuable for the Land Use and Shoreline environmental disciplines. In general, the contractor team valued the RS/GIS products in the range of less than 1% to as much as 10% of the amount expended for work done on that discipline for the DEIS. The respondents from other state DOTs found it more difficult to provide quantitative estimates of the value of the RS/GIS products. When they did, they valued the RS/GIS Transportation and Wetlands products significantly more than did the contractor team. In other cases, these other respondents thought that there was too much uncertainty for estimating the value or that there was no basis for an estimate. One respondent thought that the only opinions that really mattered were those of the review agencies. In general, the value of the RS/GIS products depends on the environmental discipline, as well as on the specific methods and remotely sensed data used. Such products do not appear to be particularly useful for some environmental disciplines such as “Noise.” They might not be cost-effective for other environmental disciplines, as well, particularly when assessments are based on administratively determined classifications.

55
The contractor team tended to value the RS/GIS products less than did the other respondents. Compared to the cost of producing the RS/GIS materials – an average of $6,000 per environmental discipline – the contractor team generally regarded their value to be less than their cost, while the other respondents thought they were worth more than their cost. The very limited number of responses must be kept in mind, however, and additional study to obtain a larger sample of respondents is recommended. Caveats and Suggested Refinements of the Methodology Of all of the questions in the survey, this question – the one asking for estimates of the value of the RS/GIS products – was probably the most difficult to answer. The concept of value is distinct from that of cost. Value is manifested in the benefit of the products to its users, whereas cost refers to the monetary cost of making the products. In the survey, we attempted to gauge the value of the RS/GIS products for a given discipline by asking respondents about their hypothetical "willingness to pay" for them, relative to the total cost of the DEIS material for that discipline. Specifically, the question was phrased in such a way that respondents were asked how much they valued the products as a percentage of the total cost of completing the data compilation, analysis, and write-up for the DEIS.8 This phrasing of the question has both advantages and disadvantages. The major advantage is that respondents were not forced to provide a dollar amount or range – which is typically difficult for respondents to do. A disadvantage was that there was not a direct comparison between the cost of developing the RS/GIS products and the cost of the corresponding data compilation and GIS products in the DEIS. Perhaps the most important caveat about the results is that it is unclear whether the value of the information used in the analysis and write-up were taken into account in valuing these products. That is, the value of the products, as distinct from their cost, is more than just the cost of generating the maps. In particular, the value of the products includes the value of the information used to generate the maps, the value of the land use and land cover statistics calculated from the products, and the value of the insights from studying the maps. This information and insights are used in the analysis and to write the DEIS report. A way of estimating the lower bound on the monetary value of the GIS/RS products is first to develop estimates of the cost of only the GIS work done for the DEIS – including the effort and cost of compiling the data but excluding the analysis of information and the writing of the DEIS itself.9 Then the responses to 8 Respondents were not provided with any information about the cost of either the RS/GIS products or the DEIS material. Perhaps if respondents had been provided with the cost information in Table 6.2, they would have given responses that more accurately reflected their assessment of the RS/GIS products. These data were not provided, however, because it was felt that they could bias the responses. 9 Note that most of the effort and cost of developing map products is in acquiring the data, not in “drawing” the maps. Thus, the cost of generating the maps, per se, is not a good gauge of their total cost.

56
the usefulness of the GIS/RS products, summarized in Tables 6-4 and 6-5, would indicate their value in the following way. If the GIS/RS products were considered to be at least as useful as the conventional information, then the value of the GIS/RS products would be at least the cost of producing the information for the DEIS, i.e., the cost of producing the products is a lower bound on their value. Note that some of the responses might not be consistent with this premise. A refinement of the survey form also merits consideration. The wording of the question was. “Considering the cost of completing the work on this environmental Discipline, what would it have been worth (either in addition to or instead of some of the original expense) to have had the RS/GIS products available for the DEIS and expertise reports, or as supplementary material? Please circle one of the choices …” Respondents could have one of two different interpretations of this question. One interpretation is that an assessment of the incremental value of the RS/GIS products is being requested – over and above the cost and value of the existing map products in the DEIS. In this case, the overall value of the RS/GIS products would be the value of the DEIS material plus the value indicated in response to the question. An alternative interpretation, however, is that an assessment of the total value of the RS/GIS products is being requested. In this latter case, the value of the RS/GIS products is simply the value indicated in response to the question. If they are considered to be adequate substitutes or even better than the information in the DEIS then, as previously discussed, their value would presumably be at least the cost of the compiling the data and the maps in the DEIS. One final caveat is important to comparing the two sets of materials. Sometimes, it is difficult to assess the contribution of the remotely sensed data to the map product, as opposed to differences in cartographic quality and presentation. For example, the Wetlands data used in both sets of maps were identical. What differed was the LULC information in the RS/GIS product, which provided a contextual landscape for studying the wetlands.
6.5 Usefulness of Remote Sensing Products for Environmental Analysis and Transportation Planning In a brochure describing the NCRST-E consortium, Dr. Fenton Carey, past DOT RSPA Associate Administrator for Innovation, Research and Technology is quoted as saying that, “We want the transportation community to understand the benefits of remote sensing, … and over time, (to) become owners of these technologies and improve the transportation system we all use.” Remote sensing specialists have pointed out many opportunities for these technologies in environmental assessment of transportation projects (TRB 2000; King and O’Hara, no date; Laymon et al. 2001). Indeed, the NCRST-E has as its mission the goals of developing remote sensing technology solutions for assessing the implications of transportation on the environment and of helping to move these solutions to the mainstream of practice. Jensen (2000) has cautioned, however, that, “The knowledge gap needs to be bridged between the transportation and remote-sensing communities. In
57
particular, he noted that, “State transportation departments and other agencies should carefully outline their information requirements …” This section summarizes results from Questions 2, 4, 5, and 6 in Form 3 of the interview (refer to Appendix B). As previously stated, the responses were provided by individuals who researched and wrote sections of the DEIS and Technical Expertise Reports and by others who were generally with other state DOTs. In their responses, they assessed the extent to which the RS/GIS products would meet information requirements for a DEIS, as required under NEPA. Table 6.5 lists the results of interviews about the extent to which the RS/GIS products are comparable to conventional maps, as developed for the DEIS itself. Those interviewed were asked the following question: Compared to the work done for the environmental discipline in the DEIS, would the RS/GIS products:
• Be a comparable substitute for some of the information or data used, or
work done for the DEIS, • Improve the DEIS by replacing some of the information used or work done
for it, • Complement or supplement the DEIS by providing additional useful
information, or • Detract from the DEIS (if the RS/GIS products had been the only data
available)? Table 6.6 summarizes the responses about the level of detail provided by the RS/GIS products compared to conventional maps. The choices given to the respondents were the following:
• The DEIS provides a more appropriate level of detail • The RS/GIS products provide a more appropriate level of detail • There is no difference between the DEIS and RS/GIS products regarding the
appropriate level of detail • Neither the DEIS and RS/GIS products provide the appropriate level of detail.
Perhaps the most important question is whether RS/GIS products could be so significant that they might alter conclusions about parts of the I-405 corridor study. The responses to this question are tabulated in Table 6.7. Overall, the assessments about the usefulness of the RS/GIS products varied depending on the environmental discipline, as well as on the respondent: Environmental justice: The stakeholder who commented on the Environmental
Justice material thought there was no significant difference between the RS/GIS products and the material from the DEIS. The person pointed out that remote sensing itself does not identify minority populations and cautioned that it “seems a little dangerous to have remote sensing and minority labels on the same map without clearer explanation.” A respondent from another
58
state DOT thought that the RS/GIS and conventional-map information were comparable (aside from data from different years’ Census being used in the two sets of maps). The level of detail was perceived to be the same; and the RS/GIS products would not affect the respondent’s conclusions about the I-405 study.
Farmland: The contractor team pointed out that the RS/GIS farmland map
overstates the amount of farmland subject to protection in the study area. If the RS/GIS map had been used, then the DEIS would have identified impacts to farms that are not under protection. Farmland under protection is termed “prime,” “unique,” or “statewide or locally important,” and does not include all farmland identified on a purely land-cover basis. A respondent from another state DOT had the impression that the RS/GIS farmland maps were lacking some information. In general, remote sensing technologies do not identify legally or administratively defined areas, such as designated protected farmland, though they could be used to supplement other information sources.
Fish and aquatic habitat: The respondents had different opinions about the
usefulness of the RS/GIS products. The stakeholder thought that the RS/GIS material had the more appropriate level of detail and that the information was useful. The contractor team, on the other hand, thought that the fish and aquatic habitat maps would detract from the DEIS. The statistics on “land cover” and “land use” in the RS/GIS material were considered to be less directly useful to analysis than the “impervious surface” quantities from King County which were used in the DEIS document. (It is unclear how the latter were originally derived – perhaps from estimates of land use and land cover.) A respondent from another state DOT preferred the RS/GIS material, considering them to have more detail. One stakeholder cautioned against trying to convey too much information in some of these maps: “Some of the maps have too much information to clearly portray the topic area, e.g, ‘Soils Potentially Suitable for Stormwater Recharge’ and potentially the wetlands mapping.”
Floodplains: The two stakeholders who commented specifically about the
material for this environmental discipline favored the RS/GIS material. The contractor team regarded the two sets of materials as being comparable, noting though that the RS/GIS files took much longer to load and thus possibly to manipulate. The contractor team noted that the floodplain databases appeared to differ. (This question should be addressed, but the difference is not inherent to the two different methods being compared.)
Land use: The two stakeholders who provided specific assessments for this
environmental discipline both favored the RS/GIS material. One stakeholder commented that the comparison of land use and land cover information “gives a better depiction of the landscape context” than the material in the DEIS. The contractor team regarded the RS/GIS maps and statistics as improving identification of most major land uses in each drainage basin: “This added information is helpful in portraying the overall extent and location of land uses potentially sensitive to project alternative actions.” The contractor team noted that maps based on remotely sensed imagery could be manually

59
augmented, for example adding a category for government land use. All respondents pointed out that the RS/GIS maps had more detail and thought that they would have improved the DEIS study. One respondent thought that the products could even lead to different conclusions. He pointed out that the more accurate and detailed breakdown of land uses (especially undeveloped land) could require more analysis of the impacts of project alternatives on these areas. He also noted that the quantification of major land uses in different drainage basins would “be particularly helpful in doing a more accurate and cost effective analysis of potential … impacts on various water-related and fish/wildlife elements of the DEIS.” A respondent from another state DOT mentioned that the RS/GIS maps would be “useful for corridor-level analysis to gain a general understanding of environmental constraints.” He stated, however, that this information “would not be of sufficient detail for alternative-level analyses.”
Recreational resources: One stakeholder noted that the LULC classification
missed a lot of public open spaces and parks, and that this information is readily available from the local jurisdictions. The person had the same comment about the DEIS material as well, and generally preferred the RS/GIS material. Both the contractor team and one of the respondents from another state DOT thought the RS/GIS products on recreational resources would have detracted from the DEIS. They thought the RS/GIS maps were less accurate and precise than the corresponding maps used in the DEIS. One respondent observed that “when the (remote sensing) data were combined with the GIS data, this tended to make potential direct effects on publicly owned recreation resources less easy to identify visually.” The contractor team noted that “the inclusion of privately owned golf courses which do not meet the definition for a Section 4(f) resource might lead the user to conclude a greater level of potential impact than actually was the case.” Both approaches require supplemental field investigations; and these could be used to validate and revise classifications from the remotely sensed data.
Shorelines: One respondent thought that the RS/GIS material improves the
information on streams, basins, and shorelines. Some of the same databases were used in the two sets of material, i.e., the jurisdictional shorelines. The additional layer of land use information in the RS/GIS map was regarded as being useful in portraying the overall extent of natural condition shorelines within the study area.
Surface water resources: Respondents had different opinions about the
usefulness of the RS/GIS products for this discipline. One stakeholder thought that “Especially for surface water information, the products helped to answer the natural ‘next question.’ Where, specifically are sediment loads or other water quality problems occurring …” Another stakeholder thought that, “More specific segment data on the water quality maps is helpful.” On the other hand, a contractor regarded the RS/GIS products as being comparable to the conventional products. Stream and basin information compiled for the I-405 project was also used in the RS/GIS maps. Another contractor observed that some of the information compiled for the I-405 project, such as detention ponds, was not included in the RS/GIS maps, and these omissions

60
detracted from these maps. He also thought that “the land cover data is a definite plus and would have been useful for the DEIS analysis.” A respondent from another state DOT thought the RS/GIS would improve the DEIS: “RS/GIS products help to clearly identify potential contaminant receptors such as wetlands, areas of stressed vegetation associated to surface water runoff or other factors, the presence of suspected contaminated soils in areas of proposed construction, etc.” Most of these data layers had been previously developed, so that this respondent’s assessment points to the importance of using existing GIS layers in combination with remotely sensed data.
Transportation: The respondents thought that the RS/GIS transportation maps
were preferable to the conventional maps. The contractor team and someone from a state DOT observed that the RS/GIS products would replace a “sketched” approximation with more accurate information. One respondent noted that the RS/GIS map would allow “more precise screenline analysis for traffic volumes, travel times, and person demand.” According to this respondent, the benefit of these improvements would not likely change conclusions in the analysis, but it could improve the public’s confidence in it.
Upland vegetation, habitat, and wildlife: The contractor team thought that the
RS/GIS material would both complement and improve conventional maps because they provided more detail. The contractor team also thought that it would be useful to have statistics on linear feet of habitat affected. Overall, he thought the RS/GIS products would not change any conclusions in the analysis of this environmental discipline.
Wetlands: One stakeholder felt that “having the land cover background … puts
the wetlands in a better context for analysis.” A respondent from another state DOT thought that by providing “higher resolution RS/GIS provides a more realistic look of the resource.” The RS/GIS map is “much better by showing far more complexity than the DEIS map,” which is “useful for comparing areas of impacts as well as potential mitigation areas.” Interestingly, this respondent also stated that the “RS/GIS illustrates more wetland coverage than the DEIS;” but actually the same wetlands database was used for both. The key difference of the RS/GIS maps is in providing information about the spatial context. As this respondent observed, this information is crucial to assess interrelationships between wetlands and the land uses that could affect them. Because of the differences between the two sets of maps, this respondent thought that the RS/GIS products could quite possibly lead to different public perceptions and conclusions about the impacts of alternative projects. The contractor team reserved firm judgment about this until the accuracy of the methods is assessed using ground delineation data. If the RS methods are accurate, then he thought that they would have “the potential of being a powerful tool for more than just corridor studies.”
Overall assessment (all disciplines): Several respondents thought that most
sections of the DEIS would have benefited from the RS/GIS approach. “For example, you can better visualize where the major stream basins are & observe the spatial relationships between these basins, the highway, and

61
other spatial features (e.g., urbanized areas) where we would expect decreased aquifer recharge & increased surface water runoff & associated pollutants. A stakeholder remarked that, “Generally, there is more resolution. They provide you with a greater appreciation of the variation in conditions over the corridor. (The RS/GIS) technology surpasses that of the DEIS technology and would provide a better basis for impact review on the technical level.” Several other respondents, in their comments pertaining to individual discipline categories, echoed this assessment. One stakeholder also noted that there “ … should be careful consideration to the clarity of the information that is trying to be conveyed. More information is not always better.” The person added that, “ … there may be times when this level of detail is overwhelming or clutters the map and prevents clear understanding of the topic area.”

62
Table 6.5: Assessment of Which Format Provides a Level of Detail More Appropriate to a Corridor Level of Environmental Review:
Number of Respondents Who Favored Each Type of Product (1), (2)
Environmental Discipline I-405 Stakeholders' Responses
DEIS Contractors’ Responses
Other State DOTs’ Responses
Conv’l Maps
RS/GIS Conv’l Maps
RS/GIS Conv’l Maps
RS/GIS
Environmental justice
1 nd (3)
1 nd
1 nd
1 nd
Farmland
1 1
Fish and aquatic habitat
1 1 1
Floodplains
1 nd
1 1 nd
1 nd 1 nd
Land use
2 1 1
Recreational resources
1 nd 1 nd 1 1
Shorelines
1 1
Surface water resources
1 1
Transportation
1 1 1
Upland vegetation, habitat, and wildlife
1
Wetlands
2 1
Overall assessment (4) (all disciplines)
1 nd
2 1 nd
1 nd 1 nd
Notes for Table 6.5: (1) Number of respondents who favored either the conventional maps or the RS/GIS products. Different respondents reviewed the material for different disciplines. Some respondents reviewed material for more than one discipline. Because of the limited number of survey respondents, the specific in RS/GIS methods used in this case study, and the study context itself – the opinions of the respondents reported in this table should not be interpreted as general conclusions about the appropriateness of RS/GIS products. (2) A blank entry for both Conventional Maps and RS/GIS means that there was no assessment for that discipline among that group of respondents. (3) No difference between the two types. “1 nd” means that another respondent said there was no difference between the two types in terms of the appropriate level of detail. (4) Individuals’ overall assessments are not included in the tabulation of the number of responses for each individual discipline.

63
Table 6.6: Usefulness of RS/GIS Products: Number of Respondents Who Favored Conventional Maps in the DEIS and Number Who Regarded the RS/GIS Products as
Being Comparable, Complementing, or Improving the Information (1), (2)
Environmental Discipline I-405 Stakeholders' Responses
DEIS Contractors’ Responses
Other State DOTs’ Responses
Conv’l Maps
RS/GIS Conv’l Maps
RS/GIS Conv’l Maps
RS/GIS
Environmental justice
1
nd
nd
Farmland
1 1
Fish and aquatic habitat
1 1
Floodplains
2 nd nd
Land use
2 1 1
Recreational resources
1 1 1
Shorelines
Varied(3) Varied 1
Surface water resources
1 2
Transportation
1 1 1
Upland vegetation, habitat, and wildlife
1
Wetlands
2 1
Overall assessment (4) (all disciplines)
2 2
Notes for Table 6.6: (1) The numbers in the table refer to the number of respondents who favored either the conventional maps or the RS/GIS products. Different respondents reviewed the material for different disciplines. Because of the limited number of interviews, the specific RS/GIS methods used in this case study, and the study context itself – the opinions of the interviewees reported in this table should not be interpreted as general conclusions about the usefulness of RS/GIS products (2) A blank entry for both Conventional Maps and RS/GIS means that there was no assessment for that discipline among that group of respondents. (3) “Varied” means that different aspects of the RS/GIS products would be comparable to, improve, complement, or detract from the DEIS.

64
Table 6.7: Assessment of Whether the Information in the RS/GIS Products Would Lead to Different Conclusions than the Information Using Conventional GIS Methods:
“No” – the RS/GIS Information Would Make No Difference or Detract from the DEIS; “Yes” – the RS/GIS Products Could Alter Conclusions By Providing More/Better Information (1), (2)
Environmental Discipline I-405 Stakeholders' Responses
DEIS Contractors’ Responses
Other State DOTs’ Responses
No Yes No Yes No Yes Environmental justice
1
Farmland
1
Fish and aquatic habitat
1 1
Floodplains
1 1
Land use
1 1
Recreational resources
1 1
Shorelines
1
Surface water resources
1
Transportation
1 1 1
Upland vegetation, habitat, and wildlife
1
Wetlands
1 1
Overall assessment (4) (all disciplines)
2
Notes for Table 6.7: (1) The numbers in the table refer to the number of respondents who favored either the conventional maps or the RS/GIS products. Different respondents reviewed the material for different disciplines. Because of the limited number of interviews, the specific RS/GIS methods used in this case study, and the study context itself – the opinions of the interviewees reported in this table should not be interpreted as general findings about the effect of RS/GIS products on the conclusions of any NEPA analysis. (2) A blank entry for both Conventional Maps and RS/GIS means that there was no assessment for that discipline among that group of respondents.
65
7. CONCLUSIONS, CAVEATS, AND RECOMMENDATIONS We hope this study has contributed to bridging the transportation and remote-sensing communities. The study has provided land cover and land use information on the I-405 corridor, general guidelines for developing this type of information (also refer to Xiong et al., 2003), and a case study of the value and usefulness of remote sensing/geographic information system products. The study has demonstrated that remotely sensed data can be used productively in combination with GIS layers to generate useful maps and statistics that can be used as part of a transportation corridor study, as required by NEPA. RS/GIS products are particularly useful for environmental disciplines where it is important to consider land cover or spatial proximity to other land uses (e.g., land use, transportation, and wetlands). Several I-405 stakeholders also pointed out that RS/GIS products “may be even more useful in areas that have not been explored so heavily already” or where information quickly becomes outdated. Indeed, one person suggested that, “Ultimately, a change in process by using the RS/GIS methods as a foundation could make sense to start substituting other data like land use that expires quickly.”
On the other hand, if an environmental discipline requires information about administrative or legal units such as political boundaries or officially designated facilities or resources, then analysts should rely initially on official information about these entities. County and city designations are obvious examples. There might be previously developed GIS files on officially designated environmental disciplines, as well. An example is “prime,” “unique,” or “statewide or locally important” farmlands. However, there could be situations in which there is no or outdated information, and in these cases RS/GIS products could be very useful. From the survey responses, the RS/GIS material developed largely with Landsat-7 data were useful for environmental analysis at the corridor level. All of the stakeholder respondents and most of the respondents from other state DOTs thought that the RS/GIS products provided comparable, complementary, or improved information. Several respondents noted the improved spatial detail they provide (even at the coarse resolution of Landsat-7 imagery compared to IKONOS or other higher-resolution data). Respondents also mentioned the benefits of having land cover information as a context for viewing information about other environmental disciplines. Several stakeholders appeared to hint that perhaps RS/GIS technologies should be used more in such analyses. Some respondents thought that such material could conceivably alter some of the analysis for the environmental discipline or at least increase public confidence in it. But virtually all respondents made clear that NEPA analysis goes far beyond compiling, displaying, and statistically summarizing spatial data so that even if the RS/GIS products were superior, they would unlikely alter the basic conclusions in the EIS. Clearly, generalizations about the value RS/GIS products, relative to their costs, cannot be drawn from a single case study. Furthermore, study results should not be generalized to other remote sensing technologies, or to other regions whose environments are greatly different from the I-405 area. The classification methods in

66
our case study relied largely on LULC interpreted from Landsat data, with orthophotography and available GIS data used for reference. Future studies should assess the usefulness of other remote sensing technologies including more extensive analytic use of LIDAR, radar imaging and mapping, ground-penetrating radar, and high-resolution multi-spectral and hyperspectral imaging. In terms of the case study of the value and usefulness of RS/GIS products, the sample of those surveyed was not randomly drawn and it is of insufficient size for the responses to be statistically significant. The protocol itself could be improved, as well, to obtain information about the value of the data files and products for future or other applications and use – benefits that the case study did not consider. For these reasons, the survey results should be regarded as the individuals’ opinions, rather than as general conclusions, about the possible value and usefulness of RS/GIS products. Yet, we hope that the results will be sufficiently enlightening to help WSDOT and other environmental and transportation agencies in their planning for the development and use of some of these methods. We also hope that the results will be sufficiently interesting to encourage additional analysis of the value of using remotely sensed data in these types of applications, as well as of their limitations. Most of the responses were generally positive about the value and usefulness of the RS/GIS products. One stakeholder noted, “Using classification of imagery helps guide the reader to how things occurred more naturally before development enhancing the ability to see where environmental work may be more useful or simply raising awareness to what could be or has been in the area.” With such positive comments, expanding the case study, using the existing map products and perhaps a refinement of the interview protocol to a larger and more representative sample of respondents, would be a useful next step. One of the primary goals of this study was to help bridge the gap between remote-sensing experts and transportation professionals in terms of the potential value and usefulness of RS/GIS products for environmental analysis in transportation planning. We think the study has been successful at least to some degree. Our understanding is that some of these RS/GIS products are, in fact, being requested for use in ongoing and future studies of the I-405 corridor. In quantitative, economic terms, the respondents’ valuing of the RS/GIS products was inconclusive. At the low end, the values were less than the cost of developing the products. At the high end, the values were greater than the cost. Perhaps more telling than such numerical values are the qualitative assessments, such as that of one of the stakeholders:
“Although I am cautious about overstatements about the value of this technology, people in my agency indicate they think the remote sensing data are compelling added value. After reviewing the maps for all the topic areas provided, I conclude that ... the data are at least as good as the non-remote source data … such information should be more defensible upon challenge.”

67
APPENDICES
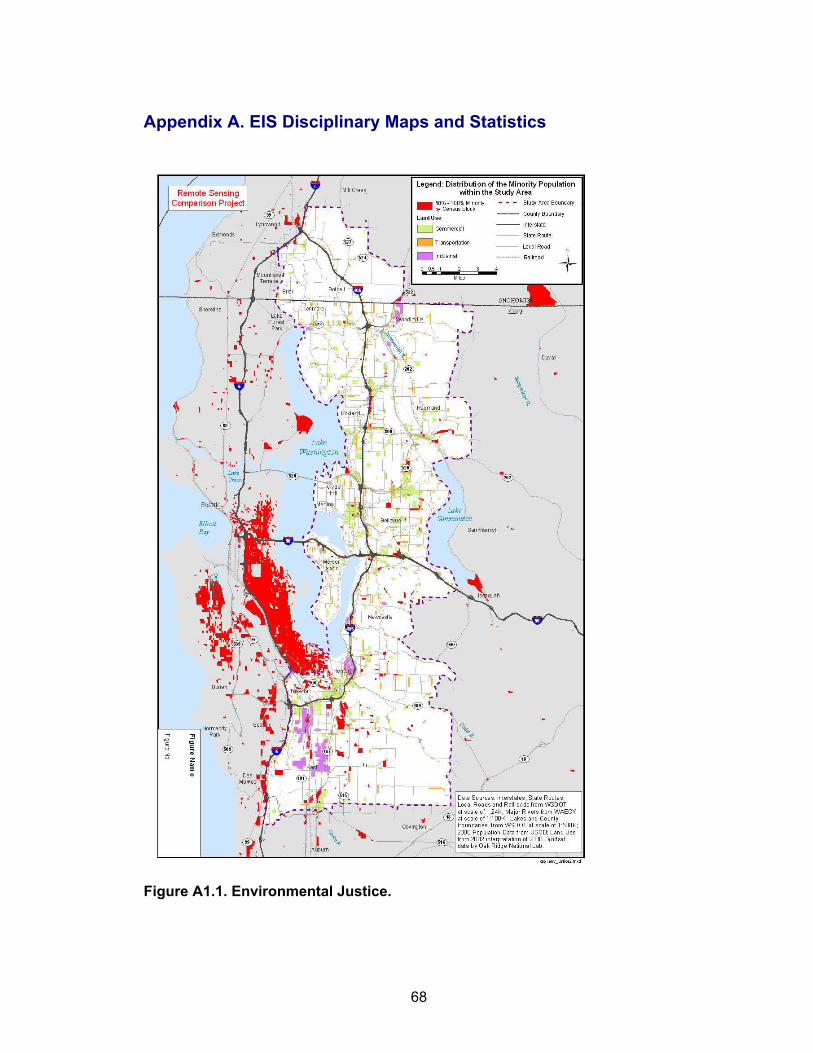
68
Appendix A. EIS Disciplinary Maps and Statistics
Figure A1.1. Environmental Justice.

69
Figure A1.2. Farmland.

70
Figure A1.3. Fish and Aquatic Habitat.

71
Figure A1.4. Floodplains.

72
Figure A1.5. Land Use.

73
Figure A.1.6 Recreational Resources.

74
Figure A1.7. Shorelines.

75
Figure A1.8. Surface Water Resources: Stormwater Management Facilities (Also See Figure A1.3. Fish and Aquatic Habitat).

76
Figure A1.9. Transportation Networks and Screenlines.

77
Figure A1.10. Wildlife Habitats.

78
Figure A1.11. Wetlands.

79
Table A1.1. Acreage of Land Cover Type (LULC Layer I) by Drainage Basins

80
Table A1.2. Acreage Summary of Land Cover Type (LULC Layer I)

81
Table A1.3. Acreage of Land Use Type by Drainage Basin (LULC Layer II)
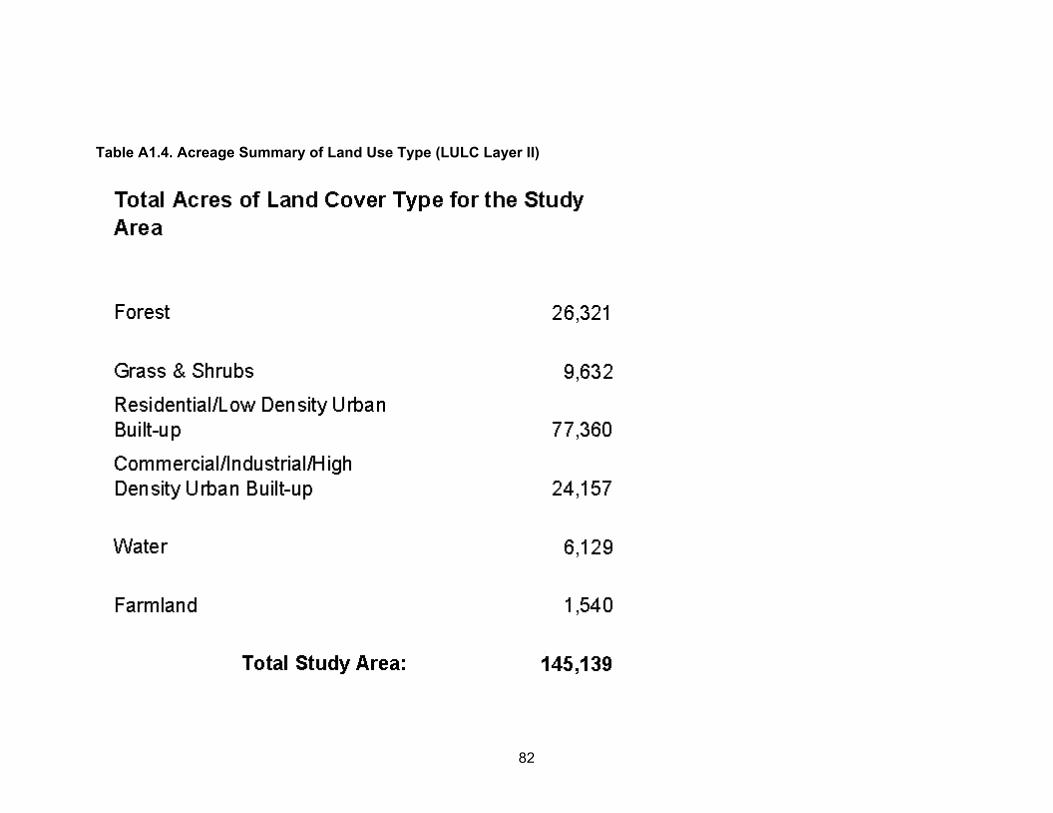
82
Table A1.4. Acreage Summary of Land Use Type (LULC Layer II)

83
Table A1.5. Acreage of Land Use/Land Cover Type by Drainage Basin (LULC Layer III)

84
Table A1.6. Acreage Summary of Land Use/Land Cover Type (LULC Layer III)

85
Appendix B. Survey Protocol and Form 1. Introduction This appendix describes the planned approach to assess the value of using remotely sensed data for environmental analysis in transportation planning, using the I-405 project as a case study. This study focuses on land use and land cover (LULC) classification and its application to providing information that would be useful for the transportation planning and environmental analysis process. This assessment will provide a sense of the value of the information and insight provided by remotely sensed data when used in combination with geographic information systems and other conventional spatial data technologies. 2. Scope LULC information is commonly compiled and analyzed for the purposes of satisfying requirements under the National Environmental Policy Act (NEPA), as well as for other legislative, regulatory and permitting requirements. This study will assess the incremental value of LULC-related information that is to be developed using remotely sensed data, relative to a baseline set of information representing current practice. For this case study, we use information in the Draft Environmental Impact Statement (DEIS) for the I-405 Corridor Program (U.S. DOT et al. 2001) as the baseline representing the current state-of-the-art practice for environmental analysis in transportation planning. Additional LULC-related information -- the maps, images, and analytical information provided by remotely sensed data that are integrated with other spatial data -- will be compared to this baseline. We refer to these two sets of information as "current practice" and "RS/GIS," respectively. As reflected in the DEIS, LULC information is used in descriptions and analyses of the different environmental disciplines that the NEPA process typically addresses, including (number in parenthesis is the section number in the DEIS report):
• Water resources - surface water (3.5) • Wetlands (3.6) • Threatened and endangered species habitat (3.7) • Fish and aquatic habitat (3.8) • Farmland (3.9) • Floodplains (3.10) • Shorelines (3.11) • Transportation (3.12) • Land use (3.13) • Recreational resources (3.17).
We plan to consider these categories and to assess the value of developing and providing information about these disciplines using RS/GIS methods compared to current practice. The comparisons will focus on aspects in which RS/GIS methods could provide complementary or supplementary information, as well as identifying

86
environmental disciplines where these methods might not be as useful or cost-effective. 3. Approach for Developing Estimates of Costs and Value The categories and ways of measuring information about each discipline vary, as do the data sources, data manipulation required, and presentation format. These attributes in turn affect the nature and value of the information presented, as well as the costs of compiling it. We plan to present the results of the analysis in a format that facilitates comparisons and assessments of the incremental value of the RS/GIS approach for each of the discipline.
Form 1. Description of Information from Conventional Practice and Using
RS/GIS Name of environmental Discipline: _________________________________ Attribute
Conventional Practice Information from RS/GIS
Parameters or Categories
Data Sources
Data Manipulation Needed
Presentation Format

87
Form 2. Costs of Developing and Presenting the Information in the DEIS
(All items in thousands of dollars, except the last item which is in months) Please complete the form, using a different form for the work done for each environmental Discipline. The cost and time estimates are for all work done by all contractors, subcontractors, and agency staffs related to the specific Discipline. Name of environmental Discipline: _________________________________
Cost Category
Cost ( $‘000) Or Months
1. Staff Labor Costs
2. Other Costs (data, software and hardware acquisition; travel; materials and supplies)
3. Indirect and Overhead Costs and Profit
4. Total Cost for this Particular Discipline (Line 1 + Line 2 + Line 3)
5. Amount of Time to Complete the Task (from the time the task was initiated to completion, in calendar-months)

88
Form 3. Assessing the Benefits of Products from RS/GIS Relative to Information from Conventional Practice, as Reflected in the Draft Environmental Impact Statement (DEIS) INSTRUCTIONS: Information being compiled on this form will be used in a study being done by Washington State Department of Transportation (WSDOT) and Oak Ridge National Laboratory. The study is funded by WSDOT and the U.S. Department of Transportation. The purpose of the study is to assess the usefulness of data, information, and maps that can be developed using remote sensing, for the purpose of environmental analysis in transportation planning. The I-405 project in Washington is being used as a case study. Environmental analysis for the I-405 project was recently completed and published in the Environmental Impact Statement (DEIS). We are asking you to assess the information and maps developed using a combination of remotely sensed data and geographic information systems (RS/GIS) in terms of their possible value in substituting for, replacing, or complementing the work done for the DEIS. (The DEIS does not contain the RS/GIS material you are being asked to assess.) To keep the number of things you have to look at to a minimum, we only made RS/GIS maps for Alternative 3. Please respond as if all Alternatives had been mapped. Please review the sections from the DEIS and the RS/GIS material, complete the attached form, and return to: Russell Lee Oak Ridge National Laboratory P. O. Box 2008 Oak Ridge, TN 37831-6205 Or fax to: 865-574-5282 or -5283. Or email to: [email protected] For further questions or information about the overall study, please contact: Elizabeth Lanzer Washington Department of Transportation Environmental Affairs Office Phone: 360-705-7476 E-mail: [email protected] Thank you.

89
Form 3. Assessing the Benefits of Products from Remote Sensing/Geographic Information Systems (RS/GIS) Relative to Information from Conventional Practice, as Reflected in the Draft Environmental Impact Statement (DEIS)
Name of environmental Discipline under consideration: _____________________ 1. Please circle the item below that best describes your role or the nature of your
interest in the DEIS: i. Lead agency or division responsible for the DEIS
ii. Participating or reviewing agency or division
iii. Contractor or contributor to the DEIS
iv. Native American Tribe
v. Non-Government Organization
vi. Individual person or company
vii. University or research
viii. Other (please specify) ______________________________
2. Please circle the letter(s) of the statement(s) that reflects your assessment:
Compared to the work done for the environmental Discipline in the DEIS, the RS/GIS products would:
• Be a comparable substitute for some of the information or data used, or work done for the DEIS
• Improve the DEIS by replacing some of the information used or work done
for it • Complement or supplement the DEIS by providing additional useful
information • Detract from the DEIS (if the RS/GIS products had been the only data
available) If your answer includes 'a' or 'b', please indicate which parts of the DEIS (give page numbers or describe).
3. If your answer to Question 2 includes 'a', 'b', or 'c', please answer the following:

90
(i) Considering the cost of completing the work on this environmental Discipline, what would it have been worth (either in addition to or instead of some of the original expense) to have had the RS/GIS products available for the DEIS and expertise reports, or as supplementary material? Please circle one of the choices below:
<1> value is much less than 1% of the cost of completing this section (and its corresponding expertise report) in the DEIS
<2> value is comparable to about 1% of the cost of completing this section
(and its corresponding expertise report) in the DEIS <3> value is comparable to 1%-5% of the cost of completing this
section (and its corresponding expertise report) in the DEIS <4> value is comparable to 5%-10% of the cost of completing this
section (and its corresponding expertise report) in the DEIS <5> value is comparable to 10%-15% of the cost of completing this
section (and its corresponding expertise report) in the DEIS <6> value is greater than 15% of the cost of completing this section
(and its corresponding expertise report) in the DEIS. (ii) How or why are the RS/GIS products useful (use additional sheets if
necessary)? (iii) How could they be improved (use additional sheets if necessary)?
______________________________________________________________
______________________________________________________________
______________________________________________________________
______________________________________________________________
______________________________________________________________

91
4. If your answer to Question 2 includes 'd', please comment on how the RS/GIS products would detract from the DEIS (use additional sheets if necessary). ____________________________________________________________________________________________________________________________________________________________________________________________________________________________________
5. Do you think the information presented in the DEIS lead you to different
conclusions than the information presented in the RS/GIS products? (Please circle one.) Yes No If yes, please explain why: _________________________________________________________ _________________________________________________________________
_________________________________________________________________
________________________________________________________
6. Which format provides a level of detail most appropriate to a corridor level of
environmental review? (Please check one of the following)
The DEIS provides a more appropriate level of detail.
The RS/GIS products provide a more appropriate level of detail.
There is no difference between the DEIS and RS/GIS products regarding the appropriate level of detail.
Neither the DEIS and RS/GIS products provide the appropriate level of detail.
Thank you for your participation in this survey. Please email this document promptly to Russell Lee at [email protected], or fax or mail to the address shown on the Instructions.

92
REFERENCES Abbett, T., Carlson, M., Fields, M., Mazzella, F. and L. Watson (2001), “NCRST-E Remote Sensing Mission to Eddyville, Iowa In Conjunction with the Iowa Department of Transportation,” unpublished note. Anderson, J.R., Hardy, E.E., Roach, J.T., and R.E. Witmer (1976), “A Land Use and Land Cover Classification System for Use with Remote Sensor Data,” Washington, DC: U.S. Government Printing Office. CH2M HILL (2000) “Remote Sensing Technologies,” chapter 4 in Technologies to Improve Consideration of Environmental Concerns in Transportation Decisions, NCHRP 25-22, Washington, DC: National Academy of Sciences. CH2M HILL (2001a), I-405 Corridor Program Draft Environmental Justice Expertise Report, NEPA/SEPA technical expertise report in support of I-405 Corridor Program Draft Environmental Impact Statement, Seattle, WA: Washington State Department of Transportation. CH2M HILL (2001b), I-405 Corridor Program Draft Surface Water Resources Expertise Report, NEPA/SEPA technical expertise report in support of I-405 Corridor Program Draft Environmental Impact Statement, Seattle, WA: Washington State Department of Transportation. David Evans and Associates, Inc. (2001a), I-405 Corridor Program Draft Farmland Expertise Report, NEPA/SEPA technical expertise report in support of I-405 Corridor Program Draft Environmental Impact Statement, Seattle, WA: Washington State Department of Transportation. David Evans and Associates, Inc. (2001b), I-405 Corridor Program Draft Fish and Aquatic Habitat Expertise Report, NEPA/SEPA technical expertise report in support of I-405 Corridor Program Draft Environmental Impact Statement, Seattle, WA: Washington State Department of Transportation. David Evans and Associates, Inc. (2001c), I-405 Corridor Program Draft Floodplain Expertise Report, NEPA/SEPA technical expertise report in support of I-405 Corridor Program Draft Environmental Impact Statement, Seattle, WA: Washington State Department of Transportation. David Evans and Associates, Inc. (2001d), I-405 Corridor Program Draft Land Use Expertise Report, NEPA/SEPA technical expertise report in support of I-405 Corridor Program Draft Environmental Impact Statement, Seattle, WA: Washington State Department of Transportation. David Evans and Associates, Inc. (2001e), I-405 Corridor Program Draft Recreation Expertise Report, NEPA/SEPA technical expertise report in support of I-405 Corridor Program Draft Environmental Impact Statement, Seattle, WA: Washington State Department of Transportation.

93
David Evans and Associates, Inc. (2001f), I-405 Corridor Program Draft Shorelines Expertise Report, NEPA/SEPA technical expertise report in support of I-405 Corridor Program Draft Environmental Impact Statement, Seattle, WA: Washington State Department of Transportation. David Evans and Associates, Inc. (2001g), I-405 Corridor Program Draft Upland Vegetation, Habitat, and Wildlife Expertise Report, NEPA/SEPA technical expertise report in support of I-405 Corridor Program Draft Environmental Impact Statement, Seattle, WA: Washington State Department of Transportation. David Evans and Associates, Inc. (2001h), I-405 Corridor Program Draft Wetlands Expertise Report, NEPA/SEPA technical expertise report in support of I-405 Corridor Program Draft Environmental Impact Statement, Seattle, WA: Washington State Department of Transportation. Durbrow, R., Richardson, J., Hoctor, T., and M. Carr (2000), “Southeastern Ecological Framework,” EPA Region 4, Planning and Analysis Branch flyer. Ekern, David (2001), “Remote Sensing Technology for Transportation,” presentation at the GIS-T Conference, April 8-12, 2001, Washington, DC http://www.bts.gov/gis/reference/gist/2001/23/231_remote_sensing/tsld001.html Lanzer, E., D. Xiong, R. Lee, J.B. Saulsbury, L. Oman, and A. Perez (2002), “Remote Sensing Applications for Environmental Analysis in Transportation Planning: Application to the Washington State I-405 Corridor,” poster presented at the Pecora 15/Land Satellite Information IV Conference, Transportation Applications Showcase and Poster Session Denver, Colorado, November 10-15, 2002.. Federal Highway Administration, Washington State Department of Transportation, Federal Transit Administration, King County Department of Transportation, and Central Puget Sound Regional Transit Authority (2001), I-405 Corridor Program, Draft NEPA/SEPA Environmental Impact Statement and Draft Preliminary Section 4(f) Evaluation, Report No. FHWA-WA-EIS-01-01-D, Seattle, Washington: Washington State Department of Transportation. Federal Highway Administration (FHWA) (2003), Web site on “NEPA: Project Development Process,” http://www.fhwa.dot.gov/environment/nepa/nepatxt.htm Federal Transit Administration (FTA) (2003), Web site on “Overview of Transportation Planning and Environmental Analysis in the United States,” http://www.fta.dot.gov/office/planning/overview/ Jenson, J.R. (2000), “Conference Closing and Future Directions,” in Transportation Research Board, Remote Sensing for Transportation: Report on a Conference, December 4-5, 2000, Washington, DC: National Research Council, p. 52. King, R.L. and C.G. O’Hara (2001), “The National Consortium on Remote Sensing in Transportation – Environmental Assessment,” in Proceedings of the IEEE 2001 International Geoscience and Remote Sensing Symposium, Vol. 4, pp. 1820-1822.

94
King, R.L. and C.G. O’Hara (2002), “A Synthesis of Remote Sensing Applications for Environmental Assessment,” paper in the proceedings of the Pecora 15/Land Satellite Information IV, Integrated Remote Sensing at the Global, Regional and Local Scale Symposium, 10-15 November 2002, Denver, Colorado, http://www.isprs.org/commission1/proceedings/paper/00095.pdf King, R. and C. O’Hara, no date - a, “NCRST-E: Building the Future of Environmental Assessment in Transportation,” program folder, Mississippi State, Mississippi: Mississippi State University. King, R. and C. O’Hara, no date - b, “Streamlining Environmental Assessment,” brochure. Mississippi State University. Lanzer, E. (2002) “Demonstrating Remote Sensing Solutions for Environmental Analysis of the Washington State I-405 Corridor,” unpublished paper available on the following Washington State Department of Transportation web site: http://www.wsdot.wa.gov/environment/envinfo/docs/RSPrj_Intro2002.pdf Laymon, C., J. Cruise, M. Estes, B. Howell (2001), “Assessing the Need for Remote Sensing Information to Conduct Environmental Assessment in Transportation,” Technology Guide: NCRSTE-TG001, http://www.ncrste.mssstate.edu/publications/ncrste_tg001.pdf Leica Geosystems (2003) ERDAS IMAGINE Tour Guide for IMAGINE v8.6, Atlanta, Georgia: Leica Geosystems. Mirai Associates and David Evans and Associates, Inc. (2001), I-405 Corridor Program Draft Transportation Expertise Report, NEPA/SEPA technical expertise report in support of I-405 Corridor Program Draft Environmental Impact Statement, Seattle, WA: Washington State Department of Transportation. Mississippi Automated Resource Information System (2000), Land Cover and Land Use Digital Data for Mississippi. http://www.maris.state.ms.us Mississippi State University (2001), Web site for “National Consortium for Remote Sensing in Transportation – Environmental Assessment,” http://www.ncrste.msstate.edu/new/ncrste/index.html O’Hara, C.G. (2001), “Remote Sensing and Geospatial Applications for Wetland Mapping and Assessment,” Technology Guide: NCRSTE_TG003, http://www.ncrste.mssstate.edu/publications/ncrste_tg003.pdf O’Hara, C.G., King, R.L., Cartwright, J., and J. King (2002), “Remote Sensing and Geospatial Technologies Application for Developing Options to Relocate CSX Railroad from Mississippi Gulf Coast Townships,” Proceedings of International Mechanical Engineering Congress and Exposition 2002, November 17-22, 2002, New Orleans, Louisiana, TTSRP-32912. Oman, L. (2000), “Environmental Assessment, Integration, and Streamlining,” in Transportation Research Board, Remote Sensing for Transportation, Report on a
95
Conference, December 4-5, 2000, Washington, DC: National Research Council, p. 39. Transportation Research Board (TRB) (2000), Remote Sensing for Transportation, Report on a Conference, December 4-5, 2000, Washington, DC.: National Research Council. U.S. Geological Survey (1992), Multi-Resolution Land Characteristics – Statewide digital data for Mississippi. http://landcover.usgs.gov/nationallandcover.html Washington State Department of Transportation (WSDOT) (2003), Web site on “NEPA Process Improvement Initiative: Summary of NEPA Process Improvement Initiative,” http://www.wsdot.wa.gov/eesc/environmental/programs/regcomp/nepa/nepa_summary.htm Washington State Department of Transportation (WSDOT) (2003), Web site on “Environmental Permit Streamlining Act (ESB 6188 and 5279) (TPEAC),” http://www.wsdot.wa.gov/environment/streamlineact/default.htm Washington State Department of Transportation (WSDOT) (2003), Web site on, “I-405 Congestion Relief and Bus Rapid Transit Projects,” http://www.wsdot.wa.gov/projects/I-405/default.htm Washington State Department of Transportation (WSDOT) (2003), Web site on, “I-405 Project Final Environmental Impact Statement,” http://www.wsdot.wa.gov/projects/I-405/feis.htm Xiong, D., Lee, R., Saulsbury, J., Lanzer, E., and A. Perez (2004), Guidance on Using Remote Sensing Applications for Environmental Analysis in Transportation Planning, prepared for the Washington State Department of Transportation. Oak Ridge, Tennessee: Oak Ridge National Laboratory.