Embed Size (px)
Citation preview

Cases and solutions
194 Environmental Geology 34 (2/3) May 1998 7 Q Springer-Verlag
Merging remote-sensing images forgeological-environmental mapping:application to the Cabo deGata-Níjar Natural Park, SpainJ. P. Rigol, M. Chica-Olmo
Received: 29 November 1996 7 Accepted: 29 July 1997
J. P. Rigol 7 M. Chica-Olmo (Y)Laboratorio RSGIS “Teledetección, GIS y Geoestadística”,Dpto. Geodinámica, Universidad de Granada/IACT,Avd. Severo Ochoa s/n. E-18071 Granada, SpainTel./Fax: c34 58 243363 7 e-mail: [email protected]
Abstract The Cabo de Gata Níjar Natural Park inSpain presents certain unique characteristics whichmake it of great geological, ecological and environ-mental interest. As a prior step to the environmen-tal study of the park and the impact produced bythe mining activities carried out up until ten yearsago, the mining and waste-tip areas were definedand a lithological discrimination carried out. Forthis purpose, various remote-sensing techniqueswere employed to create high-resolution imagedocuments on which the geological and environ-mental mapping of the area would be based, withspecial attention being paid to the areas of formermining activity because of its implications for thelocal environment. The merging of remote-sensingimages with different spatial/spectral resolutionshas become a highly useful tool, due to their in-creasing availability. Such is the case of the SPOTpanchromatic and Landsat Thematic Mapper mul-tispectral images, which are two of the most com-monly used images in geological and environmentalstudies based on remote sensing. Of the numeroustechniques described for merging remote sensingimage data, this paper analyses those based on In-tensity-Hue-Saturation, Principal Component Anal-ysis, Spherical Coordinates, High-Pass Filters andColour Normalized transform, using SPOT pan-chromatic and Landsat TM data. The research goalswere (1) to analyse and compare some of the mostcommonly used methods; (2) to select the most ap-propriate method for a detailed geological-environ-mental study, and (3) to apply the methodology tothe Cabo de Gata-Níjar area, the site of one of themost distinctive natural parks in the country.
Key words Remote sensing 7 Merging multisensorimages 7 Geological-environmental mapping 7Cabo de Gata-Níjar natural park
Introduction
The protected zone of Cabo de Gata-Níjar, with 26 000terrestrial Ha and 12 000 marine Ha, was declared a mari-time-terrestrial Natural Park in 1987, and in 1997 theUnited Nations declared it a site of the Biosphere Re-serve. The area, located in the south-eastern corner of theIberian Peninsula, presents certain unique characteristicswhich make it of great geological, ecological and environ-mental interest. Notable among these are its semi-aridclimate, which has a significant influence on the geomor-phology and local vegetation, and its volcanic nature –the area contains the most extensive outcrops of this typein the Iberian Peninsula, with some eruptive forms stillremaining. Other characteristics of interest are the widevariety of biotopes (saline pools, semi-arid mountainranges, cliffs, etc.) containing interesting fauna (threespecies of amphibia, 13 of reptiles and 101 of birds) andvegetation with abundant endemic species. What makesthis area particularly noteworthy is that within the limitsof the Natural Park are numerous abandoned mineworks, some of which were still being worked up until adecade ago, dedicated to the extraction of gold, of poly-metallic sulphides (Pb, Zn, Cu, Ag), industrial clays (ben-tonites) and alunite. The mine works, extending through-out the park, range from small underground galleries toopen pits of considerable size. In the Rodalquilar areathere are important gold mines, which reached maximumproduction levels during the 1960s. These used a cyanidi-zation treatment process and large waste tips accumu-lated. The extraction of the sulphide metals was concen-trated in the southern part of the park, while that of thenon-metallic metals, always in opencast works, occurredthroughout the region.One of the first and most relevant steps to be taken inenvironmental studies and in policies to remedy pollu-tion is the definition of the areas in which the problemarises. Also of great concern is the identification of theareas most susceptible to contamination and to the ill-ef-
Cases and solutions
Environmental Geology 34 (2/3) May 1998 7 Q Springer-Verlag 195
fects of human activities. Therefore, and as a prior stageto the environmental study of the park and the impactproduced by mining activities there, together with a li-thological discrimination, the exact locations of the mineworks and waste tips were identified. This was achievedby use of various remote-sensing techniques to createhigh-resolution image documents, focusing particularlyon the mine-works areas. The objective of this study wasto demonstrate that the extensive information contentavailable from merged remote-sensing images may beused to solve problems related to environmental protec-tion.Remote-sensing techniques have been used for severaldecades to obtain geological data on many areas of thesurface of the earth, either as the fundamental method, inthe case of areas of difficult access, or as an auxiliary toolto back up other techniques. Nevertheless, there are stilllimitations in the field of remote sensing, such as themasking effect that may be produced by vegetation andrelief shadows, and the limited spatial and spectral reso-lution, for certain applications, of some of the most fre-quently used sensors. On the other hand, it is becomingmore and more commonplace to find that geological andenvironmental studies make use of different digitalimages obtained by remote-sensing devices with differentspectral/spatial resolutions. There then arises the possibil-ity of merging these to create new images that will com-bine the most appropriate information from each sensor.Image merging refers to image processing techniques thatcombine two image sets from two or more sensors, form-ing an enhanced final image (Yocky 1996). By this pro-cess, the limited spectral/spatial resolution problem mayat least be alleviated.The aforementioned technique was used in the case ofthe SPOT HRV and Landsat Thematic Mapper (TM) sen-sors, which are commonly used in studies of natural re-sources. The Landsat TM is characterized by its goodspectral resolution for many applications (seven bands).However, a notable limitation of Landsat is its relativelypoor spatial resolution for large-scale (1 : 24 000) geologi-cal analysis and mapping of small landforms (Grasso1993). The SPOT HRV has a good spatial resolution inpanchromatic mode, 10 m, but its spectral resolution ispoor. Therefore, a combination of the two would give theresearcher and the user of remotely sensed imagery moreadequate data (Pellemans and others 1993). Furthermore,the extensive use of aerial photographs converted to digi-tal format could play an important role, analogous tothat of the SPOT panchromatic images, with the bonus oftheir relatively low cost.Various image-merging methods have been described,ranging from the simplest, such as the direct substitutionof bands in the visualization, or arithmetic operations(Ehlers 1991), through the Intensity-Hue-Saturationtransform (Carper and others 1990; Chavez and others1991; Ehlers 1991; Shettigara 1992; Grasso 1993; Pelle-mans and others 1993), Principal Component Analysis(Chavez and others 1991; Ehlers 1991), Spherical Coordi-nates (Pellemans and others 1993), High Pass Filters
(Chavez and others 1991), Colour Normalized transform(Hallada and Cox 1983; Vrabel 1996), the Statistical meth-od (Press and others 1989; Pellemans and others 1993), tothe most recent and sophisticated, such as the Radiomet-ric method (Pellemans and other 1993) and the Multire-solution Analysis and Wavelet transform (Garguet-Du-port and others 1996; Yocky 1996). Of all of these, per-haps the Intensity-Hue-Saturation transform is the mostcommonly used in geological applications and the inves-tigation of natural resources, while others are particularlysuitable for certain types of study; for example, the Ra-diometric Method, or the Multiresolution Analysis andWavelet transform, for the analysis of vegetation.This paper presents a comparative study in relation tothe obtaining of merged images for the visual interpreta-tion of the aforementioned characteristics of the Cabo deGata-Níjar study area. To this end, some of the mostcommon techniques for image merging, in the field ofgeological resources, have been applied and compared.These techniques are Intensity-Hue-Saturation (IHS),Principal Component Analysis (PCA), Spherical Coordi-nates (SC), High Pass Filters (HPF) and Colour Normal-ized (CN) transform, which were applied to a group ofSPOT panchromatic and Landsat TM images of the Cabode Gata-Níjar Natural Park.
Study area and remote-sensingimages
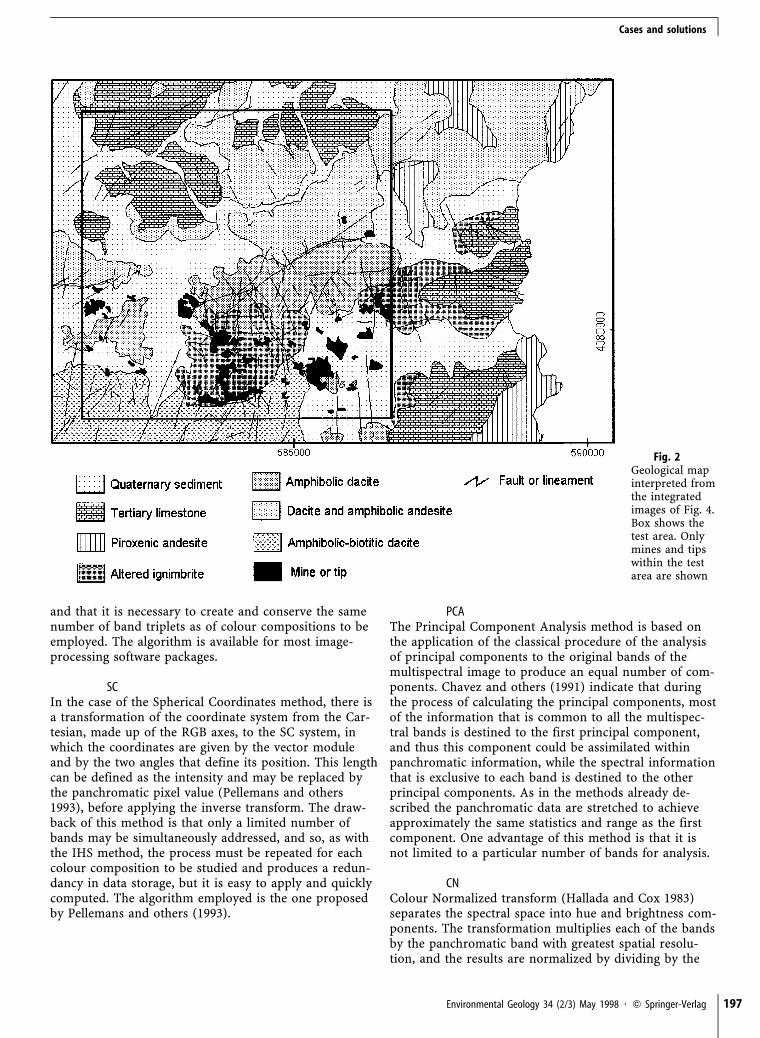
The study area is located in the south-east of the IberianPeninsula, within the province of Almería, Spain, and ap-proximately corresponds to the Cabo de Gata-Níjar Natu-ral Park (Fig. 1). The area extends along a strip of landparallel to the eastern end of the mediterranean coast ofAlmería, bounded to the north-west by the CarbonerasFault, where the Serrata de Níjar is a notable feature, andto the south-west by the coast, between Cabo de Gataand Punta Javana. From the geomorphological viewpoint,there are no great extremes of relief. Two factors are ofrelevance to the relief in this zone; firstly, the geological(lithological and structural), and secondly, the climato-logical factor. As regards this latter factor, the most note-worthy feature of the area is its aridity, and hence itssemi-desert type of climate.Geologically, the volcanic area of Cabo de Gata is situ-ated at the eastern end of the Betic Cordillera (Doblasand Oyarzun 1989; Vissers and others 1995). The volcan-ism of Cabo de Gata belongs to the calc-alkaline series(López-Ruiz and Rodríguez-Badiola 1980), and is charac-terized by the presence of a variety of lithologies, rangingfrom basaltic andesite to rhyolite, with a moderate potas-sium content and a predominance of the intermediateterms, andesite and dacite (Fig. 2) (Fernández Soler, un-published data; Arribas and Arribas 1995). The Messinianrocks that seal the volcanic activity are represented bycarbonated and marly sediments, constituting reef com-

Cases and solutions
196 Environmental Geology 34 (2/3) May 1998 7 Q Springer-Verlag
Fig. 1Map showing location of the study area and the Cabo deGata-Níjar Nature Park. Box shows the test area
plexes around the most pronounced features. Additional-ly, the volcanic rocks are partially covered by Plioceneand Quaternary sediments. During the Miocene epoch,and as a consequence of the volcanic and subvolcanic ac-tivity, a series of hydrothermal systems developed simul-taneously with the emission of the volcanic rocks (Arri-bas and others 1989). These produced minor alterationsand large areas of alterations-mineralizations, corre-sponding to hydrothermal (epithermal) circulation sys-tems (Rytuba and others 1990; Arribas and Arribas 1995).For the purposes of the study, Landsat TM and panchro-matic mode SPOT HRV images were available. The win-ter SPOT panchromatic image (Fig. 4a), acquired on 1December 1991, was used for the geomorphological andstructural study of the area, for which the presence ofshadows was a favourable factor. The Landsat TM sensorprovided a summer image (Fig. 4b), acquired on 7 July1991, to enable soil and lithological discrimination, asground reflectivity is greatest at this time of the year,while vegetation coverage is minimal.
Methods
Merging information from different imaging sensors in-volves two distinct steps (Chavez and Bowell 1988). First,
the digital images from both sensors were geometricallyregistered to one another. Next, the information contents– both spatial and spectral – were mixed to generate asingle data set that contained the best of both sets.
Digital preprocessingBefore being able to perform any joint image processing,the spatial registering must be obtained. This may beperformed in a relative way, or, preferably, by using asystem of absolute coordinates. In our case, the SPOTpanchromatic image was geometrically corrected and reg-istered to the UTM coordinate system, using knowncoordinate control points and based on a topographicalmap. Then the Landsat TM multispectral image was geo-metrically corrected and registered, using the SPOTpanchromatic image as the base. During the process oftransforming the TM image, a resampling was carriedout, at a pixel size of 10!10 m, to make it coincide withthat of the panchromatic image. For this resampling, acubic convolution algorithm was used, with the aim ofsmoothing the blockiness introduced by the 3x digital en-largement of the pixel size (Chavez and others 1991).
Merging methodsThe general procedure for merging panchromatic infor-mation into the multispectral bands is to transform theoriginal multispectral image into a new coordinate sys-tem in which one of the axes represents intensity (Pelle-mans and others 1993). After replacing this intensity bythe panchromatic band and after the inverse transforma-tion, the merging process is completed. This general out-line, which is employed by all the methods except HPFand CN, is represented in Fig. 3 and subsequently dis-cussed in detail for each individual method.Note that the TM band corresponding to thermal infra-red has been excluded from the analysis, as, despite thefact that it provides relevant data, its spatial resolution isvery low (120!120 m).
IHSThe IHS is perhaps the most commonly used mergingmethod. It consists of a numerical procedure developedto convert a three-band RGB (red-green-blue) displayinto its fundamental physiological (IHS) elements of hu-man colour perception (Buchanan and Pendergrass 1980).As a result of applying the transform, an intensity com-ponent is obtained, which groups the information that iscommon to the three RGB bands, which in turn is mainlyrelated to the illumination changes caused by ground re-lief effects. The hue and saturation components containthe spectral information, corresponding to the reflectivityof the surface. On applying the inverse transform, aftersubstitution of the intensity component by an image withgreater spatial resolution, an RGB triplet is obtained thatis spectrally similar to the initial one, but with improvedspatial resolution. One disadvantage of the IHS transformwith respect to the other methods is that only threebands may be used simultaneously for analysis. Thismeans that the process must be repeated for each triplet
Cases and solutions
Environmental Geology 34 (2/3) May 1998 7 Q Springer-Verlag 197
Fig. 2Geological mapinterpreted fromthe integratedimages of Fig. 4.Box shows thetest area. Onlymines and tipswithin the testarea are shown
and that it is necessary to create and conserve the samenumber of band triplets as of colour compositions to beemployed. The algorithm is available for most image-processing software packages.
SCIn the case of the Spherical Coordinates method, there isa transformation of the coordinate system from the Car-tesian, made up of the RGB axes, to the SC system, inwhich the coordinates are given by the vector moduleand by the two angles that define its position. This lengthcan be defined as the intensity and may be replaced bythe panchromatic pixel value (Pellemans and others1993), before applying the inverse transform. The draw-back of this method is that only a limited number ofbands may be simultaneously addressed, and so, as withthe IHS method, the process must be repeated for eachcolour composition to be studied and produces a redun-dancy in data storage, but it is easy to apply and quicklycomputed. The algorithm employed is the one proposedby Pellemans and others (1993).
PCAThe Principal Component Analysis method is based onthe application of the classical procedure of the analysisof principal components to the original bands of themultispectral image to produce an equal number of com-ponents. Chavez and others (1991) indicate that duringthe process of calculating the principal components, mostof the information that is common to all the multispec-tral bands is destined to the first principal component,and thus this component could be assimilated withinpanchromatic information, while the spectral informationthat is exclusive to each band is destined to the otherprincipal components. As in the methods already de-scribed the panchromatic data are stretched to achieveapproximately the same statistics and range as the firstcomponent. One advantage of this method is that it isnot limited to a particular number of bands for analysis.
CNColour Normalized transform (Hallada and Cox 1983)separates the spectral space into hue and brightness com-ponents. The transformation multiplies each of the bandsby the panchromatic band with greatest spatial resolu-tion, and the results are normalized by dividing by the

Cases and solutions
198 Environmental Geology 34 (2/3) May 1998 7 Q Springer-Verlag
Fig. 3General outline of the process for the merging ofmultiresolution images
sum of the multispectral bands. The advantage of thismethod lies in its simplicity and the fact that there is norestriction on the number of bands to which it may si-multaneously be applied.
HPFThe High-Pass Filter method (Chavez and others 1991)does not follow the general methodology described in thepreceding, but rather processes the information withgreatest spatial resolution and adds it to the multispectralinformation. An extrapolation is performed of the spatialinformation from the band with the highest to thosebands with the lowest spatial resolution. The point of thisis to isolate the high-frequency information, mainly re-lated to spatial information; when the filtering is applied,most of the spectral information is removed. Finally, theresultant image is added, pixel by pixel, to the data setwith the lowest spatial resolution but which has a greaterspectral resolution. Various filters, with different window
sizes, were applied, from which the high pass 5!5 Lapla-cian filter was chosen. This method also enables themerging of the SPOT panchromatic data into all theLandsat TM multispectral bands in one operation.
Comparative analysisIn our case, the main objective of merging is visual inter-pretation, for which it is desirable to retain as much ofthe spectral information as possible, whilst improvingspatial information. In this respect, Chavez and others(1991) point out that a good method should maintain thespectral characteristics of the multispectral data, in orderto ensure that the same objects may still be distinguishedin the merged images as in the original ones. However,all merging methods, to a greater or lesser extent, intro-duce certain distortions into the multispectral data withrespect to the original. This aspect must be taken into ac-count when evaluating the different methods, and notonly their ease of application and the visual quality of themerged product.To test the quality of the merging methods analysed,both numerical and visual comparisons were made of thespectral characteristics of the data sets produced and ofthe original data. To illustrate this process, a test sectorof the study area, of some 5.3!5.3 km (Fig. 1) was se-lected, corresponding to 530!530 pixels of 10!10 m(Fig. 4).Various procedures have been suggested for numericalcomparison of the results of the merging process. Chavezand others (1991) proposed the study of the correlationbetween the intensity component produced by the chosenalgorithm and the panchromatic image. It was reasonedthat, for these to be interchangeable, they are assumed tobe spectrally similar. However, this procedure is only ap-plicable to the techniques that produce an “intensity”component as such, and not to HPF or CN. They alsosuggested the study of the images after subtracting themerged product from the original, and in particular thestatistical standard deviation. Carper and others (1990)proposed that the spectral changes produced by mergingcould be quantified by determining the changes in thecorrelations between the panchromatic band and themultispectral bands, before and after merging. But per-haps the simplest and most direct method is to analysethe correlations of the multispectral images before andafter merging. The correlation coefficients between eachmultispectral band and its corresponding merged one in-dicate the spectral distortion introduced during the merg-ing process.Thus, the correlation coefficients for various sets ofimages, before and after merging, have been calculated.Specifically, the TM 541, TM 742 and TM 475 tripletswere used, these being highly useful in lithological dis-crimination studies. As already described, the HPF andCN methods were applied individually to each multispec-tral band; in the analysis of correlations, this aspectshould be taken into account. Furthermore, the PCAmethod can be applied to any set of bands, and was thusapplied to the mentioned triplets for purposes of com-
Cases and solutions
Environmental Geology 34 (2/3) May 1998 7 Q Springer-Verlag 199
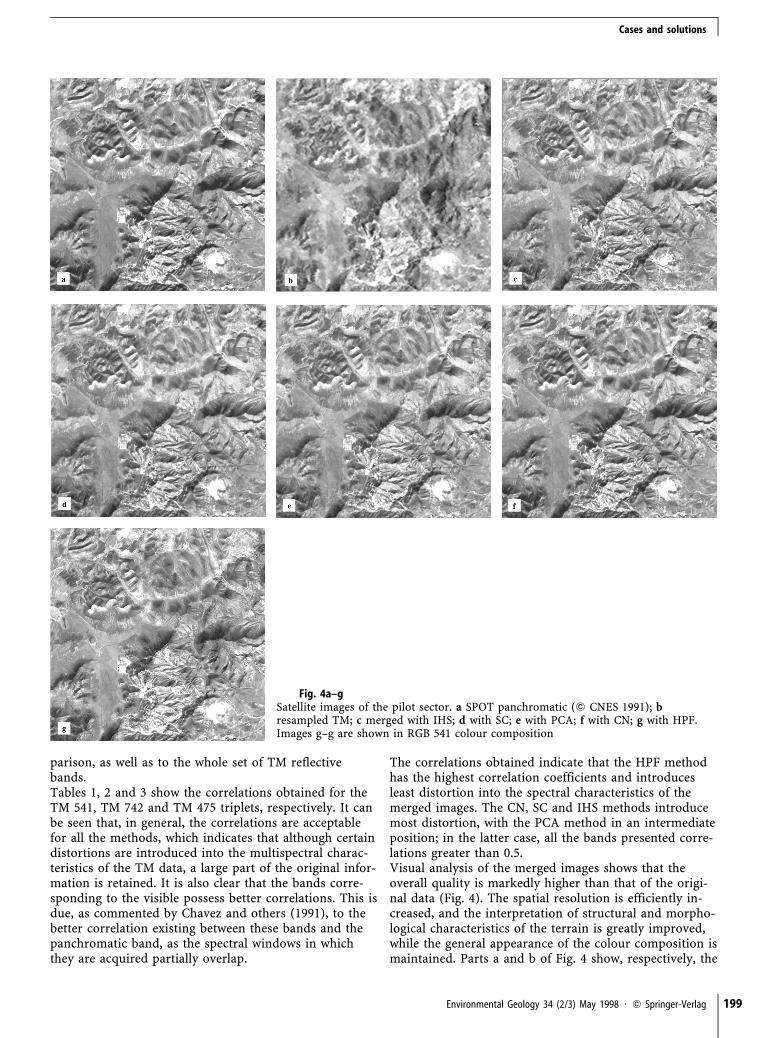
Fig. 4a–gSatellite images of the pilot sector. a SPOT panchromatic (Q CNES 1991); bresampled TM; c merged with IHS; d with SC; e with PCA; f with CN; g with HPF.Images g–g are shown in RGB 541 colour composition
parison, as well as to the whole set of TM reflectivebands.Tables 1, 2 and 3 show the correlations obtained for theTM 541, TM 742 and TM 475 triplets, respectively. It canbe seen that, in general, the correlations are acceptablefor all the methods, which indicates that although certaindistortions are introduced into the multispectral charac-teristics of the TM data, a large part of the original infor-mation is retained. It is also clear that the bands corre-sponding to the visible possess better correlations. This isdue, as commented by Chavez and others (1991), to thebetter correlation existing between these bands and thepanchromatic band, as the spectral windows in whichthey are acquired partially overlap.
The correlations obtained indicate that the HPF methodhas the highest correlation coefficients and introducesleast distortion into the spectral characteristics of themerged images. The CN, SC and IHS methods introducemost distortion, with the PCA method in an intermediateposition; in the latter case, all the bands presented corre-lations greater than 0.5.Visual analysis of the merged images shows that theoverall quality is markedly higher than that of the origi-nal data (Fig. 4). The spatial resolution is efficiently in-creased, and the interpretation of structural and morpho-logical characteristics of the terrain is greatly improved,while the general appearance of the colour composition ismaintained. Parts a and b of Fig. 4 show, respectively, the

Cases and solutions
200 Environmental Geology 34 (2/3) May 1998 7 Q Springer-Verlag
Table 1Correlations for the TM 541 triplet (* indicates the TM 123457set)
Method Band 5 Band 4 Band 1
IHS 0.547 0.438 0.704PCA 0.517 0.635 0.771SC 0.552 0.490 0.798CN 0.560 0.484 0.766
HPF 0.887 0.746 0.751PCA* 0.566 0.630 0.745CN* 0.560 0.468 0.759
Table 2Correlations for the TM 742 triplet (* indicates the TM 123457set)
Method Band 7 Band 4 Band 7
IHS 0.672 0.473 0.703PCA 0.619 0.603 0.670SC 0.470 0.496 0.509CN 0.649 0.487 0.695
HPF 0.804 0.746 0.728PCA* 0.608 0.630 0.704CN* 0.629 0.468 0.680
Table 3Correlations for the TM 475 triplet (* indicates the TM 123457set)
Method Band 4 Band 7 Band 5
IHS 0.411 0.549 0.565PCA 0.655 0.589 0.511SC 0.494 0.633 0.543CN 0.500 0.626 0.544
HPF 0.746 0.804 0.887PCA* 0.630 0.608 0.566CN* 0.468 0.629 0.560
SPOT panchromatic and resampled TM images of the testarea in the RGB TM 541 colour composition, and Fig. 4c–g shows the merged images for each of the methods ana-lysed, also in the RGB TM 541 colour composition, towhich the same linear contrast stretch for visual presen-tation has been applied.The merged images have the great advantage, inherent intheir superior spatial resolution, with respect to the origi-nal multispectral images, of providing more abundantand accurate geomorphological and structural informa-tion, which is expressed as a more precise differentiationof the contacts between different materials. It is wellknown that these are two of the most crucial aspects ofvisual interpretation within the field of geological map-ping. Furthermore, the merged images obtain structuralinformation from the panchromatic image, such that themost important lineaments and fracture systems are still
visible. A visual comparison of the original and themerged data also reveals that, in general, the methodsused in every case produce high-quality images that arevery similar to the original ones. Nevertheless, the imagesobtained by IHS, PCA and SC present stronger colourand contrast than by the other methods, while the colourof those obtained by HPF is less attractive.Study of the merged images has enabled us to create aphoto-interpreted map of the main lithologies and theformer mine works present in the area (Fig. 2). Quaterna-ry sedimentary materials, which occur in the western halfand in the south-eastern quadrant of the test area, appearin the colour compositions (Fig. 4b–g) as reddish-browntones, speckled with green, indicating the presence ofbrushwood-type vegetation and some non-irrigated crops.The discordant contact of these sediments with the vol-canic rocks may be discerned in the SPOT image by thegradient change that frequently occurs, as the sedimentsform flat areas around the hills of volcanic rock; the greytones in this image, however, hardly change between onematerial and another. In the merged images, the coinci-dence of the gradient changes with the varying tonalitymay be observed, enabling the contacts to be very accu-rately mapped. In the TM image, the outcrop in thesouth-eastern quadrant appears in reddish-pink tones,speckled with green due to the vegetation. These out-crops have a similar appearance in the other mergedimages, except in the case of the CN method (Fig. 4f)and, above all, in that of HPF (Fig. 4g), where the tonesare less vivid.The limestones and tertiary calcarenites outcrop in theupper part of the test area. They are of reef origin and insome cases still retain the outlines of the original reefand the slopes with their original downward incline to-wards the progradation of the Neogene basin. Theserocks lie in raised areas, either forming resistant outcropswith a moderate topographic relief or being present asintercalations among volcanic materials. In the TM andmerged images, they are visible as dark-brown materialsand have a planar or undulating morphology, with slopesthat are readily observed in the SPOT and mergedimages, appearing in clear tones, due to their rugged tex-ture. The merged images provide a good characterizationof these rocks, and it was possible to map numerous out-crops in the region that had previously been ill-defined.In the lower centre and on the right of the test area,there are outcrops of hydrothermally altered ignimbrites,where most of the mining activity in this sector was con-centrated. These are basically pyroclastic and ignimbriticflows with an argillic-type variable hydrothermal altera-tion. In the merged images they appear with a speckledtexture in tones of brown, mainly, but also of green andpurple, and with a relatively abrupt relief. There are nu-merous zones with clear tones that correspond to areasof mine works and waste tips.In the centre and to the left of the test area, outcrops ofamphibolic dacites may be distinguished. These aremainly constituted of fine-grain quartz-amphibolic daciteflows and domes, together with some ignimbritic tuffs

Cases and solutions
Environmental Geology 34 (2/3) May 1998 7 Q Springer-Verlag 201
and dacites. In the merged images, these appear as hillsof considerable height, in tones of green. These tonescorrespond to brushwood-type vegetation, which is denseon this type of outcrop.The upper right part of the test area is mainly occupiedby amphibolic dacites and andesites, forming domes, py-roclastic brecchia and areas of biotitic-amphibolic ande-sites which cannot be differentiated in the images. In theTM and merged images, these rocks appear in cyan andpurple tones, and the relief shows relatively smooth hills.There is no great difference between the colours of thesematerials as they appear in the various colour composi-tions, though the image merged with PCA provides adarker tone, more similar to that of the original TMimage.In the lower part of the test area, an outcrop of biotitic-amphibolic dacites may be distinguished. In the field, thenatural colouring of these is reddish-violet. In the colourcompositions, these appear in tones of green, due to thevegetation, with a speckled texture and reddish-browntones. These rocks form a plateau with a pronounced re-lief, formed of several superimposed cooling units.There are numerous remains of mine works throughoutthe test area, mainly dedicated to the search for gold,though also for sulphides and bentonite-type clays. Theseremains normally appear as lighter-toned areas in theimages of Fig. 4, as they correspond to loose, rugged-tex-tured materials that better reflect solar radiation. Analysisof the merged images has enabled us to distinguish nu-merous waste tips and former mine works and to differ-entiate these from the areas where materials derived fromroad-construction projects were piled, such as the elon-gated zone that appears in white in the SPOT image andin light blue in the TM image, to the top right of the testarea. The largest waste tip is located at the bottom rightpart of the test area, and corresponds to the roundedzone that appears in whitish tones in the images of Fig.4. It is formed by the materials resulting from the wash-ing of the auriferous ore in cyanidization pools. There isa rectangular zone in the centre that corresponds to ac-cumulations of gold ore that were exploited by lixivia-tion. These outcrops, which in the TM image appear tobe white, should be equally white in the merged images.However, it is possible to observe discrepancies in thecolours, and hence spectral discrepancies, in the imagesobtained by some of the merging methods analysed. Ifthe original image (Fig. 4b) is compared to the mergedimages (Fig. 4c–g), these differences are seen to be minorin the case of HPF and very marked in the case of IHS,with the other methods in between. In the case of IHS,the round area appears in yellowish tones, and evenbright red at the edges, while the rectangular area is ma-genta coloured, in contrast to the white of the original.
Conclusions
The techniques to merge remotely sensed images of dif-ferent resolutions, such as SPOT panchromatic and Land-sat TM, are highly useful tools for the production ofhigh-quality hybrid images for geological mapping. Theresulting images combine the best of the initial data sets,that is, the spatial resolution of the panchromatic dataand the spectral resolution of the TM data, in a singleproduct, and at the same time retain, to a greater or less-er extent depending on the particular technique em-ployed, the spectral characteristics of the original TMimages, thus ensuring interpretability.The statistical and visual comparison of the images ob-tained by the different methods analysed indicates thatthe five merging techniques enable one to obtain imageswith good visual quality, although a more detailed analy-sis reveals that the HPF method produces least distor-tions to the spectral characteristics of the merged images,followed by the PCA method, while the IHS method pro-duces most alterations, with the SC and CN methods oc-cupying intermediate positions. Nevertheless, the imagesproduced by HPF may be perceived as less visually at-tractive than the others. This fact, together with the easeof application and versatility of the PCA method, led usto select the latter as the most appropriate to use for astudy of the whole area. Furthermore, the possibility ofapplying optimum colour enhancement in the space ofprincipal components (Vives Ruíz de Lope, unpublisheddata) at the same time as data merging was an additionalfactor in favour of this method.In general, the merged images produce a great improve-ment in visual quality and are highly beneficial for theinterpretation of geological and environmental character-istics, enabling the simple, and joint, analysis of spectralTM data, in the form of different colour tones indicatingdifferent outcrops of rock, and SPOT panchromatic spa-tial information, identifying geomorphological and struc-tural units of the terrain. This enables us to discover geo-logical relations that are characteristic of the formationspresent in the study area. The application of these tech-niques to the Cabo de Gata area has made it possible tocreate a geological-enviromnental mapping with a level ofdetail that is sufficient for the purposes of the territorialmanagement of this natural park. In particular, such anapplication enables us to identify and map the areas ofmining activity, extraction zones and waste tips, in addi-tion to differentiating numerous outcrops of sedimentarymaterials and accurately to distinguish numerous con-tacts between volcanic and sedimentary rocks, the envi-ronmental implications of which are highly relevant inthis region with a long tradition of mining. The informa-tion thus obtained is an additional element of interest forthe various studies concerning and the environmentalmanagement of this very special natural park.
Acknowledgements This study was made possible by the CEProject TOROS Environment and Climate Programme and fi-nance received from the DGICYT, Spanish Government, corre-
Cases and solutions
202 Environmental Geology 34 (2/3) May 1998 7 Q Springer-Verlag
sponding to projects PB92-0925-C02-02 and AMB94-1259-CE.The research was carried out within the RSGIS Remote Sensing,GIS and Geostatistical Laboratory, at the University of Granada,No. RNM0122, Andalusian Research Plan, Junta de Andalucía.We are grateful to the anonymous reviewers who helped im-prove the manuscript.
References
Arribas Rosado A, Arribas Moreno A (1995) Caracteresmetalogénicos y geoquímica isotópica del azufre y del plomode los yacimientos de minerales metálicos del sureste de Es-pana. Bol Geol Min 106 : 23–62
Arribas A, Rytuba JJ, Rye RO, Cunningham CG, Podwy-
socki MH, Kelly WC, Arribas A, Mckee EH, Smith JG
(1989) Preliminary study of the ore deposits and hydrother-mal alteration in the Rodalquilar caldera complex, southeas-tern Spain. US Geol Survey Open-File Report 89-327, Reston,Virginia
Buchanan MD, Pendergrass R (1980) Digital image process-ing: can intensity, hue and saturation replace red, green andblue? Electro-optical systems designs, Vol. 12, no. 3 : 29–36
Carper WJ, Lillesand TM, Kiefer RW (1990) The use of in-tensity-hue-saturation transformations for merging SPOTpanchromatic and multiespectral image data. Photogr EngRemote Sensing 56 : 459–467
Chavez PS Jr, Bowell J (1988) Comparison of the spectral in-formation content of Landsat Thematic Mapper and SPOT forthree different sites in the Phoenix, Arizona region. PhotogrEng Remote Sensing 54 : 1699–1708
Chavez PS Jr, Sides SC, Anderson JA (1991) Comparison ofthree different methods to merge multiresolution and multi-spectral data: Landsat TM and SPOT panchromatic. PhotogrEng Remote Sensing 57 : 295–303
Doblas M, Oyarzun R (1989) Neogene extensional collapse inthe western Mediterranean (Betic-Rif Alpine orogenic belt):implications for the genesis of the Gibraltar Arc and magmat-ic activity. Geology 17 : 430–433
Ehlers M (1991) Multisensor image fusion techniques in re-mote sensing. ISPRS J Photogr Remote Sensing 46 : 19–30
Garguet-Duport BJ, Girel J, Chassery JM, Pautou G
(1996) The use of multiresolution analysis and wavelets trans-form for merging SPOT panchromatic and multispectralimage data. Photogr Eng Remote Sensing 62 : 1057–1066
Grasso DN (1993) Applications of the IHS Color Transforma-tion for 1 : 24 000-Scale geologic mapping: a low-cost SPOT al-ternative. Photogr Eng Remote Sensing 59 : 73–80
Hallada W, Cox S (1983) Image sharpening for mixed spatialand spectral resolution satellite systems. 17th Intern. Sympo-sium on Remote Sensing of the Environment. Ann Arbor, vol.1 : 300–310, Michigan, USA
López-Ruiz J, Rodríguez-Badiola E (1980) La región volcáni-ca neógena del SE de Espana. Estud Geol 36 : 5–63
Pelleman AHJM, Jordans RWL, Allewijn R (1993) Mergingmultispectral and panchromatic SPOT images with respect tothe radiometric properties of the sensor. Photogr Eng RemoteSensing 59 : 81–87
Press WH, Flannery BP, Teukolsky SA, Vetterling WT
(1989) Numerical recipes (FORTRAN version). CambridgeUniversity Press, Cambridge
Rytuba JJ, Arribas A Jr, Cunningham CG, McKee EH, Pod-
wysocky MH, Smith JG, Kelly WC, Arribas A (1990)Mineralized and unmineralized calderas in Spain; Part II evo-lution of the Rodalquilar caldera complex an associated gold-alunite deposits. Mineralium Deposita, 25 : S29–S35
Shettigar KV (1992) A generalized component substitutiontechnique for spatial enhancement of multispectral imagesusing a higher-resolution data set. Photogr Eng Remote Sens-ing 58 : 561–567
Visser RLM, Platt JP, Van der Wal D (1995) Late orogenicextension of the Betic Cordillera and Alboran Domain: a li-thospheric view. Tectonics 14 : 786–803
Vrabel J (1996) Multispectral imagery band sharpening study.Photogr Eng Remote Sensing 62 : 1075–1083
Yocky DA (1996) Multiresolution wavelet decomposition imagemerger of Landsat thematic mapper and SPOT panchromaticdata. Photogr Eng Remote Sensing 62 : 1067–1074


![Camera Based 3D Input Method · Cost Sensing and Communication Using Bidirectional LEDs. [2] Nock R., Nielsen F. Statistical Region Merging. [3] Han J. Y. Low-Cost Multi-Touch Sensing](https://img.pdfslide.net/doc/110x75/5fda9aaf5aea46451967b885/camera-based-3d-input-method-cost-sensing-and-communication-using-bidirectional.jpg)