Embed Size (px)
Citation preview

WILLIAM COLLINSNASA, Institute for Space Studies
New York, NY 10025
Remote Sensing of Crop Typeand Maturity
An airborne spectroradiometer was employed to detect ared. spectral shift in the chlorophyll absorption edge and,thus, to discriminate crop type and maturity.
INTRODUCTION
T HE VITAL GOAL of monitoring wheat cropsand other vegetation canopies, based on
spectral properties observed by multi-bandremote sensing systems, has been an elusiveone. Broad-band measurements are sensitiveto large and ambiguous spectral variations inreflected radiation, caused by many natural
which, under varying canopy conditions,remains sensitive to the long-wavelengthproperties of photon absorption by the plantpigment systems. It appears that, during acrop life cycle and from species to species,the aggregated states of the chlorophyll agroup of pigments evolve in a consistent andcharacteristic manner that can be observed
ABSTRACT: A red-shift in the chlorophyll absorption edge ofheadingwheat and grain sorghum is clearly visible in high-spectralresolution measurements made from a low-flying aircraft over Imperial Valley, California. The position of the absorption edge shiftsprogressively toward the longer wavelengths during the crop growthcycle, reaching a maximum in the fully-headed pre-ripening stage.The red-shift of 7 to 10 nm can be measured by using 10 nm-widespectral bands, centered at 745 nm and 785 nm. These two bands,plus a band in the pigment absorption region at 670 nm, containenough information to identify wheat and grain sorghum in theheading stage, to indicate the degree of heading, and to indicatecanopy density during the heading stage.
A smaller red-shift in the absorption edge is also visible in nongrain crops during maturation. The working hypothesis formed as aresult of this study is that the red-shift results from increasingchlorophyll a concentration during the growth cycle. The greaterconcentration produces molecular aggregation by chlorophyllchlorophyll and possibly chlorophyll-protein interactions. Polymerforms shift the far-red absorption edge by adding closely spacedabsorption bands to the far-red shoulder of the main chlorophyll aband.
physical and biological variations in extended biomass canopies. As a result, onlygross differences in vegetation species orcondition can be resolved in the broad-bandintensity information. Much of the canopyinduced problem of background variation inradiance measurements has been overcomein the present study by using a discrimination technique based on the spectral positionof the far-red chlorophyll absorption edge,
as a change in the long wavelength limit ofphoton absorption on the absorption edge.
High-spectral-resolution data gathered forthis study using a specially designed airborne system show for the first time that variations in the spectral position of the far-redabsorption edge can be detected in the fieldwith remote sensing techniques. Underspectral resolutions on the order of 2 to 10nm, shifts in the absorption edge of crop
43PHOTOGRAMMETRIC ENGINEERING AND REMOTE SENSING,
Vol. 44, No.1, January 1978, pp. 43-55.

44 PHOTOGRAMMETRIC ENGINEERING & REMOTE SENSING, 1978
spectra are clearly visible to the remotespectral sensor. The shift is progressivelytoward the longer wavelengths during plantgrowth and maturation. In wheat and grainsorghum, a very pronounced red-shift occursduring the heading stage. The far-red progress of the shift is sensitive to the degree ofheading, which can be discriminated withproperly placed narrow bands despite largecanopy-induced background variations inother parts of the spectrum. The magnitudeof the red-shift distinguishes the headedgrains from other non-grain crops in the areasurveyed.
The results from the available aircraftspectral data of crops indicate that not onlyare wheat and grain sorghum clearly identified, but also that, with further development, it may be possible to estimate canopydensity and yield during the crucial headingstage based on remote sensor data alone.This information is contained in three spectral bands positioned to measure the near-IRretlection at 785 nm, reflection in thechlorophyll a band at 670 nm, and the redshift at 745 nm.
Changes in the long wavelength limit ofphoton absorption by chlorophyll and wholequantasome extracts have been observed inlaboratory studies. These results are reviewed later in this paper in the discussionof the physicochemical origin of the redshift. A shift in the spectral position of thechlorophyll absorption edge of whole leafsamples has also been reported by Gates etal. (1965). Their laboratory measurements ofwhite oak leaves show a progressive shifttoward the longer wavelengths as the leavesmature. The in vivo properties of the redshift or its application to remote sensinghave not, however, been reported previously. The present study ofplant canopies usingairborne remote sensing techniques (1)examines the problem of ambiguousbackground variations that effect remoteradiance measurements and analysis of vegetation canopies; (2) presents the red-shiftphenomenon observed in vivo with the airborne remote sensing system, and discussesthe potential use of the red-shift to improveremote sensing analysis of vegetationcanopies-grain crops in particular; and (3)discusses a working hypothesis for the originand behavior of the observed red-shiftphenomenon.
DATA COLLEcnON AND INSTRUMENTATION
The airborne survey was conducted inImperial Valley, California in May and September, 1975. The data were collected be-
tween 11:00 a. m. and 12:30 p. m. with clearskies and low haze conditions. More than300 fields in plots V4 mile and V2 mile (400and 800 meters) on a side, sectioned in anorthogonal pattern, were surveyed. Themain crops growing in the survey sites werewheat, alfalfa, cotton, sugar beets, sudangrass, and milo. All crops in the area aregrown under flood irrigation. The ImperialValley sites were chosen because of the variety of crops and different stages of growthavailable simultaneously. Flight lines wereflown over selected areas in a 5 mile longeast-west pattern parallel to the ground sectional pattern. The data and the survey areaare documented in more detail in Ungar etal. (1977).
The instrumentation used is a 500 channelspectroradiometer with 1.4-nm wide bands,sensitive in the 400-nm to 1100-nm spectralregion. The system employs a parallel inputoptics and detector array design, which givesoptimum band-to-band registration of theground target from a moving platform, andhigh sensitivity at rapid data acquisitionrates. The system acquires 500 channelspectra at the rate of 2.5 spectra per second.The data are digitized and stored on computer-compatible magnetic tape. The instrumentation is described fully in Collins(1976) and Chiu and Collins (1978).
The instrument was flown at 610 m abovethe ground and at 200 km per hr groundspeed. The target measurements were takenwith an 18 meter square field-of-view and ina contiguous one-dimensional sequencealong the ground track. Fifteen to fortyspectra were obtained in each field, dependent on field size, giving a complete crosssectional sampling of the field. The datawere calibrated channel-by-channel forradiance received at the entrance aperture.The calibrated spectral data have been processed in order to obtain individual reflection curves (in spectral radiance) and differential spectral information in the crosssectional sample (traverse) of individualfields (standard and percent standard deviation). Discrete wider band ratios have beencalculated for field and entire flight linetraverses by integrating over selected portions of the spectral curves.
INTERPRETATION OF AIRCRAFT SPECTRAL
DATA
SPECTRAL VARIATIONS IN EXTENDED NATURAL
CANOPIES
In order to appreciate the importance ofthe spectral information obtainable from the

REMOTE SENSING OF CROP TYPE AND MATURITY 45
~I----------------i
B
°4·':::00=---=-~~---=60::!-:0=---:;7;!::OO=---;800=---;900=---;;IOOO=-~1100WAVELENG TH (NANOMETERS)
WHEAT
020 I~~O~:~~R,SENESCENT STAGE(GREEN-YELLOW)
381--------------l
.~I---------------l
.~r----r--r--..--..--"T"""""-"T"""""--'
...uz~ .001a""l<
... 20z...~~ 10
,"
~': .015
"" ~rs OlO
J~
AWHEAT
12 INCHES,10 TO 80 -I. LEAF
COVER.BooTPHASE (GREEN)
STANDARD
~
0400 ~
PERCENT STANDARD DEVIATION
--2.1----------------i.002...uz5 .ocu
""l<
... 20z...Ul<...... 10
1......020
"utf~ .Ot5z~.....~'E .010l<~
~-.OO~
FIG. I. Reflected spectral radiance and deviation spectra ofwheat from two fields in different stages ofgrowth. The top curves show the spectral extremes in each field based on the ratio of near-IR reflectionat 785 nm to chlorophyll absorption at 670 nm.
position of the chlorophyll absorption edge,it is necessary to understand the physical effects responsible for the vegetation canopyspectra. It is necessary in particular to establish the nature of the canopy-induced spectral variations inherent in the aircraft remotesensor measurements, which are individually integrated over extended, nonhomogeneous fields-of-view and collectively gathered over terrain with varyingcanopy conditions.
A combination of different energy-matterinteractions in the visible (400 to 750 nm)and near IR (750 to 2000 nm) are responsiblefor the characteristic vegetation spectrashown in Figure 1 and elsewhere in thisstudy. In the near IR, leaf material is transparent to the long wavelength radiation.This radiation is scattered by multiple reflections at optical density boundarieswithin the mesophyll structure (Gates et al.,1965; Gates, 1970). Therefore, the near IRreflectivity of a vegetation canopy is dependent on development of the mesophyll structure in individual plants and on the verticaldensity (up to the light penetration limit) ofthe overall canopy. Laboratory measurements presented by Gates et al. (1965) andGates (1970) show increasing near-IR reflectance in white oak leaves during themesophyll development stage of plantgrowth. Increased reflectance from multipleleaf layers is demonstrated by Myers et al.
(1970). Laboratory measurements by Gates(1970) also show a decrease in the IR reflectivity in matured plants in the senescentstage where dehydration occurs and themesophyll structure breaks down.
Radiation interactions with thechlorophylls and auxiliary pigments in thevisible region are far more complex. Photonabsorption bands of individual chlorophyllpigments are on the order of 25 nm or less inwidth. In a living plant, however, the interactive effects of the photon absorbingpigments broaden the absorption bandscausing considerable overlap. In addition,large changes in the refractive indices forwavelengths near the pigment absorptionfrequencies (anomalous dispersion) causewavelength-selective losses of radiation byscattering (French, 1960). This "apparentabsorption" also tends to widen the photonabsorption region and increase the overlapamong individual bands. The result is a wideabsorption area in the visible region withonly a small rise in the green part of the reflection spectrum at 550 nm where the overlap is not quite complete.
Although the enhanced reflectivity in theIR and the absorption in the visible spectrum are due to different processes ofenergy-matter interaction, they are relatedinsofar as chlorophyll production andmesophyll development are interdependentfunctions of the plant growth and vigor.

46 PHOTOGRAM METRIC ENGINEERING & REMOTE SENSING, 1978
Under field conditions, unfortunately, variations in relative reflectivity between thenear-IR region and the red chlorophyll absorption band can be caused by several(sometimes overlapping) plant or canopyconditions. For instance, the spectral reflection variations due to the ground surfaceshowing through a healthy green canopy aresimilar to the spectral variations producedby chlorosis.
Nature ofcanopy related variations in theaircraft data. Spectral variations due tocanopy density effects and ripening in twodifferent wheat fields from the Imperial Valley study are shown in Figure" 1. Spectralreflection curves show the two most different spectra in a single field. The differencecriterion is the ratio difference between thenear-IR plateau and the chlorophyll absorption band at 670 nm. The lower curves showthe standard deviation and percent standarddeviation among all spectra in the individualfields. The deviation spectra are calculatedfrom 15 to 40 spectral measurements depending on the field width along the aircrafttraverse. The spectral variation in the field ofyoung green wheat with areas of sparser leafcover (figure lA) are similar, except for degree, to the spectral variations seen in awheat field in the senescent (ripening) stage(figure IB). In the case of soil showingthrough the canopy and senescence, the decrease in chlorophyll absorption is accompanied by a drop in the IR reflection.
In addition to these spectral variations, independent fluctuations occur in both thechlorophyll band and the near-IR plateau inhealthy plant canopies with total leaf cover.Variation in the IR plateau in fields of alfalfaand cotton, shown in Figures 6B and 7, arenot accompanied by a sympathetic variationin the chlorophyll band. Similarly, the variation in the chlorophyll band in the alfalfafield of Figure 6A is not accompanied by anIR plateau fluctuation. These independentspectral variations compound the alreadylarge uncertainty inherent in using the relative height of the IR plateau and depth of thechlorophyll band as an indication of plantspecies, canopy condition, or state of stress.
SPECTRAL VARIATION ON THE CHLOROPHYLL
ABSORPTION EDGE
The far-red absorption edge between 700nm and 750 nm has been considered a transition region that, when using wide spectralbands on the order of 50 nm or more, doesnot contain information useful in remotesensing of vegetation canopies (Tucker andMaxwell, 1976). This is understandable be-
cause broad bands straddling the absorptionedge are in a position to be sensitive to theintensity variations in both the chlorophyllabsorption region and the near-IR plateau ofhigh reflectivity in green canopies. Therefore, radiance measurements in bands covering the entire 700 to 750 nm region would bea convoluted function of the canopy variables affecting the spectral regions on bothsides of the absorption edge. The problemsof background canopy-induced variationsbecome more complex when using broadbands in the absorption edge region.
Under the wavelength resolutionachieved in the airborne system, however,the absorption edge region contains uniquespectral information about the location of thefar-red pigment absorption bands. This is theonly region in the vegetation spectrumwhere the sides of the pigment absorptionbands are unobstructed and can be used toextract spectral information that may indicate the physicochemical states of the pigment systems. Furthermore, with properlyplaced narrow bands in this region, thebroad-band problems of canopy-inducedbackground "noise" variations are greatlyreduced.
The red-shift. In the aircraft data from Imperial Valley, the absorption edge in spectraof crop canopies shifts toward the longerwavelengths as a function of both crop typeand stage of growth (Figure 2). The largestspectral shift, 7 to 10 nm toward the longerwavelengths, occurs consistently in thespectra of wheat crops during the green,headed stage. A red-shift of similar magnitude is present in the reflected spectra ofgrain sorghum (milo), also in the green,headed stage.
Green alfalfa and green wheat are amongthe "confusion" crops, with respect to theirbroad-band spectral characteristics. Individual spectra of these crops, compared inFigure 2, show a typical example of thedistinctive red-shift phenomenon as it develops in the green wheat spectrum duringthe heading stage. The red-shift occurs alongthe entire length of the absorption edge. It ismost pronounced on the shoulder at =740nm.
The difference and percent differencespectra for the two spectral curves in Figure2 are shown in Figure 3. A maximum relativedifference of 15 percent occurs on the absorption edge at 725 nm. The absolute difference is greatest on the shoulder at 740nm. The width of the difference peaks is =50nm at the half power points. Among the morethan 300 crop fields surveyed, the spectral

REMOTE SENSING OF CROP TYPE AND MATURITY 47
.040 r------,,------,-----,------,-----,.----,------,
RED SHIFT
RED SHIFT IN THE SPECTRUM
OF HEADING·WHEAT WMPAREOWITH ALFALFA
.035
.030
~7
.025:n~
~i .020
E
wu .015z<lCi<l<r .010
.005
400 500 GOO 700 800 900 1000 1100
WAVELENGTH (NANOMETERS)
FIG. 2. The reflected spectral radiance of wheat in thegreen, headed stage compared with the spectrum of mature,green alfalfa clearly shows the nature of the red-shiftphenomenon.
shift of this magnitude and toward the longerwavelengths is an unambiguous indicator (1)of grain crops in the green, headed stage asopposed to grain crops in pre-heading (boot)or ripening stages; and (2) of green, headedgrain crops as opposed to green, non-graincrops.
Narrow band ratios for canopy discrimination. For analyzing large numbers ofspectra, the aircraft data have been reduced
to the four lO-nm wide bands shown in Figure 2. The lO-nm bands are simulated byintegrating the 1.4-nm instrument channelsover the selected spectral regions. Band 1, at670 nm, is at the center of the chlorophyll aabsorption region. Bands 2 and 3, near thedifference maxima in Figure 3, are centeredat 735 nm and 745 nm; they are shifted toward the longer wavelengths to avoid the effects of intensity variations in the 670 nm
.010,-----,------,----.---,---,---,------,50
.008 40OJUZ<lo;i.oOG
::<:0<r....~.004Q.U)
OJUz~.002
w"'"'-o
o
EoI!.
~l1...
"'"'"(")'"30 z-<
~-.,-.,'"20 '"'"z(")
'"U)
10 ~(")
-<
'"c;::o
-.002 -10400 ~oo GOO 700 800 900 1000 1100
WAVELENGTH (NANOMETERS)
FIG. 3. Difference spectra of wheat and alfalfa.

48 PHOTOGRAMMETRIC ENGINEERING & REMOTE SENSING, 1978
chlorophyll region. The crossover, quasiisobestic point, between the major effects ofpigment absorption in the visible region andenhanced reflectivity on the near-IR plateau,is indicated by the dip in the deviationcurves at 730 nm (e.g., Figure IB).
Band 4, on the near-IR plateau at 785 nm,is the reference point for relative measurement of apparent chlorophyll absorption inband 1 and the red-shift in bands 2 and 3.Band 4 is placed on the absorption shoulder,close to the difference maxima, in order tominimize possible noise effects of wideband variations in the near-IR region, Le.,canopy effects, instrument factors, atmospheric effects. The four bands for discrimination have been tested by varying the positions and widths. The present configurationgives optimum contrast of relative variationsin the chlorophyll absorption region and onthe absorption edge.
Red-shift in wheat. The band 4/3 ratioshave proven the most sensitive to the redshift. The 4/3 and the 4/1 ratios for 10 wheatfields in various stages ofmaturity are shownin Figure 4. The band ratios are plotted withrespect to the sequence of spectral measurements along the traverses of selectedfields from three adjacent flight lines. Allspectral data presented in Figure 4 weretaken within a 15-minute interval at midday, which amounts to a 2 degree change insolar elevation at that time and location.
The red-shift among wheat spectra followsa very consistent trend over the crop life cycle. The absorption edge shifts progressivelyinto the far-red (4/3 ratios increase) duringthe green growth stage. The shift reaches amaximum when the heads are fully emergedand green. The ratios, for 24-inch wheat, increase from 1.15 for the unheaded wheat to1.25 for the field of24-inch wheat with headsemerged. The incremental nature of the increase is probably an artifact of the data: noearly stages of heading occurred in the area.The wheat heads in the 24-inch headed fieldare not quite fully emerged (90 percentemerged). The ratios for the following twofields in the fully headed stage go wellabove 1.30. The band 4/3 ratios declinesteadily in the senescent (ripening) stageand go below 1.10 as ripening progresses.
Although the band 4/1 ratios follow a general upward trend in the green growth stage,the variations within fields and amongfields, which can be considered the canopyinduced noise, range between 7.0 and 13.0for headed and non-headed (booted) wheatalike. In contrast, the 4/3 ratios increase from1.150 to greater than 1.250 with only a±0.025 canopy-induced noise variation. Thered-shift, measured by the magnitude of the4/3 ratios, is an unambiguous indicator ofheading in the green wheat. Furthermore,the large canopy-induced noise variations affecting the 4/1 ratios do not have the same
28024020016012080
WHEAT20.0 GROWTH STAGE $[N£SCENT STAG(
BOOT PHASE ~J:.; H[AOS ["ERGLO ~ liIt!:!:NPROGRESSIVE PHASES Of 'l'E:LLOWtNG
12 INCHES,1O TO eo.,. COVER 241trK;HD. M leKS. 36 TO 40 INCHES. 36 TO 40 INCHES,K)()"'COV£Ren 16.0 IOO'IoCOYEit ~~ 100... COY(JIl
0;::<I
~~~.a: 12.0
"".0 8.0Z<I
~ ~.I-III
4.0
0.0
1.300
~~IenQ 1.250
~0::·1.200...,
~III~ 1.1500:i 1.100III
1.050
SPECTRUM NUMBER
FIG. 4. Spectral band ratios from traverses over selected wheat fields in differentstages ofgrowth. The ratio curves are constructed from the 15 to 40 measurements takenin a continuous sequence along aircraft traverses of each field.

REMOTE SENSING OF CROP TYPE AND MATURITY 49
signal degradation effect on the 4/3 ratios.The decrease in the 4/1 ratios toward theedges of the fields, where the canopies aregenerally thinner, is not reflected in the 4/3ratios.
The red-shift is also very sensitive to thedegree of heading, as indicated by the lowerratios ("'"1.250) in the field of 24-inch wheatwith the heads only 90 percent emerged.The average 4/3 ratios of fully headed fieldsare higher by twice the noise factor than theheading field. This difference is not visibleamong the 4/1 ratios of the heading andfully-headed fields. These relationships demonstrated in the sample fields of Figure 4hold true for all wheat crops observed in 72aircraft traverses of 49 individual wheatfields in the survey sites.
The ripening fields presented in Figure 4are in the earlier stages of turning greenyellow. The first yellowing tint is barelyperceptible to the eye in the field centeredat spectrum 180. The 4/1 ratios drop veryquickly in the senescent stage, probably as aresult of dehydration at the onset of senescence. The 4/3 ratios indicate that the absorption edge shifts back toward the shorterwavelengths in the senescent wheat.
Red-shift in other crops. The spectralband ratios for some non-grain crops and forgrain sorghum (milo) are shown in Figure 5.
Although the 4/1 ratios vary widely in thesecrops, due mostly to canopy density variations, the 4/3 ratios follow consistent trends.The non-grain crops occur in various stagesof growth and canopy condition throughoutthe survey region, but the absorption edgedoes not shift into the far-red region beyonda maximum 4/3 ratio of 1.15 in any non-grainfield. The ratios range between 0.95 for baresoil to 1.15 for a mature green canopy. Thered-shift in grain sorghum spectra, however,follows a trend similar to the one in thewheat cycle. The heading stage is accompanied by a high 4/3 ratio that drops in theripening stage. The non-grain form of sorghum (sudan grass) does not develop a redshift.
Selected spectra from some of the fieldsused in Figure 5 are shown in Figures 6 and7. The two individual spectra for each fieldare those with the maximum difference inthe 4/1 ratio. The spectral variation within aspecies is far greater than any differenceamong them, except in the position of thefar-red absorption edge, which can hardly bediscriminated by eye in the spectral plots.
The small variations that occur on the absorption edge of non-grain crops can be observed in the sensitive 4/3 ratios. These absorption edge variations, which, on a muchreduced scale, behave similarly to those ob-
ALFALFA COTTON SUGAR BEET SUDAN GRASS MILO
20.0
16.0eno~a:
::':(~s. •II.cIlU,
I I IMHlCIII1. IC)OlI, IO'l.CO¥fI,
.IT020 toTU ,. ,"CIIU. lOO""toYfll, uro, IUlCAOWlIlSDI:¥.,
12 TO 14 IIt(IIU, IIICIIU, '0 TO 100'" tOVl., Ik.OSSO-S UO ClOWtIS ""IJI' atOP J TO I.' Fru,tsTOIOO'l.c:ow.R IOO'l.COV(Jl Nf-tLOSSOll STAU (LOUD MUS "'tIL. ItUOY FOIl MUVfSf TotOlOO"Ic:ovt:ll
STO... ,4111eMU,nn, .'"CtlU. lOO"'C{WU.TOTO IOO"'C'MIt. _f:llI110CItOWIS100'" snocflOMlS NSTHtl...I.,roeMit 0fV(l.1'lt(f"1 Mf.".IlfOnlT
'4 ftl4f1IIItN.,lOO"'toYf.,_SIn~ ....,fOlIMdY(ST
1.300enQ 1.250!:ia: 1.200r<'l
~ 1.150o~ 1.100CD
1.050
40 120
SPECTRUM NUMBER
FIG. 5. Spectral band ratios from aircraft traverses over fields containing other major crops in thesurvey area.

50 PHOTOGRAMMETRIC ENGINEERING & REMOTE SENSING, 1978
.030 03C ,---,---.,--,----,-",,---,---,---,
01---------------1
ALFALFA18 TO 20 INCHES,
100·/. LEAF COVER
STANDARDDEVIATION
01---------------1
ol---=======::~------____I
t: .002z<Io<Ia:: .001
.005
.025
";"~ .020'" vu_·z'~} .015<I'
'" 5•.010E
AALFALFA
12 TO 14 INCHES,95 TO 100% LEAF
COVER
STANDARDDEVIATiON
01---------------1
.025
.015
~~I: .010
.§
.005
loW .002uz<Io~ .001
PERCENT STANDARD DEVIATION PERCENT STANDARD DEVIATION
40
.... 30
~u'"'"Q. 20
10
°4':-00=---=500~---=600=---=7::':00::--e::00::--::90:-:0,..-:::10':-00=---:-:'1I0·0WAVELENGTH (NANOMETERS)
40
.... 30z'"u.'"'"Q. 20
10~
~0'-:0--:-500~---=6.L00=---=7~00=----,e::':00::--9OC::-:----:1-="000l::::--.,.J1l00WAVELENGTH (NANOMETERS)
FIG. 6. Reflected spectral radiance and deviation spectra from two alfalfa fields with differingvariance characteristics.
served in the wheat growth cycle, may beindicative of maturation within thesespecies. The higher 4/3 ratios for alfalfa andcotton in Figure 5 occur in the taller or moremature fields. The lower ratios for sugarbeets occur in the post growth stage: readyfor harvest. As further example, the deviation curves for the shorter alfalfa crop (Figure 6A) indicate a uniform canopy with varying chlorophyll content, suggesting thepigment development stage. Compared withFigure 5, the red absorption edge is well toward the shorter wavelength region, also indicating a young, developing pigment system. In the taller crop, the chlorophyll isvelY uniformly developed (Figure 6B), andthe absorption edge has shifted toward thefar-red in Figure 5. This is probably theorder of magnitude signal that will be important in the analysis of non-grain crops andother types of vegetation. Noise filteringmay be required to further analyze thesesmaller red-shifts.
Wheat discrimination based on the redshift. The obvious and vital application ofthe red-shift in grain crops is toward
monitoring growth conditions in the vastwheat fields of the Midwest and other areasof the world. With further experimentationand quantification of the information available in the 4/3 and 4/1 ratios, the potential foridentifying wheat and estimating grain yieldbased on spectral remote sensing techniquesmay improve significantly.
Ratio plots for the data in one continuousaircraft traverse of ten fields are shown inFigure 8. The crops covered in this traverseinclude wheat in various stages, alfalfa, andsugar beets. High 4/1 ratios indicate thickcanopy development in three fields containing wheat and alfalfa. The high 4/3 ratiosclearly distinguish the two headed wheatfields from the alfalfa, which has very low4/3 ratios. The 4/2 ratios also separateheaded wheat from the other fields, but thecontrast is not as clear as in the 4/3 curve.The slightly lower 4/3 ratios in the headedwheat field near the end of the flight line(spectra 240 to 260) indicate that heading hasnot progressed as fully as in the field with4/3 ratios exceeding 1.30. Ground-truth substantiates that the wheat heads in the field

REMOTE SENSING OF CROP TYPE AND MATURITY 51
.040 r---.--,...----,---,.----,r--r------,
COTTON36 INCHES,IOO". LEAF COVER,BLOSSOMS AND CLOSED BALLSoN'PLANT'S'
.030
.020
~ .010o
N 0 '---_-'-_--'-_-'-_----'-_----JL-_-'----_...J'E 400 500 600 700 800 900 1000 1106o
.040 r--,---,...----,---,.----,r--r------,
.040 r---r---,---.------r--r--r----,
SUGAR BEETS24 TO 36 INCHES, 100% LEAF COVER.BROWN·SEEa·CROWNS
.030
.020
'.010
500 600 700 800 900 1000 1100
.040 "'--,--,...--.-----,-----,r--r---,wuz«Ci~ .030
SUDAN GRASS3 TO 6.5 FEET, 70 TO 100%LEAF COVER
MILO40 INCHES, 100·'" LEAF COVER,SEED HEADS GREEN
.030
oL-_-'-_--L_--l..._---l._.......JL.-_.l-_.J400 500 600 700 BOO 900 1000 1100
.020
.010
500 600 700 BOO 900 1000 1100
WAVELENGTH (NANOMETERS)
FIG. 7. Reflected spectral radiance curves showing the extremes of spectral variation in fourfields used in Figure 5.
with slightly lower 4/3 ratios have not yetfully emerged, The sharp shoulders on the4/3 ratio curves of the headed wheat indicatethat heading has occurred, or is uniformly inprogress, across the fields. The roundedshoulders on the 4/1 ratio curves, however,indicate that these crops have thinnercanopies on one side of the field,
The identification of wheat and indicationof the degree of heading are a critical part ofthe information required for grain yield estimates. The high 4/3 ratios also indicate thatthe canopy is in the mature, green stage,which removes the ambiguity introduced inbands 1 and 4 by the effects of underdeveloped pigment systems in young canopiesor chlorosis in senescent canopies. Giventhe information that tHe canopy is green andmature, canopy density estimates based onthe 4/1 ratio values should definitely improve.
PHYSICOCHEMICAL ORIGIN OF THE RED-SHIFT
The red-shift in the absorption edge ofwhite oak spectra, observed by Gates (1965),was interpreted as a response to variation inchlorophyll content. Evidence from the literature on photosynthesis research substantiates this interpretation. However, thephysicochemical states of the pigment systems responsible for increased photon absorption at longer wavelengths are onlypartly understood; they result from a verycomplex system of bioenergetic and biochemical processes that are difficult toresolve, especially in living plants.
In the green plants, an undeterminednumber of pigments interact in a specific ordered sequence to energize the photosynthetic reaction. Chlorophyll a, which isthe pigment present in all green plants, isthe end member in the ordered sequence.Photon absorption by this pigment deter-

52 PHOTOGRAMMETRIC E GINEERI G & REMOTE SENSING, 1978
FIG. 9. Schematic diagram of the two pigmentsystem model of green plant photosynthesis (fromRabinowitch and Govindjee, 1969).
POLYMERIZATION
The multiple forms of chlorophyll a absorbing beyond the far-red limit of the mainchlorophyll a band at 675 nm can beexplained by polymerization of the singlemolecule form. Aggregation of chlorophyll amolecules in highly concentrated solutionsbroadens the absorption band and also shiftsit toward the far-red (Brody and Brody,1963). The absorption spectrum of achlorophyll a extract from bacteria shows ared-shift of up to 12 nm in the dimeric formrelative to the absorption spectrum of the
llqhl reochon!LUJhI reoclionn
Pigmenl system n
terns of pigment interaction occur simultaneously in green plants (Govindjee andGovindjee, 1975). The two types of photosynthetic units (Figure 9) apparently perform photosynthesis by somewhat differentprocesses using different relative amounts ofaccessory pigments, chI a 670, and chI a 680to gather energy for sensitizing photosynthesis. (The numbers 670 and 680 indicatethe central absorption wavelength.)
The two pigment systems are distinctivein that they transfer energy to different longwavelength chlorophyll forms (chi a 690, chia 695, and chI a 700) at the termini of thedual bioenergetic chains. These longerwavelength pigments, although they absorbphoton energy, apparently are not importantenergy contributors for the photosyntheticprocess. They serve rather as the critical"energy trap" for photon energy absorbed bypigments farther up the chain (Rabinowitchand Govindjee, 1969). The photosyntheticreaction is energized in these vital longerwavelength forms of chlorophyll, whichfunction as the reaction center.
WHEAT DISCRIMINATION
15.0
"<toZ
~
(f)
o~ 10.0
(f)
of= 1200<l0::r<l 1.150~oZ<l
m105011 ~1.000o 50 100 150 200 250
SPECTRUM NUMBER
FIG. 8. Continuous aircraft traverse of ten cropfields. The ratio combinations of band 4 withbands 1, 2, and 3 are plotted in the measurementsequence along the flight path.
1.250
1.300
(f)o!i0::N"<toZ
~
mines the position and shape of the far-redabsorption edge in the reflectance spectrum.The chlorophyll a group absorbs in a variable band that is nominally 30 nm wide andcentered at about 675 nm. This band contains the two most abundant forms ofchlorophyll a: chI a 670 and chI a 680.Photon energy absorbed by the accessorypigments at shorter wavelengths (mainlychlorophyll b and the carotogens) is passedon to the chlorophyll a group.
TWO PIGMENT SYSTEMS
The interacting pigments in a bioenergeticchain are defined as a photosynthetic unit.Although the details of the interactionswithin a photosynthetic unit are controversial, the general biophysical process is welldocumented. Two distinct bioenergetic sys-

REMOTE SENSING OF CROP TYPE AND MATURITY 53
monomer (Sauer, 1975). A study by Dratz etai. (1967) on whole quantasome extracts ofbarley indicates that about half of thechlorophyll a is aggregated, and much of itmay be in a higher form than the dimer. Theabsorption band of the partially aggregatedchlorophyll a shows component peaks at 673nm, 683 nm, and 695 nm. The two longerwavelength peaks are due to absorption bythe aggregated chlorophyll forms. The resultant absorptance curve peaks at 678 nm andhas a broadened shoulder on the far-red side.
Methods of derivative spectroscopy havebeen used to resolve the longer wavelengthforms of polymeric chlorophyll a that develop progressively from the monomericfOlm. Litvin and Sineshchekov (1975) showthat as concentration of chlorophyll a increases, resulting in more aggregation(chlorophyll-chlorophyll interactions andprobably chlorophyll-protein interactions),the apparent broadening of the absorptionband actually is due to the addition of narrowly spaced bands appearing in the far-redshoulder. The new bands result from thesplitting of the allowed energy levels in theexcited electronic states of the more complexpolymer molecules. The discrete nature ofthe bands indicates selection rules of quantum mechanics in the physicochemicalbonding of aggregate states. Litvin andSineshchekov conclude that chlorophyll aforms between 665 nm and 676 nm are probably dimeric with increasing interaction orpacking density toward 676 nm. The longerwavelength forms are higher order polymers.
Preferred polymeric bonding states, therefore, would explain the persistence of certain far-red peaks commonly observed at 685nm, 695 nm, 700 nm, and 707 nm. Thesepeaks become progressively weaker; however, only small red-shifts in the absorptionpeak can give the edge variation seen inwheat. Ke and Sperling (1967) show that a 2nm red-shift in the absorption maximum ofpolymerized chlorophyll a results in a 15percent peak in the difference spectrum.Their results very closely match the red-shiftseen in Figure 2 and the difference spectrumof wheat and alfalfa in Figure 3.
RED-SHIrr HYPOTHESIS
The physicochemical mechanism of thered-shift, from the latest experimental evidence, is most likely polymerization, orother forms of aggregation, of chlorophyll a.The biochemical and physiological events inthe plant cycle that could affect polymerization, however, are not resolved. A change in
activity between the two separate photosynthetic systems could determine the relative amounts of long wavelength pigments.On the other hand, concentration of chlorophyll a would determine the degree ofpolymerization, in which case, relative activities of the two bioenergetic chains wouldhave to adjust according to the concentrationof the long wavelength forms of chlorophylla. The events that determine chlorophyll aconcentration could begin farther down thebiochemical chain where thermochemicalreactions controlled by plant enzymes produce protochlorophyll. The protochlorophy11 is rapidly converted to chlorophyll by a photochemical reaction inthe presence of visible radiation in the shorter wavelength region. The slower thermochemical reactions, therefore, may alsocontrol the events observed on the far-redabsorption edge by controlling the rate ofchlorophyll a production.
DISCUSSION
The airborne spectroradiometer study ofImperial Valley agricultural fields revealsthe red-shift phenomenon as it occurs in thecrops and under the growing conditions inthe survey sites. Extensive additional research will be required to explain fully thein vivo characteristics of this biologicalphenomenon, namely, its dependence oncrop variety, irrigation practices, fertilization, health and vigor, disease, and manyother environmental factors and management practices. The experimental resultsthus far obtained, however, indicate th:;tt theposition and shape of the far-red absorptionedge is potentially a very important diagnostic in remote sensing ofvegetation canopies.
The red-shift phenomenon is all the moreinteresting because it can be observed independently of background canopy-inducedvariations that confuse the information inother spectral regions. The large backgroundvariations induced by canopy effects areespecially overwhelming in agricultural andforestry applications aimed at detecting subtle states of plant condition or stress. In remote surveillance of crops and forests, it isdesirable to detect the smallest possiblespectral reflectance variations in order toevaluate growth and vigor or to detect theearliest phases of disease and insect infestation. In order to be useful in remote sensing,the subtle spectral variations indicating abnormal plant conditions or different phasesof growth must be uniquely different fromthe canopy-induced background variationsin biomass canopies, and detectable even in

54 PHOTOGRAMMETRIC ENGINEERING & REMOTE SENSING, 1978
the presence of the very large canopyinduced "noise" in remote spectral measurements.
Based on the ratio plots of Figures 5 and 4,it can be concluded that the young non-graincrops are very low in far-red pigments. Evenunder full canopy conditions, the 4/3 ratiosstay below 1.05. Maturity in the non-graincrops affects a small red-shift, but the ratiosdo not exceed 1.15. The large red-shift develops only in the heading grains. They areidentified by 4/3 ratios greater than 1.20. Ifthese or similar limits persist under fieldtesting, discrimination based on the upperlimits, especially of the headed grains, willbe unique.
The upper limits of variation in the 4/3band ratios are uniquely determined by theposition of the absorption edge. The common environmental noise factors operate onthe 4/3 ratios in the opposite direction fromthe red-shift. For example, large amounts ofsoil showing through the canopy will depress the 4/3 ratio signal. The 4/3 ratios forbare soil in the survey region are in the rangeof 0.97 to 0.95. Increasing atmospheric interference should have minimal effect on the4/3 ratios. Atmospheric effects are broadband and relatively small in the red and farred region; they are further minimized bythe close band spacing. Those atmosphericeffects that are seen, will tend also to depress the 4/3 ratios because or-higher backscattering in the shorter wavelengths (band3) and greater absorption in the longerwavelengths (band 4). Lower 4/3 ratios,therefore, can be ambiguous; but the higher4/3 ratios uniquely identify vegetationcanopies with far-red absorbing pigments.
Variations in the position or shape of theabsorption edge, other than the red-shift associated with maturing pigment systems,have been observed. Laboratory measurements by Keegan et al. (1956) show a rounding effect on the shoulder of the absorptionedge in the near-IR spectra of plants suffering from wheat rust. It is not dear from theirdata if the rounding on the shoulder is associated with the pigment absorption properties and a shift in the spectral position ofthe absorption edge. If'the long wavelengthlimit of photon absorption changes in stressed plants with decreased chlorophyll productivity, it would be expected to shift toward the shorter wavelengths. This kind ofabsorption edge change has been detectedin the spectra from a forest canopy growingover copper-lead-zinc sulfide mineralization(Collins et'al., 1977). The forest canopy data,collected with the same airborne system
used in the Imperial Valley study, show asmall absorption edge shift toward the blueend of the spectrum of stressed trees growing in soil with high heavy metal concentrations. The forest 'study- is' very 'encouragingfor geobotanical and other studies of stressedcanopies, and it substantiates the presentworking hypothesis for the red-shift.
Narrow bands placed at 745 nm and 785nm should theoretically be very effective insatellite applications. These bands are in aspectral region of good atmospheric transmittance, and the close spacing minimizesthe relative atmospheric noise effects. Thepractical limitation is one of obtaining sufficient signal strength in such narrow bands.The width and position of the spectral bandsfor monitoring the absorption edge are critical. The positions of bands 3 and 4 havebeen tested by simulating shifted bands, buttheir present positions yield optimum sensitivity to the red-shift as measured by theband ratios. Increasing the width of band 3also has the effect of decreasing the ratiosensitivity. The outside limits of band 3width are the oxygen absorption band at 760nm and the crossover region at 730 nm. The730 nm limit is especially critical becausethe background band 1 variations are two orders of magnitude greater than the band 3signals.
ACKNOWLEDGMENTS
This study was conducted as a part of theremote sensing research project at GoddardInstitute for Space Studies under the supervision of Dr. Robert Jastrow. Data processing was supported by the Institute and bythe data analysis group under Dr. StephenUngar. I am grateful to Professor A. L. Mancinelli of Columbia University for the discussions on photosynthesis.
REFERENCES
Brody, S. S., and M. Brody, 1963, AggregatedChlorophyll in vivo, in B. Kok and S. T.Jagendorf, ed., Photosynthetic Mechanisms ofGreen Plants: Pub. 1145, Nat!. Acd. Sci. Nat!.Res. Council, Washington, D. C., p. 455-485.
Chiu, Hong-Yee, and W. Collins, 1978, A spectroradiometer developed for airborne remotesensing applications: Photogrammetric Engineering and Remote Sensing (in press).
Collins, W., 1976, Spectroradiometric detectionand mapping of areas enriched in ferric ironminerals using airborne and orbiting instruments, Ph.D. Dissertation, Columbia University.
Collins, W., Gary L. Raines, and Frank C. Canney,1977, Airborne spectroradiometer discrimina-
REMOTE SENSING OF CROP TYPE AND MATURITY 55tion of vegetation anomalies over sulfidemineralization-a remote sensing technique:Geological Society of America, 1977 AnnualMeeting, Abstracts with Programs.
Dratz, E. A., A. J. Schultz, and K. Sauer, 1967,Chlorophyll-chlorophyll interactions: U. S.Brookhaven National Laboratory Symposia inBiology, 19, p. 303-318.
French, C. S., 1960, The Chlorophyll in vivo and.in vitro, in W. Rukland, ed., Encycl. PlantPhysiol: Springer-Verlag, Berlin, 5, p. 252297.
Gates, D. M., H. ]. Keegan, ]. C. Schleter, and V.R. Weidner, 1965, Spectral properties ofplants: Applied Optics, vo!. 4, No.1, p. 1I-20.
Gates, D. M., 1970, Physical and Physiologicalproperties of plants, in Remote Sensing: Nat!'Acd. Sci., Washington, D. C., p. 224-252.
Govindjee and R. Govindjee, 1975, Introductionto photosyntheses, in Govindjee, ed.,Bioenergetics of Photosynthesis: AcademicPress, New York, p. 1-50.
Ke, B. and W. Sperling, 1967, Evidence for thepresence of ordered' aggregates in chlorophylla Monolayers: U. S. Brookhaven NationalLaboratory Symposia in Biology, 19, p. 319327.
Keegan, Harry ]., John C. Schleter, Wiley A. Hall,Jr., and Gladys M. Haas, 1956, Spec-
trophotometric and colorimetric study ofdiseased and rust resisting cereal crops: Nat!'Bur. Stds. Rept. 4591, 128 pp.
Litvin, F. F. and V. A. Sineshchekov, 1975,Molecular Organization of Chlorophyll andenergetics of the initial stages in photosynthesis, in Govindjee, ed., Bioenergetics ofPhotosyntheses: Academic Press, New York,p. 619-661.
Meyers, V. I., M. D. Heilman, R. J. P. Lyon, L. N.Namkin, D. Simonett, J. R. Thomas, C. L.Wiegand, and J. T. Woolley, 1970, Soil, Water,and Plant Relations, in Remote Sensing: Nat!.Acd. Sci., Washington, D. C., p. 253-297.
Rabinowitch, E., and Govindjee, 1969, Photosynthesis: John Wiley and Sons Inc., New York,1969, p. 273.
Sauer, K., 1975, Primary events and the trappingof energy, in Govindjee, ed., Bioenergetics ofPhotosynthesis: Academic Press, New York,p. 115-181.
Tucker, C. J., and E. L. Maxwell, 1976, Sensordesign for monitoring vegetation canopies:Photogrammetric Engineering and RemoteSensing, Vo!. 24, No. 11, p. 1399-1410.
Ungar, S. G., et al., 1977, Atlas of selected cropspectra, Imperial Valley, California: NASAInstitute for Space Studies, Goddard SpaceFlight Center.
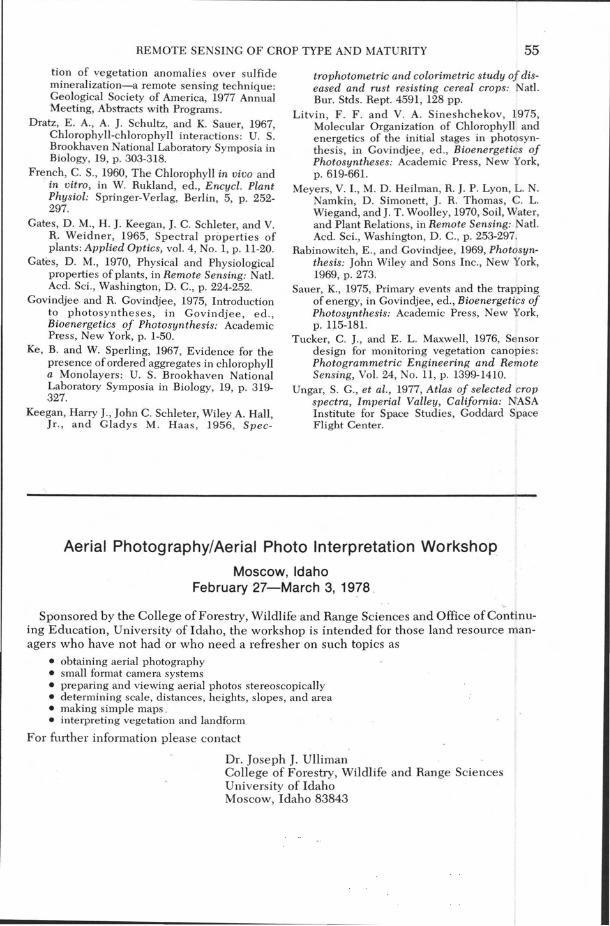
Aerial Photography/Aerial Photo Interpretation Workshop
Moscow, IdahoFebruary 27-March 3, 1978.
Sponsored by the College of Forestry, Wildlife and Range Sciences and Office ofContinuing Education, University of Idaho, the workshop is intended for those land resource managers who have not had or who need a refresher on such topios as
• obtaining aerial photography• small format camera systems• preparing and viewing aerial photos stereoscopically• determining scale, distances, heights, slopes, and area• making simple maps.• interpreting vegetation and landform
For fUlther information please contact
Dr. Joseph J. UllimanCollege of Forestry, Wildlife and Range SciencesUniversity of IdahoMoscow, Idaho 83843