Embed Size (px)
Citation preview
The Influence Of Introducing An Integrated Computer System On The Organisational Structure Of Remploy
Furniture Group
David Perton
A thesis submitted to the University of Bristol in accordance with the requirements of the degree of Master of Science in the Faculty of
Engineering.
Department of Engineering Management
March 1999
Abstract
This thesis starts by looking at the background to the company. This includes the
history of the company and its mission statement. It then goes on to examine the
business case for the change to the Triton system. The corporate IT strategy and the
capital expenditure justification are examined. The areas where Triton is expected to
assist the company are established. This is followed by a SWOT analysis at both
corporate and Furniture Group level, together with a market analysis for the Furniture
Group.
The thesis then goes on to examine the process of preparing for change. There is
scrutiny of data acquisition, processing, validation, and the systems to control change.
The next step is to assess the implementation of Triton. The phased approach is
critically evaluated, along with the lessons learned and changes to the approach.
The thesis then continues with the results of a survey of managers' expectations about
organisational change arising from the implementation of Triton. It then explores the
implications for change.
The next stage is an analysis of the current organisation. This considers the present
organisation’s structure, culture and management style. An analysis of the
organisational effectiveness of the Furniture Group is the presented.
The thesis then reviews the available writing about the relationship between IT and
organisational change. Following on from that best practice is assessed by way of a
survey. The survey is similar to the internal survey of managers' expectations.
Options are formulated by drawing together the common themes from published work,
best practice, and the survey of managers' expectations. Conclusions are then drawn
from the whole thesis and recommendations are made. The recommendations are that
the organisation moves towards a system of empowered multi-disciplinary teams. There
should be cross training within these teams to encourage team members to be multi-
skilled. The teams should be organised to execute business processes. The organisation
should be made smaller with fewer departments and flatter, with less management
levels where possible. An incremental strategy for implementation is described.

Acknowledgements
Acknowledgements are due to a number of people who have helped in various ways
with this study.
The author wishes to express his thanks to his tutor, Dr. John Bishton of the University
of Bristol, who has motivated, advised and expanded horizons throughout the course of
the study.
Remploy Furniture Group have provided the course fees and expenses that have made
this study possible. Appreciation is due to Mr. Shaun Parker for his help and support to
gain the commitment of the company to provide these funds. Mr. Richard Omerod, Mr.
Ed Ziebart, and Mr. Paul Randall all provided vital background information. Mr Paul
Randall also provided advice on the interpretation of financial information. Recognition
must be made to Mr. Phillip Husband for his willingness to help where possible as the
author’s manager during the second half of the study. The author is indebted to Mr.
Derek Brown for providing information for the process maps in appendix G and for
information about the background to Triton and the Triton procedures. Thanks are also
due to the fifteen managers who completed the internal survey of expectations.
Gratitude is expressed to those companies who completed the best practice survey and
the individuals who gave their time, effort and experience. The extra information they
provided was especially welcome.

Author’s Declaration
No study of this magnitude can be completely original. The information contained in
chapters one and two was difficult to obtain and derives mostly from published work.
The conclusions drawn are the author’s. The five forces models of the market structures
were constructed by the author from answers to a series of questions posed to the
Marketing Manager.
Chapter three is a mainly a history of events, the critical comments in this chapter are
the work of the author.
The surveys in chapters four and eight were constructed by the author. They drew upon
learning from part one of the JBEM diploma course. The interpretation of the results is
the author’s own work and draws from nearly 3 years experience within Remploy.
The analysis of the organisation in chapter 5 is the authors work. The frameworks for
this analysis were chosen by the author from the work of others as being appropriate to
the study being undertaken.
Published work is source of the information contained in chapter 7. The works were
selected by the author to illustrate the development of knowledge and to highlight how
computers have enabled many of the modern management philosophies.
The statement of the challenge to realise the potential benefits of introducing an
integrated computer system in chapter 6 was assisted by the research undertaken during
this study.
The evaluation of options, recommendations, and implementation strategy is the
author’s own work. It necessarily draws upon the research of published work, and the
results of the internal and external surveys. It also draws upon learning and experience
gained by the author during his lifetime.
The views expressed in this document are solely those of the author. They do not
represent the views of the University of Bristol or those of Remploy Ltd.
Contents
Abstract i
Acknowledgements ii
Authors Declaration iii
Contents 1
1 Background of the Company 4
1.1 Remploy’s History and Structure 4
1.2 Remploy Today 10
2 The Business Case for Change 14
2.1 Corporate Information Technology Strategy 14
2.2 Capital Expenditure Justification 19
2.3 Corporate Financial Analysis 22
2.4 Corporate SWOT Analysis 32
2.5 Furniture Group Financial and Market Analysis 34
2.6 Furniture Group Customer Service Level Analysis 40
2.7 Furniture Group SWOT Analysis 42
2.8 Summary 45
3 Preparing for Change and Implementation of the MIS 46
3.1 Introduction and Background 46
3.2 Designing the Documentation 52
3.3 Data Acquisition 53
3.4 Data Processing and Transformation 56
3.5 Team Leaders 61
3.6 Systems to Control Change 63
3.7 Validation 64
3.8 Sheffield and Barnsley Validation 65
3.9 Plymouth Validation 66
3.10 Treforest Validation 68
3.11 Validation at Other Factories 69
3.12 Data Preparation Conclusion 70
3.13 Implementation Strategy of the Management Information System 72
3.14 Sheffield Factory Implementation 73
3.15 Barnsley, Plymouth and Treforest Factory Implementations 75
1

3.16 Neath Factory Implementation 76
3.17 Strategy Changes and the Remaining Factory Implementations 77
3.18 Data Processing During Implementation 79
3.19 Data Security and Ownership 79
3.20 Business Process Ownership 81
3.21 Conclusions 81
3.22 Summary 84
4 Survey of Organisational Expectations 85
4.1 Survey Format and Approach 85
4.2 Collation and Presentation of Results 87
4.3 Analysis of Results 94
4.4 Implications for Change 98
4.5 Summary 98
5 Analysis of the Current Organisation and its Effectiveness 99
5.1 A Definition of Structure, Culture and Management Style 99
5.2 Head Office and the Management of the Groups, 103
Structure, Culture and Style
5.3 Furniture Group Departmental and Factory Organisation, 106
Structure, Culture and Style
5.4 Organisational Design 108
5.5 Organisational Effectiveness, a TQM Approach 112
5.6 Organisational Effectiveness, a People Approach 117
5.7 Summary 122
6 Definition of the Challenge 123
6.1 The Expected Benefits
123
6.2 Functions and Processes 124
6.3 Statement of the Challenge 126
7 Search for Solutions 1 (Published Work) 128
7.1 Causal Analysis 128
7.2 Introduction 129
7.3 Organisational Policy 131
7.4 The Role of the Manager 136
7.5 Organisational Structure 137
7.6 Job Satisfaction 143
2

7.7 Empowerment 144
7.8 Leadership Style, Power and Influence 145
7.9 Process Innovation 147
7.10 Summary 153
8 Search for Solutions 2 (Best Practice Survey) 155
8.1 Approach: Benchmarking 155
8.2 The Survey Format and Approach 157
8.3 Collation and Presentation of Results 158
8.4 Analysis of Results 164
8.5 Determination of Best Practice 168
8.6 Summary 169
9 Formulation and Evaluation of the Options 170
9.1 Common Themes From Research, Best Practice 170
and Managers Expectations
9.2 Key Differences Between Best Practice and Managers 171
Expectations Survey
9.3 Critical Success Factors Emerging 172
9.4 Options 172
9.5 Evaluation of the Options 173
10 Conclusions, Recommendations and Implementation
175
10.1 Conclusions 175
10.2 Recommendations 177
10.3 Success Significance 187
10.4 Failure Consequences 187
10.5 Strategy for Implementation 188
Bibliography 192
Appendix A: Part Numbering Systems 196
Appendix B: Engineering Change Control Systems 202
Appendix C: Formally Structured Descriptions 206
Appendix D: Internal Survey of Managers Expectations 210
Appendix E: External Best Practice Survey 216
Appendix F: Organisation Charts 221
Appendix G: Business Process Maps 224
3

Chapter 1. Company Background
The objective of this thesis is to examine the implementation of an integrated computer
system by Remploy Furniture Group, and assess the opportunities the system gives to
alter the organisational design of the group, so that it is more effective. The aim is to
make recommendations, which if implemented, will enhance the group’s ability to
satisfy customers in terms of price, quality and service. This should enable market
growth. The aim is also to improve efficiency. Increased market share coupled with
greater efficiency should lead to a greater number of disabled people being offered
employment by the group at a reduced cost to the tax payer.
This chapter provides an introduction to the company, with a description of its history
and of its current circumstances.
1.1 Remploy’s History and Structure
The Disabled Persons (Employment) Act brought about the creation of Remploy. It
was set up by the government to employ disabled ex-servicemen returning from world
war two. The first factory was opened in Bridgend in 1946 where an Estonian prisoner
of war taught the work force to make violins. By 1952 there were 90 factories.
Some highlights of the development of Remploy are shown below:
1954 to 1975 The company gained the sole manufacturing and selling rights for the
Swedish range of Furniture, Lundia.
The Queen bought Remploy knitwear made at the Kidbrooke factory,
London.
The company made 4 600 chairs for the Investiture of the Prince of
Wales at Caernarfon Castle on 1 July 1969.
Croydon orthopaedic footwear factory started making race shoes for
horses, including shoes for those with hoof defects.
4

The Wigan factory began producing paper knickers and bikinis,
reflecting the demands of a frivolous decade.
The types of disability changed as ex-service people reached retirement
age
1975 to 1995 The Royal Warrant was awarded to Remploy for Knitwear in 1977
Successful open days were held at all the factories to commemorate the
Year of the Disabled in 1988.
A horticultural unit was opened at Wisbech employing 15 disabled
people. Vegetables and flowers grown there are sold at commercial rates
at the National Vegetable Market.
Old factories were replaced with more modern premises where possible.
The Spennymoor factory made 2 million door knocker red noses for
Comic Relief in 1993
Over 95 factories gained the Quality Standard BS EN 9002 award.
Changes in public sector buying and overseas competition meant
Remploy had to develop alternative markets in the private sector.
(Remploy, 1995).
The Mission Statement of the company is:
Remploy exists to provide quality products and services to our customers and so create
good employment opportunities for people with a wide range of disabilities. (Remploy,
1998).
Today Remploy employs people disabled by many different causes including congenital
disabilities, illnesses and accidents. The range of disabilities is varied and includes
5

people with missing limbs, the blind, the deaf, people with learning difficulties and
people with epilepsy. The disabilities breakdown as follows:
Mental and Nervous 40%
Physical 36%
Age Related 14%
Other 10%
Over 10 000 people are now employed in over 90 factories, spread nationwide, in a
range of industries and services, from contract manufacturing to lingerie. Customers
include Marks & Spencer, BHS, Rover, Lever Brothers, Courage, Esso, Ford and
Kodak. (Remploy, 1995).
The company focuses on providing meaningful work for disabled people by providing
products and services with an uncompromising level of commitment to customers
needs. A high priority is also given to quality, training and good environmental
management. (Remploy, 1998).
In 1995 there were 7 434 disabled workers in Remploy factories and offices. A further
1 472 disabled workers were supported in outside industry by the Interwork scheme
which releases Remploy employees to companies in the open market. The company
turnover was £134.3 million giving a turnover per disabled worker of £15 080.
(Remploy, 1995).
Remploy is organised into six distinct trading groups. These are listed below with their
1995 turnover and a brief description of their products and services:
Packaging £36.3m 14 Factories
The Packaging Group handles all types of packaging, from corrugated board to plastics
as well as filling and contract manufacturing services. Many top household and personal
hygiene brands are blended or packed by Integrasol, which fills 150 million containers
a year. The Starman operation also produces its own brand of toiletries. Fragile
products from televisions to eggs are safely packed in cartons, boxes or PVC packs
from Amalgamated Packaging. Contract Services markets its own branded products:
6
Tor Filters and Sterile Supplies. Larch & Mansfield’s Amalgamated and Larch Plastics
produce high quality, high impact, highly protective point-of-sale packaging.
Manufacturing Services £30.6m 16 Factories
The Manufacturing Services Group assembles products for many top British and
international companies in the electronic, electrical, automotive and mechanical sectors,
including Black & Decker, Panasonic, Rover and Sony. Every steering column for
every Mini produced has been assembled by Remploy. Other products include printed
circuit boards for computers, vehicle speed sensors, the Fire Brigade’s heat-seeking
cameras, gaming equipment, light controllers, drink measuring devices and translator
units for conference centres. They also assemble the ribbon cables used to interconnect
printed circuit boards in telecommunication, computer, military, aerospace and medical
equipment. Further products include mechanical sub-assemblies and wiring harnesses
for the automotive industry, built, tested, and delivered on a “just in time” basis.
Textiles £25.7m 23 Factories
The Textile Group comprises three businesses. Textile Sewing makes specialised
performance wear for military, commercial, industrial and leisure markets. The
knitwear business produces robust garments for organisations like the Fire Service, but
also now supplies Marks & Spencer. The Silhouette lingerie ranges are sold on the High
Street and through mail order catalogues. The marine products business is the largest
manufacturer of life jackets in the UK.
Furniture £17.4m 13 Factories
The Furniture Group manufactures a wide range of wooden, upholstered and metal
furniture. Both branded and contract products are supplied across many market sectors:
from archives to shops, hotels to schools. The Profile brand is directed at the education
market and includes ranges of furniture for reception and dining areas, classrooms,
conference rooms and laboratories. The Exel range offers desking, seating and storage
systems for the office. Diploma is a range of bed bases, divans, mattresses and bedroom
furniture for both commercial and domestic use. Lundia is a storage solutions business,
covering library and display shelving, mobile archiving and general storage.
7
Healthcare £17.0m 7 Factories
The Healthcare Group specialises in two principal markets: mobility products and
orthotic products. The mobility business is the UK market leader in the NHS manual
wheelchair sector. A range of chairs is also offered to the commercial and private
sectors. Remploy is the UK’s leading orthotic company and runs more than 100 clinics
for NHS hospitals in areas such as back care and post mastectomy care. Products also
include ready-to-wear footwear, moulded plastic and carbon fibre orthoses, and soft
products. The group exports its products to more than 20 countries.
Creative products £ 7.8m 11 Factories
The Creative Products Group’s primary product is the rebinding of library books and
journals for universities, local authorities, technical institutions and schools. The Group
also specialises in producing Library Editions. A range of spoken word audio CDs and
cassettes are supplied and serviced under the Green Dragon brand. Portway large print
books are also produced and Transcript foreign language books are supplied. There is a
wide range of stationery including diaries, address books, notebooks and photograph
albums, many of which are developed from In-House designs and destined for national
and international multiple stores. (Remploy, 1995).
Interwork
This group is newly established. For some years Remploy has been encouraging its
employees to take places in host companies. The host company pays Remploy based on
the output of the disabled worker. Remploy employs the interworker, pays the
interworker’s wages and employment costs. Until 1997 each group supported those
interworkers originating from it. As disabled people started to be recruited directly into
interwork places, the separate group was set up to support all interworkers.
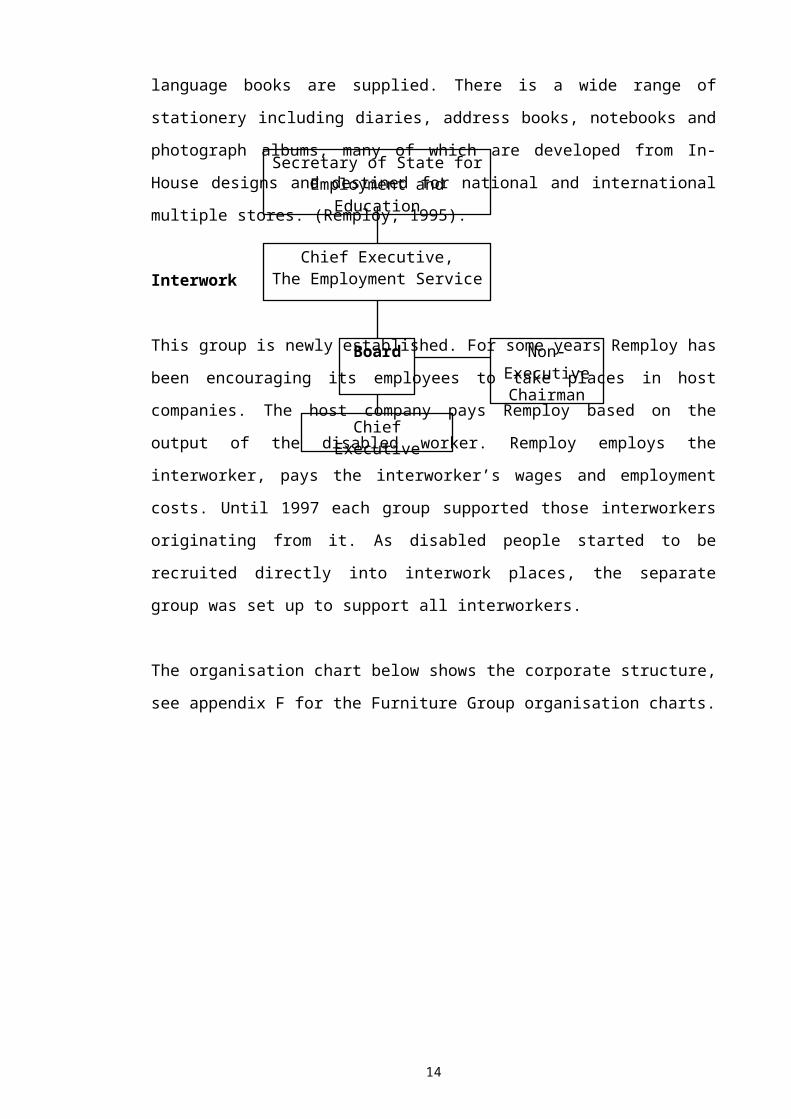
The organisation chart below shows the corporate structure, see appendix F for the
Furniture Group organisation charts.
8
Non-Executive Chairman
Chief Executive,The Employment Service
Secretary of State for Employment and Education
Board
1.2 Remploy Today
Remploy’s markets have been traditionally public sector customers. According to the
chairman this is changing dramatically. Five years ago this market accounted for 45%
9
Chief Executive
Marketing Director
Personnel Director
FinanceDirector
Operations Director
Corporate IT Team
Corporate Finance Team
Personnel Manager
Purchasing
Manager
Industrial Engineering Manager
Group General Managers
The Groups

of total sales it had decreased to only 20% by the end of 1998, (Remploy News,
Christmas 1998).
By 1998 30% of Remploy employees were part of the interwork scheme, leaving 70%
working in Remploy factories. The trend to increase the number of interworkers at the
expense of the factory workers is continuing. This brings into question “why does
Remploy exist”. The mission statement appears above. There has been a change in the
company’s role with the advent and development of the interwork scheme. There is
financial and demographic pressure on the government. The Department for Education
and Employment has a different mission from Remploy, which exists even if it is not
explicitly stated, and is to provide quality employment for as many disabled people as
possible, wherever they live within the UK, at the least cost to the tax payer.
This mission is achieved by a strategy on several fronts:
· Encourage commercial firms to employ disabled people, contributing unsupported to the firm, suggest quotas, etc.
· Discourage discrimination by employers against disabled people, e.g. the recent Disability Discrimination Act.
· Encourage supported employment places in commercial firms, where a small subsidy is paid, ostensibly due to a lower productivity level.
· Support sheltered employment by grants.
The two items at the top of the list are the most cost effective, the last is the least cost
effective. The first three are able to use employment opportunities wherever disabled
people live. Sheltered employment in workshops or factories cannot be easily spread to
areas where there are low concentrations of disabled people. Small factories would not
be cost effective and the blend of skills required would not necessarily be available.
Remploy fulfils the last two strategies. The interwork scheme is a specialised
employment agency. This is not directly compatible with the Remploy mission
statement. The recent hiving off of this function from the individual groups into a
separate group does allow the manufacturing groups to be more focused. The number of
progressions to interwork from Remploy factories is small. The main growth is by
recruitment. The number of factory based employees are shrinking by natural wastage.
The company is achieving government targets of increasing the number of disabled
employees whilst not increasing the need for grant funds by recruiting to interwork
10
more people than are lost from the factories. The grant support for an interworker is
roughly half of that for a factory based employee. This means two interworkers can be
recruited for every factory based employee that leaves to open employment, retires, or
leaves due to a medical termination. For every factory based employee who progresses
to interwork, one extra person can be recruited to interwork. This movement and
recruitment of people hides the true picture of productivity within the factories, which
as the National Audit Office reports is in decline, (National Audit Office, 1997). This is
a good reason for the company not to want to give up the interwork role despite it not
being the historical core activity. There are specialised skills in the interwork group that
it would be unwise for the government to lose if any change were made. The interwork
group now accounts for 30% of the disabled people on Remploy’s books. This is a very
significant proportion.
Because Remploy’s traditional role is the least effective, in both cost and demographic
terms, of the government's strategy there is some doubt about its future role. The
demographic structure of the manufacturing side of the business incurs increased costs
compared with its competitors in the markets within which it operates. This is reflected
in a corporate strategy to reduce the number of factories it operates. This can be
achieved where factories are located close together, such as the recent amalgamation of
three factories in Sheffield and one in Rotherham in to one purpose built new factory,
supporting two groups. There are possibly three or four more opportunities of this
nature. Other structural changes can be made by transferring factories between groups.
For example, opportunities are created because the packaging group is expanding. Due
to the nature of the product, e.g. cardboard boxes, the industry has a structure of small
operating units located close to customers. This reduces transport costs and there is no
need for economies of scale in manufacturing with this product. This is an ideal
business for Remploy. Significant cost savings have been made as a result of transfer
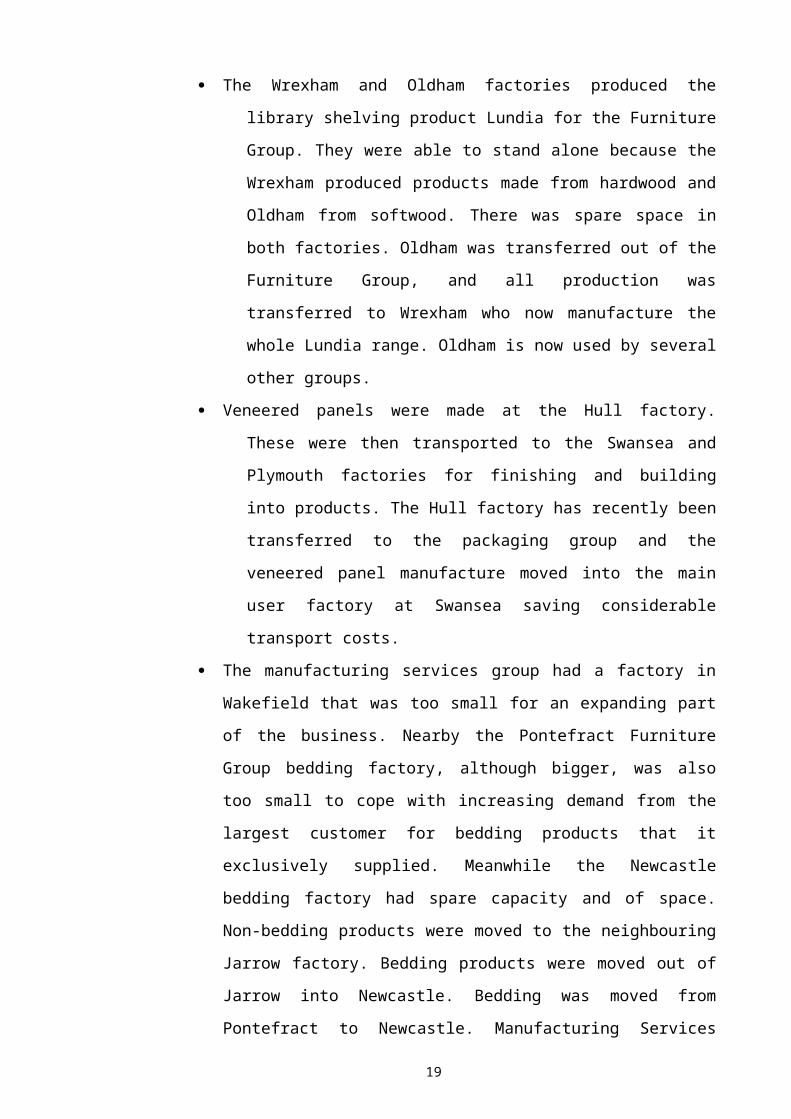
strategies already. Three examples relating to the furniture group are listed below:
· The Wrexham and Oldham factories produced the library shelving product
Lundia for the Furniture Group. They were able to stand alone because
the Wrexham produced products made from hardwood and Oldham from
softwood. There was spare space in both factories. Oldham was
transferred out of the Furniture Group, and all production was
11

transferred to Wrexham who now manufacture the whole Lundia range.
Oldham is now used by several other groups.
· Veneered panels were made at the Hull factory. These were then transported
to the Swansea and Plymouth factories for finishing and building into
products. The Hull factory has recently been transferred to the packaging
group and the veneered panel manufacture moved into the main user
factory at Swansea saving considerable transport costs.
· The manufacturing services group had a factory in Wakefield that was too
small for an expanding part of the business. Nearby the Pontefract Furniture
Group bedding factory, although bigger, was also too small to cope with
increasing demand from the largest customer for bedding products that it
exclusively supplied. Meanwhile the Newcastle bedding factory had spare
capacity and of space. Non-bedding products were moved to the
neighbouring Jarrow factory. Bedding products were moved out of Jarrow
into Newcastle. Bedding was moved from Pontefract to Newcastle.
Manufacturing Services took over the Pontefract factory and the Wakefield
factory was closed.
There will undoubtedly be more of these structural changes. It would be possible to go
a step further and privatise some factories. It may be possible for the Wrexham factory
to compete in the open market if group overheads were removed, the absence rate of
14% was addressed and the non-productive work at 34% was also addressed. The
drawback is that to achieve this some of the more severely disabled people may have to
be made redundant. Another possible scenario would be the transfer of the Newcastle
factory to the largest customer. This could be sweetened by making all of the
employees interworkers. The Manufacturing Services Group and the recently formed
Contract Services Group would have similar opportunities for specialising factories and
transferring them to interwork operations.
Whatever the outcome of structural changes it is unlikely all manufacturing activities
will cease. The chairman has said that the company is determined to give disabled
people more choice in how and where they work, but the chief executive has also said
that the factory base will remain the largest and core part of the company, (Remploy
News, Christmas 1998). The Triton computer system that has been implemented is
12
designed for the integrated planning, control and reporting of manufacturing activities
and hence it is only relevant to this part of the business.
Remploy suffers a quandary when trying to compete in open markets. It is difficult to
increase productivity if sales are static because labour cost reduction relies upon people
moving into interwork. Remploy does not make disabled people redundant.
13

Chapter 2. The Business Case For Change
This chapter examines the business case for implementing an integrated computerised
information system. It establishes some of the challenges the company faces and
explores the operating environment. The information presented was not found to be
generally available, and hence a knowledge of the company and its operating
environment is not well known to all the employees. The chapter starts by examining
the official reasons for implementing a new computer system using the corporate
Information Technology (IT) strategy and the capital expenditure justification presented
to the board. The chapter then goes on to examine the financial and market background
in more detail for the whole company and for the Furniture Group in particular.
2.1 Corporate Information Technology Strategy
As the operating environment for the organisation changed and pace of development in
both hardware and software continued, it was recognised in early1994 that a corporate
IT strategy needed to be developed. This would recognise changes in those IT solutions
which were currently available and address the weaknesses in using the current outdated
systems. It would also indicate where competitive advantage may be gained.
An information technology strategy was written in May 1994 by the company’s IT
Manager. This is summarised here. It set the scene by looking at the company structure
and its business aims and objectives to determine the business environment. It went on
to specify the current IT environment in terms of applications (software), hardware and
networks. Comments were made upon each of these areas and the costs assessed. From
this background a strategy for the future was set out. It was again divided into the areas
of applications, hardware and networks. Finally a timetable was provided together with
an estimate of costs. Key elements of the strategy are drawn out below.
The company structure has been explained in chapter 1. Two statements are made to
define the organisation's business aims and objectives and are quoted in full overleaf.
¨ Remploy exists to provide both sheltered employment for disabled persons within
its own factories and also to place disabled persons with client companies via
14
the Interwork programme. Over the next few years the aim is to significantly
increase the number of Interworkers by both recruitment and transferring
factory based employees.
¨ Although a large part of the company’s income is provided in the form of a subsidy
from the Government, Remploy is a commercial operation, competing in open
markets, and working with the Annual Performance Agreement (APA) negotiated
with the Government. This APA defines levels of employment and the financial
Operating Deficit for the company.
This builds on the mission statement quoted in chapter 1 to define part of the corporate
strategy.
The applications in use at the time the strategy was written were based on the MAS-M
system purchased originally from Hoskyns in 1981. The software had been altered and
added to over the years to try to keep pace with the changing demands of the groups. It
has become increasingly difficult and expensive to maintain. This system ran on VAX
computers using the VMS operating system provided by Digital (DEC). Data security
was a problem, hardware failure required users to re-input information. Only one of the
computers was a “current machine” and the disk configurations had an “inherent
obsolescence”.
There had been an exponential increase in the use of personal computers and a similar
growth in IT literacy of company personnel. This had led to increased demands for
more information and more sophisticated systems to manage it.
There was limited operational support for the groups from the MAS-M system and
virtually no management information. This had the effect of making it difficult to
streamline the business processes and improve customer service. Many people including
significant numbers of managers were wasting time re-inputting and re-analysing data
in order to increase its usefulness.
The estimated annual cost (drawn from the 1994/95 budget) was £3.283M. This
included staff costs, hardware depreciation and maintenance, software support,
telecommunications, and personal computers.
15

The existing systems had by then become an inhibitor of change rather than an enabler.
Because of the use of PC systems along side MAS-M the use of computers had become
fragmented. The conclusion was “MAS-M and its associated applications had reached
the end of their useful life and needed replacing”. A new integrated system was
required together with hardware which would support the “open systems” philosophy.
This would be centrally based: “Because of the dispersed geographic nature of Remploy
and also the fluidity of the organisation, a centrally supported application provides the
most cost effective solution both in respect of on-going support and flexibility.”
It was recognised a single package would not meet all the needs. The strategy was
therefore to find a package that could be tailored, that would run on a relational
database, under a UNIX environment, that would enable PC applications to integrate
with it. For this reason the strategy also included the need for all PC’s to move to a
Windows environment using Windows based applications. Although a single package
would not meet all needs the package needed to meet as many as possible. The
following list of areas of functionality sought was proposed:
· Customer Management· Product Configuration· Estimating and Quotations· Sales Order Processing· Supplier Management· Purchasing· Despatch Management· Inventory Management· Materials Planning· Production Planning· Capacity Planning· Work in Progress Control· Factory and Product Costing· Sales Ledger· Purchase Ledger· Nominal Ledger· Fixed Asset Ledger· Project/Contract Management
There are particular criteria due to the structure of Remploy: “The requirements
associated with the multi-site nature of Remploy and the Group structure are a major
factor in the selection process. Furthermore, the diversity of products and
16
manufacturing processes will require considerable flexibility in any package
considered."
To support these changes the existing wide area network (WAN) would need
upgrading, especially the replacement of analogue circuits with digital ones. New
hardware and disk drives would clearly also be needed.
The implementation plan was to pilot a new system in one of the groups, followed by a
phased roll out into the other groups together with a gradual phasing out of the old
systems.
The timetable was set out thus:
June 1994Agree strategySet up project teams
July to November 1994Select software and hardware suppliersProduce planProduce budgetary costing for implementationBoard approval
December 1994 to February 1995Commence hardware installationStart pilot of software in one group
March to August 1995Complete software pilotCommence network implementation
September 1995 to February 1996Complete network implementation
February 1995 to March 1997Complete hardware implementationComplete software implementation
The estimated cost at this time was £881 000 of capital expenditure and £911 000 of
revenue expenditure, a total of £1.792M over a period of 5 years with the heaviest costs
in the first 3 years. In fact the cost of maintaining the present system in years 4 and 5
would be more than the new system. The payback however was expected to come from
the groups. The emphasis was not so much about an investment with payback as a
necessity without which the company could not continue to operate.
It was clear the project would involve major change requiring a significant commitment
of management time.
17

The final statement of the executive summary read thus: “Little benefit will be gained
by computerising many of the existing business processes. These will need to be
reviewed and possibly revised in light of the software capabilities but, primarily, as a
result of the business requirements.”
There was a project update document produced on 27 September 1994, which added the
following information. By this time two software suppliers had been short listed. The
steering committee and project teams had been set up and a list of Critical Success
Criteria developed for the groups. The Critical Success Criteria for the Furniture Group
is reproduced as follows:
“The following will need to be achieved if the business of the Furniture Group is to
develop in the medium term. These are the factors critical to the success of the business
strategy and also certain key measurable targets to be achieved."
1. Customer request met by response, any formal quotation within a minimum specified period (to be defined).
2. Lead times for customer order cycles to average 10 days.
3. Lead times for customer order cycles not to exceed 20 days
4. Delivered service levels over X% from current level of Y% (further definition necessary).
5. Stock weeks to fall from 18 weeks to 3 weeks.
6. Debtor weeks to be less than 6 weeks, from 10 weeks.
7. Administration staff head count to fall by 10% over a 3 year period (target for staff categories to be defined).
8. Output per disabled to increase by 3% per annum in real terms (higher target if practicable).
9. Real reduction in purchase prices against current standard pricing by 1% per annum.
10. Credit note frequency against invoices raised to fall by X% per annum (say 25% reduction in each of 3 years).
11. Provision of all management information with due set dates always.
18

12. Any other key requirements.
2.2 Capital Expenditure Justification
By February 1995 enough work had been completed to present a paper to the board for
approval. This was done at the 519th board meeting in that month. A summary of the
information in that paper follows. The application software had now been chosen as
‘TRITON’ supplied by Baan Europe, who were also to be appointed prime contractors.
To run the software it was proposed to purchase hardware manufactured by Hewlett-
Packard, and a Wide Area Network provided by IBM would be used for
communications.
A summary of the current IT difficulties was drawn from the IT strategy and included
in the paper to the board. There was also a list of benefits that was divided into
quantifiable and business benefits. These are quoted below:
Quantifiable benefits:
· Inventory turnover increase.· Inventory reduction.· Manufacturing lead time reduced.· Meeting promised delivery date improvements.· Purchase prices reduced.· Number of orders requiring splits because of unavailable inventory
reduced.· Number of expediters reduced.· Scrap material reduced.· Labour efficiency increased.· Machine efficiency increased.· Parts' obsolescence reduced.
Business benefits:
· Increasing customer satisfaction.· Improving/reducing working capital utilisation.· Reducing production lead times.· Improving unit cost reduction.· Providing corporate data for Supply/Demand integration.· Providing “React to Change” potential.· Increasing personnel efficiency.· Stock/sales ratio more in focus (Inventory Turns Improvement).
The payback was based upon improvements in three areas, purchases, stocks and
debtors. These were quantified as follows:
19

Purchases:
· A real cost reduction of 1% year on year.
· A 2% year on year Purchase Cost avoidance against the company’s consolidated ‘basket’ of purchased commodities.
Stocks:
· Between 1994/95 and 1999/2000
Components and
Raw Material WIPFinishedGoods
· Percentage reduction 32% 36% 23%
· 1994/95 Forecast Stock Value £8,950k £2,950k £7,150k
Debtors:
· Percentage reduction: 14%
· 1994/95 Forecast Debtors £27,500k
A number of secondary, non cash, quantifiable benefits were also stated:
· Complete on time to promise shipment performance, targeted at >95% of all orders.
· General customer enquiries to be replied to in <2 working days.· Responses to tenders to be despatched no less than 3 working days before
the required return date.· Output per employee (all) to improve by 4%.
It is noted no evidence of similar benefits achieved by others is cited in the paper to the
board. It is not made clear how the new system will achieve these benefits.
There is a statement headed “Business Strategy and Corporate Plan” that shows some of
the difficulties in the trading position at that time that is reproduced here:
“The Remploy Executive are now re-assessing plans for 1995/96 due to both recent
trading difficulties and pending problems within the Textile Group.
The Company will only be involved in new capital expenditure where there is either a
very short payback or the business need is significant.
It is considered that the IBS project falls in both these categories.”
20

The cash flow projections and payback calculations are based only on the
improvements in the working capital position of the Company. The purchasing savings
being recognised as being not practicable to fully quantify, and that it is not possible to
identify the full effect of improvements in customer service.
The gross expenditure during the first year is quoted as £1.1 million capital and £0.9
million revenue. Reductions in working capital of £0.6 million are assumed in year 1
with major savings taking place later. The anticipated payback is 2.6 years and the
proposal was cited as being “critical to the development of the business”. The payback
was calculated using a discounted cash flow of 6%. A sensitivity analysis showed that
at 75% savings the payback would be 3 years and at 50% savings it would be 3.9 years.
The following tables show the predicted financial effect over 5 years. All figures are in
£000.
Expenditure 1995/96 1996/97 1997/98 1998/99 1999/00 TotalRevenue 945 745 55 -57 -68 1620Capital 1107 1050 0 0 0 2157Total 2052 1795 55 -57 -68 3777
Income 1995/96 1996/97 1997/98 1998/99 1999/00 TotalWorking capital change
-600 -1435 -3453 -3030 -1000 -9518
Balance 1995/96 1996/97 1997/98 1998/99 1999/00 TotalNet Cash Flow -1452 -360 3398 3087 1068 5741Rate of return 1.00 0.94 0.89 0.84 0.79DCF -1452 -339 3024 2593 846 4672Cumulative DCF
-1452 -1791 1233 3826 4672
21
The projected working capital levels (£000) for the Furniture group are shown below:
1994/95 1995/96 1996/97 1997/98 1998/99 1999/00Raw Materials 1300 1200 900 800 700 650Work In Progress
500 500 500 350 350 350
Finished Stock 800 800 700 600 550 510Debtors 3500 3500 3300 2900 2700 2640Total 6100 6000 5400 4650 4300 4150Working capital change
-100 -600 -750 -350 -150
2.3 Corporate Financial Analysis
Any change must be seen against the background in which an organisation operates.
Change becomes necessary either as a result of changes in the business environment to
remain competitive or as a means to achieve competitive advantage. The causes of
change can thus be seen in an analysis of internal strengths and weaknesses and of
external opportunities and threats, called a SWOT analysis. This may be made formally
or be part of corporate knowledge called upon when constructing a business case for
something that is felt to be right for the company. This section presents the background
information to be able to create a corporate SWOT analysis, which is presented in
section 2.4.
Two brief SWOT analyses, one for the corporate level and one for the Furniture group,
(see section 2.7) will be used to show the need for change. Inevitably there is a
correlation between them on some points. They have been completed as if before the
decision to buy the MIS, however some of the information used to assess the business
environment is more recent. For the analysis at the corporate level, the older material
relates to the IT strategy and paper to the board discussed above which give information
about the operating environment at the time. The more recent data come from two team
briefs (February and May 1998) and a corporate briefing paper issued in March 1998
from which some of the company background described in chapter one is drawn. All of
these papers are prepared under the authority of the Chief Executive. The other
significant document is a National Audit Office report and much information is
reproduced here. The SWOT analyses are drawn out from all these sources.
22

In the briefing of 9 February 1998 the end of the financial year was approaching. It
was stated that the forecasts of the time were showing that it was proving difficult to
stay within the grant received for the financial year ending 31 March 1998. The
emphasis during February and March was to be on increasing sales and output whilst
keeping a tight control on costs. The plans and budgets for the next financial year were
in the process of being approved. They were based on the Government grant remaining
at £94.2 million for the fourth successive year. This means that all cost increases have
to be absorbed by way of increased productivity and sales. The targets set for the
company for the next year will be to reduce the average subsidy per person to be able to
maximise the number of disabled people that can be employed.
By the time of the briefing of 15 May 1998 the financial results had been prepared. All
of the Government targets for the company as a whole for the previous financial year
had been met. However individual group performance varied considerably. A further
worrying feature was a return to worsening absenteeism after two years of
improvement, the rate being 12%.
A summary of the target, performance and next year's target follows:
1997/98 Next Year’s
Target Actual TargetAverage number of disabled employees 9 800 10 021 10 050Average number of interworkers 3 000 3 123 3 350Progressions 200 226 250Operating deficit per disabled employee £10 000 £9 726 £9 700Operating deficit per interworker £4 400 £4 226 £4 300Total Operating Deficit £99.0m £99.0m £99.0m
Progressions are the number of disabled people who have moved on to open
employment, i.e. have left a Remploy site based job or Interwork supported job to work
for a company where no subsidy exists; or have moved from a Remploy factory to an
Interwork placement.
23
The following table shows how the Government grant to Remploy has changed since
1987, all figures are at 1995/96 prices in £m:
Year 87/88 88/89 89/90 90/91 91/92 92/93 93/94 94/95 95/96Grant 84.9 86.1 85.9 85.7 84.2 90.2 93.1 94.4 94.2
For the periods 1996/97 and 1997/98 the grant has remained at £94.2m cash value, a
drop in real terms each year, (National Audit Office, 1997).
The number of people employed mirrors the grant to some extent but there is a clear
trend towards placement in host companies under the interwork scheme at the cost of
places in factories.
Year 87/88 88/89 89/90 90/91 91/92 92/93 93/94 94/95 95/96Factories 8993 8740 8648 8423 8359 7933 7671 7434 7144Interwork 0 50 90 207 232 643 983 1472 2190Total 8993 8790 8738 8630 8591 8576 8684 8906 9334(National Audit Office, 1997).
The figures represent the average numbers throughout the year. The cost of a place in a
Remploy factory has increased in real terms over this period by 25%. Between 1993/94
and 1994/95 the cost of an interwork place rose by 7% in real terms. The reduction in
the number of factory based employees has not been followed by a commensurate
reduction in the number of factories. This has had the effect of reducing the average
number of severely disabled people in a factory from 96 in 1987/88 to 76 in 1995/96
with the result of some surplus production capacity. The number of factories in both
years stood at 94. (National Audit Office, 1997).
Remploy believes that they may have up to 40% surplus capacity in their factories,
particularly those in their textile and furniture groups which have been experiencing
difficult trading conditions, according to the National Audit Office. It goes on to say the
surplus capacity at Remploy exists in terms of structure and equipment available to
meet additional customer needs but more staff would also be required to meet any
additional demands. As part of their current business strategy, Remploy is continuing to
merge factories which are surplus to core requirements into neighbouring ones.
(National Audit Office, 1997).
24

To assess the strategy of Remploy in terms of the location of its factories and
geographical dispersion it is necessary to return to the mission statement. It is clear the
company’s raison d’être is to provide work for disabled people. This requires factories
to be based within reasonable distances from those peoples' abodes. It is therefore
necessary for the company to know where disabled people live. Under the 1944 and
1958 Disabled Persons (Employment) Acts, the Secretary of State for Employment had
a responsibility to maintain a register of people who wished to be registered and met
the eligibility conditions. However the Disability Discrimination Act 1995 has
abolished this requirement. The Employment Service has decided that the eligibility
conditions should remain the same for supported employment. These conditions are:
· The person should have a productivity level which is 30-80% of that of a non
disabled person; and be unable to obtain or retain work because of the nature or
severity of their disability.
The last survey carried out by the Department for Education and Employment (DFEE)
in 1990 indicated between 130 000 and 270 000 people with severe disabilities were
employed or self employed, including the 20 000 on the supported employment
program. Half of the latter are employed by Remploy or are on its interwork scheme,
the remainder work in workshops run by local authorities or charities, or are in host
companies supported by these. The survey estimated between 60 000 and 100 000
severely disabled people were actively seeking work. The survey was based on a small
sample and extrapolated to the national population and hence there is some imprecision.
There is no reliable information about the geographical spread of those seeking work.
(National Audit Office, 1997).
A model was constructed by the DFEE in 1992 to show the distribution of supported
employment places (Remploy, Local Authorities and Charities combined). This showed
most regions were under provided but there was a concentration of provision in some
areas, namely Fife and the Central Lowlands of Scotland, North East England,
Yorkshire and Humberside, South Wales and South West England. These areas are
where there are concentrations of Remploy factories and others' workshops. (National
Audit Office, 1997). This shows the inflexibility of this type of supported employment.
The competition for places in these areas will mean a higher proportion than might
otherwise be found of the lower productivity workers. There is insufficient growth to
25
create any meaningful redistribution of places. It is not possible to move the location of
a factory without incurring a high cost, both financial and more importantly social.
People in long term supported employment would be made redundant.
The relationship with the government, as a significant fund provider has a real bearing
on the environment in which the company operates. This is defined by a “Main
Agreement” and since 1992 performance targets. These are both as defined here.
The main agreement is between the Secretary of State and Remploy it is subject to
review every 3 years. The one that came into operation in April 1992 gives Remploy
more flexibility than it has had over the use and transfer of funds. It can transfer monies
between capital and revenue grants, and use the proceeds from sales and capital
investments to develop commercial activities. The latest agreement came into force in
December 1996 after a major examination of the DFEE’s financial and management
controls by Deloitte and Touche Consulting Group. The result of this examination also
influenced how the Treasury and the Cabinet Office deal with all Non Departmental
Public Bodies. (National Audit Office, 1997).
The agreement sought to bring Remploy’s aims and objectives in line with the DFEE’s
aims and objectives of the supported employment programme, committing Remploy to:
· provide a range of disabled employment opportunities that is responsive to local
needs;
· help severely disabled people progress into more open working environments; and
· secure continuing value for money improvements, including minimising the call on
the Government funding and maximising employment opportunities for disabled
people.
Remploy’s proposals for achieving their aims and objectives are set out in an annual
corporate plan which covers a period of three years ahead. Guidelines are issued by the
chief executive of the Employment Service on behalf of the Secretary of State setting
out direction for the plan. The guidelines for the plan for the period 1996/97 to 1998/99
are shown overleaf.
26

· A reduction in the cost or operating deficit per disabled employee of 10% in real
terms in the three years to 1997/98 (over 3% annually, building on a 3%
reduction in real terms in 1995/96);
· Increasing the number of disabled people helped within the resources available;
· Increasing the number of interwork placements offered;
· Ensuring that competition is based on the pricing policy recommendations agreed
with the DFEE; and
· Identifying clearly the proportion of costs which result from employing disabled
people.
The performance targets and Remploy’s performance against them give a good
indication of their operating position. Looking at historical data will show trends in
performance. The main agreement allows Remploy to carry out their day to day
business without reference to the DFEE. The performance targets require monthly
returns to the Employment Service. Additionally there are quarterly reviews with the
Chief Executive of the Employment Service, two of which each year are also attended
by a Minister of the DFEE. Summary reports are prepared in advance of these
meetings. (National Audit Office, 1997).
27
The following table shows the performance targets and performance against them from when they were first set in 1992/93 until 1997/98 (National
Audit Office, 1997).
1992/93 1993/94 1994/95 1995/96 1997/98(6)
1. The average number of disabled employees in the:
2. total work force Target minimum 8 390 8 550 8 900 9 200 9 800Achievement 8 576 8 654 8 906 9 334 10 021
3. factories Target minimum Not set 7 700 7 450 7 200 Not setAchievement 7 993 7 671 7 434 7 144 6 898
4. “Interwork placement Target minimum 641 850(2) 1 450(2) 2 000(2) 3 000 scheme Achievement 643 983 1 472 2 190 3 1235. Progressions Target minimum 190 115 74(3) 125 200
Achievement 197 234 118(3) 177 2256. The number of factories with Target minimum Not set Not set 50 All All the ‘choices’ programme (4) Achievement 56 All All7. The cost or operating deficit
of each disabled worker in the:
£ £ £ £ £
8. total work force Target maximum 9 684 9 731 9 650(1) 10 400 10 000Achievement 9 472 9 727 10 237 10 175 9 726
9. Interwork scheme Target maximum Not set 4 310 4 420 4 500 4 400Achievement 3 967 4 320 4 242 4 226
10. Operating deficit £m £m £m £mTarget maximum 81.3 83.2(1)(5) Not set Not set Not setAchievement 81.2 84.2 91.2 95.0 99.0

Notes:(1) Target not met.(2) These targets were not set in the annual performance agreement but were
implicit from other targets set.(3) The definition of a progression was tightened up in 1994/95 so that a
progression from a factory only counted if the individual had been in the factory for at least 12 months.
(4) The ‘choices’ programme is designed to give recruits and existing employees the opportunity to receive guidance and training in order to plan a career best suited to their individual needs.
(5) Although the total operating deficit target was not achieved, the target for the total number of disabled employees was exceeded and thereby the unit cost target was still achieved.
(6) Figures from published accounts for 1997/98. (Remploy l998.)
The reason the operating deficit per disabled worker was not achieved in 1994/95 is
quoted as difficult trading conditions, particularly in the Textile and Furniture Groups.
The following year the company achieved its year on year reduction of the target and so
remained on track for the 10% reduction in real terms over 3 years. The following table
compares the trading positions in 1987/88 and in 1995/96:
1987/88 1995/96 Increase/(Decrease)Cash 1995/96
pricesIn real terms
%
£’000 £’000 £’000 £’000Sales(1) 90 968 133 138 133 440 302 0.2%less Cost of materials consumed 46 653 68 280 68 482 202 0.3%Gross profit(1) 44 315 64 858 64 958 100 0.2%lessStaff costs of fit employees 20 885 30 566 29 468 (1 098) (4%)Operating charges(2) 16 692 24 430 31 369 6 939 28%Depreciation 5 360 7 845 11 623 3 778 48%Contribution to the cost of disabled employees
1 378 2 017 (7 502) (9 519) (472)
Staff costs of disabled employees
56 678 82 952 87 470 4 518 5%
Operating deficit 55 300 80 935 94 972 14 037 17%Exceptional costs(3) 408 597 3 582 2 985 500%Total deficit 55 708 81 532 98 554 17 022 21%
Number of disabled employees 8 993 9 334 341 4%Number of fit employees 1 955 1 591 (364) (19%)
£ £ £ £Staff costs per disabled employee
6 302 9 223 9 371 148 2%
Staff costs per fit employee 10 683 15 635 18 522 2 887 19%Operating deficit per disabled employee
6 149 9 000 10 175 1 175 13%
(National Audit Office, 1997).
29

Notes:(1) The 1995/96 sales and gross profit figures include £9 394 000 for Interwork
receipts from host companies.(2) Net of interest receivable.(3) Exceptional costs relate to restructuring..
The operating deficit per disabled employee is defined by the DFEE as the excess of
operating expenditure (including depreciation but excluding exceptional costs such as
reorganisation) over income, divided by the annual average number of disabled
employees.
It is clearly the increase in operating charges principally, but coupled with depreciation
that has led to a trading position where the company no longer contributes to the staff
costs of disabled employees. Seen as a commercial operation, the financial position has
got worse since 1987/88. The picture given by the above table does not show that
£9.4million of income was received from Interwork host companies. The relative cost-
effectiveness of the Interwork scheme hides the true decrease in performance of the
factory based part of the organisation. The company cite increases in the cost of
insurance, transport, and health and safety as the major contributors to the increase in
overhead costs.
The make up of the operating deficit for each factory worker and each Interworker in
1995/96 is shown in the following table:
Factory Employee
Interworker
Material Costs £9 585 £0On Costs £9 772 £1 208Wages, etc. £9 999 £7 323Total Costs £29 356 £ 8 531Sales Revenue/ Host Company contribution £17 363 £4 289Operating Deficit £11 993 £4 242 (National Audit Office, 1997).
30

A number of conclusions can be drawn from further examination of the accounts:
· in 1995/96 each disabled factory worker cost in total an average of £29 356. About
one third of this figure related to wage costs, one third to the cost of materials
consumed and the final third to overhead costs;
· factory sales were insufficient to cover materials and other costs and therefore
made no contribution to the disabled factory workers pay;
· of the total average cost of an Interworker 86% is related to pay;
· on average the host company paid half the costs of an Interworker; and
· for every £1 of DFEE funding, disabled factory employees earned 83p and
Interworkers earned £1.73. (National Audit Office, 1997).
There are considerable variations in operating deficit per disabled employee between
each of the six business groups and even greater variations between factories within a
group. For example, in 1995/96 the highest unit operating deficit, among each of the
groups, at £13 400 was 44% higher than the lowest at £9 291. The range of variation
among the factories in the Manufacturing Services group in 1995/96 is from £4 461 to
£11 403 whereas for the same period the range in the Textile group is £6 436 to
£18 787. The variation between these two groups reflects the difficult trading
conditions being experienced by the Textile group. It can be seen that there is a very
uneven distribution of funding between groups and factories, and that relatively cost-
effective units support those that are less cost-effective. (National Audit Office, 1997).
Remploy’s current business strategy is as follows:
To expand Interwork and rationalise manufacturing activity by:
· eliminating higher-cost product ranges to concentrate on core products and services;
· continuing changes in the trade of many of the factories, 32 of which have switched
to significantly different types of work in the period 1988 to 1995;
· merging factories which are surplus to core requirements into neighbouring
factories. Since 1987, ten factories have been merged into four sites, and this
pattern is set to continue, where appropriate, in future years; and
· acquiring companies and brands which complement existing activities.
31
The company have also been investigating possible diversification into services such as
hotels and catering, landscaping, computing, and social services. All services requiring
capital but little stock. In addition they have identified employment opportunities which
would involve contracting out disabled employees to work on other companies' business
premises, thus reducing material and overhead costs to Remploy. It is expected that the
cost of this would be half of a factory based worker, that is 40% more expensive than
an Interworker. (National Audit Office, 1997).
2.4 Corporate SWOT Analysis
Strengths:
· A large established well-known company operating in many market sectors with a
wide range of customers. Many of these customers are themselves in strong
positions in their markets. They are keen on single sourcing and will make their
own expertise available, e.g. Ford, Kodak, and Lever Brothers.
· Has a good reputation for quality, delivery and price in some markets. Has won
awards from Rover Group, and the Post Office. Works to Ministry of Defence
standards. All factories registered to BS EN 9002.
· Customers like doing business with an employer of principally disabled people as
it enhances their social aspirations and standing, e.g. Marks & Spencer.
· A government grant of £94.2m (equating to £27 per employee per week) helps
offset inefficiencies. Grant given in respect of interworkers pays for the
administration costs of the scheme and yields more cash as numbers increase.
· No requirement from share holders to make a profit allows cash to be re-invested.
Funds can be managed for long term advantage.
· Up to 40% surplus capacity, allows growth or cost reduction by rationalisation.
Weaknesses:
· Geographically dispersed, over 80 operating units, which are small (average 70
employees), leading to a group structure that incurs extra cost (e.g. travelling)
for central staff. This requires arm's length management and more levels in the
organisational structure to effect the same degree of control.
· Long chains of command dilute the message and slows down communication.
· Poor control systems, accounts from the various groups are costly to consolidate,
32

i.e. MAS-M computer system is not integrated.
· Little opportunity for economies of scale, due to having to be where the disabled
work force is, i.e. geographically dispersed.
· Some of the work force are inevitably less efficient than their “fit” counterparts.
· The interwork scheme drains away the most efficient workers leaving a base of
less efficient people.
· Government grant has now been frozen at £94.2m for four years.
· Absenteeism is 12%.
· A policy of not making disabled employees redundant restricts the speed at which
the capacity can be reduced to match sales.
Opportunities:
· Some customers are in growing markets. Sales increased by 7% in the year to
March 1998.
· There are opportunities for further product diversification.
· More interworkers can be placed with companies. Companies hosting interworkers
include Marks & Spencer, Halifax, Tesco, Sainsbury’s Boots and the National
Trust.
· UK GDP is growing.
Threats:
· New market entrants, there are few barriers to entry in most markets, e.g. capital
costs. This includes contract services and manufacturing, which is the biggest
growth area.
· Many central and local government markets now require competitive tendering,
whereas Remploy were once the only approved supplier. This is leading to
increased competition from more efficient companies. For example, Ministry of
Defence furniture, textiles and weapons storage, and school furniture for
LEA’s.
2.5 Furniture Group Financial and Market Analysis
33
The need to implement a Management Information System, MIS, and the type of
system required was a decision taken at corporate level. The drivers for change can
therefore be seen by the SWOT analysis at that level. The groups below this level also
face many challenges and a SWOT analysis reveals even more potent arguments for
change. The pressure on the groups does vary according to their own environment. For
example the Manufacturing Services group assembles products for top British and
international companies, including companies in the automotive sector where lead-
times are short, customisation high and quality requirements strict. There is an
expectation from customers that suppliers will use not only the newest technology in
their processes, and the latest manufacturing techniques (JIT, TQM, etc.), but also the
best planning tools. This points to a requirement to use an MRP II system of proven
capability.
The data for the Furniture group analysis comes from two sources. The monthly
accounts for the eighteen months ending September 1998, and marketing information
given by the Marketing Manager. Financial information earlier than April 1997 was
disregarded because of the number of changes that had happened before that time.
These included the amalgamations to form the Furniture Group. The number of product
movements between factories also makes analysis at factory level unreliable.
The financial information drawn upon includes monthly versions of the balance sheet
and the annual, (year ending 31 March 1998) and half year, (ending 30 September
1998) income and expenditure account. Additional information is obtained from reports
breaking down this data, again for the same year end and half year, but not analysed
monthly. These reports include sales and costs split by market sector, factory data and a
manpower report.
Products have only moved between factories making products for the same major
market segments. This allows analysis by these segments. The marketing information
has also been obtained relating to these market segments. Although the Furniture Group
has a central administration, any SWOT analysis must be based on the major market
segments because it is weak in some and strong in others. Six distinct segments can be
distinguished, Profile, Diploma, Exel, Lundia, Contracts and MOD. These are described
and analysed below.
34

The first segment to be analysed is the Profile brand. This consists of metal framed
tables and chairs. These are sold to the education market. Some items are made in
different sizes to suit the varying age of children. These products are found in colleges,
schools, and in commercial companies in canteens and reception areas. Some sales are
through purchasing organisations’ catalogues. There are approximately 242 factory
based people employed in this sector, 25% of the factory based people in the group.
The turnover represents 30% of the total. This is the largest part of the group. This
market is seasonal with a peak demand period in the schools’ summer holidays. Sales
have grown by 17% in the last year. This market is growing at 5% annually. Remploy’s
strategy is one of value and market leadership. Remploy is equal market leader with
two other companies, each having 9% of the total market. There are over 100 smaller
competitors. Approximately 70% of customers’ multi-source but each customers’ spend
is only 0.04% of the turnover in this sector. It is not known how many new customers
are attracted each year or how many existing customers are lost, but both are in the
region of 500. There are no barriers to customers’ switching to competitors' products.
From this data it is possible to use Porter’s Five Forces model (Bowman C, 1990) to
analyse the competitive position.
Threats from potential entrantsLow:· Brand loyalty· Access to distribution
channels Power of suppliersMedium:· Some suppliers have
few competitors, others have many
· Good relationships exist
RivalryHigh:· Equally sized
competitors· Low market growth· Insignificant product
differentiation
Power of customersMedium:· Large numbers of
customers, high turnover
· Low percentage of turnover
· Customers multi-source
· Threats from substitutesLow:· Products significantly
more expensive.
The second segment to be analysed is the Diploma brand. This consists of beds,
mattresses, headboards and surrounds. These are sold to the domestic market and under
contract to two major customers. There are approximately 159 factory based people
35
employed in this sector, 16% of the factory based people in the group. The turnover
represents 19% of the total. Sales have contracted by 2% in the last year. This market is
mature not growing or contracting. Remploy’s strategy is one of cost leadership.
Remploy has 1% of the market. The market leader has 33%. Approximately 30
companies having a larger market share than Remploy and roughly 70 companies have
a smaller market share. Approximately 60% of customers’ multi-source. It is not known
how many new customers are attracted each year or how many existing customers are
lost, but both are presumed to be in the region of 50. Each customers’ average spend is
15% of the turnover in this sector. This is influenced however, because the two main
customers take 85% of sales. There are no barriers to other customers switching to
competitors' products. The smaller of the two main customers is a retailer and could
switch to another supplier if they had capacity. The main customer is another
manufacturer and could sub-contract elsewhere or make themselves. Again capacity is
the only constraint, and this is only a question of semi-skilled labour and space. There is
little capital required. Again Porter’s Five Forces model can be used to analyse the
competitive position.
Threats from potential entrantsHigh:· Only small capital
requirement· Few special skills
Power of suppliersLow:· Many suppliers· Good relationships
exist
RivalryHigh:· Large number of
competitors, some with greater economies of scale
· No market growth· Little product
differentiation
Power of customersHigh:· Small numbers of
customers· High percentage of
turnover· Customers multi-
source
· Threats from substitutesLow:· Market inertia is high.
The third segment to be analysed is the Exel brand. This consists of office furniture
including desks and wooden cupboards. Office chairs are factored along with screens.
An installation service is provided via a sub-contractor. Office planning facilities are
provided by the contract's department. The products are sold using a sales force to the
36

manufacturing industry and service sectors. There are approximately 107 factory based
people employed in this sector, 11% of the factory based people in the group. The
turnover represents 7% of the total. Sales have grown by 55% in the last year. This
market is growing at 7% annually. Remploy’s strategy is one of differentiation.
Remploy has 0.3% of the market. The market leader has 10%. Over 150 companies
having a larger market share than Remploy and roughly 30 companies have a smaller
market share. Approximately 60% of customers’ multi-source. There are less than 5
new customers each year, but more than 5 customers were lost last year. Each
customers’ average spend is 10% of the turnover in this sector. There are no barriers to
customers switching to competitors' products. Once again Porter’s Five Forces model
can be used to analyse the competitive position.
Threats from potential entrantsMedium:· Some capital
requirement· Some special skills,
e.g. veneering panels
Power of suppliersLow:· Many suppliers· Good relationships
exist
RivalryHigh:· Many competitors· Most competitors
bigger
Power of customersHigh:· Small numbers of
customers, reducing
· Large number of small sellers
· Customers multi-source with no barriers
· Threats from substitutesLow:· No obvious substitutes.
The fourth segment to be analysed is the Lundia brand. This consists of library shelving
systems. An installation service is provided via a sub-contractor. Planning facilities are
provided by the contract's department. The products are sold to public and education
sector libraries. There are approximately 110 factory based people employed in this
sector, 11% of the factory based people in the group. The turnover represents 17% of
the total. Sales have grown by 1% in the last year. This market is mature neither
growing nor contracting. Remploy’s strategy is one of cost leadership. Remploy has
13% of the market. The market leader has 45%. Only 2 companies having a larger
37

market share than Remploy and roughly 10 companies have a smaller market share.
Approximately 30% of customers’ multi-source. It is not known how many new
customers are attracted each year or how many existing customers are lost, but both are
presumed to be in the region of 50. Each customers’ average spend is 0.3% of the
turnover in this sector. There are some barriers to customers switching to competitors'
products, for example as the systems are modular reconfiguring is possible only if
products come from one supplier. Again Porter’s Five Forces model can be used to
analyse the competitive position.
Threats from potential entrantsMedium:· Some capital
requirement· Some special skills,
e.g. planning services
Power of suppliersLow:· Many suppliers· Good relationships
exist
RivalryLow:· Few competitors· Good market share
Power of customersLow:· Few potential suppliers· Some switching
barriers· Product is an important
input to the customer
· Threats from substitutesLow:· Substitute products
much less space efficient.
The fifth segment to be analysed is the Contracting market. This is a diverse market that
ranges from headrests for cars to speaker stands for hi-fi manufacturers. The products
are sold by the specialist contracts department. There are approximately 295 factory
based people employed in this sector, 29% of the factory based people in the group.
The turnover represents 19% of the total. Sales have grown by 17% in the last year. It is
not possible to analyse this market due to the fragmented nature of the product offering
which fall into many market sectors.
The sixth segment to be analysed is the Ministry of Defence (MoD) market. This is a
single customer market. The products range from chairs to weapons racks. The products
are sold by the specialist contracts department. The MoD was once a major and captive
38

customer, due to the relationship Remploy has with the government. Since the advent of
competitive tendering the business has been shrinking rapidly. It is still analysed in the
accounts separately for historical reasons. There are approximately 90 factory based
people employed in this sector, 9% of the factory based people in the group. The
turnover also represents 9% of the total. Sales have contracted to only 35% of last year's
turnover. Not all of the information is available to analyse this market using Porter’s
model but the chart below shows some key points.
Threats from potential entrantsLow:· Small capital
requirement· Some special skills,
e.g. quality requirements & special specifications.
Power of suppliersLow:· Many suppliers· Good relationships
exist
RivalryHigh:· Increasing numbers of
competitors.· Market share
decreasing
Power of customersHigh:· Many potential
suppliers· Single customer· Product is not an
important input to the customer
· Threats from substitutesLow:· Customer will not
accept substitutes.
A number of observations that are not dependent on the market sectors can be deduced
from the accounts. An overall performance picture can also be gained.
· Growth overall in the last year was 5%. · Absenteeism is high at 13% and not decreasing· Labour turnover is low at 1% and is stable· Labour being lost is not being replaced· Progressions to interwork or open employment are low but increasing (10 in
6 months to September 1998, 10 the previous year)· Disabled overtime is increasing, 2.9% to September 1998, 0.7% previous
year· Non-disabled overtime is decreasing, 0.7% to September 1998, 3.9%
previous year· Percentage of non-disabled is stable, 14.5%· Fixed assets are decreasing as factories are disposed of or transferred to
other groups
39
· Total stock is stable over the last 18 months· Debtors are also stable, but there is a seasonal trend· Creditors have been reduced in line with budget
There are a number of ratios that are a useful guide as follows, (as of September 1998)
· Trade creditors turnover 7.3 times· Trade debtors turnover 6.9 times· Raw material stocks 4.7 times· Work in progress stocks 26 times· Finished goods 14 times
Raw materials seem to turnover slowly, there could be large amounts of slow moving
and obsolete stocks. This is where Triton can make control easier. It should be possible
to halve this stock. As £1.5m is tied up in this stock there could be a significant release
of working capital and reduction in interest payments.
2.6 Furniture Group Customer Service Analysis
Another benefit of Triton should be better levels of customer service, although this is
quantifiable the benefits are intangible. There should be better customer retention rates,
however. An analysis of the figures for the different product brands for the 5 weeks
ending 2 August 1998, which includes some factories live on Triton reveals the
following picture:
Brand Percentage of Orders Percentage of ValueEarly 59% 66%
Profile On Time 14% 13%Late 27% 20%Early 63% 72%
Diploma On Time 23% 16%Late 14% 12%Early 49% 38%
Exel On Time 6% 12%Late 45% 50%Early 91% 53%
Lundia On Time 5% 40%Late 4% 7%Early 67% 58%
Total On Time 14% 18%Late 19% 24%
This is in the summer peak for Profile and as there is insufficient capacity to cope this
explains the late deliveries. The early deliveries were probably the result of a stock
40
build before the peak of items that were known to sell well. As schools and colleges are
closed they are able to take deliveries early.
The Diploma early deliveries are probably to the two main customers. The late
deliveries are high however the majority were cleared within one week.
The Exel performance is poor, 80% of the early deliveries were one week early. These
could be products held in the warehouse used to buffer this product against
unpredictable demand. Only half of the late deliveries were cleared the following week.
The early deliveries of Lundia can be explained by the same reasons as profile.
Predicting demand and building for stock, or capacity do not appear to be a problem
with the Lundia product.
If early or on time deliveries can be said to satisfy the customer, there are still 19% of
customers dissatisfied. This is very high in an environment where it is customer service
that gets repeat business.
Graphs of these orders show deliveries against time.
>2 weeks early 1 w eek early 1 week late >2 weeks late
OrdersValue
41

An analysis of the orders processed through Triton between week ending 18 September
1998 and week ending 23 October 1998 reveals the following picture:
Percentage of Orders Percentage of ValueEarly 13% 17%On Time 32% 26%Late 55% 57%
This appears to be worse. It could be adversely affected by one of the Exel factories
being live and a number of Profile factories being live, with this period being at the tail
of the peak period. At this time all of the stock that had been built would have been
used. Any orders outstanding would be likely to be overdue. Graphs of these orders
show deliveries against time.
>2 weeks early 1 week early 1 week late >2weeks late
OrdersValue
This graph implies that 3 weeks late and 4 weeks late should be detailed to show the
true tail off as the > 2 weeks late quantity and value are higher than the 2 weeks late
quantity and value.
2.7 Furniture Group SWOT Analysis
Strengths:
· Part of a large established well-known company operating in many market sectors
with a wide range of customers. (See corporate SWOT).
Furniture Group operates in four distinct market sectors and additionally
undertakes contract work. Customers in some sectors are themselves in strong
positions in their markets, (e.g. Dunlopillo) or are local or central government
42

departments or agencies, (e.g. Ministry of Defence).
· Strong Contracts department able to support aggressive growth in this area, 17% in
1997/98.
· Strong presence in the market sector served by the Profile brand, 9% joint leader.
In peak periods demand can outstrip capacity.
· Only UK company licensed to manufacture and sell the Swedish product Lundia,
library systems.
· Customers like doing business with an employer of principally disabled people as
it enhances their social aspirations and standing.
· The government grant helps offset inefficiencies.
· No requirement from share holders to make a profit allows cash to be re-invested.
· Funds can be managed for long term advantage.
· Can considerably reduce costs using techniques such as Value Analysis, especially
on products in weak areas, (e.g. Exel).
· Weaknesses:
· Geographically dispersed, 14 operating units, which are small, leading to a
structure that incurs extra cost (e.g. travelling) for central staff.
· Department Heads spend significant time driving rather than managing. Mobile
phone bills are high.
· Dispersed chains of command dilute the message, slow down communication and
make managing more difficult.
· Delivery performance is poor, late deliveries range from 19% to 55%.
· Some markets are seasonal, (e.g. furniture for schools is purchased for installation
during the long summer holiday). Capacity is not geared up to spread variations
in the seasons between factories. In some cases this would be impossible as a
metal working factory cannot use spare capacity to make wooden furniture, and
vice- versa.
· Poor control systems for capacity planning materials planning and purchasing.
(The MAS-M system does not plan material or capacity, this is done manually)
· Little opportunity for economies of scale, due to having to be where the disabled
work force is, i.e. geographically dispersed. Some factories feed others causing
delivery costs due to the geographic dispersion. (The factory at Treforest in
Wales supplies table tops to the factory in Blackburn in Lancashire.)
· Some of the work force are inevitably less efficient than their “fit” counterparts in
43

competitors' organisations.
· The interwork scheme drains away the most efficient workers leaving a base of
less efficient people. (Mostly young people join this scheme).
· Absenteeism is 13%.
· Raw material stock turnover is slow, every 11 weeks tying up capital.
· Opportunities:
· There are opportunities for further product diversification, product other than
tables based on welded tubular designs could be made.
· New products can be brought to market in weak areas (e.g. Exel, new range
currently being designed).
· Opportunities exist to take on new contracts. For example, chair parts.
· UK GDP is growing.
· Threats:
· New market entrants, there are few barriers to entry in most markets, e.g. capital
costs.
· Many central and local government markets now require competitive tendering,
whereas Remploy were once the only approved supplier. This is leading to
increased competition from more efficient companies.
· A small market share in the office furniture segment with high cost products that
offer limited choice and of outdated design aesthetic.
· Reliance of two main customers to support the bedding factory make it
vulnerable.
44

2.8 Summary
A number of key points can be deduced from the information gained researching the
background to the implementation of an integrated computer system.
· The status quo was not an option, the IT infrastructure was obsolete and costly.
· The level of productivity is in decline, and is very variable across the company.
· Increasing numbers of Interworker masks the decline in productivity.
· The market position is as variable as the productivity.
· The furniture group is defined by commonality of product, not by commonality of
processes, market structure, or geographic location.
· Poor customer service levels are affecting the viability of the Furniture Group.
· The company is struggling to adapt to compete in open markets.
45

Chapter 3. Preparing for Change and Implementing the
M.I.S.
The purpose of this chapter is to describe the decisions and actions taken within the
Furniture Group once it was known that the new MRPII system was to be introduced.
These decisions and actions were to prepare the ground for the actual implementation
but were not part of a normal implementation. The author was the project engineer in
this process. These decisions and actions are critically reviewed. The chapter then
reviews the implementation process.
3.1 Introduction and Background
It was known that high quality accurate information needed to be input into the system
to make it a success. Inaccurate information would lead to a worse performance than at
present. Because of the integrated nature of the system the level of customer service
depends on the accuracy of many sets of data. Getting the right product to the right
customer at the right time, in a complete, functioning form depends on the products of
the data accuracy as shown in the table below:
Accuracy Accuracy Accuracy Accuracy
Demand 60% 100% 100% 100%
Stock on hand 50% 90% 95% 97%
Open orders 50% 90% 95% 98%
Planning parameters 30% 90% 95% 97%
Bills of Materials 90% 95% 99% 99.5%
Material Requirements Planning Calculations
Customer Service 4% 69% 85% 92%
Messages in error 24 in 25 1 in 3 3 in 20 1 in 12
(Goodfellow R, 1994)
The Furniture Group was formed by a number of amalgamations of smaller divisions
over a period of time. These divisions were based around the trading names of
particular types of furniture: Profile for the education market; Exel office furniture;
Lundia shelving systems for libraries; and Diploma bedding. Each factory within these
46

divisions was allowed to determine its own part numbers and used different systems to
do this. Most numbers were meaningful. With the amalgamation of the divisions there
were many common items which had different numbers, and in some cases different
items with the same number. The MRPII system would need one part number per item
to allow efficient operation. This was identified as the first requirement of the
preparation phase.
All part numbers were held on the existing system. This system held all top level
numbers to be able to take sales orders and raise invoices, and all purchased part
numbers to be order raw materials. The old system also had a Bill of Material where
one factory produced an item for another factory, this enabled orders to be placed on
the feeder factory. These items were mostly upholstered seats and backs, and laminated
table tops. There were no Bills of Materials linking the purchased parts into sales items
and so all stock control and planning was done by setting up re-order points, safety
stocks and by manual calculations. Clearly the materials requirement planning part of
the MRPII system would need fully structured Bills of Material. This would also be
required to allow automated product costing. This was identified as the second
requirement of the preparation phase.
Because each factory operated a bonus scheme each operation needed to be documented
and timed. There existed on paper “Method Operations Layouts” (MOL’s); these listed
the operations to make a product together with allowed times. Some times were
negotiated and some came from time studies. There was a large percentage of
unmeasured work where average bonus was paid. Many of the time studies that did
exist were based on methods that had now changed and hence were not valid. The times
were not based on the industry standard BSI 100 rating system. They had also been
adjusted to take into account the less efficient working of disabled people. The
operations on the “MOL’s” were not structured in the same way the Bills of Materials
(BOM's) would be structured. For the Capacity Planning part of the MRPII system to
work, the routes would need to be structured to match the BOM's and the times on them
be accurate. Again this was also a product costing requirement. The times would need
to be set according to the industry standard BSI system. A global factor could then be
applied when planning production and calculating costs to take into account disabilities.
This task was identified as the third requirement of the preparation phase.
47

Each of the divisions joining the Furniture Group had its own drawing office. The
standards used varied considerably. The availability of engineering drawings did not
cover all products. Because there were no BOM's all the content of a product was
sometimes included on one drawing, i.e. assembly details and piece part dimensions.
This often led to drawings being cluttered with too much detail leading to confusion.
The abilities of some of the CAD operators were less than expected of a draughtsman.
There were serious quality problems in factories as a result of poor, missing or
confusing drawings. In producing structured BOM's and routings it was obvious that the
engineering drawings would need to be structured in the same way and this would give
the opportunity to create missing drawings, remove detail from cluttered drawings
putting it on other drawings, and correct errors. It was also clear that changes had been
made in production and the resource had not been available to keep the drawings up to
date, this exercise would also enable these changes to be made. This then was identified
as the fourth task of the preparation stage.
The preparation stage was thus a complete re-write of all of the engineering data across
the 16 factories that were in the group at the start of the project in the summer of 1996.
Meetings were held to determine a strategy and plan for this project. With 16 000
products and a similar number of purchased items, it was clear this would be a lot of
work over a long time at considerable cost. It was also clear that without this work the
poor data that existed would mean the MRPII system would not be successfully
implemented, meaning the large investment in it would be wasted. Financial and human
factors would evidently play a big part in this project. The strategy was to use existing
resources wherever possible, supplemented using temporary staff where necessary. One
draughtsman operating on his own in a profile factory had been made redundant earlier
in the year before the need was recognised. Two more draughtsmen based in the group
headquarters in Swansea were assigned to work on new contracts, new products and
customer specified one off products using current systems and procedures while work
on new drawings was assigned to a temporary drawing office to be based in Sheffield.
The two draughtpersons based in the Oldham factory were to assist with some of the
work undertaken in Sheffield.
It was decided that materials planning was critical to the implementation of the MRPII
system, but capacity planning was not. Therefore two projects would be set up. The
48

first would gather engineering data to create structured BOM's, routes and engineering
drawings. The routes would contain all operations but no times. The second project
would address the operation times. Routes were included in the first project because the
BOM's, routes and drawings must be contiguous, and because there is significant value
in having the sequence of operations printed on production orders, even without times.
Because all times were to be re-studied, there was no work for the existing work study
staff until the second project started. As this was expected to be a long time after the
first project, these staff could be released for the first project. They had the advantage
of being based in factories and each had experience in a number of factories having
worked in the divisions. Their product knowledge was good and they knew the
management and staff in their factories. The plan was that they would gather data to be
processed in Sheffield. As it amassed the temporary staff there would be increased in
number to cope, but gradually so that they would not be starved of data to process.
It was decided the best way forward would be to invent a new part numbering system
for all items other than saleable products. Work was already taking place to adjust these
numbers to a common format. Coding legends were being produced so that products
would be numbered according to their attributes. All product numbers would be
alphanumeric and be seven characters long. To avoid keying errors, commonly found
when using long part numbers, it was decided that factory part numbers, i.e. those for
purchased raw materials and piece parts and for manufactured components, would also
be seven characters long. To distinguish them from saleable items they would be
numeric, therefore any part number with a letter in would be recognisable as a saleable
item. There were a number of meeting and some heated discussion about the design of
the number. The principal area of disagreement was whether the number should be
meaningful or not. The arguments are discussed in appendix A which is a paper written
by the author at the time. It was decided that a compromise was best. The first three
characters of the part number would contain some meaning and the last four would be
purely sequential. The system adopted is shown overleaf.
49

Wooden Items110 Solid Timber120 Plywood130 M.D.F.140 Chipboard150 Hardboard160 Veneer170 Cork
Metal Items210 Tube220 Bar230 Angle240 Sheet250 Plate260 Strip270 Extrusion280 Casting290 Blank
Plastic Items310 Injection
Moulding320 Extrusion330 Vacuum
Forming340 Glass
Reinforced350 Foam360 Rubber370 Laminate
Fabrics410 Fabric420 Quilting430 Upholstery
Sundry
Fabrications & Assemblies510 Wooden Assy520 Panel Assy530 Fabricated Metal540 Mixed Material
Assy550 Upholstered
Assy
Packaging Material & Documents610 Cardboard620 Expanded
Polystyrene630 Bubble Wrap640 Plastic Film650 Tape660 Labels670 Assy Instruction
Sheet680 Fitting Kit Sheet
Fittings & Fasteners710 Wood Screw720 Self Tapping
Screw730 Machine Screw740 Metal Fastening750 Other Fastening770 Fitting780 Mechanism
Consumables & Indirect810 Adhesive820 Finishing
Material840 Abrasive850 Cleaning
Material860 Personal
Protective Equipment
870 Gas & Fuel880 Lubricant890 Tool & Fixture
Miscellaneous910 Mirror920 Glass930 Foil990 Sundry
50
The meaning is restricted to the nature of the part so that it would be unlikely to need to
change. The first character of the part number defines a major category, the next, a
more limited category. Scope for extension was deliberately built into the system.
There were similar discussions about the drawing numbering system. The main point of
contention being whether the part number should be used or whether there should be a
separate drawing number. Because the products tended to be many variations on
relatively few themes, there is an ability to draw a number of similar components on
one drawing using a table to list those dimensions and features (e.g. colour or hand) that
vary. This means a range of parts can be put onto one drawing. This, together with the
non-sequential alphanumeric nature of the product numbers which would need to be
used for general assembly drawings, means it is easier to manage drawings if they have
a separate numbering system. If extra sizes of products are added to ranges after
introduction the numbers can not be the next in a sequence unless gaps are left. If gaps
are left how many should there be? The difficulty of managing part numbers to allow
extensions to ranges was the final point to ensure that the drawing number should be
separate from the part number. Disparate part numbers can then be added to one
drawing. It was decided drawing numbers would have no meaning as nothing is gained.
Being purely sequential, it therefore made sense that they be numeric, not
alphanumeric, and to distinguish them from part numbers it was decided they would be
six characters long.
The MRPII system is complex and requires a lot of data to be able to add a part
number, e.g. planning and ordering data fields are mandatory. This data was not readily
available. System navigation requires special training. The Sheffield site did not have
the data connections to the main computers in head office, to be able to access the
MRPII system. Because of the access issues, planning data availability, and the training
requirements, for temporary staff who may not stay to see the project through,
(necessitating training of replacements before they became effective), it was decided
not to use the MRPII system to deposit the engineering data gathered. There were no
spare personal computers within the company to be able to put the engineering data
onto spreadsheets. Computers did exist for draughtsmen to use to create engineering
drawings using Autocad. It was therefore decided drawings would be produced using
Autocad but BOM's and routes would be produced using a paper system.
3.2 Designing the Documentation
Before the program of gathering the data and processing it could begin all the forms to
be used had to be designed and a framework of operating procedures established. It was
decided that as there were nine major part number categories one lever arch file would
be assigned to each of them. Inside each file would be a set of ten part dividers for the
minor categories. An additional file would be used for the drawing register. It was felt
important to be able to record the old part number as a cross reference. A column in the
master parts register was therefore included. The part number was to be recorded along
with the description. There would also be a record of the part source, (i.e. purchased or
manufactured) and provision for notes or comments. To enable a cross reference to the
drawing the drawing number was also to be recorded. In the drawing register the new
drawing number was to be recorded along with a description and, where available, the
old drawing number.
Once the registers were set up, it was necessary to design forms to record the
BOM's and routes. These are shown in shortened form below. A new drawing
border was also designed. This enabled quick distinction between new and old
drawings. It also allowed items that should be on drawing borders, (e.g. general
tolerances, copyright statements, revision history, etc.), but were missing from the
old borders to be included. All the forms including those in the registers were
numbered and given an issue status for later inclusion into the Quality Systems
Procedures.
REMPLOY
FURNITURE GROUP
BILL OF MATERIALS (B.O.M.) SHEET:............
OF.....................
PART No.:........................................
DRAWING No:-.........................
DESCRIPTION:-
..........................................................................................................................
IT’M
PART
No
DESCRIPTION DRG
No
PART
SOURCE
QTY
RQ’D
UOM COMMEN
T
ERRORS AND/OR OMMISIONS TO THIS ISSUE No. DATE CC No. CHECKED
DOCUMENT SHOULD BE BROUGHT TO THE
ATTENTION OF THE INDUSTRIAL ENGINEERING
DEPARTMENT WITHOUT DELAY. DO NOT MAKE
ALTERATIONS TO THIS DOCUMENT.
ROUTING SHEET SHEET .......
OF...............
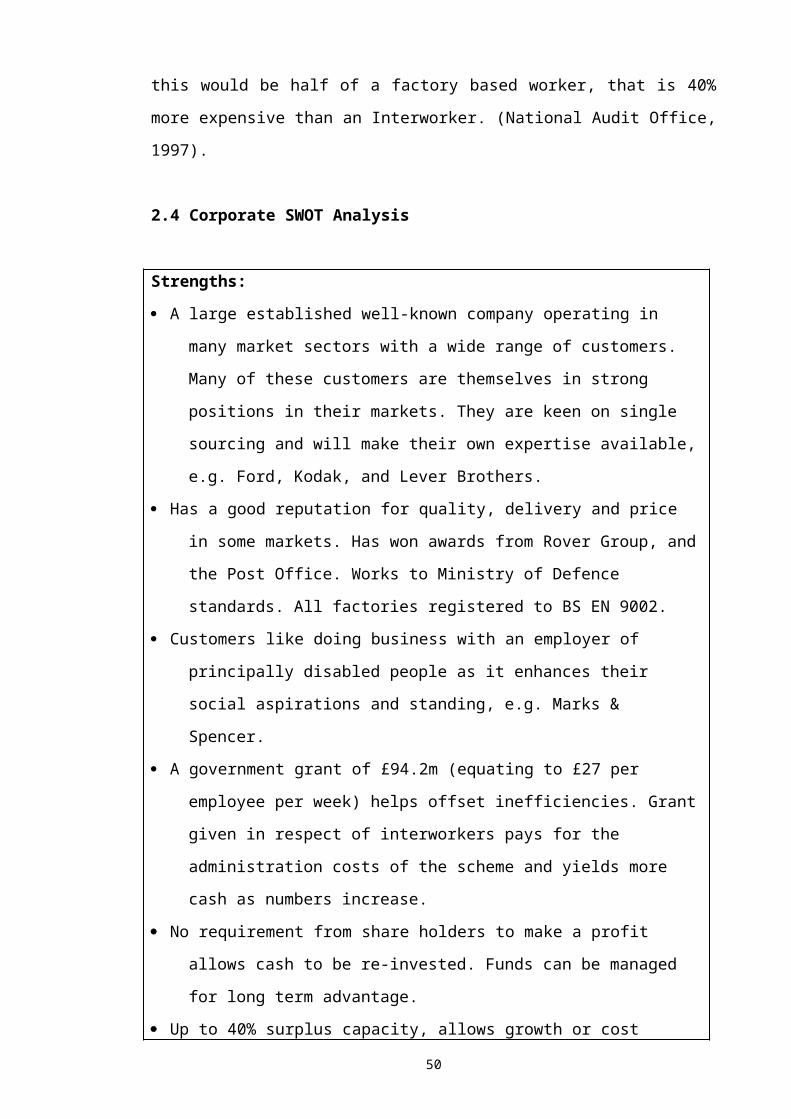
REMPLOY
FURNITURE GROUP
PART No. DESCRIPTION: ROUTE No. FACTORY:
DRAWING No. PREFERRED: Y/N
Work OP. DESCRIPTION M/C MACHINE TOOL INSPECTION Mannin
g
Std Min Value
Centre No. OF OPERATION No. TYPE No. INSTRUCTIONS Level Set Time Op Time
ERRORS AND/OR OMMISIONS TO THIS DOCUMENT
SHOULD BE BROUGHT
ISSUE No. CC No. Planned By Approved
By
TO THE ATTENTION OF THE INDUSTRIAL ENGINEERING
DEPARTMENT WITHOUT DELAY.
DO NOT MAKE ALTERATIONS TO THIS DOCUMENT.
3.3 Data Acquisition
The BOM and route forms and drawing border blanks were distributed to the data
gatherers at a meeting. The meeting included presentations about the methodologies to
be used. It was stated the drawings were to be the master data and the BOM's and routes
were to be based on them. The importance of the documents being contiguous was
explained. The logic of multi-level BOM's was explained, how they linked together,
how they must all end in purchased items, and how there must be no circular references.
At this time the work study personnel, who had been assigned to the project, reported to
manufacturing management. Their assignment to this project was explained and the
time commitments required made clear. The Group Industrial Engineering Manager
explained how he had the overall responsibility for the project and that the author
would co-ordinate it on a daily basis, offering advice on format, content and technical
issues. Support would also be available from the Industrial Engineers, who each dealt
with engineering issues in a number of factories assigned to them.
The importance of the documentation being based on the production process was
emphasised. The break points in the bills of material was discussed. It was stated that if
an item went into a store, or moved between factories this must be represented by a part
number, BOM, route and drawing in its state at that point. Because the paper system
had no ability to cope with parallel operations in routings, BOM's were to be structured
so that these would be avoided.
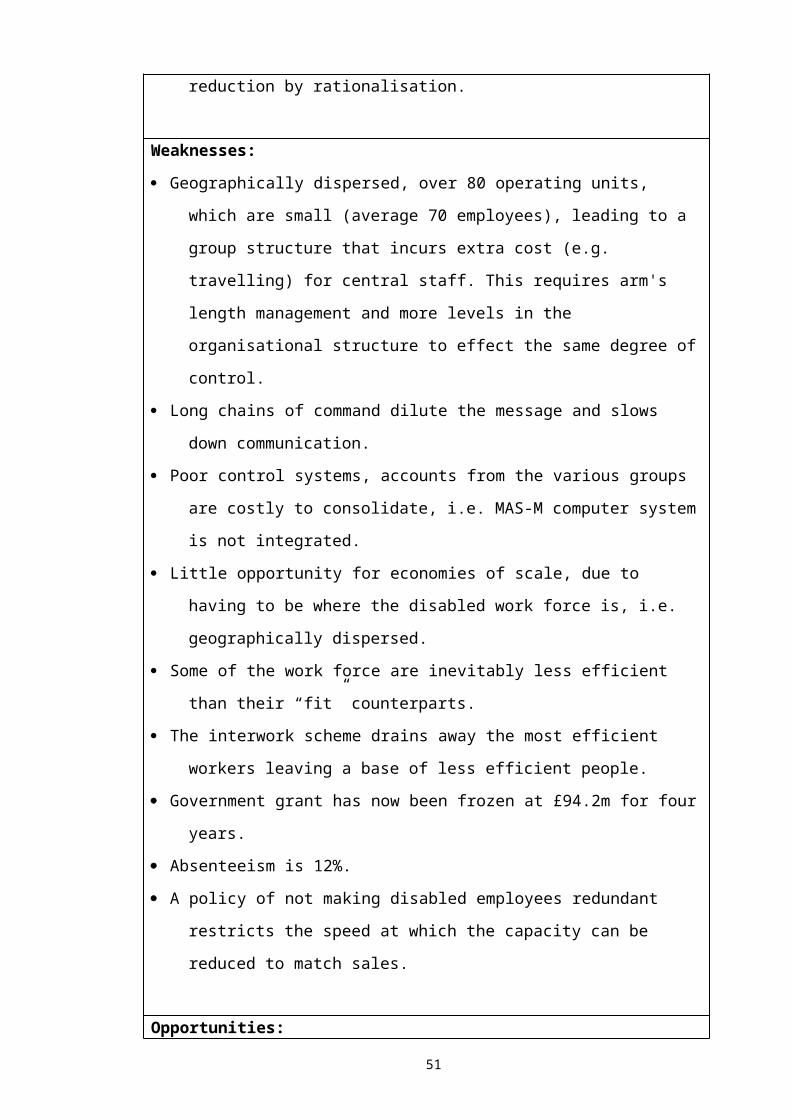
There were seven people assigned to collect data. They were each assigned a number of
factories and given a priority order of factories. The factories for each person were
those they were familiar with. The priority order was based on where it was thought the
best data (most accurate and most complete) was held. The thinking behind this was
that it would make the job easier at the start. It was also thought this data could be
gathered quickly, so enabling an early start to the process of transforming it by
temporary staff at Sheffield, and hence giving the whole project early successes, which
would build confidence, both in the project team and the rest of the company. To assist
this approach, the data gatherers were tasked with tackling the high volume products
first. The theory being, that those products would be well understood and documented.
Also they could be being manufactured, enabling the gatherer to go and look at the
product and if necessary watch it being made. They were asked to send packs of
information relating to a product (or range of products, i.e. various sizes and colours of
a generic product type). The pack should contain all the BOM's, routes and drawings.
Only products that were “standard” were to be processed in this way. These included
products made and sold via catalogues and those made under contract, provided that the
contracts were ongoing. There was a listing called the standard product list. However, it
was far from clean, containing many one off items, items for contracts which had
expired and were not likely to be renewed, and many other miscellaneous items, such as
transport charges, etc. The list was tidied up and did get down to 16 000 items in its
second edition, which was made available to the project team. The list was available on
MS Excel and the first character of the part number denoted the factory of manufacture.
This enabled the list to be sorted and passed on to the data gathers. However it was
found to be confusing by most people and was not widely used; catalogues proved more
useful in some factories, but in others were not helpful.
The data gatherers were sent to the factories and told to base themselves there until they
moved on to their next factory.
There were a number of problems. Some became apparent immediately, others only
over time. Most gatherers quickly started sending significant amounts of work, whilst a
few sent none. Those that were not sending work claimed that their line manager had
set other priorities. At one point, one person was playing two managers off against each

other. Some of these problems took quite a long time to resolve. The volume of data
being sent to Sheffield was too great to check in any detail. Cursory checks were made
and advice given. The data was filed by product and factory. Systematic errors were
missed, e.g. the structuring of the product into too many levels.
The skills of the data gathers varied considerably and some had more product and
process knowledge than others. Very few had any understanding of BOM's. Most had
limited experience of drawings. Some recognised their weaknesses and were motivated
to do a good job. They would ring asking for advice up to three times a day, asking ever
more pertinent and complex questions. Many of the gathers had been with the company
many years. They had seen several waves of senior managers come and go. They were
quite politicised and sometimes very cynical. There was a resentment about being
seconded to the project rather than doing their normal job. They felt threatened by
change. They were concerned about their job security. This led to some of them
underplaying their skills, claiming they could not do some work when it was known
they could. The lack of understanding of the structure of BOM's was a cause for
concern. Efforts were made to explain who the “customers” of the BOM's were,
principally planning and costing functions, and how they would use them. Despite
many attempts, including some visits and personal training, some of the data gatherers
never managed to fully understand BOM's and how they needed to be structured.
The size of the task had been underestimated. This led to the gathering of data to start to
over run its allotted time scale. Because of the difficulties and over run the Industrial
Engineers became more involved and gathered some of the data themselves.
When most of the data that was to be gathered by the work study personnel had been
collected they were all made redundant. They were told they were not required for
project 2, assigning times to all operations. This was because it had been decided to use
contract personnel to do this. It was a one off task, after this had been done all new
products would have times generated from synthetics using a new computer system.
One work study engineer and one industrial engineer were recruited for this job and
carried on gathering data. Two of the work study personnel are disabled, and as
Remploy has a policy of always finding alternative work for disabled people in
redundant jobs, they were offered alternative work. The others left the company. This
meant those people processing the gathered data could not question them about it when
they started processing it. This made their task more difficult. However, the quality of
some of the data gatherers' work was so poor it had to be collected again. Continuing to
employ them on the project would not have gained anything.
3.4 Data Processing and Transformation
When enough data arrived, to ensure processors would not be starved of work, a
draughtsman and a technical clerk were taken on. These were employed on contract
through an agency. Some drawing work was also undertaken by the two drawing office
staff based in the Oldham factory. The quality of the work from Oldham was extremely
poor, marked up drawings were sent, or taken, back to correct the errors and
presentation. Many drawings had to go back several times. The drawing process ground
to a halt as the people at Oldham struggled to complete the drawings for two styles of
one chair, made at the Barnsley factory to Remploy’s own design. The contract
draughtsman based in Sheffield drew the other chairs made at the Barnsley factory.
These chairs were a wooden frame construction with upholstered seats and backs. They
were made under contract for the Ministry of Defence, to their design. The person
collecting data at the Barnsley factory claimed he could not sketch the piece parts for
these chairs as he had no experience of drawing. The source material was therefore the
MOD specification, from the contract, and an MOD drawing for each chair. These
drawings were A0 in size and were general arrangements. The quality and layout of
these drawings was poor, with a lot of manufacturing information missing. It became
necessary to obtain samples from the factory to extract missing information. The design
of these chairs was complex, including mortise and tennon joints many of which were
set at angles. This, with the poor and missing information made the drawings time
consuming to produce. When 80% of this drawing work was completed the contract for
these chairs was lost making all of this work invalid.
The Oldham factory was transferred out of the Furniture Group. A significant amount
of BOM's had been collected, but the person collecting this data had become long term
sick. The production of the products made at Oldham was transferred to the Wrexham
factory. The disabled work force at Oldham were transferred to the Packaging Group
along with the factory. The two draughtspersons, who were not disabled, were made
redundant. The two CAD computers, a printer and a plotter they had been using were
transferred to Sheffield.

At this time enough data had arrived to justify increasing the temporary staff at
Sheffield. A second technical clerk and a second draughtsman were taken on. To keep
costs under control the technical clerk was a young graduate, recruited through a non-
technical employment agency.
With the sudden removal of the chairs from Barnsley’s product range the focus was
moved to the Neath and Plymouth factories. This was followed by the Sheffield factory,
which at the time was on another site within the city. The graduate then found a job
more in line with his career aspirations and had to be replaced. The amount of work
available at this time meant the team was increased by one draughtsman, from the
technical agency, and three young graduates from the non-technical agency. With such
a large intake training became a problem. Much of the new technical clerks’ training
and queries had to be handled by the technical clerk recruited first. This person,
although capable of understanding BOM's and routes, had no engineering knowledge.
Work then started on the Merthyr Tydfil and Blackburn factories.
Soon after the intake of new staff it became apparent that the new draughtsman was
unable to use Autocad properly. He was told of the concerns, and after showing no
improvement was sacked after three weeks with the team. All of his work had to be
revisited. At this time there was enough work building to employ two more
draughtsmen, four in total with four technical clerks. With this number of people
working on the project, an additional permanent member of staff, (making a total of
two) was added to the team, with the task of checking and collating BOM's and Routes,
ensuring none were missed out, checking drawings and compiling the data ready for
issue.
By this time the project was running significantly late against the original project plan.
The plan had been conceived with little knowledge of the resources required or the
volume of data to be progressed. There was also no indication of how long it would
take to process individual items of data. Because of the lateness against plan it was
decided it was important to get the data in use in a factory. Once the resource was
available for thorough checking, it was decided that the Sheffield factory would be the
first to use the data. This was for four reasons, firstly it was local meaning support
could easily be offered. Secondly they were one of the few factories that had already
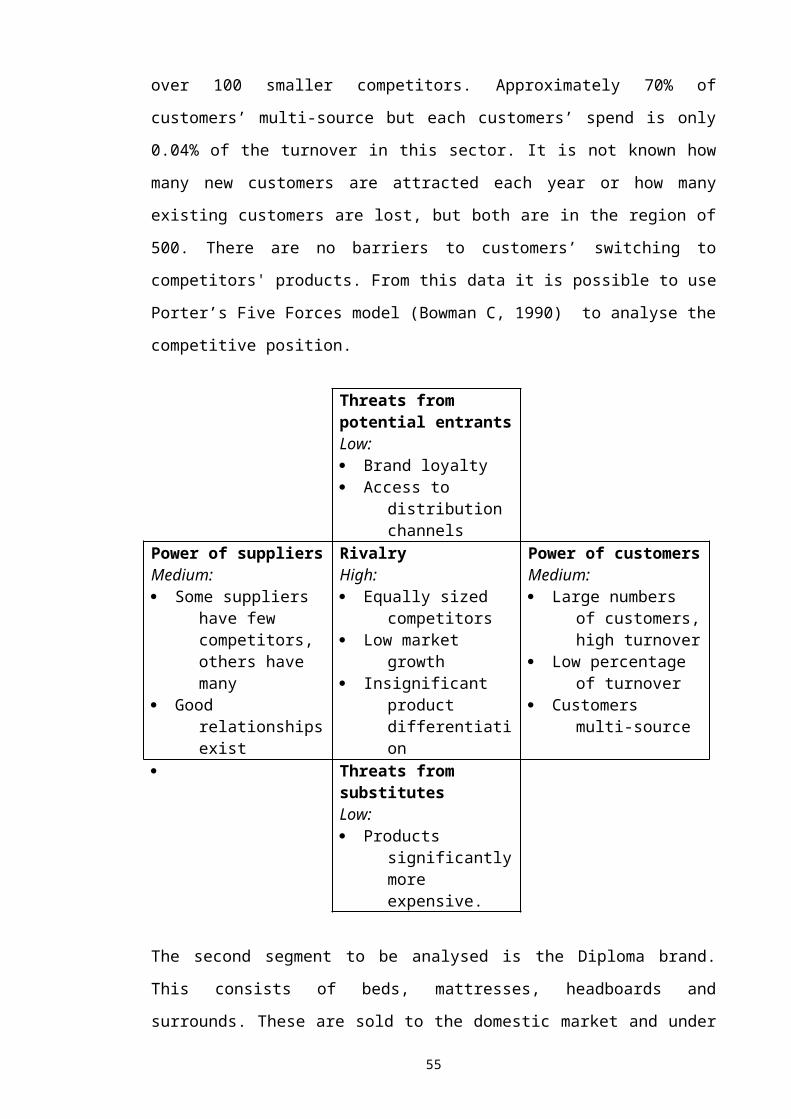
been used to operating systems of control similar to those proposed. Thirdly because
they had operated formal procedures already it was expected that the data gathered
would be accurate. Finally it is a small factory with a limited product range. Much of
the checkers initial time on the project was thus spent preparing the Sheffield data for
issue. When it was issued the Work Study Engineer who gathered the data took it to the
factory for a thorough validation by himself and two members of the factory staff. The
Factory Scheduler reviewed the BOM's and routes and the Quality Technician reviewed
the drawings. This process is described more fully in section 3.8.
Once the checker was free of this work he started to compile the Neath data for issue.
He also took a more active role in reviewing the work currently being produced.
Meanwhile a major new contract had been won and was being processed in the Swansea
drawing office. The project co-ordinator had responsibility there and had to almost
withdraw from the project to ensure the data required for the contract was produced in
time.
The flow chart overleaf shows the way the documents were processed by the clerks and
the draughtsmen.
Re-file queuing for draughtsmen
Copy data and compile into Red Files ready for issuing to factories. Stamp each copy “CONTROLLED COPY” in blue ink.
Check data, ensure all manufactured parts have a BOM & route. Check the content against the source data.
From source data and prepared data produce engineering
drawings of both piece parts and assemblies, including GA’s.
Draughtsmen
From source data prepare BOM’s & routes. Allocate new part
numbers and drawing numbers. Use structured descriptions.
Technical Clerks
Gathered data filed by product and by factory prior to processing
Data Gathered, validated and missing data created.Sent in packs by product and by factory to Sheffield by
Work Study Engineers.

Major problems began to become apparent. The data gathered by the work study
personnel often did not include enough information to define a part exactly. The
technical clerks and draughtsmen had to phone the data gatherers or other factory staff
several times a day for more information. To avoid assigning new part numbers to parts
that already existed a system of structured formal descriptions was introduced. All
descriptions had to start with a keyword. Depending on the keyword a table was used to
construct the remainder of the description. Formalising them in this way makes it easier
to spot a similar part, it is then necessary to investigate further to establish if the part is
identical. A fuller explanation together with a list of keywords and sample table is
included in Appendix C. The data gatherers were asked to use this system on all BOM's
they submitted. The technical clerks were asked to use this system on all BOM's they
wrote and especially for all part numbers recorded in the master parts catalogue.
The data gatherers were told if they did not have all the information required for a
particular keyword’s table they should find it. This is because without the full
description it could not be guaranteed that only one part number would be assigned for
a part in use in more than one place. Using the full descriptions would greatly reduce
the number of times the Technical Clerks had to contact them for further information.
This would increase the clerks' productivity and that was crucial for achieving the
deadlines that had been set.

The work of the technical clerks was examined and found to be poor. Little attention
had been paid to avoiding the assignation of duplicate numbers. They had not always
worked within the numbering system, giving parts numbers from the wrong coding
section. Work rate was slow and motivation was poor. Two of the clerks gave their
notice within two days of each other. The long standing clerk gave her notice in a week
later as she wished to return to her native India for an extended holiday. The final clerk
was dismissed having been seen sitting chatting or doing nothing once too often. A
draughtsman was also dismissed for poor time keeping, which was suspected of being
alcohol related. The project was in crisis.
The philosophy of employing young graduates as technical clerks had clearly failed. It
had been hoped they would be intelligent and quick to learn. They were found to be
slow to learn and not conscientious in the work they undertook. This was because they
were not motivated and could not be motivated. They were transient, as they were
always looking for work in their chosen field, and moving on.
It was decided to stop using the non-technical agency. To attempt to recruit technical
clerks who had experience of similar work and to pay as much as was necessary to get
the right people. It was also decided to pay more for draughtsmen to get top quality
people. At this stage it was also becoming necessary to increase the size of both teams.
Having so many people from one agency was thought to be a useful way of applying
pressure on the agency to supply the best people at reasonable cost. However cost
would not be a limiting issue. A series of meeting were held, senior managers met with
directors of the technical agency to explain the needs and the strategy.
3.5 Team Leaders
With so many temporary staff it was decided to also recruit working team leaders. The
first technical clerk team leader was recruited before all of the technical clerks left but
he was found to be less able than he claimed he would be, and was dismissed.
One replacement draughtsman, one additional draughtsman and a draughting team
leader were taken on. The agency loaned one CAD computer and the team leader

brought his own CAD computer into the office, for which he was paid a weekly fee.
The total drawing team now consisted of six people including the team leader.
Four technical clerks and a team leader were also taken on. The team leader played an
active part in the recruitment process. All eleven people were from the same technical
agency, the manager visited once every two weeks to ensure everyone was working
well.
Weekly meetings were started to monitor progress. These were chaired by the Group
Industrial Engineering Manager and involved the two team leaders, (who reported
directly to him) and the project engineer. Estimates were made for outstanding work,
these were adjusted weekly as work was finished and new data arrived. The pace of the
project started to pick up significantly, but the project was still behind schedule.
Although it was part of the team leaders brief to check the work of their team, they
were unable to do this, due to the pressure on them to co-ordinate the teams work and
increase output, by working as much as they could themselves. The permanent checker
continued to check drawings, but did not have enough time to check BOM's or routes,
or prepare data for issuing.
Meetings were held in the Sheffield factory to appraise the validation work going on
there. It was taking longer than expected and revealing more errors than expected. The
staff were having difficulty finding their way through the data and understanding the
structured nature of multi-level BOM's. It was felt that there were too many levels in
the BOM's. A need was established to produce an “is-was” list. This was to list all the
new part numbers and against each: the old part number, the drawing number, the
structured description, the part source (purchased or manufactured), the unit of
measure, the supplier and supplier’s part number if known. This list would assist the
transition to the new system in the factory, enable the re-labelling of stores locations,
etc.
The “is-was” list was seen as a crucial tool for implementation and hence a computer
with Microsoft Excel was made available, and a clerk was recruited to work for the
project engineer, producing the lists for the factories where the data had already been
processed by the technical clerks. This clerk’s job was to include photocopying

processed data and preparing it for issue. A specially fast photocopier capable of
punching ringbinder holes as it copied was hired for this purpose.
It was at about this time that the redundant work study engineers referred to in section
3.3 left the company.
The validated data from the Sheffield factory was returned to the Sheffield office and
some of the technical clerks and draughtsmen were assigned to correct it. This slowed
down the normal output of the team. Validation is dealt with in more detail in section
3.7. By the time this was complete the project was running so late it was decided that
the factory would not be run using the paper system. The data would be loaded onto the
computer and the factory would be the pilot for the computer system. The
implementation of the MIS is described in section 3.14. It was also decided that all
factories needed to move directly to the MIS, missing out the stage of using the paper
system, to bring the project closer to the required time scale objectives. As the data for
a number of other factories was ready for validation, the number of clerks preparing
“is-was” lists and preparing data for issue was increased from one to three. This took
the total Sheffield team strength to 16, including the two permanent members of staff. It
was calculated that the output of the technical clerks team required one and a half full
time equivalents to check their work. This was not possible with the manpower
available and the time scales demanded. It was also not possible to check the “is-was”
lists properly, or even the quality of the photocopying. It was possible to check all
drawings, however. The pace was frantic. Quality suffered due to the requirements of
time. The effect of this was to be felt later in the computer implementation.
A number of products for new contracts, or customer designed one off specials had to
be processed, where possible at the Swansea drawing office. There were also many
product transfers between factories, adding to the work necessary and causing
confusion in priorities. There were also, during this period, requests for changes to the
design or specification of some products. All these issues added to the work load and
caused committed time scale objectives to be missed.
3.6 Systems to Control Change

With so much data being re-created from first principles it was vitally important to
control change. This needed to be controlled for both old data and applied to new data.
The systems for controlling change that already existed within the company were
inadequate. Meetings were held and a system of Engineering Change Control was
created and incorporated into the Quality Procedures System. A discussion paper
produced by the author prior to the new system being introduced and a flow chart
produced as a training aid upon implementation are included in Appendix B.
At the start of the project changes were simply applied to the old data, so that it was
more correct when it was gathered and checked against production. When the data
gatherers collected data and checked it against production they found a number of
scenarios:
· The drawings and product data corresponded to the product.
· The drawings and product data had always been wrong and required
updating.
· Unauthorised changes had been made in production so that the
drawings and product data no longer corresponded to the product.
In the first scenario the old product data was passed on unaltered to the processing
team, with any additional data required. In the second scenario the existing data was
corrected in red, additional data provided, and the pack passed on to the processors. In
the third scenario there were two possible courses of action. If the change did not
increase the cost, invalidate any testing, contradict any contractual specification, or
change the aesthetics, it was marked onto the drawings and passed on as in scenario
two, however an engineering change request, (ECR), was also raised to approve the
change, in this case it would be a formality to get it authorised. If however, the criteria
outlined above were not met, the product data submitted to the processors was not
altered to match production. The factory staff were informed of the deviation and
requested to raise an ECR if they wanted to pursue the change. They were also told they
required a concession, from the quality department, if they wished to carry on making
the product not to the specification.
If an engineering change was raised and was approved the old data was amended by the
Swansea Drawing Office. Copies of the amended drawings and the engineering change

notice, (ECN), were sent to the processors in Sheffield to incorporate the changes when
they processed that product’s data.
When the gathering exercise started all changes could be fed back to the factory and
picked up by the gatherers. As it continued changes were more often spotted by the
gatherers and the amended data had to be passed on to the processors. There was a
significant time lag between collecting the data and implementing it, requiring the
amended old format data to be sent to the factory. The changed data always arrived at
Sheffield before the gathered data had been processed during this phase of the project.
As more and more factories had their data collected and processed data was completed
at Sheffield, awaiting preparation for issue, control became increasingly difficult. It
became necessary to process virtually all engineering changes at Sheffield. Once
drawings were issued to factories all engineering changes were processed at Sheffield
with no involvement at Swansea. This had the effect of slowing down the processing of
data at Sheffield and diluting the focus.
3.7 Validation
The validation process uncovered a number of failings from earlier in the project and
exposed weaknesses in its own process. It quickly became clear that the people who
collected the data were not always given the help and assistance that they needed from
the staff in the factories. This is partly because factory staff had to continue to fulfil
their own function and did not have the time to invest. There was also some
protectionism of data. It is an often used phrase that knowledge is power. In this case,
those with the data could foresee major changes with the introduction of the new
systems. The knowledge that they had accumulated over many years was to be
extracted and made available to all. This led to some resentment, as the hard work done
by them would no longer be a source of praise when they demonstrated their ability.
The erosion of the power based on the accumulated knowledge was also a factor, and in
extreme cases there was job insecurity. It was possible, when their knowledge had been
recorded, they would not be needed.
Although work study engineers are trained to spot misleading movements of operators
when conducting time studies and to be sensitive to the effects of change, their lack of
knowledge of the systems and procedures meant they did not always ask the right
questions. They did not always chase out a line of enquiry to get to the accurate
information. Some factory personnel were deliberately obstructive claiming no
knowledge, others would answer questions but only volunteer the information
requested, knowingly leaving out crucial information because the question was not
phrased correctly. Sometime people genuinely did not have the answers. There were
those people who did their best and assisted in every way possible too. The validation
exposed these problems when factory staff pointed out errors, some with glee.
3.8 Sheffield and Barnsley Validation
The other major cause of errors found during validation was due to the data processors
at Sheffield. Particularly the work undertaken by the young graduates. There was a lack
of thoroughness and care. Because there were insufficient resources for checking, this
only came to light during the validation at the factory, which was embarrassing. It was
noticeable that specific technical clerks’ work was a problem. It was also apparent that
the work of certain of the data gatherers caused errors too, even when processed by
good technical clerks. When a poor technical clerk processed the work of a poor data
gatherer the result was unusable data. Generally the work of the draughtsmen was
better. Although there were some problems in presentation, all drawings were checked
before issue and so any errors were normally due to inadequate information sent from
the factories. There were still a significant number of these and because drawings take
longer to produce than BOM's and routes the impact was significant from the first
factory.
As factories validated data it was sent back for correction to the data processors at
Sheffield. This then slowed down the output of new work, increasingly. This got to the
point where no new work was being processed at all.
When data had been amended at Sheffield it was sent back to the factory for a final
check. This should have been a formality but further problems where revealed. The
Sheffield factory was the first to have its data validated and although it took longer than
expected it went relatively smoothly. The only problem was that of too many levels in
the BOM structure which was addressed upon implementation, see section 3.14.
Barnsley was the next factory to be validated. The main product went smoothly but

some other products had been moved into the factory from the Hull factory after data
had been collected. The Hull data had been processed and sent to Barnsley. The method
of manufacture at Barnsley was significantly different to that at Hull. After the data had
moved between Sheffield and Barnsley several times, it was decided some people
would travel to Sheffield from Barnsley every day and work through all of the data with
the project engineer until everything was correct. This process worked.
3.9 Plymouth Validation
The next factory after Barnsley to be validated was Plymouth. By this time the work
study engineer who had gathered the data had been made redundant and had left the
company. It was already known that his work was of poor quality and significant time
had been invested in training with little effect. This engineer had been based in
Swansea. Because of the distance involved he had not visited Plymouth as often as
required to ensure clean data. The Plymouth factory make office furniture and the
engineer had some of this furniture in his office and used that as a source of
information. He failed to check if any changes had been made, and because this
furniture was about three years old, the data he sent was severely flawed. This was not
helped because several technical clerks had worked on the data due to the high labour
turnover whilst it was being processed. The file sent to Plymouth for validation was
therefore very inaccurate, so much so that it was necessary to gather the information
again rather than try to correct it, although this was not immediately apparent. An
industrial engineer was sent to Plymouth for several days a week over several weeks to
do this. The first attempt was a correction. This resulted in a new file being issued,
however it had almost as many faults as the first version. A rewrite of the file was
necessary. The engineer, after spending time with the quality technician in the factory
gathering the data, then spent time with a technical clerk whilst it was being processed.
When queries arose the engineer phoned the quality technician. It was during one of
these phone calls where the proof of a further problem was obtained. During a five
minute phone call three different answers to the same simple question were given by the
quality technician. The factory manager had volunteered this person for the data
validation on the pretext of him having the best product knowledge. It was clear his
product knowledge was weak. Tactics were changed and leading hands were phoned
with queries, being closer to everyday production more accurate answers were obtained.
The assignation of the wrong person was probably a genuine error by the factory
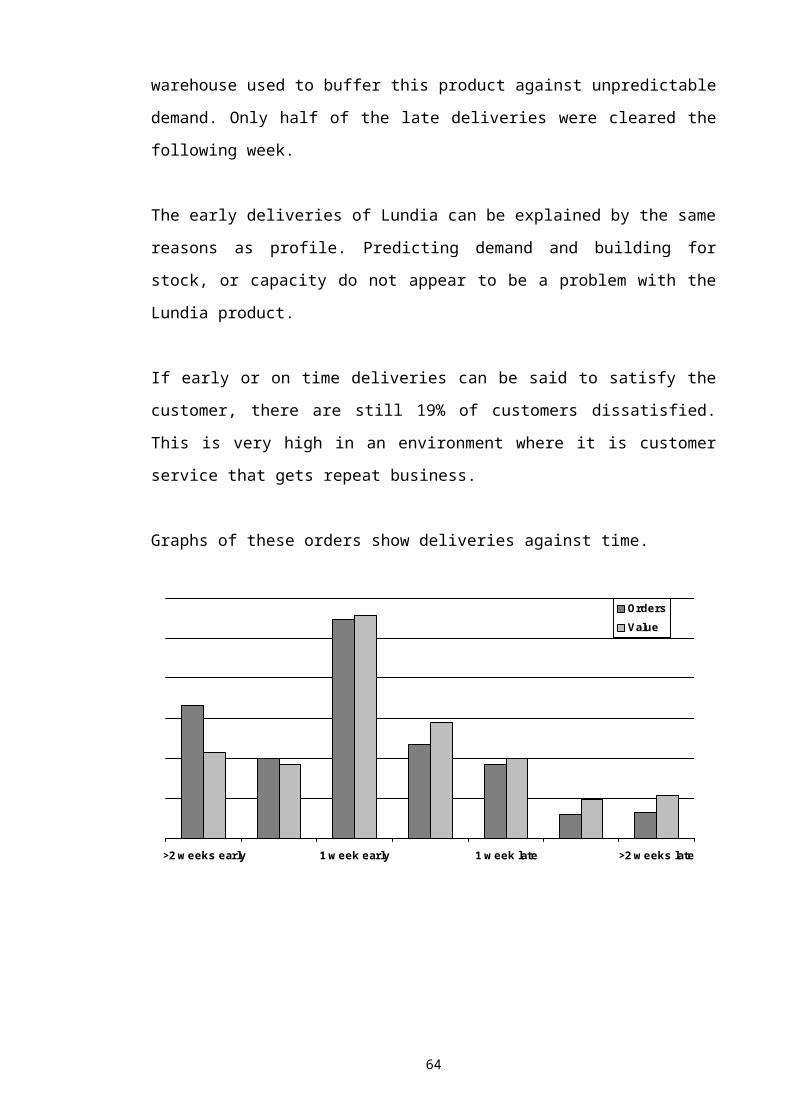
manager. However a suspicion of expediency is raised, was he assigned because he had
much more time available than the leading hands? If they had been assigned production
output of the factory would have been reduced, although the data would have become
accurate much more quickly. Similar problems were also experienced later in other
factories. It soon became clear there was no strength in depth, in any factory, of people
with product knowledge. Because of the informal way factories had been run in the
past, combined with little or no usable information about product specification, the way
a product was made often varied from batch to batch. This had conspired to make the
gatherers job difficult and was now causing problems with validation.
When the third version of the file for the Plymouth factory was ready for issue the
industrial engineer took it personally. His knowledge of the gathering, processing and
validation, gained during this period, meant he was able to rewrite BOM's and routes at
the factory, where there were still errors and his presence meant people could not
prevaricate about the data. He did not leave until the factory manager signed off the
data as being correct. He brought a copy of the data back to Sheffield to replace the
master file.
Every time the data was altered the “is-was” was updated, new parts were added and
duplicate parts removed. The Purchasing and Production Planning departments were
using this information to prepare the planning and ordering data required to go live on
the computer system. Because many parts were used in more than one product it was
necessary to change many BOM's. With a paper system it is not possible to look up
where an item is used. To assist this an extra column was added to the Plymouth, and
all future, “is-was” lists. This itemised the BOM an item is used on. This made the “is-
was” lists much longer and take much more time to produce. Each part could appear
many times on the list, but the benefit was to ensure families of BOM's were consistent.
There were problems with erroneous or missing old part numbers in the gathered data
that came to light when “is-was” lists were provided to Purchasing and Planning
departments. The “where-used” facility provided a method of tracing up the BOM
structure to find out on which product an item was used. This then enabled the old part
number to be traced in the factory. Purchasing and Planning insisted that this be a part
of all future “is-was” lists.
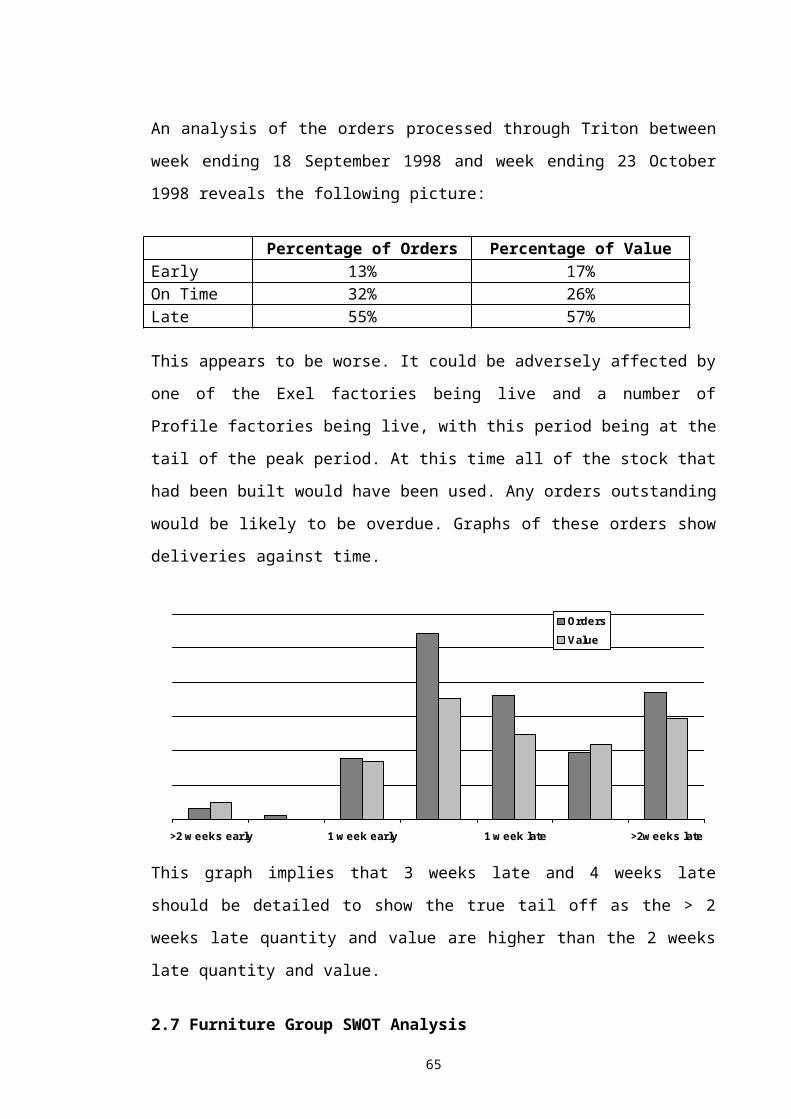
The number of alterations to the Plymouth “is-was” list proved difficult for Purchasing
and Planning to track and so a “date altered” column was added allowing the latest
changes to be obvious, and actioned.
3.10 Treforest Validation
Treforest was the next factory to have its processed data validated. The problems at
Plymouth were thought to be isolated and hence the same approach was adopted. The
person who gathered the data at the Treforest factory was thought to be one of the better
data gatherers. He had stayed in daily contact with the Project Engineer during his
period of gathering data. He had asked the most intelligent questions. Although he had
generally incorporated too many levels in the BOM structure, these had been reduced
by the technical clerks that processed his data. Treforest was the third factory he had
gathered data for. The clerks expressed pleasure in the presentation of his work, which
was clearer and neater than other data gatherers. The clerks who processed the Treforest
data were the newer ones working for the team leader. The product range at Treforest is
fairly simple. They make top panels for tables, upholstered seats and backs for chairs,
some items such as writing attachments for chairs and some pedestals hung from tables.
All of this pointed to an easy validation compared to the Plymouth factory.
Unfortunately this was not the case.
The validation of the table tops was relatively smooth. There were some disputes about
manufacturing allowances, and the types of tops not produced often had errors. There
were a few drawing inaccuracies but nothing significant. There were some problems
associated with the upholstery data. Examples of these include a formed ply back, no
one seemed to know if it was supplied as double size and cut into two or not, and an
inner and outer back ply, where it was uncertain if it was supplied as a set, or as
separate parts. In both these cases the information from purchasing contradicted that
from the factory and both seemed to change their mind regularly.
The validation of the BOM's, for the seats, backs, pedestals and the small volume items,
started to take on the format of the Plymouth validation, going back and forth between
the Sheffield office and the factory. This was happening on a product by product basis,
rather than the whole file as at Plymouth. By this time much of the data was loaded
onto the Triton computer system and it went live. The need to get the data correct was

then vital. This time it was decided that the person the factory manager had chosen to
do this validation, the deputy quality technician, would visit the Sheffield office and
work through the file with the technical clerks’ team leader until the file was validated.
This was completed over a three week period. A new file was sent to the manager
overseeing the Triton implementation. There were still problems found several weeks
later, particularly with the pedestals where the description of many parts on the BOM's
did not match the drawings for those part numbers. The project engineer, and others,
spent three weeks putting these and other errors right after the factory was live.
3.11 Validation at Other Factories
At the same time as Treforest was being validated a validation had happened at the
Neath and Merthyr factories and the data had been amended and started to be loaded
onto the Triton system. Because of the problems found at Treforest these validations
were not trusted. It was decided a new approach was needed. The outcome of this was
the final validation was incorporated into the Triton go live process. A multi-
disciplinary team was sent into the Neath factory, consisting of the project engineer, a
member of the Triton implementation team and a member of the Systems department.
The data was put into the computer. The old part number was put into a spare field to
assist validation. The BOM's were printed out and factory staff validated them. Queries
and problems were addressed as they arose, as a team. The “is-was” list was updated as
changes were made. Requests for part numbers were made to the technical clerks team
leader in the Sheffield office by the project engineer. As the validation changes were
identified the Triton system was changed. When all of the data was validated the
factory went live, see section 3.16. Prints of the validated BOM's were sent to the
Sheffield office to update the paper system, but this never happened due to time
pressures to get other factories validated. The paper system thus became out of date and
the Triton computer system became the master data. There was a need to revisit the
factory after it had gone live. This was mainly to resolve some systematic errors and
was fairly simple.
Other validations were going on in other factories at this time and were not stopped, but
the nature of the project was changing. Almost all of the data had been gathered and
processed. The team in Sheffield was reducing in size and had been concentrating on
validation. Now that validation was becoming integrated with the implementation of the
computer system it was time to wind up the temporary team. They were reduced to the
two team leaders and one other draughtsman. The last project they did was to assign
new numbers to a new office furniture product range being introduced. They finally left
in early October 1998. The cost of the temporary staff over the life of the project was
approximately £250 000.
3.12 Data Preparation Conclusion
There is no doubt that senior management’s expectations for the completion date of the
data gathering, processing and validation were totally unrealistic. When one of the first
meetings for the launch was held, on 13 May 1996, the expectation was that it could be
completed by November 1996. The project was declared finished in September 1998,
even though one product range (limited to the Brynamman factory) had not had its data
collected, and many drawings for the Newcastle and Worksop factories had never been
drawn. Much validation was still outstanding at this time but this task had been moved
into the next phase of Triton implementation.
It was known at this meeting that the list of standard products stood at 25 000 and that
there were some 12 000 purchased items. It was estimated that there would be 20 000
intermediate levels in the BOM's, and 6000 drawings to produce. Once the forms were
designed and the data started to arrive there were 18 weeks left to process it. Original
estimates were as follows:
· To write one single level BOM 20 minutes
· To write one route 25 minutes
· To draw one drawing 120 minutes
· To assign one part number 2 minutes
It would have required 65 people to complete this in the time scale expected. The
estimated number of “man weeks” was 1169. The period of the project was
approximately 120 weeks giving an average resource requirement, over the period,
based on this estimate, of just under 10 people. This was in fact close to the average.

The constant pressure of unrealistic time expectations by management led to poor
motivation and poor quality work due to rushing. Mistakes had the effect of increasing
time scales.
The quality of the resources available was a major contributor to the number of errors
made and time taken to get the data correct. All resources involved in the project
contributed to this problem, from the factory staff, through the data gatherers, to the
data processors. Help from other staff, e.g. purchasing and production planning, was
not readily forthcoming and not always accurate when received.
The number of people with expert knowledge were too few to manage the teams of
gatherers, processors and validators and to support factory staff. These teams were too
big, producing too much data at once to check.
Hindsight is always with 20-20 vision, but some of the problems above could have been
addressed. The approach has varied throughout from “as many factories at once”,
through “a few factories at a time” (in five distinct sets), to “one factory at a time” and
back again. One strategy would have been better. The strategy that would have used the
expert resources to their best advantage would have been one factory at a time. The data
should have not been created on paper only to have errors introduced when entered onto
the Triton system. A small team should have been based in one factory and worked
through that factory product by product. As soon as data was gathered it should have
been entered onto Triton and validated before moving on to the next product. When the
factory was finished the team should have moved onto the next factory. The team
should have been led by a project engineer and consisted of two draughtsmen, a
production planner, a work study engineer, and a data entry clerk. The planner would
validate all BOM's and stocking points, which would have eliminated the problem of
too many levels in some BOM's. The work study engineer would have created the
routes. The project engineer would have addressed any engineering issues, validated
drawings and provided leadership. Assigned part time to the project based in their own
offices would be a costing engineer, a buyer and a computer expert. The factory
managers in each factory should have been more involved earlier in the project.

There should have been a rule that no new product or product transfer should involve a
factory already live unless the team stopped the factory they were processing and
returned to the live factory to implement the product.
Although the initial pace of implementation would have been slower there would have
been a lot of re-work eliminated. The use of expensive temporary staff would have been
reduced. There was a two year time scale to gather, process and first cut validate the
data. Five factories that were live on Triton at the end of that time, more would have
been had this approach been adopted.
3.13 Implementation Strategy of the Management Information System
The software vendor has a key interest in a successful implementation. They have
experience in this field and hence offer consultancy as part of the purchase. They have a
tried and trusted implementation strategy that they strongly recommend is followed.
The philosophy is to train the trainers in the use of the package and to go through a
three phase implementation. These phases they call simulations, thus the
implementation advances through sim 1, sim 2 and sim 3 progressively.
Sim 1 is a phase where the consultants get to know the company, they pay several
visits, (in the case of the Furniture Group to several different factories) and learn the
business processes. They then construct a model of the company using the software.
This has some sample products in it. They use these to present to senior management
and the project team how the company would be run using the software. Whilst sim 1 is
underway the project team receive intensive training in the form of hands on use of the
system.
The next phase is sim 2. In this phase the project team take what they have learnt about
the software and build their own more extensive model of the company’s data. The
project team are selected to be a multi-disciplined team with a cross section of
expertise. They bring to this model less knowledge of the software than the consultants
but a more intimate knowledge of the company.
The final phase is sim 3. This is the phase where the live data is input and personnel are
trained ready to “go live”.

As part of sim 2 two members of the project team were assigned to prepare procedures'
manuals. To do this they mapped the business processes. They met key personnel and
department heads to discuss procedures and prepare flow charts to map the processes.
There were several problems with this process. Many managers had not been on any
training, and those that had received limited exposure to the system. This meant they
had little knowledge of its capabilities and limitations. Managers could not therefore
move the business processes forward based on the enhanced capability of the software.
A further drawback was that some of the managers had little or no experience of similar
software. This restricted their ability to assist in mapping how it would work in their
area. A number of managers were new to the company. The Furniture Group was a
relatively new group; many of the managers from the divisions that were brought
together to form the group had been moved into other jobs or left the company. This
meant that a significant number of key managers were not totally familiar with the
company’s procedures, products and philosophy. All of these factors meant some gaps
were left in the allocation of responsibilities.
3.14 Sheffield Factory Implementation
Sheffield was the first factory to be fully implemented. This was in November 1997.
This was a relatively smooth implementation, there being only two significant
problems. The first was that BOM’s did not match the organisation of the factory.
Sheffield makes one major product, a sorting system for the Post Office. It also makes
tables and other overflow products from other factories in times of peak demand. The
manufacturing of the single product has allowed a cellular layout with flow production.
Material has been issued in a Kanban style. Work is pulled through the cell to meet a
customer delivery schedule. The BOM's were not set up to mirror this process. There
were too many levels each requiring a production order to be raised. The paper system
did not have the ability to cope with flattened BOM's because it could not deal with
routings that had operations running parallel with each other. The Triton system can
cope with this, using operation overlaps. Work was done to turn the levels not required
to phantom parts, no works orders can be raised for them and they do not have a route
assigned. A drawing can still exist for them, however. The routings for these phantom
parts were moved up to the next non-phantom level. Overlaps were built into the
operations. Triton uses percentage overlaps, (rather than quantity or time overlaps).

This would create lead-times that are batch size sensitive. Because true times for
operations were not available dummy operations were added, all other operation times
were set at zero. The total of the two dummy operation times equalled the estimated
time. This allowed the cost roll up to give correct product costs. The individual dummy
operation times and their overlap were set to give the correct lead time, so that the
software was able to correctly phase the manufacture of components.
The other significant issue was the quantity of paint on the BOM's. This had been
estimated inaccurately, usually a large amount too much. This is an item that is
backflushed, i.e. it is not issued, instead when a completed product is booked into stores
the stock of the paint is automatically reduced by the quantity on the BOM. Because
there was too much paint on the BOM the physical stock was soon much more than the
computer stock. The computer then suggested ordering more paint, which was not
really required. This problem was not spotted straight away. When the Blackburn
factory tried to order some black paint from the supplier and was told the Sheffield
factory had taken all of their black paint it became apparent. Quantities on BOM's were
altered, and as time went on they were further fine tuned several times. This problem
also arose at other factories for paint, lacquers and other items where it is difficult to
measure the quantities used. Backflushing is a useful way of saving time, eliminating
keying issues for items of relatively low value. However, any item measured in a unit
other than each, (e.g. metres, kilograms, litres, etc.) can be difficult to establish the
usage and can suffer random wastage. It is necessary to conduct fine tuning of BOM's
and to use short cycle stock checks to keep stock accurate.
3.15 Barnsley, Plymouth and Treforest Factory Implementations
Barnsley was the next factory to go live and the effort to get the paper based
information correct was successful. The implementation went smoothly. The next
factory to go live was Plymouth. There had been considerable problems getting the
paper system correct, (see section 3.9), which caused the implementation to be delayed.
Once the implementation went ahead, however it was successful, except for quantities
of lacquer on BOM's causing the same backflushing problems as at Sheffield. At first
factory staff were adamant the quantities were correct, however comparing with
suppliers recommended coverage figures they were overstated by 430%. Factory staff

were finally convinced when the purchasing department showed them how much Triton
had suggested ordering.
At Plymouth the investment of getting the paper system correct worked but pressure
was now building to get factories live more quickly. The next factory scheduled to go
live was Treforest. This would be the first of the large factories. When Treforest went
live the paper system had just been reviewed by the technical clerks' team leader and
the factory’s deputy quality technician but the amendments had not been entered onto
the computer. A fully rewritten file was passed to the Triton project manager who did
not act upon it. After being live for several months the problems were building in the
factory. It was requested the paper systems project engineer conduct a review of the
BOM's. He found that if the changes in the re-written file were applied most of the
problems would be solved. This then happened. By this time the Neath factory had also
gone live. A problem was found in both factories. When an item, e.g. a tube was cut
from a 6.1M length no account had been taken on the BOM of the wastage. Similarly
when the core for a table top was cut from a 2440x1220mm sheet of chipboard the
same problem arose. Spread sheets were developed to calculate how many parts could
be cut from one length or sheet and define the quantity including wastage for each part.
The BOM's for all these types of parts at both factories were altered.
3.16 Neath Factory Implementation
The Neath implementation followed a different model. In other factories after the paper
data had been validated and amended it was often found still to be wrong; once it was
entered on to the computer system keying errors caused more inaccuracies. As the
validation had been completed it was decided to key this data unchecked. Once that had
been finished a team of people went to the factory. This included one member of the
Triton team, one member of the systems department (responsible for implementation
and the systems outside the computer) and the Project Engineer from the paper system
project (the author). Whilst in the factory the BOM's were printed from the computer,
checked by factory staff and corrected. The project engineer updated the is-was list and
liaised with the team leaders at Sheffield for the issuing of new part numbers and
drawing modifications required. The implementation was much quicker and more
successful. Correct prints from Triton were taken back to Sheffield to be fed into the
paper system, which was still recognised as the master data and the mechanism to
update computer data. Time and resource pressure meant this updating never happened.
A system for data correction after a factory was live was introduced. This was less
formal than the engineering change system and was meant only for error correction. A
form was to be used and a procedure set up to ensure all changes were made to all data,
and the originator was informed when this was complete. In the case of changes to
BOM's or routes the request was passed to the Sheffield processors. They would
validate the change and if proved correct would change the paper system. A copy of the
form plus the amended paper system BOM's and routes would then be sent to the Triton
team who would update the computer. New copies of the amended paper system
documents would also be sent to the factories concerned. As factories became live, the
volume of changes meant they were made directly on the Triton system and the paper
system did not become updated and became less accurate. This came to a point where
the files for the live factories were an archive of the data at a point in time and the
computer database was the master record. The files for the factories not yet live were
viewed as the input documents and the starting point only to create the master records
on the computer.
76

3.17 Strategy Changes and the Remaining Factory Implementations
The implementation strategy had altered several times whilst these factories had gone
live. This strategy had followed that of the paper system. Firstly there were going to be
5 sets of two, three or four factories at a time. Each factory’s live date would be only
one or two weeks offset from the next in its set. There would be bigger gaps between
sets. The reality was, each factory was taking as long as necessary to get live and when
it was, and the initial teething problems were resolved, work would start on the next
factory. The desired offsets were never achieved but the general sequence had been
followed. The main reason for this was that resources would have been stretched too
thinly to do anything else. Gradually the team of people who could take a factory live
was increasing as skills were disseminated. The Merthyr factory was the next in
sequence after Neath. The team went into Merthyr and started the process. It became
clear that it would not be possible to get Merthyr live before the summer (of 1998) peak
demand period and it was decided to leave the factory until the autumn. The Blackburn
factory made products for the same market and hence was in the same position. One
person was left full time validating the Blackburn BOM's and one person worked in the
factory part time putting validated BOM's correct on the Triton system. Thus the work
was kept ticking over in the background.
There was a change in responsibilities at this time, the Triton manager was asked to
support those factories that were already live. The systems manager would assume
responsibility for taking all of the non-live factories live. The author was transferred
from the Industrial Engineering department to work for the Systems Manager to bring
engineering expertise to the team taking the factories live. To try to speed up the
process of getting factories live a further person was brought in from the core Triton
team at corporate headquarters. She was assigned the Wrexham factory as the next in
the sequence. The systems manager was assigned the Swansea factory. Two project
teams were set up for each of the two factories. The proposal was that two factories at a
time could be prepared and taken live.
Swansea was chosen because there were particular problems of control that needed
addressing. The factory would be easier to control if they used the Triton system. It was
known that the quality of the paper system data was not as good or as ready as some
77
other factories. A person with good product knowledge was assigned from the contracts'
department to work with the author to get validated BOM's onto Triton.
Before the Wrexham factory could go live the project team manager was withdrawn by
corporate headquarters because she was needed to work on the preparation for the next
release of the Triton software, (to be called BAAN 4). The systems manager then had to
fill the gap, which meant he could not work on Swansea as well, however it was taking
time to get the BOM's at Swansea validated and onto Triton. This meant the time scale
to take Swansea live was not affected.
Two factors arose by September 1998 that put pressure for much faster implementation
of the remaining factories. The first was that it was planned to switch to the new release
of software at Christmas 1998. This would be across all groups and would be easier if
all factories were live. The second was more significant. It was found that the software
which Triton was replacing and enhancing was not year 2000 compliant. Because some
of the programs worked on future dates it was necessary to change from this software
significantly before the date change. A target of the end of November 1998 was set to
get all factories live. If necessary this would be with flat BOM's (i.e. only top level and
purchased item part numbers), or with no BOM's (just part numbers). The latter would
mean no computerised planning would be possible, however this would be the same as
the current system being replaced. The advantage would be all support departments
would be operating one system instead of two, (e.g. purchasing, ledgers) reducing their
work load. This new target soon became unobtainable because of the support required
to keep live factories functioning. The Swansea and Wrexham factories went live and
were followed by the Blackburn factory in November 1998. At the beginning of 1999
work resumed on the Merthyr factory which went live in early March.
Another meeting took place to determine the close down date of the MAS-M system in
mid-February. The cost of keeping this system operational and supporting so few
factories was a significant factor. Another target date of 31 March 1999 was set. By this
time there was more expertise available to prepare factories. The author was assigned to
Worksop, a small factory, from mid-February, to do everything but training. The IT
manager was given the same role at Brynamman, a factory of similar size. A manager
from the Healthcare group was assigned with the Planning Manager, (a former Triton
team member) to implement the much larger factory at Newcastle, and its small satellite
78
at Jarrow. Their brief, however was only to get all parts input, without bills of materials
or routings. These would be created in April 1999.
3.18 Data Processing During Implementation
The central team set up to implement the software took on the role of data entry during
the implementation. Where necessary they supplemented their number by the use of
temporary staff. The data was provided on paper. This was in the form of BOM's and
routes from engineering and item master sheets, (containing ordering, planning and
purchasing information) from the materials department, (Purchasing and Planning
functions). The materials department obtained the new and old part numbers from the
“is-was” list to determine the parameters to set for the part.
The use of a central team had the advantage of concentrating and building knowledge in
one geographical place, with one set of people. It allowed effective control over all data
input to the system. There were several disadvantages to this approach. The
departmental personnel who provide the information have no control over its input and
any errors made at that stage, there is therefore less ownership of the data than there
would be. The build up of knowledge and training is in an elite team, most of which
will not go back to the departments they came from. They do not represent all of the
departments that will own the data, and indeed none are from the key departments for
such a system, with one exception. There appears to be no strategy for a change over
from the central team to the departments and no time scale. The central team was
unwilling to let the data input function be spread and are mistrusting of the abilities of
anyone outside their team. This will require careful change management.
3.19 Data Security and Ownership
The Triton system is menu driven. Menu choices lead to further menus and eventually
to what are called sessions. A session may be a screen display, (with single, multiple, or
scrolling screens), or a data input screen, (creating new data or amending existing data),
or a report session where parameters are entered into a screen to generate a report,
(which can be seen on the screen or printed on any printer attached to the system). The
method of achieving data security is to give each person a unique log in identity
protected by their own personal password. Once logged in the menu options available to
79
them have been tailored to only allow access to the data they need to update, create or
view. Every user will have some data that they cannot view and some they can view but
not amend or create. Most users will also be able to create and amend some types of
data.
Because the way Triton is structured may not reflect the organisational structure, a
session may allow access to change some data that a person in a particular department
would normally do, but also allow access to change other data that is normally the
responsibility of another department. Most sessions will allow field by field access to be
set up for these sessions so that the access and hence ownership of the data can be
preserved. Because the central team inputting the data during the implementation have
access to all parts of the system, there have been problems when new people have
joined the team. People have denied responsibility for errors citing others access as the
reason.
The sessions where field by field access is not available and where the accountability
for the data contained in these sessions crosses current organisational boundaries is one
of the challenges to be solved, (see chapter 6).
The most important session that falls into this category is that of the item master record.
This is the master record where the part number and description are created. This is a
five page screen containing engineering, costing, planning, purchasing, selling, ordering
and manufacturing information. Many of the fields are mandatory requiring input
before the record is allowed to be written away to the file. No one department will have
all of this information. Giving access to one department with others providing
information in writing or orally is inefficient and those other departments lose
ownership, and thus will not allow themselves to be held responsible. Giving access to
more than one department will also dissipate ownership and allow the excuse that
someone from another department changed a departments' data, accidentally or
purposefully.
80

3.20 Business Process Ownership
As described earlier, part of the early stages of the implementation process included the
mapping of some business processes. In the later stages these process maps were
redrawn to show the relationship with the organisation. This was completed for
processes within one factory, Swansea, but included some processes that happen in the
group’s central departments too. One member of the Triton implementation team
interviewed members of each department involved and using his knowledge of the
software, was able to map these business processes as they would happen using the
software. Fourteen process maps were produced covering all of the processes from
quotation to installation of office furniture. Information from these maps is reproduced
in appendix G, to show two key business processes. Typically processes cross between
two and five departmental boundaries.
Although these maps have been produced, responsibility for each task within the
process still lies within the functionally based department performing it. No one
manager owns a whole process. The customers of tasks within processes are not able to
influence their suppliers, as they would if they were in the same department.
Departments can blame others if the process fails.
A process improvement team has been set up. An outside consultant has been brought
in to advise the team. This team is looking at individual business processes and ways to
improve them by eliminating waste. A holistic approach is required because all
processes are interdependent, reviewing the whole business may lead to process
boundaries being moved. Improving business processes is good practice and
demonstrates a commitment to continuous improvement philosophies. It is critical that
ownership of processes is assigned to an individual who will co-ordinate and be
accountable for it, (see also Chapter 6).
3.21 Conclusions
Much can be deduced and learned from the difficulties encountered in this project.
Plans were drawn up, but because they presented a picture so far away from senior
management’s expectations, they were never formally adopted. The whole project was
driven by top down expectation rather than bottom up planning. The project managers
81

were continually reacting to problems. They were never in a position to proactively
manage the project. Because expectations were unreasonable the milestones that were
set were arbitrary and meaningless. Milestones were constantly being missed, with
consequential re-planning. The reasons for this were twofold. It was difficult to
estimate time scales for the vast amount of work that needed to be completed, because it
was difficult to establish the extent of this work. The second reason was that the poor
quality of the resources caused large amounts of rework, which seriously delayed the
project. Much work time should have been invested in the planning stage, so that a plan
could have been developed with realistic time scales.
Time scale planning is only one factor of project management. Resource allocation is
another major factor. Careful consideration of resource requirements, including a skills'
analysis in the planning phase would have revealed that the project was endangered by
a skill shortage. This would have probably resulted in a different strategy being adopted
and a more careful allocation of resources. Some resources used on the project would
not have been used. A skill audit would have taken time and delayed the start of the
project. The temporary resources taken on were restricted by market conditions. If there
had been less time pressure some resources would have not been used. A more patient
approach would have led to a slower build up of more appropriate resources. Skill was
the biggest constraint upon all phases of the project.
An analysis of the critical success factors for this project was never undertaken. Had
they been the focus could have been different. The main objective of the project was to
prepare data and then input it onto to Triton so that Triton could be used as an
integrated planning and control system. The terms of reference included times not being
added to routes. This meant the capacity planning part of the system could not be used.
Under these circumstances the routes are not critical to the success of the project.
Drawings too, would not be critical as they do not relate to the planning and control
system. Routes and drawings were included in the project because of other problems
related to quality assurance. These could have been left to later providing a much more
focused approach to the creation of bills of material. It was not strictly necessary to
introduce a new part numbering system. Because each part number has a prefix
denoting the factory it is used in existing numbers could have been used. Numbers in
different factories must be different to prevent the system allocating stock in one
factory for use in another factory, perhaps many miles away. Provided duplicated part
82
numbers do not exist within a factory any numbering system would work. Using
existing numbers would have sped up data creation considerably. In some cases the bills
of material prepared by the better data gatherers would have need no further work.
The structure of the bills of material was felt to be important. Data gatherers and clerks
were told they must reflect the manufacturing process. The net effect of their actions
however was that they added too many levels only to have them taken out (by removal
or being made phantoms) when the data was validated on Triton. It would have been
better to have used flat structures, i.e. only two levels, the product with the purchased
parts below it. Additional levels could have been added where necessary during the
Triton validation.
If only flat bills of materials were created using existing part numbers, the time scale
would have been drastically reduced. This focused approach would have enabled the
benefits of Triton to have been achieved earlier. New part numbers could have been
introduced in a rolling program. Routes could have been created after implementation,
based on the bills of material, to aid production. Finally drawings could have been
produced to cure the product quality and consistency problems. They too would have
been based on the bills of material, reducing the quantity required.
Failure of the project was never an option. However, many people within the
organisation see at least the paper part of the project to have been a failure. This is
partly due to the amount of rework required after the paper based data was input to the
computer. The final outcome is a computer system that is working in most factories
with very few errors in bills of materials, reasonable routes and usable drawings.
83
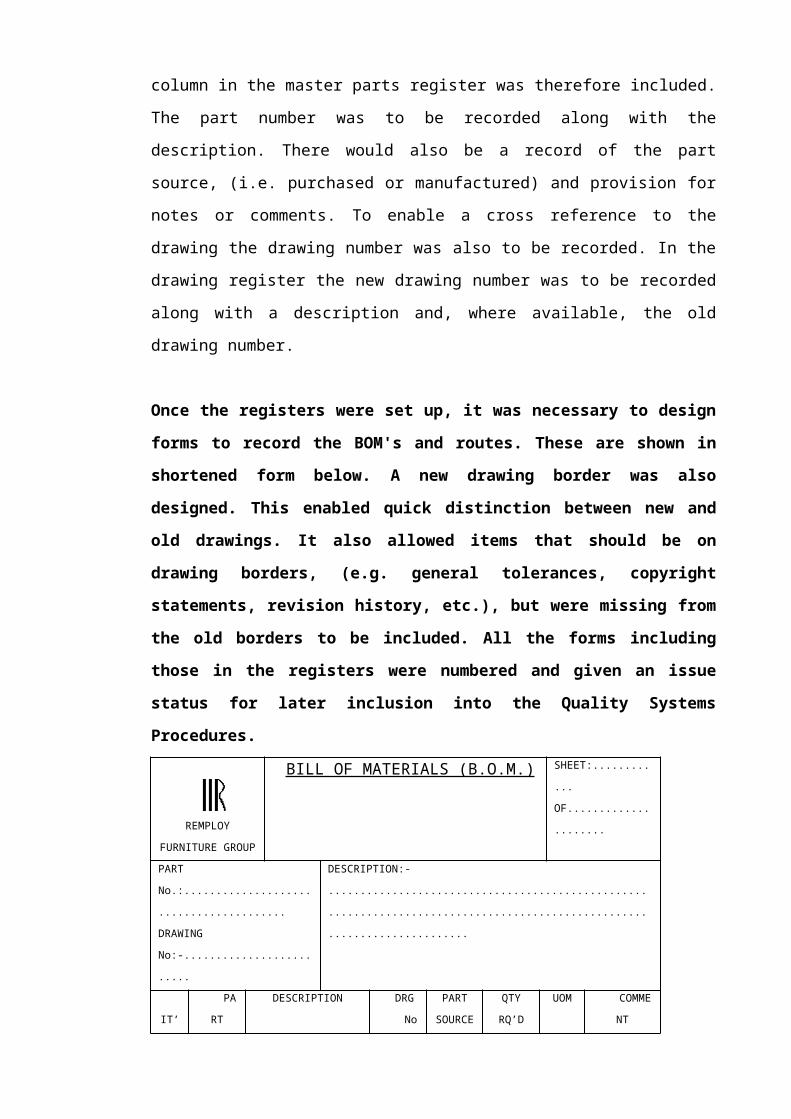
3.22 Summary
A summary of this review of the preparation and implementation of the integrated
computer system is presented below.
· The position inherited, i.e. poor quality information, would not have been
encountered in a commercial operation. Previous managements had been guilty of
a lack of investment. This led to a breakdown in product and process control.
· Present management seriously under estimated the situation and the amount of work
to correct it. They also under estimated the volume of data that would exist and
the time scale required to gather, cleanse and create it.
· The quality of personnel was crucial to all stages of the preparation and
implementation. It was not good enough in all stages. This included factory
personnel, data gatherers, data processors, validators, and data entry to the
computer. This problem seriously impacted time scales.
· The management of the project was made more difficult by trying to do too much at
once and too quickly. There was not enough strength in depth of the specialised
management and technical skills required to manage a project of this magnitude at
this pace.
· With hindsight the project should have been run at a slower pace using only those
staff with the specialised skills available. The project would have finished in a
similar time scale without all the re-work that was necessary, and the frustrations
that were caused by this.
84

Chapter 4. Survey of Organisational Expectations
This chapter describes a survey undertaken to establish what influence managers
expected the implementation of Triton to have for a number of organisational issues.
The survey itself is included in appendix D. The chapter covers the format of the survey
and the approach taken by it. The chapter then goes on to collate and present the results.
The results are then analysed. Possible drivers for the answers given are discussed,
including where answers to different questions appear to conflict. Finally the chapter
considers the implications of the attitudes for changes that could be made.
4.1 Survey Format and Approach
The survey was deliberately designed in a multiple choice format. Thirty-six questions
were chosen to cover all aspects of the potential organisational changes. It was
important to keep the format short enough to encourage recipients to complete it but be
long enough to be thorough. It was also important to give the impression to the
recipients that it was thorough, professional and serious. It was expected that recipients
would take about 15 minutes to complete the survey. The multiple choice answers were
usually a choice from 4 options to prevent respondents simply opting for the middle
ground. They were phrased to exclude the no change option in most cases, however
some respondents wrote that option in and used it. The analysis that follows respects
that opinion by assuming both options either side of the middle position were answered
by that particular respondent giving a neutral effect.
The survey was divided into four sections. The first three sections repeated some
questions for the company as a whole, then for the Furniture Group, and finally for an
individual factory. The fourth section applies to the Furniture Group. The questions in
the first three sections try to establish what respondents' feel are the drivers for
organisational change, and how they perceive the way the organisation changes. This
provides a reference point for analysis. The questions are also asked will the
introduction of Triton lead to change, and will it facilitate change.
The fourth section is presented as a continuous series of 25 questions. However, the
questions cover a 8 key subjects.
85

These subjects are:
· The decision making process
· The organisational structure
· Task distribution
· Team working
· Procedures and formality
· Job design and content
· Problem solving
· Communications systems
These topics encompass the formative elements of the design of an organisation, see
chapter 5. The questions concerning job content are phrased to incorporate the
motivational factors, drawn from a model for job characteristics described in Torrington
and Hall (Torrington D and Hall L, 1991). This model is reproduced below. It suggests
“core job dimensions” lead to “critical psychological states”, these in turn lead to
“personal and work outcomes”.
CORE JOB DIMENSIONS
CRITICAL PSYCHOLOGICAL
STATES
PERSONAL AND WORK OUTCOMES
High internal work Skill Variety Experienced motivationTask Identity meaningfulnessTask Significance of the work High quality work
performance
AutonomyExperienced
responsibility for the outcomes of the work
High satisfaction with the work
Feedback Knowledge of the actual results of the work
activities
Low absenteeism and turnover
Employee growthneed strength
4.2 Collation and Presentation of Results
86

The potential drivers of organisational change were listed for three levels within the
company and respondents asked to rank them. The results are presented in the following
table:
Rank Corporate Level Furniture Group
Level
Factory Level
1 Customers Customers Financial constraints
2 Increased financial
efficiency
Increased financial
efficiency
Manpower skills
available
3 Financial constraints Financial constraints Increased financial
efficiency
4 Political/Government
requirements
Manpower skills
available
Customers
5 Manpower skills
available
Advancing product and
process technology
Information
Technology advances
6 Advancing product and
process technology
Pressure from
competitors
Advancing product and
process technology
7 Pressure from
competitors
Information
Technology advances
Pressure from
competitors
8 Information
Technology advances
Political/Government
requirements
Society’s expectations
9 Society’s expectations Society’s expectations
87

The speed that the organisation reacts to these drivers is shown in the following table:
Speed Corporate Level Furniture Group
Level
Factory Level
Dynamic 0% 20% 7%
Fluid 7% 7% 7%
Organic 13% 27% 14%
Evolutionary 80% 46% 72%
Dynamic organisations act to cause opportunities for change, fluid organisations predict
changes and react as they occur, organic organisations follow changes closely, and
evolutionary organisations follow external changes only slowly.
The graphs below indicate the respondents opinions about whether the introduction of
Triton will enable organisational changes and whether its introduction will cause
changes at the group and factory level.
Will the Introduction of Triton Enable Organisational Change
MuchMore
Difficult
SomewhatMore
Difficult
SomewhatEasier
MuchEasier
Corporate
Group
Factory
88

Will the Introduction of Triton Cause Organisational Change
Significant Some Minor None
Group
Factory
The graph below shows the relationship between the numbers of managers, service
departments, levels in the hierarchy and spans of control. The respondents were asked
to predict the effect of introducing Triton on these factors.
The Effect of Introducing Triton on the Dimensions of the Structure
Many Less A Few Less A Few More Many More
ManagersLevelsService DeptsPeople for Each Manager
89
Triton could influence or enable a change of structural type, from a bureaucratic style to
a matrix style using multi-disciplined teams. Respondents were asked to assess to what
degree these changes might be expected. Their opinions are shown below.
Effect on Multi-Disciplinary Teams and Matrix Links
SignificantlyLess
Less More SignificantlyMore
Matrix Links
Multi-Skilled Teams
There is the possibility that Triton will influence the way tasks are distributed between
people and across departmental boundaries. It could also have an effect on the
distribution of tasks between the factories and the central group departments. The
respondents were asked to assess this influence.
Task Movement Within & Between Departments
Many Few None
Within Departments
Between Departments
90

Task Movement Relationships Between Departments and Factories
No Tasks Move Between Factories and Departments
Few From Factories to Departments
Few From Departments to Factories
Many From Factories to Departments
Many From Departments to Factories
Triton will have an influence on the design of jobs and the ways in which jobs are done.
It will therefore influence procedures. Respondents were asked to evaluate the degree of
change.
Effect on Procedures and Job Design
NoChange
MinorChange
SomeChange
SignificantChange
Procedures
Job Design
91

The introduction of Triton is expected to influence the formality with which people
must work. It will also effect the amount of supervision required. Respondents were
asked to assess these factors. The answers will depend on individual perceptions about
the current levels of formality and supervision, which will vary across the company.
The Effect on Formality and Supervision
Much less A Little Less A Little More Much More
Formality
Supervision
The following graph assesses the respondents' expectations in terms of changes to job
satisfaction following on from the introduction of Triton. A stacked bar graph has been
used as each factor improves motivation if enhanced.
Job Enrichment Effect
Much Less A Little Less A Little More Much More
Feedback
Autonomy
Task Importance
Task Variety
Skill Variety
92
The introduction of Triton is expected to influence the methods of communication.
Because Triton is an integrated system some communication should be totally within
the system reducing the need for reports and meetings. The respondents were asked to
evaluate the effect of Triton on these factors. Their responses are shown in the graph
below.
Effect on Communication
Many Less A Few Less A Few More Many More
Ad-hoc ReportsStandard ReportsAd-hoc MeetingsStandard Meetings
The introduction of computer systems is normally expected to influence where
decisions are made, that is are they made centrally or are they devolved. The
respondents were asked to assess what effect they expected from the implementation of
Triton.
Decision Making
Much MoreDevolved
MarginallyMore
Devolved
MarginallyMore
Centralised
Much MoreCentralised
93
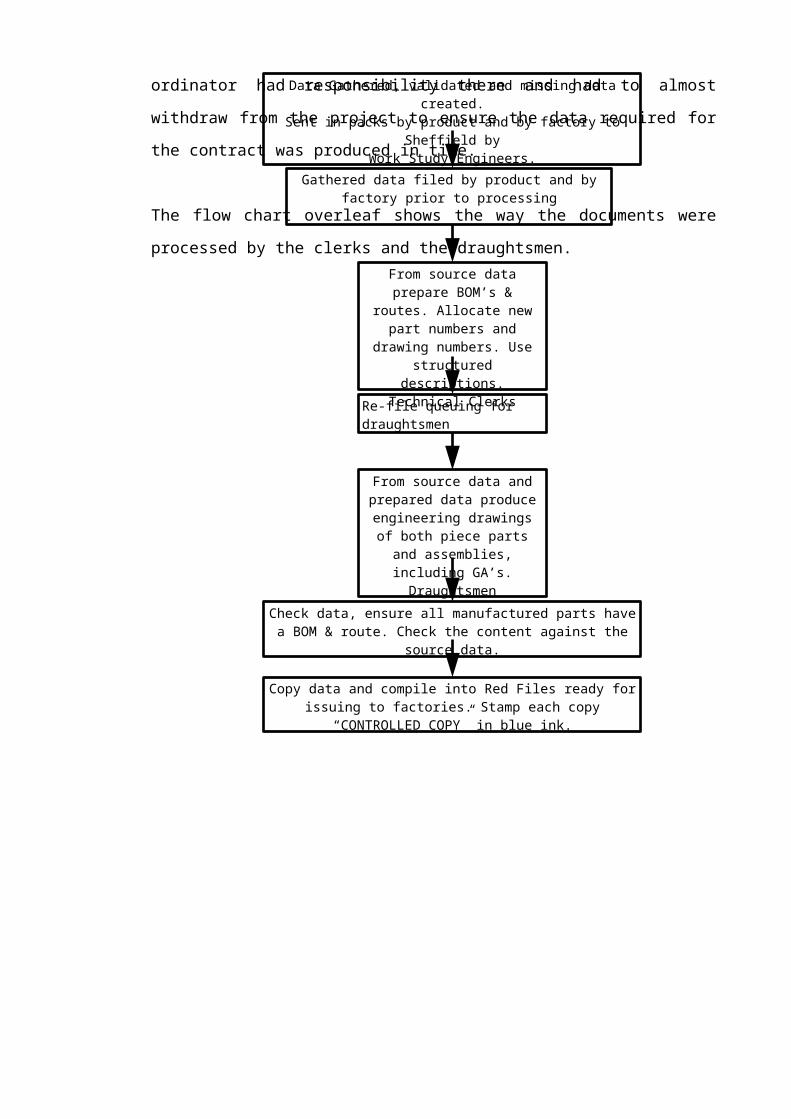
Triton is expected to have an effect upon problem solving by quickly providing
information to assist decision making. The degree of change was inquired from
respondents. The results are shown below:
Effect of Triton in Problem Solving
Much Less A Little Less A Little More Much More
Ability to ReactQuickly
Ability to InnovateSolutions
4.3 Analysis of Results
The ranking of the drivers of organisational change shows similar importance given
irrespective of the place in the hierarchy being considered. It is logical that
governmental influence will be higher at the corporate level than the group level. This
was not made an option at the factory level as it was felt to be too far removed. In a
normal company increased financial efficiency would be increased profit. This along
with control of costs are only exceeded in importance by the need to serve customers.
At the factory level the rating associated with the work-force skills available suggests
this is a constraint on the business at this level. This is rated equally with controlling
costs. This suggests the organisation is shaped by the need to deal with constraints
rather than exploiting opportunities. At the factory level the influence of customers is
ranked equally with that of information technology. It is felt that the closer to the
production process, the more the influence of IT.
The opinion on the speed of organisational change in response to changes in the
operating environment is weighted toward the slow side at all levels of the organisation.
94
The group seems to be seen as the area that changes more speedily than the rest,
however this is where there is the widest level of disagreement. The reason some
managers rate this more highly could be because there has been an increasing amount of
organisational change at the group level, which seems set to continue.
When asked if the introduction of Triton will enable organisational change, the clear
majority think it will make changes somewhat easier. Because no middle point is
offered as an option, there is the possibility that the opinion of the majority was that it
would not make a difference. The likelihood is that the effect will be marginal. This is
not the case when managers were asked if the introduction of Triton was likely to cause
organisational change. Because it was felt that Triton would not have an effect at the
corporate level, this option was excluded. The opinion was clearly that there would be
change as a result of implementing Triton. This could be as it enables beneficial
changes, that could not be made with previous systems, rather than it causing changes.
When assessing the effect on the dimensions of structure, the trend in answers is toward
the mid point. This could imply an expectation of little or no change. There is a marked
difference in the different aspects, however. Fewer managers and levels in the structure,
but more service departments and more people reporting to each manager are expected.
If the number of managers is reduced, it follows that there will either be fewer
departments, fewer levels or both. In view of the expectation of more service
departments, then the number of levels must be the driver to reduce the number of
managers. The distribution of opinion about the number of people reporting to each
manager almost follows the normal curve. If there are fewer managers, then naturally
more people will report to each, unless the expectation is to reduce the total head count.
Overall a wider flatter structure seems to be expected.
The structure may change in other ways. There may be an effect on multi-disciplinary
team working and an effect on the number of matrix links in the structure. The
expectation is that there will be more of both. Triton will be an enabler rather than a
cause of the expected change.
The questions about the expectation of tasks moving gave the opportunity for
respondents to express the opinion that there would be no change. The majority opinion
did expect tasks to move between people within departments, between departments and
95

from central departments to factories. This ties in with an expectation of more service
departments, but also shows an expectation of the devolving of tasks from service
departments to factories. Moving tasks will have the effect of changing the content of
jobs.
The effect on the content of jobs is further explored by more detailed questions. The
majority of respondents envisaged a significant change in job design with a
commensurate change in procedures. The expected effect on job satisfaction was also
investigated against the model described in section 4.1. Overall the expectation clearly
shows enhanced job satisfaction. Closer examination reveals a danger area. The skill
variety, task identity and task significance all show an expected significant increase.
According to the model these will lead to the employees feeling that the work is more
meaningful. The expectation is also that there will be more feedback. This means
people will have knowledge of the results of their endeavours. They can then modify
their actions to be successful. The one area where the expectation is a movement that
would decrease job satisfaction is autonomy. There is a definite expectation that there
will be less autonomy. According to the model this will mean employees will feel less
responsibility for the outcomes of their work. It is important to bear this in mind when
tasks are moved and jobs designed. A deliberate policy building in autonomy needs to
be followed.
Two further questions show some reasons for the expected loss in autonomy. There is
clear expectation of a requirement to work in a more formal way and a marginal
requirement for more supervision. At present in the Furniture Group some areas of
work are informal. A job may be completed in a different way each time it is done,
sometimes this yields the same output, but sometimes the output will vary slightly. An
example of this may be when products are made from alternative sizes of raw materials.
This could lead to a cost variance, and this is not always recorded against the job or
formally authorised. In the past the design of products has been fairly fluid. The
introduction of a newly formed Quality Department, with quality procedures, and
Engineering Department with Engineering Change Control Procedures, within the last
three years has started to formalise working practices. The feeling within these
departments is that they are making slow progress because of the high level of
informality that was inherited.
96

An integrated management information system should have some effect on
communications systems. Four questions were posed, about standard and ad-hoc reports
and meetings. Opinion was very divided, with no clear trend, except that there would be
more standard reports. A computer system offers the facility of more reports, both ad-
hoc and standard, but it is the needs of the business that will determine which are run
and used. There is the conundrum of the original vision of the paperless office, versus
the experience of computers' generating more paper than existed before. Again it is the
business needs that influence the number of meetings. During implementation ad-hoc
meetings are likely to rise and then fall away when the system stabilises. This may
explain the breadth of opinion. Standard meetings achieve more than data interchange.
They are often the forum for decisions. These decisions are more effective as all
attendees are more likely to buy into them. The expectation appears to be for no change
in the number of standard meetings. It could be that attendees are better informed, with
more accurate and up to date information, as a result of the implementation of Triton,
leading to better and more timely decisions.
The expectation is that decision making will become much more centralised. Triton
could enable more centralised decision making by gathering information from dispersed
sources and collated and presented centrally. In a similar way this information could be
dispersed and decision making be devolved. The expectation of more centralised
decisions could be dependant on the management style, which lends itself to centralised
decision making, (see chapter 5).
Decisions are often taken in an attempt to resolve problems. Better, more timely
information should allow problems to be resolved quicker and better. When asked if
Triton would enable a quicker reaction to problems, and an enhanced ability to innovate
solutions to problems, the results were divided. Expectations vary considerably and
probably result in an average of no overall change. The expectations could be based on
the respondents' opinion about the current ability to solve problems.
97
4.4 Implications for Change
Management theory says that a business should be re-engineered first. Once that is
completed, it is possible to apply information technology to take advantage of
streamlined business processes, (see chapter 7 and chapter 8). In practice the reverse is
true, the IT has been implemented before any processes or the organisational design
have been re-engineered. This survey shows where change is expected and where it is
not. Therefore it shows what can be done and where there will be resistance to change.
Overall there is the expectation of organisational change as a result of introducing
Triton. Reading the survey has probably focused managers' attention on this aspect of
the implementation. Those that considered the survey and completed it will have a
picture in their minds of the changes they expect, either because Triton forces or
enables change.
An expectation of change and a knowledge of the likely types of change is a powerful
agent to enable change. Resistance to change is often born of fear of the unknown. It
appears managers therefore will not be resistant to change for this reason. Managers
will still be resistant if they see a threat to their job, their power, or their status. This is
likely to affect individual managers rather than the whole management team.
No formal assessment has been made of the expectations of non-management
employees. The high rating amongst managers for a dynamic rate of change at the
group level is reflected in anecdotal evidence from employees, who expect change at an
increasing rate. They tend to see change as something that is done to them, over which
they have no influence, and consequently take a resigned attitude, that is sometimes also
cynical.
4.5 Summary
· Change is expected.· Change is expected to be easier to introduce. · Tasks are expected to move between people and departments, changing job designs.· A flatter wider structure is expected, with more multi-skilled teams.· More formal ways of working are expected to be needed.· Decision making is expected to be more centralised.
98

Chapter 5. Analysis of the Current Organisation and its Effectiveness
This chapter seeks to analyse the organisation of the Furniture Group. It also reviews
the organisation of Remploy at the corporate level and the way that impinges on the
Group. Three aspects are examined, the type of organisational structure, both formal
and informal, the culture within the organisation, and the management style. The
organisation is then investigated using some measures of organisational design. The
chapter then goes on to review the organisational effectiveness of the Furniture Group
using two approaches. The first is from a Total Quality Management point of view. The
second is from the perspective of forming partnerships between all the people within
the organisation. Both approaches use a self assessment framework to establish the
present position and determine a path of improvement, culminating in best practice.
5.1 A Definition of Structure, Culture and Management Style
To conduct an analysis it is necessary to have a framework for comparison. The
frameworks for the three areas of analysis are drawn from Charles Handy’s book
Understanding Organisations, (Handy C,1993). There is an interdependence between
culture and structure with four types that can be distinguished.
Bureaucracy is the first type of structure. It is an impersonal and rational system
characterised by a number of factors:
· The specialisation of roles, (demonstrated by functional
departments).
· The formalisation of discretion, rules, procedures, and control
activities.
· A clear hierarchy.
· Stable rules that are clearly defined.
· Officials are appointed on the basis of expertise, including
management expertise.
· There is career tenure, (as opposed to job tenure).
· There is equality of treatment.
99
The culture associated with bureaucratic structures is called role culture. The
procedures and rules describe the role to be played by each person in the hierarchy. The
limits of their discretion and authority are clearly defined. There is usually a job
description for each position. People are recruited or promoted into roles based on their
ability and expertise to fulfil the duties of that role.
Structures and cultures of this nature tend to be slow moving. They do not react quickly
to change. Power is based upon position, which means that decisions are referred to
defined levels in the hierarchy rather than being made where the best knowledge
resides. Work is clearly and carefully allocated. Tasks are not readily moved to where
resources are available. People feel secure in these systems, where career paths tend to
be clearly defined, and rewards and sanctions are universally and impersonally applied.
The second type of structure is the matrix structure. This has been developed to try to
overcome the weaknesses of the bureaucratic structure. In the matrix structure the
traditional bureaucratic hierarchy exists but it is overlaid with a horizontal structure.
The vertical hierarchy is still normally organised around functional groups and is the
dominant structure. The horizontal structure is based around projects or product groups,
or more recently processes, and features multi-disciplinary teams. The characteristics of
a matrix structure include:
· Decision making is sped up and is multi-disciplined.
· Staff can be utilised more efficiently.
· There is a loss of the unity of command that can result in conflict.
· There can be a duplication of problem solving, which is inefficient.
· If people are members of several horizontal project teams there can
be conflicts of priorities. If some duties are purely functional this
can also arise.
· Demand for the best skilled people for project teams is high, and for
the least skilled it is low.
100

The culture associated with matrix structures is called task culture. The culture copes
well with change. The features of task culture include:
· A project based system of work.
· A concentration on the product, project or process.
· The flexible use of people.
· The presence of team identities and team loyalty.
· Very fast reactions to changing circumstances.
· Decisions are delegated to the lowest levels where the knowledge
resides.
· Power is based upon knowledge.
· Dual control and management.
· Low levels of differentiation for status.
· Judgement by results.
· High levels of ambiguity and low levels of stability.
· People develop by broadening skills rather than deepening them.
The third type of structure is called the web structure. It is described this way because
all points are linked together from the centre. The culture that fits with a web structure
is power culture and they are characterised in the following way:
· There is fast decision making and adaptability to change.
· There are few rules.
· It is a self confident organisation.
· There is central control.
· There are key individuals whose power is personal rather than based
upon position or knowledge.
· Political influence prevails over logic.
· Success is celebrated and judgements are made on the results not the
means.
· There is a competitive atmosphere.
· There is faith in individuals, with a dislike of committees.
The fourth type of structure is not a structure at all, but a loose collection of individuals.
The culture in these circumstances is called person culture. This combination is not
101

often found. It exists in small organisations where everyone is a stake holder of similar
power and influence. An example of this is a solicitors' partnership. Control is achieved
by mutual consent, and the organisation exists to serve the members rather than external
stake-holders, (e.g. shareholders).
Any organisation of a significant size will be made up of a mix of cultures and
structures. The structure and culture of any part of an organisation will be determined
by a number of factors, including the management style that is dominant in that part of
the organisation, the nature of the tasks to be achieved, and the level of stability of the
environment. Objectives are achieved by consistent behaviour, which is encouraged by
role culture. Innovation is achieved by inconsistent behaviour, which exists in task and
power cultures.
Management style is usually described as authoritarian or participative. This does not
recognise that there is a continuum between these extremes. The participative end of the
continuum is described as a democratic approach. Different organisational cultures are
associated with different styles, for example role cultures tend toward the authoritarian
approach, whereas task cultures tend toward a democratic style. The nature of the task
and the expectations of employees will also have an effect on the style. Stress will be
caused if any of these factors are out of step with the others. Handy produces a table
that emphasises the continuum by putting points between the extremes. It uses the work
of writers on management style and leadership who define these points. Part of the table
is reproduced below but is amended to better align the styles:
Range: Autocratic DemocraticWriter:Harbison & Myers
Autocratic Paternalistic Consultative Participative
Vroom Decides Consults Shares DelegatesHersey &Blanchard
Telling Selling Participating Delegating
Handy Structuring Supportive(Handy C, 1993).
As management is about decision making, it is the way decisions are taken that others
notice. The consultative approach could be seen as gathering information and making a
logical decision based upon the evidence. This in turn could be seen as an extra
dimension of style.
102

The contingency approach to organisation asserts that the structure, culture and style
will be set by environmental determinants. These will include customers, markets,
competition, and suppliers as well as social, technological, financial and political
factors. As all of these factors change the organisation must be organic, moving,
changing and growing to meet new challenges.
A further approach breaks down different aspects of the organisation's function and
determines that different needs are served in different ways as the table below shows:
State Structure Culture Style
Steady state Bureaucratic Role Authoritarian
Policy Web Power Consultative
Innovation Matrix Task Participative
Crisis Bureaucratic Power Authoritarian
(Handy C, 1993).
5.2 Head Office and the Management of the Groups, Structure, Culture and Style
The dominant organisational structure of the company is of the bureaucratic type. The
culture is predominantly role culture. Each group is headed by a General Manager. He
has all functions for that group reporting directly to him. He in turn reports to the
Operations Director. There are however three functional executive directors, (for
finance, personnel and marketing), and below them, and the Operations Director, there
are a number of functional managers. These include a personnel manager, a purchasing
manager and an industrial engineering manager. Each head of department in each group
has a relationship with the manager and director of their function. This relationship
does not extend to day to day reporting or control, but it sets policy and co-ordinates
activities that cross group boundaries. So that for example the Purchasing Manager
would set a code of ethics for all buyers in the company. Regular meetings are held
between department heads, and sometimes their staff, and the company managers. This
is a way of spreading “best practice”, and to engender a common corporate culture.
Because these are the only factors of these relationships, they do not undermine the
hierarchy of the bureaucratic structure. They help to create a wider sense of belonging
103
and give Remploy more of a corporate identity to its staff than they might otherwise
have. This structure strengthens the company’s value system and management style,
although this will inevitably be at some expense to the any group style set by the group
general manager, that differs from that of the company. The groups are thus bound
together.
This structure has the appearance of a matrix type, with the group general managers
responsible for the portfolio of products of his group, forming what has traditionally
being the horizontal axis. The vertical axis that has traditionally been the functional
dimension is in this case only used for information and values' dissemination.
Writers on organisational structure have usually seen the horizontal axis as a temporary
one, for projects, or one based on products placed over an existing bureaucratic
structure. The problems that writers have emphasised are based on equality of power in
the two dimensions of the structure, placing particular significance on conflicts of time
allocation. These can be managed more easily if only one dimension is used for
allocating work, and is clearly seen as the dominant structure. This is the case at
Remploy where there are no significant conflicts.
The structure described above does not have a significant effect upon the major part of
the Furniture Group. It has bearing on the heads of departments where there is a
director and, or a senior manager, and their senior staff. These departments are all
service departments, mostly staffed with professionals, who are used to the strong
functional identity associated with their profession. Others in the group are not affected.
The culture of the senior managers and directors has not been seen in any detail, but is
expected to be a power culture when deciding policy. When imparting values and
beliefs it displays some signs of role culture, emphasising procedures.
The management style of the directors and senior managers tends toward the autocratic
in matters of policy. When dispensing corporate doctrine it is moderated to be
paternalistic. The mangers are recognised as being senior in status and knowledge, with
a breadth of experience. Thus they can communicate best practice and values in this
way.
104

The style also tends to be paternalistic in many of its dealings with the work force. It is
not surprising that a company that has been established to employ people disadvantaged
by disability, and has a mission statement that emphasises providing employment, takes
a nurturing parent role when dealing with those people. Such a role can prove offensive,
however to people who struggle for their independence and hence a careful line must be
drawn.
The company’s management style is also more likely to place emphasis on people than
production. The managerial grid developed by Blake and Moulton, as shown in
Understanding Organisations by Charles Handy (Handy C, 1993), shows graphically
how Remploy needs to move many of its managers from the “country club” style to the
“team management” style.
Concern for People9Country club management (1,9). Production is incidental to lack of conflict and ‘good fellowship’
Team management (9,9).Production is from integration of task and human requirements
Dampened pendulum (5,5).(Middle of the road.)Push for production but don’t go ‘all out’. Give some but not all: ‘be fair but firm’
Impoverished management (1,1). Effective production is unobtainable because people are lazy, apathetic and indifferent. Sound mature relationships are difficult to achieve because, (human nature being what it is) conflict is inevitable
Task management (9,1). Men are a commodity just as machines. A manager’s responsibility is to plan, direct and control the work of those subordinate to him
1 3 6 9
Concern for production
105

5.3 Furniture Group Departmental and Factory Organisation,
Structure, Culture and Style
The structure of the Furniture Group is similar to that of the whole company. A
dominant bureaucratic structure exists, with department heads covering the functional
specialities at group level. However, because there are 13 factories, (each relatively
small), there have to be some aspects of each of several of the functions performed at
factory level. The staff performing these functions are directly responsible to the
factory manager. There is a similar matrix structural relationship between them and the
central functional staff in each linked function, to that of the group department heads
with the head office managers.
An example of the relationships in the Furniture Group is that of those staff engaged in
the quality assurance process. Each factory has a Quality Technician who reports to the
Factory Manager. A Quality Engineer will be assigned to cover a group of factories,
working with the Quality Technician in each of those factories to resolve quality
problems. A Factory Manager may request a Quality Engineer to assist with a particular
problem, but it is the Quality Manager who decides the Quality Engineers’ priorities
and dictates their modus operandii. The Quality Manager also trains the Quality
Technicians and dictates their method of work. This is a stronger link than exists above
the group level, because the Quality Manager has the authority to stop production. Such
a decision would start with the Quality Technician finding a problem and notifying it to
a Quality Engineer. In this case, the two dimensions of the matrix structure are more
equally balanced. A Factory Manager under pressure to achieve output may try to
influence a Quality Technician to “turn a blind eye”.
Another example of matrix structure is found in the production planning process. Each
factory has a Scheduler who will load individual works orders onto the factory but it is
the Production Planner who loads the factory’s overall capacity and chooses which
factory will make a batch of a product given a choice. A similar example exists in the
purchasing process. Factory staff schedule delivery dates and quantities against call off
purchase orders and may place orders themselves. It is the central buyers who negotiate
prices and contracts and place the major orders. The introduction of Triton is changing
this, however.
106
The matrix relationships between these people are crucial to the organisation’s success.
Because the work is not project oriented the predominant culture is role, rather than
task, which is normally found in matrix structures. Because most factories are small
there is a need to cross train the administrative staff to cover for holidays, sickness and
work overloads. The structure is flexible at this level and so these people are more
likely to switch into task culture even if those they liaise with at group level are not.
Some central departments do tend to use task culture, although the dominant culture
found is role. It is those departments in which projects arise, or which have to deal with
crises (or work overload), which requires an “all hands to the pump” approach. This
would include the Industrial Engineering and Quality departments, although because
the management style tends toward the autocratic the culture can tend from task to
power. The Contracts Department, or rather parts of it, have been seen to switch to task
culture or power culture too. This is probably because they are close to the ultimate
customer and see the need to achieve immediate goals, whatever the means.
Discussing management style can be emotive, describing an individual manager as
autocratic for example could upset them. A number of managers will read this thesis
and hence it will examine management style in general terms. The Group General
Manager and his immediate subordinates, (the heads of departments) have been on a
number of workshops, one of which dealt with management style. They underwent a
test that measured their individual styles, in both normal circumstances and crisis
circumstances. The results were expressed in three dimensions denoted by colours:
· Red = Autocratic
· Blue = Human Centred
· Green = Logical
In the normal mode all but two of the ten managers were judged to be Red, of the two
who were not Red, one was Blue and the other Green. In the crisis mode those
managers that were already Red remained Red usually becoming more so, the manager
who was Blue became Red, and the manager who was Green remained Green but
moved in the Red direction. Quite clearly the overall style of the Furniture Group is
towards the autocratic end of the spectrum.
5.4 Organisational Design
107
The main dimensions of the design of an organisation’s structure are the number of
levels in the hierarchy and spans of control of managers. These factors are in tension. If
all other factors remain the same, and the same number of people are employed, it is not
possible to remove levels from the hierarchy without increasing spans of control.
Traditionally spans of control tend to broader at the top and bottom levels in the
hierarchy than in the middle. This is because the span of control is directly proportional
to the amount of time required for supervisory activities. It is also a function of the time
each manager or supervisor is required to spend completing non-supervisory activities.
If the staff reporting to a manager are well trained it is possible to minimise the
supervisory activity and even delegate work that would otherwise be performed by the
manager. The level of competence within the organisation is therefore key to its design
and is an enabler of flatter hierarchies. Empowerment is another enabler of flat
structures, staff able to supervise themselves require less of their managers' time, hence
increasing the manager’s potential span of control. Information Technology is an
enabler of empowerment, see chapter 7. No matter how competent staff are and how
enabling the IT, the manager must also trust to delegate. The managers’ personal style
and training are therefore also crucial to the design of the organisation. Individuals' jobs
must be designed to take all of these factors into account. Once jobs are designed the
way they are grouped into departments also influences the levels in the hierarchy. For
example, a department head could comfortably have a larger span of control, but the
departmental boundaries prevent this, due to there being no other tasks the department
is required to perform. This would have the effect of increasing the size of the structure.
The design of departmental boundaries needs to avoid waste of this kind.
Another dimension of organisational design is the methods of communication and co-
ordination. The number of regular formal meetings is an aspect of job design as they
take up management time. Informal but regular communication also takes time. Reports
take time to produce too, and wide circulation requires time from each recipient.
Information Technology can facilitate flatter structures by disseminating information
and producing analysis, freeing up peoples time. Data is available to be viewed, or
printed if required, but need not be formally circulated. Management by exception is
easier.
108

The following twelve points are the formative elements of the structure of an
organisation, (Buchanan D and Huczynski A, 1991):
· Levels in the hierarchy
· Spans of control
· Job design, individuals and groups
· Departmental boundaries
· Formal communications systems
· Ad hoc communications systems
· Informal lines of communication
· Leadership, management and power
· Control Structures
· Co-ordination and integration structures
· Reward systems and motivational aspects
· Size and divisionalisation
The Furniture Group can be examined using these elements. Organisation charts are
contained in appendix F, these show the formal organisation structure. The shallowest
part of the structure is the single level of the Group General Manager’s secretary
reporting to him. Other parts of the hierarchy, however are quite deep. For example
take the path from the Group General Manager (GGM) to the buyers that has five
levels. There are four levels from the GGM to the lowest level in most of the service
departments, except for a few smaller departments that have three levels. There are up
to 7 levels down to the operators in the factories. It is clear that the number of levels is
influenced by spans of control.
The span of control of the GGM is 10 including his secretary. At the level that reports
to the GGM the spans of control vary. The manufacturing manager has a span of
control over 13 factories, although this has been reduced by increasing the levels in
parts of the structure so that some factory managers report through others. This reduces
his effective span to 6. There is a relatively large span of control for the contracts'
manager due to the nature of the markets the company operates in, this is 5. The finance
manager also has a span of 6, which is relatively large. Power is concentrated here by
the nature of the different functional disciplines that report to him. The national sales
manager is the only other manager with managers reporting to him, where there are
109

three. All of the other managers at this level do not have managers reporting to them.
They tend to have smaller departments with some professional grades reporting to
them. Spans of control vary from one to six. At the factory level, the managers span of
control is usually about 6, but some managers manage two factories, without another
manager, giving a span of 12. The supervisor will have 3 or 4 leading hands reporting
to him. If the manager is away the supervisor is often the person chosen to deputise
increasing his span temporarily. The leading hands will have a span of control varying
from about 10 to 20.
It is beyond the scope of this study to identify the job designs of everyone and each
group in the organisation. Jobs designed within the competency and training of people
do allow supervisors to increase their span of control. As people grow and can take on
more work, this trend increases. Information Technology and automation can remove
some elements of a job, allowing people to take on even more challenging work,
increasing spans of control even further.
The departmental boundaries are functional. This can quite clearly be seen from the
organisation charts. There are some anomalies, such as the materials manager reporting
to the group finance manager. Although material is a cost that must be controlled, most
functional structures have purchasing and production planning department reporting to
a manufacturing manager. Labour is another resource that requires financial control but
factory managers report to a manufacturing manager not an accountant.
Formal communication is achieved by reports and meetings. Most of the system is
geared around measuring performance, feeding that information to others, analysing it
and disseminating it, to then be used as control mechanisms. This information takes
several forms, including output, efficiency, order intake, customer service, material
control and financial control. Budgets are set and performance against budget is
monitored, and corrective action taken when necessary. Part of the formal information
system is facilitated by the use of computers. The system is based around processes and
is cross functional.
Ad hoc communications systems are usually used for specific projects or when
emergency action is required, i.e. when performance deviates from budget by levels that
require more urgent or more drastic action than the formal communication system can
110

deliver. Ad hoc communication is also used for communicating messages of strategic
importance or changes in strategic direction.
There are three types of informal communications that feature in the organisation. The
first is almost formal. This is communication between a manager and people a level
below those immediately below him within the same chain of command. For example
the manufacturing manager talking directly to a factory manager who reports through
another manager in the formal structure. Another informal communication takes place
when information is required to do a specific task that is not provided by the formal
system. This communication would take place with the person best placed to provide
the information, irrespective of their position within the hierarchy, or with someone
who has provided information in similar circumstances in the past. It may also be
provided by intermediaries with whom the person requiring the information has a
formal or informal relationship. The third type of informal communication is the
“grapevine”. This varies in its activity level and its accuracy. It is sometimes very fast,
accurate and widespread.
The aspects of leadership, management and power have been dealt with earlier in this
chapter, where management style has been discussed. Power being concentrated by the
structure has also been discussed above. In the autocratic management style
environment, much power is positional. Power based on knowledge usually is also
related to position. Communication is not totally open, and therefore knowledge is also
based on position. There is not a great emphasis on personal power, although some
factory managers and a few other managers do exhibit this type of power.
Control structures are embedded in the hierarchical structure and the formal
communication system.
Co-ordination and integration is achieved both by the formal and informal
communication systems.
The reward systems within the organisation do not affect the structure. At the operators'
level there are bonus schemes based on output. There is no known career planning or
development. People do not tend to be promoted into jobs. Instead job vacancies are
advertised, although people whom managers feel would be able to do the vacant job are
111

sometimes encouraged to apply. Motivation strategies vary. They reside with the
individual managers, in some cases' people are self motivated despite the managers.
The size and geographical dispersion of the group is fundamental to the design of the
organisation. Factory managers who are skilled to have responsibility for more than one
factory are assigned on a geographical and product group basis. The main residence of
the central departments is in Swansea, however some departments are based in
Sheffield. Some managers are based at home with secretarial support in Sheffield. It is
the communication systems that are impacted most by the geography. They have to be
sophisticated and speedy. Managers all require mobile phones, there is an under used e-
mail system and computer transfer of information via networks (LAN’s & a WAN) is
increasing. Managers necessarily spend time in their company cars reducing the time
they can spend on productive work, (however part of their driving is in their own time).
This increases the number of managers required. The corporate plan for the whole of
Remploy is to rationalise the number of factories. This will not only reduce costs
directly but will enable smaller more efficient structures with the consequence of
reducing overheads.
5.5 Organisational Effectiveness, a TQM Approach
Part of the philosophy of Total Quality Management is that the quality of the
organisation is as important as any other facet of any enterprise. Quality must be
measurable and hence TQM has generated a number of self assessment questionnaires.
A useful measure of the organisational effectiveness, (which is delivered by the
combination of structure, culture and style) can be obtained by completing the self
assessment. The European Foundation for Quality Management (EFQM) has produced
a well-received system, (EFQM, 1995). The system breaks into nine sections, each is
applied a weighting according to its importance. Each section has a series of key
comments that are attached to points, there are points between the key comments to
allow an assessment between them. There is a total of ten points for each section and
the weightings for the sections total 100, giving a maximum possible score of 1000.
The sections and weightings and an assessment of the Furniture Group are set out
below:
Section Weighting Assessment
112

· Leadership 10 2· Policy & Strategy 8 4· People Management 9 2· Resources 9 4· Processes 14 3· Customer Satisfaction 20 2· People Satisfaction 9 3· Impact on Society 6 3· Business Results 15 3
Weighted Total 278 (or 27.8%)
Although Remploy Furniture Group only scored 27.8% this is not a bad score. When
BAe undertook the same survey they scored 48.16% as shown below, and 70% is
considered world class.
Section Weighting Assessment· Leadership 10 4.6· Policy & Strategy 8 5.9· People Management 9 4.6· Resources 9 5.2· Processes 14 4.3· Customer Satisfaction 20 3.9· People Satisfaction 9 5.5· Impact on Society 6 6.0· Business Results 15 5.1
Weighted Total 481.6 (or 48.16%)(Weston J, 1999)
The key points of each of the sections are shown on the following pages. They are
particularly useful as they not only indicate best practice, but also give intermediate
targets for improvement.
113

Leadership Management act as individuals in taking and communicating decisions. They promote the need to develop and improve the organisation and to set targets.
Management acts as a team, ensure two-way open communication, become involved in improvement groups. They agree plans and set priorities.
Managers develop and support improvement teams and make time available for them to work. They check progress and recognise involvement, they say ‘thank you’
Managers are willing to ‘let go’ and empower people to become involved in improvement teams between departments and with customers and suppliers.
All managers are active inside and outside the organisation in promoting improvement activity. Continuous improvement is the culture and business philosophy.
Score 1 3 5 7 9Policy & Strategy
Partial Business Plans exist—only concentrating on financial targets. Plans are not widely communicated or visibly championed by the top team.
Business plans encompass competition data, e.g. customer satisfaction measures. Key points are communicated; individuals understand and accept responsibility.
Strategic direction—Vision, Mission Objectives, etc. are communicated to all stake holders. A new culture is being developed. Resource made available for continuous improvement.
Strategic Direction understood by all stake holders. Visibility championed by top team. Key success indicators (for example meeting customers' needs) are reviewed at all levels in the organisation.
Strategic direction visibility achieved. People’s success recognised by leaders at all levels. Innovation and continuous improvement is the culture throughout the organisation.
Score 1 3 5 7 9People Management
Training is seen as a cost and people are employed to do a job.
The management team recognises that success comes from employees. Skills training is encouraged and training plans are agreed and aligned to company goals
Delegation of responsibility to people at appropriate levels takes place. Appraisal schemes match the aspirations of the people and the organisation.
Employees are allowed to implement improvement activity without reference to management. A climate conducive to personal development and continuous improvement exists.
Staff morale is high and exceeds the competitive benchmark. The full potential of all people is being realised to achieve the strategic direction.
Score 1 3 5 7 9
Resources Resource management Information available— Decisions are made on All areas of waste are All the companies’

tends to be directed solely at financial areas. Decisions on stock and materials are taken using hunches and ‘gut’ feelings. Information is ‘kept in peoples' heads’.
often talked about or over-analysed but rarely used to improve. Cash and working capital are seen by all to be important. Stock controls in place.
the basis of information. Stock is related to customer requirements. Process improvement and evaluation of new technology takes place. Planning systems are in use.
measured and form part of the improvement plans. Data is gathered to form an accurate view of competitors and used in business planning. Financial plans meet stake holder needs.
resources are deployed to meet agreed policies and strategies. Benchmarking against the ‘best in class’ is a key resource improvement driver.
Score 1 3 5 7 9Processes Few procedures exist
apart from financial controls. Everyone does their best and fire fighting is the norm. Changes are made to fix problems as and when appropriate.
Procedures have been written and imposed. A bureaucratic system exists with little chance for improvement. Non-conformance’s are seen as ‘bad’. Systems purpose not clear to operators.
Critical processes are owned and there is support to monitor and improve them. Ownership is assigned to management who review corrective action, etc.
Meeting customer needs is seen as the purpose of the system. Procedures and operating standards are owned by the operators, managers and suppliers. Processes are being controlled.
System ensures all stake holders’ needs are met by existing and new products and services. Customers find it easy to do business. Continuous feedback causes improvement and innovation.
Score 1 3 5 7 9Customer Satisfaction
Customer satisfaction only considered in terms of external complaints. Complaints are dealt with when they arise with little attempt to find or correct the cause.
Customer satisfaction measures are available from surveys. This data is used to set performance standards and staff have been trained in customer service.
The need to meet agreed customer needs is reflected within the core strategic plans. A customer care policy exists and is widely published.
Continuous research exists to identify and meet individual customer needs. This research is fully integrated into business planning, improvement and innovation processes.
Customer commitment is being delivered by all processes and relationships. Improvement and innovation exceed customer’ expectations and the competitive edge is being increased.
Score 1 3 5 7 9
People Disputes and grievances People’s views are Two way internal Business changes that Benchmarking against
Satisfaction are resolved as and when they arise. Absenteeism and/or staff turnover are high. Morale at times is poor and management tends to concentrate on themselves.
sought through surveys. Staff are consulted on improvement but grievances are dealt with by ‘personnel’. Health and safety are treated seriously.
discussions take place & an appraisal process is used for joint improvement targets. Communication & feedback happen: morale is good.
may adversely affect staff are jointly worked on. Data available to show that all employees feel responsible for both their jobs and improving the organisation’s capability.
other organisations shows employee satisfaction is high and has an improving trend. Two way appraisal is taken as the norm.
Score 1 3 5 7 9Impact on Society
Environmental and social obligations are seen as costly and a threat to competitiveness. Damage limitation exercises are used to counter ‘problems’. Community work limited to individuals.
Environmental and social requirements are dealt with to conform fully with legal requirements. Policy documents and internal standards have been written.
Strategic Quality Planning incorporates Environmental and Social obligations. Res-ponsibility is allocated to senior managers. Environmental audits take place. Keen practitioners are encouraged.
Data shows the organ-isation ‘betters’ legal requirements. Encour-agement is given for employees to become involved in supporting local community activit-ies. Public aware of environmental strategy.
Data is gathered and views sought from the local society and employees, and is used in business planning. The organisation has received formal recognition of environmental performance.
Score 1 3 5 7 9Business Results
The financial results are available and some non-financial indicators published. They are seen as management data by the majority of staff.
Systems exist to display financial and non-financial indicators they are communicated to staff and improvement targets indicated.
Indicators are used to measure process and output and available for improvement teams. Trends are monitored and used to set targets. Supplier quality is measured and shared.
Benchmarking is used to compare results with industry and ‘best in class’ trends. Difference between targets and results are always pub-lished and are available to stake holder on request.
The organisation’s performance exceeds external benchmarks and stake holders are proud to be associated with us. Commitment by all to improve our business continuously is our culture.
Score 1 3 5 7 9

5.5 Organisational Effectiveness, a People Approach
“There is no other source of competitive advantage! Others can copy our investment,
technology and scale - but NOT the quality of our people”.
This quote is taken from a joint publication by the Department of Trade and Industry
and the Department for Education and Employment called Competitiveness Through
Partnerships With People, (DTI, 1997). It is thus clear that the effectiveness of any
organisation depends on the people employed at all levels. It is people who decide the
next investment, how to use the latest technology, how to match the scale to the market.
Competitive advantage is achieved by being one step ahead of the competition in all
areas of the business. This is achieved by having people in the organisation who can
innovate these steps. To empower them to do this these people must be well trained,
correctly organised, immersed into an innovative culture and managed, (or rather led) in
an enabling style.
The booklet suggests a number of key “paradoxes” can be used to describe a successful
company these are:
Demanding yet Giving
Structured yet Fluid
Disciplined yet Creative
Confident yet Self-critical
Supportive yet Stretching
Accountable yet Blame free
Entrusted yet Managed
The Partnerships With People booklet is based on a study drawing on the experience of
companies, academic institutions, professional associations and advisory bodies. It
identifies five of what it calls paths to sustained success:
· Shared Goals: Understanding the business we are in
· Shared Culture: Agreed values binding us together
· Shared Learning: Continuously improving ourselves
· Shared Effort: One business driven by flexible teams
· Shared Information: Effective communication throughout the company

Three stages make up a framework for progress, these are designated: starting out,
moving forward, and, new horizons. A matrix is provided based on the five paths and
three stages. There is then a self assessment exercised based on the matrix. These are
reproduced overleaf and an assessment is made of the Furniture Group.
The scores taken as a percentage of the total possible equals 45%. The chart shows
strong areas, e.g. shared culture and weak areas, e.g. shared goals and shared effort.
Further analysis can be made because each questions position is aligned with the three
stages, the first is starting out, the second moving forward and the third new horizons.
The total possible in this analysis is 25 in each stage. Adding up the scores in the stages
gives the following analysis:
Stage Score Percentage
Stage 1 14 56%
Stage 2 11 44%
Stage 3 9 36%
This shows a decreasing trend as would be expected.
The organisational effectiveness is seen to be better with this model than the EFQM
model. It is evident from both models that substantial progress would need to be made
before best practice is achieved.
The assessments made are personal ones by the author, it is possible others could make different
assessments. The Partnerships With People booklet does suggest getting people from a variety of levels
from within the hierarchy to make assessments and warns not to be surprised if people from the lower
levels make significantly different assessments from those at the top.
Starting Out Moving Forward New HorizonsShared Goals · Plan developed from the MD’s
vision· The plan explained to all staff· Performance against plan is shared
· The vision is developed by top team
· The vision is shared with all the people
· Jobs related to the longer term goals
· Participative planning enabled· Unit planning facilitated· Agile planning operated
Shared Values · Managers are fair and involved· Commitment to your customers· Start to tackle fear of change
· Build collective confidence· Demonstrate you value everyone· Face problems - be tough
· Lessons are learned, blame is removed
· Shape a competitive culture· Change is embraced
Shared Learning · Performance measures are defined· Employees are trained for job
competence· Recruit and select with care
· People enrolled in their own development
· Managers are developed to achieve stretching targets
· High performance is expected
· Develop the person· Train managers as coaches· Build tomorrow’s capability
Shared Effort · Managers developed as team leaders
· Team performance measured· Team problem solving encouraged
· Teams trained as effective working units
· Discretion given to teams· Teams made internal customers
· Inter-team working as required· Ad hoc teams used· Build the firm as ‘the team’
Shared Information
· Communications effectiveness is checked
· Process for reporting decisions is used
· Communicate through behaviour
· Be open, good and bad news is relayed
· Process in place to allow ideas to be taken into account
· Information is shared between teams
· Information is available to allow decisions to be delegated
· Everyone is responsible for seeking and passing information

The score is based on a rating from 0 to 5 with the following meaning for each score: 0= to no extent 3= to a moderate extent
1= to a little extent 4= to a great extent
2= to a slight extent 5= to a very great extent
Path To what extent... Score
Path 1 ¼ is there a step-by-step plan to develop the business which all employees fully understand
¼ do all staff contribute creative ideas about how objectives can be implemented
¼ is the firm’s strategy and business plan widely discussed before it is agreed
Path 1 Total Score
2
1
1
4
Path 2 ¼ would all employees say “management are fair and respect every employee”
¼ do both staff and managers expect that every employee will be dedicated and professional
¼ does the culture of the firm develop widespread confidence and a ‘can do’ attitude
Path 2Total Score
4
4
3
11
Path 3 ¼ is everyone highly skilled to perform their tasks
¼ does everyone feel that they are developing new knowledge and skills
¼ are people being deliberately developed to provide a competitive advantage for the firm
Path 3Total Score
4
2
2
8
Path 4 ¼ do staff (at every level) work in high performing teams 2
¼ are there efficient mechanisms to ensure that teams co-operate
¼ do teams form and re-form to solve problems quickly and efficiently
Path 4Total Score
1
1
4
Path 5 ¼ is there a frequent and open cascade of information down the organisation
¼ is there continuous and open communication across the organisation
¼ is there comprehensive and open communication flowing up the organisation - so that top management really know what is
going on
Path 5 Total Score
2
3
2
7
5.7 Summary
· Remploy is moving from a paternalistic employer to a company competing in open
markets. This will affect its culture and management style.
· The Furniture Group has an autocratic management style.
· The structure and culture of the Furniture Group is typical of many British
companies.
· The organisational effectiveness of the Furniture Group shows room for significant
improvement in most areas.
· Some recent changes are moving the Furniture Group in the right direction.
· The organisational design of the Furniture group could be altered to enhance
effectiveness.
123

Chapter 6. Definition of the Challenges
This chapter defines the organisational challenges brought about by the implementation
of the computerised integrated business system, Triton. The challenges defined in this
chapter are then the basis of a search for ways to meet them in the next two chapters.
To define the challenges it is necessary to draw upon the previous chapters to analyse
the expectations. Simply implementing the system will not in itself necessarily satisfy
all of the expectations. There are also areas of the business where there are expectations
of improvement that can not be brought about by Triton alone. However, it can act as a
facilitator of other changes that will satisfy these expectations.
6.1 The Expected Benefits
The business case was based on improvements to only two parameters. The first was
lower stocks and hence an increased stock turnover, releasing capital. The second was
increased debtors turnover, that is collecting money from customers more quickly,
bringing in funds, and so decreasing borrowing. Both these improvements relate to
financial efficiency and are directly measurable. Cash flow is important within the
business and money released will reduce the pressures on it. The expectation of a more
efficient business is implicit within the business case. However, improvements gained
could be offset by lower productivity and organisational effectiveness, which would be
unsatisfactory for the board and the government. From the point of view of those who
authorised the expenditure to purchase Triton, it also needs to enable stopping the
decline in productivity, (see chapter 2).
The business improvement expectations from the user base is even more stringent. At
the lower levels, people have been used to using a system which is not easy to use and
is not integrated with other elements of the system. The expectation is that their job will
be made easier, by not having to search for information. At the management level the
expectation is that information will be more readily available, it will be more reliable,
and it will be presented in a way that assists the decision making process. It is also
expected that an integrated system will be able to supply more information using less
resources, eliminating duplicated effort. It is also a fair expectation that the planning
124

and control facilities will improve some problem areas, such as delivery service and
improve the performance of the organisation.
People at all levels within the organisation have a stake in the success of the
implementation, and ongoing use of the system. There are high expectations, but
coupled with this, there are high levels of goodwill that will yield considerable effort to
make the system work and bring about the benefits. If the benefits are not forthcoming
the negative effect on morale will be significant. Cynicism will develop and there will
be a drop off in motivation. It is therefore vital that success is obtained.
The high level of expectation is a lever that assists the management of change. Most
people foresee an improvement for them personally. If it becomes apparent that
improvements will not be realised resistance to change will become conspicuous.
The internal survey shows that there are expectations other than those for direct
business improvement. There is the anticipation of organisational changes that are
examined in chapter 4. The conclusions include fewer managers, fewer levels in the
structure and more service departments. There is also expected to be the movement of
tasks between people and departments, more multi-skilled team working and more
matrix links in the structure. Quite a lot of procedural changes and job redesign are
anticipated, working in more formal ways, with more supervision. Some of these
expectations appear to be based on the implementation of an integrated system, and
others based on using the system as a means to improve business performance.
6.2 Functions and Processes
Any changes to the organisation to achieve business benefits must take into account the
present organisational structure and the functions, tasks and processes it executes.
Although, as shown in chapter 5, some functional staff report to general managers the
structure is primarily functional. Where day to day control over people employed at
factory level cannot be executed by a functional manager, that person will report to the
factory manager. There will be a link to the functional manager. This arrangement has
more to do with control, discipline and lack of trust than trying to organise for efficient
operation. The link with the functional manager serves to emphasise the functional
nature of the structure.
125

Chapter 3 explains that Triton has been designed to follow business processes. All the
training received from the Baan consultants was based on completing a business process
through the system. This is the natural way to train and to design a system. There is
huge flexibility however, because there are 16000 sessions. About one third of the
sessions create or modify data, each session is therefore a small enough discreet task to
be completed by on person as only a part of their job. The next task in the process could
be completed by the same person, another person in the same department, or a person in
another department. With field by field security it is even possible to create different
tasks performed by different people within the same session. This is not recommended
as the work would then become too fragmented. In most cases a number of tasks would
be completed using a number of sessions by one person as their part of the process
being tackled.
The key places that have an effect upon control, efficiency and communication are the
points where business processes cross any type of boundary. This could be from one
person to another in the same department, or between departments. Important questions
to consider include:
· Timing: How is the person doing the next task informed it can be started
· Information: How is data required to perform the next task that has been
generated by earlier tasks passed on.
· Ownership: Who is responsible if a process is not completed on time
· Quality: Who is accountable if there are quality problems within the process
In an integrated system it is possible for the system itself, or an associated e-mail
system, to prompt the next person in a process to act. It is also possible to use simple
manual systems where something is passed into an in-tray. As Remploy is a
geographically dispersed company, the more sophisticated systems are required to keep
the process moving in a timely fashion. In many cases the data the next person in the
line requires has been created on the system and is available to them. This is another
advantage of an integrated system. The last two points are more difficult to solve.
Where there is a quality or timing problem with a task or series of tasks assigned to one
person, then they are clearly accountable. When these tasks are spread within a
department the manager of that department can be held accountable. If individuals
126

within the department are blaming each other, it is the manager’s responsibility to sort
it out. If the series of tasks crosses a departmental boundary it would be expected that
the two department heads would work together to resolve the problems. In some
cultures, however they may blame each other and the problem may be referred up the
chain of command to a common point. This point could be too remote and unfamiliar
with the tasks to do any more than “bang heads together”. The more that processes
cross boundaries, the more difficult it is to assign ownership for quality and timing.
A whole process cannot normally be completed by a single person. They would have
neither the skills nor the time. When designing jobs and assigning tasks, time and skill
constraints are crucial factors. Sets of related specialised skills reside in the current
functional departments. The head of department is normally an expert in the skills and
able to train and coach staff to use best practices. This is the critical success factor of
functional organisations.
6.3 Statement of the Challenge
To change the organisation to be more effective. Some changes will be made because
working with Triton with the present structure will be ineffective. Some changes will be
made because Triton is an enabler. They are desirable changes that could not have been
easily made before the introduction of and integrated business system. The changes will
attempt to satisfy all of the business improvement expectations generated by the
implementation of Triton. They will also not compromise organisational effectiveness
as measured in chapter 5, the aim will be to provide a platform to move forward and
improve performance against these measures.
Frank Land, Professor of Systems Analysis at the London School of Economics and
Political Science has identified three phases, set out in a model defined by Hedberg in
1980. Phase 1 took no account of the impact of computer systems on the organisation
any impact was unforeseen and unhelpful. In phase 2 systems were carefully designed
to avoid organisational change. It is only in phase 3 that systems designers attempt to
use the technology to shape an organisation’s structure so that the organisation becomes
more effective, (Land F, 1984), (see chapter 7). The changes recommended will build
on the design intent within Triton to achieve a stage three organisation, i.e. to maximise
Triton’s potential to make the organisation more effective.
127

128
Phase 2Systems designed to overcome specific
operating problems.Systems designed to avoid any effect
upon the organisational design
Phase 1Systems designed to overcome specific
operating problems.Effect upon organisational design
unforeseen and unhelpful
Phase 3Systems designed to fully account for
the organisational implications.
Systems flexible enough to be tailored to suit varying organisational designs.
Re-engineer processes (then)Re-engineer organisation (then)Tailor and apply software (to)
Achieve a more effective business
Chapter 7. The Search for Solutions: Research
This chapter presents a review of writing and research on the subject of how
computerised management information systems affect organisational design. It covers a
number of key topics. In each it looks back to the earliest days of computerised systems
in industry where predictions were made about the future, and moves forward to current
thinking.
7.1 Causal Analysis
Before searching for solutions it is useful to summarise the Problems and their causes.
The key problems can be identified as follows:
· The level of productivity is in decline, and is variable across the Furniture Group.
· The company is struggling to adapt to compete in open markets.
· Poor customer service levels, (e.g. on time deliveries) exist in the Furniture Group.
· Capacity management is ineffective and is a major reason for poor customer service
levels.
· The management of the supply chain could be improved to help ensure on time
deliveries to customers.
The causes of these problems can be seen from the analysis of the organisation and its
effectiveness. They include:
· Poor systems for planning and control of material, capacity and production.
· Lack of integration and co-ordinating mechanisms in planning and control processes.
· Disjointed processes, crossing many boundaries, with consequential loss of
accountability.
· Process improvement, including management, planning and control processes, could
be more proactively pursued.
· A centralised, autocratic decision making process that does not utilise the expert
knowledge that exists where the decisions are actioned.
· Resources, including, information are poorly used. Fire fighting is common.
129
· Morale is poor especially amongst professional staff. Cynicism is rife.
· Employees are not involved in creating innovative ideas to aid achieving objectives.
· There is a blame culture in some parts of the organisation.
· Training and development is not given a high priority. Changes of trade are de-
skilling some factories.
· People work in departments not teams. Tasks are completed by individuals. The
synergy available from team work is not evident.
· Information dissemination is hindered by long chains of command and geographical
dispersion.
7.2 Introduction
In order to survive and thrive an organisation must know where it is going and how to
get there. Standing still usually leads to demise in today’s fiercely competitive world.
There is hence much made of mission statements. From the mission statement a
corporate strategy is developed to achieve the mission. A company needs to organise
itself to enable the strategy to be effectively followed. This often means companies
adopt a contingency approach to organisation, changing to meet the demands of a
changing environment. Instead of Bureaucracy there is now Ad-hocracy. In his 1989
book GameChange, David Kaye of Andersen Consulting highlights the way computers
are affecting strategy and organisation. He talks about the way information technology
shrinks distances and favours global operations and global competition; the way
computer technology can be used as a barrier to market entry; the way IT can be used to
overcome the complexity of product variety and customisation. IT is also having the
effect of reducing the time to market of new products and shortening product lives.
These affects require an examination of the organisational structures required to
compete, (Kaye D, 1989).
Frank Land, Professor of Systems Analysis at the London School of Economics and
Political Science has investigated the impact of computers in the work place. He
concluded there were not enough studies to indicate whether the restructuring of work
and changes in job content would cause a de-skilling of jobs. He went on to look at
wider organisational issues and identified three phases set out in a model defined by
Hedberg in 1980. In phase 1 “the designers of information systems attempted to
130

increase the efficiency with which data processing tasks were carried out. The
introduction of computer systems had not been intended to change the organisation, and
if there were impacts on the organisation, these were largely unforeseen, often
dysfunctional, and surprised both designers and users.” In phase 2 “systems were
carefully designed to avoid organisational change.” “It is only in phase 3 that systems
designers attempt to use the technology to shape an organisation’s structure so that the
organisation becomes more effective.” (Land F, 1984).
Professor Land determined that in 1984 most UK companies were still in either phase
1or phase2. He believed that most systems were designed to achieve the limited
objective of cost saving. Objectives such as improvements in customer service, or
coping with growing work loads, and the provision of extra services without increasing
establishments, were also beginning to appear. Few applications attempted to alter the
decision processes of senior management, although many organisations used computer
systems to improve the timeliness and appearance of management reports. Professor
Land cites two studies undertaken as research for his conclusions. Both were companies
who had been using computer systems for a long time, one since the mid 1950’s, both
had implemented new systems the previous year and both were phase 1 or 2 systems.
He relates a further case study where a major driver for implementing a new system
was low job satisfaction, however that was not referenced in the statement of
requirements, or evaluated in the feasibility study, (Land F, 1984).
The work of Professor Land shows clearly that companies have found it difficult to
make the mental leap from automating what they do now, to evaluating the organisation
to find the most efficient structure and designing systems to suit. The first building
block for this evaluation has started in the 1990’s under the name of Business Process
Re-engineering.
In response to the challenge of the European Single Market in 1992, the PA consulting
group wrote a book, published by the CBI in 1990, called “Information Technology:
The Catalyst For Change”. This book analyses many aspects of IT and its effect on
corporate strategy in relation to the single European market. It briefly examines the
effect of IT on the organisation. It reviews a proposal by Levitt, which views the
organisation as operating in a state of balance between four forces, being, organisation
structure, tasks or functions, people, and, technology. Levitt proposed a model in the
131
shape of a diamond shown below. In the model a change in any of the forces operating
will lead to an imbalance, which must be countered by changes in the other three parts
to re-establish equilibrium.
Organisation
Task/
Function People
Technology
The Levitt Model
PA Consulting argue that it can be seen that by changing the technology alone the
efficiency of a company will not improve, as it has only disrupted the balance. There
needs to be task restructuring, training of people, and changes to corporate structures
and responsibilities to enable the technology to make the company more effective, (PA
Consulting Group, 1990).
7.3 Organisational Policy
In 1971 Victor Brink investigated the impact of computers on organisational policy. He
defined organisational policy as organisational structure and organisational
relationships. He believes there are six key questions which provide the setting for more
specific questions. His key questions are:
1. Will computers lead to a greater centralisation of authority and decision making?
2. How will the structure of line operations be affected?
3. What will be the effect on the role of middle management and the number of middle
managers?
4. How will the role, and related organisation, of staff activities be affected?
5. Will the profit decentralisation approach be weakened or strengthened?
6. What types of human problems will be involved, and how can they be best dealt
with? (Brink V, 1971).
132

Brink states there are a number of factors which bear upon these questions and will
influence the answers, these are listed below:
1. The degree of operational integration.
2. The nature and scope of operational relationships.
3. The nature of the major operations.
4. The need for prompt response to the environment.
5. The importance of human factors.
6. The historical traditions and management climate.
7. The management attitude toward decentralisation. (Brink V, 1971).
These are all specific to a particular company, hence the answers to the key questions
could vary between companies operating in different environments, or with different
cultures.
Brink carried out research by way of interviews, examination of organisation charts and
company papers, and observations to reach a set of major findings. He looks at this
from two aspects. The first where the computer replaces clerical tasks directly, the other
where the computer provides management information for decision making. The
findings are summarised below divided into these two aspects.
When a new computer application replaces certain clerical operations of a company, it
is expected that there will be changes in the job content for a number of individuals.
There will be new work flows built into the system’s design. These changes will then
require appropriate modifications in the organisational structure of that particular area
of the operation. The impact on organisational structure is a direct reflection of the
extent to which a computer application eliminates previously existing manual
operations and establishes new types of responsibility, covering input and retrieval of
the now computerised information. Similarly, the organisational arrangements reflect
the new flow of work and sequences of processing the new forms and papers. There are
not clear boundaries because the data to be input and the output will be used by other
areas. There will therefore be a ripple of lessening intensity emanating from the
changes, (Brink V, 1971).
133
Although many computer systems costs are justified by an expected reduction in
clerical staff, there is rarely a large reduction. Often there will be a freeze on
recruitment and there will be some loss through natural wastage. Other factors eliminate
the need for mass redundancies. These include the fact that most implementations occur
in an environment where the workload is growing, and more people would have been
required. Often growth requires computerisation to prevent an impossible situation
arising. Another aspect is that the computer system usually has a greater coverage than
the manual system it replaced. There is a broader range of service providing more
information, more accurately and more quickly than before, (Brink V, 1971).
Brink reports that he has found improved job satisfaction amongst clerical employees
after the introduction of computers. The reasons for this are quoted as a low level of
satisfaction from the previous system coupled with a satisfaction with the capabilities of
the new system, and in their new power in obtaining and processing data. Other
important factors include a recognition that their company is adjusting to the times, and
the enjoyment of being part of the team effort to develop and implement the new, more
sophisticated system. Some of these factors could be short lived and it is the design of
the work using the new system that is key, (Brink V, 1971).
At the lower and middle management levels there is also the potential for job losses, as
decisions made by these staff are covered by decision rules programmed into the
computer. Brink’s findings indicate however that there are more managers. The scope
of their jobs has changed, by replacing the previous routine decision making with the
management of more complex systems. The job has extended in scope and upgraded in
importance, (Brink V, 1971). This bears out the prediction made by Ansoff, (see section
7.3). It is not unexpected therefore, that managers' job satisfaction has also increased.
The thread of the successful management of change run through all of these findings
about duties and job satisfaction. These findings can be used to allay many of the
personal fears inherent in implementing a new computer system. People will be happier
to co-operate and less fearful for their future if their job security, job satisfaction and
power are guaranteed before implementation begins.
An instrumental factor in the determination of an organisational structure is the flow of
information. Brink believes that organisations, before the implementation of computers,
134

were moulded by mainly formal, bottom up flows of information, with some informal
flows, to allow people to do their jobs, made possible by informal personal contact.
The computer cuts across the organisation, giving greater depth and scope of
information to all, and especially central management. This he maintains is a force for
changes in organisational structure, (Brink V, 1971).
It is difficult to assess which organisational changes are due to computers and which are
due to other factors. The difficulty exists in the limitations of measuring the precise
impact of the various active factors, including computers, especially under conditions of
dynamic change in the external environment. Brink categorised the organisation into
general, line structure, and staff organisation to assess the impact of computers. His
findings at a general level have varied, but overall he found the high level
organisational policy is determined by factors other than computerisation. It was
generally believed that top management expected the computer activities to support the
organisational approach adopted, whatever that organisational approach may be, (Brink
V, 1971).
The investigation revealed more impact on line structure. This is because of the way
computers had been used to support activities in the fields of production, distribution
and sales, the traditional areas of line structure. The flow of work and the allocation of
responsibilities had necessarily been modified to fit the system. Increasingly, the
organisational arrangements and specific job responsibilities were focused on
supporting the system. The impact of the system extended beyond the operations of the
particular group and involved its relationship with other groups in the organisation.
This had an integrating effect on different areas of line operations, and integrated the
line structure with corporate management and staff, (Brink V, 1971).
Brink found there had been relatively little impact on the staff organisation, except
naturally, for the service department responsible for the operation of the computer
itself. He did predict a change that he expects to see in the future. The development of
central data banks would replace the separately stored information held by each
department. This would lead to a single uniform and authoritative source for
information. As a result the individual staff departments would be freed of work and
this could mean there might be reductions in the number of personnel. The use of the
common data bank, both in the planning and operational activities, could bring staff
135
departments' activities closer together in their day to day working relationships, (Brink
V, 1971).
On the question of centralisation, Brink identifies the forces acting for and against
centralisation. He cites the potential to analyse, plan and control centrally as a force that
encourages centralisation. There are a number of forces, however, that tend to oppose
centralisation. Business is complex and it is difficult to develop systems that can
satisfactorily cope with the complicated technical and financial activities. To remain
competitive, the trend is to develop products and services that cater more precisely to an
expanding range of actual and perceived human needs. This trend continuously extends
the complexity of corporate activities to provide the goods and services. The trend also
always seem to out pace the computer programmers ability to compile new systems,
technologically and that are justifiable economically. Human factors are a major force
opposing centralisation. Personnel at all levels need motivation. This is best provided
by challenging and meaningful tasks. This can be accomplished by giving individuals
considerable control over a substantial portion of their work and enabling them to see
the results of their own performance. This is true of personnel at all levels, but
particularly of managers, especially managers of decentralised profit centres. Brink
expects an evolving trade off between the forces for and against centralisation,
reconciling them. He concludes that computer applications in the foreseeable future will
not be the major determinants of high level organisational structure. They are a tool that
can aid managers to organise, as they see fit, in response to other more causal factors.
This emphasises a less than dramatic effect of computers on organisational design, and
expects an evolutionary development. Computers are seen as the servant not the master,
the role is to support good organisational policy, rather than causing the determination
of that policy. Thus, if top management wants to run a company on a centralised basis,
computers have the capabilities to support this organisational approach. If, on the other
hand, top management wishes to decentralise its operations, computers can provide the
means for assisting the decentralisation, (Brink V, 1971).
136

7.4 The Role of the Manager
An area of interest since the early days is the role of the manager. Ansoff stated in 1965
that the successful firm of the future will be one that gives appropriate and continuous
attention to both external and internal problems. The management structure was also
expected to be one that would be conducive to innovation. This would enable the search
for opportunities and problems to be institutionalised and continuous, (Ansoff H, 1969).
Here he is predicting the activities such as quality circles and kaizen (continuous
improvement) teams. The role of senior managers was expected to change. They would
act as the interface between the firm and its external environment, which would focus
their attention on entrepreneurial activities. They would search for opportunities and
problems, assess the firm’s product-market strategy. In this activity they would be
assisted by human-computer systems, (Ansoff H, 1969).
The expectation was that middle managers would be concerned with the internal
efficiency and response of the firm. The computer would make many of the
programmable decisions, which consumed most of their attention in the 1960’s. Their
attention would be directed toward the search for better decision rules. In this search
they would have the opportunity for a continuing study of the relationships between
their areas of responsibility and the rest of the firm. They would be expected to manage
by exception, that is to change the rules when appropriate, make decisions when a
problem cannot be solved by the computer, monitor computer decision making, and
take over when the computer breaks down. These managers would also continue to
devote their attention to leading, co-ordinating, and motivating their subordinates.
Because it was expected that the traditional staff activity of data acquisition,
compilation, and presentation would have been taken over by the computer, the
manager would require broader experience, with a thorough understanding of the firm’s
technology and be capable of dealing with problems on a combined economic-political-
cultural level. Management would require enhanced skills in human relations. In a
climate of change, increasing importance would be placed on the manager’s ability to
communicate rapidly and intelligibly, gain acceptance for change and innovation, and
motivate and lead people in new and varying directions, (Ansoff H, 1969). Ansoff felt
that if his predictions were correct, no one should worry about computers making
managers obsolete. The manager of the future would need all the computer help he can
get to cope with the greatly increased complexity of his job. The role of the manager
137

and the complexity of that role would also have a bearing on the number of managers,
as the job of management would have to be divided into job sized pieces, (Ansoff H,
1969).
There are three roles of middle management. These are being affected by IT. This in
turn affects the structure of the organisation. The three roles are the Relay Role, to
transmit and filter top level directives to lower levels of activity and monitor their
productivity; the Problem Solving Role, to take decisions for lower level activities; the
Functional and Co-ordination Role, to co-ordinate activities and planning with other
departments, (Kaye D, 1989).
Kaye analyses the changes in these roles due to IT. The relay role involves collating
information and passing it on. As IT enables the recording of information at the point of
activity and its presentation in a collated and analysed format, less management time is
needed. This then means that supervision ratios can be higher leading to fewer middle
managers. This also can reduce the number of management levels. Middle
management’s role in solving problems is becoming more important. This is because
computer technology is changing the role of the lowest level of activity to enable
responsibility to be taken for a greater range of manufacturing tasks, covering a volume
of production. This is causing a higher level of training at this level. The people at this
level are dealing with more complex problems due to the changed environment, and the
problems passed up to middle management are even more complex. All of the relatively
easy problems are solved by the computer. This has the opposite effect for the managers
time to the change in the relay role. The increased calibre required at this level makes it
more difficult to distinguish it from the level above and hence also has the effect of
decreasing the levels in the hierarchy. With a flattened structure the middle manager
will be more likely to consult with colleagues in other departments to solve problems,
hence also changing the co-ordinating role, (Kaye D, 1989).
7.5 Organisational Structure
Lucas makes the point that many different influences drive changes, and it is often
difficult to establish which changes can be directly attributable to the implementation of
a computer system. He found changes in the number of departments and the number of
levels of management in some instances. The effect of the computer in his studies was
138

inextricable from other variables, such as growth. Despite the evidence that a driver
exists for what has come to be called “de-layering”, he believes there is no reason why
computer systems should result in a drastic change in the number of levels of
management. Clearly it can be seen with hindsight computers have facilitated a change
by removing programmable tasks. De-layering was most likely driven by cost reduction
efforts and has yielded enlarged more interesting jobs, and hence more motivated
managers and shorter chains of command, giving more effective communications.
Lucas did predict some changes in the composition of departments and the relationship
between them without a drastic reshaping of the organisational structure, in common
with other writers. He also predicted some staff (as opposed to line) functions would be
transferred to top management, with the programmable work eliminated. This suggests
a reduction in staff department employees, (Lucas H, 1973).
Lucas makes a point of real relevance. This is that the pace of computer systems
development outstrips studies on their impact, and hence the studies which are up to
date have limited validity due to their small number. Here he implies that as they
develop the impact of the systems will change. It must be recognised that the drivers for
change of the sophisticated computerised management information systems of today are
likely to include a drive towards flexibility and towards enabling the type of
management systems proposed by the gurus of management thinking. Lucas concludes
that the designers of systems need to be sensitive to potential problems and consider the
possible effects of design decisions on the organisation. Under these conditions, there is
a much higher probability that the impact of the system will be consistent with the goals
and objectives of the organisation. This will be true, also of the desired organisational
structure to achieve those goals, (Lucas H, 1973).
Professor Richard Long has investigated the integrated nature of the elements in an
organisation’s design. He refers to examples of fragmented jobs, such as filing, typing
and quotations being merged into jobs using people with upgraded skills. By combining
jobs and automating menial tasks fewer people are required for the routine
manipulation of information. He states that this reduction is a driver to reduce the
number of supervisors. This effect will ripple up the organisation, the end effect being a
reduction in the number of hierarchical levels in the structure and a smaller
organisation, (Long R, 1984). This is down-sizing and de-layering in today’s language.
The advocates of this thinking today make much of the improved communication and
139

other advantages, but make no mention of the technology that has made such changes
possible. It is clear that job design has far reaching effects, from job satisfaction and
motivation to the structure of an organisation. The design of a computerised
information system has significant effects on the job content of many of a company’s
work force.
Professor Roger Mansfield identifies three functions that the design of an organisational
structure must achieve. The first he calls task accomplishment, i.e. getting the job done.
The second is managerial control and the third is cost. There are many factors that
influence the structure including the type of product and process, as well as geography
(location of customers and suppliers) and the type of customer. The organisation is a
division of labour, the logic is that by dividing tasks they can be done better, or faster or
cheaper. This applies to both the productive tasks as well as the support tasks, which
includes management, co-ordination and control, and cost regulation, (Mansfield R,
1984).
Professor Mansfield identifies a number of factors which have led to the expanded use
of computers. These include relative and absolute price reductions, increasing
computing speed and power, reducing size of hardware, an increasing range of ever
more sophisticated and versatile software, an increasing ability to deal with non-
numerical information, and more user-friendly interfaces requiring less specialised
training. The advent of these changes has changed organisations, in effect it has taken it
back 30 years to where it was before the large centralised computer systems, with
control back in the hands of department heads. There are the same departments as there
were then, work divided functionally, because they were successful in the past for the
three functions required of the organisational structure, (Mansfield R, 1984).
Taken together Professor Long and Professor Mansfield depict an unaltered structure in
terms of departments but with fewer staff, some migration of tasks at the boundaries,
and fewer levels of hierarchy over them.
Professor Mansfield concludes with a view of the future that predicts no great changes
in structure, but the re-working of many jobs, for example first level managers would
move to more personnel, industrial relations, and training types of activity. Top
140

managers would move towards more corporate planning and political work with
external contacts, (Mansfield R, 1984), (see 7.3 The Role of the Manager).
In an international study by Bjørn-Andersen, Eason, and Robey in 1986, (see section
7.7), it was found that computer systems were implemented in response to operating
problems or opportunities and that structural changes were an additional compatible
response to these problems or opportunities. It was found that sometimes computer
system implementation was fitted to existing structures, while sometimes they followed
structural change and sometimes they preceded changes. The notion that there is a
causal link between computer implementation and structural change is therefore not
proven. It was found however the more wide ranging and integrative the computer
application, the more likely there was to be structural change. In some cases both the
structure and the system were changed to give a better solution to a problem, or
response to an opportunity. This sometimes resulted from the system and the structure
not meshing together well. The range of structural arrangements was quite varied, from
strict bureaucratic to matrix and team designs. The greater the complexity of the co-
ordination task, the more complex the structure generally becomes. These structures are
suited to the relative flexibility of the application software available. The implication is
that both organisational structure and computer systems are available to solve problems
or seek competitive advantage, but they are both closely interrelated. Designing an
organisational structure without paying heed to the technical options will not produce
the most effective business solution. Equally, it is clear the design, or tailoring, and
organisation (access rights, etc.) of software applications should not be left to the
technical staff who often have little concept of organisation design. It is important to
take account of the effects of political issues of power, influence and discretion when
considering the total solution, (Bjørn-Andersen N, Eason K, and Robey D, 1986).
Kaye writes that IT developments are making it possible to change, or remove, the
frontiers between operational departments and functional and support departments. As
IT changes the information systems within a company, the split of people with different
functional skills into departments needs to be re-examined. In the past each department
did its own data capture, data processing and reporting. This led to different systems in
each department, both functional and operational. Now there is an integrating effect of
IT where data capture is at the point of the activity, data processing is automated
centrally, and reports are available for anyone who wants to see them, (and is
141

authorised to do so). Problem solving can be increasingly the province of computers,
especially for those problems of a routine nature. As more knowledge is built into ever
increasingly sophisticated software, expert systems are developed for problem solving.
All of this allows the integration of functional activities into operational areas. This is
the principle that underpins what today is called Cellular Manufacturing. What remains
are smaller functional departments dealing with exceptional problems and functional
planning. Key to the success of such a move are three factors, firstly cost - changes will
only happen if they are cost-effective, secondly - the availability of managers who are
able to run multi-functional teams, and thirdly - the levels of support available from the
expert systems and the “rump” functional departments. With smaller functional
departments it is possible that some combination of them could occur reducing the
overall number of departments. It is also more likely that multi-functional task forces
will be set up to deal with particular challenges, i.e. the ad-hocracy model is more likely
to occur. Kaye writes that an objective of exploiting IT to change operational and
functional department frontiers is to give better focus, adaptability, accountability and
economy, (Kaye D, 1989).
The Commission of the European Communities published a study in 1991. This looked
at the skills and qualification issues for Small and Medium-sized Enterprises (SME’s)
when introducing Computer-Integrated Manufacturing (CIM). Section II of the study
evaluated the implications for the organisation of work when implementing CIM. The
study reasons that failure to adopt a total systems approach can be expensive and lead to
failed implementations, also that this should be done at the conceptual planning stage to
avoid extra costs. It quotes K. Ebel as suggesting a number of studies show that
companies need to draw up efficient, integrated and flexible management and
organisational systems before they computerise. Those studies point to between 40%
and 70% of the total improvements achieved are due to the organisational change,
rather than the integrated technology, (European Communities Commission, 1991).
The EC study refers to the integrated nature of the IT, and how that cuts across
departmental boundaries. Such boundaries then become barriers disrupting the
integration. The study suggests that interdepartmental team work is not effective as it
allows each department the opportunity to refuse to take responsibility when problems
arise. It is argued that work should be organised to be tackled by interdisciplinary teams
who act as a group, understand each other’s areas of operation, and are not organised
142
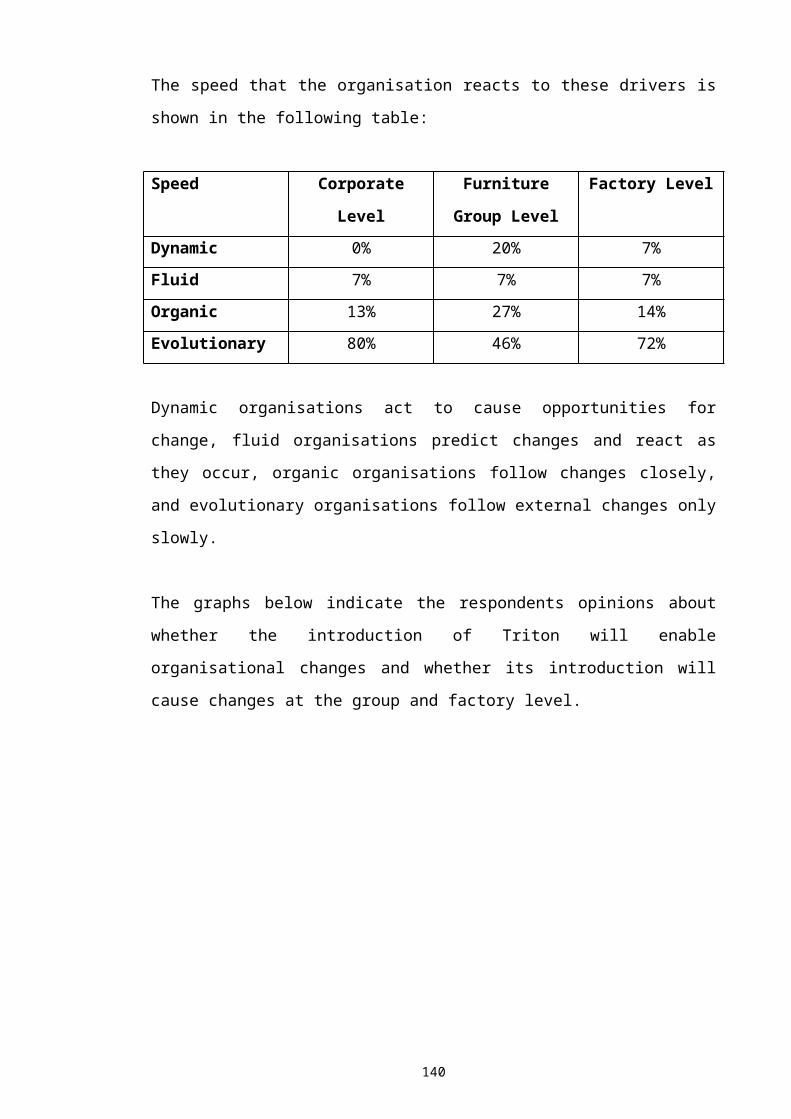
into separate departments. This enables problem solving as a co-operative group
activity. The study states that the work needs to be organised in terms of functions,
however because of the use of the word function in “functional departments” this is
confusing. Today the language used is to organise the work into business processes.
Examples of this would include the order winning process, the new product
introduction process or the logistics (or supply chain) process. The organisation around
these processes must be in small enough units to be managed effectively, however. The
study determines that an organisational framework must be established and maintained.
In establishing this framework it is necessary to draw upon expertise in all disciplines,
from all levels of the hierarchy, to ensure the complete picture is available. This has the
added benefit of educating people in the operation of the company as a whole, helping
to breakdown thinking and actions that do not cross departmental boundaries,
(European Communities Commission, 1991).
A number of factors are quoted as driving organisational structure away from the
Taylor model, of a standardised product, being produced by standardised process, by a
standardised organisation. These drivers are:
· Political changes in Europe
· The globalisation of world markets
· The globalisation of high technology production
· Competition between major trading blocks
· Demands by consumers for individually designed products
The new organisation needs to be flexible and adaptable within an overall integrated
framework. This framework should be made up of autonomous work groups giving
responsibility to individuals, but integrated by a common set of values and agreed
purpose and strategies. To implement such an organisation requires a change of culture
which emphasises trust, responsibility and initiative. The study stresses that a company
operating this new organisational paradigm is open to its external environment, able to
move quickly, requires a horizontal (not autocratic) style of management, with less
layers of management, and an emphasis on self management, within an active self-
learning environment. The supervisor’s role changes from control to that of motivator,
advisor and trainer, in today’s language a facilitator. The strategic role of top
143

management becomes more important in helping people to understand and agree to
work to common goals, (European Communities Commission, 1991).
7.6 Job Satisfaction
Due to the changing technology, early work could only deal with predictions about the
more global aspects of the impact of computers on organisational design. However, it
can be seen from this early work that the likely impact is in the detail, rather than at the
macro level where more potent forces are at play. In the mid 1970’s most companies
computer systems were centralised. Data was sent to the data processing department
where it was input on to the system, processed and results fed back to the department
responsible for the data. This had the effect of centralising power and pace in the data
processing department, making many managers feel they did not have sufficient
control, which is known to adversely affect motivation. By 1984 more integrated
systems were being developed and the advent of the personal computer had started to
have an impact. Many managers took back control at the expense of co-ordination and
integration. This quickly drove the need for the ability of individual user departments to
be able to input data into centralised computers. The outputs still depended on the data
processing department for some time however. At this time “The Management
Implications of Information Technology” edited by Nigel Piercy was published. This is
a collection of writings by eminent academics reviewing the issues some of which have
been drawn out here.
The beginning of general access to computers meant the design of the system, the
screen design, etc. all became significant factors in job satisfaction for a much larger
proportion of the work force. Professor Land concluded there is a potential for
information technology to exert social control on employees. Systems and organisations
need to be designed to ensure there is no negative effect of this potential, (Land F,
1984).
Professor Long also contends that such systems have the potential to affect the quality
of working life in both positive and negative ways. It could result in the creation of
work environments where employees are freed from tedious, repetitive tasks and can
concentrate on tasks that require judgement and skill. Alternatively, it could create a
type of organisation beyond the wildest dreams of Frederick Taylor, where machine
144

controlled people endlessly repeat identical tasks. The technology itself does not dictate
either of these outcomes. It is managerial values and beliefs that are the determining
factor, (Long R, 1984).
7.7 Empowerment
Centralisation is a major issue when examining the impact of computers upon
organisations. Henry Lucas, Jr. Reviews this in his book “Computer Based Information
Systems in Organisations”, published in 1973. He refers to early predictions of
centralisation and produces the following table of the early predictions on the role of
employees:
Top management Middle management Non-management employees
· Re-centralisation· Assume innovative
activities· More control over firm· More challenge· Become more elite
· Fewer managers· Lower pay· Less status· Less Planning· More programmed· Less mobility
· Replacement· Personnel versus
operating problems· Less mobility· Less creativity
(Lucas H, 1973).
He then revises these predictions based on knowledge at the time of writing his book to:
Top management Middle management Non-management employees
· Assume programmed functions
· Provide models for strategic planning
· Provide and organise planning data
· Assume operating problems
· Free manager for more managerial-control activities
· Provide planning models
· More training for top management
· Eliminate some jobs, enlarge others
· Help with operating problems
· Provide normative models for scheduling status, etc.
· Local replacement· Provide some job
enlargement
(Lucas H, 1973).The question whether instant access to information will cause a trend toward
centralisation was considered as early as 1966. There was already a trend toward
managerial decentralisation. The dispersion of authority was giving more independent
scope to more people. Since information technology began coming into use in the
145
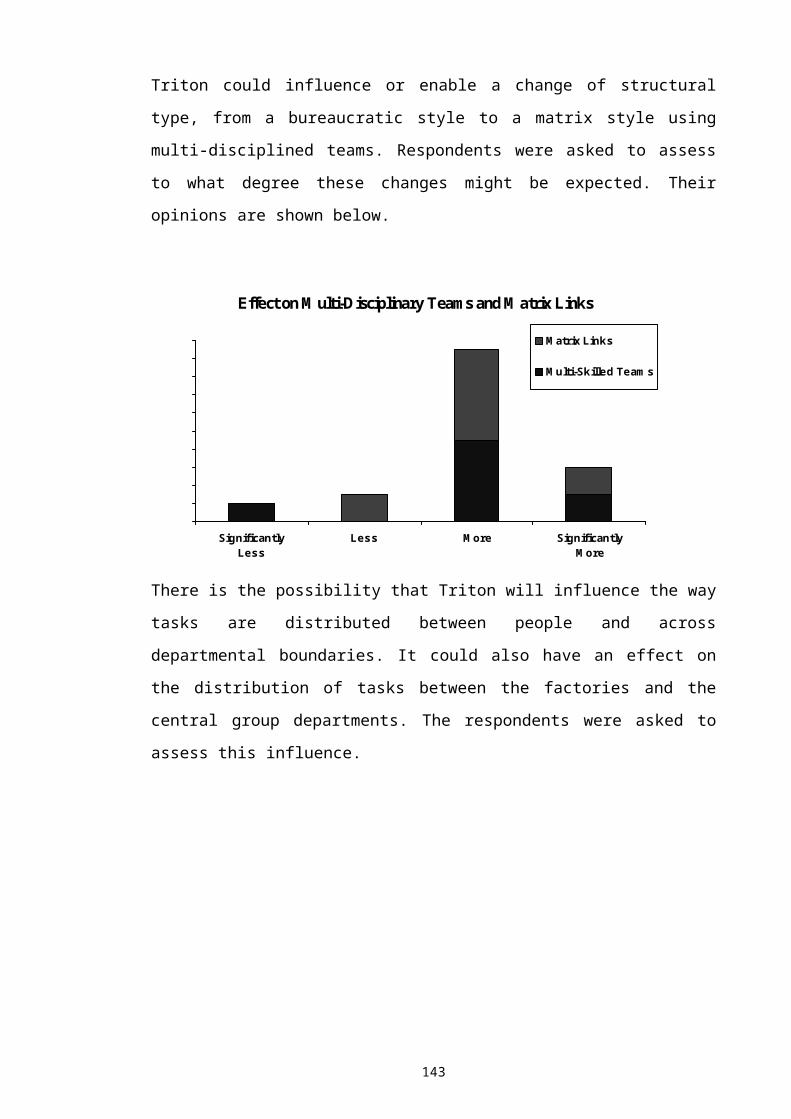
fifties, the trend toward decentralisation had accelerated, indicating there were better
reasons for decentralisation than lack of instant information at headquarters. Computers
can be used to reinforce either a centralising policy or its opposite. The expectation was
that decentralisation would be continued to lengths undreamed of ten years earlier,
(Ways M, 1969). This was prophetic and hints at the trend to decentralise below the
management strata that is now called “Empowerment”.
Dr. Ian Nicholas identified some drivers that act both upon the design of the
organisational and on the software applications. These include an increasing emphasis
upon flexibility, the capacity of the work force and the equipment to handle smaller
batches, increased product complexity, and higher demands for precision, (Nicholas I,
1984).
Dr. Nicholas asserts that these factors motivate against a bureaucratic structure with a
division of labour based on specialisation, decision making functional remote experts,
and de-skilling of shop floor activities. He believes the emphasis must be on making
decisions at the machine where the skilled knowledge resides. There must also be a high
degree of integration between the operator and the system, (Nicholas I, 1984).
7.8 Leadership Style, Power and Influence
In 1973 Niels Bjørn-Andersen, Ken Eason and Daniel Robey looked at the available
literature about managing computer impact. They decided the studies they found were
not wide enough to be relevant to organisations’ other than those studied. They
therefore conducted an international study of companies in the UK, USA, West
Germany, Denmark and Austria. Companies in eight different markets, from both
manufacturing and service sectors were surveyed. The study was based on case studies
and questionnaires to managers, subordinates and computer professionals. The
management questionnaire comprised 800 questions. This exhaustive study was
completed and presented in 1986, with contributions from other writes under the
editorship of Michael J. Ginzberg with the sub-title Computer Based Information
Systems in Organisations. Conclusions were drawn in many areas. Those areas relating
to organisation included: leadership style; organisational power, influence and
discretion of the different types of computer user; and the formal organisational
146

structure. Their conclusions about the organisational structure are presented in section
7.4.
The conclusions drawn from the part of the study into leadership style, were that an
increase in the amount of factual information, coupled with an increased check on
activities, led to an increased appeal to involve influential people, especially related to
computer issues. It seems computer systems complement existing communication
systems. This means that managers who see themselves as participative state that
computer systems have enabled them to be more participative. However managers who
do not see themselves as participative believe computer systems have influenced their
style to become less participative. One might conclude that computer systems therefore
are flexible and have no real influence on management style. This analysis at the
personal level is not borne out by an analysis at the organisational level. When an
analysis is made using the types of task undertaken by managers it is found that
participative managers tend to be those with particular types of tasks, and non-
participate managers a different set of tasks. In this case the computer system caused
non-participative managers to become more participative and participative managers to
become more non-participative. The computer systems hence has the effect of
harmonising styles. The difference in leadership style between the two sets of managers
is smaller after computer implementation, but the range of style within each set is
larger, (Reindl E, 1986).
Power and influence seem not to be directly influenced by the implementation of a
computer system. The study shows that they are affected by the decisions about access
to the information held within the computer, just as they would be by decisions about
access to information outside of a computer. The adage that information is power
appears to be true. Computers have the ability to spread or restrict that power, whereas
it is more difficult to spread information and easier to deliberately restrict information
(at all levels within the hierarchy) when computers are not present. The effect on
discretion appears to relate to the interdependency of tasks. Tasks which have a high
level of interdependency tend to restrict user discretion and this is especially true when
the tasks are timing critical and sequential. It can thus be seen that it is important to
bear these factors in mind when setting up the task procedures and access rights of a
computerised information system. This will be both at a personal level and at
departmental level. Those users in the middle of business processes benefit most in
147

power and influence, but suffer most with lack of discretion (method, timing and
choice), (Pederson P, 1986).
The study looked in particular at a production and inventory control system and noted
that the production planners gained power over the production management by virtue of
their knowledge about capacity and loading. While the organisational diagram showed
the materials management department as just another functional department it in fact
cut across the production process as if a matrix structure existed, (Pederson P, 1986).
7.9 Process Innovation
In 1993 Thomas H. Davenport writing for the Ernst & Young Centre for Information
Technology and Strategy produced a book called Process Innovation. He examined the
redesign of business processes through the use of information technology.
Davenport describes three elements of the redesign of business processes, the ends, the
ways and the means. The ends represent the corporate objectives, the ways are the
specific visions and the critical success factors, and the means are the enablers of
change. He asserts that the traditional approach is to define the ends, deduce the ways
from them, and then search for the means to achieve them. He quotes Hayes as
suggesting that the means for change should be provided and the directions in which to
apply them will become apparent as the environment changes. Davenport argues that
the greatest enablers of change are technologies, (of which information technology is
one), and organisational or human factors, (Davenport T, 1993).
148

Nine factors can be identified where information technology can impact upon
processes. These are listed below:
Impact Explanation
Automation Eliminating human labour from a process
Information Capturing process information for the purposes of
understanding
Sequential Changing process sequences, or enabling parallelism
Tracking Closely monitoring process status and objects
Analytical Improving analysis of information and decision making
Geographical Co-ordinating processes across distances
Integrative Co-ordination between tasks and processes
Intellectual Capturing and distributing intellectual assets
Disintermediating Eliminating intermediaries from a process
(Davenport T, 1993).
Some or all of these factors can be applied to improve the efficiency, effectiveness and
cost of processes. Some of the processes that can be improved are:
· Product Development
· Order Fulfilment
· Logistical
Just as IT can assist process redesign or improvement it can also act as a constraint. The
IT system may have been designed around a number of assumed processes. If these do
not fit the processes used in the business implementing the IT system conflicts will
become apparent. Most packages are modular. If these modules are based around
functions rather than processes then this can be a constraint to process improvement,
(Davenport T, 1993).
Information Technology alone is not sufficient to generate process change according to
Davenport. Organisational changes are also required. The organisational enablers of
process innovation are both structural and cultural. From a structural standpoint
research by the Tavistock School in the late 1940’s showed that teams coped better with
new technology than individuals. This is because combining multiple functions into the
149
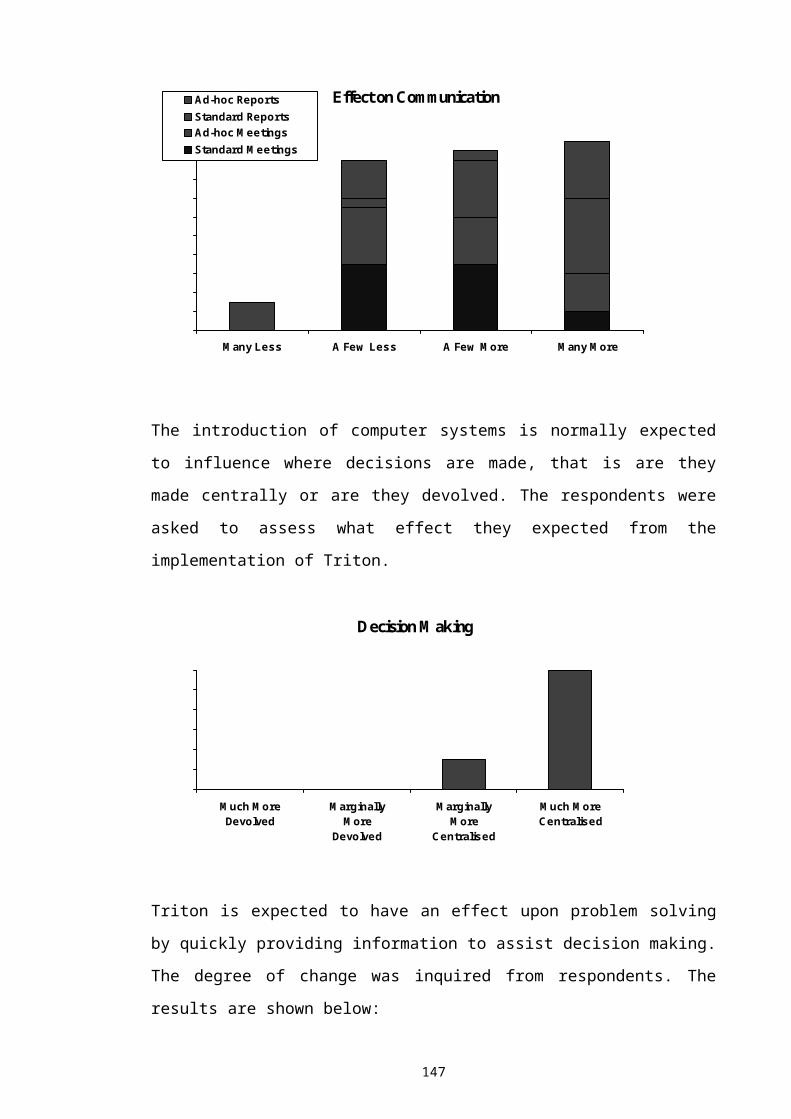
team enabled the team to be more adaptable to change due to the synergy generated.
The organisation of people into a multi-disciplinary team to carry out a particular
process thus breaks down functional barriers and allows the increasing pace of change
to be encompassed, (Davenport T, 1993).
The cultural enablers are those that move management style towards a more
participative approach. These can be brought about by the philosophies of
empowerment and de-layering already dealt with earlier in this chapter. Empowerment
however depends upon job design. Poorly trained workers doing repetitive menial tasks
are not likely to be motivated to innovate solutions to problems, (Davenport T, 1993).
Both structural and cultural aspects of the organisation can act as constraints as well as
enablers. This will be the case if the organisational design does not fit with the process
design. When re-engineering business processes these constraints must be removed.
When redesigning business processes it is necessary to create a process vision.
Furthermore this vision must take into account the company’s strategy, customer
perspectives and external benchmarks. Key questions about a new process include:
· How will it work
· How well will it work
· What things have to go right
· What things may not go right
(Davenport T, 1993).
150

Other factors to consider about a new process include:
· Key process characteristics
· Flow
· Output
· Performance
· Organisation
· Technology
· Performance measures and objectives
· Cost
· Quality
· Cycle time
· Responsiveness
· Critical success factors
· People
· Technology
· Product
· Potential barriers to implementation
· Resource allocation
· Organisational and cultural
· Technical
· Product factors
· Market and environmental factors
(Davenport T, 1993).
151

The following table shows the different approaches to improving business processes:
Approach Objective Tools/Method Roots
Activity-Based Costing
Cut CostCost build up over
process/value-added analysis
Accounting for product line
selectionProcess Value
AnalysisStreamline a single process/reduce cost
and time
Value analysis for each process step Consulting
approaches
Business Process Improvement
Continuously improve one or all processes in terms of cost, time, and
quality
Process step classification, quality tools
Total Quality Management
Information Engineering
Build a system along process lines
Descriptions of current and future
processes
Systems Analysis
Business Process Innovation
Use enablers of change to radically
improve key processes
Change enablers, future vision
Competitive systems
(Davenport T, 1993).
When designing a new process the following key activities can be identified:
· Brainstorm design alternatives
· Assess feasibility, risk and benefit of design alternatives
· Select preferred process design
· Prototype the new process design
· Develop a migration strategy
· Implement new organisational structures and systems
(Davenport T, 1993).
152
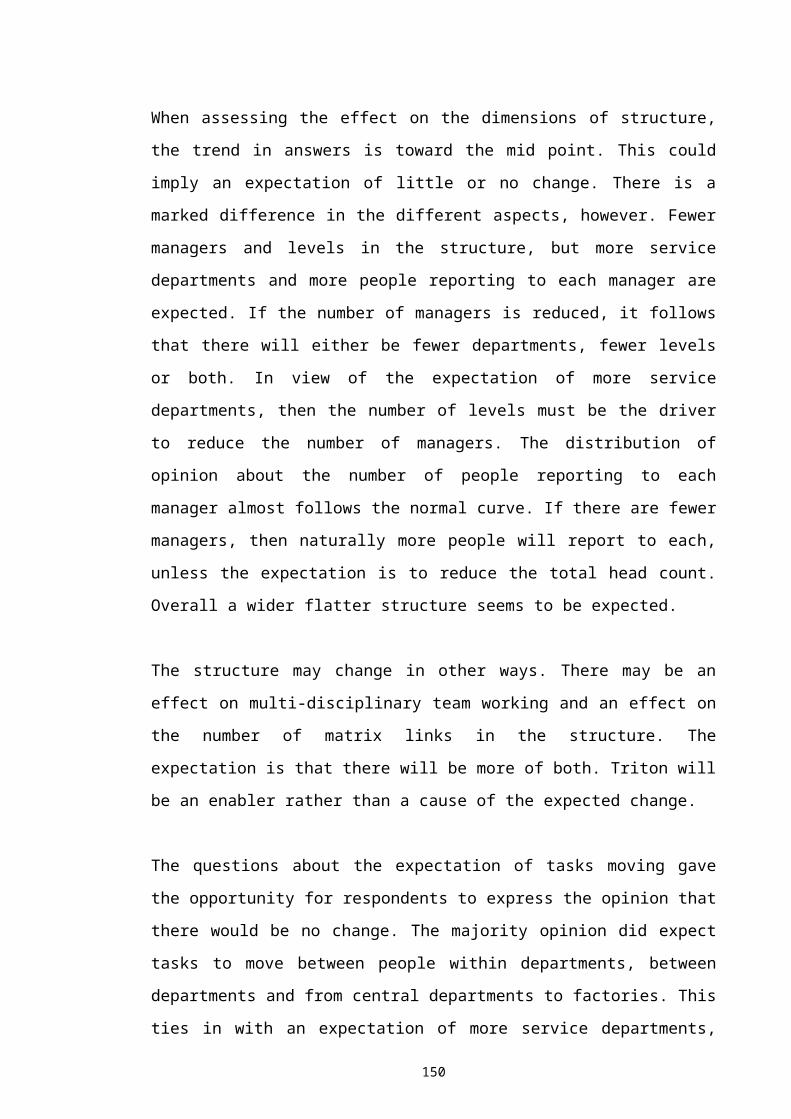
When mapping a process there are three levels of process design with the following
information required at each level:
1. Process Level
· Inputs
· Outputs
· Interfaces
· Flow
· Measures
1. Sub-process Level
· Objective
· Performance Metrics
· Who Performs
· IT Enablers
· Information Needs/Activities
· Value-Added (prerequisites)
· Activities in the Process (narrative)
1. Activity Level
· Information Needed
· Decision Point
· Who Does It
· Value-Added (optional)
(Davenport T, 1993).
When addressing the issue of organisational structure Davenport does not suggest
moving to a structure based purely on the processes. There are valid reasons for
functional structures which would be lost, for example, functional skills are important
to the successful completion of activities within processes. They need to be developed
and maintained and a functional organisation is the best method of achieving this. It is
also true that key activities can slip through the gaps in a process structure as well as a
functional structure. There will also always be the need for cross-process integration.
The problems of excessive time spent in meetings and on co-ordinating activities,
unclear reporting relationships, and diffusion of responsibility associated with a matrix
organisational structure are well known. The strengths of functional and process
153
structures can be obtained, however if these are two dimensions of such a matrix
structure, (Davenport T, 1993).
It is important to recognise that most structures are organic and evolve ever more
quickly. Processes change quicker than functions, which could lead to a rate of change
that is unstable if an organisation is structured around processes alone, (Davenport T,
1993).
7.10 Summary
The writers whose work has been drawn upon have shown that computerised
information systems will enable many of the methodologies proposed in the 1990’s by
the writers on best management practice, including down-sizing, de-layering,
empowerment and business process re-engineering. The commercial competitive
pressures on cost, customisation, reduced lead-times, higher quality and reliability, and
better functionality seems to have driven the development of the software applications
that has enabled the management methodologies. The influence on organisational
structure therefore is not the teaching of the guru’s or the IT but is the market.
The introduction of computers will give companies the scope to change the way they
operate and how they are organised. The increases in functionality and integration of
computer systems have been driven by business needs to organise more effectively. The
key points are summarised below:
· It will be possible to further centralise or decentralise decision making.
· Management time will be freed up by automating programmable decisions and
information dissipation, but better calibre managers will be required.
· Spans of control can increase.
· Job content will change.
· Job satisfaction will increase, for both clerical and management employees.
· Top management will have more time for strategic planning.
· There will be some scope for de-layering and down-sizing.
· It will be possible to gain competitive advantage by shaping the organisation’s
structure to gain the benefit of the enabling influence of the computer system.
154

· Empowerment is possible because information can be dissipated.
· Computer systems tend to complement existing communications systems.
· Computer systems can alter the power and influence of individuals.
· Computers can reduce new product development time, and hence product lives, and
can assist mass customisation by coping with complexity. The designer of the
organisation must take this into account so that the structure enables competitive
advantage to be gained through these means.
· Cellular manufacturing is possible when expert knowledge is available via the
computer allowing functional activities to be integrated into operational areas.
· Organisational structure is likely to change more often in response to changes in the
operating environment.
· There is a balance to be achieved between the organisation, the technology, the tasks
and the people.
· The integrated nature of computer systems requires a holistic approach to
organisation design.
· Organisation into interdisciplinary teams arranged to execute business processes, is
possible and gives enhanced problem solving abilities.
· The flexibility and adaptability of computer systems allows the organisation to
change, within an overall integrated framework, to suit business needs.
· Information Technology enables business process re-engineering.
155

Chapter 8. The Search for Solutions: Best Practice
This chapter describes a survey of companies who have experience of successful
implementations of systems similar to Triton. The survey seeks to establish the
influence of the system on a number of organisational issues. The survey itself is
included in appendix E. The chapter covers the selection of the companies, the format
of the survey and the approach taken by it. The chapter then goes on to collate and
present the results. The results are then analysed. Possible drivers for the answers given
are discussed, including where answers to different questions appear to conflict.
8.1 Approach: Benchmarking
The objective was to use the survey to benchmark what is the best practice
organisational design. For this reason the selection of companies to survey was critical.
Considerable time was spent searching for appropriate companies.
The first company approached was Project Office Furniture PLC. They are an ex-
employer of the author. They are a member of the Department of Trade and Industry’s
Business excellence club. They have been using MRP systems for many years and have
recently updated to an equivalent of Triton. Their short list of 7 products included
Triton.
The second company to be approached was the suppliers of Triton, Baan. It was felt
that their consultants would have experience of many implementations. They would
have knowledge of many different types of company and should be able to determine
organisational critical success factors.
The third company that was approached was York International. The company had been
used in a case study, in a DTI publication, about MRPII. They are an established
business in the refrigeration and air conditioning industry. They were portrayed as a
company who had learnt from the implementation of an MRPII system and had
achieved excellence in its operation.
156

The fourth company approached was Hoechst Tresaphan, formerly Courtaulds films.
They manufacture polypropylene food packaging materials. They were presented as a
case study in a booklet about the Best Factory Awards, published by Management
Today, the magazine of the Institute of Management. This was obtained from the
Cranfield University School of Management who administer the awards. This indicated
that they excelled in the areas of capacity management and cultural change. They had
changed their organisational structure to gain efficiency.
Because MRPII functionality lies at the heart of the Triton system, and this is
predominantly a production planning and control tool, the search was focused on this
area. The Institute of Operations Management was approached to see if they could
suggest potential companies. This institute was formerly the British Production and
Inventory Control Society. They were unable to do this, but suggested other useful
information may be gained from their library and web site on the Internet. When
looking at the I.o.M. web site it was noticed there was an I.o.M. news group, based on
the web site of egroups.com. This was used to send an e-mail to all members of the
news group asking if anyone could help complete a best practice survey. There were
three replies. Because these people had been contacted via a professional institution and
had responded to a request for knowledge of best practice it was felt they were likely to
have that knowledge.
The first respondent was a consultant. He is a certified consultant for a package called
SAP which is the market leader for Triton type software. He has experience of
implementing this package. He also teaches the production planning module at the SAP
academy at Heathrow.
The second respondent was from Bell Equipment in South Africa. He had been
involved in the implementation of software called MAPICS for them. MAPICS is also
in the top echelon in terms of sales of this type of software.
The third respondent was a Supply Chain Analyst working for Hewlett-Packard. He
was leading a project to remove an MRP system, where the implementation had failed.
This was because they had tried to impose the system on business processes that were
inefficient. They decided they needed to remove the MRP system, re-engineer their
157
business processes, and then apply process specific software solutions, rather than an
integrated system.
8.2 The Survey Format and Approach
The survey was based on the same questions as the internal survey of managers
expectations, (see chapter 4). It was again deliberately designed in a multiple choice
format. Twenty nine questions were posed. This was achieved by removing irrelevant
questions from the internal survey. Again it was important to keep the format short
enough to encourage recipients to complete it, but be long enough to be thorough. It
was also important to give the impression to the recipients that it was thorough,
professional and serious. It was expected that recipients would take about 15 minutes to
complete the survey. The multiple choice answers were usually a choice from 4 options
to prevent respondents simply opting for the middle ground, as in the internal survey.
They were again phrased to exclude the no change option in most cases, however again
some respondents wrote that option in and used it. The analysis that follows respects
that opinion by assuming both options either side of the middle position were answered
by that particular respondent giving a neutral effect.
The questions follow the same pattern, and in many cases are identical to, the internal
survey.
158
8.3 Collation and Presentation of Results
The potential drivers of organisational change were listed and respondents asked to rank
them. The results are presented in the following table:
Rank Corporate Level
1= Customers
1= Profit
3 Pressure from competitors
4 Advancing product and process technology
5 Manpower skills available
6 Cost
7 Information Technology advances
8 Political/Government requirements
9 Society’s expectations
The speed that the organisation reacts to these drivers is shown in the following table:
Speed Responses
Dynamic 50%
Fluid 33%
Organic 17%
Evolutionary 0%
The definitions of the types of speed of response of the organisation to the changing
environment are the same as in chapter 4.
159

The graphs below indicate the respondents opinions about whether the introduction of
an MRPII system enables organisational changes and whether its introduction causes
organisational changes.
Does the introduction of an MRPII system enable organisational change
MuchMore
Difficult
SomewhatMore
Difficult
SomewhatEasier
MuchEasier
Does the introduction of an MRPII system cause organisational change
Significant Some Minor None
160
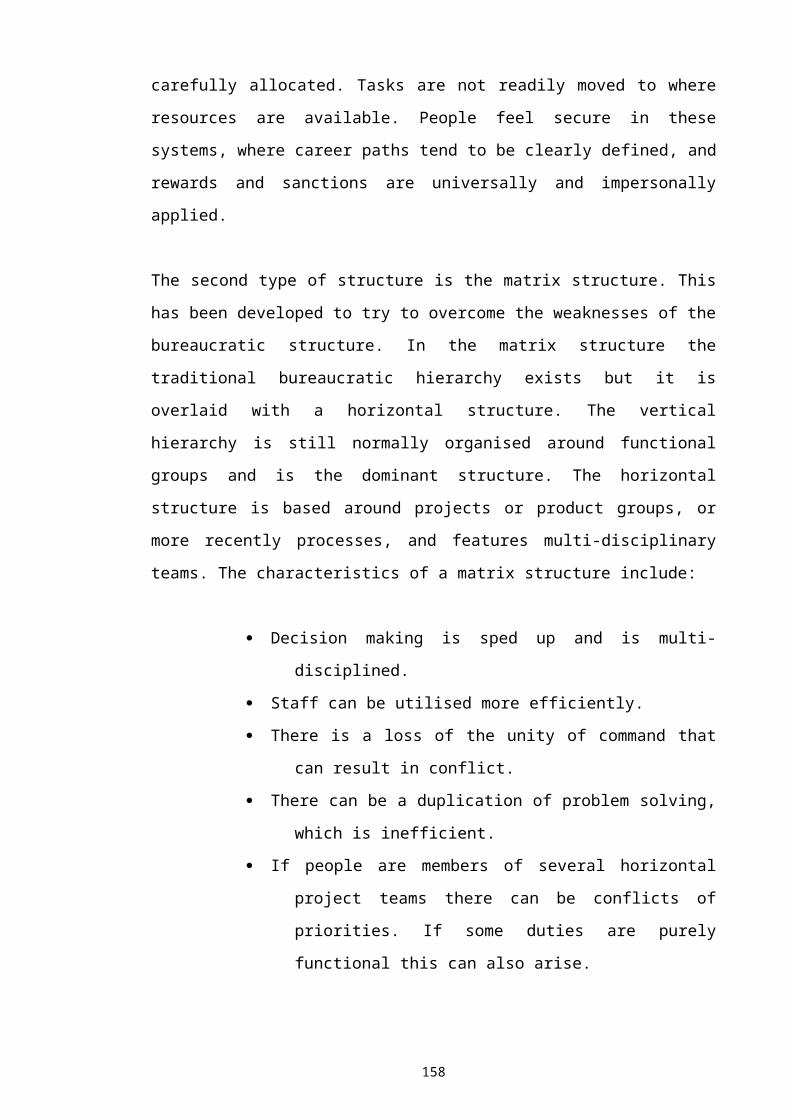
The graph below shows the relationship between the numbers of managers, service
departments, levels in the hierarchy and spans of control. The respondents were asked
to assess the effect of introducing an MRPII system on these factors.
The effect of introducing an MRPII system on the dimensions of the structure
Many Less A Few Less A Few More Many More
ManagersLevelsService DeptsPeople for Each Manager
An MRPII system could influence, or enable, a change of structural type, from a
bureaucratic style to a matrix style, using multi-disciplined teams. Respondents were
asked to assess to what degree these changes might be expected. Their opinions are
shown below.
Effect on Multi-Disciplinary Teams and Matrix links
SignificantlyLess
Less More SignificantlyMore
Matrix Links
Multi-Skilled Teams
161

There is the possibility that an MRPII system will influence the way tasks are
distributed between people, within and between departments. The respondents were
asked to assess this influence.
Task Movement Within & Between Departments
Many Few None
Within Departments
Between Departments
An MRPII system will have an influence on the design of jobs and the ways in which
jobs are done. It will therefore influence procedures. Respondents were asked to
evaluate the degree of change.
Effect on Procedures and Job Design
NoChange
MinorChange
SomeChange
SignificantChange
Procedures
Job Design
162

The following graph assesses the respondents' experience in terms of changes to job
satisfaction following on from the introduction of an MRPII system. A stacked bar
graph has been used as each factor improves motivation if enhanced.
Job Enrichment Effect
Much Less A Little Less A Little More Much More
Feedback
Autonomy
Task Importance
Task Variety
Skill Variety
The introduction of an MRPII is expected to influence the formality with which people
must work. It will also effect the amount of supervision required. Respondents were
asked to assess these factors. The answers will depend on individual perceptions about
the previous levels of formality and supervision, which will vary between companies.
The Effect on Formality and Supervision
Much less A Little Less A Little More Much More
Supervision
Formality
163

The introduction of an MRPII system is expected to influence the methods of
communication. Because it is an integrated system some communication should be
totally within the system, reducing the need for reports and meetings. The respondents
were asked to assess the effect of their implementation on these factors. Their responses
are shown in the graph below.
Effect on Communication
Many Less A Few Less A Few More Many More
Ad-hoc ReportsStandard ReportsAd-hoc MeetingsStandard Meetings
The introduction of computer systems is normally expected to influence where
decisions are made, that is are they made centrally or are they devolved. The
respondents were asked to assess what effect they experienced from the implementation
of an MRPII system.
Decision Making
Much MoreDevolved
MarginallyMore
Devolved
MarginallyMore
Centralised
Much MoreCentralised
164
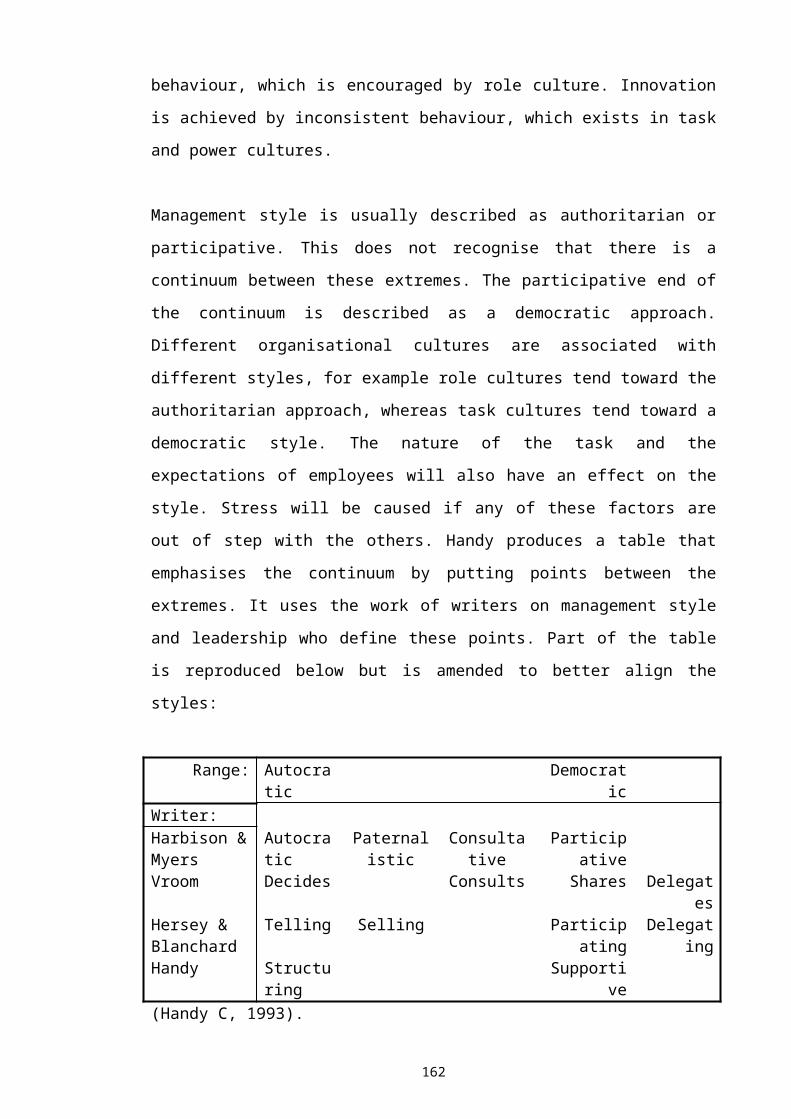
An MRPII system has an effect upon problem solving by quickly providing information
to assist decision making. The degree of change was inquired from respondents. The
results are shown below:
Effect of an MRPII System in Problem Solving
Much Less A Little Less A Little More Much More
Ability to React Quickly
Ability to Innovate Solutions
8.4 Analysis of results
The ranking of the drivers of organisational change shows the need to make profits for
shareholders, and the needs of customers, are of paramount importance in shaping the
organisation. If customers do not receive the service they require they will go
elsewhere, affecting the viability of the company. The typical commercial company
operates in a fiercely competitive market, which may explain why pressure from
competitors is rated third in importance. Superior product and process technology are
often seen as a way of achieving competitive advantage. Adapting the organisation to
take best advantage of this technology is therefore relatively high at fourth in
importance. The remaining factors tend to be constraints that shape the organisation. A
shortage of skills will have more effect than the availability of extra skills. In a similar
way the control of costs in sixth position is often seen as a brake on business. The
position of information technology is notably low on the list of potential drivers for
organisation change. The requirements of government and society are relatively remote
and are not surprising at the bottom of the list.
165
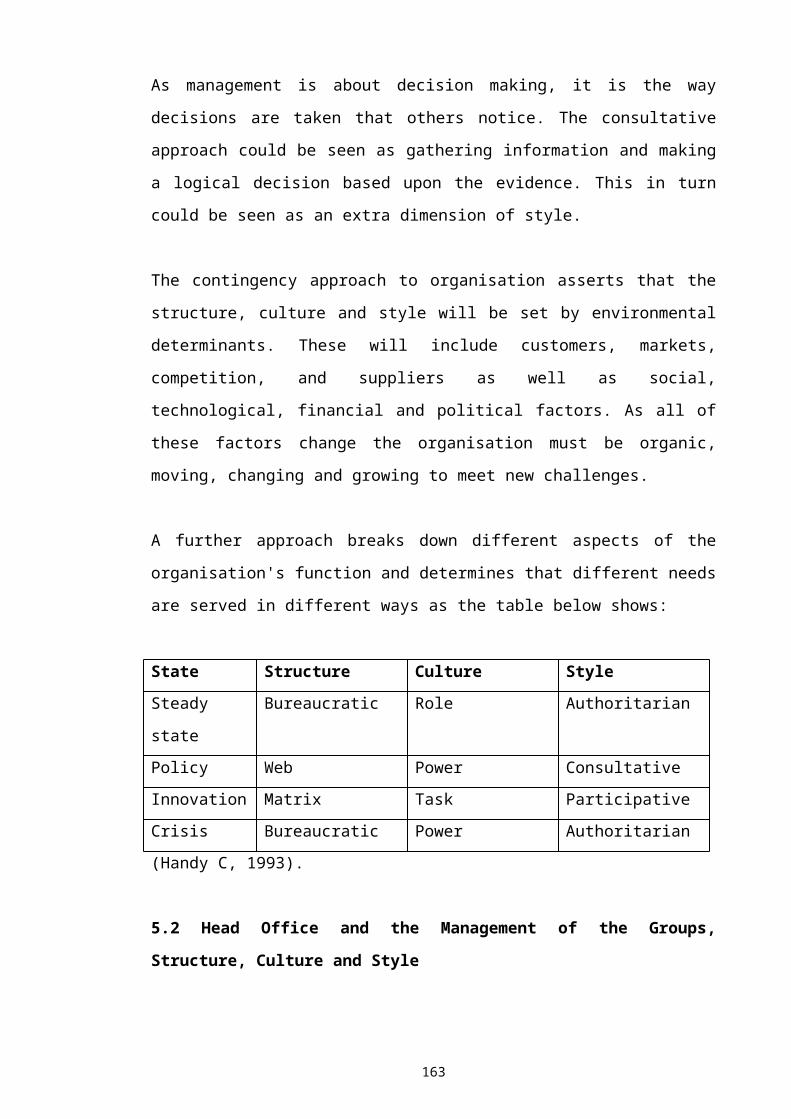
It is expected that companies who exhibit best practice in one area are likely to exhibit
best practice in other areas. It is not surprising that they rate the speed of organisational
change in response to changes in the operating environment weighted toward the faster
end of the spectrum.
When asked if the introduction of an MRPII system enabled organisational change all
respondents indicated that it made changes easier. When asked if the introduction
caused organisational change the answer was an even more emphatic yes. This could be
because the system acts as an enabler of beneficial changes that could not be made with
previous systems, rather than it causing changes per se.
When assessing the effect on the dimensions of structure the answers given show a
definite trend. Fewer managers, levels in the structure and service departments but more
people reporting to each manager were experienced. If the number of managers was
reduced, together with the number levels, and the number of departments, then it
follows that there will be more people reporting to each manager, unless the total head
count was also reduced dramatically. Overall a smaller flatter structure seems to have
resulted. Two respondents were categorical, however, that there were the same number
of managers and the same number of levels. One of them also said there were the same
number of service departments and number of people reporting to each manager. The
answers do depend where the base line is for all of these factors. Another respondent
said that the number of managers, levels and people reporting to each manager
depended on whether decisions were centralised or devolved. The software enables both
rather than dictates a particular style, see below.
The structure may have changed in other ways. There may have been an effect on
multi-disciplinary team working and an effect on the number of matrix links in the
structure. The experience was that there were more of both, although the increase in the
number of matrix structural links was not so emphatic as the number of multi-
disciplinary teams. This suggests that multi-disciplinary teams had been set up in non-
matrix style organisations as well as matrix organisations. This is notable when taken
together with the answer that all respondents had experienced a move towards a
structure based on processes rather than functions.
166
These changes would be likely to cause changes in the distribution of tasks in the
companies. The answers to the questions about this bear this out. Tasks had moved
between individuals within departments and to a slightly greater extent between
departments. With the number of departments reducing, and the roles of the remaining
departments changing to encompass multi-disciplinary team working, based around
business processes', tasks would have to move and jobs be redesigned. There would also
be an effect on procedures. The effect on the content of jobs was said to be significant
with a bigger change in procedures. This might be explained because the same business
processes would be taking place, but carried out by different people within different
departments. Hence the procedures would change to reflect this, but how each task was
performed would not necessarily change. When making changes of this nature however
there is the opportunity to re-engineer the business processes and no doubt some
companies did this.
The effect on the job satisfaction was also investigated against the model described in
section 4.1. Overall there was clearly an increase in all the factors that lead to job
satisfaction in the model. Some companies did report less varied tasks and less
autonomy, however. One respondent also reported no change to the amount of feed
back. Another respondent reported more skills required for some jobs, but less in
others. According to the model the majority will experience feeling that the work is
more meaningful, will have knowledge of the results of their endeavours, and will feel
more responsibility for the outcomes of their work. This motivates employees to
achieve better quality work. Having achieved this, employees experience a feeling of
pride and self worth. This results in lower absence, lower labour turnover and
employees that are growing individually and as a team.
It is difficult to assess the effect of introducing an MRPII system on the formality with
which work must be undertaken, and the level of supervision required, because it
depends on the levels of these factors before the implementation, in the individual
companies. The questions had been asked in the internal survey of expectations, (see
chapter 4), and so were included in the best practice survey. There was a significant
majority view that it is necessary to work in a much more formal way. Those that gave
answers that do not reflect this view may have already been working very formally. The
majority also expressed the view that there was less requirement for supervision,
although one reported no change. This again depends on what was required before, and
167

those that experienced a requirement for more supervision may have been operating
with less at the start. This could suggest that the introduction of an MRPII system
narrowed differences in supervisory requirements. After training, and with more formal
ways of working, it is logical to assume less supervision would be required. This would
have the effect of decreasing the amount of time each manager spent supervising each
employee, enabling the managers to increase their span of control. This ties in with the
increase in the number of people reporting to each manager highlighted above. It also
ties in with a possible strategy of empowerment.
An integrated management information system should have some effect on
communications systems. Four questions were posed, about standard and ad-hoc,
reports and meetings. Opinion was very divided, with no clear trend. Much will again
depend on the position before the computer system was introduced. It seems it is the
needs of the business that determine these factors, with or without the introduction of a
computer system. The vision of the paperless office and reduced meetings as a result of
computerisation is therefore flawed.
The communication systems are closely linked to the decision making process. The
effect of introducing a management information system, on how centralised or
devolved this is, depends again on the situation before implementation. Respondents'
experience was split, although the majority did report more devolved decision making.
This was probably due to a conscious effort, with the MIS acting as an enabling
technology, which could be used to devolve or centralise decision making. Two
respondents indicated this explicitly, and one indicated that it would cause decision
making to go to one or other extreme.
Decisions are often taken in an attempt to resolve problems. Better, more timely
information should allow problems to be resolved quicker and better. When asked if the
introduction of an MRPII system had enabled a quicker reaction to problems, and an
enhanced ability to innovate solutions to problems, the results were clearly that it had.
This was especially true of the speed of response. This does depend on data being
gathered and input to the system so that it is there and up to date for the decision.
Otherwise a quick decision could be made on out of date information, which could well
be a bad decision.
168

8.5 Determination of Best Practice
Changes in information technology are not a prime driver for organisational change.
Many of the aspects of an organisation's design are not directly affected by a change in
IT, but computers can be enablers of change. In some cases this change still requires a
strategic decision, because the IT only widens the spectrum of choice available.
Best practice companies are likely to use changes in IT to enable changes in the
organisation. They are companies that are looking to change constantly to avoid threats
and take advantage of opportunities in their environment. They will make large and
rapid changes when they are necessary, or advantageous.
As a result of a successful MRPII implementation they will change to have a smaller
flatter structure, which uses multi-disciplinary teams organised to carry out business
processes efficiently. They will move away from functionally based organisations. They
may use a matrix organisation to ensure best practice and common standards are applied
by specialists within different teams, although this is not always the case. To achieve
this new structural model they will move tasks between people and departments as
necessary. This will necessitate changes to procedures and the re-design of jobs. The
result of the team working approach, the re-designed jobs and the effect of the MRPII
system will be an increase in job satisfaction coupled with better quality work and
lower absenteeism and labour turnover. Less supervision will be required, but more
formality will be demanded.
The communications systems will be designed around the needs of the business, not
dictated by the software. The number of reports generated by the system and their
content will be curtailed and tailored, to suit a management by exception approach. The
number of meetings will match the need, but attendees will be armed with better quality
and more timely information. Decisions made at these meetings will be better.
The decision making process is likely to be devolved to the lowest level where all of the
information and expertise exists to make effective decisions. Problems will be solved at
this level quickly and with more innovative and relevant solutions.
8.6 Summary
169
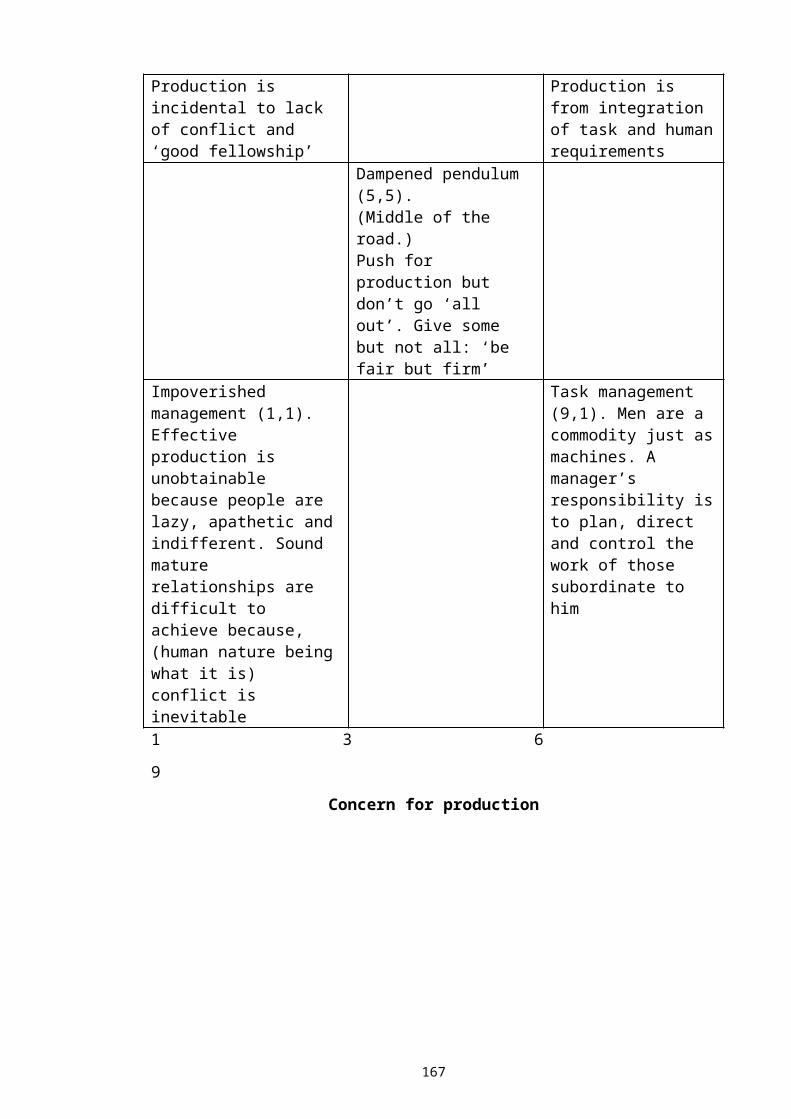
· IT enables organisational change, rather than driving it.
· In best Practice companies a flatter, smaller structure is found.
· Matrix structure are sometimes found, but not always.
· Organisations tend to be based around business processes, rather than functions.
· To achieve the new organisational paradigm tasks are moved between people and
departments.
· Jobs get redesigned, and procedures are changed resulting in multiskilled teams.
· More formal ways of working are necessary.
· Teams are empowered, leading to less supervision and enhanced job satisfaction.
· Empowerment results in devolved decision making.
· Communication systems are based on need and not the capability of the IT.
· Problems are solved quicker and better.
170
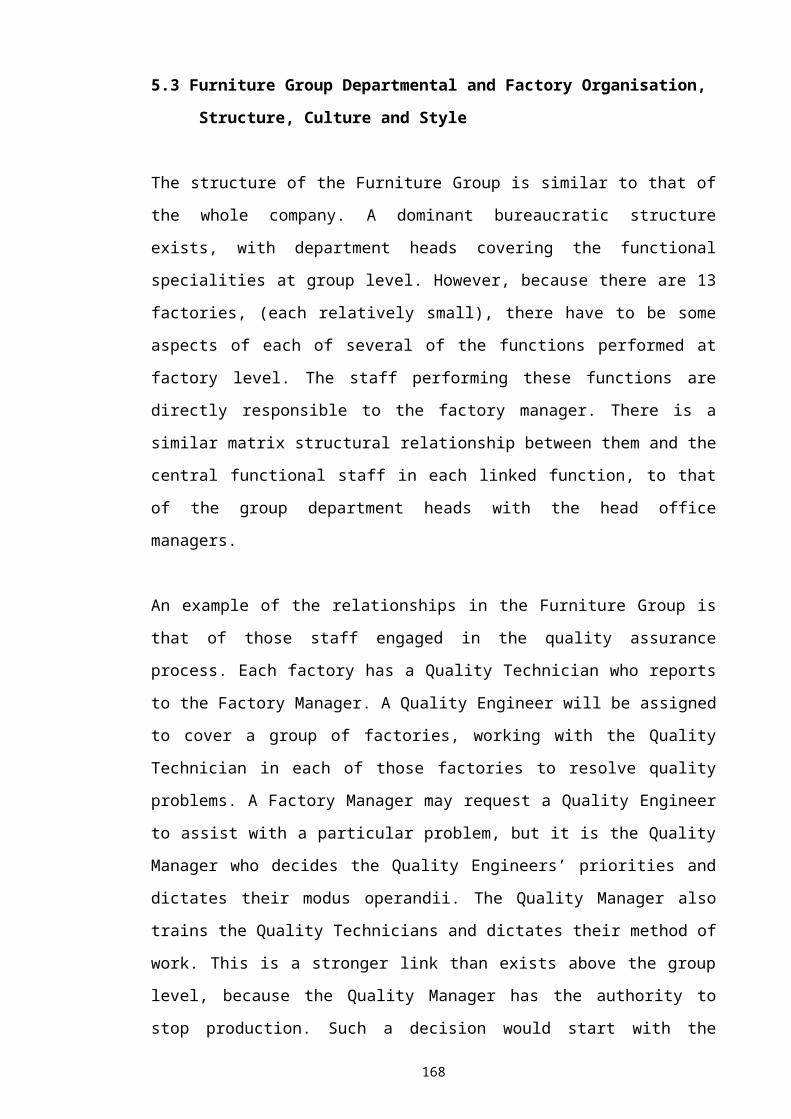
Chapter 9. Formulating Options
This chapter draws together the expectations expressed in chapter 4, with the research
in chapter 7 and the best practice in chapter 8 to formulate a number of common
themes. From these themes a number of critical success factors are then distilled. Some
alternative solutions are developed that include these factors and are evaluated and
compared. Finally the benefit of success is weighed against the cost of failure for each
option.
9.1 Common Themes from Research, Best Practice and Managers Expectations
The general agreement is that the introduction of a system like Triton makes
organisational changes easier. It is also agreed that changes are made more likely by
such an implementation. The dimensions of structure are one facet of an organisation
that can change. It is likely to result in a flatter, smaller structure with fewer
departments and more people reporting to each manager. There is an expectation of a
flatter but wider organisational structure, however.
Changes in job content are expected, with tasks moving between people and between
departments. A commensurate change in procedures is expected. Best practice and
published work indicate that this is a realistic expectation.
More recent published work and best practice indicate that there is a change towards re-
engineering the business processes. Following this with the practice of organising
interdisciplinary teams to execute those processes. The changes in job design and
organisation result in enhanced job satisfaction. The expectation of Furniture group
managers is that there will be some movement in this direction.
The expectation is that marginally more supervision will be required. Best practice and
published work, however, indicate that much less supervision is required because teams
and employees can be empowered. More formality is expected and this expectation
appears to be justified. The varied expectations about changes to the systems of
communication bear out the variety of effect experienced by companies. There is an
expectation of much more centralised decision making. This is not Best practice.
171

Empowerment requires that decisions are devolved. However this will be a strategic
decision as Triton will allow the status quo to be maintained, or for decisions to be
devolved, or centralised much more.
Although the expectation of management overall is that there will be no real effect on
the ability to react quickly to problems and innovate better solutions, the indications are
that the introduction of Triton will improve both of these factors.
9.2 Key Differences Between Best Practice and Managers Expectations Surveys
There was a high correlation between the results of the two surveys to many of the
questions. This is encouraging. However, there were a small number of key differences
emerging between the two surveys.
Pressure from competitors was ranked higher by respondents to the best practice survey
as a driver for change than by Remploy managers. This could reflect the history of
protected markets, and could be a worrying viewpoint in today’s open markets. The
manpower skills available are ranked as a less powerful driver by best practice survey
respondents than Remploy managers. This could indicate that finding appropriately
skilled disabled people is a constraint on the business, especially at factory level.
Remploy managers expected a few more service departments being required as a result
of implementing Triton. However, the consensus of best practice is that there will be
fewer departments.
Some more marginal differences included a stronger increase in multi-disciplinary
teams from the best practice survey than expected by the Remploy managers. Also
managers’ expectations were for less autonomy over work for employees, whereas best
practice companies found there to be more autonomy. The effect on decision making
varied and reflected the views of how top management would be expected to manage.
172

9.3 Critical Success Factors Emerging
The common themes have running through them a number of factors that appear to be
critical to the success of joining the most competitive companies. These factors centre
around the techniques that the top management consultants and writers recommend
implementing to be a world class company. These include business process re-
engineering, empowerment, team working, interdisciplinary and multi-disciplinary
teams, process based organisations, de-layering, down-sizing, lean manufacturing, and
agile organisations.
9.4 Options
When designing an organisational structure, the first question to be answered is why
have a structure? A structure serves several purposes. It co-ordinates activities, and
integrates the output of individuals to achieve the desired outputs of the whole
company. It also responds to changes in output requirements and ensures they are met.
Finally it defines responsibility and authority. Any structure will achieve these
purposes, to a greater or lesser degree, depending upon its design. The functional
bureaucratic structure is very good at defining responsibility and authority but does not
cope well with change or have the ability to foster innovation. The addition of a matrix
layer to a structure blurs responsibility and authority but co-ordinates and integrates
well. It is better adapted to react to change and assist innovation.
There is a structure in place and as described in chapter 5 it is a functional bureaucratic
style, with some elements of a matrix overlaid in some areas. This structure has
developed piece meal and has changed organically to meet changing needs and a
changing environment. It could thus be argued that this is the best structure for today. It
is, however useful to take a step back sometimes and review the structure as a whole.
The scores in the measure of organisational effectiveness show there is clearly room for
improvement, and a step change could be possible, rather than the continuous
improvement derived by reacting to, or predicting changes in the operating environment
as they happen. The introduction of Triton with its enabling characteristics is an ideal
time to take this step back and redesign the organisational structure. When doing this it
is vital to keep in mind the purpose of the structure as defined at the beginning of this
section.
173

There are a number of key options about the overall fundamental design principles of
the structure. At lower levels these options can be mixed, for example a department in a
traditional bureaucratic structure may have a matrix organisation within it.
The key options are listed below:
· Bureaucratic or Matrix
· Functions or Processes
· Cellular or Traditional Manufacturing.
9.5 Evaluation of the Options
The advantages and disadvantages of bureaucratic and matrix styles of organisation
were outlined in section 9.3. If decisions are delegated using the principles of
empowerment the definition of responsibility and authority become less important.
Today’s organisation needs to innovate to survive. The operating environment is
changing faster than ever and the trend pace of change is unrelenting and increasing.
The organisation must cope with this. All of these factors point toward a matrix style
structure.
Companies have been organised functionally for many years, however more and more
companies are turning to process based organisations to knock down the barriers
between departments. Mapping processes in functionally organised companies show
how they cross many departmental boundaries. This has the effect of allowing
departments to blame others for failure of processes, as described in chapter 6. The
strength of functional organisations is the ability of experts within the department to
coach, and carry out on the job training, of others within the department. The loss of
this ability in process based organisations can be minimised by using mentoring
techniques, matrix links, and formal training plans. Recruitment of people who are
already well trained can help. The principles of the Government sponsored Investors in
People scheme can be applied to achieve these aims. It is stated Remploy policy to have
every Remploy location registered with this scheme. Best practice companies clearly
believe process based organisations are more efficient.
174
Cellular manufacturing has enjoyed considerable popularity with companies in recent
years. Functions are usually delegated into cells by creating teams in the cells with a
variety of skills. Cells will clearly have barriers and business processes will cut across
them. A Remploy factory in the Furniture Group could be seen as a large cell. There are
manufacturing personnel, logistics personnel (Scheduler and Storeman), a Quality
Technician, wages clerks, etc. All these people are functional specialists working for
the factory manager (who is effectively the cell team leader). There is a balance to be
achieved between organising in processes and devolving to the team. An example of
how this is achieved at present is the matrix style relationship that exists between the
factory schedulers and the central production planners. There is no defined authority in
this relationship. The planners achieve power and influence by virtue of their expert
skills and access to planning and scheduling information, knowledge power. The
planners are also higher graded people and so have some perceived positional power.
Finally they will use their powers of persuasion, personal power, to achieve their
objectives. The crux is whether this design is best to execute the process. The principle
alternative would be to have the schedulers work directly for the planners, or for their
manager. A formal matrix link could still be applied between the scheduler and factory
manager if it was proved necessary. In the Furniture Group a significant problem is that
of achieving on time deliveries. This is a function of planning and control of
production, which breaks down into capacity management and the management of the
supply chain. The planners and schedulers have key roles in each of these processes. It
would therefore seem appropriate to remove any barriers between them.
175

Chapter 10. Conclusions, Recommendations, and
Implementation
This chapter draws conclusions from all of the previous chapters. Recommendations are
then put forward. Finally a strategy for the implementation of the recommendations is
set out.
10.1 Conclusions
· There is a conflict between the objective to employ more disabled people at the same
cost to the tax payer, and to being able to reduce costs to compete in commercial
markets, that causes a move away from manufacturing and towards the
employment agency that is interwork.
· As the grant required to support an interworker is half that required to support a
factory based worker, every factory worker that retires, is medically terminated or
leaves for open employment allows two interworkers to be taken on. Every
factory based employee that joins the interwork scheme can be joined by one new
interworker from outside the company.
· The Furniture Group operates in markets that are structured in different ways. Its
position in these markets is also very different from one to another.
· The delivery performance of the Furniture Group is poor, especially during seasonal
peaks in demand. This is due to poor capacity management and inflexible
manufacturing systems.
· The project to prepare for the implementation of Triton proved that time scales
cannot be imposed when the resources necessary would be too large to manage
effectively. The work content is fixed, as is the maximum amount of temporary
resource, the time scale is derived from these factors.
· Resources of low quality require more supervision and make more errors than is cost
effective. The re-work required significantly affects time scales.
176

· The quality of input information needs to be ultra high if the output is to be
acceptable.
· The geographic dispersion of factories badly affects communications and causes
great difficulty in verifying work as correct.
· There is an expectation of organisational change with the introduction of Triton.
This will make change easier.
· There is an expectation of a flatter but wider organisational structure.
· Changes in job content are expected, with tasks moving between people and between
departments.
· Job satisfaction is expected to improve.
· The management style of the Furniture Group is autocratic.
· Matrix structure links exist in an organisational structure that is primarily
bureaucratic. This is matched by a predominantly role culture.
· The organisational effectiveness scores are low, but not uncommonly so, giving
room for improvement.
· The TQM model shows leadership, people management, processes, and customer
satisfaction could all be improved.
· The people approach to organisational effectiveness shows that there is a shared
culture, but shared goals and shared effort need encouragement.
· Published work concludes that the result of implementing an integrated computer
system will include: a change in job content, an increase in job satisfaction, an
ability to increase managers spans of control, the possibility of deploying de-
177

layering, empowerment, cellular manufacturing, and multi-disciplinary team
working strategies.
· Information technology is an enabler of change rather than a driver.
· Best practice companies modify their organisations often to meet changing
circumstances.
· Best practice companies have flatter, narrower structures and use interdisciplinary
teams. These teams are organised to execute business processes rather than into
functional departments. Decision making is delegated to the lowest level where the
decision can be made effectively.
10.2 Recommendations
It is recommended that the organisation moves towards a system of empowered multi-
disciplinary teams. There should be cross training within these teams to encourage team
members to be multi-skilled. The teams should be organised to execute business
processes. The organisation should be made smaller with less departments and flatter,
with less management levels where possible.
There has already been some movement towards this approach. For example the team
working for the Systems Manager has skills from Finance, Customer Support and
Engineering.
There are some important factors to bear in mind when introducing empowered teams,
(sometimes called self directed teams). The role of the supervisor must change to that of
a team leader, requiring a participative management style. Multi-skilling and job
rotation can work, but there are limits when complex skills are required for some tasks.
Teams work best when the membership is between 6 and 12 people. As all processes
are interdependent there will always be a need to co-ordinate between teams. One
method of doing this is to co-opt team members into company wide co-ordinating
teams. Team members are not best placed to appraise their own performance. They are,
however in a position to solve problems and to find ways to enhance performance.
Because there are less opportunities for promotion, careers and reward systems must be
178
structured in a new way. Being an empowered member of a team will bring the rewards
of discretion and responsibility sought by those who wish to move into management.
Salary can be the addition of several factors:
· Base pay
· Skill pay
· Profit share
The skill pay needs to be based on both the breadth and depth of skills. As skills are
enhanced skill pay is increased rewarding self improvement, (Wellins, Byham and
Wilson, 1991).
Hal Mather has likened functional management to silo management where work is
trapped in departmental silo’s instead of flowing through the business. This can be
shown as follows:
Managers
Flow
Purchasing Manufacturing Planning Design Accounts Distribution Sales
179

The alternative process organisation can be depicted as follows:
Entity Function
BusinessTeam
Long Term R & DPublic RelationsSupply of Funds
and CapitalSmall AutonomousProduct/ServiceTeamsCustomers
It may be necessary to re-organise the product family to achieve this organisation.
When implementing the changes the emphasis should be on the flow of information.
Groups being formed around this flow, both physically and organisationally. Queuing
should be eliminated so that the organisation becomes lean. Co-ordination and the
sharing of expertise can be achieved by setting up councils, drawing members from
teams, (Mather H, 1999 and Mather H, 1999).
The specific organisation can then be built from these teams. There still needs to be
departments and reporting structures based around the key business processes. One
model has been suggested by Eur Ing Julian Gray of P.A. Consulting and is shown
below, (Gray J, 1996):
180
Strategy Process Leader
People Process Leader
Operations Process Leader
Resources Process Leader
Innovation Process Leader
Market ProcessLeader
Information Process Leader
He also suggests some key factors in moving towards this style of organisation:
· The chief executive must be prepared to substitute leadership for power and
let go of the reins.
· The whole company needs to have a vision of itself in a few years time that is
radically different, and have a burning desire to make it happen.
· There must be a framework of business processes that are a sustainable basis
for the operation.
Within Remploy the last factor is being addressed. A consultant has been brought in
and a team set up to re-engineer the business processes. This team comprises people
from different levels within the business and from different functions. They are due to
report about the same time as this thesis is completed. It must be recognised however,
this is only the first step. Julian Gray concluded his paper to the Institute of Operations
Management Conference: “Don’t stop at re-engineering your business processes, re-
engineer your business too”, (Gray J, 1996).
It is notable how some parts of Remploy already fit the model. For example materials,
and money are resources. The Materials Manager reports to the Group Finance
Manager, who in the model above equates to the Resources Process Leader. He also has
responsibility for Information Technology, which in the model has its own leader, but
with a wider remit than IT. Some of the current departments have roles that would be
split using Gray’s model. Industrial Engineering would be an example of this. The work
that is undertaken introducing new products and making product improvements via
engineering changes is clearly part of the innovation process. The work to provide new
machines and other manufacturing resources is part of the resources process. The work
to improve processes could be seen as part of the manufacturing process, especially if
this is initiated from within empowered manufacturing cells.
One process that appears to be part of the manufacturing process in the model is that of
Quality Assurance. All of the available writing about quality assurance and Total
Quality Management recommend that it is a separate department, reporting at the
business team level, because of its importance to toady’s company. Quality Assurance
is critical in the Furniture Group, inconsistent product quality has been a problem in the
recent past. The other key areas to the Furniture Group are capacity management,
181
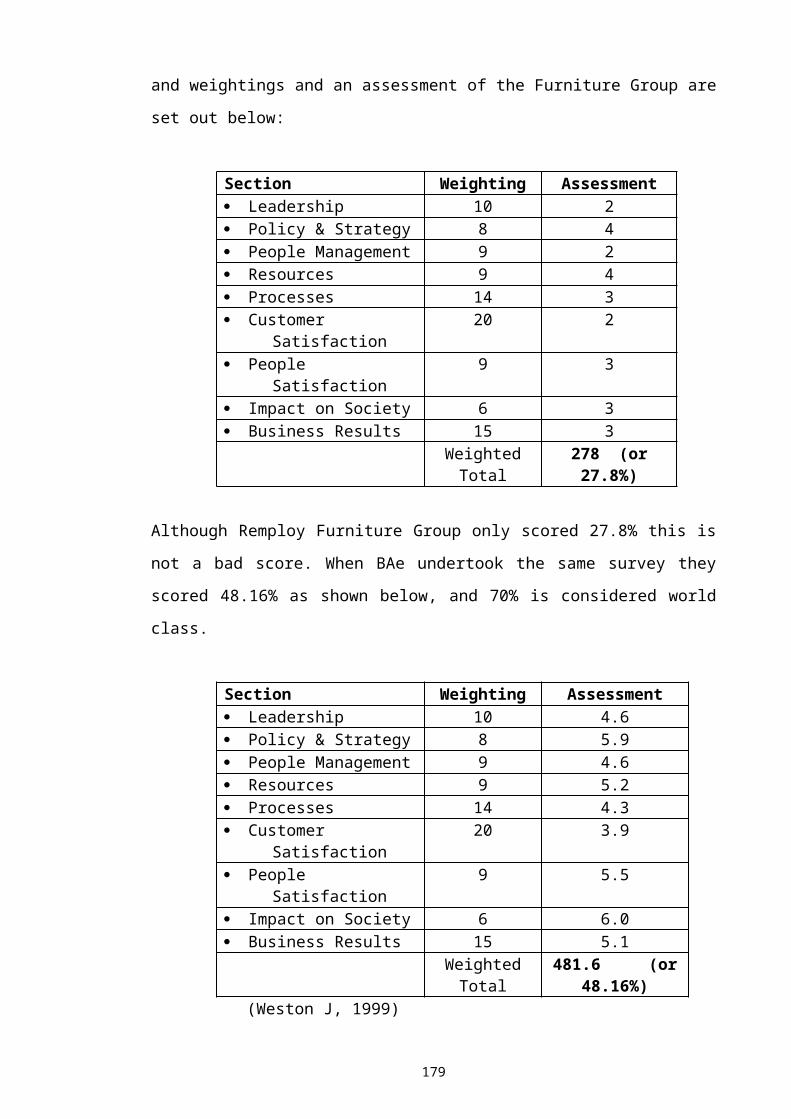
production scheduling and management of the supply chain, all of which impact
delivery performance.
To redefine the organisational structure based on business processes it is necessary to
first define those processes. They can be defined as follows.
1. The Order Winning Process.
This is segmented because the Furniture Group operates in markets with different
structures. Some orders are obtained from catalogue sales, some by personal
calling by sales personnel, and some by a tendering process to gain contracts.
2. The Order Processing Process.
Because of the segmented order winning process the input to this process is also
segmented.
3. The Supply Chain Process.
This process includes procurement, storage of purchased parts, work in progress
and finished goods, and delivery to the customer. It includes distribution
management of finished goods and of manufactured components between
factories. It includes determining materials requirements.
4. The Capacity Management and Production Planning Process.
This process includes determining production capacity and deciding where
products are to be made. It includes planning and scheduling of production based
on available capacity and material availability. It involves re-scheduling in the
event of machine breakdown or failure of a supplier to deliver.
5. The Manufacturing Process.
This includes manufacturing process improvement activities.
6. The Quality Assurance Process.
This includes quality improvement activities.
7. The New Product Innovation Process.
This includes defining market requirements, concept design, detailed design,
engineering products into production, and market launch activities.
8. The Information Management Process.
This includes computer support activities, procurement and maintenance of
computer hardware, telephone, fax and e-mail facilities. It includes software
application procurement and maintenance. In Remploy this is mostly co-ordinated
at corporate level.
182

9. The Human Resources Management Process.
This includes the recruitment process, training, appraisal and retention. It includes
negotiations, rewards package management, grievance, dispute and discipline
systems management.
10.The Strategic Management Process.
This includes gathering market and competitor intelligence, obtaining capital and
funds. It includes setting mission and vision statements, and communicating the
corporate culture. It includes setting corporate objectives, defining strategy and
establishing budgets to achieve the aims. This process also pulls together the
leaders of all the other processes into the business team.
The next stage is to define where responsibility lies for these processes at present. This
is likely to be in more than one functional department. This can then be transferred to
the new departments.
When small sections of expertise exist problems can arise in changing to a process
organisation. For example, the drawing office has only two draughtsmen. If the process
organisation required draughtsmen in three different processes, recruitment might be
necessary. This could lead to under utilised resources. Flexibility is also lost to deal
with peaks in demand in one of the processes, where in a functional department all
resources could more easily be switched to one project. In the new organisation it
would be necessary to gain the agreement of the various process leaders. An analogy of
this problem is the layout of a machine shop. Like machines can be grouped together in
a functional layout. The alternatives, which are now recognised as the best layouts, are
cells or flow lines. It may be necessary to tie up more resources in duplicate machines,
but the flow of materials is simplified and queuing is reduced. Cells can be set up in
offices, people being the resource rather than machines.
The two key problems when flattening structures are that spans of control will increase,
and the number of managers will decrease. Managers can control more staff when those
staff are well trained, take responsibility for their actions and have authority delegated
to them. To reduce the number of managers the strategy would be to define the
positions required, write a person specification and see if a manager fits it. As many
managers’ positions as possible would be filled this way. Any remaining positions
would be advertised, any remaining managers would be redundant, and would either
183

leave or move into non-managerial jobs. If they have specialist skills and knowledge the
latter is preferred.
Because the order winning process is segmented there needs to be three process teams.
One person, should however lead the whole process. The process team dealing with the
engineer to order contract products needs to include engineering staff, sales staff, space
planning staff and product costing staff. The team dealing with the sale of products that
are sold as installations (Exel, Lundia, Technology) will need sales staff, space planning
staff, and quotations staff. The team dealing with catalogue sales need only customer
support staff. For contract products, where the Furniture Group has already engineered
the product, but there is a need to re-quote or re-tender, this would be dealt with by the
installed furniture team.
At present customer support staff also manage sales order processing. This is partly
because catalogue sales represent the majority of the volume of orders. One of the key
tasks in this area is determining the promised delivery date. This is better determined by
production planners. All sales order processing could be passed back into the relevant
sales winning teams. This will generate a better flow of information, see appendix G for
the current flow, as the delivery date needs to be fed back to the customer by the
relevant order winning team. Credit control is part of sales order processing and so
belongs to the order winning process.
Because the scheduling of production depends critically on available capacity and
available materials it is impossible to separate the supply chain management process
and the capacity management process from it. The process team leader should therefore
manage all staff involved in all these processes. This includes factory based schedulers
and storekeepers. The factory based scheduler can schedule production and deliveries of
purchased items. Central purchasing staff will also belong to this team. They will
concentrate on negotiating prices and contracts, monitoring supplier performance on
cost, quality and delivery, and management by exception of purchasing problems.
Capacity managers will be required to take a company wide view of product loading.
They will need to define which products are to be loaded onto which factories. Until
times are added to routes, allowing Triton to finite capacity plan, they will need to
operate manual systems to fill capacity.
184
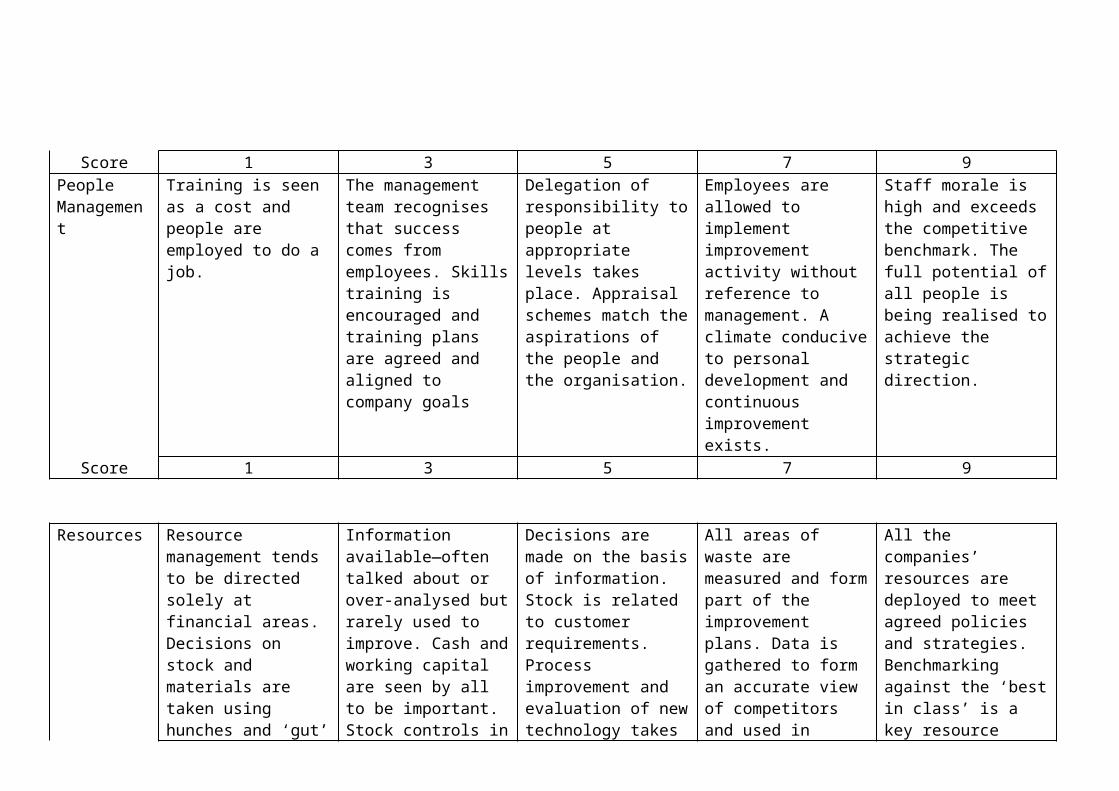
Bought Ledger and Sales Ledgers control cash and are therefore part of the resources
team.
The Quality Technicians are part of the quality assurance process. They can be
organised into cells with the Quality Engineers.
By removing Quality Technicians, Store Persons and Schedulers from Factory
Managers control it will be possible for each factory manager to control more factories.
This can lead to a de-layering of the Operations Process Team. Manufacturing cells can
be set up to assist this. Cell team leaders replacing Supervisors and Leading Hands.
The new product innovation process is similar to the engineer to order process. Only
one new product range has been launched in the last 3 years. The process used has not
been very effective. There needs to be a marketing presence in this team because a
market need must be established, from which a marketing brief is determined. A design
brief can be derived from the marketing brief by a designer. Once approved concept
design work can start. As there is no design department within the Furniture Group this
part of the process would be undertaken by a design house. This immediately creates
barriers in the process, with queuing, communications difficulties and loss of
efficiency.
Because of the small level of design work designers are probably not justified.
Draughtsmen will be required in this team to create the detailed drawings. Product
engineers will also be required to engineer the product into production. The level of
design work allows some resources to be transferred from the Engineer to Order Sales
Winning Team, providing this does not impact on their projects. Because the business is
seasonal new product innovation work can be phased to allow resource to be assigned
in non-busy periods.
Some elements of the Human Resources Management process are completed at
corporate level. The others are mostly already in the domain of the Personnel
department.
185

The Strategy Process is the responsibility of the Group General Manager. He will
involve his direct reports, the business team, and will require the approval of the board
for any major changes.
The new structure can thus be defined by placing these business processes into the
boxes in Gray’s model.
186Operations Process
Manufacturing Cells
People Process
Human Resources Team
Innovation Process
Product Innovation Team
Quality Assurance Process
Quality Cells
Operating Process
Manufacturing cells
Market ProcessesOrder Winning: Engineer to Order Team
Installed Furniture TeamCustomer Support Team
Resources ProcessFinancial resources: Financial Accounts TeamMaterials Resources: Supply Chain & Capacity Team

One area of particular concern is who should add the item master data to Triton. In the
present structure Engineering have control of the key field, the part number, for
purchased items and manufactured components. The Systems department controls
customer facing part numbers. The description belongs to everybody, a system of
structured descriptions has been set up, see appendix C, but is not always being used.
The item master record also contains the selling price, purchasing price and supplier,
ordering data (e.g. safety stock, order multiple, order system, etc.), back flushing rules,
and inventory data (unit of measure, warehouse, etc.). None of the present functional
departments own all this data. No single process team will own the data in the new
structure either. When adding an item, default data can be brought into many fields by
adding an item group code. The default data has to be set up first. The data brought in
will be chosen as a particular set by reading the item type (Manufactured, Purchased,
etc.) and the item group. Some default data has been set up but not all. The item groups
that have been set up do not necessarily group items with like data sets. The items
groups are set up for analysis rather than to get the nearest set of default data. It would
be better to use the product type field for this analysis. The recommendation is to copy
the current item groups into the product type field. Adjust any reports to work on this
field instead of the item group field. Use the purchasing statistics and sales statistics
fields for reporting too. Redefine the item groups to be based on sets of default data.
Ensure all that item group/item type pairs have default data created for them. A report
needs to be produced each day showing every part that was added to the system the
previous day. This would be sorted by item type and item group. The appropriate parts
of the report would be printed for the people who owned various types of data to check
and amend. Many people would have access to item data. Procedures would need to
define who could update which fields. People would have to work in a formal way with
self discipline, not altering data they do not own. This would be a problem today.
Training is required to change the culture of people, trying to do their best, but making
mistakes altering data they have not been trained to amend, and consequently not
understanding the ramifications of their changes. It will also be necessary to ensure
people understand the need to work consistently and carefully. Those who cannot must
be replaced by those who can. The new people must be fully trained first however.
10.3 Success Significance
The expected benefits of the new organisation are:
187
Strategy Process
Business TeamManagement Accounts

· Faster processing of tasks.
· Reduced queuing.
· Shorter lead times.
· Reduced errors.
· Less re-work.
· Reduced costs, leaner organisation.
· Better customer service levels, on-time delivery, correct products in load, etc.
· Quicker and more effective response to change, more agile organisation.
10.4 Failure Consequences
If the changes fail to deliver the expected benefits the consequence would be that the
company has not moved forward and competitors are likely to have moved forward.
There is a danger that managers will have left the company or become de-motivated.
This would make it difficult to move back to the previous structure. The changes
require a change of culture. This will be the most difficult factor to bring about. It will
take time and could slow down the introduction and speed with which the benefits are
gained. Every day lost will be a day where competitors take market share. The pace of
change should be as fast as is possible without jeopardising success. A communication
strategy is necessary to minimise this risk. This should include meetings, written
messages and presentations. The message needs to be conveyed by high profile methods
and constantly reinforced by lower profile methods.
188

10.5 Strategy for Implementation
The only person with the necessary authority to implement the recommended changes is
the Group General Manager. There are two ways to implement organisational change.
One is to make all the changes at one point in time, the other is to change incrementally
over a period of time. If the second option is chosen, a decision must be made about the
pace of change.
It is not recommended that the changes set out above are all implemented at the same
time. The implementation of Triton is a major change that has been taking place over a
period of eighteen months. After such a change there should be a period of
consolidation. Change within a company tends to follow a pattern of continuous
improvement interrupted by step changes. Triton is a step change. The best way to
implement change after such a step is to do so with a steady pace. Change management
is a difficult process and this can be eased by making regular small steps.
Organisational change is one of the most difficult types of change. This is because it
usually affects peoples power and status. The changes recommended will undoubtedly
do this, and will be particularly significant for managers. Staff who may perceive a loss
of status must understand the reasons for the change and understand the outcomes will
make their jobs more secure. One method to assess how change can be best
implemented is to conduct a stake holder analysis. Everyone who will be affected in
some way by the change is listed. An assessment is then made in two dimensions. The
first is the power they have over the successful implementation of the change. The other
is the effect the change will have over them. These can then be plotted on a scatter
graph as shown overleaf.
189

Stake Holder Analysis
-100
-50
0
50
100
-100 -50 0 50 100
Personal Effect of Change
Power Held Over Succes of
Implementation of Change
In the graph there are positive or negative effects of the change on people. People will
also hold more or less power to influence the success of the introduction of change.
Different strategies must be adopted for each of the four quadrants of the graph.
People who have no power over the change and who are affected positively by it
require a strategy that explains how they benefit, because they need to feel involved in
the change to aid motivation. People who are positively affected by the change and
have power to influence its success need to have the benefits explained to them. They
then need to be brought into the implementation to help win over the people who are
against the change. People who are negatively affected by the change but have no
power over the implementation must not be neglected. They need to understand how
the company will benefit. Time must be spent to minimise any de-motivational effects
of the change. The people who are adversely affected by the change and who also have
power over its successful implementation need to be won over. They are the people
who can cause the change to fail. The stake holder analysis must identify these people
so that every effort can be made to get them to support the change, or at the least agree
not to fight against it. (Johnson and Scholes).
Ten steps of an incremental strategy can be identified. These stages could be spread
over a twelve month period. It would be important to avoid making some changes in the
summer peak selling period. Targets should be set for customer service performance
improvement, reduced lead-times and head count reduction. As the changes are made
the performance of the company for each of these measures should be monitored.
190

The strategy process team would still need to review the organisation on a regular basis,
and in response to any significant changes in the operating environment.
The order of an incremental strategy could be as follows:
1. Place Quality Technicians under the control of the Quality Manager.
2. Place Schedulers and Storekeepers under the control of the Materials
Manager.
3. De-layer factory managers.
4. Create an engineer to order sales winning team.
5. Create an installed furniture sales winning team.
6. De-layer the resources process team, creating cells.
7. Create the strategy process team.
8. Create manufacturing cells.
9. Create the innovation process team.
10. De-layer the order winning teams, creating cells.
The timing could be as the following Gantt chart:M
ay-99
Jun-99
Aug-99
Sep-99
Nov-99
Jan-00
Feb-00
10987654321
191

The present organisation structure can be found in appendix F. The structure below
represents the new organisation.
192
Quality AssuranceProcess Leader
Market ProcessLeader
Innovation Process Leader
Resources Process Leader
Operations Process Leader
People Process Leader
Strategy Process Leader
Quality CellsHuman Resources Team
Management Accounts Team
Manufacturing CellsProduct Innovation Team
Customer Support Team
Installed Furniture Team
Engineer to Order Team
Supply Chain and Capacity Management Team
Financial Accounts Team

Bibliography
ANSOFF, H.I. The firm of the future, in Business Strategy, edited by H. Igor Ansoff.
Harmondsworth, England: Penguin 1969, pp107-121.
BJØRN-ANDERSEN N, EASON K and ROBEY D. in Managing computer impact,
edited by M.J. Ginzberg. New Jersey: Ablex publishing corporation: 1986, pp 186-198.
BOWMAN, C. The essence of strategic management. Hemel Hempstead: Prentice Hall,
1990.
BRINK, V.J. Computers and management: the executive viewpoint. New Jersey:
Prentice Hall, 1971.
BUCHANAN, D and HUCZYNSKI, A. Organisational Behaviour. Hemel Hempstead:
Prentice Hall, 1991
DAVENPORT, T. Process innovation: re-engineering work through information
technology. Harvard Business School Press, 1993.
DEPARTMENT of TRADE and INDUSTRY. Competitiveness Through Partnerships
With People. London: DTI, 1997.
EUROPEAN COMMUNITIES COMMISSION. Computer-integrated manufacturing
skills and qualification issues for small and medium-sized enterprises. Luxembourg:
Office for official publications of the European Communities, 1991.
EUROPEAN FOUNDATION for QUALITY MANAGEMENT. The European model
for TQM-guide to self assessment. EFQM, 1995.
GOODFELLOW, R. Manufacturing resource planning. High Wycombe:
Manufacturing Business Excellence Ltd, 1994.
GRAY, J. Process organisation models-the good, the bad and the ugly, in Conference
proceedings 1996. Coventry: Institute of Operations Management, 1996.
193

HANDY, C. Understanding Organisations. 4th Ed. London: Penguin Group, 1993.
JOHNSON and SCHOLES. Exploring corporate strategy. 4th Ed. Hemel Hempstead:
Prentice Hall.
KAYE, D. Game change: the impact of information technology on corporate strategies
and structures. Oxford: Heinemann professional publishing, 1989.
LAND, F. The impact of information technology on the work place, in The
management implications of information technology, edited by N. Piercy. Beckenham,
England: Croom Helm Ltd: 1984, pp 75-91.
LONG, R. The application of micro-electronics to the office: organisational and human
implications, in The management implications of information technology, edited by N.
Piercy. Beckenham, England: Croom Helm Ltd: 1984, pp 95-117.
LUCAS Jnr, H.C. Computer based information systems in organisations. Chicago:
Science Research Associates inc: 1973.
MANSFIELD, R. Changes in information technology, organisational design and
managerial control, in The management implications of information technology, edited
by N. Piercy. Beckenham, England: Croom Helm Ltd: 1984, pp 216-229.
MATHER, H. Competitive manufacturing. 2nd Ed. Cambridge: Woodhead publishing,
1999.
MATHER, H. How to profitably delight your customers. Cambridge: Woodhead
publishing, 1999.
NATIONAL AUDIT OFFICE (Comptroller and Auditor General). The Department for
Education: Remploy Limited. London: The Stationery Office, 1997.
NICHOLAS, I. Control, structure and identity: managerial problems in technological
innovation, in The management implications of information technology, edited by N.
Piercy. Beckenham, England: Croom Helm Ltd: 1984, pp 231-242.
194
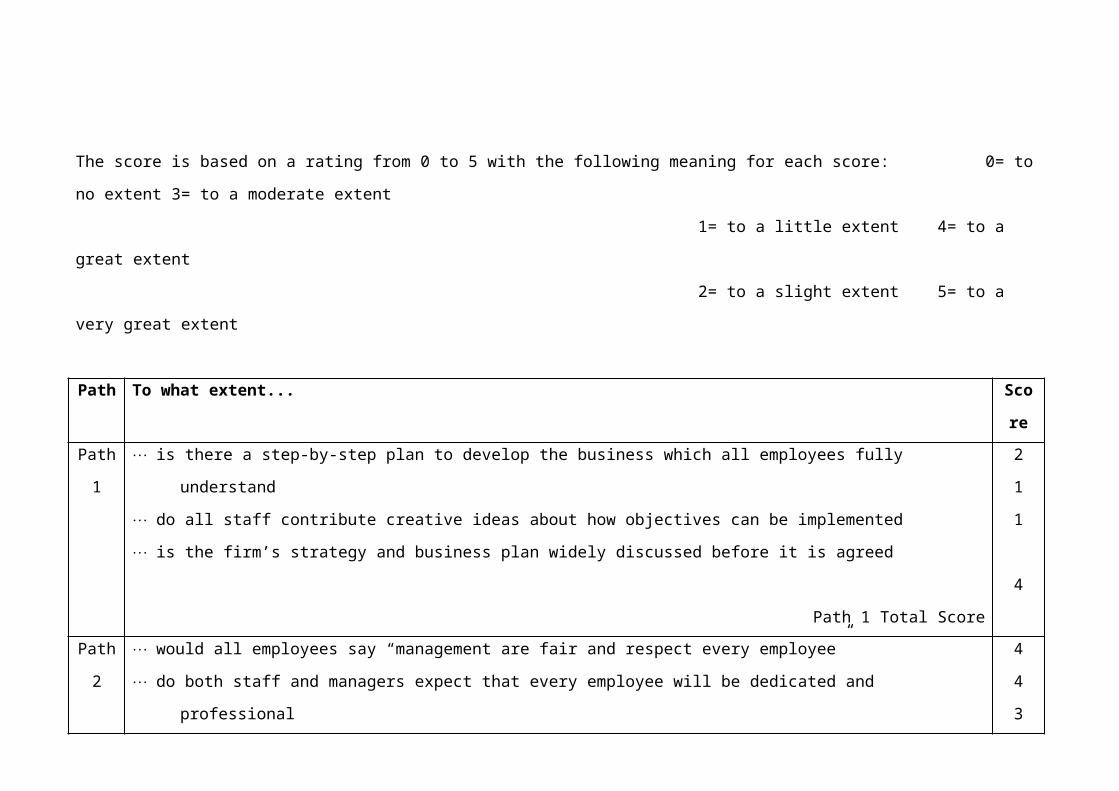
PA CONSULTING GROUP. Information technology: the catalyst for change. London:
WH Allen & Co. 1990.
PEDERSON, P. Organisational power systems, in Managing computer impact, edited
by M.J. Ginzberg. New Jersey: Ablex publishing corporation: 1986, pp 150-167.
PEDERSON, P. Influence and discretion of different user types, in Managing computer
impact, edited by M.J. Ginzberg. New Jersey: Ablex publishing corporation: 1986, pp
168-185.
REINDL, E. Impact on leadership style, in Managing computer impact, edited by M.J.
Ginzberg. New Jersey: Ablex publishing corporation: 1986, pp 127-149.
REMPLOY Ltd. Company Profile 1995. London: Remploy Ltd, 1995.
REMPLOY Ltd. Annual Report and Accounts 1998. London: Remploy Ltd, 1998.
REMPLOY Ltd. The Way We Are. Remploy News, Christmas ‘98, pp. 1-3.
TORRINGTON, D and HALL, L. Personnel management, a new approach. 2nd Ed.
Hemel Hempstead: Prentice Hall, 1991.
WAYS, M. Tomorrow’s management: a more adventurous life in a free-form
corporation, in Business Strategy, edited by H. Igor Ansoff. Harmondsworth, England:
Penguin 1969, pp122-138.
WELLINS, BYHAM and WILSON. Empowered teams. San Francisco: Jossey-Bass,
1991.
WESTON, J. Back from the brink, in Manufacturing Engineer, Vol. 78, No. 1
(February 1999) pp.15-19.
195

Appendix A: Part Numbering System Format,
A Discussion Paper
Numbers, Letters or Both
It must be recognised that most computer users are not typists. The use of the number
pad on an extended keyboard is quicker to learn and use than the letters on the
QWERTY pad. Because there are fewer numbers than letters and they are closer
together on the keyboard they are quicker to use. Numeric part numbers are therefore
more efficient than alphabetic or alphanumeric. However, it is easier to hit the wrong
key. The shorter the number the quicker it is to key and fewer errors are made than in
long part numbers.
Delimiters or no Delimiters
Meaningful part numbers are usually in a segmented format. The use of delimiters
between segments has pro’s and con’s. The points in favour include that it is easier to
recognise the segments, especially in long numbers. It is also easier to ensure the format
is correct. Short numbers reduce the need for delimiters, as do numbers with few
segments. Arguments against the use of delimiters are that it increases the length of the
part number, without adding meaning. The delimiter needs to be a different type of
character to the numbers or letters used in the part number. This restricts the choice and
often means shifted characters are used, which substantially slows down data entry.
Meaningful Numbers or Non-meaningful Numbers
Brisch invented a system of meaningful part numbers before the advent of computers. If
numbers are meaningful or have a meaningful element they can be sorted and classified,
other data held against them can be analysed. Sorted and analysed data is essential for
management planning and control. With the introduction of computers other key fields
have become available, (e.g. classification code, customer code, commodity code,
supplier code, part type, item group, etc.). Parts can be indexed on each (or even
several) of these fields for analysis. Now that open systems and relational databases
196

exist it is even possible to add fields, there is no limit to the analysis that can be
achieved without the need for a meaningful part number.
A further use for a meaningful number is for recognition and validation. Personnel who
come into contact with the numbers and the physical items, (e.g. stores' personnel),
soon recognise parts and their numbers. They can often correct errors if they find them.
There is always the danger of invalid correction, however. The computer reduces the
need for this by displaying a description, but this will not help if someone has a part and
no number at all, unless they can search for the description. Relational databases allow
searches for descriptions using wild cards, but their success depends heavily upon the
formality with which the description has been added. It has been seen that some
personnel can remember non-meaningful numbers too, although the range of part
numbers remembered depends upon the frequency with which each is used. Because the
ability to remember numbers is not infallible and parts, or delivery notes and other
documents can have part numbers missing there is a driving force for formal
meaningful descriptions. The rules for setting up a system of meaningful descriptions
are similar to those for setting up a system of meaningful part numbers. When opinions
are sought, parts with both meaningful part numbers and meaningful descriptions are
preferred by most users.
The Range of Meaning in a Part Number
More or less meaning can be held within a part number, for example the number might
simply convey that one item is a screw and another is a nut. Alternatively a number
could define that the part is a screw, that it has a countersunk head, with a socket drive.
It could also indicate it has an M6 thread and it is 10mm long, and that it is bright zinc
plated. It could also define that it is used on XYZ range of products, that it is used at
“Sometown” site. It could even convey that it is purchased, from “Hiprice” suppliers,
and the products it is used on are sold to the customer “Bigbuyers”.
197

Meaningful Codes for the Segments in the Part Number
The method of conveying the meaning could be by a meaningful code or a non-
meaningful code. For example, in the case of the screw the part number could be
0131526. Here 01 defines it a screw, 3 that it is countersunk, 1 that it is socket driven, 5
that it is M6, 2 that it is 10mm long and 6 that it is BZP. Alternatively the part number
could be SCWCSKSOCM6X10BZP. The latter code is clearly more recognisable, it is
easier to learn the elements and easier to validate. It is also easier to add an item to a
range without fear of running out of codes. It is of course much longer and it is much
more difficult to keep part numbers for different types of items the same length, unless
void characters are used. The issue of length variation of part numbers is dealt with
below. It can be seen that meaning is the enemy of brevity.
A nut could be described using the second system above thus: NUTHEXM6SC, a self
colour hexagonal M6 nut. The first segment of a meaningful part number determines
the choice of the following segments in some cases and not in others. The range of
types of parts will have a significant influence on the number of characters required to
define meaning. If a company only makes screws and nuts, S and N can be the first
segments. If screws, nuts, screens and skid frames are to be numbered, clearly more
characters are required in the meaningful code type of system. This is not necessary in
the non-meaningful code (but meaningful part number) system.
If only numeric characters are used it is impossible to have meaningful codes, although
some segments could be. There is a trade off between speed of data entry of a non-
meaningful code and the enhanced accuracy potential of a meaningful part number with
meaningful coded segments. An efficient part number is the optimal balance between
these parameters. Because part numbers are typed many times over and error rates are
relatively low the balance is towards reduced meaning.
Part Number Length Variation
If part numbers are drawn from a system where length is constant it is easier to check
that the format is correct. Missing characters are immediately evident. If the lengths of
the segments are also kept constant validation becomes even easier, especially when
scanning a column of numbers, (e.g. a computer report). All of these benefits are lost
198

with part numbers that vary in length, therefore there is a strong motivation for constant
length and constant segment size if this is possible to achieve. If it is not lengths should
be kept constant for all parts within a type defined by their first segment.
Prefixes and Suffixes
The only reason to add a prefix or a suffix to a part number is to add further meaning,
that cannot be added within the existing system design. Prefixes, if used on all part
numbers are just another segment in reality. If prefixes are used on some part numbers
and not others the benefits of constant length and constant segment lengths are lost,
especially if the prefix length varies. Prefixes complicate the process of sorting part
numbers, especially by computer.
Suffixes are less of a problem for sorting as the part number is normally sorted from the
beginning. If they vary in length, with different types of meaning, and are not applied to
all part numbers, then the drawbacks of part numbers with varying lengths' returns. If a
suffix is simple, of fixed length and only conveys the meaning of one variable then the
effect is minimised.
Ease of Change
Because the part number is the key field against which all other data is assigned it
cannot be changed. It can be replaced if the meaning held in one or more of its
segments' changes, and the data held against it transferred. There are several drawbacks
in replacing a part number. Some data may not be transferable, e.g. if stock movements
are kept in a computer system, they usually cannot be transferred. The computer might
calculate average usage, used for inventory control purposes. The new part number
could start life with a zero average usage. This would become more accurate with time,
dependent on the method of calculation. Losing historical data in this way can have a
significant business impact. The problem of replacing part numbers becomes more
complex if they are used in bills of materials. This is especially true if engineering
change control systems are used to manage changes to bills of material. This formal
procedure takes time and resources that would not have been necessary. One example
of this is if a part number segment is used to denote whether an item is manufactured or
purchased. If a particular part is purchased a supplier may want to increase the price.
199

This could make it more economic to make the part, assuming the capacity is available.
The part number would then need to be replaced. If this part is used in a large number
of products and engineering change control is used then a lot of work could be
necessary. Some computer systems have a “replace everywhere used” feature that
would minimise the work. These features cannot always replace parts if there is a
change in the unit of measure, (possible if the item is a raw material rather than a piece
part). They cannot usually change quantities. Those that can will only be able to apply a
uniform change. Non-uniform changes would necessitate visiting every parts' list.
Alternatively if the purchased or manufactured definition is not held as part of the part
number but in a separate field then it is a simple step to change it. It might still be
necessary to create a part's list and production routing for it, but not to visit every
product in which it is used.
For these reasons it is best not to include meanings that are fairly likely to change in a
part number. Examples of these could be: make/buy (part source), customer, supplier,
product range, bin number (location in stores), site of manufacture, analysis codes, etc.
All of this information should be held in separate fields.
Part Selection
When designing new products or changing existing ones it is essential not to assign a
new number to a part that already exists. To avoid this it is necessary to search the
existing master parts catalogue. This could be a paper document or held on computer.
The more meaning there is built into the part number the easier it is to find. With the
system described above with the screw, (SCWCSKSOCM6X10BZP), if an attempt is
made to assign a new number it will automatically be the same as the existing one.
However because of the other arguments against such numbers it is necessary to use
other criteria to effect a search. Having limited meaning, such as a commodity code, as
one meaningful segment will help limit the search. A good description will also help to
narrow the search. If a description carries all of the meaning in the example of the
screw part number it can define a part completely. It is always easier to change a
description than a part number, and hence such descriptions do not have the same
drawbacks as meaningful part numbers. Other data, for example a supplier's part
number can also assist to define a part completely. The final arbiter of the definition of
200
a part is the drawing, but it is not always efficient to have to go to drawings when
wanting to select a part.
Conclusions
It is essential to have only one numbering system, except for items that are saleable.
These could be distinguished from other part numbers. The part number can have
meaning to assist with analysis and selection but there should only be one meaningful
segment. The meaningful segment should be fixed in length. There should be no
delimiter to separate the meaningful segment from the sequential segment. The
delimitation should be recognisable by the constant and limited length of the
meaningful segment, two or three characters. If the meaningful segment is only letters
whilst the sequential segment is numbers, (or vice versa) delimitation is achieved
without the need for a special character and is more obvious than just relying on length.
Having some meaning gives a psychological comfort factor to users and can reduce, by
one, the number of other fields required for analysis. If this field is a commodity code it
is unlikely to change, however care must be taken in setting up the commodity codes. If
some parts could be assigned to more that one code the system will breakdown. Finally
an investment should be made to define a system of descriptions that are meaningful,
formal, and searchable. They should be able to be sorted on, be unambiguous, and
completely describe the part.
201
Appendix B: Engineering Change Control Systems
Any procedure can be bypassed. Because a computer restricts access to amend data,
computer based systems are less easily corrupted, but the data can still be ignored. All
systems therefore rely on the discipline of all those who come into contact with them. A
willingness to operate a system can be engendered by a number of factors. Well-trained
personnel who have been educated about the need for the system, and what goes wrong
when it is bypassed are more likely to operate it. This is especially true if they are
committed to the company’s objectives. Systems that are seen as facilitators of change,
rather than barriers to it, are more likely to be successful. It is necessary when designing
a system to make it responsive, and to resource it correctly to avoid queues and
backlogs becoming long enough to bring it into disrepute. An effective official shortcut
such as a temporary concession can help. People at all levels who are committed to
customer satisfaction will be motivated to ignore systems that stand in their way. Given
that, an E.C.C. system is a control system, there is a balance to be drawn between
control and responsiveness.
Changes can be considered to be of two types, significant and insignificant. Significant
changes must have appropriate approval before implementation. They will affect one or
more of the key factors listed:
· Fitness for purpose
· Aesthetic appeal
· Structural integrity
· Cost
· Affect on other components
· Affect on required production processes.
Insignificant changes will not affect these factors and may be error corrections, for
example. In a responsive system, a skilled assessor would be authorised to sort changes
and gain appropriate approvals (or rejections), without referring all change requests to
all potential approvers. The assessor must have sound engineering judgement and a
good grasp of the commercial implications of change.
202

Any system of E.C.C. implemented must take into account the requirements of I.S.O.
9000. The company is currently registered at BS EN ISO 9002. It would be good
practice to design a system that meets BS EN ISO 9001 and takes into account the
advisory section of BS EN ISO 9004. These systems require:
· A written procedure, including release and approval of manufacturability.
· A planning system for design changes.
· A matching of design output to design input intent.
· A revision history, issue numbering system to record & manage change.
· A system for checking for correctness by authorised personnel.
· A verification system to ensure changes are made at the right time.
There is a need for sufficient documentation to achieve manufacture. This must be:
· Unambiguous, (including between different documents).
· Legible and clean.
· Dated, including the last revision date.
· Identifiable (i.e. numbered).
· Maintained in an orderly manner, (i.e. retrievable).
Documentation can be hard copy or held on computer, but must be backed up if the
latter. Types of documentation include:
· Drawings (and blue prints).
· Bills of Materials.
· Routings.
· Engineering Change Requests.
· Engineering Change Notices.
· Procedures.
203

The design of an E.C.C. system will include the five phases of change. That is:
· A system to request change.
· A procedure for validation, evaluation and approval (or not).
· Changing of all relevant data.
· Checking changed data, (accuracy & completeness), and authorisation to
release.
· A method of notification to all concerned and of implementation.
Those requiring notification include:
· Marketing.
· Finance (costing, stock accounting).
· Manufacturing (management, supervision, operators).
· Stock controllers.
· Purchasing.
· Quality Assurance.
It is assumed that Design, Product Engineering and Industrial Engineering (Process
Engineering and Work Study) will have worked together to implement the change. The
most effective way to do this is to work concurrently using the principles of
Simultaneous Engineering.
The implementation of a change may require simultaneous action by several people in
several places. If this does not happen components may not fit together. This requires a
degree of co-ordination best achieved by a sole authority on the timing of change.
Production Planning and Control have the best information to organise this. They can
be advised on the urgency of change (e.g. do we need to scrap stocks and W.I.P.), and
can manage the most economical change over to suit the circumstances.
Obsolete or superseded documentation needs to be removed from live files and
destroyed or archived as appropriate (another I.S.O. 9002 requirement) in a timely
fashion.
A flow chart of an Engineering change system is shown overleaf:
204

ECR Operating Procedure
205
ECR ReceivedCheck for validity.Evaluate
Reject Proceed
Complete circulation form.
Copy rejected ECR& file in reject file.Return original to originator, explaining reason for rejection.
Assign Engineer to evaluate.Copy ECR, Pass original to Engineer. File copy in evaluation file.
Evaluate & prepare report
Attach copy of report to both original and file copy of ECR.
Attach a Approval Form to the OriginalTake out the next available number in the ECR Log. Fill in the detail from the ECR and the circulation form. Record the ECR number on the original & copy of the ECR & circulation form & the approval form. File the copy & circulation form in ECR number order in the Process Approval File
On receipt of completed ECN update ECR log and file ECN, original ECR & circulation form in completed file, destroy copy. Issue ECN
Circulate to next person on circulation list.Write date sent on circulation form.Return copy and form to file.Update stage in ECR Log
On receipt record date received on circulation form.
Any more people to circulate? No Yes
Has everyone approved the
request No
Yes
ProcessECR.
Resolve issuesProceed
No
Yes

Appendix C: Formal Structured Description System
Many of the discussion points that apply to meaningful part numbers, (see Appendix
A), also apply to structured descriptions. However, it is not normally necessary to use
the formality of an Engineering Change Control procedure to change a description. It is
important not to include the supplier or the suppliers' part number if an item is multi-
sourced. This is because on most computer systems there is only one description, and
this will be printed on any purchase orders.
A description needs to be all things to all people. Every function in a company that
comes into contact with part numbers will also come into contact with descriptions and
has their own special needs. Unlike part numbers the description does not have to be
unique, but there are many advantages to making as many descriptions as unique as
possible. A unique description tied to a unique part number reduces the scope for error.
Purchasing requires a description that will be recognised and understood by their
suppliers. Different suppliers will have their own descriptions for their products, which
may use jargon known within that industry, but having different or no meaning to the
layman.
Stores and manufacturing personnel need a description that describes what a part is in
their own terms. It may include jargon used in their own industry, but needs to avoid
jargon used in other industries such as the suppliers, which might not be understood.
Engineering needs a description that can be used to search for a part that exists, to be
able to use this part in a new or modified product. This prevents assigning a new part
number to an item that already has a number.
All of these functions can be fulfilled by a description if it is made long enough. There
are drawbacks to over long descriptions, however. They could be keyed wrongly, or be
difficult to interpret. Some computer systems, including the Triton system implemented
by Remploy, have a finite description length that is too small to easily satisfy all of the
purposes of a description. The Triton description is limited to 30 characters. It is
206

therefore necessary to introduce abbreviations that make interpretation even more
difficult.
The system that follows is based on limiting descriptions to 30 characters. It is built
upon a keyword system. The keyword is the first word of the description. There are a
limited number of keywords to aid searching. For each keyword is a series of
descriptors. Each descriptor represents the next segment in the description. The segment
is either a choice from a menu of discrete options or a value drawn from a continuous
range of options. In the case of a value there is often a qualifier automatically added to
give the value meaning, e.g. a unit of measure. Because of the limit to the length of
descriptions it is necessary to limit the length of qualifiers. This sometimes means it is
necessary to refer to the table of descriptors for a keyword to interpret the description.
This would be avoided in an ideal situation. It is particularly necessary to avoid this
requirement for purchased parts because the supplier would not normally have access to
the keyword descriptor tables. Where an item is very particular to a product it can help
to include a product reference in the description. This should be avoided, however, for
more generally used parts as it may inhibit their selection and create duplicates.
207

KEYWORD LIST BOM ITEMS ISSUE 3
KEY WORD ABBREVIATION FOR DESCRIPTION
PURCHASED OR MANUFACTURED
ACRYLIC ACRLC PURCHASEDADHESIVE ADHSV PURCHASEDANGLE ANGL PURCHASEDASSEMBLY ASSY MANUFACTUREDBAR BAR PURCHASEDBLANK BLNK PURCHASEDBOARD BRD PURCHASEDCASTING CSTG PURCHASEDCORE CR MANUFACTUREDCUT LENGTH CT-LNG MANUFACTUREDDOCUMENT DOC EITHEREDGING EDG PURCHASEDEXTRUSION EXT PURCHASEDFINISHING MATERIAL FM PURCHASEDFITTING FTG PURCHASEDFITTINGS KIT FIT-KIT EITHERFOAM FOAM PURCHASEDFRAME FRM MANUFACTUREDGLASS GLASS PURCHASEDKEY KEY PURCHASEDLABEL LBL PURCHASEDLAMINATE LAMINATE PURCHASEDLAMINATE LAM MANUFACTUREDLEG LEG-FRM MANUFACTUREDLOCK LOCK PURCHASEDMECHANISM MECH PURCHASEDNUT NUT PURCHASEDPACKAGING PKG PURCHASEDPANEL (EXCEPT TOPS) PNL MANUFACTUREDPLY (FORMED) PLY- FRMD PURCHASEDPOLY POLY PURCHASEDRAIL RAIL MANUFACTUREDSCREW SCRW PURCHASEDSHEET SHT PURCHASEDSLIDE SLIDE PURCHASEDSTAPLE STPL PURCHASEDSTRIP STRP PURCHASEDSUNDRY SNDRY PURCHASEDTAMBOUR TAM PURCHASEDTEXTILES TXTL PURCHASEDTHREAD THRD PURCHASEDTIMBER TMBR PURCHASEDTOP TOP MANUFACTUREDTUBE TUBE PURCHASEDUPHOLSTERY UPHLSTY MANUFACTUREDVENEER VENEER PURCHASEDVENEER VNR MANUFACTUREDWASHER WSHR PURCHASED
Descriptions to be a maximum of 29 characters
208

KEYWORD : SCRWDescription Options/Range
1 TYPE
2 DIAMETER
3 LENGTH METRIC(OR)
3 LENGTH IMPERIAL
4 HEAD
5 DRIVE
6 FINISH
7 TWINFAST
MCSTWD
M3xM4xM5xM6xM8xM10xNo3xNo4xNo5xNo6xNo7xNo8xNo10xNo12x
From 5 mm to 100 mm
From 0.125” to 4”
ALLTHRDBTNCAPCHSCSKFLNGEGRBHEXMUSHPANRNDRSD
PZSLTSCKT
BLKBRASSBZPCHROMEFL/BZS/C
TF
An example of a description built from the table is:
SCRW WD No8x1” CSK PZ BZP TF
209

Appendix D: Survey Of Expectations
The Impact Of Triton At Corporate Level
The organisation at this level decides what groups there are and which factories are in which groups.
1. Remploy must change if it is to survive and thrive, what factors do you think affect the organisation at this level. Rank in order the following list (1,2,3, etc.)
Society’s expectations · Information technology advances ·Advancing product & process technology · Financial constraints ·Political/governmental requirements · Increased financial efficiency ·Manpower skills available · Pressure from competitors
·Customer needs ·
2. Which describes Remploy’s overall organisational style, (tick one box).
Dynamic (causes opportunities for change) ·
Fluid (predicts changes and reacts as they occur) · Organic (follows change closely)
·Evolutionary (follows external changes only slowly) ·
3. Do you see Triton as an enabler of change at this level:
Will make changes much easier·
Will make changes somewhat easier ·Will make changes somewhat more difficult ·Will make changes much more difficult
·
The Impact Of Triton At Group Level
The organisation at this level decides which departments are required and what they do in support of the factories.
4. What factors do you think affect the organisation at this level. Rank in order the following list (1,2,3, etc.)
Society’s expectations · Information technology advances ·Advancing product & process technology · Financial constraints ·Political/governmental requirements · Increased financial efficiency ·Manpower skills available · Pressure from competitors
·Customer needs ·
210
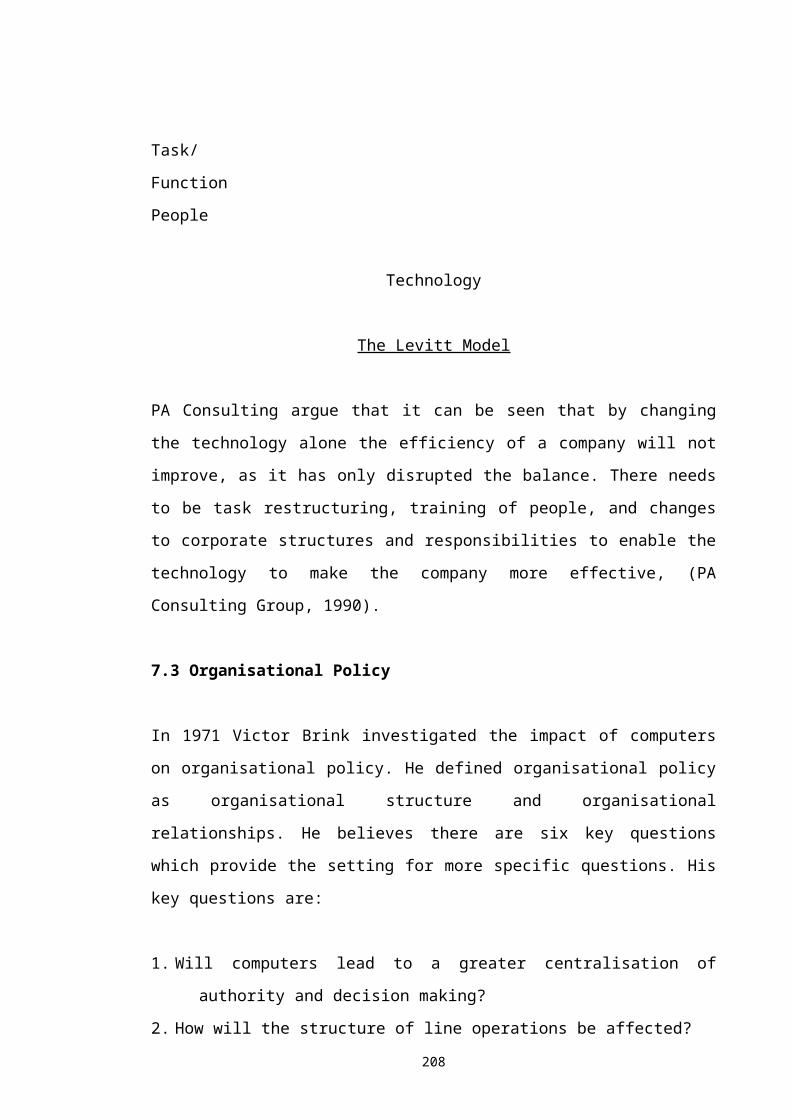
5. Which describes the Furniture Group’s overall organisational style, (tick one box).
Dynamic (causes opportunities for change) ·
Fluid (predicts changes and reacts as they occur) · Organic (follows change closely)
·Evolutionary (follows external changes only slowly) ·
6. Do you expect organisational changes to result from the introduction of Triton.
Will cause significant changes·
Will cause some changes·
Will cause minor changes·
Will cause no change ·
7. Do you see Triton as an enabler of organisational change at group level.
Will make changes much easier·
Will make changes somewhat easier ·Will make changes somewhat more difficult ·Will make changes much more difficult
·
The Impact Of Triton At Factory Level
8. What factors do you think affect the organisation at this level. Rank in order the following list (1,2,3, etc.)
Society’s expectations · Information technology advances ·Advancing product & process technology · Financial constraints ·Manpower skills available · Increased financial efficiency ·Customer needs · Pressure from competitors
·
9. Which describes the Furniture Group’s factorys’ overall organisational style, (tick one box).
Dynamic (causes opportunities for change) ·
Fluid (predicts changes and reacts as they occur) · Organic (follows change closely)
·Evolutionary (follows external changes only slowly) ·
10. Do you expect organisational changes to result from the introduction of Triton.
211

Will cause significant changes·
Will cause some changes·
Will cause minor changes·
Will cause no change ·
11. Do you see Triton as an enabler of organisational change at this level:
Will make changes much easier·
Will make changes somewhat easier ·Will make changes somewhat more difficult ·Will make changes much more difficult
·
212
Generally
12. How will Triton affect the decision making process, will it be:
Much more centralised·
Marginally more centralised ·Marginally more devolved
·Much more devolved ·
13. Will the introduction of Triton lead to:
Many more managers ·A few more managers ·A few less managers ·A lot less managers ·
14. Will the introduction of Triton lead to:
Many more levels in the structure·
A few more levels in the structure·
A few less levels in the structure·
A lot less levels in the structure·
15. Will the introduction of Triton lead to:
Many more service departments·
A few more service departments·
A few less service departments·
A lot less service departments·
16. Will the introduction of Triton lead to, (on average):
Many more people reporting to each manager·
A few more people reporting to each manager·
A few less people reporting to each manager ·A lot less people reporting to each manager ·
17. Will the introduction of Triton lead to changes in the distribution of tasks within a department.
213

Many tasks will be done by different people than at present ·A few tasks will be done by different people than at present·No tasks will be done by different people than at present
·
18. Will the introduction of Triton lead to changes in the distribution of tasks between departments.
Many tasks will move between departments ·A few tasks will move between departments ·No tasks will move between departments
·19. Will the introduction of Triton lead to changes in the distribution of tasks between
departments and factories.
Many tasks will move from factories to departments ·A few tasks will move from factories to departments
·Many tasks will move from departments to factories ·A few tasks will move from departments to factories
·No tasks will move between factories and departments
·
20. Will the introduction of Triton encourage multi-skilled team working.
Much more likely·
A little more likely·
A little less likely·
Much less likely·
21. Will Triton lead to any effect on the unity of command, (note the current matrix structural links, e.g. where a Quality Technician reports to their Factory Manager, but has a relationship with the Quality Manager and a Quality Engineer):
Many more matrix structural links ·A few more matrix structural links ·A few less matrix structural links
·A lot less matrix structural links
·
22. Will Triton necessitate job redesign.
Will cause significant job redesign ·Will cause some job redesign ·
214

Will cause minor job redesign·
Will cause no job redesign·
23. Will Triton necessitate procedural changes.
Will cause significant changes to procedures ·Will cause some changes to procedures
·Will cause minor changes to procedures
·Will cause no changes to procedures ·
24. What will be the effect on the variety of skills required (on average):
Many more skills·
A few more skills·
A few less skills·
A lot less skills·
215

25. What will be the effect on the variety of tasks undertaken (on average):
Many more varied tasks·
A few more varied tasks·
A few less varied tasks·
A lot less varied tasks ·
26. What will be the effect on the importance of tasks undertaken (on average):
Much more important ·A little more important
·A little less important ·Much less important ·
27. What will be the effect on the autonomy with which tasks are undertaken (on average):
Much more autonomy ·A little more autonomy
·A little less autonomy ·Much less autonomy ·
28. What will be the effect on the feedback to the individual on how well a task is being performed (on average):
Much more feedback ·A little more feedback
·A little less feedback ·Much less feedback ·
29. What will be the effect on the requirement for supervision, after training, to perform tasks (on average):
Much more supervision required·
A little more supervision required·
A little less supervision required·
Much less supervision required·
30. Will Triton affect the formality with which work is performed.
Much more formality required·
216
A little more formality required·
A little less formality required·
Much less formality required ·
217

31. Will Triton affect the ability to innovate solutions to problems.
Much more ability to innovate solutions to problems·
A little more ability to innovate solutions to problems·
A little less ability to innovate solutions to problems·
Much less ability to innovate solutions to problems ·
32. Will Triton affect the ability to react quickly to problems.
Much more ability to react quickly to problems·
A little more ability to react quickly to problems·
A little less ability to react quickly to problems·
Much less ability to react quickly to problems·
33. Will the introduction of Triton lead to:
Many more standard meetings·
A few more standard meetings·
A few less standard meetings ·A lot less standard meetings ·
34. Will the introduction of Triton lead to:
Many more ad-hoc meetings ·A few more ad-hoc meetings ·A few less ad-hoc meetings ·A lot less ad-hoc meetings ·
35. Will the introduction of Triton lead to:
Many more standard reports ·A few more standard reports ·A few less standard reports ·A lot less standard reports
·
36. Will the introduction of Triton lead to:
Many more ad-hoc reports ·A few more ad-hoc reports ·A few less ad-hoc reports
·
218
A lot less ad-hoc reports·
219
Appendix E: Best Practice Survey1. A company must change if it is to survive and thrive, what factors do you think
affect organisational change. Rank in order the following list (1,2,3, etc.)
Society’s expectations · Information technology advances ·Advancing product & process technology · Financial Constraints ·Political/governmental requirements · Opportunities to increase profits ·Manpower skills available · Pressure from competitors
·Customer needs ·
2. Which describes your company’s overall organisational style, (tick one box)
Dynamic (causes opportunities for change) ·
Fluid (predicts changes and reacts as they occur) ·Organic (follows change closely)
·Evolutionary (follows external changes only slowly) ·
3. Do you see an Enterprise Wide Computerised Management Information System as an enabler of organisational change:
Makes changes much easier ·Makes changes somewhat easier
·Makes changes somewhat more difficult
·Makes changes much more difficult ·
4. Did the introduction of An Enterprise Wide Computerised Management Information System result in organisational changes:
Significant changes ·Some changes ·Minor changes ·No change
·
5. How does An Enterprise Wide Computerised Management Information System affect the decision making process, is it:
Much more centralised·
Marginally more centralised ·Marginally more devolved
·Much more devolved ·
220

6. Does this system lead to:
Many more managers ·A Few more managers
·A Few less managers ·A Lot less managers ·
221

7. Does the system lead to:
Many more levels in the structure·
A few more levels in the structure·
A few less levels in the structure·
A lot less levels in the structure·
8. Does the system lead to:
Many more service departments·
A few more service departments·
A few less service departments·
A lot less service departments·
9. Does the system lead to, (on average):
Many more people reporting to each manager·
A few more people reporting to each manager·
A few less people reporting to each manager ·A lot less people reporting to each manager ·
10. Does the system lead to changes in the distribution of tasks within a department:
Many tasks move between personnel in a department·
A few tasks move between personnel in a department·
No tasks move between personnel in a department ·
11. Does the system lead to changes in the distribution of tasks between departments:
Many tasks move between departments·
A few tasks move between departments·
No tasks move between departments ·
12. Does An Enterprise Wide Computerised Management Information System lead to an organisation more based on:
Functions · Processes ·
222
13. Does An Enterprise Wide Computerised Management Information System encourage multi-skilled team working:
Much more likely·
A little more likely·
A little less likely·
Much less likely·
223

14. Does An Enterprise Wide Computerised Management Information System cause any effect on the unity of command, (are Matrix Structural links more likely):
Many more links·
A few more links·
A few less links·
A lot less links ·
15. Does An Enterprise Wide Computerised Management Information System necessitate job redesign:
Causes significant job redesign·
Causes some job redesign·
Causes minor job redesign·
Causes no job redesign·
16. Does An Enterprise Wide Computerised Management Information System necessitate procedural changes:
Causes significant changes to procedures·
Causes some changes to procedures ·Causes minor changes to procedures ·Causes no changes to procedures
·
17. What is the effect on the variety of skills required (on average):
Many more skills·
A few more skills·
A few less skills·
A lot less skills·
18. What is the effect on the variety of tasks undertaken (on average):
Many more tasks·
A few more tasks·
224
A few less tasks·
A lot less tasks·
19. What is the effect on the importance of tasks undertaken (on average):
Much more important ·A little more important
·A little less important ·Much less important ·
225

20. What is the effect on the autonomy with which tasks are undertaken (on average):
Much more autonomy ·A little more autonomy
·A little less autonomy ·Much less autonomy ·
21. What is the effect on the feedback to the individual on how well a task is being performed (on average):
Much more feedback ·A little more feedback
·A little less feedback ·Much less feedback ·
22. What is the effect on the requirement for supervision, after training, to perform tasks (on average):
Much more supervision required·
A little more supervision required·
A little less supervision required·
Much less supervision required·
23. Does An Enterprise Wide Computerised Management Information System affect the formality with which work is performed:
Much more formality required·
A little more formality required·
A little less formality required·
Much less formality required ·
24. Does An Enterprise Wide Computerised Management Information System affect the ability to solve problems:
Much more ability to innovate solutions to problems·
A little more ability to innovate solutions to problems·
A little less ability to innovate solutions to problems·
Much less ability to innovate solutions to problems ·
226

25. Does An Enterprise Wide Computerised Management Information System affect the ability to react quickly to problems:
Much more ability to react quickly to problems·
A little more ability to react quickly to problems·
A little less ability to react quickly to problems·
Much less ability to react quickly to problems·
227
26. Does an Enterprise Wide Computerised Management Information System lead to:
Many more standard meetings·
A few more standard meetings·
A few less standard meetings ·A lot less standard meetings ·
27. Does an Enterprise Wide Computerised Management Information System lead to:
Many more ad-hoc meetings ·A few more ad-hoc meetings ·A few less ad-hoc meetings ·A lot less ad-hoc meetings ·
28. Does an Enterprise Wide Computerised Management Information System lead to:
Many more standard reports ·A few more standard reports ·A few less standard reports ·A lot less standard reports
·
29. Does an Enterprise Wide Computerised Management Information System lead to:
Many more ad-hoc reports ·A few more ad-hoc reports ·A few less ad-hoc reports
·A lot less ad-hoc reports
·
228
Appendix F: Organisation Charts Organisational Chart: Furniture Group
Group General Manager
Quality Manager
Industrial Engineering
Manager
Manufacturing Manager
Marketing Manager
Quality Engineers
IndustrialEngineers
Product Engineers
Factory Managers(see separate chart)
Clerks
Finance Manager
Management & Cost
Accountant
Financial Accountant
Materials Manager
Estimators &
Clerks
Clerks
Production Planners
Purchasing
Manager
Buyers
Contracts Manager
National Sales
Manager
Sales Managers
Sales Persons
(See separate chart)
Secretary
PersonnelManager
PersonnelStaff
TransportManager
TransportStaff
SystemsManager
Systems Staff
Contracts Department Organisation Chart
Factory Organisation Chart
Project Manager
Quotations Staff
Bids & Quotations Manager
Layout Planners
Planning Manager
Customer Service Clerks
Customer Support
Supervisor
Contracts Manager
Operatives
Leading Hands
Senior Superviso
r
Store Keeper
Quality Technicia
n
Wages Clerk
Scheduler
Factory Manager
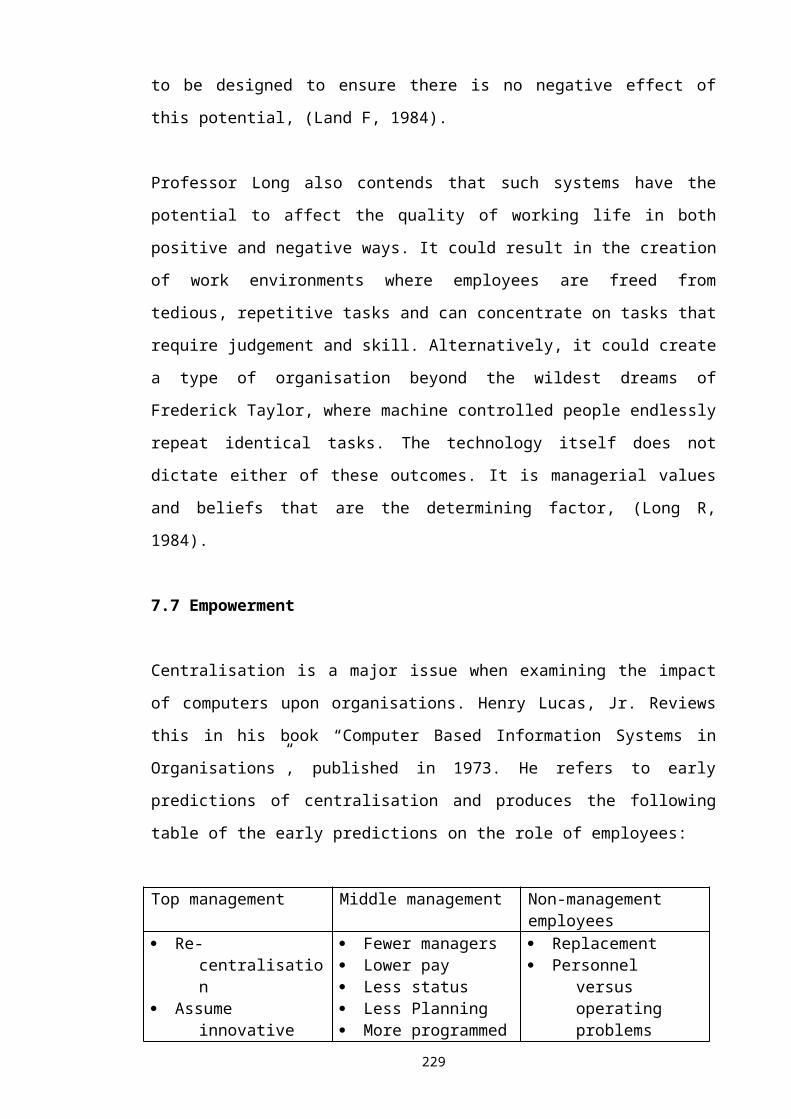
Appendix G: Process Maps
Sales Order Receipt and Processing
Customer Support
Bids & Quotes
Customer Support
Credit Control
Bids & Quotes
Bids & Quotes
Customer Support
Central Planning
Customer Support
232
Sales order receipt
Check requirement
Allocate order no.
Credit check
Tie order to quote
Manufacturing Schedule
Enter order on computer
Delivery date
Order acknowledgement

Logistics Process
Central Planning
Central Planning
Purchasing
Purchasing
Factory Storekeeper
Factory Scheduler
Factory Scheduler
Factory Storekeeper
Manufacturing
Factory Storekeeper
Factory Scheduler
Transport
Factory Storekeeper
Transport
233
Order receiptOrder receipt
Run MRPRun MRP
Run MRP on purchased items
Place purchase orders
Receive Goods raise GRN
Print production orders
Manufacture order
Issue materials
Issue production orders
Close production order
Receive product
Plan transport
Despatch order
Deliver order