Embed Size (px)
Citation preview
WRITERS GUILD OF AMERICA, WEST
THE 2016 HOLLYWOOD WRITERS REPORT
Renaissance in Reverse?
Prepared by: Darnell M. Hunt, Ph.D. Director, Ralph J. Bunche Center for African American Studies at UCLA
Professor and Chair, Department of Sociology
March 2016
2
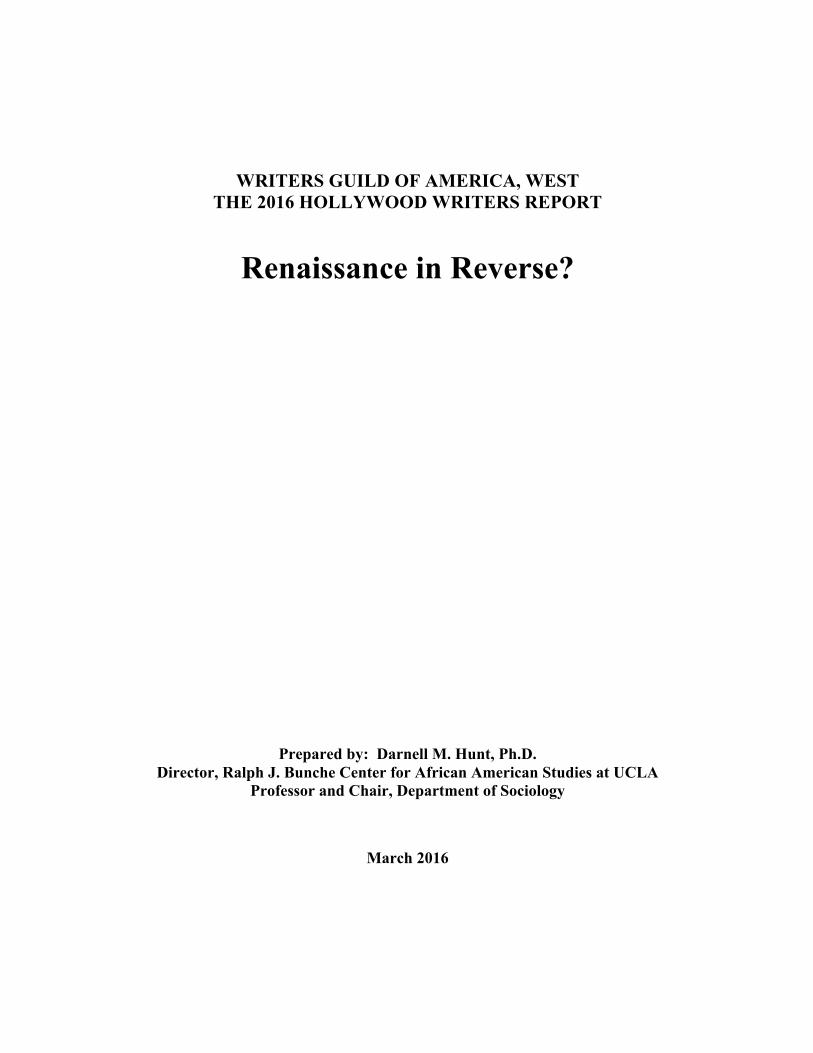
TABLE OF CONTENTS List of Tables and Figures I. BACKROUND AND INTRODUCTION 6 Organization of the Report A Note on Other Groups of Writers II. STUDY DATA 8 Missing Data Earnings Statistics Production Companies Comparing Tables and Figures to earlier Hollywood Writers Reports III. OVERALL TRENDS 11 Membership Employment Earnings Conclusions IV. WOMEN WRITERS 17 Television Employment Film Employment Television Earnings Film Earnings Conclusions V. MINORITY WRITERS 20 Television Employment Film Employment Television Earnings Film Earnings Conclusions VI. OLDER WRITERS 25 Television Employment Film Employment Television Earnings Film Earnings Conclusion

3
VII. SUMMARY AND CONCLUSIONS 30 APPENDIX: TABLES AND FIGURES
4
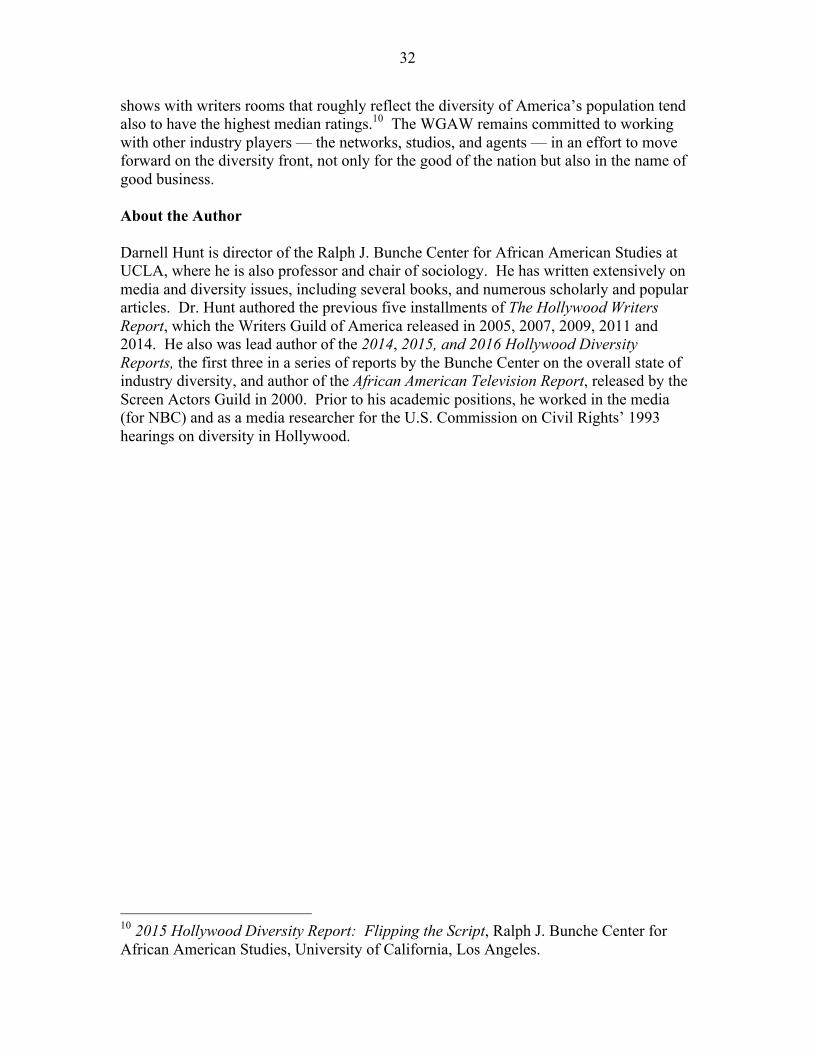
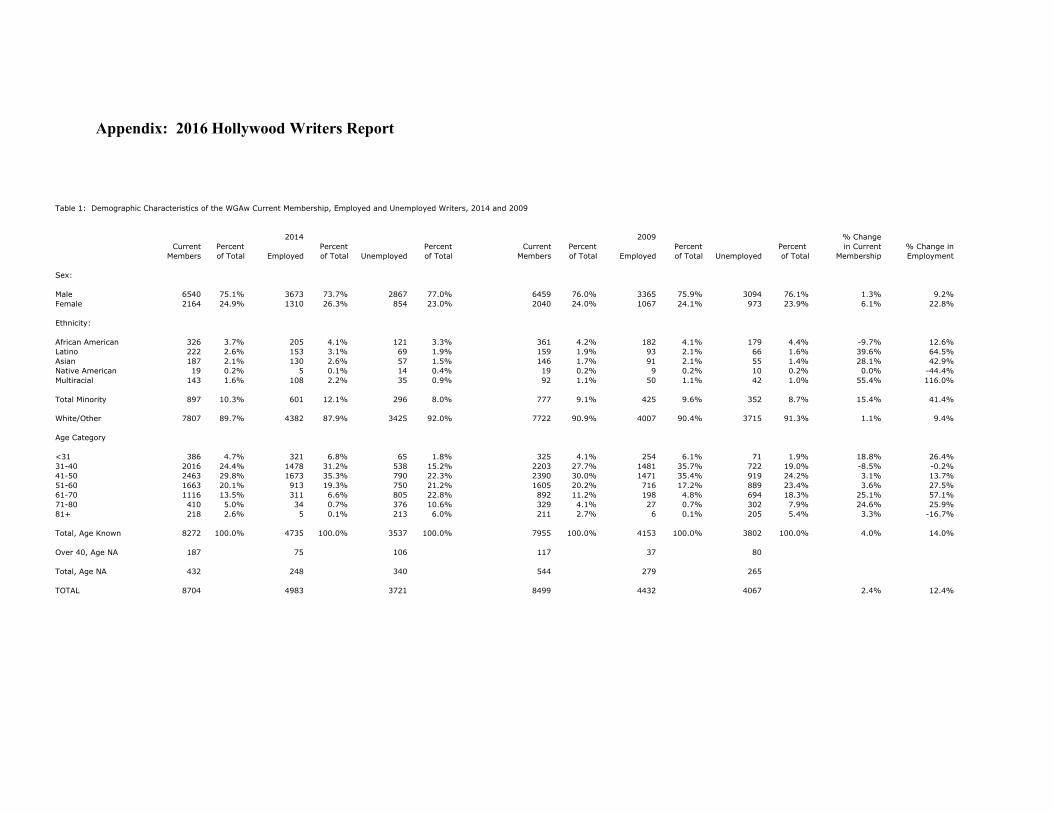
LIST OF TABLES AND FIGURES Tables: Table 1: Demographic Characteristics of the WGAW Current Membership, Employed and Unemployed Writers, 2014 and 2009 Table 2: Current Membership, Employment and Unemployment by Group, 2014 and 2009 Table 3: Overall Trends in Employment and Earnings by Group, 2008-2014 Table 4: Employment Trends by Gender, by Sector, 2008-2014 Table 5: Earnings Trends by Gender, by Sector, 2008-2014 Table 6: Employment Trends by Race/Ethnicity, by Sector, 2008-2014 Table 7: Earnings Trends by Race/Ethnicity, by Sector, by 2008-2014 Table 8: Employment Trends by Age Group, by Sector, 2008-2014 Table 9: Earnings Trends by Age Group, by Sector, 2008-2014 Table 10: Snapshot of Employed Writers, 2014 Figures: Figure 1: Current WGA Members, 2007 to 2014 Figure 2: Current WGA Members, Female and Minority Shares, 2007 to 2014 Figure 3: Employed WGA Writers, 2007 to 2014 Figure 4: Median Earnings, Employed Women, Minority, and White Male Writers, 2004-2014 Figure 5: Women Writers’ Share of Employment, 2010-2014 Figure 6: The Gender Earnings Gap, TV, 2009-2014 Figure 7: The Gender Earnings Gap, Film, 2009-2014
5
Figure 8: Television Employment by Minority Status, 2010-2014 Figure 9: Film Employment by Minority Status, 2010-2014 Figure 10: The Earnings Gap for Minorities, TV, 2009-2014 Figure 11: The Earnings Gap for Minorities, Film, 2009-2014 Figure 12: Trends in Minority Employment Share, 1990-2014 Figure 13: Employment Rate by Age Group, 2010, 2012, and 2014 Figure 14: Share of Television Employment, by Age Group, 2010, 2012, and 2014 Figure 15: Share of Film Employment, by Age Group, 2010, 2012, and 2014 Figure 16: Television Earnings by Age Group, 2010, 2012, and 2014 Figure 17: Film Earnings by Age Group, 2010, 2012, and 2014
6
I. BACKGROUND AND INTRODUCTION The 2016 Hollywood Writers Report: Renaissance in Reverse? is the tenth in a series of reports released by the Writers Guild of America, West (WGAW) examining employment and earnings trends for writers in the Hollywood industry. These reports have highlighted three groups of writers — women, minority, and older writers — who traditionally have been underemployed in the industry. The reports have documented the employment experiences of these study groups relative to their male, white, and younger counterparts in order to identify any patterns that suggest either progress or retreat on the industry diversity front. Using the reports as a diagnostic tool, the WGAW seeks to collaborate with the industry in efforts to increase the employment opportunities of all writers. The 2016 report serves as a follow-up to its predecessor, The 2014 Hollywood Writers Report: Turning Missed Opportunities Into Realized Ones. While it focuses primarily on hiring and earnings patterns for the latest two-year period not covered in the previous report (i.e., 2013 to 2014), it also includes new analyses of data for the years 2009 to 2012 and data for select years imported from previous reports. Prior reports in the series provide summary data on trends going back to 1982. Organization of the Report This report is organized as follows: Section II discusses the sources and limitations of the data and provides background information on the types of analyses performed throughout the report; Section III provides a general overview of WGAW membership, employment, and earnings trends over the study period; Section IV focuses on the experiences of women writers, particularly as they compare to those of their male counterparts; Sections V and VI present similar, detailed analyses for minority writers and for older writers, respectively; Section VII summarizes the report findings and presents conclusions. A Note on Other Groups of Writers Depictions of LGBT persons and those with disabilities have increased in film and television in recent years. Yet questions remain regarding the degree to which writers from these groups have been incorporated into the industry workforce, particularly to work on projects for which their perspectives and sensitivities might be most valued. Indeed, anecdotes suggest that television and film projects featuring depictions of LGBT persons and those with disabilities all too often fail to employ writers from these groups. Beyond the industry experiences reported by select Guild members, however, the data do not currently exist to systematically examine the industry positions of these groups of writers. The WGAW sponsors member committees that represent the special concerns of these groups of writers and that work with the Guild’s Diversity Department to make sure
7
that their concerns are addressed by internal Guild programs and industry-Guild, collaborative initiatives. The LGBT Writers Committee has advocated using current estimates of gay and lesbian representation in the overall population as a benchmark against which to measure the group’s position in the industry. By this logic, at least one in ten voices and perspectives on a project writing staff ideally should be LGBT. Meanwhile, there are only a handful of self-identified writers with disabilities who are members of the WGAW. This fact is associated, in part, with the dearth of characters with disabilities in film and on television. The mission of the Writers with Disabilities Committee is to nurture young writers with disabilities (future WGA members) and to serve as a resource for the whole Guild in matters pertaining to disability. Although one out of two Americans has a family member or close friend who is disabled, this reality has yet to be reflected on the big or small screen. In an effort to increase the employment opportunities of all writers, the WGAW announced a TV Writer Access Program (TV WAP) in January 2009 designed to identify and connect outstanding screenwriters from each of the diverse communities to showrunners looking to staff their television shows. Modeled on this television initiative, the Feature WAP was introduced in 2011 for writers seeking exposure to decision makers in the film sector. The WGAW’s goal is to employ data from this report in order to strengthen the impact of the TV WAP and Feature WAP, as well as collaborate with key industry players on rewriting the all-too-familiar story about the challenges faced by diverse writers.
8
II. STUDY DATA The primary data for The 2016 Hollywood Writers Report come from the computerized files of the WGAW, which are based on member reports of employment and earnings for each quarter. The Guild collects these reports in the normal course of business for the purpose of establishing member dues. They include information on the nature of the employment (e.g., staff writer, executive story editor, rewrite, development deal, and so on), whether it was provided for the television or film sectors, the company and/or conglomerate for which the work was completed, and the amount of compensation for the work. The WGAW also keeps track of basic demographic information on its members, such as gender, ethnicity, birth date, and the year in which each member joined the Guild. This demographic information is linked to each work report in the computerized files. Six separate datasets — each based on member employment and earnings reports for a specific year between 2009 and 2014 — were analyzed to produce this report. Because the cases examined in this report essentially constitute entire populations of interest (i.e., “current Guild members,” “employed television writers,” “employed film writers,” and so on), inferential statistics are unnecessary for making distinctions between groups and are thus not used. Missing Data Despite Guild efforts to collect basic demographic information on its members, some members choose not to identify their gender and/or ethnicity. In the 2014 earnings dataset, for example, less than 1 percent of the cases had missing information for gender, while about 5 percent had missing information for age and about 16 percent for ethnicity. Whenever feasible, the first name of members was used to identify gender for cases where the information was missing. Since an analysis of cases with missing ethnicity information revealed that these cases were more similar to white writers in terms of earnings than to other writers, and because research suggests that minority respondents generally are less likely to omit ethnicity information than non-minorities, cases with missing ethnicity information were coded as “white” for the purposes of analysis (which follows the practice employed in earlier Hollywood Writers Reports). Cases with missing age information were singled out and examined separately in some of the tables that summarize age differences in employment and earnings. In other tables that examine these differences, the year a member joined the Guild was used to approximate age if the exact age of a member was missing. That is, if the data show that a given member joined the WGAW 20 years or more prior to the year for which employment and earnings were being reported (i.e., prior to 1994 in the 2014 data set), it was assumed that the member was more than 40 years old in the report year (i.e., the case was coded as “over 40 age n/a”).
9
Earnings Statistics “Median” earnings statistics are used throughout this report to compare earnings trends1 among different groups of writers: non-minority writers, minority writers, white male writers, female writers, writers over 40 years of age, writers under 40 years of age, and so on. The “median” refers to the value physically in the middle of a ranked distribution of numbers. Like the “mean” or arithmetic “average,” it is a measure of what is typical for a given distribution of numbers. But unlike the mean or average it has the advantage of not being unduly influenced by extremely high or extremely low values, which might otherwise produce a distorted view of what is typical for the distribution. For these reasons, the median is conventionally used to examine income distributions, as they often contain very low and/or very high values. In this report, the median is the primary measure used to identify any meaningful earnings differences between the different groups of writers. The “95th percentile,” by contrast, provides us with a measure of what the highest paid writers in a particular group of writers earned in a given year. That is, only 5 percent of writers in a given group earned this amount or more, while 95 percent earned less. Using this statistic provides us with another way of thinking about any earnings differences between the groups: To what degree do earnings differences between the groups exist when we consider only the writers who are at the very top of the profession? “Relative earnings” statistics are ratios used in some tables to compare a group’s earnings at the median or 95th percentile to those of another referent group. In this report, the earnings of women and minorities (numerator) are reported in relation to those of white males (denominator), while the earnings of writers over 40 (numerator) are reported relative to those of writers under 40 (denominator). When the ratio is below $1.00, the group in question earns less than the referent group; when it is above $1.00, the group earns more. For reasons of writer confidentiality and because both the median and 95th percentile statistics are less reliable when the number of observations is low, earnings statistics are reported for a given group of writers only when there are five or more observations.
1 While member-reported film earnings reflect the total earnings of writers from film employment, television earnings are reported on all script fees and on approximately the first $6,500 earned per week by television writers employed in additional capacities.
10
Production Companies Due to changes in media ownership in recent years, this report omits the production company analyses presented in earlier reports. Future reports in this series will consider employment and earnings statistics for each group of writers by conglomerate and larger independent production company. Comparing Tables and Figures Across Hollywood Writers Reports The WGAW member reports on which this study is based are received by the Guild on a continual basis, sometimes significantly beyond the year in which the work was performed. For this reason, each of the six yearly data sets used to compile this report’s tables may be adjusted in future reports as new member information is received by the Guild. By contrast, data reported herein for years prior to 2009 have not been updated and thus conform to those presented in tables from the previous report.
11
III. OVERALL TRENDS The 2016 Hollywood Writers Report provides an update on the progress of women, minority, and older writers on the employment and earnings fronts. Relative to their white male and younger counterparts, these groups of writers have traditionally faced underemployment and/or lower earnings in Hollywood’s television and film sectors. This report focuses on changes in the groups’ prospects since 2012, which must be considered in the context of major trends in the Hollywood industry. One of the most important industry trends is the volume of film and television production. While theatrical film production among the major studios has declined significantly since 2006,2 the explosion in original programming across broadcast, cable, and digital platforms has ushered in a renaissance in television. Indeed, the increase in jobs in the television sector has more than offset the losses in film in recent years. How have women, minority and older writers fared in this expanding Hollywood context?
The previous report — which considered employment and earnings through 20123 — found modest progress for women and minorities in television, and gains for older writers in film. It noted that women writers had reduced the gender earnings gap in television, despite a small decline in the group’s share of sector employment. By contrast, the report found that minority television writers had posted small increases in employment share and earnings relative to their white male counterparts by 2012. In the film sector, however, the report found stagnation for both women and minority writers as neither group had gained any ground on their white male counterparts. As a result, both groups remained seriously underrepresented among the corps of writers in both sectors. Meanwhile, the report noted that older writers (particularly those aged 41 to 50) claimed the largest share of employment in television and film in 2012, as well as the highest earnings in each sector.
The current report reveals a mixture of slow, forward progress, stalls and reversals on the Hollywood diversity front. Women writers have made small advances in television employment and earnings since 2012. Though women writers also made small gains in film employment, the report reveals they lost ground in sector earnings by 2014. For minority television writers, however, any advances in employment share and relative earnings have stalled since the previous report. Only in the film sector have minority writers enjoyed any gains since 2012 — a slight increase in their share of employment and a small closing of the earnings gap. Meanwhile, the corps of employed writers in television and film has continued to age since the last report. Older writers aged 51 to 60
2 The number of films released by the major studios declined from 204 in 2006 to just 136 in 2014, a 33.3 percent decrease (see Theatrical Market Statistics, 2014, p. 21, Motion Pictures Association of America). Meanwhile, the number of writers employed in the film sector dropped 16.3 percent over the same period, from 1922 in 2006 to 1608 in 2014 (see Table 4 from the 2014 and 2016 Hollywood Writers Report). 3 The 2014 Hollywood Writers Report considered employment and earnings in television and film through 2012. It can be accessed on-line at: http://www.wga.org/uploadedFiles/who_we_are/HWR14.pdf
12
became the highest paid television writers among the age groups by 2014, while writers aged 41 to 50 remained the highest paid in the film sector.
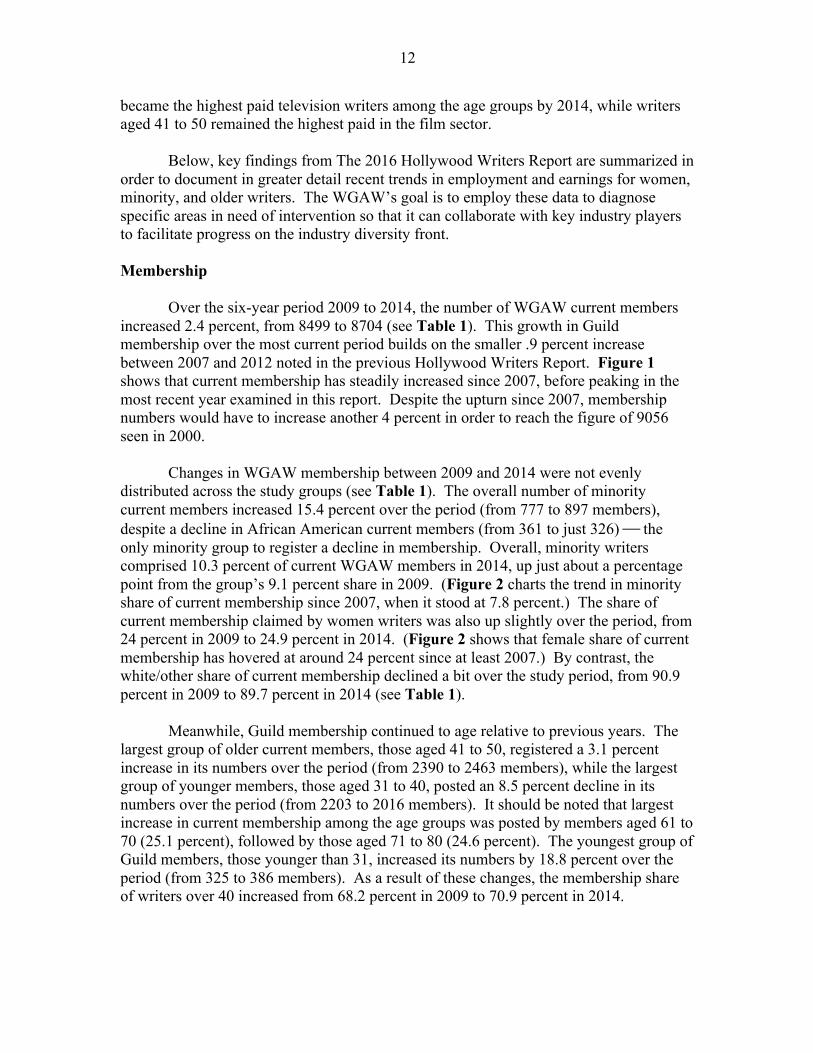
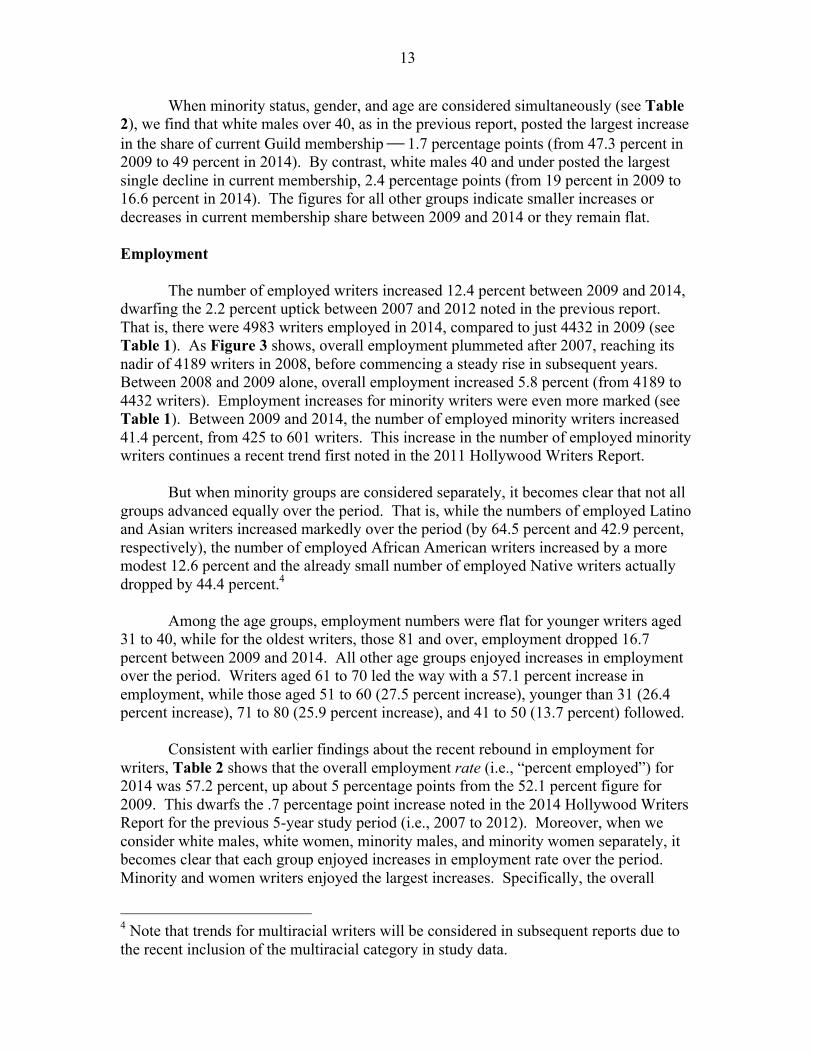
Below, key findings from The 2016 Hollywood Writers Report are summarized in order to document in greater detail recent trends in employment and earnings for women, minority, and older writers. The WGAW’s goal is to employ these data to diagnose specific areas in need of intervention so that it can collaborate with key industry players to facilitate progress on the industry diversity front. Membership Over the six-year period 2009 to 2014, the number of WGAW current members increased 2.4 percent, from 8499 to 8704 (see Table 1). This growth in Guild membership over the most current period builds on the smaller .9 percent increase between 2007 and 2012 noted in the previous Hollywood Writers Report. Figure 1 shows that current membership has steadily increased since 2007, before peaking in the most recent year examined in this report. Despite the upturn since 2007, membership numbers would have to increase another 4 percent in order to reach the figure of 9056 seen in 2000. Changes in WGAW membership between 2009 and 2014 were not evenly distributed across the study groups (see Table 1). The overall number of minority current members increased 15.4 percent over the period (from 777 to 897 members), despite a decline in African American current members (from 361 to just 326) ! the only minority group to register a decline in membership. Overall, minority writers comprised 10.3 percent of current WGAW members in 2014, up just about a percentage point from the group’s 9.1 percent share in 2009. (Figure 2 charts the trend in minority share of current membership since 2007, when it stood at 7.8 percent.) The share of current membership claimed by women writers was also up slightly over the period, from 24 percent in 2009 to 24.9 percent in 2014. (Figure 2 shows that female share of current membership has hovered at around 24 percent since at least 2007.) By contrast, the white/other share of current membership declined a bit over the study period, from 90.9 percent in 2009 to 89.7 percent in 2014 (see Table 1).
Meanwhile, Guild membership continued to age relative to previous years. The largest group of older current members, those aged 41 to 50, registered a 3.1 percent increase in its numbers over the period (from 2390 to 2463 members), while the largest group of younger members, those aged 31 to 40, posted an 8.5 percent decline in its numbers over the period (from 2203 to 2016 members). It should be noted that largest increase in current membership among the age groups was posted by members aged 61 to 70 (25.1 percent), followed by those aged 71 to 80 (24.6 percent). The youngest group of Guild members, those younger than 31, increased its numbers by 18.8 percent over the period (from 325 to 386 members). As a result of these changes, the membership share of writers over 40 increased from 68.2 percent in 2009 to 70.9 percent in 2014.
13
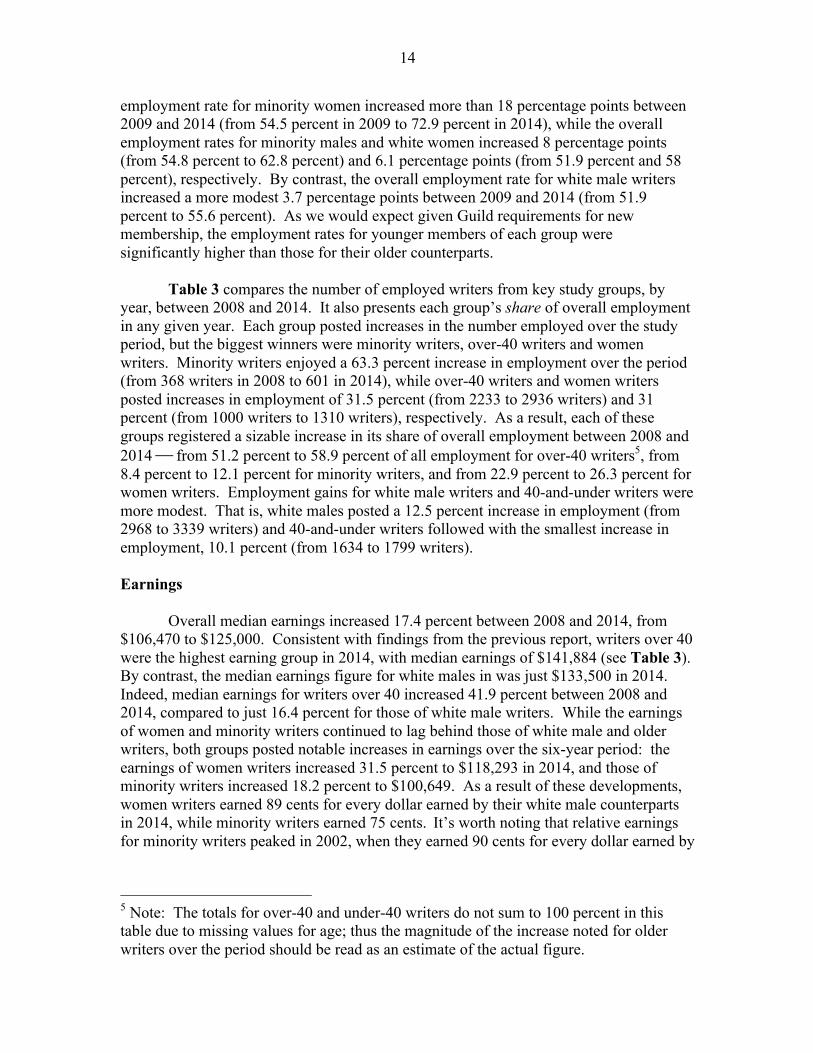
When minority status, gender, and age are considered simultaneously (see Table 2), we find that white males over 40, as in the previous report, posted the largest increase in the share of current Guild membership ! 1.7 percentage points (from 47.3 percent in 2009 to 49 percent in 2014). By contrast, white males 40 and under posted the largest single decline in current membership, 2.4 percentage points (from 19 percent in 2009 to 16.6 percent in 2014). The figures for all other groups indicate smaller increases or decreases in current membership share between 2009 and 2014 or they remain flat. Employment The number of employed writers increased 12.4 percent between 2009 and 2014, dwarfing the 2.2 percent uptick between 2007 and 2012 noted in the previous report. That is, there were 4983 writers employed in 2014, compared to just 4432 in 2009 (see Table 1). As Figure 3 shows, overall employment plummeted after 2007, reaching its nadir of 4189 writers in 2008, before commencing a steady rise in subsequent years. Between 2008 and 2009 alone, overall employment increased 5.8 percent (from 4189 to 4432 writers). Employment increases for minority writers were even more marked (see Table 1). Between 2009 and 2014, the number of employed minority writers increased 41.4 percent, from 425 to 601 writers. This increase in the number of employed minority writers continues a recent trend first noted in the 2011 Hollywood Writers Report.
But when minority groups are considered separately, it becomes clear that not all groups advanced equally over the period. That is, while the numbers of employed Latino and Asian writers increased markedly over the period (by 64.5 percent and 42.9 percent, respectively), the number of employed African American writers increased by a more modest 12.6 percent and the already small number of employed Native writers actually dropped by 44.4 percent.4
Among the age groups, employment numbers were flat for younger writers aged
31 to 40, while for the oldest writers, those 81 and over, employment dropped 16.7 percent between 2009 and 2014. All other age groups enjoyed increases in employment over the period. Writers aged 61 to 70 led the way with a 57.1 percent increase in employment, while those aged 51 to 60 (27.5 percent increase), younger than 31 (26.4 percent increase), 71 to 80 (25.9 percent increase), and 41 to 50 (13.7 percent) followed. Consistent with earlier findings about the recent rebound in employment for writers, Table 2 shows that the overall employment rate (i.e., “percent employed”) for 2014 was 57.2 percent, up about 5 percentage points from the 52.1 percent figure for 2009. This dwarfs the .7 percentage point increase noted in the 2014 Hollywood Writers Report for the previous 5-year study period (i.e., 2007 to 2012). Moreover, when we consider white males, white women, minority males, and minority women separately, it becomes clear that each group enjoyed increases in employment rate over the period. Minority and women writers enjoyed the largest increases. Specifically, the overall
4 Note that trends for multiracial writers will be considered in subsequent reports due to the recent inclusion of the multiracial category in study data.
14
employment rate for minority women increased more than 18 percentage points between 2009 and 2014 (from 54.5 percent in 2009 to 72.9 percent in 2014), while the overall employment rates for minority males and white women increased 8 percentage points (from 54.8 percent to 62.8 percent) and 6.1 percentage points (from 51.9 percent and 58 percent), respectively. By contrast, the overall employment rate for white male writers increased a more modest 3.7 percentage points between 2009 and 2014 (from 51.9 percent to 55.6 percent). As we would expect given Guild requirements for new membership, the employment rates for younger members of each group were significantly higher than those for their older counterparts. Table 3 compares the number of employed writers from key study groups, by year, between 2008 and 2014. It also presents each group’s share of overall employment in any given year. Each group posted increases in the number employed over the study period, but the biggest winners were minority writers, over-40 writers and women writers. Minority writers enjoyed a 63.3 percent increase in employment over the period (from 368 writers in 2008 to 601 in 2014), while over-40 writers and women writers posted increases in employment of 31.5 percent (from 2233 to 2936 writers) and 31 percent (from 1000 writers to 1310 writers), respectively. As a result, each of these groups registered a sizable increase in its share of overall employment between 2008 and 2014 ! from 51.2 percent to 58.9 percent of all employment for over-40 writers5, from 8.4 percent to 12.1 percent for minority writers, and from 22.9 percent to 26.3 percent for women writers. Employment gains for white male writers and 40-and-under writers were more modest. That is, white males posted a 12.5 percent increase in employment (from 2968 to 3339 writers) and 40-and-under writers followed with the smallest increase in employment, 10.1 percent (from 1634 to 1799 writers). Earnings Overall median earnings increased 17.4 percent between 2008 and 2014, from $106,470 to $125,000. Consistent with findings from the previous report, writers over 40 were the highest earning group in 2014, with median earnings of $141,884 (see Table 3). By contrast, the median earnings figure for white males in was just $133,500 in 2014. Indeed, median earnings for writers over 40 increased 41.9 percent between 2008 and 2014, compared to just 16.4 percent for those of white male writers. While the earnings of women and minority writers continued to lag behind those of white male and older writers, both groups posted notable increases in earnings over the six-year period: the earnings of women writers increased 31.5 percent to $118,293 in 2014, and those of minority writers increased 18.2 percent to $100,649. As a result of these developments, women writers earned 89 cents for every dollar earned by their white male counterparts in 2014, while minority writers earned 75 cents. It’s worth noting that relative earnings for minority writers peaked in 2002, when they earned 90 cents for every dollar earned by
5 Note: The totals for over-40 and under-40 writers do not sum to 100 percent in this table due to missing values for age; thus the magnitude of the increase noted for older writers over the period should be read as an estimate of the actual figure.
15
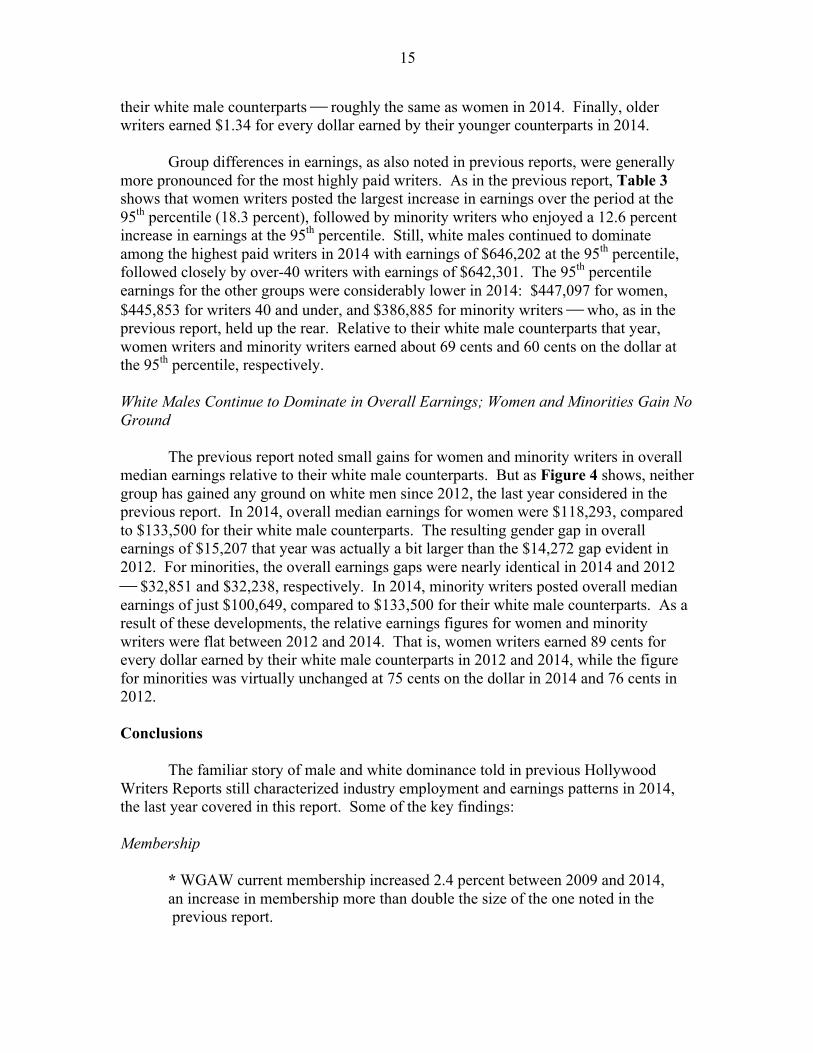
their white male counterparts ! roughly!the same as women in 2014. Finally, older writers earned $1.34 for every dollar earned by their younger counterparts in 2014. Group differences in earnings, as also noted in previous reports, were generally more pronounced for the most highly paid writers. As in the previous report, Table 3 shows that women writers posted the largest increase in earnings over the period at the 95th percentile (18.3 percent), followed by minority writers who enjoyed a 12.6 percent increase in earnings at the 95th percentile. Still, white males continued to dominate among the highest paid writers in 2014 with earnings of $646,202 at the 95th percentile, followed closely by over-40 writers with earnings of $642,301. The 95th percentile earnings for the other groups were considerably lower in 2014: $447,097 for women, $445,853 for writers 40 and under, and $386,885 for minority writers ! who, as in the previous report, held up the rear. Relative to their white male counterparts that year, women writers and minority writers earned about 69 cents and 60 cents on the dollar at the 95th percentile, respectively. White Males Continue to Dominate in Overall Earnings; Women and Minorities Gain No Ground The previous report noted small gains for women and minority writers in overall median earnings relative to their white male counterparts. But as Figure 4 shows, neither group has gained any ground on white men since 2012, the last year considered in the previous report. In 2014, overall median earnings for women were $118,293, compared to $133,500 for their white male counterparts. The resulting gender gap in overall earnings of $15,207 that year was actually a bit larger than the $14,272 gap evident in 2012. For minorities, the overall earnings gaps were nearly identical in 2014 and 2012 ! $32,851 and $32,238, respectively. In 2014, minority writers posted overall median earnings of just $100,649, compared to $133,500 for their white male counterparts. As a result of these developments, the relative earnings figures for women and minority writers were flat between 2012 and 2014. That is, women writers earned 89 cents for every dollar earned by their white male counterparts in 2012 and 2014, while the figure for minorities was virtually unchanged at 75 cents on the dollar in 2014 and 76 cents in 2012. Conclusions The familiar story of male and white dominance told in previous Hollywood Writers Reports still characterized industry employment and earnings patterns in 2014, the last year covered in this report. Some of the key findings: Membership * WGAW current membership increased 2.4 percent between 2009 and 2014, an increase in membership more than double the size of the one noted in the
previous report.
16
* As in the previous report, writers aged 61 to 70, writers aged 71 to 80, and minority writers posted the largest gains in WGA membership, while the membership numbers for women increased more modestly between 2009 and 2014.
* Male writers continued to dominate current membership, accounting for 75.1 percent of members in 2014.
Employment * The overall number of employed writers increased 12.4 percent between
2009 and 2014, dwarfing the 2.2 percent increase for the five-year period considered in the previous report.
* The overall number of employed minority writers increased 41.4 percent over the period, due primarily to increases in employment enjoyed by Latino and Asian American writers.
* Male writers accounted for 73.7 percent of industry employment in 2014, down
about a percentage point from the 75 percent share the group claimed in 2012, the last year examined in the previous report.
Earnings * Overall median earnings increased 17.4 percent since 2008. * Older writers posted the largest median earnings increases,
followed by women and minority writers, whose earnings nonetheless continued to lag behind those of their white male counterparts.
* As in previous reports, group differences were generally more pronounced when only the highest-earning writers were considered.
* The earnings gap between white male writers and women writers increased slightly between 2012 and 2014, reversing the decline in the gap noted in the previous report. For minority writers, the earnings gap was virtually unchanged between reports.
* In 2014, women writers earned 89 cents and minority writers earned 75 cents for each dollar earned by white male writers. The sections that follow provide more-detailed findings regarding television and film employment and earnings for women, minority, and older writers.
17
IV. WOMEN WRITERS Television Employment Table 4 presents employment trends by gender and industry sector for the seven-year study period, 2008 to 2014. While women constitute a little more than half of the population, previous reports consistently show that women have traditionally claimed considerably less than half of all employment in the television sector. Table 4 reveals that this pattern held throughout the study period. While women writers clearly benefitted from the recent renaissance in television production ! the 35.8 percent increase in overall sector employment ! they gained little ground on their male counterparts because male writers also enjoyed sizable increases in sector employment over the period. That is, the number of women employed in the television sector increased 41.7 percent between 2008 and 2014 (from 828 to 1173 writers), compared to a smaller but still robust 33.5 percent increase in the number of employed male writers (from 2181 to 2912 writers). The net result of these developments was an increase of only about a percentage point in women writers’ share of television employment over the period, from 27.5 percent to 28.7 percent. Film Employment While employment soared in the television sector over the study period, it continued to decline in the film sector (7.1 percent between 2008 and 2014), continuing the trend noted in the previous report. However, Table 4 shows that it was male writers who took the biggest hit in the latest period, posting an 8 percent decline in the number of employed film writers (from 1452 writers in 2008 to 1336 in 2014). The employment numbers for women writers, by contrast, declined only 2.5 percent over the period (from 279 to 272 writers). Women film writers thus were able to gain a little ground on their male counterparts since the last report, claiming 16.9 percent of sector employment in 2014 compared to only 16.1 percent in 2008. Women Writers’ Share of Television and Film Employment Rises Since 2012, the last year examined in the previous report, women writers have made notable gains in television and film employment relative to their male counterparts. Figure 5 shows women’s share of television employment increased 2 percentage points between 2012 and 2014, from 27 percent to about 29 percent. This latter figure is the highest share on record for women television writers. The group also posted an increase of 2 percentage points in its share of film employment over the period, from 15 percent to about 17 percent. Its share of overall industry employment in 2014 was 26 percent, up 1 percentage point from the 25 percent figure registered in 2012. If we consider the 5-year period beginning in 2010, women writers made small, steady gains in television relative to their male counterparts but merely treaded water in film. That is, the group’s share of
18
television employment increased 2 percentage points between 2010 and 2014 (from 27 percent to 29 percent) but remained flat in film (17 percent). Women were underrepresented by factors of a little less than 2 to 1 among television writers and nearly 3 to 1 among film writers in 2014, both small improvements over the findings from the previous report for 2012. Television Earnings Table 5 presents earnings trends by gender and employment sector over the seven-year study period. It shows that overall median earnings in television increased 27.4 percent between 2008 and 2014. For women, median earnings in television increased considerably after 2008, peaking at $118,910 in 2014. Over the study period, women’s earnings in television increased 34.8 percent (from $88,207 to $118,910), compared to a 24.1 percent increase for their male counterparts (from $100,000 to $124,071). Gender Earnings Gap in Television Continues to Shrink The previous report showed that women television writers closed the gap in median earnings a bit with their white male counterparts by 2012, the last year examined in the report. This trend continued into 2014. Consistent with their gains in television employment since 2012 (see Figure 5 above), women writers continued to enjoy gains in sector earnings compared to their white male counterparts as well (see Figure 6). In 2012, white male television writers earned $124,905, while women earned $113,350 (91 cents on the dollar). By 2014, white male sector earnings had increased by less than $3,000 to $127,768, compared to an increase of more than $5000 for women to $118,910 (93 cents on the dollar). It is worth noting that women posted the highest relative earnings over the study period, 96 cents, in 2010 and 2011, when the gender earnings gap nearly closed altogether. In 2011, for example, the gap between white male and female sector earnings was less than $5,000 ($116,504 and $112,091, respectively). Film Earnings Previous reports show that the earnings of women writers in the film sector have routinely lagged behind those of their male counterparts. Table 5 shows this pattern continues, despite earnings gains women writers made relative to men over the seven-year study period. That is, though the median earnings of women film writers increased 5.5 percent between 2008 and 2014 (from $48,299 to $50,938) and those of male film writers declined 5.5 percent (from $77,857 to $73,557), the earnings of women film writers continued to trail those of their male counterparts in the sector. Across all film writers, earnings declined 8.3 percent between 2008 and 2014 (from $75,000 to $68,750). Gender Earnings Gap in Film Continues to Widen The gender earnings gap in film has traditionally been greater than the gap in television, and since the last report, it has widened even more (see Figure 7). In 2012,
19
women film writers earned 78 cents for every dollar earned by their white male counterparts ($62,138 versus $80,000). By 2014, the relative earnings figure had dropped to just 68 cents. In that year, the median earnings figure for women film writers was $50,938, compared to $75,000 for white males. It’s worth noting that the lowest relative earnings figure over the six-year period appeared a year earlier, in 2013, when women earned just 61 cents for every dollar earned by men ($43,708 versus $71,077). Conclusions The previous Hollywood Writers Report noted that women’s shares of both television and film employment were on a downward trajectory, falling about a percentage point over the study period. This report, however, reveals a small rebound in employment for women in both sectors, if not in relative earnings:
* Since 2012, the last year covered in the previous report, women’s share of television employment increased from 27 percent to about 29 percent ! which is the highest share for the group on record.
* Women were underrepresented among television writers by a factor of a little less than 2 to 1 in 2014.
* Since the last report, women’s share of film employment increased by 2 percentages points to about 17 percent ! which equals the share the group posted four years earlier in 2010.
* Women were underrepresented among film writers by a factor of nearly 3 to
1 in 2014.
* Since the previous report, the gender earnings gap in television has continued to decline slowly.
* Women television writers earned 93 cents for every dollar earned by their white male counterparts in 2014, which represents a 2 cent increase in relative
earnings since the previous report.
* The gender earnings gap in film continued to widen a bit after 2012, the last year covered in the previous report, despite a 5.5 percent increase in film earnings for women writers between 2008 and 2014.
* Women film writers earned 68 cents for every dollar earned by their white
male counterparts in 2014, down 9 cents since the last report.
20
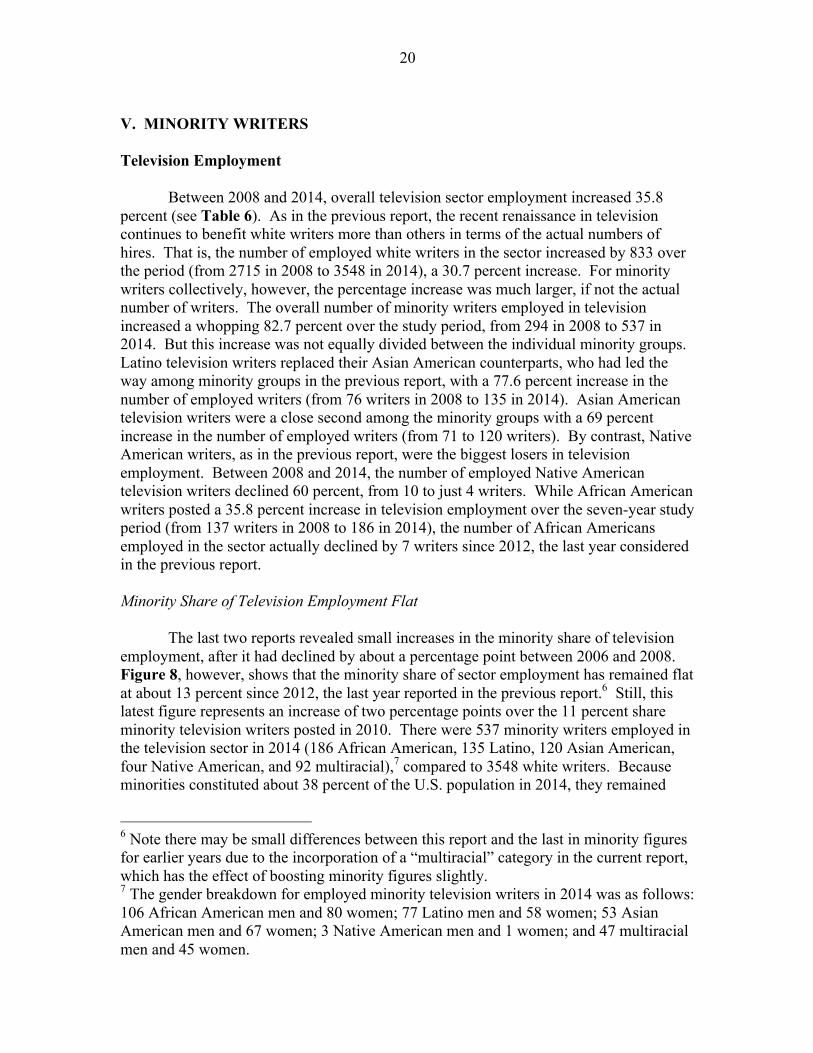
V. MINORITY WRITERS Television Employment Between 2008 and 2014, overall television sector employment increased 35.8 percent (see Table 6). As in the previous report, the recent renaissance in television continues to benefit white writers more than others in terms of the actual numbers of hires. That is, the number of employed white writers in the sector increased by 833 over the period (from 2715 in 2008 to 3548 in 2014), a 30.7 percent increase. For minority writers collectively, however, the percentage increase was much larger, if not the actual number of writers. The overall number of minority writers employed in television increased a whopping 82.7 percent over the study period, from 294 in 2008 to 537 in 2014. But this increase was not equally divided between the individual minority groups. Latino television writers replaced their Asian American counterparts, who had led the way among minority groups in the previous report, with a 77.6 percent increase in the number of employed writers (from 76 writers in 2008 to 135 in 2014). Asian American television writers were a close second among the minority groups with a 69 percent increase in the number of employed writers (from 71 to 120 writers). By contrast, Native American writers, as in the previous report, were the biggest losers in television employment. Between 2008 and 2014, the number of employed Native American television writers declined 60 percent, from 10 to just 4 writers. While African American writers posted a 35.8 percent increase in television employment over the seven-year study period (from 137 writers in 2008 to 186 in 2014), the number of African Americans employed in the sector actually declined by 7 writers since 2012, the last year considered in the previous report. Minority Share of Television Employment Flat The last two reports revealed small increases in the minority share of television employment, after it had declined by about a percentage point between 2006 and 2008. Figure 8, however, shows that the minority share of sector employment has remained flat at about 13 percent since 2012, the last year reported in the previous report.6 Still, this latest figure represents an increase of two percentage points over the 11 percent share minority television writers posted in 2010. There were 537 minority writers employed in the television sector in 2014 (186 African American, 135 Latino, 120 Asian American, four Native American, and 92 multiracial),7 compared to 3548 white writers. Because minorities constituted about 38 percent of the U.S. population in 2014, they remained
6 Note there may be small differences between this report and the last in minority figures for earlier years due to the incorporation of a “multiracial” category in the current report, which has the effect of boosting minority figures slightly. 7 The gender breakdown for employed minority television writers in 2014 was as follows: 106 African American men and 80 women; 77 Latino men and 58 women; 53 Asian American men and 67 women; 3 Native American men and 1 women; and 47 multiracial men and 45 women.
21
underrepresented by a factor of nearly 3 to 1 among television writers. As previous reports have concluded, it appears as if minority television writers are at best treading water when it comes to their representation in sector employment, particularly when we consider how rapidly the nation is diversifying.8
In 2014, Latinos were the largest minority group in the nation, accounting for about 17.4 percent of the population. The population shares for African Americans (13.2 percent), Asian Americans (5.4 percent) and Native Americans (1.2 percent) followed behind. When each individual minority group’s share of television employment (see Table 6) is considered in tandem with the group’s share of the U.S. population, we can compute the degree to which each group was underrepresented among employed television writers in 2014. Native Americans were the most underrepresented in sector employment, by a factor of 12 to 1, and Latinos were next, underrepresented by a factor of more than 5 to 1. By comparison, African Americans were underrepresented by a factor of nearly 3 to 1 in television, while Asian Americans were closest to proportionate representation, underrepresented by a factor of less than 2 to 1. Film Employment As noted above, production in the film sector between 2008 and 2014 hardly resembled the renaissance defining activity in the television sector. This reality was reflected in the employment of film writers (see Table 6), whose overall numbers declined 7.1 percent over the period (from 1731 writers in 2008 to 1608 in 2014). When we consider the racial and/or ethnic background of film writers, we see that the number of white film writers declined 7.7 percent over the period (from 1619 writers in 2008 to 1494 in 2014), while the overall number of minority writers was virtually flat (112 in 2008 and 114 in 2014). Among the individual minority groups, the number of Latino writers increased 6.7 percent over the period (from 30 to 32 writers) and the number of multiracial writers was not counted in 2008 but stood at 22 in 2014. By contrast, African American, Asian American, and Native American film writers all registered declines in sector employment over the period. For African Americans, the drop in the number of employed film writers was quite significant, 31.5 percent (from 54 writers in 2008 to just 34 writers in 2014). For Native American and Asian American writers the declines in sector employment were smaller in absolute terms: 33.3 percent (from just 3 writers to an even smaller number of 2 writers) and 16 percent (from 25 writers to 21 writers), respectively. Taking into account the population statistics cited above, we find that Native Americans have since the last report replaced Latinos as the most underrepresented minority group among writers in the film sector ! by a factor of 12 to 1. Latinos were next, underrepresented by a factor of nearly 9 to 1. Meanwhile, African Americans and Asian Americans faired moderately better compared to their minority peers,
8 The U.S. Census Bureau estimated the minority share of the nation’s population to be about 38 percent in 2014, up considerably from the Census count of 31 percent in 2000 (QuickFacts, 2014 Estimate).
22
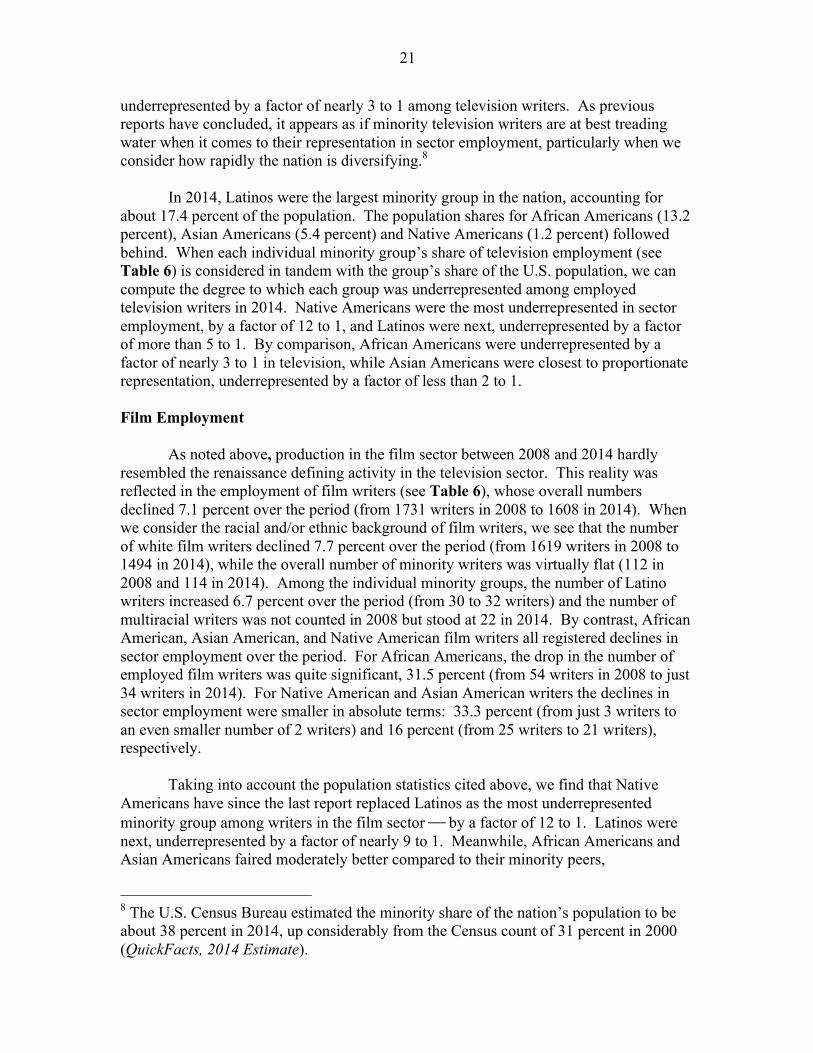
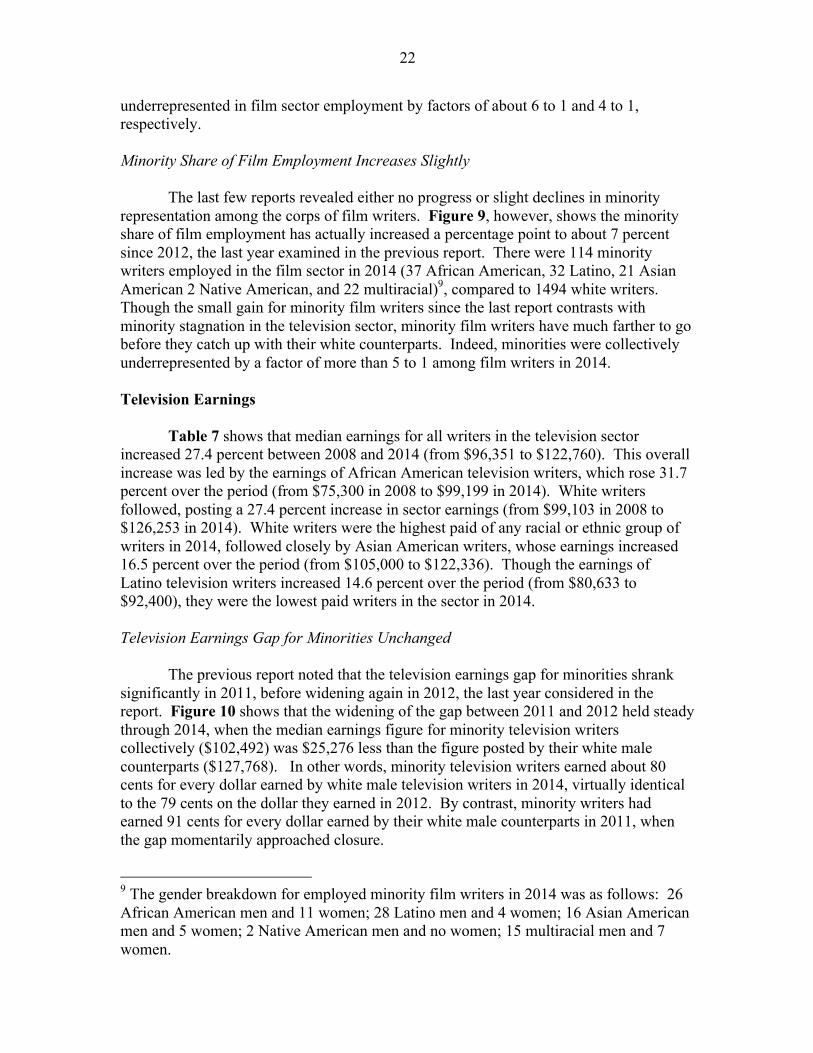
underrepresented in film sector employment by factors of about 6 to 1 and 4 to 1, respectively. Minority Share of Film Employment Increases Slightly The last few reports revealed either no progress or slight declines in minority representation among the corps of film writers. Figure 9, however, shows the minority share of film employment has actually increased a percentage point to about 7 percent since 2012, the last year examined in the previous report. There were 114 minority writers employed in the film sector in 2014 (37 African American, 32 Latino, 21 Asian American 2 Native American, and 22 multiracial)9, compared to 1494 white writers. Though the small gain for minority film writers since the last report contrasts with minority stagnation in the television sector, minority film writers have much farther to go before they catch up with their white counterparts. Indeed, minorities were collectively underrepresented by a factor of more than 5 to 1 among film writers in 2014. Television Earnings Table 7 shows that median earnings for all writers in the television sector increased 27.4 percent between 2008 and 2014 (from $96,351 to $122,760). This overall increase was led by the earnings of African American television writers, which rose 31.7 percent over the period (from $75,300 in 2008 to $99,199 in 2014). White writers followed, posting a 27.4 percent increase in sector earnings (from $99,103 in 2008 to $126,253 in 2014). White writers were the highest paid of any racial or ethnic group of writers in 2014, followed closely by Asian American writers, whose earnings increased 16.5 percent over the period (from $105,000 to $122,336). Though the earnings of Latino television writers increased 14.6 percent over the period (from $80,633 to $92,400), they were the lowest paid writers in the sector in 2014. Television Earnings Gap for Minorities Unchanged The previous report noted that the television earnings gap for minorities shrank significantly in 2011, before widening again in 2012, the last year considered in the report. Figure 10 shows that the widening of the gap between 2011 and 2012 held steady through 2014, when the median earnings figure for minority television writers collectively ($102,492) was $25,276 less than the figure posted by their white male counterparts ($127,768). In other words, minority television writers earned about 80 cents for every dollar earned by white male television writers in 2014, virtually identical to the 79 cents on the dollar they earned in 2012. By contrast, minority writers had earned 91 cents for every dollar earned by their white male counterparts in 2011, when the gap momentarily approached closure.
9 The gender breakdown for employed minority film writers in 2014 was as follows: 26 African American men and 11 women; 28 Latino men and 4 women; 16 Asian American men and 5 women; 2 Native American men and no women; 15 multiracial men and 7 women.
23
Film Earnings
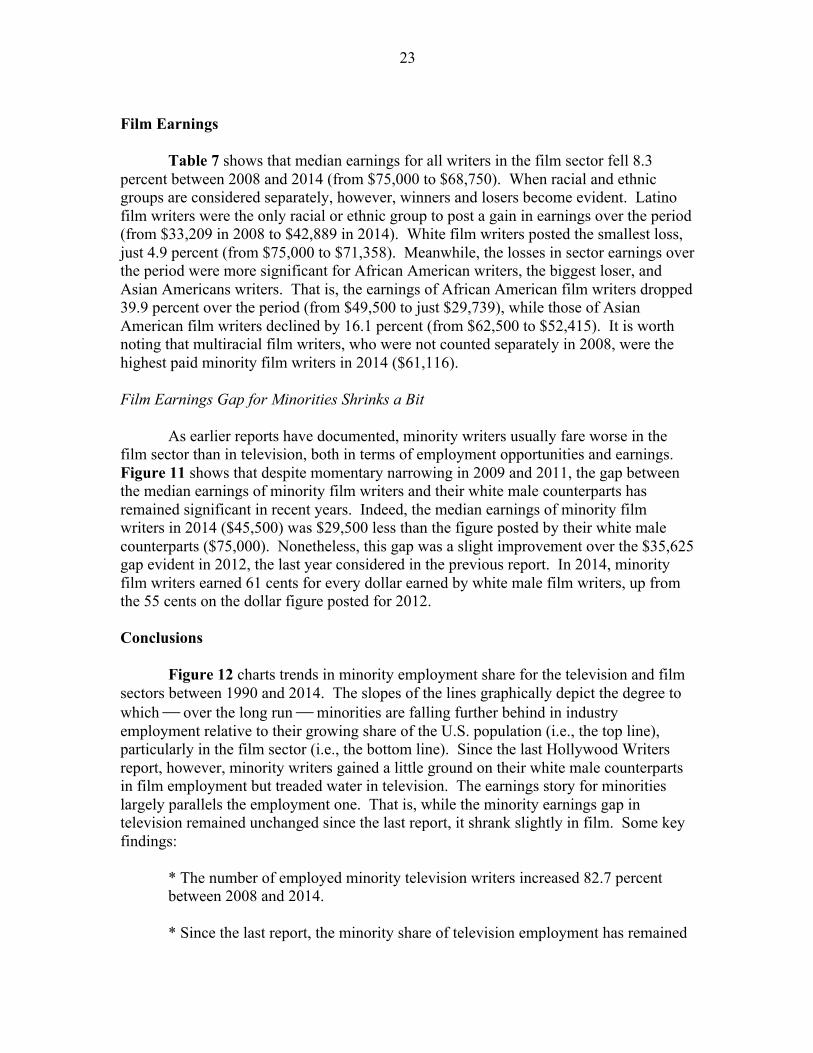
Table 7 shows that median earnings for all writers in the film sector fell 8.3 percent between 2008 and 2014 (from $75,000 to $68,750). When racial and ethnic groups are considered separately, however, winners and losers become evident. Latino film writers were the only racial or ethnic group to post a gain in earnings over the period (from $33,209 in 2008 to $42,889 in 2014). White film writers posted the smallest loss, just 4.9 percent (from $75,000 to $71,358). Meanwhile, the losses in sector earnings over the period were more significant for African American writers, the biggest loser, and Asian Americans writers. That is, the earnings of African American film writers dropped 39.9 percent over the period (from $49,500 to just $29,739), while those of Asian American film writers declined by 16.1 percent (from $62,500 to $52,415). It is worth noting that multiracial film writers, who were not counted separately in 2008, were the highest paid minority film writers in 2014 ($61,116). Film Earnings Gap for Minorities Shrinks a Bit As earlier reports have documented, minority writers usually fare worse in the film sector than in television, both in terms of employment opportunities and earnings. Figure 11 shows that despite momentary narrowing in 2009 and 2011, the gap between the median earnings of minority film writers and their white male counterparts has remained significant in recent years. Indeed, the median earnings of minority film writers in 2014 ($45,500) was $29,500 less than the figure posted by their white male counterparts ($75,000). Nonetheless, this gap was a slight improvement over the $35,625 gap evident in 2012, the last year considered in the previous report. In 2014, minority film writers earned 61 cents for every dollar earned by white male film writers, up from the 55 cents on the dollar figure posted for 2012. Conclusions Figure 12 charts trends in minority employment share for the television and film sectors between 1990 and 2014. The slopes of the lines graphically depict the degree to which ! over the long run ! minorities are falling further behind in industry employment relative to their growing share of the U.S. population (i.e., the top line), particularly in the film sector (i.e., the bottom line). Since the last Hollywood Writers report, however, minority writers gained a little ground on their white male counterparts in film employment but treaded water in television. The earnings story for minorities largely parallels the employment one. That is, while the minority earnings gap in television remained unchanged since the last report, it shrank slightly in film. Some key findings: * The number of employed minority television writers increased 82.7 percent between 2008 and 2014. * Since the last report, the minority share of television employment has remained
24
flat at about 13 percent. * Minorities remained underrepresented by a factor of nearly 3 to 1 among employed television writers.
* The minority share of film employment increased a percentage point to about 7 percent in 2014.
* Minorities were underrepresented by a factor of more than 5 to 1 among employed film writers. * The television earnings gap for minorities was unchanged since the last report. * Minority television writers earned 80 cents for every dollar earned by white male television writers in 2014, virtually identical to the 79 cents figure evident
in 2012.. * The film earnings gap for minorities closed slightly again between 2012 and 2014. * Minority film writers earned 61 cents for every dollar earned by white male
film writers in 2014, up from 55 cents figure evident in 2012.
25
VI. OLDER WRITERS Employment Rate Increases for All Groups of Writers 70 and Under “Employment rate” is a measure of the percentage of those seeking work that actually finds it. In this report series, “employment rate” is defined as the percentage of current Guild members who are actually employed in some capacity during the year in question. Figure 13 shows that employment rate has increased for all age groupings of writers 70 and under since the last report. The biggest single percentage-point gain in employment rate among the age groupings was enjoyed by older writers aged 61 to 70. In 2014, the group’s employment rate was 28 percent, up 6 percentage points from the 22 percent figure posted for 2012. Following closely behind, writers aged 51 to 60 have experienced an increase of 4 percentage points in employment rate since the last report – from 51 percent in 2012 to 55 percent in 2015. The largest group of writers among the age groupings, those aged 41 to 50, posted a gain of 1 percentage point (from 67 percent in 2012 to 68 percent in 2014). Consistent with earlier reports, employment rates were generally higher among younger writers, as employment is a condition of WGA membership and younger writers were more likely to have recently joined the Guild. But the gains since the last report in employment share were more modest for younger writers relative to their older counterparts. While the very youngest writers (those under 31) enjoyed a gain of 3 percentage points in employment rate to 83 percent (just half the gain of writers aged 61 to 70), the largest group of younger writers (those aged 31 to 40) saw a gain of only 1 percentage point (from 72 percent in 2012 to 73 percent in 2014). By contrast, the employment rate for writers aged 71 to 80 actually declined between reports, from 10 percent in 2012 to just 8 percent in 2014. Television Employment Between 2008 and 2014, employment in the television sector increased 39.8 percent for all writers of known age (see Table 8). Reflecting again the general renaissance in television production over the period, each age grouping posted increases in its employment numbers. The single largest increase in the number of employed writers, 131.3 percent, was enjoyed by writers aged 61 to 70 (from 99 writers in 2008 to 229 in 2014). But departing from the previous report, in which employment gains in the sector were largely claimed by older writers, the youngest writers also made considerable progress over the period. That is, the number of employed writers aged 31 and under increased 52.4 percent between 2008 and 2014 (from 185 to 282 writers). Older writers aged 51 to 60 followed closely behind, posting a 51.4 percent increase in the number of employed writers from the age category (from 490 to 742 writers). The largest age groupings of writers ! older writers aged 41 to 50 and younger writers aged 31 to 40 ! saw more modest gains. The older group enjoyed an increase of 38.1 percent (from 996 writers in 2008 to 1375 in 2014), while the younger group posted the smallest gain among the age groupings, 24.1 percent (from 995 to 1235 writers). When the 40-and under and over-40 shares of television sector employment are examined, we find that
26
older television writers continued to gain ground relative to their younger counterparts between 2008 and 2014. That is, television writers over-40 gained more than three percentage points in employment share on their 40-and-under counterparts over the period (from 57.5 percent to 60.9 percent of all television employment). Corps of Employed Television Writers Continues to Age The previous report revealed no change in employment share for television writers aged 41 to 50 between 2009 and 2012, when the group enjoyed the highest shares of any age group (37 percent). Figure 14 shows that though television writers aged 41 to 50 continued to claim the largest employment share in 2014, that share has declined by 2 percentage points since 2012 to 35 percent. Meanwhile, the employment shares for younger writers has remained flat since the last report or declined. That is, television writers aged 31 to 40 experienced a decline in employment share of 1 percentage point between 2012 and 2014 (from 33 percent to 32 percent), while the share claimed by those younger than 31 remained flat (7 percent). Among the age groupings, it was only television writers over 50 who enjoyed gains in employment share since the last report. The largest of those groups, television writers aged 51 to 60, enjoyed a 1 percentage point increase in employment share between 2012 and 2014 (from 18 percent to 19 percent), after experiencing no gains during the period examined in the previous report. As noted in the previous report, the corps of employed television writers is aging as a whole, and older writers continue to improve upon their shares of sector employment. The 61 percent share of sector employment claimed by writers over 40 in 2014 constitutes an increase of 1 percentage point in the group’s share since the last report. Film Employment Between 2008 and 2014, film sector employment declined 5.3 percent for all writers of known age (see Table 8), continuing a trend noted in the previous report. This drop in sector employment was driven mostly by younger writers under 31 and younger writers aged 31 to 40. These groups weathered declines in their employment numbers of 30.6 percent (from 98 writers in 2008 to just 68 in 2014) and 21.3 percent (from 596 to 469 writers), respectively. By contrast, the number of employed older writers in the sector increased over the period. Most notably, the single largest age grouping of film writers in 2014 ! those aged 41 to 50 ! posted a modest increase in employment of 7.1 percent (from 521 writers in 2008 to 558 in 2014). Meanwhile, the increases in sector employment enjoyed by the smaller groupings of the oldest writers were more marked. That is, the number of employed film writers aged 51 to 60 and 61 to 70 increased by 43.5 percent (from 85 to 122 writers) and 50 percent (from 14 to 21 writers), respectively. As a result of these developments, the 40-and-under share of film employment dived more than 8 percentage points over the period, from 43.4 percent in 2008 to just 35.4 percent in 2014. This most recent decline for younger film writers perfectly matches the drop of 8 percentage points observed for the period examined in the previous report.
27
Corps of Employed Film Writers Continues to Age Paralleling the pattern evident in television, the corps of writers employed in the film sector has also aged since the previous report — despite a decline of 1 percentage point in the share claimed by the largest group of older writers (writers aged 41 to 50). Film writers aged 41 to 50 accounted for 37 percent of all sector employment in 2014, down from 38 percent in 2012 (see Figure 15). But their older colleagues, film writers aged 51 to 60, enjoyed an increase of 1 percentage point in employment share between 2012 and 2014 (from 17 percent to 18 percent). The employment shares for younger film writers have either declined or remained flat since the last report. Writers aged 31 to 40 saw their collective share of sector employment shrink from 33 percent in 2012 to just 31 percent in 2014, while the shares for the youngest film writers (those younger than 31) remained flat at 5 percent. In 2014, writers over 40 combined for nearly two thirds of sector employment (64.6 percent), up from about 62 percent in 2012. Television Earnings Between 2008 and 2014, median earnings in the television sector increased 25.9 percent among writers of known age (see Table 9). All but writers aged 71 to 80 and younger writers aged 31 to 40 enjoyed increases in earnings to varying degrees. Older writers aged 61 to 70 posted the biggest gain in earnings over the period. This relatively small group of older writers enjoyed a 172.4 percent increase in earnings (from $40,500 in 2008 to $110,337 in 2014). Older writers aged 51 to 60 followed closely behind with a 108.5 percent increase in earnings over the period (from $70,250 to $146,564). The largest group of older writers ! those aged 41 to 50 ! posted a smaller but also significant 25.6 percent increase in earnings between 2008 and 2014 (from $112,500 to $141,319). By contrast, earnings were flat for younger writers aged 31 to 40 ($112,150 in 2008 and $112,268 in 2014), while they fell 7.4 percent for writers aged 71 to 80 (from $68,000 to 63,000). Older Writers Aged 51 to 60 Become Highest Paid Television Writers In recent years, median earnings in television have been highest among older writers aged 41 to 50. Figure 16 reveals this pattern shifted in 2014, when television writers aged 51 to 60 posted the highest median earnings of $146,465, a figure more than $5,000 above that of their older counterparts aged 41 to 50 ($141,319). Meanwhile, median earnings for television writers aged 61 to 70 ($110,337) approximated those for younger writers aged 31 to 40 ($112,268) in 2014 ! thus eliminating a sizable earnings advantage observed in 2012 and 2010 for the younger group of writers relative to the older one. Indeed, writers over 50 enjoyed most of the increases in median sector earnings since the last report. Writers aged 71 to 80, for example, nearly doubled their earnings between 2012 and 2014 (from $32,216 to $63,000). By contrast, the gain in median earnings posted by television writers younger than 31 was much smaller, just a little over $3,000 (from $73,601 in 2012 to $76,993 in 2014).
28
Film Earnings Median earnings for writers of known age decreased 8.8 percent in the film sector between 2008 and 2014 (see Table 9). The small group of film writers aged 71 to 80 experienced the largest drop in earnings, 59.6 percent (from $123,750 in 2008 to just $50,000 in 2014). They were followed closely by writers aged 61 to 70, whose earnings dropped 38.4 percent over the period (from $65,000 to $40,069). Declines for the other age groupings were more modest. Writers under 31 saw their earnings decline 17.4 percent (from $57,500 in 2008 to $47,500 in 2014), while writers aged 51 to 60 and 31 to 40 posted declines of 13 percent (from $59,500 to $51,759) and 11.3 percent (from $78,918 to $70,000), respectively. The only age category to enjoy an increase in earnings over the period was writers aged 41 to 50, whose earnings increased 8.7 percent (from $80,500 to $87,500). Older Writers Aged 41 to 50 Remain Highest Paid Film Writers In the previous report, writers aged 41 to 50 became the highest paid writers in the film sector, ending a pattern in which median earnings in the sector had previously peaked among the oldest group of writers, those aged 71 to 80. Figure 17 shows this pattern continued in 2014, when older writers aged 41 to 50 again posted the highest median earnings in the film sector ($87,500). Writers aged 71 to 80 slipped to fourth place ($50,000), replaced by younger writers aged 31 to 40 who claimed second place ($70,000). Writers aged 51 to 60 had the third highest sector earnings ($51,759), while those younger than 31 ($47,500) and aged 61 to 70 ($40,069) trailed. It is worth noting that since the last report, median earnings in the sector have declined for every age grouping, which mirrors the decline in theatrical film releases by the major studios since 2006. Conclusions While older writers continued to dominate in employment and earnings in key areas, employment rate still declined sharply with age, though there were even some signs of progress for older writers on this front as well. Some key findings:
* Since the last report, the employment rate increased for all groups of writers aged 70 and under, with older writers aged 61 to 70 posting the largest gain.
* Older writers continued to constitute the majority of employed television writers in 2014. * Since the last report, the employment share for the largest group of older television writers, those aged 41 to 50, declined 2 percentage points to 35 percent.
29
* Between 2008 and 2014, only older writers posted increases in their film employment numbers.
* Older writers continued to constitute the majority of employed film writers, with writers in the 41 to 50 age group claiming the single largest share of sector employment.
* Since the last report, writers aged 51 to 60 became the highest earners in the television sector.
* Older writers aged 41 to 50 remained the highest paid film writers.
30
VII. SUMMARY AND CONCLUSIONS
A snapshot of the typical employed woman writer in 2014 showed that she was nearly three years younger, had been a Guild member for nearly three fewer years, and earned about 89 cents for every dollar earned by her white male counterpart. Meanwhile, the typical employed minority writer was about five years younger, had been a Guild member for about five fewer years, and earned only about 75 cents on the dollar relative to his/her white male counterpart (see Table 10, which also presents snapshots of the typical employed writer from each specific minority group).
These disparities, of course, are reflections of an industry that has long been
dominated by white males. Previous Hollywood Writers Reports have consistently documented the considerable distance women and minority writers would have to travel in order to come close to achieving parity with white males in the Hollywood industry. While the past three decades have been marked by moments of both progress and retreat, the net result is an industry status quo that continues to be marked by substantial degrees of underrepresentation for both women and minority writers. Indeed, the long-run view reveals that the employment gap is actually widening for minority writers as the nation’s population is diversifying more rapidly (and consistently) than the corps of Hollywood writers.
Renaissance in Reverse Since the previous report, television production has continued to flourish, while major theatrical film releases have stagnated. In this context, white males maintained their dominant hold on employment and earnings in both the television and film sectors, despite a few small gains for women and minorities. Women writers increased their share of television sector employment from 27 percent to 29 percent between 2012 and 2014, and increased their relative earnings to 93 cents on the dollar. Though women writers also made small gains in their share of film employment (from 15 percent to 17 percent), their relative earnings in the sector fell to 68 cents on the dollar by 2014. For minority television writers, however, both employment share (13 percent) and relative earnings (80 cents on the dollar) have been flat since the previous report. Only in the film sector have minority writers enjoyed any gains since 2012 — a slight increase in their share of employment (from 6 percent to 7 percent) and a small closing of the earnings gap (from 55 cents to 61 cents on the dollar). In the end, women and minorities remained severely underrepresented among the corps of film and television writers (for women, by a factor of nearly 2 to 1 in television and nearly 3 to 1 in film; for minorities, by a factor of nearly 3 to 1 in television and more than 5 to 1 in film). Meanwhile, the corps of employed writers in television and film has continued to age since the last report. Older writers aged 51 to 60 became the highest paid television writers among the age groups by 2014, while writers aged 41 to 50 remained the highest paid in the film sector. And despite the longstanding pattern of declining employment prospects with age, older
31
writers between 51 and 70 years of age enjoyed notable increases in employment rate since the last report. As earlier reports in this series have concluded, business-as-usual hiring practices will not yield any real progress on the industry diversity front. Progress has been slow at best for women and minority writers in an era of television renaissance, while film sector stagnation has witnessed either anemic advances or actual reversals of fortune for groups of writers that remain woefully underrepresented in both sectors. In an effort to help break the business-as-usual cycle on the diversity front, the Writers Guild of America, West (WGAW) in 2009 established the TV Writer Access Project and in 2013 the Feature Writer Access Project (Feature WAP). These script-judging initiatives are aimed at enlisting Guild membership in the process of identifying and recognizing outstanding, yet underutilized diverse writing talent. The TV WAP relies upon active showrunners to review spec scripts from diverse writers with an eye toward selecting honorees they would feel comfortable hiring for their own show staffs. The idea is both to identify “showrunner-certified” talent for the broader television sector and to expose the judges to the richness of the talent pool of diverse writers. Contestants compete in five categories — women writers, minority writers, writers with disabilities, writers over 55, and LGBT writers — categories associated with the Guild’s major diverse writer committees. Submissions are grouped by genre (drama or comedy) and subjected to two rounds of judging by multiple readers. Since 2009, the TV WAP has produced more than 100 honorees, many of whom have gone on to secure staff positions or freelance work. The most recent cycle of the TV WAP (2015/2016) enlisted 100 judges and featured 173 submissions, 31 semi-finalists and 17 honorees (one writing team). The Feature WAP is modeled after the WGAW’s successful television initiative but focuses on theatrical film writing. Qualified minority writers (and since 2015 women and writers 60 and over) are invited to submit a current, feature-length, unproduced spec script. Entries are read and scored on a blind submission basis by a panel of judges comprised of WGAW members recruited by the Feature Committee. The selected scripts are publicized and made available to entertainment industry decision-makers — including producers, studio executives, agents and managers — to help raise the writers’ profiles and generate potential employment opportunities. In its third cycle (2015), the Feature WAP attracted 314 submissions (of which 19 were teams). Eleven projects were selected for a total of 12 honorees (1 team). For nearly three decades, the Hollywood Writers Report series has championed the cause of increasing diversity among the ranks of television and film writers. This issue is a critical one because the Hollywood industry plays a major role in the process by which a nation circulates stories about itself. To the degree that female, minority and older voices are left out of this process, large segments of America’s increasingly diverse audiences are denied access to characters and situations that resonate most fully with all of our experiences. If this rationale is not compelling enough, recent evidence suggests that diversity among writers is also good for the bottom line. It turns out that television
32
shows with writers rooms that roughly reflect the diversity of America’s population tend also to have the highest median ratings.10 The WGAW remains committed to working with other industry players — the networks, studios, and agents — in an effort to move forward on the diversity front, not only for the good of the nation but also in the name of good business. About the Author Darnell Hunt is director of the Ralph J. Bunche Center for African American Studies at UCLA, where he is also professor and chair of sociology. He has written extensively on media and diversity issues, including several books, and numerous scholarly and popular articles. Dr. Hunt authored the previous five installments of The Hollywood Writers Report, which the Writers Guild of America released in 2005, 2007, 2009, 2011 and 2014. He also was lead author of the 2014, 2015, and 2016 Hollywood Diversity Reports, the first three in a series of reports by the Bunche Center on the overall state of industry diversity, and author of the African American Television Report, released by the Screen Actors Guild in 2000. Prior to his academic positions, he worked in the media (for NBC) and as a media researcher for the U.S. Commission on Civil Rights’ 1993 hearings on diversity in Hollywood.
10 2015 Hollywood Diversity Report: Flipping the Script, Ralph J. Bunche Center for African American Studies, University of California, Los Angeles.
Appendix: 2016 Hollywood Writers Report
Table 1: Demographic Characteristics of the WGAw Current Membership, Employed and Unemployed Writers, 2014 and 2009
2014 2009 % Change
Current Percent Percent Percent Current Percent Percent Percent in Current % Change in Members of Total Employed of Total Unemployed of Total Members of Total Employed of Total Unemployed of Total Membership Employment
Sex:
Male 6540 75.1% 3673 73.7% 2867 77.0% 6459 76.0% 3365 75.9% 3094 76.1% 1.3% 9.2%Female 2164 24.9% 1310 26.3% 854 23.0% 2040 24.0% 1067 24.1% 973 23.9% 6.1% 22.8%
Ethnicity:
African American 326 3.7% 205 4.1% 121 3.3% 361 4.2% 182 4.1% 179 4.4% -9.7% 12.6%Latino 222 2.6% 153 3.1% 69 1.9% 159 1.9% 93 2.1% 66 1.6% 39.6% 64.5%Asian 187 2.1% 130 2.6% 57 1.5% 146 1.7% 91 2.1% 55 1.4% 28.1% 42.9%Native American 19 0.2% 5 0.1% 14 0.4% 19 0.2% 9 0.2% 10 0.2% 0.0% -44.4%Multiracial 143 1.6% 108 2.2% 35 0.9% 92 1.1% 50 1.1% 42 1.0% 55.4% 116.0%
Total Minority 897 10.3% 601 12.1% 296 8.0% 777 9.1% 425 9.6% 352 8.7% 15.4% 41.4%
White/Other 7807 89.7% 4382 87.9% 3425 92.0% 7722 90.9% 4007 90.4% 3715 91.3% 1.1% 9.4%
Age Category
<31 386 4.7% 321 6.8% 65 1.8% 325 4.1% 254 6.1% 71 1.9% 18.8% 26.4%31-40 2016 24.4% 1478 31.2% 538 15.2% 2203 27.7% 1481 35.7% 722 19.0% -8.5% -0.2%41-50 2463 29.8% 1673 35.3% 790 22.3% 2390 30.0% 1471 35.4% 919 24.2% 3.1% 13.7%51-60 1663 20.1% 913 19.3% 750 21.2% 1605 20.2% 716 17.2% 889 23.4% 3.6% 27.5%61-70 1116 13.5% 311 6.6% 805 22.8% 892 11.2% 198 4.8% 694 18.3% 25.1% 57.1%71-80 410 5.0% 34 0.7% 376 10.6% 329 4.1% 27 0.7% 302 7.9% 24.6% 25.9%81+ 218 2.6% 5 0.1% 213 6.0% 211 2.7% 6 0.1% 205 5.4% 3.3% -16.7%
Total, Age Known 8272 100.0% 4735 100.0% 3537 100.0% 7955 100.0% 4153 100.0% 3802 100.0% 4.0% 14.0%
Over 40, Age NA 187 75 106 117 37 80
Total, Age NA 432 248 340 544 279 265
TOTAL 8704 4983 3721 8499 4432 4067 2.4% 12.4%
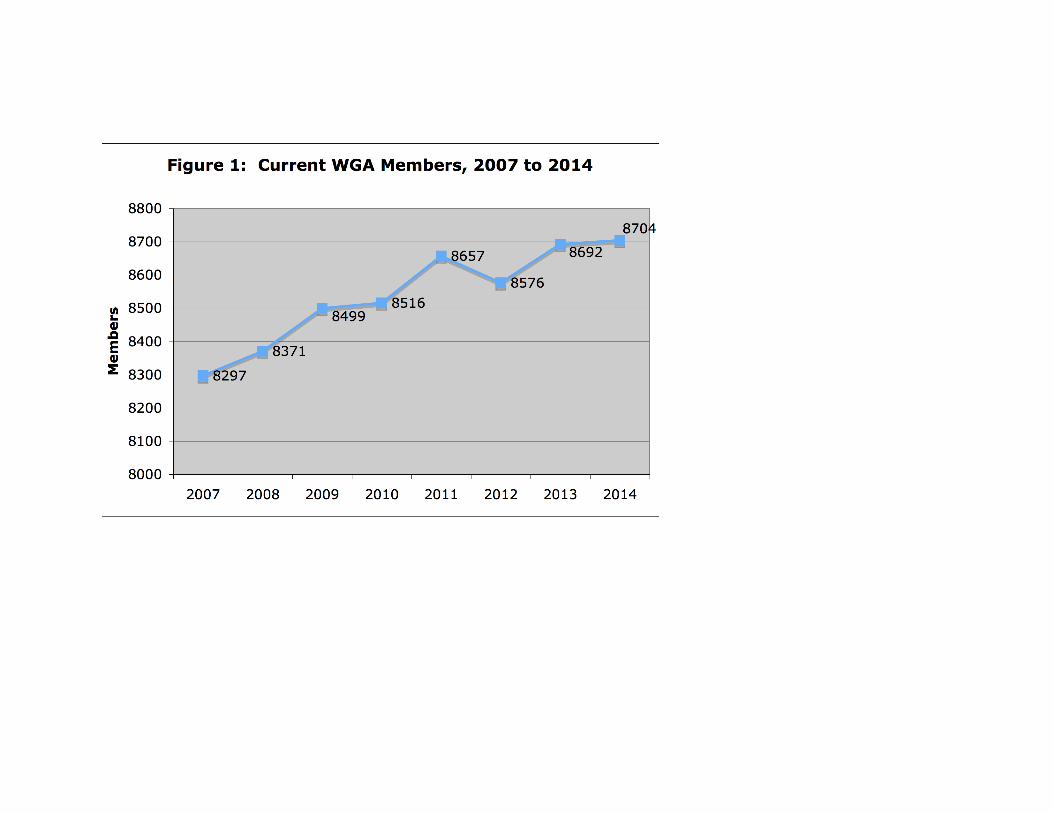
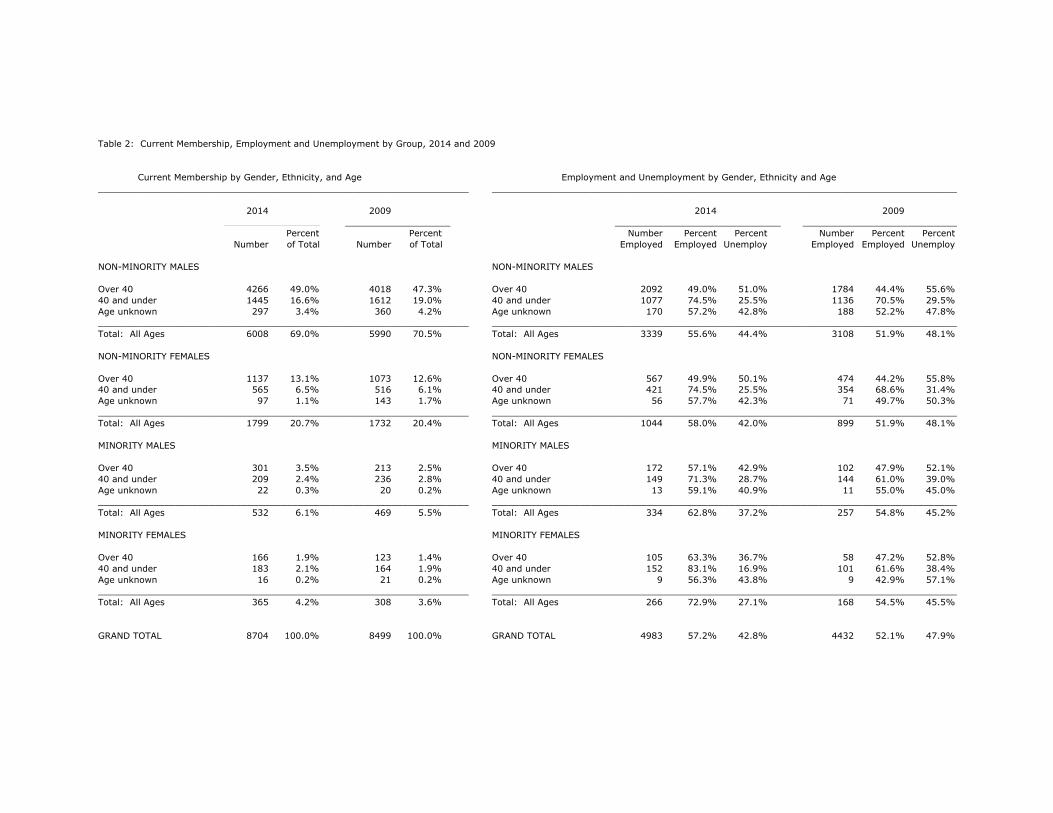
Table 2: Current Membership, Employment and Unemployment by Group, 2014 and 2009
Current Membership by Gender, Ethnicity, and Age Employment and Unemployment by Gender, Ethnicity and Age___________________________________________________________________ __________________________________________________________________________________________
2014 2009 2014 2009 ____________________ ___________________ ______________________________ ______________________________
Percent Percent Number Percent Percent Number Percent Percent Number of Total Number of Total Employed Employed Unemploy Employed Employed Unemploy
NON-MINORITY MALES NON-MINORITY MALES
Over 40 4266 49.0% 4018 47.3% Over 40 2092 49.0% 51.0% 1784 44.4% 55.6%40 and under 1445 16.6% 1612 19.0% 40 and under 1077 74.5% 25.5% 1136 70.5% 29.5%Age unknown 297 3.4% 360 4.2% Age unknown 170 57.2% 42.8% 188 52.2% 47.8%___________________________________________________________________ __________________________________________________________________________________________Total: All Ages 6008 69.0% 5990 70.5% Total: All Ages 3339 55.6% 44.4% 3108 51.9% 48.1%
NON-MINORITY FEMALES NON-MINORITY FEMALES
Over 40 1137 13.1% 1073 12.6% Over 40 567 49.9% 50.1% 474 44.2% 55.8%40 and under 565 6.5% 516 6.1% 40 and under 421 74.5% 25.5% 354 68.6% 31.4%Age unknown 97 1.1% 143 1.7% Age unknown 56 57.7% 42.3% 71 49.7% 50.3%___________________________________________________________________ __________________________________________________________________________________________Total: All Ages 1799 20.7% 1732 20.4% Total: All Ages 1044 58.0% 42.0% 899 51.9% 48.1%
MINORITY MALES MINORITY MALES
Over 40 301 3.5% 213 2.5% Over 40 172 57.1% 42.9% 102 47.9% 52.1%40 and under 209 2.4% 236 2.8% 40 and under 149 71.3% 28.7% 144 61.0% 39.0%Age unknown 22 0.3% 20 0.2% Age unknown 13 59.1% 40.9% 11 55.0% 45.0%___________________________________________________________________ __________________________________________________________________________________________Total: All Ages 532 6.1% 469 5.5% Total: All Ages 334 62.8% 37.2% 257 54.8% 45.2%
MINORITY FEMALES MINORITY FEMALES
Over 40 166 1.9% 123 1.4% Over 40 105 63.3% 36.7% 58 47.2% 52.8%40 and under 183 2.1% 164 1.9% 40 and under 152 83.1% 16.9% 101 61.6% 38.4%Age unknown 16 0.2% 21 0.2% Age unknown 9 56.3% 43.8% 9 42.9% 57.1%___________________________________________________________________ __________________________________________________________________________________________Total: All Ages 365 4.2% 308 3.6% Total: All Ages 266 72.9% 27.1% 168 54.5% 45.5%
GRAND TOTAL 8704 100.0% 8499 100.0% GRAND TOTAL 4983 57.2% 42.8% 4432 52.1% 47.9%
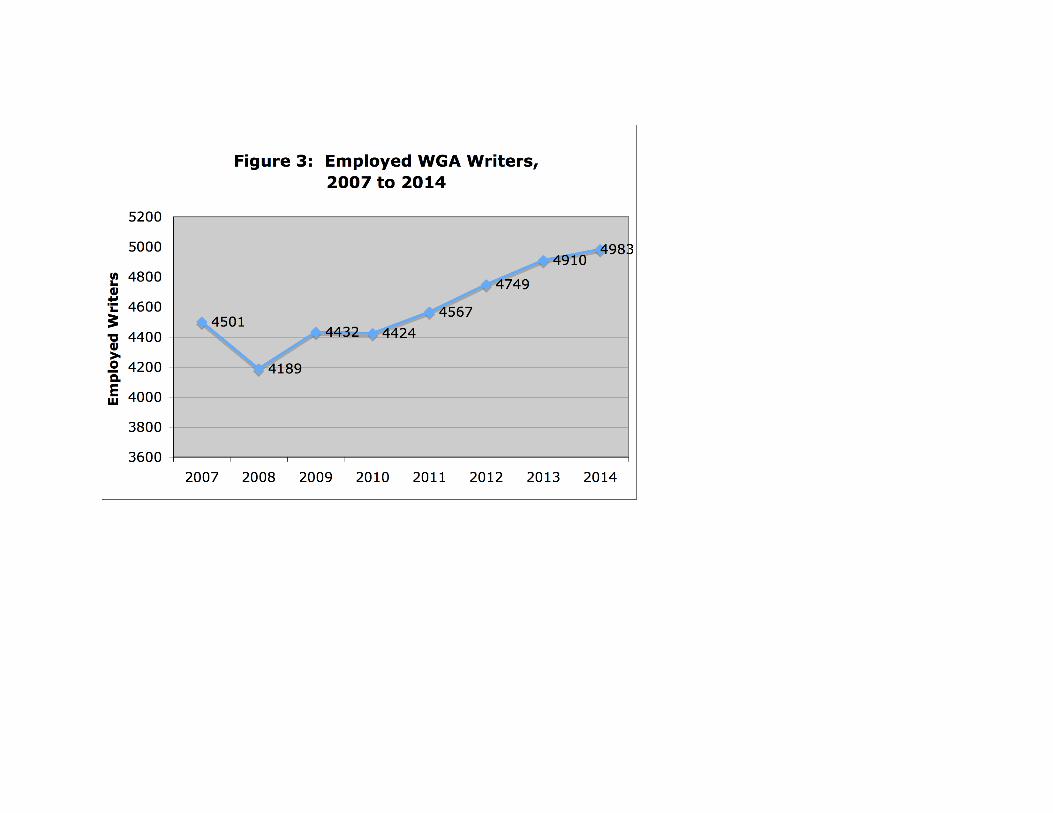
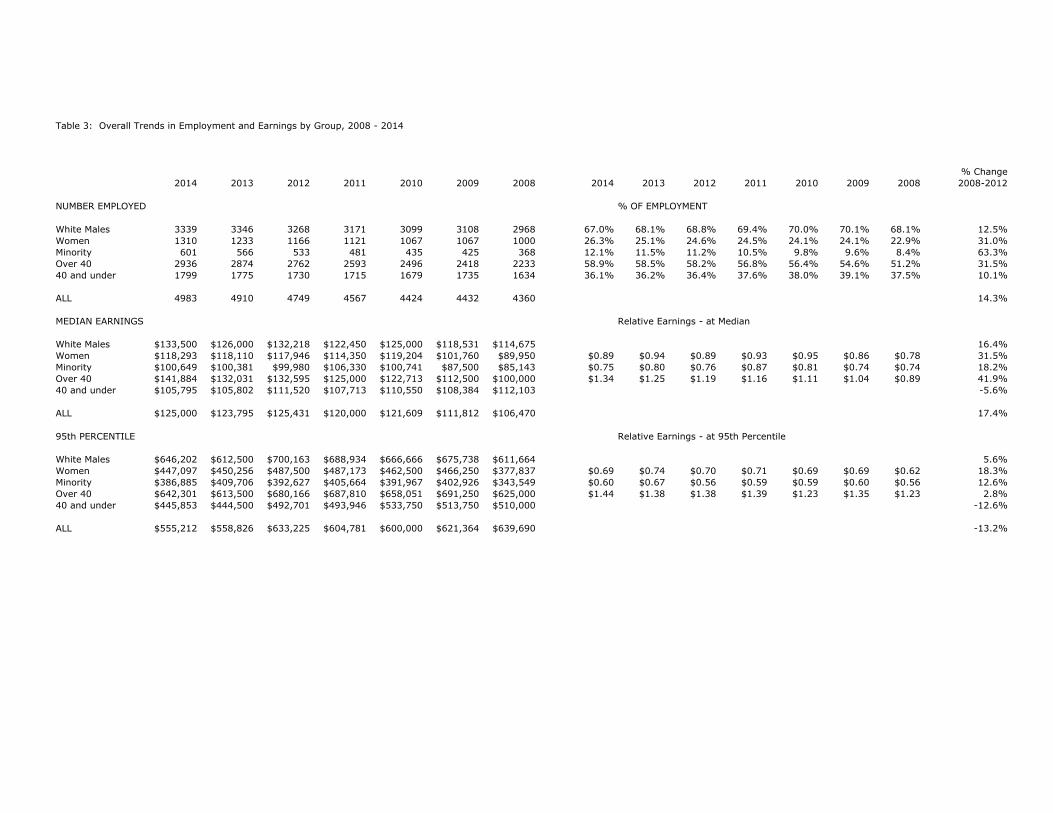
Table 3: Overall Trends in Employment and Earnings by Group, 2008 - 2014
% Change 2014 2013 2012 2011 2010 2009 2008 2014 2013 2012 2011 2010 2009 2008 2008-2012
NUMBER EMPLOYED % OF EMPLOYMENT
White Males 3339 3346 3268 3171 3099 3108 2968 67.0% 68.1% 68.8% 69.4% 70.0% 70.1% 68.1% 12.5%Women 1310 1233 1166 1121 1067 1067 1000 26.3% 25.1% 24.6% 24.5% 24.1% 24.1% 22.9% 31.0%Minority 601 566 533 481 435 425 368 12.1% 11.5% 11.2% 10.5% 9.8% 9.6% 8.4% 63.3%Over 40 2936 2874 2762 2593 2496 2418 2233 58.9% 58.5% 58.2% 56.8% 56.4% 54.6% 51.2% 31.5%40 and under 1799 1775 1730 1715 1679 1735 1634 36.1% 36.2% 36.4% 37.6% 38.0% 39.1% 37.5% 10.1%
ALL 4983 4910 4749 4567 4424 4432 4360 14.3%
MEDIAN EARNINGS Relative Earnings - at Median
White Males $133,500 $126,000 $132,218 $122,450 $125,000 $118,531 $114,675 16.4%Women $118,293 $118,110 $117,946 $114,350 $119,204 $101,760 $89,950 $0.89 $0.94 $0.89 $0.93 $0.95 $0.86 $0.78 31.5%Minority $100,649 $100,381 $99,980 $106,330 $100,741 $87,500 $85,143 $0.75 $0.80 $0.76 $0.87 $0.81 $0.74 $0.74 18.2%Over 40 $141,884 $132,031 $132,595 $125,000 $122,713 $112,500 $100,000 $1.34 $1.25 $1.19 $1.16 $1.11 $1.04 $0.89 41.9%40 and under $105,795 $105,802 $111,520 $107,713 $110,550 $108,384 $112,103 -5.6%
ALL $125,000 $123,795 $125,431 $120,000 $121,609 $111,812 $106,470 17.4%
95th PERCENTILE Relative Earnings - at 95th Percentile
White Males $646,202 $612,500 $700,163 $688,934 $666,666 $675,738 $611,664 5.6%Women $447,097 $450,256 $487,500 $487,173 $462,500 $466,250 $377,837 $0.69 $0.74 $0.70 $0.71 $0.69 $0.69 $0.62 18.3%Minority $386,885 $409,706 $392,627 $405,664 $391,967 $402,926 $343,549 $0.60 $0.67 $0.56 $0.59 $0.59 $0.60 $0.56 12.6%Over 40 $642,301 $613,500 $680,166 $687,810 $658,051 $691,250 $625,000 $1.44 $1.38 $1.38 $1.39 $1.23 $1.35 $1.23 2.8%40 and under $445,853 $444,500 $492,701 $493,946 $533,750 $513,750 $510,000 -12.6%
ALL $555,212 $558,826 $633,225 $604,781 $600,000 $621,364 $639,690 -13.2%
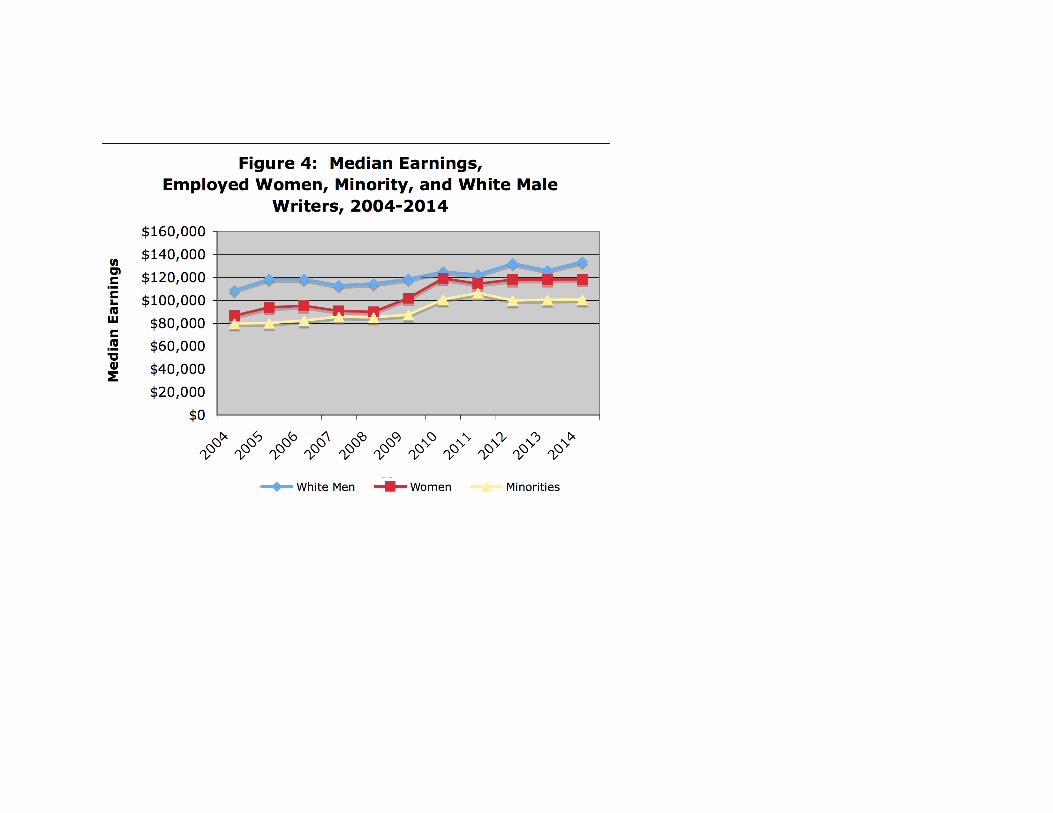
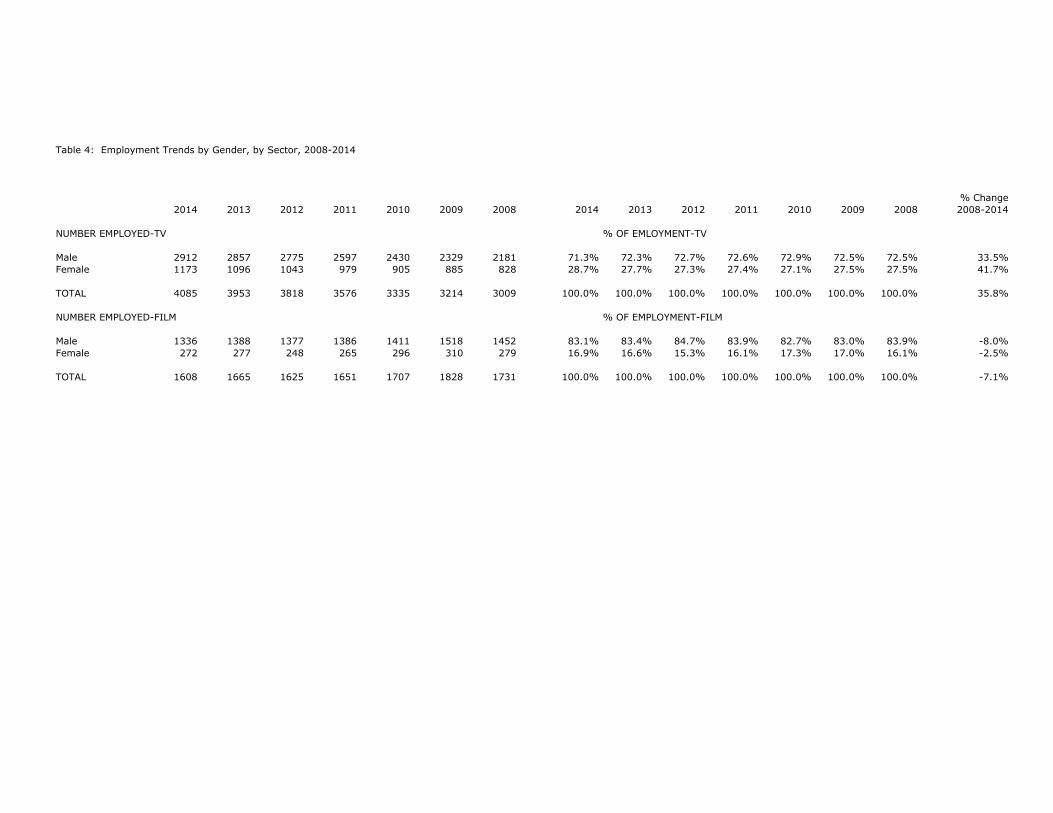
Table 4: Employment Trends by Gender, by Sector, 2008-2014
% Change 2014 2013 2012 2011 2010 2009 2008 2014 2013 2012 2011 2010 2009 2008 2008-2014
NUMBER EMPLOYED-TV % OF EMLOYMENT-TV
Male 2912 2857 2775 2597 2430 2329 2181 71.3% 72.3% 72.7% 72.6% 72.9% 72.5% 72.5% 33.5%Female 1173 1096 1043 979 905 885 828 28.7% 27.7% 27.3% 27.4% 27.1% 27.5% 27.5% 41.7%
TOTAL 4085 3953 3818 3576 3335 3214 3009 100.0% 100.0% 100.0% 100.0% 100.0% 100.0% 100.0% 35.8%
NUMBER EMPLOYED-FILM % OF EMPLOYMENT-FILM
Male 1336 1388 1377 1386 1411 1518 1452 83.1% 83.4% 84.7% 83.9% 82.7% 83.0% 83.9% -8.0%Female 272 277 248 265 296 310 279 16.9% 16.6% 15.3% 16.1% 17.3% 17.0% 16.1% -2.5%
TOTAL 1608 1665 1625 1651 1707 1828 1731 100.0% 100.0% 100.0% 100.0% 100.0% 100.0% 100.0% -7.1%
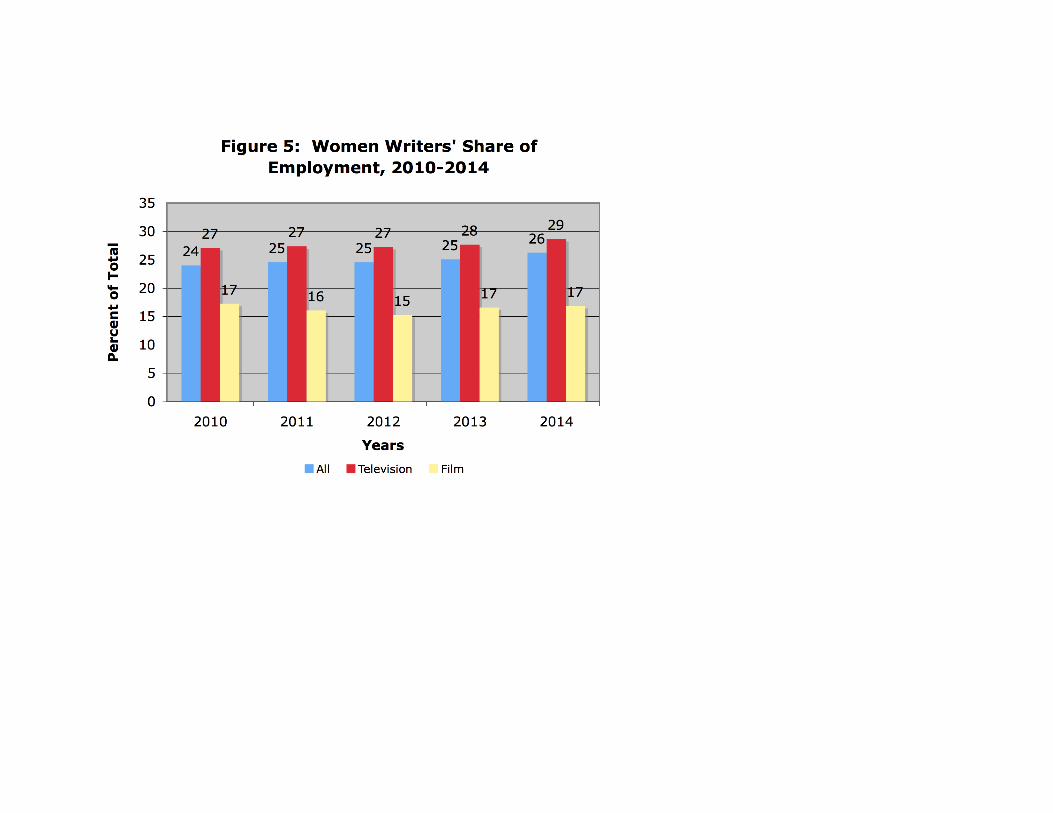
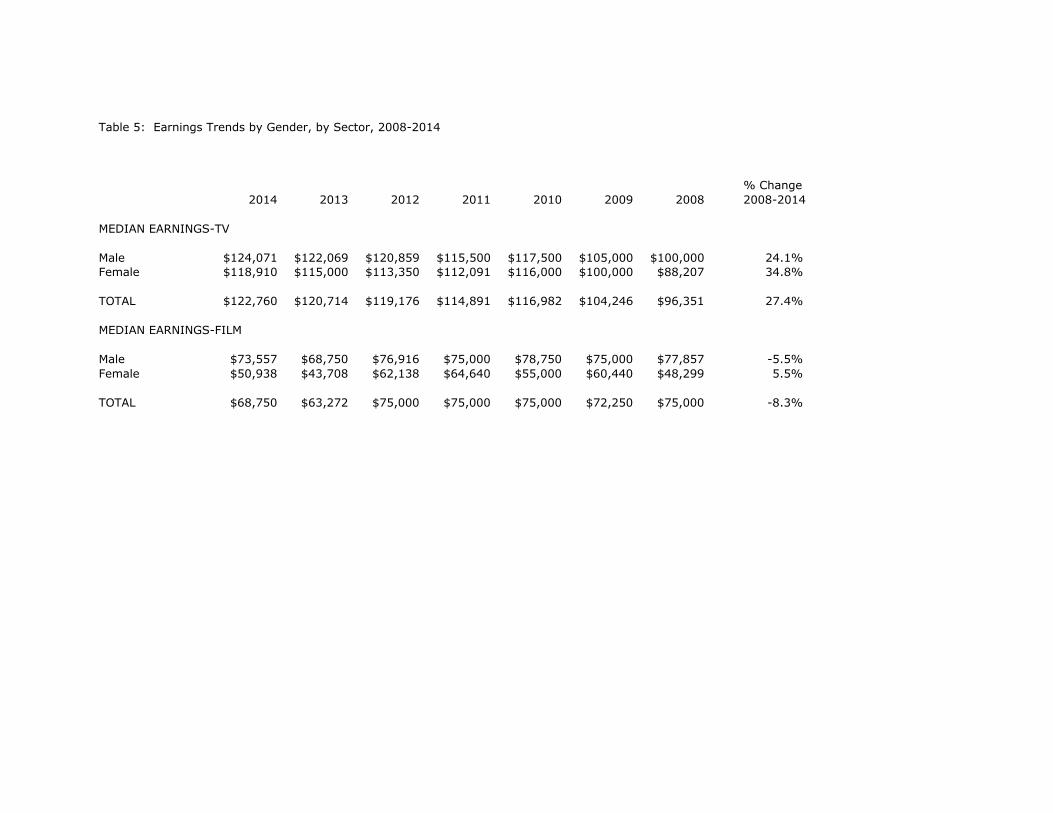
Table 5: Earnings Trends by Gender, by Sector, 2008-2014
% Change 2014 2013 2012 2011 2010 2009 2008 2008-2014
MEDIAN EARNINGS-TV
Male $124,071 $122,069 $120,859 $115,500 $117,500 $105,000 $100,000 24.1%Female $118,910 $115,000 $113,350 $112,091 $116,000 $100,000 $88,207 34.8%
TOTAL $122,760 $120,714 $119,176 $114,891 $116,982 $104,246 $96,351 27.4%
MEDIAN EARNINGS-FILM
Male $73,557 $68,750 $76,916 $75,000 $78,750 $75,000 $77,857 -5.5%Female $50,938 $43,708 $62,138 $64,640 $55,000 $60,440 $48,299 5.5%
TOTAL $68,750 $63,272 $75,000 $75,000 $75,000 $72,250 $75,000 -8.3%
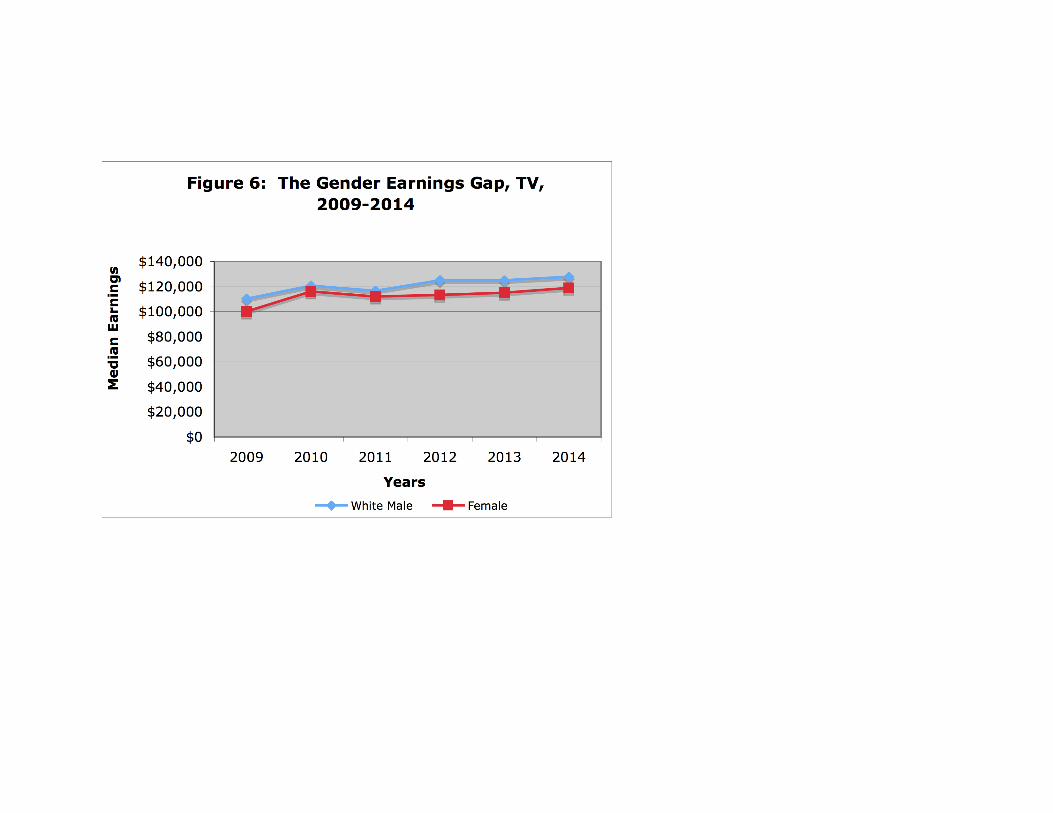
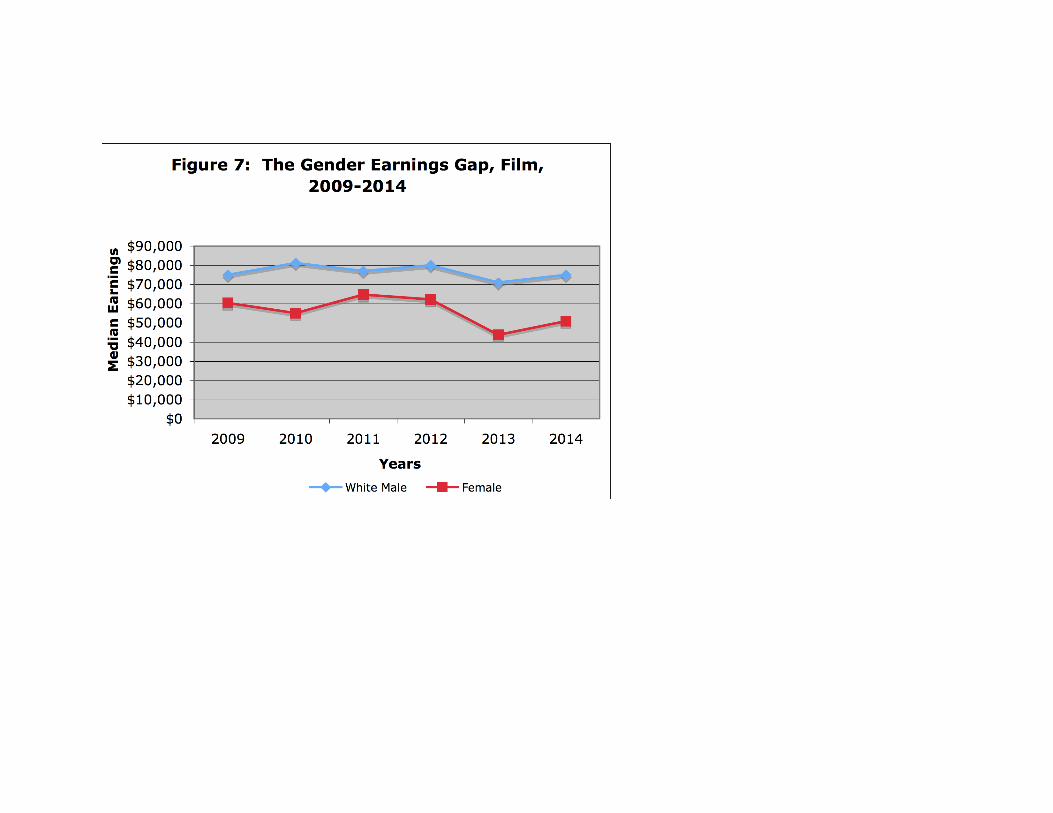
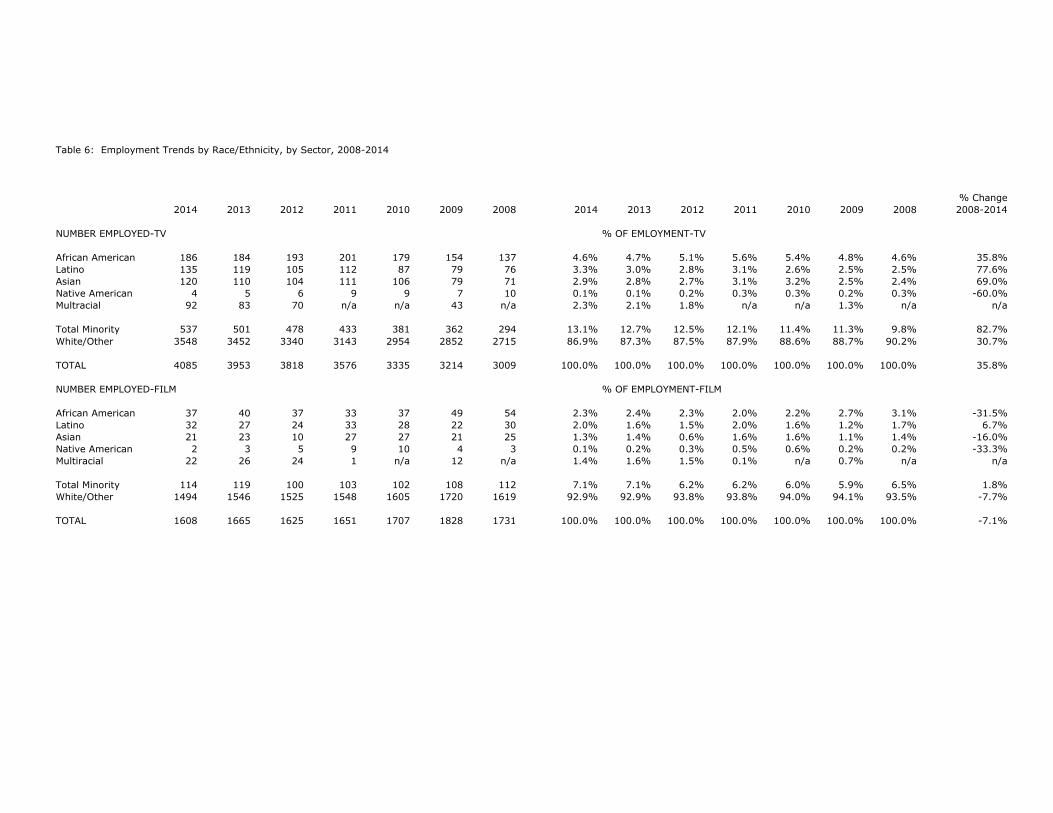
Table 6: Employment Trends by Race/Ethnicity, by Sector, 2008-2014
% Change 2014 2013 2012 2011 2010 2009 2008 2014 2013 2012 2011 2010 2009 2008 2008-2014
NUMBER EMPLOYED-TV % OF EMLOYMENT-TV
African American 186 184 193 201 179 154 137 4.6% 4.7% 5.1% 5.6% 5.4% 4.8% 4.6% 35.8%Latino 135 119 105 112 87 79 76 3.3% 3.0% 2.8% 3.1% 2.6% 2.5% 2.5% 77.6%Asian 120 110 104 111 106 79 71 2.9% 2.8% 2.7% 3.1% 3.2% 2.5% 2.4% 69.0%Native American 4 5 6 9 9 7 10 0.1% 0.1% 0.2% 0.3% 0.3% 0.2% 0.3% -60.0%Multracial 92 83 70 n/a n/a 43 n/a 2.3% 2.1% 1.8% n/a n/a 1.3% n/a n/a
Total Minority 537 501 478 433 381 362 294 13.1% 12.7% 12.5% 12.1% 11.4% 11.3% 9.8% 82.7%White/Other 3548 3452 3340 3143 2954 2852 2715 86.9% 87.3% 87.5% 87.9% 88.6% 88.7% 90.2% 30.7%
TOTAL 4085 3953 3818 3576 3335 3214 3009 100.0% 100.0% 100.0% 100.0% 100.0% 100.0% 100.0% 35.8%
NUMBER EMPLOYED-FILM % OF EMPLOYMENT-FILM
African American 37 40 37 33 37 49 54 2.3% 2.4% 2.3% 2.0% 2.2% 2.7% 3.1% -31.5%Latino 32 27 24 33 28 22 30 2.0% 1.6% 1.5% 2.0% 1.6% 1.2% 1.7% 6.7%Asian 21 23 10 27 27 21 25 1.3% 1.4% 0.6% 1.6% 1.6% 1.1% 1.4% -16.0%Native American 2 3 5 9 10 4 3 0.1% 0.2% 0.3% 0.5% 0.6% 0.2% 0.2% -33.3%Multiracial 22 26 24 1 n/a 12 n/a 1.4% 1.6% 1.5% 0.1% n/a 0.7% n/a n/a
Total Minority 114 119 100 103 102 108 112 7.1% 7.1% 6.2% 6.2% 6.0% 5.9% 6.5% 1.8%White/Other 1494 1546 1525 1548 1605 1720 1619 92.9% 92.9% 93.8% 93.8% 94.0% 94.1% 93.5% -7.7%
TOTAL 1608 1665 1625 1651 1707 1828 1731 100.0% 100.0% 100.0% 100.0% 100.0% 100.0% 100.0% -7.1%
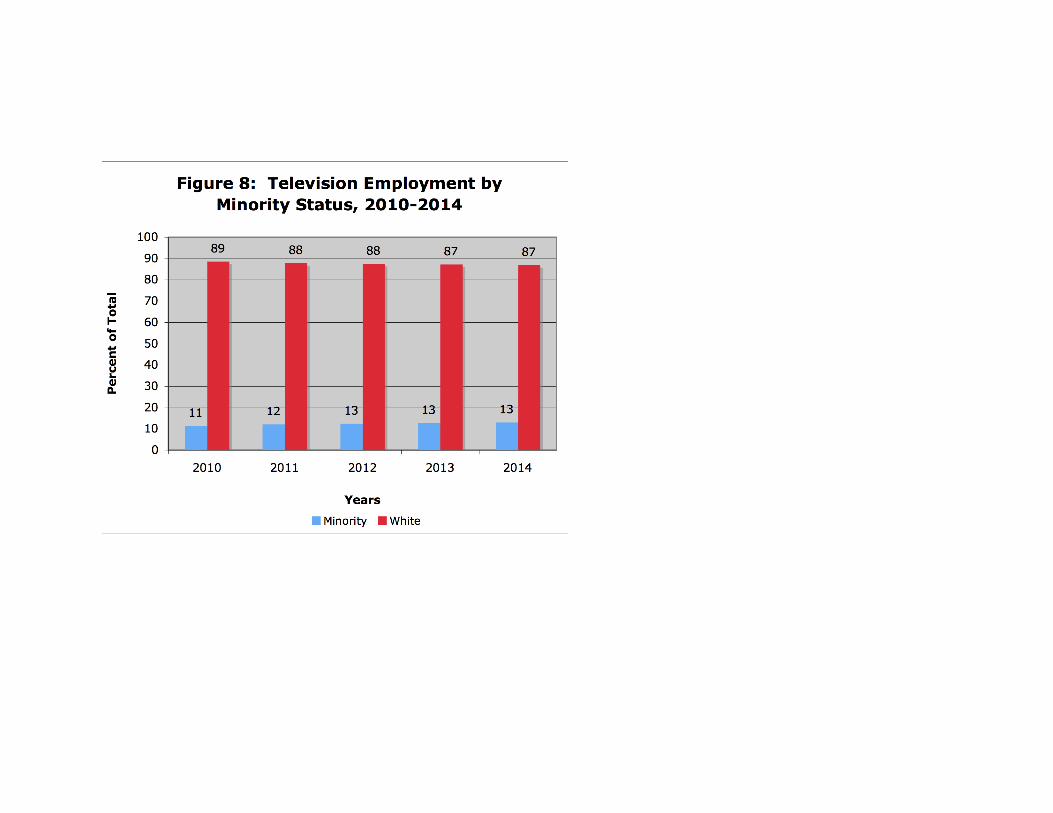
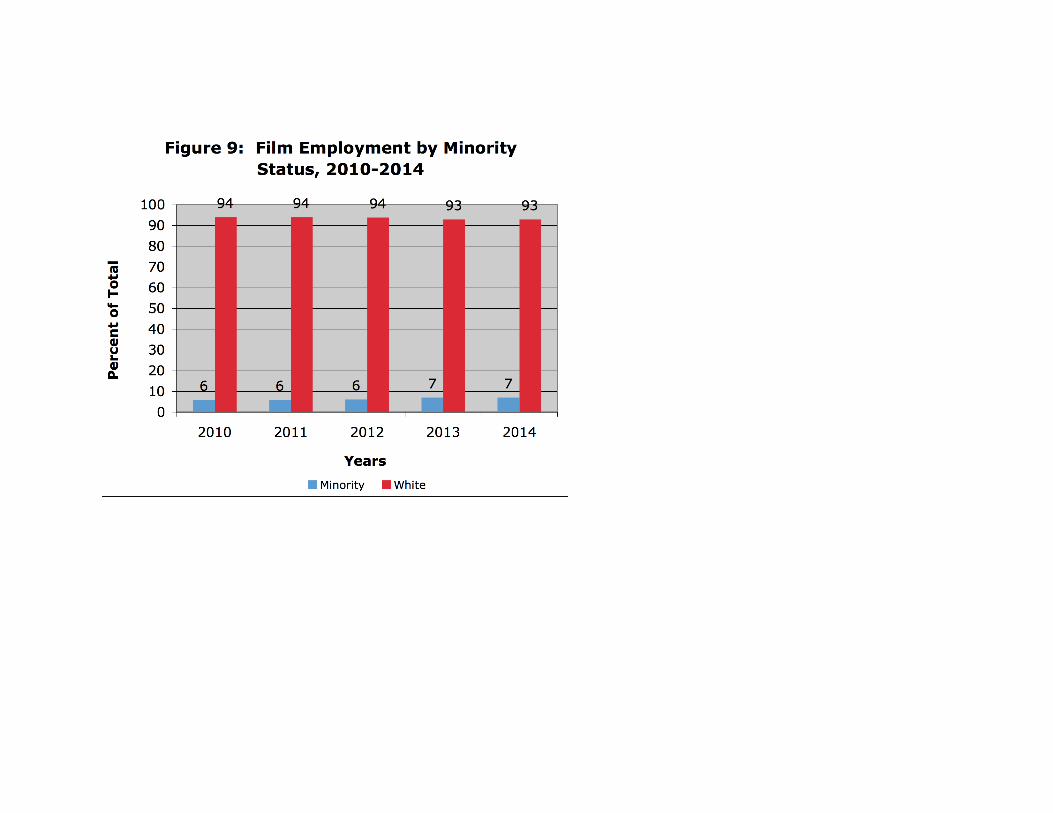
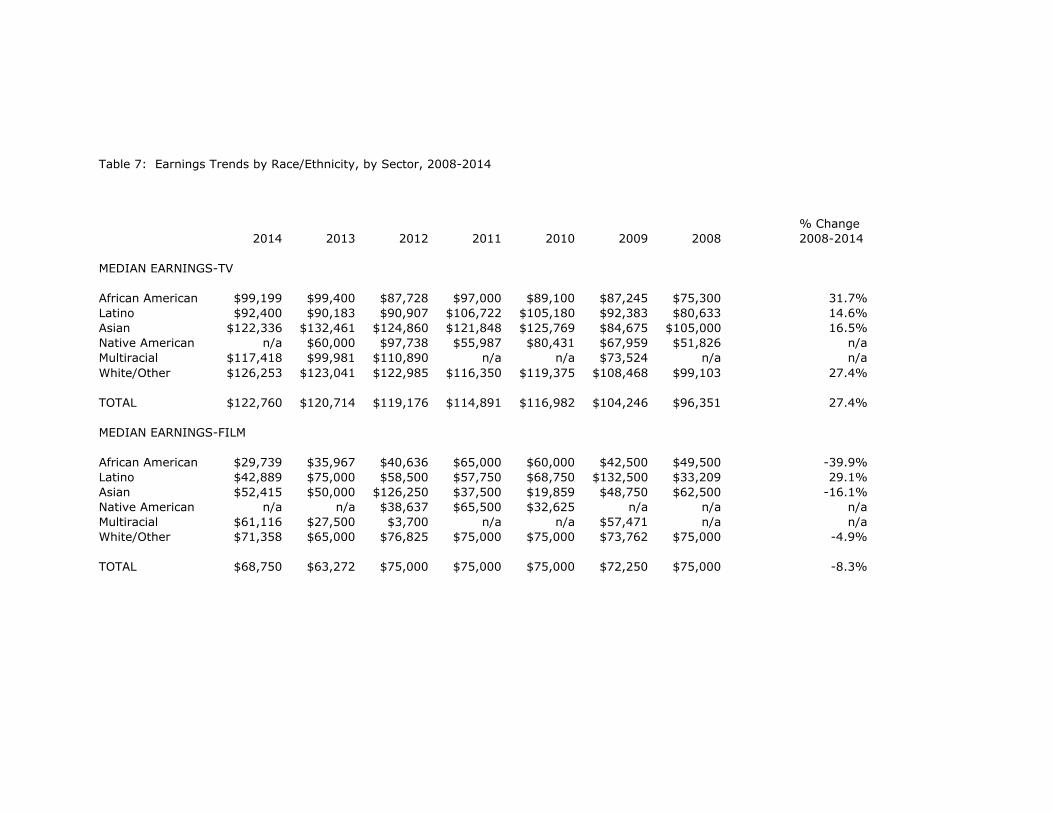
Table 7: Earnings Trends by Race/Ethnicity, by Sector, 2008-2014
% Change 2014 2013 2012 2011 2010 2009 2008 2008-2014
MEDIAN EARNINGS-TV
African American $99,199 $99,400 $87,728 $97,000 $89,100 $87,245 $75,300 31.7%Latino $92,400 $90,183 $90,907 $106,722 $105,180 $92,383 $80,633 14.6%Asian $122,336 $132,461 $124,860 $121,848 $125,769 $84,675 $105,000 16.5%Native American n/a $60,000 $97,738 $55,987 $80,431 $67,959 $51,826 n/aMultiracial $117,418 $99,981 $110,890 n/a n/a $73,524 n/a n/aWhite/Other $126,253 $123,041 $122,985 $116,350 $119,375 $108,468 $99,103 27.4%
TOTAL $122,760 $120,714 $119,176 $114,891 $116,982 $104,246 $96,351 27.4%
MEDIAN EARNINGS-FILM
African American $29,739 $35,967 $40,636 $65,000 $60,000 $42,500 $49,500 -39.9%Latino $42,889 $75,000 $58,500 $57,750 $68,750 $132,500 $33,209 29.1%Asian $52,415 $50,000 $126,250 $37,500 $19,859 $48,750 $62,500 -16.1%Native American n/a n/a $38,637 $65,500 $32,625 n/a n/a n/aMultiracial $61,116 $27,500 $3,700 n/a n/a $57,471 n/a n/aWhite/Other $71,358 $65,000 $76,825 $75,000 $75,000 $73,762 $75,000 -4.9%
TOTAL $68,750 $63,272 $75,000 $75,000 $75,000 $72,250 $75,000 -8.3%
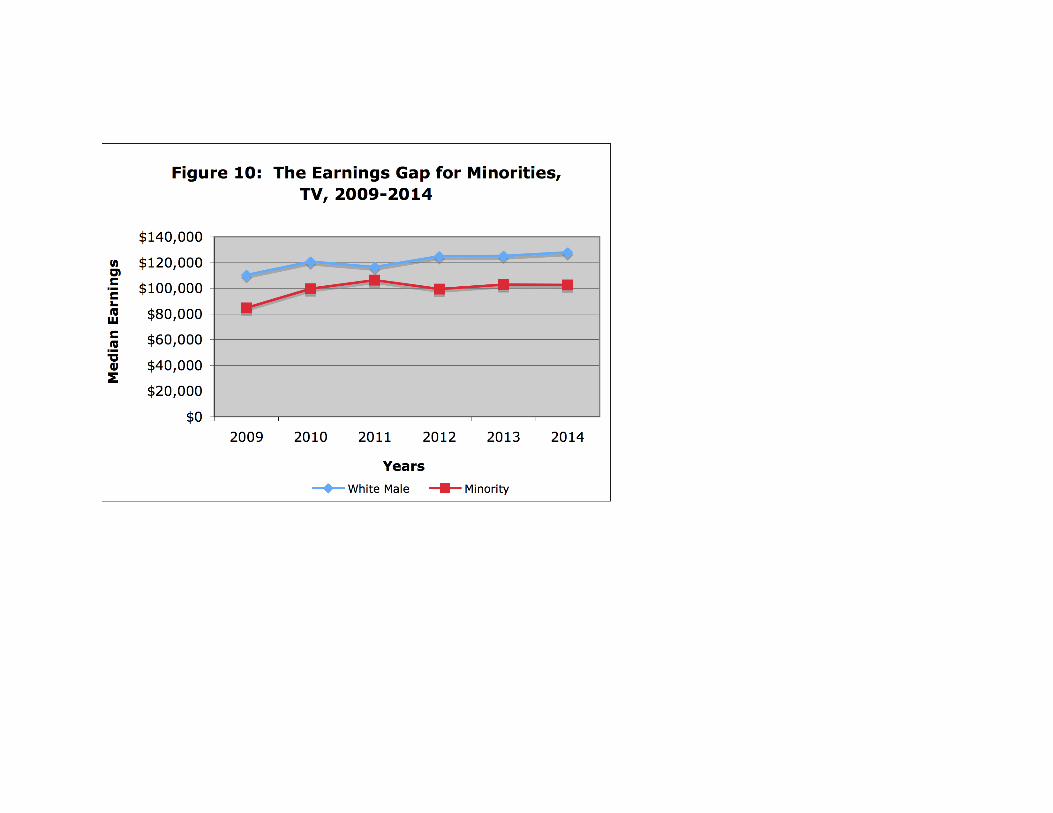
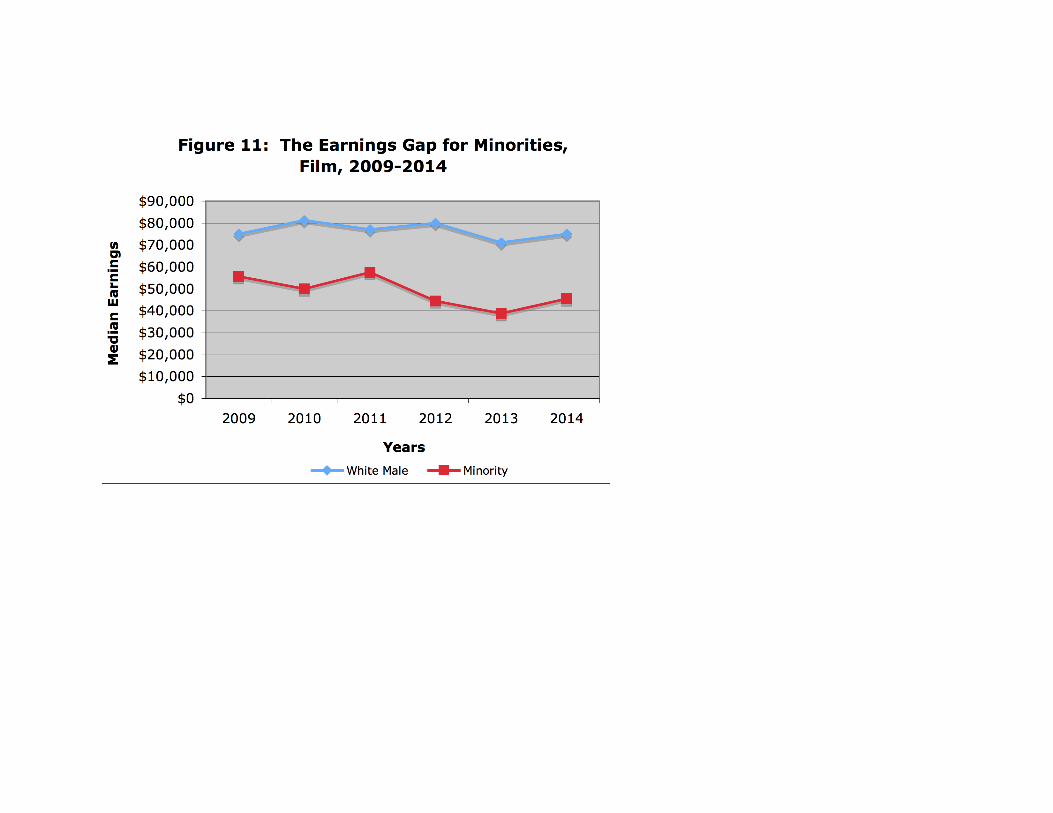
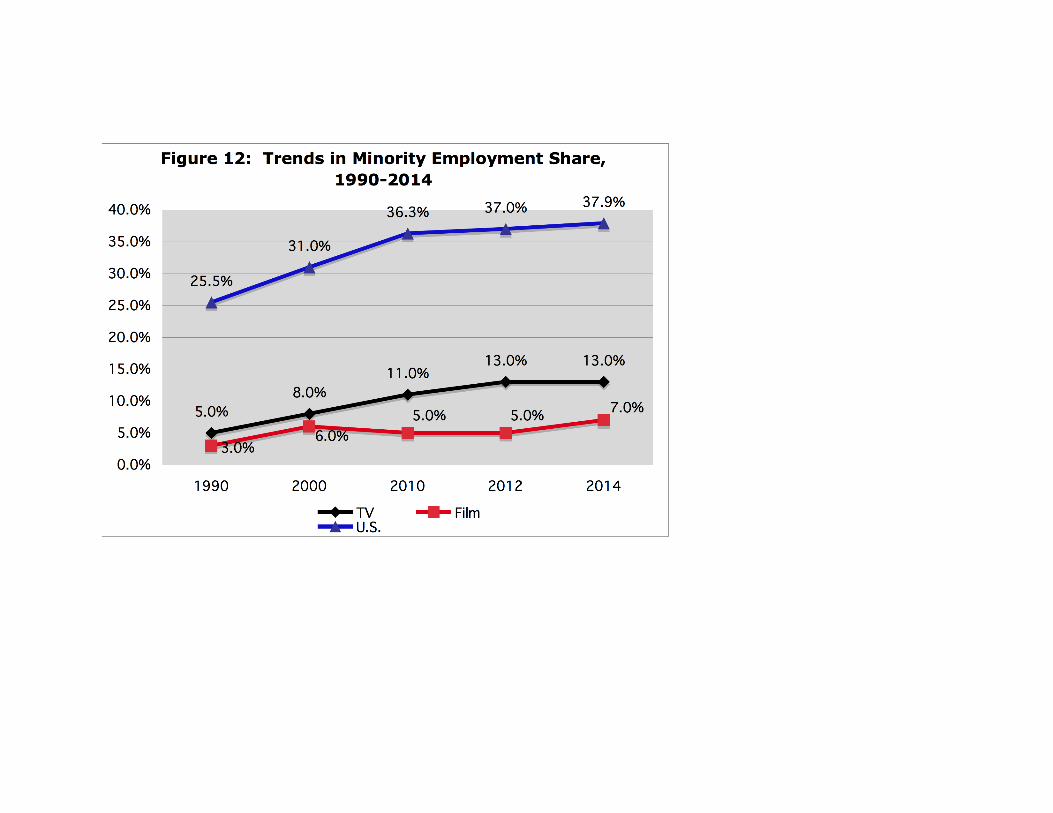
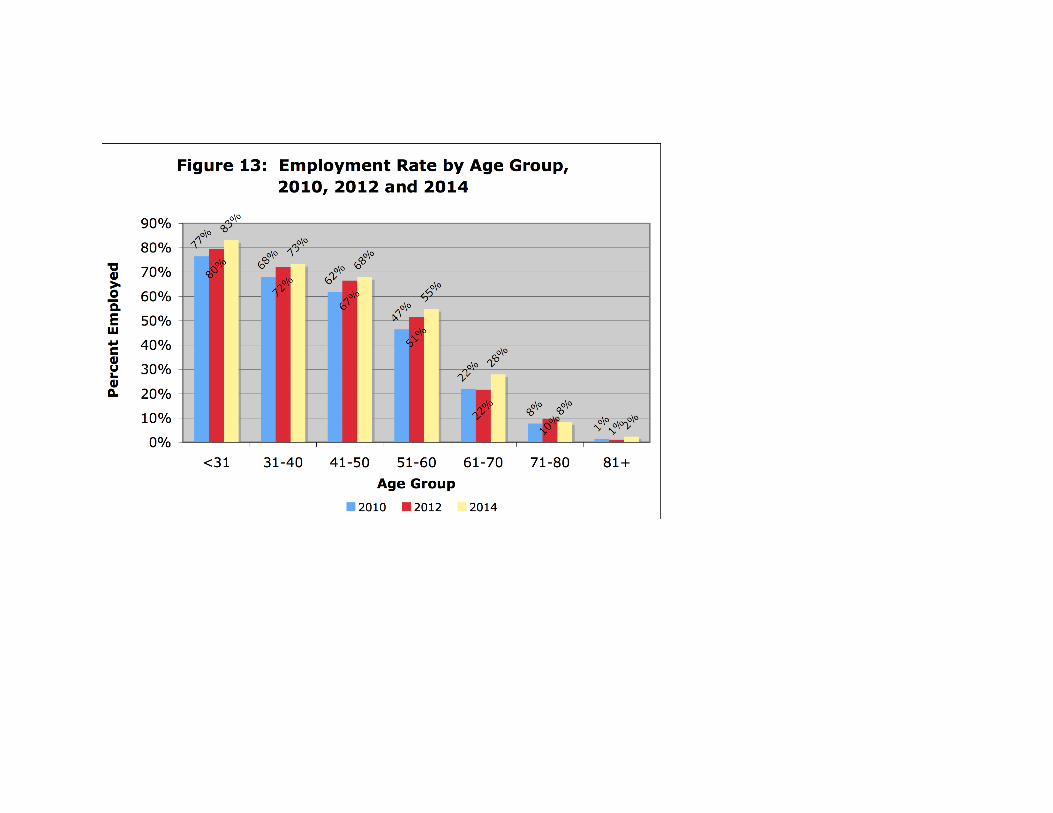
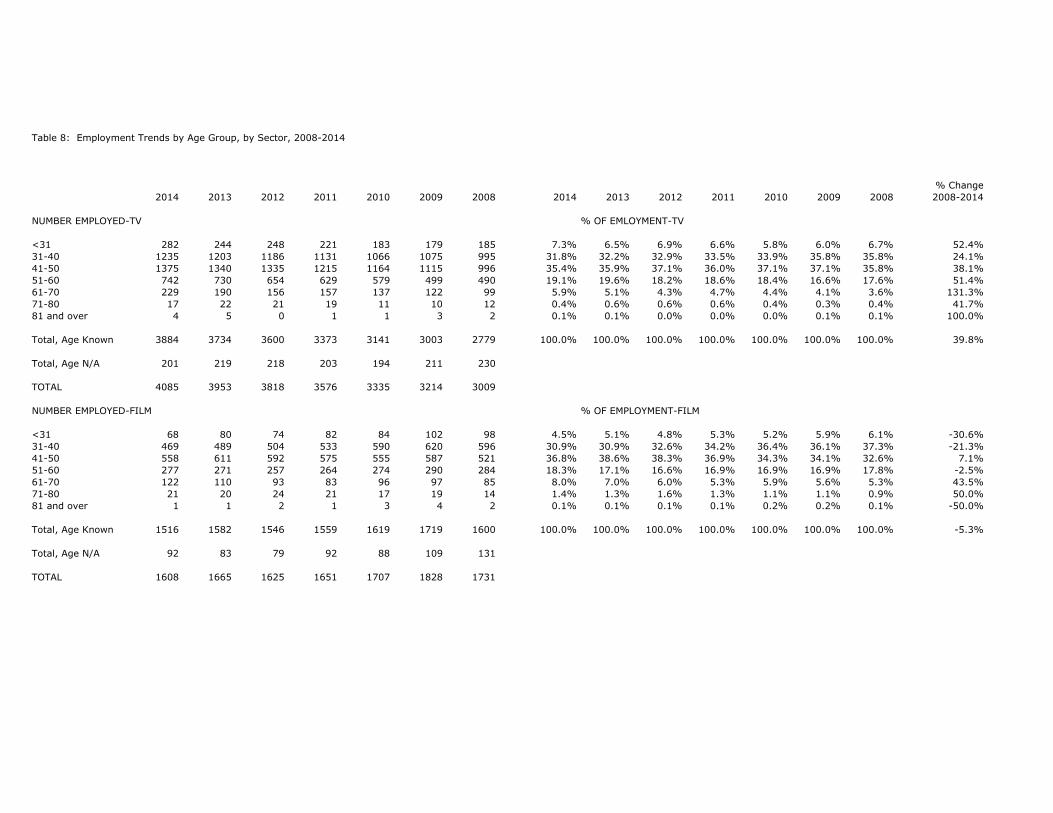
Table 8: Employment Trends by Age Group, by Sector, 2008-2014
% Change 2014 2013 2012 2011 2010 2009 2008 2014 2013 2012 2011 2010 2009 2008 2008-2014
NUMBER EMPLOYED-TV % OF EMLOYMENT-TV
<31 282 244 248 221 183 179 185 7.3% 6.5% 6.9% 6.6% 5.8% 6.0% 6.7% 52.4%31-40 1235 1203 1186 1131 1066 1075 995 31.8% 32.2% 32.9% 33.5% 33.9% 35.8% 35.8% 24.1%41-50 1375 1340 1335 1215 1164 1115 996 35.4% 35.9% 37.1% 36.0% 37.1% 37.1% 35.8% 38.1%51-60 742 730 654 629 579 499 490 19.1% 19.6% 18.2% 18.6% 18.4% 16.6% 17.6% 51.4%61-70 229 190 156 157 137 122 99 5.9% 5.1% 4.3% 4.7% 4.4% 4.1% 3.6% 131.3%71-80 17 22 21 19 11 10 12 0.4% 0.6% 0.6% 0.6% 0.4% 0.3% 0.4% 41.7%81 and over 4 5 0 1 1 3 2 0.1% 0.1% 0.0% 0.0% 0.0% 0.1% 0.1% 100.0%
Total, Age Known 3884 3734 3600 3373 3141 3003 2779 100.0% 100.0% 100.0% 100.0% 100.0% 100.0% 100.0% 39.8%
Total, Age N/A 201 219 218 203 194 211 230
TOTAL 4085 3953 3818 3576 3335 3214 3009
NUMBER EMPLOYED-FILM % OF EMPLOYMENT-FILM
<31 68 80 74 82 84 102 98 4.5% 5.1% 4.8% 5.3% 5.2% 5.9% 6.1% -30.6%31-40 469 489 504 533 590 620 596 30.9% 30.9% 32.6% 34.2% 36.4% 36.1% 37.3% -21.3%41-50 558 611 592 575 555 587 521 36.8% 38.6% 38.3% 36.9% 34.3% 34.1% 32.6% 7.1%51-60 277 271 257 264 274 290 284 18.3% 17.1% 16.6% 16.9% 16.9% 16.9% 17.8% -2.5%61-70 122 110 93 83 96 97 85 8.0% 7.0% 6.0% 5.3% 5.9% 5.6% 5.3% 43.5%71-80 21 20 24 21 17 19 14 1.4% 1.3% 1.6% 1.3% 1.1% 1.1% 0.9% 50.0%81 and over 1 1 2 1 3 4 2 0.1% 0.1% 0.1% 0.1% 0.2% 0.2% 0.1% -50.0%
Total, Age Known 1516 1582 1546 1559 1619 1719 1600 100.0% 100.0% 100.0% 100.0% 100.0% 100.0% 100.0% -5.3%
Total, Age N/A 92 83 79 92 88 109 131
TOTAL 1608 1665 1625 1651 1707 1828 1731
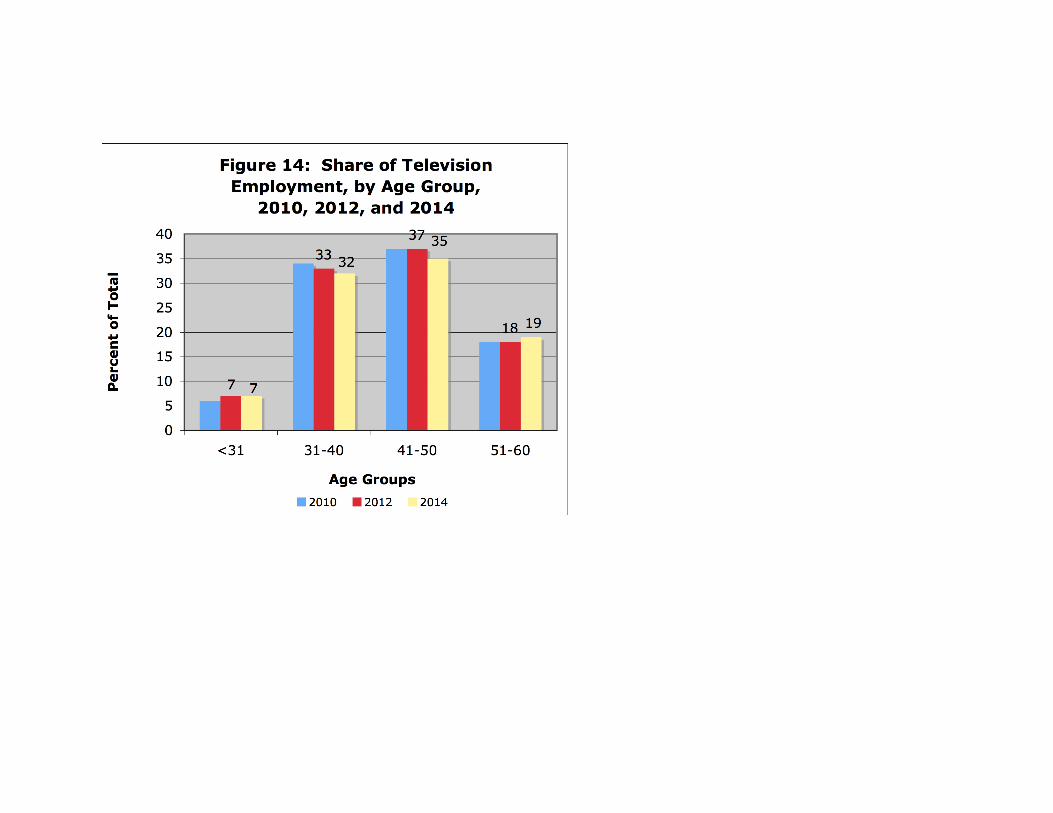
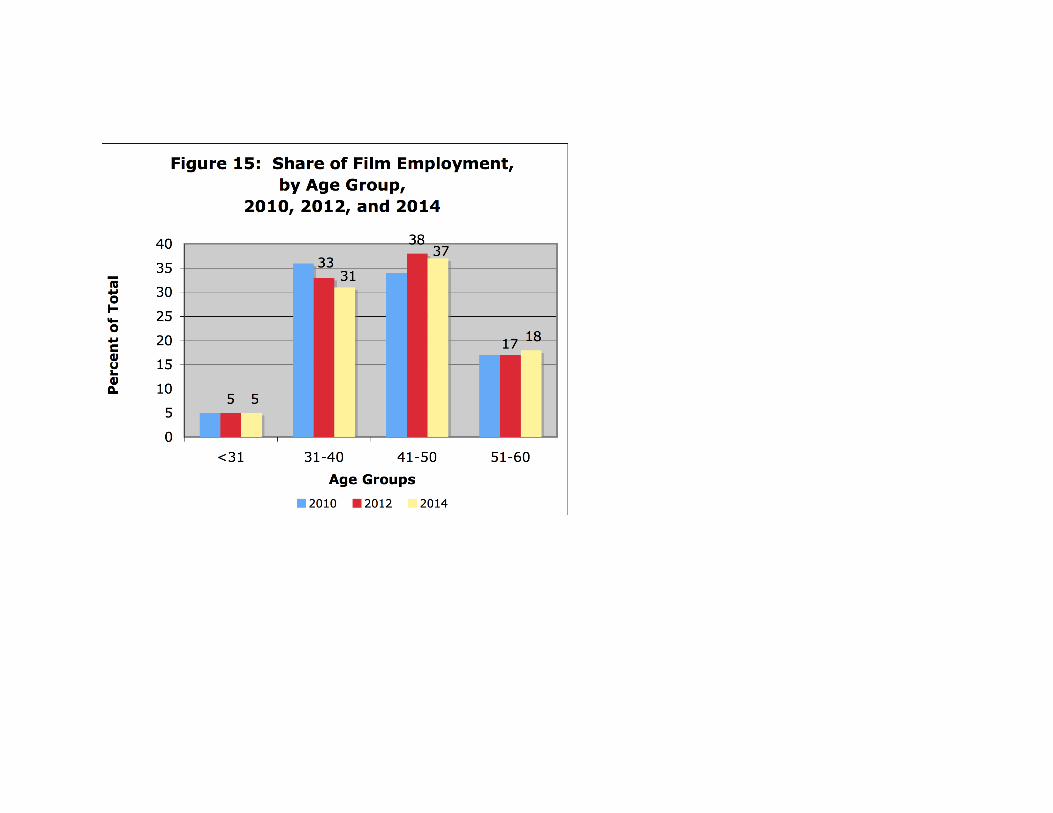
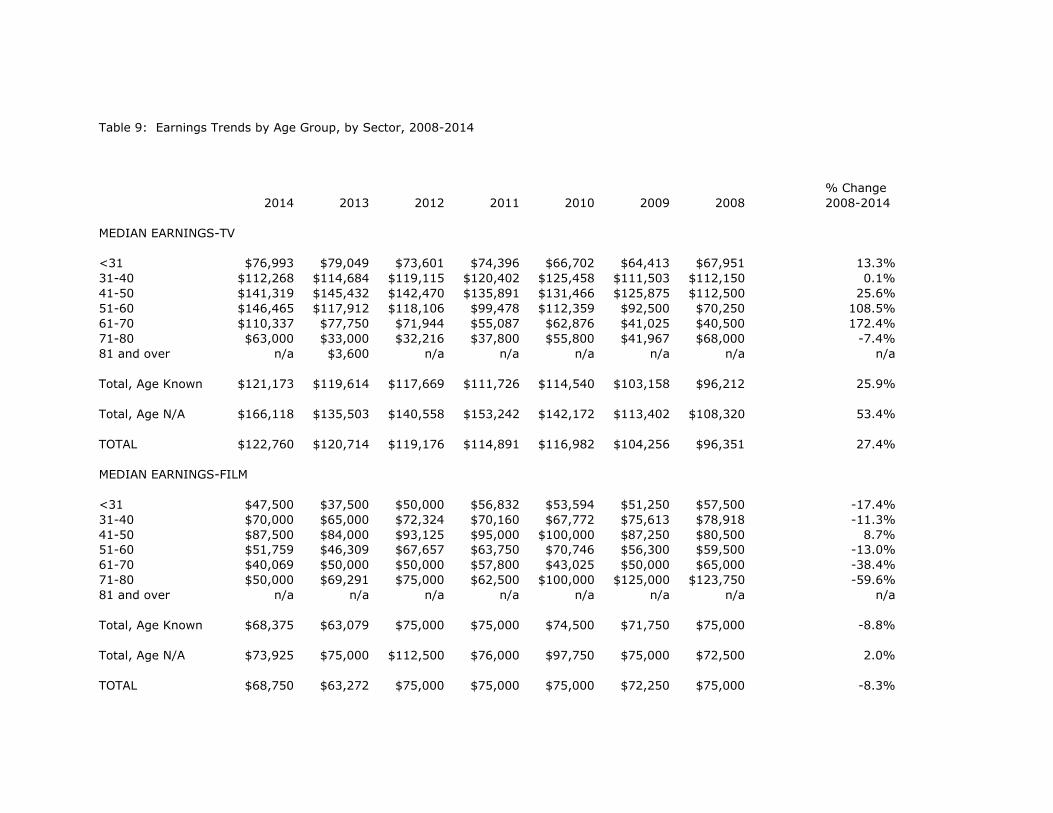
Table 9: Earnings Trends by Age Group, by Sector, 2008-2014
% Change 2014 2013 2012 2011 2010 2009 2008 2008-2014
MEDIAN EARNINGS-TV
<31 $76,993 $79,049 $73,601 $74,396 $66,702 $64,413 $67,951 13.3%31-40 $112,268 $114,684 $119,115 $120,402 $125,458 $111,503 $112,150 0.1%41-50 $141,319 $145,432 $142,470 $135,891 $131,466 $125,875 $112,500 25.6%51-60 $146,465 $117,912 $118,106 $99,478 $112,359 $92,500 $70,250 108.5%61-70 $110,337 $77,750 $71,944 $55,087 $62,876 $41,025 $40,500 172.4%71-80 $63,000 $33,000 $32,216 $37,800 $55,800 $41,967 $68,000 -7.4%81 and over n/a $3,600 n/a n/a n/a n/a n/a n/a
Total, Age Known $121,173 $119,614 $117,669 $111,726 $114,540 $103,158 $96,212 25.9%
Total, Age N/A $166,118 $135,503 $140,558 $153,242 $142,172 $113,402 $108,320 53.4%
TOTAL $122,760 $120,714 $119,176 $114,891 $116,982 $104,256 $96,351 27.4%
MEDIAN EARNINGS-FILM
<31 $47,500 $37,500 $50,000 $56,832 $53,594 $51,250 $57,500 -17.4%31-40 $70,000 $65,000 $72,324 $70,160 $67,772 $75,613 $78,918 -11.3%41-50 $87,500 $84,000 $93,125 $95,000 $100,000 $87,250 $80,500 8.7%51-60 $51,759 $46,309 $67,657 $63,750 $70,746 $56,300 $59,500 -13.0%61-70 $40,069 $50,000 $50,000 $57,800 $43,025 $50,000 $65,000 -38.4%71-80 $50,000 $69,291 $75,000 $62,500 $100,000 $125,000 $123,750 -59.6%81 and over n/a n/a n/a n/a n/a n/a n/a n/a
Total, Age Known $68,375 $63,079 $75,000 $75,000 $74,500 $71,750 $75,000 -8.8%
Total, Age N/A $73,925 $75,000 $112,500 $76,000 $97,750 $75,000 $72,500 2.0%
TOTAL $68,750 $63,272 $75,000 $75,000 $75,000 $72,250 $75,000 -8.3%
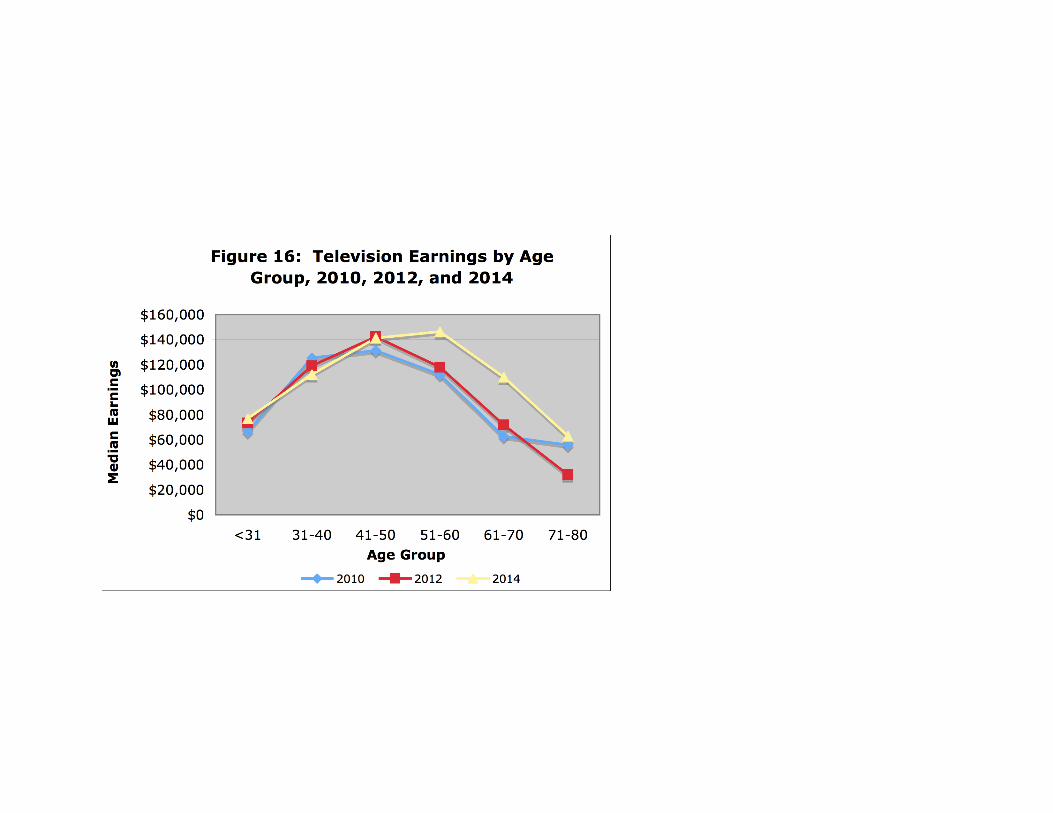
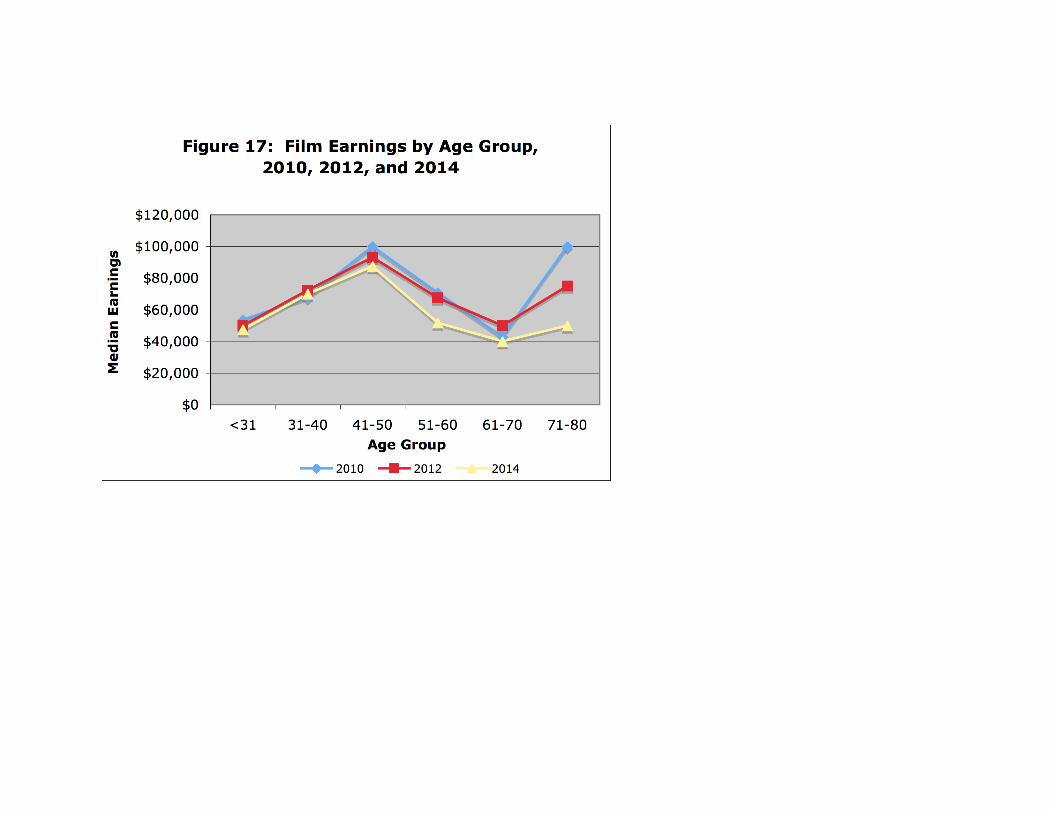
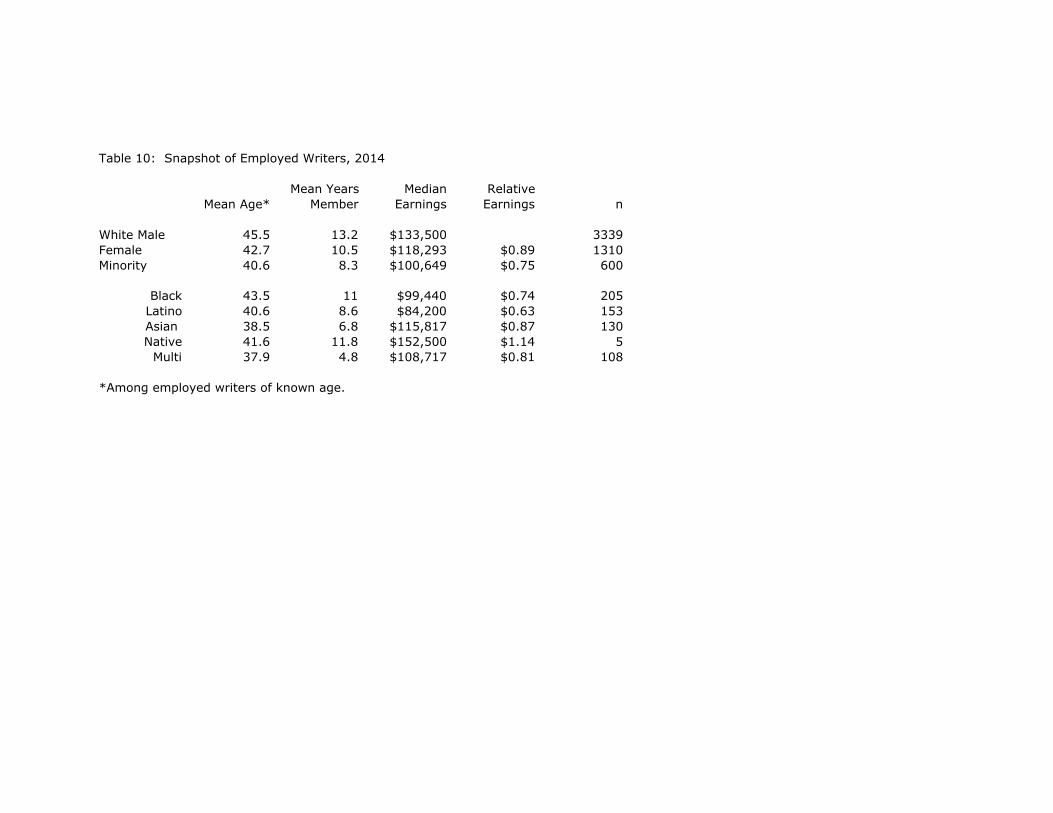
Table 10: Snapshot of Employed Writers, 2014
Mean Years Median RelativeMean Age* Member Earnings Earnings n
White Male 45.5 13.2 $133,500 3339Female 42.7 10.5 $118,293 $0.89 1310Minority 40.6 8.3 $100,649 $0.75 600
Black 43.5 11 $99,440 $0.74 205Latino 40.6 8.6 $84,200 $0.63 153Asian 38.5 6.8 $115,817 $0.87 130Native 41.6 11.8 $152,500 $1.14 5
Multi 37.9 4.8 $108,717 $0.81 108
*Among employed writers of known age.