Embed Size (px)
Citation preview

4
Renewable Energy and Coal Use in Turkey
Ali Osman Yılmaz Karadeniz Technical University/Department of Mining Engineering, Trabzon
Turkey
1. Introduction
The development level of a country is directly related to its economical and social level. One of the most important factors that takes an active role in achieving such development level is energy. Energy, which is the requirement of sustainable development, can only be an impulsive force in industrialization and overall development of societies if it is supplied on time, with sufficient quantity and under reliable economical conditions and considering the environmental impacts. The demand for energy increases rapidly in parallel with the population increase, industrialization and technological developments in Turkey and the other developing countries in the world. Turkey has been developing since the foundation of the Republic of Turkey in 1923. Turkish Government played a leading role in energy production and in energy use, as well as in other fields, and implemented several policies to increase electricity production. By 1950s, thermal power plants were used commonly in electricity production. In the following years, hydroelectric power plants were put into operation in order to use the considerable amount of water resources of the country. Coal-fired power plants using national resources accounted for 70–80% of the thermal electricity production. After 1960s, oil, an imported resource, was replaced with national resources due to two petroleum crises. Therefore, the proportion of use of lignite in the energy field increased. By 1980s, energy production lead by the government went on. Afterwards, applications of liberal economy policies resulted in implementation of different energy production methods, and the country had a increasing tendency to meet energy demand by imports as a result of improvement in international economic relations. Natural gas became prevalent in the country as well as all over the world and accounted for 50% of the electricity production in 2009 (Fig 1, Table 1). On the eve of 21st century, Turkey was unable to meet its energy requirement with its limited sources as a result of the increasing population and industrialization and thus the deficit between the energy production and energy consumption increased rapidly. Under such conditions, utilizing own resources more effectively had become more important increasingly day by day. Turkey became more dependent on imports year to year. It still supplies about 71% of its primary energy consumption from imported energy sources. This percentage is 59% for electricity production. It is now vital for Turkey to attach importance to coal and renewable energy sources, which are the largest domestic energy sources of Turkey, in order to meet this increasing energy deficit. Especially, it is possible to produce electricity using the said domestic sources.
www.intechopen.com

Sustainable Growth and Applications in Renewable Energy Sources
62
Population 73.722.988 (2010)
Gross national product (GNP) 615 billion $
GNP per capita 8.215 $/person
Primary energy production 30.328 ktoe (thousand tons of oil equivalent)
Distribution of primary energy production Lignite 52%,wood 12%, hydraulic 10%, Petroleum 8%,hard coal 4%, other 14 %
Primary energy consumption 104.117 Ktoe
Distribution of primary energy consumption
Petroleum 29 %, natural gas 31 %, lignite 15 %, hard coal 14 %, hydraulic 3 %, other 8 %.
Distribution of primary energy consumption by sectors
Industry 23 %,residential 27 %, transportation 15%, energy 25%, other 10%
Rate of primary energy [production/consumption]
29 %
Primary energy consumption per capita 1435 Koe (Kilogram oil equivalent)
World primary energy consumption per capita
1710 Koe
Installed capacity 44.761 MW
Distribution of installed capacity by primary energy sources
Renewable 35 %, natural gas 26 %, lignite 18 %, petroleum 4 %, imported coal 5 %, hard coal 1%, other 11 %
Electricity generation 194.813 GWh
Distribution of electricity generation by primary energy sources
Natural gas 49 %, renewable 19%, lignite 20 %, petroleum 3%, imported coal 6 %, hard coal 2 %, other 1 %.
Electricity gross consumption 194.079 GWh
Electricity gross generation per capita 2.685 kWh/person
Electricity net consumption per capita 2.162 kWh/person
Word electricity generation 20.202 billion kWh (2008)
Word electricity consumption 16.880 billion kWh (2008)
World electricity generation by primary energy sources
Coal 42%,natural gas 21%, nuclear14 %, hydraulic 16%, petroleum 6%, biomass 3%, other 4 %. (2007)
World electricity production per capita 3012 kWh/person (2008)
World electricity consumption per capita 2516 kWh/person (2008)
Table 1. Energy Profile of Turkey (2009)
www.intechopen.com

Renewable Energy and Coal Use in Turkey
63
15 14 15 16 16 16 16 17 18 17 17 18 19 19 20
22
24
25 25 26 25 26
27 26 27 27 27 28 29
28
26
25 24 24 24 25
27 27
29 30
19
20
22
24 25
27
30
32 33
31
32 32
34
36
37
39
42
47 48
51
53
54
56
59
58
63
68
72
73 73
79
74
77
82
86
89
98
106
104
10477
72
68
64 64
60
55
5255
5654
5756
54 5456 55
5451 51
48 47 4844 46
4240 39 40
38
33 3332
29 28 28 27 2628 29
0
10
20
30
40
50
60
70
80
90
0
20
40
60
80
100
120
1970
1971
1972
1973
1974
1975
1976
1977
1978
1979
1980
1981
1982
1983
1984
1985
1986
1987
1988
1989
1990
1991
1992
1993
1994
1995
1996
1997
1998
1999
2000
2001
2002
2003
2004
2005
2006
2007
2008
2009
Prim
ary
ener
gy p
rodu
ctio
n-co
nsum
ptio
n [M
toe]
[Pro
duct
ion/
Con
sum
ptio
n]x
100
[%]
Consumption
Production
[production/Consumption]x100
Primary energy production compared with primary energy consumption
Fig. 1. During period of 1970-2009, primary energy production-consumption and rates of production and consumption (data from MENR,1970-2009)
In this chapter, the primary energy production– consumption of renewable energy sources of Turkey and coal as well as the development of their use rates in electricity production are discussed for a definite time period. In addition, some information is given about the projected use rates of such energy sources in energy production and projected consumption in Turkey for the years 2015 and 2020.
2. Energy outlook of Turkey
When the Republic of Turkey was founded in 1923, Turkey’s population was 12 million. Installed capacity of electricity production, total electricity production, per capita electricity production and per capita electricity consumption were 33MW, 45 GWh, 3.6kWh and 3.3 kWh, respectively. Initially, almost all electricity demand was met by thermal power plants. The foundation of the Turkish Republic became the start of the development of the country. In 2009 year, the population has reached 73,7 million increasing about by six fold. In 2009 year, installed capacity reached 44.761MW increasing about by 1356-fold, electric production reached to 194.813 GWh increasing by 4329-fold. Per capita electricity production and electricity consumption reached 2685 and 2162 kWh increasing by 745-fold and by 655-fold, respectively. In 2009 year, primary energy production and consumption were 30.328 Ktoe and 104.117 Ktoe respectively. Also, distributions of primary energy production were lignite 52%, wood 12%, hydraulic 10%, hard coal 4%, and petroleum 8%. Distribution of primary energy consumptions were petroleum, natural gas, lignite, hard coal, hydraulic and other 29%, 32 %, 15%, 14 %, 3 % and 8%, respectively (Table 1). The net effect of all these factors is that Turkey’s energy demand has grown rapidly almost every year and is expected to continue growing (Arıoğlu and Yılmaz, 1997a; SIS, 2003,2004; Yılmaz, 2003, 2004,2011; TEIAS, 2004, 2009; Yılmaz and Uslu 2007; BP, 2009). Energy has been the most important investment sector over the world. Turkey’s energy needs are increasing quickly. Primary energy production-consumption and rates of production and
www.intechopen.com

Sustainable Growth and Applications in Renewable Energy Sources
64
consumption are illustrated in Fig.1. Since Turkey is an energy importing country more than about 70% of the country’s energy consumption is met by imports, and the share of imports is growing in the following years. While the primary energy consumption in 1970 was 18.84 mtoe, it reached 104 mtoe (million ton oil equivalent) with an increase rate of 552% in 2009. Primary energy production and consumption rates realized 1.39% and 4.29% per year, respectively. In other words, increase in consumption is three times bigger than the increase in production. While the ratio that production meets consumption was 77 % in 1970, this ratio reduced and reacted to 29 % in 2009. In other words, Turkey has been a country that depends on other countries in energy fields, especially in terms of oil and natural gas. (Fig. 1). (Yılmaz, et al, 2005; Yılmaz, 2003; Yılmaz and Arıoğlu 2003; Yılmaz and Uslu, 2007; Yılmaz 2006; Yılmaz 2009; Yılmaz 2011; Arıoğlu 1994; Arıoğlu 1996). Distribution of total electricity generation by energy resources during the period 1940–2009 is shown in Fig 2. As seen in the figure, renewable, oil-natural gas and coal accounted for 8%, 6%, 86 of electricity production in 1940. The share of the coal reduced continuously in the following years and reached as 55% in 1960, 25% in 1980 and again increased to 29%(imported coal included) in 2009. The increase rate of use of renewable energy sources was accelerated especially from 1960s, as seen in the electricity production capacity, and use rate of renewable energy sources was recorded as 8 % in 1940, 37% in 1960, 52% in 1980 and decreased to 19% in 2009. Because, after the year 2000, a sharply increase in share of imported natural gas in electricity production, lowered the use of domestic lignite and hard coal. Turkey is dependent on foreign countries especially in terms of oil and natural gas. In 1960, imported oil made up 8% of electricity production and this rate abruptly increased in the after years and it’s had been reached 30% in 1970. During period 2000s years, imported of the natural gas sharply increased and reacted to 50% in 2009. Natural gas has been fast-growing fuel of energy market in Turkey. The tremendous growth and increased trend in gas demand during the period 1990-2009 showed that Turkey will need much more gas in the following years. Especially the share of the natural gas consumed in electricity generation has sharply increased and is considered to increase also in the future (Yılmaz 2008; Yılmaz 2011). Turkey became more dependent on imports year to year. It still supplies about 71% of its primary energy consumption from imported energy sources. This percentage is 59% for electricity production. These rates are exactly seen in Fig 3. and Fig. 4 during of the period 1970-2009. In Fig 3 show that Turkey’s primary energy consumption was 77% share of the domestic energy sources in 1970. While 54% of the consumed energy in 1980 was by the domestic energy sources, this percentage decreased to 33% and 29% in 2000 and 2009 respectively. On the other hand, share of the imported energy sources was increased from 23% in 1970 to 71% in 2009. In Figure 4 distribution of electricity production by domestic and imported energy sources are given in historical order. As seen in Figure, while domestic energy sources had a share of 68% in electricity production in 1970, imported energy sources had a share of 42% in electricity generation. After the 1970s years, oil crisis started. Turkey gave importance on lignite, coal and own renewable energy potential sources. So the rate of electricity production using Turkey’s domestic sources was increased. But in 1990s use of imported natural gas in electricity production has sharply increased to 45% and 59% in 2000 and 2009 respectively. It is now vital for Turkey to attach importance to coal and renewable energy sources, which are the largest domestic energy sources of Turkey, in order to meet this increasing energy deficit. Especially, it is possible to produce electricity using the said domestic sources (Yılmaz 2006; Yılmaz 2011, Yılmaz and Arıoğlu 1997b).
www.intechopen.com

Renewable Energy and Coal Use in Turkey
65
(8,6,86)
(11,10,79)(37,8,55)
(37,30,33)
(52,24,25)(40,25,35)
(25,44,30)(37,46,17)
(19,52,29)
0 20 40 60 80 100RENEWABLE [%]
100
80
60
40
20
0
OIL-N
ATU
RA
L GA
S [%]
100
80
60
40
20
0
CO
AL
[%]
(Renewable,Oil,Coal) Proportions
1940
19561960
1970
19801990
20002004
2009
COAL
REN
EWA
BLE
OIL- NATURAL GAS
Year
Fig. 2. Distribution of primary energy sources in electricity production by years (data from TEIAS, 2009)
23
2832
36 3640
4548
45 4446
43 44 46 46 44 45 4649 49
52 53 5256 54
5860 61 60
62
67 67 6871 72 72 73 74
72 71
77
72
68
64 64
60
55
52
5556
54
5756
54 5456 55
5451 51
4847 48
4446
4240 39 40
38
33 3332
29 28 28 2726
2829
0
10
20
30
40
50
60
70
80
90
100
19
70
19
71
19
72
19
73
19
74
19
75
19
76
19
77
19
78
19
79
19
80
19
81
19
82
19
83
19
84
19
85
19
86
19
87
19
88
19
89
19
90
19
91
19
92
19
93
19
94
19
95
19
96
19
97
19
98
19
99
20
00
20
01
20
02
20
03
20
04
20
05
20
06
20
07
20
08
20
09
% o
f to
tal
Co
nsu
mp
tio
n
INDIGENOUS ENERGY SOURCES
IMPORTED ENERGY SOURCES
Fig. 3. During the period 1970 and 2009, primary energy consumption with domestic and imported energy sources (data from MENR, 1970-2009)
www.intechopen.com

Sustainable Growth and Applications in Renewable Energy Sources
66
32
4346
53
46
36
3135
31
26 26 24 2227
2321 21
1814
26 25 2624
2225 26 25
29 30
38
50 50
5653
55 5559
68
57
54
47
54
64
69
65
69
74 7476
78
73
7779 79
82
86
7475
74
7678
7574
75
7170
62
55
50 50
44
4745 45
41 4041
0
10
20
30
40
50
60
70
80
90
100
19
70
19
71
19
72
19
73
19
74
19
75
19
76
19
77
19
78
19
79
19
80
19
81
19
82
19
83
19
84
19
85
19
86
19
87
19
88
19
89
19
90
19
91
19
92
19
93
19
94
19
95
19
96
19
97
19
98
19
99
20
00
20
01
20
02
20
03
20
04
20
05
20
06
20
07
20
08
20
09
% o
f to
tal
pro
du
ctio
n
INDIGENOUS ENERGY SOURCES
IMPORTED ENERGY SOURCES
Fig. 4. During the period 1970 and 2009, in electricity generation imported and indigenous energy sources (data from TEIAS, 1970-2009)
3. Renewable energy use in Turkey
Totally energy demand of Turkey was making up about 29% of domestic resources and about 71% import resources. Turkey’s primary energy production is 30.3 Mtoe (Table 1, Fig 1.). Turkey got a great share coal which is consisted of 57%. The primary energy that follows the coal and their shares are as follows; oil 8%, natural gas 2% and renewable energy 33%. Distribution of the share on the renewable energy are hydraulic, geothermal, wood, animal and vegetable waste and other 10%, 6%,12%,1% and 1%, respectively in primary energy production (Fig 5.). On the other hand, primary energy consumption of Turkey is 104.1 Mtoe in 2009. The biggest energy consumption resource is natural gas with 32% and followed of this gas; oil 29%, coal 30%, and renewable energy 9% in consumption (Fig5). Distribution of the share on the renewable energy are hydraulic, geothermal, wood, animal and vegetable waste and other 3%, 1%, 3%, 1% and 1%, respectively in primary energy consumption (MENR, 2010; TKI, 2004,2009). Turkey is dependent on the import of foreign primary energy sources especially; oil, natural gas and hard coal. Recently, according to research estimates, this trend is likely to continue in the near future. Turkey has two main energy resources with large capacities. These are coal and renewable energy resources. Both energy resources constitute 90% of the primary energy production. The total primary energy production was 31% in 1970 and increased to 50% and 57% in 1989 and in 2009 respectively and this rate was met by coal. The share of the renewable energy resources was 43% in 1970 and decreased to 33% in 2009 (Fig. 6) (Yılmaz 2006; Yılmaz 2011).
www.intechopen.com

Renewable Energy and Coal Use in Turkey
67
PRIMARY ENERGY PRODUCTION-2009 PRIMARY ENERGY CONSUMPTION-2009
Coal
57%
Oil
8%
Natural Gas
2%
Hydraulic
10%
Geothermal
6%
Wood
12%
Animal and wegetable
wast 4%
Other 1%
Renewable
33%
Coal
30%
Oil
29%
Natural Gas
32%
Hydraulic
3%
Geothermal
1%
Wood
3%
Animal and wegetable
wast 1%
Other 1%
Renewable
9%
Fig. 5. Total primary energy production and consumption by energy sources in 2009 (data from MENR, 2009)
31 33 34 34 35 36 37 36 38
34 36 38 39 41 43
48 48 49
45
5046 43 45 44 46 45 45 47 48 48 48 50
47 45 43 46
49
54
57 57
43 42 43 43
43 45
47 47 46
49
50 48 48 47
46
41 39 39 44
38
38
38
37 40 39 40 41 40 39 38 39
38
41 42 44 41
39
35
32 3374 7577 76
7980
83 83 84 8386 86 87 88 89 90
88 88 89 8884
8183 84 85 86 86 86 87 86 87 88 88 87 88 87 88 89 89 90
0
10
20
30
40
50
60
70
80
90
100
1970
1971
1972
1973
1974
1975
1976
1977
1978
1979
1980
1981
1982
1983
1984
1985
1986
1987
1988
1989
1990
1991
1992
1993
1994
1995
1996
1997
1998
1999
2000
2001
2002
2003
2004
2005
2006
2007
2008
2009
OTHER: Natural gas, petroleum(Coal+Renewable) in total production
RENEWABLE
COAL
% o
f tot
al p
rodu
ctio
n
Fig. 6. During of the period 1970-2009, total primary energy production with rates of renewable energy and coal (data from MENR 1970-2009)
The distribution of renewable energy sources in primary energy production in Turkey is illustrated in Fig. 7 for the term 1970 and 2009. The energy sources used for the primary energy production are hydraulic energy, geothermal energy, wood, animal and vegetable waste. On average 43% of the primary energy production was met by the renewable energy in 1970. This percentage increased to 50% in 1980 and due to the imported natural gas, this rate was decreased to 33% in 2009. The shares of the energy sources in this production rate
www.intechopen.com

Sustainable Growth and Applications in Renewable Energy Sources
68
were as follows: 10% hydraulic, 6% geothermal, 12% wood and 4% animal and vegetable waste in 2009. According to this data, the largest energy source used in primary energy production was wood and hydraulic. While the share of the wood and waste and drung has decreased, the share of the hydraulic, geothermal has increased (Yılmaz 2008; MENR,1970-2009; SIS, 2003–2004; TEIAS, 2004,2009).
2 2 2 1 2 3 4 4 5 5 6 6 6 5 6 5 4
7
10
6
8 8 9
11
10 12 13
12 13
11
10
9
12 13
17
14 15
12
10 10
0
1
1
2
2
2
2 2 2
2 2
3
3
3
3
4 3
3
4
6
26
25 2
7
27 27 2
7 27
27
26 2
7 27
26 26
27 25
24
22 2
1
22
21
21
21 20
21
21 2
1 20
20
19
19
20
20
19 1
9
18
17
15
14
13 1
2
1515
14 14 14
15
15 15 15
16
17
16 15 15 14
12
11 10
10
10
7 7 7
6
6
6 6
5 5 5 5 5
5 5
5
5
4
4
4 4
4342
43 43 4345
47 4746
4950
48 48 4746
4139 39
44
38 38 38 37
4039
40 4140 39 38 39 38
41 42
44
41
39
35
3233
0
5
10
15
20
25
30
35
40
45
50
1970
1971
1972
1973
1974
1975
1976
1977
1978
1979
1980
1981
1982
1983
1984
1985
1986
1987
1988
1989
1990
1991
1992
1993
1994
1995
1996
1997
1998
1999
2000
2001
2002
2003
2004
2005
2006
2007
2008
2009
WOOD
Renewable in total production
Geothermal
Hydraulic
Animal and vegetable Waste
% o
f tot
al p
rodu
ctio
n
Fig. 7. During of the period 1970-2009, renewable energy sources and rates used in primary energy production (data from MENR 1970-2009)
The development of the total share of renewable energy sources in primary energy consumption in Turkey is illustrated in Fig. 8 for the term 1970 and 2009. Turkey’s main energy production resources are hard coal, lignite and renewable energy. The total domestic energy production was 77% (hard coal 15%, lignite 8%, renewable 33% and other oil-gas 21%) in 1970. The share of total domestic energy sources in overall primary energy production was 48% (hard coal 4%, lignite 18%, renewable 18 and other 8%) in 1990, and it decreased to 29% (hard coal 1%, lignite 15%, renewable 10% and other 4%) in 2009. In other words, the share of the renewable energy resources was 33% in 1970 and decreased to 10% in 2009. As seen in Figure 8, Turkey’s total domestic energy sources in overall production has decreased from 1970 and 2009 term. When use of renewable domestic energy sources is considered in terms of primary energy production, it decreased to 10% levels in the recent years. The primary energy consumption of Turkey has increased day by day and it will follow in the future. The development of the total share of renewable energy sources in primary energy consumption in Turkey is illustrated in Fig. 9 for the term 1970 and 2009. The energy sources used for the primary energy production are hydraulic energy, geothermal energy, wood, animal and vegetable waste. The share of total renewable energy sources in overall consumption was 33% in 1970 (hydraulic 1% wood 20%, waste and drug 11%) and it decreased to 23% (hydraulic 4% wood 11%, waste and drug 5%) in 1990. In 2009, the share of renewable energy sources in total primary energy consumption decreased and reached to 9% (Yılmaz 2008; MENR, 2006-2009; SIS, 2003–2004; TEIAS, 2004-2009).
www.intechopen.com

Renewable Energy and Coal Use in Turkey
69
15 14 13 12 12 11 10 8 8 8 7 8 7 6 6 6 5 5 5 4 4 3 3 3 3 2 2 2 2 1 1 2 1 1 1 1 1 1 1 1
9 9 10 10 11 11 11 11 13 11 12 14 15 16 1821 22 22 19 21 18 17 19 17 18 17 16 16 17 17 14 15 13 12 11 11 12 13 15 15
3330 29
27 28 2726
2425 27 27
28 27 26 2523 22 21
22 1918
18 1818 18
17 16 16 16 1513 13
1312 12 11 11 9
9 10
77
7268
64 6460
5552
5556
5457 56
54 54 56 5554
51 5148 47 48
44 4642
40 39 4038
33 33 3229 28 28 27 26
28 29
0
10
20
30
40
50
60
70
80
90
1001
97
0
19
71
19
72
19
73
19
74
19
75
19
76
19
77
19
78
19
79
19
80
19
81
19
82
19
83
19
84
19
85
19
86
19
87
19
88
19
89
19
90
19
91
19
92
19
93
19
94
19
95
19
96
19
97
19
98
19
99
20
00
20
01
20
02
20
03
20
04
20
05
20
06
20
07
20
08
20
09
% o
f to
tal
co
nsu
mp
tio
n
Hard coal
RENEWABLE
Imported energy sources:Oil, Natural gas, Hard coal
Total Indigenous energy sources
Fig. 8. During of the period 1970 and 2009 development of the total share of renewable energy sources in primary energy production (data from MENR 1970-2009)
1 1 1 1 1 2 2 2 2 3 3 3 4 3 3 3 24
53 4 4 4 5 5 5 5 5 5 4 3 3
4 4 5 4 4 3 3 3
2018 18
17 17 16 1514 14
15 15 15 1514 14
13 12 11
11
1110 10 10
9 9 9 8 8 87
6 76 5
55 4
4 43
11
11
109 9
99
8 8
9 9 9 88 7
66 5
5
5 4 3 3 3 3 2 22 2
2
2 2 22 1
1 1
1 1 1
33
3029
27 2827
26
2425
28 28 2827
2625
23
2221
23
1918 18 18 18 18
1716
16 1615
13 13 1312 12
1111
9 99
0
5
10
15
20
25
30
1970
1971
1972
1973
1974
1975
1976
1977
1978
1979
1980
1981
1982
1983
1984
1985
1986
1987
1988
1989
1990
1991
1992
1993
1994
1995
1996
1997
1998
1999
2000
2001
2002
2003
2004
2005
2006
2007
2008
2009
WOOD
Renewable in total consumption
Hydraulic
Geothermal
% o
f tot
al c
onsu
mpt
ion
Animal and vegetable Waste
Fig. 9. During of the period 1970 and 2009 development of the total share of renewable energy sources in primary energy consumption (data from MENR 1970-2009)
3.1 Energy production using renewable energy sources Distribution of installed capacity of Turkey by energy sources during the period 1940 and 2009 is illustrated in Fig. 10. The overall installed capacity was 217 MW in 1940 and the rate of renewable energy source was 3%. The overall installed capacity increased 164 times in 2003 and reached 35587 MW. The renewable source, which was 7.8 MW at the beginning of the term, increased 1614 times and reached 12594 MW (35%). The increase rate of use of renewable energy sources was accelerated especially in the middle of 1950s. This rate increased to 33%, 38%, and 35% in 1973, 1986 and in 2009 respectively. Especially, the electricity production using natural gas caused that this rate decreased. While hard coal
www.intechopen.com

Sustainable Growth and Applications in Renewable Energy Sources
70
accounted for 50% of total installed capacity and 80% of electricity production in 1950, its share reduced continuously in the following years and realized 1.1% in installed capacity and 1.9% in electricity production. Lignite proved its importance during the petroleum crisis in 1973–1979. After 1973, its importance increased. The share of lignite in electricity production increased to 45% from 20% and its share in installed capacity reached 35% in the 1980s. After the year 2000, an increase in share of natural gas, both installed capacity and in electricity production, lowered the use of lignite. In 2009, the share of installed capacity by resources was 1%, 19%, 35%, 4%, 26% and 11% for hard coal, lignite, renewable, crude oil, natural gas and other, respectively (Yılmaz et al., 2005; Yılmaz, 2004,2011; Yılmaz 2008; Yılmaz and Aydıner, 2009; Yılmaz and Uslu, 2006). The most important and the largest energy capacities of Turkey’s are coal and renewable energy resources. Both energy resources constitute 61% (hard coal 16%, lignite 13% and renewable 32%) of the total installed capacity in 1970. The total installed capacity increased and reached to 78% (hard coal 2%, lignite 29% and renewable 47%) until 1995. In this rate just only hard coal percentage decreased, lignite and renewable increased as domestic energy sources. But, after this time the total installed capacity decreased and reached to 54% (hard coal 1%, lignite 18% and renewable 34%) in 2009 as illustrated in Fig 11. In Figure 12, distribution of electricity production of Turkey by energy resources is given in a long historical order for 1940 and 2009 term. As seen in the Figure, coal (especially hard coal) had a share of 80% in electricity production in 1940. In the same year, the share of electricity production by resources was 6%, 3%, 6%, 5%, for lignite, renewable, crude oil and other, respectively. The rate of electricity production using renewable energy resources and lignite had begun increasing in time reached to 21% and 14% respectively in 1973. The share of hard coal sharply decreased and reached to 12% in 1973. By the middle of 1960s, use of oil
Hard coal
Lignite
İmportedcoal
Renewable
PetroleumNatural gas
Other
6867
65 6665 64 64
63
65
70
6766 66
65
6362
5658
54
48
44
4241 41
3941
38
32 32 32
29
2524
30
25
2322
26
2827 27
2829 30
30
34
37 37
32 32 32 31 3129 30
30 3029
28
26 2625
2223 23
2325 25 24
7270
69 6968 67 67
66
69
7371 72
72
71 7068
7475 75 75
76 76 75 75 75 75 75
6869 69
61
59
57
60
6465 65
6667
68 68
70
7576 76 76 76
77
7574 73 73
7677 77 78 77
75
72
6667
66
60
5957 57
58 58 58
0
10
20
30
40
50
60
70
80
90
100
1940
1942
1944
1946
1948
1950
1952
1954
1956
1958
1960
1962
1964
1966
1968
1970
1972
1974
1976
1978
1980
1982
1984
1986
1988
1990
1992
1994
1996
1998
2000
2002
2004
2006
2008
% o
f tot
al
43 %
25 %
28 %
3%
55 %
15 %
27 %
3 %
48 %
14 %
6 %
29 %
13 %
11 %
33 %
42 %
2 %
35 %
38 %
17 %
0.8 %
18 %
4 %
35
35%
3 %
11 %
Coa lTot a l
3 %
26 %
2 %
(Coa l+Re ne w able )Tota l
4 %
Fig. 10. During period of the 1940- 2009 distribution of installed capacity by energy sources (data from TEIAS 2009)
www.intechopen.com

Renewable Energy and Coal Use in Turkey
71
16 14 13 11 9 8 8 7 7 6 6 6 5 4 3 2 2 1 1 2 2 2 2 2 2 2 2 2 1 1 1 1 1 1 1 1 1 1 1 1
1311 11
1916
14 1419 22 20 20 22 24 26 28 31 35 35
31 30 30 29 29 28 28 29 28 28 27 24 24 23 20 18 18 18 20 20 20 18
3234 33
31 39 43 4340 39 42 42 43
46 47 46 43 39 4043 42 42 41 45 48 47 47 47 46
4440 41 41
3935 34 33 32 33 34 34
6159
5760
64 65 65 66 67 68 6870
75 76 76 76 76 7775 74 73 73
76 77 77 78 77 7572
66 66 65
60
54 53 53 53 54 54 54
0
10
20
30
40
50
60
70
80
90
100
19
70
19
71
19
72
19
73
19
74
19
75
19
76
19
77
19
78
19
79
19
80
19
81
19
82
19
83
19
84
19
85
19
86
19
87
19
88
19
89
19
90
19
91
19
92
19
93
19
94
19
95
19
96
19
97
19
98
19
99
20
00
20
01
20
02
20
03
20
04
20
05
20
06
20
07
20
08
20
09
% o
f to
tal
inst
alle
d c
ap
aci
ty
LIGNITE
RENEWABLE
Hard coal
Total Indigenous energy sources
Imported energy sources:Oil, Natural gas, Hard coal
Fig. 11. During of the period 1970 and 2009 development of the share of renewable energy and coal by the total installed capacity (data from TEIAS, 2009)
in electricity production increased, since it is a cheaper than other resources, and this was quickly renounced after the oil crisis in 1973. After the crisis, Turkey gave importance on lignite, one of its own energy resources, and the share of coal in electricity production began increasing and reached 50%. After 2000s, use of natural gas began using in electricity production as in all other areas and its share in electricity production reached 45% in a very short time until 2003. Also imported hard coal began to use in electricity production with 6% in 2003. The share of natural gas has increased and reached to 49% in electricity generation in 2009. At the same year, distribution by resources was as follows natural gas: coal (hard coal %2 + lignite %20) renewable %19, oil %3, and imported hard coal 7% (Yılmaz 2008; Yılmaz, and Aydıner, 2009).
Hard coal
Lignite
İmportedcoal
Renewable
Natural gasPetroleum
Other
86 8688
87 87
8888 88 88 87
86
84
81 82 81 82
79
75
61
63
55
49
60
38
54
45
47
34
32
31
33
30
26 26
29
26
24 24
26
29
2625 24
31
33
44
49
40
26
39
3536
36
32
36
33 3233 32 32
3131
25
23 23
27 2628
29 29
89
91
9392 92
93 93 92 9291
9089
87 87 87 87 87
90 89 90 90 91 91 91 91
89 89
73
78
75
68
57
54
47
54
64
69
65
69
74 74
76
78
73
77
79 79
82
86
74
75
74
76
78
7574
75
7170
62
55
51 51
48
54
51 52
47 46
48
0
10
20
30
40
50
60
70
80
90
100
1940
1942
1944
1946
1948
1950
1952
1954
1956
1958
1960
1962
1964
1966
1968
1970
1972
1974
1976
1978
1980
1982
1984
1986
1988
1990
1992
1994
1996
1998
2000
2002
2004
2006
2008
% o
f tot
al
27 %
61 %
21 %
6 %
12 %
11 %
21 %
51 %
2 %
47 %
30 %
17 %
1.9 %
20 %
19 %
2.5
%
CoalTota l
3 %
(Coal+Renew able)Tota l
45 %
49 %
25 %
7 %
17 %
14 %
10 %
2.5 %
1.9 %
6 %
Fig. 12. During period of the 1940- 2009 electricity production by energy sources (data from TEIAS 2009)
www.intechopen.com

Sustainable Growth and Applications in Renewable Energy Sources
72
The first of the areas where coal and renewable energy can be used most intensively is electricity production. In Figure 13, distribution of the total electricity production by renewable energy and coal sources are given in a historical order. As seen in the Figure, coal (especially hard coal) and renewable energy had a share of 68% (hard coal 16%, lignite 17% and renewable 18%) in electricity production in 1970. The rate of electricity production using renewable energy resources and lignite had begun increasing in time and the share of the hard coal decreased to 1% until beginning of 1988 and the share of renewable energy resources and lignite increased to 42% and 38% respectively. But, after that time the total electricity generation by renewable energy and coal resources decreased and reached to 41 % (hard coal 2%, lignite 20 % and renewable 19%) in 2009. Turkey has become a country, which imports 70% of its energy resources, during this term. Because after the crisis in 1973, Turkey gave importance on lignite, one of its own energy resources, and the share of coal in electricity production began increasing. However, after 2000s, use of natural gas began prevailing in electricity production as in all other areas and its share in electricity production reached 45% in a very short time.
16 15 13 12 11 9 7 6 6 5 4 4 3 3 2 2 2 1 1 1 1 2 3 2 3 3 3 3 3 3 3 2 2 2 2 2 2 2 2 2
1716
13 14 1717
16 18 20 2422 21 21
28 31
4247
38
25
38 34 34 3430
3430 29 30 29 29 28 28
2217 15
18 18 20 21 20
35
2729
21
2538 46
4243
46 49 51 53 4144
3530
42
60 35 40 38 40 46 3941 43 39 38
3025
2026
25 31 25 25 19 17 19
68
5754
47
54
64
6965
69
74 74 76 78
7377
79 7982
86
7475
7476
7875 74 75
71 70
62
55
50 50
4447
45 45
41 40 41
0
10
20
30
40
50
60
70
80
90
100
19
70
19
71
19
72
19
73
19
74
19
75
19
76
19
77
19
78
19
79
19
80
19
81
19
82
19
83
19
84
19
85
19
86
19
87
19
88
19
89
19
90
19
91
19
92
19
93
19
94
19
95
19
96
19
97
19
98
19
99
20
00
20
01
20
02
20
03
20
04
20
05
20
06
20
07
20
08
20
09
% o
f to
tal
ele
ctri
city
pro
du
ctio
n
LIGNITE
RENEWABLE
Hard coal
Total Indigenous energy sources
Imported energy sources:Oil, Natural gas, Hard coal
Fig. 13. During of the period 1970 and 2009 development of the share of renewable energy and coal in the total electricity production (data from TEIAS 2009)
3.2 Renewable energy potential of Turkey The potentials of the main renewable energy sources of Turkey are collectively given in Table 2. The economical potential given in the Table equals the usable potential. The mostly used renewable energy sources in Turkey are biomass energy and hydraulic energy. While geothermal is the third source in the listing, its use is very limited. Use of solar energy is at an emblematic level and use of wind energy is being commenced recently. The overall economical and/or usable potential of the listed renewable energy sources is at a level of 68 Mtoe/year (TUSIAD,1998). The overall annual electricity production potential of renewable energy sources is 486.3 billon kWh economically. Solar energy, geothermal energy and wind energy potentials are not used or used scarcely. The most used renewable energy source in Turkey is hydraulic energy. Today, the economical hydroelectric potential of Turkey is 129.9 billion kWh and 35% (45.930 GWh) of it is operative, 8% (10.518 GWh) of it is under construction and 57% (73.459 GWh) of it is at project level Table 2.
www.intechopen.com

Renewable Energy and Coal Use in Turkey
73
Renewable Energy Source Gross Technical Economic available
Hydropower (MW) (billion kWh/year)
107 500
430
53 730
215
36652 129.9
Geothermal Heat (MW)
(Mtoe/year) Electricity (MW)
(billion kWh/year)
31 500
- 4 500
-
7 500 5.4 500
-
2 843 1.8 350 1.4
Solar Heat + electricity (MW)
(billion kWh/year) (Mtoe/year)
111 500 x 103
977 000 80 000
1 400 000
6 105 500
116 000
305 25
Wind Electricity (MW)
(billion kWh/year)
220 000
400
115 000
290
20 000
50
Classic Biomass Fuel (Mtoe/year)
Modern Biomass Fuel (Mtoe/year)
30
90
10
40
7
25
Table 2. Potential of Renewable Energy Sources (MENR,2009)
4. Coal and energy
4.1 Energy production based on coal The coal production culture in Turkey was introduced with the exploration of hard coal by Uzun Mehmet in Köseağzı quarter of Kestaneci village in Zonguldak province on 8th November 1829. Up to date, hard coal has been produced in Turkey. There is no definite information about the first use of lignite. It is known that lignite was being produced in many locations in Turkey, especially in Soma -Kütahya (Yılmaz, 2008). Hard coal is used intensively in industry and heating and especially in electricity production. Lignite coals are used mostly for electricity production since its calorific value is low. The share of coal in overall primary energy production was 31% (lignite 12%, hard coal 19%) in 1970, and it increased to 46% (lignite 38%, hard coal 8%) in 1990 with an increase rate of 48%. In 2009, the share of coal in total primary energy sources has increased and reached to 57% (lignite 53%, hard coal 4%) as shown in Fig 14. The primary energy production of Turkey has been limited and the largest share in this increase belonged to lignite. It is hope that this rate of percentage increase will continue in the following years. On the other hand, the share of coal in overall consumption was 24% (lignite 9%, hard coal 15%) in 1970, and it increased to 31%
www.intechopen.com

Sustainable Growth and Applications in Renewable Energy Sources
74
(lignite 19%, hard coal 12%) in 1990 with an increase rate of 16%. In 2009, the share of coal in total primary energy sources decreased and reached to 29% (lignite15%, hard coal 14%) (Fig. 15). Turkey’s primary energy consumption is higher than energy production. In other words, the increase rate of primary energy consumption is about 6 times of that of the production. And Turkey consumes 6 times of its production. If this rate increased in the following years, Turkey would become an import dependent country in terms of energy in the following years (Arıoğlu, Yılmaz, 2002a, 2002b,2002c; MENR, 2009; Yılmaz 2008).
19 20 19 18 19 18 17 16 15 14 13 13 13 11 11 10 9 8 9 8 8 7 6 7 6 5 5 5 4 4 4 5 4 5 4 5 5 4 4 4
12 13 15 16
17 18 19 20 23
20 23
25 26 30
32
38 39 40
36
42
38
36 39 37 39 40 40 42 44 44 44
45
42 41
39
41
44
50
53 533133 34 34
35 36 37 3638
3436
3839
41
43
48 48 49
45
50
46
4345
4446 45 45
4748 48 48
50
4745
4346
49
54
57 57
0
5
10
15
20
25
30
35
40
45
50
55
60
65
1970
1971
1972
1973
1974
1975
1976
1977
1978
1979
1980
1981
1982
1983
1984
1985
1986
1987
1988
1989
1990
1991
1992
1993
1994
1995
1996
1997
1998
1999
2000
2001
2002
2003
2004
2005
2006
2007
2008
2009
% o
f tot
al p
rodu
ctio
n
LIGNITE
HARD COAL
Coal in total production
Fig. 14. During of the period 1970 and 2009, development of the share of coal energy sources in primary energy production (data from MENR, 1970-2009)
15 1413
12 1211
108 8 8
7 8 76 6 6 5 5 5 4 4 3 3 3 3 2 2 2 2 1 1 2 1 1 1 1 1 1 1 1
0 0
0 0 0
0 1
1 1 2 2 1 2 3 3 4 4 5
6 5
8 9 8
7 7 7 9 10 11
9 11
8 10
12 13 12 13 14 12 13
9
10 10
1111
1314
17
2217 20
1920
19
17 18 1716
17 17
17
16
1514
1211
11
12 13 1515
24 2423
2122
2221
20 20
22 22 2223
25
27
3031
30
28
3030
32
30
2727
2627
29 29
2828
25 25 2526
24
2628 28
30
0
5
10
15
20
25
30
35
1970
1971
1972
1973
1974
1975
1976
1977
1978
1979
1980
1981
1982
1983
1984
1985
1986
1987
1988
1989
1990
1991
1992
1993
1994
1995
1996
1997
1998
1999
2000
2001
2002
2003
2004
2005
2006
2007
2008
2009
% o
f tot
al c
onsu
mpt
ion
LIGNITE (indigenous)
HARD COAL (indigenous)HARD COAL (iimported)
Fig. 15. During the period of 1970 -2009 development of share of coal in primary energy consumption (data from MENR, 1970-2009)
www.intechopen.com

Renewable Energy and Coal Use in Turkey
75
4.2 Coal potential, production and consumption Turkey has an important potential from the point of view of coal reserves (Fig. 16). Apart from the hard coal and lignite reserves, asphaltite, bituminous shale and peat reserves are also present in the country. Turkey’s significant hard coal basin exists in Zonguldak province which is on the Western Back Sea Region. The total reserve (ready + proven + probable + possible) is about 1.3 billion ton (Table 3). Hard coal reserves are distributed into five districts. Distributions of total reserves among these five districts are: Ereğli 34 million tons; Zonguldak 884 million tons; Amasra 408 million tons; Kurucaşile 1 million tons; Azdavay 5 million tons. The calorific value of the hard coal differs from 6.500 to 6.650 kcal/kg (Table 3) (TTK, 2004,2009; TKI, 2004,2009).
BİNGÖL
KAHRAMANMARA Ş
SİVAS
ÇORUM
MUĞLA
DENİZLİ
KÜTAHYAESKİŞEHİR
ANKARA
BOLU
KONYA
BURSAÇANAKKALE
BALIKES İR
MANİSA
AYDIN
M A R M A R AD E N İZ İ
iSTANBULTEKİRDAĞ
B L A C K S E A
M E D I T E R R A N E A N S E A
4.9Billion ton
1.4Billion ton
666Million ton
438Million ton
386Million ton
80Million ton
254Million ton
275Million ton
30Million ton
29 Million ton
82Million ton
100Million ton
38Million ton
104Million ton
6Million ton
3Million ton
340Million ton
323Million ton
435Million ton
ADANA
1.3Billion ton
HARD COAL
LIGNITE
Fig. 16. Distribution of hard coal and lignite reserves of Turkey
Location RESERVES (1000 TON) Calorific value, kCal/kg
Province Dictrict Proven Probable Possible Total
Zonguldak Ereğli 11.241 15.86 7.883 34.984 6650 Zonguldak Center 351.272 294.043 239.029 884.345 6650 Bartın Amasra 172.107 115.052 121.535 408.694 6000 Bartın Kurucaşile 1 1 6500 Kastamonu Azdavay 5.593 5.593 6500
TOPLAM 534.62 431.548 368.447 1.334.615 -
Table 3. Distribution of hard coal reserves of Turkey (MENR 2010)
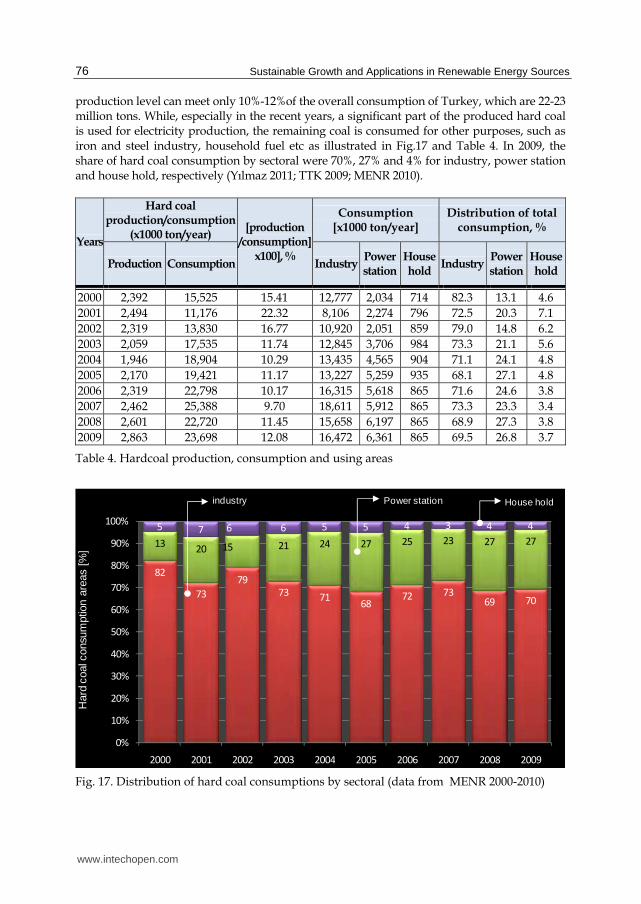
Hard coal Production is maintained under very difficult geological conditions. The production depth reached 600-1000 m in some regions. Such difficult working conditions caused that the unit costs increased and this affected the competitive power of the country in world's markets. In addition, the expected increase in production could not be achieved and contrary to expectations the production was decreased to 3 million tons from 9 million tons (Table 4). This
www.intechopen.com
Sustainable Growth and Applications in Renewable Energy Sources
76
production level can meet only 10%-12%of the overall consumption of Turkey, which are 22-23 million tons. While, especially in the recent years, a significant part of the produced hard coal is used for electricity production, the remaining coal is consumed for other purposes, such as iron and steel industry, household fuel etc as illustrated in Fig.17 and Table 4. In 2009, the share of hard coal consumption by sectoral were 70%, 27% and 4% for industry, power station and house hold, respectively (Yılmaz 2011; TTK 2009; MENR 2010).
Years
Hard coal production/consumption
(x1000 ton/year) [production
/consumption] x100], %
Consumption [x1000 ton/year]
Distribution of total consumption, %
Production Consumption Industry Power station
House hold
Industry Power station
House hold
2000 2,392 15,525 15.41 12,777 2,034 714 82.3 13.1 4.6 2001 2,494 11,176 22.32 8,106 2,274 796 72.5 20.3 7.1 2002 2,319 13,830 16.77 10,920 2,051 859 79.0 14.8 6.2 2003 2,059 17,535 11.74 12,845 3,706 984 73.3 21.1 5.6 2004 1,946 18,904 10.29 13,435 4,565 904 71.1 24.1 4.8 2005 2,170 19,421 11.17 13,227 5,259 935 68.1 27.1 4.8 2006 2,319 22,798 10.17 16,315 5,618 865 71.6 24.6 3.8 2007 2,462 25,388 9.70 18,611 5,912 865 73.3 23.3 3.4 2008 2,601 22,720 11.45 15,658 6,197 865 68.9 27.3 3.8 2009 2,863 23,698 12.08 16,472 6,361 865 69.5 26.8 3.7
Table 4. Hardcoal production, consumption and using areas
82
73
79
73 7168
72 7369 70
1320 15 21 24 27 25 23 27 27
5 7 6 6 5 5 4 3 4 4
0%
10%
20%
30%
40%
50%
60%
70%
80%
90%
100%
2000 2001 2002 2003 2004 2005 2006 2007 2008 2009
Power stationindustry House hold
Har
d co
al c
onsu
mpt
ion
area
s [%
]
Fig. 17. Distribution of hard coal consumptions by sectoral (data from MENR 2000-2010)
www.intechopen.com

Renewable Energy and Coal Use in Turkey
77
Lignite reserves constitute the large portion of total coal reserves. Lignite deposits dispersed all over the country (Yılmaz, 2006). The most important known lignite deposits reserves are located in Afşin Elbistan, Muğla Soma, Tunçbilik, Seyitömer, Beypazarı and Sivas regions (Fig. 16). About 40% (4.9 billion tons) lignite reserve is located around Afsin-Elbistan which is in the southeast of the Turkey (Yılmaz and Uslu 2007). Although total lignite reserves were about 8.07 billion tons (TKI 2009; TKI, 2010), Turkey’s new total lignite reserves including proven, probable and possible reserves have reached about 11.4 billion tons after recent exploration activities. Turkey has a share of 2.5% in the world reserves and 8.2% in the world production (Yılmaz , 2011). Distribution of the lignite reserves in the Turkey is shown in Table 5 (TKI, 2004; 2010). Turkey’s coal deposits are operated by companies which are Turkish Hard Coal Enterprise (TTK), Turkish Coal Enterprises (TKI) and the Electricity Generation Company (EUAS) and Private sectors. TTK is authorized for hard coal production, processing and distribution. More than half of lignite reserves are produced by TKI. Production of remains are belongs to private companies and EUAS for we in power plants. The distribution of reserves is as follows: TKI 21.5 %, EUAŞ 42 %, MTA 23% and Private sector 13.5% (Table 5.) (Yılmaz 2008, EUAS 2004,2009; Anaç 2003).
LIGNITE
Coal field Reserves (1000 TON)
Ration in total, %
Calorific value,
Kcal/kg Proven Probable Possible Total
EÜAŞ 4.718 104 - 4.822 42.0
1031-4900
TKİ 2.239 218 1 2.458 21.5 MTA 1.803 685 123 2.611 23.0 Private sector
1.077 337 138 1.554 13.5
TOPLAM 9837 1344 262 11.445 100
ASPHALTITE
Location Reserves (1000 TON) Calorific value,
Kcal/kg Province Dictrict Proven Probable Possible Total
Şırnak Silopi 31.812 16.21 1 49.022 5310 Şırnak Merkez 7.724 13.26 6.3 27.284 5330
TOPLAM 39.536 29.47 7.3 76.306 -
Table 5. Distribution of Lignite and Asphaltite Reserves of Turkey (Data from, TTK, 2004; TKI, 2010).
The lignite mined from most lignite deposits is low calorific value lignite and the calorific value of 90% of them is between 1000 and 3000 Kcal/kg (Fig.18). In this context, a significant part of the lignite production is used for electricity production (Fig 19.). Lignite production depends on electricity production. Lignite production reached to 76 million ton/year especially in 1970 and 2009 term, when the lignite production is very effective in electricity production. Its production decreased to 45 million ton/year after 2000, since its use in electricity production repressed after 2000. The overall lignite consumption can be met by the domestic production (Fig.19.)
www.intechopen.com

Sustainable Growth and Applications in Renewable Energy Sources
78
Lignite production depends on electricity production While 1% of produced lignite in 1970 was used in power stations, 5% was used as house hold and industry. In 2000, the share of lignite consumption by sectoral were 82% and 18% power station and house hold and industry, respectively. In 2009, the share of the power station in lignite consumption increased and reached to 83% (Fig. 19).
<1000 Kcal/kg
%3.2
1000-2000 Kcal/kg
%65.6
2000-3000 Kcal/kg
%24.3
3000-4000
Kcal/kg
%5.1
>4000 Kcal/kg
%1.8
Fig. 18. Lignite by calorific value
1 26
20
30
40
5348 51
6166
63
57
9
15
16
13
11
8
10
12
13
6
9
15
35
46
52
64
57
60
7275 76
6
9
15
36
44
53
61
58
61
72
76 76
0.0
10.0
20.0
30.0
40.0
50.0
60.0
70.0
80.0
1970 1975 1980 1985 1990 1995 2000 2005 2006 2007 2008 2009
Lig
nite
pro
duct
ion/
cons
umpt
ion
[Mill
ion
ton/
year
]
Lignite production Lignite consumption
Power station
House hold+industry
Fig. 19. Lignite production/consumption and consumption areas (data from TKI, 1970-2009)
www.intechopen.com

Renewable Energy and Coal Use in Turkey
79
5. Future projection
The primary energy production–consumption of Turkey and distribution of electricity production of Turkey by sources projected for the years 2015 and 2020 are given in Figs. 20–21. No major change is seen or foreseen in the development of share of domestic energy sources in primary energy production. It is planned that this rate will be 32% in 2015 and 30% in 2020. In other words, 70% of the primary energy production of Turkey will be dependent on imports. On the other hand, renewable energy sources and hard coal constitute 90% of the primary energy consumption; 5–10 points increase is foreseen in the share of coal in primary energy production 2015 and 2020. It is planned that this share will be 54% and 61%, respectively, for the years. The dependence on imported energy sources for electricity production projected for the years 2015 and 2020 are 47% and 50%, respectively (Fig.22). It is projected that the share of coal in electricity production will increase to 28% in 2020 and no significant change is planned in electricity production using renewable sources and it is projected that this share will decrease to 23% in 2020. In other words, Turkey does not plan to introduce any expansion in energy production until 2020 when compared with today’s conditions according to its energy projections (Yılmaz,2008; TPAO 2006).
13 14 16 17 17 18
11 99 10 9 9
73 74 72 71 68 70
27 2628 29
3230
0
10
20
30
40
50
60
70
80
90
100
2006 2007 2008 2009 2015 2020
% o
f to
tal
con
sum
pti
on
FUTURE
Total Indigenous energy sources
Imported energy sources:Oil, Natural gas, Hard coal
COAL
RENEWABLE
Fig. 20. Projection of development of the share of domestic energy sources in overall primary energy consumption (data from MENR, 2006,2010).
www.intechopen.com

Sustainable Growth and Applications in Renewable Energy Sources
80
49 54 57 57 54 61
39 35 32 33
28
30
12 11 11 10 18
9
0%
20%
40%
60%
80%
100%
2006 2007 2008 2009 2015 2020
Coal (Hard coal+lignite)
% o
f to
tal
Renewable
Other
FUTURE
Fig. 21. Projection of distribution of domestic energy sources in overall primary energy production (data from MENR, 2006,2010).
20 22 23 22 24 28
25 19 17 1923
23
5559 60 59
53 50
4541 40 41
4750
0
10
20
30
40
50
60
70
80
90
100
2006 2007 2008 2009 2015 2020
% o
f to
tal
co
nsu
mp
tio
n
FUTURE
Total Indigenous energy sources
Imported energy sources:Oil, Natural gas, Hard coal
COAL=Hard coal+Lignite
RENEWABLE
Fig. 22. Projection of development of domestic energy sources in electricity production (data from MENR, 2006,2010).
6. Discussion and conclusion
Turkey imports about 70% of the energy sources it uses in primary energy consumption. This percentage is 59% for electricity production. The imported energy sources are oil, natural gas and hard coal. The load of imports on Turkey’s economy as of 2000-2009 is illustrated in Fig. 23. Turkey spent 29 billion dollars overall for energy imports in 2009. This amount constitutes 29% of the overall exports in 2009 and 21% of the overall imports. In other words, Turkey spends approximately one-third of the income it obtains from overall exports for energy imports. Oil and natural gas are the most imported energy sources with a
www.intechopen.com

Renewable Energy and Coal Use in Turkey
81
percentage of 89% (26 billion dollars) of the overall energy source imports and it is followed by hard coal with a percentage of 11% (3 billion dollars). The incredible increase rate of natural gas consumption in the recent years constitutes an important expense item in the imports items of Turkey. More importantly, use of natural gas in industry and electricity production makes Turkey completely dependent on the foreign countries in terms of energy security. Especially Turkey’s supplying over 50% of its electricity production from natural gas causes very severe security problems and Turkey should question this issue very seriously. On the other hand, although Turkey has sufficient hard coal reserves, it increasingly imports hard coal in order to consume it in industry and electricity production due to some reasons such as production difficulties and insufficient investments. Turkey should immediately take action in order to meet such requirements from its own sources. It should not be expected that the domestic production covers the consumption within a very short time, but it should be aimed at meeting or minimizing the deficit between the production and import within a long time. On the other hand, although Turkey has sufficient lignite reserves for electricity production, importing hard coal for this purpose is a completely strategic mistake (Yılmaz,2008).
2000 2001 2002 2003 2004 2005 2006 2007 2008 2009
Import 55 41 52 69 98 117 140 170 202 141
Export 28 31 36 47 63 73 86 107 132 102
Energy imp/import. [%] 17 20 18 17 15 18 21 20 24 21
55
41
52
69
98
117
140
170
202
141
2831
36
47
63
73
86
107
132
102
17 20 18 17 15 18 21 2024 21
0
50
100
150
200
250
Imp
ort
-Ex
po
rt, [
Bil
lio
n $
]
Fig. 23. Load of energy source imports on Turkey’s economy
www.intechopen.com
Sustainable Growth and Applications in Renewable Energy Sources
82
The largest energy sources of Turkey are coal and renewable energy. Turkey should use these energy sources in areas where it can substitute them for oil and natural gas. The first of these areas is electricity production. In projections of Turkey (Fig. 22), it is proposed that 50% of the electricity production will be imported. It is planned that the overall demand for electricity will be 500 billion kWh in 2020. However, there is a potential for producing reliable electricity from renewable energy sources (480 billion kWh) and lignite thermal power plants (100 billion kWh), which are operative and of which the projects are completed, economically (Table 2.). In other words, Turkey has a potential for producing electricity it demands by using only its own sources. It is obligatory to comply with the environmental pollution and emission limits in use and production of coal. The required measures in this regard has been taken in most of the operative power plants and the studies for taking such measures continue rapidly in the other power plants. It is vital for Turkey to take operating the coal reserves by using environment-friendly technologies and utilizing its sources at the highest level among its priorities (Yılmaz, 2008).
7. References
Anaç, S. (2003). The Place of Coal in Energy Policies in Turkey, Turkish Coal Enterprise, Available from http://www.tki.gov.tr.
Arıoğlu E. (ed).(1994). General Outlook to Turkish Lignite Sector, Privatisation in the World and Turkey, Turkish Mine Workers Union Publication, Ankara.
Arıoğlu, E.(1996) General Outlook For Worldwide Hard Coal Mining and The Evaluation of The Zonguldak Coal Enterprise/TURKEY, Privatization in The UK and Turkey With Particular Reference to The Coal Sector (Ed.M.Dartan), Marmara University European Community Institute, Istanbul, May
Arıoğlu, E., & Yılmaz, A.O. (1997a). A Short Statistical Evaluation of Turkish Lignite Sector During 1983–1993. Istanbul Branch of Mining Engineers Chamber of Turkey, Working Report No. 2, Istanbul.
Arıoğlu, E; Yılmaz, A.O. (1997b). Turkish Economy With Macro Economic Indications and Statistical Evaluation of Turkish Mining Sector, Istanbul Branch of Mining Engineers Chamber of Turkey, Working Report No :5, Istanbul
Arıoğlu, E., & Yılmaz, A.O. (2002a). General Outlook for Worldwide Hard Coal Mining and the Evaluation of the Zonguldak Coal Enterprise. Proceedings of the 13th coal
congress of Turkey, Zonguldak Branch of Mining Engineers Chambers of Turkey, Zonguldak,
Arıoğlu, E, & Yılmaz, A.O. (2002b). Realities in Zonguldak coal basin. Zonguldak Branch of
Mining Engineers Chamber of Turkey, Zonguldak, Arıoğlu, E; & Yılmaz, A.O. (2002c). Evaluation of Turkish Lignite Mining, Tunçbilek
Municipality 2nd Lignite Festival, Tunçbilek, Kütahya. BP ( 2009, 2010 ). Statistical Review of World energy, Annual Report. Available from
http://www.bp.com
www.intechopen.com

Renewable Energy and Coal Use in Turkey
83
EUAS.(2004,2009). Statistic Data, Electricity Generation Co. Inc. Available from http://www.euas.gov.tr.
MENR. (1970,2000,2002, 2006, 2009, 2010). Ministry of Energy and Natural Resources (MENR), Energy report of Turkey, Ankara. Available from http://www.enerji.gov.tr.
SIS. (2003,2004). State Institute of Statistics yearbook of Turkey, Prime Ministry, Available from http:// www.tuik.gov.tr / [in Turkish and English]. Republic of Turkey, Ankara.
TEIAS. (1970, 2004, 2009). Electricity Generation-Transmission Statistics of Turkey, Turkish Electricity Transmission Co. General Management Rpc Department, Ankara. Available from: http://www.teias.gov.tr/ [in Turkish and English].
TKI. (2004,2009, 2010). Turkish Coal Enterprises. Coal (lignite) Annual Sector Report. Available from: http://www.tki.gov.tr
TPAO(2006) Primary Energy Production–Consumption in Turkey. Available from http://petrol.tpao.gov.tr/ rprte/ energytr2.htmS.
TTK, (2004, 2009). Turkish Hard Coal Enterprises, Annual Reports, Zonguldak. Available from: http://www.taskomuru.gov.tr
TUSIAD. 1998. The Evaluation of Turkey’s Energy Strategies Toward to 21st Century. Publication Number TUSIAD-T/98-12/239, İstanbul.
Yılmaz, A.O, & Arıoğlu E.(2003). The Importance of Lignite in Energy Production and Turkish Coal Enterprise. In: Proceedings of the 18th International Mining Congress
and Fair of Turkey. Mining Engineers Chamber of Turkey. Antalya. Yılmaz, A. O, & Aydıner, K. (2009). The Place of Hard Coal in Energy Supply Pattern of
Turkey, Energy Sources, part B, 4, 179-189. Yılmaz, A. O., & Uslu, T.(2006). The Role of Coal in Energy Production—Consumption and
Sustainable Development of Turkey. Energy Policy, 35, 1117–1128. Yılmaz, A. O.& Uslu, T.(2007). Energy policies of Turkey During the Period 1923–2003.
Energy Policy, 35, 258–264. Yılmaz, A.O. &Uslu, T. & Savaş M.(2005). The Role of Coal in Sustainable Development of
Turkey, Turkish 5th Energy Symposium, Electricity Engineers Chamber of Turkey, Ankara.
Yılmaz, A.O.(2003). General Outlook to Turkish Energy Sector and the Importance of Coal in Energy Production. In: Turkish Fourth Energy Symposium, Electricity Engineers Chamber of Turkey, Ankara.
Yılmaz, A.O., (2004,2011) . Energy Statistics of Turkey, Unpublished Documents, Trabzon.
Yılmaz, A. O.(2006). Coal potential of Turkey: Coal and Energy, Energy Exploration
Exploitation ,Volume 24, Number 6, 371–390 Yılmaz, A.O.(2008). Renewable Energy and Coal Use in Turkey, Renewable Energy, 33, 950–
959. Yılmaz, A.O.(2009). Present Coal Potential of Turkey and Coal Usage in Electricity
Generation, Energy Sources, part B, 4, 135-144.
www.intechopen.com

Sustainable Growth and Applications in Renewable Energy Sources
84
Yılmaz, A.O.(2011), Evaluation of Turkish Lignite Mining, Tunçbilek Municipality 8rd Lignite
Festival, Tunçbilek, Kütahya.
www.intechopen.com

Sustainable Growth and Applications in Renewable EnergySourcesEdited by Dr. Majid Nayeripour
ISBN 978-953-307-408-5Hard cover, 338 pagesPublisher InTechPublished online 02, December, 2011Published in print edition December, 2011
InTech EuropeUniversity Campus STeP Ri Slavka Krautzeka 83/A 51000 Rijeka, Croatia Phone: +385 (51) 770 447 Fax: +385 (51) 686 166www.intechopen.com
InTech ChinaUnit 405, Office Block, Hotel Equatorial Shanghai No.65, Yan An Road (West), Shanghai, 200040, China
Phone: +86-21-62489820 Fax: +86-21-62489821
Worldwide attention to environmental issues combined with the energy crisis force us to reduce greenhouseemissions and increase the usage of renewable energy sources as a solution to providing an efficientenvironment. This book addresses the current issues of sustainable growth and applications in renewableenergy sources. The fifteen chapters of the book have been divided into two sections to organize theinformation accessible to readers. The book provides a variety of material, for instance on policies aiming atthe promotion of sustainable development and implementation aspects of RES.
How to referenceIn order to correctly reference this scholarly work, feel free to copy and paste the following:
Ali Osman Yılmaz (2011). Renewable Energy and Coal Use in Turkey, Sustainable Growth and Applications inRenewable Energy Sources, Dr. Majid Nayeripour (Ed.), ISBN: 978-953-307-408-5, InTech, Available from:http://www.intechopen.com/books/sustainable-growth-and-applications-in-renewable-energy-sources/renewable-energy-and-coal-use-in-turkey

© 2011 The Author(s). Licensee IntechOpen. This is an open access articledistributed under the terms of the Creative Commons Attribution 3.0License, which permits unrestricted use, distribution, and reproduction inany medium, provided the original work is properly cited.