Embed Size (px)
Citation preview
Renewable energy policy
in Germany and the European Union
Dr. Martin Schöpe
German Federal Ministry for the Environment,
Nature Conservation and Nuclear Safety
JREF Conference,
Tokyo, 9th March 2012
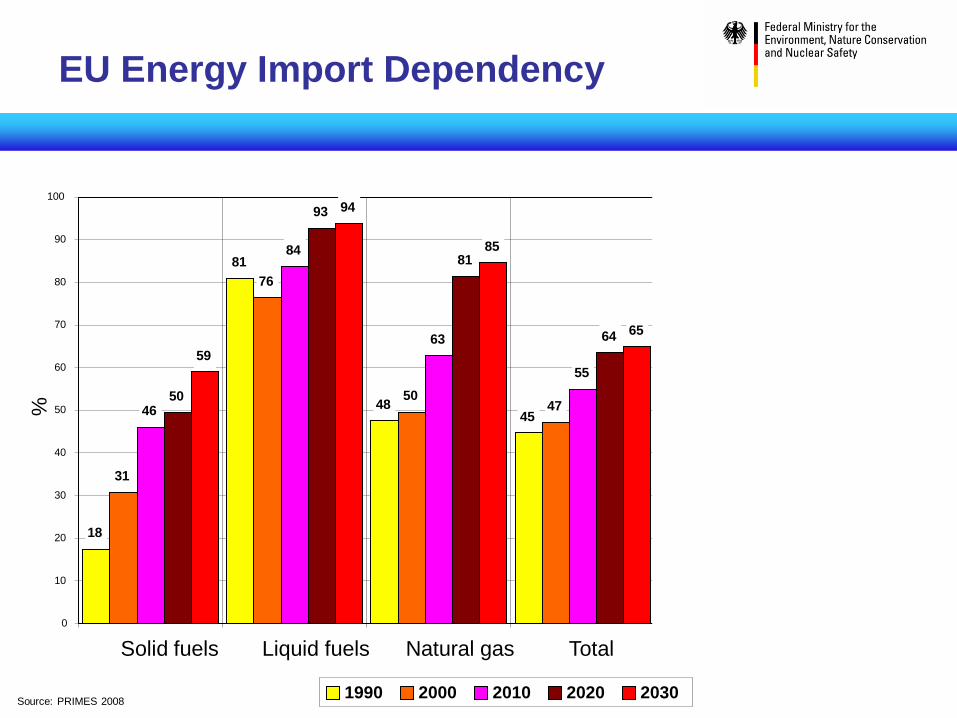
EU Energy Import Dependency
Import dependency in EU-25 according to a business as usual case
18
81
48 45
48
29 31
76
50 47
50
30
46
84
63
55 57
44
50
93
81
64 65
52
59
94
85
65 67
54
0
10
20
30
40
50
60
70
80
90
100
Solid fuels Liquid fuels Natural gas Total
Source: PRIMES 2008
%
1990 2000 2010 2020 2030
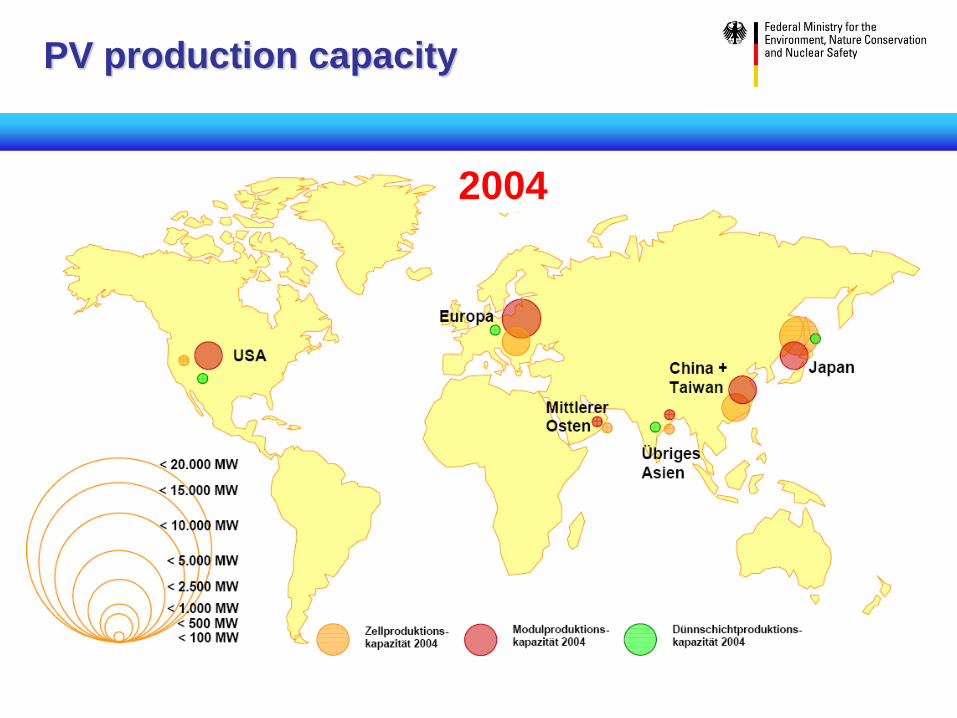
2004
PV production capacity

2010
$1.52
2014
$1.05
1979
1992 1998
2002
2004
2011
$1.3-1.5
2015
$1.08
$0.10
$1.00
$10.00
$100.00
1 10 100 1,000 10,000 100,000 1,000,000
Welt
weit
erl
Mo
du
ldu
rch
sch
nit
tsp
reis
(2010$U
S/W
p)
Cumulative Production Volume (MW)
- Kristallin
- Dünnfilm
Poli-Si-knappheit
Source: Mints, Navigant, Bloomberg NEF, First Solar, NREL PV cost
Model
22% cost reduction with every doubling of capacity
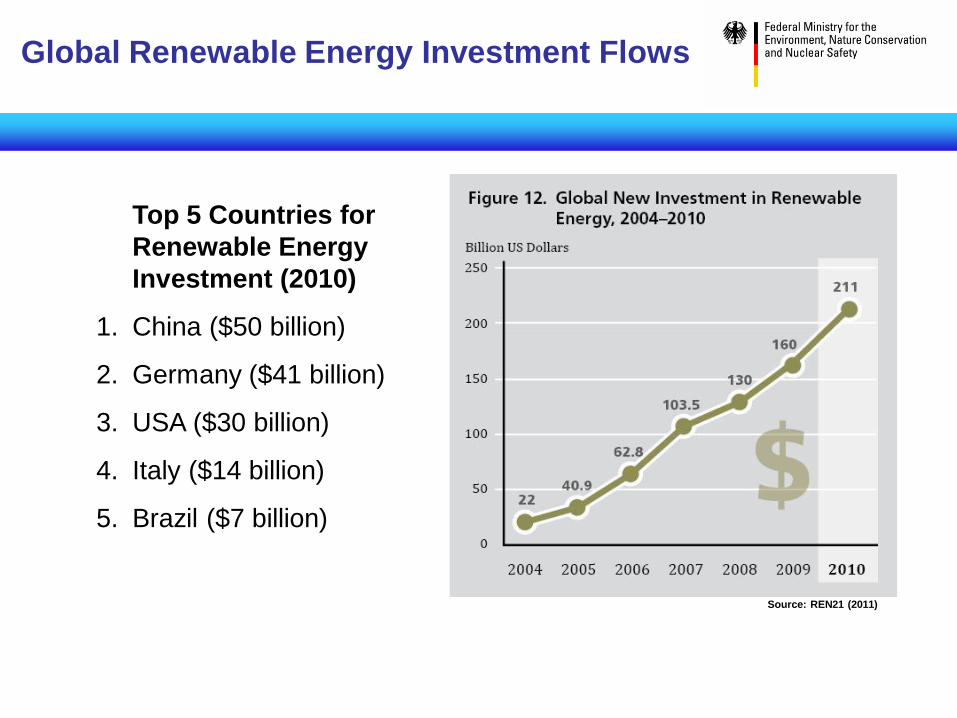
Source: REN21 (2011)
Global Renewable Energy Investment Flows
Top 5 Countries for
Renewable Energy
Investment (2010)
1. China ($50 billion)
2. Germany ($41 billion)
3. USA ($30 billion)
4. Italy ($14 billion)
5. Brazil ($7 billion)
6
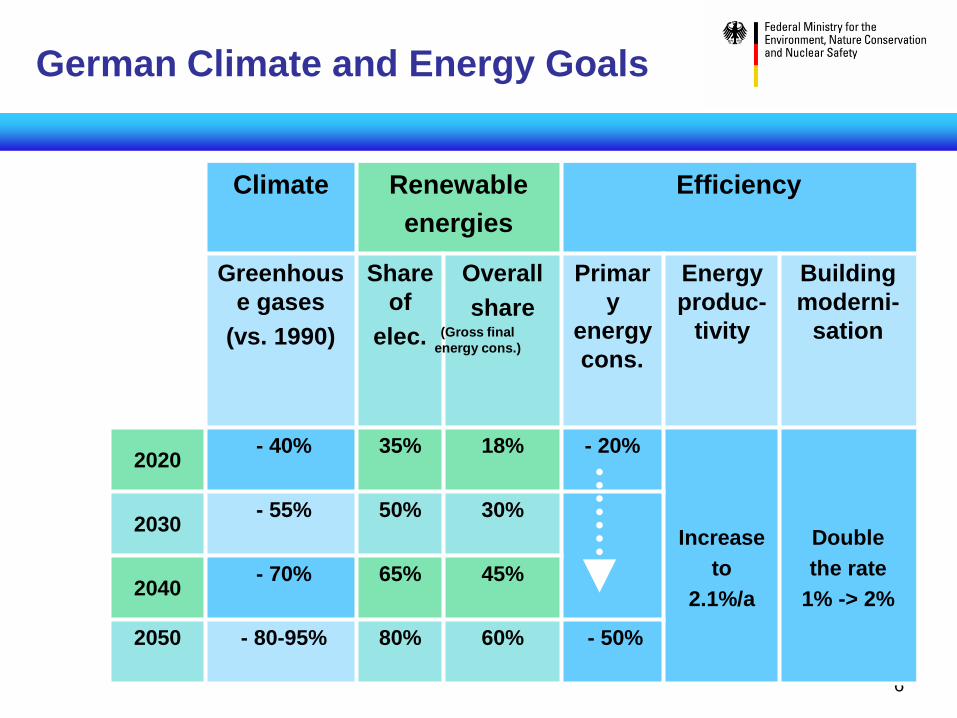
Climate Renewable
energies
Efficiency
Greenhous
e gases
(vs. 1990)
Share
of
elec.
Overall
share
Primar
y
energy
cons.
Energy
produc-
tivity
Building
moderni-
sation
2020 - 40% 35% 18% - 20%
Increase
to
2.1%/a
Double
the rate
1% -> 2%
2030 - 55% 50% 30%
2040 - 70% 65% 45%
2050 - 80-95% 80% 60% - 50%
(Gross final
energy cons.)
German Climate and Energy Goals
7
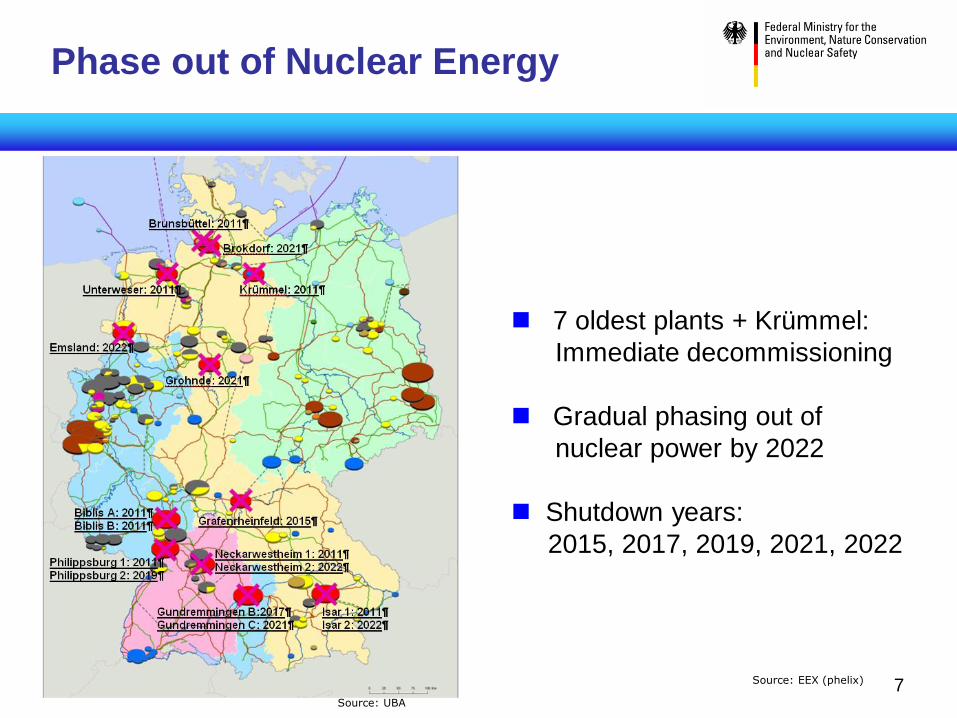
Phase out of Nuclear Energy
7 oldest plants + Krümmel:
Immediate decommissioning
Gradual phasing out of
nuclear power by 2022
Shutdown years:
2015, 2017, 2019, 2021, 2022
Source: UBA
Source: EEX (phelix)
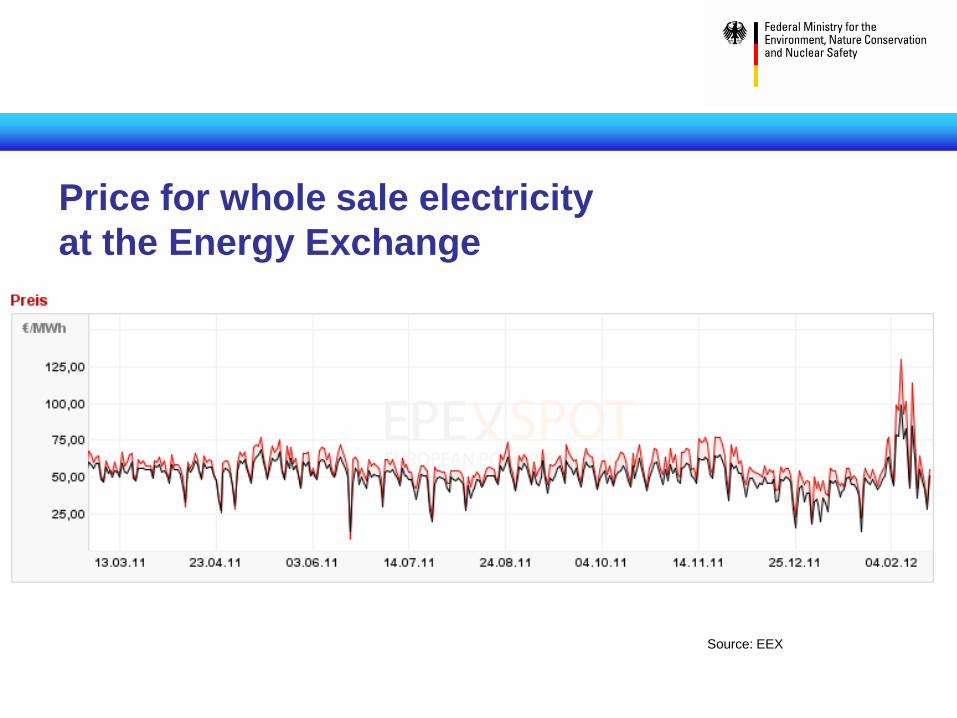
Price for whole sale electricity
at the Energy Exchange
Source: EEX
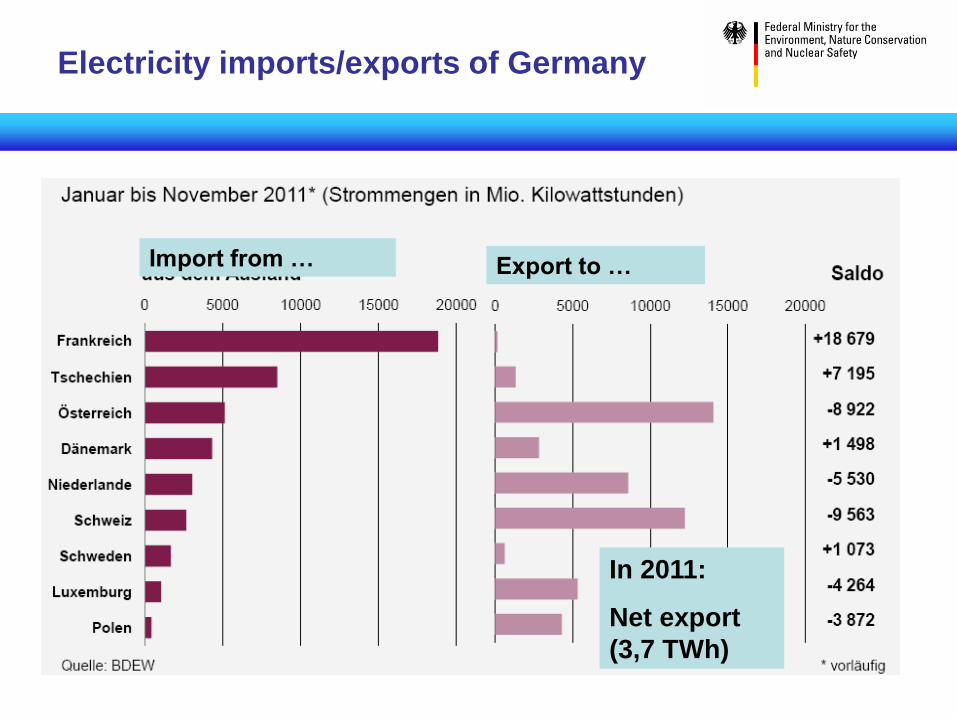
Electricity imports/exports of Germany
Import from … Export to … Import from …
In 2011:
Net export
(3,7 TWh)
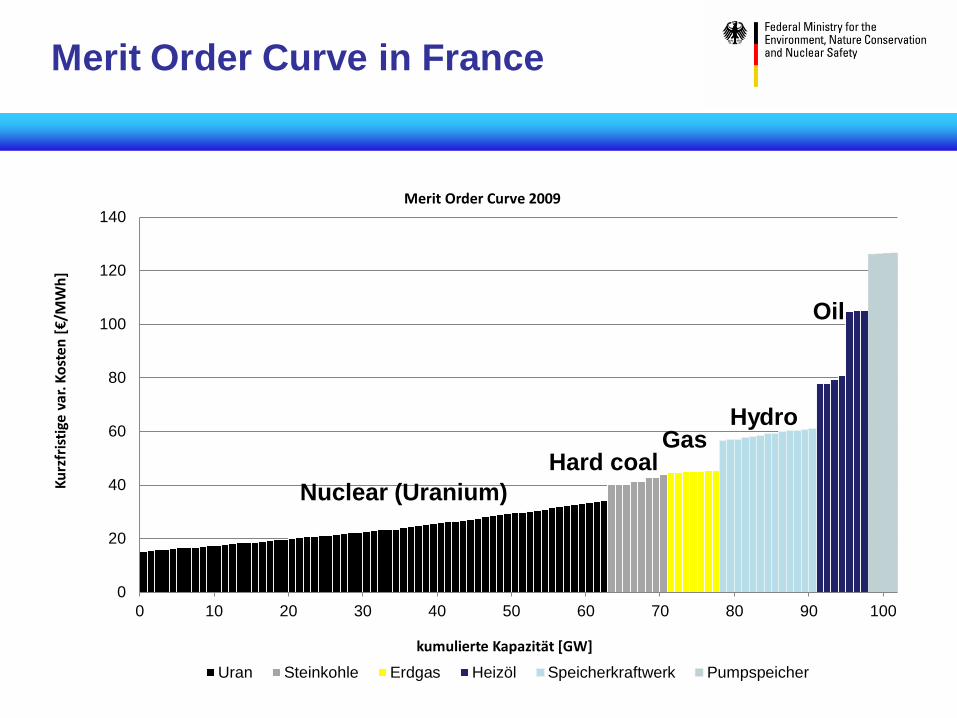
Merit Order Curve in France
0
20
40
60
80
100
120
140
0 10 20 30 40 50 60 70 80 90 100
Ku
rzfr
isti
ge v
ar. K
ost
en [€/
MW
h]
kumulierte Kapazität [GW]
Merit Order Curve 2009
Uran Steinkohle Erdgas Heizöl Speicherkraftwerk Pumpspeicher
Nuclear (Uranium)
Hard coal Gas
Hydro
Oil
0%
10%
20%
30%
40%
50%
60%
70%
80%
Au
str
ia
Be
lgiu
m
Bu
lga
ria
Cypru
s
Czech
Re
pu
blic
Den
ma
rk
Esto
nia
Fin
lan
d
Fra
nce
Ge
rma
ny
Gre
ece
Hun
ga
ry
Irela
nd
Ita
ly
La
tvia
Lith
ua
nia
Lu
xe
mb
ou
rg
Ma
lta
Neth
erla
nd
s
Po
lan
d
Po
rtug
al
Rom
an
ia
Slo
va
kia
Slo
ve
nia
Sp
ain
Sw
ed
en
Unite
d K
ing
do
m
EU
27
RE
S in
te
rms o
f fin
al e
ne
rgy [
% o
f d
em
an
d]
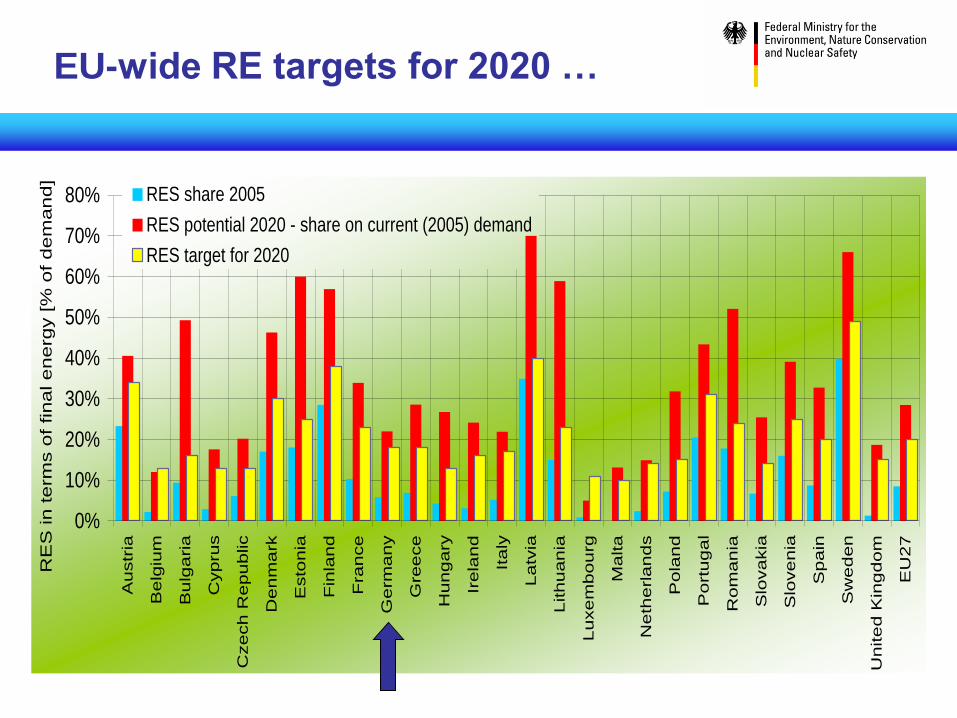
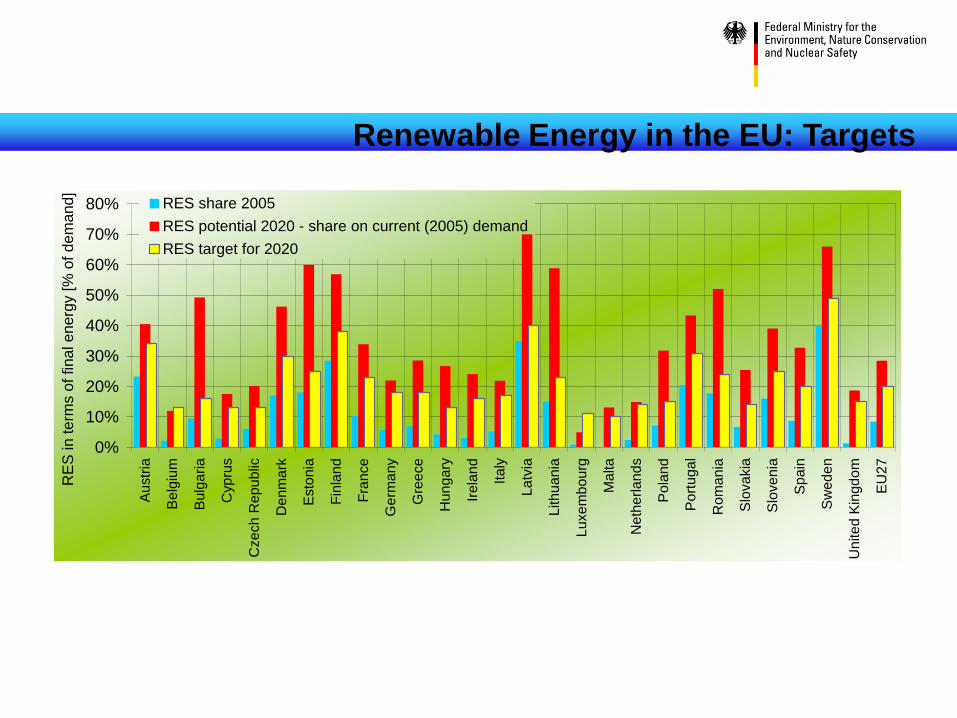
RES share 2005
RES potential 2020 - share on current (2005) demand
RES target for 2020
EU-wide RE targets for 2020 …
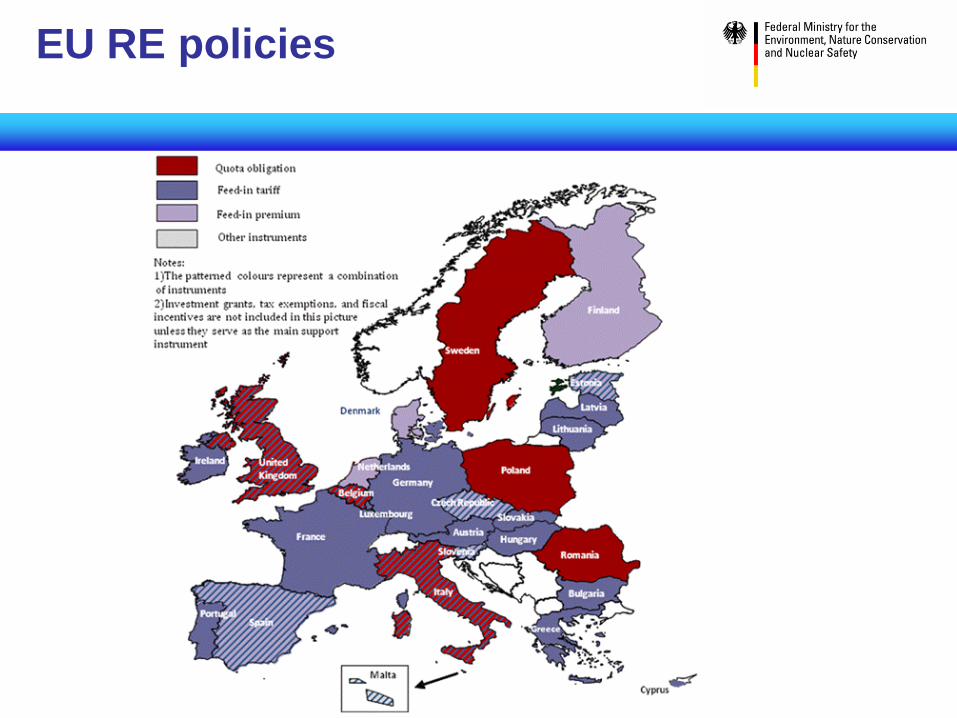
EU RE policies
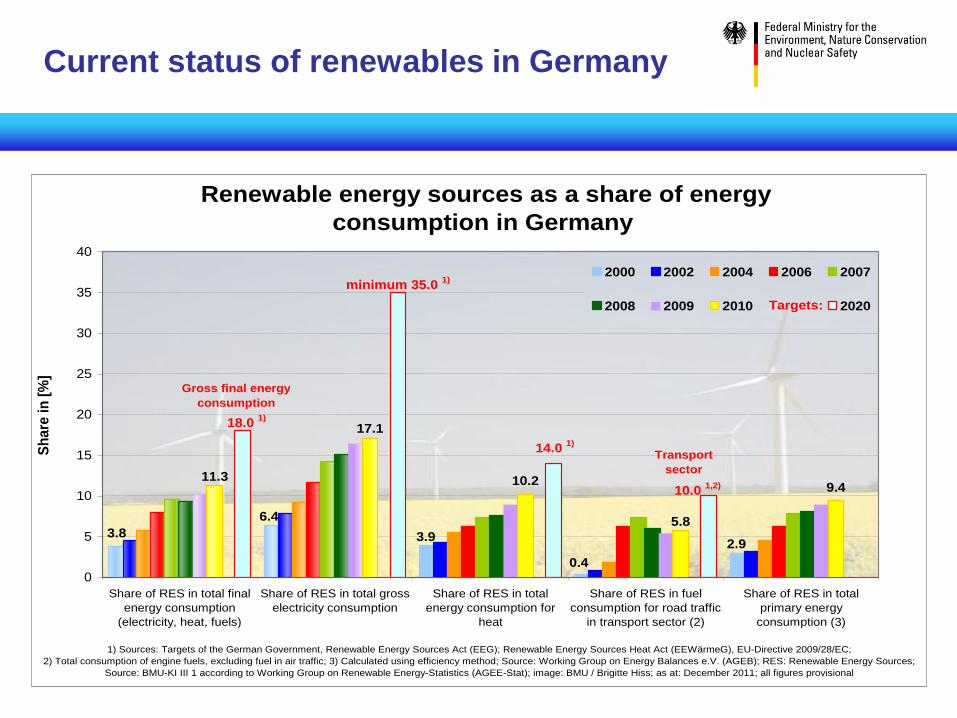
Current status of renewables in Germany
Renewable energy sources as a share of energy
consumption in Germany
3.8
9.4
2.9
0.4
3.9
6.4
10.2
5.8
17.1
11.3
18.0 1)
minimum 35.0 1)
14.0 1)
10.0 1,2)
0
5
10
15
20
25
30
35
40
Share of RES in total final
energy consumption
(electricity, heat, fuels)
Share of RES in total gross
electricity consumption
Share of RES in total
energy consumption for
heat
Share of RES in fuel
consumption for road traffic
in transport sector (2)
Share of RES in total
primary energy
consumption (3)
Sh
are
in
[%
]
2000 2002 2004 2006 2007
2008 2009 2010 2020
1) Sources: Targets of the German Government, Renewable Energy Sources Act (EEG); Renewable Energy Sources Heat Act (EEWärmeG), EU-Directive 2009/28/EC;
2) Total consumption of engine fuels, excluding fuel in air traffic; 3) Calculated using efficiency method; Source: Working Group on Energy Balances e.V. (AGEB); RES: Renewable Energy Sources;
Source: BMU-KI III 1 according to Working Group on Renewable Energy-Statistics (AGEE-Stat); image: BMU / Brigitte Hiss; as at: December 2011; all figures provisional
Targets:
Gross final energy
consumption
Transport
sector
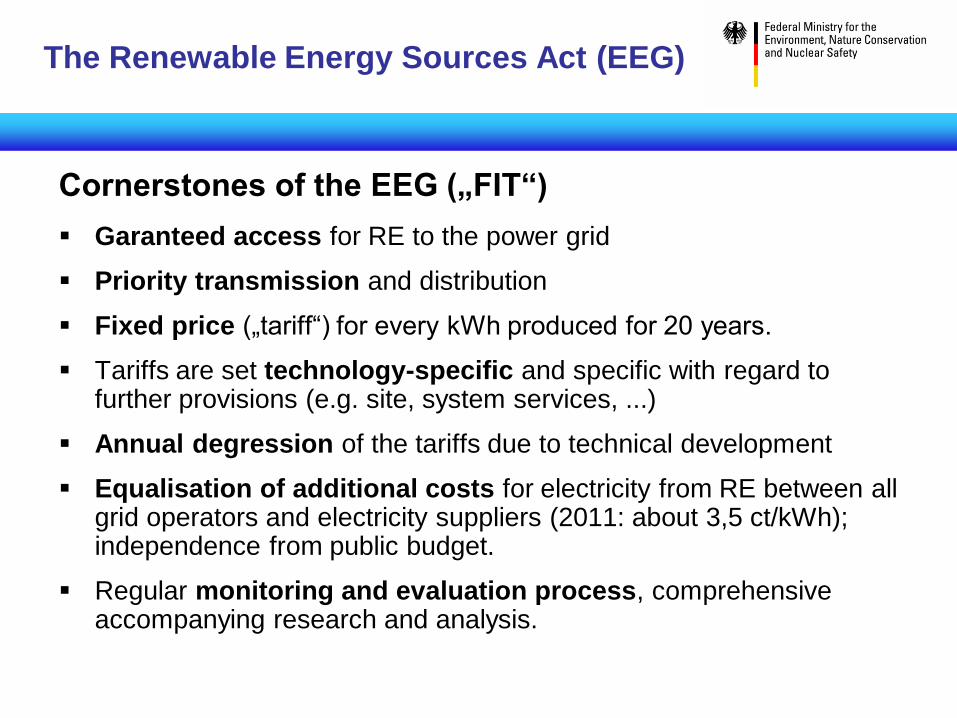
The Renewable Energy Sources Act (EEG)
Cornerstones of the EEG („FIT“)
Garanteed access for RE to the power grid
Priority transmission and distribution
Fixed price („tariff“) for every kWh produced for 20 years.
Tariffs are set technology-specific and specific with regard to further provisions (e.g. site, system services, ...)
Annual degression of the tariffs due to technical development
Equalisation of additional costs for electricity from RE between all grid operators and electricity suppliers (2011: about 3,5 ct/kWh); independence from public budget.
Regular monitoring and evaluation process, comprehensive accompanying research and analysis.
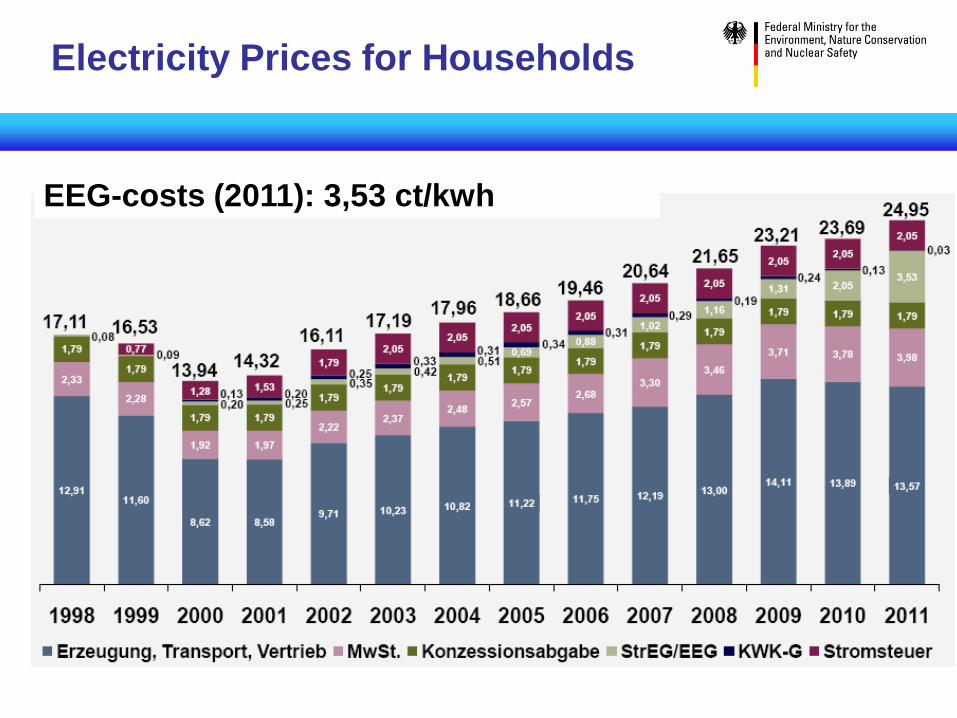
Electricity Prices for Households
EEG-costs (2011): 3,53 ct/kwh
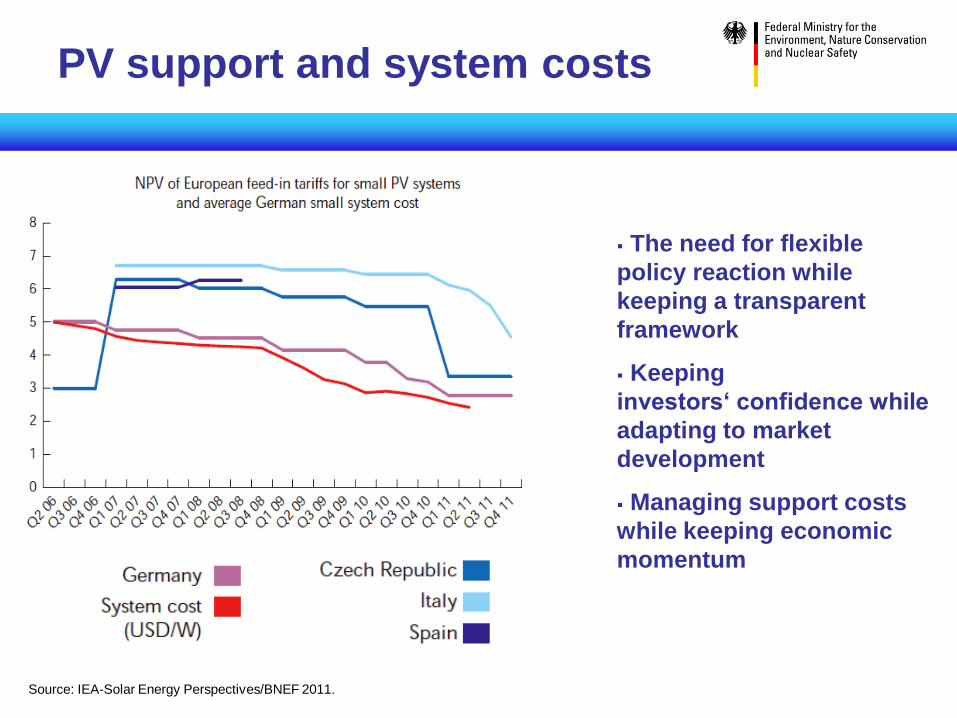
PV support and system costs
Source: IEA-Solar Energy Perspectives/BNEF 2011.
The need for flexible
policy reaction while
keeping a transparent
framework
Keeping
investors‘ confidence while
adapting to market
development
Managing support costs
while keeping economic
momentum
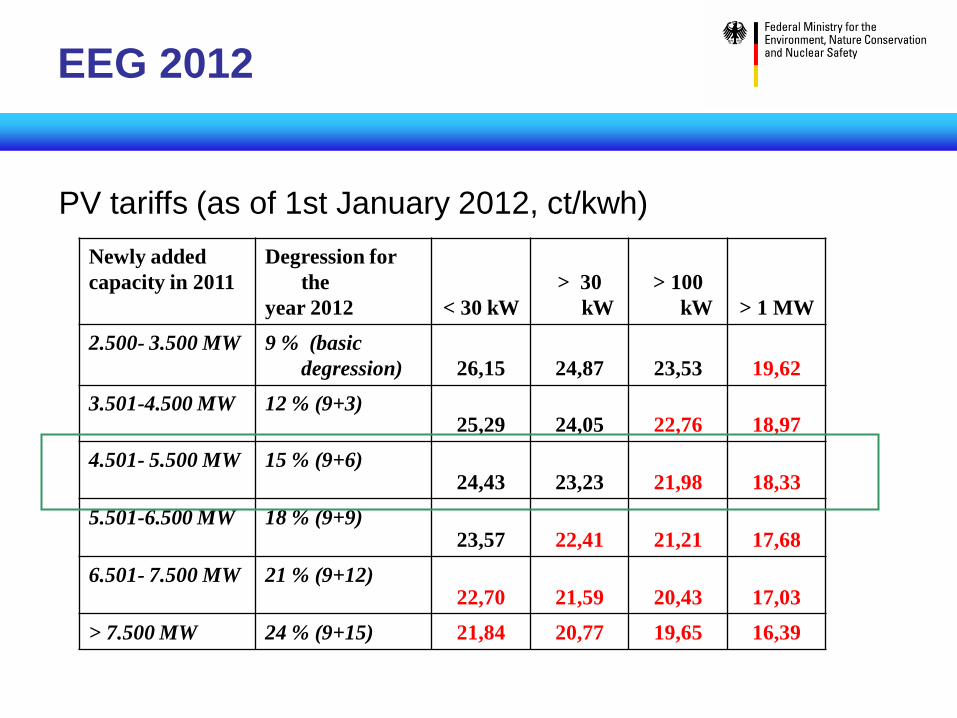
EEG 2012
Newly added
capacity in 2011
Degression for
the
year 2012 < 30 kW
> 30
kW
> 100
kW > 1 MW
2.500- 3.500 MW 9 % (basic
degression) 26,15 24,87 23,53 19,62
3.501-4.500 MW 12 % (9+3) 25,29 24,05 22,76 18,97
4.501- 5.500 MW 15 % (9+6) 24,43 23,23 21,98 18,33
5.501-6.500 MW 18 % (9+9) 23,57 22,41 21,21 17,68
6.501- 7.500 MW 21 % (9+12) 22,70 21,59 20,43 17,03
> 7.500 MW 24 % (9+15) 21,84 20,77 19,65 16,39
PV tariffs (as of 1st January 2012, ct/kwh)
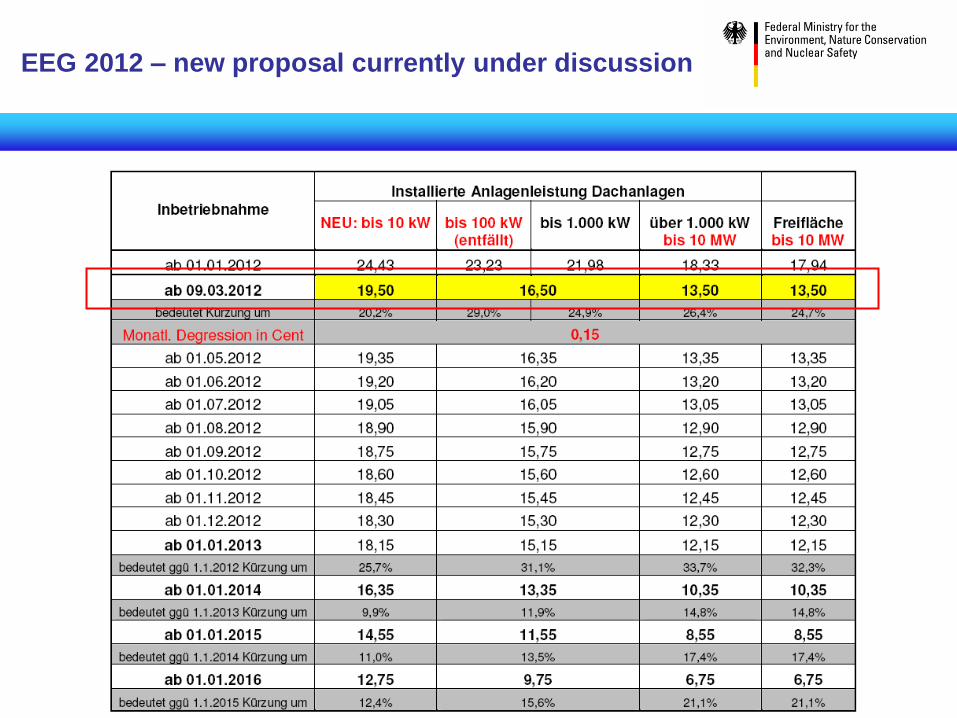
EEG 2012 – new proposal currently under discussion
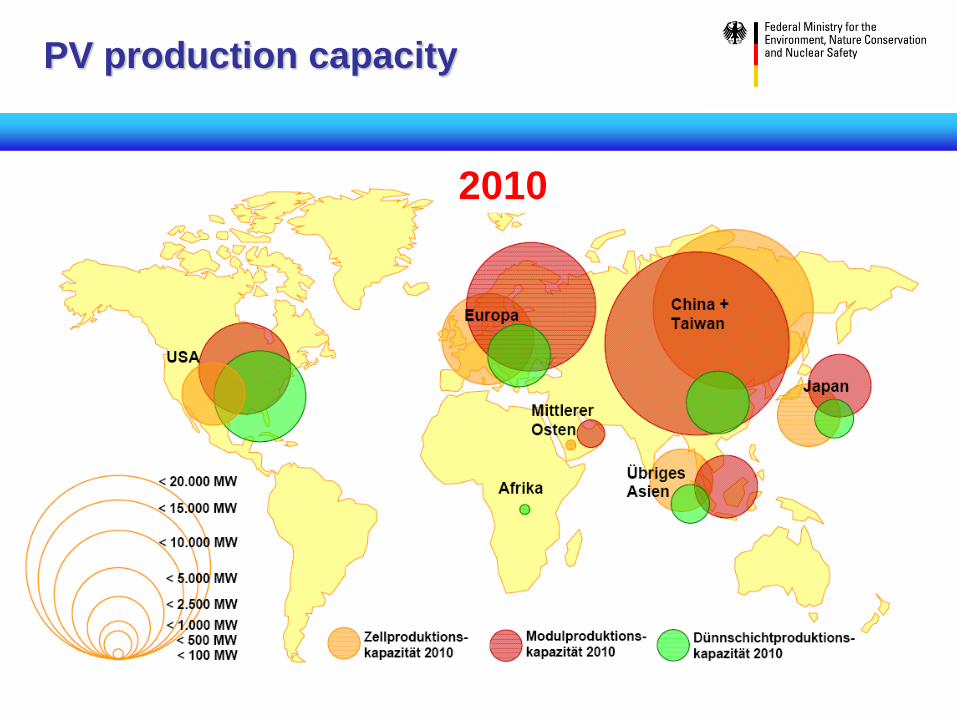
2010
PV production capacity
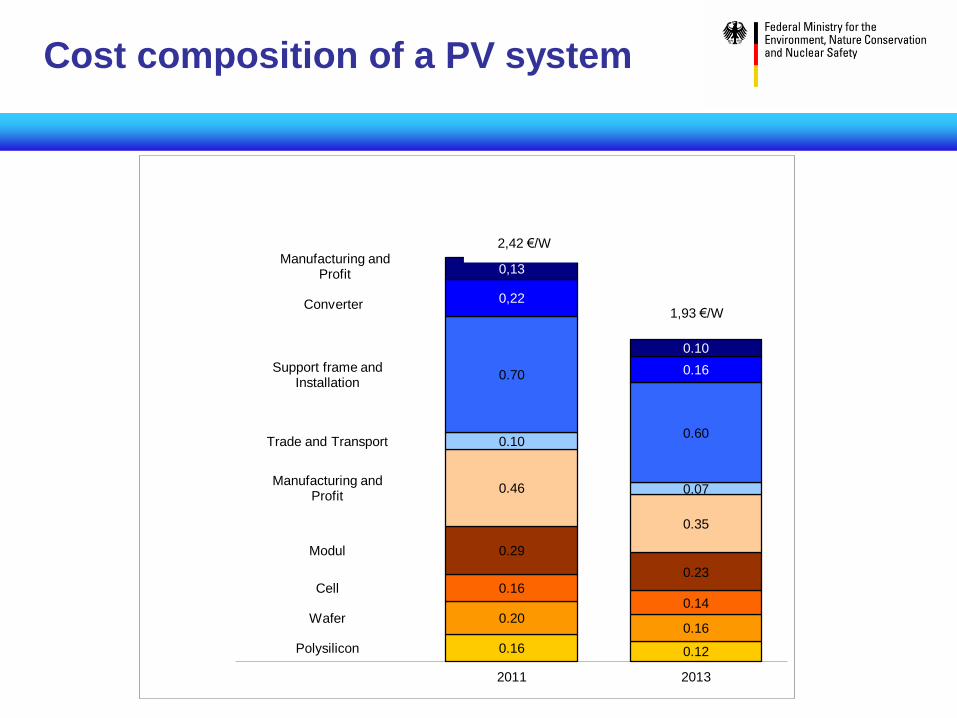
Polysilicon 0.16 0.12
Wafer 0.20 0.16
Cell 0.16 0.14
Modul 0.29
0.23
Manufacturing and Profit
0.46
0.35
Trade and Transport 0.10
0.07
Support frame and Installation
0.70
0.60
Converter 0,22
0.16
Manufacturing and Profit 0,13
0.10
0
0.5
1
1.5
2
2.5
3
2011 2013
1,93 €/W
2,42 €/W
Cost composition of a PV system
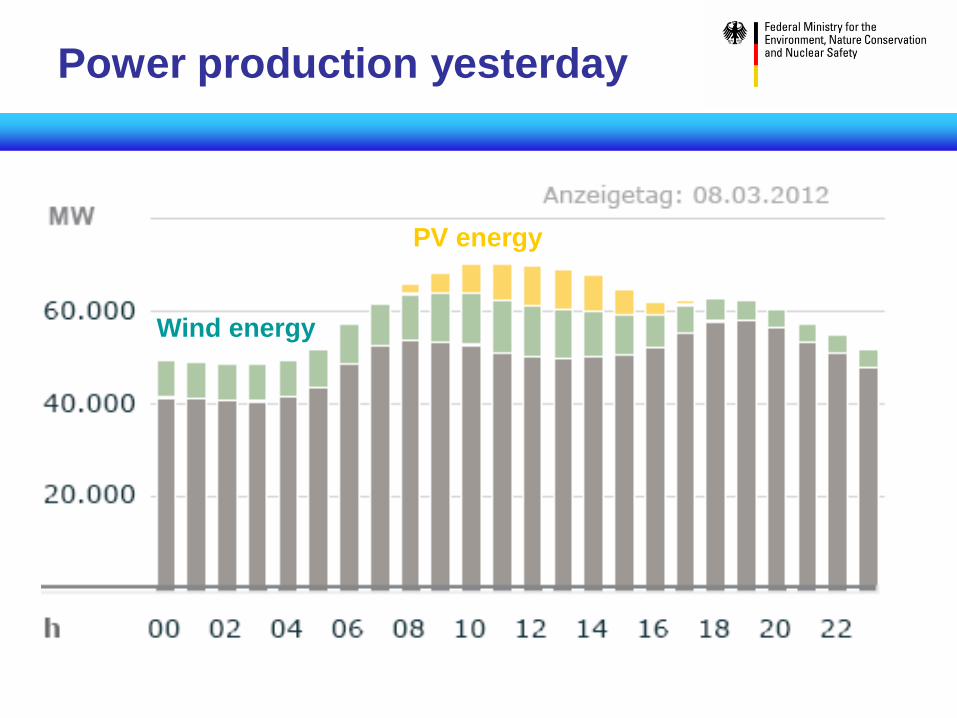
Power production yesterday
Wind energy
PV energy
22
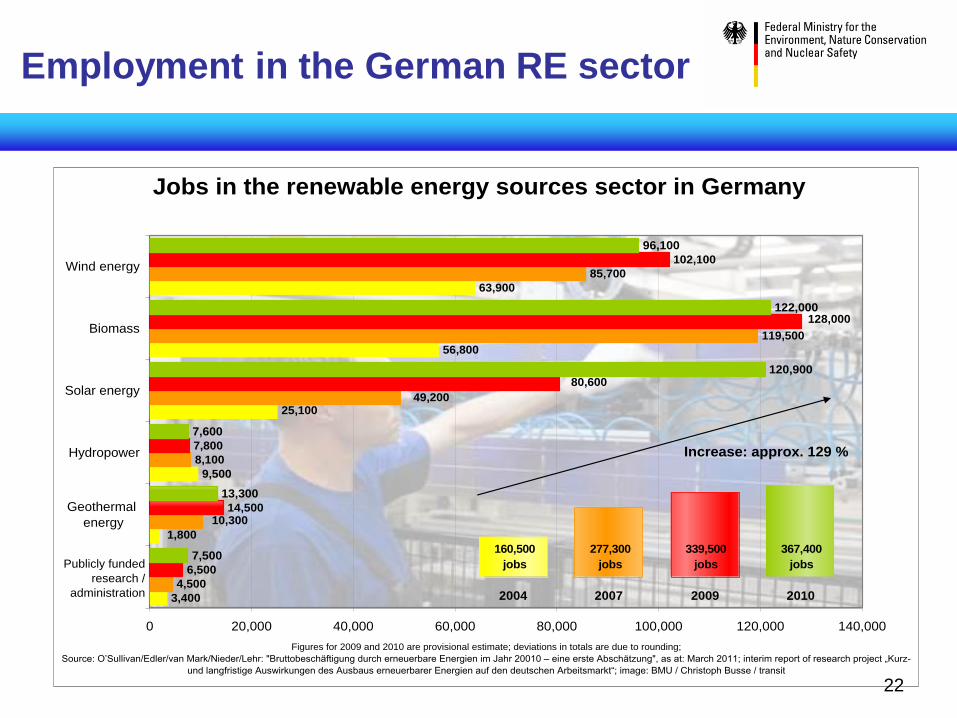
Employment in the German RE sector
Jobs in the renewable energy sources sector in Germany
3,400
9,500
56,800
63,900
4,500
8,100
119,500
85,700
6,500
14,500
7,800
102,100
7,500
13,300
7,600
120,900
122,000
96,100
1,800
25,100
10,300
49,200
80,600
128,000
0 20,000 40,000 60,000 80,000 100,000 120,000 140,000
Geothermal
energy
Hydropower
Solar energy
Biomass
Wind energy
Increase: approx. 129 %
Figures for 2009 and 2010 are provisional estimate; deviations in totals are due to rounding;
Source: O’Sullivan/Edler/van Mark/Nieder/Lehr: "Bruttobeschäftigung durch erneuerbare Energien im Jahr 20010 – eine erste Abschätzung", as at: March 2011; interim report of research project „Kurz-
und langfristige Auswirkungen des Ausbaus erneuerbarer Energien auf den deutschen Arbeitsmarkt“; image: BMU / Christoph Busse / transit
Publicly funded
research /
administration 2004 2007 2009 2010
160,500
jobs
277,300
jobs
367,400
jobs
339,500
jobs
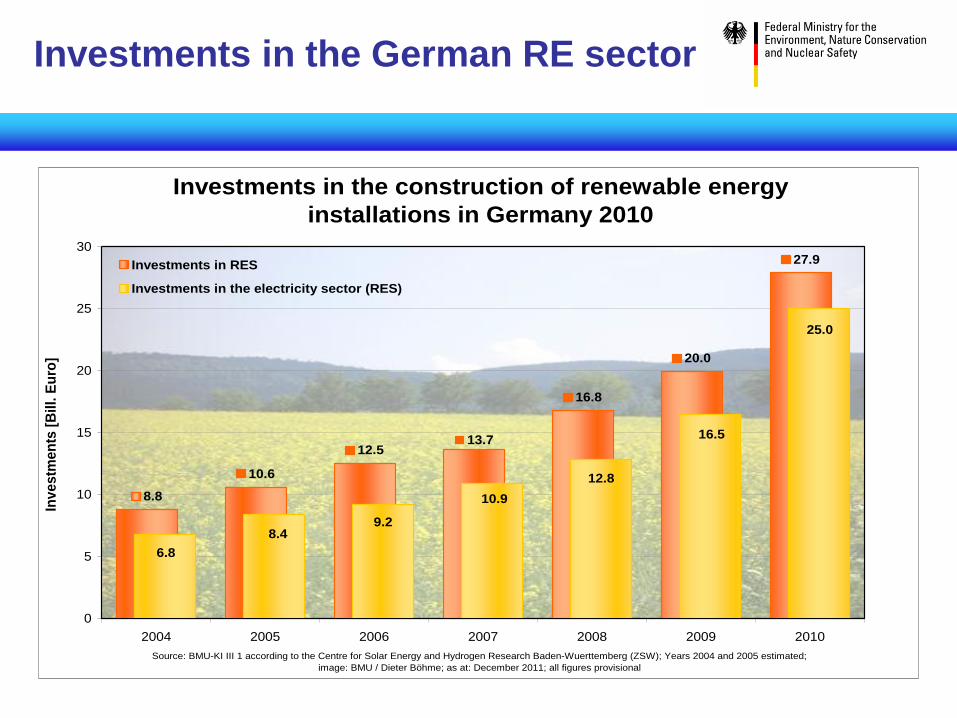
Investments in the German RE sector
Investments in the construction of renewable energy
installations in Germany 2010
8.8
10.6
12.5
16.8
20.0
27.9
13.7
25.0
16.5
12.8
6.8
8.4
10.9
9.2
0
5
10
15
20
25
30
2004 2005 2006 2007 2008 2009 2010
Inv
es
tme
nts
[B
ill.
Eu
ro]
Investments in RES
Investments in the electricity sector (RES)
Source: BMU-KI III 1 according to the Centre for Solar Energy and Hydrogen Research Baden-Wuerttemberg (ZSW); Years 2004 and 2005 estimated;
image: BMU / Dieter Böhme; as at: December 2011; all figures provisional
25
Thank you for your attention!
More Information:
www.bmu.de/english www.erneuerbare-energien.de/english
Appendix
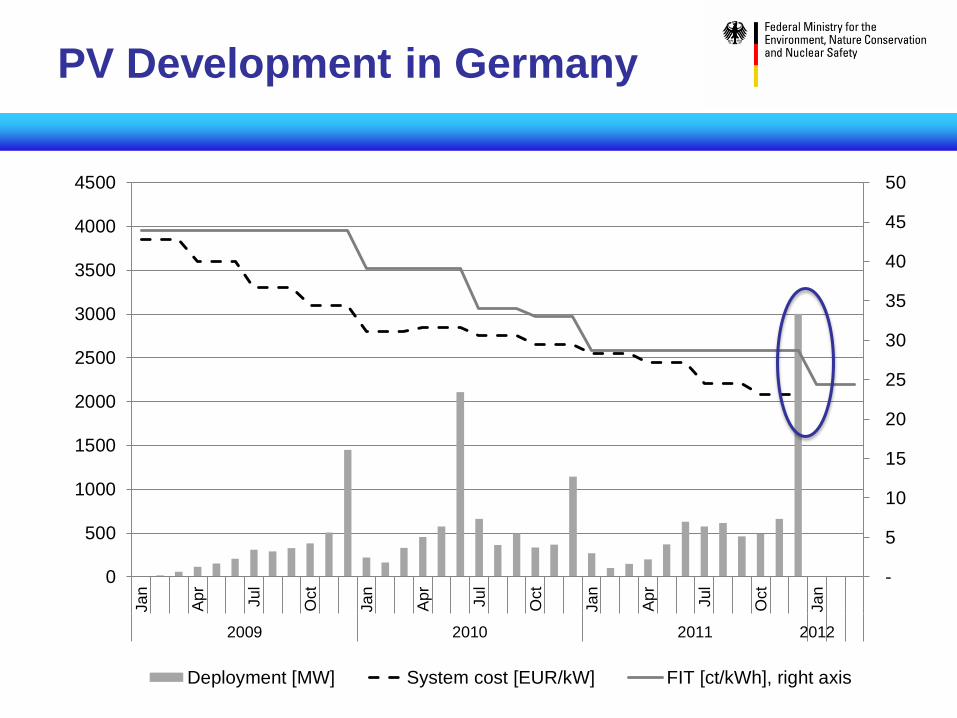
PV Development in Germany
-
5
10
15
20
25
30
35
40
45
50
0
500
1000
1500
2000
2500
3000
3500
4000
4500
Ja
n
Ap
r
Ju
l
Oct
Ja
n
Ap
r
Ju
l
Oct
Ja
n
Ap
r
Ju
l
Oct
Ja
n
2009 2010 2011 2012
Deployment [MW] System cost [EUR/kW] FIT [ct/kWh], right axis
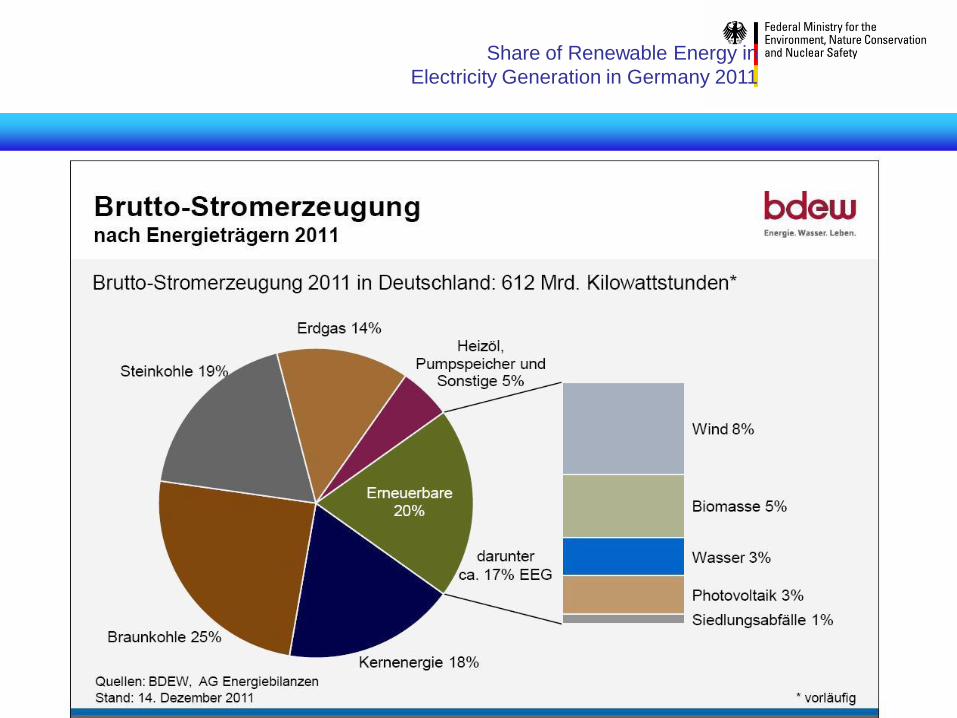
Share of Renewable Energy in
Electricity Generation in Germany 2011
Electricity
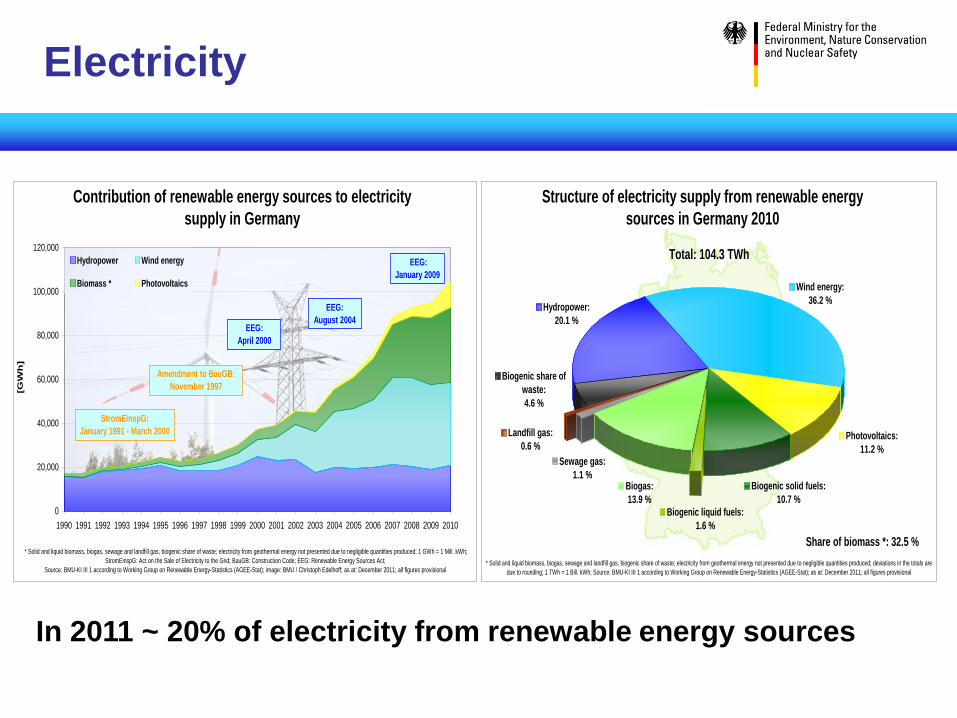
Contribution of renewable energy sources to electricity
supply in Germany
0
20,000
40,000
60,000
80,000
100,000
120,000
1990 1991 1992 1993 1994 1995 1996 1997 1998 1999 2000 2001 2002 2003 2004 2005 2006 2007 2008 2009 2010
[GW
h]
Hydropower Wind energy
Biomass * Photovoltaics
* Solid and liquid biomass, biogas, sewage and landfill gas, biogenic share of waste; electricity from geothermal energy not presented due to negligible quantities produced; 1 GWh = 1 Mill. kWh;
StromEinspG: Act on the Sale of Electricity to the Grid; BauGB: Construction Code; EEG: Renewable Energy Sources Act;
Source: BMU-KI III 1 according to Working Group on Renewable Energy-Statistics (AGEE-Stat); image: BMU / Christoph Edelhoff; as at: December 2011; all figures provisional
StromEinspG:
January 1991 - March 2000
Amendment to BauGB:
November 1997
EEG:
April 2000
EEG:
January 2009
EEG:
August 2004
Structure of electricity supply from renewable energy
sources in Germany 2010
Hydropower:
20.1 %
Wind energy:
36.2 %
Photovoltaics:
11.2 %
Biogenic solid fuels:
10.7 %
Biogenic liquid fuels:
1.6 %
Biogas:
13.9 %
Sewage gas:
1.1 %
Landfill gas:
0.6 %
Biogenic share of
waste:
4.6 %
* Solid and liquid biomass, biogas, sewage and landfill gas, biogenic share of waste; electricity from geothermal energy not presented due to negligible quantities produced; deviations in the totals are
due to rounding; 1 TWh = 1 Bill. kWh; Source: BMU-KI III 1 according to Working Group on Renewable Energy-Statistics (AGEE-Stat); as at: December 2011; all figures provisional
Share of biomass *: 32.5 %
Total: 104.3 TWh
In 2011 ~ 20% of electricity from renewable energy sources
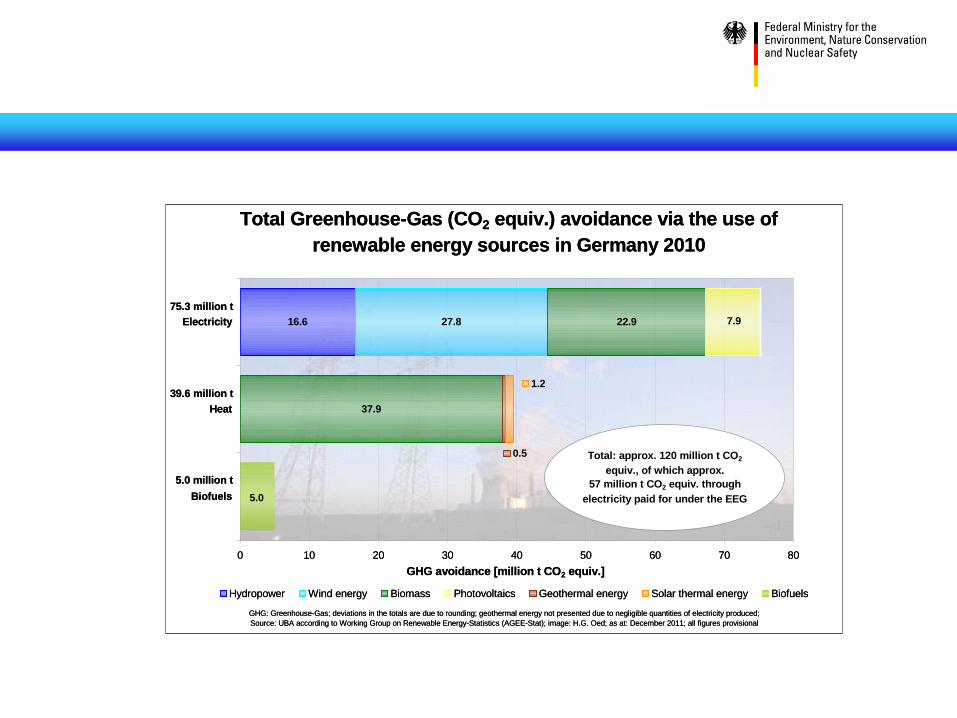
Total Greenhouse-Gas (CO2 equiv.) avoidance via the use of
renewable energy sources in Germany 2010
16.6 27.8
37.9
22.9 7.9
0.5
1.2
5.0
0 10 20 30 40 50 60 70 80
Biofuels
Heat
Electricity
GHG avoidance [million t CO2 equiv.]
Hydropower Wind energy Biomass Photovoltaics Geothermal energy Solar thermal energy Biofuels
75.3 million t
5.0 million t
39.6 million t
Total: approx. 120 million t CO2
equiv., of which approx.
57 million t CO2 equiv. through
electricity paid for under the EEG
GHG: Greenhouse-Gas; deviations in the totals are due to rounding; geothermal energy not presented due to negligible quantities of electricity produced;
Source: UBA according to Working Group on Renewable Energy-Statistics (AGEE-Stat); image: H.G. Oed; as at: December 2011; all figures provisional
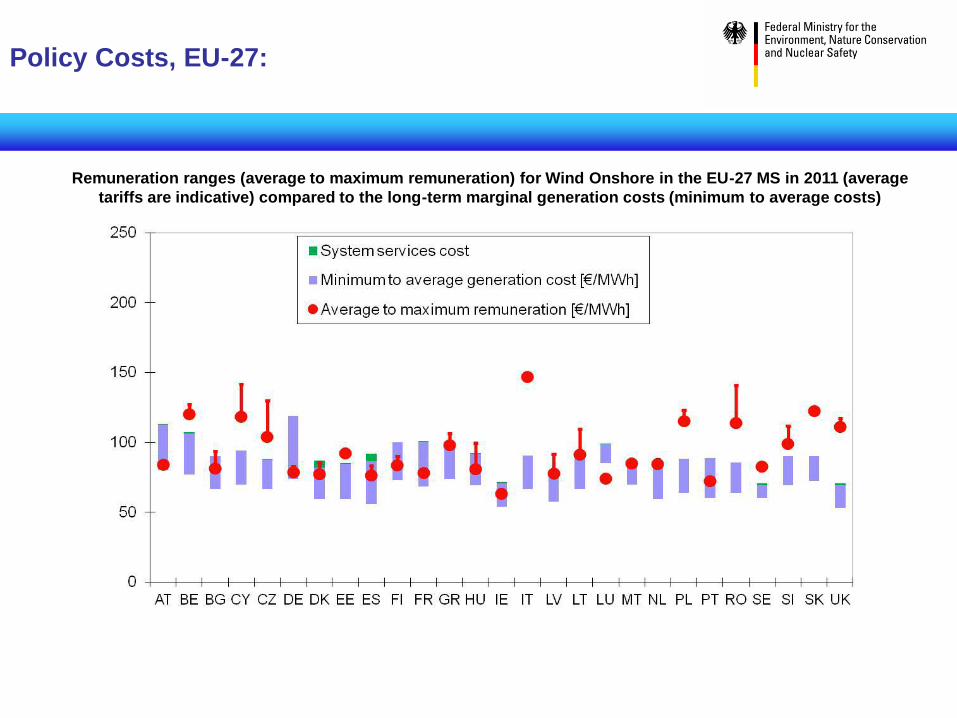
Policy Costs, EU-27:
Remuneration ranges (average to maximum remuneration) for Wind Onshore in the EU-27 MS in 2011 (average
tariffs are indicative) compared to the long-term marginal generation costs (minimum to average costs)
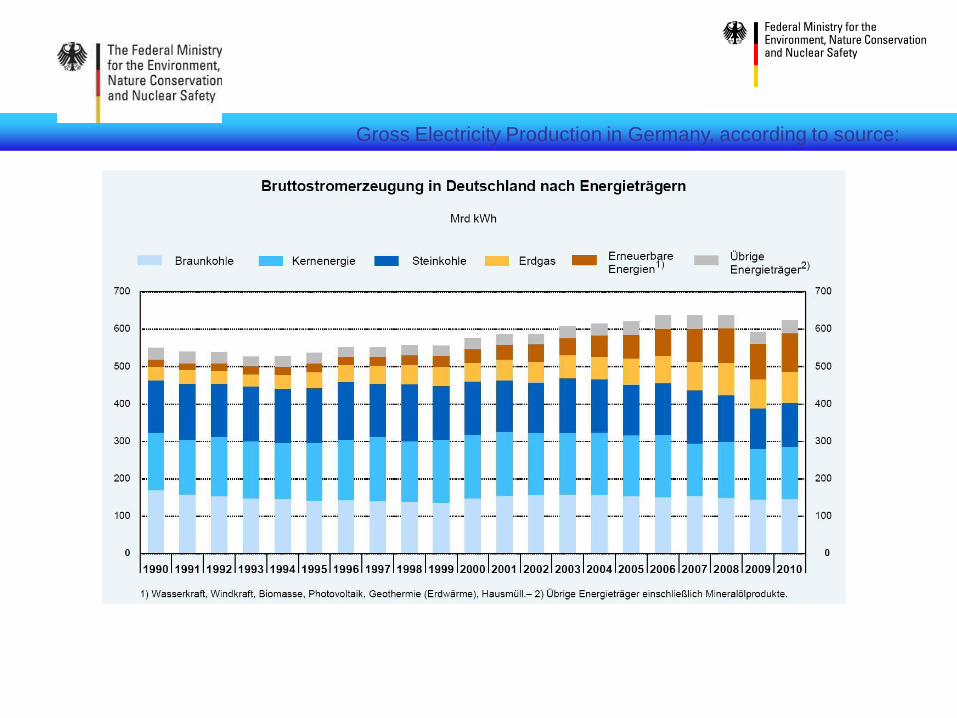
Gross Electricity Production in Germany, according to source:
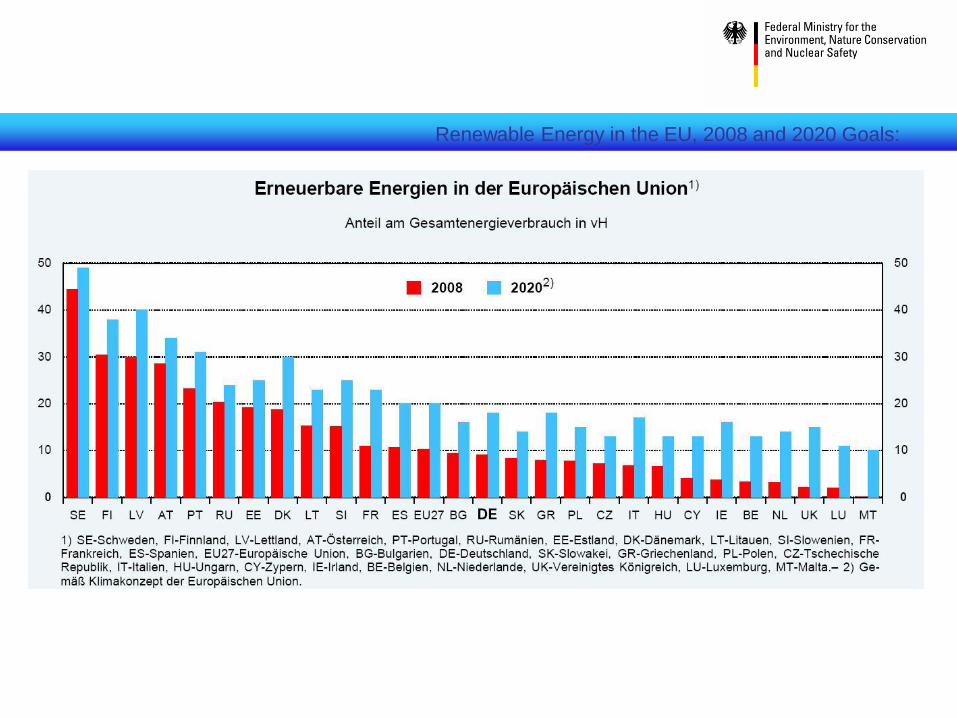
Renewable Energy in the EU, 2008 and 2020 Goals:
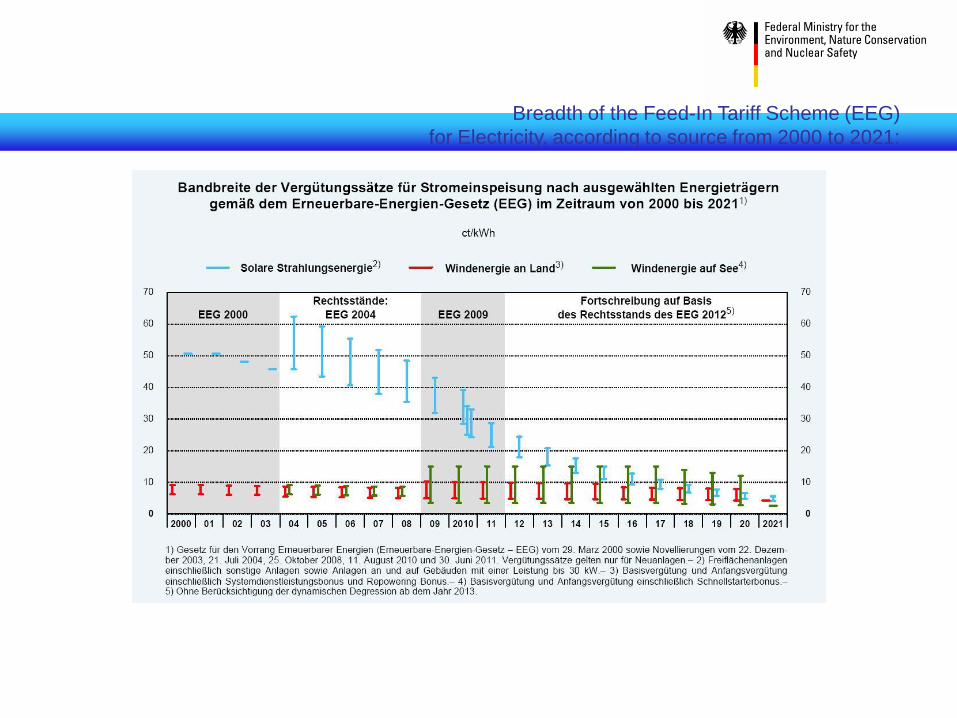
Breadth of the Feed-In Tariff Scheme (EEG)
for Electricity, according to source from 2000 to 2021:
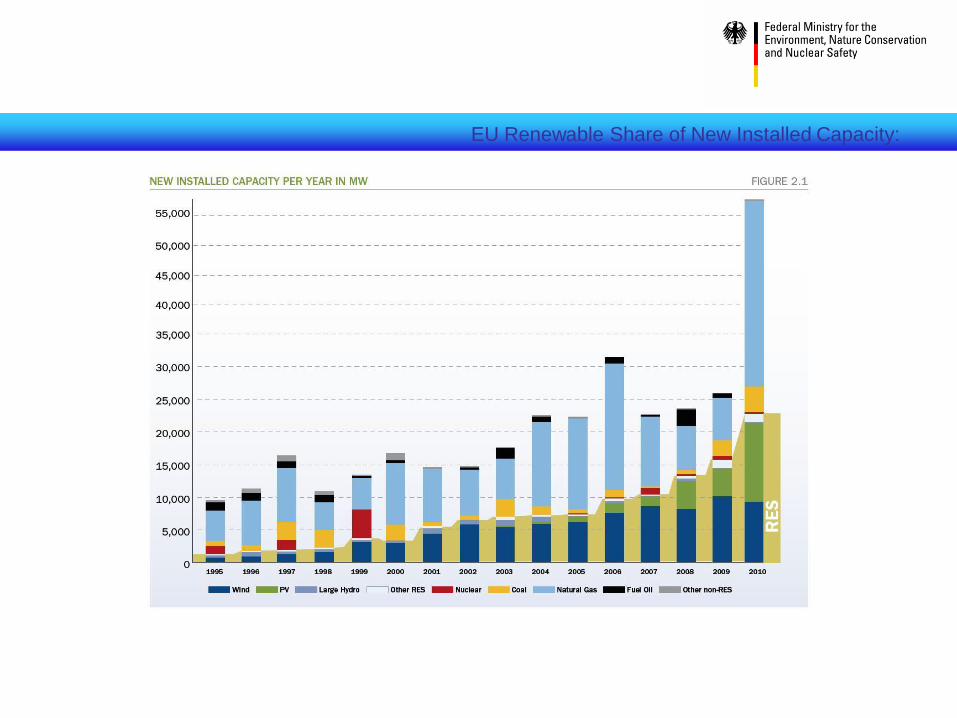
EU Renewable Share of New Installed Capacity:
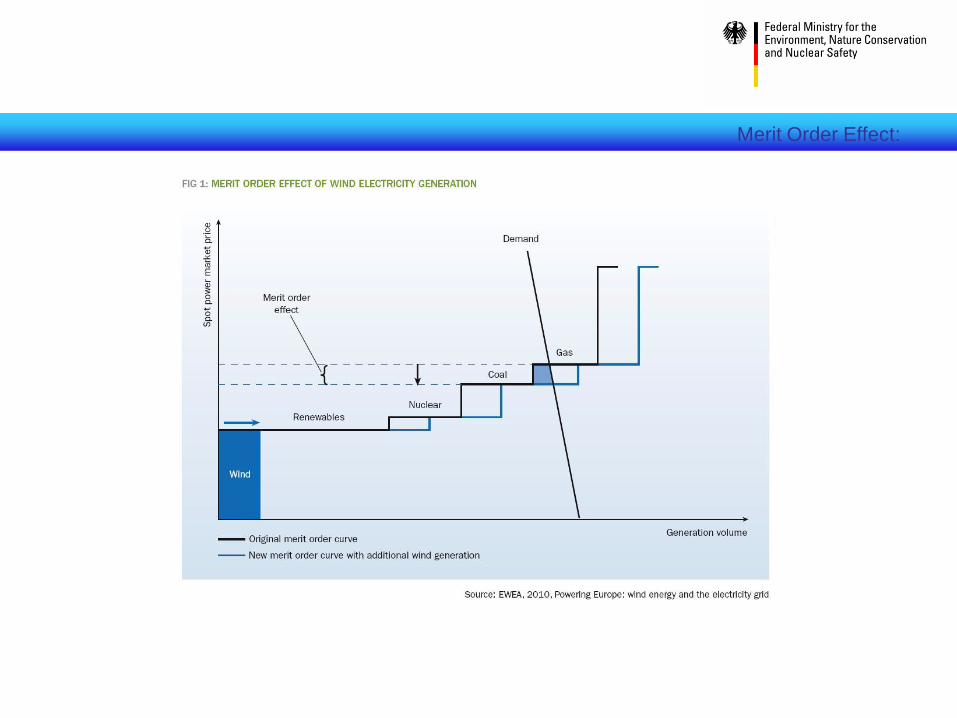
Merit Order Effect:
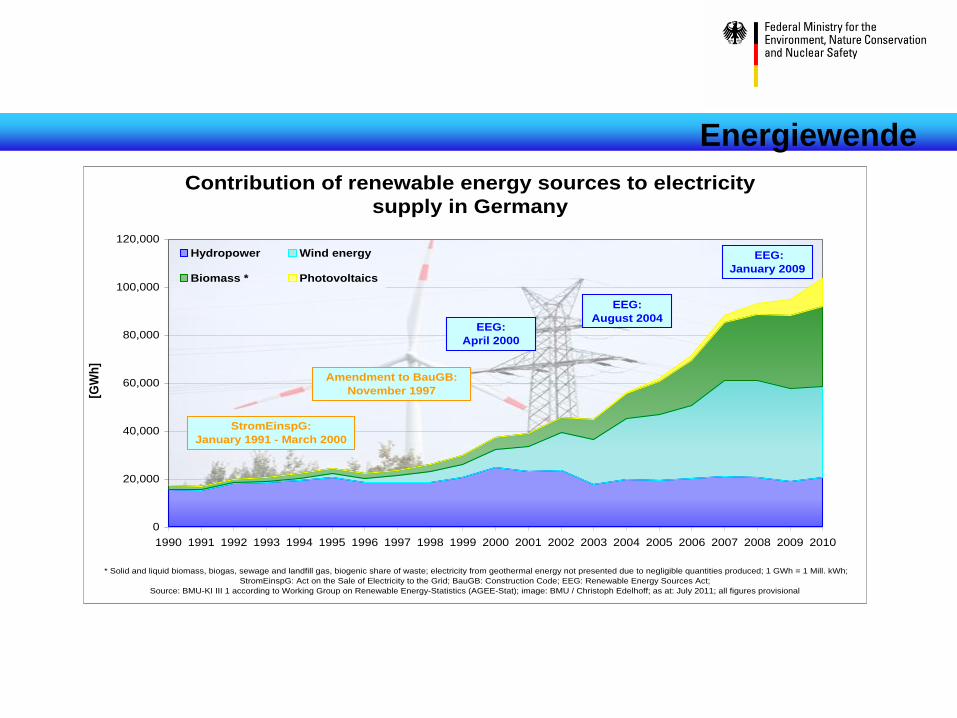
Energiewende
Contribution of renewable energy sources to electricity
supply in Germany
0
20,000
40,000
60,000
80,000
100,000
120,000
1990 1991 1992 1993 1994 1995 1996 1997 1998 1999 2000 2001 2002 2003 2004 2005 2006 2007 2008 2009 2010
[GW
h]
Hydropower Wind energy
Biomass * Photovoltaics
* Solid and liquid biomass, biogas, sewage and landfill gas, biogenic share of waste; electricity from geothermal energy not presented due to negligible quantities produced; 1 GWh = 1 Mill. kWh;
StromEinspG: Act on the Sale of Electricity to the Grid; BauGB: Construction Code; EEG: Renewable Energy Sources Act;
Source: BMU-KI III 1 according to Working Group on Renewable Energy-Statistics (AGEE-Stat); image: BMU / Christoph Edelhoff; as at: July 2011; all figures provisional
StromEinspG:
January 1991 - March 2000
Amendment to BauGB:
November 1997
EEG:
April 2000
EEG:
January 2009
EEG:
August 2004
0%
10%
20%
30%
40%
50%
60%
70%
80%
Au
str
ia
Be
lgiu
m
Bu
lga
ria
Cypru
s
Czech
Re
pu
blic
Den
ma
rk
Esto
nia
Fin
lan
d
Fra
nce
Ge
rma
ny
Gre
ece
Hun
ga
ry
Irela
nd
Ita
ly
La
tvia
Lith
ua
nia
Lu
xe
mb
ou
rg
Ma
lta
Neth
erla
nd
s
Po
lan
d
Po
rtug
al
Rom
an
ia
Slo
va
kia
Slo
ve
nia
Sp
ain
Sw
ed
en
Unite
d K
ing
do
m
EU
27
RE
S in
te
rms o
f fin
al e
ne
rgy [
% o
f d
em
an
d]
RES share 2005
RES potential 2020 - share on current (2005) demand
RES target for 2020
Renewable Energy in the EU: Targets
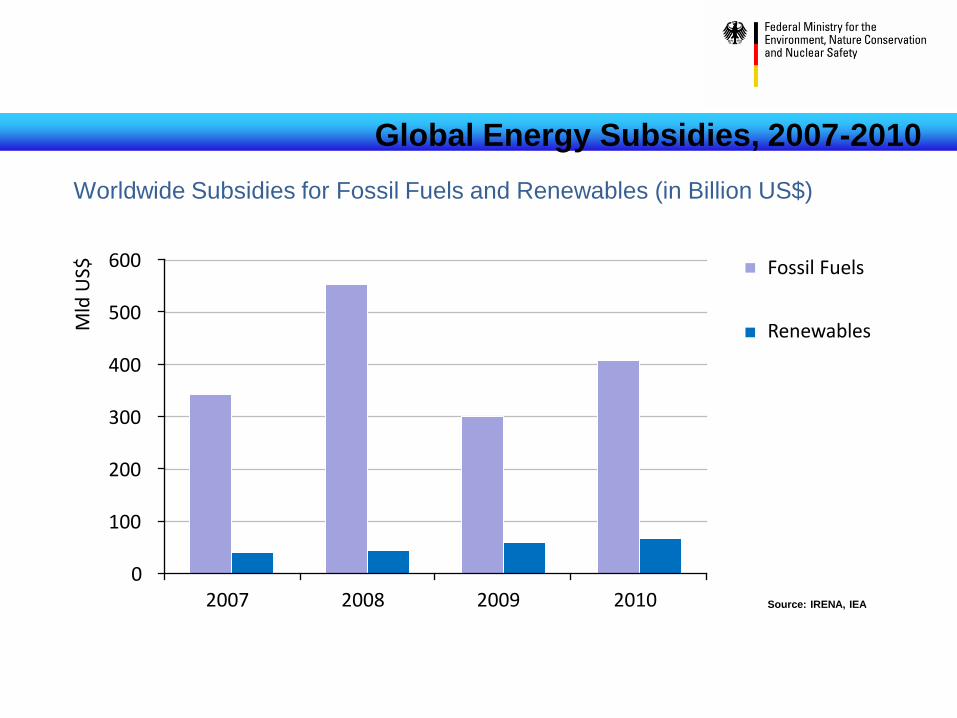
Source: IRENA, IEA
Global Energy Subsidies, 2007-2010
Worldwide Subsidies for Fossil Fuels and Renewables (in Billion US$)
Fossil Fuels
Renewables
0
100
200
300
400
500
600
2007 2008 2009 2010
Mld
US$
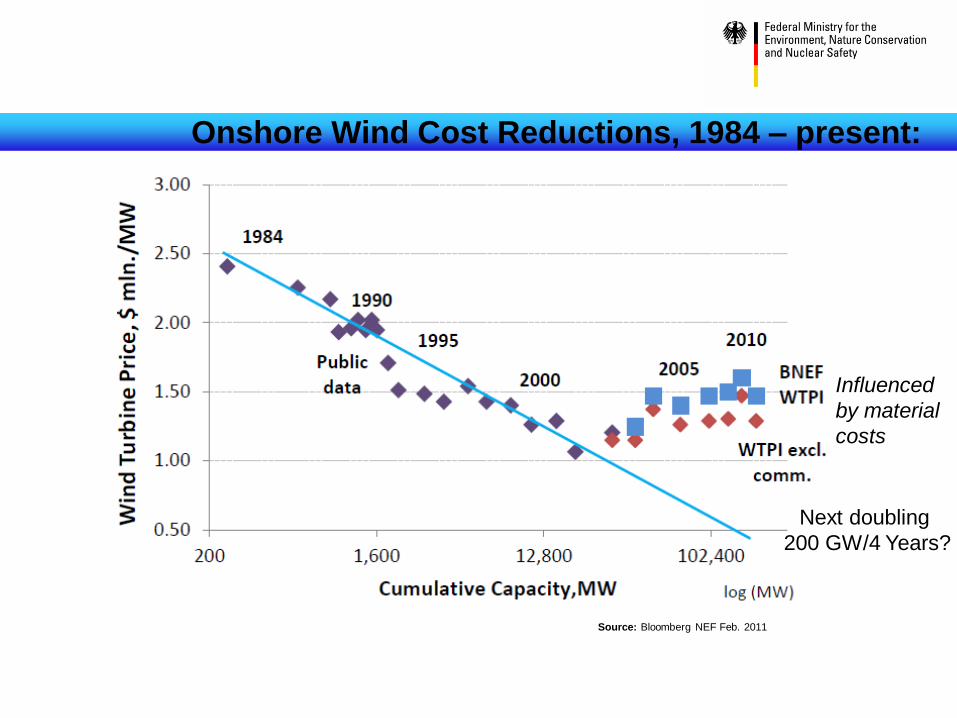
Source: Bloomberg NEF Feb. 2011
Onshore Wind Cost Reductions, 1984 – present:
Influenced
by material
costs
Next doubling
200 GW/4 Years?