Embed Size (px)
Citation preview

Repair monitoring using Impulse - Response method
N. ZoidisManagement Director, Geotest SA, Ioannina, Greece
E. TatsisPhd Candidate, Materials Science and Engineering Dept, University ofIoannina, Greece
C. VlachopoulosMaterials Engineer, Geotest SA, Ioannina, Greece
J. S. ClausenInspection Specialist, Ramboll Denmark A/S, Copenhagen, Denmark
T. MatikasProffesor, Materials Science and Engineering Dept, University of Ioannina, Greece
D. AggelisAssistant Proffesor, Materials Science and Engineering Dept, University of Ioannina, Greece
A. GkotzamanisCivil Engineer, MSc in Seismic Design of Structures, Ioannina, Greece

Acknowledgements:
• Dr. Nikolaos Naskos
• Dr. Nicholas J. Carino
• Mr. Claus Germann Petersen

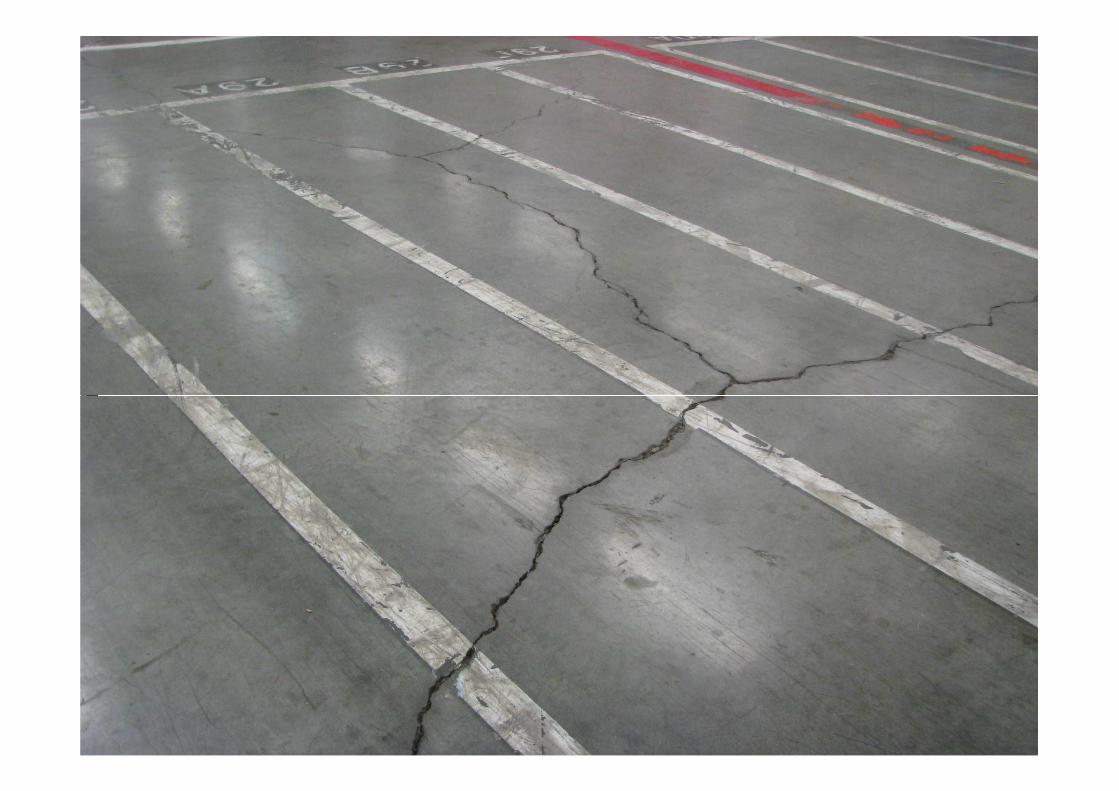
GEOTEST SAThe tests were carried out by GEOTEST SA at a warehouse for foods anddrinks. The warehouse covers an area of about 36.000m2 and was build in 2005.
On the floor there are metal joints which divide the surface into independentsections about 1200m2.
The warehouse’s concrete floor suffers from extensive cracking on its surface.
The design thickness of floor is 18cm , C25/30 with metal fibres 40kg/m3
Cracks deteriorate the ride quality of the vehicles that move in the warehouse.(lift tracks, pallet carrying trucks and vehicles used for transporting, sorting andloading of products)
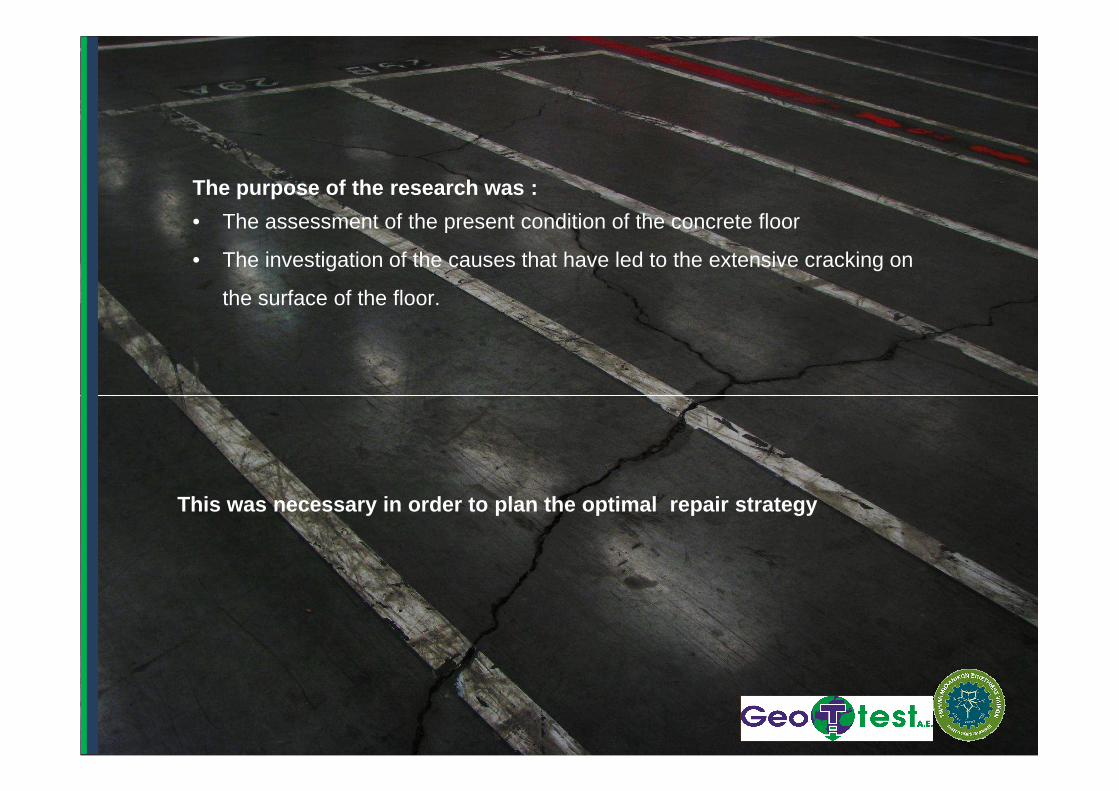
The purpose of the research was :
• The assessment of the present condition of the concrete floor
• The investigation of the causes that have led to the extensive cracking on
the surface of the floor.
This was necessary in order to plan the optimal repa ir strategy
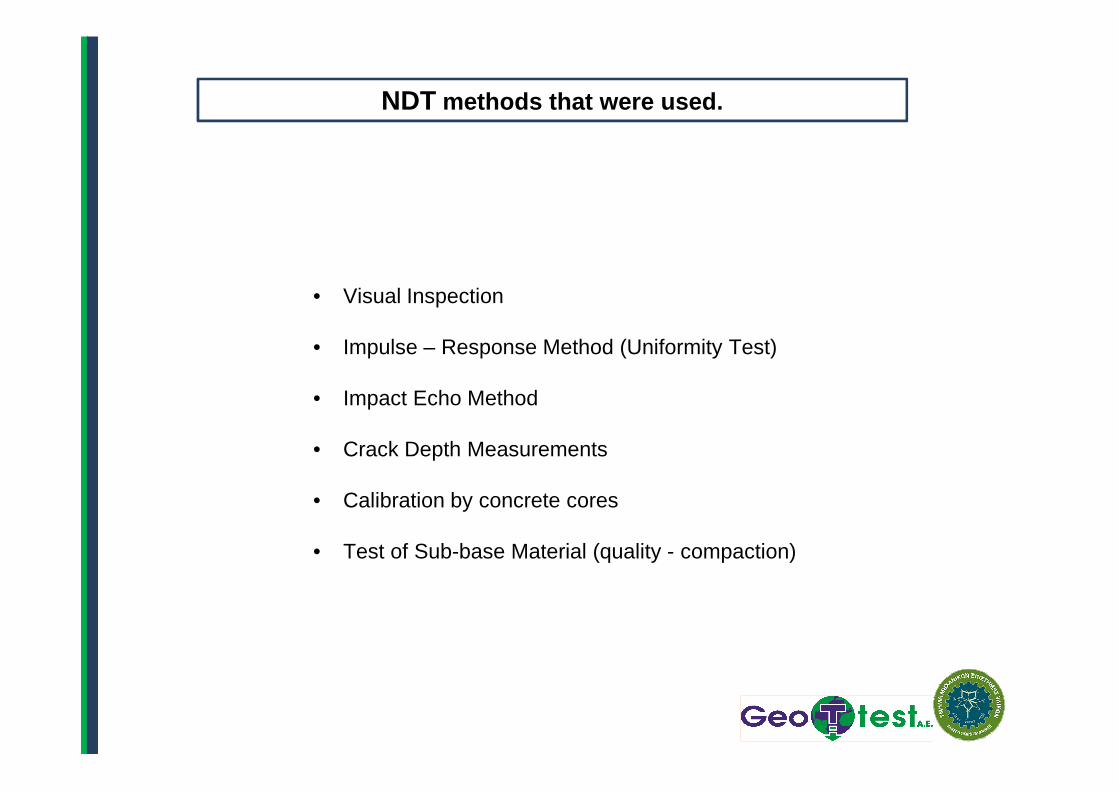
NDT methods that were used.
• Visual Inspection
• Impulse – Response Method (Uniformity Test)
• Impact Echo Method• Impact Echo Method
• Crack Depth Measurements
• Calibration by concrete cores
• Test of Sub-base Material (quality - compaction)
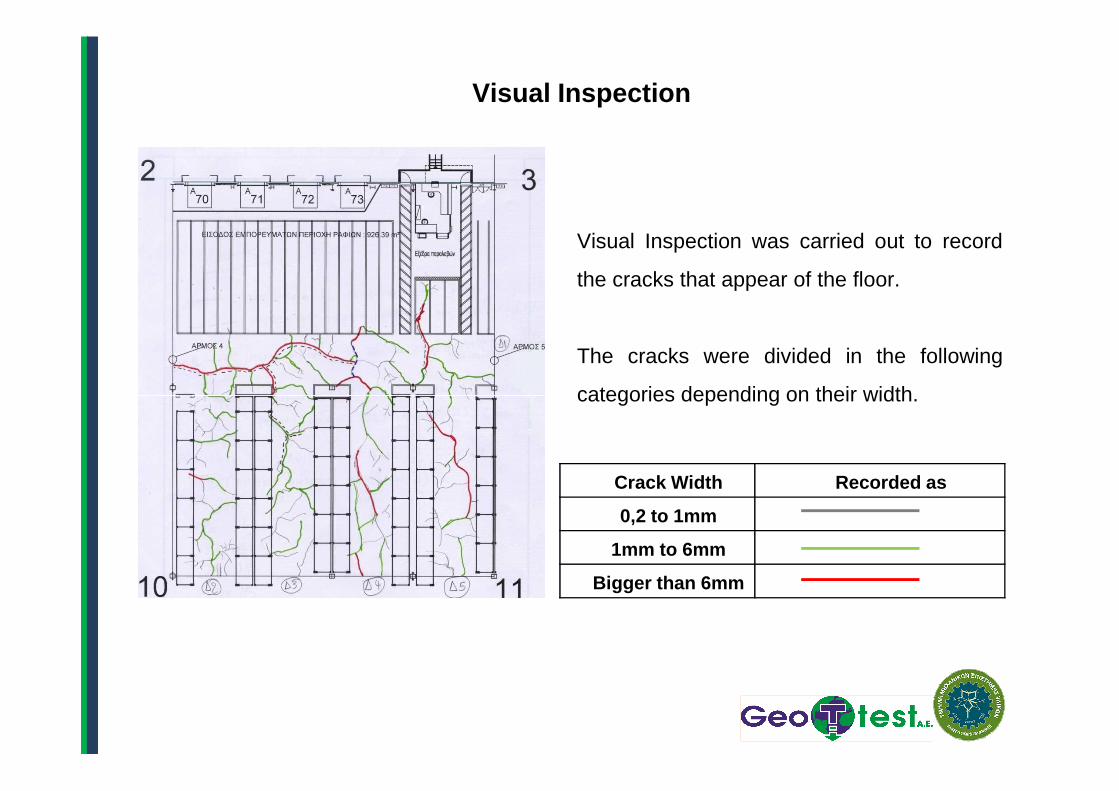
Visual Inspection
Visual Inspection was carried out to record
the cracks that appear of the floor.
The cracks were divided in the following
categories depending on their width.categories depending on their width.
Crack Width Recorded as
0,2 to 1mm
1mm to 6mm
Bigger than 6mm
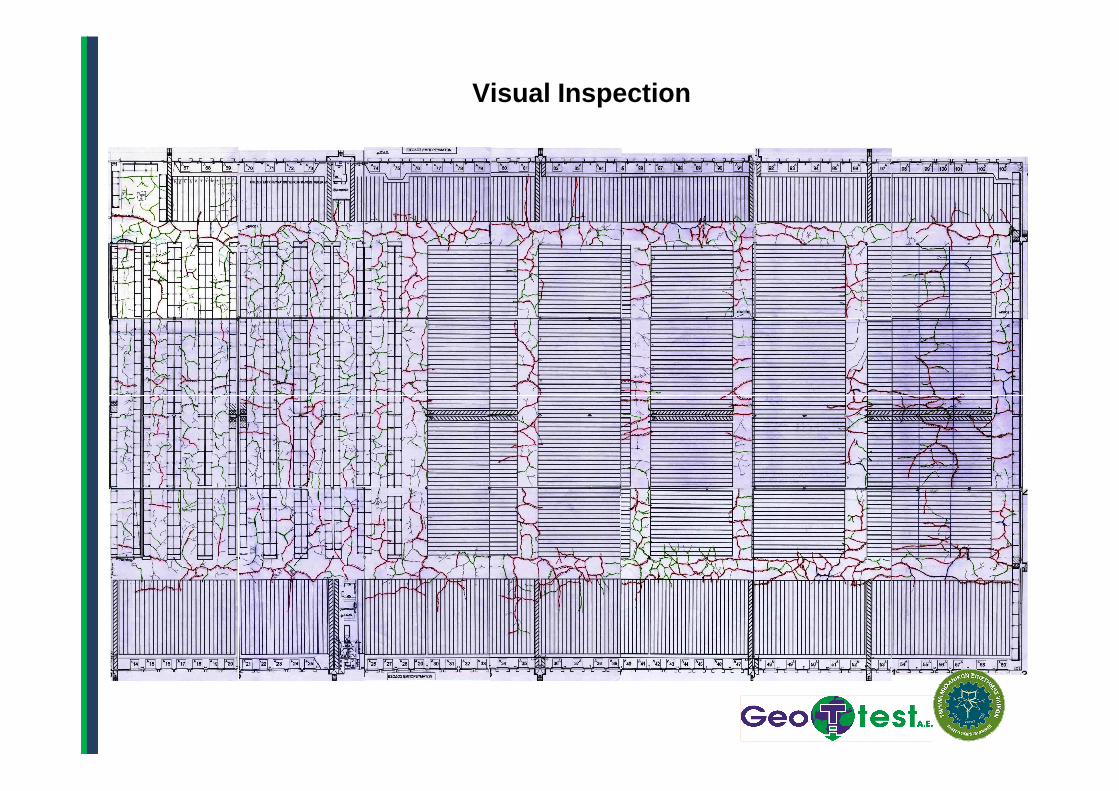
Visual Inspection
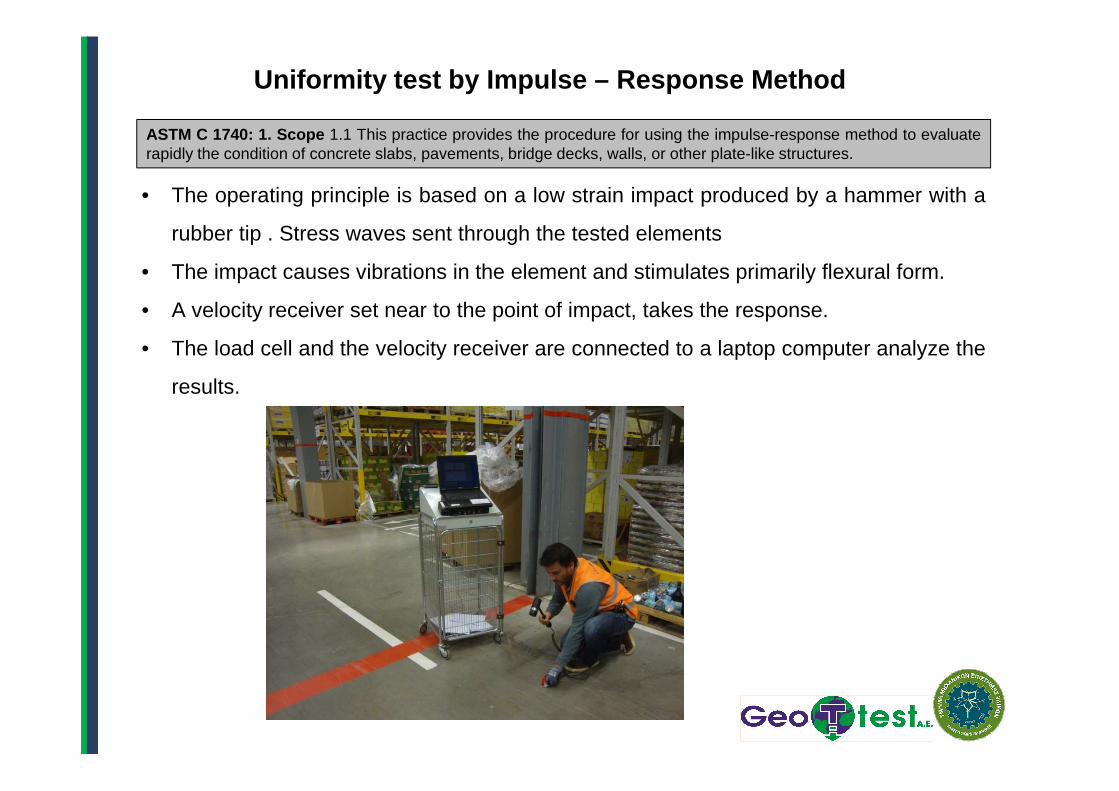
Uniformity test by Impulse – Response Method
• The operating principle is based on a low strain impact produced by a hammer with a
rubber tip . Stress waves sent through the tested elements
• The impact causes vibrations in the element and stimulates primarily flexural form.
• A velocity receiver set near to the point of impact, takes the response.
• The load cell and the velocity receiver are connected to a laptop computer analyze the
results.
ASTM C 1740: 1. Scope 1.1 This practice provides the procedure for using the impulse-response method to evaluaterapidly the condition of concrete slabs, pavements, bridge decks, walls, or other plate-like structures.
results.
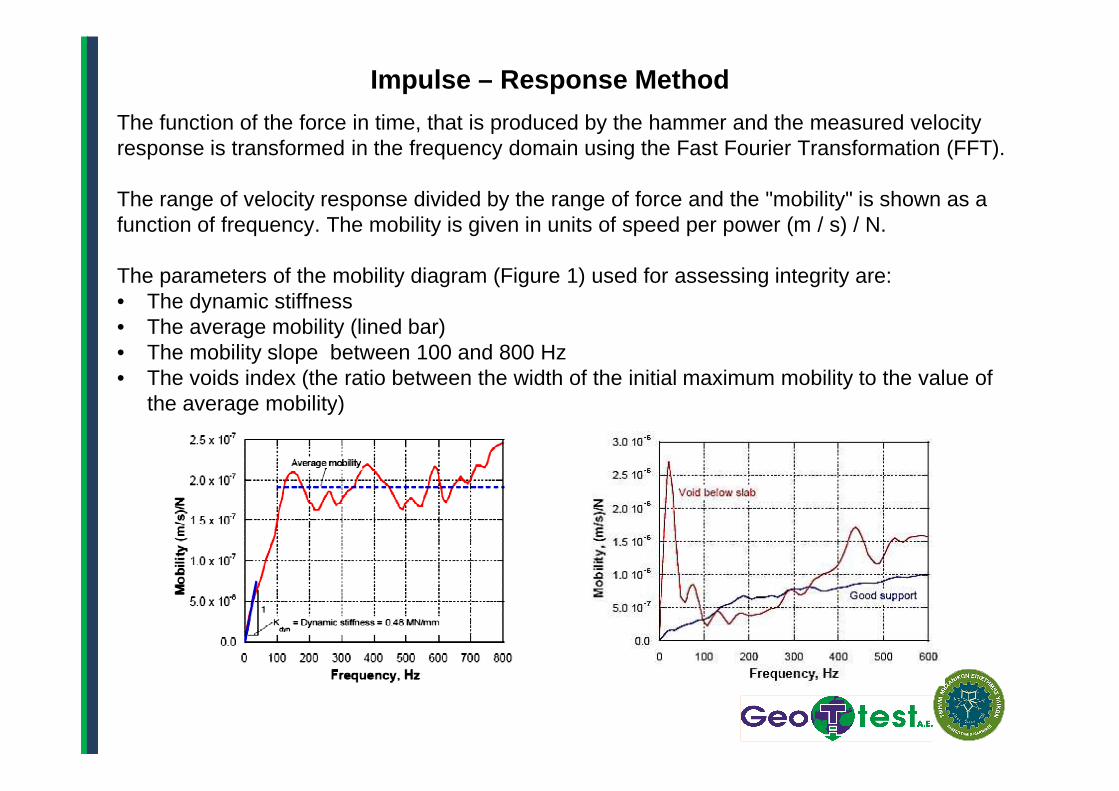
The function of the force in time, that is produced by the hammer and the measured velocity response is transformed in the frequency domain using the Fast Fourier Transformation (FFT).
The range of velocity response divided by the range of force and the "mobility" is shown as a function of frequency. The mobility is given in units of speed per power (m / s) / N.
The parameters of the mobility diagram (Figure 1) used for assessing integrity are:• The dynamic stiffness• The average mobility (lined bar)• The mobility slope between 100 and 800 Hz• The voids index (the ratio between the width of the initial maximum mobility to the value of
the average mobility)
Impulse – Response Method
the average mobility)
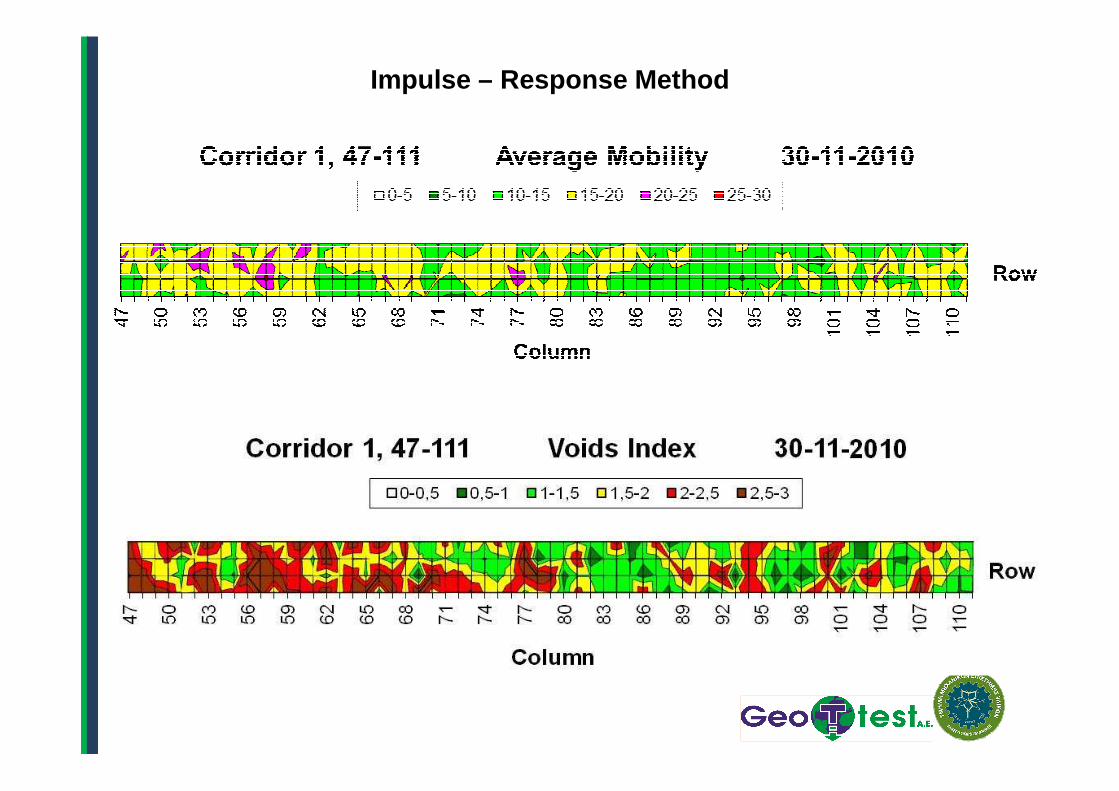
Impulse – Response Method
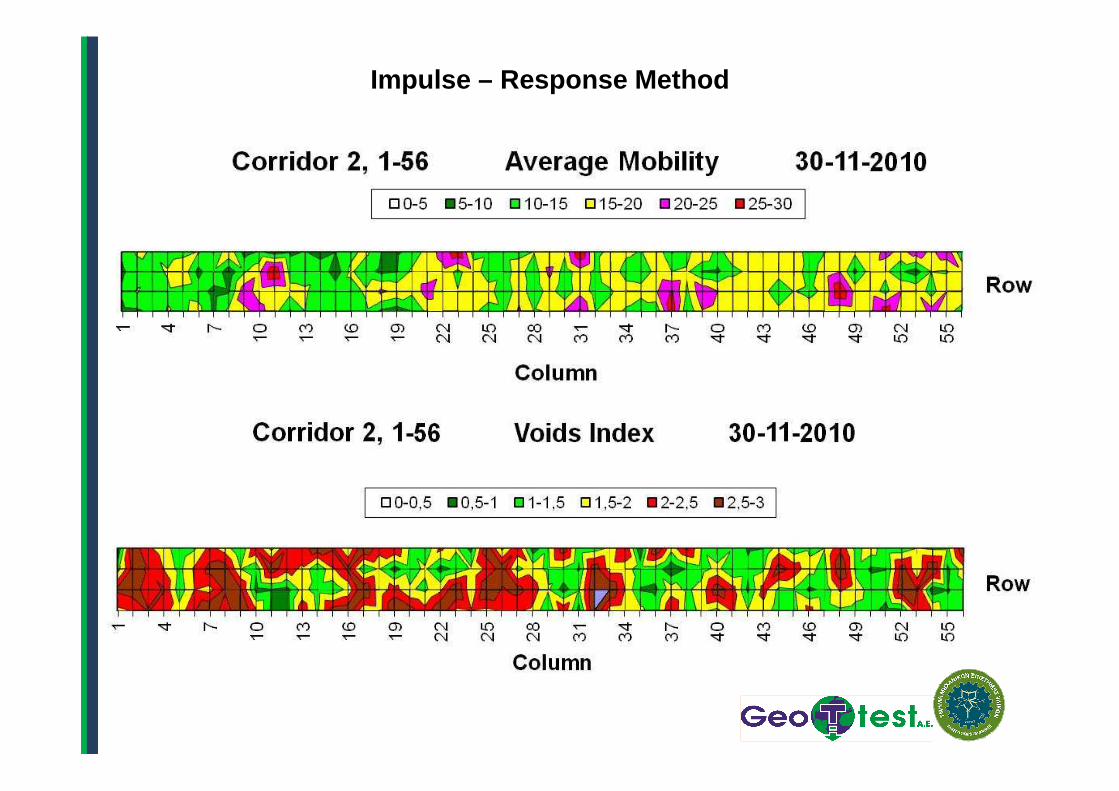
Impulse – Response Method
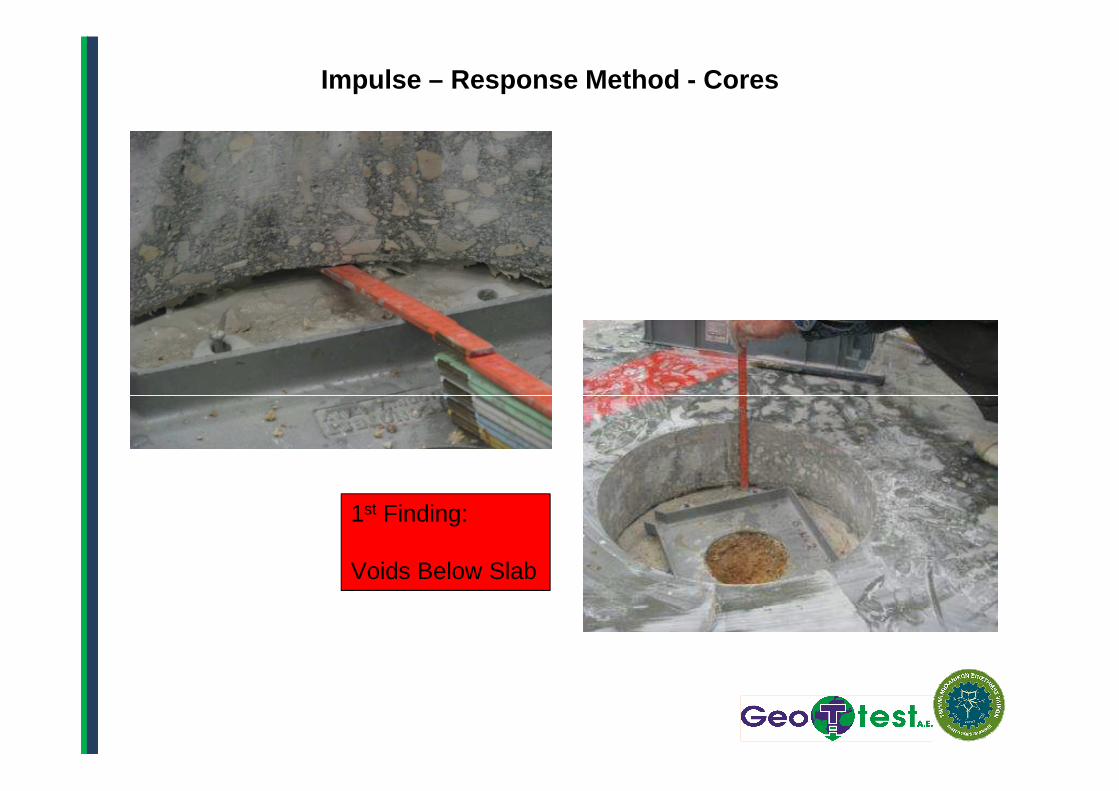
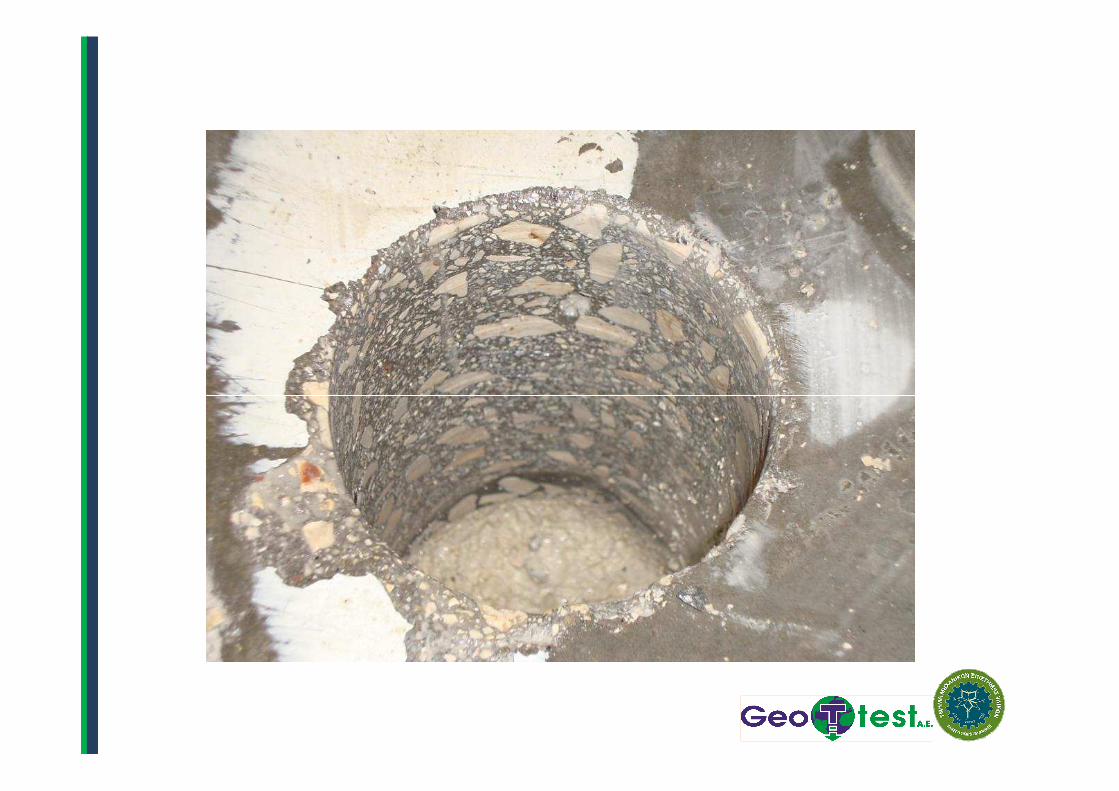
Impulse – Response Method - Cores
1st Finding:
Voids Below Slab
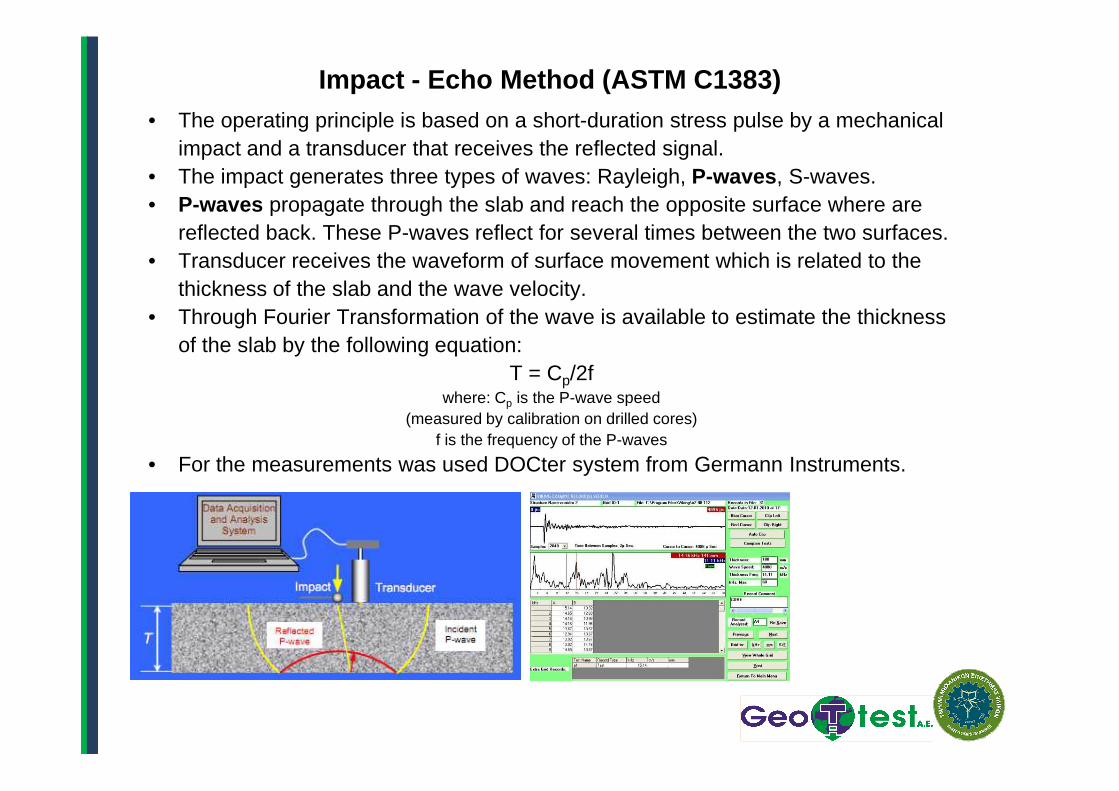
Impact - Echo Method (ASTM C1383)• The operating principle is based on a short-duration stress pulse by a mechanical
impact and a transducer that receives the reflected signal.• The impact generates three types of waves: Rayleigh, P-waves , S-waves. • P-waves propagate through the slab and reach the opposite surface where are
reflected back. These P-waves reflect for several times between the two surfaces.• Transducer receives the waveform of surface movement which is related to the
thickness of the slab and the wave velocity.• Through Fourier Transformation of the wave is available to estimate the thickness
of the slab by the following equation:T = Cp/2f
where: C is the P-wave speed where: Cp is the P-wave speed (measured by calibration on drilled cores)
f is the frequency of the P-waves
• For the measurements was used DOCter system from Germann Instruments.
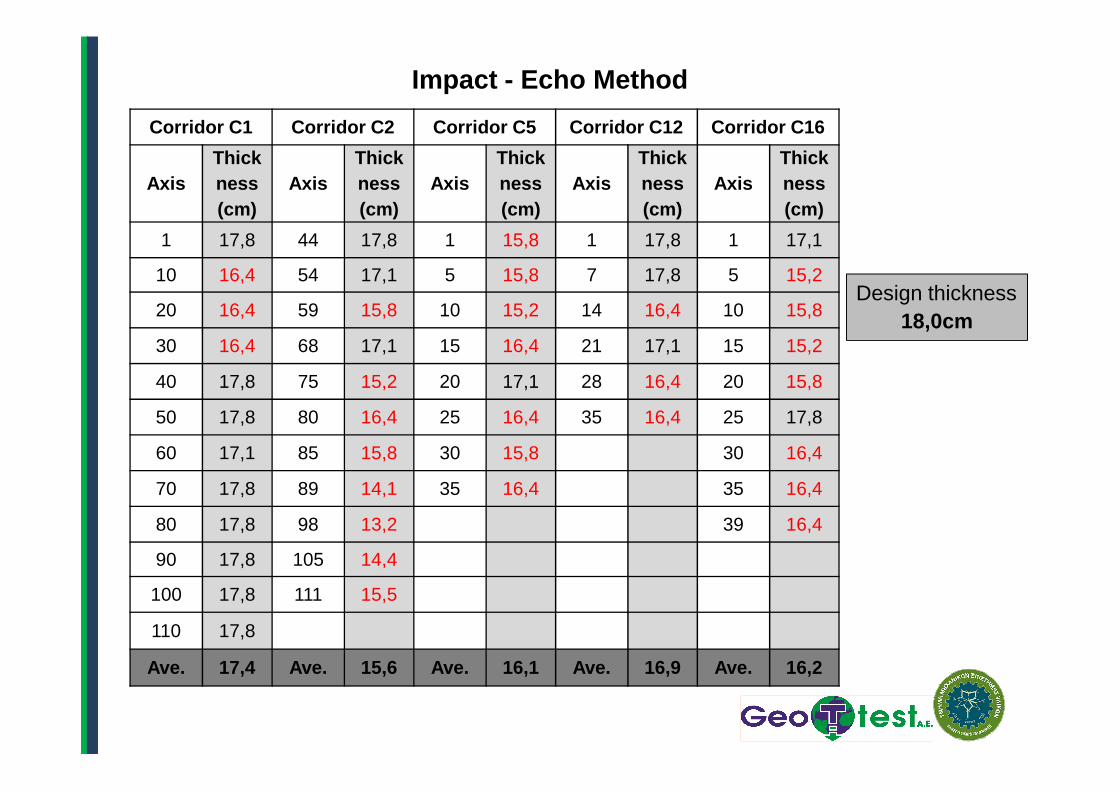
Impact - Echo Method
Corridor C1 Corridor C2 Corridor C5 Corridor C12 Corridor C 16
AxisThickness(cm)
AxisThickness(cm)
AxisThickness(cm)
AxisThickness(cm)
AxisThickness(cm)
1 17,8 44 17,8 1 15,8 1 17,8 1 17,1
10 16,4 54 17,1 5 15,8 7 17,8 5 15,2
20 16,4 59 15,8 10 15,2 14 16,4 10 15,8
30 16,4 68 17,1 15 16,4 21 17,1 15 15,2
40 17,8 75 15,2 20 17,1 28 16,4 20 15,8
Design thickness 18,0cm
50 17,8 80 16,4 25 16,4 35 16,4 25 17,8
60 17,1 85 15,8 30 15,8 30 16,4
70 17,8 89 14,1 35 16,4 35 16,4
80 17,8 98 13,2 39 16,4
90 17,8 105 14,4
100 17,8 111 15,5
110 17,8
Ave. 17,4 Ave. 15,6 Ave. 16,1 Ave. 16,9 Ave. 16,2
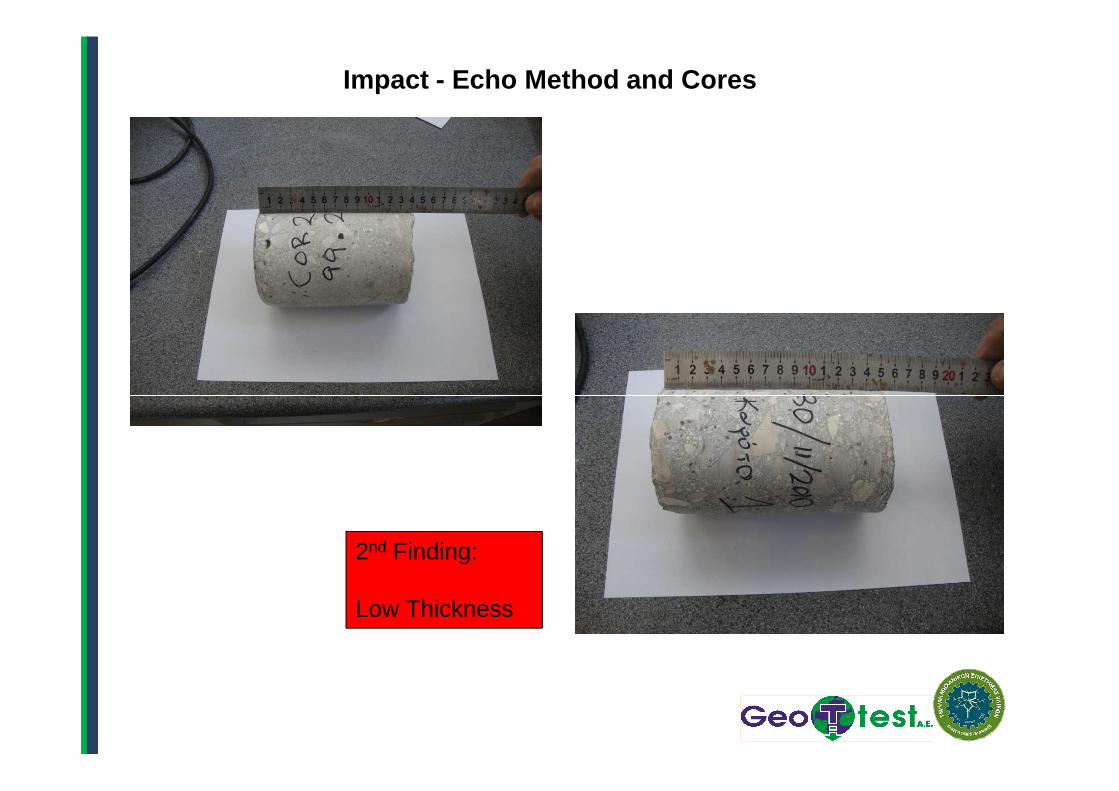
Impact - Echo Method and Cores
2nd Finding:
Low Thickness
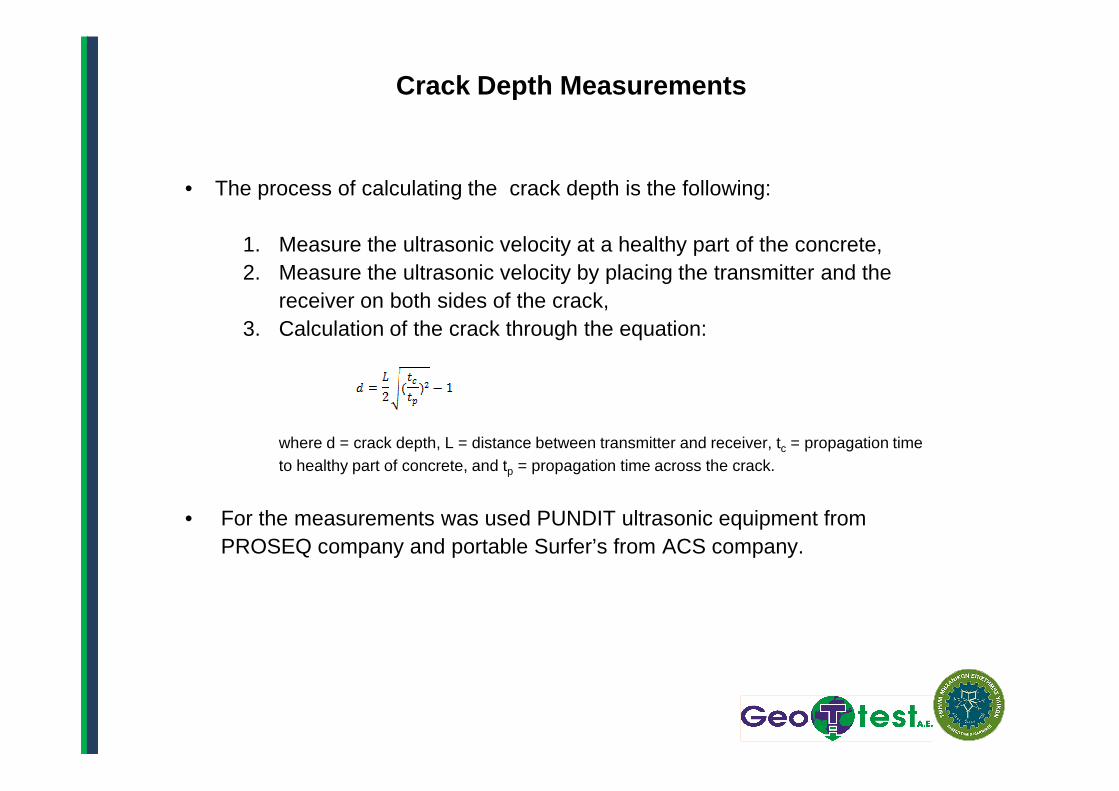
Crack Depth Measurements
• The process of calculating the crack depth is the following:
1. Measure the ultrasonic velocity at a healthy part of the concrete,2. Measure the ultrasonic velocity by placing the transmitter and the
receiver on both sides of the crack, 3. Calculation of the crack through the equation:
where d = crack depth, L = distance between transmitter and receiver, tc = propagation time to healthy part of concrete, and tp = propagation time across the crack.
• For the measurements was used PUNDIT ultrasonic equipment from PROSEQ company and portable Surfer’s from ACS company.
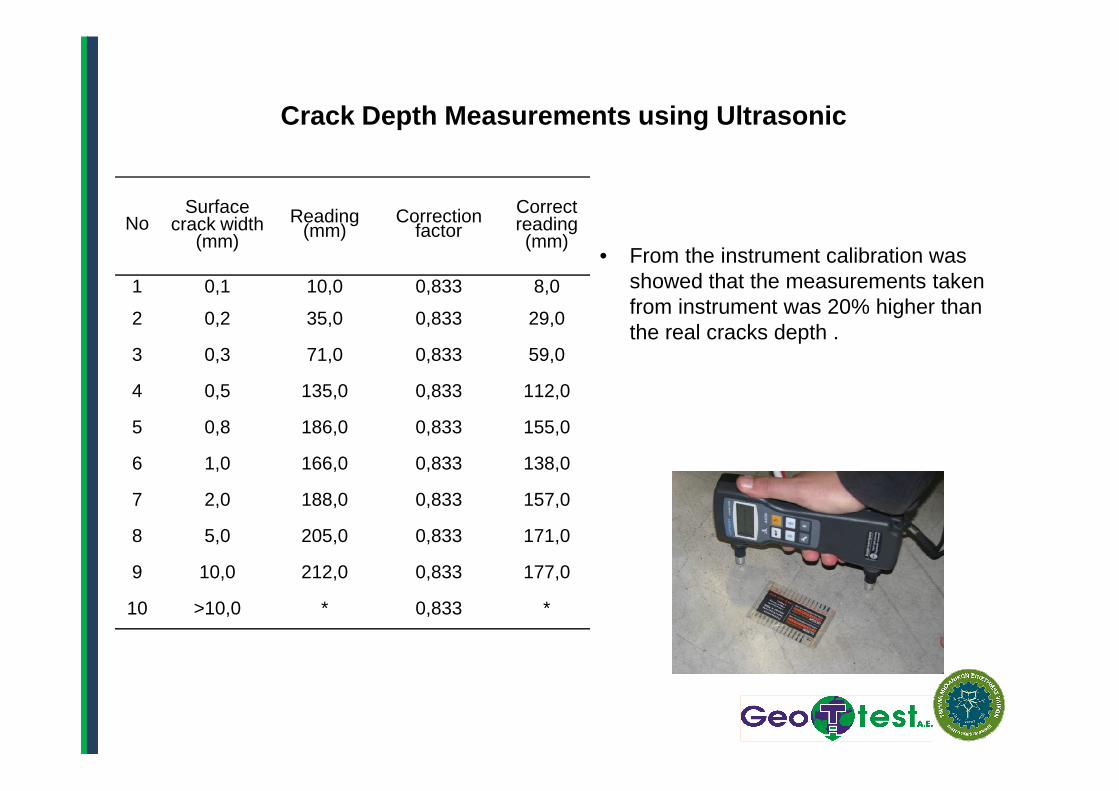
Crack Depth Measurements using Ultrasonic
NoSurface
crack width(mm)
Reading(mm)
Correction factor
Correct reading(mm)
1 0,1 10,0 0,833 8,0
2 0,2 35,0 0,833 29,0
3 0,3 71,0 0,833 59,0
4 0,5 135,0 0,833 112,0
• From the instrument calibration wasshowed that the measurements takenfrom instrument was 20% higher thanthe real cracks depth .
4 0,5 135,0 0,833 112,0
5 0,8 186,0 0,833 155,0
6 1,0 166,0 0,833 138,0
7 2,0 188,0 0,833 157,0
8 5,0 205,0 0,833 171,0
9 10,0 212,0 0,833 177,0
10 >10,0 * 0,833 *
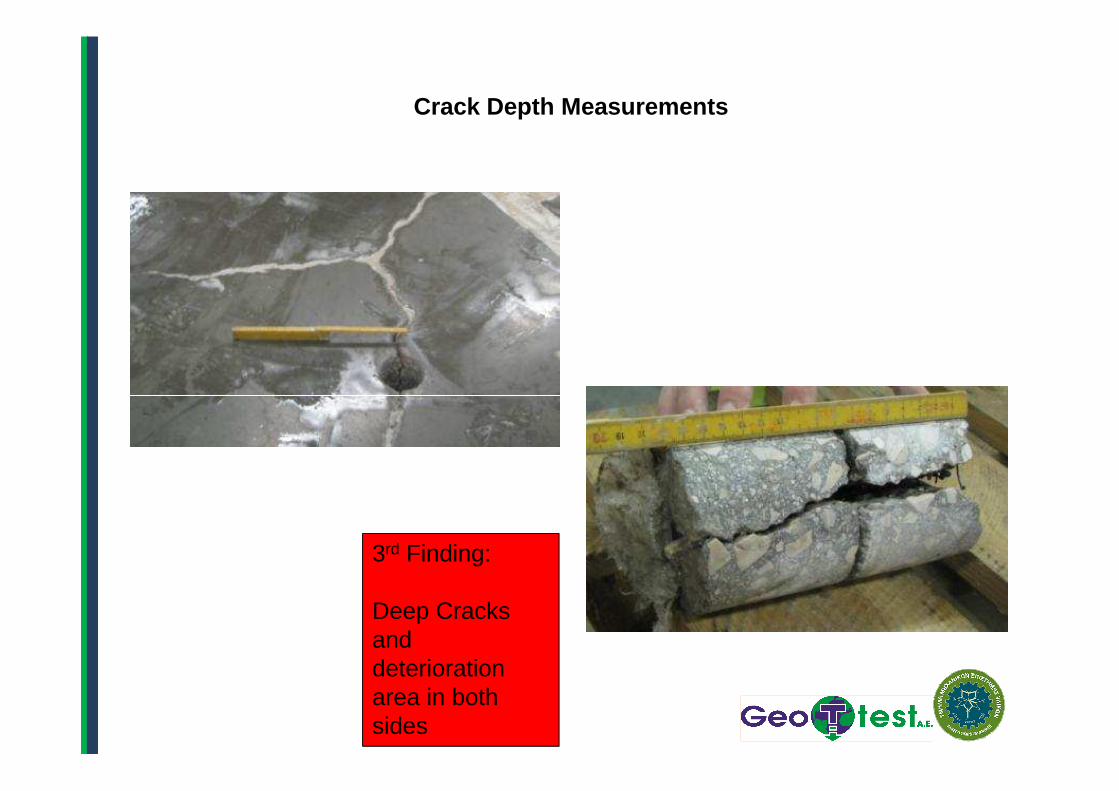
Crack Depth Measurements
3rd Finding:
Deep Cracks and deterioration area in both sides
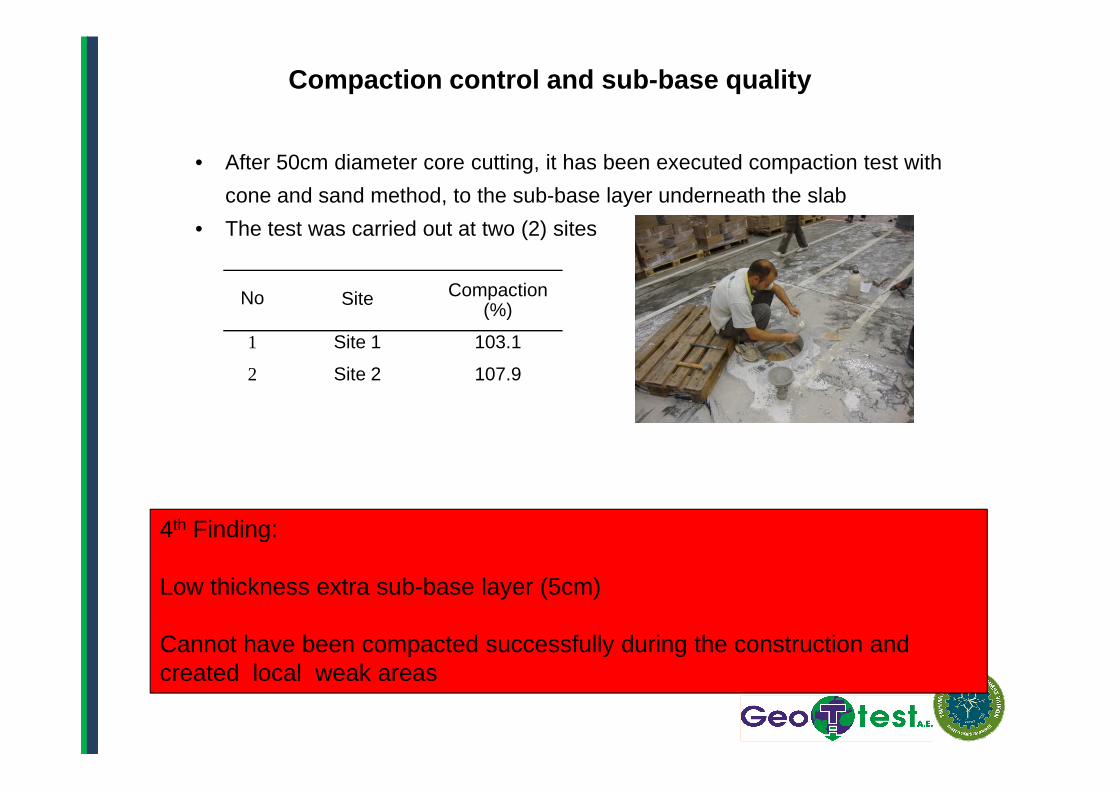
Compaction control and sub-base quality
• After 50cm diameter core cutting, it has been executed compaction test with
cone and sand method, to the sub-base layer underneath the slab
• The test was carried out at two (2) sites
No Site Compaction (%)
1 Site 1 103.1
2 Site 2 107.9
4th Finding:
Low thickness extra sub-base layer (5cm)
Cannot have been compacted successfully during the construction and created local weak areas
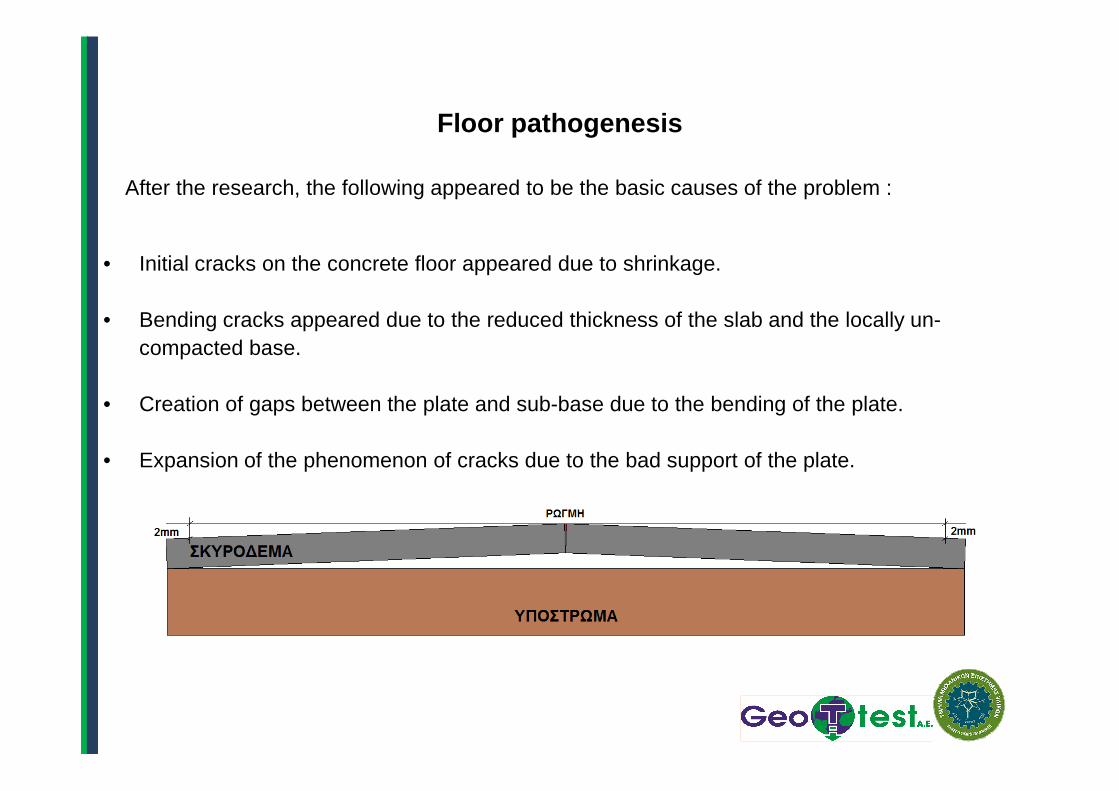
Floor pathogenesis
• Initial cracks on the concrete floor appeared due to shrinkage.
• Bending cracks appeared due to the reduced thickness of the slab and the locally un-compacted base.
• Creation of gaps between the plate and sub-base due to the bending of the plate.
After the research, the following appeared to be the basic causes of the problem :
• Creation of gaps between the plate and sub-base due to the bending of the plate.
• Expansion of the phenomenon of cracks due to the bad support of the plate.
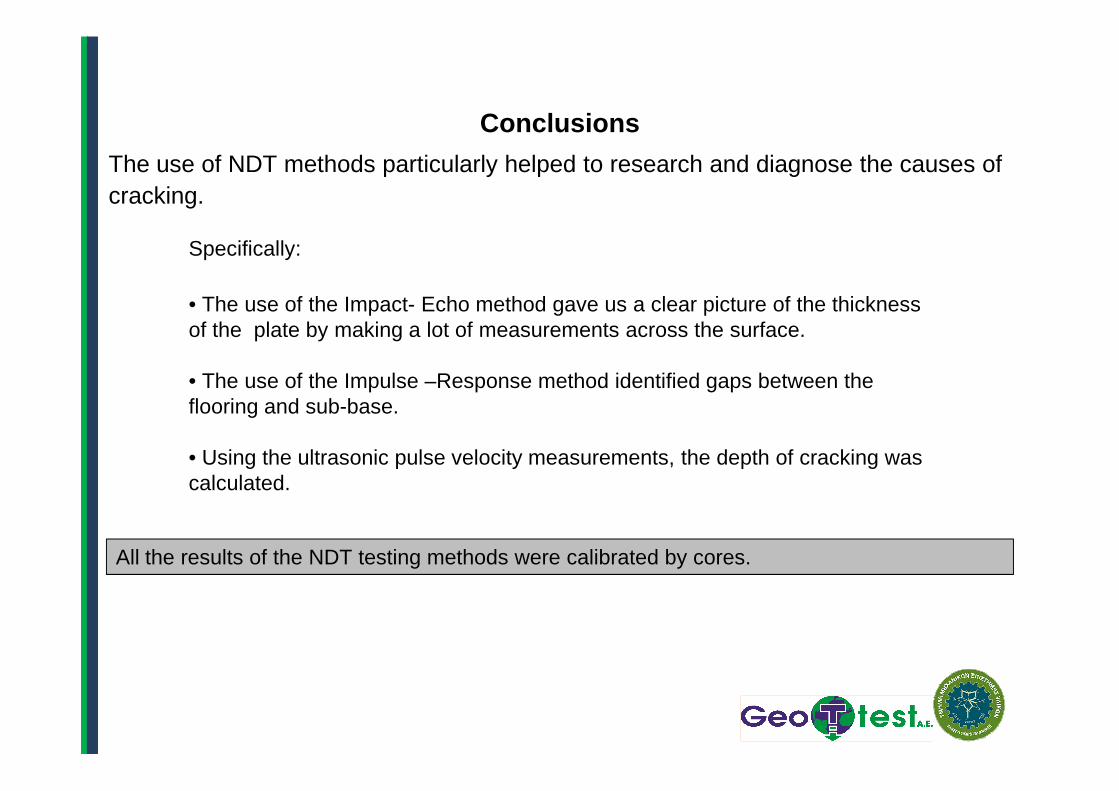
Specifically:
• The use of the Impact- Echo method gave us a clear picture of the thickness of the plate by making a lot of measurements across the surface.
• The use of the Impulse –Response method identified gaps between the flooring and sub-base.
Conclusions
The use of NDT methods particularly helped to research and diagnose the causes of cracking.
flooring and sub-base.
• Using the ultrasonic pulse velocity measurements, the depth of cracking was calculated.
All the results of the NDT testing methods were calibrated by cores.
REPAIRREPAIR
After the research and the according proposals, the owner of the warehouse chose a repair strategy aimed at limiting the evolution of the phenomenon.
The chosen strategy included the following:
• Filling of the the voids between the slab and the sub-base by grout injections, while strengthening the sub-base
• Sealing of the cracks. Some of the cracks will be sealed using epoxy products to offer Some of the cracks will be sealed using epoxy products to offer structural support
Some of the cracks will be sealed using elastic products, in order to continue to function as extra joints
Choosing this kind of repair strategy, that doesn’t include increasing thethickness and/or reconstruction of the slab, the full restoration of thestructural integrity of the floor is not possible
The grout injections at the first part of the floor were assigned to GEOTEST S.A.
The following methodology was chosen :
• A triangular grid was designed, with side dimension of 1,60m
• Holes of 26mm diameter were drilled up to a depth of around 20-22cm
• Grout with a W/C ratio of 0,7 to 0,9 (under pressure of 2bars at the maximum) was • Grout with a W/C ratio of 0,7 to 0,9 (under pressure of 2bars at the maximum) was injected through the drilled holes using equipment specifically designed according to the needs of the project
The project was monitored by extensive use of the Impulse – Response method
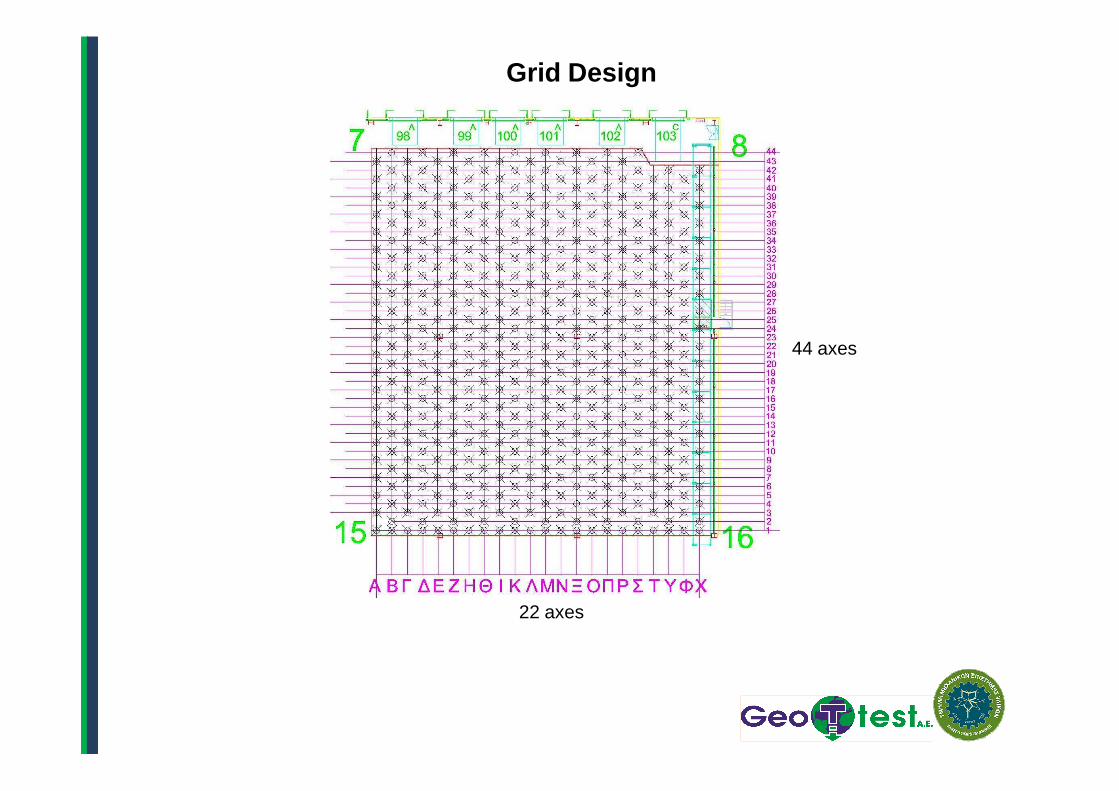
Grid Design
44 axes
22 axes

Grid Design
• Triangular grid, with side dimension of 1,60m
• The first horizontal and vertical axes were put 0,5 m from the joints
• The point of reference was A1, that was put 0,5m fr om each joint and based on that, the grid was designed on site
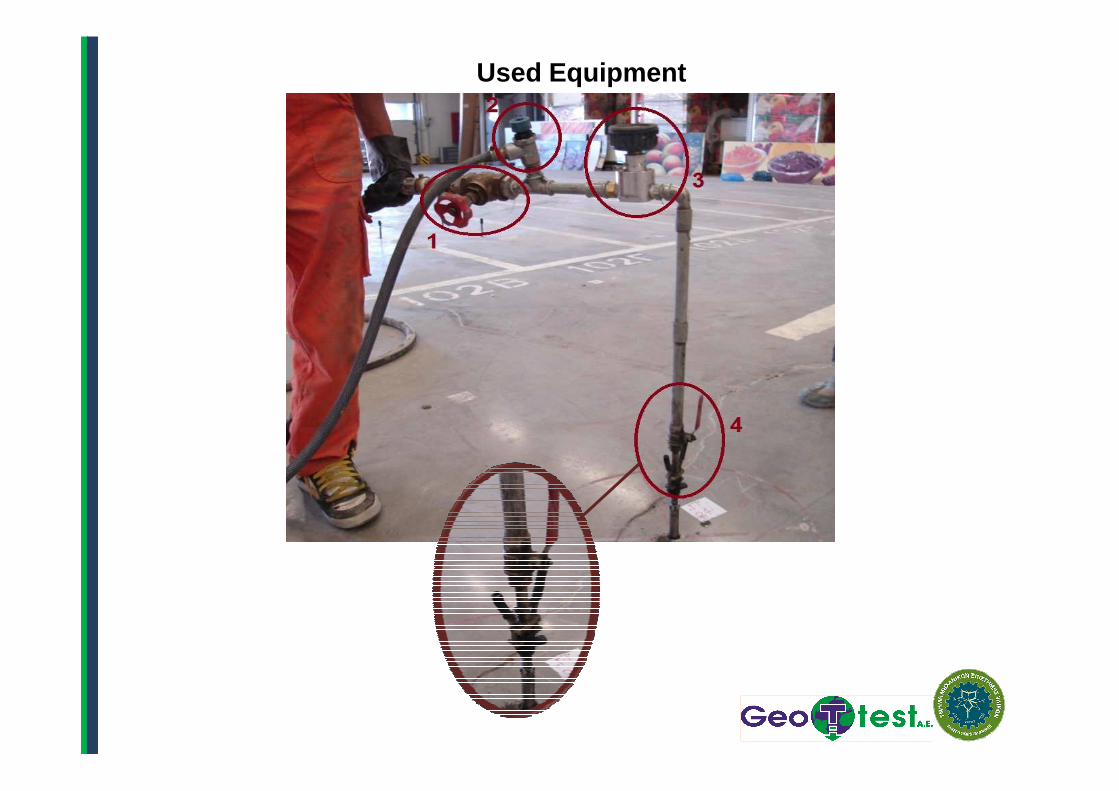
Used Equipment
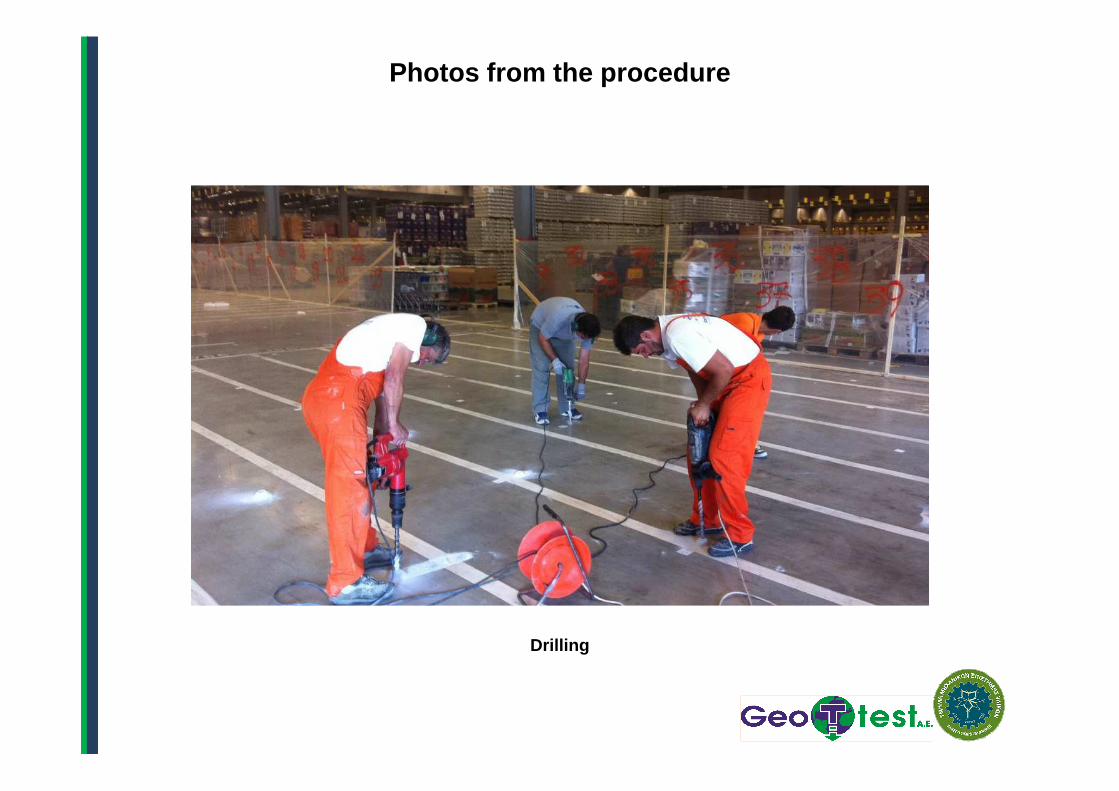
Photos from the procedure
Drilling
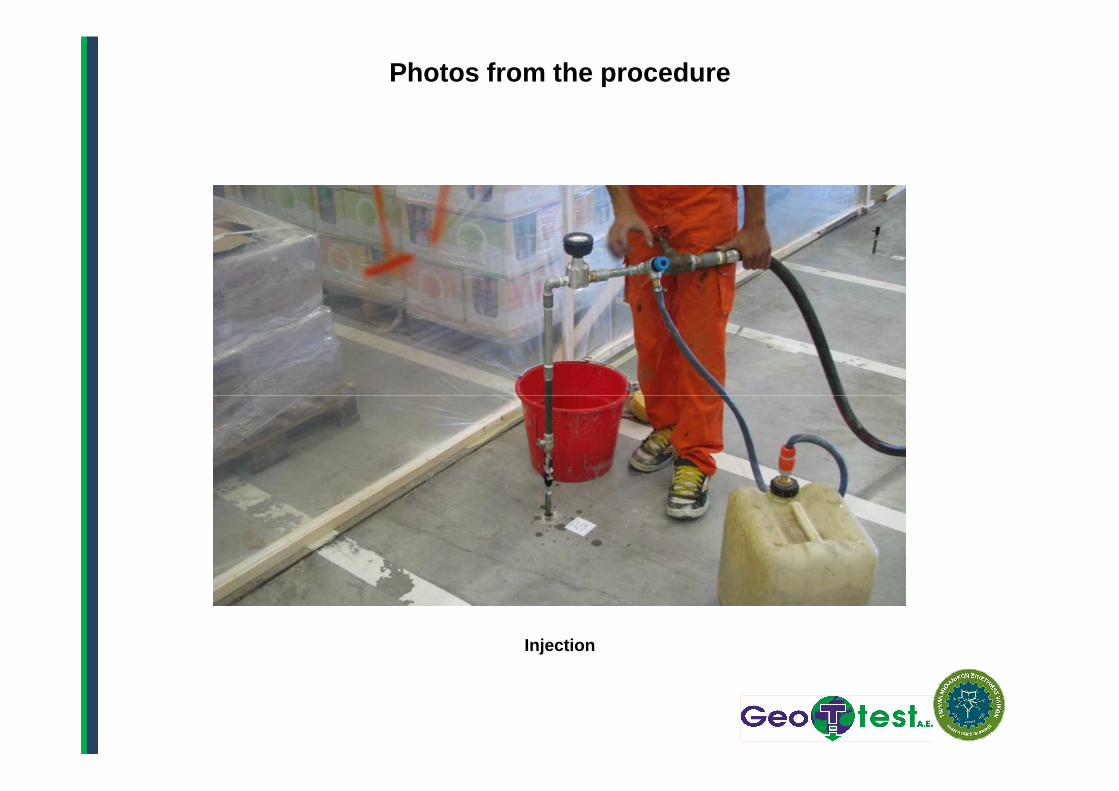
Photos from the procedure
Injection
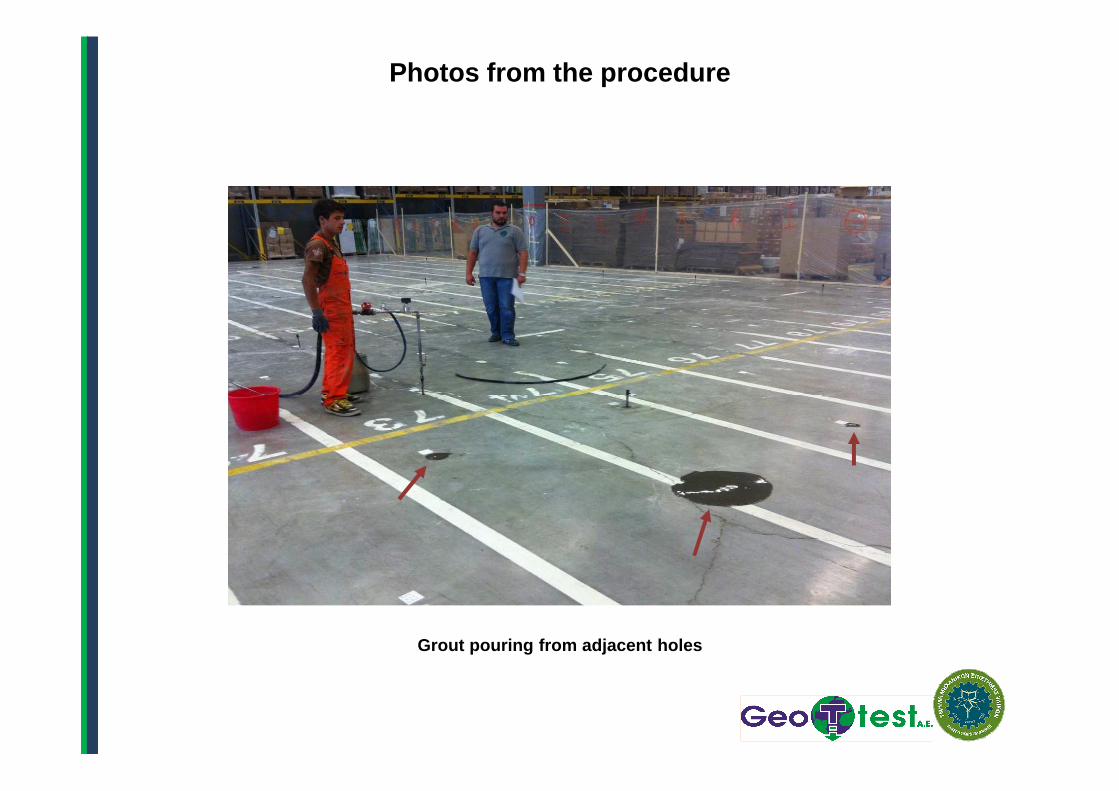
Photos from the procedure
Grout pouring from adjacent holes
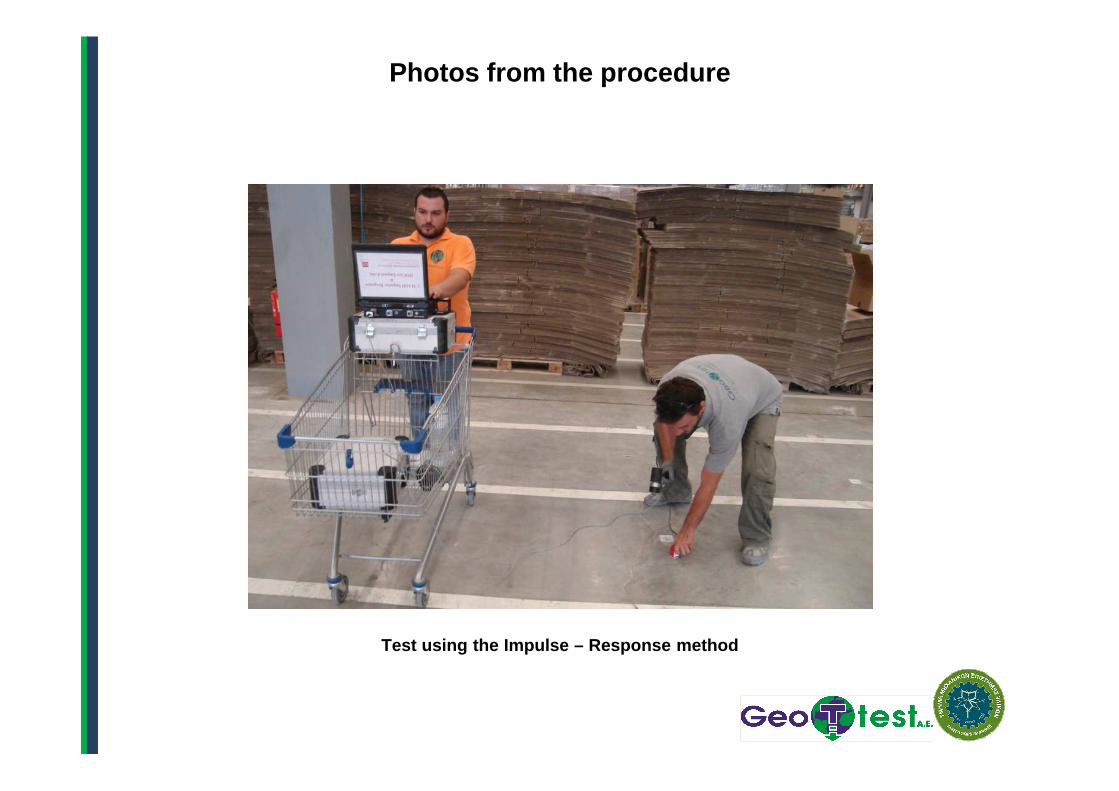
Photos from the procedure
Test using the Impulse – Response method
Impulse – Response Method
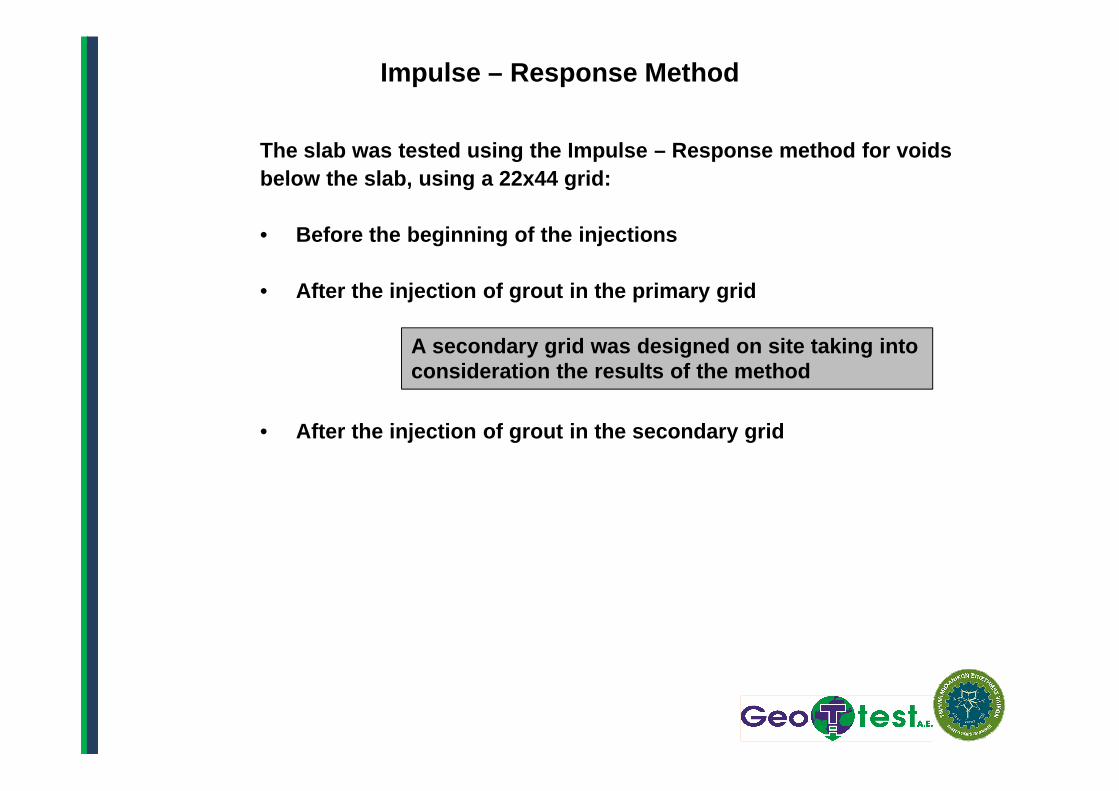
The slab was tested using the Impulse – Response met hod for voids below the slab, using a 22x44 grid:
• Before the beginning of the injections
• After the injection of grout in the primary grid
A secondary grid was designed on site taking into consideration the results of the method
• After the injection of grout in the secondary grid
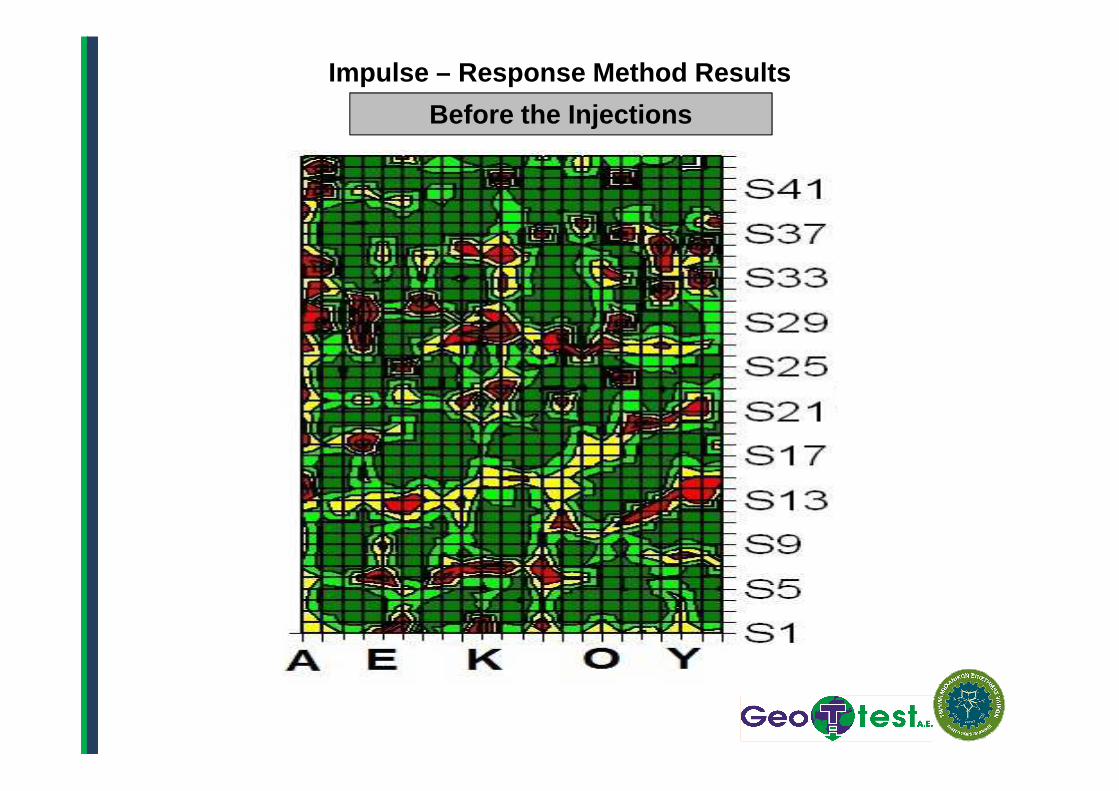
Impulse – Response Method Results
Before the Injections
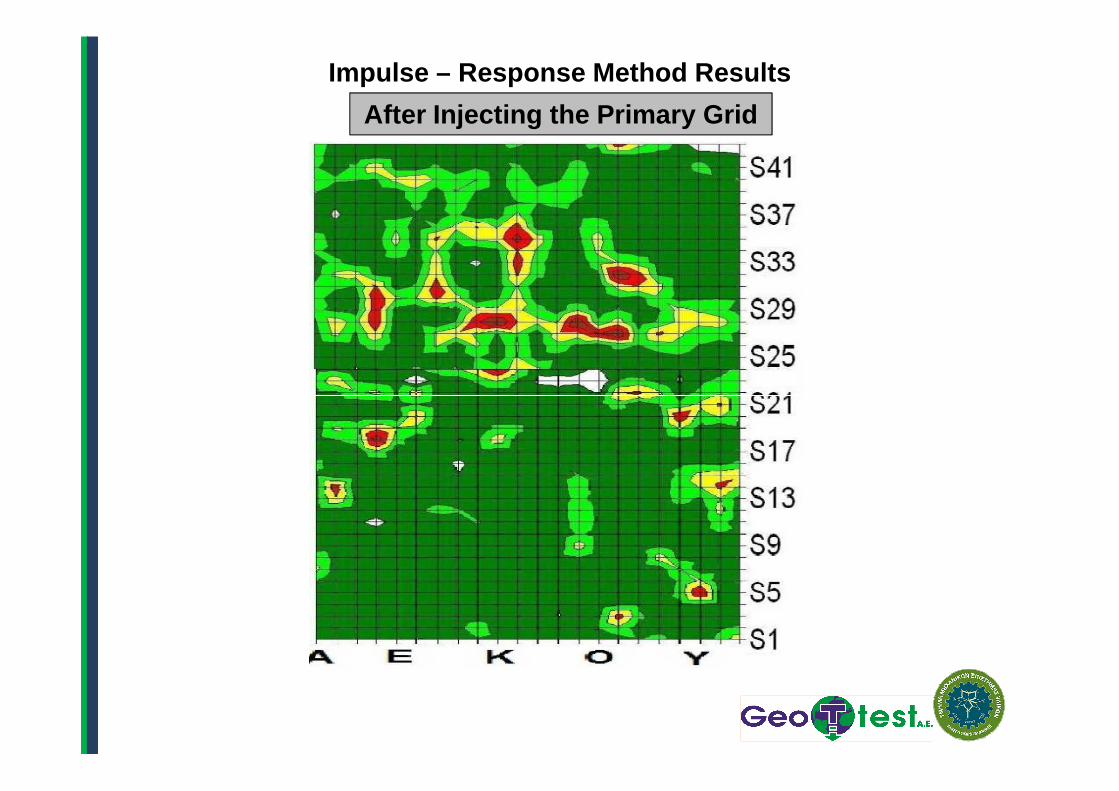
After Injecting the Primary Grid
Impulse – Response Method Results
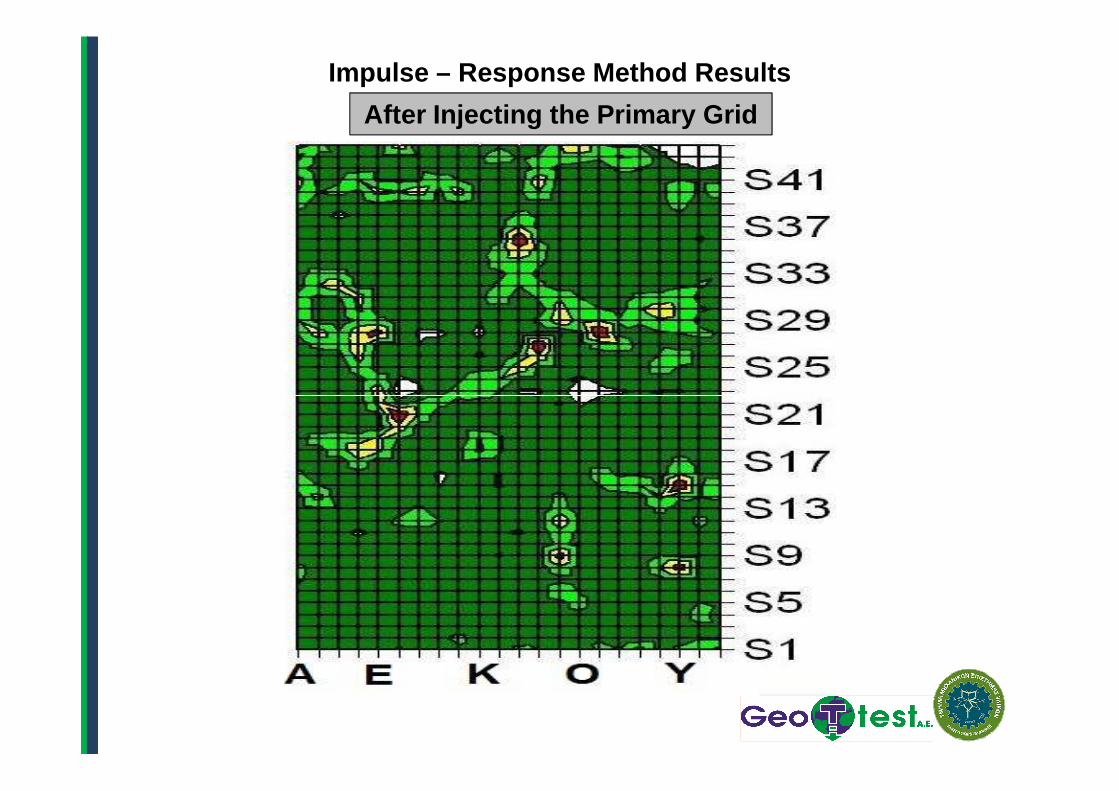
After Injecting the Primary Grid
Impulse – Response Method Results
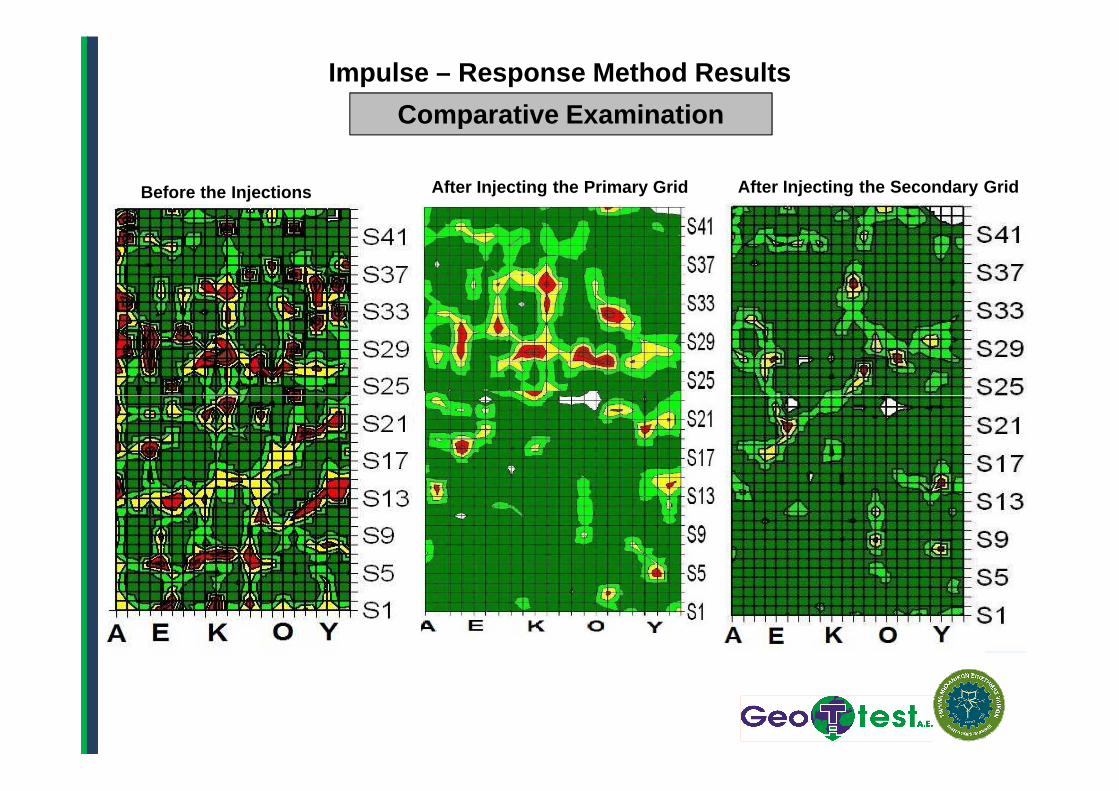
Impulse – Response Method Results
Comparative Examination
After Injecting the Primary GridBefore the Injections After Injecting the Secondary Grid
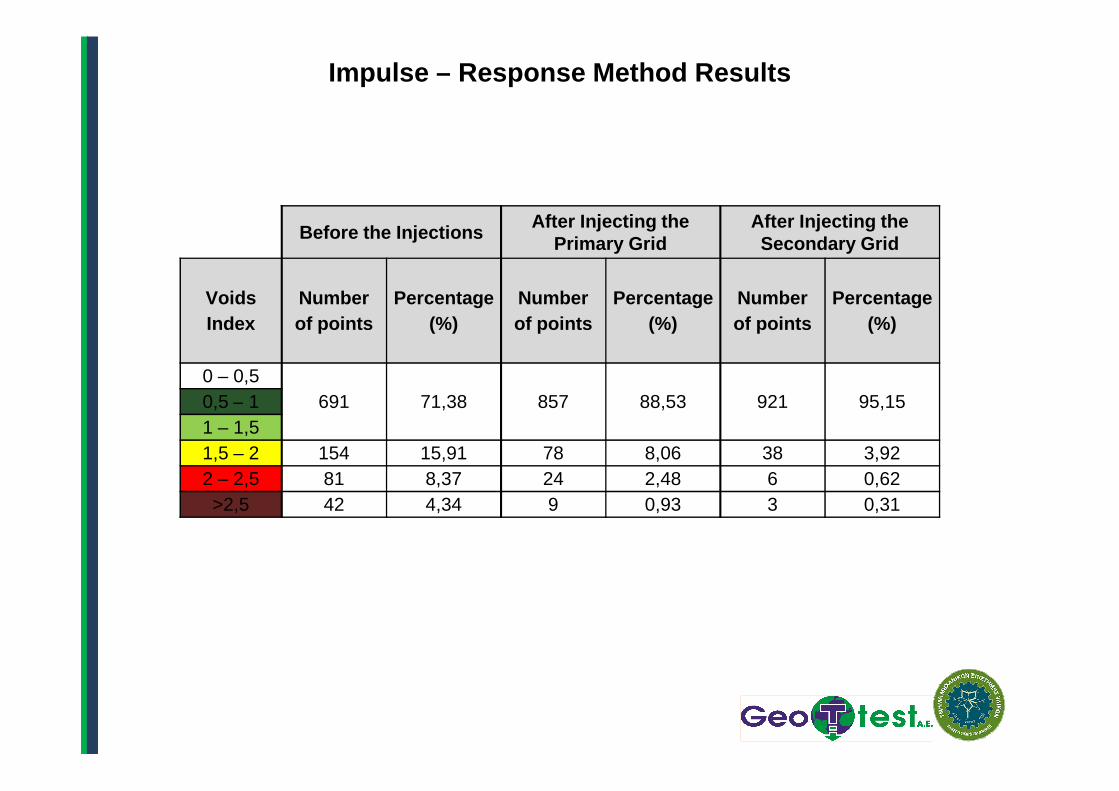
Impulse – Response Method Results
Before the InjectionsAfter Injecting the
Primary GridAfter Injecting the Secondary Grid
VoidsIndex
Number of points
Percentage(%)
Number of points
Percentage(%)
Number of points
Percentage(%)
0 – 0,5691 71,38 857 88,53 921 95,150,5 – 1 691 71,38 857 88,53 921 95,150,5 – 1
1 – 1,51,5 – 2 154 15,91 78 8,06 38 3,922 – 2,5 81 8,37 24 2,48 6 0,62>2,5 42 4,34 9 0,93 3 0,31
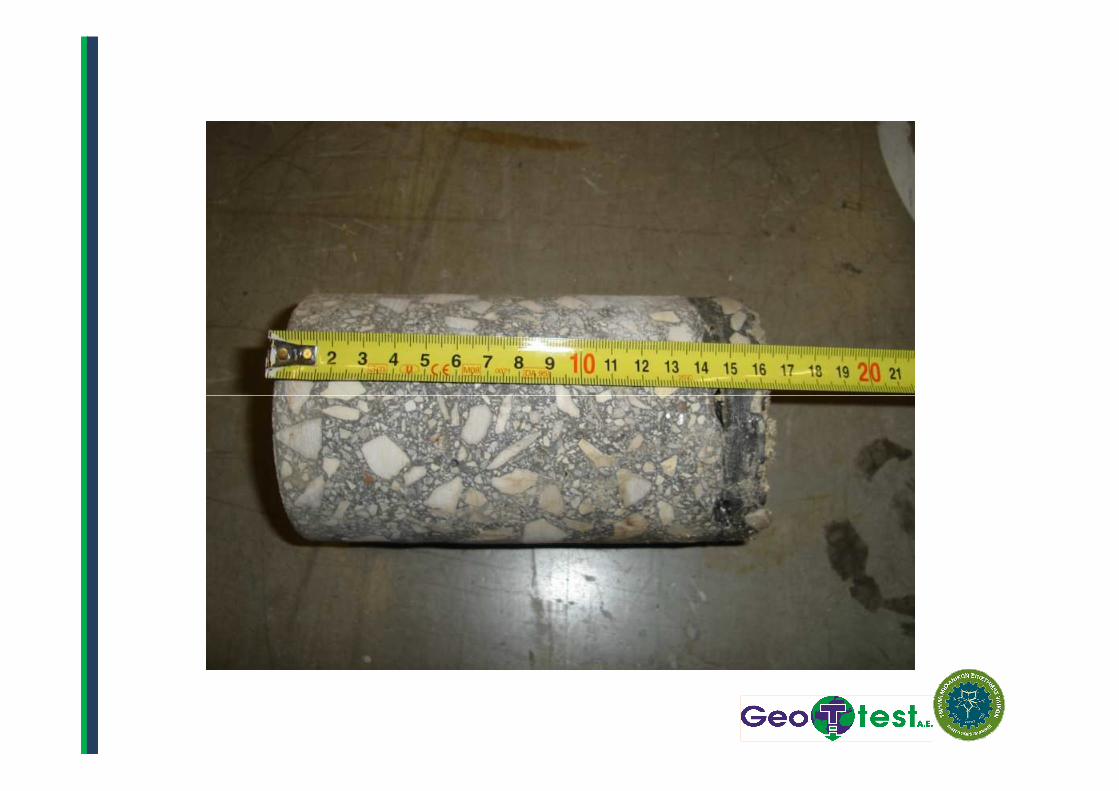
The results of the Impulse – Response method were confirmed by concrete method were confirmed by concrete
cores that were cut off

THANK YOUTHANK YOU