Embed Size (px)
Citation preview
Reply
RYAN P. CROMPTON, K. JOHN MCANENEY, KEPING CHEN, ROGER A. PIELKE JR.,AND KATHARINE HAYNES
(Manuscript received and in final form on 22 December 2010)
In our article (Crompton et al. 2010) we normalized
bushfire building damage to current societal conditions
by multiplying historical loss records by the factor
change in total dwelling numbers from when the event
occurred to 2008/09. The dwelling number factor was
calculated at the state level and we tested the validity
of this resolution using two historic case studies: the
1967 Hobart and 1983 Ash Wednesday bushfires. No
trend in building damage was found after normalization.
Nicholls (2011) speculates that the absence of an up-
ward trend in normalized building damage may reflect
a bias introduced through our use of state level nor-
malization factors and presumed reductions in vulner-
ability over the time period examined: 1925–2009. Here
we explain why the factors that Nicholls states as being
unaccounted for either miss the most important points,
are uncertain and unquantifiable, or are negligible in
extreme impact events such as the 7 February 2009
Black Saturday bushfires. The extreme impact events
are critical as these dictate the pattern in normalized
building damage.
The first issue raised by Nicholls (2011) is that state
level normalization factors do not account for the in-
creasing urbanization of Australia and that this is im-
portant because capital city populations are generally
far less vulnerable to bushfires than those living in small
towns or isolated communities. Our estimate of pop-
ulation distribution change is not as dramatic as that
reported by Nicholls: according to the Australian Histor-
ical Population Statistics [available from the Australian
Bureau of Statistics (ABS) online at http://www.abs.
gov.au], the proportions of the population outside each
of the capital cities of Victoria, New South Wales, and
Tasmania in 1958 were 37%, 45%, and 68% and
equivalent figures for 2007 (the latest year for which data
were available) were 27%, 37%, and 58%. If we adopt
the ABS classification on urban and rural dwellings (the
ABS defines urban areas to be those with 1000 or more
people), the change of rate is even less pronounced over
a similar timeframe: the proportions of rural dwellings in
Victoria, New South Wales, and Tasmania in 1961 were
16%, 15%, and 33%, only slightly decreasing to 11%,
11%, and 29% in 2006 (dwelling data are contained in
the census of population and housing and are available
from the ABS). Note that these three states of southeast
Australia account for over 90% of total normalized
building damage.
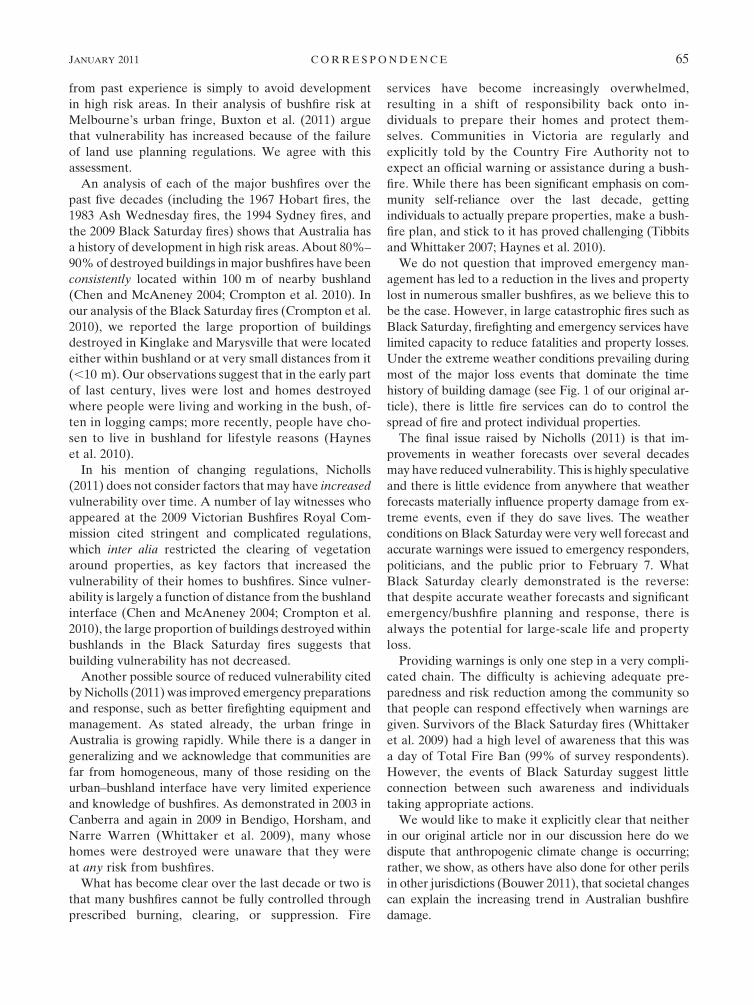
In focusing on urbanization and the relative vulnera-
bility of cities and areas outside of cities, Nicholls (2011)
misses the point—what matters most to our normaliza-
tion is how the rate of growth of bushfire-prone dwell-
ings compares to that of state level total dwellings. In
particular, he overlooks urban encroachment into bush-
lands on the fringes of many Australian cities (e.g., Fig. 1).
Rapid urban encroachment has resulted in an increase
in the absolute number of bushfire-prone dwellings in
Melbourne (Victoria), Sydney (New South Wales), and
Hobart (Tasmania). It also has produced a likely in-
crease in the proportion of bushfire-prone dwellings in
some capital cities (e.g., Sydney and Hobart); that is, the
rate of growth of bushfire-prone dwellings exceeds that
of total dwellings in some capital cities. While it is not
possible to quantify this or the number of bushfire-prone
dwellings at any resolution throughout our period of
study, if this has occurred, then the rate of growth of
bushfire-prone dwellings in some capital cities must
have also exceeded that of respective state level total
dwellings.
We should also note that there is evidence to suggest
that for some areas outside of capital cities, the rate of
growth of bushfire-prone dwellings has been similar
to and, if anything, larger than the contemporaneous
Corresponding author address: Ryan P. Crompton, Risk Fron-
tiers, Macquarie University, Sydney, NSW 2109, Australia.
E-mail: [email protected]
JANUARY 2011 C O R R E S P O N D E N C E 63
DOI: 10.1175/WCAS-D-11-00002.1
� 2011 American Meteorological Society

growth in statewide total dwellings. This evidence in-
cludes the 1983 Ash Wednesday fires case study shown
in Table 2 of our original article and two of the most
severely affected locations (Kinglake and Marysville)
in the 2009 Black Saturday fires (Table 1). There is
further evidence in those areas impacted by the 1967
Hobart fires outside of Hobart.
So what is the significance of this discussion?
Where rates of bushfire-prone dwelling growth ex-
ceed that of total dwellings across the state, then this will
have the opposite effect to that suggested by Nicholls
(2011): historic events should have a larger normaliza-
tion factor applied to them, which would in turn tend
to make the trend in normalized damage negative. In
other words, if anything, our normalization using state
total dwellings is likely conservative.
Nicholls (2011) refers to several factors that may have
led to a reduction in building vulnerability to bushfire
over time. He also suggests bushfire risk reduction mea-
sures undertaken by property owners to be a recent
phenomenon. However, preparing a property and active
defense to save lives and livelihoods has been a necessity
for generations of rural Australians. The ‘‘stay and de-
fend, or leave early’’ policy may have become official
Australian Fire Authority Commission policy in 2005,
but it has been implemented as a survival strategy in
rural areas and country towns since European settle-
ment (Handmer and Tibbits 2005). An examination of
many eyewitness accounts of Australian bushfire prep-
aration and survival demonstrates that little has changed
over 100 years (Haynes et al. 2010).
Nicholls (2011) further argues that changes in building
or planning regulations and autonomous actions by
householders (in response to official enquiries into past
major bushfire disasters or otherwise) would have led
to a decline in damage. While many lessons have been
learned from past experience, it is unlikely that any
changes implemented would have prevented the im-
pacts of the most extremely damaging bushfires. The
most important lesson that should have been learned
FIG. 1. Aerial view of northern Sydney showing the highly dissected and complex interface (red
line) between bushland (dark green) and urban areas.
TABLE 1. The factor change in dwellings at 10-yr intervals rela-
tive to the 2008 bushfire year. The underlying data are from the
census of population and housing in the stated years (available
from the ABS).
Dwelling factor
Year Victoria
Kinglake
UCL
Marysville
UCL
1966 2.3 Not available 2.1
1976 1.7 Not available 2.3
1986 1.4 3.5 1.4
1996 1.2 2.6 1.1
64 W E A T H E R , C L I M A T E , A N D S O C I E T Y VOLUME 3
from past experience is simply to avoid development
in high risk areas. In their analysis of bushfire risk at
Melbourne’s urban fringe, Buxton et al. (2011) argue
that vulnerability has increased because of the failure
of land use planning regulations. We agree with this
assessment.
An analysis of each of the major bushfires over the
past five decades (including the 1967 Hobart fires, the
1983 Ash Wednesday fires, the 1994 Sydney fires, and
the 2009 Black Saturday fires) shows that Australia has
a history of development in high risk areas. About 80%–
90% of destroyed buildings in major bushfires have been
consistently located within 100 m of nearby bushland
(Chen and McAneney 2004; Crompton et al. 2010). In
our analysis of the Black Saturday fires (Crompton et al.
2010), we reported the large proportion of buildings
destroyed in Kinglake and Marysville that were located
either within bushland or at very small distances from it
(,10 m). Our observations suggest that in the early part
of last century, lives were lost and homes destroyed
where people were living and working in the bush, of-
ten in logging camps; more recently, people have cho-
sen to live in bushland for lifestyle reasons (Haynes
et al. 2010).
In his mention of changing regulations, Nicholls
(2011) does not consider factors that may have increased
vulnerability over time. A number of lay witnesses who
appeared at the 2009 Victorian Bushfires Royal Com-
mission cited stringent and complicated regulations,
which inter alia restricted the clearing of vegetation
around properties, as key factors that increased the
vulnerability of their homes to bushfires. Since vulner-
ability is largely a function of distance from the bushland
interface (Chen and McAneney 2004; Crompton et al.
2010), the large proportion of buildings destroyed within
bushlands in the Black Saturday fires suggests that
building vulnerability has not decreased.
Another possible source of reduced vulnerability cited
by Nicholls (2011) was improved emergency preparations
and response, such as better firefighting equipment and
management. As stated already, the urban fringe in
Australia is growing rapidly. While there is a danger in
generalizing and we acknowledge that communities are
far from homogeneous, many of those residing on the
urban–bushland interface have very limited experience
and knowledge of bushfires. As demonstrated in 2003 in
Canberra and again in 2009 in Bendigo, Horsham, and
Narre Warren (Whittaker et al. 2009), many whose
homes were destroyed were unaware that they were
at any risk from bushfires.
What has become clear over the last decade or two is
that many bushfires cannot be fully controlled through
prescribed burning, clearing, or suppression. Fire
services have become increasingly overwhelmed,
resulting in a shift of responsibility back onto in-
dividuals to prepare their homes and protect them-
selves. Communities in Victoria are regularly and
explicitly told by the Country Fire Authority not to
expect an official warning or assistance during a bush-
fire. While there has been significant emphasis on com-
munity self-reliance over the last decade, getting
individuals to actually prepare properties, make a bush-
fire plan, and stick to it has proved challenging (Tibbits
and Whittaker 2007; Haynes et al. 2010).
We do not question that improved emergency man-
agement has led to a reduction in the lives and property
lost in numerous smaller bushfires, as we believe this to
be the case. However, in large catastrophic fires such as
Black Saturday, firefighting and emergency services have
limited capacity to reduce fatalities and property losses.
Under the extreme weather conditions prevailing during
most of the major loss events that dominate the time
history of building damage (see Fig. 1 of our original ar-
ticle), there is little fire services can do to control the
spread of fire and protect individual properties.
The final issue raised by Nicholls (2011) is that im-
provements in weather forecasts over several decades
may have reduced vulnerability. This is highly speculative
and there is little evidence from anywhere that weather
forecasts materially influence property damage from ex-
treme events, even if they do save lives. The weather
conditions on Black Saturday were very well forecast and
accurate warnings were issued to emergency responders,
politicians, and the public prior to February 7. What
Black Saturday clearly demonstrated is the reverse:
that despite accurate weather forecasts and significant
emergency/bushfire planning and response, there is
always the potential for large-scale life and property
loss.
Providing warnings is only one step in a very compli-
cated chain. The difficulty is achieving adequate pre-
paredness and risk reduction among the community so
that people can respond effectively when warnings are
given. Survivors of the Black Saturday fires (Whittaker
et al. 2009) had a high level of awareness that this was
a day of Total Fire Ban (99% of survey respondents).
However, the events of Black Saturday suggest little
connection between such awareness and individuals
taking appropriate actions.
We would like to make it explicitly clear that neither
in our original article nor in our discussion here do we
dispute that anthropogenic climate change is occurring;
rather, we show, as others have also done for other perils
in other jurisdictions (Bouwer 2011), that societal changes
can explain the increasing trend in Australian bushfire
damage.
JANUARY 2011 C O R R E S P O N D E N C E 65

Our result—that there is no discernable evidence that
normalized building damage is being influenced by cli-
mate change due to the emission of greenhouse gases—
is not surprising, when you consider that bushfire
damage is not solely a function of bushfire weather; far
from it, in fact. Even given a gradual aggravation of
bushfire weather due to anthropogenic climate change
or other factors, a bushfire still has to be ignited. Once
ignited, a bushfire then has to traverse the landscape
and impact a populated area, where outcomes in terms
of damage will be a function of the spatial disposition
of dwellings with respect to the fire front, and espe-
cially distance of properties from the bushland bound-
ary (McAneney et al. 2009). These factors all contribute
a large degree of stochasticity to eventual event loss
outcomes.
The Nicholls (2011) speculations are worthy of dis-
cussion but no evidence is presented to support these
contentions. Moreover, the evidence that we are aware
of and have presented here in relation to a potential bias
in our normalization methodology and to the possible
sources of reduced vulnerability does not undermine
our findings in any way. Our conclusion holds up well
without Nicholls’ proposed caveat. Generally speaking,
if others are able to improve upon our normalization
methodology, then we encourage them to do so.
REFERENCES
Bouwer, L. M., 2011: Have disaster losses increased due to anthro-
pogenic climate change? Bull. Amer. Meteor. Soc., 92, 39–46.
Buxton, M., R. Haynes, D. Mercer, and A. Butt, 2011: Vulnera-
bility to bushfire risk at Melbourne’s urban fringe: The failure
of regulatory land use planning. Geogr. Res., 49, 1–12,
doi:10.1111/j.1745-5871.2010.00670.x.
Chen, K., and K. J. McAneney, 2004: Quantifying bushfire pene-
tration into urban areas in Australia. Geophys. Res. Lett., 31,
L12212, doi:10.1029/2004GL020244.
Crompton, R. P., K. J. McAneney, K. Chen, R. A. Pielke Jr., and
K. Haynes, 2010: Influence of location, population, and cli-
mate on building damage and fatalities due to Australian
bushfire: 1925–2009. Wea. Climate Soc., 2, 300–310.
Handmer, J., and A. Tibbits, 2005: Is staying at home the safest
option during bushfires? Historical evidence for an Australian
approach. Global Environ. Change, 6, 81–91.
Haynes, K., J. Handmer, J. McAneney, A. Tibbits, and L. Coates,
2010: Australian bushfire fatalities 1900-2008: Exploring trends
in relation to the ‘prepare, stay and defend or leave early’ policy.
Environ. Sci. Policy, 13, 185–194.
McAneney, J., K. Chen, and A. Pitman, 2009: 100 years of Aus-
tralian bushfire property losses: Is the risk significant and is it
increasing? J. Environ. Manage., 90, 2819–2822.
Nicholls, N., 2011: Comments on ‘‘Influence of location, popula-
tion, and climate on building damage and fatalities due to
Australian bushfire: 1925–2009.’’ Wea. Climate Soc., 3, 61–62.
Tibbits, A., and J. Whittaker, 2007: Stay and defend or leave early:
Policy problems and experiences during the 2003 Victorian
bushfires. Environ. Hazards, 7, 283–290.
Whittaker, J., J. McLennan, G. Elliott, J. Gilbert, J. Handmer,
K. Haynes, and S. Cowlishaw, 2009: Research results from
February 7th Victorian fires report on human behaviour and
community safety. Report for the Bushfire CRC, Australia, 47 pp.
[Available online at http://www.bushfirecrc.com/sites/default/
files/managed/resource/chapter-2-human-behaviour.pdf.]
66 W E A T H E R , C L I M A T E , A N D S O C I E T Y VOLUME 3