Embed Size (px)
Citation preview

October 2017 CHIS 2015-2016 Methodology Report Series
Report 3
Data Processing Procedures

CALIFORNIA HEALTH INTERVIEW SURVEY
CHIS 2015-2016 METHODOLOGY SERIES
REPORT 3
DATA PROCESSING PROCEDURES
OCTOBER 2017
This report was prepared for the California Health Interview Survey by Darryl Cooney, Julie Linville, and Dustin Williams of RTI International.

www.chis.ucla.edu
This report describes the data processing and editing procedures for CHIS 2015-2016 performed
by RTI International. This report discusses standard data editing procedures and addresses the steps taken
for ensuring data quality. It also present discussions on special procedures of editing and coding of
geography as well as race and ethnicity survey items.
Suggested citation:
California Health Interview Survey. CHIS 2015-2016 Methodology Series: Report 3 - Data Processing Procedures. Los Angeles, CA: UCLA Center for Health Policy Research, 2017.
Copyright 2017 by the Regents of the University of California.
The California Health Interview Survey is a collaborative project of the UCLA Center for Health Policy Research, the California Department of Public Health, and the Department of Health Care Services. Funding for CHIS 2015-2016 came from multiple sources: the California Department of Health Care Services, the California Department of Health Care Services (Mental Health Services Division), the California Department of Public Health, The California Endowment, the California Health Benefit Exchange, the California Health Care Foundation, the California Tobacco Control Program and UC San Diego, the California Wellness Foundation, First 5 California, Kaiser Permanente, Keiro Senior HealthCare, San Diego County Health and Human Services Agency, the Williams Institute at UCLA Law School, Marin County Health and Human Services, Imperial County Public Health Department, and the California Immigration Research Initiative.

i
PREFACE
Data Processing Procedures is the third in a series of methodological reports describing the
2015-2016 California Health Interview Survey (CHIS 2015-2016). The other reports are listed below.
CHIS is a collaborative project of the University of California, Los Angeles (UCLA) Center for
Health Policy Research, the California Department of Public Health, and the Department of Health Care
Services. RTI International was responsible for data collection and the preparation of five
methodological reports from the 2015-2016 survey. The survey examines public health and health care
access issues in California. The telephone survey is the largest state health survey ever undertaken in the
United States.
Methodological Report Series for CHIS 2015-2016
The methodological reports for CHIS 2015-2016 are as follows:
Report 1: Sample Design;
Report 2: Data Collection Methods;
Report 3: Data Processing Procedures;
Report 4: Response Rates; and
Report 5: Weighting and Variance Estimation.
The reports are interrelated and contain many references to each other. For ease of presentation,
the references are simply labeled by the report numbers given above. After the Preface, each report
includes an “Overview” (Chapter 1) that is nearly identical across reports, followed by detailed technical
documentation on the specific topic of the report.
Report 3: Data Processing Procedures (this report) describes the data processing and editing
procedures for CHIS 2015-2016. One chapter details the data editing procedures and addresses the steps
taken for ensuring data quality. Delivery of the final data sets is also discussed. Another chapter presents
information about geographic coding. The next chapter describes how the race and ethnicity survey items
were coded for CHIS.
For further methodological details not covered in this report, refer to the other methodological
reports in the series at http://healthpolicy.ucla.edu/chis/design/Pages/methodology.aspx. General
information on CHIS data can be found on the California Health Interview Survey Web site at
http://www.chis.ucla.edu or by contacting CHIS at [email protected].

ii
TABLE OF CONTENTS
Chapter Page
PREFACE ............................................................................................................................................... i 1. CHIS 2015-2016 SAMPLE DESIGN AND METHODOLOGY SUMMARY ........................... 1-1
1.1 Overview ................................................................................................................... 1-1 1.2 Switch to a Continuous Survey ................................................................................. 1-2 1.3 Sample Design Objectives ........................................................................................ 1-3 1.4 Data Collection.......................................................................................................... 1-6 1.5 Responsive and Adaptive Design Elements ............................................................ 1-11 1.6 Response Rates ....................................................................................................... 1-11 1.7 Weighting the Sample ............................................................................................. 1-14 1.8 Imputation Methods ................................................................................................ 1-15
2. DATA EDITING PROCEDURES ............................................................................................... 2-1 2.1 Resolving Problem Cases .......................................................................................... 2-2 2.2 Interviewer Comments .............................................................................................. 2-3 2.3 Coding with Text Strings .......................................................................................... 2-3 2.4 Verifying Data Updates ............................................................................................. 2-5
3. GEOGRAPHIC CODING ............................................................................................................ 3-1 3.1 County of Residence ................................................................................................. 3-1 3.2 Geocoding Process .................................................................................................... 3-2 3.3 School Names ........................................................................................................... 3-7
4. INDUSTRY AND OCCUPATION CODING ............................................................................. 4-1 5. RACE AND ETHNICITY CODING ........................................................................................... 5-1
5.1 Coding Procedures .................................................................................................... 5-1 6. IMPERIAL COUNTY ADDRESS-BASED SAMPLE (ABS) .................................................... 6-1
List of Tables Table Page
1-1. California county and county group strata used in the CHIS 2015-2016 sample design .............. 1-5 1-2. Number of completed CHIS 2015-2016 interviews by type of sample and instrument ............... 1-7 1-3. CHIS 2015-2016 survey topic areas by instrument ...................................................................... 1-8 1-4a. CHIS 2015 response rates – Conditional .................................................................................... 1-12 1-4b. CHIS 2015 response rates – Unconditional ................................................................................ 1-12 1-4c. CHIS 2016 response rates – Conditional .................................................................................... 1-12 1-4d. CHIS 2016 response rates – Unconditional ................................................................................ 1-13 1-5. 2015-2016 CHIS incentives by interview type ........................................................................... 1-13 3-1. Number of Geocodes Assigned by Rule and by Sample Type ..................................................... 3-3 3-2. Final distribution of adult extended completed cases by self-reported and original
sampling stratum, landline/list sample for CHIS 2015-2016 ........................................................ 3-4 3-3. Final distribution of adult extended completed cases by self-reported and original
sampling stratum, cell phone sample for CHIS 2015-2016 .......................................................... 3-6

1-1
1. CHIS 2015-2016 SAMPLE DESIGN AND METHODOLOGY SUMMARY
1.1 Overview
A series of five methodology reports are available with more detail about the methods used in
CHIS 2015-2016.
Report 1 – Sample Design;
Report 2 – Data Collection Methods;
Report 3 – Data Processing Procedures;
Report 4 – Response Rates; and
Report 5 – Weighting and Variance Estimation.
For further information on CHIS data and the methods used in the survey, visit the California
Health Interview Survey Web site at http://www.chis.ucla.edu or contact CHIS at [email protected]. For
methodology reports from previous CHIS cycles, go to http://healthpolicy.ucla.edu/chis/design/Pages/
methodology.aspx
The CHIS is a population-based telephone survey of California’s residential, non-institutionalized
population conducted every other year since 2001 and continually beginning in 2011. CHIS is the
nation’s largest state-level health survey and one of the largest health surveys in the nation. The UCLA
Center for Health Policy Research (UCLA-CHPR) conducts CHIS in collaboration with the California
Department of Public Health and the Department of Health Care Services. CHIS collects extensive
information for all age groups on health status, health conditions, health-related behaviors, health
insurance coverage, access to health care services, and other health and health-related issues.
The sample is designed and optimized to meet two objectives:
1) Provide estimates for large- and medium-sized counties in the state, and for groups of the smallest counties (based on population size), and
2) Provide statewide estimates for California’s overall population, its major racial and ethnic groups, as well as several racial and ethnic subgroups.
The CHIS sample is representative of California’s non-institutionalized population living in
households. CHIS data and results are used extensively by federal and State agencies, local public health
agencies and organizations, advocacy and community organizations, other local agencies, hospitals,
community clinics, health plans, foundations, and researchers. These data are used for analyses and

1-2
publications to assess public health and health care needs, to develop and advocate policies to meet those
needs, and to plan and budget health care coverage and services. Many researchers throughout California
and the nation use CHIS data files to further their understanding of a wide range of health-related issues
(visit UCLA-CHPR’s publication page at http://healthpolicy.ucla.edu/publications/Pages/default.aspx for
examples of CHIS studies).
1.2 Switch to a Continuous Survey
From the first CHIS cycle in 2001 through 2009, CHIS data were collected during a 7 to 9 month
period every other year. Beginning in 2011, CHIS data have been collected continually over a 2-year
cycle. This change was driven by several factors including the ability to track and release information
about health in California on a more frequent and timely basis and to eliminate potential seasonality in the
biennial data.
CHIS 2015 data were collected between May 2015 and mid-February 2016. CHIS 2016 data
were collected between January and December 2016. Approximately half of the interviews were
conducted during the 2015 calendar year and half during the 2016 calendar year. As in previous CHIS
cycles, weights are included with the data files and are based on the State of California’s Department of
Finance population estimates and projections, adjusted to remove the population living in group quarters
(such as nursing homes, prisons, etc.) and thus not eligible to participate in CHIS. When the weights are
applied to the data, the results represent California’s residential population during that year for the age
group corresponding to the data file in use (adult, adolescent, or child). In CHIS 2015-2016, data users
will be able to produce single-year estimates using the weights provided (referred to as CHIS 2015 and
CHIS 2016, respectively).
See what’s new in the 2015-2016 CHIS sampling and data collection here:
http://healthpolicy.ucla.edu/chis/design/Documents/whats-new-chis-2015-2016.pdf
In order to provide CHIS data users with more complete and up-to-date information to facilitate
analyses of CHIS data, additional information on how to use the CHIS sampling weights, including
sample statistical code, is available at http://healthpolicy.ucla.edu/chis/analyze/Pages/sample-code.aspx.
Additional documentation on constructing the CHIS sampling weights is available in the CHIS
2015-2016 Methodology Series: Report 5—Weighting and Variance Estimation posted at
http://healthpolicy.ucla.edu/chis/design/Pages/methodology.aspx. Other helpful information for

1-3
understanding the CHIS sample design and data collection processing can be found in the four other
methodology reports for each CHIS cycle year.
1.3 Sample Design Objectives
The CHIS 2015-2016 sample was designed to meet the two sampling objectives discussed above:
(1) provide estimates for adults in most counties and in groups of counties with small populations; and (2)
provide estimates for California’s overall population, major racial and ethnic groups, and for several
smaller racial and ethnic subgroups.
To achieve these objectives, CHIS employed a dual-frame, multi-stage sample design. The
random-digit-dial (RDD) sample included telephone numbers assigned to both landline and cellular
service. The RDD sample was designed to achieve the required number of completed adult interviews by
using approximately 50% landline and 50% cellular phone numbers. For the RDD sample, the 58
counties in the state were grouped into 44 geographic sampling strata, and 14 sub-strata were created
within the two most populous counties in the state (Los Angeles and San Diego). The same geographic
stratification of the state has been used since CHIS 2005. The Los Angeles County stratum included eight
sub-strata for Service Planning Areas, and the San Diego County stratum included six sub-strata for
Health Service Districts. Most of the strata (39 of 44) consisted of a single county with no sub-strata (see
counties 3-41 in Table 1-1). Three multi-county strata comprised the 17 remaining counties (see counties
42-44 in Table 1-1). A sufficient number of adult interviews were allocated to each stratum and sub-
stratum to support the first sample design objective for the two-year period—to provide health estimates
for adults at the local level. Asian surname sample list frames added 426 Japanese, 280 Korean, and 359
Vietnamese adult interviews based on self-identified ethnicity for the combined 2015 and 2016 survey
years.1 Additional samples from both the landline and cell phone frames produced 1,042 interviews in
2015 within Marin County and 2,388 interviews in 2016 within San Diego County. Furthermore, an
address-based sample from the USPS Delivery Sequence File produced 258 landline or cell phone
interviews in 2016 within the northern part of Imperial County.
Within each geographic stratum, residential telephone numbers were selected, and within each
household, one adult (age 18 and over) respondent was randomly selected. In those households with
adolescents (ages 12-17) and/or children (under age 12), one adolescent and one child of the randomly
1 For the 2015 and 2016 survey years combined, all sample frames produced totals of 667 Japanese, 497 Korean, and 597 Vietnamese adult interviews.

1-4
selected parent/guardian were randomly selected; the adolescent was interviewed directly, and the adult
sufficiently knowledgeable about the child’s health completed the child interview.
The CHIS RDD sample is of sufficient size to accomplish the second objective (produce
estimates for the state’s major racial/ethnic groups, as well as many ethnic subgroups). However, given
the smaller sample sizes of one-year data files, two or more pooled cycles of CHIS data are generally
required to produce statistically stable estimates for small population groups such as racial/ethnic
subgroups, children, teens, etc. To increase the precision of estimates for Koreans and Vietnamese, areas
with relatively high concentrations of these groups were sampled at higher rates. These geographically
targeted oversamples were supplemented by telephone numbers associated with group-specific surnames,
drawn from listed telephone directories to increase the sample size further for Koreans and Vietnamese.
Surname and given name lists were used similarly to increase the yield of Californians of Japanese
descent.
To help compensate for the increasing number of households without landline telephone service,
a separate RDD sample was drawn of telephone numbers assigned to cellular service. In CHIS 2015 and
2016, the goal was to complete approximately 50% of all RDD interviews statewide with adults contacted
via cell phone. Because the geographic information available for cell phone numbers is limited and not as
precise as that for landlines, cell phone numbers were assigned to the same 44 geographic strata (i.e., 41
strata defined by a single county and 3 strata created by multiple counties) using a classification
associated with the rate center linked to the account activation. The cell phone stratification closely
resembles that of the landline sample and has the same stratum names, though the cell phone strata
represent slightly different geographic areas than the landline strata. The adult owner of the sampled cell
phone number was automatically selected for CHIS. Cell numbers used exclusively by children under 18
were considered ineligible. A total of 1,594 teen interviews and 4,293 child interviews were completed in
CHIS 2015-2016 with approximately 58% coming from the cell phone sample.
The cell phone sampling method used in CHIS has evolved significantly since its first
implementation in 2007 when only cell numbers belonging to adults in cell-only households were eligible
for sampling adults. These changes reflect the rapidly changing nature of cell phone ownership and use in
the US.2 There have been three significant changes to the cell phone sample since 2009. First, all cell
phone sample numbers used for non-business purposes by adults living in California were eligible for the
extended interview. Thus, adults in households with landlines who had their own cell phones or shared
2 http://www.cdc.gov/nchs/data/nhis/earlyrelease/wireless201605.pdf

1-5
one with another adult household member could have been selected through either the cell or landline
sample. The second change was the inclusion of child and adolescent extended interviews. The third,
enacted in CHIS 2015-2016 was to increase the fraction of the sample comprised of cell phones from
20% to 50% of completed interviews.
Table 1-1. California county and county group strata used in the CHIS 2015-2016 sample design
1. Los Angeles 7. Alameda 27. Shasta
1.1 Antelope Valley 8. Sacramento 28. Yolo
1.2 San Fernando Valley 9. Contra Costa 29. El Dorado
1.3 San Gabriel Valley 10. Fresno 30. Imperial
1.4 Metro 11. San Francisco 31. Napa
1.5 West 12. Ventura 32. Kings
1.6 South 13. San Mateo 33. Madera
1.7 East 14. Kern 34. Monterey
1.8 South Bay 15. San Joaquin 35. Humboldt
2. San Diego 16. Sonoma 36. Nevada
2.1 N. Coastal 17. Stanislaus 37. Mendocino
2.2 N. Central 18. Santa Barbara 38. Sutter
2.3 Central 19. Solano 39. Yuba
2.4 South 20. Tulare 40. Lake
2.5 East 21. Santa Cruz 41. San Benito
2.6 N. Inland 22. Marin 42. Colusa, Glen, Tehama
3. Orange 23. San Luis Obispo 43. Plumas, Sierra, Siskiyou,
4. Santa Clara 24. Placer Lassen, Modoc, Trinity, Del Norte
5. San Bernardino 25. Merced 44. Mariposa, Mono, Tuolumne,
6. Riverside 26. Butte Alpine, Amador, Calaveras, Inyo
Source: UCLA Center for Health Policy Research, 2015-2016 California Health Interview Survey.
The cell phone sample design and targets by stratum of the cell phone sample have also changed
throughout the cycles of the survey. In CHIS 2007, a non-overlapping dual-frame design was
implemented where cell phone only users were screened and interviewed in the cell phone sample.
Beginning in 2009, an overlapping dual-frame design has been implemented. In this design, dual phone
users (e.g., those with both cell and landline service) can be selected and interviewed from either the
landline or cellphone samples.

1-6
The number of strata has also evolved as more information about cell numbers has become
available. In CHIS 2007, the cell phone frame was stratified into seven geographic sampling strata
created using telephone area codes. In CHIS 2009 and 2011-2012, the number of cell phone strata was
increased to 28. These strata were created using both area codes and the geographic information assigned
to the number. Beginning in CHIS 2011, with the availability of more detailed geographic information,
the number of strata was increased to 44 geographic areas that correspond to single and grouped counties
similar to the landline strata. The use of 44 geographic strata continued in CHIS 2015-2016.
1.4 Data Collection
To capture the rich diversity of the California population, interviews were conducted in six
languages: English, Spanish, Chinese (Mandarin and Cantonese dialects), Vietnamese, Korean, and
Tagalog. Tagalog interviews were conducted for part of the CHIS 2013-2014 cycle, but 2015-2016 were
the first cycle years that Tagalog interviewers were conducted from the beginning of data collection.
These languages were chosen based on analysis of 2010 Census data to identify the languages that would
cover the largest number of Californians in the CHIS sample that either did not speak English or did not
speak English well enough to otherwise participate.
RTI International designed the methodology and collected data for CHIS 2015-2016, under
contract with the UCLA Center for Health Policy Research. RTI is an independent, nonprofit institute that
provides research, development, and technical services to government and commercial clients worldwide,
with specialization in designing and implementing large-scale sample surveys. For all sampled
households, RTI staff interviewed one randomly selected adult in each sampled household, and sampled
one adolescent and one child if they were present in the household and the sampled adult was their parent
or legal guardian. Thus, up to three interviews could have been completed in each household. Children
and adolescents were generally sampled at the end of the adult interview. If the screener respondent was
someone other than the sampled adult, children and adolescents could be sampled as part of the screening
interview, and the extended child (and adolescent) interviews could be completed before the adult
interview. This “child-first” procedure was first used in CHIS 2005 and has been continued in subsequent
CHIS cycles because it substantially increases the yield of child interviews. While numerous subsequent
attempts were made to complete the adult interview for child-first cases, the final data contain completed
child and adolescent interviews in households for which an adult interview was not completed. Table 1-2
shows the number of completed adult, child, and adolescent interviews in CHIS 2015-2016 by the type of
sample (landline RDD, surname list, cell RDD, and ABS). Note that these figures were accurate as of
data collection completion and may differ slightly from numbers in the data files due to data cleaning and

1-7
edits. Sample sizes to compare against data files you are using are found online at
http://healthpolicy.ucla.edu/chis/design/Pages/sample.aspx.
Interviews in all languages were administered using RTI’s computer-assisted telephone
interviewing (CATI) system. The average adult interview took about 41 minutes to complete. The
average child and adolescent interviews took about 19 minutes and 22 minutes, respectively. For “child-
first” interviews, additional household information asked as part of the child interview averaged about 12
minutes. Interviews in non-English languages typically took somewhat longer to complete. More than 13
percent of the adult interviews were completed in a language other than English, as were about 24 percent
of all child (parent proxy) interviews and 25 percent of all adolescent interviews.
Table 1-2. Number of completed CHIS 2015-2016 interviews by type of sample and instrument
Type of sample1 Adult2 Child Adolescent
Total all samples 42,089 4,293 1,594
Landline RDD 15,106 1,178 542
Vietnamese surname list 3,558 316 111
Korean surname list 1,772 130 64
Japanese surname list 631 34 25
Cell RDD 19,722 2,521 807
Marin County Oversample3 1,042 83 33
Imperial County ABS Oversample 258 31 12
Source: UCLA Center for Health Policy Research, 2015-2016 California Health Interview Survey. 1 Completed interviews listed for each sample type refer to the sampling frame from which the phone number was
drawn. Interviews could be conducted using numbers sampled from a frame with individuals who did not meet the target criteria for the frame but were otherwise eligible residents of California. Interviews from the Marin County oversample include respondents who did not live in this county and interviews from the Vietnamese, Korean, or Japanese surname lists include respondents who do not have one of these ethnicities. For example, only 182 of the 3,558 adult interviews completed from the Vietnamese surname list involved respondents who indicated being having Vietnamese ethnicity.
2 Includes interviews meeting the criteria as partially complete, 3 Completed interviews for the Marin County oversample do not include interviews completed via the Vietnamese
surname list frame. These interviews are counted in the row for the Vietnamese surname list.
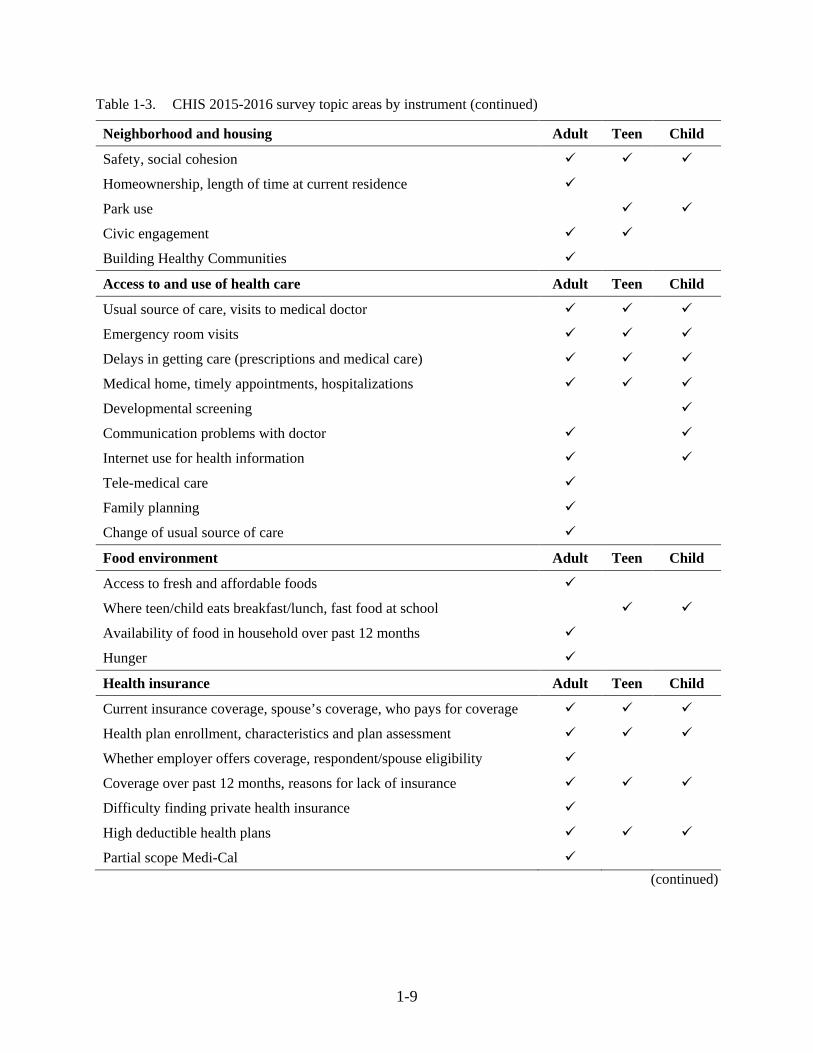
Table 1-3 shows the major topic areas for each of the three survey instruments (adult, child, and
adolescent).

1-8
Table 1-3. CHIS 2015-2016 survey topic areas by instrument
Health status Adult Teen Child
General health status
Days missed from school due to health problems
Health-related quality of life (HRQOL)
Health conditions Adult Teen Child
Asthma
Diabetes, gestational diabetes, pre- /borderline diabetes
Heart disease, high blood pressure, stroke
Physical, behavioral, and/or mental conditions
Physical disabilities, blindness, deafness
Mental health Adult Teen Child
Mental health status
Perceived need, access and utilization of mental health services
Suicide ideation and attempts
Functional impairment, stigma
Health behaviors Adult Teen Child
Dietary intake, fast food and soda intake
Water Consumption
Physical activity and exercise, commute from school to home
Sedentary time
Walking for transportation and leisure
Doctor discussed nutrition/physical activity
Flu Shot
Alcohol use
Cigarette and E-cigarette use
Sexual behavior
Breastfeeding
Women’s health Adult Teen Child
Mammography screening
Pregnancy
Dental health Adult Teen Child
Last dental visit, main reason haven’t visited dentist (continued)
1-9
Table 1-3. CHIS 2015-2016 survey topic areas by instrument (continued)
Neighborhood and housing Adult Teen Child
Safety, social cohesion
Homeownership, length of time at current residence
Park use
Civic engagement
Building Healthy Communities
Access to and use of health care Adult Teen Child
Usual source of care, visits to medical doctor
Emergency room visits
Delays in getting care (prescriptions and medical care)
Medical home, timely appointments, hospitalizations
Developmental screening
Communication problems with doctor
Internet use for health information
Tele-medical care
Family planning
Change of usual source of care
Food environment Adult Teen Child
Access to fresh and affordable foods
Where teen/child eats breakfast/lunch, fast food at school
Availability of food in household over past 12 months
Hunger
Health insurance Adult Teen Child
Current insurance coverage, spouse’s coverage, who pays for coverage
Health plan enrollment, characteristics and plan assessment
Whether employer offers coverage, respondent/spouse eligibility
Coverage over past 12 months, reasons for lack of insurance
Difficulty finding private health insurance
High deductible health plans
Partial scope Medi-Cal
(continued)

1-10
Table 1-3. CHIS 2015-2016 survey topic areas by instrument (continued)
Public program eligibility Adult Teen Child
Household poverty level
Program participation (CalWORKs, Food Stamps, SSI, SSDI, WIC, TANF)
Assets, alimony/child support, social security/pension, worker's compensation
Medi-Cal and Healthy Families eligibility
Reason for Medi-Cal non-participation among potential beneficiaries
Bullying and interpersonal violence Adult Teen Child
Bullying, personal safety, school safety, interpersonal violence Parental involvement/adult supervision Adult Teen Child
Adult presence after school, role models, resiliency Parental involvement Child care and school attendance Adult Teen Child Current child care arrangements Paid child care Preschool/school attendance, name of school Preschool quality School instability First 5 California: "Talk, Read, Sing Program" Employment Adult Teen Child Employment status, spouse’s employment status Hours worked at all jobs
Income Adult Teen Child Respondent’s and spouse’s earnings last month before taxes Household income, number of persons supported by household income
Respondent characteristics Adult Teen Child Race and ethnicity, age, gender, height, weight Veteran status Marital status, registered domestic partner status (same-sex couples) Sexual orientation Education, English language proficiency Citizenship, immigration status, country of birth, length of time in U.S., languages spoken at home
Education of primary caretaker Citizenship, immigration status, country of birth, and length of time in U.S. of parents
Source: UCLA Center for Health Policy Research, 2015-2016 California Health Interview Survey.

1-11
1.5 Responsive and Adaptive Design Elements
The CHIS 2015 and 2016 data collection protocol included the following two responsive design
protocols to maximize response rates, provide protection against nonresponse bias, and control data
collection costs:
1) a propensity model experiment in the first phase of each quarterly data collection that identified a set of cases with low propensities to discontinue calling for the remainder of Phase 1
2) a second nonresponse follow-up (NRFU) phase in each quarterly data collection period where a different protocol was implemented to increase response rates and reduce the risk of nonresponse bias.
Additional documentation on the responsive design protocols and outcomes is available in the
CHIS 2015-2016 Methodology Series: Report 2—Data Collection Methods posted at
http://healthpolicy.ucla.edu/chis/design/Pages/methodology.aspx.
1.6 Response Rates
The overall response rates for CHIS 2015 and 2016 are composites of the screener completion
rate (i.e., success in introducing the survey to a household and randomly selecting an adult to be
interviewed) and the extended interview completion rate (i.e., success in getting one or more selected
persons to complete the extended interview). For CHIS 2015, the landline/list sample household response
rate was 9.1 percent (the product of the screener response rate of 21.0 and the extended interview
response rate at the household level of 43.2 percent). The cell sample household response rate was 9.8
percent, incorporating a screener response rate of 21.5 percent household-level extended interview
response rate of 45.9 percent. For CHIS 2016, the landline/list sample household response rate was 6.8
percent (the product of the screener response rate of 15.5 and the extended interview response rate at the
household level of 44.0 percent). The cell sample household response rate was 8.4 percent, incorporating
a screener response rate of 18.5 percent household-level extended interview response rate of 45.4 percent.
CHIS uses AAPOR response rate RR4 (see more detailed in CHIS 2015-2016 Methodology Series:
Report 4 – Response Rates).
Within the landline and cell phone sampling frames for 2015, the extended interview response
rate for the landline/list sample varied across the adult (41.8 percent), child (44.7 percent) and adolescent
(17.1 percent) interviews. For 2016, the extended interview response rate for the landline/list sample
varied across the adult (41.3 percent), child (69.6 percent) and adolescent (17.9 percent) interviews. The
adolescent rate includes the process of obtaining permission from a parent or guardian. The adult

1-12
interview response rate for the cell sample was 48.5 percent, the child rate was 43.9 percent, and the
adolescent rate was 17.4 percent in 2015 (see Table 1-4a). The adult interview response rate for the cell
sample was 46.9 percent, the child rate was 59.7 percent, and the adolescent rate was 21.6 percent in 2016
(see Table 1-4c). Multiplying these rates by the screener response rates used in the household rates above
gives an overall response rate for each type of interview for each survey year (see Table 1-4b and Table
1-4d, respectively). As in previous years, household and person level response rates vary by sampling
stratum. CHIS response rates are similar to, and sometimes higher than, other comparable surveys that
interview by telephone.
Table 1-4a. CHIS 2015 response rates – Conditional
Type of sample Screener Household
Adult (given
screened)
Child (given
screened)
Adolescent (given screened & permission)
Overall 21.4% 45.2% 47.2% 44.0% 17.3%
Landline RDD 21.0% 43.2% 41.8% 44.8% 17.1%
Cell RDD 21.5% 45.9% 48.5% 43.9% 17.4%
Source: UCLA Center for Health Policy Research, 2015-2016 California Health Interview Survey.
Table 1-4b. CHIS 2015 response rates – Unconditional
Type of sample Screener Household
Adult (given
screened)
Child (given
screened)
Adolescent (given screened & permission)
Overall 21.4% 9.7% 10.1% 9.4% 3.7%
Landline RDD 21.0% 9.1% 8.8% 9.4% 3.6%
Cell RDD 21.5% 9.8% 10.4% 9.4% 3.7%
Source: UCLA Center for Health Policy Research, 2015-2016 California Health Interview Survey.
Table 1-4c. CHIS 2016 response rates – Conditional
Type of sample Screener Household
Adult (given
screened)
Child (given
screened)
Adolescent (given screened & permission)
Overall 17.8% 45.1% 44.6% 63.0% 20.0%
Landline RDD 15.5% 44.0% 41.3% 69.6% 17.9%
Cell RDD 18.5% 45.4% 46.9% 59.7% 21.6%
Source: UCLA Center for Health Policy Research, 2015-2016 California Health Interview Survey.

1-13
Table 1-4d. CHIS 2016 response rates – Unconditional
Type of sample Screener Household
Adult (given
screened)
Child (given
screened)
Adolescent (given screened & permission)
Overall 17.8% 8.0% 7.9% 11.2% 3.6%
Landline RDD 15.5% 6.8% 6.4% 10.8% 2.8%
Cell RDD 18.5% 8.4% 8.7% 11.1% 4.0%
Source: UCLA Center for Health Policy Research, 2015-2016 California Health Interview Survey.
To maximize the response rate,
especially at the screener stage, an advance
letter in five languages was mailed to all
landline sampled telephone numbers for
which an address could be obtained from
reverse directory services. An advance letter
was mailed for 34.5 percent of the landline
RDD sample telephone numbers not
identified by the sample vendor as business
numbers or not identified by RTI’s dialer
software as nonworking numbers, and for
92.3 percent of surname list sample
numbers. Combining these two frames, advance letters were sent to 40.5 percent of all fielded landline
telephone numbers. Addresses were not available for the cell sample. As in all CHIS cycles since CHIS
2005, a $2 bill was included with the CHIS 2015-2016 advance letter to encourage cooperation.
Additional incentives were offered to cell phone and Phase 2 nonresponse follow up (NRFU)
respondents. Details on the incentives are provided in Table 1-5.
After all follow-up attempts to complete the full questionnaire were exhausted, adults who
completed at least approximately 80 percent of the questionnaire (i.e., through Section K which covers
employment, income, poverty status, and food security), were counted as “complete.” At least some
responses in the employment and income series, or public program eligibility and food insecurity series
were missing from those cases that did not complete the entire interview. They were imputed to enhance
the analytic utility of the data.
Table 1-5. 2015-2016 CHIS incentives by interview type
Type of interview Adult
Cell Phone Screener $5 Cell Phone Adult Interview $20 Cell Phone Child Interview $10 Cell Phone Teen Interview $10
Nonresponse Follow-Up Adult Interview $40
Nonresponse Follow-Up Child Interview $20
Nonresponse Follow-Up Teen Interview $20
Source: UCLA Center for Health Policy Research, 2015-2016 California Health Interview Survey.

1-14
Proxy interviews were conducted for any adult who was unable to complete the extended adult
interview for themselves, in order to avoid biases for health estimates of chronically ill or handicapped
people. Eligible selected persons were re-contacted and offered a proxy option. In the 2015-2016 CHIS,
either a spouse/partner or adult child completed a proxy interview for 274 adults. A reduced
questionnaire, with questions identified as appropriate for a proxy respondent, was administered.
Further information about CHIS data quality and nonresponse bias is available at
http://healthpolicy.ucla.edu/chis/design/Pages/data-quality.aspx.
1.7 Weighting the Sample
To produce population estimates from CHIS data, weights were applied to the sample data to
compensate for the probability of selection and a variety of other factors, some directly resulting from the
design and administration of the survey. The sample was weighted to represent the non-institutionalized
population for each sampling stratum and statewide. The weighting procedures used for CHIS 2015-2016
accomplish the following objectives:
Compensate for differential probabilities of selection for phone numbers (households) and
persons within household;
Reduce biases occurring because nonrespondents may have different characteristics than
respondents;
Adjust, to the extent possible, for undercoverage in the sampling frames and in the conduct
of the survey;
Reduce the variance of the estimates by using auxiliary information; and
Account for the second-phase sampling that was part of the responsive and adaptive design (Phase 2 NRFU).
As part of the weighting process, a household weight was created for all households that
completed the screener interview. This household weight is the product of the “base weight” (the inverse
of the probability of selection of the telephone number) and a variety of adjustment factors. The
household weight was used to compute a person-level weight, which includes adjustments for the within-
household sampling of persons and for nonresponse. The final step was to adjust the person-level weight
using weight calibration, a procedure that forced the CHIS weights to sum to estimated population control
totals simultaneously from an independent data source (see below).
Population control totals of the number of persons by age, race, and sex at the stratum level for
CHIS 2015-2016 were created primarily from the California Department of Finance’s (DOF) 2015 and

1-15
2016 Population Estimates, and associated population projections. The procedure used several
dimensions, which are combinations of demographic variables (age, sex, race, and ethnicity), geographic
variables (county, Service Planning Area in Los Angeles County, and Health Region in San Diego
County), and education. One limitation of using Department of Finance (DOF) data is that it includes
about 2.4 percent of the population of California who live in “group quarters” (i.e., persons living with
nine or more unrelated persons and includes, for example nursing homes, prisons, dormitories, etc.).
These persons were excluded from the CHIS target population and, as a result, the number of persons
living in group quarters was estimated and removed from the Department of Finance control totals prior
to calibration.
The DOF control totals used to create the CHIS 2015 and 2016 weights are based on 2010
Census counts, as were those used for the 2013-2014 cycle. Please pay close attention when comparing
estimates using CHIS 2015-2016 data with estimates using data from CHIS cycles before 2010. The most
accurate California population figures are available when the U.S. Census Bureau conducts the decennial
census. For periods between each census, population-based surveys like CHIS must use population
projections based on the decennial count. For example, population control totals for CHIS 2009 were
based on 2009 DOF estimates and projections, which were based on Census 2000 counts with
adjustments for demographic changes within the state between 2000 and 2009. These estimates become
less accurate and more dependent on the models underlying the adjustments over time. Using the most
recent Census population count information to create control totals for weighting produces the most
statistically accurate population estimates for the current cycle, but it may produce unexpected increases
or decreases in some survey estimates when comparing survey cycles that use 2000 Census-based
information and 2010 Census-based information.
1.8 Imputation Methods
Missing values in the CHIS data files were replaced through imputation for nearly every variable.
This was a substantial task designed to enhance the analytic utility of the files. RTI imputed missing
values for those variables used in the weighting process and UCLA-CHPR staff imputed values for nearly
every other variable.
Two different imputation procedures were used by RTI to fill in missing responses for items
essential for weighting the data. The first imputation technique was a completely random selection from
the observed distribution of respondents. This method was used only for a few variables when the
percentage of the items missing was very small. The second technique was hot deck imputation. The hot

1-16
deck approach is one of the most commonly used methods for assigning values for missing responses.
Using a hot deck, a value reported by a respondent for a specific item was assigned or donated to a
“similar” person who did not respond to that item. The characteristics defining “similar” vary for different
variables. To carry out hot deck imputation, the respondents who answered a survey item formed a pool
of donors, while the item nonrespondents formed a group of recipients. A recipient was matched to the
subset pool of donors based on household and individual characteristics. A value for the recipient was
then randomly imputed from one of the donors in the pool. RTI used hot deck imputation to impute the
same items that have been imputed in all CHIS cycles since 2003 (i.e., race, ethnicity, home ownership,
and education).
UCLA-CHPR imputed missing values for nearly every variable in the data files other than those
imputed by RTI and some sensitive variables for which nonresponse had its own meaning. Overall, item
nonresponse rates in CHIS 2015 and CHIS 2016 were low, with most variables missing valid responses
for less than 1% of the sample.
The imputation process conducted by UCLA-CHPR started with data editing, sometimes referred
to as logical or relational imputation: for any missing value, a valid replacement value was sought based
on known values of other variables of the same respondent or other sample(s) from the same household.
For the remaining missing values, model-based hot-deck imputation without donor replacement was used.
This method replaced a missing value for one respondent using a valid response from another respondent
with similar characteristics as defined by a generalized linear model with a set of control variables
(predictors). The link function of the model corresponded to the nature of the variable being imputed (e.g.
linear regression for continues variables, logistic regression for binary variables, etc.). Donors and
recipients were grouped based on their predicted values from the model.
Control variables (predictors) used in the model to form donor pools for hot-decking always
included standard measures of demographic and socioeconomic characteristics, as well as geographic
region; however, the full set of control variables varies depending on which variable is being imputed.
Most imputation models included additional characteristics, such as health status or access to care, which
are used to improve the quality of the donor-recipient match. Among the standard list of control variables,
gender, age, race/ethnicity and region of California were imputed by RTI. UCLA-CHPR began their
imputation process by imputing household income and educational attainment, so that these
characteristics are available for the imputation of other variables. Sometimes CHIS collects bracketed
information about the range in which the respondent’s value falls when the respondent will not or cannot

1-17
report an exact amount. Household income, for example, was imputed using the hot-deck method within
ranges defined by a set of auxiliary variables such as bracketed income range and/or poverty level.
The imputation order of the other variables generally followed the questionnaire. After all
imputation procedures were complete, every step in the data quality control process was performed once
again to ensure consistency between the imputed and non-imputed values on a case-by-case basis.

2-1
2. DATA EDITING PROCEDURES
Survey data for all CHIS 2015-2016 samples – landline and cellular RDD, surname list, and
supplemental address-based sample (ABS) in Imperial County – were collected using the same computer-
assisted telephone interview (CATI) system. While the screening interview varied somewhat by sample,
the same editing procedures were followed for all CHIS 2015-2016 cases.
In a CATI environment, the data collection and interview process is controlled using a series of
computer programs to ensure consistency and quality. (CHIS 2015-2016 Methodology Series: Report 2 -
Data Collection Methods provides a thorough discussion of the interview process and a description of
how the survey data were collected.) The CATI system programming determines which questions are
asked based on household composition, respondent characteristics or preceding answers, and the order in
which the questions are presented to interviewers. The system also presents the response options available
for recording answers.
CATI range and logic edits help ensure the integrity of the data during collection. Editing at the
time of the interview greatly reduces the need for post-interview editing, and allows most questionable
entries to be reviewed in real time with the respondent as part of the collection process. Although the
CATI system virtually eliminates out-of-range responses and many other anomalies, some consistency
and edit issues may arise. For example, interviewers may note concerns or problems that must be handled
by data preparation staff after the interview is complete. Updating activities include both manual and
machine editing procedures to correct interviewer, respondent, and CATI program errors and to check
that updates made by data preparation staff are input correctly. Because data editing results in changes to
the survey data, specific quality control procedures were implemented. CHIS 2015-2016 survey data were
examined and edited before RTI delivered final data files to UCLA. Quality control procedures involved
limiting the number of staff who made updates, using the CATI specifications to resolve issues in
complex questionnaire sections, carefully checking updates, and performing simulation computer runs to
identify inconsistencies or illogical patterns in the data.
The data editing procedures for CHIS 2015-2016 consisted of three main tasks: (1) managing and
resolving problem cases, (2) coding question responses that were recorded as text strings (i.e., “up-
coding” responses captured in “other specify” fields), and (3) verifying data editing updates. The final
step was to convert the edited data from the CATI system to the SAS data delivery files. The sections
below describe each of these processes in turn.

2-2
2.1 Resolving Problem Cases
One important task for ensuring high-quality data was managing and resolving problem cases.
The data preparation staff, as well as project staff and CATI staff, worked collectively to resolve problem
cases. The method interviewers used to communicate problems is described in this section, along with the
system used by data editing and preparation staff to update or modify the data.
An interviewer who experienced a problem while working a case could alert the project team in
one of two ways. One method was to fill out an electronic problem sheet for the case. All problem sheets
were transmitted to a single staff member who distributed them to the appropriate department or project
staff person. Data preparation staff often used these problem sheets as a guide to review cases and to
make certain that any required updates were made accurately.
The second method of communicating problems was to assign a specific result code to cases
within the CATI system. Problem cases were reviewed electronically by a Research Operations Center
(ROC) supervisor and either re-fielded to the interviewing staff or distributed to the appropriate staff for
resolution. The problem result code category had three sub-categories to indicate the RTI staff person or
group responsible for investigating the case further—1) ROC staff who work directly with the
interviewers, 2) project staff who oversee survey design and implementation, or 3) data cleaning and
processing staff.
Not all problems required CATI database updates. Some could be resolved by simply releasing
the case for general interviewing with a message telling the interviewer what to do. If, for example, an
adult extended interview was stopped during the middle of Section E, the interviewer would enter a
detailed comment explaining why the case could not proceed (e.g., “Respondent wanted to change several
answers. I was unable to back up properly.”). The solution for these types of cases was to re-field the
interview and all questions in Section E could be asked again. Most restart cases were made available to
the general interviewing staff. For unusual or complex problems, the case could be assigned to a specific
interviewer with experience in handling these types of problems.
Some examples of cases reviewed by RTI project staff were those in which an error was made in
enumerating a household member or when a change in the person named as most knowledgeable about
the sampled child was needed. Other types of problems required special interviewer handling, even after
changes were made to the CATI database.

2-3
One specific category of problems—enumeration errors where some household members were
either incorrectly identified or their characteristics were entered in error—was somewhat more
challenging than other types of errors to resolve. If enough information was not available to complete the
screener accurately the data manager could reload the case by using a utility created for CHIS and allow
the next interviewer to enter data anew.
2.2 Interviewer Comments
Another important data editing task is reviewing comments interviewers enter in a window
accessed by a CATI “hot key.” Comments are used to record answers and statements that don’t fit into
programmed response options. Some comments merely elaborate on previously-recorded responses,
express an opinion, or are otherwise not directly related to the survey. These kinds of comments usually
do not require modifying or updating survey responses. In other situations, substantive comments indicate
that a data update is needed. For example, if the weight that a respondent reports is outside the
predetermined acceptable range programmed in CATI, the interviewer would first ask the respondent to
confirm the response, then would enter “Don’t Know” as the answer in CATI, and then would add a
comment with the respondent’s actual weight. In this case, the data preparation staff reviewing the
comment later would enter the correct weight value into the CATI data file.
2.3 Coding with Text Strings
Most items in CHIS 2015-2016 had only close-ended response options, but several of them had
the option of entering an ‘other-specify’ response that required coding of narrative text strings recorded
by interviewers. For example, question AA5 in the adult extended interview was asked of respondents who
had reported being of Hispanic or Latino ancestry or origin: “And what is your Latino or Hispanic ancestry
or origin? Such as Mexican, Salvadoran, Cuban, Honduran -- and if you have more than one, tell me all of
them.” The list of potential responses in AA5 included 10 different nationalities, and interviewers could
use an “other (specify:)” category for responses outside this list. Additional questions with an “other
(specify:)” category from the CHIS 2015-2016 adult extended interview included:
Racial/ethnic ancestry (AA5, AA5A, AA5E, AA5E1);
Tribal names (AA5B, AA5D);
Sexual orientation (AD46);
Country of birth (AH33, AH34, AH35);
Languages spoken at home (AH36);
Usual place visited for health care (AH3);

2-4
Usual place where buy cigarettes (AC55);
Reasons for using E-cigarettes (AC83);
Rules about smoking inside home (AC84);
Industry and Occupation (AK5, AK6);
Health insurance coverage items (AI15, KAI15, AI15A, KAI15A, AI17A, KAI17A, AI45,
KAI45, AI45A, KAI45A, AI36, KAI36, AI24, KAI24, AL19, AH104 KAH104, AH105,
KAH105, AH106, KAH106, AH122, KAH122, AH101, KAH101, AH114, KAH114,
AH121, KAH121);
Child/adolescent health insurance coverage items (CF7, KCF7, CF18, KCF18, IA18, KIA18,
CF29, KCF29, IA29, KIA29, CF1A, CF2A, KCF2A, IA1A, KIA1A, IA2A, KIA2A, IA7,
KIA7, AI90, KAI90, AI91, KAI91, AI92, KAI92, AI115, KAI115, AI94, KAI94, AI95,
KAI95, AI96, KAI96, AI116, KAI116).
Adult/child/adolescent Insurance plan names (AH50, AI22A, MA2, MA7, KAH50, KAI22A,
KMA2, KMA7);
Reason no longer receiving behavioral health treatment (AF80);
Country of birth (AI56, AI56C, AI56T);
Language used by doctor to speak to respondent (AJ50);
Reason for delay in getting needed health care (AJ131);
Main birth control method: female (AJ142);
Where received birth control method: female (AJ143);
Where received birth control method: male (AJ146).
Questions with an “other (specify:)” category in the child and adolescent interviews:
Child condition or disability (CA10A);
Adolescent race and ethnicity (TI1A, TI2, TI2A,TI2C,TI2D,TI2D1);
Child race and ethnicity (CH2, CH3, CH4, CH6, CH7, CH7A);
Child/adolescent languages spoken at home (CH17, TI7);
Child/mother/father place of birth (CH8, CH11, CH14);
Adolescent country of birth (TI3);
Child/adolescent school name/type of school (CB22, CB22TYPE, TA4B, TA4BTYPE);
Reason for adolescent to have changed school (TA7);
Grade attending in school currently/last time in school (TA8, TA9);
Extra-curricular activities in school (TL20);

2-5
Child/adolescent usual source of health care (CD3, TF2);
Child/adolescent reason for delay in getting health care (CD68, TH59);
Language used by child’s doctor to talk to parent (CD31);
Reasons for using E-cigarettes (TE68).
RTI data preparation staff reviewed these responses and up-coded them to existing categories
whenever possible. Text responses were also reviewed to remove indications to respondents’ names (or
initials) and to summarize long responses.
Soft-range edits were activated during the interview when the respondent gave an unlikely
response (a value outside the specified range). The CATI system responded by placing a message on the
screen and required the interviewer to re-enter the response. This system feature gives the interviewer an
opportunity to verify that the response is recorded accurately or re-ask the question to be certain the
respondent understood what was being asked as needed. Hard-range edits prevented recording
unacceptable values. For example, for a question on how many glasses of juice the adolescent respondent
had the previous day, the soft range is 0-9, the hard range 0-20.
When a respondent insisted on giving a response that violated the hard-edit specifications,
interviewers recorded the answer in the comment field, and data preparation staff reviewed and updated
the case as needed.
2.4 Verifying Data Updates
Updates to the original interview data were required in a variety of circumstances as described
above. A series of techniques verified that the data were updated accurately. The CATI case identification
number was also recorded to ensure that updates were associated with the appropriate case. A printout
was created and checked for accuracy, effects on any other questions, or logical skip patterns in the
questionnaire. For more complicated circumstances, the data preparation staff carefully reviewed
interviewer comments, messages, and problem descriptions to verify data updates.
Cases with similar problems were reviewed and updated together in manageable batches to
ensure consistency in handling data problems. Following the series of updates, a program checked for all
errors identified to date to ensure that editing had not created new errors. Frequency distributions and
cross-tabulations were used extensively by data preparation staff to verify data updates. Structural edits
assessed the integrity of the CATI database (e.g., verifying that all database records that should exist
existed, and those that should not exist did not), and edits that evaluated complex skip patterns were run

2-6
periodically during data collection. When discrepancies were discovered, problem cases were reviewed
and updated as necessary.

3-1
3. GEOGRAPHIC CODING
For CHIS 2015-2016, RTI delivered geo-coded survey data for any household where at least one
interview had been completed, identifying the approximate (i.e., not “rooftop”) location of the
respondent’s residence. The self-reported county was used to assign cases to landline sample strata as
described in CHIS 2015-2016 Methodology Series: Report 1 – Sample Design. RTI also prepared and
delivered more specific geocodes based on the respondent-reported address and other information. The
geographic coding process for CHIS 2015-2016 used Esri’s ArcGISdesktop software that calls upon the
Business Analyst extension database to geocode the CHIS addresses. Esri’s geocoder tool utilizes the
Business Analyst data using an address-based approach with more than 54 million residential and
commercial US-based addresses. The Business Analyst data is compiled from the Tele Atlas Address
Points database.
3.1 County of Residence
The CHIS 2015-2016 adult extended interview asked all respondents the name of the county
where they lived: “To be sure we are covering the entire state, what county do you live in?” (AH42). In
addition, for cases in which an address had been matched to the sampled telephone number3, interviewers
verified the street address and ZIP code with the adult respondent (AO1) and then collected the name of a
nearby cross-street (AM9). These same questions were asked of adults who completed the child interview
under the “child first” protocol. The child-first protocol allowed completion of the child interview before
the adult extended interview was conducted. (See CHIS 2015-2016 Methodology Series: Report 2 – Data
Collection Methods for details regarding the child-first protocol.)
If there was no matched address for a given case, respondents were asked to provide their ZIP
code (AM7), their street address (AO2) and then the name of the nearest cross-street (AM9). Adult
respondents who refused to provide a complete street address with house number were asked just for the
name of the street they lived on (AM8) and the nearest cross street.
Because telephone numbers were assigned to sampling strata based on the telephone area code
and exchange (see CHIS 2015-2016 Methodology Series: Report 1 - Sample Design), and some
exchanges serve more than one county or city, the actual stratum where the respondent resides may differ
from the sampling stratum. Both to monitor the sample yield during data collection and to ensure that the
3 The verification was not done if the telephone number was unlisted or if the sample vendor indicated that the number was on the “do not call” list.

3-2
analysis file reflects the sampled person’s actual residence, it was important to assign each adult who
completed the extended interview to the correct stratum that the adult self-reported as the residence.
The following two questions were asked toward the end of the adult extended interview and were
used to make the self-reported stratum assignment that is used for data collection targets:
AH42. “To be sure we are covering the entire state, what county do you live in?” and
AM7. “What is your ZIP code?”
The final self-reported stratum included in the final data file was determined by applying the
geocodes developed RTI staff as described below. See CHIS 2015-2016 Methodology Series: Report 5 -
Weighting and Variance Estimation, Section 8.4.5, for a fuller discussion of this process.
The final distribution of completed landline sample adult extended interview cases by self-
reported and original sampling stratum is presented in Table 3-2 at the end of this chapter. Generally, the
frequency counts show that there is good correspondence between the original sampling stratum and the
self-reported stratum for the landline sample. The self-reported stratum may differ from the original
sampling stratum, however, because the sampling stratum may have been incorrect or the respondent may
have incorrectly reported the county of residence.
3.2 Geocoding Process
The geocoding for CHIS 2015-2016 was accomplished using the Esri ArcGISdesktop software
package. First the software automatically matched the input addresses to a spatial database of roads,
which returned the address's latitude/longitude, state FIPS and county FIPS.
When an exact location is not identified, additional matching techniques within the software will
be employed:
Address Points: The address is assigned to a fixed point physical location (80% minimum
match score).
Street Address: The matched address’s position is a linear interpolation along the address
range into which it falls. The household for the selected respondent should be shown on the
correct street and usually the correct side of the street, but the actual location might be up to a
few hundred feet either up or down the street as compared to where they are shown on the
map. This method has a 72% minimum match score.

3-3
Zip code: Located at the geographic center of the zip code area for that address. These
locations are KNOWN to be highly inaccurate and not suitable for most applications.
Rematching: Manually assigning locations to unmatched addresses or updating address
inaccuracies when possible.
If the software was unable to match to the street address or linear interpolation of the street
address, it automatically matched to the geographic ZIP centroid as a fallback. In such cases, the
latitude/longitude, state FIPS code and county FIPS code of the ZIP code centroid was provided.
If a batch match was not obtained, RTI staff interactively examined the unmatched records
(excluding PO boxes and rural routes) to try and determine the reason why the software could not
automatically match the address. Sometimes this was due to misspelled street names, city names, etc., or
to missing house numbers. RTI corrected the address to match the street database, or matched to the
segment’s nearest intersection. If the street address or nearest intersection could not be identified, RTI
would then match to geographic ZIP centroid. If no zip code or address information was provided, a zip
code was imputed using hot-deck imputation with area code, stratum and county as imputation classes.
The frequencies of assigned geocodes by rule and sample type are shown in Table 3-1.
Table 3-1. Number of Geocodes Assigned by Rule and by Sample Type
Rule Cell Land Japanese Korean Vietnamese Total
1 - Address assigned to a fixed point physical location
11,157 10,706 553 1,387 2,221 26,024
2 - Matched by linear interpolation along address range into which it falls
3,540 2,264 53 244 567 6,668
3 - Matched to ZIP centroid based on address
5,768 2,876 36 181 879 9,740
4 - Matched based on manual assignment of unmatched or inaccurate address
10 7 0 1 0 18
Total 20,475 15,853 642 1,813 3,667 42,450 Source: UCLA Center for Health Policy Research, 2015-2016 California Health Interview Survey.

3-4
Table 3-2. Final distribution of adult extended completed cases by self-reported and original sampling stratum, landline/list sample for CHIS 2015-2016
Stratum name Sampling
stratum count Removed Added Final self-reported
stratum count
1 - LOS ANGELES 4,002 35 44 4,011
2 - SAN DIEGO 1,961 9 8 1,960
3 - ORANGE 1,206 34 15 1,187
4 - SANTA CLARA 911 7 15 919
5 - SAN BERNARDINO 642 11 14 645
6 - RIVERSIDE 1,019 7 17 1,029
7 - ALAMEDA 663 34 21 650
8 - SACRAMENTO 691 11 13 693
9 - CONTRA COSTA 489 14 35 510
10 - FRESNO 420 3 5 422
11 - SAN FRANCISCO 386 16 7 377
12 - VENTURA 430 4 15 441
13 - SAN MATEO 324 15 21 330
14 - KERN 352 3 2 351
15 - SAN JOAQUIN 229 1 3 231
16 - SONOMA 240 6 7 241
17 - STANISLAUS 263 6 2 259
18 - SANTA BARBARA 241 4 1 238
19 - SOLANO 247 12 2 237
20 - TULARE 249 4 1 246
21 - SANTA CRUZ 244 10 3 237
22 - MARIN 848 14 3 837
23 - SAN LUIS OBISPO 238 1 5 242
24 - PLACER 235 8 12 239
25 - MERCED 240 0 5 245
26 - BUTTE 227 5 14 236
27 - SHASTA 251 7 13 257
28 - YOLO 237 0 6 243
29 - EL DORADO 247 5 4 246
30 - IMPERIAL 265 2 3 266 (continued)

3-5
Table 3-2. Final distribution of adult extended completed cases by self-reported and original sampling stratum, landline/list sample for CHIS 2015-2016 (continued)
Stratum name Sampling
stratum count Removed Added Final self-reported
stratum count
31 - NAPA 280 5 11 286
32 - KINGS 274 4 0 270
33 - MADERA 243 4 3 242
34 - MONTEREY 245 6 12 251
35 - HUMBOLDT 246 6 1 241
36 - NEVADA 263 7 7 263
37 - MENDOCINO 233 5 1 229
38 - SUTTER 237 14 19 242
39 - YUBA 237 38 13 212
40 - LAKE 240 5 1 236
41 - SAN BENITO 282 3 4 283
42 - TEHAMA, ETC 183 13 4 174
43 - DEL NORTE, ETC 193 4 11 200
44 - TUOLUMNE, ETC 226 4 3 225
Source: UCLA Center for Health Policy Research, 2015-2016 California Health Interview Survey.

3-6
Table 3-3. Final distribution of adult extended completed cases by self-reported and original sampling stratum, cell phone sample for CHIS 2015-2016
Stratum name Sampling stratum
count Removed Added Final self-reported
stratum count
1 - LOS ANGELES 3,945 458 421 3,908
2 - SAN DIEGO 1,990 226 158 1,922
3 - ORANGE 894 173 196 917
4 - SANTA CLARA 672 161 153 664
5 - SAN BERNARDINO 526 138 292 680
6 - RIVERSIDE 942 206 248 984
7 - ALAMEDA 475 148 265 592
8 - SACRAMENTO 441 98 337 680
9 - CONTRA COSTA 407 95 176 488
10 - FRESNO 380 78 136 438
11 - SAN FRANCISCO 327 145 299 481
12 - VENTURA 260 37 87 310
13 - SAN MATEO 335 115 136 356
14 - KERN 358 45 101 414
15 - SAN JOAQUIN 249 54 85 280
16 - SONOMA 163 43 153 273
17 - STANISLAUS 322 89 61 294
18 - SANTA BARBARA 255 63 47 239
19 - SOLANO 206 63 107 250
20 - TULARE 264 51 64 277
21 - SANTA CRUZ 273 66 54 261
22 - MARIN 1,092 589 37 540
23 - SAN LUIS OBISPO 256 55 50 251
24 - PLACER 245 130 128 243
25 - MERCED 253 64 55 244
26 - BUTTE 184 45 126 265
27 - SHASTA 284 68 28 244
28 - YOLO 238 80 77 235
29 - EL DORADO 241 65 50 226
30 - IMPERIAL 292 72 17 237 (continued)

3-7
Table 3-3. Final distribution of adult extended completed cases by self-reported and original sampling stratum, cell phone sample for CHIS 2015-2016 (continued)
Stratum name Sampling stratum
count Removed Added Final self-reported
stratum count
31 - NAPA 281 91 33 223
32 - KINGS 276 86 18 208
33 - MADERA 282 69 19 232
34 - MONTEREY 166 24 96 238
35 - HUMBOLDT 213 21 37 229
36 - NEVADA 232 78 58 212
37 - MENDOCINO 275 51 26 250
38 - SUTTER 918 567 14 365
39 - YUBA 9 5 267 271
40 - LAKE 246 47 40 239
41 - SAN BENITO 296 108 13 201
42 - TEHAMA, ETC 168 43 114 239
43 - DEL NORTE, ETC 166 29 49 186
44 - TUOLUMNE, ETC 155 26 37 166
Source: UCLA Center for Health Policy Research, 2015-2016 California Health Interview Survey.
3.3 School Names
CHIS 2015-2016 child and adolescent interviews collected the names of schools attended by
selected children or adolescents (CB22 and TA4B, respectively). A sufficiently knowledgeable adult
(SKA) reported the child’s school name, and the sampled adolescent answered for him- or herself.
Interviewers recorded the respondent’s answers as a verbatim text entry.
A review of the child interview data showed several spelling problems associated with item CB22
(“What is the name of the school {CHILD NAME /AGE/SEX} goes to or last attended”?). In many
problem cases, the English-speaking adult respondent was reporting a Spanish school name (and was
speaking to an English-speaking interviewer). Respondents whose first language was not English had
similar difficulties in accurately reporting or spelling school names. RTI performed spell-check and
abbreviation corrections to the school names list and provided the cleaned lists to UCLA for further
matching to the California School Directory.

4-1
4. INDUSTRY AND OCCUPATION CODING
This section describes the CHIS 2015-2016 Industry and Occupation (I&O) open-ended response
coding process. The open-ended industry question was AK5 while occupation was AK6. The first step
involved translating Spanish language open-ended responses into English.
After translation was completed, any records with an open-ended response to either AK5 or AK6
were submitted to the National Institutes for Occupational Safety and Health’s (NIOSH) NIOSH Industry
and Occupation Computerized Coding System (NIOCCS)4. This coding system was developed to
translate English language text entries to standardized I&O codes. As stated in the online documentation,
the I&O codes are “based on the Census Industry and Occupation Classification system supplemented
with special codes developed by CDC/NIOSH for non-paid workers, non-workers, and the military5.”
This means that the codes are in the same four-digit format that the Census coding system utilizes. For
this process, we used Census 2010 as the classification scheme. The data was submitted in batches of less
than 10,000 records so that the computerized system would not time out.
In addition, the data was matched separately at both the high and medium confidence level
thresholds. High confidence matches records with 90% or higher accuracy scores while the medium
threshold matches records if they have 70% or higher accuracy scores. For CHIS 2015-2016 46.5% of
industry responses matched under the high threshold with an additional 24.9% under the medium
threshold. For occupation text 38.6% matched at the high threshold with an additional 27.9% matching
under the medium threshold. Although 72.9% of records had either their industry or occupation response
match using the NIOCCS system only 65.1% matched both their industry and occupation responses.
All remaining records that did not match both their industry and occupation responses using the
NIOCCS system were sent to the Census National Processing Center (NPC) for coding using the
Demographic Survey’s Division (DSD) computer-assisted I&O coding system. Census coded industry
using census codes based on the 2012 North American Industry Classification System. The occupation
fields used census codes based on the 2010 Standard Occupational Classification Manual. First the fields
are coded and then verified. With any discrepancies, the verifier made a determination. There was no
third-party adjudication. Census NPC provided output files containing I&O codes for all remaining
records.
4 https://www.cdc.gov/niosh/topics/coding/overview.html 5 https://www.cdc.gov/niosh/topics/coding/how.html

4-2
The Census I&O codes were combined with the NIOCCS system codes and appended to the adult
data as the translated I&O coding responses for each record. In situations where both Census and
NIOCCS codes existed for a record the Census code was retained. Otherwise, if both a medium threshold
and high threshold NIOCCS code existed for a record, and they did not agree, the high threshold match
was retained.
5-1
5. RACE AND ETHNICITY CODING
This chapter describes handling of race and ethnicity responses outside of the pre-existing
categories. These “other (specify:)” responses were recorded as text strings, and were either “up-coded”
into existing codes or left in the “other (specify:)” category.
The first question in the race and ethnicity series (question AA4 in the adult interview) asked if
the respondent was Latino or Hispanic. If the response to this item was “yes,” the next question (AA5)
asked about the specific origin (Mexican, Cuban, etc.) and allowed an “other (specify:)” response entered
as text in item AA5OS. Question AA5A then asked respondents for their race: “Please tell me which one
or more of the following you would use to describe yourself. Would you describe yourself as Native
Hawaiian, Other Pacific Islander, American Indian, Alaska Native, Asian, Black, African American, or
White?” This item allowed multiple responses and included an “other race” category. The “other
(specify:)” text was recorded in item AA5AOS. Respondents who identified as American Indian, Asian,
or Pacific Islanders were asked one or two follow-up questions about their tribal or national origin
(AA5B, AA5D, AA5E, AA5E1). Each of these items also included an option for “other (specify:)’.
Respondents indicating more than one race or ethnicity were asked which they most identified with
(AA5F). This item listed the response already entered under “other (specify:),” if any, but did not allow
interviewers to collect a new “other (specify:)” response.
5.1 Coding Procedures
RTI’s procedures for race and ethnicity coding supported the data needs for weighting the CHIS
sample. If codes could not be assigned for race or ethnicity they were left as missing and were later
imputed. The imputation procedures are described in CHIS 2015-2016 Methodology Series: Report 5 -
Weighting and Variance Estimation.
The coding procedures were consistent with those from the 2010 Census data and with those used
in prior CHIS cycles. Census methods are documented in the Census 2010 Redistricting Data (Public Law
94-171) Summary File – Technical Documentation (U.S. Census Bureau, 2011) available at
http://www.census.gov/prod/cen2010/doc/pl94-171.pdf. The specific sections of interest are in Appendix
B, pages B-2 and B-3. When we refer to the Census procedures, we mean our interpretation of the
information in this document.
An initial review of cases showed that the largest group of cases with “other race” categories were
ones in which the respondent identified as being Hispanic or Latino and did not identify with any pre-
4-2

5-2
coded race categories. The typical response to the “other race” was indicative of Hispanic ethnicity such
as “Hispanic” or “Latino.” Following the Census procedures, the person was left in the “other race”
category and the “other (specify:)” text was standardized to “HISPANIC-LATINO.”
The specific procedures and guidelines we used are detailed below. Responses captured in the
“other (specify:)” text field were retained and included in the final data set delivery to accommodate other
research and analytic needs.
If the “other (specify:)” text clearly should have been included in an existing code (following
the Census procedures), then it was up-coded and removed from the “other (specify:)”
category. For example, if the respondent was coded only as other race and the “other
(specify:)” was “Irish,” then the code for “white” was upcoded to “yes,” other race was
revised to “no” and the “other (specify:)” text eliminated.
If the “other (specify:)” text did not fit into an existing code (following the Census
procedures), then it was left in the “other (specify:)” category with the existing text in the
“other (specify:).” For example, if the “other (specify:)” text for race was “American” and no
other race category was identified, then no changes were made in the responses.
If the “other (specify:)” text indicated multiple races with no specific races mentioned (such
as “mixed”), then the code for “other (specify:)” race was changed to “yes” for both the first
and second mention. The “other (specify:)” text was standardized to “UNSPECIFIED
MULTIPLE RACE.”
If the respondent was coded as being Hispanic or Latino, we never revised this code based
upon information in the “other (specify:)” comments of the other variables. For example, if
the person was coded as “Hispanic” and the specific Hispanic origin item was only coded as
“other (specify:)” with the text “Jewish,” then the Hispanic code was not altered.
If the respondent was coded as not being Hispanic or Latino but the text in the “other
(specify:)” field for race indicated they were Hispanic or Latino, then the Hispanic or Latino
coding was revised to “yes.” In addition, the specific Hispanic origin code was made
consistent with text in the “other (specify:)” text from the race variable, if it was possible to
do so. In the case where this was not possible, the “other (specify:)” Hispanic origin category
was coded and the text copied from the race variable to the “other (specify:)” for Hispanic
origin. (This procedure is an elaboration of the ones above to deal with the cross-variable
coding.) For example, if the race “other (specify:)” code was “Mexican,” then the Hispanic

5-3
or Latino category was revised to be “yes” and the Hispanic origin code was coded as “yes”
for Mexican.
Similarly, if any case was upcoded to Asian, American Indian, or Other Pacific Islander, then
the follow-up questions about specific origin (AA5B, AA5D, AA5E, AA5E1) were also
upcoded to be consistent with the “other (specify:)” text from AA5A if it was possible to do
so. In cases where this was not possible, the “other (specify:)” origin category was coded and
the text copied from the race variable to the “other (specify:)” for the follow-up question. For
example, if the race “other (specify:)” code was “Filipino,” then code for “Asian” was
upcoded to “yes,” “other (specify:)” race was revised to “no” and the “other (specify:)” text
eliminated. After doing that, the code for AA5E for “Filipino” was revised to ‘yes.”
If the “other race” text was similar to “none of above,” and the respondent was coded as
being Hispanic or Latino, the “other (specify:)” text was standardized to “HISPANIC-
LATINO.” If the respondent was not coded as Hispanic or Latino we left the response as it
was.
Hispanic or Latino respondents who reported American Indian or Alaska Native (AIAN) as
their race, but did not report a tribal affiliation, are coded as having AIAN racial identity in
the data. In prior cycles Hispanic or Latino respondents with unknown AIAN tribal identities
were generally reclassified as non-AIAN.
After upcoding the “other (specify:)” specify responses for the race question (AA5A), RTI also
reviewed all “other (specify:)” responses to the follow-up origin questions (AA5B, AA5D, AA5E, and
AA5E1). These were upcoded when possible to the existing codes using a similar procedure. The Census
procedures clearly state that persons who say they have European, Middle Eastern, or North African
origin are to be classified as “White” race. This rule has many implications. For example, if a person says
they are not Hispanic and only identify the “other race” as being “Spanish”, we would upcode Hispanic
origin to “yes” (to be consistent with the Census procedures for Hispanic origin) and then upcode “race”
to “White” (since the person is of European origin).

6-1
6. IMPERIAL COUNTY ADDRESS-BASED SAMPLE (ABS)
Data collection for the Imperial County ABS was conducted between September and November
2016. Sampled addresses without matched telephone numbers were sent a short “screening”
questionnaire, the primary purpose of which was to obtain a telephone number. These cases also received
visits from field staff to complete the screening, if they did not complete the mailed screening. Returned
questionnaires were receipted and scanned daily. A total of 42 questionnaires with telephone numbers
were returned prior to filed visits. An additional 354 questionnaires with phone numbers were completed
after initiating field efforts. Captured data were reviewed, and telephone information was transferred to
the ROC each week. Once a sampled address was associated with a telephone number, whether through
the vendor match or from the screener, the Imperial sample was fielded and processed the same way as
the RDD and list sample cases. Tables detailing the Imperial ABS can be found in the other CHIS 2015-
2016 methodology reports.