Embed Size (px)
Citation preview
1
2014 Faculty Welfare Survey Final Report
University of South Carolina Palmetto College Campuses Faculty Senate
Welfare Committee
Sponsored by the Welfare Committee of the Palmetto College Campuses Faculty Senate: Ray McManus (Chair), USC Sumter; Fernanda Burke, USC Lancaster; Samuel D. Downs, USC
Salkehatchie; Ernest Jenkins, USC Lancaster; Fidele Ngwane, USC Salkehatchie; Helene Maire-‐Afeli, USC Union; Matt Rashotte, Extended University
Survey Design & Analysis by Samuel D. Downs, USC Salkehatchie and Ray McManus, USC Sumter
University of South Carolina Palmetto College Campuses
2
Contents
EXECUTIVE SUMMARY ................................................................................................................................. 3
About the Survey ...................................................................................................................................... 3
Central Findings ........................................................................................................................................ 3
About the Survey ...................................................................................................................................... 4
Survey Design & Administration .......................................................................................................... 4
Survey Response .................................................................................................................................. 5
Participant Characteristics ................................................................................................................... 7
About the Report ..................................................................................................................................... 8
II. ACADEMIC COMMUNITY AND COLLEGIALITY .......................................................................................... 8
Collegiality .............................................................................................................................................. 10
Diversity and Value ................................................................................................................................ 11
Constructive Interaction with Administrators ........................................................................................ 13
Discrimination and Workplace Bullying ................................................................................................. 13
III. FACULTY WORKLOAD AND SUPPORT .................................................................................................... 15
Faculty Workload ................................................................................................................................... 15
Support for Professional Success ........................................................................................................... 17
Distribution of Work Time ...................................................................................................................... 20
IV. COMPENSATION AND RETENTION ........................................................................................................ 22
Job Security and the Job Market ............................................................................................................ 24
Qualitative Feedback .............................................................................................................................. 26
Note about “Other” Analyses ................................................................................................................. 28
V. APPENDIX………………………………………………………………………………………………………………………………………….29
2014 Faculty Welfare Survey
3
EXECUTIVE SUMMARY
About the Survey
The 2014 Faculty Welfare Survey’s design builds from the 2014 Faculty Welfare Survey —designed with a specific focus on the personal and professional welfare of faculty members from the University of South Carolina Palmetto College Campuses. In an effort to streamline this year’s survey, 32 individual survey items were included and were grouped in three key areas: 1) academic community and collegiality, 2) faculty workload and support, and 3) compensation and retention. Our full-‐time faculty headcount is 146, an increase of 13 faculty members from last year, and our total number of responses to this survey was 94 (resulting in a response rate of 64.4 percent). Faculty participation in rank is as followed: 25.5% instructors (24 respondents), 26.6% Assistant Professors (25 respondents), 25.5% Associate Professors (24 respondents), 10.6% Full Professors (10 respondents), 4.3% Administrators with faculty rank (4 respondents), and 7.4% who did not provide rank (7 respondents).
Central Findings
It may seem that a survey such as this one, would point to what we lack or what we could do better. And even though surveys like this one are healthy for growth in a positive direction, no one wants to hear bad news. For the most part, the survey indicates some positive results for moving forward. Respondents indicate a strong sense of collegiality among our campuses. However, respondents also indicate that there still needs to be more work done to increase diversity, especially concerning gender, race, and sexual orientation. Perhaps the most pertinent findings are those related to discrimination and workplace bullying. Among faculty respondents, 11 respondents (11.7 percent) report having personally experienced discrimination on the basis of gender, race, age, religion, disability, and/or sexual orientation. Seventeen respondents (18.1 percent) reported witnessing discrimination in the workplace. Workplace bullying was reported by 11 respondents (11.7 percent), with 13 respondents (13.8 percent) indicating that they witnessed workplace bullying. Combining four survey items on discrimination and bullying we find that 19 respondents (20.2 percent) report experiencing some form of discrimination and/or bullying and 23 respondents (24.5 percent) report witnessing some form of discrimination and/or bullying.
Workload expectations seems to indicate satisfaction as most of the faculty seem to be working a typical number of courses and labs, but there does seem to be an indication that there is less than satisfactory equitable compensation for lab instruction—particularly in the sciences. A fairly broad group of faculty is delivering “online” instruction and these trends are expected to continue given the growth of Palmetto College. Faculty members indicate that they are receiving strong levels of institutional support for their teaching and service, but support for scholarship lags considerably behind the other two areas. The faculty is generally content with the amount of time spent teaching, but many would prefer to spend more time on scholarship and less on service. Respondents seem to indicate a more optimistic feeling
University of South Carolina Palmetto College Campuses
4
about their “authority to make decisions concerning their classes,” “opportunities for advancement,” “work/life balance,” and “benefits.” But responses indicate need for improvement in “salary” and “time for keeping current in their respective fields.” Only 23 respondents (29.1 percent of 79 respondents to this question) indicate they are satisfied or very satisfied with their salary while 38 respondents (48.1 percent) indicate they are dissatisfied or very dissatisfied with their salary. Thirty-‐seven respondents (47.4 percent) report being comfortable in their current job, but 13 (16.6 percent) indicate interest in seeking another job citing salary as a primary reason. Finally, the 34 respondents (42.5 percent) indicated that Palmetto College provides added job security.
I. INTRODUCTION
About the Survey
The 2014 Faculty Welfare Survey takes from the success of last year’s survey in that it is designed with a specific focus on the personal and professional welfare of the faculty members from the University of South Carolina Palmetto College Campuses. Many of the questions were revised from last year’s survey in order to better streamline the experience for the respondents. The results of this survey should indicate opportunities for exploring the collective concerns of our faculty, advocating for matters of faculty welfare, and enabling individual faculty members to have an idea how their experiences compare to those of other faculty members. The question of “what do we do with these survey results?” is an important one. But this question relates not just to the members of the Welfare Committee of the Palmetto College Campuses Faculty Senate—it relates to all of us. We must all take ownership over these findings and be involved in the dissemination of results and the overall advocacy of faculty well-‐being. The data collected from this survey is to be used for advocacy and not research. None of the data provided in this survey is being used to support research agendas. We are simply reporting the results of this survey to the faculty of Palmetto College Campuses.
Survey Design & Administration
The 2014 survey items maintain an emphasis on the well-‐being of individual faculty members, not the welfare of the institution. Survey items were designed around highlighting faculty needs and ensuring that we all have what we need to be productive faculty members. This focus is consistent with the form and function of the Welfare Committee of the Palmetto College Campuses Faculty Senate.
Due to the nature of many questions in this survey, we invited only full-‐time faculty members of the Palmetto College Campuses.
The Faculty Welfare Survey is an anonymous survey that is aimed at locating faculty well-‐being. Some concerns have been raised as to how anonymous the survey can truly be, given that we ask individuals to provide responses to a series of demographic questions. These demographic items are used, in our
2014 Faculty Welfare Survey
5
analyses and in this report, purely for the contextualization of faculty experiences on our campuses. As you will see in the following report, no small, identifiable groups will be discussed. But, you will quickly see the vital importance that demographics serve in providing meaningful, action-‐item-‐oriented findings on various measures. Careful attention was afforded to the protection of faculty data during survey design, analysis, and the reporting of findings. To further protect individual faculty, we allowed participants to skip questions that they felt were either too personal or made them feel uncomfortable identifying.
The survey itself included a total of 32 individual survey items—some of which were presented in groups to improve the layout and flow of the survey instrument. Survey items focus on three key areas: 1) academic community and collegiality, 2) faculty workload and support, and 3) compensation and retention. Two additional segments of the survey related to faculty demographics and an optional area for open qualitative feedback. Questions were designed to focus on key issues of faculty welfare, such as experiences with discrimination, work/life balance, support for scholarship, and workplace bullying. To improve the quality of the survey for years to come, we also welcome additions, deletions, and edits to the survey in preparation for future survey administrations.
Some of the survey items are categorical in design, while others are continuous items based around a five-‐point scale. These continuous items related to the “degree to which you agree” with certain statements or the “degree to which you are satisfied” with select elements of your job. Likert-‐style survey questions included response options that ranged from Strongly Disagree to Strongly Agree (or Very Dissatisfied to Very Satisfied), and they will be discussed in great detail throughout the remainder of this report. Equally important are the survey items that included a simple dichotomy of yes/no responses. These items will garner a great deal of attention as well. A handful of the survey items also included optional feedback boxes where faculty members could contextualize their responses with qualitative insight. Such feedback will be used, when appropriate..
The 2014 Faculty Welfare Survey was administered as an online survey via Qualtrics. Qualtrics is a leading survey technology provider used by “every major university in the U.S.” (https://www.qualtrics.com/about/), and they are known for outstanding data protection, and great commonsense analytics. All full-‐time faculty members were emailed a survey link inviting them to participate.
Survey Response
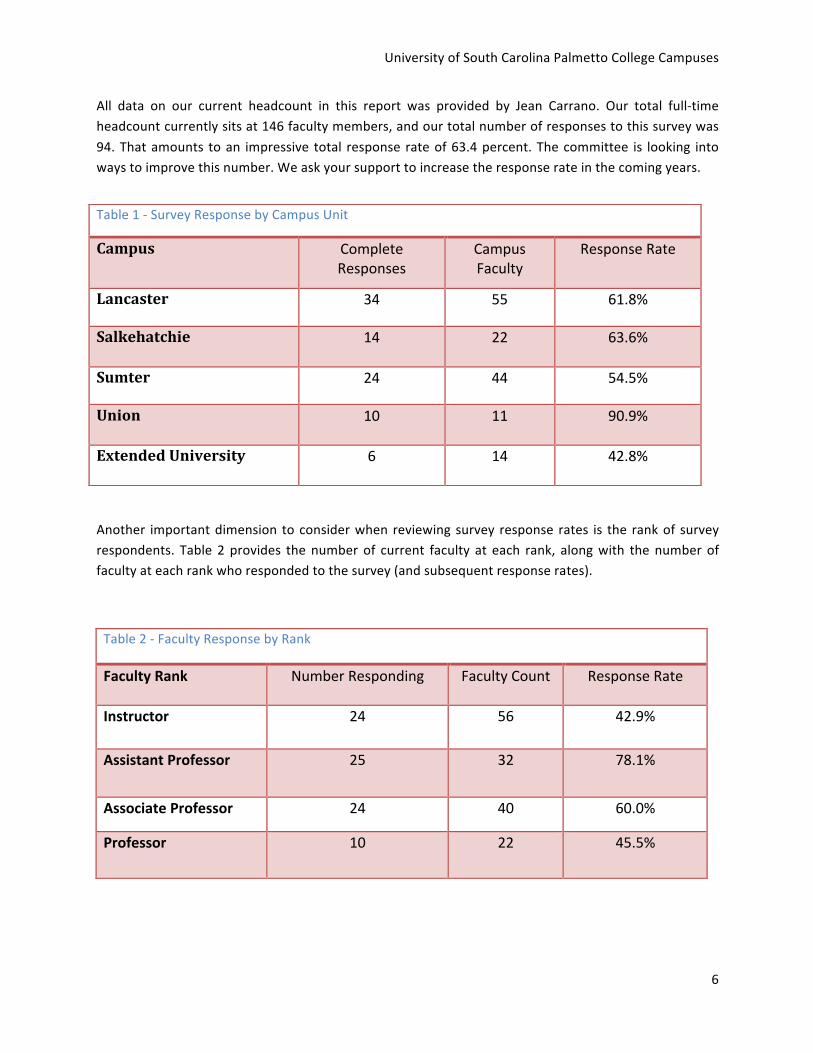
One of the key concerns during the administration of the Faculty Welfare Survey—or any survey for that matter—is the response rate. We are proud to report an exceptional response rate on nearly all accounts. Table 1 provides a quick visual breakdown of the number of full-‐time faculty members that are presently employed at each of the Palmetto College Campuses, along with the number of faculty responding to this survey from each unit (and the calculated rate of response).
University of South Carolina Palmetto College Campuses
6
All data on our current headcount in this report was provided by Jean Carrano. Our total full-‐time headcount currently sits at 146 faculty members, and our total number of responses to this survey was 94. That amounts to an impressive total response rate of 63.4 percent. The committee is looking into ways to improve this number. We ask your support to increase the response rate in the coming years.
Another important dimension to consider when reviewing survey response rates is the rank of survey respondents. Table 2 provides the number of current faculty at each rank, along with the number of faculty at each rank who responded to the survey (and subsequent response rates).
Table 1 -‐ Survey Response by Campus Unit
Campus Complete Responses
Campus Faculty
Response Rate
Lancaster 34 55 61.8%
Salkehatchie 14 22 63.6%
Sumter 24 44 54.5%
Union 10 11 90.9%
Extended University 6 14 42.8%
Table 2 -‐ Faculty Response by Rank
Faculty Rank Number Responding Faculty Count Response Rate
Instructor 24 56 42.9%
Assistant Professor 25 32 78.1%
Associate Professor 24 40 60.0%
Professor 10 22 45.5%
2014 Faculty Welfare Survey
7
Participant Characteristics
As we explained when we created the survey, all demographic information was handled delicately and securely. Information concerning demographics was only used if it offered essential insight of a particular survey item. Two demographic items asked of respondents have already been discussed (campus affiliation and academic rank). The remaining demographics included in the survey are age, ethnicity, race, time on current campus, sexual orientation, and gender. Not all respondents answered all of these questions. Given department and/or campus sizes, we wanted to allow respondents to feel comfortable in securing their anonymity. Therefore, some respondents did not answer every demographic question. Survey respondents reported ages ranging from 28 to 76, with a mean age of 46.8 years old and the standard deviation at 11.58 (data missing for 30 respondents). For ethnicity and race, we offered the same options and format as the U.S. Census. As far as ethnicity, 73 respondents (77.7%) identified as non-‐Hispanic, 2 (2.1%) identified as Hispanic, and 19 (20.2%) did not respond. The modal race category is White with 68 respondents (72.3%), followed by 5 respondents who identified as Black or African American (5.3 percent), 3 identified (3.2%) as Asian American , 2 (2.1%) identified Native American, and 19 did not identify (20.2%). The sexual orientation of survey respondents is as follows: 67 identified as heterosexual (71.3 %), 2 as gay/lesbian (2.1 %), 1 as bisexual (1.5 %), and 24 did not respond (25.5%).
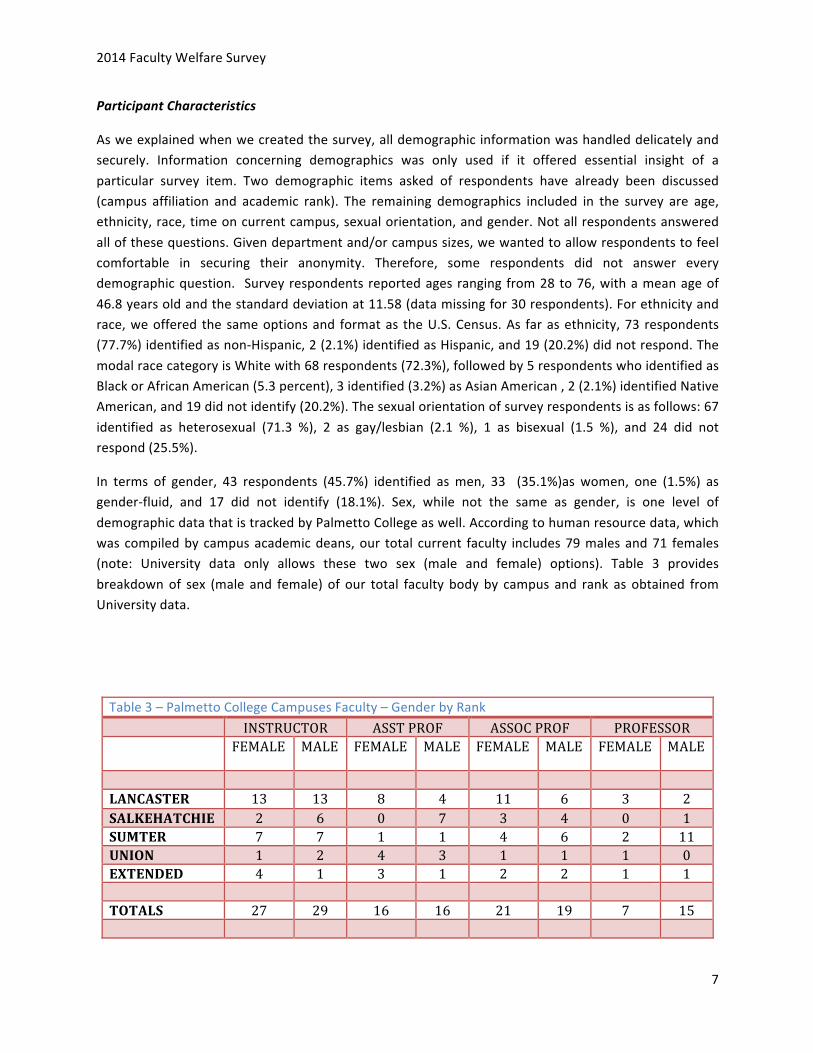
In terms of gender, 43 respondents (45.7%) identified as men, 33 (35.1%)as women, one (1.5%) as gender-‐fluid, and 17 did not identify (18.1%). Sex, while not the same as gender, is one level of demographic data that is tracked by Palmetto College as well. According to human resource data, which was compiled by campus academic deans, our total current faculty includes 79 males and 71 females (note: University data only allows these two sex (male and female) options). Table 3 provides breakdown of sex (male and female) of our total faculty body by campus and rank as obtained from University data.
Table 3 – Palmetto College Campuses Faculty – Gender by Rank INSTRUCTOR ASST PROF ASSOC PROF PROFESSOR FEMALE MALE FEMALE MALE FEMALE MALE FEMALE MALE
LANCASTER 13 13 8 4 11 6 3 2 SALKEHATCHIE 2 6 0 7 3 4 0 1 SUMTER 7 7 1 1 4 6 2 11 UNION 1 2 4 3 1 1 1 0 EXTENDED 4 1 3 1 2 2 1 1 TOTALS 27 29 16 16 21 19 7 15
University of South Carolina Palmetto College Campuses
8
About the Report
The remaining sections of the report will examine survey items in the three major areas of the survey: Chapter II will cover items related to Academic Community and Collegiality, Chapter III relates to Faculty Workload and Support, and Chapter IV covers Compensation and Retention. Analysis for each area will include a summary of individual survey items, and, where appropriate, a report of important differences among subgroups (e.g., women and men). A final item enables faculty to provide qualitative feedback at the conclusion of the survey instrument. The report concludes with information on how to contact the Welfare Committee with questions or comments about the survey.
II. ACADEMIC COMMUNITY AND COLLEGIALITY
In Section II all questions are based on assessing faculty members’ feelings about the health of their academic community and their sense (or not) that they work in a collegial environment. As seen throughout this section, some of the items in Section II yielded surprising results.
Each of the 12 items asked respondents to “please indicate the degree to which you agree with the following statements.” Table 4 includes some basic analytics of these 12 items. To aid in the discussion of the 12 survey items presented in Table 4, we decided to break them into three subgroups: 1) the first four items, relating to collegiality, 2) the middle four items, relating to diversity and value, and 3) the last four items, relating to constructive interaction with administration. To help streamline information Question 11 asked respondents to indicate the degree to which their campus valued diversity. A table indicating the responses is included in subgroup three.
At the end of Section II we have included the data concerning discrimination and workplace bullying.

2014 Faculty Welfare Survey
9
Table 4 -‐ Frequencies, Means, and Standard Deviations for Survey Items Related to “Academic Community and Collegiality”—Rated on a Scale from Strongly Disagree (value of 1) to Strongly Agree (value of 5).
Question Strongly Disagree
Disagree Neither Agree Nor Disagree
Agree Strongly Agree
Missing Data
Mean Standard Deviation
Among the colleagues on my campus, there exists a strong level of collegiality
2
10
13
46
18
5 3.76
.98
I can comfortably voice my opinion on campus matters without fear of retribution
5
7
15
42
20
5 3.73
1.07
My input is valued on matters of faculty welfare and faculty governance
4
12
15
37
21
5 3.66
1.25
I have had constructive interactions with the USC Columbia department that correspond with my discipline
13
15
23
21
17
5 3.16
1.32
In my opinion, diversity is important to the mission of Higher Education
1
5
16
25
41
6
4.14
0.98
My teaching accomplishments are recognized and valued
4
9
15
37
24
5
3.16
1.32
My scholarly achievements are recognized and valued
4
11
18
36
20
5 3.64
1.10
My service contributions are recognized and valued
5
8
15
41
20
5
3.71
1.09
I have constructive interactions with my coworkers.
2 3 4 39 40 6 4.27 .88
I have constructive interactions with my division chair.
3 4 7 29 38 13* 4.17 1.03
I have constructive interactions with my academic dean.
1 5 13 22 47 6 4.24 .98
I have constructive interactions with my dean.
6 8 9 25 40 6 3.97 1.25
University of South Carolina Palmetto College Campuses
10
Collegiality
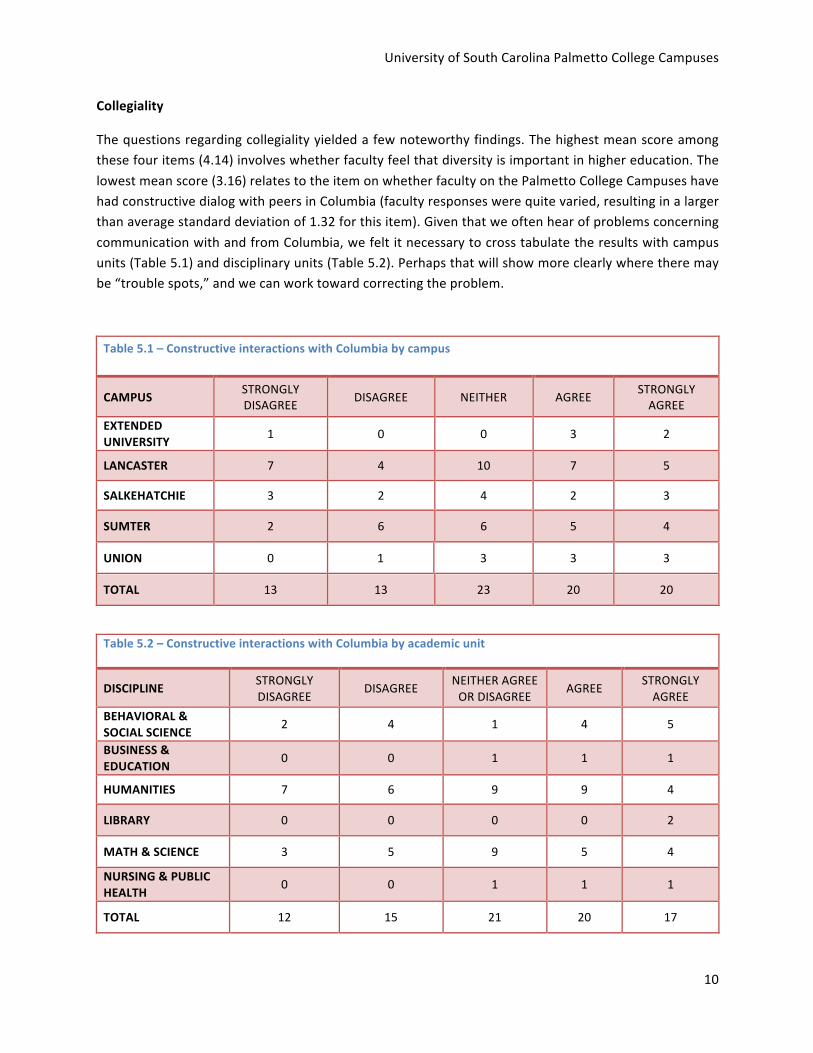
The questions regarding collegiality yielded a few noteworthy findings. The highest mean score among these four items (4.14) involves whether faculty feel that diversity is important in higher education. The lowest mean score (3.16) relates to the item on whether faculty on the Palmetto College Campuses have had constructive dialog with peers in Columbia (faculty responses were quite varied, resulting in a larger than average standard deviation of 1.32 for this item). Given that we often hear of problems concerning communication with and from Columbia, we felt it necessary to cross tabulate the results with campus units (Table 5.1) and disciplinary units (Table 5.2). Perhaps that will show more clearly where there may be “trouble spots,” and we can work toward correcting the problem.
Table 5.1 – Constructive interactions with Columbia by campus
CAMPUS STRONGLY DISAGREE DISAGREE NEITHER AGREE STRONGLY
AGREE EXTENDED UNIVERSITY 1 0 0 3 2
LANCASTER 7 4 10 7 5
SALKEHATCHIE 3 2 4 2 3
SUMTER 2 6 6 5 4
UNION 0 1 3 3 3
TOTAL 13 13 23 20 20
Table 5.2 – Constructive interactions with Columbia by academic unit
DISCIPLINE STRONGLY DISAGREE
DISAGREE NEITHER AGREE OR DISAGREE
AGREE STRONGLY AGREE
BEHAVIORAL & SOCIAL SCIENCE
2 4 1 4 5
BUSINESS & EDUCATION
0 0 1 1 1
HUMANITIES 7 6 9 9 4
LIBRARY 0 0 0 0 2
MATH & SCIENCE 3 5 9 5 4
NURSING & PUBLIC HEALTH
0 0 1 1 1
TOTAL 12 15 21 20 17

2014 Faculty Welfare Survey
11
Diversity and Value
Table 6 shows the response breakdown in terms of valuing diversity on Palmetto College campuses. The first question in this section (about whether “diversity is important to the mission of Higher Education”; see Table 4) had the highest mean of any item in the section at 4.14 with standard deviation of .98. Although respondents reported strong mean scores on questions about their campus valuing diversity in terms of race (4.0) and gender (3.87), the mean score on whether one’s campus values diversity in sexual orientation is less optimistic (3.31). Only 37 percent of respondents indicated that they either agree or strongly agree that their campus values diversity on sexual orientation. Equally less optimistic is the mean score on whether one’s campus values diversity in religion (3.44), with only 44 percent of respondents indicating that they agree or strongly agree that their campus values diversity on religion.
Three questions in the Academic Community and Collegiality segment of the survey provide us with an idea of whether faculty members feel that their accomplishments (teaching, scholarship, and service) are recognized and valued. As seen in Table 4, these three areas all had relatively high mean scores. At face value it appears that teaching is valued the most (mean = 3.76), followed by service (mean = 3.73) and scholarship (mean = 3.64). The three survey questions on “feeling valued” will prove more useful when engaging in future longitudinal analyses, particularly as the Chancellor’s office continues to pursue avenues to increase resources. From the survey, 68 percent of the respondents agreed or strongly agreed that their teaching accomplishments were recognized and valued on their campus. 62 percent agreed or strongly agreed that their scholarly achievements were recognized and valued on their
Table 6 – For only the 2014 calendar year, please indicate the degree to which you agree that your campus values diversity in terms of: Question Strongly
Disagree Disagree Neither Agree Strongly
Agree Total
Responses Mean Standard
Deviation Race 4 2 12 40 28 86 4.00 .99 Gender 5 2 16 39 24 86 3.87 1.04 Sexual Orientation
7 3 44 13 19 86 3.40 1.12
Age 3 2 33 25 23 86 3.73 1.00 Color 3 2 19 32 26 82 3.93 .99 Sex 5 2 20 33 24 84 3.82 1.07 Religion 5 8 33 21 17 84 3.44 1.10 National Origin
4 5 27 28 20 84 3.65 1.06
Genetics 2 2 46 14 16 80 3.50 .93 Veterans Status
3 2 33 25 21 84 3.70 .99
Disability Status
4 2 33 24 23 86 3.70 1.04
University of South Carolina Palmetto College Campuses
12
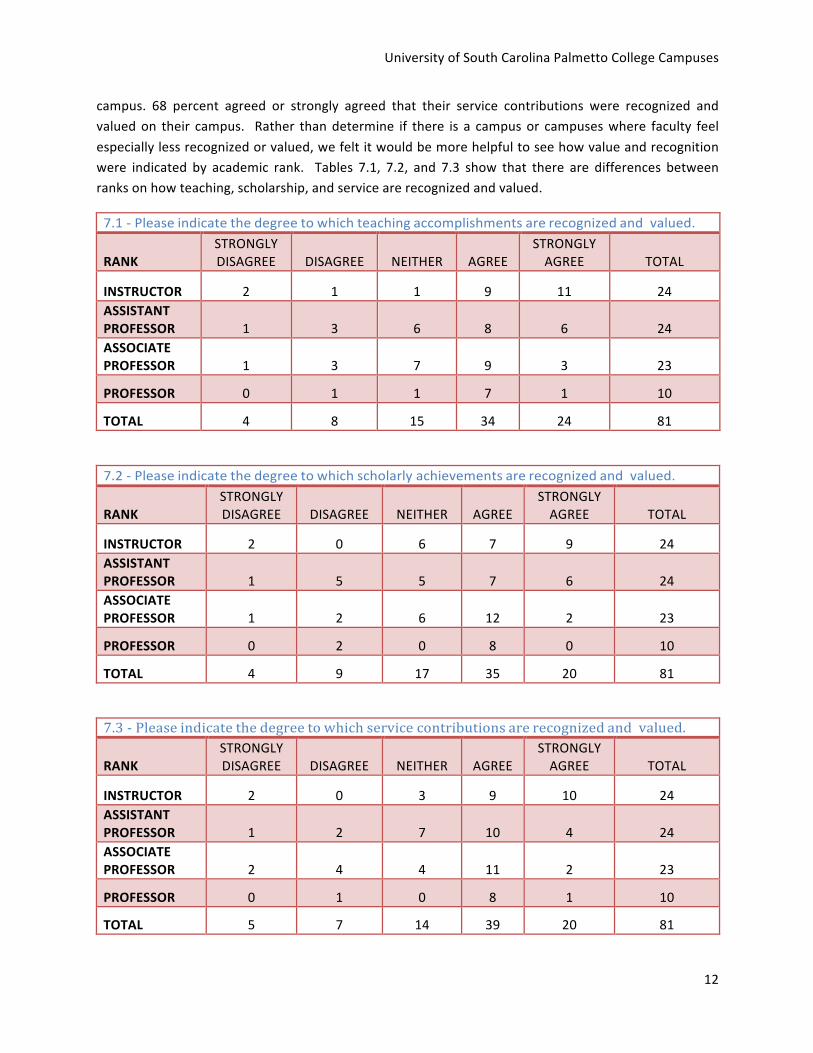
campus. 68 percent agreed or strongly agreed that their service contributions were recognized and valued on their campus. Rather than determine if there is a campus or campuses where faculty feel especially less recognized or valued, we felt it would be more helpful to see how value and recognition were indicated by academic rank. Tables 7.1, 7.2, and 7.3 show that there are differences between ranks on how teaching, scholarship, and service are recognized and valued.
7.1 -‐ Please indicate the degree to which teaching accomplishments are recognized and valued.
RANK STRONGLY DISAGREE DISAGREE NEITHER AGREE
STRONGLY AGREE TOTAL
INSTRUCTOR 2 1 1 9 11 24 ASSISTANT PROFESSOR 1 3 6 8 6 24 ASSOCIATE PROFESSOR 1 3 7 9 3 23
PROFESSOR 0 1 1 7 1 10
TOTAL 4 8 15 34 24 81
7.2 -‐ Please indicate the degree to which scholarly achievements are recognized and valued.
RANK STRONGLY DISAGREE DISAGREE NEITHER AGREE
STRONGLY AGREE TOTAL
INSTRUCTOR 2 0 6 7 9 24 ASSISTANT PROFESSOR 1 5 5 7 6 24 ASSOCIATE PROFESSOR 1 2 6 12 2 23
PROFESSOR 0 2 0 8 0 10
TOTAL 4 9 17 35 20 81
7.3 -‐ Please indicate the degree to which service contributions are recognized and valued.
RANK STRONGLY DISAGREE DISAGREE NEITHER AGREE
STRONGLY AGREE TOTAL
INSTRUCTOR 2 0 3 9 10 24 ASSISTANT PROFESSOR 1 2 7 10 4 24 ASSOCIATE PROFESSOR 2 4 4 11 2 23
PROFESSOR 0 1 0 8 1 10
TOTAL 5 7 14 39 20 81
2014 Faculty Welfare Survey
13
Constructive Interaction with Administrators
The final four questions in the Academic Community and Collegiality segment of the survey asked respondents to indicate their constructive interaction with co-‐workers and administration. Out of 88 responses, 39 agreed and 40 strongly agreed that they had constructive interactions with co-‐workers. Of the four questions in this segment, this question resulted in a mean score of 4.27 – the highest of the four. It should be noted that the question asking about interactions with division chairs has a lower number of responses since the Union campus does not have division chairs. Of the 81 responses, 29 agreed and 38 strongly agreed that they have constructive interactions with their division chairs. The survey also indicates faculty have constructive interactions with their academic deans. Out of the 88 responses, 22 agreed and 47 strongly agreed. The final question concerning constructive interactions with campus deans indicated a mean score of 3.97, and also had the highest number of strong disagreement (6) which was the highest of all four questions. However, it should be noted that Lancaster, Union, and Sumter introduced new Deans to their campuses in 2013-‐2014.
Discrimination and Workplace Bullying
In our summation, the most immediate and alarming findings of the 2014 Faculty Welfare Survey involve two areas of inquiry: 1) discrimination and 2) workplace bullying. Of the 84 faculty members who responded to this item (“I have personally faced discrimination on the basis of any of the following”)—11 (13%) faculty members responded that they have experienced discrimination. 17 (19%) claim to have witnessed it.
Of the 13 percent who responded that they have personally experienced discrimination, the majority stated gender as the basis. However, there were high numbers indicating religion, sex, age, race, color, disability, and sexual orientation as personal characteristics for which they personally faced discrimination. We would also like to point out that discrimination is commonly underreported on workplace surveys—thus, it is likely to be occurring more than our results indicate.
Following the question of discrimination, the survey asks respondents whether they have been victims of workplace bullying. The University of South Carolina has instituted a policy on workplace bullying (USC policy “ACAF 1.80” went into effect on February 28, 2014). According to the University, workplace bullying refers to “repeated, unwelcome severe and pervasive behavior that intentionally threatens, intimidates, humiliates or isolates the targeted individual(s), or undermines their reputation or job performance.” Further, “it may take, but is not limited to, one or more of the following forms: verbal abuse, malicious criticism or gossip, unwarranted monitoring, unwarranted physical contact, exclusion or isolation in the workplace, work interference or sabotage, cyber-‐bullying, or other offensive conduct/behaviors (including nonverbal) which are threatening, humiliating, harassing or intimidating.” In addition to this policy, the University has created The Faculty Committee on Professional Conduct in 2014.

University of South Carolina Palmetto College Campuses
14
One of the major points of discussion in the crafting of ACAF 1.80 rested on whether or not workplace bullying was even an issue at the University of South Carolina. Based on the findings of the 2014 Faculty Welfare Survey, it mostly certainly appears to be an issue. Among the 85 faculty members who responded to this question, 11 (13%) indicated that they have been (or presently are) a victim of workplace bullying. 13 (15%) claim to have witnessed bullying.
Before moving forward into the next segment of the survey, we would like to provide one summative statistic. When we take into account data included from discrimination and combine it with data on workplace bullying, we find the following reality: 19 faculty members (20%) of the 94 responding to the 2014 Faculty Welfare Survey have experienced some form of discrimination and/or workplace bullying, and 23 (24.5%) have witnessed it in just the calendar year of 2014. Cross tabulations with responses to discrimination and bullying indicate multiple campuses (Table 8.1) and respondents across academic ranks (Table 8.2).
Table 8.1 -‐ Discrimination and Bullying per Campus
Extended Lancaster Salkehatchie Sumter Union Faced Discrimination
Yes 0 4 1 2 3 No 5 27 13 20 7
Witnessed discrimination
Yes 0 5 0 7 3 No 6 28 13 18 7
Faced Bullying
Yes 0 3 0 4 2 No 6 28 13 18 8
Witnessed Bullying
Yes 0 4 0 4 3 No 6 27 13 17 7
Table 8.2 -‐ Discrimination and Bullying per Rank
Instructor Assistant Professor Associate Professor Professor
Faced Discrimination
Yes 1 4 4 1 No 21 19 19 9
Witnessed discrimination
Yes 1 4 6 3 No 23 19 17 7
Faced Bullying
Yes 1 3 2 3 No 21 20 20 7
Witnessed Bullying
Yes 2 4 2 3 No 20 19 20 6
2014 Faculty Welfare Survey
15
III. FACULTY WORKLOAD AND SUPPORT
The tone of Section III of the Welfare Survey is much improved from the tone of Section II. Questions center on three areas: faculty workload, support for professional success, and distribution of work-‐hours.
Faculty Workload
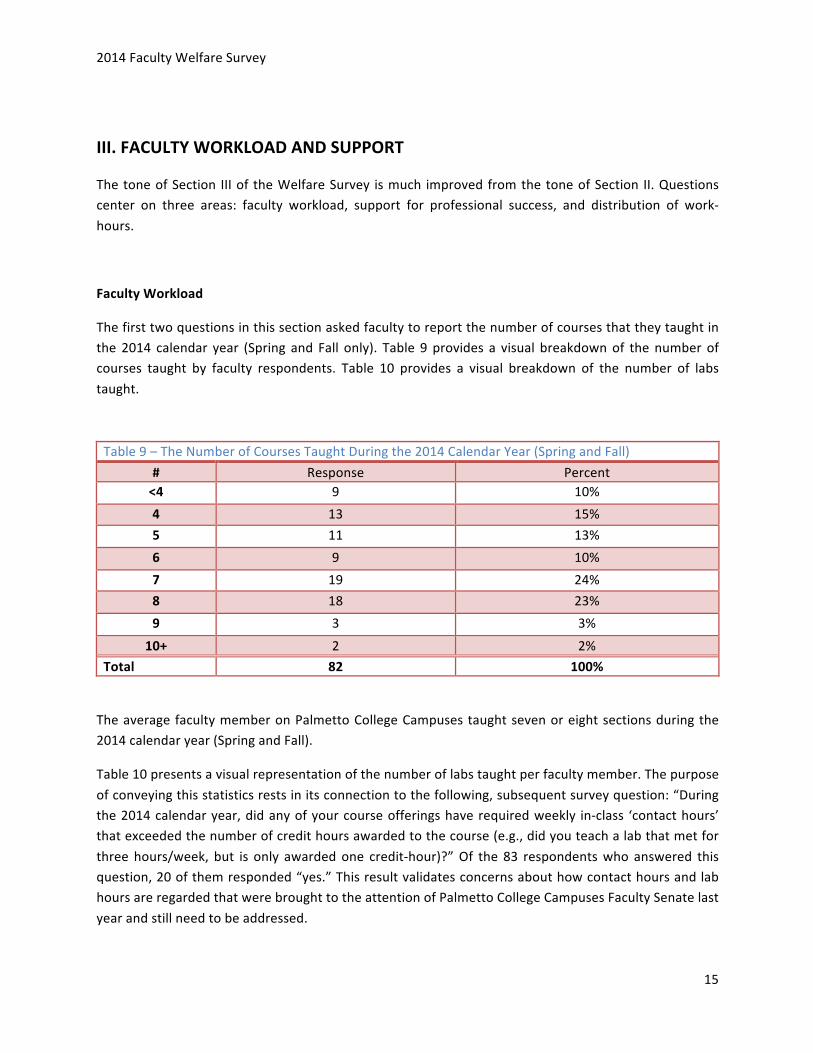
The first two questions in this section asked faculty to report the number of courses that they taught in the 2014 calendar year (Spring and Fall only). Table 9 provides a visual breakdown of the number of courses taught by faculty respondents. Table 10 provides a visual breakdown of the number of labs taught.
Table 9 – The Number of Courses Taught During the 2014 Calendar Year (Spring and Fall) # Response Percent <4 9 10% 4 13 15% 5 11 13% 6 9 10% 7 19 24% 8 18 23% 9 3 3%
10+ 2 2% Total 82 100%
The average faculty member on Palmetto College Campuses taught seven or eight sections during the 2014 calendar year (Spring and Fall).
Table 10 presents a visual representation of the number of labs taught per faculty member. The purpose of conveying this statistics rests in its connection to the following, subsequent survey question: “During the 2014 calendar year, did any of your course offerings have required weekly in-‐class ‘contact hours’ that exceeded the number of credit hours awarded to the course (e.g., did you teach a lab that met for three hours/week, but is only awarded one credit-‐hour)?” Of the 83 respondents who answered this question, 20 of them responded “yes.” This result validates concerns about how contact hours and lab hours are regarded that were brought to the attention of Palmetto College Campuses Faculty Senate last year and still need to be addressed.
University of South Carolina Palmetto College Campuses
16
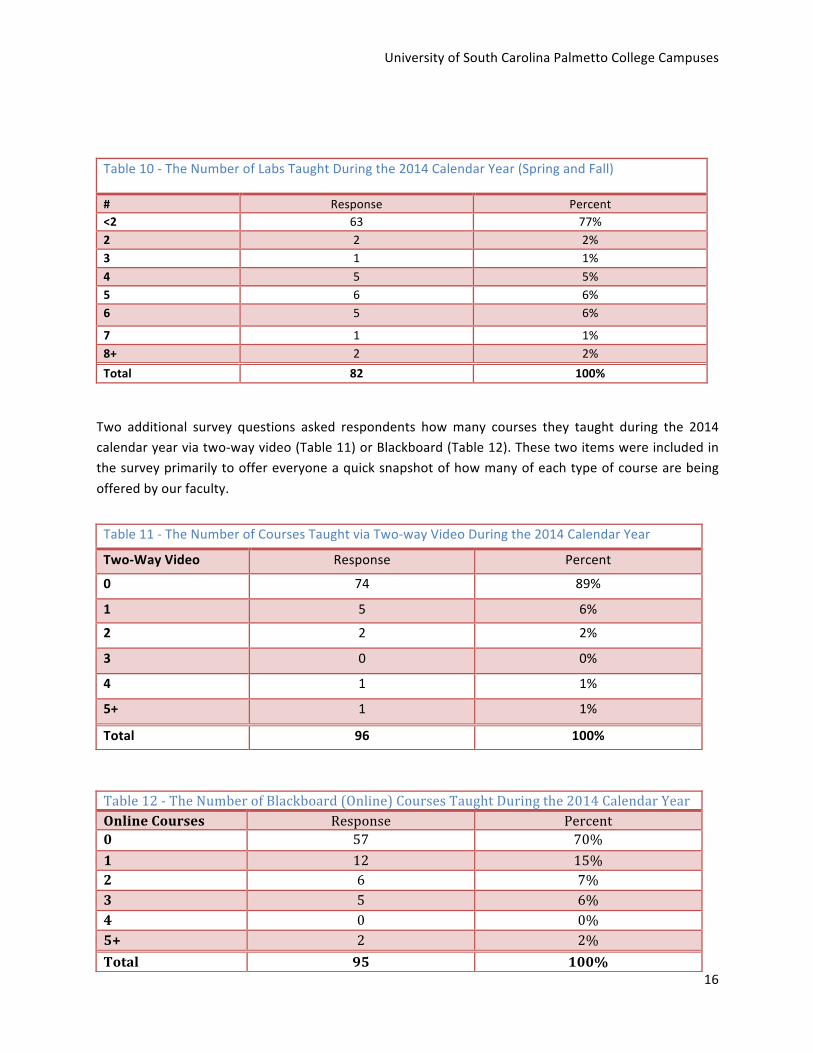
Table 10 -‐ The Number of Labs Taught During the 2014 Calendar Year (Spring and Fall) # Response Percent <2 63 77% 2 2 2% 3 1 1% 4 5 5% 5 6 6% 6 5 6%
7 1 1% 8+ 2 2% Total 82 100%
Two additional survey questions asked respondents how many courses they taught during the 2014 calendar year via two-‐way video (Table 11) or Blackboard (Table 12). These two items were included in the survey primarily to offer everyone a quick snapshot of how many of each type of course are being offered by our faculty.
Table 11 -‐ The Number of Courses Taught via Two-‐way Video During the 2014 Calendar Year
Two-‐Way Video Response Percent
0 74 89%
1 5 6%
2 2 2%
3 0 0%
4 1 1%
5+ 1 1%
Total 96 100%
Table 12 -‐ The Number of Blackboard (Online) Courses Taught During the 2014 Calendar Year Online Courses Response Percent 0 57 70% 1 12 15% 2 6 7% 3 5 6% 4 0 0% 5+ 2 2% Total 95 100%
2014 Faculty Welfare Survey
17
Support for Professional Success
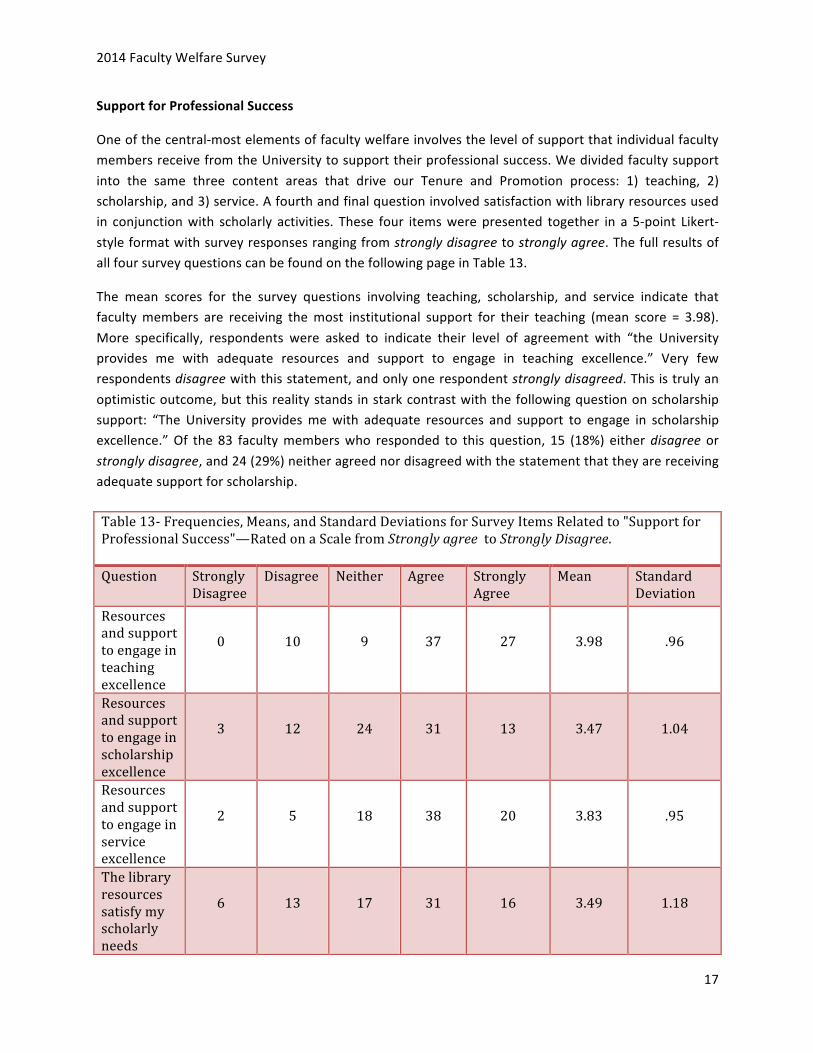
One of the central-‐most elements of faculty welfare involves the level of support that individual faculty members receive from the University to support their professional success. We divided faculty support into the same three content areas that drive our Tenure and Promotion process: 1) teaching, 2) scholarship, and 3) service. A fourth and final question involved satisfaction with library resources used in conjunction with scholarly activities. These four items were presented together in a 5-‐point Likert-‐style format with survey responses ranging from strongly disagree to strongly agree. The full results of all four survey questions can be found on the following page in Table 13.
The mean scores for the survey questions involving teaching, scholarship, and service indicate that faculty members are receiving the most institutional support for their teaching (mean score = 3.98). More specifically, respondents were asked to indicate their level of agreement with “the University provides me with adequate resources and support to engage in teaching excellence.” Very few respondents disagree with this statement, and only one respondent strongly disagreed. This is truly an optimistic outcome, but this reality stands in stark contrast with the following question on scholarship support: “The University provides me with adequate resources and support to engage in scholarship excellence.” Of the 83 faculty members who responded to this question, 15 (18%) either disagree or strongly disagree, and 24 (29%) neither agreed nor disagreed with the statement that they are receiving adequate support for scholarship.
Table 13-‐ Frequencies, Means, and Standard Deviations for Survey Items Related to "Support for Professional Success"—Rated on a Scale from Strongly agree to Strongly Disagree. Question Strongly
Disagree Disagree Neither Agree Strongly
Agree Mean Standard
Deviation Resources and support to engage in teaching excellence
0
10
9
37
27
3.98
.96
Resources and support to engage in scholarship excellence
3
12
24
31
13
3.47
1.04
Resources and support to engage in service excellence
2
5
18
38
20
3.83
.95
The library resources satisfy my scholarly needs
6
13
17
31
16
3.49
1.18
18
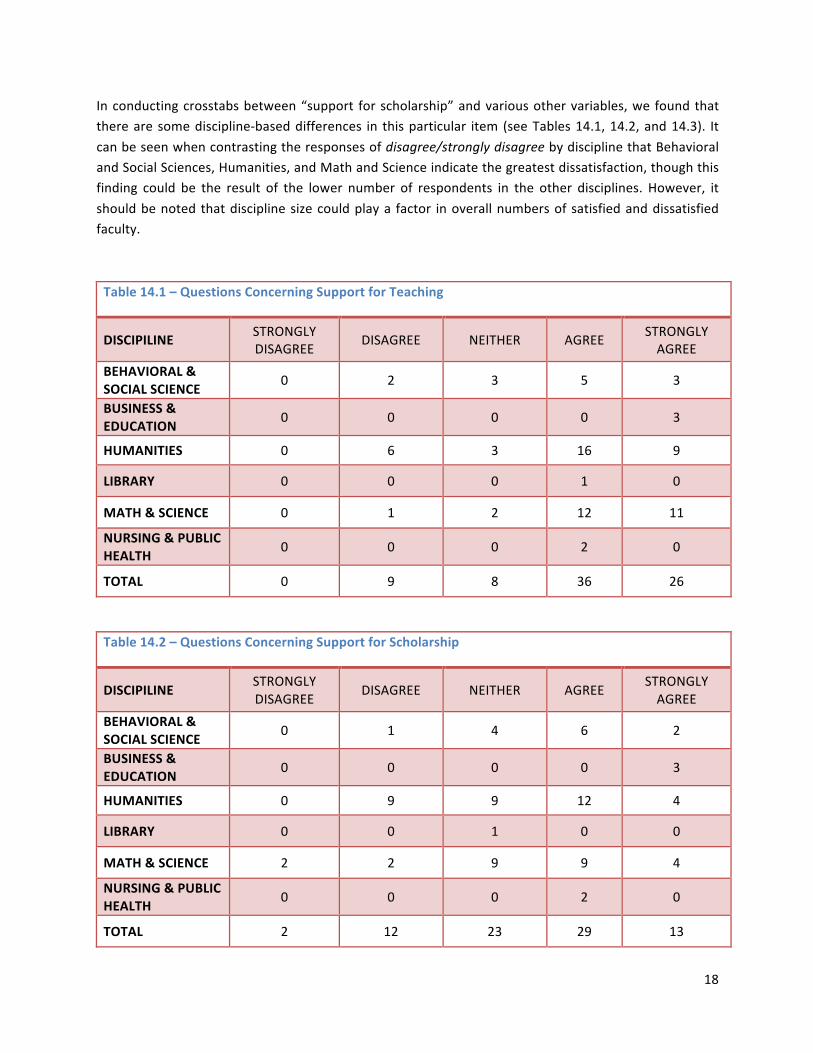
In conducting crosstabs between “support for scholarship” and various other variables, we found that there are some discipline-‐based differences in this particular item (see Tables 14.1, 14.2, and 14.3). It can be seen when contrasting the responses of disagree/strongly disagree by discipline that Behavioral and Social Sciences, Humanities, and Math and Science indicate the greatest dissatisfaction, though this finding could be the result of the lower number of respondents in the other disciplines. However, it should be noted that discipline size could play a factor in overall numbers of satisfied and dissatisfied faculty.
Table 14.1 – Questions Concerning Support for Teaching
DISCIPILINE STRONGLY DISAGREE DISAGREE NEITHER AGREE STRONGLY
AGREE BEHAVIORAL & SOCIAL SCIENCE 0 2 3 5 3
BUSINESS & EDUCATION 0 0 0 0 3
HUMANITIES 0 6 3 16 9
LIBRARY 0 0 0 1 0
MATH & SCIENCE 0 1 2 12 11
NURSING & PUBLIC HEALTH 0 0 0 2 0
TOTAL 0 9 8 36 26
Table 14.2 – Questions Concerning Support for Scholarship
DISCIPILINE STRONGLY DISAGREE DISAGREE NEITHER AGREE STRONGLY
AGREE BEHAVIORAL & SOCIAL SCIENCE 0 1 4 6 2
BUSINESS & EDUCATION 0 0 0 0 3
HUMANITIES 0 9 9 12 4
LIBRARY 0 0 1 0 0
MATH & SCIENCE 2 2 9 9 4
NURSING & PUBLIC HEALTH 0 0 0 2 0
TOTAL 2 12 23 29 13
2014 Faculty Welfare Survey
19
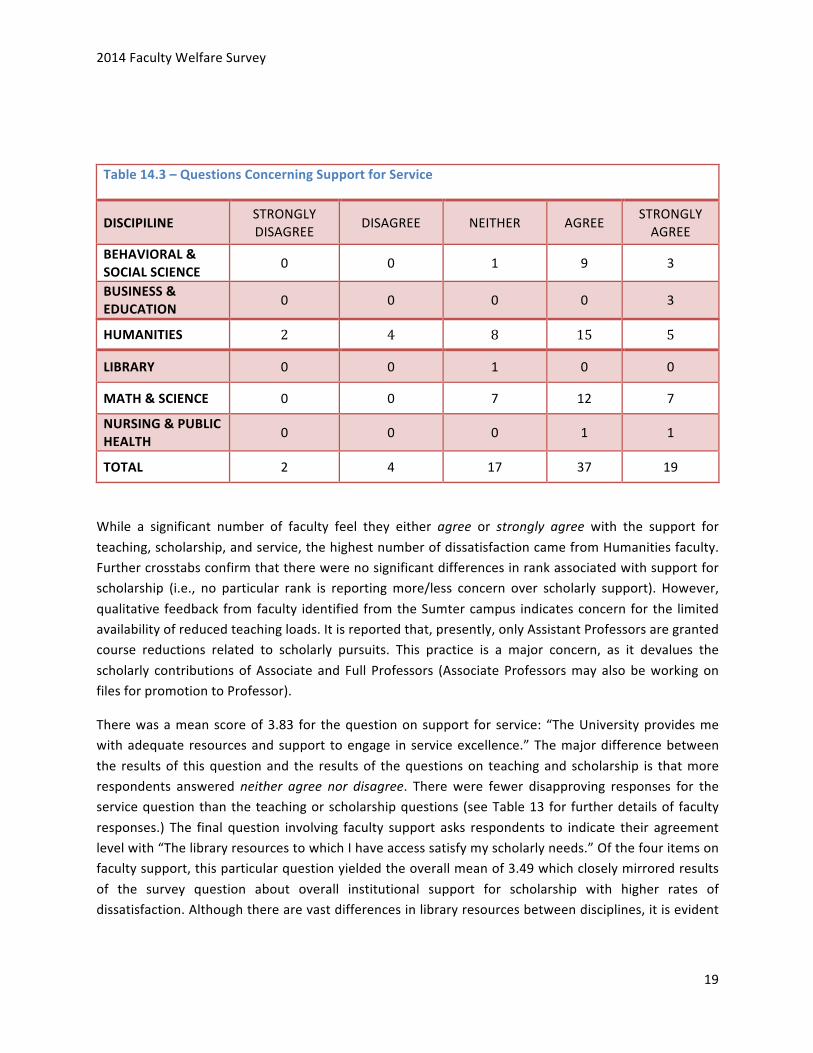
Table 14.3 – Questions Concerning Support for Service
DISCIPILINE STRONGLY DISAGREE DISAGREE NEITHER AGREE STRONGLY
AGREE BEHAVIORAL & SOCIAL SCIENCE 0 0 1 9 3
BUSINESS & EDUCATION 0 0 0 0 3
HUMANITIES 2 4 8 15 5
LIBRARY 0 0 1 0 0
MATH & SCIENCE 0 0 7 12 7
NURSING & PUBLIC HEALTH 0 0 0 1 1
TOTAL 2 4 17 37 19
While a significant number of faculty feel they either agree or strongly agree with the support for teaching, scholarship, and service, the highest number of dissatisfaction came from Humanities faculty. Further crosstabs confirm that there were no significant differences in rank associated with support for scholarship (i.e., no particular rank is reporting more/less concern over scholarly support). However, qualitative feedback from faculty identified from the Sumter campus indicates concern for the limited availability of reduced teaching loads. It is reported that, presently, only Assistant Professors are granted course reductions related to scholarly pursuits. This practice is a major concern, as it devalues the scholarly contributions of Associate and Full Professors (Associate Professors may also be working on files for promotion to Professor).
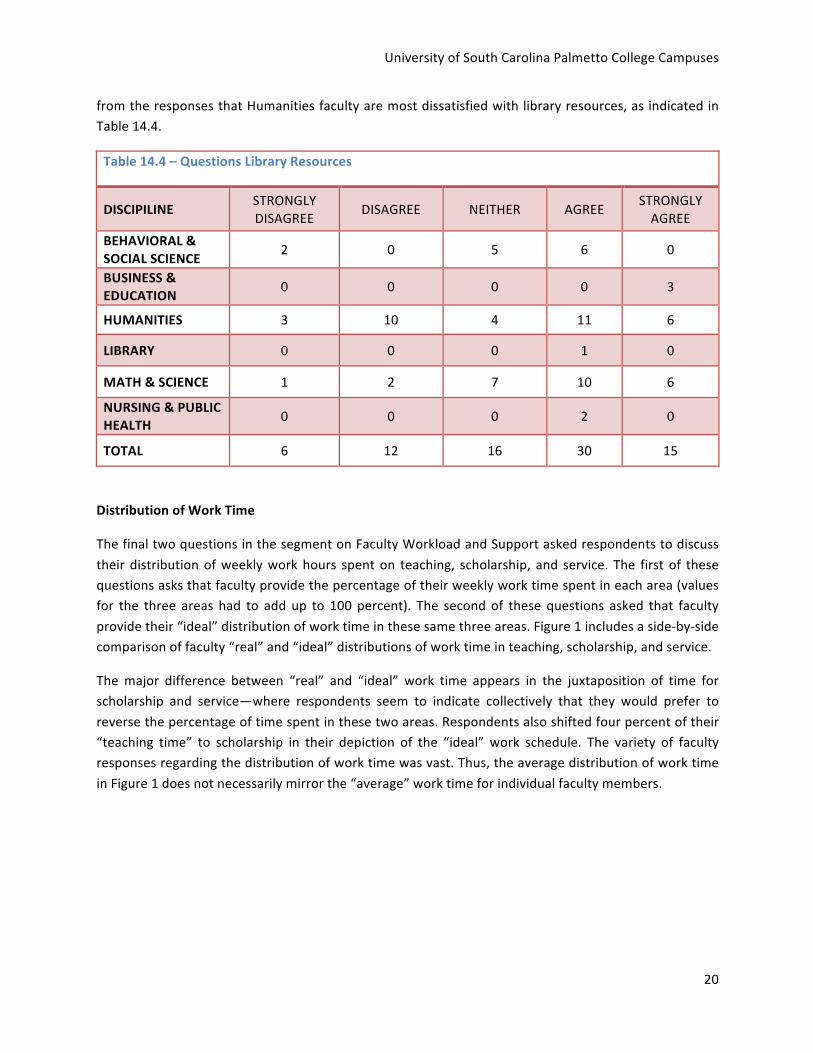
There was a mean score of 3.83 for the question on support for service: “The University provides me with adequate resources and support to engage in service excellence.” The major difference between the results of this question and the results of the questions on teaching and scholarship is that more respondents answered neither agree nor disagree. There were fewer disapproving responses for the service question than the teaching or scholarship questions (see Table 13 for further details of faculty responses.) The final question involving faculty support asks respondents to indicate their agreement level with “The library resources to which I have access satisfy my scholarly needs.” Of the four items on faculty support, this particular question yielded the overall mean of 3.49 which closely mirrored results of the survey question about overall institutional support for scholarship with higher rates of dissatisfaction. Although there are vast differences in library resources between disciplines, it is evident
University of South Carolina Palmetto College Campuses
20
from the responses that Humanities faculty are most dissatisfied with library resources, as indicated in Table 14.4.
Table 14.4 – Questions Library Resources
DISCIPILINE STRONGLY DISAGREE DISAGREE NEITHER AGREE STRONGLY
AGREE BEHAVIORAL & SOCIAL SCIENCE 2 0 5 6 0
BUSINESS & EDUCATION 0 0 0 0 3
HUMANITIES 3 10 4 11 6
LIBRARY 0 0 0 1 0
MATH & SCIENCE 1 2 7 10 6
NURSING & PUBLIC HEALTH 0 0 0 2 0
TOTAL 6 12 16 30 15
Distribution of Work Time
The final two questions in the segment on Faculty Workload and Support asked respondents to discuss their distribution of weekly work hours spent on teaching, scholarship, and service. The first of these questions asks that faculty provide the percentage of their weekly work time spent in each area (values for the three areas had to add up to 100 percent). The second of these questions asked that faculty provide their “ideal” distribution of work time in these same three areas. Figure 1 includes a side-‐by-‐side comparison of faculty “real” and “ideal” distributions of work time in teaching, scholarship, and service.
The major difference between “real” and “ideal” work time appears in the juxtaposition of time for scholarship and service—where respondents seem to indicate collectively that they would prefer to reverse the percentage of time spent in these two areas. Respondents also shifted four percent of their “teaching time” to scholarship in their depiction of the “ideal” work schedule. The variety of faculty responses regarding the distribution of work time was vast. Thus, the average distribution of work time in Figure 1 does not necessarily mirror the “average” work time for individual faculty members.

2014 Faculty Welfare Survey
21
Figure 1 -‐ Percentage of Work Time Faculty Spend on Teaching, Scholarship, and Service (Side-‐by-‐side Comparison of "Real" versus "Ideal")
Actual Time Spent
Teaching
Scholarship
Service
60% 15%
25%
Ideal Time Spent
Teaching
Scholarship
Service
54% 26%
20%
University of South Carolina Palmetto College Campuses
22
IV. COMPENSATION AND RETENTION
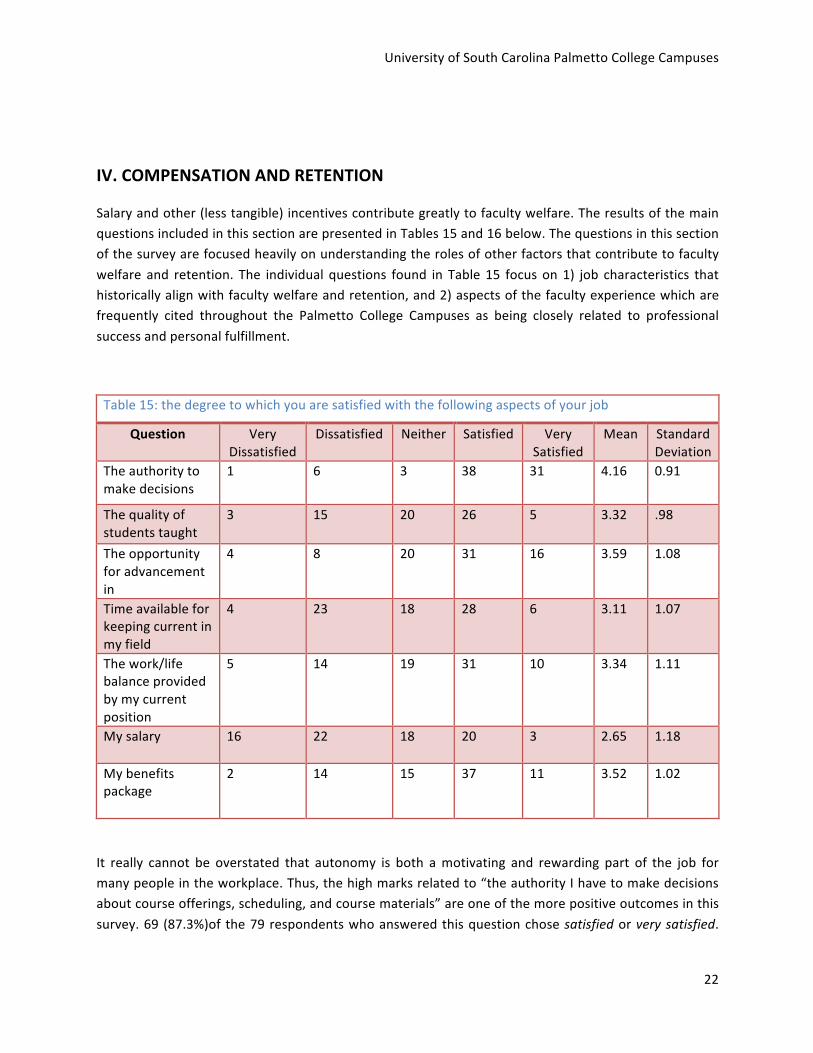
Salary and other (less tangible) incentives contribute greatly to faculty welfare. The results of the main questions included in this section are presented in Tables 15 and 16 below. The questions in this section of the survey are focused heavily on understanding the roles of other factors that contribute to faculty welfare and retention. The individual questions found in Table 15 focus on 1) job characteristics that historically align with faculty welfare and retention, and 2) aspects of the faculty experience which are frequently cited throughout the Palmetto College Campuses as being closely related to professional success and personal fulfillment.
Table 15: the degree to which you are satisfied with the following aspects of your job
Question Very Dissatisfied
Dissatisfied Neither Satisfied Very Satisfied
Mean Standard Deviation
The authority to make decisions
1 6
3 38 31 4.16
0.91
The quality of students taught
3 15 20 26 5 3.32
.98
The opportunity for advancement in
4 8 20 31 16 3.59
1.08
Time available for keeping current in my field
4 23 18 28 6 3.11
1.07
The work/life balance provided by my current position
5
14
19 31 10 3.34
1.11
My salary
16 22 18 20 3 2.65
1.18
My benefits package
2 14 15 37 11 3.52
1.02
It really cannot be overstated that autonomy is both a motivating and rewarding part of the job for many people in the workplace. Thus, the high marks related to “the authority I have to make decisions about course offerings, scheduling, and course materials” are one of the more positive outcomes in this survey. 69 (87.3%)of the 79 respondents who answered this question chose satisfied or very satisfied.
2014 Faculty Welfare Survey
23
Welfare surveys at many larger universities often report a great deal of discontent in this area, so the “high marks” on autonomy at Palmetto College Campuses should definitely be emphasized.
Other satisfactory “high marks” include opportunities for advancement, work/life balance, and benefits. On the other hand, the results of the survey questions on “time available for keeping current” and “satisfaction with salary” is a major concern. The score distribution for the salary question yields the only outcome in the 2014 survey that carries a mean below 3.0 (2.65) in which more of survey respondents answered very dissatisfied or dissatisfied than those who answered satisfied or very satisfied. The 2012-‐13 Faculty Salary Study, authored by the RCFS Welfare Committee in April of 2013, confirms that faculty sentiment about salaries is perfectly in line with the reality that the faculty of Palmetto College Campuses has been/are, on average, underpaid. Consider the following finding from the 2012-‐13 Faculty Salary Study:
Perhaps the clearest evidence of the relative inequity in salaries can be seen in comparing the USC Regional Campuses Average against the AAUP published average for “All U.S. 2-‐Year Institutions (Public).” The aggregate AAUP figure includes two-‐year state universities, community colleges, two-‐year technical schools, and any other institution of higher education which is considered a Rank III institution. . . At the rank of Professor, faculty members of the USC Regional Campuses and Extended University still make, on average, $6,700 less than the average Professor employed at a U.S. 2-‐Year public institution. Likewise, Associate Professors make $5,400 less, Assistant Professors make $7,300 less, and Instructors make $2,900 less. Put simply, our salary figures come in below average at all ranks.
The last item in Table 15, which had a less favorable mean score of 3.11, is “time available for keeping current.” Keeping current in one’s field is related to many aspects of the job—most notably teaching and scholarship—which are crucial to faculty and student success. Thus, we should work to advance opportunities for faculty to remain current in order to drive our success in the classroom and in scholarly pursuits. It should also be noted that “work/life balance” dropped slightly from last year’s survey (mean of 3.40), but was still at a mean of 3.34.
Other responses indicated more optimism. Faculty indicated favorably with their “opportunity for advancement” and “benefits.” Both of these measures had modal responses of satisfied and mean scores ranging from 3.59 to 3.52 respectively.
The final factor in Table 15 is the question about satisfaction over “quality of students.” A lukewarm faculty response for the question about “quality of students” may not be easily remedied, but the results at least serve as a reading on how the faculty feels about the individuals on the other end of most campus interactions (i.e., students). As noted below, a fair number of faculty respondents cited the “quality of students” as a potential reason to seek employment elsewhere.

University of South Carolina Palmetto College Campuses
24
Job Security and the Job Market
The final Likert-‐style questions in the survey relate to issues of job security and the job market. Each of these items asked that respondents indicate the “degree to which they agree” with the item. A full breakdown of these three items can be found in Table 16. Perhaps a positive indicator here is the mean score of 2.49 that tells us that the majority of faculty do NOT actively plan to be on the market during the next three years. However, faculty responses may be very broad in this area, as 29 faculty (30.8%) neither agreed nor disagreed, and another 15 (16.0%) percent did not respond.
Table 16 -‐ Frequencies, Means, and Standard Deviations for Survey Items on "the degree to which you agree" with a Series of Job Characteristics Related to Compensation and Retention-‐-‐Rated on a Scale from Strongly Disagree (value of 1) to Strongly Agree (value of 5).. Question Strongly
Disagree Disagree Neither Agree Strongly
Agree Mean Standard
Deviation
Palmetto College job security
6 14 26 22 12 3.25
1.14
comparable salary
14 24 30 9 2 2.51
1.00
seek a different full-‐time job
20 17 29 7 5 2.49
1.16
One item included in Table 16 indicates room for improvement. On the question asking respondents whether their salary is comparable to peers in their discipline, the results mirrored the results of the “my salary” question included in Table 15.
Another item in Table 16 asked respondents about whether “Palmetto College will provide added job security.” The question here provides a reading on the perception that Palmetto College improves faculty welfare via added job security. Since it is a mission of Palmetto College to strengthen the campuses in the “regional” system, it is a question worth asking – do faculty “buy-‐in” to Palmetto College? The mean score of 3.25 on this item indicates that faculty buy-‐in is better than last year, but it should be noted that Palmetto College (as it exists today) was barely a year old. The modal group responded neither agree, nor disagree (32 percent of responses), so opinions of job security in Palmetto College may still be too early to tell. It is important to see improvement here, and hopefully it will be a trend that continues to grow in a positive direction.
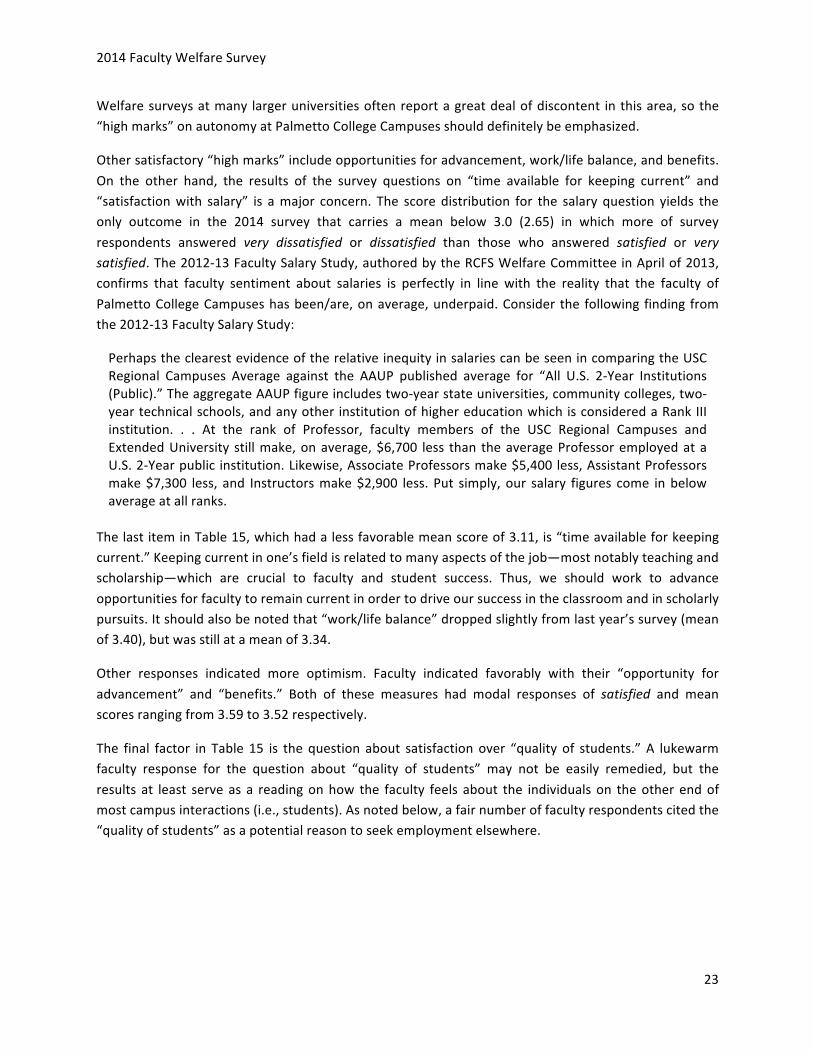
The final two quantitative questions on the survey asked respondents to identify the reason(s) they would seek another full-‐time job. The first item asked: “If you were to seek a different full-‐time job in the next three years, which of the following factors would serve as motivator for seeking a different full-‐time job?” Table 17 includes a visual for the number and types of responses provided—respondents were instructed to “select all that apply,” thus there are more responses than there are respondents.
2014 Faculty Welfare Survey
25
This question does not assume that respondents are actually interested in leaving—it simply asks “if you were to seek.”
Table 17 -‐ Motivating Factors for Seeking a Different Full-‐time Job
Answer Response % Increase in salary 55 77%
Improved job security 30 42%
Geographic location 26 37%
Opportunities for advancement 30 42%
Different students 20 28% Other (explain) 12 17%
As a follow-‐up question, respondents were asked to rank order their selected reasons for hypothetically leaving. Table 18 confirms that salary is the top motivating factor for seeking a different job. It stands head-‐and-‐shoulders above all other available response options, particularly in terms of being ranked first.
Although salary stands out here as the top motivation for seeking a different full-‐time job in these last two survey items, we should reiterate the relationship between “interest in leaving,” salary, and having experienced discrimination and/or workplace bullying. Collectively, these three factors serve as the most resounding issues of potential faculty attrition.
Table 18 -‐ Rank Ordering for Motivating Factors (1 = most important, etc.)
Answer 1 2 3 4-‐6 Total Responses Increase in salary 33 17 5 0 55
Improved job security 13 8 7 2 30
Geographic location 6 9 8 3 26 Opportunities for advancement
11 8 6 5 30
Different students 3 8 4 5 20
Other (explain) 5 6 1 0 12
Total 71 56 31 15 -‐
University of South Carolina Palmetto College Campuses
26
Qualitative Feedback
One final item at the end of the 2014 Faculty Welfare Survey gave respondents the opportunity to provide additional, open-‐ended insights into welfare-‐related matters. Keeping in line with the goal of protecting respondents’ identities, we will not be providing exact quotes in this report. Many of the comments included details that could help identify the authors. Instead, we will offer summative comments about the responses (which delete any identifiable information) in this section in an effort to convey their concerns to the faculty body at-‐large. Note: if you provided a detailed comment that you would like us to share among our faculties, verbatem, please contact the Chair of the Welfare Committee, Ray McManus, at [email protected].
Text Responses
• I do not feel that (my campus) administration has done anything at all to address the serious concerns raised in last year's Faculty Welfare Survey. The silence sends the impression that the administration does not take these issues, such as bullying and discrimination, seriously.
• Make sure someone reads it this time. • I am angry that the workload for Palmetto College faculty exceeds that of the Columbia Campus
faculty and that we are paid less and still expected to achieve publication and research at their level. The Columbia Campus departments also refuse to let us teach classes that we are qualified for and approved to teach. They consider us "less" than they are. I am insulted by their attitude.
• The school puts money above quality most of the time. For example, seeking to teach more online and high school courses without considering if they are taught in a quality way. Too much emphasis on replacing in-‐class courses with online courses. There is no evidence to show that these online courses are better or on a par with in-‐class courses.
• I have a great deal of respect for most of my colleagues and, and generally for the administrators on my campus too. However, more and more of the things we were told about Palmetto College are turning out not to be true. The regional campuses' autonomy has diminished over the past few years, and I don't think we've gotten anything significant in return. The Columbia administration's lack of honesty and basic respect during the recent standardization of the two-‐year curricula still rankles (though admittedly, much of the responsibility for the discord falls to the local campuses too).
• I do have concerns about contact hours. As a science teacher teaching a full load (three lectures plus three labs every semester), I teach 7.5 hours of lecture and 6 hours of lab each week for a total of 13.5 contact hours per week. A non-‐science full load would be 4 classes per semester for a total of 10 contact hours per week (2.5 * 4). I do not understand why my 13.5 hours in the classroom/lab is considered the equivalent of someone else's 10 hours in the classroom. In reality, I teach the equivalent of 5 classes per week not 4. From my perspective, teaching lab is far more difficult than teaching lecture. Moving around the lab and answering the questions of up to 24 students as they are actively completing the lab is a monumental task. I am often
2014 Faculty Welfare Survey
27
physically exhausted after lab just trying to keep up with all of their questions. Teaching lab also includes about 1 hour prior to lab for prepping and about 1 hour after lab for cleaning-‐up. Of course, this always depends on the lab. Then there are lab report/hand-‐ins that are completed and graded every week. And all of this is on top of teaching lecture. At most 4 year campuses, the same person does not teach both the lecture and lab. I don't know what could be done about this but either making salary more commensurate with actual contact hours, reducing the course load to only 2 lecture/labs per week, or hiring extra personnel just to teach labs would be a tremendous help.
• I would like to see our campuses begin to allocate work fairly-‐-‐the same few people are doing the same work over and over again. Give people a chance to choose one major project or committee and focus on that, rather than have so many people overburdened with multiple major projects.
• The question about contact hours and credit hours, related to lab courses, is a very important issue that needs to be addressed across the Palmetto College Campuses (PC Campuses). Tenure-‐track and tenured science faculty across the PC Campus system routinely teach three, 4-‐credit hour courses at least one semester per academic year. On "paper" this equates to 12 credit hours, but the actual teaching load is 18 contact hours (9 contact hours for the lectures plus 9 contact hours for labs). This is the equivalent of teaching six, 3-‐credit hour courses in one semester -‐ a teaching overload by PC Campuses standards. Similarly, teaching a 4-‐credit hour course in a summer session is the equivalent of teaching two, 3-‐credit hour courses. From a summer salary perspective, faculty should be compensated as if they were teaching six credits of coursework. This may not be an important issue on the Columbia campus because there are lab TA's and lab managers that teach, prep, and plan labs. Palmetto College Campus faculty spend just as much time on their lab courses as they do on lecture courses each week. This should be a discussion item to either begin, or revisit, so we can think about strategies for lab assistance or compensation for the teaching overload.
• I have concerns about the survey construction: Many of the questions related to "teaching" don't fit a librarian's job description. Provide options that librarians can also relate to. I object to having to report my age. I don't quite know the difference between sex and gender, when you've already listed sexual orientation separately. Same problem with race and color, and aren't national origin, color, and race interrelated, which could skew the results? Not sure what genetics means, unless you're referring to appearance (such as being overweight, which may or may not be a genetic issue.) Maybe you should include definitions.
• Please make recommendations to the chancellor and campus deans based on the results of this survey.
• I was on a hiring committee who focused on a male candidate; because, he reminded them of themselves when they came here (I was the only woman on the committee besides the Columbia representative). I thought the two women we brought to campus were more than qualified. They were not even considered as a second choice.
• I am VERY disappointed with the administrative leadership of Extended University and Palmetto College
University of South Carolina Palmetto College Campuses
28
• Instructors are a regular part of the university system, but they are commonly viewed as "less than" professors. It would be more helpful if we all worked together as a team, rather than viewing instructors as simply occupying spots that should be filled by PhDs.
• I'm not sure what you mean by the genetics item earlier in the survey. Makes me wonder if you are concerned we have white supremacists lurking on campus. I think you might want to make an individual item for satisfaction with the overall Faculty Organization functioning at each campus rather than an overall leadership. Enjoyed the survey. Keep up the good work!
• Very unequal maximum student numbers allowed in classes from different disciplines at my campus. Disciplines such as Math which involve a great deal of grading often have class sizes exceeding 40 students.
• There are no questions about how we could be/are bullied by the students or the ambiance on campus due to the student population's behavior, yet it is part of our job satisfaction.
• some subjects, such as English, have limits of 12 -‐1 8 students in class, while other subjects like history, math and biology and chemistry have over 40 students in class
• We have an interesting situation here where some of the worst teachers (based on low standards and supported by evaluation and observation) get by with little to no interference, yet the ones who are great teachers have to work with inadequate support and technology. When this issue is raised it is "shot down" by older faculty who see no value in it. As long as we allow inadequate professors who have long since lost their place in their discipline to call the shots thus making it difficult for junior faculty and newly tenure faculty to advance in their disciplines, I am greatly concerned with the future of this campus.
• There needs to be a better structure or publicized one for advancement in both rank and salary for instructors. There also needs to be more investment in instructors at Sumter campus in terms of the length of contract. Instructors are offered a one year contract here, whereas at other regionals they are offered three year contracts. This would solve a lot of the job insecurity and cause the instructors to be even more invested and productive at their jobs.
Note about “Other” Analyses
Some of you may be interested in specific findings that were not discussed in our Final Report for the 2014 Faculty Welfare Survey. If you would like to see any analyses which go beyond the report, such as more campus specific information, or more gender dynamics, please contact the Chair of Welfare at the email address above. As was our position throughout the administration of this survey, we will not release raw data or statistics on small, identifiable groups as we work to maintain the anonymity of survey respondents. If you have additional comments about the survey itself, our analyses, or this final report, please contact the Chair as well. On behalf of the Palmetto College Campuses Faculty Welfare Committee, we’re happy to serve your needs and advocate on your behalf.
2014 Faculty Welfare Survey
29
Appendix—Survey Items
Faculty Welfare Survey 2014 Calendar Year
1 2014 Faculty Welfare Survey University of South Carolina Palmetto College Campuses Faculty Senate This survey will take 10-‐12 minutes to complete. In an effort to better serve the faculty of Palmetto College, the Welfare Committee of the Palmetto College Campuses Faculty Senate would like to invite you to take this brief, 10-‐12 minute survey. As faculty, we will use the results of this survey to analyze and investigate the state of faculty welfare in the Palmetto College Campuses. The survey concentrates on five (5) areas: 1) demographics, 2) academic community and collegiality, 3) faculty workload and support, 4) compensation and retention, and 5) an area for open feedback. These items have been selected to help illuminate faculty needs, address issues, and ensure fairness. This survey is not being conducted for any research purposes that will result in scholarly publication. A summary of the entire survey will be presented at the final meeting of the academic year for the Palmetto College Campuses Faculty Senate, and a copy of the final report will be disseminated soon thereafter to faculty members of Palmetto College. Individual responses are anonymous. To ensure anonymity of respondents, responses that result in small categories will be grouped together for analysis (i.e., no findings will be shared on data related to small, identifiable groups). To ensure the security of the survey, survey responses are kept on either password protected servers or computers, and only Dr. Ray McManus, the Welfare Committee Chair, and Dr. Samuel D. Downs, the survey administrator, will have access to the entire raw data set. The Welfare Committee of the Palmetto College Campuses Faculty Senate is committed to ensuring that this survey is a safe way to provide feedback on your welfare. Please feel free to answer honestly and confidently. For all questions, please consider only the 2014 calendar year. We sincerely thank you for taking the time to complete this important survey.
2 Campus Unit
m Extended University (1) m Lancaster (2) m Salkehatchie (3) m Sumter (4) m Union (5)
University of South Carolina Palmetto College Campuses
30
3 Number of years employed as a full-‐time faculty member at your campus unit.
m 0 -‐ 5 years (1) m 6 -‐ 10 years (2) m 11 -‐ 15 years (3) m 16-‐20 years (4) m 21+ years (6)
4 Current academic unit / Discipline area
m Behavioral and Social Sciences (1) m Business and Education (2) m Humanities (3) m Library (4) m Math and Science (5) m Nursing and Public Health (6)
5 Rank
m Administrator (with faculty rank) (1) m Instructor (2) m Assistant Professor (3) m Associate Professor (4) m Full Professor (5)
6 Age
7 Gender
m Man (1) m Woman (2) m Transgender (3) m Gender Fluid (4)
8 Ethnicity
m Hispanic (1) m Non-‐Hispanic (2)

2014 Faculty Welfare Survey
31
9 Race (choose all that apply)
q Asian or Asian American (1) q Black or African American (2) q Native American (3) q Native Hawaiian or Other Pacific Islander (4) q White (5)
10 Sexual Orientation
m Gay/Lesbian (1) m Heterosexual (2) m Bisexual (3) m Pansexual or Fluid (4)
University of South Carolina Palmetto College Campuses
32
11 For all questions, please consider only the 2014 calendar year. Please indicate the degree to which you agree with the following statements:
Strongly Disagree (1)
Disagree (2) Neither Agree nor Disagree (3)
Agree (4) Strongly Agree (5)
Among the colleagues on my campus, there exists a strong
level of collegiality. (1)
m m m m m
I can comfortably voice my opinion
on campus matters without
fear of retribution. (2)
m m m m m
My input is valued on matters of
faculty welfare and faculty
governance. (3)
m m m m m
I have had constructive
interactions with the USC Columbia
department that corresponds with my discipline. (4)
m m m m m
I have constructive
interactions with my coworkers.
(12)
m m m m m
I have constructive
interactions with my division chair. Note: Do not reply if you are from Union. (13)
m m m m m
I have constructive
interactions with my academic dean. (14)
m m m m m
I have m m m m m
2014 Faculty Welfare Survey
33
constructive interactions with my dean. (15)
My teaching accomplishments are recognized and valued. (9)
m m m m m
My scholarly achievements are recognized and valued. (10)
m m m m m
My service contributions are recognized and valued. (11)
m m m m m
In my opinion, diversity is
important to the mission of Higher Education. (5)
m m m m m

University of South Carolina Palmetto College Campuses
34
Q40 For only the 2014 calendar year, please indicate the degree to which you agree that your campus values diversity in terms of:
Strongly Disagree (1)
Disagree (2) Neither Agree nor Disagree (3)
Agree (4) Strongly Agree (5)
race (6) m m m m m
gender (7) m m m m m
sexual orientation (8) m m m m m
age (16) m m m m m
color (17) m m m m m
sex (18) m m m m m
religion (19) m m m m m
national origin (20) m m m m m
genetics (21) m m m m m
veteran's status (22)
m m m m m
disability status (23) m m m m m
Q31 In the 2014 calendar year, I have personally faced discrimination on the basis of any of the following personal characteristics: age, race, color, sex, gender, religion, national origin, genetics, veterans' status, disability status, and/or sexual orientation. Note: More specific questions will follow if you select Yes.
m Yes (11) m No (12) If No Is Selected, Then Skip To I have witnessed discrimination on th...

2014 Faculty Welfare Survey
35
Q34 Please identify any personal characteristics for which you personally faced discrimination. Select all that apply.
q age (1) q race (2) q color (3) q sex (4) q gender (5) q religion (6) q national origin (7) q genetics (8) q veterans' status (9) q disability status (10) q sexual orientation (11)
Q35 Optional: If you wish to elaborate on any ways in which you have personally faced discrimination, please do so here.

University of South Carolina Palmetto College Campuses
36
Q32 In the 2014 calendar year, I have witnessed discrimination on the basis of any of the following personal characteristics: age, race, color, sex, gender, religion, national origin, genetics, veterans' status, disability status, and/or sexual orientation. Note: More specific questions will follow if you select Yes.
m Yes (9) m No (10) If No Is Selected, Then Skip To I have been a victim of workplace bul...If Yes Is Selected, Then Skip To Please identify any personal characte...
Q36 Please identify any personal characteristics for which you witnessed discrimination. Select all that apply.
q age (1) q race (2) q color (3) q sex (4) q gender (5) q religion (6) q national origin (7) q genetics (8) q veterans' status (9) q disability status (10) q sexual orientation (11)
Q37 Optional: If you wish to elaborate on any ways in which you have witnessed discrimination, please do so here.
2014 Faculty Welfare Survey
37
15 In the 2014 calendar year, I have been a victim of workplace bullying. **Note: The University of South Carolina defines workplace bullying as: repeated, unwelcome severe and pervasive behavior that intentionally threatens, intimidates, humiliates or isolates the targeted individual(s), or undermines their reputation or job performance. It may take, but is not limited to, one or more of the following forms: verbal abuse, malicious criticism or gossip, unwarranted monitoring, unwarranted physical contact, exclusion or isolation in the workplace, work interference or sabotage, cyberbullying, or other offensive conduct/behaviors (including nonverbal) which are threatening, humiliating, harassing or intimidating. For a copy of the University policy on workplace bullying, visit: http://www.sc.edu/policies/acaf180.pdf
q Yes (1) q No (2) q Optional: If you wish, you may elaborate here. (3) ____________________
Q38 In the 2014 calendar year, I have witnessed workplace bullying. **Note: The University of South Carolina defines workplace bullying as: repeated, unwelcome severe and pervasive behavior that intentionally threatens, intimidates, humiliates or isolates the targeted individual(s), or undermines their reputation or job performance. It may take, but is not limited to, one or more of the following forms: verbal abuse, malicious criticism or gossip, unwarranted monitoring, unwarranted physical contact, exclusion or isolation in the workplace, work interference or sabotage, cyberbullying, or other offensive conduct/behaviors (including nonverbal) which are threatening, humiliating, harassing or intimidating. For a copy of the University policy on workplace bullying, visit: http://www.sc.edu/policies/acaf180.pdf
q Yes (1) q No (2) q Optional: If you wish, you may elaborate here. (3) ____________________
University of South Carolina Palmetto College Campuses
38
16 How many courses did you teach during the Spring and Fall of 2014? Note: do not count labs in this item—there is a separate question for labs
m 0 (1) m 1 (2) m 2 (3) m 3 (4) m 4 (5) m 5 (6) m 6 (7) m 7 (8) m 8 (9) m 9 (10) m 10 (11) m 11 (12) m 12 (13) m 13 (14) m 14 (15) m 15 (21) m 16+ (22)
17 How many labs did you teach during the Spring and Fall of 2014?
m 0 (1) m 1 (2) m 2 (3) m 3 (4) m 4 (5) m 5 (6) m 6 (7) m 7 (8) m 8 (9) m 9 (10) m 10 (11) m 11 (12) m 12 (13) m 13 (14) m 14 (15) m 15 (16) m 16+ (17)
2014 Faculty Welfare Survey
39
18 During the 2014 calendar year, did any of your course offerings have required weekly in-‐class “contact hours” that exceeded the number of credit hours awarded to the course (e.g., did you teach a lab that met for three hours/week, but is only awarded one credit-‐hour)?
q Yes (1) q No (2) q If there are any discipline specific issue we need to know about, please use this space to tell us. (3)
____________________
19 During the Spring and Fall of 2014, how many of your courses were taught via two-‐way video?
m 0 (1) m 1 (2) m 2 (3) m 3 (4) m 4 (5) m 5 (6) m 6 (7) m 7 (8) m 8 (9) m 9 (10) m 10 (11) m 11+ (12)
20 During the Spring and Fall of 2014, how many of your courses were taught via online (i.e., Blackboard) courses?
m 0 (1) m 1 (2) m 2 (3) m 3 (4) m 4 (5) m 5 (6) m 6 (7) m 7 (8) m 8 (9) m 9 (10) m 10 (11) m 11+ (12)
University of South Carolina Palmetto College Campuses
40
21 For the 2014 calendar year, please designate the percentage of your average weekly work hours spent on each of the following areas by clicking on the appropriate percentage for each area.Note: your values for all categories should not exceed 100%. For example, if no one comes to office hours and you work on scholarship during this time, this activity only counts toward one area. You may select which area.
______ Teaching (includes in-‐class teaching, course prep, office hours, and the like) (1) ______ Scholarship (includes work on publications, professional development, etc.) (2) ______ Service (includes campus and community service, advising, etc.) (3)
22 If you could establish the ideal work schedule, what percentage of your time would you prefer to spend in each of the following areas? (Again, be sure that your values do not exceed 100%)
______ Teaching (includes in-‐class teaching, course prep, office hours, and the like) (1) ______ Scholarship (includes work on publications, professional development, etc.) (2) ______ Service (includes campus and community service, advising, etc.) (3)
2014 Faculty Welfare Survey
41
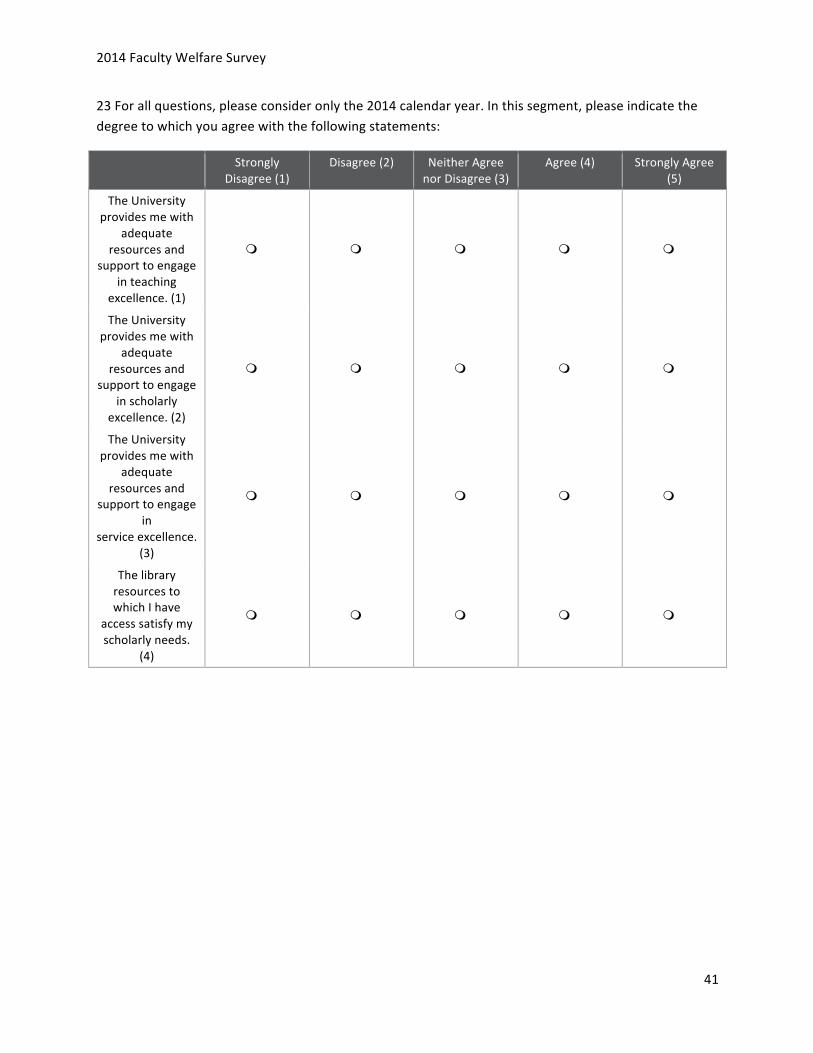
23 For all questions, please consider only the 2014 calendar year. In this segment, please indicate the degree to which you agree with the following statements:
Strongly Disagree (1)
Disagree (2) Neither Agree nor Disagree (3)
Agree (4) Strongly Agree (5)
The University provides me with
adequate resources and
support to engage in teaching
excellence. (1)
m m m m m
The University provides me with
adequate resources and
support to engage in scholarly
excellence. (2)
m m m m m
The University provides me with
adequate resources and
support to engage in
service excellence. (3)
m m m m m
The library resources to which I have
access satisfy my scholarly needs.
(4)
m m m m m
University of South Carolina Palmetto College Campuses
42
24 For all questions, please consider only the 2014 calendar year. In this segment, please indicate the degree to which you are satisfied with the following aspects of your job at this institution:
Very Dissatisfied (1)
Dissatisfied (2) Neither Satisfied nor Dissatisfied
(3)
Satisfied (4) Very Satisfied (5)
The authority I have to make decisions about course offerings, scheduling, and course materials
(1)
m m m m m
The quality of students whom I have taught here (2)
m m m m m
The opportunity for
advancement in rank at this institution (3)
m m m m m
Time available for keeping current in my
field (4)
m m m m m
The work/life balance
provided by my current position
(5)
m m m m m
My salary (6) m m m m m
My benefits package (7)
m m m m m
My co-‐workers (8) m m m m m
The nature of my work (9) m m m m m
The supervision over me (10)
m m m m m
2014 Faculty Welfare Survey
43
25 For all questions, please consider only the 2014 calendar year. In this segment, please indicate the degree to which you agree with the following statements:
Strongly Disagree (1)
Disagree (2) Neither Agree nor Disagree (3)
Agree (4) Strongly Agree (5)
The Palmetto College will
provide added job security over the previous form and
function of the Regional
Campuses and Extended
University. (1)
m m m m m
My salary is comparable to
faculty members in my discipline at our
“peer” institutions (that
is, Rank III, predominantly 2-‐year schools).
(2)
m m m m m
During the next three years, I will seek a
different full-‐time job (at
either another post-‐secondary institution or in a non-‐academic setting)? (3)
m m m m m
University of South Carolina Palmetto College Campuses
44
26 If you were to seek a different full-‐time job in the next three years, which of the following factors would serve as motivation for seeking a different full-‐time job?Please select all factors that apply.
q Increase in salary (1) q Improved job security (2) q Geographic location (3) q Opportunities for advancement (4) q Different students (5) q Other (explain) (6) ____________________
27 Please rank order the factors you selected as hypothetical reasons for seeking a different job by dragging each factor to its appropriate place.
28 If you have any other issues or concerns about faculty welfare and/or job satisfaction that you wish to share with the Welfare Committee, please use this space.
29 Thank you for taking the time to complete the 2014 Faculty Welfare Survey. We, the Welfare Committee of the Palmetto College Campuses Faculty Senate, are dedicated to the well-‐being of all faculty members, and we welcome the opportunity to serve your needs. If you wish to provide any feedback on the survey items, or the survey instrument itself, please contact the Chair of the Welfare Committee, Dr. Ray McManus, at [email protected] or Dr. Samuel D. Downs, at [email protected].