Embed Size (px)
Citation preview

QReport for the
SIX MONTHSended 30 June 2018Lundin Petroleum AB (publ)company registration number 556610-8055
2

Highlights
2
• Record high quarterly EBITDA and operating cash flow. • Production above guidance. Full year guidance increased to 78–82 Mboepd from previous guidance of 74–82 Mboepd. • Operating cost of USD 3.30 per barrel for the first six months 2018. Full year guidance reduced to below USD 4 per barrel. • Dividend of SEK 4 per share distributed on 11 May 2018. • Improved borrowing terms re-negotiated for reserve-based lending facility, resulting in a net accounting gain of MUSD 166.4. • Phase 1 of the Johan Sverdrup project about 75 percent completed. Two platforms successfully installed on the field. • Development drilling programme on Edvard Grieg completed under budget and on schedule.
Financial summary
1 Jan 2018- 30 Jun 2018
6 months
1 Apr 2018- 30 Jun 2018
3 months
1 Jan 2017- 30 Jun 2017
6 months
1 Apr 2017- 30 Jun 2017
3 months
1 Jan 2017- 31 Dec 2017
12 months
Production in Mboepd 82.1 81.2 86.1 89.5 86.1
Revenue and other income in MUSD 1,370.0 677.1 886.1 464.6 1,997.0
EBITDA in MUSD 964.2 507.7 689.3 333.5 1,501.5
Operating cash flow in MUSD 967.6 505.8 705.9 340.0 1,530.0
Net result in MUSD 264.8 36.0 204.8 145.6 380.9
Earnings/share in USD1 0.78 0.10 0.61 0.43 1.13
Earnings/share fully diluted in USD1 0.78 0.11 0.61 0.43 1.13
Net debt 3,798.5 3,798.5 4,080.8 4,080.8 3,883.6 The numbers included in the table above for 2017 are based on continuing operations. 1 Based on net result attributable to shareholders of the Parent Company.
Comment from Alex Schneiter, President and CEO of Lundin Petroleum: I am pleased to report another quarter with strong EBITDA and operating cash flow for Lundin Petroleum, driven by production above guidance, continued low operating cost and higher oil prices. This strong performance has led us to increase our production guidance for the full year to between 78 and 82 Mboepd and reduce the operating cost guidance to below USD 4 per barrel. During the second quarter, we also re-negotiated improved borrowing terms for our reserve-based lending facility, which has resulted in the reduction of the current interest rate margin over LIBOR from 3.15 percent to 2.25 percent. This re-negotiation demonstrates our lenders confidence in our ability to continue to successfully fund the future growth of the Company. Our key operated asset Edvard Grieg continues to outperform on all fronts. We recently announced the completion of the PDO development drilling programme, achieved under budget and on schedule. With the significant resource upside and tie-back opportunities that are being identified in the area, I believe there is potential to double the total resources produced through the Edvard Grieg facilities, relative to the current best estimate gross ultimate recovery for the field, allowing us to keep the facilities full for many years to come. In addition, we await the appraisal results of the nearby Rolvsnes discovery, expected in August, which could be another tie-back development to Edvard Grieg in addition to Luno II. The offshore installation programme for Johan Sverdrup has progressed well over the summer. Phase 1 is now about 75 percent complete with still just over a year to go until first oil. The drilling platform, installed last month, is among the largest modules to have ever been installed in one go, taking only two days from sail away to installation. This is a great achievement not only for the Johan Sverdrup project but for the industry as a whole. The remaining two steel jackets are scheduled for installation in August and the PDO for Phase 2 will be submitted before September. We remain as focused as ever on pursuing organic growth opportunities in our core areas and have had a good start to 2018 with three successful wells on Luno II, Frosk and Lille Prinsen. I look forward to the active drilling programme that is planned for the remainder of the year, updated to include two follow-up exploration wells to the Frosk oil discovery. Furthermore, the extended production test on the Alta discovery in the southern Barents Sea has started and initial results look promising. A successful outcome of this extended test, lasting for two months, will take us one step closer to a field development in this region.
Lundin Petroleum is one of Europe’s leading independent oil and gas exploration and production companies with operations focused on Norway and listed on NASDAQ Stockholm (ticker "LUPE"). Read more about Lundin Petroleum’s business and operations
at www.lundin-petroleum.com
For definitions and abbreviations, see page 30.

3
OPERATIONAL REVIEW All the reported numbers and updates in the operational review relate to the six month period ending 30 June 2018 (reporting period) unless otherwise specified. Norway Production Production was 82.1 thousand barrels of oil equivalent per day (Mboepd) (compared to 86.1 Mboepd for the same period in 2017) which was 4 percent above the mid-point of the production guidance for the reporting period. This result is due to strong facilities and reservoir performance at both the Edvard Grieg field and the Alvheim area. Based on this performance, Lundin Petroleum is increasing its full year production guidance to between 78 and 82 Mboepd from the previous guidance of between 74 and 82 Mboepd. Operating cost, including netting off tariff income, was USD 3.30 per barrel and 19 percent below the guidance for the reporting period. This was due to increased production volumes and a reversal of an accrual as a result of the termination of the Brynhild production. As a result, Lundin Petroleum is reducing its operating cost guidance for the full year to less than USD 4 per barrel from the previous guidance of USD 4.15 per barrel.
Production in Mboepd
WI1
1 Jan 2018- 30 Jun 2018
6 months
1 Apr 2018- 30 Jun 2018
3 months
1 Jan 2017- 30 Jun 2017
6 months
1 Apr 2017- 30 Jun 2017
3 months
1 Jan 2017- 31 Dec 2017
12 months
Edvard Grieg 65% 63.7 63.4 67.3 71.0 66.7
Ivar Aasen 1.385% 0.9 0.9 0.6 0.6 0.7
Alvheim 15% 9.1 9.2 14.5 14.3 12.4
Volund 35% 7.5 6.8 0.1 – 3.9
Bøyla 15% 0.9 0.7 1.2 1.2 1.1
Brynhild 51%2 0.0 – 2.2 2.2 1.2
Gaupe 40% 0.1 0.1 0.2 0.2 0.2
82.1 81.2 86.1 89.5 86.1 1 Lundin Petroleum’s working interest (WI).
2 WI 90% up to 30 November 2017.
Production from the Edvard Grieg field was higher than forecast due to strong production efficiency of 97 percent which was above guidance. During the reporting period, the final three PDO production wells have been successfully drilled with results in line or better than prognosis. The PDO development drilling programme has been completed under budget by the Rowan Viking jack-up rig which has now demobilized. The production capacity from the ten completed production wells is currently more than double the facilities capacity contractually available for Edvard Grieg production. Reservoir performance continues to exceed expectations with no material water production to date. A 4D seismic survey will be acquired over the field during the third quarter 2018 in order to support an infill drilling programme that is being planned for 2020. Operating cost for the Edvard Grieg field, including netting off tariff income, was USD 3.59 per barrel. Production from the Ivar Aasen field was in line with forecast. During the second quarter 2018, two new water injection wells were successfully drilled to improve pressure support to the eastern area of the field. Production from the Alvheim area, consisting of the Alvheim, Volund and the Bøyla fields, was ahead of forecast due to better than expected reservoir performance and continued strong production efficiency for the Alvheim FPSO of 97 percent. The two infill wells drilled during 2017 in the Boa area of the Alvheim field started production in the first quarter 2018 and are producing ahead of expectations. An infill well targeting the Kameleon area of the Alvheim field is currently being drilled and a planned sidetrack of an existing Volund well has been moved to 2019. Operating cost for the Alvheim area was USD 4.77 per barrel. Production from the Brynhild field was limited and below forecast. A solution to the water capacity constraints and uptime issues at the Haewene Brim FPSO has not been found and it is therefore no longer economical to produce the Brynhild field. The Brynhild partners have decided to permanently cease production from the field and work on a cessation plan has started, which will be submitted in due course to the Ministry of Petroleum and Energy for approval. The remaining book value for the field was written off at year end 2017. Despite no remaining reserves being attributed to the Gaupe field, the field is producing intermittently subject to favourable economic conditions.
Production in Mboepd
1 Jan 2018- 30 Jun 2018
6 months
1 Apr 2018- 30 Jun 2018
3 months
1 Jan 2017- 30 Jun 2017
6 months
1 Apr 2017- 30 Jun 2017
3 months
1 Jan 2017- 31 Dec 2017
12 months
Norway
Crude oil
72.6
71.6
77.7
80.8
77.6
Gas 9.5 9.6 8.4 8.7 8.5
Total production 82.1 81.2 86.1 89.5 86.1

4
Development
Field WI Operator PDO Approval Estimated gross reserves
Production start expected
Expected gross plateau production
Johan Sverdrup
22.6% Equinor August 2015 2.1 – 3.1 Bn boe Late 2019 660 Mbopd
Johan Sverdrup Phase 1 of the Johan Sverdrup project is on schedule with approximately 75 percent completed and remains firmly on track for first oil in late 2019. 2018 is a key installation year for Phase 1 of the project. In April 2018, both the steel jacket for the drilling platform and the riser platform topsides were successfully installed offshore. In June 2018, the drilling platform topsides was successfully installed offshore by the Allseas Pioneering Spirit heavy lift vessel, the bridge linking the two installed topsides was lifted into place and the power from shore cable was also installed. Two accommodation units have been mobilised offshore and approximately 800 personnel are working on the hook-up of the installed facilities. Installation of the oil export pipeline is ongoing and will be followed by installation of the gas export pipeline. Construction of the remaining two steel jackets is underway at the Kvaerner Verdal yard in Norway and at the Dragados yard in Spain and are both scheduled to be installed in August 2018. Construction of the topsides for the process platform is ongoing at Samsung Heavy Industries in Korea and for the living quarters platform at the Kvaerner Stord yard in Norway. Both these topsides are scheduled for installation in Spring 2019. Eight production wells and ten water injection wells have been completed to date with results in line or better than expected. Pre-drilling activities have been completed significantly ahead of schedule and to utilise the remaining contracted rig time two additional water injection wells have been added to the programme to be drilled in the second half of 2018 with the rest of the time being sublet. The drilling platform is scheduled to commence tie-back of the eight pre-drilled production wells during the fourth quarter of 2018. At the time of submitting the Phase 1 PDO in 2015, the capital expenditure for Phase 1 was estimated at gross NOK 123 billion (nominal). Due to improvements in project execution and delivery, the latest cost estimate for Phase 1 is NOK 88 billion (nominal), which represents a saving of approximately 30 percent, excluding additional foreign exchange rate savings in US dollar terms. The gross production capacity for Phase 1 is estimated to 440 Mbopd. Phase 2 will involve the installation of an additional processing platform bridge linked to the Phase 1 field centre and additional subsea facilities to allow the tie-in of additional wells to access the Avaldsnes, Kvitsøy and Geitungen satellite areas of the field. 28 new wells are planned to be drilled in connection with the Phase 2 development. These additional facilities will take the full field gross plateau production level to 660 Mbopd. The cost for Phase 2 is estimated below NOK 45 billion (nominal), which represents approximately a 50 percent reduction compared to the original estimate in the PDO for Phase 1, due to a combination of market conditions and optimisation of the Phase 2 facilities. Front End Engineering Design (FEED) has been completed. The PDO for Phase 2 will be submitted before September 2018 and production is scheduled to start in 2022. To secure synergies with Phase 1, pre-commitment has been made to long lead equipment items for Phase 2. In addition, letters of intent have been awarded to Aibel for an engineering, procurement and construction (EPC) contract for the Phase 2 process platform topsides and to a joint venture of Aker Solutions and Kvaerner for an EPC contract for modifications to the Phase 1 field centre to accommodate Phase 2. Full field breakeven oil price is estimated at below 20 USD per barrel.
Appraisal
2018 appraisal well programme
Licence Operator WI Well Spud Date Status PL359 Lundin Norway 50% Luno II February 2018 Completed March 2018
PL338C Lundin Norway 50% Rolvsnes April 2018 Ongoing
PL609 Lundin Norway 40% Alta April 2018 Ongoing
PL203 Aker BP 15% Gekko Fourth quarter 2018 The Luno II appraisal well was successfully completed in March 2018 and encountered a gross oil column of 22 metres in Triassic sandstones with very good reservoir quality, which was significantly better than expected. Following the positive well results, the gross resource range for the Luno II discovery has been increased to between 40 and 100 MMboe and development studies will now be progressed with the objective of submitting a PDO in early 2019. The development concept for Luno II is a subsea tie-back to the nearby Edvard Grieg platform. In April 2018, appraisal drilling commenced on the Rolvsnes oil discovery in PL338C in the Utsira High area in the North Sea. The main objective is to confirm commercial rates from a horizontal appraisal well drilled in fractured and weathered basement reservoirs, with results from the well expected in August 2018. The well is being drilled by the COSL Innovator rig which will go off contract on completion of the operations. Rolvsnes is also considered a potential tie-back development to Edvard Grieg. Drilling of the horizontal well for extended well testing has been completed on the Alta discovery in the southern Barents Sea. The objective of the extended well test is to prove sustainable production rates and reduce the uncertainty around the recovery

5
mechanism in the karstified and fractured carbonate reservoirs. The well results indicate better reservoir quality than prognosed and the two month production test is ongoing. The test is being conducted by the Leiv Eiriksson rig, for which a flexible contract with multiple option slots is in place, and production volumes are being flowed through a flexible flowline to the Teekay Scott Spirit tanker. A successful outcome will provide important information to progress further appraisal drilling and field development studies. Exploration
2018 exploration well programme
Licence Operator WI Well Spud Date Result PL340 Aker BP 15% Frosk January 2018 Oil discovery
PL167 Equinor 20% Lille Prinsen April 2018 Oil discovery
PL659 Aker BP 20% Svanefjell May 2018 Minor gas discovery
PL830 Lundin Norway 40% Silfari Third quarter 2018
PL825 Faroe Petroleum 20% Rungne Third quarter 2018
PL860 MOL 40% Driva/Oppdal Third quarter 2018
PL857 Equinor 20% Gjøkåsen Shallow Fourth quarter 2018
PL857 Equinor 20% Gjøkåsen Deep Fourth quarter 2018
PL869 Aker BP 20% Froskelår Fourth quarter 2018
PL869 Aker BP 20% Rumpetroll Fourth quarter 2018
PL916 Aker BP 20% JK Fourth quarter 2018 The 2018 exploration drilling programme has been further updated to reflect changing rig schedules and priorities. The updated schedule consists of 11 wells targeting net unrisked resources of approximately 600 MMboe. Drilling of the Korpfjell Deep prospect has been moved to 2019 due to later availability of the rig and two follow-up wells in PL869, in the same area as the Frosk oil discovery, have been added to the programme. The updated appraisal and exploration expenditure guidance for 2018 is being maintained at MUSD 300. In February 2018, the Frosk prospect in the North Sea, located northwest of the Bøyla field, proved an oil discovery. The discovery is estimated to contain gross resources of between 30 and 60 MMboe, which is significantly more than the pre-drill estimates and has a positive impact on the assessment of further exploration potential in the area. Two follow-up wells on the Froskelår and Rumpetroll prospects in the adjacent PL869 are now planned in the fourth quarter 2018. Additionally, a production test well on the Frosk discovery, to be tied into the Bøyla subsea facilities, is being planned for 2019. In May 2018, the Svanefjell prospect in PL659 in the southern Barents Sea proved a minor non-commercial gas discovery. In June 2018, the Lille Prinsen prospect in the North Sea, located northeast of the Ivar Aasen field, proved an oil discovery. The discovery is estimated to contain gross resources of between 15 and 35 MMboe and with significant appraisal upside potential of over 100 MMboe. It is expected that Lille Prinsen will be economic to develop and appraisal drilling is being planned for 2019. Licence awards and transactions In January 2018, Lundin Petroleum was awarded 14 licences in the 2017 APA licensing round, of which six as operator. In June 2018, Lundin Petroleum was awarded three licences in the 24th licensing round, of which one as operator. Lundin Petroleum acquired a 10 percent working interest in each of PL539 and PL860 and a 30 percent working interest in each of PL820S and PL825 from Fortis Petroleum and also acquired a 20 percent working interest in PL860 from Equinor, increasing Lundin Petroleum’s working interest in PL860 to 40 percent and in PL539 to 20 percent. Lundin Petroleum has concluded a licence swap with DNO to create an initial entry position in the Tampen/Horda Platform area of the Norwegian North Sea. Lundin Petroleum will receive a 10 percent working interest in each of PL926 and PL929 and 15 percent in each of PL921 and PL924 in exchange for DNO receiving 10 percent working interest in each of PL825, PL767, PL902 and PL950. Additionally, Lundin Petroleum has concluded a licence swap with Edison in the southern Barents Sea where Lundin Petroleum will receive a 10 percent working interest in PL850 in exchange for Edison receiving a 10 percent working interest in PL952. The transaction is pending partner approval. Russia Lundin Petroleum has previously written down the entire contingent resources and book value for the Morskaya oil discovery and options for the asset are being reviewed. Health, Safety and Environment During the reporting period, one lost time incident and one medical treatment incident occurred, resulting in a Lost Time Incident Rate of 0.9 per million hours worked and a Total Recordable Incident Rate of 1.8 per million hours worked. There were no material safety or environmental incidents.

6
FINANCIAL REVIEW Result The operating profit from continuing operations for the reporting period amounted to MUSD 724.2 (MUSD 373.8). The increase compared to the comparative period was mainly driven by higher oil prices in combination with lower cost of sales. The net result from continuing operations for the reporting period amounted to MUSD 264.8 (MUSD 204.8) and included a foreign currency exchange gain of MUSD 9.6 (MUSD 139.2). The net result from continuing operations excluding foreign currency exchange results amounted to MUSD 255.2 (MUSD 65.6). The increase compared to the comparative period was mainly driven by higher oil prices, lower cost of sales and a post-tax accounting gain of MUSD 98.1 as a result of the re-negotiated improved borrowing terms for the reserve-based lending facility. The net result from continuing operations attributable to shareholders of the Parent Company for the reporting period amounted to MUSD 264.8 (MUSD 207.3) representing earnings per share of USD 0.78 (USD 0.61). Earnings before interest, tax, depletion and amortisation (EBITDA) from continuing operations for the reporting period amounted to MUSD 964.2 (MUSD 689.3) representing EBITDA per share of USD 2.85 (USD 2.03). Operating cash flow for the reporting period amounted to MUSD 967.6 (MUSD 705.9) representing operating cash flow per share of USD 2.86 (USD 2.07). Changes in the Group On 24 April 2017, Lundin Petroleum completed the spin-off of its assets in Malaysia, France and the Netherlands (the IPC assets) into International Petroleum Corporation (IPC) by distributing the IPC shares, on a pro-rata basis, to Lundin Petroleum shareholders. The results of the IPC business are included in the Lundin Petroleum financial statements until the completion of the spin-off and are shown as discontinued operations in the comparative periods. Revenue and other income Revenue and other income for the reporting period amounted to MUSD 1,370.0 (MUSD 886.1) and was comprised of net sales of oil and gas, change in under/over lift position and other revenue as detailed in Note 1. Net sales of oil and gas for the reporting period amounted to MUSD 1,366.7 (MUSD 881.0). The average price achieved by Lundin Petroleum for a barrel of oil equivalent from own production amounted to USD 68.04 (USD 48.67) and is detailed in the following table. The average Dated Brent price for the reporting period amounted to USD 70.58 (USD 51.80) per barrel. Net sales of oil and gas from own production for the reporting period are detailed in Note 3 and were comprised as follows:
Sales from own production Average price per boe expressed in USD
1 Jan 2018- 30 Jun 2018
6 months
1 Apr 2018- 30 Jun 2018
3 months
1 Jan 2017- 30 Jun 2017
6 months
1 Apr 2017- 30 Jun 2017
3 months
1 Jan 2017- 31 Dec 2017
12 months
Crude oil sales
– Quantity in Mboe 13,715.8 6,757.7 14,174.5 7,907.7 28,106.9
– Average price per bbl
Gas and NGL sales
70.08 74.04 50.29 48.43 53.37
– Quantity in Mboe 1,571.7 788.8 1,808.3 994.7 3,943.1
– Average price per bbl 50.28 49.55 35.98 33.01 39.23
Total sales
– Quantity in Mboe
15,287.5
7,546.5
15,982.8
8,902.4
32,050.0
– Average price per bbl 68.04 71.48 48.67 46.70 51.63
The table above excludes crude oil revenue from third party activities.
Net sales of crude oil from third party activities for the reporting period amounted to MUSD 326.5 (MUSD 103.1) and consisted of Grane Blend crude oil purchased from outside the Group by Lundin Petroleum Marketing SA and sold to the market. Sales of oil and gas are recognised when the risk of ownership is transferred to the purchaser. Sales quantities in a period can differ from production quantities as a result of permanent and timing differences. Timing differences can arise due to under/over lift of entitlement, inventory, storage and pipeline balances effects. The change in under/over lift position amounted to a cost of MUSD 13.9 (MUSD 5.1) in the reporting period due to the timing of the cargo liftings compared to production.
Other income for the reporting period amounted to MUSD 17.2 (MUSD 10.2) and included a quality differential compensation on Alvheim blended crude and tariff income of MUSD 15.4 (MUSD 9.0) which is due to net income from Ivar Aasen tariffs paid to Edvard Grieg.

7
Production costs Production costs including inventory movements for the reporting period amounted to MUSD 68.9 (MUSD 78.0) and are detailed in Note 2. The total production cost per barrel of oil equivalent produced is detailed in the table below:
Production costs
1 Jan 2018- 30 Jun 2018
6 months
1 Apr 2018- 30 Jun 2018
3 months
1 Jan 2017- 30 Jun 2017
6 months
1 Apr 2017- 30 Jun 2017
3 months
1 Jan 2017- 31 Dec 2017
12 months
Cost of operations
– In MUSD 47.4 20.1 55.3 28.9 117.3
– In USD per boe 3.19 2.72 3.55 3.54 3.73
Tariff and transportation expenses
– In MUSD 17.2 8.3 17.4 9.7 37.9
– In USD per boe 1.16 1.13 1.12 1.19 1.21
Operating costs
– In MUSD 64.6 28.4 72.7 38.6 155.2
– In USD per boe1 4.35 3.85 4.67 4.73 4.94
Change in inventory position
– In MUSD 0.6 0.0 -0.5 0.1 -0.4
– In USD per boe 0.04 0.00 -0.03 0.01 -0.02
Other
– In MUSD 3.7 1.9 5.8 3.2 9.4
– In USD per boe 0.24 0.25 0.37 0.40 0.30
Production costs
– In MUSD 68.9 30.3 78.0 41.9 164.2
– In USD per boe 4.63 4.10 5.01 5.14 5.22 Note: USD per boe is calculated by dividing the cost by total production volume for the period. 1 The numbers in this table are excluding tariff income netting. Lundin Petroleum’s operating cost for the reporting period of USD 4.35 (USD 4.67) per barrel is reduced to USD 3.30 (USD 4.09) when tariff income is netted off. The operating cost for the second quarter 2018 of USD 3.85 (USD 4.73) per barrel is reduced to USD 2.78 (USD 4.14) when tariff income is netted off.
The total cost of operations for the reporting period amounted to MUSD 47.4 (MUSD 55.3). The total cost of operations excluding operational projects amounted to MUSD 43.0 (MUSD 51.2). The reduction compared to the comparative period included the reversal of an accrual as a result of the termination of production from the Brynhild field of MUSD 5.5. The cost of operations per barrel for the reporting period amounted to USD 3.19 (USD 3.55) including operational projects and USD 2.89 (USD 3.29) excluding operational projects. Tariff and transportation expenses for the reporting period amounted to MUSD 17.2 (MUSD 17.4) or USD 1.16 (USD 1.12) per barrel. Other costs for the reporting period amounted to MUSD 3.7 (MUSD 5.8) and related to the business interruption insurance. The comparative period also included the operating cost share arrangement on the Brynhild field whereby the amount of operating cost varied with the oil price until the end of May 2017. This arrangement was being marked-to-market against the oil price curve. Depletion and decommissioning costs Depletion and decommissioning costs for the reporting period amounted to MUSD 232.7 (MUSD 275.3) at an average rate of USD 15.65 (USD 17.67) per barrel and are detailed in Note 3. The lower depletion costs for the reporting period compared to the comparative period is due to the lower depletion rate per barrel for the Edvard Grieg field as a result of the increased reserves per end 2017. Exploration costs Exploration costs expensed in the income statement for the reporting period amounted to MUSD 5.9 (MUSD 25.9) and are detailed in Note 3. Exploration and appraisal costs are capitalised as they are incurred. When exploration drilling is unsuccessful, the capitalised costs are expensed. All capitalised exploration costs are reviewed on a regular basis and are expensed where their recoverability is considered highly uncertain. Impairment costs of oil and gas properties Impairment costs in the income statement for the reporting period amounted to MUSD – (MUSD 13.2) and are detailed in note 3. The impairment costs in the comparative period was triggered by the partial sale of the Brynhild field in PL148 where a 39 percent working interest was divested. Purchase of crude oil from third parties Purchase of crude oil from third parties for the reporting period amounted to MUSD 324.8 (MUSD 103.2) and related to Grane Blend crude oil purchased from outside the Group by Lundin Petroleum Marketing SA.

8
General, administrative and depreciation expenses The general administrative and depreciation expenses for the reporting period amounted to MUSD 13.5 (MUSD 16.7) which included a charge of MUSD 2.4 (MUSD 1.8) in relation to the Group’s long-term incentive plans (LTIP), see also Remuneration section below. Fixed asset depreciation expenses for the reporting period amounted to MUSD 1.4 (MUSD 1.3). Finance income Finance income for the reporting period amounted to MUSD 197.4 (MUSD 139.6) and is detailed in Note 4.
The net foreign currency exchange gain for the reporting period amounted to MUSD 9.6 (MUSD 139.2). Foreign exchange movements occur on the settlement of transactions denominated in foreign currencies and the revaluation of working capital and loan balances to the prevailing exchange rate at the balance sheet date where those monetary assets and liabilities are held in currencies other than the functional currencies of the Group’s reporting entities. Lundin Petroleum has hedged certain foreign currency capital expenditure amounts against the US Dollar and for the reporting period, the net realised exchange gain on these settled foreign exchange hedges amounted to MUSD 7.6 (MUSD 6.2 loss). The US Dollar strengthened against the Euro during the reporting period resulting in a net foreign currency exchange loss on the US Dollar denominated external loan, which is borrowed by a subsidiary using Euro as functional currency. In addition, the Norwegian Krone strengthened against the Euro in the reporting period, generating a net foreign currency exchange gain on an intercompany loan balance denominated in Norwegian Krone. During the reporting period the reserve-based lending facility was successfully re-negotiated resulting in the interest rate margin over LIBOR being reduced from 3.15 percent to a current rate of 2.25 percent effective as of 1 June 2018. The amendment of the interest rate margin has resulted in an accounting gain of MUSD 183.7 (MUSD –) in accordance with IFRS 9. When a financial liability, measured at amortised cost, is modified without this resulting in derecognition, a gain or loss should be recognised in the income statement based on IFRS 9. The gain or loss is calculated as the difference between the original contractual cash flows and the modified cash flows discounted at the original effective interest rate. Other financial income amounted to MUSD 3.3 (MUSD 0.2) and included the change in fair value under IFRS 9 of the shares held in ShaMaran as described on page 11. The shares held in ShaMaran were sold during the reporting period at the prevailing market price. Finance costs Finance costs for the reporting period amounted to MUSD 96.1 (MUSD 89.8) and are detailed in Note 5. Interest expenses for the reporting period amounted to MUSD 49.1 (MUSD 58.1) and represented the portion of interest charged to the income statement. An additional amount of interest of MUSD 43.1 (MUSD 26.6) associated with the funding of the Norwegian development projects was capitalised in the reporting period. The total interest expense has increased compared to the comparative period mainly due to higher interest rates. The result on interest rate hedge settlements amounted to a loss of MUSD 1.7 (MUSD 11.0). The amortisation of the deferred financing fees for the reporting period amounted to MUSD 9.2 (MUSD 8.5) and related to the fees incurred in establishing the reserve-based lending facility. The fees are being expensed over the period of usage of the facility. Loan facility commitment fees for the reporting period amounted to MUSD 6.8 (MUSD 5.4) with the increase compared to the comparative period being the result of the lower drawn debt under the reserve-based lending facility somewhat offset by a lower percentage for commitment fees as agreed through the recent amendment of the facility effective as of 1 June 2018. The unwinding of the loan modification gain amounted to MUSD 3.7 (MUSD –) and related to the expensing of the accounting gain from the re-negotiated improved borrowing terms for the reserve-based lending facility over the period of usage of the facility. The loan modification fees amounted to MUSD 17.3 (MUSD –) and related to the fees incurred for the re-negotiated reserve-based lending facility resulting in the interest rate margin over LIBOR being reduced from 3.15 percent to a current rate of 2.25 percent effective as of 1 June 2018. The net accounting gain when offsetting these loan modification fees against the reported loan modification gain amounted to MUSD 166.4. The associated deferred taxes amounted to MUSD 68.3 resulting in a post-tax accounting gain of MUSD 98.1. Share in result of associate company Share in result of associated company for the reporting period amounted to MUSD -0.0 (MUSD –) and related to the share in the result of the investment in Mintley Caspian Ltd. Tax The overall tax charge for the reporting period amounted to MUSD 560.7 (MUSD 218.8) and is detailed in Note 6. The current tax charge for the reporting period amounted to MUSD 8.7 (MUSD -1.1) of which MUSD 8.2 (MUSD -1.4) related to Norway. The current tax charge for Norway related to Corporate Tax only with no current tax charge to the income statement in relation to the Special Petroleum Tax (SPT) as the Company continues to be sheltered from SPT tax losses.

9
The deferred tax charge for the reporting period amounted to MUSD 552.0 (MUSD 219.9) and related to Norway. The deferred tax amount arises primarily where there is a difference in depletion for tax and accounting purposes. The Group operates in various countries and fiscal regimes where corporate income tax rates are different from the regulations in Sweden. Corporate income tax rates for the Group vary between 12.5 and 78 percent. The effective tax rate for the reporting period is affected by items which do not receive a full tax credit such as the reported net foreign currency exchange gain, Norwegian financial items and by the uplift allowance applicable in Norway for development expenditures against the offshore tax regime. Non-controlling interest The net result attributable to non-controlling interest for the reporting period amounted to MUSD – (MUSD -2.5) and related in the comparative period to the non-controlling interest’s share in Mintley Caspian Ltd., which is the holding company of Lundin Petroleum´s investment in Russia, which was fully consolidated up to the end of the third quarter 2017. The investment in Mintley Caspian Ltd. was deconsolidated at the end of the third quarter 2017 and the results are now reported as share in result of associated company. Balance Sheet Non-current assets Oil and gas properties amounted to MUSD 5,379.5 (MUSD 4,937.1) and are detailed in Note 7.
Development, exploration and appraisal expenditure incurred for the reporting period was as follows:
Development expenditure in MUSD
1 Jan 2018- 30 Jun 2018
6 months
1 Apr 2018- 30 Jun 2018
3 months
1 Jan 2017- 30 Jun 2017
6 months
1 Apr 2017- 30 Jun 2017
3 months
1 Jan 2017- 31 Dec 2017
12 months
Norway 376.3 205.3 512.7 255.7 950.0
Development expenditures 376.3 205.3 512.7 255.7 950.0 Development expenditure of MUSD 376.3 (MUSD 512.7) was incurred in Norway during the reporting period, primarily on the Johan Sverdrup and Edvard Grieg fields. In addition an amount of MUSD 43.1 (MUSD 26.6) of interest was capitalised.
Exploration and appraisal expenditure in MUSD
1 Jan 2018- 30 Jun 2018
6 months
1 Apr 2018- 30 Jun 2018
3 months
1 Jan 2017- 30 Jun 2017
6 months
1 Apr 2017- 30 Jun 2017
3 months
1 Jan 2017- 31 Dec 2017
12 months
Norway 172.7 118.6 103.0 48.9 227.1
Russia – – 0.8 0.4 1.1
Exploration and appraisal expenditure 172.7 118.6 103.8 49.3 228.2
Exploration and appraisal expenditure of MUSD 172.7 (MUSD 103.0) was incurred in Norway during the reporting period, primarily for the appraisal wells Luno II in PL359, Rolvsnes in PL338C and Alta in PL609, the exploration wells Frosk in PL340, Svanefjell in PL659 and Lille Prinsen in PL167 as wells as for Phase 2 of the Johan Sverdrup project. Goodwill associated with the accounting for the Edvard Grieg transaction during 2016 amounted to MUSD 128.1 (MUSD 128.1). Financial assets amounted to MUSD 0.4 (MUSD 6.7). The comparative period included the shares held in ShaMaran which were sold during the reporting period to a related party, see also the Related Party Transactions section below. Derivative instruments amounted to MUSD 42.7 (MUSD 26.5) and related to the marked-to-market gain on the outstanding interest rate and currency hedge contracts due to be settled after twelve months. Current assets Inventories amounted to MUSD 34.6 (MUSD 33.7) and included both well supplies and hydrocarbon inventories. Trade and other receivables amounted to MUSD 354.3 (MUSD 304.4) and are detailed in Note 8. Trade receivables, which are all current, amounted to MUSD 263.7 (MUSD 202.7) and included invoiced cargoes. Underlift amounted to MUSD 17.0 (MUSD 29.4) and was attributable to an underlift position on the producing fields, mainly from Edvard Grieg. Joint operations debtors relating to various joint venture receivables amounted to MUSD 15.2 (MUSD 15.6). Prepaid expenses and accrued income amounted to MUSD 31.8 (MUSD 29.3) and represented mainly prepaid operational and insurance expenditure. Other current assets amounted to MUSD 26.6 (MUSD 27.4) and included a short term receivable from IPC in relation to certain working capital balances following the IPC spin-off, VAT receivables and other miscellaneous receivable balances. Derivative instruments amounted to MUSD 31.7 (MUSD 7.7) and related to the marked-to-market gain on the outstanding interest rate and currency hedge contracts due to be settled within twelve months. Cash and cash equivalents amounted to MUSD 96.5 (MUSD 71.4) of which MUSD 16.7 (MUSD –) is restricted. Cash balances are held to meet ongoing operational funding requirements.
10
Non-current liabilities Financial liabilities amounted to MUSD 3,648.5 (MUSD 3,880.0) and are detailed in Note 9. Bank loans amounted to MUSD 3,895.0 (MUSD 3,955.0) and related to the outstanding loan under the reserve-based lending facility. Capitalised financing fees relating to the establishment of the facility amounted to MUSD 66.5 (MUSD 75.0) and are being amortised over the expected life of the facility. The capitalised loan modification gain relating to the re-negotiated improved borrowing terms for the lending facility amounted to MUSD 180.0 (MUSD –) and are being amortised over the expected life of the facility. Provisions amounted to MUSD 495.4 (MUSD 420.6) and are detailed in Note 10. The provision for site restoration amounted to MUSD 490.6 (MUSD 414.6) and related to future decommissioning obligations. The increase mainly reflects the additional liability for Edvard Grieg and for the Johan Sverdrup development project. Deferred tax liabilities amounted to MUSD 1,847.3 (MUSD 1,302.2). The provision mainly arises on the excess of book value over the tax value of oil and gas properties. Deferred tax assets are netted off against deferred tax liabilities where they relate to the same jurisdiction. Derivative instruments amounted to MUSD 9.6 (MUSD 3.1) and related to the marked-to-market loss on outstanding interest rate and currency hedge contracts due to be settled after twelve months. Current liabilities Financial liabilities amounted to MUSD 17.9 (MUSD –) and are detailed in note 9. Financial liabilities related to the obligation to settle the 2015 long-term performance based incentive plan in respect of Group management and a number of key employees, see also the Remuneration section below. Trade and other payables amounted to MUSD 264.5 (MUSD 259.0) and are detailed in Note 11. Overlift amounted to MUSD 13.8 (MUSD 12.8) and was attributable to an overlift position on the producing fields, mainly from the Alvheim area and Brynhild. Deferred revenue amounted to MUSD 9.0 (MUSD –) and related to Edvard Grieg and Ivar Aasen. Joint operations creditors and accrued expenses amounted to MUSD 189.0 (MUSD 188.9) and related to activity in Norway. Other accrued expenses amounted to MUSD 18.9 (MUSD 19.5) and other current liabilities amounted to MUSD 8.0 (MUSD 7.7). Derivative instruments amounted to MUSD 3.0 (MUSD 6.4) and related to the marked-to-market loss on outstanding interest rate and currency hedge contracts due to be settled within twelve months. Current provisions amounted to MUSD 4.9 (MUSD 7.7) and related to the current portion of the provision for Lundin Petroleum’s Unit Bonus Plan. Parent Company The business of the Parent Company is investment in and management of oil and gas assets. The net result for the Parent Company for the reporting period amounted to MSEK 1,662.2 (MSEK 46,500.9). The net result for the reporting period included MSEK 1,714.6 financial income as a result of received dividends from a subsidiary. The net result for the comparative period included MSEK 46,543.2 financial income as a result of an internal restructuring prior to the IPC spin-off in 2017. The net result excluding these financial income items amounted to MSEK -52.4 (MSEK -42.3). The net result included general and administrative expenses of MSEK 66.8 (MSEK 47.6) and net finance income of MSEK 6.1 (MSEK 0.8) when excluding the finance income items as mentioned above. Pledged assets of MSEK 55,118.9 (MSEK 55,118.9) relate to the carrying value of the pledge of the shares in respect of the reserve-based lending facility entered into by its wholly-owned subsidiary Lundin Petroleum Holding BV, see also the Liquidity section below.
Related Party Transactions During the reporting period, the Group has entered into various transactions with related parties on a commercial basis including the transactions described below. The Group has purchased oil from the Equinor group (previously Statoil) on an arm’s-length basis amounting to MUSD 203.1 (MUSD –). The Group has sold oil and related products to the Equinor group on an arm’s-length basis amounting to MUSD 650.2 (MUSD 174.3). As at the date of the IPC spin-off, the Group had a residual receivable for working capital from IPC of MUSD 27.4 which has been reduced to MUSD 23.6. This receivable is due by mid 2019. The Group has sold the shares held in ShaMaran to Zebra Holdings and Investment (Guernsey) Ltd. based on the quoted market share price of ShaMaran amounting to MUSD 9.3.
11
Liquidity In February 2016, Lundin Petroleum entered into a committed seven year senior secured reserve-based lending facility of USD 5.0 billion. The facility was amended during the second quarter of 2018 resulting in the interest rate margin over LIBOR being reduced from 3.15 percent to a current rate of 2.25 percent. The facility is secured against certain cash flows generated by the Group. The amount available under the facility is recalculated every twelve months based upon the calculated cash flow generated by certain producing fields and fields under development at an oil price and economic assumptions agreed with the banking syndicate providing the facility. The facility is secured by a pledge over the shares of certain Group companies, a pledge over the Company’s working interest in some production licenses and a charge over some of the bank accounts of the pledged companies. Subsequent Events There are no subsequent events to report. Share Data Lundin Petroleum AB’s issued share capital amounted to SEK 3,478,713 represented by 340,386,445 shares with a quota value of SEK 0.01 each (rounded off). During 2017, Lundin Petroleum purchased 1,233,310 of its own shares at an average price of SEK 186.14 based on the approval granted at the AGM 2017. During the reporting period Lundin Petroleum purchased an additional 640,000 of its own shares at an average price of SEK 186.77 based on the approval granted at the AGM 2017 resulting in 1,873,310 of its own shares held at the end of the reporting period. The AGM of Lundin Petroleum held on 3 May 2018 in Stockholm approved an inaugural cash dividend distribution for the year 2017 of SEK 4.00 per share and the dividend was distributed on 11 May 2018. Based on the number of shares outstanding, excluding own shares held by the Company, the dividend distribution amounted to MSEK 1,354.1, equaling MUSD 153.1 based on the exchange rate on the date of AGM approval. Based on current market conditions, an annual cash dividend of at least MUSD 350.0 is anticipated from next year. Remuneration Lundin Petroleum’s principles for remuneration and details of the long-term incentive plans are provided in the Company’s 2017 Annual Report and in the materials provided to shareholders in respect of the 2018 AGM, available on www.lundin-petroleum.com Unit Bonus Plan The number of units relating to the awards made in 2016, 2017 and 2018 under the Unit Bonus Plan outstanding as at 30 June 2018 were 108,200, 188,064 and 226,389 respectively. Performance Based Incentive Plan The AGM 2017 resolved a long-term performance based incentive plan in respect of Group management and a number of key employees. The plan is effective from 1 July 2017 and the 2017 award is accounted for from the second half of 2017. The total outstanding number of awards at 30 June 2018 was 355,954 and the awards vest over three years from 1 July 2017 subject to certain performance conditions being met. Each original award was fair valued at the date of grant at SEK 100.10 using an option pricing model. The 2016 plan is effective from 1 July 2016 and the total outstanding number of awards at 30 June 2018 was 406,902 and the awards vest over three years from 1 July 2016 subject to certain performance conditions being met. The outstanding number of awards increased compared to the original number of awards as a result of the dividend distribution of the IPC business as per the plan rules. Each original award was fair valued at the date of grant at SEK 89.30 using an option pricing model. Awards given to employees now employed by IPC following the IPC spin-off have been pro-rated until the spin-off date 24 April 2017. The 2015 plan is effective from 1 July 2015 and the total outstanding number of awards at 30 June 2018 was 646,503 and the awards vest over three years from 1 July 2015 subject to certain performance conditions being met. The outstanding number of awards increased compared to the original number of awards as a result of the dividend distribution of the IPC business as per the plan rules. Each original award was fair valued at the date of grant at SEK 91.40 using an option pricing model. Awards given to employees now employed by IPC following the IPC spin-off have been pro-rated until the spin-off date 24 April 2017. Accounting Policies This interim report has been prepared in accordance with International Accounting Standard (IAS) 34, Interim Financial Reporting, and the Swedish Annual Accounts Act (SFS 1995:1554). IFRS 9 has come into effect with effective date 1 January 2018. IFRS 9 Financial instruments, addresses the classification, measurement and recognition of financial assets and financial liabilities, introduced new rules for hedge accounting and a new impairment model for financial assets. Based on this standard, the investment in ShaMaran Petroleum Corp. (ShaMaran) was booked at fair value of the shares with movements in the fair value of the shares being directly recognised in the consolidated income statement. The Group applies the new rules retrospectively from 1 January 2018 and the comparatives are not restated. Based on IFRS 9, a net accounting gain of MUSD 166.4 was recognised during the reporting period as a result of the re-negotiated improved borrowing terms for the reserve-based lending facility taking effect as of 1 June 2018. See also Financial Income section on page 8. IFRS 15 has come into effect with effective date 1 January 2018. IFRS 15 Revenue from contract with customers, addresses revenue recognition and established principles for reporting useful information to users of financial statements. Based on this standard,

12
certain transactions are no longer reported as revenue but as other revenue instead. The Group applies the new rules using the full retrospective approach and the comparatives have been restated.
The accounting policies adopted are in all other aspects consistent with those followed in the preparation of the Group’s annual financial statements for the year ended 31 December 2017.
The financial reporting of the Parent Company has been prepared in accordance with accounting principles generally accepted in Sweden, applying RFR 2 Reporting for legal entities, issued by the Swedish Financial Reporting Board and the Annual Accounts Act (SFS 1995:1554).
Under Swedish company regulations it is not allowed to report the Parent Company results in any other currency than Swedish Krona or Euro and consequently the Parent Company’s financial information is reported in Swedish Krona and not the Group’s reporting currency of US Dollar.
Risks and Risk Management The objective of Business Risk Management is to identify, understand and manage threats and opportunities within the business on a continual basis. This objective is achieved by creating a mandate and commitment to risk management at all levels of the business. This approach actively addresses risk as an integral and continual part of decision making within the Group and is designed to ensure that all risks are identified, fully acknowledged, understood and communicated well in advance. The ability to manage and or mitigate these risks represents a key component in ensuring that the business aim of the Company is achieved. Nevertheless, oil and gas exploration, development and production involve high operational and financial risks, which even a combination of experience, knowledge and careful evaluation may not be able to fully eliminate or which are beyond the Company’s control.
A detailed analysis of Lundin Petroleum’s strategic, operational, financial and external risks and mitigation of those risks through risk management is described in Lundin Petroleum’s 2017 Annual Report.
Derivative financial instruments Lundin Petroleum has entered into forward currency hedges to meet part of its future NOK capital requirements relating to the Johan Sverdrup field development. At 30 June 2018, Lundin Petroleum had outstanding currency hedges as summarised below:
Lundin Petroleum entered into interest rate hedge contracts and at 30 June 2018 had outstanding interest rate hedge contracts as follows:
Under IFRS 9, subject to hedge effectiveness testing, all of the hedges are treated as effective and changes to the fair value are reflected in other comprehensive income.
Exchange Rates For the preparation of the financial statements for the reporting period, the following currency exchange rates have been used.
30 Jun 2018 30 Jun 2017 31 Dec 2017
Average Period end Average Period end Average Period end
1 USD equals NOK 7.9264 8.1588 8.4784 8.3870 8.2712 8.2050
1 USD equals Euro 0.8259 0.8578 0.9238 0.8763 0.8855 0.8338
1 USD equals SEK 8.3902 8.9664 8.8660 8.4471 8.5481 8.2080
Buy Sell Average contractual Exchange rate Settlement period
MNOK 1,744.1 MUSD 211.2 NOK 8.26:USD 1 Jul 2018 – Dec 2018
MNOK 2,622.4 MUSD 320.2 NOK 8.19:USD 1 Jan 2019 – Dec 2019
MNOK 1,835.0 MUSD 237.0 NOK 7.74:USD 1 Jan 2020 – Dec 2020
MNOK 1,450.0 MUSD 189.4 NOK 7.66:USD 1 Jan 2021 – Dec 2021
MNOK 1,200.0 MUSD 158.2 NOK 7.59:USD 1 Jan 2022 – Dec 2022
Borrowings expressed in MUSD
Fixing of floating LIBOR average rate per annum Settlement period
3,000 1.87% Jul 2018 – Dec 2018
3,000 1.42% Jan 2019 – Dec 2019
1,750 2.01% Jan 2020 – Dec 2020
1,000 2.17% Jan 2021 – Dec 2021
1,000 2.37% Jan 2022 – Dec 2022

Consolidated Income Statement
13
Expressed in MUSD Note
1 Jan 2018- 30 Jun 2018
6 months
1 Apr 2018- 30 Jun 2018
3 months
1 Jan 2017- 30 Jun 2017
6 months
1 Apr 2017- 30 Jun 2017
3 months
1 Jan 2017- 31 Dec 2017
12 months
Revenue and other income 1
Revenue 1,366.7 672.5 881.0 499.8 1,958.3
Other income 3.3 4.6 5.1 -35.2 38.7
1,370.0 677.1 886.1 464.6 1,997.0
Cost of sales
Production costs 2 -68.9 -30.3 -78.0 -41.9 -164.2
Depletion and decommissioning costs -232.7 -114.2 -275.3 -144.2 -567.3
Exploration costs -5.9 -6.2 -25.9 -21.7 -73.1
Impairment costs of oil and gas properties – – -13.2 -13.2 -30.6
Loss from sale of assets – – – – -14.4
Purchase of crude oil from third parties -324.8 -132.6 -103.2 -83.9 -303.3
Gross profit/loss 3 737.7 393.8 390.5 159.7 844.1
General, administration and depreciation expenses -13.5 -7.2 -16.7 -5.7 -31.7
Operating profit/loss 724.2 386.6 373.8 154.0 812.4
Net financial items
Finance income 4 197.4 35.0 139.6 119.0 256.7
Finance costs 5 -96.1 -57.1 -89.8 -44.5 -186.6
101.3 -22.1 49.8 74.5 70.1
Share in result of associated company -0.0 -0.0 – – -0.4
Profit/loss before tax 825.5 364.5 423.6 228.5 882.1
Income tax 6 -560.7 -328.5 -218.8 -82.9 -501.2
Net result from continuing operations 264.8 36.0 204.8 145.6 380.9
Discontinued operations
Net result - IPC – – 47.9 43.9 46.5
Net result 264.8 36.0 252.7 189.5 427.4
Attributable to:
Shareholders of the Parent Company 264.8 36.0 255.2 190.7 431.2
Non-controlling interest – – -2.5 -1.2 -3.8
264.8 36.0 252.7 189.5 427.4
Earnings per share – USD1
From continuing operations 0.78 0.10 0.61 0.43 1.13
From discontinued operations – – 0.14 0.13 0.14
Earnings per share fully diluted – USD1
From continuing operations 0.78 0.11 0.61 0.43 1.13
From discontinued operations – – 0.14 0.13 0.14
1 Based on net result attributable to shareholders of the Parent Company.

Consolidated Statement of Comprehensive Income
14
Expressed in MUSD
1 Jan 2018- 30 Jun 2018
6 months
1 Apr 2018- 30 Jun 2018
3 months
1 Jan 2017- 30 Jun 2017
6 months
1 Apr 2017- 30 Jun 2017
3 months
1 Jan 2017- 31 Dec 2017
12 months
Net result 264.8 36.0 252.7 189.5 427.4
Items that may be subsequently reclassified to profit or loss:
Exchange differences foreign operations 12.3 21.2 -58.5 -60.4 -96.2
Cash flow hedges 39.2 -26.2 40.7 22.0 76.4
Available-for-sale financial assets – – 0.2 1.0 4.9
Other comprehensive income, net of tax 51.5 -5.0 -17.6 -37.4 -14.9
Total comprehensive income 316.3 31.0 235.1 152.1 412.5
Attributable to:
Shareholders of the Parent Company 316.3 31.0 237.6 153.4 416.3
Non-controlling interest – – -2.5 -1.3 -3.8
316.3 31.0 235.1 152.1 412.5

Consolidated Balance Sheet
15
Expressed in MUSD Note 30 June 2018 31 December 2017
ASSETS
Non-current assets
Oil and gas properties 7 5,379.5 4,937.1
Other tangible fixed assets 13.8 13.2
Goodwill 128.1 128.1
Financial assets 0.4 6.7
Derivative instruments 12 42.7 26.5
Total non-current assets 5,564.5 5,111.6
Current assets
Inventories 34.6 33.7
Trade and other receivables 8 354.3 304.4
Derivative instruments 12 31.7 7.7
Cash and cash equivalents 96.5 71.4
Total current assets 517.1 417.2
TOTAL ASSETS 6,081.6 5,528.8
EQUITY AND LIABILITIES
Equity
Shareholders´ equity -217.9 -350.8
Liabilities
Non-current liabilities
Financial liabilities 9 3,648.5 3,880.0
Provisions 10 495.4 420.6
Deferred tax liabilities 1,847.3 1,302.2
Derivative instruments 12 9.6 3.1
Total non-current liabilities 6,000.8 5,605.9
Current liabilities
Financial liabilities 9 17.9 –
Trade and other payables 11 264.5 259.0
Derivative instruments 12 3.0 6.4
Current tax liabilities 8.4 0.6
Provisions 10 4.9 7.7
Total current liabilities 298.7 273.7
Total liabilities 6,299.5 5,879.6
TOTAL EQUITY AND LIABILITIES 6,081.6 5,528.8

Consolidated Statement of Cash Flows
16
Expressed in MUSD
1 Jan 2018- 30 Jun 2018
6 months
1 Apr 2018- 30 Jun 2018
3 months
1 Jan 2017- 30 Jun 2017
6 months
1 Apr 2017- 30 Jun 2017
3 months
1 Jan 2017- 31 Dec 2017
12 months
Cash flows from operating activities
Net result 264.8 36.0 204.8 145.6 380.9
Adjustments for:
Exploration costs 5.9 6.2 25.9 21.7 73.1
Depletion, depreciation and amortisation 234.1 114.9 276.5 144.8 570.9
Impairment of oil and gas properties – – 13.2 13.2 30.6
Current tax 8.7 8.4 -1.1 -1.4 -0.5
Deferred tax 552.0 320.1 219.9 84.3 501.7
Impairment of other shares – – – – 11.2
Long-term incentive plans 9.9 6.2 6.1 2.8 12.7
Foreign currency exchange gain/ loss -9.7 147.0 -146.4 -123.6 -258.0
Interest expense 49.1 24.6 58.1 29.5 115.0
Loan modification gain -183.7 -183.7 – – –
Loan modification fees 17.3 17.3 – – –
Unwinding of loan modification gain 3.7 3.7 – – –
Capitalised financing fees 9.2 4.6 8.5 4.2 17.5
Other 3.6 – 5.6 2.9 26.4
Interest received
0.6
0.4
0.2
0.1
1.0
Interest paid -91.9 -45.9 -84.0 -43.4 -177.3
Income taxes paid / received -0.7 -0.4 -0.2 -0.2 82.2
Changes in working capital -65.5 -54.6 14.3 -19.8 -88.1
Total cash flows from operating activities 807.4 404.8 601.4 260.7 1,299.3
Cash flows from investing activities
Investment in oil and gas properties -553.7 -323.8 -616.5 -305.0 -1,178.2
Investment in other fixed assets -2.0 -1.1 -0.8 -0.2 -1.6
Investment in other shares and participations1 9.3 9.3 -1.3 – -1.3
Decommissioning costs paid – – -0.1 -0.3 -0.4
Disposal of fixed assets 2 – – – – 93.7
Other payments – – -7.2 -7.2 -7.8
Total cash flows from investing activities -546.4 -315.6 -625.9 -312.7 -1,095.6
Cash flows from financing activities
Changes in long-term liabilities -60.0 70.0 10.9 70.4 -188.7
Financing fees paid -16.9 -16.9 – – –
Cash funded from / to discontinued operations – – 31.7 – 31.7
Dividends paid -153.1 -153.1 – – –
Purchase of own shares -14.3 – – – -28.0
Total cash flows from financing activities -244.3 -100.0 42.6 70.4 -185.0
Change in cash and cash equivalents
16.7
-10.8
18.1
18.4
18.7
Cash and cash equivalents at the beginning of the period 71.4 100.6 56.1 56.3 56.1
Currency exchange difference in cash and cash equivalents 8.4 6.7 0.0 -0.5 -3.2 Cash and cash equivalent of deconsolidated operations – – – – -0.2
Cash and cash equivalents at the end of the period
96.5
96.5
74.2
74.2
71.4
1 Cash received on the sale of the shares held in ShaMaran. 2 Cash received on the divestment of a 39 percent working interest in the Brynhild field on closing including settlement of net working capital.

Consolidated Statement of Changes in Equity
17
Attributable to owners of the Parent Company
Expressed in MUSD Share
capital
Additional paid-in-
capital/Other reserves
Retained earnings Dividends Total
Non- controlling
interest Total
equity
At 1 January 2017 0.5 548.3 -787.4 – -238.6 -113.6 -352.2
Comprehensive income
Net result – – 255.2 – 255.2 -2.5 252.7
Other comprehensive income – -17.6 – – -17.6 – -17.6
Total comprehensive income – -17.6 255.2 – 237.6 -2.5 235.1
Transactions with owners Distributions – – – -410.0 -410.0 – -410.0Spin off IPC – – – – – 0.3 0.3 Share based payments – -12.4 – – -12.4 – -12.4Value of employee services – – 1.6 – 1.6 – 1.6
Total transactions with owners – -12.4 1.6 -410.0 -420.8 0.3 -420.5
At 30 June 2017 0.5 518.3 -530.6 -410.0 -421.8 -115.8 -537.6
Comprehensive income
Net result – – 176.0 – 176.0 -1.3 174.7
Other comprehensive income – 2.7 – – 2.7 – 2.7
Total comprehensive income – 2.7 176.0 – 178.7 -1.3 177.4
Transactions with owners
Change in consolidation – – -82.0 – -82.0 117.1 35.1
Purchase of own shares – -28.0 – – -28.0 – -28.0
Share based payments – -0.8 – – -0.8 – -0.8
Value of employee services – – 3.1 – 3.1 – 3.1
Total transaction with owners – -28.8 -78.9 – -107.7 117.1 9.4
At 31 December 2017 0.5 492.2 -433.5 -410.0 -350.8 – -350.8
Transfer of prior year dividends – -410.0 – 410.0 – – –
Comprehensive income
Net result – – 264.8 – 264.8 – 264.8
Other comprehensive income – 51.5 – – 51.5 – 51.5
Total comprehensive income – 51.5 264.8 – 316.3 – 316.3
Transactions with owners Distributions – – – -153.1 -153.1 – -153.1
Purchase of own shares – -14.3 – – -14.3 – -14.3
Share based payments – -17.9 – – -17.9 – -17.9
Value of employee services – – 1.9 – 1.9 – 1.9
Total transaction with owners – -32.2 1.9 -153.1 -183.4 – -183.4
At 30 June 2018 0.5 101.5 -166.8 -153.1 -217.9 – -217.9
Notes to the Consolidated Financial Statements
18
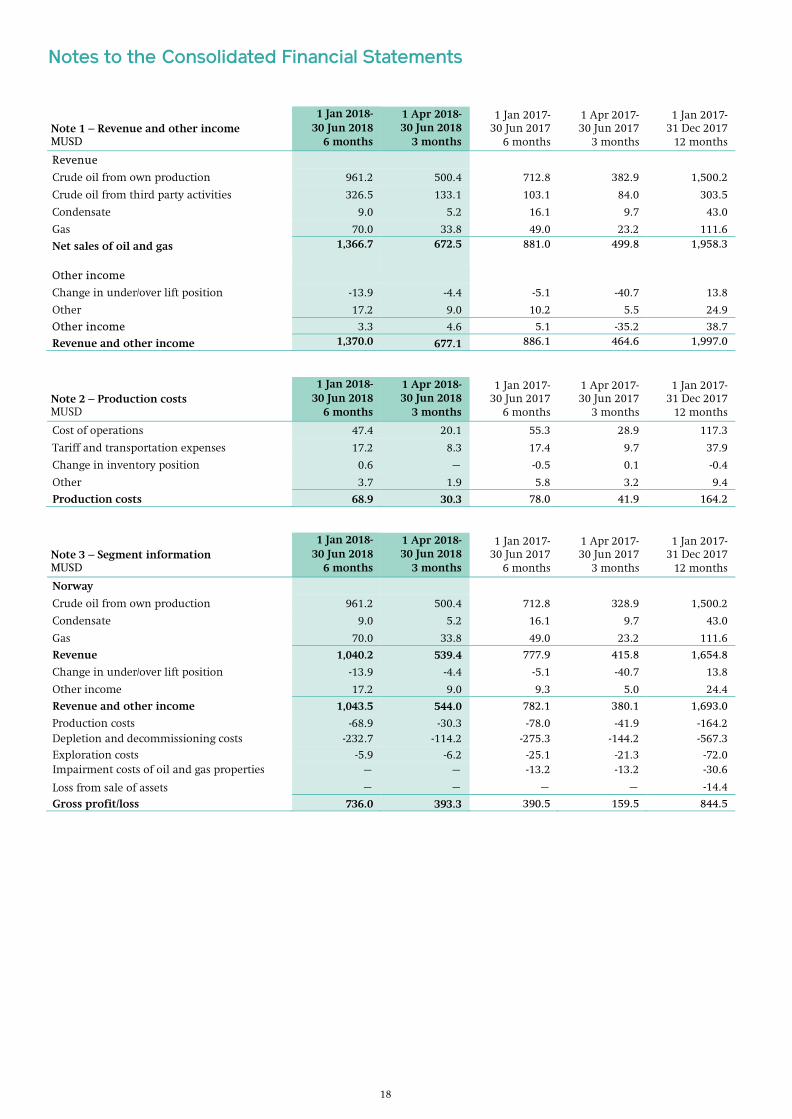
Note 1 – Revenue and other income MUSD
1 Jan 2018- 30 Jun 2018
6 months
1 Apr 2018- 30 Jun 2018
3 months
1 Jan 2017- 30 Jun 2017
6 months
1 Apr 2017- 30 Jun 2017
3 months
1 Jan 2017- 31 Dec 2017
12 months
Revenue
Crude oil from own production 961.2 500.4 712.8 382.9 1,500.2
Crude oil from third party activities 326.5 133.1 103.1 84.0 303.5
Condensate 9.0 5.2 16.1 9.7 43.0
Gas 70.0 33.8 49.0 23.2 111.6
Net sales of oil and gas 1,366.7 672.5 881.0 499.8 1,958.3
Other income
Change in under/over lift position -13.9 -4.4 -5.1 -40.7 13.8
Other 17.2 9.0 10.2 5.5 24.9
Other income 3.3 4.6 5.1 -35.2 38.7
Revenue and other income 1,370.0 677.1 886.1 464.6 1,997.0
Note 2 – Production costs MUSD
1 Jan 2018- 30 Jun 2018
6 months
1 Apr 2018- 30 Jun 2018
3 months
1 Jan 2017- 30 Jun 2017
6 months
1 Apr 2017- 30 Jun 2017
3 months
1 Jan 2017- 31 Dec 2017
12 months
Cost of operations 47.4 20.1 55.3 28.9 117.3
Tariff and transportation expenses 17.2 8.3 17.4 9.7 37.9
Change in inventory position 0.6 – -0.5 0.1 -0.4
Other 3.7 1.9 5.8 3.2 9.4
Production costs 68.9 30.3 78.0 41.9 164.2
Note 3 – Segment information MUSD
1 Jan 2018- 30 Jun 2018
6 months
1 Apr 2018- 30 Jun 2018
3 months
1 Jan 2017- 30 Jun 2017
6 months
1 Apr 2017- 30 Jun 2017
3 months
1 Jan 2017- 31 Dec 2017
12 months
Norway
Crude oil from own production 961.2 500.4 712.8 328.9 1,500.2
Condensate 9.0 5.2 16.1 9.7 43.0
Gas 70.0 33.8 49.0 23.2 111.6
Revenue 1,040.2 539.4 777.9 415.8 1,654.8
Change in under/over lift position -13.9 -4.4 -5.1 -40.7 13.8
Other income 17.2 9.0 9.3 5.0 24.4
Revenue and other income 1,043.5 544.0 782.1 380.1 1,693.0
Production costs -68.9 -30.3 -78.0 -41.9 -164.2Depletion and decommissioning costs -232.7 -114.2 -275.3 -144.2 -567.3
Exploration costs -5.9 -6.2 -25.1 -21.3 -72.0Impairment costs of oil and gas properties – – -13.2 -13.2 -30.6
Loss from sale of assets – – – – -14.4
Gross profit/loss 736.0 393.3 390.5 159.5 844.5

19
Note 3 – Segment information cont. MUSD
1 Jan 2018- 30 Jun 2018
6 months
1 Apr 2018- 30 Jun 2018
3 months
1 Jan 2017- 30 Jun 2017
6 months
1 Apr 2017- 30 Jun 2017
3 months
1 Jan 2017- 31 Dec 2017
12 months
Other
Crude oil from third party activities 326.5 133.1 103.1 84.0 303.5
Revenue 326.5 133.1 103.1 84.0 303.5
Other income – – 0.9 0.5 0.5
Revenue and other income 326.5 133.1 104.0 84.5 304.0
Exploration costs – – -0.8 -0.4 -1.1
Purchase of crude oil from third parties -324.8 -132.6 -103.2 -83.9 -303.3
Gross profit/loss 1.7 0.5 0.0 0.2 -0.4
Total
Crude oil from own production 961.2 500.4 712.8 382.9 1,500.2
Crude oil from third party activities 326.5 133.1 103.1 84.0 303.5
Condensate 9.0 5.2 16.1 9.7 43.0
Gas 70.0 33.8 49.0 23.2 111.6
Revenue 1,366.7 672.5 881.0 499.8 1,958.3
Change in under/over lift position -13.9 -4.4 -5.1 -40.7 13.8
Other income 17.2 9.0 10.2 5.5 24.9
Revenue and other income 1,370.0 677.1 886.1 464.6 1,997.0
Production costs -68.9 -30.3 -78.0 -41.9 -164.2
Depletion and decommissioning costs -232.7 -114.2 -275.3 -144.2 -567.3
Exploration costs -5.9 -6.2 -25.9 -21.7 -73.1
Impairment costs of oil and gas properties – – -13.2 -13.2 -30.6
Loss from sale of assets – – – – -14.4
Purchase of crude oil from third parties -324.8 -132.6 -103.2 -83.9 -303.3
Gross profit/loss 737.7 393.8 390.5 159.7 844.1
Within each segment, revenues from transactions with a single external customer amount to ten percent or more of revenue for that segment.
Note 4 – Finance income MUSD
1 Jan 2018- 30 Jun 2018
6 months
1 Apr 2018- 30 Jun 2018
3 months
1 Jan 2017- 30 Jun 2017
6 months
1 Apr 2017- 30 Jun 2017
3 months
1 Jan 2017- 31 Dec 2017
12 months
Foreign currency exchange gain, net 9.6 -152.5 139.2 118.8 255.3
Loan modification gain 183.7 183.7 – – –
Interest income 0.8 0.6 0.2 0.1 1.0
Other 3.3 3.2 0.2 0.1 0.4
Total finance income 197.4 35.0 139.6 119.0 256.7
Note 5 – Finance costs MUSD
1 Jan 2018- 30 Jun 2018
6 months
1 Apr 2018- 30 Jun 2018
3 months
1 Jan 2017- 30 Jun 2017
6 months
1 Apr 2017- 30 Jun 2017
3 months
1 Jan 2017- 31 Dec 2017
12 months
Interest expense 49.1 24.6 58.1 29.5 115.0
Result on interest rate hedge settlement 1.7 -0.3 11.0 5.0 17.4
Unwinding of site restoration discount 7.7 3.8 5.8 3.0 13.7
Amortisation of deferred financing fees 9.2 4.6 8.5 4.2 17.5
Loan facility commitment fees 6.8 3.3 5.4 2.6 11.1
Loan modification fees 17.3 17.3 – – –
Unwinding of loan modification gain 3.7 3.7 – – –
Impairment of other shares – – – – 11.2
Other 0.6 0.1 1.0 0.2 0.7
Finance costs 96.1 57.1 89.8 44.5 186.6
20
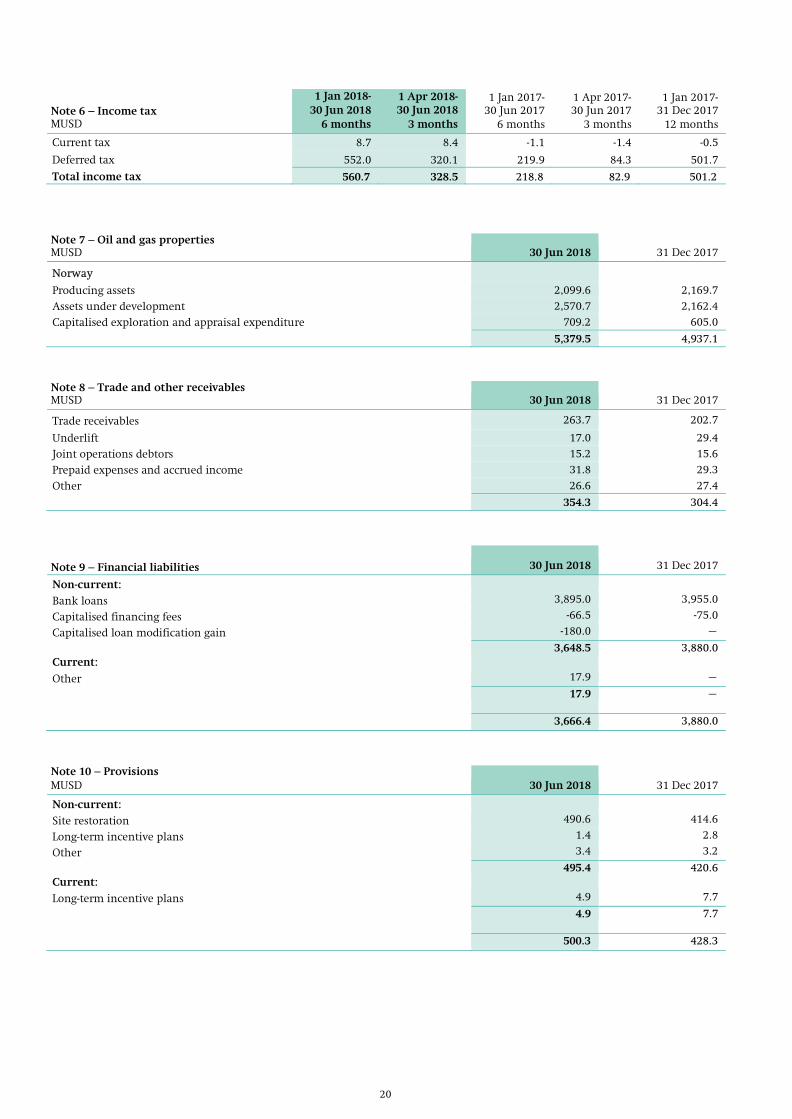
Note 6 – Income tax MUSD
1 Jan 2018- 30 Jun 2018
6 months
1 Apr 2018- 30 Jun 2018
3 months
1 Jan 2017- 30 Jun 2017
6 months
1 Apr 2017- 30 Jun 2017
3 months
1 Jan 2017- 31 Dec 2017
12 months
Current tax 8.7 8.4 -1.1 -1.4 -0.5
Deferred tax 552.0 320.1 219.9 84.3 501.7
Total income tax 560.7 328.5 218.8 82.9 501.2
Note 7 – Oil and gas properties MUSD 30 Jun 2018 31 Dec 2017
Norway
Producing assets 2,099.6 2,169.7
Assets under development 2,570.7 2,162.4
Capitalised exploration and appraisal expenditure 709.2 605.0
5,379.5 4,937.1
Note 8 – Trade and other receivables MUSD 30 Jun 2018 31 Dec 2017
Trade receivables 263.7 202.7
Underlift 17.0 29.4
Joint operations debtors 15.2 15.6
Prepaid expenses and accrued income 31.8 29.3
Other 26.6 27.4
354.3 304.4
Note 9 – Financial liabilities 30 Jun 2018 31 Dec 2017
Non-current:
Bank loans 3,895.0 3,955.0
Capitalised financing fees -66.5 -75.0
Capitalised loan modification gain -180.0 –
Current: 3,648.5 3,880.0
Other 17.9 –
17.9 –
3,666.4 3,880.0
Note 10 – Provisions MUSD 30 Jun 2018 31 Dec 2017
Non-current:
Site restoration 490.6 414.6
Long-term incentive plans 1.4 2.8
Other 3.4 3.2
Current: 495.4 420.6
Long-term incentive plans 4.9 7.7
4.9 7.7
500.3 428.3

21
Note 11 – Trade and other payables MUSD 30 Jun 2018 31 Dec 2017
Trade payables 25.8 30.1
Overlift 13.8 12.8
Deferred revenue 9.0 –
Joint operations creditors and accrued expenses 189.0 188.9
Other accrued expenses 18.9 19.5
Other 8.0 7.7
264.5 259.0
Note 12 – Financial instruments
For financial instruments measured at fair value in the balance sheet, the following fair value measurement hierarchy is used:
– Level 1: based on quoted prices in active markets;– Level 2: based on inputs other than quoted prices as within level 1, that are either directly or indirectly observable;– Level 3: based on inputs which are not based on observable market data.
Based on this hierarchy, financial instruments measured at fair value can be detailed as follows:
30 June 2018 MUSD Level 1 Level 2 Level 3
Assets
Other shares and participations – – –
Derivative instruments – non-current – 42.7 –
Derivative instruments – current – 31.7 –
– 74.4 –
Liabilities
Derivative instruments – non-current – 9.6 –
Derivative instruments – current – 3.0 –
– 12.6 –
31 December 2017 MUSD Level 1 Level 2 Level 3
Assets
Other shares and participations 6.3 – –
Derivative instruments – non-current – 26.5 –
Derivative instruments – current – 7.7 –
6.3 34.2 –
Liabilities
Derivative instruments – non-current – 3.1 –
Derivative instruments – current – 6.4 –
– 9.5 –
There were no transfers between the levels during the reporting period.
The fair value of the financial assets is estimated to equal the carrying value. The fair value of the derivative instruments is calculated using the forward interest rate curve and the forward exchange rate curve respectively for the interest rate swap and the currency hedging contracts. The hedge counterparties are all banks which are party to the loan facility agreement.

Parent Company Income Statement
22
Expressed in MSEK
1 Jan 2018- 30 Jun 2018
6 months
1 Apr 2018- 30 Jun 2018
3 months
1 Jan 2017- 30 Jun 2017
6 months
1 Apr 2017- 30 Jun 2017
3 months
1 Jan 2017- 31 Dec 2017
12 months
Revenue 8.3 1.0 4.5 3.5 9.4
General and administration expenses -66.8 -39.6 -47.6 -17.0 -146.7
Operating profit/loss -58.5 -38.6 -43.1 -13.5 -137.3
Net financial items
Finance income 1,720.9 1,716.2 46,544.5 46,544.2 46,786.4
Finance costs -0.2 – -0.5 – -0.5
1,720.7 1,716.2 46,544.0 46,544.2 46,785.9
Profit/loss before tax 1,662.2 1,677.6 46,500.9 46,530.7 46,648.6
Income tax – – – – –
Net result 1,662.2 1,677.6 46,500.9 46,530.7 46,648.6
Parent Company Comprehensive Income Statement
Expressed in MSEK
1 Jan 2018- 30 Jun 2018
6 months
1 Apr 2018- 30 Jun 2018
3 months
1 Jan 2017- 30 Jun 2017
6 months
1 Apr 2017- 30 Jun 2017
3 months
1 Jan 2017- 31 Dec 2017
12 months
Net result 1,662.2 1,677.6 46,500.9 46,530.7 46,648.6
Other comprehensive income – – – – –
Total comprehensive income 1,662.2 1,677.6 46,500.9 46,530.7 46,648.6
Attributable to: Shareholders of the Parent Company 1,662.2 1,677.6 46,500.9 46,530.7 46,648.6
1,662.2 1,677.6 46,500.9 46,530.7 46,648.6

Parent Company Balance Sheet
23
Expressed in MSEK 30 June 2018 31 December 2017
ASSETS
Non-current assets
Shares in subsidiaries 55,118.9 55,118.9
Other tangible fixed assets 0.1 –
Total non-current assets 55,119.0 55,118.9
Current assets
Receivables 6.4 7.5
Cash and cash equivalents 33.4 4.8
Total current assets 39.8 12.3
TOTAL ASSETS 55,158.8 55,131.2
SHAREHOLDERS´EQUITY AND LIABILITIES
Shareholders´ equity including net result for the period 55,125.2 54,936.6
Non-current liabilities
Provisions 0.5 0.6
Total non-current liabilities 0.5 0.6
Current liabilities
Current liabilities 33.1 194.0
Total current liabilities 33.1 194.0
Total liabilities 33.6 194.6
TOTAL EQUITY AND LIABILITIES 55,158.8 55,131.2
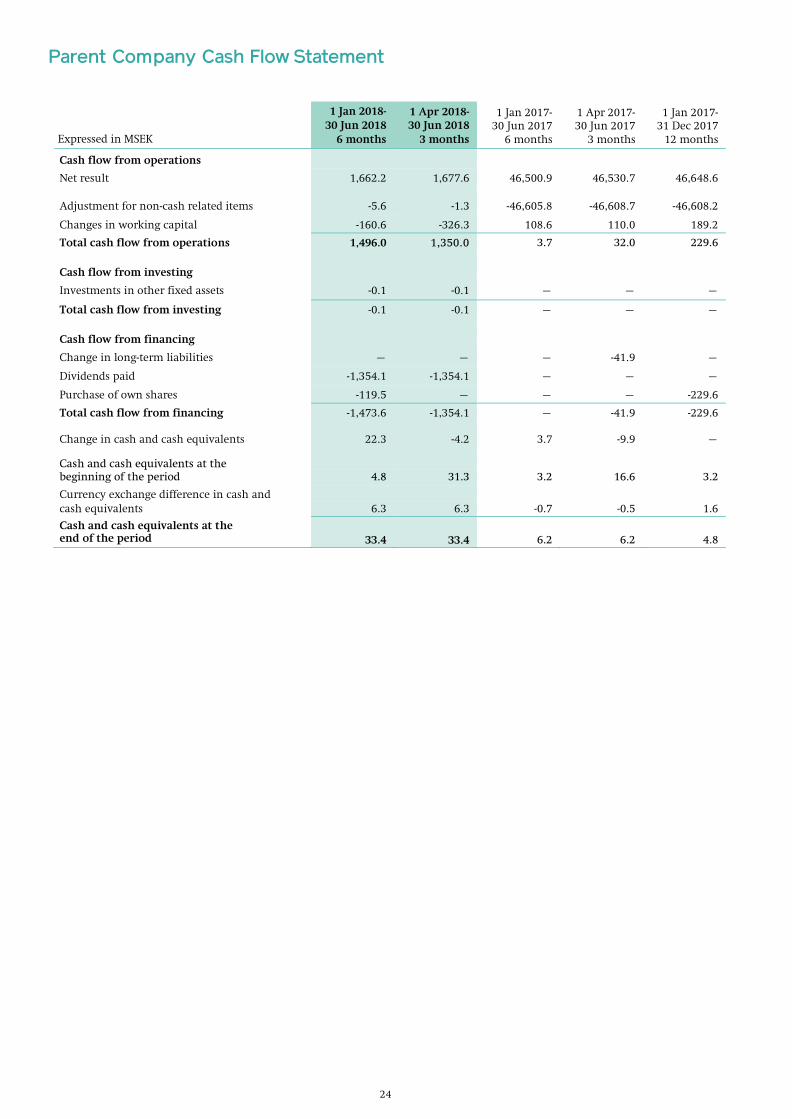
Parent Company Cash Flow Statement
24
Expressed in MSEK
1 Jan 2018- 30 Jun 2018
6 months
1 Apr 2018- 30 Jun 2018
3 months
1 Jan 2017- 30 Jun 2017
6 months
1 Apr 2017- 30 Jun 2017
3 months
1 Jan 2017- 31 Dec 2017
12 months
Cash flow from operations
Net result 1,662.2 1,677.6 46,500.9 46,530.7 46,648.6
Adjustment for non-cash related items -5.6 -1.3 -46,605.8 -46,608.7 -46,608.2
Changes in working capital -160.6 -326.3 108.6 110.0 189.2
Total cash flow from operations 1,496.0 1,350.0 3.7 32.0 229.6
Cash flow from investing
Investments in other fixed assets -0.1 -0.1 – – –
Total cash flow from investing -0.1 -0.1 – – –
Cash flow from financing
Change in long-term liabilities – – – -41.9 –
Dividends paid -1,354.1 -1,354.1 – – –
Purchase of own shares -119.5 – – – -229.6
Total cash flow from financing -1,473.6 -1,354.1 – -41.9 -229.6
Change in cash and cash equivalents 22.3 -4.2 3.7 -9.9 –
Cash and cash equivalents at the beginning of the period 4.8 31.3 3.2 16.6 3.2
Currency exchange difference in cash and cash equivalents 6.3 6.3 -0.7 -0.5 1.6
Cash and cash equivalents at the end of the period 33.4 33.4 6.2 6.2 4.8

Parent Company Statement of Changes in Equity
25
Expressed in MSEK
Restricted equity Unrestricted equity
Share capital
Statutory reserve
Other reserves
Retained earnings Dividends Total
Total equity
Balance at 1 January 2017 3.5 861.3 6,828.8 4,519.3 – 11,348.1 12,212.9
Total comprehensive income – – – 46,500.9 – 46,500.9 46,500.9
Transactions with owners
Distributions – – – – -3,695.3 -3,695.3 -3,695.3
Total transactions with owners – – – – -3,695.3 -3,695.3 -3,695.3
Balance at 30 June 2017 3.5 861.3 6,828.8 51,020.2 -3,695.3 54,153.7 55,018.5
Total comprehensive income – – – 147.7 – 147.7 147.7
Transactions with owners
Purchase of own shares – – -229.6 – – -229.6 -229.6
Total transactions with owners – – -229.6 – – -229.6 -229.6
Balance at 31 December 2017 3.5 861.3 6,599.2 51,167.9 -3,695.3 54,071.8 54,936.6
Transfer of prior year dividends – – – -3,695.3 3,695.3 – –
Total comprehensive income – – – 1,662.2 – 1,662.2 1,662.2
Transactions with owners
Distributions – – – – -1,354.1 -1,354.1 -1,354.1
Purchase of own shares – – -119.5 – – -119.5 -119.5
Total transactions with owners – – -119.5 – -1,354.1 -1,473.6 -1,473.6
Balance at 30 June 2018 3.5 861.3 6,479.7 49,134.8 -1,354.1 54,260.4 55,125.2

Key Financial Data
26
Lundin Petroleum discloses alternative performance measures as part of its financial statements prepared in accordance with ESMA’s (European Securities and Markets Authority) guidelines. Lundin Petroleum believes that the alternative performance measures provide useful supplement information to management, investors, security analysts and other stakeholders and are meant to provide an enhanced insight into the financial development of Lundin Petroleums business operations and to improve comparability between periods. Definitions of the performance measures are provided under the key ratio definitions below:
Financial data from continuing operations MUSD
1 Jan 2018- 30 Jun 2018
6 months
1 Apr 2018- 30 Jun 2018
3 months
1 Jan 2017- 30 Jun 2017
6 months
1 Apr 2017- 30 Jun 2017
3 months
1 Jan 2017- 31 Dec 2017
12 months
Revenue and other income 1,370.0 677.1 886.1 464.6 1,997.0
EBITDA1 964.2 507.7 689.3 333.5 1,501.5
Net result 264.8 36.0 204.8 145.6 380.9
Operating cash flow1 967.6 505.8 705.9 340.0 1,530.0
Free cash flow 261.0 89.2 -24.5 -52.0 203.7
Data per share from continuing operations USD
Shareholders’ equity per share -0.64 -0.64 -1.24 -1.24 -1.03
Operating cash flow per share 2.86 1.49 2.07 1.00 4.50
Cash flow from operations per share 2.38 1.20 1.77 0.77 3.82
Earnings per share 0.78 0.10 0.61 0.43 1.13
Earnings per share fully diluted 0.78 0.11 0.61 0.43 1.13
EBITDA per share 2.85 1.50 2.03 0.98 4.41
EBITDA per share – fully diluted 2.84 1.50 2.02 0.98 4.40
Number of shares issued at period end 340,386,445 340,386,445 340,386,445 340,386,445 340,386,445
Number of shares in circulation at period end 338,513,135 338,513,135 340,386,445 340,386,445 339,153,135
Weighted average number of shares for the Period 338,672,675 338,513,135 340,386,445 340,386,445 340,237,772
Weighted average number of shares for the period fully diluted 339,709,098 339,549,557 341,682,882 341,628,882 341,380,316
Share price
Share price at period end in SEK 285.70 285.70 162.10 162.10 187.80
Share price at period end in USD2 31.86 31.86 19.19 19.19 22.88
Key ratios from continuing operations
Return on equity (%)3 – – – – –
Return on capital employed (%) 25 16 10 4 22
Net debt/equity ratio (%)3 – – – – –
Equity ratio (%) -4 -4 -11 -11 -6
Share of risk capital (%) 27 27 6 6 17
Interest coverage ratio 17 22 5 4 6
Operating cash flow/interest ratio 19 21 10 10 12
Yield 1 1 6 6 5
1 Excludes the reported after tax accounting loss in 2017 of MUSD 14.4 on the divestment of a 39 percent working interest in the Brynhild field.
2 Share price at period end in USD is calculated based on quoted share price in SEK and applicable SEK/USD exchange rate as per period end.
3 As the equity at 30 June 2018, 31 December 2017 and 30 June 2017 is negative, these ratios have not been calculated.

Key Ratio Definitions
27
EBITDA (Earnings Before Interest, Taxes, Depreciation and Amortisation): Operating EBITDA (Earnings Before Interest, Taxes, Depreciation and Amortisation): Operating profit before depletion of oil and gas properties, exploration costs, impairment costs, depreciation of other tangible assets and gain on sale of assets.
Operating cash flow: Revenue less production costs and less current taxes.
Free cash flow: Cash flow from operating activities less cash flow from investing activities in accordance with the consolidated statement of cash flow.
Shareholders’ equity per share: Shareholders’ equity divided by the number of shares in circulation at period end.
Operating cash flow per share: Operating cash flow divided by the weighted average number of shares for the period.
Cash flow from operations per share: Cash flow from operating activities in accordance with the consolidated statement of cash flow divided by the weighted average number of shares for the period.
Earnings per share: Net result attributable to shareholders of the Parent Company divided by the weighted average number of shares for the period.
Earnings per share fully diluted: Net result attributable to shareholders of the Parent Company divided by the weighted average number of shares for the period after considering any dilution effect.
EBITDA per share: EBITDA divided by the weighted average number of shares for the period.
EBITDA per share fully diluted: EBITDA divided by the weighted average number of shares for the period after considering any dilution effect.
Weighted average number of shares for the period: The number of shares at the beginning of the period with changes in the number of shares weighted for the proportion of the period they are in issue.
Weighted average number of shares for the period fully diluted: The number of shares at the beginning of the period with changes in the number of shares weighted for the proportion of the period they are in issue after considering any dilution effect.
Return on equity: Net result divided by average total equity.
Return on capital employed: Income before tax plus interest expenses plus/less currency exchange differences on financial loans divided by the average capital employed (the average balance sheet total less non-interest bearing liabilities).
Net debt/equity ratio: Bank loan less cash and cash equivalents divided by shareholders’ equity.
Equity ratio: Total equity divided by the balance sheet total.
Share of risk capital: The sum of the total equity and the deferred tax provision divided by the balance sheet total.
Interest coverage ratio: Result after financial items plus interest expenses plus/less currency exchange differences on financial loans divided by interest expenses.
Operating cash flow/interest ratio: Revenue less production costs and less current taxes divided by the interest expense for the period.
Yield: dividend per share in relation to quoted share price at the end of the period.
Board Assurance
28
The Board of Directors and the President and CEO certify that the financial report for the six months ended 30 June 2018 gives a fair view of the performance of the business, position and profit or loss of the Company and the Group, and describes the principal risks and uncertainties that the Company and the companies in the Group face.
Stockholm, 31 July 2018
Ian H. Lundin Chairman
Alex Schneiter President and CEO Peggy Bruzelius
C. Ashley Heppenstall Lukas H. Lundin Torstein Sanness
Grace Reksten Skaugen Jakob Thomasen Cecilia Vieweg

29
Review Report
We have reviewed this report for the period 1 January 2018 to 30 June 2018 for Lundin Petroleum AB (publ). The board of directors and the President and CEO are responsible for the preparation and presentation of this interim report in accordance with IAS 34 and the Swedish Annual Accounts Act. Our responsibility is to express a conclusion on this interim report based on our review.
We conducted our review in accordance with the Swedish Standard on Review Engagements ISRE 2410, Review of Interim Report Performed by the Independent Auditor of the Entity. A review consists of making inquiries, primarily of persons responsible for financial and accounting matters, and applying analytical and other review procedures. A review is substantially less in scope than an audit conducted in accordance with International Standards on Auditing, ISA, and other generally accepted auditing standards in Sweden. The procedures performed in a review do not enable us to obtain assurance that we would become aware of all significant matters that might be identified in an audit. Accordingly, we do not express an audit opinion.
Based on our review, nothing has come to our attention that causes us to believe that the interim report is not prepared, in all material respects, in accordance with IAS 34 and the Swedish Annual Accounts Act, regarding the Group, and with the Swedish Annual Accounts Act, regarding the Parent Company.
Stockholm, 31 July 2018
PricewaterhouseCoopers AB
Johan Rippe Johan Malmqvist Authorised Public Accountant Authorised Public Accountant Lead Partner

Financial Information
30
The Company will publish the following reports:
• The nine month report (January – September 2018) will be published on 7 November 2018.• The year end report (January – December 2018) will be published on 31 January 2019.• The three month report (January – March 2019) will be published on 2 May 2019.
The AGM will be held on 29 March 2019 in Stockholm, Sweden.
For further information, please contact:
Definitions and abbreviations An extensive list of definitions can be found on www.lundin-petroleum.com under the heading “Definitions”.
EBITDA Earnings Before Interest, Tax, Depreciation and Amortisation CAD Canadian dollar CHF Swiss franc EUR Euro NOK Norwegian krona RUR Russian rouble SEK Swedish krona USD US dollar TSEK Thousand SEK TUSD Thousand USD MSEK Million SEK MUSD Million USD
Oil related terms and measurements boe Barrels of oil equivalents boepd Barrels of oil equivalents per day bopd Barrels of oil per day Mbbl Thousand barrels Mboe Thousand barrels of oil equivalents Mboepd Thousand barrels of oil equivalents per day Mbopd Thousand barrels of oil per day Mcf Thousand cubic feet
Alex Budden Sofia Antunes Robert Eriksson VP Communications &
Investor Relations Investor Relations Officer
Tel: +41 795 23 60 75 Manager Media Communications
Tel: +46 701 11 26 15 Tel: +41 22 595 10 19 [email protected] [email protected]

31
This information is information that Lundin Petroleum AB is required to make public pursuant to the EU Market Abuse Regulation and the Securities Markets Act. The information was submitted for publication, through the contact persons set out above, at 07.30 CEST on 31 July 2018.
Forward-Looking Statements Certain statements made and information contained herein constitute "forward-looking information" (within the meaning of applicable securities legislation). Such statements and information (together, "forward-looking statements") relate to future events, including the Company's future performance, business prospects or opportunities. Forward-looking statements include, but are not limited to, statements with respect to estimates of reserves and/or resources, future production levels, future capital expenditures and their allocation to exploration and development activities, future drilling and other exploration and development activities. Ultimate recovery of reserves or resources are based on forecasts of future results, estimates of amounts not yet determinable and assumptions of management. All statements other than statements of historical fact may be forward-looking statements. Statements concerning proven and probable reserves and resource estimates may also be deemed to constitute forward-looking statements and reflect conclusions that are based on certain assumptions that the reserves and resources can be economically exploited. Any statements that express or involve discussions with respect to predictions, expectations, beliefs, plans, projections, objectives, assumptions or future events or performance (often, but not always, using words or phrases such as "seek", "anticipate", "plan", "continue", "estimate", "expect", "may", "will", "project", "predict", "potential", "targeting", "intend", "could", "might", "should", "believe" and similar expressions) are not statements of historical fact and may be "forward-looking statements". Forward-looking statements involve known and unknown risks, uncertainties and other factors that may cause actual results or events to differ materially from those anticipated in such forward-looking statements. No assurance can be given that these expectations and assumptions will prove to be correct and such forward-looking statements should not be relied upon. These statements speak only as on the date of the information and the Company does not intend, and does not assume any obligation, to update these forward-looking statements, except as required by applicable laws. These forward-looking statements involve risks and uncertainties relating to, among other things, operational risks (including exploration and development risks), productions costs, availability of drilling equipment, reliance on key personnel, reserve estimates, health, safety and environmental issues, legal risks and regulatory changes, competition, geopolitical risk, and financial risks. These risks and uncertainties are described in more detail under the heading “Risks and Risk Management” and elsewhere in the Company’s annual report. Readers are cautioned that the foregoing list of risk factors should not be construed as exhaustive. Actual results may differ materially from those expressed or implied by such forward-looking statements. Forward-looking statements are expressly qualified by this cautionary statement.
Corporate Head OfficeLundin Petroleum AB (publ)Hovslagargatan 5SE-111 48 Stockholm, SwedenT +46-8-440 54 50F +46-8-440 54 59E [email protected] lundin-petroleum.com