Embed Size (px)
Citation preview

Report No. 1638a-INF EIndonesia ~FILE COPYIndonesia
Perusahaan Umum Listrik NegaraAppraisal of the Seventh Power ProjectJanuary 19, 1978
Projects DepartmentEast Asia and Pacific Regional Office
FOR OFFICIAL USE ONLY
Document of the World Bank
This document has a restricted distribution and may be used by recipientsonly in the performance of their official duties, Its contents may nototherwise be disclosed without World Bank authorization.
Pub
lic D
iscl
osur
e A
utho
rized
Pub
lic D
iscl
osur
e A
utho
rized
Pub
lic D
iscl
osur
e A
utho
rized
Pub
lic D
iscl
osur
e A
utho
rized

CURRENCY EQUIVALENTS
US$1 = Indonesian Rupiah (Rp) 415Rp 100 = US$0.241Rp 1 million = US$2,410
UNITS AND EQUIVALENTS
1 metric ton = 1,000 kilograms (kg)1 liter (1) = 0.0063 barrels1 kilometer (km) = 0.6215 miles (mi)1 kilovolt (kV) = 1,000 volts (V)1 megavolt-ampere (MVA) = 1,000 kilovolt-amperes (kVA)1 kilovolt-ampere (kVA) = 1,000 volt-amperes (VA)1 megawatt (MW) = 1,000 kilowatts (kW)1 gigawatt hour. (GWh) = 1 million kilowatt hours (kWh)
ABBREVIATIONS AND ACRONYMS
AID - Agency for International DevelopmentAPBN - Anggaran Pendapatan dan Belanja
Negara (Final Total Budget)BAPPENAS - National Planning AgencyBVI - Black and Veatch International
(Engineering Consultants)c.i.f. - Cost, Insurance and Freight (International
Shipping Clause)DIP - Daftar Isian Projek (Final Budget Shares of
the various Government Departments)Distribusi - PLN's Distribution Regions on JavaDIJP - Daftar Usulan Projek (Budget Proposal)EHV - Extra High VoltageEPA - Environmental Protection AgencyGNP - Gross National Product
HSD - High Speed Diesel OilIAEA - International Atomic Energy AuthorityIDO - Industrial Diesel OilIERR - Internal Economic Rate of ReturnLCF - Labor Conversion FactorLRMC - Long Run Marginal CostsMONENCO - Montreal Engineering CompanyPCR - Preece, Cardew and Rider (Engineering
Consultants)PERTAMINA - National Oil CompanySCF - Standard Conversion FactorSOFRELEC - French Engineering and Management ConsultantsWilayah - PLN's Operational Region
PLN'S FISCAL YEARS (FY)
1971-1973 - January 1 - December 311975 onwards - April 1 - March 31

INDONESIA FOR OFFICIAL USE ONLY
PERUSAHAAN UMUM LISTRIK NEGARA (PLN)
Appraisal of the Seventh Power Project
TABLE OF CONTENTS
Page No.
SUMMARY AND CONCLUSION . . . ........ . i-
1. INTRODUCTION . . . . . . 1
2. THE POWER SECTOR.. . . . . . . . 2
Background ... 2Existing Public Power Facilities . . . . . . . . . . 2Energy Resources ... 3The Power Market . . . . . . . . . . . . . . . . . . 3Sector Development . .. . . . . 5
3. THE BENEFICIARY.. . . . 7
Background . . . . . .. . . . . 7Legal Status and Responsibilities . . . . . . . . . . 7Organization and Management . . . . . . . . . . . . . 8Performance Under Earlier Bank Operations . . . . . . 9
4. THE PROJECT . . ; ... 10
Description of the Project . . . . . . . . . . . . . 10Cost Estimate .. 11Amount and Term of the Loan . . . . . . . . . . . . . 13Procurement . . . . . . . . . . . . . . . . . . . . . 13Disbursement ... 13Engineering and Construction . . . . . . . . . . . . 13Ecology ... 14
5. JUSTIFICATION . . . . . . . . . . . . . . . . . . . . . 15
Demand Forecast .. 15Least Cost Solution.. . 15Internal Economic Rate of Return . . . . . . . . . . 15
6. FINANCIAL ASPECTS . . . . . . . . . . . . . . . . . . . 16
Past Performance . .16
Financial Targets After Recovery .. 17Financing Plan . . . . .. 18
This report was prepared by Messrs. K. Stichenwirth, C.K. Chandran andM. Munasinghe and is based on information obtained during missions toIndonesia in March and August 1977.
This document has a restricted distribution and may be used by recipients only in the performanceof their official duties. Its contents may not otherwise be disclosed without World Bank authorization.

Page No.
Corporate Income Tax ... . . . . . . . . . . . . . 19Subsidiary Loan . . . . . . . . . . . . . . . . . . 19Audit .... . . . . . . . . . . . . . . . . . . . . 19Insurance . . . . . . . . . . . . . . . . . . . . . . 20Tariffs .... . . . . . . . . . . . . . . . . . . . 20
7. AGREEMENTS REACHED AND RECOMMENDATION . . . . . . . . . 21
ANNEXES
1. Page 1 - Actual and Forecast Power Generation (Including Purchases)and Sales 1971-1985/86
Page 2 - Java - Growth of Generation, Sales, Peak Demand and DependableCapacity
2. Comparative Forecasts of Annual Generation (GWh)
3. Summary of Legislation Affecting PLN
4. Training
5. Project Cost Estimate
6. Project Implementation Schedule
7. Estimated Schedule of Disbursements
8. Page 1 - Internal Economic Rate of ReturnPage 2 - Long-Run Marginal Cost of Electric Energy
9. Forecast Capital Expenditures
10. Financial Data
MAPS
IBRD 12435 R IIBRD 12453 R

INDONESIA
PERUSAHAAN UMUM LISTRIK NEGARA (PLN)
Appraisal of the Seventh Power Project
SUMMARY AND CONCLUSION
1 l. This report covers the appraisal of a power generation project
for Perusahaan Umum Listrik Negara (PLN), the national power company of
Indonesia charged with the responsibility for power generation, transmission
and distribution throughout the country. The proposed project includes the
third, oil-fired thermal power unit (200 MW) at the Semarang Harbor power
station in Central Java, associated transmission lines (121 km) and substations,
consulting services for engineering and procurement of major equipment for a
dual-fired (oil and coal) thermal power station in West Java (Suralaya), and
consulting services for a feasibility study and site investigations of a new
dual-fired thermal power plant site in East Java.
2. The Semarang no. 3 unit will primarily serve the Central Java area
where additional generating capacity is most urgently needed. It will also
be most favorably located to meet the requirements of Java since Central Java
will be interconnected with the western and eastern areas by 1981. This
interconnection, at 150 kV, would be sufficient for satisfactory operation of
Semarang no. 3 unit.
3. The engineering services for the dual-fired Suralaya and East Java
power stations are a consequence of the Government's decision to diversify
the pattern of utilization of the country's energy resources. Engineering
services must commence in 1978 to permit commissioning of the first two units
of the Suralaya plant in 1984 when they are required to meet expected
system demand.
4. The total cost of the project is estimated at US$161.5 million
equivalent, of which US$112.0 million represent the foreign exchange component.
A Bank loan of US$109 million equivalent is proposed covering the total
foreign exchange cost with the exception of those engineering services
(US$3.0 million) which were included in Loan 1365-IND.
5. The project cost estimate for the Semarang unit no. 3, including
transmission, was prepared by PLN with consultants' help. It is based on
bid prices recently obtained for equipment for similar units (Muara Karang 4
and 5) as well as transmission equipment. Physical contingencies of 5% on
the total cost of the generation unit and tranmission equipment, and 10% on
the civil works for transmission lines and substations have been included.
Price contingencies of 35% overall have been provided to allow for future
price increases.
6. Procurement under the proposed loan will be on the basis of inter-
national competitive bidding in accordance with the Bank's Guidelines. Some
Participation by Indonesian manufacturers is envisaged, in which case a 15%
margin of preference on the c.i.f. price, or the prevailing duties, if lower,

will be applicable for purposes of bid evaluation. Over the past several
years, Indonesia has developed local construction industries capable of
performing civil works construction similar to that required for the proposedproject. One such contractor is performing satisfactorily on the Bank-financed
Muara Karang project. Consequently, the documents for the proposed loanprovide for the 7.5% preference in bid evaluation for domestic civil works
contractors for which Indonesia qualifies on the basis of its low GNP percapita level.
7. Independent reviews by two consulting firms confirm that the growth
opportunities of PLN's market are large, particularly in the industrial
sector where many captive generating plants exist. It is estimated that PLNis presently serving only about 50% of the underlying demand. Consequently,PLN's annual growth rates during the next several years are entirely afunction of its capability to provide increased power service. It is esti-mated that PLN will be able to attain average annual growth rates of about16% to 22% per year during FY78-83 as it increases its share of the totalmarket to about 80%. After 1983, the growth rates are expected to graduallydecline to about 15% per year.
8. Power sector development in Indonesia, more specifically in the
island of Java which accounts for about 75% of PLN's market, has now reacheda stage where very large investments are required and coordinated systemplanning is essential. Consequently, the assurances given by PLN under Loan1365-IND with respect to system planning have been included in the documentsof the proposed loan. In addition the Government and PLN have agreed to takethe necessary steps to implement the development program as agreed with theBank during annual reviews.
9. The 200 MW Semarang unit no. 3 represents the next step in theleast cost Java system expansion program. It is more economical than the
next best alternative of two 100 MW thermal units at the same location to be
commissioned in FY83 and FY84 for discount rates up to 20%. The i.nternaleconomic rate of return is about 19%.
10. "LN having achieved financial recovery, defined as operatingrevenues covering operating expenses, the documents of the proposed loan now
include conventional financial targets consisting of gradually increasinginternal contributions to investments, minimum debt service coverages andmaximum debt/equity ratios.
11. The average price level for power sales after the next proposedtariff increase will be close to the long run marginal cost level of energysupplied. However, the structure of tariffs needs revision. A new tariffstructure will be designed for implementation not later than April 1, 1979.
12. The proposed project provides a suitable basis for a Bank loanof US$109 million equivalent for a term of 20 years, including 5 years ofgrace. The loan would be made to the Government, which in turn would relendthe funds to PLN on terms equivalent to the Bank loan. However, following

- iii -
preferred public utility practice, the Government would finance interest andcommitment charges during the grace period of the loan.


INDONESIA
PERUSAIAAN TIJUM LISTRIK NEGARA (PLN)
Appraisal of the Seventh Power Project
1. INTRODUCTION
1.01 The Government of Indonesia has requested Bank assistance for a
project consisting of the following elements:
(a) the third, oil-fired thermal power unit (200 MW) at
the Semarang Harbor power station;
(b) associated 150 kV transmission lines (121 km) and
substations;
(c) consulting services for engineering and procurement of major
equipment for a dual (coal/oil) fired thermal power station in
West Java (Suralaya); and
(d) consulting services for a feasibility study and site investigations
for a new dual-fired thermal power plant site in East Java.
1.02 The proposed loan would be the seventh Bank Group operation in the
power sector with PLN the beneficiary in all cases. Credits 165 and 334 and
Loan 1259-IND were made to help finance a large distribution rehabilitation
and expansion program in the Jakarta and West Java areas. The third credit
(399-IND) and Loans 1127 and 1365-IND are financing part of the foreign
exchange cost of the five oil-fired generating units at the Muara Karang
steam power station (3 x 100 MW and 2 x 200 MW) on the outskirts of Jakarta.
1.03 In its power lending operations the Bank has been promoting a
balanced program between generation and distribution which is important for
the development of an organized power system. Furthermore, it has provided
funds for extensive engineering and management consulting services as well
as training of PLN's personnel. These efforts, on balance, have been
successful and the progress achieved is encouraging.
1.04 This report was prepared by Messrs. K. Stichenwirth, C.K. Chandran
and M. Munasinghe and is based on information obtained during missions to
Indonesia in March and August 1977.

- 2 -
2. THE POWER SECTOR
Background
2.01 The public power sector is synonymous with PLN, a Government-ownedenterprise statutorily responsible for all generation, transmission anddistribution of electricity in the country. Despite PLN's exclusive respon-sibilities for electricity supply, companies and individuals have beenallowed to install generating stations for their own use when PLN wasnot able to meet the demand. Partly due to inadequate and unreliable publicpower supply in the past and because of the country's economic growth, muchof the power demand increase was satisfied by these small, private dieselgenerating stations. They now account for about half of the country's totalcapacity, representing uneconomic investments at high capital and operatingcosts. PLN's major programs of distribution, rehabilitation and expansionhave, however, just begun to take effect. During 1977-82 economic newgenerating capacity will also be added. PLN's large generating stations areexpected to gradually take over the developed market outside PLN's presentscope of supply and meet the bulk of future overall growth. PLN has thusreached the take-off stage of development.
Existing Public Power Facilities
2.02 PLN's total installed generating capacity at the end of FY77 was1,502 MW./1 It comprises 30% hydro, 17% steam, 22% diesel and 31% gasturbine capacity. The island of Java accounts for about 75% of PLN's supplywith the bulk of captive generating plant also located there. Java has threepresently isolated power systems - West, Central and East; their present andfuture installed capacity is given in the table below:
Installed Generating Capacity (MW)
West Java Central Java East Java TotalType 1977 1982 1977 1982 1977 1982 1977 1982
Hydro 216 255 40 68 152 206 408 529Steam 150 850 - 100 50 250 200 1,200Gas Turbine 280 460 34 94 26 66 340 620Diesel 10 - 29 - 18 - 57 -
Total 656 1,565 103 262 246 522 1,005 2,349
2.03 The attached map no. 12435R1 shows the existing 150 kV system andthe major extensions committed and under construction. The West and CentralJava systems will be interconnected by 1980 and East Java by 1981, to form anall-Java Grid. The distances involved, however, will limit interregional
/1 This includes the 125 MW Juanda hydro plant owned by the JatiluhurAuthority from which PLN purchases the output.

3-
power transfers to about 100 MW. More effective higher voltage interconnection
at either 400 kV or 500 kV is therefore planned for the mid-eighties.
Energy Resources
2.04 Indonesia has several alternative energy resources - hydroelectric,
oil, natural gas, coal and geothermal. The country depended largely on
hvdroelectric resources in the initial stage of development of its electricity
£ )ply; it is now predominantly oil based.
2.05 The hydroelectric potential is estimated at 31,000 MW, of which
only 2,500 MW is in Java, the main load center. Present utilization is 1.5%.
Wi 1 a few exceptions, unfavorable location of potential hydroelectric sites,
th. nondependable capacity value, particularly of projects associated with
ir-. gation, and long gestation periods limit hydroelectric development in the
near future.
2.06 A 30 MW pilot geothermal plant is to be set up in Java in collabor-
ation with New Zealand; if successful, it could lead to commercial developments
of an important nonfuel energy source in Java, Sumatra and Sulawesi.
2.07 The country has large reserves of oil and natural gas. Intensive
explorations are being carried out to assess the total oil potential. Proven
crude oil reserves are about 15 billion barrels. Current production is about
1.7 million barrels per day.
2.08 Indonesia has large gas reserves. Annual production is about
200 trlion cubic meters, used mainly for domestic production of fertilizer
and petrochemicals. Its use for export as liquified natural gas is being
increaFnd. This source will be available for electricity production only
where it is surplus to other users.
2.09 Indonesia's coal reserves are estimated at about 1.2 billion tons,
85% of which are in Sumat.a and 10% in Kalimantan. Actual coal prc uction
has declined from about 2.0 million tons per year in 1940 to about 0.25 million
tons per year, but recent oil price increases have spurred efforts by the
Government to develop the cointry's coal resources. The Bank is considering
n engineering loan designed to prepare an integrated coal mine and land/sea
cransportation project which would provide coal for the planned Suralaya
team plant in West Java. The proposed loan includes funds for financing
A ltailed igineering of the Suralaya plant (para 4.06).
I e Power Market
2.10 Several attempts have been made in recent years to prepare a
usable demand forecast for Indonesia. This has been difficult because of
lo consump ion levels and a background of public power supply which covered

- 4 -
only a fraction of the total market (para. 2.01). Furthermore, severerestrictions on PLN's ability to supply including financial, management andtechnical constraints made PLN's past record of sales an exceedingly unreliablebase for future projections. In 1973, a consultant, Chas. T. Main of the USA,applied an indirect method of using growth probabilities in selected sensitiveeconomic sectors and their probable impact on other sectors. A more directdetailed assessment of the underlying /1 demand in Java was made during 1974-76by Preece, Cardew and Rider (PCR) of the UK as a part of the Bank financedcomprehensive Java System Development Study (Credit 399-IND). This studyquantified the effects of restrictions on supply during peak hours, lowvoltage, self-generation and PLN's waiting lists. PCR's projections up to1995 based on the underlying demand are given in Annex 2.
2.11 Realizing that PLN's sales would not immediately rise to the levelsof the underlying demand and that a certain portion of this market willcontinue to be met indefinitely by captive installations, PCR also indicatedwhat it considered realistic targets of sales on which PLN could base itsfuture development program. This lower forecast is also shown in Annex 2.It is substantially lower than the underlying high market forecast, but ofthe same order of magnitude as an independent macro estimate which usedper capita GNP projections/2. These studies show that PLN's future sales, inthe short and medium term, will depend entirely on the rate at which PLN iscapable of satisfying an increasing proportion of the existing demandwhereas, in the long term, they are expected to reflect more closely thegrowth of the power market based on the overall level of economic develop-ment.
2.12 In 1976, PLN and the Bank accepted the PCR low forecast as areasonable basis for planning PLN's long-term development program (para. 2.14).Based on this, a comprehensive, optimized program of generation andtransmission expansion was prepared by PCR. It was felt, however, that thisprogram should be jointly reviewed by PLN and the Bank and modified annuallyto ensure that in the short and medium term, it is consistent with PLN'sactual development of generation, transmission and distribution facilities,and with the growth of sales. The latest such forecast of PLN's sales, madein August 1977, is indicated in Annex 1. It is about 20% lower than PCR'slow forecast in 1983 but catches up with it by about 1990. Accordingly,growth rates between 1978-1983 are expected to increase from about 16% toabout 22% per year while PLN increases its share of the total market fromabout 50% to about 80%; thereafter growth is expected to gradually decline toabout 15% per year.
/1 The demand PLN would have served if its installations had been adequateand all self-supplied installations had been served by PLN.
/2 By the International Atomic Energy Authority in 1976.

-5-
Sector Development
2.13 The main sector objectives at this stage are:
(a) on the organizational side, to ensure that PLN expands itssales in step with the growth of its generation, transmission anddistribution facilities; and
(b) on system planning, to ensure the lowest possible future cost ofsupply.
PLN's system is currently characterized by extremely high costs, due both toits widely spread out and fragmented systems, inefficient operations and thead hoc approach in the past to system expansion.
2.14 PLN's planning capabilities, particularly in system planning, havebeen inadequately developed in the past leading to imbalances between gener-ation, transmission and distribution facilities. Power sector development inJava is now reaching the stage where very large investments are required andcoordinated system planning for the whole island is essential. Recognizingthe need for balanced development of generation, transmission and distribution,the following agreements were reached in connection with Loan 1365-IND and,with the addition of the requirement to take the necessary steps for implemen-tation of the development program (subparagraph (b)), have been repeated inthe loan documents:
(a) PLN will adopt the lower forecast of the Java System DevelopmentStudy as a guideline for power development in Java until FY86/87;
(b) PLN will review annually with the Bank the potential changes inthe load growth and the variations of its development program forJava that are required as a result of such changes and it will takethe necessary steps to implement the program as annually reviewedwith the Bank; and
(c) PLN will review annually with the Bank its investment budget forthe next fiscal year before final Government approval. Thisenables the Bank to express its views on the priorities assignedto the investments included in the budgeL and on the resultingbalance among genieratioi, transmission and distribution inveitlnt-s
2.15 A generation development program for FY78-87 has been prepared byPLN (Annex 1, page 2, and Annex 9) and submitted to the Government in August1977. This program is based mainly on the most economic projects outlined inthe PCR study, rescheduled to take into account likely commissioning datesand the latest demand forecast (para. 2.12). An understanding was obtainedfrom Government and PLN that this program will be used to plan PLN'sfuture investment during FY78-87 and, in particular, to initiate the prepar-atory steps which are required for timely implementation of the projects inthe program. This program will be annually reviewed with the Bank.

-6-
2.16 As mentioned above (para. 2.11), the increase in PLN's marketshare will depend on its capability to supply and, consequently, on the rateat which it connects new customers. It is important, therefore, that PLNadopt an aggressive marketing policy, an essential component of which is theconnection policy. PLN has therefore agreed during negotiations to submitannually to the Bank for review its customer connection program for thefollowing fiscal year and, subsequently, shall implement the program in amanner satisfactory to the Bank.
2.17 PLN's system losses, currently of the order of 25%, are high; thefigure has not changed significantly since the early seventies. Althoughthese losses are expected to fall to about 21% by FY85/86, more comprehensivemetering than presently used and efficient monitoring of all losses in genera-tion, transmission and distribution on a detailed basis is essential to ensuremaximum possible improvement. PLN has prepared a detailed program of improve-ment of metering and action to reduce these losses, together with morecomprehensive monitoring systems. This program was reviewed during negotia-tions and performance targets agreed. Further reviews will be made from timeto time to agree on specific regional targets as well as targets for elec-tricity generation, transmission and distribution.
2.18 The necessity for PLN to develop capabilities to evolve optimumdevelopment programs was discussed with PLN during appraisal. PLN is in theprocess of strengthening the existing system planning unit. Among otherresponsibilities this unit will be in charge of updating annually PLN'soptimal generation and transmission programs on the basis of PLN's actualperformance in reaching its sales targets.

-7-
3. THE BENEFICIARY
Background
3.01 Although created in 1965, PLN's corporate existence is based onthe 1972 Electricity Act which was issued as Presidential Decree No. 18/1972(Annex 3). In addition, a number of decrees interpret or amend the basic Act.They are not only used to clarify issues not sufficiently treated in the existinglaws but also to regulate managerial and operational responsibilities.
3.02 The Electricity Act, drafted with the assistance of SOFRELEC,PLN's management and distribution engineering consultant, originally aimedat creating an autonomous public utility which would have been fully respon-sible for all its activities. This was considered important because PLNfunctioned as a Government agency reporting to the Directorate General ofElectric Power, a Department of the Ministry of Public Works and ElectricPower. PLN's responsibilities were ill-defined and, in fact, consisted onlyof those for day to day operations. Important matters such as systemplanning, construction, procurement and finance were the responsibility ofthe Directorate General, relegating PLN's management to a secondary role.
3.03 However, during the discussions on the Act it became clear thatthe Government preferred a partially rather than fully autonomous entitysince total autonomy would have been inconsistent with its policy of con-trolling important sectors of the economy. Consequently, it was agreedthat the Government would retain responsibility for matters affecting thenational economy, for instance tariffs and approval of investment plans, andit would exercise control over other matters it considers important such asevaluation of bids and decisions on contract awards for investments financedthrough the Government budget. PLN would be charged with the responsibilityfor executing power development, drafting development plans for Governmentapproval and all aspects of operation. The Directorate General of ElectricPower was abolished.
Legal Status and Responsibilities
3.04 PLN is a public enterprise (Perum). It is the executing agencyof the Ministry for power development throughout the country, carrying outits objectives within the National Development Program in accordance withGovernment policies.
3.05 PLN reports to the Ministry of Public Works and Electric Power.The Minister determines its policy and exercises general control over itsactivities. He is assisted by an Advisory Board consisting of the Minis-ters of Finance, Industry, and National Development Planning (Chairman ofBAPPENAS) in making decisions on important matters.
3.06 PLN is responsible for construction and operation of power facil-ities throughout the country, drafting of power development plans, draft-ing of regulations on standardization, safety and licensing of captiveplant, and entering into contracts for purchase or sale of electricity.

- 8 -
It is also in charge of research activities in the field of electric powerand for organizing personnel training. Its draft regulations must beapproved and made public by the Government to gain legal force.
Organization and Management
3.07 PLN's organization comprises three operational levels:
(a) leadership level;
(b) supporting services; and
(c) execution level.
The leadership level, consisting of the management together with the deputydirectorships, is responsible for overall planning and guidance, data col-lection, and central accounting and budgeting. It also maintains contactwith all Government agencies. In the field of construction it reviews thebidding documents and proposes contract awards for major projects. Thesuppotting services consist of the power research center and the trainingcenter. The execution level includes the regional offices which are respon-sible for all activities within their respective areas, including minorconstruction, and the offices for major construction, called Special Projects.Special projects are established as and when the need arises to carry outprojects too large or too important to be handled by the regional offices.
3.08 PLN's management (Board of Directors) consists of a PresidentDirector and at least two other Directors. In addition to the PresidentDirector, there are presently five, responsible for planning, operation,construction, finance and administration (including personnel). The mem-bers of the Board are appointed and dismissed by the President of Indonesiaupon the recommendation of the Minister. They normally serve a five-yearterm, but may be reappointed. The President Director is responsible to theMinister and the Directors report in their respective fields to the PresidentDirector.
3.09 PLN's middle management (deputy directors, and chiefs of regionaloffices and special projects) is appointed by the Minister upon the recom-mendation of the Board of Directors. The deputy directors are responsibleto the directors in their respective fields whereas the regional chiefsreport to the entire Board of Directors.
3.10 The organization scheme is appropriate for delegating theresponsibility for day to day operation and construction implementation tothe regional managers. This is particularly important in the light of thelarge area PLN has to cover and the long distances involved.
- 9 -
3.11 In certain areas, for instance accounting, annual reports andmaintenance of statistics, PLN's performance has improved significantly inrecent years. Project implementation has also improved. However, as pointedout in paragraphs 2.14 and 2.17, PLN has not made sufficient progress inother aspects of operational efficiency and system planning. In future, PLNmust therefore focus its attention particularly on these urgent needs.Steady, but slow progress is expected because of the magnitude of the taskinvolved.
Performance Under Earlier Bank Operations
3.12 In the past the Bank has concentrated on providing funds fora balanced power generation/distribution program in the Jakarta and WestJava area./l Three distribution projects (Credits 165 and 334, and Loan1259-IND) for the rehabilitation and expansion of the distribution facilitiesin the greater Jakarta area and three power generation projects (Credit399, and Loans 1127 and 1365-IND) for the same area were undertaken to helpPLN in commencing the necessary modernization programs in and around thecapital city. The past loans and credits also provided funds for a number ofconsulting services such as the large management consulting effort of SOFRELEC,the Java System Development Study undertaken by Preece, Cardew and Rider(PCR), feasibility studies of the 1,400 MW Saguling hydroelectric project,the West Java dual fired (coal and oil) thermal power project (Suralaya), andthe study for a Java Extra High Voltage Interconnection.
3.13 PLN's performance in implementing the above projects was unevenduring the period 1969 through about 1975. The earlier distributionprojects (Credits 165 and 334-IND) are now expected to be completed abouttwo years behind schedule./2 PLN's overall inexperience in project imple-mentation in the early stages of the projects was as much to blame forthe delay as was the lack of coordination between the Government, morespecifically the city planning department of the municipality of Jakarta, andPLN which made it virtually impossible for the consultants to design adistribution project for ultimate implementation. Similarly, construction ofthe first three 100 MW units at the Muara Karang thermal station (Credit 399and Loan 1127-IND) has fallen behind schedule by about two years. Costoverruns in the wake of the oil crisis and consequent time-consuming problemsin raising the necessary additional funds, a prerequisite for PLN to be ableto let the affected supply contracts, were the main reasons for the delay.
3.14 Project implementation has improved since about 1975 and progress,although still sometimes slow, is encouraging. It is unfortunate that thedelays mentioned in para. 3.13 together with other earlier deficiencies(para. 3.11), the effect of which is now apparent, largely obscure theprogress PLN has actually achieved. Better progress in future is expectedwhen the benefits of earlier projects materialize.
/1 The Bank commitments in the Indonesian power sector so far, excludingthe proposed loan, amount to US$348 million equivalent.
/2 Credit 165-IND is fully disbursed. Since Credits 165 and 334 are con-sidered to finance one project, a completion report will be issuedonly after full disbursement of Credit 334-IND.

- 10 -
4. THE PROJECT
Description of the Project
4.01 The proposed project consists of:
(a) construction of a third oil-fired thermal power unit (200 MW)at the Semarang Harbor power station;
(b) construction of 121 km of 150 kV transmission lines connecting theSemarang Harbor power station to Ungaran, West Semarang andKudus;
(c) construction of two new 150 kV substations at Ungaran andKudus and extension of the existing Semarang Harbor, WestSemarang, Jatingaleh and Solo substations with a total transformercapacity of 150 MVA;
(d) consultants' services for engineering and procurement of majorequipment for a new, dual (coal and oil) fired thermal powerstation in West Java (Suralaya); and
(e) consultants' services for the preparation of a feasibility studyand site investigations for a new dual (coal/oil)-fired thermalpower plant site in East Java.
4.02 At the Semarang Harbor site in Central Java, two 50 MW oil-firedunits presently under construction, are being financed by the Agency forInternational Development (AID) of the United States. Engineering is beingcarried out by Black and Veatch International (BVI) of the USA. These unitswill be commissioned early in 1978. The power station site has been laid outfor convenient extension. The proposed project will add a single, oil-fired,thermal unit of 200 MW at this site during the latter half of 1982. Aprovision of US$3.0 million was made in Loan 1365-IND to cover engineeringand design, including preparation of bid documents and evaluation of bids forthe third unit to ensure its timely implementation, BVI was engaged for thiswork.
4.03 Central Java is presently served by two separate, rapidly expanding,150 kV power systems - the Tuntang in the east and the Ketenger in the west -
and some isolated diesel power stations. They will all be interconnected by1978 on completion of the 150 kV Semarang-Pekalongan line to form the CentralJava grid. The Semarang thermal station, the major energy source in CentralJava, would essentially meet the electricity needs of Central Java, but itstiming and operation would be in the context of the all-Java grid (para. 2.03).During the last few years, a major program of transmission and distributionextensions has been undertaken in Central Java. Therefore, the only trans-mission line extensions which are required to distribute the additionalpower from Semarang Harbor station are those needed to link it to:

- II -
(a) new substations to be built up at Ungaran (which will haveadequate space for expansion and for future interconnection tothe Java EHV line - para. 2.03) and Kudus (a developing centeron the Semarang-Surabaya coastal route, along which a second150 kV Central-East Java tie line is proposed); and
(b) the substation at West Semarang.
The aggregate capacity of step down transformers at the new substations atUngaran and Kudus and for extension of other substations at West Semarang,Jatingaleh and Solo is 150 MVA. These essential transmission lines andsubstations are included in the project.
4.04 Distribution extensions required in Central Java are minimal atthis stage and can be implemented under PLN's normal construction program.
4.05 The third power unit at Semarang Harbor will enable the growth ofdemand in Java to be met until the end of 1983. A new major thermal stationmust therefore be commissioned early in 1984 to meet further growth ofdemand. The Java System Development Study (paras. 2.10-2.12) indicates anumber of economic projects of which the West Java thermal power station(paras. 3.12 and 4.06) is the only one which can be implemented by early1984. It also recommends that this station should use larger unit sizes (upto 500 MW) than those currently under consideration (200 MW), and should bedesigned to use both coal and oil.
4.06 Loan 1127-IND provided for feasibility stage engineering servicesfor the new West Java (Suralaya) thermal plant, in particular for selectionof the site, choice of unit sizes and conceptual design. Montreal EngineeringCompany (MONENCO) of Canada was selected for this assignment. The field workhas been completed and conceptual designs are being prepared. MONENCO hasrecommended a site at Suralaya on the West Coast of Java, across the Sunda Straitfrom Sumatra, and the use of 375 MW sets initially. To meet a commissioningtarget of early 1984, consultants would have to be selected to commence detailedengineering by mid-1978. US$3.0 million have therefore been included in theproposed loan to cover detailed engineering and procurement action up to thestage of evaluation of bids for major equipment.
4.07 PLN's long-term planning for Java calls for developing new powerstation sites on the island. In line with the Government's policy of usingindigenous coal to the extent possible for electricity generation, PLN hasrequested the Bank to finance under the proposed loan the consultants'services for physical investigations of a new site for a dual-fired thermalpower station in East Java. Consequently, an amount of US$1.5 million(foreign exchange cost) is included in the cost estimate for this purpose.
Cost Estimate
4.08 The detailed cost estimate of the Project is given in Annex 5 andsummarized below:

- 12 -
Foreign Local Total Foreign Local Total(in Rp billion) (in US$ million)
A. Semarang No. 3
1. Preliminary civil works - 2.92 2.92 - 7.03 7.03
2. Mechanical and electrical equipment 15.81 1.20 17.01 38.10 2.89 40.993. General construction /a 6.77 1.70 8.47 16.32 4.09 20.414. Engineering and construction
supervision 2.28 0.25 2.53 5.50 0.60 6.105. PLN's administration and management - 1.12 1.12 - 2.70 2.706. Contingencies
(a) Physical 1.13 0.29 1.42 2.72 0.70 3.42(b) Price 8.56 3.47 12.03 20.62 8.37 28.99
Total Semarang Unit No. 3 34.55 10.95 45.50 83.26 26.38 109.64
B. Transmission Lines and Substations1. Land, route survey and foundations - 3.90 3.90 - 9.39 9.392. Material and erection 6.66 1.08 7.74 16.06 2.60 18.663. Engineering and construction
supervision 0.61 0.15 0.76 1.47 0.38 1.854. PLN's administration and management - 0.75 0.75 - 1.80 1.805. Contingencies
(a) Physical 0.33 0.38 0.71 0.80 0.91 1.71(b) Price 2.46 3.10 5.56 5.91 7.47 13.38
Total transmission lines and substations 10.06 9.36 19.42 24.24 22.55 46.79
C. Additional Engineering Services1. West Java Thermal Power Project
(Suralaya) 1.25 0.12 1.37 3.00 0.30 3.30
2. East Java Thermal Power Project 0.62 0.12 0.74 1.50 0.30 1.80
Total Project Cost 46.48 20.55 67.03 112.00 49.53 161.53
/a Covering construction of the power house structure and all other ancillaryelectrical and mechanical equipment.
4.09 The cost estimate for Semarang unit 3 was prepared by PLN with theassistance of BVI. It is based on bid prices recently obtained for similarunits in Muara Karang 4 and 5 (West Java), experience of civil works construc-tion at Muara Karang 1-3 and Semarang 1-2, and bid prices obtained recentlyby PLN for transmission line and substation projects. The prices are net ofcustoms duties since all imports financed from aid funds are exempt frompayment of duties. Physical contingencies have been provided at 5% of the totalcost of Semarang unit 3 and foreign cost of transmission/substations, and 10% of
the local cost (foundations and erection/supervision) of the latter. They arereasonable. Annual price contingencies have been provided at 7.5% (1977-79) and7% (later years) on foreign costs and, on average, 10% on local costs.
13 -
4.10 The specific cost of Semarang no. 3 unit is estimated at US$403 perKW installed at early 1977 price levels and US$548 per KW, including escala-tion up to mid-1983.
Amount and Term of the Loan
4.11 A Bank loan of US$109 million equivalent is proposed. It wouldcover the total foreign exchange cost of the project with the exception ofthe engineering services for Semarang unit no. 3 covered under Loan 1365-IND(US$3.0 million). The loan would be for a term of 20 years, including 5years of grace.
Procurement
4.12 Procurement of materials and equipment under this loan would beon the basis of international competitive bidding in accordance with theBank's guidelines. Some participation by Indonesian equipment manufacturersfor minor equipment items is envisaged, in which case a 15% margin of prefer-ence on the c.i.f. price, or the prevailing duties, if lower, will be appli-cable for purposes of bid evaluation. Documents of the proposed loan willalso include a 7.5% preference in bid evaluation for domestic civil workcontractors for which Indonesia qualifies on the basis of its low per capitaGNP.
Disbursement
4.13 The Bank loan will be disbursed against the following items:
(a) major equipment - 100% of foreign expenditures for directly importedgoods, 95% /1 of the ex-factory cost for locally manufactured goodsand 65%/1 of the total expenditures for imported goods procuredlocally;
(b) general construction:
(i) civil and structural works - 69% of total expenditures(representing the estimated foreign cost)
(ii) ancillary mechanical arid etri-L ecnis - 100% of ror',expenditureb, and
(c) consultants' services lO-OZ of foreign expenditures.
No disbursements will be made for expenditures prior to loan signing. Theclosing date of the loan is December 31, 1983 or such later date as the Bankwill establish.
Engineering and Construction
4.14 As mentioned in paragraph 4.02, BVI will be responsible forengineering design and construction supervision of Semarang 3. Loan 1365-IND
/1 The percentages represent prices net of taxes.
- 14 -
includes funds for consulting services up to the stage of bid evaluationwhereas the proposed loan will include funds mainly for construction super-vision and training of PLN personnel in plant operation. The total consultingeffort is estimated to require 1,074 man-months at a foreign cost ofUS$5.50 million (814 man-months in the home office at a man-month cost ofUS$3,900 and 260 man-months in the field at a man-month cost of US$6,800 plusdirect expenses). The contract would be on a similar basis as that for MuaraKarang units 4 and 5. Bank approval of the contract will be required.
4.15 The estimate for design and engineering of the associated trans-mission system has been made on the basis of 196 man-months at an estimatedforeign cost of US$1.47 million (109 man-months in the home office at a costof US$3,900 per man-month and 87 man-months at a man-month cost of US$6,200plus direct expenses). PLN has asked Bank approval for appointing BVI which wasgranted. The appointment is expected to be made in February 1978.
4.16 Detailed engineering and procurement action, up to evaluationof bids for the major items of equipment for the West Java (Suralaya) thermalstation, is expected to take about a year and involve about 600 man-months ata foreign cost of US$3.0 million. The estimate for the East Java ThermalPower Site study is based on about 230 man-months at a foreign cost ofUS$1.5 million. For both consulting services PLN will be required to inviteproposals from firms experienced in such work, and to appoint consultantssatisfactory to the Bank.
4.17 No problems of any significance are expected in the constructionof the project, as the Semarang thermal station site has been fully acquiredand partially developed for the proposed expansion. The main fuel and watersupply system will be built in the initial phase, which will be completedin 1978.
Ecology
4.19 Indonesia has not yet ruled on matters of environmental quality.The US Environmental Protection Agency (EPA) standards are being used asdesign criteria. Maximum particulate concentration at ground level due toexhaust gases will be below EPA standards and a mechanical precipitator willbe sufficient to remove solid particles from the gas. However, space willbe provided for future installation of electrostatic precipitators, shouldthey become necessary. Stack height will keep the sulfur pollution below EPAstandards even for high-sulfur Middle East oil which may be used insteadof Indonesian low sulfur oil. BVI will carry out surveys of atmospheric andoceanographic conditions in the vicinity of the project area so that conditionsbefore and after the plant installation will be monitored.

-15-
5. JUSTIFICATION
Demand Forecast
5.01 On the basis of the latest forecast of PLN's sales (para. 2.12 andAnnex 1), its generation facilities will be unable to meet the forecast loadby 1982/83. The capacity reserve margin /1 will by then have been reducedto the low level of about 12%.
Least Cost Solution
5.02 In the comprehensive Java System Development Study PCR has recom-mended a least cost sequence of generation expansion which remains unchangedwhen tested for sensitivity within the wide limits of the latest salesforecast and PCR's high load forecast (which represents the total underlyingmarket - Annex 2). The next step in this expansion plan is a third thermalunit of 200 MW at Semarang Harbor which can be added by 1982/83. The PCRstudy shows that the above project is more economical than the next bestalternative of two 100 MW thermal units at Semarang Harbor when these arescheduled in 1982/83 and 1983/84 respectively, for discount rates from zeroto 20%. This result is acceptable.
5.03 The programmed island-wide 150 kV interconnection, which will be com-pleted by 1981/82, as well as the 121 km of transmission line extensions andsubstations proposed under this project, will be adequate to distribute powerfrom the 200 MW unit. The distribution system, recently strengthened,requires only minimum additions. The new generating capacity made availableunder the Semarang 3 project in Central Java will thus be located advanta-geously and where it is most urgently needed.
Internal Economic Rate of Return
5.04 The internal economic rate of return (IERR) is the discount ratewhich equalizes the economic costs and benefits attributable to the project.The project cost and benefit streams, and details of shadow pricing areprovided in Annex 8. Ideally, the benefits should be measured in terms ofthe consumers' willingness to pay, but since this is practically impossibleto evaluate, the incremental revenues based on the average 1977 price of Rp30.5 per kWh was used as a proxy for total benefits. The above is a minimummeasure of benefits principally because consumer surplus is ignored. On thisbasis the IERR is about 19% which indicates that the incremental cost ofsupply of project output is somewhat below the prevailing average tarifflevel. The main reason for this is that there will be significant unutilizedcapacity in Central Java's subtransmission and distribution network, which isadvantageous to the project. However, the long-run marginal cost of supply(Annex 8) based on PLN's 1978-86 investment program is only slightly abovethe existing average price.
/1 The difference between available capacity and peak demand.

- 16 -
6. FINANCIAL ASPECTS
Past Performance
6.01 PLN's past financial performance has been closely linked with themanagement consulting effort and the Financial Recovery Plan. The objectiveof the Plan was to achieve full revenue/cost coverage in FY79, with interimtargets of 80% in FY75 and 90% in FY77. Revenue/cost coverage was defined asrevenues from sales of power plus other operating revenues divided by operatingexpenses consisting of expenses for fuel, operation, maintenance and adminis-tration as well as depreciation, allowance for bad debts, and interest andsimilar charges on debt, if any. Furthermore, it was agreed that all fundsprovided by the Government /1 would be in the form of equity or borrowings onterms not requiring debt service payments on the part of PLN during therecovery period FY74-FY79. This was considered appropriate because burdeningPLN with debt service requirements at a time when it was hardly able to meetits cash expenses would have had a retarding effect on its recovery process.
6.02 PLN has met the targets set for financial recovery as the followingtable indicates (for details see Annex 10):
Fiscal Year /a 1971 1972 1973 1975/b 1976 1977________ _______ (%)… _________________
1. Revenue/cost ratio 74.7 72.2 77.5 97.3 109.0 106.6
2. Rate of return on average netfixed assets in operation - -7.2 -6.3 - 4.0 3.6
3. Increase in average revenues - 4.2 23.9 47.1 33.3 24.0
4. Net internal cash generationas percentage of investments /c 28.4 -47.5 15.8 7.8 14.5
/a Until 1973 the fiscal years coincided with the calendar year. Since 1975they extend from April 1 through March 31.
/b First quarter 1974 omitted.
/c Records for 1971 are unreliable.
The recovery was achieved particularly through tariff increases totaling214% between FY71 and FY77. It was attained three years ahead of schedule(in FY76 instead of FY79). Consequently, the conventional financial targets
/1 In practice all Government-owned enterprises in Indonesia are only per-mitted to borrow through the Government which raises the funds on theirbehalf. The interest provision in the revenue/cost coverage clause wasincluded as a precaution in case PLN should borrow minor amounts ofshort-term funds from local banks.

- 17 -
discussed below have been substituted for the "Financial R1-very Pi ~" inthe proposed loan and all references to the Plan have been deleted from thedocuments of earlier loans.
Financial Targets after Recovery
6.03 Bearing in mind that the revenue/cost targets of the recovery plan
were of a temporary nature, it was agreed in connection with Loans 1259 and1365-IND that PLN would develop, in consultation with the Bank, a system ofconventional financial targets to apply after financial recovery had beenachieved. Such targets were designed over the past several months, werediscussed during appraisal and were agreed on during negotiations.
6.04 In designing the new financial targets special consideration wasgiven to PLN's circumstances, which are characterized by:
(a) operations involving heavy costs due to small and fragmented sub-systems, spread out over vast areas, outdated installations, gasturbine operation for base load, and high system losses;
(b) a large investment program to be added to a comparatively smallasset base; and
(c) the desirability of beginning to finance a reasonable share of newassets by debt and by internal cash generation.
6.05 The resulting agreements reached during negotiations are as follows:
(a) a minimum contribution of 30% to capital expenditures through fundsfrom PLN's internal sources during any consecutive three-year periodstarting with fiscal years 1982/83 through 1984/85 and continuingthereafter; /1
(b) to achieve above target PLN will make all efforts to reach the fol-lowing interim targets which will serve as an appropriate indicationof the due diligence exercised by PLN in improving its operationalefficiency: /1
Contribution From InternalSources to PLN's Capital Expenditures
(consecutive three-year periods)
Fiscal years 1976/77-1978/79 17%Fiscal years 1Q79/80-1981/82 21%Fiscal years 1981/82-1983/84 25%
Above targets will be periodically reviewed between the Bank and PLN;
/1 The performance test will be made on the basis of historic years. The fundsfrom internal sources (the numerator in the calculation) will comprise the respec-tive three-year average of all of PLN's internal sources, including consumers'capital contributions after allowing for debt service and variations in workingcapital, the denominator will consist of the respective three-year average ofPLN's capital expenditures including interest during construction.

- 18 -
(c) a debt service limitation of 1.3 /1 to ensure that PLN refrainsfrom excessive medium-term borrowing; and
(d) a debt/equity ratio of not more than 60/40 to assure reasonableborrowing levels.
Financing Plan
6.06 The above criteria and targets result in the following financingplan for PLN (for details see Annex 10).
Financing Plan
Project construction Forecast periodperiod (FY77/78-FY82/83) (FY77/78-FY85/86)
US$ million % US$ million %
Sources of fundsInternal sourcesNet revenues 1,768.4 25.6 4,519.8 33.3Debt service - 51.3 - 0.7 - 468.7 - 3.5Net variations in working capital - 315.7 - 4.6 - 628.9 - 4.6Funds from internal sources 1,401.4 20.3 3,422.2 25.2
External sourcesGovernment contributions 3,624.3 52.5 6,232.5 46.0Borrowings 1,874.0 27.2 3,901.9 28.8
Total sources of funds 6,899.7 100.0 13,556.6 100.0
Applications of fundsCapital expenditures /aForeign expenditures 3,708.9 53.8 7,397.8 54.6Local expenditures 3,190.8 46.2 6,158.8 45.4
Total capital expenditures 6,899.7 100.0 13,556.6 100.0
Total applications of funds 6,899.7 100.0 13,556.6 100.0
/a Including interest during construction.
/1 Maximum future annual debt service covered 1.3 times by the net revenuesof the actual twelve-month period prior to debt incurrence or theprior fiscal year, whichever is the higher.
- 19 -
6.07 During the project construction period (FY78-FY83), net internalcash generation is expected to finance about 20% of PLN's financial require-ments. Internal cash generation is expected to increases to about 25% ofPLN's investments during FY78-FY86 which are estimated at about US$13.6 bil-lion. PLN's gross fixed assets will increase to about ten times the 1977level. Despite the expected earnings improvement, the equivalent of $10.1billion will have to be raised through bilateral and multilateral aid andthrough the Government budget in the form of loans and equity input./l Newforeign aid equivalent to about US$7.8 billion will have to be sought./2 Therate of return on average net fixed assets in operation will increase toabout 8% in FY83 remaining at about this level thereafter. The above dataillustrate the large efforts PLN has to undertake in order to transformitself into a financially viable power utility capable of satisfying anincreasing share of Indonesia's power market.
Corporate Income Tax
6.08 PLN is beginning to earn profits which, in accordance with pre-vailing tax legislation, would be liable to corporate income tax at the rateof 45% of taxable profit. With the exception of a three-year carry over ofpast losses, no system of investment incentives such as tax credits, acceler-ated depreciation or reinvestment in PLN of levied taxes, now apply for PLN.
However, such investment incentive benefits are common in other countries andare being applied to some revenue earning corporations in Indonesia. PLN isalso expected to enjoy the same treatment. Consequently, the attachedprojections do not assume an income tax liability on the part of PLN.
Subsidiary Loan
6.09 As in previous operations, the Government has agreed to relend the
proceeds of the proposed loan to PLN on terms equivalent to those of the Bankloan. In addition, interest and commitment charges during the grace period ofthe loan will be capitalized, a procedure which is in line with financingpractices in public utilities. Signing of the Subsidiary Loan Agreement isa condition of loan effectiveness.
Audit
6.10 As agreed under earlier operations, the Directorate General of
State Financial Supervision, which by law has to audit PLN, will audit PLN'saccounts as long as it continues to provide satisfactory audit. However, anunderstanding was reached during negotiations that, in addition to theGovernment auditor, PLN will employ on a one-time basis a commercial auditoracceptable to the Bank so that PLN can benefit from the views of a newauditor. Audit reports will be sent to the Bank annually not later than sixmonths after the close of the fiscal year.
/1 Because of the absence of a working local capital market in Indonesia,both Government contributions and borrowings have to be made availablethrough the Government budget.
/2 The total foreign cost of all PLN capital expenditures, consisting ofprojects either already under construction or construction of which isplanned to start during FY78-86, is estimated at US$10.2 billion. Ofthis amount, about US$2.4 billion are committed.

- 20 -
Insurance
6.11 PLN does not presently insure its property in operation although
insurance against hazards of acquisition and transportation and delivery of
goods is regularly arranged. A review by SOFRELEC revealed that insurance
rates are exorbitantly high in Indonesia and would be prohibitive for PLN.
As an interim measure, an understanding was reached in earlier operations that,
pending development of a self-insurance plan by PLN, the Government will pro-
vide PLN with the funds required to cover normally insurable damage minus a
deductible amount equivalent to $100,000. This arrangement will continue under
this project.
Tariffs
6.12 PLN's basic tariff is based on the 1972 tariff study by SOFRELEC
and introduced by Government decree on June 12, 1973. Subsequently, sur-
charges have been levied which have raised the level of average revenues to
about 100% of the basic tariff. The surcharges were only on the energy
charge, leaving the demand charge unchanged. This has led to distortions in
the tariff structure and requires correction.
6.13 The average price per kWh after the next tariff increase in FY78/79
(Annex 10) will approximate the long run marginal cost (LRMC) of energy supplied,
based on a nine-year investment program (Annex 9). However, although the
average price level is acceptable, the structure of tariffs needs revision. As
a first step, agreement was reached in previous operations that PLN will designa new tariff structure to become effective not later than April 1, 1979.
The Bank will assist PLN in designing such a tariff structure. In the present
operation agreement was reached that the new tariff structure will reflect as
closely as possible the long run marginal cost to the economy of meeting the
demand for electricity.
6.14 At present PLN collects high connection charges which deter customers
from seeking connections. This policy is in any case not appropriate with PLN's
increasing supply capability and its objective of increasing its share of
electricity supply. Together with the new tariff structure (para. 6.13), the
Bank will assist PLN in reviewing its customer connection policy (para.
2.16), treating it as an integral part of the overall financial policy.

- 21 -
7. AGREEMENTS REACHED AND RECOMMENDATION
7.01 During loan negotiations, agreement was reached on the followitigprincipal points and appropriate covenants were included in the documents:
(a) adoption of the lower of two projections of the Java System Develop-ment Study as a guideline for system development in Java until FY87(para. 2.14 (a));
(b) annual review with the Bank of potential load growth changes andvariations in the Java system development program (para. 2.14 (b));
(c) annual review with the Bank of PLN's annual investment budget(para. 2.14 (c));
(d) annual review of PLN's customer connection program (para. 2.16);
(e) implementation of plans to attain specific targets on reduction ofsystem losses (para. 2.17);
(f) achievement of (para. 6.05):
(i) specific internal contribution to investment targets;
(ii) a debt service limitation of 1.3; and
(iii) a maximum debt/equity ratio of 60/40; and
(g) design and implementation of a new tariff structure to beimplemented not later than April 1, 1979 (para. 6.13).
7.02 Signing of the Subsidiary Loan Agreement between the Government andPLN is a condition of loan effectiveness (para. 6.09)
7.03 The proposed Project constitutes a suitable basis for a Bank loan ofUS$109 million, for a term of 20 years including five years of grace.


INDONESIA
PERUSAHAAN U14UM LISTRIK NEGARA (PLN)
SEVENTH POWER PROJECT
Actual and Forecast Power Geaeratioo (Ioc-Idina Purchases) aod Sales 1971-85/86 /a
Java Other Areas Total IndonesiaStatioe co.e.mp- Station ro.sump- Station conseup-
Statio. .oen.up- tiEn and lien Sales increases Station conaump- tion and line Sales increase Station cona..p- tion -ad line Sales increasesGenera- ties and lint lassos an percent over previous Gsesra- tion and line looses as percent over previous Genera- tion and line losses a. percent ever previoustion /b losse. oEf eneratioe Sales year tion /b losses of generation Gales year tion Lb losses of generatioo Sales year(Gwvh (Gvh) IT) (Gvh) (2) (Gvh) (GCh) (2) (Gvh) (t) (Gob) () (t) (Geh) (t)
Actual1971 1,925 465 24.2 1,460 12.8 429 103 24.0 326 10.1 2,354 568 24.1 1,786 12.41972 2,033 497 24.4 1,536 5.2 465 108 23.2 357 9.5 2,498 605 24.2 1,893 6.01973 2,427 637 26.2 1,790 16.4 505 120 23.8 385 7.6 2,932 757 25.8 2,175 14.91974/75 /c 2,724 734 26.9 1,990 n.a. 621 167 26.9 454 n,a, 3,345 901 26.9 2,444 10.3 /d1975/76 3,055 769 25.2 2,286 14.9 715 197 27.8 518 14.1 3,770 966 25.6 2,804 14.71976/77 3,310 804 24.3 2,506 9.6 817 233 2d.5 583 12.5 4,127 1,037 25.2 3,089 10.2
Porecast1977/78 3,909 977 25.0 2,932 17.0 901 252 28.0 649 11.3 4,810 1,229 25.5 3,581 15.91978/79 4,769 1,992 25.0 3,577 22.0 1,051 209 27.5 762 17.4 5,820 1,481 25.4 4,339 21.21979/80 5,780 1,416 24.5 4,364 22.0 1,280 346 27.0 934 22.6 7,060 1,762 25.0 5,298 22.11980/81 7,005 1,681 24.0 5,324 22.0 1,555 412 26.5 1,143 22.4 8,560 2,093 24.4 6,467 22.11981/82 8,491 1,996 23.5 6,495 22.0 1,879 489 26.0 1,390 21.6 10,370 2,485 23.9 7,885 21.91982/83 10,291 2,367 23.0 7,924 22.0 2,269 579 25.5 1,690 21.6 12,560 2,946 23.4 9,614 21.91983/84 12,388 2,799 22.5 9,589 21.0 2.722 681 25.0 2,041 20.8 15,110 3,480 23.0 11,630 21.01984/85 14.771 3,265 22.0 11,506 20.0 3.239 794 24.5 2,445 19.8 18,010 4,059 22.5 13,951 20.01985/86 17,332 3,640 21.0 13,692 19.0 4,108 986 24.0 3,122 27.7 21,440 4,626 21.6 16,814 Z0.5
/a FrPn 1971-73,- PLN's fiscal y-ars wore identical vith the calendar years. Freo 1974/75 on-erds, they cover the period April I - March 31.Lb Including purchases./c First quarter 1974 onitted./d Adjusted to take into account the change is fiscal yearn.
n.a. - set available.

ANNEX 1Page 2
INDONESIA
PERUSAHMN OMUM LISTRIK NEGARA (PLN)
SEVENTH POWER PROJECT
JAVA
Growth of Generation. Sales. Peak Demand and Dependable Capacity
Actual ForecastFiscal year ending March 31 1975/76 1976/77 1977/78 1978/79 1979/80 1980/81 1981/82 1982/83 1983/84 198.4/85 1985/86 1986/87
A. Generation (GWh) 3,055 3,310 3,909 4,769 5,780 7,005 8,491 10,291 12,388 14,771 17,332 20.478
B. Station Consumption andSystem Losses (GWh) 769 804 977 1,192 1,416. 1,681 1,996 2,367 2,799 3,265 3,640 4,321
C. Sales (GWh) 2,286 2,506 2,932 3,577 4,364 5,324 6,495 7,924 9,589 11,506 13,692 16,157
D. System Peak Demand (MW) 491 556 687 838 1,015 1,230 1,491 1,807 2,176 2,594 3,044 3,438
E. System Load Factor (2) 71 68 65 65 65 65 65 65 65 65 65 68
F. Installed Capacity (KW)1. Hydra
Existing 408 408 408 408 408 408 408 408 408 408 408 408Saguling 1-4 - - - - - - - - - 175 525 700Garung I and 2 - - - - 14 28 28 28 28 28 28 28Mrica 1-3 - - - - - - - - - - 60 180Wlingi I and 2 - - - 27 27 54 54 54 54 54 54 54Sempor - - - 1 1 1 1 1 1 1 1 1Wonigiri - - - - - 13 13 13 13 13 13 13Jatiluhur 6 - - - - - 25 25 25 25 25 25 25
Total hydro 408 408 408 436 450 529 529 529 529 704 1.114 1,409
2. Gas turbinesExisting 184 340 340 340 340 340 340 340 340 340 340 340Tanjung Priok - - 180 180 180 180 180 180 180 180 180 180Semarang - - 20 20 20 20 20 20 20 20 20 20Cilacap - - - 40 40 40 40 40 40 40 40 40Gresik - - 40 40 40 40 40 40 40 40 40 40
Total gas turbines 184 340 580 620 620 620 620 620 620 620 620 620
3. Diesel, total 57 57 57 14 - - - - - -
4. Steam turbinesExisting 200 200 200 200 200 200 200 200 200 200 200 200Muara Karang 1-5 - - - 100 200 500 700 700 700 700 700 700Suralaya I and 2 - - - - - - - - - 375 750 750Semarang 1-3 - - 50 100 100 100 100 300 300 300 300 300Tanjung Perak 3 and 4 - - - 50 100 100 100 100 100 100 100 100Gresik 1-3 - - - - - 100 100 100 400 400 400 400
Total steam turbines 200 200 250 450 600 1.000 1.200 1.400 1.700 2.075 2,450 2,450
Total installed capacity 849 1.005 1.295 1.520 1.670 2.149 2.349 2,549 2.849 3.399 4,184 4,479
G. Nonavailable Capacity (MW)Station service 20 35 40 60 65 72 90 100 130 I 162 166 200Nonf irm hydro 198 198 198 198 205 270 270 270 270 270 290 330
Total nonavailable capacity 218 233 238 258 270 342 360 370 400 432 456 530
H. Dependable Capacity (MW) F-G 631 772 1,057 1,262 1,400 1,807 1,989 2,179 2,449 2,967 3,728 3,949
1. Capacity Reserve Margin(Year end) (%) 28.5 38.8 53.9 50.6 37.9 46.9 33.4 20.6 12.5 14.4 22.5 14.9

ANNEX 2
INDONESIA
PERUSAHAAN UMUM LISTRIK NEGARA (PLN)
SEVENTH POWER PROJECT
JAVA
Comparative Forecasts of Annual Generation (GWh)
Year PCR (High) PCR (Low) IAEA (Low) PLN/IBRD /a (1977)(1) (2) (3) (4) (5)
1977 9,755 4,526 3,909
1978 11,587 5,505 4,769
1979 13,826 7,500 - 5,780
1980 16,078 9,728 9,165 7,005
1981 18,538 11,639 - 8,491
1982 21,513 13,285 12,926 10,291
1983 24,894 15,054 - 12,388
1984 27,212 16,999 - 14,771
1985 31,393 19,198 20,142 17,332
1986 36,187 21,646 - 19,810
1987 41,684 24,370 - 22,643
1988 47,986 27,393 - 26,039
1989 55,266 30,739 - 29,945
1990 53,669 34,439 43,400 34,437
/a The figures in this column are for PLN's fiscal year which ends in Marchof the succeeding year. To compare with the figures in the precedingcolumns, they should be decreased by about 5% up to 1984, and 4% thereafter.

ANNEX 3Page 1
INDONESIA
PERUSAHAAN UMUM LISTRIK NEGARA (PLN)
SEVENTH POWER PROJECT
Summary of Legislation Affecting PLN(as of December 31, 1976)
1. The following is a summary of the Indonesian legislation as far asit affects directly PLN's legal status and activities. In particular itcomprises:
(a) Government Decree No. 18/1972 dated May 18, 1972 ofthe President of the Republic - PLN's Charter;
(b) Decree No. 12/PRT/1975 dated September 9, 1975 of theMinister of Public Works and Electric Power - GeneralPolicy, Objective and Scope of Activities. This regulationrevokes Decree No. 13/PRT/1972;
(c) Decree No. 13/PRT/1975 dated September 9, 1975 of theMinister of Public Works and Electric Power - Organizationand Business Rules of PLN. This regulation revokesDecree No. 1/PRT/1973; and
(d) various decrees on budget administration.
Status
2. PLN is a Public Enterprise (Perum). It is the executing agencyof the Ministry of Public Works and Electric Power for power developmentthroughout the country, carrying out its objectives within the NationalDevelopment Program in accordance with Government policies. All legalprovisions existing in Indonesia and not revoked or modified by above decreescontinue to apply.
Responsibilities
3. Most of the activities mentioned below are PLN's exclusive res-ponsibility. In some cases, however, the Government retained the right offinal decision, and if so, appropriate notes have been made. PLN's respon-sibilities are:
(a) construction and operation of generation, transmissionand distribution facilities including procurement. DespiteDecree No. 12/PRT/1975, which provides the Government withthe authority for procurement of goods and services financedfrom the national budget, an undertaking was received fromthe Government during negotiations that it will restrictits involvement to bid evaluation only.

ANNEX 3Page 2
(b) drafting of power development plans based on demand surveys and
load forecasts. These programs become part of the national
development plan and, consequently, are subject to Government
approval;
(c) drafting of regulations licensing power installations owned by
third parties. After approval by the Minister, administration of
the regulation becomes PLN's responsibility. At the moment the
following licensing rules apply:
(i) no registration is required for power generators
of less than 2 kVA capacity;
(ii) generators with a capacity of 2-25 kVA must be
registered with PLN;
(iii) prior to installing a generator of more than
25 kVA capacity, a permit must be obtained from
PLN; and
(iv) installations existing before May 18, 1972 (date
of PLN's Charter) are exempt from above licensing
provisions.
(d) entering into purchase or sales contracts of electric power with
third parties;
(e) organizing of training for its personnel; and
(f) conducting research in the field of electric power.
In exercising its responsibilities, PLN is entitled within the framework
of existing laws and regulations to:
(a) make use of private and public roads;
(b) enter into and/or make temporary use of public and
private property;
(c) install wires and cables above or under public and
private property; and
(d) dig in public as well as private roads.
Supervision by Government
4. The Minister determines PLN's policy and exercises general control
over its activities. He is advised by an Advisory Board consisting of the
Ministers of Finance, Industry and National Development Planning (Chairman
of BAPPENAS) on all policy matters, including annual and long-range development
programs, tariffs, audits and other issues of major importance for PLN's
activities.
ANNEX 3Page 3
Management
5. PLN's management is in the hands of a Board of Directors consistingof a President Director and at least two Directors. At the moment there arefive Directors responsible for planning, construction, operation, financeand administration. The President Director is responsible to the Minister,and the Directors report to the President Director in their respective fields.
6. In performing its management functions the Board acts as an agentof the Minister. The members of the Board are appointed by the Presidentof the Republic for a maximum period of five years. They are eligible forreappointment.
7. PLN's middle management consists of (see also Organization Charton page 6):
(a) Deputy Directors in headquarters;
(b) Director Power Research Center;
(c) Director Training Center;
(d) Chiefs, Regional Offices; and
(e) Chiefs, Special Projects.
They are appointed by the Minister upon recommendation of the Board. Theofficials mentioned in (a) through (d) are responsible to the Board.Concerning the Chiefs, Special Projects the decree is not clear. For allpractical purposes, however, they can also be considered as responsible tothe Board.
Organization
8. The organization is divided into three distinct levels whichreflect the fact that PLN has to cover a huge area with largely inadequatecommunication and transportation facilities:
(a) Leadership - Board of Directors together with the deputy director-ships, all located in headquarters. Internally the leadershiplevel is responsible for overall guidance, planning and policymatters in coordination with the Ministry. Externally it keepscontact with all agencies of the GoVernment, particularly theMinistries of Public Works and Electric Power. Operationallyheadquarters performs all the tasks prior to implementation (forinstance drafting and review of bidding documents, budget, andoperation of the central warehouse and workshop) and collectionand finalization of statistical and accounting data.

ANNEX 3Page 4
(b) SupportingServices - Power Research Center and Training Center.
(c) ExecutingLevel - Regional Offices and Special Projects. The
regional offices are responsible for all opera-tional matters within their area as well as theimplementation of minor projects. SpecialProjects are construction implementation unitsfor projects too large or too important to behandled by regional offices.
9. PLN's directorates in headquarters have the following responsi-bilities:
(a) DirectoratePlanning - Technical as well as management planning; input
for the national development plans; designing oftechnical standards throughout the country; evalua-tion of application for captive plant licenses;and bid evaluation and bid award.
(b) DirectorateOperation - Guidance and supervision in matters of operation
and maintenance of generation transmission anddistribution facilities; construction of minordistribution facilities; operation of the centralworkshop and warehouse; and drafting of powersupply contracts with third parties.
(c) DirectorateConstruction - Guidance and supervision in project implementation;
research on improvement of construction methods;procurement of construction equipment, if required;construction contract supervision; and draftingand supervision of construction budget.
(d) DirectorateFinance - Central accounting and financial management;
drafting and supervision of the revenues andexpenditures budget; and internal audit.
(e) DirectorateAdministration - Performance of administrative services; personnel
management; legal assistance; Board secretariat;and personnel safety.
Audit
10. PLN's external audit is the responsibility of the DirectorateGeneral of State Financial Supervision. PLN has to submit its annual accounts

ANNEX 3Page 5
for auditing not later than six months after the end of the fiscal year.The audit should normally be completed within three months. The Directoratemaintains staff in PLN's headquarters who are responsible for a permanentaudit.
Budget
11. The budget of revenues and expenditures is within PLN's authorityand has to be submitted to the Government only for information and assupporting data on internal cash generation. The investment budget, however,is subject to strict Government regulations and, although PLN enjoys slightlymore autonomy than other state enterprises, the budget process is stillcumbersome. The following paragraphs illustrate the preparation, approvaland supervision process of PLN's investment budget.
12. Budget Calendar(Fiscal Year April 1 - March 31)
Septemberthrough - After negotiations with BAPPENAS on work programs to beDecember performed in the coming fiscal year as well as budget
ceiling settings (this is in fact a continuous process),the final budget proposal (Daftar Usulan Projek - DUP) issubmitted through the Minister of Public Works andElectric Power to BAPPENAS and the Ministry of Financeto be included in the Rencana Anggaran Pendabatan danBelanja Negara (RAPBN), the overall budget proposal.
January - The President of the Republic submits the overalibudget proposal to the Parliament for approval.
March - Before the end of March the Parliament has to finishits deliberations on the budget proposal which, afterapproval, becomes the final budget (Anggaran Pendapatandan Belanja Negara - APBN).
April - The Ministry of Finance through the Minister of PublicWorks and Power informs PLN of its share of the finalGovernment budget. This is called Daftar Isian Projek(DIP).
13. For each fiscal year regulations on budget withdrawal proceduresare stipulated by decree. They may differ somewhat from year to year, but inprinciple remain unchanged. In the case of PLN the various regional Treasuryoffices receive authorization to release quarterly the budgeted amounts overwhich PLN then has spending authority.

Annex 3INDONESIA Page 6
PERUSAHAAN UMUM LISTRIK NEGARA iPLNlFIFTH POWER PROJECT
ORGANIZATION CHART1
/
-."A OF DIRECTORS
PRESIDENT DIRECTOR
DIRE 7 ; | DlRfCTOR DIRECTORTIR ECORDlRECTOR DIRECTOR_PLANNING ~ OERAYIOR CONSTRUCTION PINANCE ADNINISTRAT
l l ~ ~ I __ _1 0'e ,.I.*I mAAlYIIf,U AA0,TJ, Ad0m,mnI,UIo AAI.11IIRbo.. -*nw¢e
DEPUTY DIRECTOR DGPUJT~ DIReCODEUYICTO TO DEPUITY DIRECTOR DPUTY DIRECTORIOER RSECOTRAIINonsArloh. STEAM AND EUOGET FE.So
OEPUTY O"CTO OPERATION R&CONSTRUNTEX
.. E..lzro ILN. PLNNNP..RR
D_,o.o. R0.-. O1-on *I.epl D.-$ SIn..
_r . . - Ad Dlwn ~~~ ~ ~~~D-l D.-m D.- _
L Lo. S_ ESL AN 0 _ DHERO
STRUCTIONDEPUTY DIRECTOR TUTY DIRECTOR _F-
TECHNICAL LOGISTICS DD-- _ UT DIECTOR'LANNING DdNER AFI.IRS
51801, D-oa.EodW~01101f Tlw_111 's" 0111101 001111 011eo -
Slete DEPUTY DIRECTOR | | DEPUTY DIRECTOR
_. 151.1110 _ MAINTENANCE NETWNORKS _loa
_10111 PLANNING § i I _4 OEPUTY DIRECTONR LO
D OEPUTY DIRECTOR | -cD- S0.oR P.TI D11* TO
_ ODINIRNTR*TIORI 01_. TEll. S GilD_ PoI Pex110e Te;P"ANNING | 01 *bes_ s^510.11
DIJTY DIR 1 .Eks J CO"TC7TOR | '- SECUOITR
110 CCRIII CONSTRUCTION~~~~OIIPIRC bOO ADEENIRTRATIOEE 0 0 n D115reDR
_C ol P81_1 Olle_. D 5I
X.o is y NPM, X. W-D f UTY DIRECTOR R- =
.~ ~ ~ ~ ~ ~~~6 C-* 9- FNdRA | - K M2
PSOOR. IN~~~~~~TERmN,lI.4
_1 G_ A1IIl -
- A.al.
N I
12
| V CIAL. CUO EREIOALGF
Ed onWE ___ R*01 I, 5blD TOIIDI RI d0 Alll R.G 50_ AyA
Iy O-N N-.0R3 111T 0 .d 3. CW _- R I 1E P110_ ~ 30KPT1S/R7R ol 4. 0.11 RID LRR b ^I1 Rd
IDlE UAIRDI a PlAIn-d 0-..35 R .n IE C P - 1
*. C...Dd.IERRMRd IREllERI
I_*_511o: DIED
(_10. }1~-1 Tl Dl_l C_1. #h IAIN P10 1511d0 R11_1 - _eId by D_-- N7 GP3IPTIISN R '3. CR' R. YallI R d
n- 1*_L1 _- _* N 0 10R3RTIS ORR10a1 PsR 1RR

ANNEX 4Page 1
INDONESIA
PERUSAHAAN UMUM LISTRIK NEGARA (PLN)
SEVENTH POWER PROJECT
Training
The following training activities have been undertaken in the pastor are presently underway.
A. TRAINING CENTERS
1. In Operation
(a) Slipil: This is the training center for finance andadministration. It was originally inauguratedin 1972 and, after some interruption, reopenedin September 1974. During the first phase about150 employees were trained. The total capacityhas been increased to about 300 trainees peryear. Between October 1976 and March 1977, 250persons have been trained. The center employsseven full-time teachers.
(b) Cibogo: Center for technical training in generation,transmission and distribution control. It wasopened in 1973. By end-1974, 159 employees hadbeen trained and training programs for another400 have been conducted between early 1975 andMarch 1977. The Center employs eight full-timeand 16 part-time instructors.
(c) Ancol: Center for distribution construction and main-tenance. It was originally inaugurated in 1972and, after interruption, reopened in early 1975.The total capacity is about 180 persons per yearin classes of 12-32 weeks duration.
(d) Taniung Priok: Center for steam and gas turbine plant operation.The center was opened in March 1976. Its capacityis 60 employees per year.
2. Planned
(a) Pandaan: Center for diesel plant and distribution operation.(Surabaja) Opening is planned for end-1977. Capacity of 60
trainees per year.

ANNEX 4Pag 2
(b) Ujung Pandang: Center for diesel plant and distributionoperation. Implementation is in the earlyplanning stage.
(c) Medan: Center for diesel plant and distributionoperation. Implementation is in the earlyplanning stage.
B. OTHER TRAINING ACTIVITIES
(a) On-the-job training for operation of steam power plants.SOFRELEC has successfully completed a nine-month course inSurabaya and similar classes in Tanjung Priok. Similar efforts
are being continued by consultants in the context of steam plantdesign and supervision of construction jobs (for instance Black
and Veatch in Muara Karang).
(b) Continuous on-the-job training in accounting mechanization.
(c) Training of about 200 employees outside PLN and abroad incomputer operation, management, system planning and personnelmanagement.

ANNEX 5
INDONESIA
PERUSAhAAN UMUM LISTRIK NEGASA (PLN)
Seventh Power Prolect
Project Cost Estimate /a
Rate of exchange: US$1.00 - Rp 415
Foreign Local Total Foreisn Local Total(in Rp billion) (in US$ million equivalent)
SEMARANG UNIT 1N0. 3
1. Preliminary Civil Works - 4.41 4.41 - 10.63 10.63
2. Mechanical and Electrical EquipmentBoiler and auxiliaries lb 6.98 1.08 8.06 16.82 2.60 19.42Turbine generator and auxiliaries /b 9.79 0.46 10.25 23.59 1.10 24.69Electrical equipment 2.08 - 2.08 5.02 - 5.02Transformers 0.48 - 0.48 1.16 - 1.16Instrumentation 0.72 0.04 0.76 1.74 0.09 1.83Structural steel 1.08 - 1.06 2.59 - 2.59Air pollution equipment 1.52 0.65 2.17 3.65 1.57 5.22
Subtotal 22.65 2.23 24.88 54.57 5.36 59.93
3. General ConstructionCivil and structural 2.37 1.09 3.46 5.72 2.63 8.35Mechanical and electrical 7.25 1.78 9.03 17.47 4.29 21.76
Subtotal 9.62 2.87 12.49 23.19 6.92 30.11
4. Engineering and Construction Supervision 2.28 0.25 2.53 5.50 0.60 6.10
5. PLN's Administration and Management - 1.19 1.19 - 2.87 2.87
6. Contingencies /cPhysical - - - - -
Price -
Subtotal - - - -
Total Semarang Unit No. 3 34.55 10.95 45.50 83.26 26.38 109.64
TRANSMISSION LINES AND SUBSTATIONS
l. Land. Route Survey and Foundations - 6.66 6.66 - 16.04 16.04
2. Material and Erection 9.45 1.80 11.25 22.77 4.33 27.10
3. Engineering and Construction Supervision 0.61 0.15 0.76 1.47 0.38 1.85
4. PLN's Administration and ManaRement - 0.75 0.75 - 1.80 1.80
5. Contingencies /c
Physical - - -Price
Subtotal - -
Total transmission lines andsubstations 10.06 9.36 19.42 24.24 22.55 46.79
ADDITIONAL ENGINEERING SERVICES
1. West Java Thermal Power Project (Suralaya) 1.25 0.12 1.37 3.00 0.30 3.30
2. East Java Thermal Power Project 0.62 0.12 0.74 1.50 0.30 1.80
TOTAL PROJECT COST 45.48 20.55 67.03 112.00 49.53 161.53
/a The cost estimate, particularly for major equipment, is based on the bid prices obtained forMuara Karang Nos. 4 and 5. Since these prices are considered favorable, these of the second lovestbidder plus one year escalation have been assumed.
Ab Includes erection.
/c Physical and price contingencies have been included in the various items. They are:
(a) Physical contingencies: 5X of the total cost of Semarang Unit No. 3 and thecost for material of the transmission lines and substations; and 10X on thefoundations/erection of the transmission lines and substations.
(b) Price contingencies: Foreign cost - 7.5X per year betwen 1977 and 1979 and7.0% per year thereafter.
Local cost - on average 102 per year.

INDONESIAPerusahaan Umum Listrik Negara (PLN)
Seventh Power Project
Project Implementation Schedule
1 977 1978 1979 1980 1 981 198;1 83PROJECT ELEMENT J F N A 14 j J A, S 0. P 0 J F N A N J J A 5 0 9 D J F 4 A 4 J J A S 0 N D J F 14 A M J J A S 0 N D J F M A N J J A S 0 N D J F M i J A S 0 N DIJ F M
ENGINEERING AND DESIGN I i i I I I I I I I I I I I f I I I I
PROJECT DE31W REPOIY SUPPLEMENT L
PROJECT SCMEii-LE Al CHART I
PROJECT CPW ANALYSIS m
PROJEct cost ES i)(ATE
PLANT ARRA46EMENTS -- 4TTTF_F1OW DIAIIIAMI�
E Li CT t I CA L CIE - L I ME3 4 -+--4 4-4-4-� -4 -_fLECTOICAL SCNE!IT_ICS���
CONTROL LOGIC UllblAWS
EOUIPkf*T SCREPULES
CIVIL CONSTRUCT10k PLANSMECHANICAL COJISTRUCTION PLANSELECTRICAL CONSTRUCTION PLANSCIVIL CONSItUCTiOll SPECIFICATIONSRECOA11CAL C003TRUCTION SPECi!ICATIONS
ELECTRICAL CONSTRUCTION SPECIFICATIOIS 0
ITE t[YELOPMENT PLANS AND SPtCIFICA7100S ifs
PILINA AND PILE CAPS PUNS ANO SPECIFICATIONS N. c
T',11- I -itlttkTC-RO. DOILERS, 13- -D
Rk t-#0 I I IDI
ELICTKI c
C"TROLSSTRUCTURAL STEEL
±1ELD �q.NSTRVCTJON. - - - 4-4 1 1SITE PREPARATION
1`1011TIONS
ELEtTki
TURBINE ERATO* - ENECTION
EXE04TOR (IOILER) - ERECTION ANN WON
TESTIK!_SYSTEMS - - - - - - - - --
TIEST1116 UNITS
__LEAFORMANCE TESTSENSiRE
NCE AID C
LEGEND0S 'Sp,'EC,'1jC'.TI
0 0c""E., AT CO-STRUCTION SITE SEMARANG S7FAM POWER PLANTAs A.SSOUNIODRAW106$
UNIT 3I Is g(O 0 REVIEW G E N E R A L PROJECT SCHEDULE

ANNEX 7
INDONESIA
PERUSAHAAN UMUM LISTRIK NEGARA (PLN)
Seventh Power Project
Estimated Schedule of Disbursements
IBRD fiscal year Cumulative disbursementand quarter at end of quarter
1978/79
September 30, 1978December 31, 1978March 31, 1979 1,000,000June 30, 1979 5,250,000
1979/80
September 30, 1979 10,000,000December 31, 1979 15,500,000March 31, 1980 21,400,000June 30, 1980 27,000,000
1980/81
September 30, 1980 31,200,000December 31, 1980 41,000,000
March 31, 1981 49,000,000June 30, 1981 58,300,000
1981/82
September 30, 1981 68,600,000December 31, 1981 84,000,000March 31, 1982 92,000,000June 30, 1982 96,000,000
1982/83
September 30, 1982 100,000,000December 31, 1982 102,000,000March 31, 1983 104,000,000June 30, 1983 106,000,000
1983/84September 1983 109,000,000

ANNEX 8Page 1
INDONESIA
PERUSAHAAN UMUM LISTRIK NEGARA (PLN)
Seventh Power Project
Cost and Benefit Streams for Internal Economic Rate of Return Calculation(In Rp billion - border prices)
Costs Benefits NetYear Construction /a O&M /b Fuel /c Increm. Rev./d benefits
Foreign Domestic /e
1978 0.92 0.47 - - - -1.39
1979 7.75 4.31 - - - -12.06
1980 11.03 3.77 - - - -14.80
1981 12.34 3.96 - - - -16.30
1982 6.12 1.22 0.40 2.74 6.37 -4.11
1983 - - 0.80 10.96 25.47 13.71
1984-93 - - 1.11 10.96 25.47 13.40
1994-98 - - 1.11 8.80 20.46 10.55
1999-2012 - - 1.11 4.82 11.17 5.24
/a Includes the costs of Semarang 3 and associated transmission and substation
costs.
/b 2% of capital costs.
/c World market price of fuel used ($11.6 per barrel); operating pattern68% plant factor during 1983-93, 55% during 1994-98, and 30% during1999-2012.
/d Rp 30.5 per kWh average 1977 tariff used as proxy for benefits of incrementalconsumption, and standard conversion factor (SCF) = 0.87 applied.
/e Composite labor conversion factor (LCF) = 0.78 applied, based on LCF = 0.61 forthe 35% unskilled labor component, and a conversion factor of 0.87 for theremaining 65% of domestic construction costs.

ANNEX 8Page 2
INDONESIA
PERUSAHAAN UMUM LISTRIK NEGARA (PLN)
Seventh Power Project
Long-Run Marginal Cost of Electric Energy (Java)(In Rp billion - border prices)
(GWh)Construction Incremental
Year Foreign Domestic |a O&M /b Fuel /c consumption
1978 99.20 30.10 1.60 6.40 426
1979 95.80 40.40 3.00 15.30 1,071
1980 124.10 53.60 4.10 26.20 1,858
1981 129.80 58.60 5.40 33.60 2,818
1982 149.60 71.40 6.90 47.10 3,989
1983 182.80 73.60 8.40 76.20 5,418
1984 141.80 47.90 9.50 108.30 7,083
1985 70.50 30.70 9.90 118.20 9,000
1986 47,20 26.00 10.10 117.70 11,186
1987-95 - - 10.10 120.90 12,143
1996-2005 - - 10.10 80.60 8,095
2006-2015 - - 10.10 40.30 4,048
/a See page 1 of Annex 8 for explanatory footnotes.
/b 2% of capital costs for thermal plants and 0.5% for hydro.
/c Fuel Cost: Oil - US$11.6 per barrel (world market price);Coal - US$25 per ton (assumed supply cost in Suralaya).
From the above table, the long-run marginal cost (domestic prices)equals Rp 31.3 per kWh for a 10% discount rate and Rp 34.2 for a 12%discount rate using a standard conversion factor of 0.87 to convertfrom border prices to domestic prices. The actual average tariff for1977 is Rp 30.5 per kWh, the expected average tariff for 1978 isRp 34.9 per kWh.

ISDUOgESIA
PERUSANAAN UlU11 LISTRIKC NEGARA (PLN)
SEVENTH POWER PROJECT
Forecast Capital Espeodit.res(to Rp bu lledn
Fiscal years ending March 31 1977/78 197b/79 1979/80 1980/81 1981/82 198Z/83 1983/84 1984/85 1985/86 1977/88 - 1985/86Total
F L F L F L F L F L F L F L F L F L F L
SUMMA4RY
1. Generation(a) Hydro plants 9.1 3.5 13.3 9.2 21.8 17.2 31.7 24.6 40.0 27.4 41.6 23.4 35.3 17.2 26.5 12.1 21.0 7.0 240.3 141.6
(b) Gas turbines 26.7 4.0 5.4 0.9 - - - - - - - - - - - - - - 32.1 4.9
(c) Diesel plants 8.7 3.7 8.7 3.7 8.7 3.7 8.7 3.7 8.7 3.7 8.7 3.7 8.7 3.7 8.7 3.7 7.8 2.6 77.4 32.2
(d) Steam turbines 36.6 17.8 55.6 23.2 64.2 24.7 72.1 27.7 78.7 32.5 85.2 32.9 81.9 35.1 82.8 40.6 137.0 73.3 694.1 307.8
Subtotal generation 81.1 29.0 83.0 37.0 94.7 45.6 112.5 56.0 127.4 63.6 135.5 60.0 125.9 56.0 118.0 56.4 165.8 82.9 1,043.9 486.5
2. Ttansmisatoe Lines and S .b.ratios 22.4 6.6 24.2 11.1 42.7 15.0 40.0 14.9 47.1 20.1 61.8 23.2 50.6 16.7 26.7 7.6 23.4 12.4 338.9 127.6
3. Distribution 14.1 13.3 19.6 23.7 43.3 42.4 54.8 51.8 64.9 60.1 7b.2 68.8 86.bu bU.1 121.3 86.5 106.35 1U0.Z 86.7 505.9
4. Other Capital Eseenditures - 40.0 _ 49.6 - 55.2 _ 61.0 _ 62.4 _ 66.1 _ 67.4 _- 65.6 - 57.6 - 524.9
Total Capital Expenditures - 1977 prices 117.6 88.9 126.8 121.4 180.7 158.2 207.3 183.7 239.4 206.2 273.5 218.1 262.5 200.2 266.0 214.1 295.7 254.1 19_69.5 1,644.9
206.5 248.2 338.9 391.0 445.6 491.6 466.7 480.1 549.8 3,614.4
Price Escalation - - 9.5 15.8 28.2 39.4 48.9 66.3 77.4 97.7 113.8 128.5 135.2 141.1 165.2 177.5 217.1 244.7 795.3 911.0
- 25.3 67.6 115.2 175.1 242.3 276.3 342.7 461.8 1,706.3
Total Capilal Expenlditures - current prices 117.6 88.9 136.3 137.2 208.9 197.6 256.2 250.0 316.8 303.9 387.3 346.6 397.7 341.3 431.2 391.6 512.8 498.8 2.764.8 2.555.9
206.5 273.5 406.5 506.2 620.7 733.9 739.0 822.8 1.011.6 20.7
Capital Expenditures Expressed inISS sillion esuivalent
AL 1977 prices 283.4 214.2 305.8 292.5 435.4 381.2 499.5 442.7 576.9 496.8 659.0 525.6 632.5 482.4 641.0 515.9 712.5 612.3 4,745.8 3,963.6
497.6 598.1 816.6 942.2 1,073.7 1,184.6 1,114.9 1,156.9 1,324.8 8,709.4
At current prices 283.4 214.2 328.4 330.6 503.4 476.1 611.3 b02.4 763.4 732.3 933.2 835.2 958.3 822.4 1,039.0 91,3.6 1,235.7 1,201.9 6,662.1 6,158.7
497.6 659.0 979.5 1,219.7 1,495.7 1,768.4 1,780.7 1,982.6 2,437.6 12,820.8

@ . F n o^ X^ | v~~~~~~~~~~~~~~~~~~~~~~~~~~~~~~~~~~~~~~0
° 2 v r 0' ° gFFs7 *c X rtvD> r OR |° =o*°0 °wo
n x _ oS 0 o > W s Pg n~ C
8 i f 0.0 rroor 000000 r r- x>t* Xr' =' Z00o0 fl000Ho~C h >ogrp
_b 0 W F00o F' F-10 F00 '1 0 l'0000 .,0-.0
0"' ~ Fo rs 00irF00s 0s 000 ,0 0 0 00000- .'00.00000 0
000~~~~ 00. 000 Or'rno o .o , 000 r w00 w0-000 w lb :os oro__F
0.01rF 00'__ FF 0t9~ 00000000000 , ' 0'o
-- F> 0 -- 00 0.99FF 0 ,,,,,-F-- '
0 oqDr 0' 0t 0 | * * O F F O 0.0
0'~~~_Dl |, |||| 0 ~ 0,>rrt,F,,mi 0
*~~~~~,, | 1l|@lo 0,r0'r 00000,,,0 , 0 0
o~ ~~~aII 0. 0,_¢F. ,e011000 000 I0 I0Ir
o ~ ~ ~ ~ OObl'l-'l-0000 00000 '''loOn 00>00 Oli,i~~~~~~~~~~~lW r s o ao ° II II
0,001010~~ ~~ ol'> 1000'r>°~S,,, r01 r
*~~~~~~~~~~~~~ 000000 000 01 0011 ( I4 Iooa OI
0'~ ~ ~~ii -j 0.00>0000' '0<0 '0.r°FF,, , r05
0000'00 0000.0 0000 lo31 0 0'00_-w ot.~0o ri
0.0L.''1 00F |c0.0 '0'00 300000w.ww l; I-ra'4> _w
6~ ~ ~ 0000 00-''-00 000'

INDONESIA
PEaUSAHAAN UMUU LISTRIK UEGA4A (PLN)
SEVENTH POWER PROJECT
Forecast Capital E.peadit.r.s(It Rp billion)
Fiscal yeara ending March 31 Soorce of Total project 1977/78 1978/79 1979/80 1980/81 1981/87 1982/83 1983/84 1984/85 1985/86 1977/78 - 1985/86foreigs coat --- Total financing F L F L F L F L F L F L F L F L F L F L F L
Seaara.g 1 US AID 7.1 2.9 0.7 0.1 - - - - - - - - - - - - - - - - 0.7 0.1Seaarsog 2 US AID 7.1 2.9 1.4 0.4 0.7 0.1 - - - - - - - - - _ _ _ _ _ 2.1 0.5Sesarang 3 (IBRD) 32.8 12.0 - - 1.6 1.8 8.2 3.6 13.1 4.2 6.6 1.8 3.3 0.6 - - _ - - - 32.8 12.0Gresik I OECF 26.9 13.3 6.7 4.0 10.7 4.6 5.4 2.0 2.7 0.7 - - - - - _ _ _ _ _ 25.5 11.3Gresik 2 OECF 19.5 2.5 - - - - 1.0 0.4 4.9 0.7 7.8 0.9 3.9 0.4 1.9 0.1 _ _ _ _ 19.5 2.5Gre.It 3 _ 32.8 12.0 - - - - 1.6 1.8 8.2 3.6 13.1 4.2 6.6 1.8 3.3 Q.6 _ _ _ _ 32.8 12.0Tanjong Perak 3 OECF 9.8 2.3 2.0 0.3 1.0 1.0 - - - - - - - - - - - - - - 3.0 0.4Tanjong Perak 4 OECF 9.8 2.3 3.9 0.8 2.0 0.3 1.0 0.1 - - - - - - - - _ _ _ _ 6.9 1.2(ii) teal (doalS-firedSuralaya I - 69.7 29.9 - - - - - - 3.5 4.5 17.4 9.0 27.9 10.5 13.9 4.5 7.0 1.5 - - 69.7 30.0Oocalyay 2 - 43.6 18.7 - _- - - - - - 2.2 2.8 10.9 5.6 17.4 6.5 8.7 2.8 4.4 0.9 43.6 18.6Suralaya 3 - 65.4 20.0 - - - - - - - - - - - - - - 3.3 4.2 16.3 6.4 19.6 10.60Sr3alya 4 - 65.4 28.0 - - - - . - - - - - - - - - - - 3.3 4.2 3.3 4.2East Java 1 - 87.2 37.4 - - - - - - - - - - - - 4.4 5.6 21.8 11.2 34.9 13.1 61.1 29.9East Java 2 - 87.2 37.4 - - - - - - - - - - - - - - 4.4 5.6 21.8 11.2 26.2 16.8East Java 3 - 87.2 37.4 - - - - - - - - - - - - - - - - 4.4 5.6 4.4 5.6Ceotr.l Java I - 87.2 37.4 - - - - - - - - - - - - - - - - 4.4 5.6 4.4 5.6
Total te.as trbines 34.8 16.6 44.8 18.6 39.4 15.4 42.8 16.5 50.1 19.3 52.6 18.9 40.9 17.3 45.2 25.3 89.5 47.0 440.1 194.9Total Generation 67.6 22.7 59.1 24.4 54.1 25.4 65.0 33.0 80.1 39.0 87.4 37.4 73.1 31.6 69.9 36.2 108.9 53.0 665.2 302.7Trcasisisoo line1 12.0 4.4 13.7 6.9 19.1 8.0 15.6 6.0 17.8 10.0 33.8 15.3 33.1 12.3 17.5 5.4 7.7 3.9 170.3 72:2Substations 8.9 1.7 8.3 3.1 18.0 4.1 10.1 1.9 9.1 3.9 19.0 4.9 11.2 2.4 6.2 1.3 10.1 5.3 100.9 28.6Distribution 10.7 9.8 14.7 17.4 32.9 31.2 41.6 38.0 49.2 44.1 58.0 50.6 67.3 43.5 95.8 61.8 82.4 74.9 452.6 371.3TOtAL. CAPITAL EXPENDITURES (JAVA) - 1977 PRiCES0 99.2 38.6 95.5 51.8 124.1 60.7 132.3 78.9 156.2 97.0 198.2 108.2 184.7 89.8 189.4 104.7 209.1 137.1 1.389.0 774.8
137.8 147.6 192.8 211.2 253.2 306.4 274.5 294.1 346.2 2.163.8Price escalation - - 7.2 6.7 19.4 17.1 31.2 28.5 50.5 46.0 82.5 63.7 95.1 63.3 117.6 86.8 153.5 132.0 557.0 444.1- 13.9 36.5 59.7 96.5 146.2 158.4 204.4 285.5 1,001.1TOTAL CAPITAL. EXPENDOITU7RES (JAVA) - CURREbT IPRiCES 99.2 39.6 103.0 58.5 143.5 85.8 163.5 107.4 206.7 143.0 20O.7 171.9 279.8 153.1 307.0 191.5 362.6 269.1 1,946.0 1218.9
137.8 161.5 229.3 270.9 349.7 452.6 432.9 498.5 631.7 3_164.9Capital eePendlruces expressed Ix
US s$illion equivalent:
At 1977 prices 239.0 93.0 230.8 124.8 299.0 165.6 318.8 190.1 376.4 233.7 477.6 260.7 445.1 216.4 456.4 252.3 503.8 jJO.4 3,346.9 1,867.0332.0 355.6 464.6 508.9 610.1 738.3 661.3 708.7 834.2 5,213.9
At correct prices 239.0 93.0 248.2 141.0 345.8 206.7 394.U 258.8 498.1 344.6 676.4 414.2 674.2 368.9 739.8 461.4 873.7 648.4 4,689.2 2,937.0332.0 389.2 552.5 652.8 842.7 1,090.6 1,043.1 1,201.2 1,522.1 7,626.2
Notes: F - Foreign cootL - Local costRate of .echange: US$1.00 R Ep 415.

INDONESIA
FERUJS AII UMUM LISTRIK NEGAHA (FLN)
SEVENTH POWER PROJECT
Forecat Capital Ep-editura(In Rp billion)
Fiscal years ending March 31 Source of Toto1 projeci 1977/78 1978/79 197/H 1980/ 198182 192/H 83 93/84 1984/85 198586 1977178 -18/6foreign cost--T..
finaincg F L F L F L F L P L F L F L F L P L F L. F L
8. OTHER AREAS
Geseratiee L.(a) Hydro piesta
Jaissg Agsa.3 Japas Eniagank 0.6 0.1 0.1 - - - - - - - - - - - - - - - - - 0.1-Nasijan I ADB 2.5 1.1 0.6 0.4 0.7 0.4 0.3 0.3 -0.1I 0.1 - - - - - - - - - 1.9 1.2llsnijan 2 ASH 2.5 1.7 0.4 0.3 0.6 0.4 0.7 0.4 0.3 0.3 0.1 0.1 - - - - - - - - 2.3 1.5Manijan 3 ADB5 2.5 1. 7 0.2 0.2 0.4 0.3 0.6 0.4 0.7 0.4 0.5 0.3 0.1 8.1 - - - - - - 2.5 1.7Manijann4 ASH 0.0 0.1 - - - - - - 0.2 - 0.2 - 0.2 - 0.2 O.k - - - 0.8 0.1T..s3 and4 CIDA 0.8 0.6 0.2 0.2 0.2 - - - - - - - - - - - - - - - 0.4 0.2Rissdceans 3 Jspso Enia Hank 1.3 0.2 0.5 - 0.3 - 0.1 - - - - - - - - - - - - - 0.9 -T...ss awon ADS 1.1 0.3 0.3 0.1 0.3 0.1 0.2 - 4.1 - - - - - - - - - - - 0.9 0.2Tenggeri 1 and 2 - 4.2 4.2 - - 0.2 0.4 0.6 0.8 1.0 1.0 1.2 1.0 0.9 0.6 0.4 0.4 - - - - 4.2 4.2Teeggari 3 sod 4 - 3.4 3.4 - - - - - - - - - - 0.2 0.2 0.6 0.6 0.8 0.8 1.0 0.8 2.6 2.4Sadaa8 1-3 - 21.0 21.9 - - 1.2 2.1 3.3 4.5 3.4 5.4 6.6 5.4 4.5 3.3 0.9 1.2 - - - - 21.9 21.9Sentasi 1 and 2 - 3.4 1.6 0.2 0.2 0.4 0.4 0.9 0.4 1.0 0.4 0.6 0.2 0.2 - - - - - - - 3.2 1.6Sentani 3 and 4 - 3.4 1.6 - - - - - - - - 0.2 0.2 0.4 0.4 0.8 0.4 1.0 0.6 0.6 0.2 3.0 1.6Ay.ng - 2.1 2.1 - - 0.1 0.2 0.3 0.4 0.5 0.5 0.6 0.5 0.4 0.3 0.2 0.2 - - - - 2.1 2.1
Total hyd-n Plants 2. 5 1.4 4.4 4.3 7.1 7.- 2 0.5 9. 10.0 7.7 6.8 4. 9 3.1 2.9 1.8 1.2 1.6 1.0 46.8 38.7(b) Las turbines
Palsbabsg CODA 1.5 0.4 0.1 - - - - - - - - - - - - - -0.1 -Mad.nIand 2 PAROSBAS 4.0 1.0 0.4 - - - - - - - - - - - - - - -0.4-
Tute1loan t.rbines 0.5 -.5-
()Scattered diesel includes Dotch
frogron 7. 37.0 97 3.7 8.,7 3.7 8.7 377 3-73.I 7 8. . 9737 8. 3.7-8. 3.7 7. .6 11. 32.(d) Steen turbise.
(1 Oil-fire.dBelowo I and 2 Togoslavin 36.6 7.4 1.9 1.2 9.2 2.2 14.6 2.6 7.4 1.2 3.6 0.2 - -- - - - - - 36.6 7.4Bol-wn. 3 and 4 - 69.9 29.9 - - - - - - - - 3.4 4.4 17.4 9.0 27.8 10.4 14.0 4.4 7.2 1.6 69.8 29.8Sands Aceh l and 2 - 9.9 3.8 - - 0.4 0.6 2.2 1.2 3.4 1.4 1.9 0.6 1.0 - - - - - - - 8.8 5.8Tallo Laea I - 5.2 2.2 - - - - - - - - 0.3 0.3 1.3 0.7 2.1 0.8 1.0 0.3 0.5 0.1 5.2 2.2Tall. La- 2 and 3 - 10.4 4.4 - - - - - - - - - 0.6 0.6 2.6 1.4 4.2 1.6 2.0 0.6 9.4 4.2Kupeng I - 4.4 1.9 - - 0.2 0.3 1.1 0.6 1.7 0.7 0.9 0.3 5.5 - - - - - - - 4.4 1.9K.ipang 2 - 4.4 1.9 - - - - 0.2 0.3 1.1 0.6 1.7 0.7 0.9 0.3 0.3 5 - 4.4 1.9Balikpapan I - 4.4 1.9 - - 0.2 0.3 1.0 0.6 1.7 0.7 0.9 0.3 0.5 - - - - - - 4.4 1.9Halikopapso 2 - 4.4 1.9 - - - - 0.2 0.3 1.1 0.6 1.7 0.7 0.9 0.3 0.5 - - - 4.4 1.9b.ind I and 2 - 49.8 29.8 - - - - - - - - - - - - 3.4 4.4 17.4 9.0 27.8 10.4 48.6 23.8AcehlIand 2 - 17.4 7.4 - - - - - - - - - - - - - - - - 0.8 1.2 08. 1.2SuabsrlIand 2 - 17.4 7.4 - - - - - - - - - - - - - - - - 0.8 1.2 0.9 1.2Su-1 Iland 2 - 69.8 29.8 - - - - - - - - - - - - - - - - 3.4 4.4 3.4 4.4Kalti. Iond 2 - 49.9 29.8 - - - - - - - - - - - - - - - - 3.4 4.4 3.4 4.4Kspng 3send 4 - 19.4 7,4 - - - - - - - - - - - - - - 0. 12 .12DilillandZ - 17.4 7.4 - - - - - - - - - - - - - - - - 0.9 1.2 0.9 1.2
La Genthernal plants onittad.Medan c0a1-firod plants onitted.
Notes: F -Foreign rustL L- Lcl cot
R.eof onchange: US$1.00 - Hp 415

INDONESIA
PERUSAH1AAN USMUM LISTRIK NEGARA (PLN)
SEVENTH POWER PROJECT
Forecast Capital Expenditures(In Rp billion)
Fi.cal years ending March 31 Source of Total project 1977/78 1978/79 1979/80 1980/81 1981/82 1982/83 1983/84 1984/85 1985/86 1977/78 - 1985/B6foreign cost -------- Total ---------
financiog F L F L F L F L F L F L F L F L F L F L F L
(ii) Cosl (duai)-firedOmbilin I - 4.4 1.9 - - - - 0.2 0.3 1.1 0.6 1.7 0.7 0.9 0.3 0.5 - _ _ - - 4.4 1.9GObilip 2 and 3 - 8.8 3.8 - - - - - - 0.4 0.6 2.2 1.2 3.4 1.4 1.8 4.6 1.0 - - - 8.8 3.8Bukit Ream sand 2 - 17.4 7.4 - - 0.8 1.2 4.4 2.2 7.0 2.6 3.4 1.2 1.8 0.2 - - - - - - 17.4 7.4Bukit ARa. 3 and 4 - 17.4 7.4 - - - - 0.8 1.2 4.4 2.2 7.0 2.6 3.4 1.2 1.8 0.2 - - - - 17.4 7.4
Total steam turbines 1.8 1.2 10.8 4.6 24.8 9.3 29.3 11.2 28.b 13.2 32.6 14.0 41.0 17.8 37.6 15.3 47.5 26.3 254.0 112.9
Total Ge=eratiun 13.5 6.3 23.9 12.6 40.6 20.2 47.5 23.0 47.3 24.6 4d.1 22.6 52.8 24.4 48.1 20.2 56.9 29.9 378.7 183.8Tronominnios lines 0.6 0.3 1.4 0.9 4.3 2.4 10.4 5.7 14.6 5.1 6.7 2.5 4.6 1.6 1.9 0.7 3.7 2,5 48.2 21.7Substations 0.9 0.2 0.8 0.2 1.3 0.5 3.9 1.3 5.6 1.1 2.3 0.5 1.7 0.4 1.1 0.2 1.9 0.7 19.5 5.1Distributiop 3.4 3.5 4.9 6.3 10.4 11.2 13.2 13.8 15.7 16.0 18.2 18.2 18.7 16.6 25.5 22.7 24.1 26.3 134.1 134.6
TOTAL CAPITAL EXPENDITURES (OTHER AREAS) -1977 PRICES 18.4 10.3 31.0 20.0 56.6 34.3 75.0 43.8 83.2 46.8 75.3 43.8 77.8 43.0 76.6 43.8 86.6 59.4 580.5 345.2
28.7 51.0 90.9 118.8 130.0 119.1 120.8 120.4 146.0 925.7
Price osculation - - 2.3 2.6 8.8 8.5 17.7 15.8 26.9 22.2 31.3 25.8 40.1 30.3 47.6 36.3 63.6 57.2 238.3 198.7_ 4.9 17.3 33.5 49.1 57.1 70.4 83.9 120.8 437.0
TOTAL CAPITAL EYPENDITORES (OTHER AREAS) -CURRENT PRICES 18.4 10.3 33.3 22.6 65.4 42.8 92.7 59.6 3 10.1 69.0 106.6 69.6 117 9 73 3 124.2 80.1 150.2 116.6 .8 563.9
28.7 5.5.-9 108.2 152.3 179.1 176.2 197.2 204.3 266.8 136.
Capital .. pe.dit.ren expreshed in05$ million eg.iv-l-nt:
At 1977 price- 44.3 24.8 74.7 48.2 136.4 82.6 180.7 105.5 200.5 112.8 181.5 105.5 187.5 103.6 184.6 105.5 208.7 143.1 1,398.9 831.669.1 122.9 219.0 286.2 313.3 287.0 291.1 290.1 351.8 2,230.5
At current prices 44.3 24.8 80.2 54.5 157.6 103.1 223.4 143.6 265.3 166.3 256.9 167.7 284.1 176.6 299.3 193.0 361.9 281.0 1,973.0 1,310.669.1 134.7 260.7 367.0 431.6 424.6 460.7 492.3 642.9 3,283.6
Notes; P = Foreign costL- Local costhate of excha=ge: US1.00 - Rp 415. en

INDONESIA
PERUSAHAAN UMUM LISTRIK NEGARA (PLN)
Seventh Power Proiect
Actual and Forecast Income Statements(in Rp billion unless otherwise indicated)
Actual /a Forecast1971-73: FY ending December 31 1971 1972 1973 1974/ 1975/ 1976/ 1977/ 1978/ 1979/ 1980/ 1981/ 1982/ 1983/ 1984/ 1985/1974/75 onwards: FY ending March 31 75 /b 76 77 78 79 80 81 82 83 84 85 86
Sales of power (GWh) 1,786 1,893 2,175 2,444 2,804 3,089 3,581 4,339 5,298 6,467 7,885 9,614 11,630 13,951 16,814
Average revenues per kWh sold (Rp) 8.62 8.98 11.13 16.37 21.83 27.06 30.50 32.00 38.00 40.87 41.29 47.65 50.93 55.29 54.00Increase in average revenues (%) - 4.2 23.9 47.1 33.3 24.0 12.8 4.9 18.8 7.6 1.0 15.4 6.9 8.6 -
Operating revenuesRevenues from sales of power 15.4 17.0 24.2 40.0 61.2 83.6 109.2 138.8 201.3 264.3 325.6 458.1 592.3 771.4 907.9Other operating revenues 1.1 1.7 0.3 0.3 0.5 0.4 0.5 1.2 2.6 4.2 4.5 6.4 6.9 7.4 8.0Total operating revenues 16.5 18.7 24.5 40.3 61.7 84.0 109.7 140.0 203.9 268.5 _330.1 464.5 599.2 778.8 915.9
Operating expensesPurchased power 0.7 0.7 0.8 1.2 1.2 1.1 1.5 1.7 1.8 2.0 2.1 2.3 2.4 2.6 2.8Fuel 3.3 4.4 5.6 7.9 13.5 21.0 29.3 40.9 56.5 71.8 95.6 139.9 196.1 236.9 280.8Personnel expenses ) 5.7 7.5 10.9 14.6 18.9 28.7 40.3 50.6 57.0 66.0 74.9 85.2 95.2 108.4Material and other expenses for ) 8.5
operation, maintenance andadministration ) 4.7 6.0 9.0 13.8 21.2 24.6 28.9 36.6 49.0 60.5 73.6 91.6 108.0 126.3Depreciation 9.6 10.4 11.7 12.4 13.5 16.6 21.3 27.3 33.2 45.9 63.9 83.1 106.4 133.3 166.9Total operating expenses 22.1 25.9 31.6 41.4 56.6 78.8 105.4 139.1 178.7 225.7 288.1 373.8 481.7 576.0 685.2
Net operating income -5.6 -7.2 -7.1 -1.1 5.1 5.2 4.3 0.9 25.2 42.8 42.0 90.7 117.5 202.8 230.7Other income (net) 0.4 0.4 -0.6 -1.4 -6.0 -6.3 -3.9 -4.9 -6.6 -6.3 -9.0 -10.4 -11.9 -13.1 -14.8
Interest - - - - - 0.4 1.5 4.3 12.0 22.4 35.2 51.5 68.2 85.0 114.3Interest during construction - -0.4 -1.3 -4.3 -11.1 -21.5 -34.0 -43.9 -52.1 -59.3 -77.8Interest charged to operation - - - _ - - 0.2 - 0.9 0.9 1.2 7.6 16.1 25.7 36.5
Profit/loss -5.2 -6.8 -7.7 -2.5 -0.9 -1.1 0.2 -4.0 17.7 35.6 31.8 72.7 89.5 164.0 179.4Adjustments 0.4 0.7 6.5 0.8 -1.1 -0.6 - - - _ - - - - -
Profit/loss after adjustments -4.8 -6.1 -1.2 -1.7 -2.0 -1.7 0.2 -4.0 17.7 35.6 31.8 72.7 89.5 164.0 179.4
Rate of return on average netfixed assets in operation (%) - -7.2 -6.3 - 4.0 3.6 2.1 0.3 7.3 8.3 5.1 7.9 7.6 9.8 8.5
Operating ratio (%) 134 139 129 103 92 94 96 99 88 84 87 80 80 74 75
/a Due to deficient recording, the data before 1973 are unreliable and shown only to indicate the trend at that time.
/b First quarter 1974 omitted.
Rate of exchange: US$1.00 = Rp 415.

INDONESIA
PERUSAHAAN UMUM LISTRIK NEGARA (PLN)
SEVENTH POWER PROJECT
Actual and Forecast Sources and Applications of Funds Statements(in Rp billion)
Actual /a Forecast Total
1971-73: FY ending December 31 1971 1972 1973 1974/ 1975/ 1976/ 1977/ 1978/ 1979/ 1980/ 1981/ 1982/ 1983/ 1984/ 1985/ 1977/78
1974/75 onwards: FY ending Msrch 31 75 /b 76 77 78 79 80 81 82 83 84 85 86 through1985/86
SOURCES
Internal sourcesNet operating income -5.6 -7.2 -7.1 -1.1 5.1 5.2 4.3 0.9 25.2 42.8 42.0 90.7 117.5 202.8 230.7 756.9
Depreciation 9.6 10.4 11.7 12.4 13.5 16.6 21.3 27.3 33.2 45.9 63.9 83.1 106.4 133.3 166.9 681.3
Consumers' contributions 3.2 2.7 5.3 14.8 17.4 19.5 25.0 36.0 45.0 55.0 62.0 71.0 78.0 78.0 68.0 518.0
Other income (net) 0.4 -0.4 -0.6 -1.4 -6.0 -3.7 -3.9 -4.9 -6.6 -6.3 -9.0 -10.0 -11.9 -13.1 -14.8 -80.9
Net revenues 7.6 5.5 9.3 24.7 30.0 37.6 46.7 59.3 96.8 137.4 158.9 234.8 290.0 401.0 450.8 1.875.7
Less: Debt serviceAmortization - - - - - - 1.5 - 0.4 0.7 1.0 6.9 16.0 27.2 51.7 105.4
Interest - - - - - - 0.2 - 0.9 0.9 1.2 7.6 16.1 25.7 36.5 89.1
Total debt service - _- - - - - 1.7 - 1.3 1.6 2.2 14.5 32.1 52.9 88.2 194.5
Net variations in working capital
other than cashAccounts receivable 1.2 -0.5 4.7 3.4 3.5 5.6 2.5 6.0 9.0 12.0 17.0 21.0 27.0 33.0 41.0 168.5
Materials and supply 1.1 2.5 10.8 6.0 5.3 6.0 5.2 10.0 6.0 7.0 9.0 8.0 10.0 7.0 7.0 69.2
Other working capital (net) -0.1 -2.0 4.3 3.0 6.7 2.6 -5.0 -1.0 - -3.0 -5.0 -4.0 -4.0 -7.0 -6.0 -35.0
Total variations 2.2 - 19.8 12.4 15.5 14.2 2.7 15.0 15.0 16.0 21.0 25.0 33.0 33.0 42.0 202.7
Funds from internal sources 5.4 5.5 -10.5 12.3 14.5 23.4 42.3 44.3 80.5 119.8 135.7 195.3 224.9 315.1 320.6 1,478.5
External sourcesGovernment contributions 2.2 15.0 34.1 77.1 167.5 145.6 161.8 167.0 227.5 264.3 331.6 351.9 322.2 299.1 461.1 2,586.5
Borrowings - - - - 0.7 4.4 10.0 72.5 115.6 149.6 192.4 237.6 251.0 274.9 315.7 1,619.3
Total external sources 2.2 15.0 34.1 77.1 168.2 150.0 171.8 239.5 343.1 413.9 524.0 589.5 573.2 574.0 776.8 4,2Q5.8
TOTAL SOURCES 7.6 20.5 23.6 89.4 182.7 173.4 214.1 283.8 423.6 533.7 659.7 784.8 798.1 889.1 1.097.4 5.684.3
APPLICATIONS
Capital expendi lures
Foreign expenditures ) ) ) ) ) 140.7 86.3 117.6 136.3 208.9 256.2 316.8 387.3 397.7 431.2 512.8 2,764.8
Local expenditures ) 5.8) 19.4) 22.1) 78.0) 45.9 74.3 88.9 137.2 197.6 250.0 303.9 346.6 341.3 391.6 498.8 2,555.9
Interest during construction ) ) ) ) ) - 0.4 1.3 4.3 11.1 21.5 34.0 43.9 52.1 59.3 77.8 305.3
Total capital expenditures 5.8 19.4 22.1 78.0 186.6 161.0 207.8 277.8 417.6 527.7 654.7 777.8 791.1 882.1 1.089.4 5,626.0
Variations in cash 1.8 1.1 1.5 11.4 -3.9 12.4 6.3 6.0 6.0 6.0 5.0 7.0 7.0 7.0 8.0 58.3
TOTAL APPLICATIONS 7.6 20.5 23.6 89.4 182.7 173.4 214.1 283.8 423.6 533.7 659.7 784.8 798.1 889.1 1.097.4 5,684.3
Net internai cash generation
as percentage of capitalexpenditures qX) - 28.4 -47.5 15.8 7.8 14.5 20.4 16.0 19.3 22.7 20.7 25.1 28.4 35.7 29.4 26.3
Same as above bc t three-yearsliding average (X) - - - - - 11.8 14.4 17.0 18.5 20.0 21.0 23.0 25.0 30.0 31.1 -
Debt service coverage - - - - - - - - - - - 16.2 9.0 7.6 5.1 -
/a Due tc deft ient recording, the data before 1973 are unreliable and shown only to indicate the trend at that time.
/b First _':ux 1974 omitted.
Rate of eY.' US$1.00 - Rp 415.

INDONESIA
PERUSAHAAN UMUM LISTRIK NEGARA (PLN)
SEVENTH POWER PROJECT
Actual and Forecast Balance Sheets(in Rp billion)
Actual /a Forecast197L-73: FY ending December 31 19971 2 1973 1974/ 1975/ 1976/ 1977/ 1978/ 1979/ 1980/ 1981/ 1982/ 1983/ 1984/ 1985/1974/75 onwards: FY ending March 31 75 /b 76 77 78 79 80 81 82 83 84 85 86
ASSETS
Fixed assetsGross fixed assets in operation 109.6 133.9 166.4 198.8 228.9 305.6 429.0 565.7 699.9 1,087.7 1,548.1 2,011.0 2,700.0 3,445.5 4,423.2Accumulated consumers'
contributions -5.8 -8.5 -13.8 -23.5 -40.9 -63.Q -88.0 -124.0 -169.0 -224.0 --286.0 -357.0 -435.0 -513.0 -581.0Accumulated depreciation -9.6 -19.9 -31.8 -47.0 -61.0 -78.1 -99.4 -126.7 -159.9 -205.8 -269.7 -352.8 -459.2 -592.i -759.4Net fixed assets in operation 94.2 105.5 120.8 128.3 127.0 164.5 241.6 315.0 371.0 657.9 992.4 1,301.2 1,805.8 2,340.0 3,082.8Work in progress 37 0 33.8 23.4 117.4 274.1 358.3 442.7 583.8 867.2 1,007.1 1,201.4 1,516.3 1,618.4 1,755.0 1,866.7Total net fixed assets 131.2 139.3 144.2 245.7 401.1 522.8 684.3 898.8 j1 238.2 1,65s_ 2j93.8 7.5 3,424.2 4,095.0 4,949.5
Current assetsCash 5.5 6.6 8.1 20.1 16.2 28.7 35.0 41.0 47.0 53.0 58.0 65.0 72.0 79.0 87.0Accounts receivable 3.2 2.7 7.4 10.4 14.9 20.5 23.0 29.0 38.0 50.0 67.0 88.0 115.0 148.0 189.0Materials and supply 5,5 8.0 18.8 19.5 24.9 30.8 36.0 46.0 52.0 59.0 68.0 76.0 86.0 93.0 100.0Other current assets 2.6 6.4 18.4 11.0 12.9 16.0 24.3 28.3 33.3 37.3 42.3 46.9 52.9 58.9 69.9Total current assets 16.8 23.7 52.7 61.0 68.9 96.0 118.3 144.3 170.3 199.3 235.3 275.9 325.9 378.9 445.9
TOTAL ASSETS 148.0 163.0 196.9 306.7 470.0 618.8 802.6 1,043.1 1,408.5 1,864.3 2,429.1 3,093.4 3,750.1 4.473.9 5,395.4
LIABILITIES
EquityAccumulated Government
contributions 146.6 167.0 207.8 309.5 468.1 617.1 778.9 945.9 1,173.4 1,437.7 1,769.3 2,121.2 2,443.4 2,742.5 3,203.6Accumulated profit/loss -6.8 -12.3 -13.6 -8.2 -10.0 -11.7 -11.5 -15.5 2.2 37.8 69.6 142.3 231.8 395.8 575.2Total equity 139.8 154.7 194.2 301.3 458.1 605.4 767.4 930.4 1,175.6 1,475.5 _1,838.9 2,263.5 2.675.2 3,138.3 3,778.8
Long-term debt - - - - 8.1 11.0 19.5 92.0 207.2 356.1 547.5 778.2 1,013.2 1,260.9 1,524.9
Current liabilities 8.2 8.3 2.7 5.4 3.8 2.4 15.7 20.7 25.7 32.7 42.7 51.7 61.7 74.7 91.7
TOTAL LIABILITIES 148.0 163.0 196.9 306.7 470.0 618.8 802.6 1,043.1 1,408.5 1,864.3 2,429.1 3,093.4 3,750.1 4,473.9 5,399.2
Debt/equity ratio 0/100 0/100 0/100 0/100 2/98 2/98 2/98 9/91 15/85 19/81 23/77 26/74 27/73 29/71 29/71
/a Due to deficient recording, the data before 1973 are unreliable and shown only to indicate the trend at that time.
/b First quarter 1974 omitted. z
Rate of exchange: US$1.00 = Rp 415.

ANNEX 10Page 4
INDONESIA
PERUSAHAAN UMUM LISTRIK NEGARA (PLN)
SEVENTH POWER PROJECT
Notes and Assumptions on Financial Data
Sales of Power
The forecasts of electricity sales are based on the mission's bestestimates of the market share PLN will be able to satisfy. As shown in Annex1, this results in annual sales increases of 12% to 22% between FY1977 and1983, gradually decreasing to lower growth rates thereafter. The high growthrates in the earlier years are expected to occur because PLN has already madelarge investments in distribution facilities (particularly in Java) whichafter commissioning of generation capacity, presently under construction,will permit it to pick up demand with only minor additional investment.
Revenues from Sales of Power
Starting from the 1977/78 budget level of average Rp 29 per kWh,tariff projections and increases believed to be feasible have been includedin the forecasts.
Purchased Power
The bulk of the power purchases is from the Juanda hydroelectricstation (Jatiluhur Authority) and amounts at present to Rp 1.47 per kWh(USj0.35 per kWh). This expense increases in step with PLN's tariffadjustments.
Fuel
Present fuel prices (effective April 1, 1976) are (at PERTAMINAterminal):
Bunker "C" Oil : Rp 22 per litre /1High Speed Diesel (HSD) Rp 25 per litreIndustrial Diesel (IDO) : Rp 22 per litre
In addition there are surcharges for the cost of transportation which varyaccording to the location of the power stations. On average the charges areRp 0.55 per litre for Bunker C, Rp 1.237 per litre for HDS and Rp 4.4 perlitre for IDO.
/1 This is equivalent to US$8.43 per barrel and compares to about US$11.60per barrel in the world market. Indonesia's oil price is based onPERTAMINA's cost plus about 20% profit margin.

ANNEX 10Page 5
The cost of coal for the planned Suralaya power station is not knownyet. For the financial projections the comparative prices with the worldmarket price of crude oil resulting from the study undertaken by the MontrealEngineering Company (MONENCO) have been assumed. They are:
US$24.98 per metric ton plus 10% (mission assumption)to allow for 1977 price escalation (at a discount rateof 10%).
Assuming a specific consumption of 0.5 kg per kWh generated, the resultingproduction cost is Rp 5.70 (USt 1.37) per kWh.
To take into account future inflation, 10% price escalation per yearhas been assumed.
Personnel Expenses
The projections of personnel costs are based on PLN's staffing planswhich assume increases from presently about 21,000 to 27,000 in FY 1986 (opera-tion personnel from 16,200 to 19,900).
Material
The cost for materials and supplies has been increased in step withthe commissioning of the projected plant.
Depreciation
The depreciation rates are those used by PLN in the past and appliedin other countries for similar type of plant. On an average these are 5% peryear for thermal plant, 2.5%, for hydroplant and 3.5% for transmission and dis-tribution equipment.
Consumers' Contributions
Consumers' capital contributions have been assmad to reach theirpeak in FY1984 gradually receding to lower levels later.
Borrowing and Debt Service
It must be assumed that the Government, the only source of capitalin Indonesia, will only gradually shift to lending at a large scale. Inparticular, it is likely that the ongoing projects will continue to be financedthrough equity. The assumed average terms of the loans are 19 years,including four years of grace, and 9% interest per year (capitalized andfinanced during the grace period).

IBRD 12435R1
f080 .41100 712 SEPTEMBER 1977
This Sp hos boo 01prord by lEo W otlt 4 W.#d Book's off ..d.ooieOlY fo th ISo-oe-o INDONESIASUAfA TEJ ~ ~~~~~~~~~~~~~~~~of the roodoro of (So6 ,oM0o, to ofioh it;i,s att-fted, The da-f,oi-ooio-o ood atd the
SUMfA TERA t t .nbwd4,ies ehose op 7isp ehdo cdt ieplyr, op the polt of the W9rld fsk nd It7
Jfoie otgdapi5tgenon thoeho fOfeI stitw osofoy teity oryooy pdoreost or JAVA POWER SYSTEMMAJO R POWER PLANTS AND MAIN TRANSMISSION LINES
tX Suralava : : t EXISTING AND PROPOSED
Kookata.usteot\\ \P,G S. \\ ;; :: f : Q f Q O PUEOW $JBSTATIONS TRANSMISSION LINES-61 ~~~~~~~~~~~~~~~~~~~~~~~~~~~~~~~~STATIONS EV tEe H Ek
KrakataLfSteel TA. EHV 160k~~~~~~~~~~ EHV 150k~~~~*EXISTING
0S * *L UNDER CONSTRUCTION/COMMITTED FORb, ~~~~~ ~ ~~~~~JA VA SEA COMPLETION BY 1O80I81
Si ''1 <; n blJXJVA St s _-FUTURE DEVELOPMENT BEYOND 1981
* S * - ~~~~~~PROJECT LOCATION
Jatiluhur xii PLN'S WILAYAH NUMBERSS/r; ;\a I \ Padarang _ * WILAYAH OR DISTRIBUSI HEADQUARTERS
D < C a- jus ff = go < < z ,r iImbor4 a PLN'SWILAYAH BOUNDARIES
~ PeKaI0l~Q9aS SEMARANG/
/-~~~~~~~~a ung ungr\ uneedoo Jatigede 2 jPSt MA j.ti P)seo o ~ eo
r-. moiang -AI JAVA
ay. AkeS B. -* o. Kwoo Y ; IiIBAYA
asikmalBlabak Yoy ,SoT. " diun MoMoke§> , 8°-Ba aen --- _*raite Teoomades W ~ Pera
:aa : 8 Yogyakarta S. -\ \ Bang,Ir ,,,lage?~~~~~~~~~ ~~ ~ ~~~~~~~~~~~ Seap !la di. m o/eir
_ 3 : < o EASTJAVA / Proboliggo
ce-Ik.namlgl log, Moloo
Muara KiranogE onrg Priok I.Wlingi -
CY) ~~~~~~~~~~~~~~~~~'T ~~~~~~~~~~~~~ Koroog~~~~~~~~~~~~~~~~~~~~~katesTangern -.z 5J ._,s_Kogardungk ate s Jember
Cosang JA VA SEA.. ' , / POoOjC7 ... 7oDemak INDtAN OCEAN
I (K)"/ > * KaI,oy TE cO _ 0 2
7. v W eleri . West Sema-rag MlLES
SCibi-ong Jatq,- ;.-
.KIOMETERS
Btogor 1'0 \ :
EJelok |; 110t 1 114°

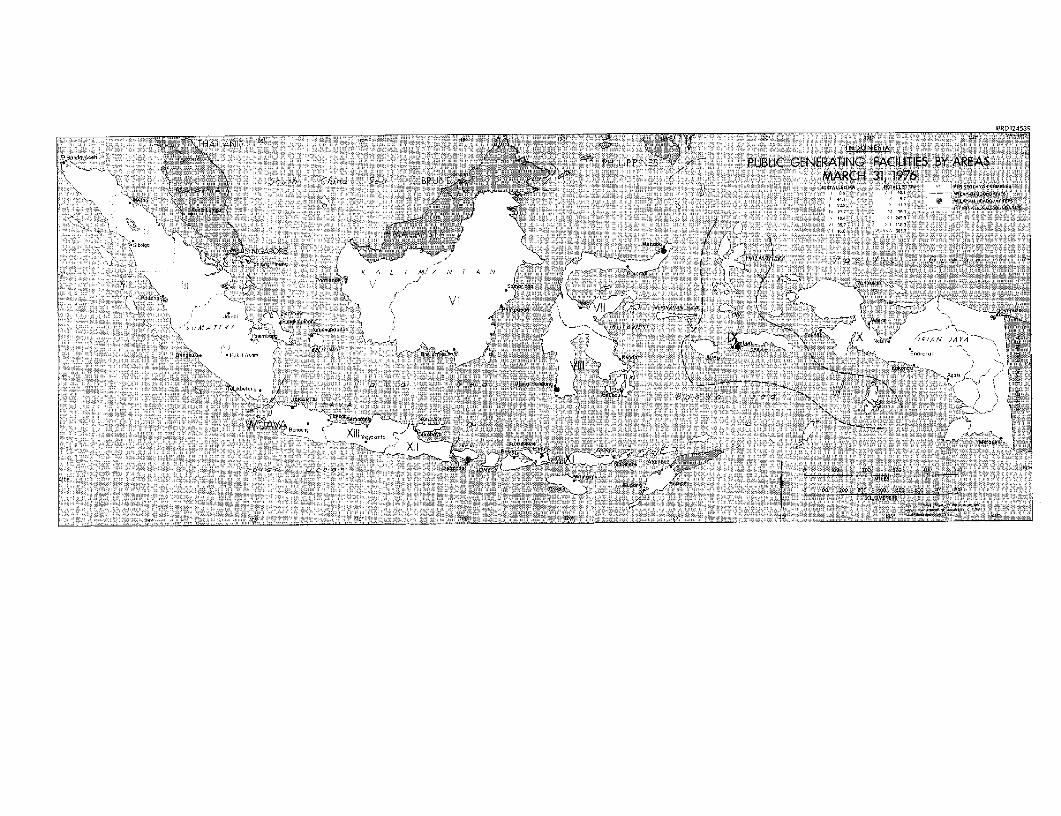
lBkD]2453R
HAILAN iNDONESI M-l-
PHI- -s PLIBLIC GENERATINQ: FACILITIES BY AREAS50,1h C-h in o 56 a BRU MARCH 31,10�
AkA -TAL.. W .. L.YA. $O�WW
1 '2�
V�,
�,bdg..J Lm4jERA
L- 0
K A L I M/ N T A NJ
A
Lm A 'FR 5 IN 'IRIAN
s., �6pr I bA I A�- E-0.
0 v 0 VOWPoodwg
JAKARTA Bo n o'a Se a
41
40"Aws
n c 66 0 w �w 466 W,
Kpl
NO 'g, 90
iw