Embed Size (px)
Citation preview
Report No. 7478-GU
GuatemalaPublic Sector Expenditure Review
May 23, 1989
Country Department IILatin America and Caribbean Regional Office
FOR OFFICIAL USE ONLY
Document of the World Bank
This document has a restricted distribution and may be used by recipientsonly in the performance of their official duties. Its contents may not otherwisebe disclosed without World Bank authorization.
Pub
lic D
iscl
osur
e A
utho
rized
Pub
lic D
iscl
osur
e A
utho
rized
Pub
lic D
iscl
osur
e A
utho
rized
Pub
lic D
iscl
osur
e A
utho
rized
CURRENCY EQUIVALENTS
US$1 = 2.70 Quetzales (Q)
ABBREVIATIONS AND ACRONYMS
AVIATECA - Empresa Guatemalteca de Aviacion (Guatemalan Aviation Company)BANDESA - Banco Nacional de Desarrollo Agricola (National Bank for
Agriculture Development)BANVI - Banco Nacional de la Vivienda (National Housing Bank)CABEI - Central American Bank for Economic IntegrationEEGSA - Empresa Electrica de Guatemala (Guatemalan Electric Company)EMPAGUA Empresa Municipal de Agua Potable (Municipal Water Supply Co.)EPNSTC - Empresa Portuaria Nicional Santo Tomas de Castilla (Santo Tomas
de Castilla National Port Company)PrGUA - Ferrocarriles de Guatemala (Guatemalan Railway Company)GUATEL - Empresa Guatemalteca de Telecomunicaciones (Guatemala
Telecommunications Company)IDB - Inter-American Development BankICTA - Instituto de Ciencia y Technologia Agricolas (Institute of
Science and Agricultural Technology)IGSS - Instituto Guatemalteco de Seguridad Social (Guatemalan Social
Security Institute)INDE - Instituto Nacional de Electrificacion (National Electricity
Company)INDECA - Instituto Nacional de Comercializacion Agricola (National
Agricultural Marketing Institute)INFOM - Instituto de Pomento Municipal (Municipal Development
Institute)INTA - Instituto Nacional de Trarsformacion Agraria (National
Institute for Agrarian Reform)MCTOP - Ministry of Communications, Transport and Public WorksMSP - Ministry of Public HealthNGOs - Non-Governmental OrganizationsSEGEPLAN - Secretaria General de Planificacion (General Planning Office)UNDP - United Nations Development ProgramUNEPAR - Executing Unit for Rural Water SupplyUSAID - United States Agency for International Development
FISCAL YEAR
January 1 to December 31

FOR OFFCIAL USE ONLY
Page 1 of 2COUNATRY DATA - CUATOKALA
AREA POPULATION D8D&ITY (1986)
108 9 thcus. sq he. In sIllion 8.438 (1q87) 77.5 per sq. kme.Rate of 0rowth: 2.92 (1980-8S) 269.5 per sq. km. of agricultural land
POPUJLATION CH4ARACTERISTICS 1965 1973 1966 IeALTH (1986)
Crude B3irth R&.t* (per 1000) 46 45 40 Populetion per physician 8.600Crude Death Roet (per 1000) 17 1a 10 Populati~ o, e hosputel bed 800Infant Mortality (per 1000 line births) 112 92 65
INCOME OISTRIOUION (Pri-. Ir.con,. Recoi.*d by) 1973 1986 ACCESS T0 ELEACTRICITY (1966)
Highest 20 percent 601 889 1 of d.ellina* - total 37.2
Lo.ast. 20 percent 88 61L.eeot 40 percent 131 148 ESUCATION 1965 1973 1986
ACCESS TO SAFE WATER 1965 1973 198$ Enrolleent Rates:
------ ----- ----- ------ ----- ----- ------ -- -- - --- ---- PrissryF Total 508 616 761Percent of population:
Total 11 39 51 Malo 655 6716 801
Urban 30 as 9 Female 451 883l 721Rurel 2 14 26 Secondary: Total as 121 171
Kael 101 121 171MfEIRITION 1968 1973 1988 Feeale 71 111 161
nenFood Produccion Por Capita (1979.100) 54 78 108 (INP PER CAPITA 1985 1973 1956rer Capita Supply of Calories/day 2.028 2.1.50 2.345----------------- -- --- -P., Capita Supply of Proteins grass/day 57 57 61 (Current US Dollars) 300 430 930
1980 1966 1967 AAB6UAL GROWTH RATES (N, conset, prices)
CROSS NATIONAL PRODUCT oilI. QI ODP oil. Q 8 CDP sil. Q I CDP 1968-73 1973-60 1980-65 196 1966 1987
MOP at earkat prices 7.679 100.0 15.8363 100.0 17.595 100.0 6.1 F.S -0.5 -0.6 0.1 3.1Groom Do...stic In-esteent 1.252 16 1.637 10.3 2,431 13.8 5.2 7.0 -8.1 -19.1 0.2 31.4Cros National Sacings 1.075 13.6 1.481 9.4 1.037 5.9 7.9 3.2 -14.5 -22.6 34.1 -4.8
Curre nt Account Balance (176) -2.2 (93) -0.6 (1,394) -7.9 nt.&. n.a. n... n.e. n.a. n.a.Eaports of Goode A NPS 1.748 22.2 2,542 16.1 2,807 16.0 7.0 5.2 -4.6 3.1 -14.0 6.0Ia.p.rt. of Goo~ds A NFS 1,96 24.9 2.311 14.6 3.948 22.4 3.3 5.6 -9.9 -12.6 -14.7 47.1
Value Added Labor Porce V.A. per Worber
OUTPUT, LABOR FORCE AND PROODUCTIVITY 1960 1967 1980 1987 1960 1967
(Constant 1980 Prices) oil. Q (1) oil. Q (1) EsplO00 (1) Emol.000 (I) Quatnal (1) Quetonl (1)
Aqriculture 1.958 24.8 1.978 25.7 1.034 49.4 838 36.2 1,894 44.6 2.360 69.2Industry 1.733 22.0 1,54S 20.1 384 16.9 378 16.3 4.890 115.1 4.084 119.7se-i~ces 4.189 83.2 4.166 54.2 703 33.6 1,089 47.8 8,958 140.3 3.792 111.1
TotalI/A,-ra,o 7.879 100.0 7,689 100.0 2.091 100.0 2,318 100.0 4.247 100.0 3.412 10000
N,llion Quetoslee As percent of current CDP
CONSOLIDATED NONFINANCIAL PUBoLIC SECTOR 1981 1962 1983 1964 1988 1986 1987 1981 1982 1983 1964 1988 1988 1987
A. TVotal Curre.nt Renenun 974 1012 964 983 1162 1i81 2144 11.3 11.8 10.9 10 4 10 8 it 1 12 8.
Total Curr,nt E.penditure b,77 878 678 952 1038 1605 1974 10.2 10.1 9.7 10 1 9 - 10.1 II 2
C Current. 8Balec. 97 134 107 33 146 147 170 1.1 1.8 1.2 0.3 1 3 0. 1 o
0. C.P,tal R-on..uea 9 16 10 6 5 64 90 0.1 0.2 0.1 0.1 00 0 4 0 SE Capital E.penditurne 724 546 413 380 301 314 467 6 4 6.3 4.6 3.8 2 7 2 0 92 8
1 Fi..d Capital Forestion 682 810 366 306 259 297 428 7.9 8.9 4.3 3.2 2 3 1 2 42 Other Cap,tal Expenditures 42 38 26 54 42 17 89 0.5 0.4 0.3 0.6 0.4 0 1 0 3
C O,erall Bele-co -618 -396 .297 -322 -150 -103 -227 -7.2 -A.5 -3.3 -3.4 -1.3 -O 6 -1 31 off,cial Capital Grentt 1 1I 1 2 1 0 198 0.0 0.0 0.0 0.0 0 0 0 0 1 12. Net Fore.gn F..Pnc.ng 109 108 124 21 26 68 68 1.3 1.2 1.4 0 2 0 2 0 4 0 43 Net Donent.c F.na-nq. 808 283 172 299 123 35 64 5.9 3.3 1.9 3.1' 1 1 0 2 0 44 Other 0 0 0 0 0 0 -101 0.0 0.0 0.0 0 0 0 0 0 0 -06
This document has a testricted distribution and may be 'ised by recipients only in the performanceof their official duties. Its contents may not otherwise be disclosed without World Bar.k authorization.

Page 2 of 2COUNJTRY DATA - IRJATEOIALA
MONEY, CREDIT AND PRICES
(Million Q-atualas) 1980 1Q81 1982 1983 1984 1985 1986 1987
floe3 aid Quasi Money 1.692 1.907 2,191 2 155 2,399 3,193 3,875 4,166CIa; as on Governmenet (Net) as9 780 1.081 1i2n 1,54) ',703 1.244 981Claias on Private Sector 1,222 1,388 1,518 1,710 1,907 2,078 2,281 2.751Claima on Other Financial 29 72 21 44 38 24 18 37
Money and Quasi Money as I of 001' 21.5 22.2 25.1 23.8 25.8 28.8 24 5 23 7Co.u..e, Price Inden (1980n100) 100.0 111.4 111.8 118.8 120.8 143.4 198 4 220.9
Annus' percentage changes in:C.onsume Price 1nden 10.71 11.41 0 41 4.61 3.41 18 71 37.01 12.51Claims on Govermeant (Net) 240.01 124 51 39.81 15 21 28.81 9 91 -27 01 -21.11Clie;s on Private Sector 95.31 147.41 -70.91 113.01 414.21 -23 71 -45.51 138.71
8ALAPCE OP PAYNDITS
(USS M;illone) 1980 fl81 1982 1Q33 1984 1985 1988 1Q87 MERCrIANDISE EX(PORTS
- ----- ------ ------ ------ -- --- ---- - -- --- ---- --- -- - ---- (Average 1980-87) mi. USI (1)Eaports of Goode and NFS 1,748 1,471 1,288 1.178 1,231 1,182 1,161 1,138 ---------------- ---
Marchandica (FOB) 1,520 1,291 1,170 1,092 1.132 1.060 1,044 978 Coffee 393 0 33 9
Non-Factor Services 228 180 118 84 99 102 117 159 Cotton 78 2 6.8
Sugar 85 7 5.7Imports of Goode and NFS 1,983 2.031 1.829 1,317 1,435 1,282 1,053 1,599 Banana 74.2 8 4
Morchendica (FOB) 1,472 :5b40 1.284 1.058 1,182 1,077 878 1.333 Meat 18 5 1.4
Non-Factor Services 491 491 345 281 253 185 17Q 285 Other 533.2 48.1
Reaource Balance (215) (581) (341) (141) (204) (101) 108 (482) Total FOB 1,180.8 100 0Net Factor Income (711 (103) (121) (113) (1-03) (188) (199) (172)
Factor Rec,.ipts 77 55 24 29 so so 33 31Factor Paysents 147 158 145 143 262 215 232 203 EXTERNAL DEBT (end period)(MLT interest paymen.ts) 80 83 77 89 95 114 208 178 (U.14Milos 1980 1988 1987
Net Current Transfers 110 91 83 31 29 20 51 70---------------- -- --- ..MALT Public & Pub. Guara. 551 2,151 2,084
Currant Account Balance (178) (573) (399) (224) (378) (287) (42) (584) Short Term Debt A IMF 335 323 508
Non-Guaran.teed Private Debt 282 119 118Long-Term Capital Inflos 244 407 350 298 147 101 184 2Q1------- ---
Direct Investmen.t a5 110 78 45 38 81 89 91 Total Outstanding & DisIurad 1,188 2.593 2,6888Official Cepitsl Grants 0 0 0 0 0 0 48 128
Net LT Loans (OAS data) 92 280 279 214 85 29 5 (147)Disbursements 170 344 337 317 254 285 184 171 DEBT SERVICE RATIORepayments 78 65 59 103 170 235 17Q 318 (percent) 1980 1Q88 1987
Other LT infloos (Net) 58 17 (7) 34 24 11 82 221---------------- -- --- --
MALT Public A Pub. Cuaro. 2.5 31.4 41.5Total Oth,er Iteas (Net) (387) (182) 22 (40) 249 71 (142) 233 Short Term Debt A IMP 1 7 8.8 2 8
Non-Guarantaad Private Debt 8 1 1.0 0 9
Changes in Net Resarva.(nn 319 348 28 (29) (18) 95 0 40 Total Outstanding A Diobureed 9.2 3Q 2 45.1Net cre.dit fron IMF 0 113 0 41 20 (49) (58) (20)
EXCHIANGE RATES 19630 1981 1982 1983 1984 1985 1988 1987 IBRD LENDOING (nl. USUI 1Q84 1985 1988 1987
Of.vical Rats: Commitments 50 0 44 8 0.0 0.0
Byett. par UISS (and period) 1 000 1.000 1.000 1.000 1.000 1.000 1.000 1 000Bust:, per USII (peri,d mug I 000 1 000 1.000 1.000 1.000 1 000 1.000 1.000 Gross Diebures-ent 7.9 48 6 17 0 11.7
Principal Repayment 13 8 14 2 17 0 22 0Banbing Rate: Net Disbureenant (5.7) 34 4 0.0 (10.3)Bust: par US15 (end period) - - - - - - 2.500 2 500 Interest Charges 12 4 It 4 21 0 23 0Bust:, Par US; (per,od sav) -- - - - - - 2 500 2.500 Net Transfers (18 1) 23 0 (21 0) (33 3)
Marbet Rats: Debt Outstanding A D'sb 188 8 '221 2 278 7 330 0Bust:. per USS (and period) - - - - - 2.850 2 570 2 510 Debt Outstanding A Ucd, 284 0 299 0 282 4 282 4Bust:. per liSt (Period avg) -- - - - - 2.850 2 700

GUATEMALA
PUBLIC SECTOR EXPENDITURE REVIEW
TABLE OF CONTENTS
EXECUTIVE SUMMARY
CHAPTER I: PUBLIC SECTOR EXPENDITURES AND RESOURCEMOBILIZATION ............................................. 1
A. Public Expenditure Fram,iework and Recent Trends ........ 2
Trends in Government Expenditure ..... ......... ....... 2Public Sector Revenues ............. ................... 4
B. Future Expenditure Options and Financing Requirements. 6
Level of Public Expenditures (1988-1991) .............. 7Composition of Public Expenditures (1988-1991) ........ 8Improving the Allocation of Public Expenditures in
the 1990s ........... ............................... 11Financing Requirements and Sources ..................... 13Public Savings, Investment and Growth (A Macro-economic
Scenario) ............................. 16Growth, Domestic Savings, and External Debt ........... 19Private Funding for Development ...... . ................ 20Concl' ions and Principal Recommendations .............. 20
CHAPTER II: AGRICULTURE SECTOR . ............................. 22
Sectoral Organization ....... .......................... 22Principal Sector Issues and Development Priorities .... 23Public Expenditures in Agriculture ..... ............... 25Planned Investment Program in Agriculture (1988-1991).. 26Ongoing Investment Projects ...... ..................... 26New Investment Projects in Agriculture .... ............ 27Agriculture Credit ..................................... 28Conclusions and Principal Recommendations ............. 29
This report is based on the findings of an economic mission that visitedGuatemala in April/May 1988. The mission was composed of George Park(Mission Chief), Tarsicio Castaneda (Health Sector), Chris Hennin (Non-Governmental Organizations), Pablo Jordan (Consultant, Housing andMunicipal Development), Jose Marques (Macroeconomic Framework), Abel Mateus(Agriculture Sector), Thomas McCarthy (Consultant, Agriculture Sector),Cesar Vallejo (Consultant, Planning and Project Execution), and AndrewVandendriessche (Public Expenditure Programming). In addition, RicardoKlockner and Luis Luzuriaga helped prepare the chapter on power, RicardoKlockner and Adan Cajina (consultant) the chapter on water supply, andShanta Pai the chapter on telecommunications. The report has been revisedand updated following discussions with the Government in December 1988 andJanuary 1989, including a revision of the public sector investment programto incorporate preliminary estimates on expenditures in 1988 to the extentdata was available.
- 2 -
CHAPTER III: POWER SECTOR ............. ..................... 32
Key Sector Issues .. 32Sector Investment Program, 1988-1991 .. 33Financing Needs . .35
Conclusions and Principal Recommendations ............. 36
CHAPTER IV: THE TRANSPORT SECTOR .... 38
Institutional Framework .. 38Planned Investment in Transportation . .39Roads Subsector .. 40Ports Subsector .. 42Railway Subsector .. 42Aviation Subsector .. 43Conclusions and Principal Recommendations 43
CHAPTER V: TELECOHMUNICATIONS SECTOR .. 44
Institutional Framework. 44Current Service Levels and Sector Development
Objectives .. 44Sector Constraints .. 45Sector Financing .............. ........................ 46Investment Program (19&S-91) and Financing Plar. 47Conclusions and Principal Recommendations 50
CHAPTER VI: WATER SUPPLY SECTOR ... 31
Key Sector Issues ................. 52Programmed Investments (1988-1991) .. 53Conclusions and Principal Recommendations 56
CHAPTER VII. THE SOCIAL SECTORS (Health and Education) .59
A. Health Sector Needs, Investment Program, andFinancing ............................................ 60
Key Sector Issues and Expenditure Priorities 61Government's Program .. 63Proposed Investment Program, 1988-91 .. 63
B. Education Sector Needs, Investment Program andFinancing ........................................... 66
Key Sector Issues ............ .... 67Government's Program .. 68Proposed Investment/Expenditure Program .. 70
C. Conclusions and Principal Recommendations 71

- 3 -
CHAPTER VIII: HOUSING AND URBAN DEVELOPMENT .... ............. 74
A. Housing Sector Needs, Investment Program andFinancing ........... ................................ ,4
Institutional F.7amework and Key Sector Issues ......... 74Public Expenditures in Housing and Urban Development .. 75lHousing Sector Needs and Revised Policy Framework ..... 77
B. Urban Development ..................................... 77
Sector Organization .................................... 7eMunicipal Finance Issues .............................. 78INFOM's Investment and Expenditure Program ............ 78Municipal Investments in Guatemala City .... ........... 81Combined Investment Program for Housing and UrbanDevelopment ......................................... 81
C. Conclusions and Principal Recommendations ............. 82
CHAPTER IX: STRENGTHENING PLANNING, PROJECT PREPARATION,AND PROJECT EXECUTION ..................... 85
Planning and Programming of Investments .... ........... 85Project Preparation ................................... 87Project Execution ..................................... 88
CHAPTER X. OVERA1,L CONCLUSIONS AND RECOMMENDATIONS ........ 92
ANNEX I: The Tax Regime ...................................... 100
ANNEX II: Macroeconomic Projections .......................... 109
ANNEX III: The Role of NGOs in Guatemala ..................... 116
STATISTIC-AL APPENDIX .................... 318
Section I: Standard Tables ................................. 119Section II: Public Sector Investment Program ............... 132Section III: Other Sector Tables ........................... 150

EXECUTIVE SUMMARY
Introduction
i. Guatemala confronts major social, political and economicchallenges as it strives to consolidate its newly established democraticframework; improve the well being of some 60 to 70 percent of thepopulation living in poverty; and reestablish a sound macroeconomicframework for sustained economic growth. These challenges are compoundedby the limited and uneven provision of basic social services, rapidpopulation growth, and the country's fragmented social structure. Almosthalf of Guatemala's 8.4 million people are indigenous descendants of theMaya civilization, with only limited assimilation into the socio-economicmainstream.
ii. Following many years of military rule, a democratically electedcivilian Government took office in early 1986. This Government hasundertaken the difficult task of stabilizing the economy and developing themedium term policies required to restore sustained economic growth, tacklethe country's major social issues, and strengthen the fledgling democraticsystem. At the heart of the Government's challenge is the need to mobilizeand utilize public resources more efficiently, while at the same timeensuring a macro-economic framework conducive to private sector investmentand renewed growth. This report is part of an ongoing World Bank effort tosupport the Government's efforts to reorganize and strengthen management ofthe public sector. It analyzes the overall allocation and use of publicsector resources, the content and focus of the public sector investmentprogram, and projected financing requirements through 1991.
Macroeconomic Background
iii. After several decades of substantial growth averaging close to 6percent of GDP during the 1960s and 1970s, Guatemala's economic performancedeclined sharply in the early 1980s as the country's external terms oftrade deteriorated, internal political difficulties mounted, andmacroeconomic adjustment efforts were untimely or insufficient. Theuncertain political and economic climate in Guatemala and the rest ofCentral America exacerbated capital flight, and sharply reduced privatedomestic and foreign investment, as well as external financing. By themiddle of the 198Cs Guatemala faced serious economic and financialproblems: foreign trade was virtually at a standstill owing in large partto an unmanageable multiple exchange rate regime; inflation was runningover 30 percent; investment and national savings were nearly half the levelof the 1970s; arrears on external payments had reached about $600 miliion;

- ii -
and GDP was 6 percent below its 1980 level. The sharp decline in GDP andmuch lower fiscal revenues also prompted a rapid increase in externalborrowing, with medium and long term debt more than tripling to US$2.5billion by 1987.
iv. Upoin taking office in early 1986, Guatemala's democraticallyelected Government moved quickly to stabilize the economy, taking measuresto impr3ve exchange rate management, reduce the fiscal deficit and increaseinterest rates. These measures, combined with favorable coffee prices,resulted in a substantial improvement in economic performance, with GDPgrowing by 3 percent in 1987, the first real growth in several years.Faced with renewed balance of payment pressures in late 1987 and 1988, theGovernment took additional stabilization measures in 1987 and mid-1988.Despite its success in stabilizing the economy, however, the Government'sefforts to improve resource mobilization and accelerate public sectorinvestment have been less successful.
Public Expenditure Trends and Key Issues
v. Faced with a major decline in tax revenues in the first half ofthe 1980s, the Government drastically cut public investment and constrainedother public expenditures, especially in the social sectors. Total publicexpenditures fell from 16 percent of GDP in 1980 to 12 percent in 1985,while capital outlays were cut by more than half, falling from over 6percent to 2.7 percent during the same period. Since 1986, publicexpenditures have begun to recover, with recurrent expenditures growingfaster than public investment, owing mainly to efforts to make up forprevious declines in real wages. At the same time, as a result ofcontinued problems in project management and budget constraints, capitaloutlays fell further to only 2 percent of GDP in 1986. Public investmentincreased moderately to 2.8 percent of GDP in 1987 and preliminaryestimates indicate the same level for 1988. Total public expenditures in1988 reached about 14.5 percent of GDP, still below the 1980 level.
vi. These trends highlight three underlying expenditure issues.First, Guatemala's overall level of public expenditures is low, especiallywhen compared with the range of unmet needs of its population. In fact,Central Government expenditures are only about one-half of the level inother countries with a similar level of per capita income. Second,the share of current expenditures, particularly wages, appears to be highin comparison with the relatively limited coverage of basic services andthe small size of the public sector investment effort. This reflects bothlow public sector productivity as well as overstaffing, especially in anumber of public enterprises. Third, the level of public sector investmentactually executed remains very low, again in comparison with the country'spriorities for expanding basic services and ensuring an adequate and wellmaintained infrastructure to support growth objectives and the exportdrive.
- iii -
Resource Mcbilization Issues and Basic Expenditure Options
vii. The relatively low level of public spending results mainly from anequally low level of resource mobilization. Guatemala's tax burden (taxrevenues divided by GDP), is estimated at 8.8 percent of GDP in 1988, andremains one of the lowest in the world. Moreover, despite approval of atax reform package in late 1987, revenues are expected to decline in thenext few years as export taxes are being phased out and import tariffsreduced. The country's poor revenue performance results in large part frompoor tax administration, with tax evasion reportedly extremely high. Thereis therefore a clear need to strengthen tax and customs administration,introduce additional tax measures, as well as adjust public utility tariffsand other user charges, if Guatemala is to finance a higher level ofinvestment and provide the additional basic social and other servicesneeded, without recourse to overly high levels of external financing anddomestic borrowing.
viii. The Government faces three main options in matching resources withexpenditure needs. First, it cmn seek to improve the capacity of thep..blic sector to utilize resources more efficiently, while also mobilizingadditional domestic resources, coupled with a judicious use of additionalexternal resources. Second, if sufficient additional domestic resourcesare not mobilized it can sharply increase foreign borrowing. Third, it cancut growth and expenditure targets and therefore limit resourcerequirements. Both the second and third options raise major questions.There are clearly limitations on Guatemala's debt servicing capacity, andlower expenditure and investment targets would undermine the country'sability to increase growth and achieve Guatemala's social, economic, andpolitical development objectives. As a consequence this repor:. argues thatGuatemala has no choice but to follow the first option, namely increasingthe mobilization of domestic resources combined with a careful use ofadditional external assistance, while sharply improving the utilization ofresources.
Reshaping Public Expenditure and Investment Priorities
ix. In addition to mobilizing additional resources, our analysis on asector by sector basis confirms the need for adjustments in the pattern andorientation of public expenditures. Although, the allocation of investmentwill continue to have a heavy infrastructure component, given the capitalintensive nature of investment in power and telecommunications, theGovernment's medium term objective should be to increase the share ofinvestment in the social sectors to at least 30 percent (it falls to about24 percent in 1990) reflecting a weak project pipeline; increase the shareof investment in water supply from about 7 to at least 10 percent; reducethe share allocated to other infrastructure (transport, power,telecommunications) to about 40 percent; and iv) hold agriculture to ashare of about 10 to 12 percent, assuming that major large scale irrigationprojects can be funded by the private sector. In terms of GDP, thereconmiended medium term public sector investment target would increasetotal investment from 2.8 percent of GDP in 1987 and 1988 to 5.0 percent ofGDP in 1992-1995. Within this overall target, investment in the socialsectors would increase by about 60 percent to 1.7 percent of GDP while the

- iv -
share allocated to infrastructure would remain at 2.7 percent of GDP, aboutthe same level estimated for 1990 and 1991. Nevertheless, the compositionof investment in infrastructure should be shifted to permit increasedinvestment in water supply (from 0.? lo between 0.5 and 0.6 percent ofGDP), while investment in power and telecommunications is reduced slightlyfrom 1.8 to 1.6 percent of GDP. The share allocated to agriculture woulddecrease slightly from the 0.6 percent of GDP estimated for 1990 to 0.5percent, but remain higher than the 0.4 percent estimated for 1988. Majorsector experditure issues are highlighted below.
Agriculture Sector
x. Agriculture remains Guatemala's most important sector, accountingfor one-fourth of GDP and two-thirds of export income, while employing overone-half of the work force. Nevertheless, despite its importance andpotential as the principal source for renewed growth and export income,Central Government expenditures on agriculture have fallen substantially inrecent years from about 1 percent GDP in 1980 to about 0.3 percent in 1985.Although the share of expenditures has increased since then to an estimated0.7 percent of GDP in 1988, the amount of funding for the sector remainsinadequate. Indeed public expenditures per person employed in agriculturehave been substantially lower than other countries in Latin America--forexample, about one-half of what Bolivia, Costa Rica and Peru spent in 1980.
x. Nevertheless, although public spending on agriculture may need tobe increased over the medium-term, the first priority should be to improvethe utilization and allocation of already available resources, including anaccelerated effort to resolve institutional bottlenecks. There are fourbasic areas where changes are recommended. First, expenditure prioritiesneed to be adjusted to increase the share of resources budgeted foragriculture extension, while better focusing agriculture investmentexpenditures on small farmer and poverty alleviation objectives and puttingincreased resources into natural resource protection, especiallyreforestation. With respect to future investment in agriculture, thiswould imply: i) expanding on-going programs in the Highlands aimed atdiversifying production of smallholders, including further emphasis onmini-irrigation; ii) expanding soil conservation efforts, includingsubstantially increasing investment and programs aimed at reforestation;and iii) reducing substantially plans for sharp increases in public sectorinvestment in larger scale irrigation projects which, given their high costper hectare and focus on commercial farming, could be financed in largepart by the private sector.
xii. The second major institutional and expenditure priority isstrengthening agriculture extension, which is critical for growth of smallfarmer income and productivity. This will require an indepth evaluation ofexisting extension efforts to identify principal constraints, coupled withthe identification of alternative approaches to providing enhancedtechnical assistance to small farmers, taking into account Guatemala'ssocial and geographical diversity. One possible approach would be to buildon the system of local agriculture representatives now being establishedthrough an expanded training effort, with the objective of maximizing theimpact of the Agriculture Ministry's small extension staff. Otherapproaches might consider the use of model farmers and the introduction of

supFporting audio-visual materials, complemented by private sector and NGOsponsored extension development efforts. Simply allocating more resourcesto extension without first developing an extension improvement programwould be counterproductive. However, once such a program is developedadditional resources woold likely be needed.
xiii. The third priority is improving access to agricultural credit,which requires both the modernization and reorganizat'.on of BANDESA (theagriculture bank), as well as consideration of other mechanisms forproviding credit to small farmers and ensuring sufficient capital forprivate investment in input supply, marketing and export ventures. On-going technical assistance efforts to strengthen BANDESA, with support fromUSAID and the Federal Republic of Germany should be expedited.
xix. A fourth area requiring attention is the Government's approach tofood security and the limited cost effectiveness and impact of ongoingprograms. An indepth review of existing programs and policies is needed,including an assessment of the effectiveness of INDECA's operations.Further investment in INDECA marketing facilities should be halted pendingthe outcome of such a study. In fact, if resources currently allocated toINDECA were invested in improved extension and rural infrastructure, theywould probably result in more food productioa and export crops, as well ashigher farmer incomes and lower prices for food, than if these resourcescontinue to be spent on INDECA's limited marketing efforts.
Infrastructure Sectors
xv. Investments in infrastructure account for about 55 percent oftotal public sector investment programmed for 1989 through 1991, with about21 percent on average programmed for power, 14 percent fortelecommunications, 14 percent for transport, and 7 percent for watersupply. As a percent of GDP about 1.6 on average is programmed for powerand telecommunications, 0.3 percent for water supply and 0.6 percent fortransport during the three year period. Although the share of investmentallocated to water supply appears on the low side, the o-erall content ofthe investment program in infrastructure is satisfactory and no majo.changes are recommended or feasible in the shortatwerm. Indeed, theprincipal challenge in the next few years will be to ensure that even thisrelatively low level of investment is achieved. This will require a majoreffort to address serious institutional and financial issues in the powersector, as well as a substantial improvement in implementation capacity inall of the other institutions involved in carrying out investments ininfrastructure. By the early 1990s, a major effort is needed to double theshare of GDP allocated to investments in water supply, while maintainingthe share allocated to transport, and reducing slightly the share of GDPallocated to power and telecommunications. Although additional heavyinvestment in the power sector in the middle 1990s may require anincreasing share of GDP, this should be accommodated by increasing theoverall level of public investment rather than penalizing investment in thesocial sectors.
- vi -
Power Sector
xvi. Maintaining an adequate level of investment in power, both toincrease the current low level of public access to electricity and ensuresufficient capacity in the sector to meet the country's growth objectives,will require a major financial and institutional restructuring of thesector. INDE (the power company) faces an extremely serious financialcrisis, wtth an expected deficit of QS00 to 600 million over the four yearperiod (1988-1991). As a consequence, INDE's ability to carry out itsinvestment program will depend on Government agreement to, and timelyimplementation of, a program tos i) reestablish INDE's financial healththrough a combination of tariff increases, increased operationalefficiency, and direct Government financial support; ii) improvecoordination between INDE and EEGSA (the principal distribution company),while also improving the distribution of activities between INDE, EEGSA,and the municipal power companies; iii) establish a regulatory body for thesector in the Ministry of Energy and Mines to permit adequate externalsupervision of the sector's investment plans, finances and operations; andiv) address INDE's serious institutional problems, including reducing itsserious overstaffing, strengthening its investment programming capacity,and carrying out existing recommendations regarding administrative reformsand asset revaluation.
xvii. INDE's problems should be addressed within the framework of adetailed adjustment program to be agreed between INDE and the Government.Such a program could take the form of a legal contract spelling out thespecific actions to be taken by INDE to strengthen its operations, while atthe same time indicating the level and nature of Government financial andpolicy support. The Government would also need to ensure that INDE wouldhave the autonomy in personnel matters needed to make the staffingadjustments required.
Transport Sector
xviii. The current focus of the Government's investment program intransport, with its emphasis on road rehabilitation and rural roadconstruction, is consistent with sector priorities. Nevertheless, theGovernment faces three basic expenditure issues which affect futureinvestment in the sector1, First, with respect to the road subsector, theprincipal challenge will be ensuring adequate financing for the program andaccelerating project execution by the Ministry of Public Works. Estimatedinvestment in the road subsector for the period 1988-91 already shows alower rate of execution than that proposed in the Ministry's medium term(1988-94) program. Road rehabilitation and maintenance must continue toreceive high priority given the deteriorated state of the road network andits importance in facilitating agriculture development and exports.Second, the Government needs to carefully review the feasibility of newinvestment in the railways which is tentatively planned over the mediumterm, given the questionable economic role of the railways in competitionwith road transport. No new investment in railways should be consideredpending completion of the National Transport Study. Third, with respect to

- vii -
ports, the Government should carefully assess the timing and magnitude ofproposed new investments in Puerto Santo Tomas de Castilla. Although thecountry's export development efforts clearly require an efficient portsystem, new investment ought to be accompanied by, if not preceded by, aprogram to improve the very low level of port productivity.
Telecommunications Sector
vx. Guatemala currently faces major bottlenecks in telecommunicationswhich seriously undermine public and private sector productivity. Thisresults from many years of limited investment given serious delays in theimplementation of major telecommunications projects. If the very ambitiousinvestment levels programmed for the next few years are to be achieved andservice levels sharply improved, overall management of the sector will needto be strengthened, including i) increasing the participation of theprivate sector in the provision of specialized services, such as datatransmisaion, while encouraging the use of private contractors to speednetwork construction; ii) revising low domestic tariffs, since these reducethe efficiency of service; and iii) improving the project implementationcapacity of GUATEL (the state-owned telecommunications enterprise) andaccelerating efforts to obtain the additional external financing requiredfor GUATEL's investment program.
Water Supply Sector
xx. Programmed investments in water supply and sanitation are fullyjustified, however the level of investment remains low in comparison withsector needs and the Government's emphasis on improving the availability ofbasic services. With current spending levels only about 0.3 percent ofGDP, there is substantial room for improvement. A possible medium termobjective would be to increase investment levels to between 0.5 and 0.6percent of GDP by 1992-1995, thus almost doubling the current level ofinvestment. This would require extensive restructuring of the sector,including: i) financial reforms to ensure adequate cost recovery, includingreform of the antiquated water title system and increasing tariff levels;ii) revising the organization of the sector to improve planning,operations, and project implementation, while eliminating the existingfragmentation in sector institutions; iii) early approval of legislation tobetter allocate and protect water sources; and Wit expanding projectpreparation activities in local communities, while also focusing onincreasingly serious contamination problems stemming from the inadequatemanagement of toxic wastes.
The Social Sectors
xxi. Guatemala's provision of public social services and efforts tomeet the basic needs of its rapidly growing population have beeninadequate. As a consequence, health indices are worse than many countriesin Latin America, literacy rates remain among the lowest in the continent,and the country confronts a serious shortage of housing meeting minimalstandards. Given these serious constraints, the Government's developmentprogram rightly stresses the importance of allocating more resources toprimary health care and primary education, while also facilitating theavailability of basic housing. At the same time, the Government has

- viii -
substantially increased the amount of resources available for municipaldevelopment through the transfer of 8 percent of ordinary revenues directlyto the municipalities for purposes of capital investment in infrastructureand public services. Achievement of these broad goals in the social sectorwill require first, a majol improvement in the utilization of existingresources, and second, a substantial increase in the level of funding forthe sector. This increase in resources should include not only increasedpublic funding, but additional efforts to facilitate the use of privatesector resources, including NGOs, and further mobilization of localcommunity resources. As a medium-term target, public sector investment inthe social sectors (health, education, housing/urban development) should beincreased from the estimated level of 1.2 percent of GDP in 1990, includingthe 8 percent transfer to the municipalities, to about 1.7 percent of GDPby 1992-1995. At the same time, part of the additional resources needed tomeet basic social needs could be provided under the proposed SocialInvestment Fund, which would open up additional funding channels formunicipalities, NGOs and other community organizations.
The Health Sector
xxii. The difficulty which the Government has in not being able toprovide adequate health care reflects not only inadequate funding, but alsoinefficient utilization of existing resources, combined with continuedoveremphasis in practice on more expensive curative care as opposed tobasic primary health care and preventive medicine. Primary health care hasreceived only about one-fourth of current expenditures and less than one-fifth of capital expenditures in the last few years. At the same time,poor hospital administration has led to an explosive increase in currentexpenditures for curative medicine, which almost doubled since 1986, whilestill leaving the hospitals without adequate resources for maintenance andsupplies. Expenditure adjustments in health should focus initially onincreasing the share of resources allocated for primary and preventivehealth care; increasing the share of resources allocated to rural areas,thus beginning to correct the current bias towards Guatemala City; andensuring adequate funding for materials, supplies, and maintenance.Increasing resources for preventive medicine and primary health care isfar the most cost effective way to improve the overall health ofGuatemala's population.
xxiii. These adjustments do not necessarily require major increases intotal resources available to the sector in the short-term, but better andmore cost effective use of existing staff, while adjusting the mix of staffand physical resources. As such, the Health Ministry should focus ontraining and recruiting primary health care personnel while redeployingmore staff to rural areas. At the same time, a major effort is needed toimprove the targeting, coordination, and cost effectiveness of on-goingpreventive and primary health care programs managed by the Ministry ofHealth. As a second priority, the Government should begin preparation ofan expanded investment program, with emphasis on primary health care, sincethe level of investment in the sector will fall sharply in the next fewyears unless a very weak project pipeline is strengthened. As a minimumthe goal should be to increase the level of investment from 0.2 percent ofGDP as projected for 1990 to at least 0.4 percent of GDP in 1992-1995.Finally, in addition to increasing investment expenditures in the sector,the overall level of resources allocated to the sector must be increased
- ix -
over the medium-term if health indicators are to improve. As a medium termgoal the Government should aim at increasing the total share ofexpenditures on health (including investment) from less than 1.5 percent ofGDP at present to at least 3.0 percent by 1995.
The Education Sector
xxiv. Although Guatemala's education system has grown rapidly over thepast 20 years, the current educational profile remains similar to the leastdeveloped countries in Latin America. The overall literacy rate is low,52 percent on average and less than 15 percent in some rural areas. Overtwo-fifths of the labor force has no formal schooling and another quarteronly 1 to 3 years of schooling. This poor level of educationalachievement reflects a long history of under investment and misdirectedinvestment in the sector. Until recently, less than 2 percent of GDP wasbeing spent on education compared to about 4.5 percent in other developingcountries. At the same time, the allocation of expenditures has beenskewed, with an unduly high share devoted to higher education, and withinsufficient resources programmed for teaching materials and support ofprimary education, particularly in rural areas. In addition to improvingthe quality and coverage of the system, the country faces the additionalchallenge of coping with the country's ethnic and linguistic diversity.
xxv. Although the Government has moved to increase spending in thesector, further efforts are needed. The principal expenditure adjustmentsrecomuen?ed include: i) making better use of available resources throughimproved utilization of existing facilities and improved management andsupervision of teachers; ii) increasing the share ef resources allocated toprimary education as well as to supplies and materials, while decreasingthe share allocated to higher education; iii) developing new educationalinvestment initiatives for the 1990s to strengthen a weak project pipeline;and iv) increasing the overall share of public resources allocated toeducation over the medium term. This will require not only increasedCentral Government participation, but also increased use of local communityresources. The overall goal should be to increase the share of resourcesallocated to education from the current low level of about 2 percent toabout 4 percent of GDP by 1995, with the share of investment in the sectorincreasing from an estimated 0.1 percent of GDP in 1990 to at least ('.3percent of GDP in 1992-1995.
Housing Sector
xIVi. Guatemala's housing deficit, which is substantial, is currentlyestimated at over 700,000 units, with public and private housing outputmeeting only a very small portion of needs. Since most families have aroof over their heads of one form or another, this deficit indicates mainlythe very high level of very poor quality or substandard housing. Effortsto resolve the country's housing shortage, require adjustments in sectorfinancing as well as policies. The challenge is to: i) introduce financialsector reforms which will encourage increased private sector involvement inhousing finance; ii) rationalize BANVI's operations and complete ongoinginitiatives to remedy serious organizational and financial constraints; andiii) develop new approaches to meeting the housing needs of the urban poor,focusing more on self-help and housing rehabilitation, while also tacklingland tenure issues.
Municipal Development
xxvii. Prospects for accelerating municipal development in Guatemala'ssecondary and smaller cities have improved considerably in the past fewyears as a result of the Government's decentralization effort and theallocation of 8 percent of general revenues for fixed capital investment.Nevertheless, most secondary municipalities have little or no capacity toeffectively program and manage development projects. Additional technicalassistance is urgently needed, particularly now that the easy and moreobvious investment needs are being taken care of. This will requireenhancing the capacity of INFOM to provide technical support, as well asfacilitating the efforts of NGOs and other community groups to providedirect support to municipalities.
Level of Public Expenditures (1988-1991)
xxviii. During the 1988-1991 period total spending for the consolidatedpublic sector is projected to increase slightly from about 14.5 percent ofGDP in 1988 to 17 percent in 1989 through 1991, with expenditures on publicsector investment increasing from an estimated 2.8 percent of GDP in 1988to an average of 4.5 percent of GDP for the remainder of the period.Higher spending levels are not feasible in the short-term, sinceachievement of even the projected levels already assumes substantialadditional resource mobilization as well as major improvements in theexecution of the public sector investment program. The proposedinvestment levels for 1989-1991 are adequate provided the expendituretargets are achieved. Guatemala cannot continue to maintain public sectorinvestment levels of less than 3.0 percent of GDP, if it is to meet itssocial and basic infrastructure needs. Urgent efforts are therefore neededto ensure that the minimum 4.5 percent of GDP target is indeed reached.
Financing Requirements and Sources (1989-1991)
xxix. Total public sector financing requirements for the period 1989 to1991 would average about 19 percent of GDP per jear, including loanamortizatior. needs as well as current and capital expenditures. Of thistotal, about 80 percent (15 percent of GDP) is expected to be financed fromdomestic resources and already available external funds. The remaining gapof about 4 percent of GDP would be met in part from new external financing,leaving about 2 percent of GDP to be financed through increased domesticresource mobilization, including improvements in tax administration, othertax reform measures, and increases in public utility tariffs and otherusers charges. Alternatively, a portion of the gap could be filled withadditional external grant financing. However, continued undue reliance ongrant financing is risky since its is unlikely to be available over themedium term.

- xi -
Public Savings, Investment and Growth
xxx. The macroeconomic projection scenario prepared as background forthe analysis of public expenditures confirms the importance of a stepped uppublic and private sector investment effort if Guatemala is to achieve GDPgrowth averaging between 4 and 5 percent per annum, which is the minimumconsidered necessary to begin making up for the sharp economicdeterioration experienced in the early 1980s. In fact, even with GDPgrowth at the 4 to 5 percent level, Guatemala would still require about tenyears to return to its 1980 level of per capita GDP, assuming thatpopulation growth averages about 2.7 percent per year.
xxxi. The high case scenario assumes that gross fixed investment wouldneed to grow gradually from about 14 percent of GDP in 1988 to 19.5 percentin 1995, reflecting both a recovery in private fixed investment as well asthe increase in public sector investmenL to 5 percent in 1992 andthereafter. At the same time, domestic savings would have to increase from8 percent of GDP in 1988 to 18 percent in 1995. This savings effort wouldrequire continued austerity in public expenditure policies as well as asignificant effort to increase public savings from 1 percent of GDP in 1988to 2.5 -ercent in the 1990s. To achieve the projected level of growthGuatemala would also require substantial external financial support. Theprojections assume: i) official grants averaging US$90 million per year;ii) gross disbursements from bilateral sources averaging US$30 million peryear; iii) a sharp increase in gross disbursements from multilateralinstitutions from US$100 million in 1988 to close to US$200 million peryear; iv) gross disbursements from financial institutions averaging aboutUS$75.0 million per year (including the roll-over of existing obligations);and v) additional assistance to cover the large unfinanced gap of aboutUS$280 million per year, with about one-third being filled by suppliers'credit and the remaining US$180 million from bilateral or other sources.
Strengthening Planning, Project Preparation and Project Execution
xxxii. Resource mobilization and improved targeting and allocation ofpublic resources are major issues on Guatemala's development agenda. Otherimportant issues include the need to improve planning, proiect preparationand project execution. Inadequate planning and project preparation reducesthe Government's flexibility in programming investments to meet itsdevelopment objectives, increases the risk of introducing low priorityprojects with poor returns into the investment program, and limits theGovernment's ability to channel external assistance into well definedpriority areas. At the same time, the public sector's poor projectexecution performance restricts the Govenrnment's ability to attractadditional external support, increases the cost of major projects both interms of higher commitment and other loan charges as well as higher prices,and delays the initiation of project benefits with obvious costs to theeconomy as a whole.
xxxiii. Investment programming has become largely an ad hoc process inrecent years, determined mainly by individual agencies, depending in parton their political clout, and allocations made by the budget office, oftenwithout sufficient information or guidance on priorities. Recognizing theimportance of a stronger planning and investment coordinating function, the
- xii -
Government has recently moved to strengthen the planning agency's capacityto program investments by introducing a number of organizational changes.Nevertheless, although the new arrangement provides a stronger functionalbasis for planning, SEGEPLAN (the planning agency) will requireconsiderable strengthening in the areas of investment programming, projectevaluation and monitoring. In the meantime, it would be helpful toestablish a small working group of economists and sectoral experts fromSEGEPLAN and other entities to: i) establish the principal policyadjustments and spending needs for each key sector; ii) review existingprograms and budgets to determine how well these priorities are being met;iii) identify the specific programs and/or projects which either need to berestructured or prepared to achieve the Government's objectives; and iv)help prepare expenditure guidelines for preparation of the 1990 budget.This should be combined with preparation of a public sector investmentprogram and overall spending guidelines for the next three years consistentwith the expected availability of resources and the macroeconomicframework.
xxxiv. Deficient project preparation is one of the most importantbottlenecks slowing Government development efforts. First, there aresimply not enough projects being prepared. In fact the only substantivepreparation work is being carried out largely by external donors, thusgiving them a major role in determining investment priorities. Second,many of the projects have been only partially prepared, particularly inrespect to implementation and procedural arrangements, thus opening the wayfor serious delays during execution. To help resolve this problem, theGovernment should take the necessary steps to make the proposed NationalSystem for Financing Pre-investment (SINAFIP) operational, while ensuringthat procedures for the system are as simple and straightforward aspossible. In addition, without waiting for SINAFIP, SEGEPLAN should reviewexisting project preparation efforts and identify which preparation workshould be stopped, accelerated, or started in accordance with theGovernment's current priorities. Without a major project preparationeffort, public sector investment will most likely decline during the 1990s.
xxxv. Poor or slow project execution remains one of the most seriousconstraints on public sector investment. More than anything else,improving execution requires the appointment of experienced projectmanagers, while ensuring that they have the high level support and adequatefinancing needed. At the same time, to better ensure that the projectmanager can operate effectively, it is important that: i) theadministrative framework and operational requirements for projectimplementation are fully worked out during project preparation; ii) projectconditionality is realistically defined; and iii) adequate mechanisms formonitoring project execution and rapidly resolving implementation problemsare established. Recent Ministry of Finance initiatives to improve themanagement of external financial resources have begun to improvecoordination and monitoring of priority investment projects. These effortsneed to be continued and further strengthened.
- xiii -
Conc lus ion
xxxvi. Guatemala is fortunate in that it has no major "white elephants"in its public sector investment program. At the same time, it does notface the need to make major cuts in investment as has been the case in manyother countries. Nevertheless, Guatemala faces the difficult challenge ofimproving the mobilization and utilization of limited public resources ifthe country is to pay its "social debt" and achieve its growth objectives.The additional public sector resource mobilization and savings effort of 2percent of GDP recommended in the short-term constitutes the minimal effortneeded if Guatemala is to begin to tac ̂ e its basic developmnent challenges.Given the country's current low tax ra,.o, this effort sho'uld not representa major sacrifice. Indeed, a much greater effort will be needed over themedium term if Guatemala is to overccme the serious backlog in socialinvestment, meet growing recurrent financing requirements for maintenanceand operational costs, and provide the basic infrastructure and servicesneeded to support its export diversification strategy.
xxxvii. The additional resource mobilization effort must also beaccompanied by substantial improvements in the efficiency of resource useand a concerted effort to prepare new programs and projects, especially inthe social sectors where the project pipeline is the weakest. In fact,this is the greater challenge. Increasing the availability of resourcesfor investment and needed service; may face political obstacles, but can beachieved through a combination of easily identifiable actions to tapdomestic and external resources. Improving the design of projects and theefficiency of project execution is much more difficult since it requiresnot only legal and institutional changes, but also changes in the waypublic sector personnel are trained, motivated, and deployed.
CHAPTER It PUBLIC SECTOR EXPENDITURES AND RESOURCE MOBILIZATION
Introduction
1.01 Guatemala, the largest of the Central American countries in termsof population and economic activity, faces major social, political andeconomic challenges as it strives to consolidate a newly establisheddemocratic political framework; improve the well being of some 60 to 70percent of its population living in poverty; and reestablish a sound macroeconomic framework for restoring sustained economic growth, following thesharp decline in growth experienced during the first part of the 1980s.These challenges are compounded by serious inequalities in the distributionof income, by the limited and uneven provision of basic social services,and by the country's fragmented social structure. Almost one-half ofGuatemala's 8.4 million people are indigenous descendants of the Mayacivilization with limited assimilation into the socio-economic mainstream.Economic and social integration has been made more difficult by thecountry's rugged topography, the scattered settlement of the Indianpopulation in the Western Highlands, and the fact that only one-fifth ofthe Indian population speak Spanish, the rest communicating in 23 differentIndian languages.
1.02 Guatemala's policy makers face major expenditure allocation andresource mobilization issues in their efforts to more effectively meet thebasic development needs of the country's rapidly growing population.Although there is general agreement that more resources need to begenerated and utilized more efficiently if the backlog of social and otherbasic development needs are to be fulfilled (what the Government refers toas the "Social Debt"), there are serious questions concerning the amount ofadditional resources needed, the priorities for public expenditure, and themeans to more effectively use public sector resources. This reportidentifies major expenditure issues and recommends changes in how resourcesare generated, allocated, and utilized. It is part of an ongoing WorldBank effort to support the Government's efforts to reorganize andstrengthen management of the public sector.
1.03 Chapter I reviews the role and impact of public expenditures inmeeting the country's development objectives, including patterns and trendsin public expenditures, together with an analysis of the principal publicsector expenditure issues and projected financing requirements for theperiod through 1991. Specific sector expenditure and investment issues forthe Central Government and major decentralized agencies are covered inChapters II through VIII. The report concludes with a discussion ofplanning, project preparation, and project execution issues (Chapter IX).
- 2 -
A. Public Expenditure Framework and Recent Trends
Background
1.04 Guatemala's recent public expenditure and investment performance,must be viewed within the context of economic developments during the firstpart of the 1980s, which saw a sharp decline in GDP as the country'sexternal terms of trade deteriorated, internal politicai difficultiesmounted, and macroeconomic adjustment efforts were untimely orinsufficient. During this period, the uncertain political and economicclimate in Guatemala and the rest of Central America resulted in a sharpreduction in private domestic and foretgn investment as well as externalfinancing, while capital flight was exacerbated. As a consequence, by themiddle of the 1980s Guatemala faced serious economic and financialproblems: foreign trade was virtually at a standstill owing in large partto an unmanageable multiple exchange rate regime; inflation was runningover 30 percent; investment and national savings were nearly half the levelof the 1970s; arrears on external payments had reached about US$600million; and GDP was 6 percent below its 1980 level. The sharp decline inGDP and much lower fiscal revenues also prompted a rapid increase inexternal borrowing, with medium and long-term debt more than tripling toUS$2.5 billion by 1987.
1.05 After taking office in early 1986, the new civilian Governmentmoved to stabilize the economy, taking measures to improve exchange ratemanagement, increase interest rates, and reduce the fiscal deficit. Thesemeasures, combined with favorable coffee prices, resulted in a substantia'limprovement in economic performance in 1987, with GDP growing by 3 percent,the first real growth in several years. Faced with renewed balance ofpayment pressures in late 1987 and 1988, the Government took additionalstabilization measures in 1987 and mid-1988. Nevertheless, despite itssuccess in stabilizing the economy, the Government's efforts to improvedomestic resource mobilization and accelerate public sector investment havebeen less successful, as discussed in greater detail below.
Trends in Government Expenditure
1.06 Faced with a major decline in tax revenues in the first half ofthe 1980s, Guatemala drastically cut public investment and constrainedother public expenditures, especially in the social sectors. As aconsequence, total public expenditures fell from 17 percent of GDP in 1980to about 12 percent in 1985. Real per capita Central Governmentexpenditures on health and education, for example, were cut by 60 and 16percent respectively; public outlays for education averaged only 2.3percent of GDP in 1980-85 compared with an average of 4.5 percent for alldeveloping countries. Capital outlays were also cut by more than halfduring the same period, falling from 6.7 to 2.7 percent of GDP, owing inpart to the completion of two major hydroelectric projects and a majorport. Central Government recurrent expenditures declined by over 1 percentof GDP, reflecting mainly a fall in the wage bill, even though overall
public sector employment increased by 13 percent between 1980 and 1985.With the exception of expenditures on defense, the expenditure cutsaffected all sectors, with health, transport and education being theministries hardest hit.
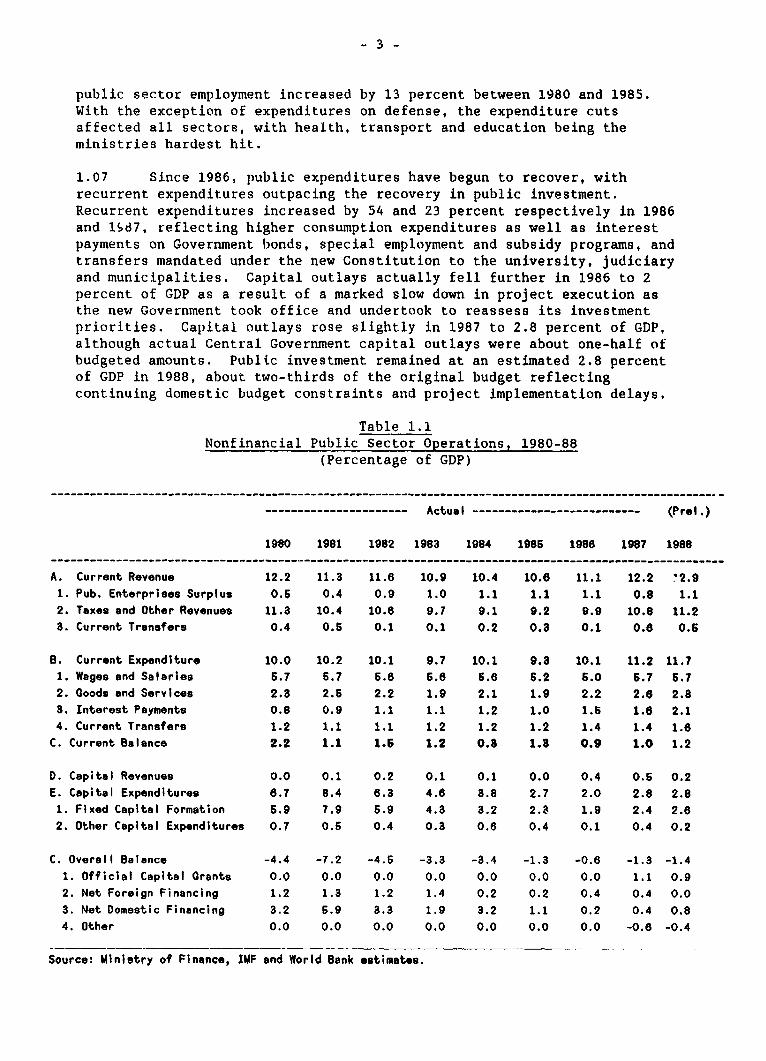
1.07 Since 1986, public expenditures have begun to recover, withrecurrent expenditures outpacing the recovery in public investment.Recurrent expenditures increased by 54 and 23 percent respectively in 1986and lSd7, reflecting higher consumption expenditures as well as interestpayments on Government bonds, special employment and subsidy programs, andtransfers mandated under the new Constitution to the university, judiciaryand municipalities. Capital outlays actually fell further in 1986 to 2percent of GDP as a result of a marked slow down in project execution asthe new Government took office and undertook to reassess its investmentpriorities. Capital outlays rose slightly in 1987 to 2.8 percent of GDP,although actual Central Government capital outlays were about one-half ofbudgeted amounts. Public investment remained at an estimated 2.8 percentof GDP in 1988, about two-thirds of the original budget reflectingcontinuing domestic budget constraints and project implementation delays.
Table 1.1Nonfinancial Public Sector Operations, 1980-88
(Percentage of GDP)
--------------------------------------------------------------------- __------__-----------------------.-
---------------------- Actual -------------------------- (Prel.)
1980 1981 1982 1983 1984 198S 1988 1987 1988
A. Current Revenue 12.2 11.3 11.8 10.9 10.4 10.6 11.1 12.2 *2.9
1. Pub. Enterprises Surplus 0.5 0.4 0.9 1.0 1.1 1.1 1.1 0.8 1.1
2. Taxes and Other Revenues 11.3 10.4 10.6 9.7 9.1 9.2 9.9 10.8 11.2
B. Current Transfers 0.4 0.6 0.1 0.1 0.2 0.3 0.1 0.8 0.6
B. Current Expenditure 10.0 10.2 10.1 9.7 10.1 9.3 10.1 11.2 11.71. Wages and Salaries 6.7 6.7 6.6 6.6 6.8 6.2 6.0 6.7 6.7
2. Goods and Services 2.3 2.5 2.2 1.9 2.1 1.9 2.2 2.6 2.8
3. Interest Payments 0.8 0.9 1.1 1.1 1.2 1.0 1.S 1.8 2.14. Current Transfers 1.2 1.1 1.1 1.2 1.2 1.2 1.4 1.4 1.6C. Current Balance 2.2 1.1 1.6 1.2 0.8 1.3 0.9 1.0 1.2
D. Capital Revenues 0.0 0.1 0.2 0.1 0.1 0.0 0.4 0.5 0.2
E. Capital Expenditures 8.7 8.4 8.3 4.8 3.8 2.7 2.0 2.8 2.8
1. Fixed Capital Formation 6.9 7.9 5.9 4.3 3.2 2.8 1.9 2.4 2.6
2. Other Capital Expenditures 0.7 0.6 0.4 0.3 0.6 0.4 0.1 0.4 0.2
C. Overall Balance -4.4 -7.2 -4.5 -3.3 -3.4 -1.3 -0.6 -1.3 -1.4
1. Official Capital Grants 0.0 0.0 0.0 0.0 0.0 0.0 0.0 1.1 0.9
2. Net Foreign Financing 1.2 1.3 1.2 1.4 0.2 0.2 0.4 0.4 0.0
3. Net Domestic Financing 3.2 6.9 3.3 1.9 3.2 1.1 0.2 0.4 0.8
4. Other 0.0 0.0 0.0 0.0 0.0 0.0 0.0 -0.6 -0.4
Source: Ministry of Finance, IMF and World Bank estimates.
- 4 -
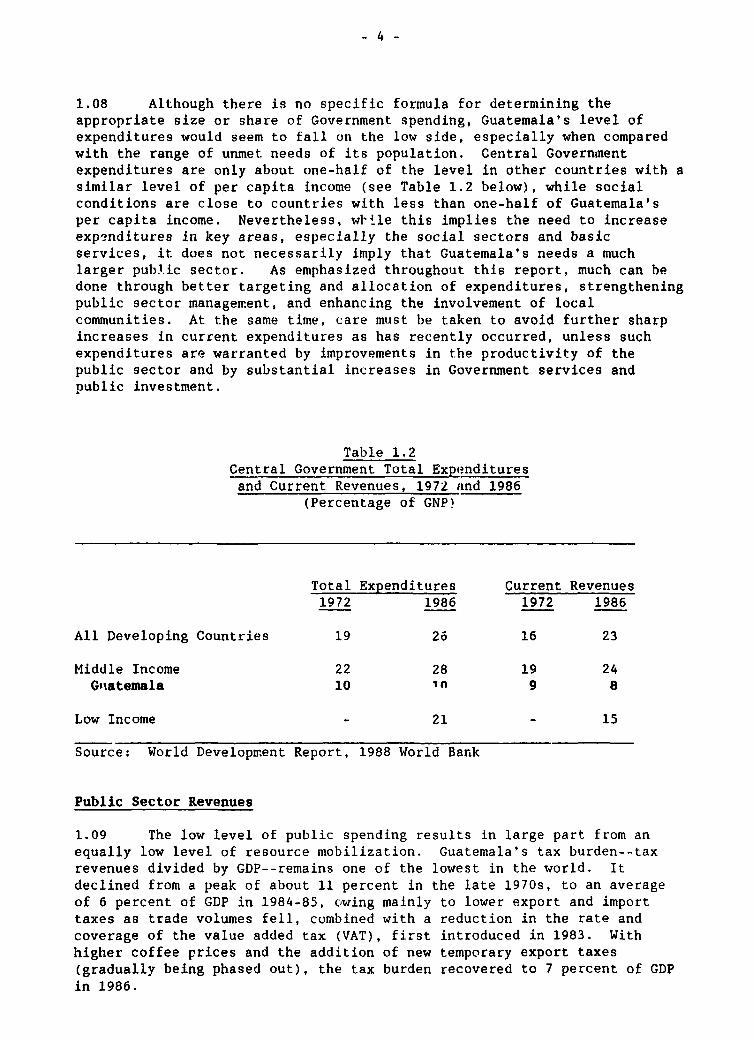
1.08 Although there is no specific formula for determining theappropriate size or share of Government spending, Guatemala's level ofexpenditures would seem to fall on the low side, especially when comparedwith the range of unmet needs of its population. Central Governmentexpenditures are only about one-half of the level in other countries with asimilar level of per capita income (see Table 1.2 below), while socialconditions are close to countries with less than one-half of Guatemala'sper capita income. Nevertheless, wI'le this implies the need to increaseexpe3nditures in key areas, especially the social sectors and basicservices, it does not necessarily imply that Guatemala's needs a muchlarger public sector. As emphasized throughout this report, much can bedone through better targeting and allocation of expenditures, strengtheningpublic sector management, and enhancing the involvement of localcommunities. At the same time, care must be taken to avoid further sharpincreases in current expenditures as has recently occurred, unless suchexpenditures are warranted by improvements in the productivity of thepublic sector and by substantial increases in Government services andpublic investment.
Table 1.2Central Government Total Expe.ndituresand Current Revenues, 1972 and 1986
(Percentage of GNP)
Total Expenditures Current Revenues1972 1986 1972 1986
All Developing Countries 19 26 16 23
Middle Income 22 28 19 24G'iatemala 10 in 9 8
Low Income - 21 - 15
Source: World Development Report, 1988 World Bank
Public Sector Revenues
1.09 The low level of public spending results in large part from anequally low level of resource mobilization. Guatemala's tax burden--taxrevenues divided by GDP--remains one of the lowest in the world. Itdeclined from a peak of about 11 percent in the late 1970s, to an averageof 6 percent of GDP in 1984-85, owing mainly to lower export and importtaxes as trade volumes fell, combined with a reduction in the rate andcoverage of the value added tax (VAT), first introduced in 1983. Withhigher coffee prices and the addition of new temporary export taxes(gradually being phased out), the tax burden recovered to 7 percent of GDPin 1986.

- 5 -
1.10 Since 1986, the Government has undertaken a number of initiativesto improve revenue performance. These have included the introduction ofnew temporary export taxes in mid-1986 to absorb part of the windfallprofit associated with the gradual unification of the exchange rate,followed by a major tax reform package in late 1987.1 As a result of theseadjustments, the tax burden increased to 8.2 percent in 1987 and to 8.8percent in 1988, with trade taxes growing to about 30 percent of revenuesin 1988. Despite this improvement, however, the tax burden is expected todecline gradually to ire-reform levels of 7.8 percent of GDP in 1991, asshown in Table 1.3, unless additional measures are taken, including furtherstrengthening of tax administration. The projected decline in revenuesresults largely from the Government's export promotion policies, as aconsequence of whic:. both temporary export and import taxes are beinggradually phased out. Additional details of the 1987 tax reform areprovided in Annex I.
Table 1.3Central Government Revenue, 1987-91
(Percentage GDP)
Est. Prel. ------ Projected ------1987 1988 1989 1990 1991
Tax Revenues 8.2 8.8 8.5 8.0 7.8Direct taxes 1.6 2.2 2.4 2.4 2.4
(income tax) (1.4) (1.9) (2.1) (2.1) (2.1)Indirect taxes 6.6 6.6 6.1 5.6 5.4
VAT 2.3 2.4 2.4 2.4 2.3Export 0.9 0.7 0.3 0.0 0.0Import 1.6 1.9 1.8 1.6 1.5Other 1.8 1.6 1.6 1.6 1.6
Source: Ministry of Finance and World Bank estimates
1.11 A major cause of Guatemala's poor revenue performance, is taxevasion, which is reportedly extremely high owing mainly to lax taxadministration. Although there is no hard evidence to indicate the degreeof tax evasion, it is interesting to note that Guatemala's income tax ratesare similar to or even higher than in other countries. Nevertheless, itsincome tax yields only a small fraction of the revenues obtained elsewhere(see Annex I). Income tax actually paid in 1986 represented only 1.4percent of corporate gross income and 3.4 percent of personal gross income.Administration of the VAT is equally poor, with many firms failing to turnin VAT receipts to the treasury and the treasury unable to provide VATrefunds to eligible taxpayers. The situation with other taxes is alsogloomy: property taxes collected reflect only a small portion of marketvalues, despite recent efforts to improve the register and valuation of
1/ The 1987 tax reform: (i) reduced top marginal income tax rates and thenumber of tax brackets; (ii) closed some talx loopholes; (iii) limitedtax deductions; (iv) introduced advance tax payments (pagos a cuenta)for corporate income tax; and iv) increased import tariffs by 4percent. The latter tariff increase will be gradually reduced to 1percent by 1992.
- 6 -
properties, including a self-valuation system (autovaluo); gift andinheritance taxes are widely avoided via trusts; taxes on idle land areseldom enforced; and selective consumption taxes introduced in 1985 are notbeing applied as a result of privaEe sector complaints that theyconstituted double taxation with the VAT and were thereforeunconstitutional.
B. Future Expenditure Options and Financing Requirements
1.12 Since Guatemala's present level of resource mobilization andpublic expenditure is too low to satisfy the population's basic needs andmeet the country's requirements ̀or improving and expanding basicinfrastructure to support growth objectives, the Government faces threebasic options.
First, improve the capacity of the public sector to utilizeresources more efficiently, ircluding reallocating resources tobetter meet investment and :-ecurrent expenditure requirements inkey areas, while accelerating efforts to mobilize additionaldomestic resources coupled with a judicious use of additionalexternal assistance.
Second, sharply increase external borrowing to make up forshortfalls in internal resource mobilization.
Third, pursue more limited growth1 and expenditure objectives.
Both the second and third options raise serious questions. There areclearly limitations on Guatemala's external debt servicing capacity, whileundue dependence on external resources is risky and not advisable. At thesame time, further limiting the low level of investment and expenditure onbasic services would undermine the country's ability to increase growth andaddress underlying social constraints which are critical for maintainingsocial and economic stability. As a consequence, this report argues thatGuatemala's only real choice is to follnw option number one, namely toincrease domestic resource mobilization, while making judicious use ofadditional external assistance, and at the same time addressing the seriousinstitutional and managerial bottlenecks which limit the capacity of theGovernment to use and allocate resources more efficiently.
1.13 Increasing expenditures on public services and essent!alinfrastructure does not mean that the size of the public sector must heexpanded. Indeed, the first priority should be to use available resourcesmore effectively. What it does mean is that a larger share of resourcesshould be allocated for investment and basic services in health andeducation, for example, while reducing overstaffing and minimizingunnecessary expenditures on general administration. At the same time, theGovernment should explore ways to minimize demands on the CentralGovernment purse. This implies continued efforts to increase localcommunity participation in the planning and financing of local developmentneeds, while also facilitating the expansion of on-going NGO sponsoreddevelopment efforts. In addition, productive investments which directly
benefit large scale private commercial interests, such as major irrigationschemes for large-scale farmers, could be financed directly by the privatesector.
1.14 The overall goal should be to adequately finance public servicesand investment in those sectors and areas where private investment cannoteffectively operate or where public interest clearly outweighs privateconcerns. It seems clear that in such areas as health, education, lowincome housing, water supply and sanitation, road irfrastructure, andagriculture services, especially for the small and medium sized farmers,that strong public sector involvement is essential. It is much less clearin such areas as telecommunications and power, for example, where privatesector financing of investment is more feasible. Although issues ofprivatization go well beyond this report, the Government may need toconsider whether certain services could not be more cheaply and effectivelysupplied by the private sector, with Government participation restricted tothe important role of maintaining an adequate regulatory environment.
1.15 The following paragraphs analyze the projected level andcomposition of public sector expenditures over the short-term (1989-1991)and recommend adjustments in the expenditure pattern and level of publicexpenditures to be achieved over the medium-term, perhaps by 1995. This isfollowed by an analysis of financing requirements for the period through1991, within the context of a medium-term economic projection scenario forachieving renewed growth.
Level of Public Expenditures (1989-1991)
1.16 Projections of total spending for the consolidated public sectorfor the period 1989-91 (Table 1.4 below) show a slight increase over theperiod, with expenditures increasing from 14 percent of GDP in 1987 toabout 14.5 percent in 1988 and to about 17 percent in 1989 through 1991.This increase in total expenditures assumes a further resource mobilizationeffort and improvements in execution of the investment program. Withinthis overall total, current expenditures reached 11.2 percent of GDP in1987, increased to 11.7 percent in 1988, and are projected to average 12.3percent through 1991. Investment expenditures ::eachee. only 2.8 percent ofGDP in 1987, and preliminary estimates indicate a similar level for 1988.However public investment levels are projected to increase to an average4.5 percent of GDP through 1991, assuming substantial additional domesticrevenue mobili7ation as well as major improvements in execution of thepublic sector investment program.

- 8 -
Table 1.4Public Sector Expenditures by Category (1980-1991)
(Percentage of GDP)
------- Actual ------- Prel. *.-- Projected ---1980 1984 1986 1987 1988 1989 1990 1991
Current Expenditures 10.0 10.1 10.1 11.2 11.7 12.5 12.4 12.2of which wages andsalaries 5.7 5.6 5.0 5.7 5.7 5.8 5.7 5.6goods and services 2.3 2.1 2.2 2.6 2.3 2.3 2.3 2.3interest payments 0.8 1.2 1.5 1.6 2.1 2.3 2.2 2.2current transfers 1.2 1.2 1.4 1.4 1.6 2.2 2.2 2.2
Capital Expenditures 6.7 3.8 2.0 2.8 2.8 4.4 4.7 5.01
Total Expenditures 16.7 13.9 12.1 14.0 14.5 16.9 17.1 17.2
1/ Includes additional unidentified investment of 0.4% of GDPSource: Statistical Appendix, Table 1.12
1.17 The proposed overall levels of spending are adequate provided thecapital expenditure target is achieved. If Guatemala is to adequatelymeet its social and basic infrastructure requirements, it cannot continueto maintain public sector investment levels of less than 3.0 percent ofGDP. Urgent efforts are therefore needed to ensure that the minimum 4.5percent of GDP target is indeed achieved in the next few years, increasingto 5.0 percent in the early 1990s. In fact, the level of 5.0 percent ofGDP still falls below average investment levels in other middle incomecountries in which public investment is in most cases over 6 percent ofGDP.
Composition of Public Expenditures (1989-1991)
1.18 As indicated in Table 1.5 below, the share of current and capitalexpenditures for the consolidated public sector is projected to be about 73and 27 percent respectively for the 1989-91 period, assuming that projectedlevels of investment are actually achieved. The share of wages andsalaries for the same period is expected to average about 33 percent oftotal expenditures, with about 14 percent on average allocated for othergoods and services, 13 percent for interest payments and 13 percent fortransfers. Although cross country comparisons must be treated withcaution as data is not strictly comparable, this spending pattern showsthat Guatemala allocates a higher share to wages than other middle incomecountries, while current transfers are considerably lower. Since thequantity and coverage of public services provided does not appear veryextensive, the very high share accorded to wages (even higher in earlieryears) would seem to reflect low productivity in the public sector togetherwith an inappropriate mix of skills, while also indicating that theGovernment is acting as an employer of last resort.

Table 1.5Public Sector Expenditures by Category
(1980-1991)(Percent of Total)
Otheractual ------- Prel. --- Projected --- Middle
1980 1984 1986 1987 1988 1989 1990 1991 Incomel/
Current Expenditures 60 73 8'. 80 81 74 73 73 77of which:Wages and Salaries 34 40 41 40 40 34 33 33 23Goods and Services 14 15 18 18 16 14 14 14 13Interest Payments 5 8 13 11 14 13 13 13 7Current Transfers 7 9 12 10 11 13 13 13 34
Capital Expenditures 40 27 16 20 19 26 27 27 23
1/ World Development Report, 1988, World Bank. Based on 1980 data for MiddleIncome Countries.Source: Ministry of Finance and World Bank estimates
Composition of Public Sector Investment (1988-91)
1.19 As summarized in Table 1.6 below, infrastructure investments,given their large capital requirements, are expected to continue to accountfor the largest share of public sector investment expenditure. The shareof infrastructure out of total capital investments increases from about 40percent in 1988 to close to 60 percent in 1990 and 1991, owing mainly toprojected higher investments in power and telecommunications. Investmentsin the social sectors (health, education, housing and urban development--including the 8 percent transfer to the municipalities) accounted for anestimated 36 percent of investment in 1988 and are projected to account forabout 30 percent of investment in 1989, but fall to about 24 percent oftotal investment in 1990 and 1991, reflecting in part a weak projectpipeline in health and education, as well as the completion of heavyinvestments in hospital equipment planned during 1988 and 1989.Agriculture investment is projected to average about 13.5 percent of totalpublic sector investment over the period.

- 10 -
Table 1.6Public Sector Investment Program, 1988-1991 1/
Percentage Share by Sector(Percent of Total)
Est. -------- Projected -------1988 1989 1990 1991
Social Sectors 36.0 30.4 24.2 23.8Education 3.1 4.1 2.7 3.1Health 11.7 8.1 3.3 3.0Housing and Urban Dev. 21.2 18.2 18.2 17.7of which 82 toMunicipalities (13.6) (9.5) (9.6) (10.6)
Infrastructure 41.0 49.4 56.9 58.8Transport 10.5 16.6 13.4 10.9Water Supply 9.9 6.8 5.6 7.9Communications 8.8 12.6 13.0 15.3Power 11.8 13.4 24.9 24.4
Agriculture 13.7 14.0 13.5 13.0
Other 9.0 6.0 5.1 4.5
1/ Excludes estimated expenditures on credit for housing and agriculture,except Central Government transfers from external loans.
Source: Statistical Appendix, Table 2.9.
1.20 The relatively small size of Guatemala's public investment effortbecomes clearer when the planned investment effort is analyzed in terms ofGDP as shown in Table 1.7. Total programmed investment for the period1989-91 averages about 4.5 percent of GDP, of which about 40 percent isallocated for power and telecommunications. The shares of GDP allocated toexpenditures for water supply and sanitation, as well as for education andhealth remain quite low.
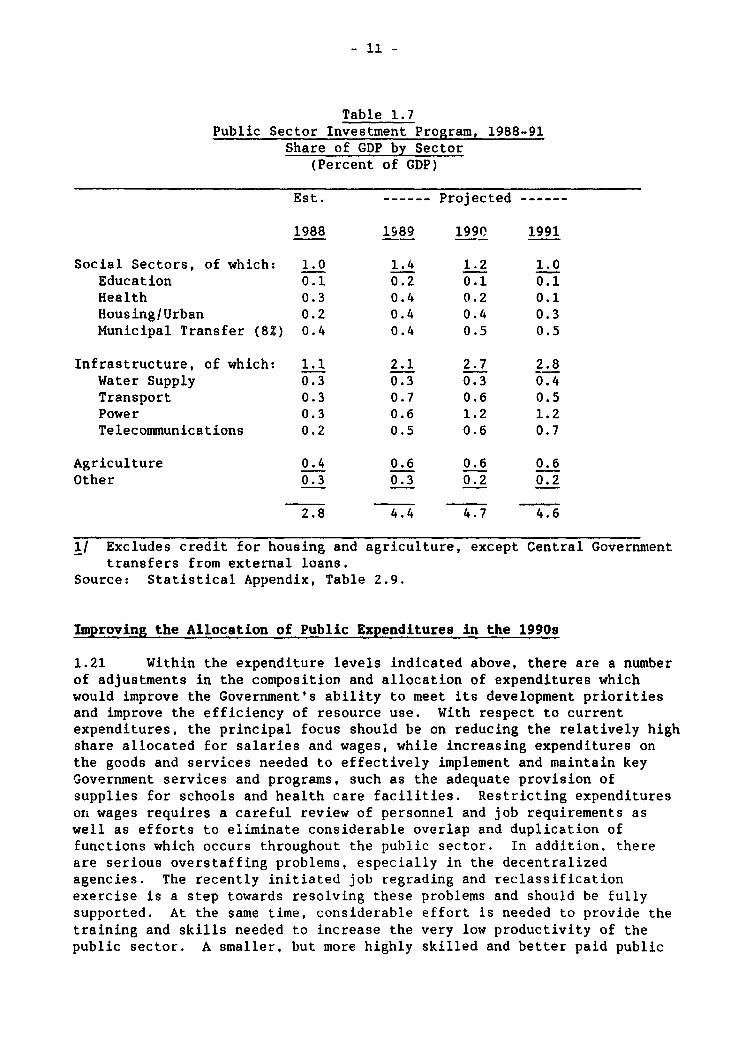
- 11 -
Table 1.7Public Sector Investment Program, 1988-91
Share of GDP by Sector(Percent of GDP)
Est. ------ Projected -
1988 1989 1990 1991
Social Sectors, of which: 1.0 1.4 1.2 1.0Education 0.1 0.2 0.1 0.1Health 0.3 0.4 0.2 0.1HousinglUrban 0.2 0.4 0.4 0.3Municipal Transfer (8Z) 0.4 0.4 0.5 0.5
Infrastructure, of which: 1.1 2.1 2.7 2.8Water Supply 0.3 0.3 0.3 0.4Transport 0.3 0.7 0.6 0.5Power 0.3 0.6 1.2 1.2Telecommunications 0.2 0.5 0.6 0.7
Agriculture 0.4 0.6 0.6 0.6Other 0.3 0.3 0.2 0.2
2.8 4.4 4.7 4.6
1/ Excludes credit for housing and agriculture, except Central Governmenttransfers from external loans.
Source: Statistical Appendix, Table 2.9.
Improving the Allocation of Public Expenditures in the 1990s
1.21 Within the expenditure levels indicated above, there are a numberof adjustments in the composition and allocation of expenditures whichwould improve the Government's ability to meet its development prioritiesand improve the efficiency of resource use. With respect to currentexpenditures, the principal focus should be on reducing the relatively highshare allocated for salaries and wages, while increasing expenditures onthe goods and services needed to effectively implement and maintain keyGovernment services and programs, such as the adequate provision ofsupplies for schools and health care facilities. Restricting expenditureson wages requires a careful review of personnel and job requirements aswell as efforts to eliminate considerable overlap and duplication offunctions which occurs throughout the public sector. In addition, thereare serious overstaffing problems, especially in the decentralizedagencies. The recently initiated job regrading and reclassificationexercise is a step towards resolving these problems and should be fullysupported. At the same time, considerable effort is needed to provide thetraining and skills needed to increase the very low productivity of thepublic sector. A smaller, but more highly skilled and better paid public

- 12 -
sector work force, would reduce the heavy burden on wages and salaries,thus freeing resources for productive services and investment. These arenot new issues and none entail easy solutions. Nevertheless, these broaderpublic sector management issues need increased attention.
1.22 The sector by sector analysis also confirms the need for changesin the pattern and orientation of public sector investment to more closelymatch Guatemala's medium term development needs and national priorities.Of particular concern is the declining share of investment projected forthe social sectors, especially health and education and the inadequatelevel of investment programmed for water supply and sanitation, althoughthis would increase assuming a portion of the 8 percent transfer to themunicipalities is used for water and sanitation investment. Although theallocation of public investment will continue to have a heavyinfrastructure component, given the capital intensive nature of investmentin power and telecommunication, the Government's medium term objectiveshould be to: Ci) increase the share of investment in the social sectors(health, education, housing and urban development) to at least 30 percent(it falls to about 24 percent in 1990 reflecting a weak project pipeline);(ii) increase the share of investment in water supply from about 7 to atleast 10 percent; (iii) reduce the share allocated to other infrastructure(transport, power, telecommunications) to about 40 percent, and (iv) keepagriculture at about 10-12 percent, assuming that major irrigation projectsare financed by the private sector.
1.23 In terms of GDP, the recommended shares of investment by sectorare shown in Table 1.8. While these adjustments may not be feasible in theshort-term, a major effort is needed to improve the balance in the programbetween investmert in the social sectors and infrastructure. To do thisthe share of investment in the social sectors should be increased by about60 percent to about 1.7 percent of GDP, thus making possible increases inhealth, education and municipal development/housing, while keeping thetotal share allocated to infrastructure at about the same level of 2.7percent of GDP. At the same time, however, the composition within theinfrastructure area should be shifted to permit an increase in water supplyinvestment from 0.3 to between 0.5 and 0.6 percent of GDP, while reducingslightly power and telecommunications from 1.8 to 1.6 percent of GDP. Theshare allocated to agriculture would be reduced slightly given privatesector funding of large scale agrictlture. Although additional heavyinvestment in the power sector in the middle 1990s would likely require anincreasing share of GDP, this should be accommodated by increasing theoverall level of public investment rather than penalizing investment in thesocial sectors. The proposed increase in investment in the social sectorswould need to be accompanied by a major effort to improve the efficiency ofresource use, while also ensuring that expenditures are carefully targetedto reach those sectors of the society where needs are the most urgent.
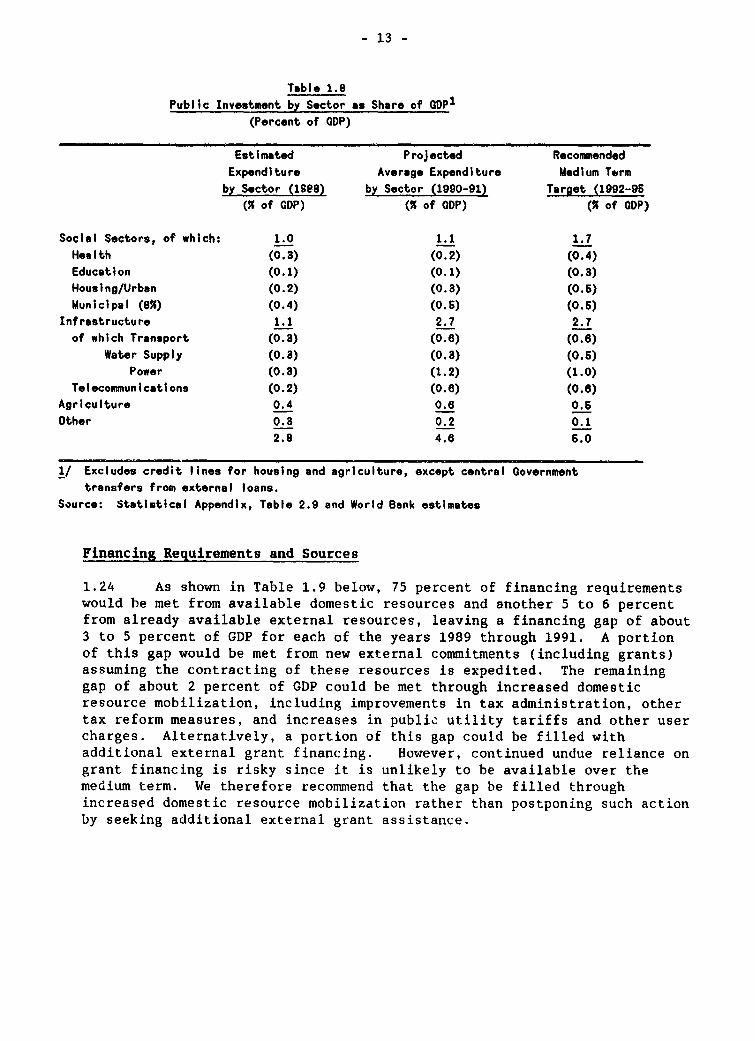
- 13 -
Table 1.8Public Investment by Sector as Share of GDPI
(Percent of GDP)
Estimated Projected RecommendedExpenditure Average Expenditure Medium Term
by Sector (1988) by Sector (1990-91) Target (1992-95(% of GDP) (% of GDP) (% of GDP)
Social Sectors, of which: 1.0 1.1 1.7
Health (0.3) (0.2) (0.4)Education (0.1) (0.1) (0.3)Housing/Urban (0.2) (0.3) (0.6)Municipal (8%) (0.4) (0.6) (0.6)
Infrastructure 1.1 2.7 2.7of which Transport (0.3) (0.6) (0.6)
Water Supply (0.3) (0.3) (0.6)Power (0.3) (1.2) (1.0)
Telecommunications (0.2) (0.6) (0.6)Agriculture 0.4 O. 0.6Other 0.3 0.2 0.1
2.8 4.e 6.0
I/ Excludes credit lines for housing and agriculture, except central Government
transfers from external loans.Source: Statistical Appendix, Table 2.9 and World Bank estimates
Financing Requirements and Sources
1.24 As shown in Table 1.9 below, 75 percent of financing requirementswould be met from available domestic resources and another 5 to 6 percentfrom already available external resources, leaving a financing gap of about3 to 5 percent of GDP for each of the years 1989 through 1991. A portionof this gap would be met from new external commitments (including grants)assuming the contracting of these resources is expedited. The remaininggap of about 2 percent of GDP could be met through increased domesticresource mobilization, including improvements in tax administration, othertax reform measures, and increases in public utility tariffs and other usercharges. Alternatively, a portion of this gap could be filled withadditional external grant financing. However, continued undue reliance ongrant financing is risky since it is unlikely to be available over themedium term. We therefore recommend that the gap be filled throughincreased domestic resource mobilization rather than postponing such actionby seeking additional external grant assistance.
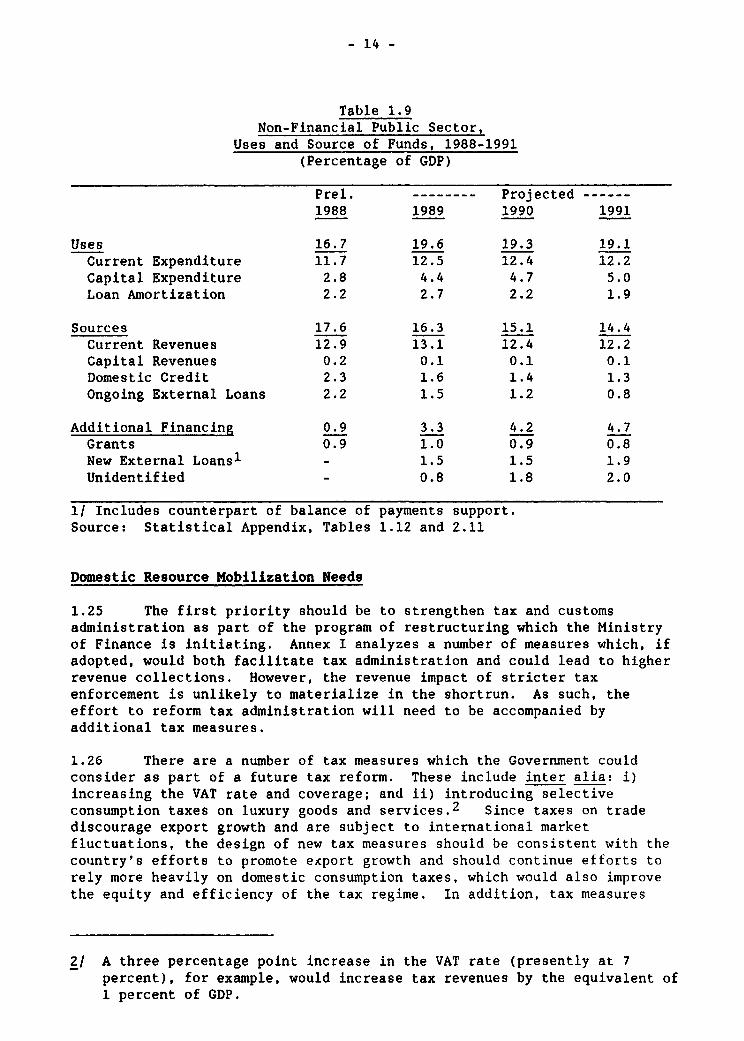
- 14 -
Table 1.9Non-Financial Public Sector,
Uses and Source of Funds, 1988-1991(Percentage of GDP)
Prel. -------- Projected ------1988 1989 1990 1991
Uses 16.7 19.6 19.3 19.1Current Expenditure 11.7 12.5 12.4 12.2Capital Expenditure 2.8 4.4 4.7 5.0Loan Amortization 2.2 2.7 2.2 1.9
Sources 17.6 16.3 15.1 14.4Current Revenues 12.9 13.1 12.4 12.2Capital Revenues 0.2 0.1 0.1 0.1Domestic Credit 2.3 1.6 1.4 1.3Ongoing External Loans 2.2 1.5 1.2 0.8
Additional Financing 0.9 3.3 4.2 4.7Grants 0.9 1.0 0.9 0.8New External Loans1 - 1.5 1.5 1.9Unidentified - 0.8 1.8 2.0
1i Includes counterpart of balance of payments support.Source: Statistical Appendix, Tables 1.12 and 2.11
Domestic Resource Mobilization Needs
1.25 The first priority should be to strengthen tax and customsadministration as part of the program of restructuring which the Ministryof Finance is initiating. Annex I analyzes a number of measures which, ifadopted, would both facilitate tax administration and could lead to higherrevenue collections. However, the revenue impact of stricter taxenforcement is unlikely to materialize in the shortrun. As such, theeffort to reform tax administration will need to be accompanied byadditional tax measures.
1.26 There are a number of tax measures which the Government couldconsider as part of a future tax reform. These include inter alia: i)increasing the VAT rate and coverage; and ii) introducing selectiveconsumption taxes on luxury goods and services.2 Since taxes on tradediscourage export growth and are subject to international marketfluctuations, the design of new tax measures should be consistent with thecountry's efforts to promote export growth and should continue efforts torely more heavily on domestic consumption taxes, which would also improvethe equity and efficiency of the tax regime. In addition, tax measures
2/ A three percentage point increase in the VAT rate (presently at 7percent), for example, would increase tax revenues by the equivalent of1 percent of GDP.
- 15 -
should also be designed with a view of minimizing tax administrationproblems given existing difficulties in tax administration. Taxes withrelatively simple administrative requirements should therefore be givengreater consideration.
1.27 Another major area for improved resource mobilization is in thearea of public utility pricing and user charges. INDE poses the majorproblem. Even assuming that electricity rates are adjusted in line withinflation in the next three years, INDE will not be able to service itsexternal debt obligations let alone contribute to finance its investment.After trimming down its investment program., to the minimum required, INDE'sfinancing gap could average about 0.5 percent of GDP in the next threeyears (or about one-fourth of the overall financing gap). There istherefore a urgent need to strengthen INDE's financial position as arguedin Chapter III.
1.28 Tariff adjustments in other sectors are also needed. As regardsthe other major public enterprise, GUATEL, Chapter V recommends revisingthe domestic tariff structure as a means of improving the efficiency oftelecommunic"tions services and raising additional revenues. Chapter VIstresses the need to implement adequate cost recovery policies in the waterand sewerage sector, including increasing water tariff levels and reformingthe antiquated water title system. Finally, Chapter VII discusses the needto increase university tuition, while protecting the access of the poor tohigher education through wider use of fellowships, thus releasing resourcesfor primary education. Additional recommendations to increase theefficiency of public sector operations are summarized in Chapter IX.
1.29 In addition to the resource mobilization effort discussed above,the GovernrAent may also need to consider privatizing certain publicservices as well as taking other actions to attract private investment intoproductive and service activities where public investment may not have aclear comparative advantage. At the same time, the use of available publicresources would have to be maximized through better targeting and improvedmanagement.
External Financing of Public Investment
1.30 Public sector investment programmed for the next three yearsremains heavily dependent on the availability of foreign financing (seeTable 2.9). Looking at the 1989-1991 investment program as a whole, almost50 percent of the investment program is expected to be financed withexternal resources, including external resources utilized for local costfinancing. External participation is particularly high in certain sectors,with external resources expected to finance about 78 percent of investmentin water supply, 66 percent in education, 62 percent in health and 60percent in transport. Use of external grant funds, mainly for financinglocal counterpart requirements has also increased in recent years, withgrant funds programmed to finance almost 12 percent of total CentralGovernment direct and indirect investment in 1988.
1.31 In addition to financing the public sector investment program,external grants are also being used to finance recurrent costs. Externalgrants were expected to finance about 4 percent of the Central Government'scurrent expenditure budget in 1988. Since grant financing is unlikely to

- 16 -
continue at high levels over the medium term, continued reliance on suchfinancing, especially to cover recurrent costs, is risky. It would bepreferable to allocate grant funds to the investment budget, particularlyto the social areas where the possibility of cost recovery is always morelimited.
Public Savings, In7estment and Growth (A Macro-economic Scenario)
1.32 The economic projections summarized in Table 1.10 below, anddiscussed in greater detail in Annex II, constitute a high case scenario.They confirm the importance of a stepped up public and private sectorinvestment effort if Guatemala is to achieve GDP growth averaging between 4and 5 percent per annum, which is considered the minimum needed to beginmaking up for the sharp deterioration in Guatemala's economy in the 1980s.In fact, even with GDP growth averaging between 4 and 5 percent per annum,Guatemala would still require about ten years to return to its 1980 levelof per capita GDP, assuming that population growth averages about 2.7percent per year.
1.33 The high case scenario assumes that gross fixed investment wouldneed to grow gradually from 14 percent of GDP in 1988 to 19.5 percent in1995. This increase in investment would result from both the gradualrecovery of private fixed investment (from 11 percent of GDP in 1988 to14.5 percent in the 1990s), as well as the proposed increase in publicsector investment (from 2.8 percent in 1988 to 5 percent in 1992 andthereafter).3 This would require not only continued domestic stability,but also effective policies to promote exports, a significant strengtheningof public sector implementation capacity and continued access to externalcredit. Foreign direct private investment would also have to make asignificant contribution, averaging about US$100 million per year, or 10percent above the 1987-88 level. To realize this level of foreigninvestment, the country would need to provide foreign investors with astable social, political and macroeconomic environment. The projectionsalso assume a substantial improvement in domestic savings which increasefrom 8 percent of GDP in 1988 to 18 percent in 1995. This savings effortwould not only require continued austerity in public expenditure policies,but also a significant effort to increase public savings from 1 percent in1988 to 2.5 percent in the 1990s, as well as improved incentives forprivate savings through realistic interest and exchange rate policies. Thelevel of savings required is essential if the additional growth in theeconomy is to be achieved without an unsustainable level of externalborrowing.
3/ The projections assume that the rate of execution of the public sectorinvestment program would increase to 80% and 90X in 1989 and 1990respectively.
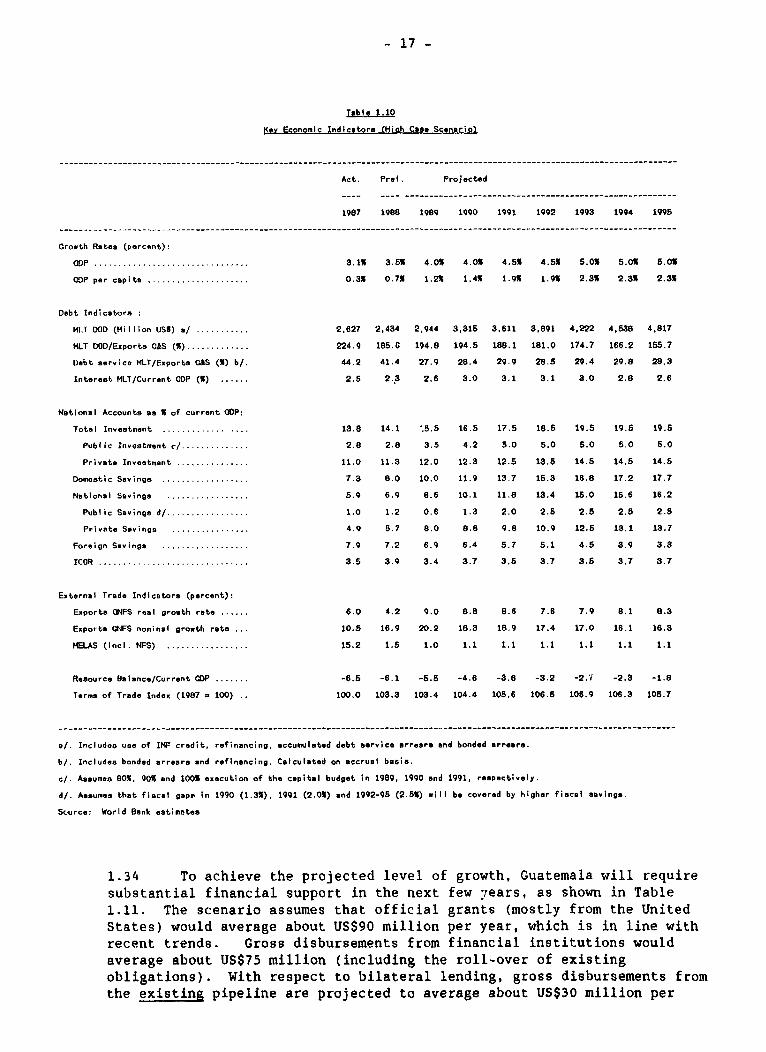
- 17 -
Table tj1
Key Economic Indicators (Hiah Case Scenario)
Act. Prel. Projected
1987 1988 1989 1990 1991 1992 1993 1994 1995
Growth Rates (percent):
CODP ........... 1.................... .1% 3.5% 4.0% 4.0% 4.5% 4.5% 6.0% 5.0% 5.0%
CDP per capita 0.3..................... 0.3% 0.7% 1.2% 1.4% 1.9% 1.9% 2.3% 2.3% 2.3%
Debt Indicatrors :
MLT DOD (Million USS) a/ 2,627 2,627 2,434 2,944 3,315 3,611 3,891 4,222 4,538 4,817
MLT DOD/Exports O&S (%) 224.9 185.6 194.8 194.5 188.1 181.0 174.7 166.2 1l5.7
Debt service MLT/Exports GAS (S) b/. 44.2 41.4 27.9 28.4 29.9 28.5 29.4 29.8 28.3
Interest MIL/Current CDP (S) 2....... 2.? 2.6 3.0 3.1 3.1 3.0 2.8 2.6
National Accounts as % of current OP:
Total Inveatment 1 3 . ..... 13.8 14.1 :5.5 16.5 17.5 18.6 19.5 19.5 19.5
Public Investment r/ 2.8 2.8 3.5 4.2 5.0 5.0 5.0 5.0 5.0
Private Investment 11................ 11.3 12.0 12.3 12.5 13.5 14.5 14.5 14.5
Domestic Savings 7................... 8.0 10.0 11.9 13,7 15.3 16.8 17.2 17.7
National Savings .......... I ...... 5.9 6.9 8.6 10.1 11.8 13.4 15.0 15.6 16.2
Public Savings d/ 1.0 1.2 0.6 1.3 2.0 2.5 2.5 2.5 2.5
Private Savings 4.9 5.7 8.0 8.8 9.8 10.9 12.5 13.1 13.7
Foreign Savings 7.9.................... 7.2 6.9 6.4 5.7 5.1 4.5 3.9 3.3
ICOR .. I ...................... 3.5 3.9 3.4 3.7 3.5 3.7 3.5 3.7 3.7
External Trade Indicators (percent):
Exports G'FS real growth rate 6.0....... 4.2 9.0 8.8 8.6 7.6 7.9 8.1 8.3
Exports GNFS nominal growth rate .. 10.5 16.9 20.2 18.3 18.9 17.4 17.0 16.1 16.3
MELAS (incl. NFS) 15.................. 1.5 1.0 1.1 1.1 1.1 1.1 1.1 1.1
Resource Balance/Current GDP -6.5........ -6.1 -5.5 -4.6 -3.8 -3.2 -2.7 -2.3 -1.8
Terms of Trade Index (1987 - 100) .. 100.0 103.3 103.4 104.4 105.6 106.5 106.9 106.3 105.7
a/. Includes use of IMF credit, refinancing, accumulated debt service arrears end bonded arrears.
b/. Includes bonded arrears and refinancing. Calculated on accrual basis.
c/. Assumes 80%, 90% and 100% execution of the capital budget in 1989, 1990 and 1991, respectively.
d/. Assumes that fiscal gaps In 1990 (1.3%), 1991 (2.0%) and 1992-95 (2.5%) will be covered by higher fiscal savings.
S<urce: World Bank estimetes
1.34 To achieve the projected level of growth, Guatemala will requiresubstantial financial support in the next few years, as shown in Table1.11. The scenario assumes that official grants (mostly from the UnitedStates) would average about US$90 million per year, which is in line withrecent trends. Gross disbursements from financial institutions wouldaverage about US$75 million (including the roll-over of existingobligations). With respect to bilateral lending, gross disbursements fromthe existing pipeline are projected to average about US$30 million per

- 18 -
year. Nevertheless, even with this level of external assistance, coupledwith a sharp increase in gross disbursements from multilaLeral institutions(which would increase from about US$100 million in 1988 to an average ofUS$200 million per year, including quick disbursing loans), the projectionsshow a large unfinanced gap of about US$280 million per year. About one-third of this gap could be filled by supplier credit to the private sector,while the remaining US$180 million would have to be financed withadditional assistance from bilateral or other sources. Failure to securethese additional resources would most likely result in a fall in GDPgrowth, with annual GDP growth not expected to surpass 2.9 percent (downfrom an average 4.6 percent in the high case scenario), with marginal gainsin per capita income.
Toble 1.11
L t Financing Requirements (High Case Scenario)
(Millions of US$)
Act. Pre. Projected
1987 1988 1989 1990 1991 1992 1993 1994 1995
Financing Requirements (net) (563) (567) (50) (S82) (555) (535) (515) (496) (460)
Official Grants (incUSAID) 126 104 100 100 95 90 85 80 80
Direct Foreign Investment 91 90 90 100 100 100 100 100 100
Multilaterals (29) 21 147 68 61 70 46 42 30
World Bank (10) (24) 87 32 33 32 31 20 11
IDB and Others (19) 45 59 36 27 37 15 21 19
Bi laterals (83) (8) (38) (12) (12) (2) 6 3 7
Suppliero Credit 0 0 6 6 7 (4) (4) (4) (4)
Financial Institutions (59) (15) 51 53 48 48 29 16 12
Stabilization Bonds (22) (76) 0 0 0 0 (37) (37) (37)
Debt Service Arrears 221 (121) (267) 0 0 0 0 0 0
Refinancing 46 121 267 0 0 0 (8) (26) (26)
Unidentified Financing 0 0 293 266 257 C23 298 322 297
Other Sources a/ 272 451 (60) 0 0 0 0 0 0
a/ Includes private capital, errors and omissions and changes ;n foreign exchange reserves.
Source: World Bank estimates
1.35 With respect to debt service requirements, the scenario shows animprovement in all debt indicators by the mid-1990s. The total long termexternal debt-to-exports ratio would decline from about 186 percent in 1988to 156 percent in 1995. The debt service ratio (after refinancing) woulddecline from 41 percent in 1988 to 28 percent in 1995. Interest paymentson medium and long term debt would peak at 3.1 percent of GDP in 1991-92and decline below 3 percent in 1995.
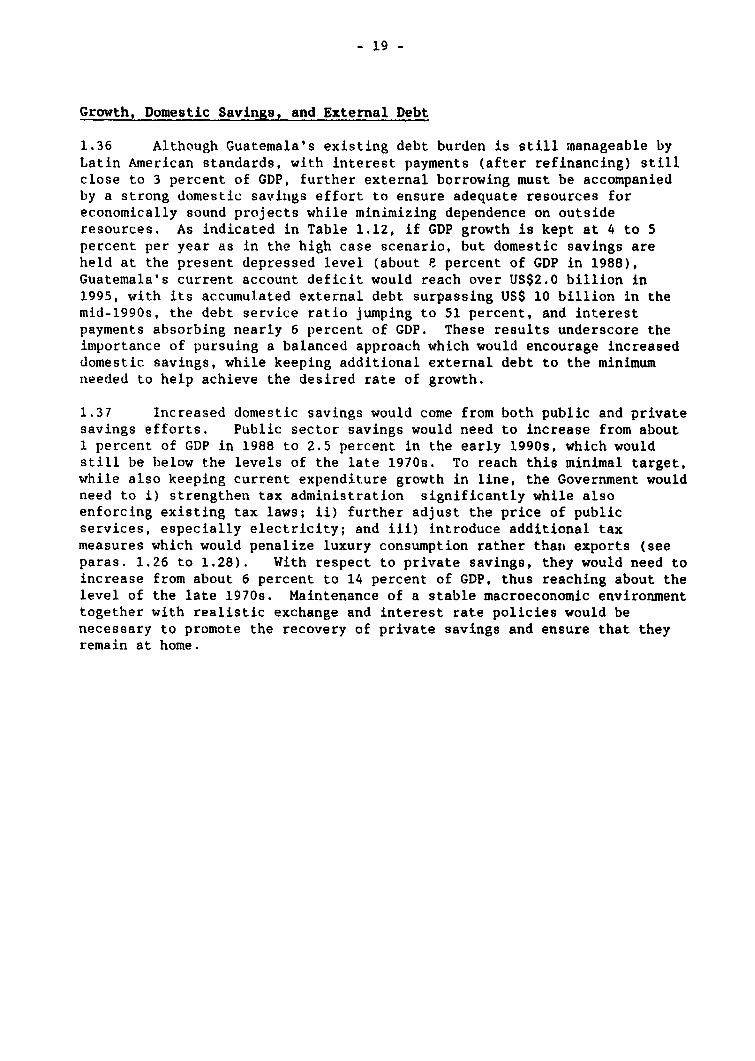
- 19 -
Growth, Domestic Savings, and External Debt
1.36 Although Guatemala's existing debt burden is still ,nanageable byLatin American standards, with interest payments (after refinancing) stillclose to 3 percent of GDP, further external borrowing must be accompaniedby a strong domestic savings effort to ensure adequate resources foreconomically sound projects while minimizing dependence on outsideresources. As indicated in Table 1.12, if GDP growth is kept at 4 to 5percent per year as in the high case scenario, but domestic savings areheld at the present depressed level (about e percent of GDP in 1988),Guatemala's current account deficit would reach over US$2.0 billion in1995, with its accumulated external debt surpassing US$ 10 billion in themid-1990s, the debt service ratio jumping to 51 percent, and interestpayments absorbing nearly 6 percent of GDP. These results underscore theimportance of pursuing a balanced approach which would encourage increaseddomestic savings, while keeping additional external debt to the minimumneeded to help achieve the desired rate of growth.
1.37 Increased domestic savings would come from both public and privatesavings efforts. Public sector savings would need to increase from about1 percent of GDP in 1988 to 2.5 percent in the early 1990s, which wouldstill be below the levels of the late 1970s. To reach this minimal target,while also keeping current expenditure growth in line, the Government wouldneed to i) strengthen tax administration significantly while alsoenforcing existing tax laws; ii) further adjust the price of publicservices, especially electricity; and iii) introduce additional taxmeasures which would penalize luxury consumption rather thati exports (seeparas. 1.26 to 1.28). With respect to private savings, they would need toincrease from about 6 percent to 14 percent of GDP, thus reaching about thelevel of the late 1970s. Maintenance of a stable macroeconomic environmenttogether with realistic exchange and interest rate policies would benecessary to promote the recovery of private savings and ensure that theyremain at home.
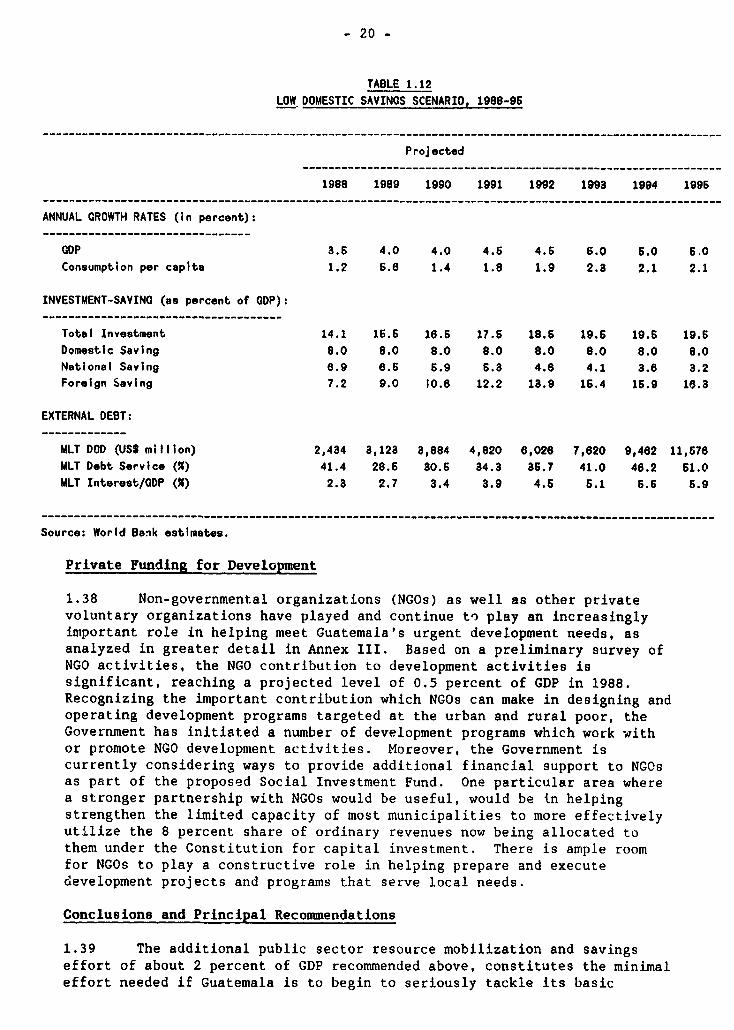
- 20 -
TABLE 1.12
LOW DOMESTIC SAVINGS SCENARIO, 1988-96
Projected
1988 1989 1990 1991 1992 1993 1994 1995
ANNUAL GROWTH RATES (in percent):________________________________
GDP 3.6 4.0 4.0 4.6 4.6 6.0 6.0 6.0Consumption per capita 1.2 5.8 1.4 1.8 1.9 2.3 2.1 2.1
INVESTMENT-SAVING (as percent of GDP):-------------------------------------
Total Investment 14.1 16.6 16.6 17.6 18.6 19.6 19.6 19.6Domestic Saving 8.0 8.0 8.0 8.0 8.0 8.0 8.0 8.0National Saving 8.9 8.5 6.9 5.3 4.6 4.1 3.8 3.2Foreign Saving 7.2 9.0 10.8 12.2 13.9 16.4 15.9 18.3
EXTERNAL DEBT:
MLT DOD (USS million) 2,434 3,123 3,884 4,820 6,028 7,620 9,462 11,676MLT Debt Service (%) 41.4 28.6 30.6 34.3 36.7 41.0 48.2 61.0MLT Interest/GDP (%) 2.3 2.7 3.4 3.9 4.6 6.1 6.6 6.9
Source: World Bank estimates.
Private Funding for Development
1.38 Non-governmental organizations (NGOs) as well as other privatevoluntary organizations have played and continue to play an increasinglyimportant role in helping meet Guatemala's urgent development needs, asanalyzed in greater detail in Annex III. Based on a preliminary survey ofNGO activities, the NGO contribution to development activities issignificant, reaching a projected level of 0.5 percent of GDP in 1988.Recognizing the important contribution which NGOs can make in designing andoperating development programs targeted at the urban and rural poor, theGovernment has initiated a number of development programs which work -withor promote NGO development activities. Moreover, the Government iscurrently considering ways to provide additional financial support to NGOsas part of the proposed Social Investment Fund. One particular area wherea stronger partnership with NGOs would be useful, would be in helpingstrengthen the limited capacity of most municipalities to more effectivelyutilize the 8 percent share of ordinary revenues now being allocated tothem under the Constitution for capital investment. There is ample roomfor NGOs to play a constructive role in helping prepare and executedevelopment projects and programs that serve local needs.
Conclusions and Principal Recommendations
1.39 The additional public sector resource mobilization and savingseffort of about 2 percent of GDP recommended above, constitutes the minimaleffort needed if Guatemala is to begin to seriously tackle its basic

- 21 -
development challenges. Given the country's current low tax ratio, thiseffort should not represent a major sacrifice or burden. Indeed, a muchgreater effort will be needed over the medium term if Guatemala is toovercome the serious backlog in social investment and meet growingrecurrent expenditure requirements, especially in health and education, butalso for rnaintenance of basic infrastructure. At the same time, theadditional resource mobilization effort must be accompanied by substantialimprovements in the efficiency of resource use and a concerted effort toprepare new programs and projects, especially in the social sectors wherethe project pipeline is the weakest. Increasing the availability ofresources for investment and needed services may face political obstacles,but can be achieved through a combination of easily identified actions totap domestic and external sources. Improving the efficiency of projectand program design arl management and removing the bottlenecks to timelyexecution of urgently needed public Livestment is much more difficult sinceit requires not only legal and institutional changes, but also changes inthe way public sector personnel are trained, motivated, and deployed.These important managerial and institutional issues are discussed ingreater detail in subsequent chapters highlighting specific sectoral issuesaffecting expenditure and investment performance.
- 22 -
CHAPTER II: AGRICULTURE SECTOR
Introduction
2.01 Agriculture remains Guatemala's most important sector, accountingfor one-fourth of GDP and two-thirds of export income and employing overone half of the labor force. Unequal access to land, disparities ineducation, cultural differences and insufficient technical assistance andcredit to small farmers have resulted in a highly dualistic structure ofagriculture. As such the sector comprises both traditional, subsistencelevel agriculture as well as modern, export oriented production.Traditional subsistence agriculture is concentrated in the highlands(altiplano), particularly the Western highlands. The Pacific slopes andthe lowlands, on the other hand, are primarily dedicated to export cropproduction, mainly in large farms with fertile soils, with greater accessto credit and infrastructure. The least cultivated areas are in thenorthern region (El Peten) where access is difficult, but where there isscope for expansion of the agricultural frontier, provided adequateattention is paid to environmental concerns in the area.
2.02 While poverty is common throughout rural Guatemala, it is mostpervasive in the small holder highland areas, which have a predominantlyIndian population. At least a third of the country's population lives inthe highlands and adjacent rural poverty centers. Farming, on plots thatnow average less than 1.4 hectares in size, consists mainly of subsistenceproduction of maize, beans, and livestock, with family incomes augmentedthrough handicraft production and seasonal employment on commercial farmsin the lowlands. The absolutely landless--now more than 30 percent of thepopulation in these poverty areas--compete for these earnings. Populationpressure, dependence on firewood for fuel, and poor grazing and farmingpractices have devastated the highland ecology. Nevertheless, whilehighland climates, soils, and water availability varies considerably, thereare high potential areas where production and earnings can be increasedsubstantially with good extension assistance, the introduction of smallscale irrigation, better soil conservation, and crop diversification,especially for export markets.
Sectoral Organization
2.03 The institutional framework in the Agriculture sector includes theMinistry of Agriculture itself, plus four major decentralized agencies.These include: the Institute of Science and Agriculture Technology (ICTA),which is responsible for agriculture research and related education andtraining program development; the National Agricultural Marketing Institute(INDECA), which regulates prices of basic grains through its marketingoperations; the National Institute for Agrarian Transformation (INTA) whichis involved in land titling, land purchase, and settlement schemes; and theNational Bank for Agricultural Development (BANDESA), which provides creditto small, medium and large farmers. The Ministry itself is divided intofour basic operational units: i) General Administrative Services, which isresponsible for the overall administration of public services inagriculture, including agriculture sector planning and programming(USPADA); ii) the Directorate General of Agricultural Services (DIGESA),

- 23 -
which has responsibility for programs to improve production, transfer newtechnology and provide assistance to producers; it has three divisions--irrigation and drainage, seed and plant development, and plant protectionand control; iii) the Directorate General of Livestock Services (DIGESEPE),with responsibility for management of programs to improve livestockproduction; and iv) the Directorate General for Forests and Silviculture(DIGEBOS), with responsibility for promoting the conservation and balanceduse of the nation's forests. This latter directorate has only recentlybeen established, taking over from INAFOR, a decentralized agency which hasnow been closed, but which previously handled forestry activities. TheAgriculture Sector is divided into eight geographical regions with each ofthe principal sector entities operating regional offices.
2.04 As indicated in Table 2.1, the two largest entities are theMinistry of Agriculture itself and BANDESA. The remaining entities arerelatively small institutions. Moreover, as indicated above, INAFOR hasnow been closed and incorporated into the Ministry.
Table 2.1Agriculture Sector Budget, 1986-88
(Q Million)
1986 1987 1988(aclual) (planned) (Programmed)
Ministry of Agriculture 93.9 112.4 165.5INTA 8.7 9.9 8.9ICTA 8.9 11.7 12.3INAFOR 1/ 6.7 10.1 6.3INDECA 17.8 38.2 57.5Of which Central Bank Credit (6.0) (19.0) (29.5)BANDESA 61.3 116.5 116.7
TOTALS 197.3 298.8 367.2
1/ Closed during 1988 and incorporated into the Ministry.Source: Ministry of Finance, 1988 Budget
Principal Sector Issues and Development Priorities
2.05 The Government's development priorities in the sector stress theimportance of diversifying production, particularly the development of non-traditional agriculture exports, given sharp declines in the production ofthe country's traditional exports (coffee, cotton, and bananas) and poorerprice and market prospects for such crops. Other priorities includeincreased investment in irrigation to facilitate crop diversification andimprove productivity; addressing problems of the landless through thepromotion of voluntary land purchase and distribution schemes; encouragingthe development of agricultural cooperatives and small and medium scaleagro-industry; and ensuring the supply of basic foodstuffs by promotingincreased production of basic grains and other essential commodities whilealso seeking to improve the effectiveness of external food assistance.

- 24 -
Although these objectives are generally sound, the specialized planningagencies--the National Planning Secretariat and the Agricultural PlanningUnit of the Ministry of Agriculture--have yet to develop a coherentstrategy for achieving these goals.
2.06 Agriculture development faces two long-standing constraints,namply, inadequate credit and insufficient coverage and effectiveness ofagriculture extension. Increased access to credit is crucial, especiallyfor small farmers. Only about 10 percent of small farmers currently haveaccess to institutional credit, reflecting strict lending standards andguarantee requirements. The bulk of available credit, including creditfrom private banks and the Bar.k of Guatemala (with IDB assistance), goes toicommercial farmers. At the same time, BANDESA. the agriculture developrmentBank, which has responsibility for small farmer lending, faces severefinancial and institutional problems which seriously limit its ability toutilize existing and proposed external credit from USAID and IDB. Morethan a third of its portfolio is in arrears. A major restructuring ofBANDESA is essential if more effective credit services are to be provided.This could be combined with parallel efforts to expand the provision ofagriculture credit by cooperatives and other private sector institutions.
2.07 Extension services are also minimal reflecting a poorly staffedagricultural extension department with only 100 professional employees, ofwhich about 70 work in the highlands, and limited operational budget.Extension coverage in the highlands is equivalent to one extension workerper 3,000 farms, whereas a ratio of 1 to 200 to 300 farms would edesirable. Nevertheless, more effective extension requires not onlyincreased funding, but more importantly the development of a new approachto extension which takes into account Guatemala's highly varied geographic,climatic, and population structure. Such an approach must deal with thetechnical requirements of crop diversification and export marketdevelopment, as well as the needs of a poorly educated farming populationwith differing language backgrounds and limited financial and technicalresources. Improving extension services also requires changes in the focusof agriculture research to i) increase research efforts in the WesternHighlands given the Government's poverty focus and the region's complexenvironmental diversity and problems; and ii) strengthen the applicabilityof research results to specific practical problems, including those arisingfrom the introduction of mini-irrigation, thus devising technologicalsolutions that are acceptable and can be more readily applied by farmers inthe field.
2.08 A further policy issue relates to the Government's price supportpolicy for basic grains. Support prices for basic grains other than wheat,are set by INDECA wihich imports, buys, sells and distributes maize, beansand rice to guarantee that domestic producers can recover production costsand realize a minimum level of income. However, this support price policyhas virtually no effect on producer prices, mainly owing to INDECA's verysmall share of the market. In fact, INDECA has purchased less than 3percent of maize and 4.5 percent of rice production in recent years, mainlyfor seasonal market balancing purposes. Much of its purchases are frommedium and large producers. Thus, while INDECA may have some influence instimulating production and raising farm incomes for some basic grains incertain regions, its price support role does not have a major impact onstimulating basic grain production and enhancing food security. If

- 25 -
resources currently allocated to INDECA were invested in improved extensionor rural infrastructure, they would probably result in more production offood and export crops as well as in higher farmer incomes and lower pricesior food.
2.09 Insufficient attention to environmental issues and protection ofimportant natural resources constitutes another major sector issue. Oneserious problem is the rapid depletion of Guatemala's forest resources.Indiscriminate cutting of trees, much of it for firewood, has a majorimpact on worsening soil erosion. This problem is most serious in theWestern Highlands, where forest resources are projected to be totallydepleted by the end of the century, if current trends continue. At thesame time, deforestation of the Peten region is also accelerating, whilereforestation efforts remain limited. A second important issue concernswater resource planning and conservation. Despite ongoing efforts toaccelerate investment in irrigation, basic water resource investigation andplanning work has yet to be completed. Moreover, while the newConstitution transferred all water resources to public ownership, a draftWater Law intended to regulate the use of water resources has yet to beapproved by Congress.
Public Expenditures in Agriculture
2.10 Despite the strategic role of agriculture in the economy, theGovernment has traditionally allocated only limited resources foragricultural services and investment. Public expenditures per personemployed in agriculture have been substantially lower than other countriesin Latin America--for example about one half of what Bolivia, Costa Ricaand Peru spent in 1980 (see Statistical Appendix Table 3.1). Moreover, thesector's share in total Central Government expenditures fell substantiallyin the early 1980s from about 6 percent in 1980 to a low of 3 percent in1985. Although the share of expenditures has increased since then to 4percent in 1987 and to an estimated 5 percent in 1988, the amount offunding for the sector remains inadequate. Total Central Governmentexpenditures in agriculture in 1980 reached close to 1 percent of GDP, butfell sharply to a low of 0.3 percent of GDP in 1985. Expendituresincreased to about one-half percent of GDP in 1987 and were budgeted toincrease to 0.7 percent of GDP in 1988.
2.11 Public spending in agriculture is presently heavily dependent onforeign financing, with external resources financing about one-third of theconsolidated agriculture sector budget. This share increases sharply forthe Ministry of Agriculture itself, with only 36 percent of the 1988Ministry of Agriculture budget financed from domestic resources. Theremainder was expected to be financed from external loans (34 percent) andexternal grants (29 percent). The draft 1989 Central Government budgetincreases the budget of the Ministry of Agriculture by about one third overthe 1988 allocation, with external financing expected to finance an evenlarger share (72 percent).

- 26 -
Planned Investment Program in Agriculture (1988-1991)
2.12 Based on estimates of currently programmed in:restments, publicsector investment in agriculture, excluding credit, would total aboutQ355.5 million over the 1988-1991 period. This level of expenditureassumes that the implementation capacity of the Agriculture Ministrycontinues to improve and that several new projects proceed as scb-duled.
Table 2.2Agriculture Sector Investment
1988-1991(Q Million)
1988 1989 1990 1991Estimated ....... Programmed.
Irrigation 36.6 54.7 58.3 49.8Livestock Development 4.8 6.4 2.1 1.0Animal Health 7.8 4.5 - -Reforestation 1/ 2.0 11.0 11.6 19.9INTA (Land Distrib.) 1.8 1.8 1.9 2.0ICTA (Transfer of 1.5 4.1 10.2 7.3
Technology)INDECA - 7.4 9.2 11.3Other 3.5 4.1 7.8 11.1
TOTALS 58.0 94.0 101.1 102.4
1/ Includes investment program for INAFOR for 1988.Source: Ministry of Finance Budget Directorate and World Bank estimates.
Ongoing Investment Projects
2.13 There are four major ongoing investment projects. These include:i) an Animal Health Project, which is financed by IDB and which focusesheavily on support for medium and large scale commercial ranching, withonly limited support for small farmers (expected to be completed in 1990);ii) a Transfer of Technology Project, also financed by IDB with supportfrom IFAD, which focuses mainly on strengthening research capabilities,including the construction of research facilities; iii) a Small Farmer andCrop Diversification Project in the western highlands financed by USAID(expected to be completed in 1989); and iv) an Agriculture and IrrigationDevelopment Project in the western highlands also financed by USAID.
2.14 The first project in the field of animal health, with its emphasison commercial farming, is not expected to be repeated since it is no longerconsistent with the Government's emphasis on small farmer development.The second project in agriculture technology, given its emphasis ontralitional crops, is also not fully consistent with current Governmentpriorities, but has substantial undisbursed funds which could be reorientedto focus more on small farmer research and extension needs, including

- 27 -
stronger support for crop diversification in the western highlands. Thelatter two projects, given their support for small farmer development inthe highlands, closely match current Government priorities. These projectsemphasize crop diversification, terracing, reforestation, small scaleirrigation, and extension service modernization. In view of their priority,investment in these activities should be continued and expanded over themedium term.
New Investment Projects in Agriculture
2.15 There are five new investment projects which the Government plansto initiate in the next three years. These include two gravity irrigationprojects, the Chixoy Dam Reforestation Project, a program to strengthenINDECA's marketing infrastructure, and a small farmer rural developmentproject in the Eastern Highlands. The five projects are described in moredetail below:
a. Irrigation II. This project which is being financed by IDBincludes three gravity irrigation schemes: 1,580 hectares inCaballo Blanco; 2,795 ha. in Cuyuta; and 108 ha. in AltoMongoy. Average farm sizes are 18, 13 and 2.5 hectaresrespectively. Total cost of the project is estimated atUS$14.6 million, of which IDB is financing US$10.6 million.Project costs average $2,500 per hectare which is on the highside, but remain acceptable. Since this project is mainlydirected at improving productivity of larger scale commercialfarms, the Government should ensure adequate cost recoveryand/or consider ways of substituting private sector financingfor at least part of the project cost.
b. Montufar Irrigation. This US$13.9 million project isproposed to be financed by the Italian Government under therecently approved financial protocol. The Montufar Project isa 3,500 ha irrigation scheme, with an average farm size of 20hectares and a development cost of almost US$4000 per hectare.Given the relatively high cost per hectare, and the large farmsize, the Government may wish to review the priority of thisproject in light of its current sector strategy whichemphasizes support for small scale irrigation to improveproductivity of small farmers. Since the Italian financin6would be provided on a grant basis, the Government may wish 'oreview whether such funds could not be better used forpriority social sector projects where cost recovery is muchmore difficult.
c. Chixoy Dam Reforestation Project. This project is included inthe investment program of the Agriculture Sector, even thoughit is primarily designed to prevent siltation of the Chixeyreservoir, to protect the Chixoy Hydroelectric scheme. Theproject is proposed for financing by IDB, with an estimatedcost of $20.0 million.
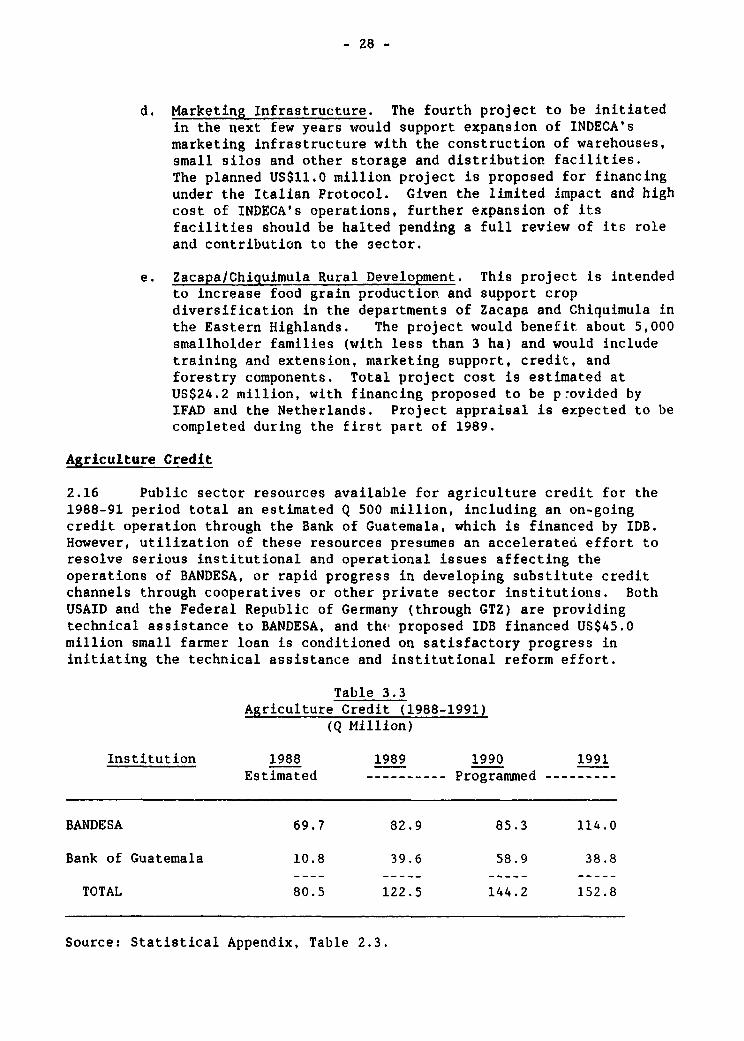
- 28 -
d. Marketing Infrastructure. The fourth project to be initiatedin the next few years would support expansion of INDECA'smarketing infrastructure with the construction of warehouses,small silos and other storage and distribution facilities.The planned US$11.0 million project is proposed for financingunder the Italian Protocol. Given the limited impact and highcost of INDECA's operations, further expansion of itsfacilities should be halted pending a full review of its roleand contribution to the sector.
e. Zacapa/Chiguimula Rural Development. This project is intendedto increase food grain productiorn and support cropdiversification in the departments of Zacapa and Chiquimula inthe Eastern Highlands. The project would benefit about 5,000smallholder families (with less than 3 ha) and would includetraining and extension, marketing support, credit, andforestry components. Total project cost is estimated atUS$24.2 million, with financing proposed to be p:ovided byIFAD and the Netherlands. Project appraisal is expected to becompleted during the first part of 1989.
Agriculture Credit
2.16 Public sector resources available for agriculture credit for the1988-91 period total an estimated Q 500 million, including an on-goingcredit operation through the Bank of Guatemala, which is financed by IDB.However, utilization of these resources presumes an accelerated effort toresolve serious institutional and operational issues affecting theoperations of BANDESA, or rapid progress in developing substitute creditchannels through cooperatives or other private sector institutions. BothUSAID and the Federal Republic of Germany (through GTZ) are providingtechnical assistance to BANDESA, and the proposed IDB financed US$45.0million small farmer loan is conditioned on satisfactory progress ininitiating the technical assistance and institutional reform effort.
Table 3.3Agriculture Credit (1988-1991)
(Q Million)
Institution 1988 1989 1990 1991Estimated ---- Programmed ---------
BANDESA 69.7 82.9 85.3 114.0
Bank of Guatemala 10.8 39.6 58.9 38.8
TOTAL 80.5 122.5 144.2 152.8
Source: Statistical Appendix, Table 2.3.

- 29 -
Conclusions and Principal Recommendations
2.17 Achievement of the Government's agriculture development goalsrequires an- adjustment of expenditure priorities as well as an acceleratedeffort to resolve key institutional bottlenecks. Although public spendingon agriculture will probably need to be increased over the medium term, theGovernment's first priority should be to review the effectiveness ofexisting programs and reallocate resources within the sector to betterreflect current Government priorities. There are three basic areas wheremajor changes are recommended. These are'as include i) the focus andcontent of the investment program; ii) the need to improve access toagriculture services, including extension and credit; and iii) foodsecurity policies.
Reshaping Investment Priorities
2.18 The present investment program reflects a mix of objectivesincluding substantial support for irrigation development and cropdiversification, both for small and large farmers; financing for marketingfacilities; limited support for reforestation; improvement of agricultureresearch and technology; credit with particular emphasis on commercialfarming; and support for livestock development and animal health, againmainly directed at commercial and large scale farmers. While theseobjectives are consistent with a broad range of Government objectives,resource constraints and the Government's emphasis on poverty alleviation,would argue for a more targeted investment effort directed principally atsmall farmer development and increasingly serious environmental protectionneeds. The approach recommended is to focus investment on those areaswhere private sector investment is unlikely to respond adequately. In thiscontext, at least one of the two new irrigation projects should bereevaluated, possibly the Montufar project which is not yet fully underway.Similarly, the on-going agriculture technology project, which still hassubstantial undisbursed funds, ought to be reviewed to see whetherremaining work could not be redesigned to better meet small holder, cropdiversification and export promotion needs, with particular emphasis on theAltiplano.
2.19 With respect to future investment in agriculture, the Governmentshould consider an expanded project preparation effort focusing oni) expanding on-going successful programs in the Altiplano for diversifyingproduction of smallholders, including mini-irrigation; and ii) developingor expanding soil conservation efforts, including substantially increasinginvestment in reforestation. Other major public investment in the sectormay not be warranted on the assumption that investments in rural roads,primary education, and primary health care are equally important inimproving the living standards of the rural poor and laying the basis forincreasing agriculture production. Current plans to substantiallyincrease major irrigation investment over the medium term for a totalinvestment of close to Q 0.8 billion by the year Z000 should bereconsidered given the high cost per hectare and emphasis on large scalecommercial farms. Although some limited public sector investment in large
- 30 -
scale irrigation could be considered provided cost recovery policies aresatisfactory, sector policies should promote direct private investment inirrigation for most major irrigation projects in areas suited for largescale commercial farming.
Strengthening Agriculture Extension and Improving Access to Credit
2.20 Improved agriculture extension is critical for growth of smallfarmer incomes and productivity. This requires an indepth evaluation ofexisting extension efforts to clearly identify principal constraints,coupied with the identification of alternative approaches to meeting theneeds of small farmers in the Altiplano while also improving exportdiversification and export market development. One possib'. approach wouldbe to build on the system of local agriculture representatives now beingestablished. This would require an expanded training effort, including thedevelopment of new approaches to increase the effectiveness of the limitedstaff available to the Ministry for training and demonstration work. Onealternative could be to adapt the 'training and visit" approach toGuatemalan conditions. Other approaches might consider the use of modelfarmers and the introduction of supporting audio-visual materials,complemented by private sector and NGO sponsored extension developmentefforts. Additional financing for extension could come from areallocation of funds within the Ministry budget as well as a possiblereallocation of funds from INDECA (see para. 2.08).
2.21 A similar effort to improve access to credit is also urgentlyneeded. Otherwise already available or planned external support for creditcannot be utilized. This requires the modernization and reorganization ofBANDESA as well as the consideration of other mechanisms for providingcredit to small farmers and ensuring sufficient capital for privateinvestment in input supply, marketing and export ventures. On-goingtechnical assistance efforts to strengthen BANDESA, with support from USAIDand the Federal Republic of Germany should be expedited, with strongGovernment support as needed.
Food Security Issues
2.22 A third area of concern is the Government's approach to foodsecurity and the cost effectiveness and impact of ongoing programs whichsupport the production and marketing of basic grains and promote self-sufficiency in basic food supplies, ever though the cost of domesticallyproduced supplies is higher than international prices. Problems in foodsecurity do not necessarily result from inadequate food supplies, but froma lack of purchasing power on the part of countries and households. Assuch, policies and programs in food security need to be designed so thatthey contribute to general economic growth while at the same time providingthe poor and disadvantaged with greater access to food. This will requirea careful balancing of measures for trade, production, and povertyalleviation. Since Current Government policies may in fact be hurting boththe rural and urban poor, they need to be carefully reviewed. Such areview should assess the effectiveness of INDECA's operations, includingthe costs and effectiveness of efforts to achieve self-sufficiency in basic

- 31 -
grains, while also exploring alternative approaches to ensuring theavailability of food supplies, including better use and targeting of foodaid. Pending the carrying out of a detailed review of food securityissues, planned investments in INDECA marketing facilities should be put onhold.
Technical Assistance for Agriculture Development
2.23 The recently reestablished UNDP Technical Assistance Project forAgriculture Development in Central America (RUTA II) for which IBRD isacting as executing agency (with financing from Japan, UNDP, IFAD and IICA)will provide further support to the Ministry of Agriculture in helpingstrengthen its capacity to address the underlying sector and investmentissues outlined above. More specifically the technical assistance unit,which will be based in Costa Rica and work initially with Guatemala,Honduras and Costa Rica, will assist the institutions involved in i)designing appropriate agriculture sector adjustment policies and programs;ii) improving the management of programs intended to reach Indiancommunities and the rural poor in general; iii) preparing agriculturalprograms and projects; and iv) strengthening donor coordination.
- 32 -
CHAPTER III: POWER SECTOR
Sector Overview
3.01 Public electricity service is provided by the Instituto Nacionalde Electricidad (INDE), the Empresa Electrica de Guatemala S.A. (EEGSA)and ten small municipal utilities. INDE is a government-owned enterpriserepo-ting to the Minister of EneLgy and Mines. It is responsible for thebulk of power generation and transmission in the country, as well as f'-rdistribution of power to about 250,000 customers in small villages andrural areas. EEGSA, a former foreign-owned utility, is now controlled byINDE, which owns 92 percent of its stock. It provides service to about317,000 custonmers in the Guatemala City metropolitan area. Municipalutilities provide the remaining electricity service in the country servingabout 10,000 additional customers.
3.02 In 1987, total installed capacity in Guatemala was 574 MW, ofwhich 74 percent was hydro; the remaining capacity was in thermal plants,most of which have been poorly maintained and are now in the process ofbeing rehabilitated. With the completion of the large Chixoy scheme (280MW) in 1986, Guatemala's generaticn system was transformed from one heavilydependent on oil to one relying almost entirely on hydropower. Howeverduring 1987, lower than normal rainfall resulted in water shortages duringthe dry season, thus forcing the use of supplemental thermal generation tomeet the maximum demand of 381 MW during that year. Table 3.2 in theStatistical Appendix provides historical and projected data on demand andsales.
3.03 Although the number of residential customers has increased byabout 7.4 percent per year since 1979, electricity consumption per capita,estimated at 156 kWh per year, remains low. About 37 percent of householdsreceive electricity service, compared with 36 percent in El Salvador, 45percent in Nicaragua, and 79 percent in Costa Rica. Total electricityconsumption stagnated during the first half of the 1980s, reflecting sharpdrops in industrial demand as the economy declined. During the past twoyears, however, consumption has begun to recover along with the recovery ofthe economy.
Key Sector Issues
3.04 The priacipal issues confronting the power sector areinstitutional and financial, with INDE confronting a major financialcrisis. This results mainly from INDE's high debt service requirements,combined with INDE's weak management capacity and poor operationalperformance. INDE's financial problems are extremely serious, with thecompany projecting deficits of Q 100 to 150 million per year through 1991(See Table 3.2). INDE's poor performance has been exacerbated byinadequate tariff adjustments (despite an average increase of 22 percent inearly 1988), a poor collection effort, and the failure to addressorganizational issues affecting the efficiency of the company's operations,including a serious overstafring problem. The ratio of consumers to stafffor INDE Is about 35:1, which is about double the level achieved by mostutilities in developing countries. INDE's precarious financial health was
- 33 -
further eroded following the Gove:nment's decision to unify the exchangerate in late June 1988. As a consequence, INDE's debt service is nowcalculated at the new unified rate of Q2.7 to US$1 rather than at a ratioof 1:1, thus virtually tripling INDE's debt service requirements in localcurrency.
3.05 EEGSA is a well managed and financially sound company, with lowdebt servicing requirements. Nevertheless, without additional tariffincreases beginning in 1989, its financial performance would deterioratesharply, with the company incurring deficits averaging Q15 to 20 million inthe coming few years. Sector performance has also been constrained by thelack of adequate coordination between INDE and EEGSA. Moreover, EEGSA maynot be adequately contributing to heavy sector investments in generationwhich have beetn carried out almost entirely by INDE. Over the past fiveyears, the Government has taken a number of steps to improve coordination,including creation of a Ministry of Energy and Mines with overallresponsibility for the power sector, nominating the same president for bothEEGSA and INDE and creating a joint INDE-EEGSA commission to coordinateoperation of the power network. Despite these efforcs, poor coordinat..orbetween the two institutions continues, especially in respect to fir.ancl.planning, planning of the distribution network, and in regard toprocurement and training of personnel.
Sector PlannJng
3.06 In late 1988, INDE completed preparation of a power sectordevelopment plan ("Plan Nacional de Electrificacion") which details sectorrequirements through the year 2000. As a starting point for this exercise,INDE prepared an electric energy demand forecast with external assistance.This forecast takes into account projected consumption patterns based ongrowth of population and GDP, while also considering other factors such asthe number and distribution of customers. As a result of this analysis,electricity sales are projected to grow at a compound annual rate of about7.1 percent during the 1987-1992 period, and 6.6 percent in the period1993-1997. This demand forecast seems reasonable as sales per connectedcustomer would only increase by about 3% per year, and most of the growthwould be caused by new connections; however, the relatively large tariffincreases that are required on financial and economic grounds could resultin lower demand.
Sector Investment Program, 1988-1991
3.07 Programmed investment in the sector, including investments plannedby both INDE and EEGSA total about Q820 million over the 1988-91 period.As indicated in the Table 3.1, about 87 percent of proposed investment inthe sector would be carried out by INDE, with the remaining 13 percent,totalling about Q104 million being programmed by EEGSA for its distributionnetwork. About 40 percent of INDE's investment program is for generation,with another 30 percent allocated for transmission and distribution. Theremaining 30 percent of the program is devoted to studies and otherinvestments such as the repair and rehabilitation of thermal and smallhydro plants, as \ 11 as construction of a national dispatch center. Thegeneration investments over the four year period include i) construction ofthe El Jute drainage gallery to ensure the reliability of the Chixoyhydroelectric plant; ii) completion of the construction of Zunil 1 (15 MW),
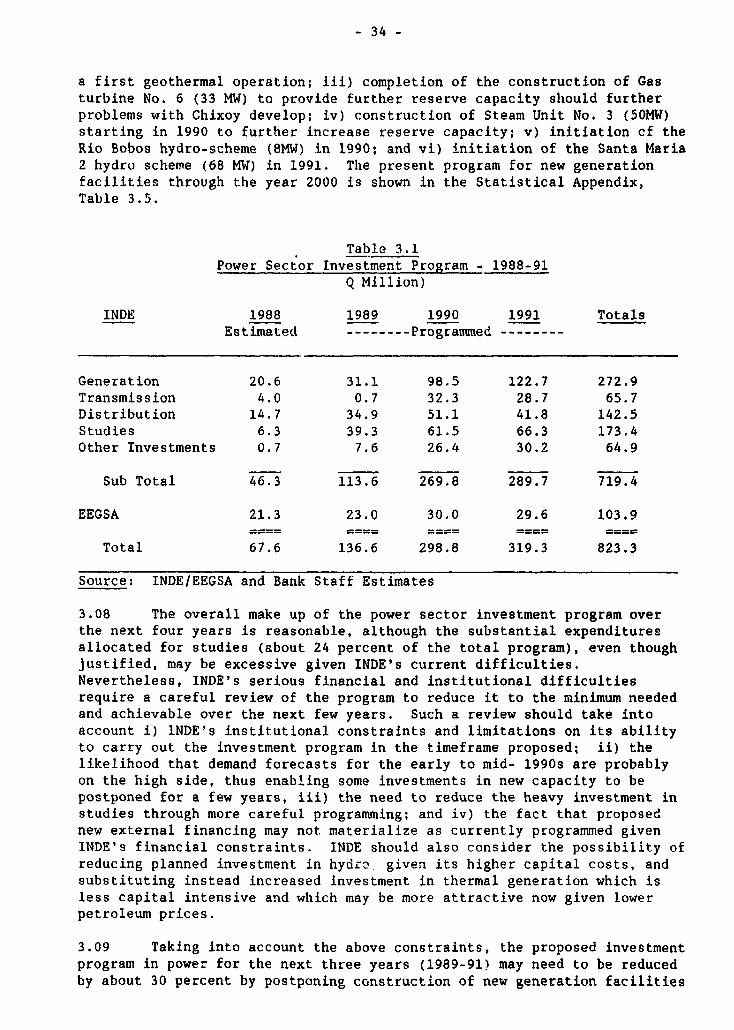
- 34 -
a first geothermal operation; iii) completion of the construction of Gasturbine No. 6 (33 MW) to provide further reserve capacity should furtherproblems with Chixoy develop; iv) construction of Steam Unit No. 3 (50MW)starting in 1990 to further increase reserve capacity; v) initiation cf theRio Bobos hydro-scheme (BMW) in 1990; and vi) initiation of the Santa Maria2 hydro scheme (68 MW) in 1991. The present program for new generationfacilities through the year 2000 is shown in the Statistical Appendix,Table 3.5.
Table 3.1Power Sector Investment Program - 1988-91
Q Million)
INDE 1988 1989 1990 1991 TotalsEstimated - Programmed --------
Generation 20.6 31.1 98.5 122.7 272.9Transmission 4.0 0.7 32.3 28.7 65.7Distribution 14.7 34.9 51.1 41.8 142.5Studies 6.3 39.3 61.5 66.3 173.4Other Investments 0.7 7.6 26.4 30.2 64.9
Sub Total 46.3 113.6 269.8 289.7 719.4
EEGSA 21.3 23.0 30.0 29.6 103.9
Total 67.6 136.6 298.8 319.3 823.3
Source: INDE/EEGSA and Bank Staff Estimates
3.08 The overall make up of the power sector investment program overthe next four years is reasonable, although the substantial expendituresallocated for studies (about 24 percent of the total program), even thoughjustified, may be excessive given INDE's current difficulties.Nevertheless, INDE's serious financial and institutional difficultiesrequire a careful review of the program to reduce it to the minimum neededand achievable over the next few years. Such a review should take intoaccount i) lNDE's institutional constraints and limitations on its abilityto carry out the investment program in the timeframe proposed; ii) thelikelihood that demand forecasts for the early to mid- 1990s are probablyon the high side, thus enabling some investments in new capacity to bepostponed for a few years, iii) the need to reduce the heavy investment instudies through more careful programming; and iv) the fact that proposednew external financing may not materialize as currently programmed givenINDE's financial constraints. INDE should also consider the possibility ofreducing planned investment in hydro. given its higher capital costs, andsubstituting instead increased investment in thermal generation which isless capital intensive and which may be more attractive now given lowerpetroleum prices.
3.09 Taking into account the above constraints, the proposed investmentprogram in power for the next three years (1989-91) may need to be reducedby about 30 percent by postponing construction of new generation facilities

- 35 -
by one to two years, slowing down expansion of the transmission network,and reducing investment in planned studies. Assuming revisions along theabove lines, programmed investment in the sector for the period 1989-1991could be reduced to about Q 550 million. Nevertheless, even though alower level of investment would reduce the amount of direct Governmentsupport and tariff increases required in the next few years, major actionsto improve sector finances would still be needed urgently.
Financing Needs
3.10 Financial projections for the 1988-91 period for the power sector,as summarized in Table 3.2 below, show deficits of Q 526.1 and 54.6 millionrespectively for INDE and EEGSA, assuming no further tariff adjustments andmaintenance of the originally proposed level of investment. Given thesedeficit levels, neither EEGSA or INDE would be able to contributeadequately to their investment financing needs. At the same time INDEwould be unable to cover its debt service requirements. If the sector isto achieve the programmed level of investment, and if direct Governmentfinancial support to the sector is to be minimized, electricity tariffswould need to be increased on average by about 65 percent during the1989-91 period. A tariff increase of this magnitude would enable INDE toservice its debt and cover about a portion of its investment requirementsfrom internally generated funds. At the same time, the proposed increasewould enable the Government to reduce its financial support to about Q 40to 50 million over the same period. Since a tariff increase of this sizecould have political and economic implications if introduced in one step,the impact of the increase could be eased by introducing the priceadjustments in small monthly or quarterly increments.
3.11 The amount of tariff adjustment or Government contributionrequired could be reduced by postponing investment in the sector asdiscussed in para. 3.9. However, the savings would be limited to aboutQ 40 to 50 million as most investment is financed from foreign sources. Assuch a major tariff adjustment on the order of at least 60 percent wouldstill be required. The only other alternative would be to sharplyincrease Government financing of the sector, although this would haveadverse implications for the Government's fiscal situation. In any case,any substantial Government support should be in the form of equitycontributions or long term loans conditioned on satisfactory progress byINDE in strengthening its management and operational framework.
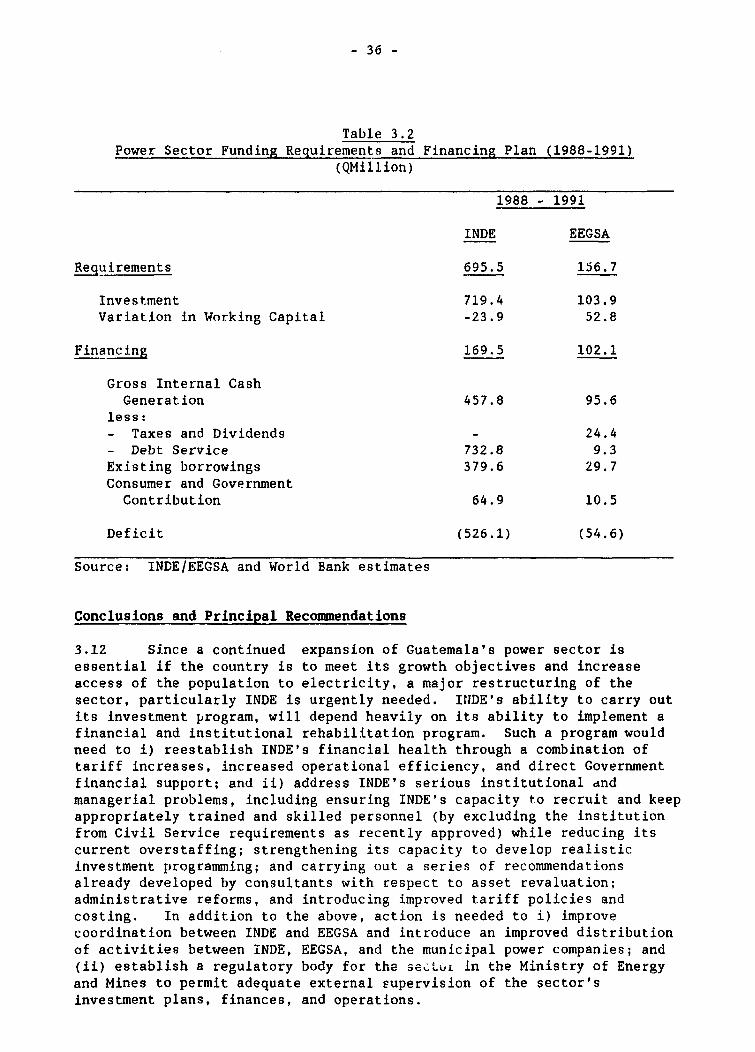
- 36 -
Table 3.2Power Sector Funding Requirements and Financing Plan (1988-1991)
(QMillion)
1988 - 1991
INDE EEGSA
Requirements 695.5 156.7
Investment 719.4 103.9Variation in Working Capital -23.9 52.8
Financing 169.5 102.1
Gross Internal CashGeneration 457.8 95.6
less:- Taxes and Dividends - 24.4- Debt Service 732.8 9.3Existing borrowings 379.6 29.7Consumer and GovernmentContribution 64.9 10.5
Deficit (526.1) (54.6)
Source: INDE/EEGSA and World Bank estimates
Conclusions and Principal Recommendations
3.12 Since a continued expansion of Guatemala's power sector isessential if the country is to meet its growth objectives and increaseaccess of the population to electricity, a major restructuring of thesector, particularly INDE is urgently needed. INDE's ability to carry outits investment program, will depend heavily on its ability to implement afinancial and institutional rehabilitation program. Such a program wouldneed to i) reestablish INDE's financial health through a combination oftariff increases, increased operational efficiency, and direct Governmentfinancial support; and ii) address INDE's serious institutional dndmanagerial problems, including ensuring INDE's capacity to recruit and keepappropriately trained and skilled personnel (by excluding the institutionfrom Civil Service requirements as recently approved) while reducing itscurrent overstaffing; strengthening its capacity to develop realisticinvestment programming; and carrying out a series of recommendationsalready developed by consultants with respect to asset revaluation;administrative reforms, and introducing improved tariff policies andcosting. In addition to the above, action is needed to i) improvecoordination between INDE and EEGSA and introduce an improved distributionof activities between iNDE, EEGSA, and the municipal power companies; and(ii) establish a regulatory body for the se.VLi in the Ministry of Energyand Mines to permit adequate external supervision of the sector'sinvestment plans, finances, and operations.

- 37 -
3.13 IN1DE's problems should be addressed within the framework of adetailed adjustment program to be agreed between INDE and the Government.Such a program could take the form of a legal contract between theGovernment and INDE under which the Government would agree to providefinancial support to INDE in return for INDE's agreement to carry outspecific steps to rationalize its expenditures and improve its efficiencyand productivity. This contract aould spell out clearly the actions to betaken to strengthen INDE's finances, including tariff adjustments andGovernment capital contributions. The Government would also need to ensurethat INDE would have the professional management required to carry out afull restructuring of the institution, as well as the autonomy needed inpersonnel matters to enable INDE to carry out the other institutional andstaffing adjustments required.

- 38 -
CHAPTER IV: THE TRANSPORT SECTOR
Sector Overview
4.01 Guatemala has a basic transport system in place, including a welldeveloped primary and secondary road network; more than adequate portcapacity on the Pacific and Atlantic Coasts; adequate air transportfacilities; and a railway system linking the two coasts and the Mexicanborder. Principal sector investment issues include the poor condition ofthe road network as a result of neglected rehabilitation and maintenance,and the need to further expand the feeder road network to supportagriculture sector growth, market integration and lay the basis forimproved access to social and other scrvices. Only small investments areneeded in the ports in the short-terni to improve operating efficiency,including specialized bulk and container handling facilities. Similarly,airport infrastructure is generally adequate given existing traffic levelsand no major investments are required in the coming few years.Nevertheless, existing facilities should be reviewed to ensure adequatesupport for the Government's export drive. Major railwa-, investments arealso unnecessary and currently not planned, given the questionable futureeconomic role of the railways.
Institutional Framework
4.02 Transport sector nanagement is scattered among several publicagencies and enterprises with varying degrees of autonomy. The Ministryof Communications, Transport and Publ'c Works (MCTOP) plays a leading rolein overall sector management and planning, which role was strengthenedfollowing a series of institutional reforms Instituted in 1987. Inaddition to road transport development and administration, MCTOP is alsoresponsible for aviation infrastructure matters, as well as overallsupervision of the Guatemalan Railway Company (FEGUA) and the new Port ofQuetzal. International and domestic air services are provided by theGovernment owned Guatemalan Aviation Company (AVIATECA) and by privateoperators. Port facilities at Santo Tomas de Castilla, the country'slargest port on the Atlantic are managed by a semi autonomous PortAuthority (EPNSTC), while facilities at the new Port of Quetzal on thePacific are operated by a public executing agency established in 1979. Thethree smaller ports--Barrios, San Jose, and Champerico--are operated underthe supervision of FEGUA.
4.03 As part of an effort to strengthen management of the transportsector, MCTOP has developed an Action Plan designed to address major sectorissues. The principal actions contemplated under the program include:i) periodic adjustment of road user charges to cover, at a minimum, thevariable costs of road use associated with each category of vehicles; andii) preparation and implementation of a National Transport Plan, to becarried out in part by consultants financed under the IBRD supportedSecondary Roads Rehabilitation Project. This Plan would cover thefollowing topics: strategy and actions needed to reduce the railwayoperations deficit; port tariffs and operational efficiency; transportregulatory framework, particularly passenger transport; transportexpenditure and investment program; institutional changes needed tostrengthen sector coordination; and an assessment of the environmental

- 39 -
impact of transport programs. The program also envisages actions tostrengthen the ability of the Ministry to manage an expanded investmentprogram, including improving the road and equipment management system,adjusting contracting policy to permit contracting out of all constructionand rehabilitation work for primary and secondary roads to reduce costs,improving financial management and accounting practices, and strengtheningpersonnel through training and technical assistance.
Planned Investment in Transportation
4.04 Pending completion of the National Transport Plan, currentlyexpected to be completed in 1992, the Government's priorities in transportwould ccntinue to concentrate on road rehabilitation and agriculture feederroad or rural access road development. These priorities reflect the urgentneed to repair and better maintain the country's basic road network, aswell as the need to increase access to rural areas if agricultureproductivity is to be increased and the country's rural population is tohave better access to education, health and other services. In addition tothe above, the Ministry will also continue with the construction of newroads or road sections on a more limited basis to reduce congestion orfoster integration of key regions.
4.05 The Government's investment program in the transport sector,including projects already underway and those expectpd to be initiatedduring 1988-1991, would absorb about 14 percent of total programmed publicinvestment for the period. The bulk of the planned investment is in roadrehabilitation and improvement rather than new construction, with aboutone-fourth being allocated for rural access roads. No major investmentsare currently programmed during the period for ports, with the exception ofrelatively small investments to complete on-going equipment purchases andmake other small improvements in port operations, although the Governmentis considering major investments in Puerto Santo Tomas de Castilla to becarried out during the 1990s (see para. 4.13). Programmed investment inairport infrastructure is limited mainly to improvements in navigationalaids. No investments are programmed for FEGUA reflecting the entity'sfinancial constraints.
Table 4.1 - Transport Sector
Programmed Investments 1988-91(Q Million)
Estimated ---- Programmed ----------1988 1987 1990 1991 Totals
Roads 45.3 148.2 128.6 116.8 438.9Airports 6.5 10.5 9.8 9.8 36.6Ports 8.8 11.2 22.6 16.9 59.5
TOTALS 60.6 169.9 161.0 143.5 535.0
Source: Statistical Appendix, Table 2.4

- 40 -
Roads Subsector
4.06 Guatemala has a well developed primary and secondary road networkwhich as a result of aging, unsuccessful efforts in controlling vehicle-axle-load and neglected maintenance has reached an advanced state ofdeterioration. The national highway network comprises about 12,000 1'w. ofprimary and secondary roads, of which some 3,100 Km are paved and the restearth or gravel. The network also includes about 1,100 km of low 'raffictertiary roads, mostly developed and maintained through community programsfinanced by USAID. Unpaved roads have accounted for a large part of the 40percent growth in the national network since 1976, with most of theremaining network having an average age of over 20 years. Results of aroad condition survey carried out under a previous IBRD financed Project(Loan 1846) indicate that about 60 percent of the paved network (about1,900 km) is seriously deteriorated and that an additional 1,400 kmrequires priority pavement strengthening if deterioration is to be halted.This survey also indicated that at least 50 percent of the unpaved network(some 4,000 km) would need to be rehabilitated or receive periodicmaintenance, given its poor condition or traffic levels above 100 vehiclesper day. For some 30 percent of these roads, carrying about 100 vehiclesper day, it would be more economical to improve drainage and provide gravelsurfacing than to attempt to maintain their level of service with intensiveroutine maintenance operations; for the remaining unpaved network, surfacegrading would be adequate. In addition, many of the bridges included inthe secondary and tertiary road networks are small temporary woodenstructures which require repair or replacement. An independent survey ofbridge condition undertaken by the Ministry of Public Works indicated thatmore than 700 bridges are in need of urgent repair and that some 200temporary structures need to be replaced by permansnt works.
4.07 In 1987 the Directorate of Roads completed preparation of apluriannual expenditure program covering the period 1988-1994 with heavyemphasis on rehabilitation and periodic maintenance (83 percent of thetotal), followed by routine maintenance (15 percent), and administration (2percent). Investment in rehabilitation and upgrading of existing roadinfrastructure, including rehabilitation and paving of earth roads andbridge replacement would account for 77 percent of total investment withtertiary road construction accounting for 18 percent, and equipment,training, supervision and studies making up the remainder. Total cost ofthe program is estimated at US$431 million, including contingencies, butexcluding debt service obligations which are considered in the CentralGovernment budget. The program also establishes physical targets for theperiod including: (a) rehabilitation and periodic maintenance of about1,400 of badly deteriorated paved roads, including the country's mainexternal trade corridors and the Altiplano region network;(b) rehabilitation and periodic maintenance of a further 4,000 km of highpriority secondary roads, in support of improved integration of thenational road network; (c) paving of some 160 km of the road connection toEl Peten; and (d) construction of about 2,600 km of tertiary roads andrehabilitation of a further 330 km for improved access to areas which stillremain largely outside the main stream of the economy. (See StatisticalAppendix, Table 3.7)

- 41 -
4.08 Planned investments in the roads subsector total Q438.9 millionfor the 1988-1981 period (see Table 4.2 below). However, actualinvestments could be lower, unless the execution capacity of the Ministryof Public Works is improved. The bulk of the planned investment isconcentrated on projects financed with external support. These include:(i) an IDB financed tertiary and rural access roads project approved inlate 1986, with actual construction beginning in November 1988; (ii) asecond IDB financed project for the reconstruction of the main highway CA-9Norte, approved in September 1985 but not started until late 1988 givenproblems in completing the bidding process; (iii) the IBRD financedSecondary Roads Rehabilitation project which is expected to get underway inlate 1989 or early 1990, assuming approval by the Guatemalan Congressduring the first half of 1989; (iv) a CABEI financed project to improve asection of the main highway CA-1 which is under execution, with additionalCABEI financing for three small rehabilitation projects for sectors of themain CA-9 CA-2, and CA-1 highways approved by the Guatemalan Congress atthe end of 1988 and signed in early January 1989; (v) a program of laborintensive rural access road development financed by USAID; and (vi) afurther program of rural road contraction to be financed with a recentlyapproved loan from KfW.
4.09 In addition to the above, several major new projects are proposedfor external filancing. These include (i) construction of a paved highwayModesto Mendez-Poptun-Flores (in Peten) expected to be initiated in 1990with possible German financing; and (ii) construction of the AutopistaPalin Escuintla proposed for Italian financing, to be initiated in 1989 or1990. Since the Modesto Mendez-Flores project consists of a majorupgrading of the existing road, it is expected to accelerate the settlementof El Peten while also speeding up the extraction of the areas's forestresources. In view of this, it is extremely important that implementationof the project be carried out within the context of a development programfor this environmentally fragile area which ensures that its natural andcultural resources are adequately protected.
Table 4.2: Roads Subsector
Planned Investments 1988 - 91 by Road Category(Q Millions)
Categories 1988 1989 1990 1991 Totals
Road Construction 6.0 31.9 40.9 38.6 117.4Rehabilitation/ 7.4 66.5 53.5 56.1 183.5Improvement
Rural Access Roads 31.4 48.3 32.7 20.6 133.0Other 0.5 1.5 1.5 1.5 5.0
TOTALS 45.3 148.2 28 .6 116.8 438.9
Source: Statistical Appendix, Table 2.4

- 42 -
Ports Subsector
4.10 The Atlantic port of Santo Tomas de Castilla, the largest ofGuatemala's five principal ports, handles about two-thirds of national porttraffic, with traffic growing at about 7 percent per year siiice 1980. ThePacific Port of Quetzal, the second largest port handles about 18 percentof port traffic, with the remaining traffic handled by the other threeports. The Port of San Jose (located on the Pacific) is now specializingin bulk liquid imports, mainly petroleum products. Champerico (on thePacific) and Barrios (on the Atlantic) are operating in a very deterioratedcondition, and their share of traffic will likely continue to decline inthe future given the availability of more modern facilities elsewhere.Low port productivity continues to be a major problem, especially forPuerto Santo Tomas de Castilla.
4.11 Having invested heavily in the ports subsector in the early 1980'swith construction and opening of Port Quetzal in 1983, planned investmentin the subsector in the period 1988-91 is limited mainly to improvingequipment and some handling facilities. Total investment in the subsectoLprogrammed during this period is estimated at 59.5 million or 11 percent ofthe total sector investment program.
4.12 The Government is however considering a number of alternatives toimprove the efficiency of Puerto Santo Tomas de Castilla, including majornew investments in port facilities based on a master plan study prepared bythe Japanese International Cooperation Agency. Although new investment inthe port will be needed in the future, first priority should be given toimproving the port's low productivity to ensure that existing and futureport facilities can be used as efficiently as possible. Improvements inproductivity would also enable new investments to be phased in over alonger period of time.
Railway Subsector
4.13 The railway system comprises about 800 km of narrow gauge track,most of which is now paralleled by paved roads. A 600 km mainline crossesthe country from the Mexican border at Tecun Uman to the Atlantic ports ofCastilla and Barrios, passing by Guatemala City. An additional 200 km ofbranch lines connect the main line with the Pacific ports of Quetzal, SanJose and Champerico and with the Salvadoran border. The difficultgeometric conditions of the network, aggravated by the very deterioratedcondition of the track and rolling stock have resulted in poor operatingperformance. In 1986 FEGUA transported about 600,000 tons of cargo over anaverage distance below 180 km together with about 400,000 passengers at anaverage distance of 80 km. Given the small volume of traffic and lowdistances involved, it is difficult for the railway to play an economicrole in competition with road transport. Although the public sectorinvestment program for the period 1988-91 includes no investment in therailway subsector, the medium term investment program prepared by theplanning agency (SEGEPLAN) proposes major new investments to rehabilitate
- 43 -
and modernize the existing system. Given the high costs involved andpossible low rates of return, consideration of major investment in railwaysshould be delayed pending completion of the National Transport Plan whichwill formulate an overall strategy to deal with FEGUA's financial andoperational issues.
Aviation Subsector
4.14 The Government operates and maintains six main domestic airportsthrough the General Directorate for Civil Aviation. Guatemala Cityis served by a modern international airport, and the Government iscurrently upgrading the Santa Helena airport in the El Peten region tointsrnational standards. Overall, existing facilities are sufficient forthe levels of air traffic, and no major investments are planned in the nextfew years. Programmed investments for the 1988-91 period are estimated atQ36.6 million or 7 percent of total sector investments. The bulk of theseexpenditures are for air navigation equipment financed in part with FrenchGovernment assistance. Other investments for strategic or touristicdevelopment may also be considered in the future.
Conclusions and Principal Recommendations
4.15 The Government's 1988-91 investment program in transport, with itsemphasis on road rehabilitation and rural access road construction, isconsistent with sector priorities. Nevertheless, the Government confrontsthree basic expenditure related issues which affect future irvestment inthe sector. First, with respect to the road subsector, the Government'sprincipal challenge will be ensuring adequate financing for the program andaccelerating project execution by the Ministry of Public Works. Estimatedinvestment in the road subsector for the period 1988-91 already indicates alower rate of execution than proposed in the Ministry's 1988-1994 program.Road rehabilitation and maintenance must continue to receive high prioritygiven tL-le importance of the road system for promoting agriculturedevelopment and facilitating export development. Second, the Governmentneeds to carefully review the feasibility of new investment in railways,given the questionable economic role of the railways in competition withroad transport. No new investment in railways should be contemplatedpending the results of the National Transport Study. Third, with respectto ports, the Government should carefully assess the timing and magnitudeof proposed new investments in Puerto Santo Tomas de Castilla. Although,Guatemala's export development strategy and the country's heavy dependenceon foreign trade clearly requires an efficient port system, new investmentought to be preceded by or at least accompanied by a program to strengthenport management and operations to enable existing facilities to be utilizedas effectively as possible.

- 44 -
CHAPTER V: TELECOMMUNICATIONS SECTOR
Sector Overview
5.01 As a result of inadequate investment levels and slower thanexpected implementation of programmed investment in telecommunications,Guatemala confronts serious bottlenecks in telecommunications, particularlyin respect to telephone service, which is of poor quality and currentlymeets only about 40 percent of demand. A substantial effort is thereforeneeded to accelerate completion of investments already underway, whileensuring adequate preparation, funding and execution of new investments.
Institutional Framework
5.02 The telecommunications sector is under the responsibility of theMinistry of Communications, Transport and Public Works (MCTOP), andcomprises mainly the Empresa Guatemalteca de Telecomunicaciones (GUATEL),together with two Directorates in the Ministry responsible for i) post andtelegraph and ii) radio and television. GUATEL, a state-owned, autonomous,commercially oriented enterprise, is responsible for all publictelecommunications services in Guatemala except domestic telegraph, whichis operated by MCTOP. Under its charter, GUATEL has full authority todetermine its own development policy, tariffs, investment program, annualbudget, borrowings, organization and staffing. However, in practice,tariff changes and investment plans require Government approval.
Current Service Levels and Sector Development Objectives
5.03 As of end-1988, with 137,235 main telephone lines in service,Guatemala had an average line density of about 1.56 lines in service per100 inhabitants. Telephone service is available in the capital city and ineach of the country's 22 provinces. However service is concentrated in thecapital city area, with greater metropolitan Guatemala City utilizing 80percent of all telephone lines in service. Only 172 of the country's 304municipalities have service of any type; of these municipalities, 60 areserved only by public call telephones. There are about 1,262 public calloffices or coinbox telephones in the country, of which sixty-one percentare located in the capital city. Demand satisfaction for telephone service(working lines/working lines + unmet demand) is currently estimated at 40percent. Telex exchange capacity at end-1987 was 1,500 lines with 1,373subscribers. Demand satisfaction for this service was 98 percent at theend of 1987.
5.04 Given the substantial shortage of telephone lines relative todemand and the delay in implementation of GUATEL's 1984-87 investmentprogram (now expected to be completed in 1990), there is heavy congestionin local service, particularly in Guatemala City. Congestion in the localnetwork is also reflected in the international telephone service, where thecall completion rate for incoming calls is only about 35 percent comparedto about 70 percent for a well-functioning network. The situation shouldbe partly alleviated with the commissioning of a new international exchangeand four new local exchanges in Guatemala City, currently being installed.

- 45 -
5.05 In order to sharply reduce existing bottlenecks and meet a largepart of increased demands for service, GUATEL's 1988-95 development planproposes to meet about 80 percent of demand for telephone service in themetropolitan and other urban areas in the interior of the country by 1995(see Table 5.1 below); the plan would also extend basic telephone serviceto all 304 municipalities, to 462 settlements with a population of 1,000 ormore, frontier townships and places of tourist interest. At the same timenew services would also be introduced such as data transmission service andmobile telephones; while the existing network would progressively bemodernized towards full digitalization. The plan also calls for improvedinstitutional efficiency through major organizational reforms, includingincreased use of private-sector assistance in sector development andoperation.
Table 5.1Demand for Telephone Service, 1987-1995 1
Subscriberlines in
Subscriber service aslines in Unmet Total % of total
End of year service demand demand demand(1) (2) (3) (4) [2+3] (5)
1987 132,718 180,397 313,115 42.41988 137,235 201,815 339,050 40.51989 197,235 167,750 364,985 54.01990 242,235 150,323 392,558 61.71991 315,235 109,014 424,249 74.31992 355,235 97,274 452,509 78.51993 405,235 88,356 493,591 82.11994 450,235 82,457 532,692 84.51995 502,000 106,053 608,053 82.6
1/ Figures for 1987 are actual. Figures for 1988-95 are estimates.
Source: GUATEL
Sector Constraints
5.06 The principal sector constraints affecting the efficiency ofoperation and expansion of telecommunications services relate to GUATEL'sinstitutional environment, sector structure and tariff policies.
5.07 GUATEL's investment effort has been slowed considerably by complexprocurement procedures, and insufficient attention to project management.At the same time, Central Government control of its capital expenditurebudget has restricted flexibility and managerial autonomy. Recognizing theneed to provide GUATEL with greater flexibility, the Government agreed in

- 46 -
1987 to grant GUATEL increased autonomy in personnel management, includinghiring decisions, subject to meeting targets on operational efficiency.The Government and GUATEL are also exploring alternative sectororganization arrangements, including private sector provision of certainservices, such as (a) subcontracting of ancillary services, (b)establishing subsidiaries, with private participation, for services such asmobile radio, data and telex, and (c) increasing the use of privatecontractors for construction of the network. Efforts to improve sectorefficiency through a change in sector structure should be supported.
5.08 GUATEL's tariff structure constitutes a further major constrainton sector development. While international tariffs and installationcharges were revised in 1986, domestic tariffs have not been adjusted since1978. The current charge for a local call unit (of 2.25 minutes) in excessof the free allowance is Q 0.02 (US$0.01) for residential subscribers and Q0.04 for business subscribers. Telephone rental is Q 4 for residential andQ 12 for business subscribers and includes 400 free local call units.These low tariffs have contributed to network congestion. An IBRD-financedtariff study in 1984 recommended a reduction in pulse duration by 33percent in conjunction with a reduction in the rental charge, which wouldhave minimized the effect on low-usage subscribers but penalized high-usagesubscribers. This has not yet been implemented because of (a) the lack offinancial pressure (the adjustment of international tariffs in 1986increased income significantly) and (b) the perception that domestictariffs are politically sensitive (an attempt in 1986 to adjust domestictariffs was reversed following complaints from the public). Nevertheless,adjustments sLould be considered. Maintaining low domestic tariffs willcontinue to degrade quality of service and constrain efficiency ofprovision of service.
Sector Financing
5.09 GUATEL's financial performance over the past few years has beengood. Its rate of return on average net revalued fixed assets for theperiod 1984-87 averaged 14 percent. Despite growth in subscriberconnections over the period of less than 6 percent per annum, operatingrevenues grew at an average 13 percent per annum in real terms. Growth intraffic per line and the adjustment in international tariffs in 1986(tariffs for international calls are now dollar-denominated) contributed torevenue growth. Growth in operating income and net income averaged 9.2percent and 13.8 percent respectively over the period (1984-1987).However, average growth in operating income and net income in real termswas less than 1 percent in 1966 and actually declined in 1987. Theimposition by the Government of an additional tax on international revenues(36 percent in 1986, 24 percent in 1987 and 20 percent in 1988), majorsalary adjustments in 1987, adjustments in depreciation rates in 1987 from3.5 percent on average to 6 percent tc reflect increased technologicalobsolescence of telecommunications equipment and increased interest chargeson foreign debt resulting from the devaluation of the quetzal werecontributing factors.
5.10 GUATEL has financed the foreign exchange cost of its investmentprogram over the period with a mix of multilateral funding (IBRD and IDB)and suppliers' credits. Local costs were financed with internallygenerated funds. The slow pace of implementation of its investment program
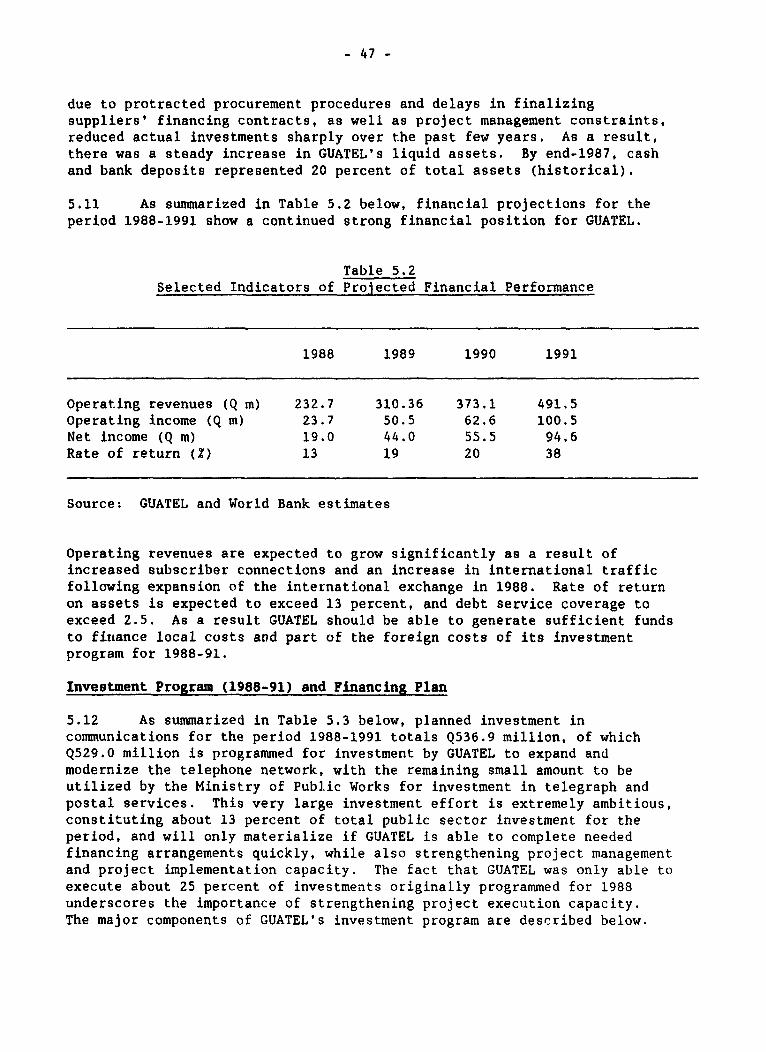
- 47 -
due to protracted procurement procedures and delays in finalizingsuppliers' financing contracts, as well as project management constraints,reduced actual investments sharply over the past few years. As a result,there was a steady increase in GUATEL's liquid assets. By end-1987, cashand bank deposits represented 20 percent of total assets (historical).
5.11 As summarized in Table 5.2 below, financial projections for theperiod 1988-1991 show a continued strong financial position for GUATEL.
Table 5.2Selected Indicators of Projected Financial Performance
1988 1989 1990 1991
Operating revenues (Q m) 232.7 310.36 373.1 491.5Operating income (Q m) 23.7 50.5 62.6 100.5Net income (Q m) 19.0 44.0 55.5 94.6Rate of return (Z) 13 19 20 38
Source: GUATEL and World Bank estimates
Operating revenues are expected to grow significantly as a result ofincreased subscriber connections and an increase in international trafficfollowing expansion of the international exchange in 1988. Rate of returnon assets is expected to exceed 13 percent, and debt service coverage toexceed 2.5. As a result GUATEL should be able to generate sufficient fundsto finance local costs and part of the foreign costs of its investmentprogram for 1988-91.
Investment Program (1988-91) and Financing Plan
5.12 As summarized in Table 5.3 below, planned investment incommunications for the period 1988-1991 totals Q536.9 million, of whichQ529.0 million is programmed for investment by GUATEL to expand andmodernize the telephone network, with the remaining small amount to beutilized by the Ministry of Public Works for investment in telegraph andpostal services. This very large investment effort is extremely ambitious,constituting about 13 percent of total public sector investment for theperiod, and will only materialize if GUATEL is able to complete neededfinancing arrangements quickly, while also strengthening project managementand project implementation capacity. The fact that GUATEL was only able toexecute about 25 percent of investments originally programmed for 1988underscores the importance of strengthening project execution capacity.The major components of GUATEL's investment program are described below.
- 48 -
(a) Ongoing works. These are the delayed works of GUATEL's 1984-87investment program which is being financed in part by IBRD,IDB, and commercial sources. The program provides for (i)expansion of the local exchange capacitv by 109,800 lines (ofwhich 79,000 are in Guatemala City), with associated expansionof the local and long-distance networks; (ii) installation of3,500 additional public call office telephones; (iii) extensionof telephone services to about 300 rural communities; and (iv)installation of a new international exchange in Guatemala City.The works are expected to be completed by end-1990.
(b) 50,000 lines (Guatemala City). This new project provides forexpansion of local exchange services in the central andnorthern areas of Guatemala City not covered under the 1984-87program. Three new digital exchanges of 50,000 lines totalcapacity will be installed with associated junction andsubscriber cable networks; two old local exchanges retired andthe existing local network in these areas rehabilitated; thenational trunk exchange expanded and the analog internationalexchange replaced. Demand satisfaction is expected to increaseto 77 percent and the quality of service in Guatemala City isexpected to improve considerably when the project is completedin the early 1990's. The project cost is estimated atUS$58.1 million equivalent with a foreign exchange component ofUS$44.0 million equivalent.
(c) Rural Telephone Expansion, Phase IV. This project wouldprovide for extension of telephone service to about 462communities with populations over 1,000 inhabitants and to allmunicipal headquarters presently without telephone service.Estimated project cost is US$16.1 million equivalent, with aforeign exchange component of US$14.5 million equivalent.
d) 250,000 lines (1990-95 Investment Program). This program aimsto satisfy a substantial portion of the demand for telephoneservice in urban areas by 1995. Program cost is expected to bearound US$267.0 million equivalent. However project details,implementation schedule, and financing arrangements remain tobe worked out.

- 49 -
Table 5.3Communication Sector Investment Program, 1988-91
(Q Million)
1988 1989 1990 1991 TotalsEstimated -- Programmed ----------
Ministry of Public Works 1.3 2.1 2.2 2.3 7.9GUATELExpansion of Metropolitan
System 21.2 33.7 71.1 59.6 185.6Expansion of Regional and 18.5 60.4 58.5 112.9 250.3Rural Systems
International Service - 7.1 2.1 1.3 10.5Other 9.P 25.8 23.0 24.0 82.6TOTAL 50.8 129.1 156.9 200.1 536.9
Source: Statistical Appendix, Table 2.6
Financing Plan
5.13 Sources of financing for GUATEL's investments over the period1988-91 are shown in Table 5.4. Local costs will be met through internallygenerated funds. Foreign exchange costs of ongoing works will be met byIBRD and IDB loans, suppliers' and bilateral credits and GUATEL'sinternally generated funds. The 50,000-line expansion is being financedthrough an OECF loan of US$47 million equivalent covering the full foreignexchange costs. Continued expansion of the rural telephone network isexpected to be financed by IDB. Sources of financing have not yet beenidentified for the 250,000-line expansion program, for which disbursementsare expected to start in 1990. Financing for other works would be throughmultilateral sources or internally generated funds.
Table 5.4Proposed Financing Plan, 1988-91
(Q Million)
Source of Financing Local External Total
World Bank -- 42.9 42.9IDB 505 50.5OECF -- 72.7 72.7Supplier's/bilateral credits -- 66.9 66.9GUATEL 243.2 -- 243.2Unidentified -- 60.9 60.9
Total 243.3 293.6 536.9
Source: Statistical Appendix, Tables 2.6 and 2.11
- 50 -
Conclusions and Principal Recommendations
5.14 Planned investments in telecommunications constitute about 13percent of public sector investment for the 1988-1991 period reflectingboth the relatively high cost of expanding and modernizing the system andthe urgency of moving rapidly to improve the current poor level of serviceand begin to satisfy the high level of unmet demand. Poortelecommunications has a direct negative impact on efforts to accelerateeconomic growth and support the country's export drive. Acceleratinginvestment in the sector is therefore urgent. Nevertheless, the very highlevel of investment planned for the sector will not materialize in thetimeframe proposed without a major effort on the part of GUATEL tostrengthen project management and accelerate efforts to secure thesubstantial additional financing required. At the same time, action isneeded to improve overall management of the sector, with particularemphasis oni i) increasing the participation of the private sector in theprovision of specialized services in the sector, while also encouraging theuse of private contractors to speed construction of the network; and ii)revising the domestic tariff structure, since continued low tariffs reducethe quality and efficiency of telecommunications services.
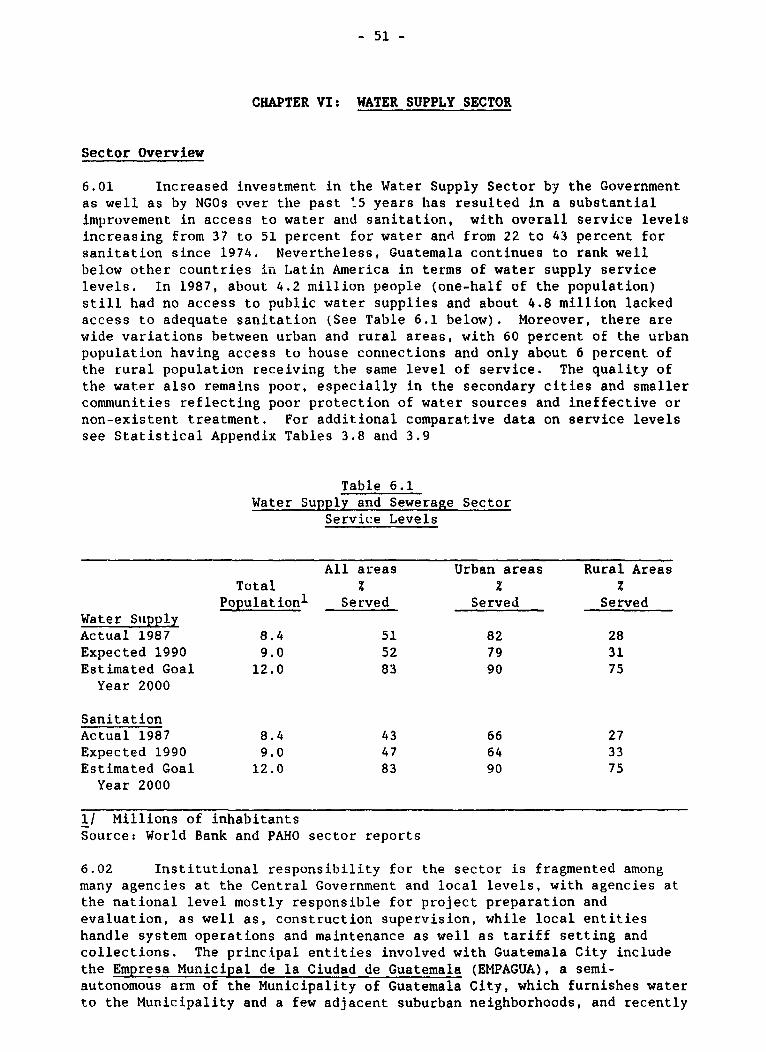
- 51 -
CHAPTER VI: WATER SUPPLY SECTOR
Sector Overview
6.01 Increased investment in the Water Supply Sector by the Governmentas well as by NGOs over the past '5 years has resulted in a substantialimprovement in access to water and sanitation, with overall service levelsincreasing from 37 to 51 percent for water and from 22 to 43 percent forsanitation since 1974. Nevertheless, Guatemala continues to rank wellbelow other countries 'n Latin America in terms of water supply servicelevels. In 1987, about 4.2 million people (one-half of the population)still had no access to public water supplies and about 4.8 million lackedaccess to adequate sanitation (See Table 6.1 below). Moreover, there arewide variations between urban and rural areas, with 60 percent of the urbanpopulation having access to house connections and only about 6 percent ofthe rural population receiving the same level of service. The quality ofthe water also remains poor, especially in the secondary cities and smallercommunities reflecting poor protection of water sources and ineffective ornon-existent treatment. For additional comparative data on service levelssee Statistical Appendix Tables 3.8 and 3.9
Table 6.1Water Supply and Sewerage Sector
Service Levels
All areas Urban areas Rural AreasTotal % 2 z
Population! Served Served ServedWater SupplyActual 1987 8.4 51 82 28Expected 1990 9.0 52 79 31Estimated Goal 12.0 83 90 75Year 2000
SanitationActual 1987 8.4 43 66 27Expected 1990 9.0 47 64 33Estimated Goal 12.0 83 90 75Year 2000
1/ Millions of inhabitantsSource: World Bank and PAHO sector reports
6.02 Institutional responsibility for the sector is fragmented amongmany agencies at the Central Government and local levels, with agencies atthe national level mostly responsible for project preparation andevaluation, as well as, construction supervision, while local entitieshandle system operations and maintenance as well as tariff setting andcollections. The principal entities involved with Guatemala City includethe Empresa Municipal de la Ciudad de Guatemala (EMPAGUA), a semi-autonomous arm of the Municipality of Guatemala City, which furnishes waterto the Municipality and a few adjacent suburban neighborhoods, and recently
- 52 -
took over responsibility for operation of the city's sewage system as well;and an executing unit in the Ministry of Public Works, which is responsiblefor constructing a major pipeline for Guatemala City plus associatedtreatment, storage, and disttibution facilities (Xaya Pixcaya NationalWater Supply System). Additional services are provided by variousmunicipalities in the surrounding suburban areas, as well as by a number ofprivately owned entities, the largest of which is the Compania de AguaMariscal, which administers about 15 percent of house connections in thecapital.
6.03 Water and sewerage services outside the Metropolitan area areprovided by INFOM, an autonomous agency of the Government, which plans,finances and implements public works projects in secondary municipalities.About 60 percent of its lending and techniical assistance has been allocatedfor water and sewerage projects. The Department of Water and Sewerage(DAYA) of the Ministry of Public Works, also designs systems for eventualfunding by INFOM. Operation and maintenance of urban water and seweragesystems in secondary municipalities is the responsibility of themunicipalities themselves, although INFOM provides technical support aswell as acting as a purchasing agent for materials and supplies formaintenance.
6.04 With respect to services in rural areas, primary responsibilityrests with the Ministry of Health. It has two agencies under itsjurisdiction, the Executing Unit for Rural Water Supply (UNEPAR), and theDivision of Environmental Sanitation (DSA). UNEPAR is semi-autonomous andis responsible for planning, constructing (through private contractors) andsupervising potable water projects in rural communities with populations ofmore than 500 inhabitants. Some of UNEPAR's projects are operated andmaintained by community water committees, and some by UNEPAR itself. DSA,a division of the Ministry of Health, is responsible for the design andconstruction of water systems in dispersed rural areas, with populationsunder 500. DSA also manufactures and distributes latrines, provideshygiene education and inspects food processing enterprises. Village watercommittees operate and maintain the systems DSA constructs.
Key Sector Issues
6.05 Low service levels reflect existing financial, institutional andlegal constraints, which have led to low levels of investment. Withrespect to sector financing, overall cost recovery for the sector fromconsumers is negligible. This lack of cost recovery leads to waste, lackof accountability for operating performance and puts an undue financialburden on the Central Government. Except for Guatemala City, water tariffsare too low to cover operating and maintenance costs, let alone contributeto debt service and a share of investment. Sewerage tariffs are generallynot charged. Tariff structures are based on an antiquated water titlesystem with i) monthly water entitlements, which are too large anddiscourage water conservation, and ii) high entry costs which are a barrierto low income consumers.
6.06 Investment in the sector is further constrained by a fragmentedinstitutional structure which results in a lack of sector-wide policies andnorms, inefficient construction, and severely deficient operations andmaintenance. Most agencies have capable staff. However the absence of
- 53 -
institutions which provide a stable working environment and long termcareer opportunities discourages the participation of professionals andtechnicians, especially outside of Guatemala City. Sector development isalso handicapped by the lack of any sectoral agency responsible forinvestment planning and sector policy. SEGEPLAN the inter-sectoralplanning agency and COPECAS, an association of major agencies in thesector, only provide very general guidance. More recently, the Governmenthas established a new coordinating body (CONAGUA) to help accelerateinvestment in the sector as part of the Program of National Reorganization.CONAGUA includes all major sector institutions as well as representativesfrom the private sector and NGOs. Although CONAGUA offers an excellentopportunity to improve coordination and planning in the sector, majorinstitutional changes are still needed to reduce the existing institutionalfragmentation and minimize unnecessary duplication and overlapping ofresponsibilities.
6.07 A water law is also needed to effectively allocate and protectwater resources. Lack of legislation has led to the indiscriminate use ofscarce water resources by private interests, while also restricting publicaccess to springs and other sources. Domestic, industrial and agriculturalpollution has also gone unchecked. The new Constitution places all waterunder public ownership and calls for the promulgation of a special law toregulate water resources. A draft of this law has been prepared but hasyet to be approved by the Guatemalan Congress. Moreover, it still needs tobe complemented by regulations to provide for its enforcement onceapproved.
Programmed Investments (1988-1991)
6.08 Estimates of planned investments for the 1988-1991 period (Table6.2 below) total Q 314.2 million. These estimates do not includeadditional water supply and sanitation investments that could be funded outof the 8 percent share of revenues earmarked for municipalities or underthe proposed Social Investment Fund. The planned investment levels areprobably overly optimistic given the sector's limited implementationcapacity. A brief description of the investment program by agency is givenbelow.
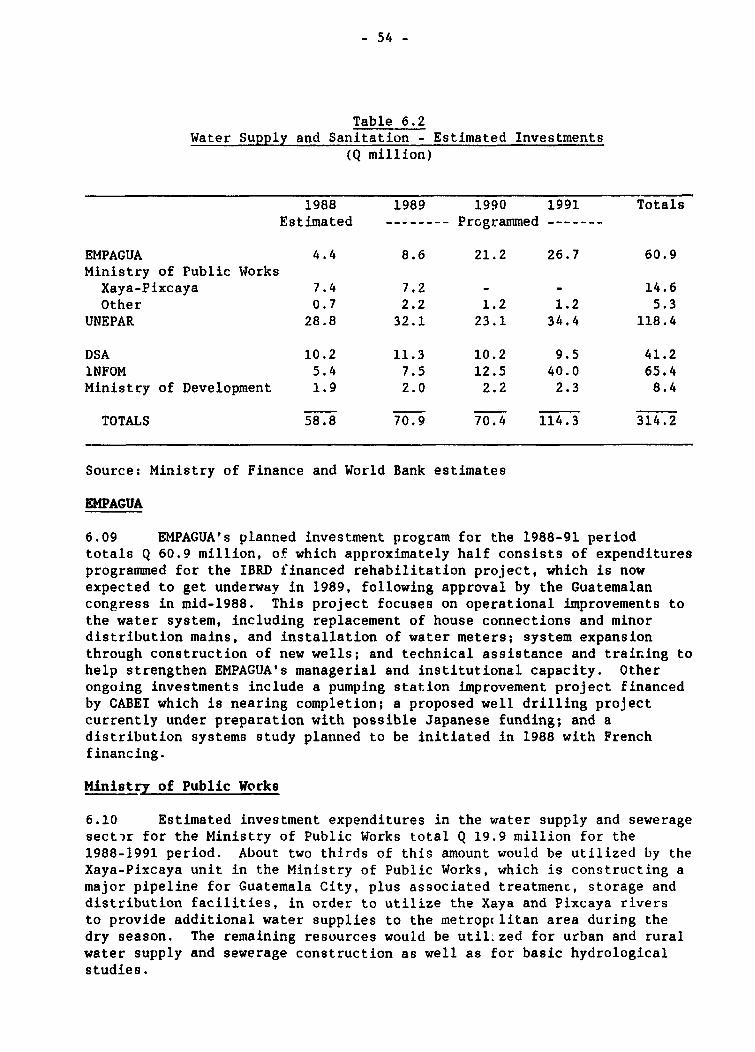
- 54 -
Table 6.2Water Supply and Sanitation - Estimated Investments
(Q million)
1988 1989 1990 1991 TotalsEstimated -------- Programmed -------
EMPAGUA 4.4 8.6 21.2 26.7 60.9Ministry of Public WorksXaya-Pixcaya 7.4 7.2 - - 14.6Other 0.7 2.2 1.2 1.2 5.3
UNEPAR 28.8 32.1 23.1 34.4 118.4
DSA 10.2 11.3 10.2 9.5 41.2INFOM 5.4 7.5 12.5 40.0 65.4Ministry of Development 1.9 2.0 2.2 2.3 8.4
TOTALS 58.8 70.9 70.4 114.3 314.2
Source: Ministry of Finance and World Bank estimates
EMPAGUA
6.09 EMPAGUA's planned investment program for the 1988-91 periodtotals Q 60.9 million, of which approximately half consists of expendituresprogrammed for the IBRD financed rehabilitation project, which is nowexpected to get underwav in 1989, following approval by the Guatemalancongress in mid-1988. This project focuses on operational improvements tothe water system, including replacement of house connections and minordistribution mains, and installation of water meters; system expansionthrough construction of new wells; and technical assistance and training tohelp strengthen EMPAGUA's managerial and institutional capacity. Otherongoing investments include a pumping station improvement project financedby CABEI which is nearing completion; a proposed well drilling projectcurrently under preparation with possible Japanese funding; and adistribution systems study planned to be initiated in 1988 with Frenchfinancing.
Ministry of Public Works
6.10 Estimated investment expenditures in the water supply and seweragesect-r for the Ministry of Public Works total Q 19.9 million for the1988-1991 period. About two thirds of this amount would be utilized by theXaya-Pixcaya unit in the Ministry of Public Works, which is constructing amajor pipeline for Guatemala City, plus associated treatmenc, storage anddistribution facilities, in order to utilize the Xaya and Pixcaya riversto provide additional water supplies to the metrop litan area during thedry season. The remaining resources would be util:zed for urban and ruralwater supply and sewerage construction as well as for basic hydrologicalstudies.
- 55 -
6.11 The first stage of the Xaya-Pixcaya project, including canals andtreatment plant has been completed, with construction currently continuingwith the first part of the second stage. This stage includes i) doublingthe number of steel pipes and sifons and expanding the treatment plant Lode Coy; and ii) additional work to expand the capacity of the main canal.Construction of the first part of stage two is expected to be completed in1989. Despite its advanced state, the project appears to be moving forwardwithout the benefit of sufficient hydrological studies needed to develop asafe water supply source for the expanded facilities. As currentlydesigned, plant capacity would only be partially utilized during the shortperiods of peak flow in the Xaya-Pixcaya river. Since further studies areneeded to define and develop adequate water sources for the expanded plant,completion of the expansion could be delayed pending further analysis ofwater resource availability. The unit is also considering a furtherproject to develop the Guacalate river, with initial work on a feasibilitystudy getting underway during 1988. The proposed project will require verycareful analysis given the expected high cost of the project, the problemsassociated with heavy pollution in the river, as well as the need for acostly relocation of coffee processing plants.
INFOM
6.12 INFOM's investment program in the water supply and sewerage sectoris estimated to total Q 65.4 million for the period 1988-1991, howeverINFOM's ability to achieve this investment level will depend heavily on theavailability of external financing, especially INFOM's ability to initiateimplementation of the proposed follow up IDB project during 1990. INFOM'sefforts in the sector over the next few years can be broken down into threemain programs. First a small on-going program of credit for municipalwater supply works financed from INFOM's own resources. Second, the on-going Water Supply and Sewerage Project financed by IDB which includesfinancing for the construction or expansion of 14 water supply systems and3 sewerage systems in 15 secondary cities. This project was expected to becompleted in 1988. However INFOM will continue the project over the nexttwo years using previously uncommitted funds to finance some additionalworks. The third project would be a follow up water supply and sewerageproject also with financing from IDB. It would finance a portion of theinvestments identified under a National Water and Sewerage Plan covering330 municipalities which was completed in late 1988 utilizing IDB technicalassistance firnancing. INFOM is expecting to complete negotiations for thisnew project in time to start construction of new works under the project in1990.
UNEPAR
6.13 Investments in water supply and sewerage programmed by UNEPAR forthe four year period through 1991 total an estimated Q 118.4 million.These investments consist of small rural water supply projects throughout
- 56 -
Guatemala, including both new construction as well as the repair andreconstruction of older systems. These projects are funded in part underthe IDB financed Fourth Rural Water Supply Project,1 with additionalfunding from USAID, the Federal Republic of Germany (KFW), France, andCARE. During 1988, UNEPAR managed about 200 small projects, with anadditional 200 projects in other small communities planned for 1989. Afollow up Fifth Rural Water Supply project is under preparation and couldbe initiated in 1990, assuming satisfactory progress in completing the on-going Fourth Project, which is now expected to be comple-.ed during 1989.This project is also proposed for IDB financing. UNEPAR's ability toachieve the substantially higher investment level programmed by 1991assumes good progress in completing negotiations for the follow-up IDBproject as well as a rapid start on implementation.
Division of Environmental Sanitation (DSA)
6.14 The investment program for the Division of EnvironmentalSanitation (DSA) for the period 1988-1991 totals Q 41.2 million, assumingcontinued funding through USAID. DSA's investment program provides for theconstruction of rural water supply systems and the construction of latrinesas part of an integrated community health program. DSA's 1988 programprovided for i) preparatory work and/or construction of 135 small watersupply systems in the departments of Totonicapan, San Marcos, Solola,Huehuetenango, Quiche, and Quezaltenango, and ii) construction of latrinesin 115 small communities in the Departments of Quezaltenango, Quiche, andHuehuetanango. This investment effort is being continued in 1989, withongoing and new works programmed for about 140 small communities in thesame departments. Both the water supply and latrine constructionprograms are fully financed by USAID grant and loan funds.
Conclusions and Principal Recommendations
6.15 Although planned investments in water supply and sanitation arefully justified, the level of investment (7.0 percent of total projectedpublic sector investment) remains low in comparison with sector needs.There is therefore, an urgent need to expand investment in the sector overthe medium term. With spending levels at only about 0.3 percent of GDP in1988, there is considerable room for improvement. A possible medium termobjective would be to seek to increase investment levels to between 0.5 and0.6 percent of GDP by 1995. To do so, however, will require a sustainedeffort to address sector financial, legal and institutional constraints.Key recommendations for sector adjustment are summarized below:
1/ The Fourth Rural Water Supply Project, financed by IDB and approved inJune 1983, includes i) the construction of 110 water supply pipelinesin rural communities to expand the provision of water supply; ii)rehabilitation of 90 existing facilities; and iii) strengthening ofUNEPAR's capacity to provide adequate maintenance of water supplysystems already in operation. After undergoing considerable initialdelays this project is now expected to be completed in 1989.

- 57 -
a. With respect to sector finances, a major effort is needed tomobilize additional domestic resources for investment and operationof water supply and sanitation systems, both to increase investmentand reduce the current heavy dependence on external financing (over75 percent of projected investment for the 1988-1991 period), aswell as ensure adequate maintenance. This will require theimplementation of adequate cost recovery policies in the sector,including increasing water tariff levels and reforming theantiquated water title system. In large communities, sufficientcash should be generated internally to cover operations,maintenance, debt service, working capital needs and a portion ofthe investment program. In smaller communities, consumers shouldpay charges which, as a minimum, cover operations and maintenance.Additional financing for investment should be made available by theGovernment through loans to larger communities, with grants limitedto small communities.
b. Although the recent establishment of CONAGUA is expected to improveoverall sector coordination, the expansion of water and sanitationservices will also require a major reorganization of the sector toconsolidate and restructure sector institutions to improve planning,finance and operations and maintenance and to end the institutionalfragmentation which reduces sector efficiency. The proposedinstitutional structure would involve: i) the creation of CentralGovernment entities for both water resource allocation and forsector investment planning; ii) the consolidation of all agenciesdealing with rural water supply into one entity; and iii)continuation of the current system of rural water committees withincreased technical support. Such an institutional framework wouldgreatly strengthen overall coordination of the sector and improveproject implementation while still providing ample room forenhancing local community participation in improving water andsanitation services.
c. Early approval of the draft water law by Congress is needed toeffectively allocate and protect water resources. At the same time,regulations need to be drafted to provide for effective enforcement,which is essential if the current indiscriminate use of scarce waterresources is to be stopped and the quality of Guatemala's waterpreserved.
d. In defining and preparing future investment in the sector thefollowing objectives should have priority: i) extending watersupply to the poor fringe areas of Guatemala City and Escuintla andQuezaltenango; ii) supporting efforts to improve water quality,reduce unaccounted for water and rehabilitate existing watersystems; ii) further extending water and sanitation services inrural areas, emphasizing low cost technology and communityparticipation; iii) protecting water supply sources in the GuatemalaCity area from contamination, possibly including solid wastemanagement for Guatemala City and an expanded reforestation effort;

- 58 -
iv) providing treatment for toxic industrial waster and domesticsewerage in areas where surface water contamination directly affectscommunity water supplies; and v) supporting institution buildingthrough training, technical assistance, equipment and supplies.
e. The proposed Social Investment Fund, by opening up new channels forsector financing and technical assistance could make a majorcontribution to expanding sector investment levels and improvingaccess to water and sanitation services, especially in the ruralareas.

- 59 -
CHAPTER VII: THE SOCIAL SECTORS(Health and Education)
Introduction
7.01 Guatemala's provision of public social services and its efforts tomeet basic needs have been inadequate to satisfy the requirements of itsrapidly growing population. Insufficient Government efforts over the pastthree decades--compounded by low public revenues and a stagnant economy inthe early part of the 1980s--have led to declining real per capital socialexpenditures. As a consequence, key health indices are worse than manycountries in Latin America, and literacy rates remain among the lowest inthe continent (see Table 7.1 below). Similarly, there has been slowprogress in both poverty alleviation, especially in the rural areas, and inthe reduction of income disparities.
Table 7.1Selected Social Indicators
Other MiddleIncome Countriesin Latin America
Indicator Guatemala Average Range
Life Expectancy (years) 61 66 60-74Infant Mortality Rate 65 46 17-73(per thousand)
Population per physician 8.6 2.3 1.5-2.9School Enrollment Ratios'
Primary 76 104 70-122Secondary 17 47 24-69
Adult Literacy Rate2 55 80 60-90
1/ Percentage of school age children enrolled in primary and secondaryschools.
2/ 1980 data except for Guatemala (data for 1984-85).
Source: Statistical Annex, Table 3.10.
7.02 Over the past three years the Government has initiated a majoreffort to better address the country's long standing needs in the socialsectors. In addition to reinforcing and beginning to expand public sectorprograms in health and education, the Government is also exploring actionsto open up new channels for improving services and support for the poor,including additional support to municipalities, NGOs, cooperatives andother private sector associations within the framework of a proposed SocialInvestment Fund. Nevertheless, despite considerable progress in redefining

- 60 -
priorities and initiating new programs, the task is an arduous one and muchmore needs to be done. This chapter examines basic sector needs andconstraints in health and education, including a review of proposedinvestments and other expenditures as well as financing requirements.Housing and urban development issues are analyzed in Chapter VIII. Watersupply and sanitation investments, which are also essential for improvinghealth conditions, were reviewed in Chapter VI.
A. Health Sector Needs, Investment Program, and Financing
Health Sector Overview
7.03 The health status of the Guatemalan population is very deficient.Infant mortality (65 deaths per 1000 live births) and maternal mortality,(1.2 per 1000 live births) are high when compared with other Latin Americancountries at a similar stage of socioeconomic development. The fact thatcontagious diseases and d4seases associated with poor hygiene andmalnutrition are among the main causes of death, further underscores thepoor health status of the population. Mortality among children is alsohigh (15 per 1000 children under five), with most deaths easily preventablethrough better sanitation and vaccination and basic primary health care.Over 50 percent of children deaths are related to intestinal andrespiratory diseases brought on by the lack of potable water and seweragefacilities and poor housing conditions.
7.04 The Ministry of Health (MSP) and the Social Security Institute(IGSS) are the public sector health care providers, with IGSS coveringabout 8 percent of the population and the Ministry nominally responsiblefor about 80 percent of the population. In practice, however, MSP servicesremain quite limited in scope, reaching only about 2 million people or lessthan 30 percent of its constituency with regular health care services.This reflects in part the lack of roads in remote areas making access tomedical services extremely difficult. It also reflects inadequate sectormanagement and financing. In addition to MSP and IGSS health care, privatesector medical services cover about 6 percent of the population, with asimilar share of services being provided by the armed forces to theirmembers. Non Governmental groups, including churches provide coverage forabout 1 percent of the population. The overall provision of servicesremains highly skewed, with a high concentration of services in theGuatemala City area and only minimal coverage in many of the outlyingregions.
7.05 The Government's Program of National Reorganization stresses theimportance of primary health care, noting that Government programs to datehave i) concentrated on curative care with little attention given topreventive medicine; ii) have resulted in little overall improvement inhealth indicators, despite substantial resources spent on hospital care;and iii) have produced a heavy concentration of health services in theurban areas in detriment to the rural areas. The Government's policyobjective of emphasizing primary health care is clearly appropriate.However, achievement of this objective will require further changes in howthe sector is administered and financed.

- 61 -
Key Sector Issues and Expenditure Priorities
7.06 The difficulties which the Government faces in trying to providesatisfactory health care, reflect not only inadequate funding for thesector, but also inefficient utilization of existing resources combinedwith continued over emphasis, at least in practice, on more expensivecurative care over basic primary health care. Primary health care hasreceived only about one-fourth of current expenditures and less than onefifth of capital expenditures in the last few years. The bias towardsurban hospital based health care, has also resulted in an emphasis ontraining more specialized health personnel, rather than concentratingresources on the training of more urgently needed auxiliary, community andhealth promoter personnel for rural areas. The adequate provision ofprimary health care services is further restricted by the centralizedadministration of the health care system, with most decisions on suppliesand personnel taken in Guatemala City, often with considerable delay.Increasing the availability of resources for preventive medicine andprimary health care is by far the most cost effective means to improve theoverall health of Guatemala's population. Comparative data from developingcountries indicates that the cost of saving one life through preventivecare is 5 to 10 times less than the cost of curative care per each lifesaved.
7.07 Poor hospital administration has also led to an explosive increasein current expenditures for curative medicine, which almost doubled since1986 (see Table 7.2). Although overall utilization of beds in MSPhospitals appears adequate, about 60 percent of all cases treated inhospitals could have been treated more cheaply and more effectively inhealth posts and rural health centers. Poor allocation of exis.ingresources has resulted in a disproportionate share of expenditures onpersonnel, with only modest amounts allocated for needed goods and servicesand only about one-fifth of what is needed allocated for maintenance andequipment.

- 62 -
Table 7.2Ministry of Health: Current Expenditures
For Preventive and Curative Medicine, 1985-1988(Q Millions)
1985 1986 1987 1988
Total Financ'ng 46.9 50.0 72.6 97.9
A. Preventive Medicine- Sanitation 0.8 u.7 0.8 1.1- Epidemilogy 3.8 3.9 8.4 9.6- Health Centers Type B & Health Posts 6.5 6.9 9.2 13.7
Total 11.1 11.5 18.4 24.4
B. Curative Medicine- General Hospitals 32.6 35.2 49.8 67.5- Specialized Hospitals 3.2 3.3 4.4 6.0
Total 35.8 38.5 54.2 73.5
Source: Ministry of Health, Unit of Planning and Budgeting
7.08 Although total Central Government budget allocations for the HealthSector increased from Q 127.4 million in 1980 to an estimated Q 251.7million in 1988, expenditures as a percentage of GDP have actually fallenfrom 1.6 percent of GDP in 1980 to about 1.3 percent of GDP in 1988. Thislevel of spending remains substantially less than allocations made in otherLatin American countries of similar socioeconomic profile. Since the shareof health expenditures in total expenditures is not unduly low and in linewith other middle income countries, the low level of expenditures on healthreflects the relatively low level of total Central Government resourcemobilization and expenditure.
7.09 Increased resources will be essential over the medium term ifGuatemala is to improve the overall quality of health care and the healthstatus of its population. However, initial efforts should focus on abetter allocation and use of existing resources. This is particularlyimportant since available resources are unlikely to grow quickly in thenext few years taking into account on-going resource constraints. Thereare five basic expenditure allocation issues. First, the continuing biastowards curative care needs to be reversed. This will involve shiftingmore resources towards primary health care, including increased allocationsfor less costly health technicians, coupled with a gradual reduction in thenumber of physicians assigned to large urban hospitals and a major effortto revamp hospital administration and ensure more efficient and costeffective provision of hospital services. Second, as indicated in partabove, MSPs staffing profile needs to be revamped to provide a more
- 63 -
efficient use of resources. The present staffing pattern, with itspredominance of high cost physicians, has an insufficient number of nursesand paramedical personnel. Third, the overconcentration of services in thecapital area needs to be corrected by increasing substantially the amountof resources allocated to the rural areas. Fourth, coordination betweenMSP and IGSS should be strengthened to avoid duplication of facilities andpermit an exchange of services in cases where there is excess capacity.Fifth, allocations for maintenance and essential supplies need to beincreased. Neither primary or curative health care facilities haveadequate funds for operations and maintenance.
Government's Program
7.10 Recognizing the need to better address the sector's underlyingconstraints, the Ministry of Health has initiated efforts to improvecoverage, provide better nutrition, tackle basic sanitation and overallhealth environment issues, and strengthen management of the sector throughdecentralization and more efficient use of resources. With respect toprimary health care and preventive medicine, the Ministry is expandingprograms of fluoridation, provision of vitamin A to children, and controlof transmittable diseases such as malaria. It is also expanding trainingof health care technicians and community health care workers, including thetraining of about 4,000 rural health care promoters. Other programs toimprove the coverage and effectiveness of health care include public healtheducation campaigns and the provision of essential medicines through statepharmacies and other non-profit establishments to help ensure adequateaccess to medicine at reasonable prices. Nevertheless, much more needs tobe done to better coordinate a wide variety of Ministry programs, whilealso improving targeting and cost effectiveness.
7.11 As a result of these and other complementary efforts, theGovernment estimates that overall health indicators have improved, notingthat the rate of infant mortality has fallen from a level of 79 in theearly l980s to 65 per thousand in 1988 and that the level of maternalmortality has fallen from l.e to 1.2 per thousand live births. Progresshas also been made in expanding vaccination programs. Polio vaccinationcoverage, for example, has increased, according to Government estimates,from 14 to 40 percent.
Proposed Investment Program, 1988-91
7.12 As in previous chapters, the subsequent analysis focusses on thethe health sector investment program, although the distinction betweeninvestment and current expenditures in the social sectors, especially inhealth and education, is somewhat of a false one. More broadly defined,social investment in the health sector includes not only capitalinvestments, but also maternal and child health care programs, familyplanning, public health education, and nutrition programs, most of whichare funded under the current budget. In addition to the above, theMinistry of Health also manages rural water supply and sanitationinvestments as discussed in the previous chapter.
7.13 The proposed investment program in the health sector is summarizedin Table 7.3. It includes investments carried out by MSP, the Ministry ofPublic Works, and IGSS, and totals Q229.6 million over the period 1988-91.

- 64 -
The bulk of programmed investments (65Z) would take place in 1988 and 1989,reflecting the completion of major ongoing investments in hospitalconstruction and equipment. Resources allocated for health centers andhealth posts average Q 9.0 million over the period, although this level ofinvestment could be increased considerably in 1990 and 1991 if preparationof a program of rural primary health care can be accelerated as currentlyproposed by the Ministry. Funding allocated for preventive health care(immunization and infant survival) is only budgeted at an average level ofabout Q 8.0 million during the period, but should be increased over themedium term. A more detailed discussion of the investment program in theHealth Sector follows:
Table 7.3Health Sector-Investment Program (1988-1991)
(Q million)
1988 1989 1990 1991
Health Centers and Posts 8.6 14.7 6.4 6.6Immunizatioa and Infant 7.0 8.5 8.5 8.5Survival
Rural Primary Care - - 11.0 11.0Construction and Repair 19.2 40.7 0.5 0.5of Hospitals
Hospital Equipment 17.0 8.2 - -Specialized Medical Care 0.2 - - -IGSS Facilities 13.1 10.0 10.0 10.0Other 1.9 1.0 3.0 3.0
TOTALS 67.0 83.1 39.4 40.1
Source: Budget Office, Ministry of Health, and World Bank estimates
Ministry of Health
7.14 Curative Health Care. Once the ongoing IDB financed project forconstruction and equipping of hospitals and specialized clinics iscomplet.ed in 1989, together with the provision of additional equipmentfinanced under a French protocol, no new investments of this type arerequired in the next tnree to four years. Indeed, new hospitalinfrastructure may not be required even beyond this period since overallhospital bed availability in the country (including IGSS and the privatesector) appears sufficient to meet projected needs, assuming provision ofservioes and hospital administration is rationalized. Existing old anddeter -ated hospital infrastructure and equipment could be graduallyreplaced or rehabilitated by increasing existing very low user fees andutilizing funds from personnel vacancies which are ,.ot filled.
- 65 -
7.15 Primary Health Care. A minimum program for replacement andequipping of existing primary health care infrastructure (Health Centers,Type B and rural posts) should be continued during the next three years toensure, as a mlnimum, that coverage is not reduced. This would requirereplacing 36 health posts and 8 health centers per year, with an annual costof about Q10.0 million per year, which is very modest compared toexpenditures on hospitals in recent years. Should additional resources bemade available, this program should be expanded once a more detailedinventory of existing infrastructure and additional needs is carried out.In fact, the Ministry is in the process of preparing an expanded ruralprimary care program which it proposes to initiate in 1990. Gross estimatesindicate that of the existing 780 rural posts and 216 health centers, about200 posts lack their own facilities with most of such posts functioning inrented property without equipment, running water or electricity. Inaddition, close to 45 percent of these poorly maintained rural posts andhealth centers are now over 10 years old.
7.16 Preventive Health Care. The existing program of immunizationshould be maintained at least at the level shown by accelerating effortsto reach agreement on and then utilize a proposed USAID grant of $16.2million. Other programs such as those for the construction of ruralwater supply aqueducts and latrines which are also financed with USAIDassistance (See Chapter on Water Supply and Sanitation) should also becontinued at least at their present levels over the next three years.
Social Security Institute (IGSS)
7.17 The investment budget proposed by IGSS for 1988 totals '13.1million, mainly for the repair, improvement, and construction of hospitalsand other facilities to improve service. This level of investment couldbe reduced to about Q10 million per year for the next few years, providedthe need for new or rehabilitated hospital infrastructure is minimizedthrough better utilization of existing public and private hospitalfacilities. One option for improving utilization of facilities would beto establish a system permitting IGSS patients to select the doctor orfacility of choice from an agreed list, with payment being made by IGSS tothe institution or doctors involved. The lower level of investmentexpenditu es would also be consistent with the expected reduction intransfers from the Ministry of Health to IGSS.
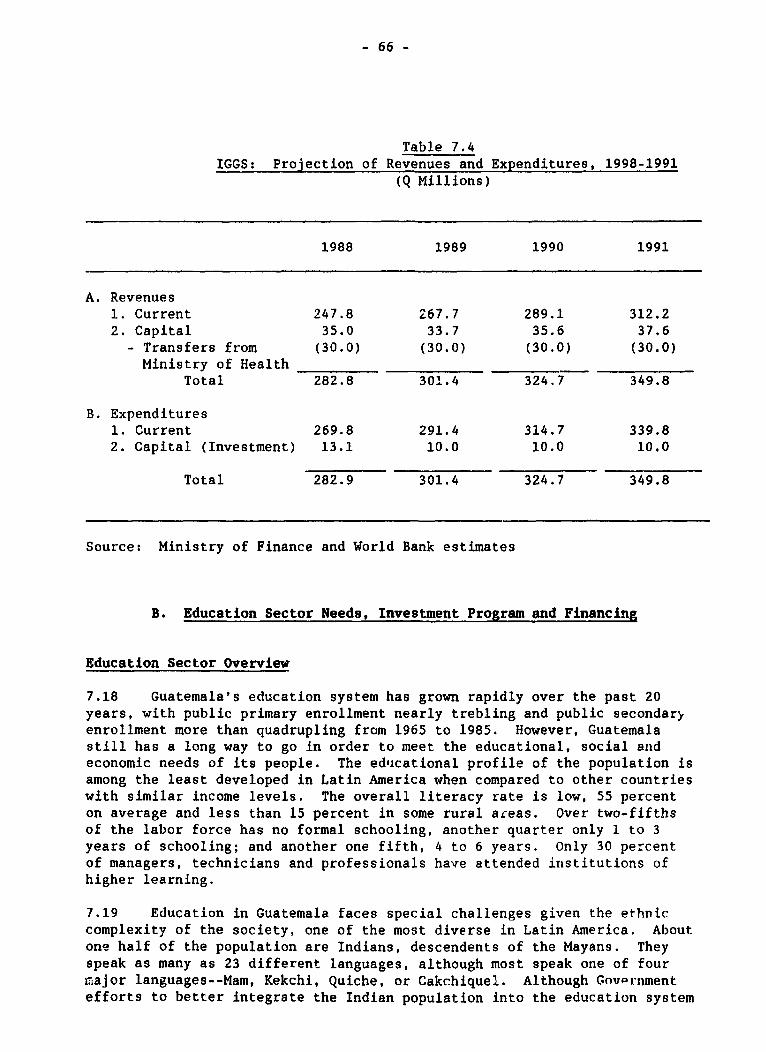
- 66 -
Table 7.4IGGS: Projection of Revenues and Expenditures, 1998-1991
(Q Millions)
1988 1989 1990 1991
A. Revenues1. Current 247.8 267.7 289.1 312.22. Capital 35.0 33.7 35.6 37.6
- Transfers from (30.0) (30.0) (30.0) (30.0)Ministry of Health
Total 282.8 301.4 324.7 349.8
B. Expenditures1. Current 269.8 291.4 314.7 339.82. Capital (Investment) 13.1 10.0 10.0 10.0
Total 282.9 301.4 324.7 349.8
Source: Ministry of Finance and World Bank estimates
B. Education Sector Needs, Investment Program and Financing
Education Sector Overview
7.18 Guatemala's education system has grown rapidly over the past 20years, with public primary enrollment nearly trebling and public secondaryenrollment more than quadrupling from 1965 to 1985. However, Guatemalastill has a long way to go in order to meet the educational, social alndeconomic needs of its people. The educational profile of the population isamong the least developed in Latin America when compared to other countrieswith similar income levels. The overall literacy rate is low, 55 percenton average and less than 15 percent in some rural areas. Over two-fifthsof the labor force has no formal schooling, another quarter only 1 to 3years of schooling; and another one fifth, 4 to 6 years. Only 30 percentof managers, technicians and professionals have attended institutions ofhigher learning.
7.19 Education in Guatemala faces special challenges given the ethniccomplexity of the society, one of the most diverse in Latin America. Aboutone half of the population are Indians, descendents of the Mayans. Theyspeak as many as 23 different languages, although most speak one of fourmajor languages--Mam, Kekchi, Quiche, or Cakchiquel. Although Govprnmentefforts to better integrate the Indian population into the education system
- 67 _
and hence into the mainstream of economic life were expanded in the early1980s under a bilingual education program, the majority of the Indianpopulation continues to speak little Spanish and remains isolated from theeconomic life of the country.
Key Sector Issues
7.20 Guatemala's poor educational profile results from a long traditionof under-investment and improperly directed investment in education. Untilrecently, less than 2 percent of GDP was being spent on education comparedwith an average expenditure of 4.5 percent of GDP in other developingcountries. Although programmed expenditures for 1988 would increasespending slightly to 2.4 percent of GDP, expenditures on education remaininadequate. At the same time, overall expenditure patterns have beeninappropriate, with i) a disproportionately large share of educationresources going for higher education while almost 40 percent of the primaryschool age population remained uncovered; ii) only very limited budgetsupport for non-salary costs, i.e. for textbooks, other teaching materials,maintenance, and pedagogical and administrative support; and iii) less than10 percent of the budget--mostly financed with external financialassistsnce--devoted to direct investment in the sector to expand coverageand improve learning conditions.
7.21 The very low level of resource allocation and the lack of prioritygiven to the lower grades of schooling are largely responsible for thebasic issues facing the sector. These include:
a. Low Efficiency. The education system has been poorly managed,as reflected in the poor utilization of facilities, and highrepetition rates (almost 50 percent in the lower primarygrades).
b. Low Quality. The instruction offered has often been of poorquality given unsuitable curriculum, and unqualified teachers,as well as inadequate physical facilities and instructionalmaterials, especially in primary education.
c Low Performance. The overall performance of the system has alsosuffered given the above problems, as illustrated by theinefficient flow of students and poor student achievement ratesin primary school. Only about 58 percent of children aged 7-14years attend school on average, with the percentage falling toabout 32 percent in rural are3s. At the same time unit costsper pupil in primary school remain extremely high.
d. Inequality of Opportunity. The system of education alsosuffers from major inequalities, with only one of three childrenin rural areas receiving some primary education and only a verysmall proportion benefiting from secondary or higher education.The special education needs of the Indian population are onlypartly addressed by current efforts to expand bilingualeducation. At the sa,ne time, the lack of an adequate costrecovery system in higher education, limits the Government'sability to allocate additional resources to better meet theneeds of the rural population.
- 68 -
Government's Program
7.22 Recognizing the serious issues in education facing the country, theGovernment's Program of National Reorganization emphasizes the need for afundamental reform of Guatemala's education system, noting the poorcoverage and quality of the existing system as well as theinappropriateness of the curriculum. More specifically, the Government'sprogram current program in the sector stresses the need to: i) adapt thesystem to better fit the social and cultural realities of the country; ii)double the budget of the Ministry of Education by 1995 with the objectiveof expanding coverage to about 90 percent of children of primary schoolage, while also providing adequate teaching materials and other schoolsupplies; iii) continue with the program of regionalization anddecentralization both to improve administration and better use ofresources, as well as to ensure that the education provided meets local andregional needs; iv) expand the coverage of the National Program forBilingual Education: v) reinforce the literacy campaigns being managed bythe National Committee for Literacy (Comite Nacional de Alfebetizacion -CONALFA), as provided for in the Constitutien; and vi) strengthen the roleof non-formal education in both complementing the formal education system,but also in helping meet the specific needs of different regions and socio-economic groups.
Recent Trends in Public Expenditures
7.23 Consistent with the increased priority being attached to education,overall public expenditures on education and training have been increasingin the past few years, with total programmed expendiLures increasing by 36Zbetween 1986 and 1988. Total expenditures by the Ministry of Education in1989 are projected to be about 14 percent above the level of 1988, mainlydue to higher wages and salavi.t:. At the same time, the investment programin the sector has progressively shifted its emphasis toward primaryeducation, with more resourcas targeted toward the rural and poor urbanpopulation. In the early 1980s major international or bilateraldevelopment agencies supported education projects in secondary, technicaland higher education. The focus of more recent projects has been onbilingual education (USAID), rural primary schooling (IDB) and theimprovement of primary education in poor urban areas (IBRD). Recentprojects approved by the Government confirm this pattern, including anutrition grant from WFP w`ich has a school nutrition component andpreparation of a Basic Education Project (Educacion Minima) aimed atexpanding coverage and improving quality of schooling for the lower primarygrades, in support of which a US$30 million loan was approved by IBRD inDecember 1988.

- 69 -
Table 7.5Education Sector - Expenditures
by Category (1986-88)(Q Million)
Category 1986 1987 1988(actual) (Approved) (Programmed)
Wages and Salaries 182.7 263.0 227.8Goods and Services 17.4 41.1 44.8Leasing of land and buildings 0.7 0.8 1.1Current Transfers1 48.5 69.3 93.2Inivestment (Educ.Min) 7.1 18.3 18.4Investment (0in. Public Works) 12.8 25.9 30.0Other 0.3 0.1 0.1
T 0 T A L 269.5 358.5 415.4
11 Current transfers consist mainly of allocations for the University ofSan Carlos which received 93, 95 and 82 percent of indicated amountsrespectively in 1986, 1987 and 1988, as part of constitutionallyearmarked revenues. The bulk of these funds are used for wages andsalaries. For 1988 an additional 14 percent of current transfers wasallocated to the National Committee for Literacy.
Source: Ministry of Finance, 1988 Budget.
7.24 Despite these positive development,, however, resource allocationand expenditures in education continue to confront serious problems. Theshare of higher education remains exceedingly high (over 20 percent of totalcurrent expenditures in 1988), as shown in Table 7.6. At the same time, asshown in Table 7.5 above, salaries and allowances consume the bulk of therecurrent budget, thus leaving only a very small portion of resources forteaching materials and maintenance. To the extent that some improvementshave been introduced in equipment, textbooks, and better trained teachers,these have generally come about as a result of programs and projectssupported by external resources. The rates of implementation of ongoinginvestments have also remained very low (between 15 and 50 per-,ent). Basedon preliminary estimates the rate of execution of the 1988 investmentprogram in the sector was about 50 percent. This reflects a lack ofcounterpart funds, limited project management and implementation capacity,and in somne cases ineffective leadership and lack of sustained commitment tocarry out specific projects. Despite efforts to improve consistency,projects financed with external resources still suffer from a lack ofadequate coordination and a unified approach to sector policy issues. Thisis particularly the case for rural school buildings (using local materialsand community participation versus more traditional sub-contracting);learning-teaching strategy for bilingual education; curriculim developmentand production of teaching materials; and pre-service versus in-serviceteacher training.
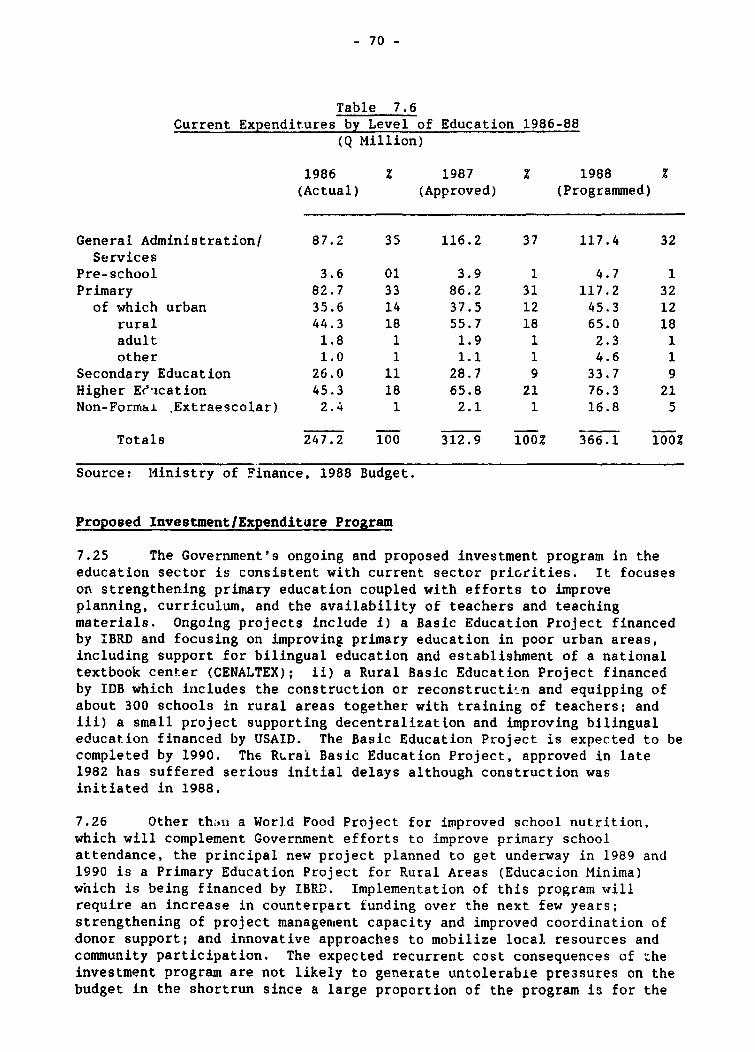
- 70 -
Table 7.6Current Expenditures by Level of Education 1986-88
(Q Million)
1986 ? 1987 Z 1988 Z(Actual) (Approved) (Programmed)
General Administration/ 87.2 35 116.2 37 117.4 32Services
Pre-school 3.6 01 3.9 1 4.7 1Primary 82.7 33 86.2 31 117.2 32of which urban 35.6 14 37.5 12 45.3 12
rural 44.3 18 55.7 18 65.0 18adult 1.8 1 1.9 1 2.3 1other 1.0 1 1.1 1 4.6 1
Secondary Education 26.0 11 28.7 9 33.7 9Higher Ee'ication 45.3 18 65.8 21 76.3 21Non-Formai Extraescolar) 2.4 1 2.1 1 16.8 5
Totals 247.2 100 312.9 100Z 366.1 100?
Source: Hinistry of Finance, 1988 Budget.
Proposed Investment/Expenditure Program
7.25 The Government's ongoing and proposed investment program in theeducation sector is consistent with current sector priorities. It focuseson strengthening primary education coupled with efforts to improveplanning, curriculum, and the availability of teachers and teachingmaterials. Ongoing projects include i) a Basic Education Project financedby IBRD and focusing on improving primary education in poor urban areas,including support for bilingual education and establishment of a nationaltextbook center (CENALTEX); ii) a Rural Basic Education Project financedby IDB which includes the construction or reconstructLn and equipping ofabout 300 schools in rural areas together with training of teachers; andiii) a small project supporting decentralization and improving bilingualeducation financed by USAID. The Basic Education Project is expected to becompleted by 1990. The Rural Basic Education Project, approved in late1982 has suffered serious initial delays although construction wasinitiated in 1988.
7.26 Other th;,n a World Food Project for improved school nutrition,which will complement Government efforts to improve primary schoolattendance, the principal new project planned to get underway in 1989 and1990 is a Primary Education Project for Rural Areas (Educacion Minima)wnich is being financed by IBRD. Implementation of this program willrequire an increase in counterpart funding over the next few years;strengthening of project managen,ent capacity and improved coordination ofdonor support; and innovative approaches to mobilize local resources andcommunity participation. The expected recurrent cost consequences of zheinvestment program are not likely to generate untolerabie pre3sures on thebudget in the shortrun since a large proportion of the program is for the
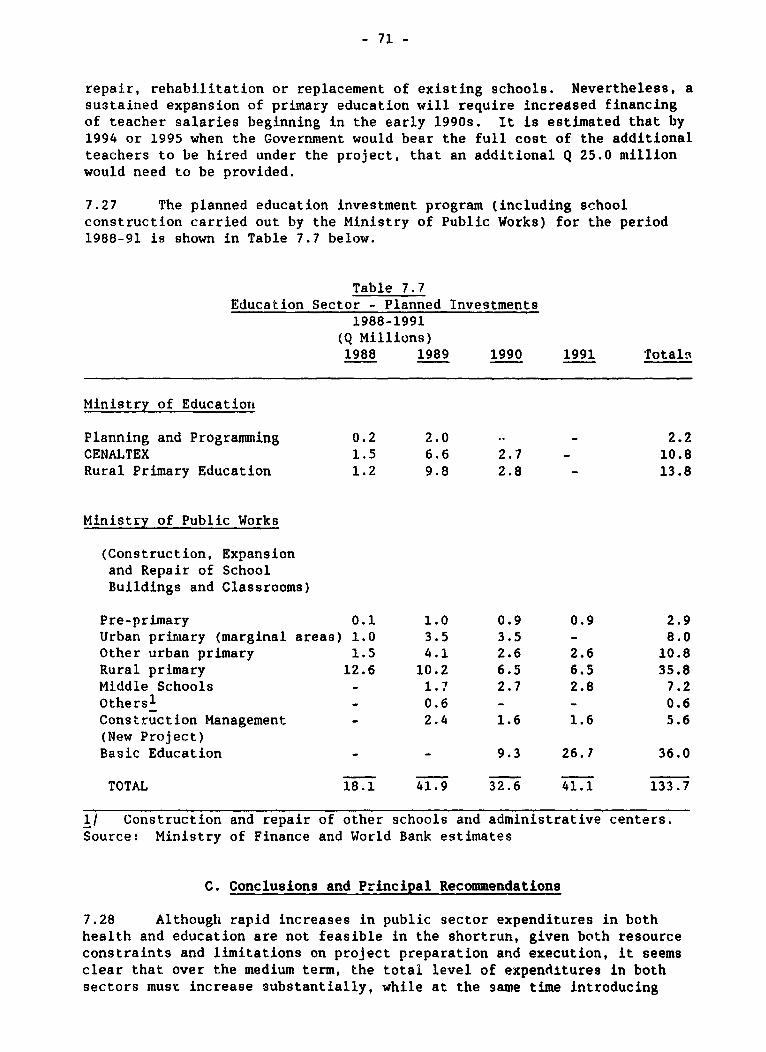
- 71 -
repair, rehabilitation or replacement of existing schools. Nevertheless, asustained expansion of primary education will require increased financingof teacher salaries beginning in the early 1990s. It is estimated that by1994 or 1995 when the Government would bear the full cost of the additionalteachers to be hired under the project, that an additional Q 25.0 millionwould need to be provided.
7.27 The planned education investment program (including schoolconstruction carried out by the Ministry of Public Works) for the period1988-91 is shown in Table 7.7 below.
Table 7.7Education Sector - Planned Investments
1988-1991(Q Millions)1988 1989 1990 1991 rotalq
Ministry of Education
Planning and Programming 0.2 2.0 - 2.2CENALTEX 1.5 6.6 2.7 - 10.8Rural Primary Education 1.2 9.8 2.8 - 13.8
Ministry of Public Works
(Construction, Expansionand Repair of SchoolBuildings and Classrooms)
Pre-primary 0.1 1.0 0.9 0.9 2.9Urban prirmiary (marginal areas) 1.0 3.5 3.5 - 8.0Other urban primary 1.5 4.1 2.6 2.6 10.8Rural primary 12.6 10.2 6.5 6.5 35.8Middle Schools - 1.7 2.7 2.8 7.2Others1 - 0.6 - - 0.6Construction Management - 2.4 1.6 1.6 5.6(New Project)Basic Education - - 9.3 26.7 36.0
TOTAL 18.1 41.9 32.6 41.1 133.7
1/ Construction and repair of other schools and administrative centers.Source: Ministry of Finance and World Bank estimates
C. Conclusions and Principal Recommendations
7.28 Although rapid increases in public sector expenditures in bothhealth and education are not feasible in the shortrun, given both resourceconstraints and limitations on project preparation and execution, it seemsclear that over the medium term, the total level of expenditures in bothsectors must increase substantially, while at the same time introducing

- 72 -
adjustments in the allocation of expenditures within each sector. At thesame time, further efforts are also needed to increase local communityparticipation in the funding and operation of basic health and educationservices, while also maximizing the impact of private sector and NGOsupported programs. More specific recommendations for each sector aresummarized below.
Health
7.29 Expenditure adjustments in health should focus initially on thefollowing. First, increasing the present share of recurrent expendituresallocated for primary and preventive health care by reducing the shareallocated for curative care, thus moving the present ratio of 25:75 forpreventive and curative care respectively towards a more balanced ratio of40:60 over the medium term. Second, increasing the share of resourcesallocated to the rural areas, thus beginning to correct the cuirrent biasfor Guatemala City. Both of these adjustments do not necessarily requiremajor increases in overall allocations, but better and more cost effectiveuse of existing staff while adjusting the mix of staff and physicalresources. As such it is urgent that the Ministry of Health preparespecific plans for changing its manpower recruitment, training, and careerdevelopment goals to begin redeploying staff to rural areas, while at timesame time ensuring that maintenance and equipment and supplies for primaryhealth rare are maintained at adequate levels. Increased emphasis onprimary health care and preventive medicine remains crucial if theGoverLnment is to begin to achieve its medium terms goals in the healthsector of improving the overall health status of Guatemala.
7.30 Ir ddition to reallocating resources to primary health care andpreventive ;.edicine, it is also urgent that the Ministry of Health beginpreparing an expanded investment program to be implemented during the1990s, including specific projects that could be available for externalfinancing, with emphasis on increasing primary health care, while ensuringadequate maintenance and supplies for the operation of the entire healthcare system. Based on existing programming of investments, the overalllevel of investment in health will fall sharply in the next few yearsunless new investments are prepared urgently.
7.31 Even with the above changes, Guatemala's health status will notimprove substantially without increasing total budget allocations forhealth within the context of an overall increase in public sector revenues.As a medium term goal, the Government should aim at increasing the share ofexpenditures on health from less than 1.5 percent of GDP to at least 3.0percent by 1995. This will require both increased budget support as wellas increasing the share cf local communities in the development andfinancing of basic health services, coupled with higher user charges forhospital services.
Education
7.32 Increasing the coverage and quality of education, with particularemphasis on primary education, will also require changes in the allocationof public expenditures as well as an expanded investment effort. First,the share of resources allocated to primary education will have to increasesubstantially if the country is to achieve its goal of providing a minimum
- 73 -
of 4 years of education to all children by the year 2000. This willrequire not only increased investment in new schools and classrooms, butimproved management of existing facilities and teachers, as well a.'increased allocations for needed teaching materials. Second, the publicinvestment program in education, particularly in primary education, willneed to be expanded. This will require i) initiating soonestimplementation of the Educacion Minima project with close attention paid toensuring effective project management; and ii) initiating preparation of afollow up program in basic education to ensure continued and expandedinvestment during the 1990s.
7.33 To help finance the increased emphasis on primary education, theGovernment should consider steps to reduce the high share of resourcescurrentlv allocated to higher education, with a greater portion of the costof higher education being borne by the beneficiaries through increases intuition, coupled with an expanded use of fellowships and student loans toensure access of students from lower socio-economic groups. At the sametime, the overall share of public resources allocated to education must beincreased over the medium term. This will require some increase in CentralGovernment participation as well as increased use of local communityresources. The overall goal should be to increase the share of resourcesallocated for education from the current low level of less than 2 percentof GDP to at least 4 percent by 1995.

- 74 -
CHAPTER VIII: HOUSING AND URBAN DEVELOPMENT
Introduction
8.01 With a housing deficit of over 700,000 units and a large number ofmunicipalities without basic facilities, increasing investment in housingand urban facilities is a major Government priority. This chapter reviewssector requirements and ongoing and proposed expenditure programs.
As Housing Sector Needs, Investment Program and Financing
Housing Sector Overview
8.02 The Government's Prugram of National Reorganization identifies thehousing sector as one of the priority areas for accelerating investmentefforts, noting that the private and public sector combinen currently coveronly a small percentage of the housing deficit generated by the annualgrowth in population. This housing deficit is currently estimated at over710,000 units, with the deficit increasing yearly by some 40,000 units.Since most families have at least some sort of roof over their heads,Government estimates of the country's housing deficit indicate the extentof very poor quality or substandard housing. Effective demand for housingis significantly lower since real income levels for most of the populationare so low that housing needs cannot easily be translated into demand.
8.03 The formal output of housing from both the publ:c and privatesectors falls far short of needs. In 1985 this output amounted to only3,000 units or about 7.5% of total new households for the year, and lessthan 1% of the accumulated deficit. Since 1986 this output has grownsubstantially, with the National Housing Bank (BANVI) alone producingalmost 5,000 housing solutions in 1986 and 11,000 in 1987. However part ofthe increase is explained by the use of a broader definition for housingsolutions to include not only basic or medium size houses, but also creditoperations, sites and services, as well as upgrading. A much larger shareof demand is met through the informal sector, which traditionally hasproduced some four or five times more shelter solutions, including creditand self help construction. Nevertheless, all of these efforts combinedwould at best cover only a small portion of the housing deficit. Moreover,much of the informal shelter output constitutes very substandard housing.
Institutional Framework and Key Sector Issues
8.04 The principal public sector institutions involved in the housingsector for middle to very low income population, are the National HousingBank (BANVI) and the National Committee for Reconstruction (CRN). BANVIwas established in the early 1970s to undertake housing constructionprograms to meet the needs of low income population in both the rural andurban areas. BANVI operates both as a financier and administrator ofhousing projects, although it is now attempting to move away from thislatter function. CRN was set up following the 1976 earthquake tocoordinate the national reconstruction effort and rebuild housing destroyed

- 75 -
by the quake. The main focus of its existing programs is oni povertyalleviation and the promotion of community development and smallinfrastructure works in urban and rural areas. As a result of itsearthquake reconstruction works it has acquired considerable expertise inlow cost shelter development. In 1986 it established a new HumanSettlements and Housing Division (DAHVI) to work specifically with urbanslum areas, including responsibility for implementation of the housingrehabilitation component of the IBRD financed Municipal DevelopmentProject, w.'hich is expected to begin implementation during 1989.
8.05 Two other public sector institutions involved in the housingsector are BANDESA, the Agriculture Bank, which provides some credit in therural sector for housing, although the bulk of its lending is foragriculture and other productive purposes, and the Instituto de Fomento deHipotecas Aseguradas, which operates mainly as a mortgage insurance agentfor upper middle to upper income families. With respect to private sectorinvolvement in the housing sector, most institutions, including privatecommercial banks aad the Guatemalan Chamber of Construction, cater to theneeds of the upper middle and upper class. Private sector efforts to meethousing needs of low income families are mainly carried out by NGOs. Inaddition, the Federacion Nacional de Cooperativas de la Vivienda provtdeshome improvement credits, mainly to targeted low income groups.
8.06 Efforts to tackle Guatemala's serious housing shortage confrontobstacles from both the demand and supply sides. With respect to demand,real income levels are so low that needs are not easily translated intodemand since this would require either very low cost housing solutionsand/or greater emphasis on housing rehabilitation rather than newconstruction. From the supply side, housing solutions are limited by i)insufficient sources of financing, including the limited availability ofpublic sector investment funding, and the absence of adequate financingmechanisms to attract and provide funding through the banking system,particularly for low income housing; ii) the very limited number ofhousing development projects directed towards low income families,reflecting the traditional orientation of private contractors andtraditional financing institutions towards high cost housing for the middleand upper class; iii) insufficient attention to, and utilization of, lowercost housing technology; and iv) slow execution of ongoing public sectorhousing projects.
Public Expenditures in Housing and Urban Development
8.07 The 1988 Central Government budget allocated Q60.2 million or 2percent of the budget to Housing and Urban Development. Of this amount,about 77 percent, or Q46.3 million, was allocated for investment, with theremaining amount financing current expenditures and operations of theMinistry of Urban and Rural Development and transfers to municipalities foroperations and general administration. Total investment expenditures weredivided between basic housing (51.2 percent), access roads (26.2 percent),and markets and slaughterhouses (22.6 percent). Almost 70 percent ofinvestment planned for the sector was to be financed with extetnalresources. Since only a little over half of the public monies budgeted for
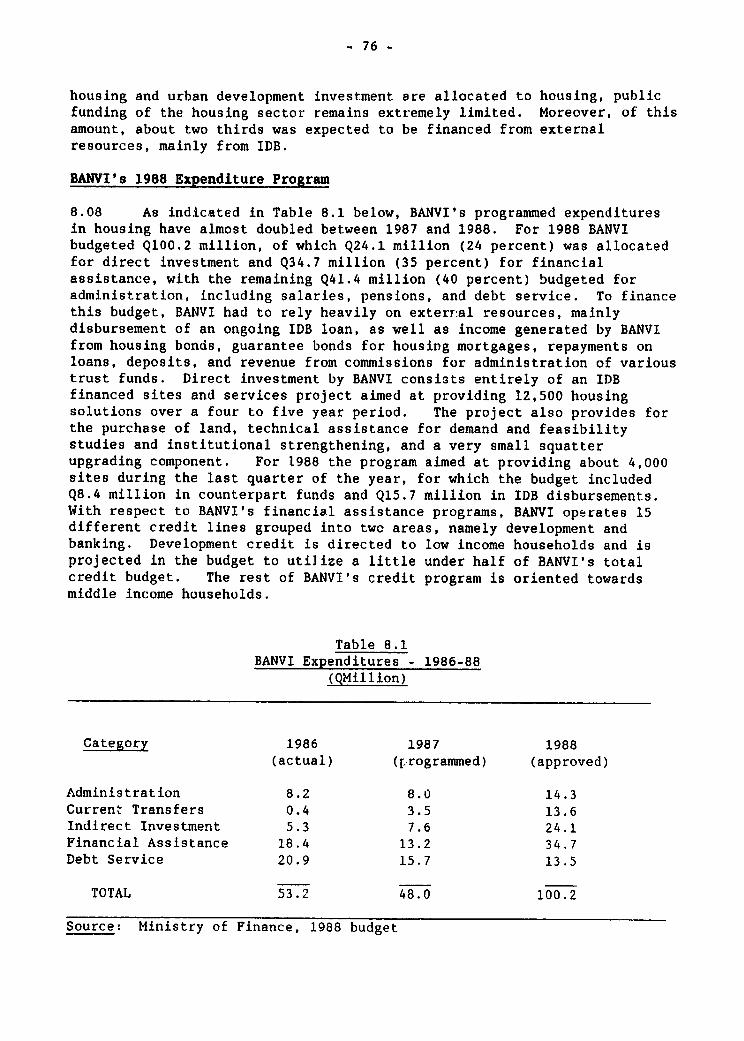
- 76 -
housing and urban development investment are allocated to housing, publicfunding of the housing sector remains extremely limited. Moreover, of thisamount, about two thirds was expected to be financed from externalresources, mainly from lDB.
BANVI's 1988 Expenditure Program
8.08 As indicated in Table 8.1 below, BANVI's programmed expendituresin housing have almost doubled between 1987 and 1988. For 1988 BANVIbudgeted Q100.2 million, of which Q24.1 million (24 percent) was allocatedfor direct investment and Q34.7 million (35 percent) for financialassistance, with the remaining Q41.4 million (40 percent) budgeted foradministration, including salaries, pensions, and debt service. To financethis budget, BANVI had to rely heavily on exterrnal resources, mainlydisbursement of an ongoing IDB loan, as well as income generated by BANVIfrom housing bonds, guarantee bonds for housing mortgages, repayments onloans, deposits, and revenue from commissions for administration of varioustrust funds. Direct investment by BANVI consists entirely of an IDBfinanced sites and services project aimed at providing 12,500 housingsolutions over a four to five year period. The project also provides forthe purchase of land, technical assistance for demand and feasibilitystudies and institutional strengthening, and a very small squatterupgrading component. For 1988 the program aimed at providing about 4,000sites during the last quarter of the year, for which the budget includedQ8.4 million in counterpart funds and Q15.7 million in IDB disbursements.With respect to BANVI's financial assistance programs, BANVI operates 15different credit lines grouped into twc areas, namely development andbanking. Development credit is directed to low income households and isprojected in the budget to utilize a little under half of BANVI's totalcredit budget. The rest of BANVI's credit program is oriented towardsmiddle income households.
Table 8.1BANVI Expenditures - 1986-88
(QMillion)
Category 1986 1987 1988(actual) ([rogrammed) (approved)
Administration 8.2 8.0 14.3Current Transfers 0.4 3.5 13.6Indirect Investment 5.3 7.6 24.1Financial Assistance 18.4 13.2 34.7Debt Service 20.9 15.7 13.5
TOTAL 53.2 48.0 100.2
Source: Ministry of Finance, 1988 budget

- 77 -
National Reconstruction Committee (CRN) Investment Budget for 1988
8.09 CRN's 1988 budget allocated Q9.7 million for direct investment, ofwhich Ql.5 million was budgeted specifically for housing as part of the CRNcomponent of the IBRD financed Municipal Development P,oject. However,since the IBRD loan still remains to be signed pending approval by theGuatemalan Congress, budgeted funds could not be used during 1988. Theremaining Q8.2 million was allocated in support of CRN's other communitydevelopment activities and emergency programs, which include a minimalamount of funding for basic housing.
Housing Sector Needs and Revised Policy Framework
8.10 Taking into account the magnitude of the country's housingshortage and the limitations on public sector investment resources, theGovernment is in the process of reformulating and reorienting itsinvolvement in the sector with the objective of i) expanding the coverageor utilization of existing resources by moving away from the provision ofcomplete (and more costly) housing units towards greater emphasis onhousing rehabilitation, including self help programs; ii) encouraginggreater private sector involvement in financing middle income housingneeds, thus moving away from the private sector's current emphasis onmeeting only the requirements of the top 4 to 5 percent of the population;iii) increasing the availability of resources for housing through theestablishment of a public lottery for housing; iv) supporting thereorientation of BANVI's activities to focus more on meeting lower incomehousing needs and less on middle class needs, while also moving BANVI awayfrom its role as an administrator of housing projects to focus mainly onfinancing and promoting housing development; and v) encouraging broadercommunity participation in tackling housing issues, including greater useof NGOs. At the same time the Government's overall approach to the sectoris moving away from a more narrow focus on simply the delivery of housingunits to a recognition that a more comprehensive approach is needed thatwould focus on increasing employment opportunities.
B. Urban Development
Sector Overview
8.11 Guatemala's urban population constitutes about 40 percent of thecountry's 8.4 million inhabitants, of which Guatemala City, with 1.4million people, accounts for about one-half. The remaining urbanpopulation resides in 326 municipalities, the bulk of which (300municipalities) have populations of less than 20,000. Guatemala City is 20times larger than either of the two largest secondary cities of Esculntla,the center of the large southern industrialized cotton and sugar plantationregion, and Quezaltenango, the center of the populous western highlandsarea, both of which have populations of less than 75,000. The existing1957 Municipal Code, currently under revision, requires municipalities toprovide essential services such as water supply, sewerage, and markets,while also giving them discretionary powers to provide transportation,
- 78 -
electricity, and coimmunity facilities either directly or throughconcessions. Nevertheless, serious financial and technical constraintshave severely limited the ability of most municipalities to provide suchservices.
Sector Organization
8.12 One of the principal objectives of the present Government underthe new Constitution is to pursue decentralization and regionalization ofpublic services, while also strengthening the role and effectiveness oflocal Governments. As part of this effort, the Government has establishedlocal and regional Development Councils, coordinated by a NationalDevelopment Council, with the objective of providing local communities withgreater participation in determining their own local developmentpriorities. These Cr-ncils are in the process of organizing themselves andpreparing their initial work programs.
8.13 The principal Government institution supporting municipaldevelopment is the Municipal Development Institute (INFOM), which isresponsible for providing technical and financial assistance to the 326municipalities outside of Guatemala City. INFOM prepares town plans,carries out project feasibility studies and provides low interest financingfor water supply, sewerage, markets, street paving and other urlan wurks.Investment in urban facilities in Guatemala City itself, is cariled outmainly by the Municipality of Guatemala Lity, together with EMPAGUA, thesemi-autonomous company responsible for water supply.
Municipal Finance Issues
8.14 The new constitution al.locates 8 percent of ordinary revenuesdirectly to the municipalities for investments in infrastructure and publicservices which improve the quality of life. These revenues are to bedivided among all 327 municipalities based on a formula that takes intoaccount their size and needs. For 1988, the total allocation is estimatedat Q123 million. While the total amount of resources per coimunity mayonly reach some Q50,000 to Q60,000 for small municipalities, even such asmall sum is 15 to 20 times greater than the amount of resources previouslyavailable to such communities for capital investment. As a consequence,these transfers have provided many municipalities, particularly the smallerones, with their first real opportunity to improve municipal facilities.Nevertheless, although many municipalities have been able to utilize asubstantial portion of the monies allocated to date to carry out relativelystraightforward projects, such as street paving and construction ofmunicipal buildings, utilization of the funds in the future is expected toslow dGwn, given the need for more complex project preparation and thatfact that most municipalities lack adequate technical capacity in projectpreparation and design. This underscores the need for providing themunicipalities with technical assistance aimed at strengthening theirproject preparation and implementation capacity.
INFOM's Investment and Expenditure Program
8.15 INFOM's municipal support activities include five operatfonalprograms, namely: i) support for administrative and financial streng: heningof municipalities through provision of training in financial management and
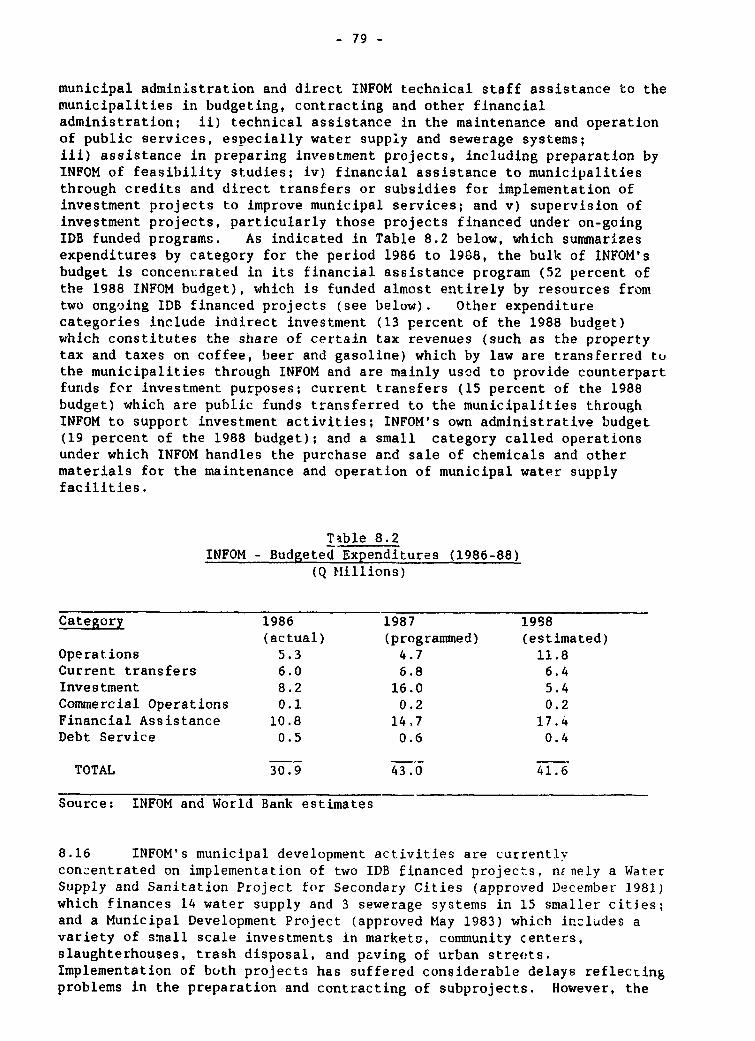
- 79 -
municipal administration and direct INFOM technical staff assistance to themunicipalities in budgeting, contracting and other financialadministration; ii) technical assistance in the maintenance and operationof public services, especially water supply and sewerage systems;iii) assistance in preparing investment projects, including preparation byINFOM of feasibility studies; iv) financial assistance to municipalitiesthrough credits and direct transfers or subsidies for implementation ofinvestment projects to improve municipal services; and v) supervision ofinvestment projects, particularly those projects financed under on-goingIDB funded programs. As indicated in Table 8.2 below, which summarizesexpenditures by category for the period 1986 to 1988, the bulk of INFOM'sbudget is concentrated in its financial assistance program (52 percent ofthe 1988 INFOM budget), which is funded almost entirely by resources fromtwo ongoing IDB financed projects (see below). Other expenditurecategories include indirect investment (13 percent of the 1988 budget)which constitutes the share of certain tax revenues (such as the propertytax and taxes on coffee, beer and gasoline) which by law are transferred tothe municipalities through INFOM and are mainly used to provide counterpartfurnds for investment purposes; current transfers (15 percent of the 1988budget) which are public funds transferred to the municipalities throughINFOM to support. investment activities; INFOM's own administrative budget(19 percent of the 1988 budget); and a small category called operationsunder which INFOM handles the purchase and sale of chemicals and othermaterials for the maintenance and operation of municipal water supplyfacilities.
Table 8.2INFOM - Budgeted Expenditures (1986-88)
(Q Millions)
Category 1986 1987 1958(actual) (programmed) (estimated)
Operations 5.3 4.7 11.8Current transfers 6.0 6.8 6.4Investment 8.2 16.0 5.4Commercial Operations 0.1 0.2 0.2Financial Assistance 10.8 14,7 17.4Debt Service 0.5 0.6 0.4
TOTAL 30.9 43.0 41.6
Source: INFOM and World Bank estimates
8.16 INFOM's municipal development activities are currentlyconcentrated on implementation of two IDB financed projects, nEnely a WaterSupply and Sanitation Project for Secondary Cities (approved December 1981)which finances 14 water supply and 3 sewerage systems in 15 smaller cities;and a Municipal Development Project (approved May 1983) which includes avariety of small scale investments in markets, community centers,slaughterhouses, trash disposal, and paving of urban streets.Implementation of both projects has suffered considerable delays reflectingproblems in the preparation and contracting of subprojects. However, the

- 80 -
water supply project is currently in an advanced state of implementationwith the bulk of planned investments completed bv late 1988.Implementation of additional water supply works utilizing previouslyuncommitted funds will extend project implementation through 1990.Implementation of the municipal development project has also accelerated inrecent months and is expected to be completed by end 1989.
8.17 The scope of INFOM's activities in the next three to four yearswill depend heavily on its ability to obtain additional external financingto continue both its municipal development and water supply and sanitationdevelopment programs. Preparation of follow up water supply and sewerageand municipal development projects are currently underway with IDB support,with the objective of completing negotiation of new loans with IDB by theend of 1989. INFOM is expected to seek additional financing of over US$100million for both projects. The additional IDB support could becomplemented with IBRD funding of a second municipal developmen. projectwith the principal objective of strengthening the capacity of smallermunicipalities to prepare and implement economic and social developmentprograms and projects while also increasing resource mobilization at themunicipal level. Both the proposed IDB and 1BRD projects are beingdesigned within the context of a broader municipal development programwhich is being developed with the support and c'ose coordination of bothinstitutions. INFOM is also expecting to receive additional Governmentresources in the form of a Q 15 million trust fund of which 50 percentwould be grant and 50 percent in the form of a long term loan to theinstitution. Estimates of INFOM's municipal development activities for theperiod through 1991 are provided in Table 8.3. They indicate substantialgrowth in INFOM's financial assistance activities assuming that additionalincome from the Q15 million trust fund becomes available in 1988 and 1989as planned, and that new funding from IDB becomes available in 1990 and1991.
Table 8.3INFOM - Estimated Expenditures 1988-1991
(Q Million)
Category 1988 1989 1990 1991Estimated Projected
Administrative 11.8 11.6 12.0 12.5Current Transfers 6.4 4.6 4.7 4.7Indirect Investment 5.4 3.9 2.3 2.9Financial Assistance 17.4 30.4 22.8 57.1Commercial Operations 0.2 0.3 0.3 0.3Debt Service 0.4 0.3 0.3 0.3
TOTAL 41.6 51.1 42.4 77.8
Source: INFOM and World Bank estimates

- 81 -
Municipal Investments in Guatemala City
8.18 As shown in tne financial projections summarized below in Table8.4, Guatemala City's principal investment project in the coming years isthe World Bank financed Municipal Development Project, of which themunicipal development component totals US$15.3 million or Q 38.5 million.This project includes updating of the cadastre for the Municipality ofGuatemala; technical assistance to strengthen municipal administration andfinancial management; and road maintenance and improvement covering 186 kmsin the principal transportation corridors and the central businessdistrict. In addition, IDB is considering financing of a program todevelop small municipal markets. The other major municipal investmentswill be carried out by the Water Stupply Agency, EMPAGUA. These investmentsare reviewed in more detail in Chapter VI on Water Supply.
Table 8.4Municipality of Guatemala-Projected Expenditures
(Q Million)
1988 1989 1990 1991
Recurrent Expenditures 33.7 35.9 38.3 40.8Personnel costs 19.2 20.2 21.3 22.5Other current Exp. 4.9 5.3 5.8 6.3Supplies and services 2.8 3.1 3.4 3.7Transfers o.8 7.3 7.8 8.3
Capital Outlays 15.6 21.6 22.9 24.2of which MunicipalDevelop. Proj. 3.7 8.2 7.9 7.4
Debt Service 1.7 1.6 1.6 1.0
TOTAL 51.0 59.1 62.8 66.0
Source: Municipality of Guatemala and World Bank estimates
Combined Investment Program for Housing and Urban Development
8.19 As summarized in Table 8.5 below, the planned investment programfor housing and urban development for the period 1988-1991 totals Q 1028.smillion, of which Q405.9 million (40 percent) is for housing and theremainder Q672.6 million for municipal development, including investmentsexpected to to be financed out of the 8 percent allocation. The bulk ofpublic sector resources devoted to the sector, over and above dhe 8percent, are utilized through on lending by BANVI for housing and lendingby INFOM to municipalities for municipal works.
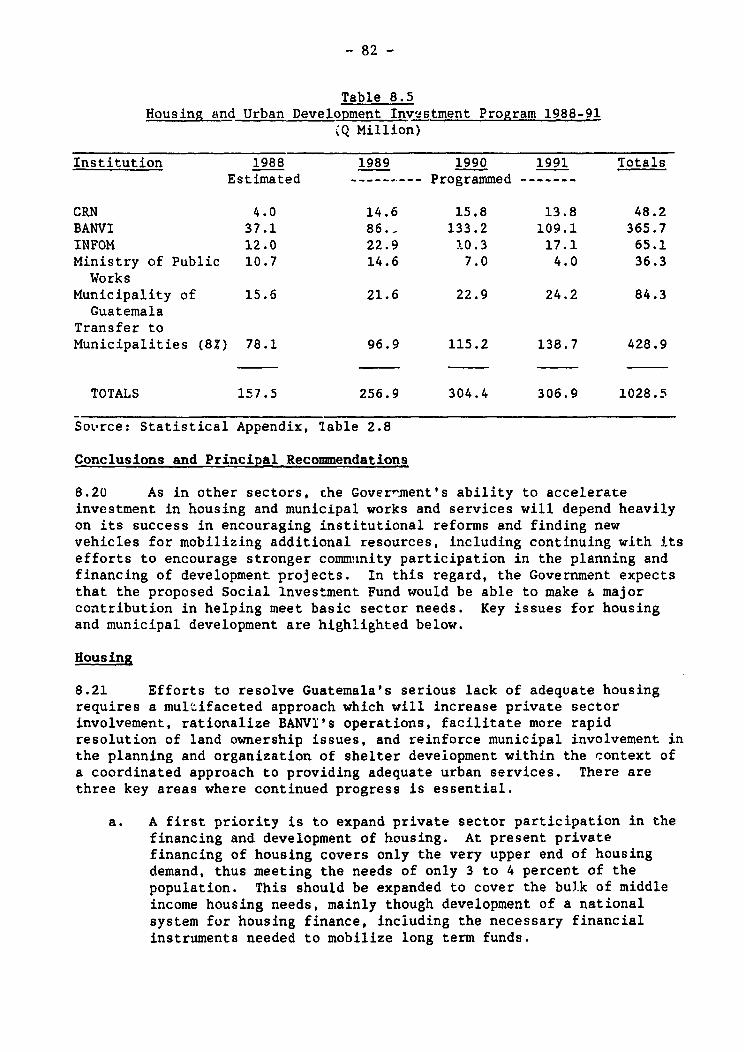
- 82 -
Table 8.5Housing and Urban Development Investment Program 1988-91
'Q Million)
Institution 1988 1989 1990 1991 TotalsEstimated - Programmed -------
CRN 4.0 14.6 15.8 13.8 48.2BANVI 37.1 86. 133.2 109.1 365.7INFOM 12.0 22.9 10.3 17.1 65.1Ministry of Public 10.7 14.6 7.0 4.0 36.3Works
Municipality of 15.6 21.6 22.9 24.2 84.3Guatemala
Transfer toMunicipalities (8Z) 78.1 96.9 115.2 138.7 428.9
TOTALS 157.5 256.9 304.4 306.9 1028.5
Sovrce: Statistical Appendix, lable 2.8
Conclusions and Principal Recommendations
8.20 As in other sectors, Ehe Gover-ment's ability to accelerateinvestment in housing and municipal works and services will depend heavilyon its success in encouraging institutional reforms and finding newvehicles for mobilizing additional resources, including continuing with itsefforts to encourage stronger community participation in the planning andfinancing of development projects. In this regard, the Government expectsthat the proposed Social lnvestment Fund would be able to make a majorcontribution in helping meet basic sector needs. Key issues for housingand municipal development are highlighted below.
Housing
8.21 Efforts to resolve Guatemala's serious lack of adequate housingrequires a multifaceted approach which will increase private sectorinvolvement, rationalize BANVI's operations, facilitate more rapidresolution of land ownership issues, and reinforce municipal involvement inthe planning and organization of shelter development within the context ofa coordinated approach to providing adequate urban services. There arethree key areas where continued progress is essential.
a. A first priority is to expand private sector participation in thefinancing and development of housing. At present privatefinancing of housing covers only the very upper end of housingdemand, thus meeting the needs of only 3 to 4 percent of thepopulation. This should be expanded to cover the bulk of middleincome housing needs, mainly though development of a nationalsystem for housing finance, including the necessary financialinstruments needed to mobilize long term funds.

- 83 -
b. A second priority is continuing the restructuring of BANVI withthe objective of i) refocusing its activities to concentrate onlower income housing; ii) restoring its financial health boththrough improving its operations and financial management,including its policies on arrears, and strengtlhening its resourcebase; iii) moving away from the direct development and managementof housing projects, while developing its role as a promoter andcoordinator of housing development; and iv) strengthening BANVI'scapacity to analyze housing sector demand and better plandevelopment of the sector.
c. A third priority is the need to develop new approaches for meetingthe needs of the urban poor, including a stronger focus on self-help, housing rehabilitation and sites and services rather thanthe provision of more costly complete housing solutions; and thedevelopment of cost recovery mechanisms which can function despitevery low income levels. In this con4ext, implementation of thepilot program in squatter upgrading included in the on-goingMunicipal Development Project, is designed to demonstrate newapproaches to providing basic services and secure tenure at costswhich can be recovered on an affordable basis from the communitiesinvolved, the vast majority of which have incomes well below the25th percentile.
Municipal Devolopment
8.22 Prospects for accelerating municipal development in Guatemala haveimproved substantially as a result of the Government's decentralizationefforts and the provision of increased resources to the municipalitiesthrough the 8 percent allocation. The speed and efficiency of the effortto expand municipal services and facilities, however, will depend largelyon the ability of local Government to improve its planning and programming,its financial management, and its capacity to design and manage investment.In reality, with the exception of the larger secondary cities, localGovernment human resources are extremely limited. As such, rapidimprovement of local Government capacity is not feasible. What isimportant is that a serious effort be initiated to provide technicalassistance and training to municipalities. At the same time, ongoingefforts to strengther, INFOM should be continued to enable it to play alarger role in supporting institutional development at the local level.Within this context, the following actions and programs should beconsidered.
a. In the short term, urgent actions are needed to providemunicipalities with direct technical assistance in designingdevelopment programs and projects and initiating execution ofmunicipal development works. This will require increasedinvolvement of INFOM as well as efforts to mobilize NGOs and othercommunity groups, while also providing the municipalities withfunding to finance project design work utilizing NGOs and privatesector consulting firms. A portion of these needs are expected tobe addressed within the framework of the proposed SocialInvestment Fund.

- 84 -
b. Over the medium term, Government should develop specific technicalassistance and training programs to strengthen municipalmanagement, with particular emphasis on grass roots programs thatwork directly at the local level. Further efforts to provide themunicipalities with access to additional financing and broadentheir revenue base will also be needed.
c. INFOM, as the only major public sector entity with direct andindepth experience with municipalities, should play a major rolein improving municipal management. To do so, its own workprograms need to be refocused to give more attention to trainingand technical assistance, and less emphasis to direct involvementin project execution. At the same time, in keeping withdecentralization efforts, INFOM's regional offices could bestrengthened to enable them to provide more effective technicalassistance to municipalities.
d. INFOM's ability to increase its role in municipal development willdepend in great part on its ability to develop permanent sourcesof funding, so as to reduce its heavy dependence on transfers andexternal borrowing.
- 85 -
CHAPTER IX: STRENGTHENING PLANNING, PROJECT PREPARATION,AND PROJECT EXECUTION
Introduction
9.01 As indicated in Chapter I, Guatemala's public sector investmenteffort has declined sharply in recent years, averaging only about 2.6percent of GDP since 1983. This low level of investment results in partfrom the country's limited resource mobilization efforts. However, it alsoreflects an inadequate planning and project preparation effort, as well asserious delays in project execution. The insufficient attention paid toplanning and project preparation has greatly increased the risk of spendingscarce resources on lower priority projects, while also having the effectof giving external agencies a more important role than may be warranted indetermining whichl projects to finance. Slow project execution has notonly undermined Guatemala's ability to reach its development objectives,but also greatly increased project costs, both in terms of the delays inobtaining the benefits from the investment effort as well as in highercosts from price increases and higher commitment and other charges onexLernal loans. At the same time, the constraints on planning and projectexecution have also undermined the country's image abroad and made it moredifficult to attract additional external support.
9.02 Guatemala needs to strengthen its planning, project preparationand project execution capacity if it is to achieve its medium termdevelopment objectives. This chapter examines the strengths and weaknessesof the Government's planning, preparation and project execution effort, andmakes specific recommendations on how they can he imp8oved.
Planning and Programming of Investments
9.03 Guatemala's institutional framework for planning and programmingof investments consists primarily of a national planning secretariat(SEGEPLAN) together with planning units in most ministries anddecentralized agencies. In addition, the Government is in the process ofestablishing a system of Urban and Rural Development CouILcils as called forunder the 1985 Constitution to provide greater local and regional inputinto the development planning process and better ensure that localpriorities are taken into account. These councJls are being established atthe municipal, departmental, regional and national levels. The first twocouncils will seek to identify the aspirations and needs of the localpopulation while the other two will have responsibility for the formulati(nof a national and regional development policies. Overall coordination isto be provided by the National Council, with SEGEPLAN serving as thetechnical secretariat to the National Council, and providing technicalsupport to the other councils, thus giving SEGEPLAN an important role inthe decentralized planning process. The Government is also in the processof creating coordinating bodies or councils for priority projects andprograms in the areas of water and itrigation, land distribution, roads,food security, housing, export promotion, health, education, and publicsecurity, with the objective of accelerating investment in these priorityareas. To date only the export promotion, water, irrigation, and landdistribution bodies have been established.

- 86 -
9.04 SEGEPLAN's role has been marginal in recent years, owing in partto the tim- needed to establish and organize the new planning framework,the lack of a clear definition of how it is to function, and the creationof several other entities whlich are also involved in development planning,such as the Technical Secretariat in the Vice President's office and theMinistry of Urban and Rural Development. It has therefore been unable toprovide sufficient guidance in investment programming and setting ofpriorities, or ensure adequate coordination between sectors. As a result,investment programming has become largely an ad hoc process determinedmainly by the individual agencies, depending in part on their politicalclout, and the decisions on budget allocations made by the Budget Office inthe Ministry of Finance, often without sufficient information or guidancein respect to sectoral and national priorities. Recognizing the importanceof a stronger planning and coordinatirg function, the Government hasrecently moved to strengthen SEGEPLAN's capacity to program investmentsthrough changes in its institutional structure. Under the new structure,SEGIPLAN is divided into two sub secretariats, one for internationalcooperation and one for regional and national planning. In addition, therecently appointed Secretary General of SEGEPLAN has stressed theimportance of strengthening SEGEPLAN's role in coordinating developmentefforts, while also improving the availability of information andstatistics so as to have a better basis for determining priorities andevaluating results. Experience in other countries has shown that planningagencies are most effective when they concentrate on i) establishingnational, regional, and sectoral priorities; ii) assisting in the reviewand evaluation of programs and projects consistent with agreed priorities;and iii) reviewing progress in the implementation of projects and in theachievement of national objectives and medium term goals. In order toprovide the guidance and support needed for a more effective planningprocess, both at the national and regional levels, SEGEPLAN will needconsiderable etrengthening in the areas of planning and investmentprogramming as well as in project evaluation and monitoring.
9.05 During the past few years, SEGEPLAN has preppred a number ofsectoral development strategies and proposed investment programs inresponse to the Government's priorities as set forth in the "Program ofNational Reorganization" anl more recently in the Government's "Guatemala2000 Program." However, its sectoral policy recommendations are quitegeneral and the investment program consists mainly of a list of proposedprojects, many only in the idea stage. As such the estimated costs of theinvestments proposed are likely to understate the actual cost. Moreover,the SEGEPLAN programs do not provide any analysis of projected resourceavailability or offer any ranking or analysis of sector priorities.Consequently, the country does not have an agreed public investment programwhich clearly takes into account sectoral and national priorities within anoverall macro economic and fiscal context. Such a program is clearlyneeded to determine the desirable level and composition of public spendingas well as its sources of finance.
9.06 Recommendation. If SEGEPLAN is to play a more effective role inhelping Guatemala's policy makers take key decisions on investmentpriorities and the allocation of public -esources, it must become moredirectly involved in translating broad development objectives into specificguidelines for spending and project preparation. The overall objective
- 87 -
should be to influence the design of public sector programs and projectsrather than simply reacting to programs or projects submitted for approval.This will require changes in the way SEGEPLAN is organized and managed aswell as changes in the mix of skills reouired. As a first step inbeginning to better link public spending with key development objectives,SEGEPLAN may wish to concentrate on the following tasks: i) reviewing thewealth of sectoral information already available and establishing the threeor four highest priority policy and spending needs for each key sector; ii)analyzing the existing budget and investment program to see how well thesepriorities are covered; iii) identifying a limited number of major policyand expenditure adjustments for each sector; and iv) recommending how thesechcl:ges can be initiated, starting with the guidelines being prepared forthe 1990 budget year.
9.07 Since on-going efforts to restructure and strengthen SEGEPLAN maytake some time, it is recommended initially that a small working group ofeconomists and sectoral experts from SEGEPLAN and other entities beestablished to carry out the above tasks, including putting togetherspecific guidelines for preparing the 1990 budget; identifying the specificprograms and/or projects which either need to be adjusted or newly preparedto achieve the Government's objectives, and preparing a public investmentprogram and overall spending guidelines for the next three years consistentwith the expected availability of resources and the macro-economicframework. The group would need to work closely with the Bank ofGuatemala, the Ministry of Economy, and the Ministry of Finance to ensure asound macro framework for such a program.
Project Preparation
9.08 Deficient project preparation is one of the most importantbottlenecks slowing Government development efforts. There are two mainaspects to the problem. First, there are simply not enough projects beingprepared since the Government's project preparation capacity and fundingfor preparation work is very limited. In fact, the only substantivepreparation work is being carried out with the active support of externaldonors, thus giving external agencies a major role in determininginvestment priorities. Second, many of the projects have been onlypartially or inadequately prepared, particularly in respect toimplementation and procedural arrangements, thus opening the way forserious delays during execution. The fact that many of the projects havebeen and continue to be prepared with the active support of externalagencies, does not necessarily guarantee adequate project preparation givendiffering levels of analysis, the pressure of often accelerated timetables,and the fact that external agencies may not have a complete understandingof the complexities of working in certain sectors. There is therefore aclear need to develop the Government's own capacity to prepare projects,including adequate and timely funding of preparation activities, as well asstrengthen the Government's ability to coordinate and monitor projectpreparation and ensure that preparation efforts are consistent with overallsector and national priorities.
9.09 In order to improve project preparation capacity, the Governmentis in the process of establishing a National System for Financing Pre-investment (SINAFIP) which is expected to be financed initially with fundsfrom IDB, the Venezuelan Fund, and the Federal Republic of Germany. This
- 88 -
system has been under discussion for manv years, but is now expected tobecome operational in the near future. The pre-investment fund wouldoperate through trust funds (fideicomisos) established in public andprivate banks, which would in turn finance feasibility studies inaccordance with agreed criteria. The trust funds would be managed by theMinistry of Finance, however overall responsibility for the SINAFIP systemwould rest with an Administrative Council, with an executive and technicalsecretariat created in SEGEPLAN. As currently designed the system formanaging the pre-investment fund appears overly complex, especially theinvolvement of the Ministry of Finance, which may no longer be needed sincethe funds will not be handled through the national budget as initiallyproposed. In addition, the prccedures for approving requests foi use ofthe funds for specific pre-investment work appear to be unduly complicated.
9.10 Recommendation. Given the importance of a well functioning pre-investment system, it is strongly recommended that the Government reviewthe proposed organizationa'l arrangements for SINAFIP and clarify andsimplify procedures for the operation of the system. More specifically,consideration should be given to: i) eliminating the direct involvement ofthe Ministry of Finance in managing the trust funds, since itsparticipation in the Administrative Council should be sufficient to ensureth.-t its interests are taken into account; ii) providing SINAFIP with legalpersonality thus enabling it to sign contracts directly as may beappropriate; iii) considering an appropriate mechanism for supportingproject preparation efforts at the local or regional level; iv) minimizingSINAFIP's dependence on budgetary appropriations and external resources byproviding it with its own capital or other permanent source of funds; v)improving the management of the project preparation fund by better definingthe functioning of the trust funds while ensuring that all administrativework is carried out by the trust fund concerned, determining th; criteriafor allocating grant funds, and spelling out SEGEPLAN's role in providingguidance on terms of reference, evaluating costs and reviewing the resultsand recommendations of completed studies. In summary, care should betaken that STNAFIP does not become a relatively large bureaucracy, whichduplicates in part functions performed by SEGEPLAN, while also ensuringthat the process of contracting and supervising pre-feasibility and otherwork remains as agile as possible so as to avoid undue delays in theinitiation and implementation of investment preparation activities.
9.11 Since actual startup of the project preparation facility may stilltake some time, SEGEPLAN should not wait for its establishment to beginstrengthening project preparation. One step that SEGEPLAN could take veryquickly is to i) analyze the status of existing project preparation; ii)identify on-going preparation work that should be stopped or accelerated ormodified in light of changing priorities; and iii) identify those sectorsand areas where project preparation is the weakest and explore alternativemeans to accelerate project preparation.
Project Execution
9.12 Poor or slow project execution remains the third major constrainton public sector investment. Although problems in the execution of

- 89 -
individual projects vary depending on the the nature of the project and itscomplexity, there are a number of key constraints which tend to affect alarge number of the projects in execution. These constraints are outlinedbelow.
a. Perhaps the most important underlying problem is a lack ofeffective project administration combined with insufficient backup and support from higher level management. This results inlarge part from inadequately trained administrators andtechnicians without the experience and skills needed to managebidding and contracting, coordinate the work of international andnational consultants, and monitor project execution. At the sametime, the executing units are often created without sufficientpower and authourity taking into account the importance of t'heproject and without having the needed access to senior managementand the legal and oLher authority needed to direct large projectsrequiring international bidding. Without sufficient high levelsupport and establishment of investment expenditure targets andpriorities, project execution is subjected to the oftenindifferent bureaucracies of the Ministries concerned as well asto the delays of other entities, such as the Contraloria, whichare not responsible for the project and have no interest inexpediting project execution.
b. Project execution is also seriously affected by the way the publicprocurement law is interpreted. Contract awards may take morethan one year partly because of endless procedures (trainites) ascivil servants try to avoid taking full responsibility or because,as often seems to be the case, the provisions of the law aresimply ignored. A recent experiment by the Technical Secretariatof the Vice Presidency demonstrated that a contract could beawarded--following existing law--in two months. A revisedprocurement law has been drafted which corrects some flaws in thepresent legislation such as low bidding thresholds and complexinternational bidding rules.
c. Further delays result from the complexity of the proceduresapplied for the disbursement of budget funds. Although payment orpurchase orders are no longer reviewed by both the Budget Officeand Controllsrs (only by Controllers), a significant amount oftime (over 70 percent) is spent in reviewing payment or purchaserequests of less than Q 1000 (US$370), even though such paymentscould be handled more expeditiously by the executing agenciesthemselves by making use of petty cash funds (Caja Chica).
d. Poor administrative arrangements also result in part frominsufficient project preparation. In many cases. the pre-feasibility study or othier project design work does not define insufficient detail the objectives of the project or establish clearparameters for bidding and other key elements. At the same time,the preparatory work may not provide sufficient analysis ofproject administrative arrangements to ensure that an adequateproject management framework is put in place. There is also atendency on the part of most external lenders and donors toestablish separate project implementation units for each project.

- 90 -
While this is und,erstandable given the weak management capacity ofexisting ministries and agencies, it nevertheless tends toincrease problems of poor coordination and often fails to addressadequately the need for overall strengthening of public sectormanagement capacity.
e. A further difficulty affecting the speed of project executionstems from delays in complying with project conditionalityrequired by external financing agencies. This results in partfrom the failure of Government and the external agencies invol.vedto realistically assess the timing and feasibility of certainrequirements and ensure that the project is designed in a way thatminimizes the potential for delays in meeting key conditionalitv.
f. Another constraint reflects the lack of coordination between theGovernment entities involved in the negotiation of loans andpreparation and execution of projects and well as the slow andextremely bureaucratic processes utilized in carrying out biddingand contracting. As a consequence the project often fails toreceive the budgetary support and legal and other requiredapprovals in a timely fashion.
9.13 Recognizing the need to strengthen project implementation, theMinistry of Finance is in the process of introducing a number of actions tospeed up the use of external resources and thereby improve overall projectexecution. First, it is establishing a new project monitoring system inthe Directorate of External Finance, including the development of a projectinformation system and the establishment of Management Committees(Comisiones Gerenciales) for major projects facing problems inimplementation and the use of external financing, with the objective ofmore effectively coordinating project execution and resolving key issues.Each Management Committee would include representatives of the ExternalFinance Department and the Budget Office, the executing agency, and thefinancing agency concerned. Second, the Ministry is proposing thereestablishment of the Commission for External Financing (COFE) as the bodyresponsible for determining external financing policy and approving thenegotiation of new loans. This Commission includes the Minister ofFinance, the President of the Bank of Guatemala, the Secretary General ofSEGEPLAN, the head of the Directorate of External rinance, and the Directorof the Technical Directorate for the Budget.
9.14 In order to formalize these initiatives and provide a strongerframework for the administration of external financial resources, theMinistry of Finance is also preparing a draft law for submission to theCongress. This law would establish a clear policy framework for externalfinancing, reactivate the Commission for External Financing, clarify thefunctions of the Directorate of External Finance as the main entityresponsible for coordinating external assistance, provide fcr theestablishment of technical working groups for each project or loan undernegotiation, and establish the Management Committees to resolve projectimplementation issues and monitor project execution.
9.15 In addition to the above, the Directorate of External Finance inthe Ministry of Finance is also undertaking a number of other steps toimprove monitoring of projects in execution. Technical assistance is being

- 91 -
provided through UNDP to assist the Directorate in reviewing itsorganization and improving the administration of external resources. Aspart of this effort the Directorate has prepared a plan of action aimed toat expediting public sector investment during 1989, including theidentification of the highest priority projects in each sector and theestablishment of a high level management review process designed to ensurethat the selected priority projects have all of the financial, managerial,and other support required to ensure their rapid implementation.
9.16 Recommendations. The most important action required to improveproject execution -s to ensure the appointment of experienced and welltrained project managers and to provide project managers with the highlevel support needed to effectively manage a major investment project.Each development project must be given the priority it deserves and seniormanagement in individual Ministries or decentra]ized entities shouldmonitor progress on a routine basis. At the same time, to ensure that theproject manager can operate effectively it is essential that: i) theadministrative framework and the operational requirements and detailsneeded to facilitate project implementation are carefully worked out duringpreparation of the project; ii) project requirements and conditionality arecarefully defined during negotiations to ensure that they are realistic;iii) adequate mechanisms for improving coordination within the Governmentare established to ensure adequate monitoring of project execution and therapid resolution of project implementation issues; iv) steps are taken tominimize the number of internal approvals required for each execution step;and v) actions are taken to simplify and make more agile the systems ofprocurement and processing of purchase orders. Ministry of Financeinitiatives to improve the management of external financial resourcesshould be continued and further strengthened, including processing of theproposed law on external financial management, which should be expedited.

- 92 -
CHAPTER X. OVERALL CONCLUSIONS AND RECOMMENDATIONS
10.01 Guatemala confronts two basic public expenditure issues. First,the ',overnment needs to improve the efficiency with which it utilizesalready available resources. This is by far the highest priority andrequires not only improvements in the execution of projects and programs,but also adjustments in the allocation of public resources. Second, theGovernment must find ways to increase the resources available to it formeeting urgent development and investment priorities. This requires notonly an additional public sector resource mobilization effort, but alsofurther actions to encourage greater community and private sectorinvolvement in the planning and financing of development needs. The tasksof improving the allocation of public expenditures and increasing theefficiency of resource use are not easy ones and require a concerted efforton several fronts at the same time. As indicated in the previous chapters,the Government has started to tackle some of these issues, but a moresystematic effort is required if satisfactory progress is to be made inachieving the country's twin goals of promoting sustained economic recoveryand redressing social inequities. An outline of key issues and suggestedagenda for action is presented below.
Improving the Allocation of Public Expenditures
10.02 Within the existing public expenditure framework, there are twomajor allocation issues. One is the overly high share allocated to wagesand salaries which is symptomatic of serious overstaffing problems and lowpublic sector productivity. Resolving this issue will require a sustainedeffort to restructure key institutions, improve public management and otherskills, while also providing incentives to facilitate transfers to theprivate sector.
10.03 The other major resource allocation issue is the inadequate shareof public resources allocated to the social sectors and certain basicservices. Additional resources need to be allocated to those activitieswith large external benefits to society and in which private sectorinvestment would always be limited. Primary education, preventive andprimary health care, water supply and sewerage, and low income housing areall activities that qualify under this criteria. In addition, theGovernment should help increase the productivity and earnings of smallfarmers, who constitute the majority of the poor, through the increasedprovision of extension services, basic infrastructure such as feeder roadsand access to credit. Increasing public expenditures in these sectorsrequires both a better allocation of existing resources within a sector, asweJl as in some cases shifting allocations between sectors. Thus, forexample, expenditures on higher education could be shifted increasingly tothe private sector, with public financing concentrating on primary andsecondary education; similarly, resources currently allocated for INDECA'soperations for its relatively minor basic grains marketing activities couldbetter be utilized to improve financing of agriculture extension, thus alsohelping to increase farmer incomes.

- 93 -
Reshaping Investment Priorities
10.04 In addition to improving the allocation of expenditures, publicsector investment priorities can be adjusted to better reflect Governmentobjectives. Guatemala is fortunate that it has no major "white elephants"in its investment program. Nevertheless, some of the older projects mayno longer fully correspcnd to the currenit Government's priorities, and somerevisions in prcject scope, if still feasible, should be carried out. Atthe same time, the preparation of new projects needs to be reviewed toensure that they match current priorities and country requirements. Thefollowing actions and adjustments in the different sectors would bedesirable:
a) Agriculture. Investment should be targeted more directly forsmall farmer development, poverty alleviation and protection ofnatural resources. Investment in costly large scale irrigationprojects should be minimized, with emphasis on encouraging privateinvestment for irrigation of large size commercial fatms. Theproposed Montufar irrigation project, for example, should beredirected towards mini-irrigation rather than utilizing publicfunds for financing large scale commercial irrigation, which couldbe financed by the private sector. Consideration should be givento reallocating remainiing funds from the ongoing agriculturetechnology project towards research on the needs of the smallholder, crop diversification, and export promotion, withparticular emphasis on the Altiplano. Further investment inINDECA to expand its marketing facilities should be halted pendinga full review of INDECA, including the rationale for andeffectiveness of its market interventions. Alternative mechanismrsfor improving food security should be explored, including bettertargeting of food aid.
b) Transport. Expedite carrying out of the National Transport St,,including a review of the feasibility of new investment inrailways given its questionable competitive edge over roadtransport. Review the timing and magnitude of the proposedinvestment in Puerto Santo Tomas de Castilla in light of the needto strengthen port management and operations, thus rnaiking opt.imaluse of existing facilities to support Guatemala's export drive.Maintain the present focus on improving rehabilitation andmaintenance of Guatemala's road network, while concentrating newconstruction on expansion of the rural road network.
c) Water Supply. Investment priorities should include: i) extendingwater supply to the fringes of the capital city and majorsecondary cities; ii) expanding water and sanitation services inrural areas, with low cost solutions and community participation;iii) protecting water sources particularly in the Guatemala cityareas through reforestation and treatment of solid wastes; andiv) providing treatment for toxic industrial wastes and domesticsewerage in areas where surface water contamination directlyaffects community water supplies.

- 94 -
d) Health. Make more effective use of existing resourc3s in reachingthe majority of the poor by increasing the share of expendituresallocated for primary and preventive health care as well as theshare of resources allocated to the rural areas, while limitingexpenditures on relatively expensive curative care in the capitalcity. Initiate preparation of additional projects in the healthsector to strengthen a very weak project pipeline, with particularemphasis on improving rural health care and enhancing theeffectiveness of preventive health care.
e) Education. Continue the emphasis on expanding primary education,including expediting implementation of on-going projects andinitiating preparation of additional projects in primary educationto strengthen a weak project pipeline. Consider increasingtuition for higher education while ensuring access throughfellowships to poor students, thus freeing resources for expandingprimary education.
f) Housing and Urban Development. Continue to design more costeffective means for meeting low income housing needs, includingemphasis on self-help solutions, housing rehabilitation and sitesand services, rather than more costly, complete housing solutions.Encourage both greater community and NGO participation in lowincome housing solutions, while modifying institutions andpolicies in the financial sector to promote greater private sectorfinancing of middle to high income housing.
g) Municipal Development. Provide municipalities with directtechnical assistance in designing development programs andprojects to facilitate appropriate utilization of the 8 percent,including efforts to strengthen INFOM's technical assistance rolewhile also expanding NGO efforts in municipal and communitydevelopment.
h) Power. Reduce planned investments to the minimal level consistentwith maintaining adequate power supplies, with particular e.mphasison reducing the high cost of studies and utilizing internationalcompetitive bidding to obtain most favorable prices.
Institutional Restructuring
10.05 Guatemala's ability to more effectively utilize its scarce publicresources for development, depends in great part on the carrying out offundamental reforms in key public entities. Serious institutionalconstraints in key public enterprises and agencies impairs development oftheir respective sectors and places an additional burden on limited fiscaland human resources. Key recommendations for major public agencies aresummarized below:
a) INDE. Improving INDE's operations and financial viability isurgent given its substantial and increasing drain on publicfinances as well as the strategic role the power sector plays indevelopment. Rehabilitating INDE's finances will require hardpolitical choices, including consideration of further periodic

- 95 -
adjustments of power tariffs, additional financial support fromthe Government, and changes in INDE's institutional structure,including the provision of increased autcnomy in handling itsstaffing and financial matters. Nevertheless, strong Governmentsupport must be accompanied by an equally strong effort ur thepart of INDE to increase the efficiency of its operations. Tofacilitate such an effort, Government suplport of INDE should beprovided within the context of a specific agreement with INDEwhich clearly spells out the actions to be taken by INDE torationalize its operations, the financial and other commitments tobe made the Government, and specific arrangements for monitoringand enforcing compliance. In addition to improving INDE'smanagement and finances, consideration should also be given toimproving coordination with EEGSA, including a possible adjustmentin the division of labor between the two institutions, with INDEspecializing in generation and EEGSA taking over responsibilityfor all distribution.
b) GUATEL. Although GUATEL is financially sound given previousincreases in international rates, its domestic rates remain fartoo low to encourage good service and efficient use of the system.The Government should consider giving GUATEL further managerialindependence including enabling it to establish its own tariffs,in exchange for agreement on actions to improve the efficiency ofits operations, reduce non essential personnel, and provideexpanded service through increased subcontracting to the privatesector.
c) BANDESA. The provision of adequate agriculture credit to smalland medium scale farmers is crucial to Guatemala's developmenteffort. In this effort BANDESA should play a major role. Itcannot do so without major institutional improvements. Ongoingefforts to modernize and reorganize BANDESA's operations, withexternal technical assistance, should be fully supported. At thesame time, alternative vehicles for providing such credit shouldbe explored, inclueing greater use of private sector financialinstitutions and cooperatives.
d) INDECA. The effectiveness of its operations in the food securityarea should be thoroughly reassessed and consideration given toalternative mechanisms to ensure the availability of foodsupplies.
e) INFOM. Its role as the major provider of technical assistance andtraining to the municipalities should be strengthened. Theurgency of this effort is now greater than ever, as themunicipalities are receiving substantial resources from thetreasury (the 8 percent) which cannot be utilized in a timely andcost effective manner without major improvements in the capacityof municipalities to prepare and execute projects, while alsostrengthening their financial management skills.

- 96 -
f) BANVI. The ongoing restructuring effort should continue with theobjective of refocusing BANVI activities on lower income housing,strengthening its financial situation including its arrearspolicies, and improving its planning capabilities.
g) Water Supply Institutions. Existing sector institutions arefragmented and weak. Although the establishment of CONAGUA willhelp improve sector coordination, a major reorganization of thesector is needed if the provision of water and sanitation servicesare to be expanded. Proposed institutional arrangements include:i) the creation of Central Government entities for both waterresource allocation and for sector investment planning; ii) theconsolidation of all agencies dealing with rural water supply intoone entity; and iii) continuation of the current system of ruralwater committees with increased technical support.
Increased Mobilization of Resources
10.06 In addition to the resource allocation issues summarized above,perhaps the most difficult and crucial development issue facing Guatemala'spoli;y makers, is the question of resource mobilization. This reportrecommends a variety of measures for increasing the availability ofresources, including both increases in revenue through better taxadministration and additional tax reform, as well as through increasedprices for public utilities and adjustments in user charges, coupled withinstitutional and administrative improvements to make more effective use ofexisting resources. Nevertheless, satisfactory progress will require timeand difficult political decisions.
10.07 While increased resources for investment in key sectors isessential if Guatemala is to achieve its development goals, a larger publicsector does not necessarily follow. The overall goal should be to financeadequate public services in those sectors and areas where privateinvestment cannot effectively operate or where public interest clearlyoutweighs private concerns. It seems clear that in such areas as health,education, low income housing, water supply and sanitation and othermunicipal services, basic transport and roads, and agriculture services,especially for small to medium sized farmers, that strong public sectorinvolvement is essential. It is much less clear in such areas astelpcommunications and power, for example, where private sector financingof investment is much more feasible. Although issues of privatization gowell beyond this report, the Government may also need to consider whethercertain services could not be more cheaply and effectively supplied by theprivate sector, thus minimizing what needs to be financed out of the publicpurse.
10.08 The Government's efforts to open up alternative developmentchannels outside the Central Government and decentralized public agenciesthrough strengthening the role of the municipalities and working withcooperatives, NGOs and other private associations should also beencouraged. The proposed establishment of a Social Invertment Fund wouldsupport the Government's efforts to develop alternative mechanisms forimproving the living conditions of the poor and increasing expenditures onsocial programs and projects.

- 97 -
Accelerating Project Execution
10.09 Urgent action is also needed to accelerate the slow pace ofproject execution. As a first step, each agency should identify itshighest priority projects, review management and funding requirements, andmake changes in project management as may be appropriate to ensure thateach project has the human and financial resources required, includingreallocating funds from less essential tasks. To help senior managementmonitor progress, specific financial and physical targets should beestablished together with mechanisms for frequent monitoring. In additionto the above, the following actions are recommended:
a) accelerating efforts to secure legislative approval of the revisedprocurement law, while reviewing internal processing requirementsto minimize the number of internal approvals required;
b) facilitating rapid resolution of implementation problems throughbetter coordination, including establishment of special ManagementCommittees (Comisiones Gerenciales) to more efficiently resolveimplementation issues as proposed by the Ministry of Finance;
c) further strengthening the management of external finance,including approval of new legislation, through reestablishment o0the Commission for External Financing, with particular emphasis onensuring that projects proposed for external financing areadequately prepared, especially the management requirements, andkey project conditionality is feasible and can be carried out inthe timeframe proposed; and
d) expediting the disbursement or utilization of project financing byencouraging the use of petty cash funds to handle smallexpenditures.
Strengthening Planning and Project Preparation
10.10 The planning agency, SEGEPLAN, requires considerable strengtheningin terms of training and skills as well as in the organization and focus ofits key tasks. This does not require an increase in the overall size ofSEGEPLAN, but rather improved use of existing resources while enablingSEGEPLAN to draw on key skills existing elsewhere in the public sector asmay be needed. SEGEPLAN's primary functions are to establish investmentand expenditure priorities; oversee and coordinate the preparation ofprojects designed to meet these priorities, while ensuring that suchprojects are economically and financially sound; and work closely with theMinistry of Finance and Banco de Guatemala to match these projects withsound financing arrangements consistent with the country's macro economicprogram. SEGEPLAN needs to minimize the time spent on listing andcategorizing projects based on limited data from project implementingagencies, and concentrate more on the tasks outlined above. Specificactions recommended to strengthen planning and project preparation include:
- 98 -
a) establishing a small working group made up of senior staff fromkey ministries to: i) establish the highest priority spending andpolicy needs in each major sector; ii) analyze the existing budgetand investment program to see how well these priorities arecovered; iii) ide;.tify the principal spending and programmingadjustments required, including suggested guidelines for the 1990budget; and iv) prepare a public investment program and spendingguidelines for the next three years consistent with theavailability of resources and the overall macro-economiz program.
b) giving increased attention to project preparation, especially inthose sectors such as healt. and education where the projectpipeline is especially weak, including strengthening SEGEPLAN'srole in coordiaating project preparation; identifying projectpreparation needs; and proriding additional funding throughestablishment of the proposed pre-investment fund, SINAFIP, whichshould be put into operation as soon as possible, while at thesame time reviewing proposed operational arrangements for the fundto simplify procedures and enhance its ability to operate as aneffective and agile institution; and
c) providing technical assistance and financial support needed toaccelerate project preparation at the local level to enhance thecapacity of local communities to satisfactorily utilize theirshare of the 8 percent of general revenues allocated to them underthe Constitution.
- 99 -
ANNEXES AND STATISTICAL APPENDIX
ANNEXES
ANNEX I: The Tax Regime
ANNEX II: Macroenomic Projections
ANNEX III: NGOs in Guatemala
STATISTICAL APPENDIX
Section I: Standard Tables
Section II: Public Sector Investment Program
Section III: Other Sector Tables

ANNEX I- 100 -
GUATEMALA
THE TAX REGIME
Introduction
1. Guatemala's tax system is characterized by: (i) low tax burden;and (ii) high reliance on indirect taxes, particularly taxes on trade. Thetax burden--tax revenues over GDP--is one of the lowest in the world and isabout one-half of countries with similar per capita income (Table I.1)).It declined from a peak of about 11 percent in the late 1970s, to anaverage of 6 percent of GDP in 1984-85. This drop resulted primarily fromlower export and import taxes due to lower trade volumes and export prices;trade taxes accounted for 39 percent of tax revenues in 1979/1980 and foronly 13 percent in 1985/1986 (Table I.2). More recently, lower revenueshave resulted from lower taxes on domestic transactions. Domestic indirecttaxes dropped with the reduction in the rate and coverage of the valueadded tax (VAT) introduced in 1983. With the introduction of new,temporary export taxes (which are gradually being phased out) the taxburden recovered in 1987 to 8.2 percent of GDP and trade taxes rose to 30percent of tax revenues.
2. Tax evasion is reportedly extremely high. Although there is nohard evidence to show the degree of tax evasion, it is revealing thatGuatemala's income tax rates are similar or even higher than in othercountries, while income tax yields are only a small fraction of therevenues obtained in those countries (Table I.3).
3. Tax legislation and tax administration have been very lax. In1986, only about two thirds of the 82,700 taxpayers filing income taxreturns paid any tax. Of those who paid any taxes, deductions wereextremely generous: corporations declared deductions covering up 95percent of their gross income; individuals 70 percent. Taxes actually paidrepresented only 1.4 percent of corporate gross income and 3.4 percent ofpersonal gross income. As regards the VAT, fiscal credits on inputs weregranted with very little control and refunds owed by the treasury to VATtaxpayers have accumulated to Q102 million (about one-third of 1987 VATcolLections). Moreover, many firms which collected VAT from customers didnot turn it into the treasury. The situation with the other taxes wasequally gloomy: property taxes were based on a late 1960 valuationobviously eroded by inflation; gift and inheritance taxes wert widelyavoided via trusts; taxes on idle land were seldom enforced; and selectiveconsumption taxes introduced in 1985 were suspended because the privatesector argued that they constituted double taxation (with the VAT) and weretherefore considered unconstitutional.
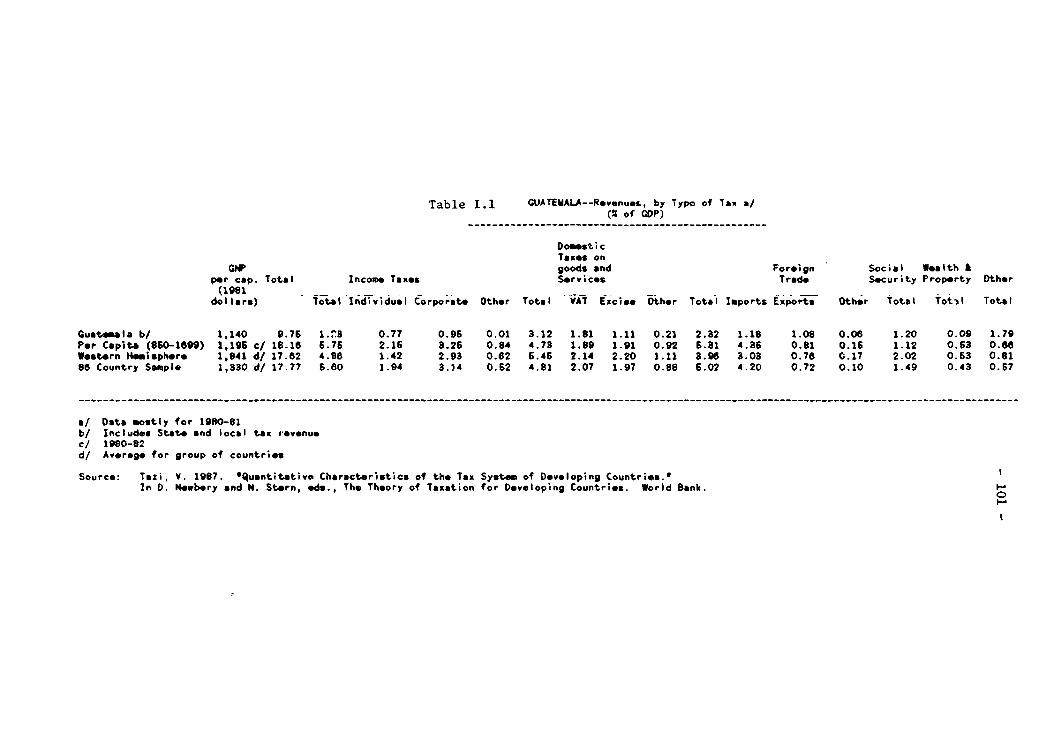
Table I.1 GUATEMALA--Revenues, by T ype of Tax a/(t of GDP)
DomesticTaxes on
CNP goods and Foreign Social Woalth &
per cap. Total Income Taxes Services Trade Security Property Other
(1981dollars) Total Individual Corporate Other Total VAT Excite Other Total Imports Exports Other Total Tot-l Total
Guatemala b/ 1,140 9.76 1.3 0.77 0.96 0.01 3.12 1.81 1.11 0.21 2.32 1.18 1.08 0.06 1.20 0.09 1.79
Per Capita (8S5-1699) 1,195 c/ 18.16 6.75 2.16 3.26 0.84 4.73 1.89 1.91 0.92 6.31 4.36 0.81 0.15 1.12 0.63 0.66
Western Hemisphere 1,841 d/ 17.62 4.86 1.42 2.93 0.62 6.46 2.14 2.20 1.11 3.96 3.03 0.76 0.17 2.02 0.63 0.81
86 Country Sample 1,330 d/ 17.77 5.80 1.94 3.)4 0.62 4.81 2.07 1.97 0.88 6.02 4.20 0.72 0.10 1.49 0.43 0.67
a/ Dats aostly for 1980-81b/ Includes State and local tax r-venuec/ 1980-82d/ Average for group of countries
Source: Tasi, V. 1987. 'Quantitative Characteristics of the Tax System of Developing Countries.o
In D. Newbery and N. Stern, ads., The Th-ory of Taxation for Developing Countries. World Bank.
C

ANNEX I- 102 -
Table I.2: Central Government Tax Revenues, SelectedYears, 1970-1986
(Percentage Composition)
1970-71 1975-76 1979-80 1985-86
I. Direct Taxes 16.8 19.4 15.6 17.7A. Personal Income 3.1 3.9 3.5 4.7B. Business Income 9.8 13.1 10.9 10.4C. Property 3.9 2.4 1.2 2.5
II. Indirect Taxes 83.2 80.6 84.4 82.2A. Inter. Trade 31.0 31.4 38.4 12.5
1. Imports 25.5 19.4 17.5 11.82. Exports 5.5 12.0 20.9 0.7
Coffee 5.2 6.9 18.9 0.4B. Domest. Trans. 52.2 49.2 46.0 69.7
1. Excises 24.4 18.4 14.5 17.02. Stamp Taxes 23.9 27.3 28.2 7.83. Value-Added - - - 30.7
4. Other 4.0 3.5 3.3 14.21
III. Total Tax Revenues 100.0 100.0 100.0 100.0
1/ Includes a tax on foreign transactions which was eliminated whentemporary export taxes were introduced in 1986.
Source: Ministry of Finance.
Table 1.3: Income Tax in Selected Countries, 1984
Top1 Total TaxMarginal asRate Z of GDP
Costa Rica 50.0 4.0El Salvador 30.0 2.0Honduras 40.0 3.7Dominican Republic 46.0 2.0Panama 50.0 6.2Mexico 42.0 4.2Guatemala 42.0 1.6
1/ Corporate Income Tax RateSource: Business Latin America, May 11, 1987 (p. 148) and World Bank.

ANNEX I- 103 -
The 1987 Tax Reform
4. As part of its fiscal modernization program, the Governmentsubmitted to Congress a tax reform proposal in September 1987. Strongprivate sector opposition to the reforms led to significant revision in theversion ultimately approved by Congress in late 1987. Highlights of the1987 tax reform are summarized below.
(i) Personal Income Tax. The number of tax brackets were reducedfrom 68 to 16. Marginal rates ranging from 5 percent of taxableincome up to Ql,000 to 48 percent of taxable income over Q500,000were reduced to rates ranging from 4 percent of taxable income upto Q5,000 to 34 percent for taxable income over Q130,000.Personal deductions were increased significantly: for a " typical"taxpayer with a family of five members, deduction were nearlydoubled and may reach Q20,000, or about 16 times the minimumsalary.
(ii) Corporate Income Tax. The number of tax brackets werereduced from five to three. Marginal rates ranging from aminimum of 5 percent for taxable income up to Q5,000 to a maximumof 42 percent for income over Q2 million were reduced to 12percent for taxable incomes up to Q30,000, 22 percent for taxableincomes between Q30,001 to Q60,000 and 34 percent for taxableincomes over Q60,000. These latter rates are proportional. A 33percent automatic deduction on reinvestment of profits wasabolished.
(iii) Other Important Modifications to the Income Tax were asfollows: (a) Banks were subjected to a minimum tax of 18 percenton net income including exempt income or 34 percent on net incomeexcluding exempt income, whichever is higher; (b) limits ondeductions were introduced inter alia on the following items:(i) Christmas bonus (aguinaldo) was limited to 200 percent ofmonthly wage; (ii) deductions for business expenses (includinginterest) were allowed only on items related to business; and(iii) interest on non-banking borrowing was limited to maximumlegal interest rates; (c) periodic quarterly payments forcorporations (pagos a cuenta) were established and tax retentionrules made clearer; and (d) a presumptive income tax forprofessionals was established.
(iv) Import Tax. Tariffs on imports were increased by 4 percent.Products exempt from this new tax include petroleum products andderivatives, some basic foodstuffs and medicines. The rate is tobe gradually reduced to one percent by 1992.
(v) Property Tax. The new law consolidates the originallegislation dating from 1921 as well as its subsequent amendmentsand unifies the tax rates set by the Central Government and themain (4) municipalities. The changes are as follows:

ANNEX I- 104 -
Old Law New LawProperty value. Q 5,000 exempt Q 2,000 exemptUp to: Q20,0Q° 0.3% Q20,000 C.2X
Q50,000 0.6% Q70,000 0.62Over Q50,000 0.8% Q70,000 0.9%
In addition to 0.8 percent under the old law, four municipalitiescharged an additiona: 0.35 percent for the highest bracket. Underthe new law the full 0.2 percent and half of ;he revenuescollected by the 0.6 percent and 0.9 percent will be retained bythe municipalities. These rates apply to the value of allproperty taken together independently of their location. The taxbase comprises the value of (') land; (ii) structures; and(iii) permanent crops. The new law requires taxpayers todetermine the value of their own properties (autovaluo).
(vi) Value Added Tax (VAT). The revised law maintains the rateof 7 percent but limits tax reimbursements to purchases of goodsand services used in generating taxable income. It classifiestraditional exports and the construction industry as finalconsumers, which under the previous law were taxed at zero ratesenjoying, therefore, tax reimbursement privileges. Under the newlaw, tax credits granted for the purchase of capital goods used asinputs will not be awarded immediately but spread over a five yearperiod.
(vii) Stamp Tax. The stamp tax covers transactions not coveredby the VAT such as rents of properties, real state contracts,transportation services, financial services, insurance anddividends. Under the new law the coverage of the stamp tax isenlarged to bonos de prenda, a negotiable certificate issued bywarehouses.
(viii) Tax on Circulation of Vehicles. Changes the tax fromspecific to ad valorem based on the market value of the vehicles.The new tax schedule ranges from 1 percent for cars one year oldto 0.1 percent for those with more than 9 years.
Tax Revenue Outlook
5. Notwithstanding the 1987 tax reform, tax revenues are not expectedto increase in the next few years. It should be noted however that t"is ismostly due to the phasing out of export taxes and the phased reduction inthe 4 percent increase in import tariffs. Revenue projections for 1988-91indicate that the tax burden would increase from 8.2 percent of GDP in 1987to 8.8 percent in 1988, but would decline gradually thereafter to pre-reform levels of 7.8 percent of GDP in 1991 (Chapter I, Table 1.3). Itshould be also noted that the Government's planned reduction in importtariffs under Common Market Arrangements, as part of its effort to promotea more competitive industrial sector has not been taken into consideration,however preliminary estimates indicate that its fiscal revenue impact wouldbe marginal.

ANNEX I- 105 -
A Proposed Agenda for Future Reform
6. Although the 1987 tax reform introduced important modifications tothe tax regime, the revenue projections underscore the urgent need toimprove tax collections. The ongoing Ministry of Finance efforts tomodernize tax administration therefore need to be accelerated.Specifically, there is a need to i) strengthen tax fiscalization andenforcement; ii) reorganize the Ministry of Finance along functional linesand establish unified procedures for administering the different taxes;iii) simplify tax legislation along the lines suggested below;iv) strengthen data processing; v) improve training and career incentives;and vi) strengthen the coordination of technical assistance. These issuesare discussed in greater detail in a recently completed Fiscal ManagementReport. A suggested agenda for future tax reform is summarized below.
Tax and Customs AdministratLon
7. The major problem of tax administration has been one ofenforcement. Tax fiscalization has been totally inadequate. In 1987 therewere about 70 tax inspectors for the 83,000 registered income taxpayers and50 tax inspector for the 26,000 VAT taxpayers. Ta. audits have averagedabout 200 per year. There is therefore an urgent need to design a systemfor the supervision and inspection for better ensuring taxpayer compliance.Concentrating fiscalization efforts on the large taxpayers would beappropriate. However, the creation of a unit to focus on large taxpayersmust be accompanied by a strong commitment to follow through against taxdelinquents.
8. Tax administration could also be better structured if the Ministryof Finance was organized by functions rather than having one department foreach major tax. Specialized units should be established to handle thoseactivities that are common to all taxes (i.e.,administration, tax control,fiscalization and auditing, and enforcement) and the manager for eachfunctional unit made responsible for each activity. Once these functionsare specified, a unified system of procedures -or all taxes could beestablished thus facilitating review and enforcement. The simplificationof tax forms and the streamlining of paperwork are additional measures thatcould be taken quickly and incorporated in the draft tax code presentlybeing discussrd. Other actions may require additional study such as:(i) determining which taxes are not cost effective to collect and should beeliminated; (ii) making an inventory of special regimes and eliminatingthose that are no longer justified; and (iii) further simplifying the taxbase by eliminating the exemptions and deductions which remain in the lawand have very little justification.
9. Corruption has been the major problem affecting Customs. Inaddition, it also suffers from acute technical deficiencies including:(i) inefficient systems of classification, valuation and appraisal;(ii) lack of expertise in special regimes; (iii) complex administrativeprocedures; and (iv) extremely poor physical facilities includinglaboratories. The Ministry of Finance has been seeking to address theseissues but it still lack a master plan which sets out the new organization,operational procedures and training needs. Specific tasks that need to becarried out include: (i) recompilation of all customs legislation including
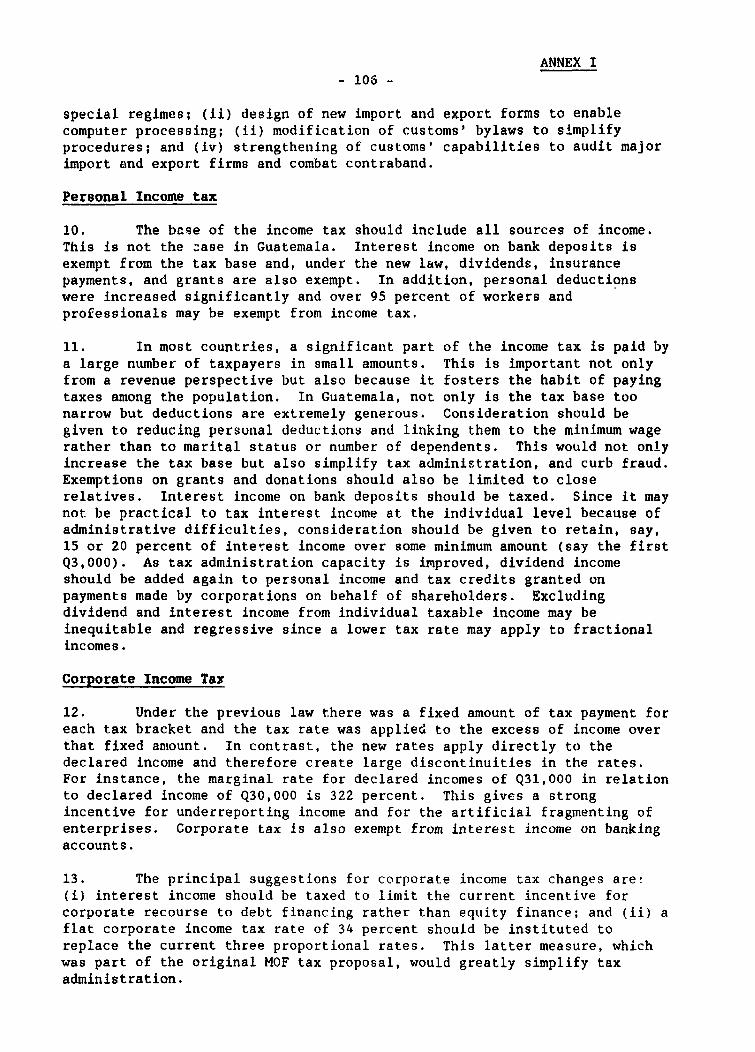
ANNEX I- 106 -
special regimes; (ii) design of new import and export forms to enablecomputer processing; (ii) modification of customs' bylaws to simplifyprocedures; and (iv) strengthening of customs' capabilities to audit majorimport and export firms and combat contraband.
Personal Income tax
10. The base of the income tax should include all sources of income.This is not the zase in Guatemala. Interest income on bank deposits isexempt from the tax base and, under the new law, dividends, insurancepayments, and grants are also exempt. In addition, personal deductionswere increased significantly and over 95 percent of workers andprofessionals may be exempt from income tax.
11. In most countries, a significant part of the income tax is paid bya large number of taxpayers in small amounts. This is important not onlyfrom a revenue perspective but also because it fosters the habit of payingtaxes among the population. In Guatemala, not only is the tax base toonarrow but deductions are extremely generous. Consideration should begiven to reducing personal deductions and linking them to the minimum wagerather than to marital status or number of dependents. This would not onlyincrease the tax base but also simplify tax administration, and curb fraud.Exemptions on grants and donations should also be limited to closerelatives. Interest income on bank deposits should be taxed. Since it maynot be practical to tax interest income at the individual level because ofadministrative difficulties, consideration should be given to retain, say,15 or 20 percent of interest income over some minimum amount (say the firstQ3,000). As tax administration capacity is improved, dividend incomeshould be added again to personal income and tax credits granted onpayments made by corporations on behalf of shareholders. Excludingdividend and interest income from individual taxable income may beinequitable and regressive since a lower tax rate may apply to fractionalincomes.
Corporate Income Tax
12. Under the previous law there was a fixed amount of tax payment foreach tax bracket and the tax rate was applied to the excess of income overthat fixed amount. In contrast, the new rates apply directly to thedeclared income and therefore create large discontinuities in the rates.For instance, the marginal rate for declared incomes of Q31,000 in relationto declared income of Q30,000 is 322 percent. This gives a strongincentive for underreporting income and for the artificial fragmenting ofenterprises. Corporate tax is also exempt from interest income on bankingaccounts.
13. The principal suggestions for corporate income tax changes are:(i) interest income should be taxed to limit the current incentive forcorporate recourse to debt financing rather than equity finance; and (ii) aflat corporate income tax rate of 34 percent should be instituted toreplace the current three proportional rates. This latter measure, whichwas part of the original MOF tax proposal, would greatly simplify taxadministration.

ANNEX I- 107 -
Value Added Tax
14. The VAT in Guatemala has four regimes: a general regime in which a7 percent rate is charged on the sale of goods and services with taxcredits granted on the VAT paid on inputs; a zero rate regime for basicfoods and non-traditional exports under which no tax is paid on the finalproduct and fiscal credits are granted for the purchase of inputs; a broadexemption regime for the bus industry and private schools unider which thebeneficiaries do not pay tax on inputs by using an exemption card and donot charge it on their sales; and a final consumption regime. Theconstruction industry, banking services, and traditional exporters havebeen placed under this latter regime which implies that they do not receivecredits on taxes paid on inputs but do not charge VAT on their sales ofgoods or services.
15. The VAT could be further simplified by changing some of itscurrent regimes. Possible modifications could include: i) incorporatingthe transport and construction industries into the general regime;ii) including educational institutions which by Constitution are exemptfrom the tax into the zero rate regime and abolish the exemption card; andiii) incorporating traditional exports into the zero tax regime since theyalready may deduct VAT paid on inputs from their income tax. Considerationshould also be given to expand VAT coverage to a~ctivities currently subjectto the stamp tax, such as banking services, rentals, and insurancepremiums. Finally, the new 5-year credit rule for capital goods(paragraph 4 (vi) not only introduces a disincentive to investment but alsomakes the VAT more difficult to administer. The immediate credit on thepurchase of capital goods should, therefore, being reinstated.
Property Tax
16. Property taxes which were collected by the municipalities and theGovernment were unified under the new law as the Impuesto Unico SobreInnuebles and their administration centralized in the Ministry of Finance.Part of the revenues collected will be earmarked for the municipalities;the other part will be equally shared by the national treasury and themunicipalities (paragraph 4 (v)). In addition, the new law changed thecharacteristic of the property tax from one that taxes property to one thattaxes asset holdings. The tax rate is applied to the value of allproperties taken together independently of their location rather than toindividual properties.
17. In most countries property taxes are a local tax. The recentreform not only changed that characteristic of the tax but also centralizedits administration in the Ministry of Finance. Consideration should begiven to transferring responsibility for this tax back to themunicipalities, particularly in light of the Government's emphasis ondecentralization and strengthening local community involvement in meetinglocal needs.
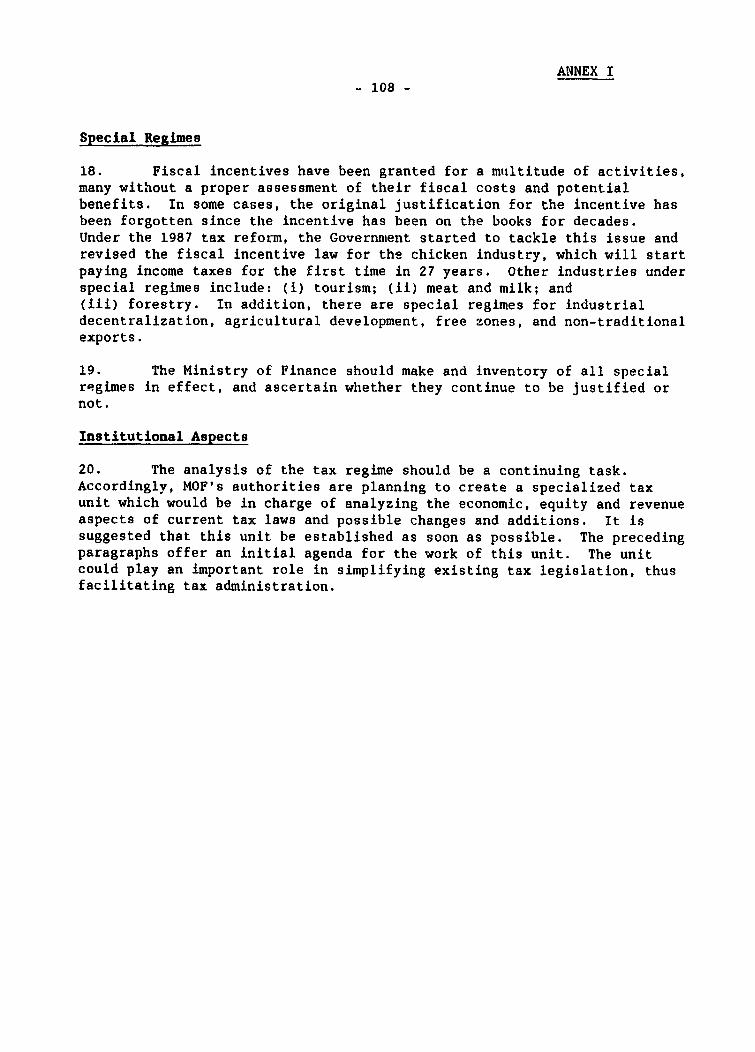
ANNEX I- 108 -
Special Regimes
18. Fiscal incentives have been granted for a multitude of activities,many without a proper assessment of their fiscal costs and potentialbenefits. In some cases, the original justification for the incentive hasbeen forgotten since the incentive has been on the books for decades.Under the 1987 tax reform, the Government started to tackle this issue andrevised the fiscal incentive law for the chicken industry, which will startpaying income taxes for the first time in 27 years. Other industries underspecial regimes include: (i) tourism; (ii) meat and milk; and(iii) forestry. In addition, there are special regimes for industrialdecentralization, agricultural development, free zones, and non-traditionalexports.
19. The Ministry of Finance should make and inventory of all specialregimes in effect, and ascertain whether they continue to be justified ornot.
Institutional Aspects
20. The analysis of the tax regime should be a continuing task.Accordinglv, MOF's authorities are planning to create a specialized taxunit which would be in charge of analyzing the economic, equity and revenueaspects of current tax laws and possible changes and additions. It issuggested that this unit be established as soon as possible. The precedingparagraphs offer an initial agenda for the work of this unit. The unitcould play an important role in simplifying existing tax legislation, thusfacilitating tax administration.
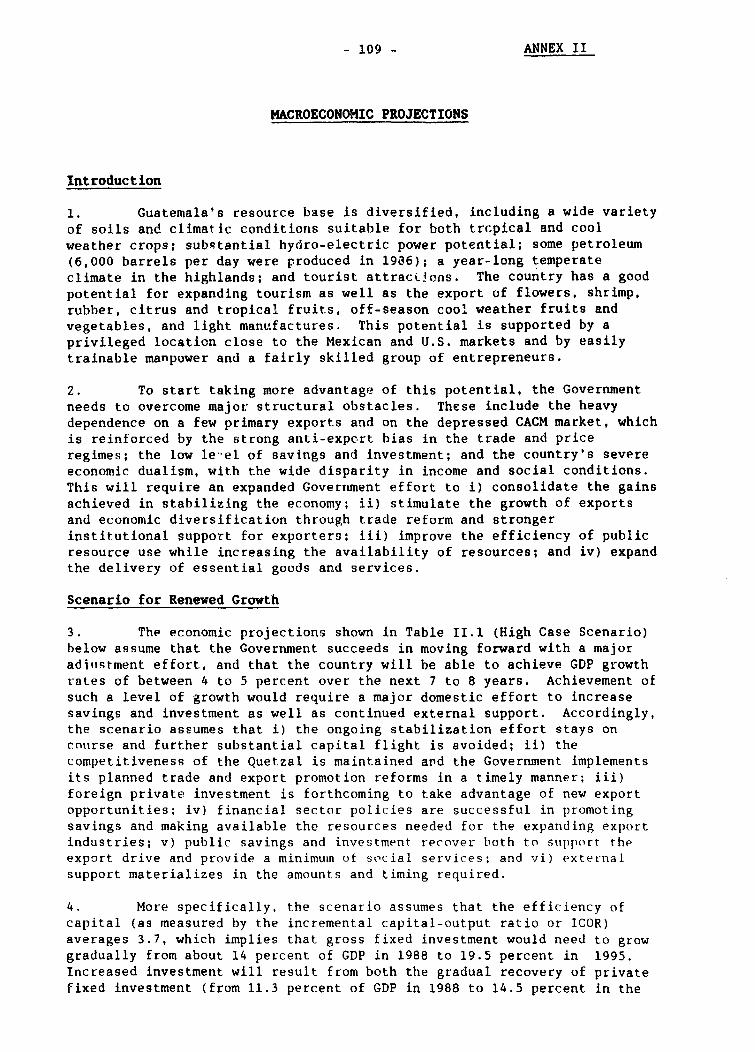
- 109 - ANNEX II
MACROECONOMIC PROJECTIONS
Introduction
1. Guatemala's resource base is diversified, including a wide varietyof soils and climatic conditions suitable for both tropical and coolweather crops; substantial hydro-electric power potential; some petroleum(6,000 barrels per day were produced in 1986); a year-long temperateclimate in the highlands; and tourist attractions. The country has a goodpotential for expanding tourism as well as the export of flowers, shrimp,rubber, citrus and tropical fruits, off-season cool weather fruits andvegetables, and light manufactures. This potential is supported by aprivileged location close to the Mexican and U.S. markets and by easilytrainable manpower and a fairly skilled group of entrepreneurs.
2. To start taking more advantage of this potential, the Governmentneeds to overcome major structural obstacles. These include the heavydependence on a few primary exports and on the depressed CACM market, whichis reinforced by the strong anti-expert bias in the trade and priceregimes; the low le-el of savings and investment; and the country's severeeconomic dualism, with the wide disparity in income and social conditions.This will require an expanded Goverrnment effort to i) consolidate the gainsachieved in stabilizing the economy; ii) stimulate the growth of exportsand economic diversification through trade reform and strongerinstitutional support for exporters; iii) improve the efficiency of publicresource use while increasing the availability of resources; and iv) expandthe delivery of essential goods and services.
Scenario for Renewed Growth
3. The economic projections shown in Table II.1 (High Case Scenario)below assume that the Government succeeds in moving forward with a majoraditjstment effort, and that the country will be able to achieve GDP growthrates of between 4 to 5 percent over the next 7 to 8 years. Achievement ofsuch a level of growth would require a major domestic effort to increasesavings and investment as well as continued external support. Accordingly,the scenario assumes that i) the ongoing stabilization effort stays oncottrse and further substantial capital flight is avoided; ii) thecompetitiveness of the Quetzal is maintained and the Government implementsits planned trade and export promotion reforms in a timely manner; iii)foreign private investment is forthcoming to take advantage of new exportopportunities; iv) financial sector policies are successful in promotingsavings and making available the resources needed for the expanding exportindustries; v) public savings and investment recover both to support theexport drive and provide a minimum of social services; and vi) externalsupport materializes in the amounts and timing required.
4. More specifically, the scenario assumes that the efficiency ofcapital (as measured by the incremental capital-output ratio or ICOR)averages 3.7, which implies that gross fixed investment would need to growgradually from about 14 percent of GDP in 1988 to 19.5 percent in 1995.Increased investment will result from both the gradual recovery of privatefixed investment (from 11.3 percent of GDP in 1988 to 14.5 percent in the
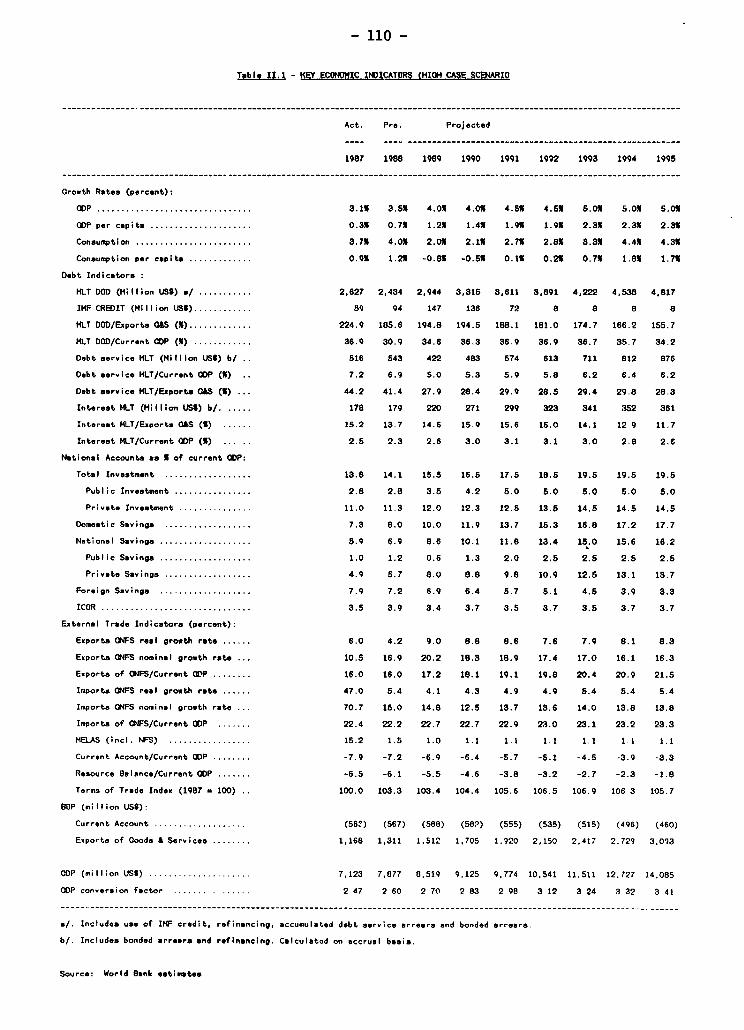
- 110 -
Tabl II.1 - KEY ECONOHIC INDICATORS (HIOH CASE SCENARIO
Act. Pro. Projected
1987 1988 1989 1990 1991 1992 1993 1994 1995
Growth Rates (percent)-
CDP 3.11................................. 3.5% 4.0% 4.0% 4.5% 4.51 6.0% 5.0% 5.01
GDP per capits 0.31 0.7% 1.2% 1.4% 1.9% 1.9% 2.3% 2.3% 2.31
Consumption ......................... 7. 4.0% 2.0% 2.1% 2.7% 2.8% 3.3% 4.4% 4.3%
Consumption per capita 0..............1 1.2% -0.8% -0.5% 0.11 0.21 0.71 1.8% 1.71
Debt Indicators :
MLT DOD (Mil lion USS) */ 2,627........2627 2,434 2,944 3,315 3,611 3,8091 4,222 4,538 4,817
IMF CREDIT (Million LISS) 5 9 59 94 147 136 72 8 8 8 8
MLT DOD/Exports GUS (%) ............. 224.9 185.6 194.8 194.5 188.1 181.0 174.7 166.2 155.7
MLT DOD/Current CDP (1) 36............. 30.9 34.6 36.3 36.9 36.9 36.7 35.7 34.2
Debt service MLT (Million USS) b/ 5 516 543 422 483 574 613 711 812 876
Debt service MLT/Current GDP (%) 7.2 6.9 S.0 5.3 5.9 5.8 6.2 6.4 6.2
Debt aervice MLT/Exports GAS (1) 44.... 41.4 27.9 28.4 29.9 28.5 29.4 29.8 28.3
Interest MLT (Million US) b/. 178 178 179 220 271 299 323 341 352 361
Interest MLT/Exports GAS (%) 15.2....... 13.7 14.6 15.9 15.6 15.0 14.1 12 9 11.7
Interest MLT/Current ODP (%) 2.5 2.3 2.6 3.0 3.1 3.1 3.0 2.8 2.6
National Accounts as % of current CDP:
Total Investment 13.8 14.1 15.5 16.5 17.5 18.5 19.5 19.5 19.5
Public Investment 2.8................. 2.8 3.5 4.2 5.0 5.0 5.0 5.0 5.0
Private Investment 11................ 11.3 12.0 12.3 12.5 13.5 14.5 14.5 14.5
Domestic Savings .................. 7.3 8.0 10.0 11.9 13.7 15.3 16.8 17.2 17.7
National Savings ................. 5.9 6.9 8.6 10.1 11.8 13.4 15.0 15.6 16.2
Public Savings 1.................... 1.2 0.6 1.3 2.0 2.5 2.5 2.5 2.5
Private Savings ..................9.9 5.7 8.0 8.8 9.8 10.9 12.5 13.1 13.7
foreign Savings 7.9 7.2 6.9 6.4 5.7 5.1 4.5 3.9 3.3
ICOR ................................. 3.9 3.4 3.7 3.5 3.7 3.5 3.7 3.7
External Trade Indicators (percent):
Exports ONPS real growth rate ......0.0 4.2 9.0 8.8 8.6 7.6 7.9 8.1 8.3
Exports CNFS nominal growth rate 10.5 16.9 20.2 18.3 18.9 17.4 17.0 16.1 16.3
Exports of ONFS/Current GOP , 16.0 16.0 17.2 18.1 19.1 19.8 20.4 20.9 21.5
Imports CNFS real growth rate 47.0 5.4 4.1 4.3 4.9 4.9 5.4 5.4 5.4
Imports CWS nominal growth rate 70.7 15.0 14.8 12.5 13.7 13.6 14.0 13.8 13.8
Imports of CNFS/Current GDP 22.4........ 22.2 22.7 22.7 22.9 23.0 23.1 23.2 23.3
MELAS (incl. NFS) 15.2 1.5 1.0 1.1 1.1 1.1 1.1 1.1 1.1
Current Account/Current GOP ... -7.9 -7.2 -6.9 -6.4 -5.7 -5.1 -4.5 -3.9 -3.3
Resource 8alance/Current GDP -6.5 -6.1 -5.5 -4.6 -3.8 -3.2 -2.7 -2.3 -1.8
Terms of Trade Index (1987 - 100) 100.0 103.3 103.4 104.4 105.6 106.5 106.9 106 3 105.7
BOP (miflion USS):
Current Account ( 5 6 °) (562) (567) (588) (582) (555) (535) (515) (496) (460)
Exports of Goods & Serviceo s....... 1,168 1,311 1,512 1.705 1,920 2,150 2,417 2.729 3,093
CDP (million USS) 7,1 2 3 7,123 7,877 8,519 9,125 9,774 10,541 11.511 12.727 14,085
CDP conversion factor 2 47 2 60 2 70 2 83 2 98 3 12 3 24 3 32 3 41
a/. Includes use of IMF credit, refinancing, accumulated debt service arrears end bonded arrears.
b/. Includes bonded arrears and refinancing. Calculated on accrual basis.
Source: World Bank estimates

- 111 - ANNEX II
1990s), as well as an increase in public sector investment (from 2.8percent in 1988 to 5 percent in 1991 and thereafter). This would requirenot only continued domestic stability, but also effective policies topromote exports, a significant strengthening of public sectorimplementation capacity and continued access to external credit. Foreigndirect private investment is expect to make a significant contribution,averaging about US$100 million per year. At the same time, the projectionsassume a substantial improvement in domestic savings which increase from 8percent of GDP in 1988 to 18 percent in 1995. This savings effort wouldnot only require continued austerity in public expenditure policies, butaiso a significant effort to increase public savings from 1.2 percent in1988 to 2.5 percent in the 1990s, as well as improved incentives forprivate savings through realistic interest and exchange rate policies. Thelevel of savings required is essential if the additional growth in theeconomy is to be achieved without an unsustainable level of externalborrowing.
5. With respect to the projected level of exports, the projectionsassume that the longer term prospects for Guatemala's traditional exportscoffee, sugar, cotton, and meat) are limited given expected world marketdemand/supply balances, and that the bulk of the increases in exportearnings will come from the expansion of non-traditional exports such asfruits, vegetables and flowers. Market prospects for these latter productsare favorable, especially in U.S. markets. Moreover, substantial growthhas been recorded in recent years, with non-traditional exports nearlydoubling from US$128 million in 1986 to US$215 million in 1988. Assumingan appropriate set of policy incentives are put in place and institutionaland infrastructure support is forthcoming, nontraditional export earningscould double (in real terms) to US$580 million by the mid-1990s.
6. There are also good opportunities to expand tourism earnings givenGuatemala's attractive natural and cultural resources. The recent strongrecovery of the tourism industry, albeit from very depressed levels, isencouraging, with earnings growing from US$13 million in 1985 to aestimated level of US$63 million in 1988. Assuming continued domestictranquillity, the tourism industry could double its earnings in real termsby the mid-1990s.
7. An adequate level of imports will be required to sustain theprojected level of GDP growth and exports. Import volume growth of capitaland intermediate goods have seem projected to increase faster than GDP asthe restructuring of the economy accelerates. Imports of consumer goodsand petroleum are projected to grow in line with GDP
8. Although the terms of trade are projected to remain at presentlevels, export growth would outpace imports and the resource balance wouldgradually improve from a deficit of US$483 million in 1988 (6.1 percent .ofGDP) to about US$258 million in 1995 (1.8 percent of GDP). As a result,the current account deficit of the balance of payments would decline from7.2 percent of GDP to a more sustainable level of 3.3 percent in 1995. Thebalance of payments projections are shown in table 11.2.
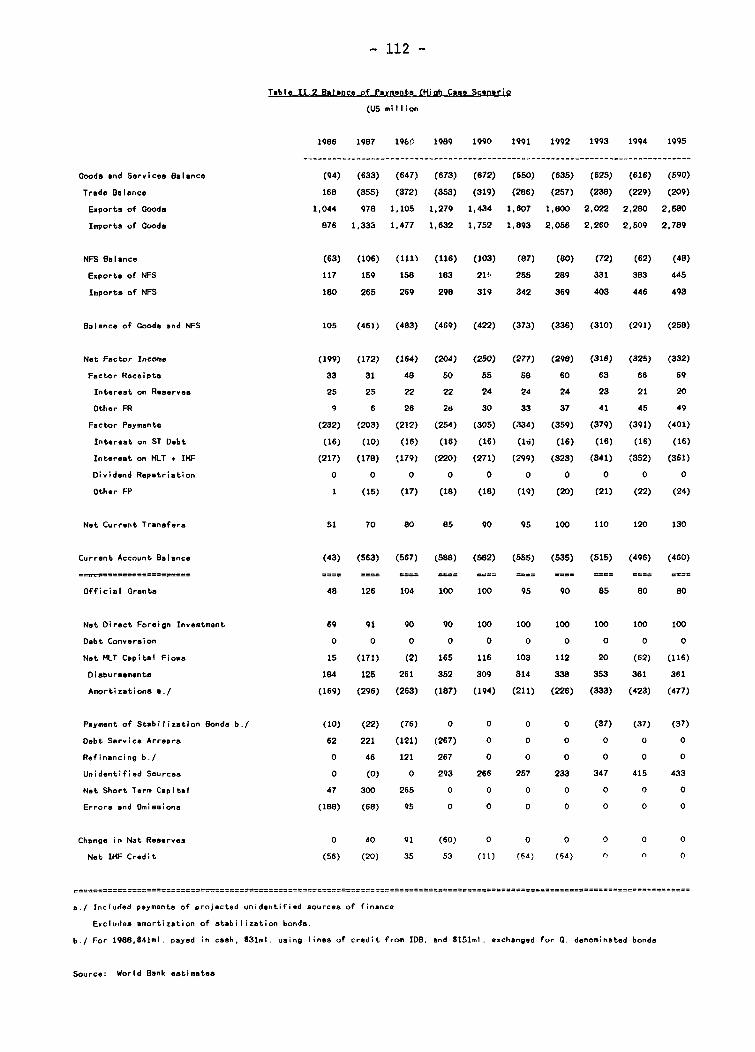
- 112 -
Table 11.2 Balance of Payments (Hiah Caoe Scenario
(US mil lion
1986 1987 1961i 1989 1990 1991 1992 1993 1994 1995
Goods and Services Balance (94) (633) (647) (673) (672) (650) (635) (625) (616) (590)
Trade Balance 168 (355) (372) (353) (319) (286) (257) (238) (229) (209)
Exports of Coods 1,044 978 1,105 1,279 1,434 1,607 1,800 2,022 2,280 2,580
Imports of Coods 876 1,333 1,477 1,632 1,752 1,893 2,056 2,260 2,509 2,789
NFS Balanco (63) (106) (111) (116) (103) (87) (80) (72) (62) (48)
Exports of NFS 117 159 158 183 21' 255 289 331 383 445
Imports of NFS 180 265 269 298 319 342 369 403 446 493
Balance of Coods and NFS 105 (461) (483) (469) (422) (373) (336) (310) (291) (258)
Not Factor Income (199) (172) (164) (204) (250) (277) (298) (316) (325) (332)
Factor Receipts 33 31 48 50 55 s8 60 63 66 69
Interest on Reserves 25 25 22 22 24 24 24 23 21 20
Other FR 9 6 26 28 30 33 37 41 45 49
Factor Payments (232) (203) (212) (254) (305) (334) (359) (379) (391) (401)
Interest on ST Debt (16) (10) (16) (16) (16) (i6) (16) (16) (16) (16)
Interest on MLT + IMF (217) (178) f179) (220) (271) (299) (323) (341) (352) (361)
Dividend Repatriation 0 0 0 0 0 0 0 0 0 0
Other FP 1 (15) (17) (18) (18) (19) (20) (21) (22) (24)
Net Current Transfers 51 70 80 85 90 95 100 110 120 130
Current Account Balance (43) (563) (567) (588) (582) (555) (535) (515) (496) (460)
Official Crants 48 126 104 100 100 95 90 85 80 80
Net Direct Foreign Investment 69 91 90 90 100 100 100 100 100 100
Debt Conversion 0 0 0 0 0 0 0 0 0 0
Net MLT Capital Fiows 15 (171) (2) 165 116 103 112 20 (62) (116)
Disbursements 184 125 261 352 309 314 338 353 361 361
Amortizations a./ (169) (296) (263) (187) (194) (211) (226) (333) (423) (477)
Payment of Stabilization Bonds b.f (10) (22) (76) 0 0 0 0 (37) (37) (37)
Debt Service Arrears 62 221 (121) (267) 0 0 0 0 0 0
Refinancing b./ 0 46 121 267 0 0 0 0 0 0
Unidentified Sources 0 (0) 0 293 266 257 233 347 415 433
Net Short Ter. Capital 47 300 265 0 0 0 0 0 0 0
Errors and Omissions (188) (68) 95 0 0 0 0 0 0 0
Change in Nat Reserves 0 40 91 (60) 0 0 0 0 0 0
Net IMF Credit (56) (20) 35 53 (11) (64) (54) ) r O
s.1 Included payments of projected unidentified sources of finance
Excludes amortization of stabilization bonds.
b./ For 1988,841ml. payed in cash, 831ml. using lines of credit from IDB, and S151ml. exchanged for Q. denominated bonds
Source: World Bank setimates

- 113 - ANNEX II
9. To achieve the projected level of growth, Guatemala will requiresubstantial financial support in the next few years. The scenario assumesthat the ongoing negotiations to refinance about US$267 million in paymentarrears would be concluded during 1989 and official grants (mostly from theUnited States) would average about US$90 million per year, whi_h is in linewith recent trends. Gross disbursements from financial institutions wouldaverage about US$75 million (including roll over of existing obligations);With respect to bilateral lending, gross disbursements from the existingpipeline are projected to average about US$30 million per year.Nevertheless, even with this level of external assistance, coupled with asharp increase in gross disbursements fLcmi multilateral institutions(which would increase from about US$100 million in 1988 to an average ofUS$200 million per year, including quick disbursing loans), the projectionsshow a large unfinanced gap of about US$280 million per year. One-third ofthis gap could be filled by suppliers credit to the private sector. Theremaining US$180 million gap would have to be financed with additionalassistance from bilateral or other sources (including additionalrefinancing), if the growth targets are to be achieved. Should theadditional resources not be secured, annual GDP growth would most likelynot surpass ̂ .9 percent (down from 4.6 percent in the higb case scenario),with marginal gains in per capita income.
10. With respect to debt service requirements, the scenario shows animprovement in all debt indicators by the mid-1990s (see Table II.1)External debt-to-exports ratio would decline from about 186 percent in 1988to 156 percent in 1995. The debt service ratio (after refinancing) woulddecline from 41 percent in 1988 to 28 percent in 1995. Interest paymentson medium and long term debt would peak at 3.1 percent of GDP in 1991-92and decline below 3 percent in 1995.
Fiscal Projections
11. The proposed public investment program for 1988-91, which isdiscussed in detail in the main text, is consistent with the high casescenario. The proposed investment program was put together by identifyingongoing and new projects that could start during the period, eitherfinanced by external sources or local resources. The level of investmentcontemplated would increase capital outlays from 2.8 percent of GDP in 1988to 4.4 percent in 1989 and to 4.7 percent in 1990 (Table I1.3). For 1991,there is a drop in the project pipeline, and identified investmentexpenditures would decline to 4.6 percent of GDP. However, it was assumedthat the Government would strive to increase investment to a the minimumlevel of 5.0 percent of GDP starting in 1991 a level that is considerednecessary to support a minimum improvement in basic services and the socialsectors.
12. Public sector consumption expenditures (wages and purchase ofgoods and services) are projected to lag only slightly behind the change innominal GDP after 1989. This would still allow the Government to allocatedadditional resources to the social sectors (i.e. education materials andpreventive medicines) or pay higher wages for employees with strategicskills (i.e. teachers, health workers, project managers or tax auditors),since the growth in other expenditure categories may be kept in check. Asregards revenue projections, they were based on a detailed analysis of theimplications of the 1987 tax reform on revenue performance as well as on

- 114 - ANNEX II
the projected growth of GDP, and the growth of imports and exports in termsof both volume and prices.
Table II.3Non-Financial Public Sector
(Percentage of GDP)
Est. Projected
1988 1989 1990 1991
Current Revenues 12.9 13.1 12.4 12.2Current Expenditures 11.7 12.5 12.4 12.2Current Account 1.2 0.6 -0.1 -0.0
Capital Revenues 0.2 0.1 0.1 0.1Capital Expenditures 2.8 4.4 4.7 5.0
Overall Balance (Deficit) -1.4 -3.7 -4.7 -4.9Grants 0.9 1.0 0.9 0.8Net External Financing 1.l -0.0 1.7 1.8 1.8Net Domestic Financing 0.5 0.3 0.3 0.3Financing Gap - 0.8 1.8 2.0
1/ Includes balance of payments support.Source: Ministry of Finance and World Bank estimates.
13. The projections show a fiscal gap of about 2 percent of GDP aftertaking into account additional financing expected from: i) disbursements onforeign loans consistent with the projected level of investment,ii) counterpart generated by official grants (equivalent to nearly 1percent of GDP during the period), and iii) counterpart generated bybalance of payments loans (averaging 0.6 percent of GDP), and iv) domesticcredit. With respect to domestic financing, it was assumed that theGovernment's net domestic credit target for 1989 (0.3 percent of GDP) wouldbe kept in the following years. Although increased recourse to domesticfinance could close the financing gap and provide counterpart for theproposed investment program, this would either crowd out private credit andinvestment and/or be inflationary. Additional foreign borrowing could alsofill the gap, but would place the economy in the low saving scenario/highdebt scenario described in Chapter I. Another option would be to seekadditional grant financing. Although this would be preferable toadditional borrowing, there is the danger of becoming too dependent onforeign grants which are already financing a share of recurrentexpenditures. Still another option would be to cut non-investmentexpenditures below the levels projected here. Although there is room tocut recurrent expenditures in selected sectors, there is also the need toincrease recurrent expenditures in the social sectors, agriculture (i.e.,extension), and maintenance of basic infrastructure. The proposed increasein investment in these sectors would also lead to additional recurrentexpenditures in the future. Thus, more than cutting the overall level ofrecurrent expenditures, there would be a need to reallocate them topriority areas. The desired course of action therefore would be to raise

- 115 - ANNEX II
additional resources by increasing revenues, through improved taxadministration, higher tariffs and user charges, and additional taxmeasures. Failing to secure additional resources, the likely outcome wouldbe spreading the implementation of ongoing projects over a longer period,while postponing the start of new projects, the typical occurrence inrecent years. The consequences would obviously be less public support foreconomic recovery and further delays in the payment of the Social Debt.
ANNEX Ill- 116 -
The Role of NGOs in Guatemala
1. NGOs have traditionally played an important role in Guatemala'sdevelopment effort, reflecting in part their comparative advantage incommunity development work, especially taking into account the ethnic andcultural diversity of Guatemala, as well the fact that the public sector'srole has been restricted by resource constraints and its generally limitedproject execution capacity. Although there are several thousand local NGOassociations, community groups and other such entities active in Guatemala,the bulk of the NGO contribution is presently being carried out by about200 larger NGOs, which provide financial, managerial and technicalassistance for develorient programs in local communities, often workingthrough smaller local groups. Over the past two to three years this groupof larger, intermediary NGOs, have expanded both in number as well as inthe size and complexity of their operations. At the same time, many of theNGOs have begun to do more forward planning of their activities while alsodiversifying their sources of income from International NGOs, Government,and bilateral and multilateral aid institutions. In addition, three NGOconsortia have been established of which the largest is ASINDES. Theseconsortia are in the process of developing their capacity to providemanagement, financial and technical support to their membership and the NGOcommunity as a whole.
2. Bilateral and multilateral funding of NGOs has increasedsubstantially over the past two years. Available estimates indicate thatof the 200 intermediary NGOs, over 160 are receiving funding in cash,materials and/or human resources from the United States alone. Other majorsources of funding include European Governments and foundations. Fundingthrough the Government is also increasing. ASINDES is currentlynegotiating a Q 8.0 million grant financing arrangement with the Ministryof Finance to utilize PL480 funds to support NGO programs developingcommercially viable income generation activities. There are also a numberof direct or indirect subcontracting arrangements between Governmentministries and NGOs to help fund NGO initiatives in agr'culture, smallscale industry, marketing, housing and other areas.
3. Based on a preliminary survey of 25 of the intermediary NGOs,the total development contribution of this sample group is estimated atabout Q 50 million during 1988 excluding a Food for Work program which isbeing implemented by one of the NGOs, with an estimated expenditure of Q57million for 1988. Since the activities of this sample group are estimatedto cover about 40 to 50 percent of all major NGO programs, total annualdevelopment activities of NGOs in Guatemala would be on the order of QlOOmillion. This level of expenditure equals about 0.5 percent of GDP, whichis significant.

ANNEX III- 117 -
TABLE 111.1NGO DEVELOPMENT ACTIVITIES, BY SECTOR, 1988
(Q millions)
Agriculture 16.3Community Development 2.7Education 10.2Health 10.3Housing 3.2Small Enterprise Development 3.2Public Works 0.7Water and Sanitation 3.0
Subtotal 49.4
Food for Work Program 57.4
Total 106.8
Source: World Bank estimates
4. NGOs in Guatemala have a wealth of experience in designing andoperating development programs targeted at the urban and rural poor. Thisknow how can be built upon and more effectively utilized and supported byGovernment and external donors to accelerate Guateniala development. Suchan effort will require time and careful nurturing to develop a soundthree-way partnership. On the part of the Government this would require i)assistance in improving the coordination and implementation of laws andprocedures involving NGOs, including for example improved Governmentprocedures for expediting importation of materials donated for NGOsponsored development activities; ii) improved coordination betweenministries with respect to development projects and programs involving NGOsto avoid duplication of effort, ensure a consistent policy framework, andestablish priorities; and iii) a willingness to involve NGOs in the processof designing development programs and policies. With respect to externalagencies, increasing cooperation with NGOs will require a much strongereffort to learn about NGO programs and development approaches, including aconcerted effort to explore and development specific project componentswhich could be handled by NGOs during the project preparation phase. Onthe part -f NGOs, increased involvement with Government and externalagencies will require a stronger effort to publicize programs anddevelopment efforts and a willingness to accept the additional controls andadditional time needed to collaborate with Government and externalagencies. As part of this effort NGOs, possibly through the existing NGOconsortia should seek to identify a small number of projects anddevelopment approaches which appear to have potential for expanding on alarger scale.

- 118 -
STATISTICAL APPENDIX
Section I: Standard Tables
1.1 National Accounts Summary, GDP in Current Quetzales1.2 National Accounts Summary, GDP in 1958 Quetzales1.3 Implicit Deflators (1958=100)1.4 Balance of Payments in (1975-1987)1.5 National Accounts Summary, GDP in 1980 Quetzales1.6 Implicit Deflators (1980=100)1.7 External Debt, Disbursements and Repayments1.8 External Trade (1975-1987)1.9 Consolidated Non-Financial Public Sector (1975-1987)1.10 Monetary Statistics (1975-1987)1.11 Selected Economic Indicators (1975-1987)1.12 Consolidated Non-Financial Public Sector (1988-1991)
Section II: Public Sector Investment Program (1988-1991)
2.1 Education Sector2.2 Health Sector2.3 Agriculture Sector2.4 Transport Sector2.5 Water Supply Sector2.6 Communications Sector2.7 Power Sector2.8 Housing and Urban Development2.9 Investment Program by Sector2.10 Investment by Institution2.11 Investment by Financing Source and Type of Financing
Section III: Sector Tables
3.1 Comparative Expenditures in Agriculture (1980)3.2 Historical and Projected Power Demand/Sales3.3 Power Capacity Balance (MW)3.4 Global Energy Balance (GWh)3.5 Power Plant Additions3.6 Road Network by Type of Pavement (1986)3.7 Road Development Program Targets (1988-1994)3.8 Water Supply/Sewerage Service Levels by Country (1984)3.9 Water Supply/Sewerage Service Levels in Guatemala3.10 Middle Income Latin American Countries
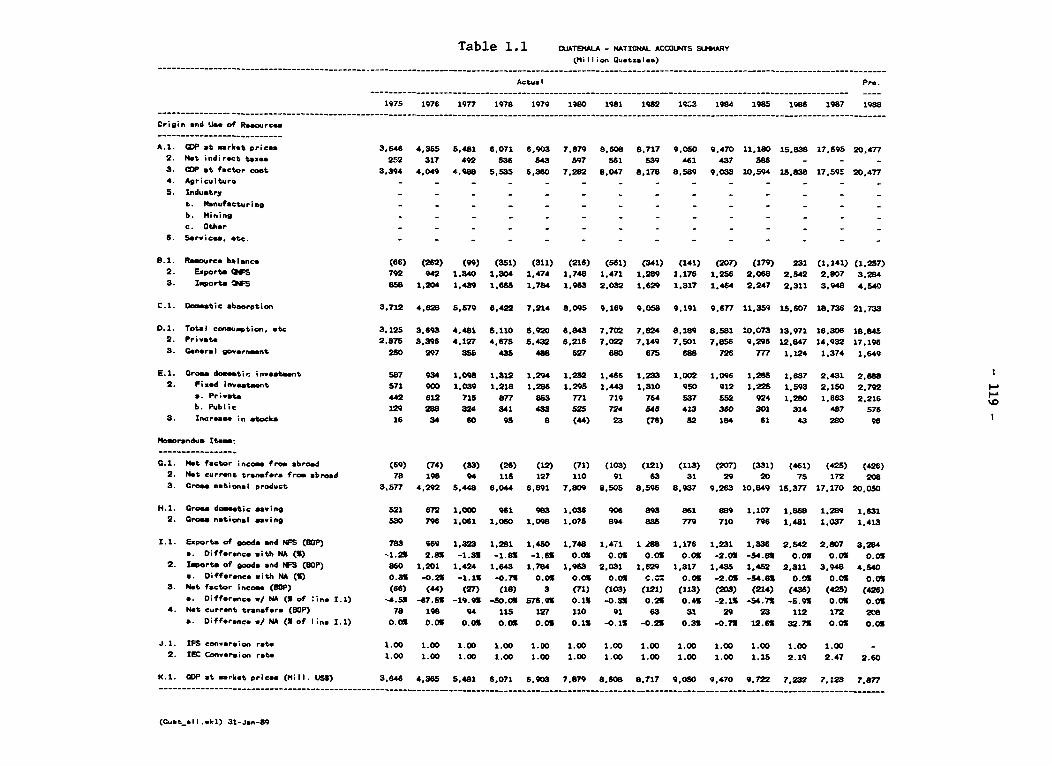
Table 1 .1 OUATBW.A - NATIONAL ACCOLUNTS SIMARY(Mill; on Ql-tzalea)
Actua I
1975 1976 1977 1978 1979 180 1981 1982 lCS3 1984 1985 1986 1987 1988
COrigin and Use of Reoumrce
A.1. CDP at mrket prices 3.646 4,365 5,481 6,071 6,903 7,879 8.608 8.717 9.050 9.470 11,180 15.838 17.595 20,4772. Net indirect tixna 2F52 317 492 536 543 597 561 539 4i6 437 586 - - -
3. CDP at fector cost 3.394 4.049 4,988 5,535 6,380 7.282 8,047 8.178 8,589 9,033 10,594 15.838 17.59! 20,4774. Agriculture - - - - - - - - - - - -
S. Industry - - - - - - - - - - - - - -
a. Manufacturing - - - - - - - - . - - - - -
b. mining - - - - - - - - - - - - -
c. Other - - - - - - _ _- - - - -_
6. Services, e. - - - - - - - - - - - - - -
B.1. Resource balance (66) (262) (99) (351) (311) (216) (581) (341) (141) (207) (179) 231 (1.141) (1.257)
2. Eaporta OWS 792 942 1.340 1,304 1.474 1,748 1.471 1.289 1.176 1,256 2.068 2,542 2.807 3,2843. Importa 24NS 858 1,204 1.439 1,655 1.784 1.963 2.032 1,629 1.317 1,464 2.247 2,311 3,948 4,540
C.1. Domestic absorption 3.712 4,628 S,579 6,422 7.214 8,095 9.169 9,058 9.191 9,677 11.359 15.607 18.736 21,733
0.1. Total consumption. etc 3.125 3,693 4,481 5,110 5,920 6,843 7.702 7,824 8,189 8.581 :0,073 13.971 16.306 18.8452. Private 2,875 3,396 4.127 4,675 5,432 6,216 7,022 7,149 7.501 7,856 9,296 12,847 14.932 17,1963. General government 250 297 355 43S 488 627 680 675 688 726 777 1,124 1.374 1.649
E.1. ross domeati, investment 587 934 1.098 1,312 1.294 1.252 1,466 1,233 1,002 1,096 1,285 1,637 2.431 2,8882. Fixed investment 571 900 1,039 1,218 1,286 1.295 1,443 1,310 950 912 1,225 1,593 2.150 2.792
a. Private 442 612 715 n77 883 771 719 784 537 552 924 1,280 1.663 2.216b. Public 129 288 324 341 433 525 724 546 413 360 301 314 487 576
3. Increaso in stocks 16 34 60 95 8 (44) 23 (76) 52 184 61 43 280 96
Memorandum Iteams
C.1. Net factor income from abroad (69) (74) (33) (26) (12) (71) (103) (121) (113) (207) (331) (461) (425) (426)2. NMt current transfers from abrod 78 198 94 115 127 110 91 63 31 29 20 75 172 208
3. roes national product 3,577 4.292 5,448 6,044 6,891 7,809 8.505 8,596 8.937 9.263 10,849 15.377 17,170 20.050
HI. Gross domestic moving 521 672 1,000 961 983 1,036 906 893 881 889 1.107 1888 1.289 1.6312. Gross nationsl ezving 330 798 1.061 1.080 1,098 1,075 894 835 779 710 796 1,481 1.037 1,413
I.1. Exports of goods and NFS (BOP) 783 989 1.32S 1,281 1,450 1,748 1,471 1 288 1,176 1.231 1,336 2,542 2,807 3,284a. Difference with NA (t) -1.2S 2.85 -1.31 -1.85 -1.65 0.03 OOS 0.01 0.OS -2.06 -54.81 0.05 0.06 0.01
2. IPOrts of goods end NFS (BOP) 880 1,201 1,424 1,643 1,784 1,963 2,031 1,629 1,317 1.435 1.452 2.311 3.948 4,540a. Difference with NA (S) 0.31 -0.21 -1.1S -0.71 0.019 0.01 09. C.= 0.01 -2.01S -54.8% 0.01 0.01 0.01
3. Net factor income (BOP) (66) (44) (27) (18) 3 C71) (103) (121) (113) (203) (214) (436) (425) (426)a. Difference w/ NA (S of ins 1.1) -4.51 -67.S6 -19.91 -SO0.0 576.91 0.1S -0.35 0.2 0.41 -2.11 -54.7S -5.9S 0.01 0.01
4. Net current transfers (BOP) 78 198 94 115 127 110 91 63 31 29 23 112 172 2C8a. Difference v NA (S of line 1.1) 0.01 0.0% 0.01 0.01 0.01 0.1S -0.11 -0.25 0.31 -0.71 12.61 32.71 0.01 0.01
J.1. IFS conversion rate 1.00 1.00 1.00 1.00 1.00 1.00 1.00 1.00 1.00 1.00 1.00 1.00 1.00 -
2. SeC Conversion rate 1.00 1.00 1.00 1.00 1.00 1.00 1.00 1.00 1.00 1.00 1.15 2.19 2.47 2.60
K.1. CDP at mrket prices (Mill. US$) 3,646 4.365 S.481 6,071 6,903 7,879 8,608 8.717 9,050 9,470 9,722 7.232 7.123 7.877
(Cuatal I -ekl) 31-Jan-89
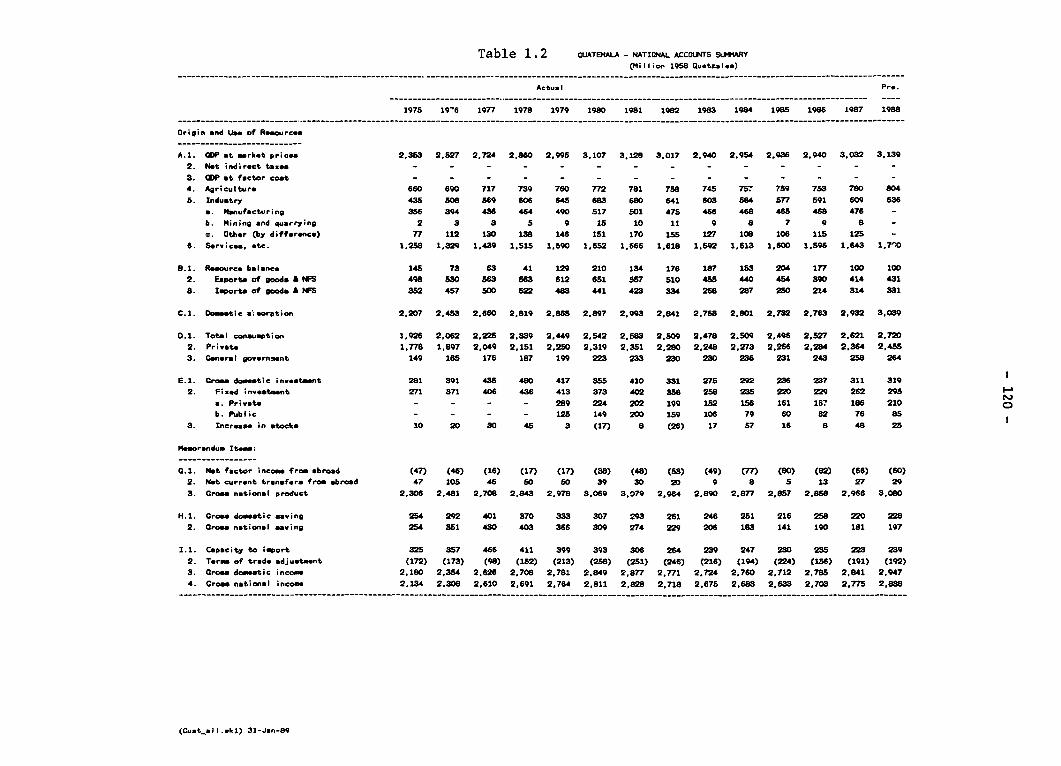
Table 1 . 2 CJATEALA - NATIONAL ACCOLTS SliARY(Millioi 1958 Quetzales)
Actual Pr..
1975 1106 1977 1978 1979 1980 1981 1982 1983 1984 1985 1986 1987 1988
Origin and Use of Resources
A.1. CP at market prices 2,353 2.527 2,724 2,860 2,995 3.107 3,128 3,017 2,940 2.954 2.936 2,940 3,032 3,1392. Net indirect taxes - - - - - - - - - - - - - -3. CDP at factor cost - - - - - - - - - - - - - -4. Agriculture 680 690 717 739 760 772 781 758 745 75' 759 753 780 8045. Industry 435 508 689 606 645 683 680 641 603 584 577 591 609 636
a. Manufacturing 356 394 436 484 490 517 501 475 466 468 4"5 468 476 -b. Mining and quarrying 2 3 3 5 9 15 10 11 9 8 7 9 8 -c. Other (by difference) 77 112 130 138 146 151 170 155 127 108 106 115 125 -
6. Services, etc. 1,258 1.329 1,439 1,515 1.590 1,652 1,666 1.618 1,592 1.613 1,600 1596 1,643 1,7-0
8.1. Rsource balance 145 73 63 41 129 210 134 176 187 153 204 177 100 1002. Exporte of goods A NFS 498 830 583 563 812 651 557 510 455 440 454 390 414 4313. Iporte of goods A NF5 352 457 500 522 483 441 423 334 268 287 250 214 314 331
C.1. Domestic : sorption 2,207 2,453 2,660 2,819 2,865 2.897 2,993 2,841 2,753 2,801 2,732 2,763 2,932 3,039
D.1. Total consumption 1,926 2,062 2.225 2.339 2,449 2.542 2,583 2,509 2,478 2,509 2,498 2,527 2,621 2,7202. Private 1.778 1,897 2,049 2.151 2.250 2,319 2,351 2,280 2.248 2,273 2,266 2,284 2,364 2,4553. General government 149 165 176 187 199 223 233 230 230 236 231 243 258 264
E.1. Crows domestic investment 231 391 435 480 417 355 410 331 275 292 236 237 311 3192. Fixed investment 271 371 406 436 413 373 402 358 258 235 220 229 262 295
a. Private - - - - 289 224 202 199 132 158 161 16? 186 210 ob. Public - - - - 125 149 200 159 106 79 60 62 76 8a
3. Incres- in stockls 10 20 30 45 3 (17) 8 (26) 17 57 16 8 48 25
Memorandue Itei_:
0.1. Net factor income from abroad (47) (46) (16) (17) (17) (38) (48) (53) (49) (77) (80) (82) (66) (60)2. Net current tranefers from abroad 47 105 45 50 s0 39 30 20 9 8 5 13 27 293. Gross national product 2,306 2,481 2,708 2,843 2,978 3,069 3,079 2,964 2,890 2.877 2,857 2,858 2.966 3,080
H.1. Groes domestic saving 254 292 401 370 333 307 293 261 246 251 216 258 220 2282. Cross national faving 254 351 430 403 366 309 274 229 206 183 141 190 181 197
I1.. Capacity to import 325 357 486 411 399 393 306 264 239 247 230 235 223 2392. Terse of trade adjustment (172) (173) (98) (152) (213) (258) (251) (248) (216) (194) (224) (158) (191) (192)3. Cross dometic incom 2,180 2,354 2,626 2,708 2,781 2,849 2,877 2,771 2,724 2,760 2,712 2,785 2.841 2.9474. Cros national incom 2,134 2,308 2,610 2,691 2,764 2,811 2,828 2,718 2,675 2,683 2,633 2,703 2,775 2,888
(Cu-t_*1 I ski) 31-Jan-89

Table 1.3 CUATEtLA - IWPLICrT DEFLATCR5(2958-100)
Actual Pre.
1975 1q76 1977 1978 1979 1980 1981 1982 1983 1984 1985 1986 1987 1988
Orioin and Use of Resources
A.1. CDP at mrket prices 155.0 172.8 201.2 212.3 230.5 253.6 275.2 289.0 307.9 320.6 380.8 58.7 580.3 652.22. Net indirect terxs - - - - - - - - - - - - - -3. MP at factor cost - - - - - - - - - - - - - -
4. Agriculture - - - - - - - - - - - - - -
5. Industry - -a. Manufacturing - -b. Mining and quarrying - -c. Other (by difference) - -
6. Services. etc. - -
B.1. Terra of Trade (Pa/Pa) 65.3 67.4 82.6 73.0 65.1 60.3 55.0 51.8 52.6 56.0 50.7 60.2 63.9 55.52. Exports of goods & NF5 159.2 177.6 237.9 231.7 240.7 268.4 263.9 252.6 258.6 285.4 455.5 651.1 678.0 761.23. Imports of goode A NF5 243.7 263.4 287.9 317.3 369.6 445.0 480.2 487.4 491.6 509.6 897.7 1082.0 S257.1 1371.7
Cl. ODoeatic abeorption 168.2 188.6 209.7 227.8 251.8 279.4 306.3 318.9 333.9 345.6 415.7 564.8 639.0 715.1
D.1. Total consumption 162.2 179.1 201.4 218.5 241.8 269.2 298.1 311.8 330.5 342.1 403.5 S52.9 622.0 692.92. Private 161.7 179.0 201.4 217.3 241.4 268.1 298.7 313.6 333.7 345.7 410.3 562.8 631.7 700.33. General o-vrnment 168.6 i80.
2201.3 252.2 245.4 281.3 292.5 294.1 299.2 307.6 337.1 462.6 533.1 624.0
E.l. Cross domestic investment 206.9 238.9 252.2 273.2 310.5 352.2 357.7 372.3 364.3 375.3 544.5 691.7 782.1 904.22. Fixed investment 210.9 242.4 255.9 279.5 311.1 347.6 359.4 S66.2 368.0 388.4 86.3 697.1 819.2 947.1
a. Private - - - - 295.7 344.2 356.0 384.4 352.9 354.4 575.5 767.3 894.1 1U55.5 1-b. Public - - - - 346.8 352.9 363.0 343.5 389.8 455.4 504.4 507.6 637.0 679.1
S. Increase in etocka 155.3 172.7 201.4 212.3 233.8 253.2 273.3 2S9.6 307.4 321.4 380.8 537.9 580.2 389.8
Morandum Itsem:
F.1. NMt factor incom from abroad 148.4 162.0 201.9 151.7 73.4 187.5 212.8 230.5 229.7 268.8 415.7 564.8 639.0 715.12. Net current transfers from abroad 168.2 188.6 209.7 227.8 251.8 279.4 306.3 318.9 333.9 345.6 41S.7 564.8 639.0 715.13. Cross national product 155.1 173.0 201.2 212.6 231.4 254.4 276.2 290.0 309.2 322.0 379.8 5S37.9 579.0 651.0
C.1. Gross domestic saving 205.2 230.5 249.2 260.1 295.6 337.6 308.9 341.5 349.4 358.6 511.9 724.0 5686.0 716.22. Cross national meving 208.8 226.8 246.8 260.7 299.8 848.4 325.6 365.1 377.3 388.9 562.8 781.4 574.4 716.5
(Guat_' I .*k) 31-Jan-89

Table 1.4 OATEFA - BACE ouF PAT,Ews(US6 Mi llion-)
Actual Pro.
1975 1976 1977 1978 1979 1980 1981 1982 1963 1964 1985 196 1987 1988
A.1. Exports of goods A NFS (F08) 783 969 1,S2S 1.281 1.4!O 1,748 1,471 1.288 i,176 1.231 1,162 1,161 1.16 1,2632. Marchandi.o 641 760 1,162 1,096 1,222 1,520 1.291 1.170 1.092 1.132 1.060 1.044 978 1,105
a. of which: Manufactures 155 179 203 2S0 268 359 325 308 319 330 805 368 -3. Non-factor service. 142 206 161 18 228 228 180 li 64 99 a*s2 117 159 158
B.1. IPorts of goods A NFS (FOB) 860 1,201 1,424 1,64S 1.784 1,963 2.031 1,629 1.317 1.435 1,262 1,055 1,599 1.7462. Merchandisa 672 951 1.066 1,282 1,402 1,472 1,540 1,284 1,0568 1.182 1.077 876 1,333 1,477
*. of which: Manufacturee 543 655 14 980 1.061 1,007 1,071 807 656 834 784 753 - -S. Non-fee.or servic.s 168 250 388 S61 382 491 491 345 261 253 185 179 265 269
C.1. RPeource balance (78) (232) (101) (362) (334) (215) (561) (341) (141) (204) (101) 106 (462) (483)
0.1. Not factor incom (66) (44) (27) (18) 3 (71) (103) (121) (113) (203) (186) (199) (172 (164)2. Factor receipts 15 30 43 73 103 77 55 24 29 30 30 33 31 48
a. of Which labor incooe 0 17 14 22 24 26 24 11 4 3 1 0 0 03. Factor payments 81 83 78 91 100 147 158 148 143 232 215 232 203 212
*. of which LT interest 1./ (DRS) 12 1S 20 33 48 so 63 77 89 95 116 208 178 179
E.1. Nat current transfers 78 198 94 116 127 110 91 63 31 29 20 51 70 602. Transfer receipt. 69 216 114 139 130 125 97 66 34 32 21 52 72 80
a. of which workers *reittances 0 0 0 0 0 0 0 0 0 0 0 0 0 03. Transfer paymante 11 16 21 24 23 16 6 8 4 S 1 1 2 0
F.1. Current account balance (65) (79) (34) (268) (205) (176) (573) (399) (224) (378) (267) (42) (564) (567) i'
0.1. Long-tera capital inflwe 146 84 200 265 242 244 407 380 293 14? 101 184 291 1162. Nat direct investment 80 13 97 127 117 98 110 78 45 38 61 69 91 903. Official capital grant. (1) 1 2 1 0 0 0 0 0 ° 0 48 126 1044. Nat LT loan- (CRS) SO 48 109 156 184 92 280 279 214 8S 29 5 (147) 43
a. disbursements 72 75 142 203 249 170 344 337 317 254 265 184 171 382b. repayment. 1./ 23 29 3S 47 68 78 65 59 10 170 235 179 318 339
S. Other LT inf loe(nat) 17 26 (9) (20) (60) 56 17 (7) 34 24 11 62 221 (121)
H.j. Other item (Nat) 2./ 23 214 16 69 (64) (387) (182) 22 (40) 249 71 (142) 233 360
I.1. Change in net reserves (-oincrmasa) (104) (220) (182) (88) 27 319 348 28 (29) (18) 95 0 40 912. Nt credit from lF 0 0 0 0 0 0 113 0 41 20 (49) (56) (20) 353. Other resrve changes (104) (220) (182) (68) 27 319 235 28 (70) (37) 144 56 60 56
Maorandus Items,
J.1. Export. of goods (UN Trade System) 623 760 1.160 1.112 161 1,486 1.115 1.120 1,159 1,127 1,107 1.194 - -a. Difference with BOP (S) -2.81 0.01 -0.21 1.31S 5.21 -2.31 -15.81 -4.5S 5.81 -0.41 4.31 12.5S - -
2. Imports of Goods (UN Trade System) 733 838 1,083 1,261 1.362 1.559 2,009 1,388 1,135 1,277 1.175 1,207 - -a. Difference with SOP (S) 8.21 -18.41 -3.21 -1.71 -2.91 5.61 23.4S 7.51 7.01 7.51 8.31 27.4S - -
K.1. Holdings of Reserves (IFS IlId) 353 557 753 86s 696 445 1SO 112 210 274 301 362 288 232
I./ On accrual basis.2./ Includes not S-T, capital n,e.i..
and errors and o.issions.
(Quat_al I -k) 31-Jan-89

Table 1.5 QUATBIALA - NATIONAL ACCOUNTS SUMMARY(Mi llion 198 Quetza le_)
Actua I Pr.
1075 1976 1977 1978 1979 198b. 1981 1982 1983 1984 1985 1988 1987 1988
Origin and Use of Rmources
A.1 CDP at market prices 5,986 6.407 6,907 7,25S 7,594 7.879 7,931 7,SS0 7,4S5 7,490 7,448 7.458 7,689 7.32
2. Net indirect teaom - - - - - - -
3. CDP at factor cost - - - - - - - _ _ _ _ _ _ _
4. Agriculture 1,673 1,749 1,817 1,874 1.928 1.958 1,982 1.922 1,889 1,918 1,926 1,909 1,978 2.038
S. Industry 1,103 1,288 1,442 1,537 1,835 1,783 1,725 1,625 1.829 1.482 1,464 1.499 1,545 1.612
a. Manufacturing 904 998 1,105 1,176 1.242 1,312 1,271 1.206 1.182 1.188 1,179 1,187 1,206
b. Mining and quarrying 5 7 8 12 22 38 24 27 24 19 16 22 21 -
c. Other (by difference) 195 283 330 349 571 383 430 393 323 275 269 290 317 -
6. Srv.ices, *tc. 3.189 3,370 3,648 3.841 4,082 4,189 4.225 4.103 4,037 4,090 4.058 4,048 4,166 4.312
8.1. Resource balance (231) (611) (712) (811) (505) (216) (387) (118) 28 (96) 105 9d (286) (315)
2. Eaports of goode A NfS 1,335 1,423 1,512 1,510 1.643 1,748 1.496 1.369 1.220 1,182 1,219 1,048 1,111 1,158
3. Iaport of goods A NfS 1.567 2.034 2,224 2,321 2.148 1.963 1,883 1,488 1,191 1,278 1,114 951 1,398 1,473
C1. Dom_tic *beorption 6,198 7,018 7,620 8,063 8,100 8.095 8.318 7,768 7.426 7,5d7 7.341 7,359 7,976 8.277
0.1. Total consumption, etc 5.208 5,640 6,086 B,372 6.832 6,843 6,874 6,601 6.457 6,5 6,6,510 6.525 6,881 7,152
2. Prive, *te 4,791 5,178 5,591 6.845 6,072 6.216 6.220 5,955 S.810 5.894 5,861 5,842 6,158 6,408
3. CGenerl government 418 4S4 495 327 560 827 654 646 647 664 649 688 725 743
El. Gros domestic investment 989 1,378 1,534 1,692 1,488 1.252 1,444 1,167 969 1,028 832 833 1.095 1,125
2. Fiwed inveetment 941 1,291 1.411 1,515 1,437 1.295 1,398 1,243 898 817 765 795 912 1,025 I-
a. Pri,et. - - - - 997 771 692 682 524 537 555 576 643 725
b. Public - - - - 440 525 704 S81 374 279 210 218 270 299
3. Incrie. in stocks 49 87 123 177 31 (44) 48 (76) 72 212 66 39 182 100
Mesorandum Items
C. l. Net factor income from abroad (87) (85) (30) (38) (32) (71) (91) (98) (92) (144) (149) (153) (125) (112)
2. Net current transfers from abroad 130 2V8 125 141 141 110 83 aS 26 23 13 37 75 81
3. Cross national product 5,879 6,322 6,877 7,220 7,563 7,809 7,841 7,552 7,362 7,348 7,297 7,303 7,565 7,850
H1.. Cross domestic soving 869 935 1,381 1,199 1,094 1,038 924 85S 841 847 743 928 691 717
2. Croms national ma,ing 912 1,142 1.476 1,307 1,203 1,075 918 812 775 726 607 812 541 687
I1.. Capacity to import 1,446 1,591 2,072 1.828 1,774 1,748 1.583 1.177 1.064 1,097 1,025 1,046 994 1,065
2. Terms of trade adjust_nt 111 167 580 318 131 0 (133) (193) (158) (85) (193) (3) (118) (93)
3. Croas domsatic income 6,077 6,575 7,467 7.571 7,725 7,879 7,799 7.457 7,299 7.405 7.252 1,454 7.572 7,889
4. Croam natimnal income 5,990 6.489 7,437 7,538 7.694 7,809 7,708 7,359 7.20S 7,261 7,103 7,300 7,447 7,757
(C.at_al lawl) 31-Jan-89
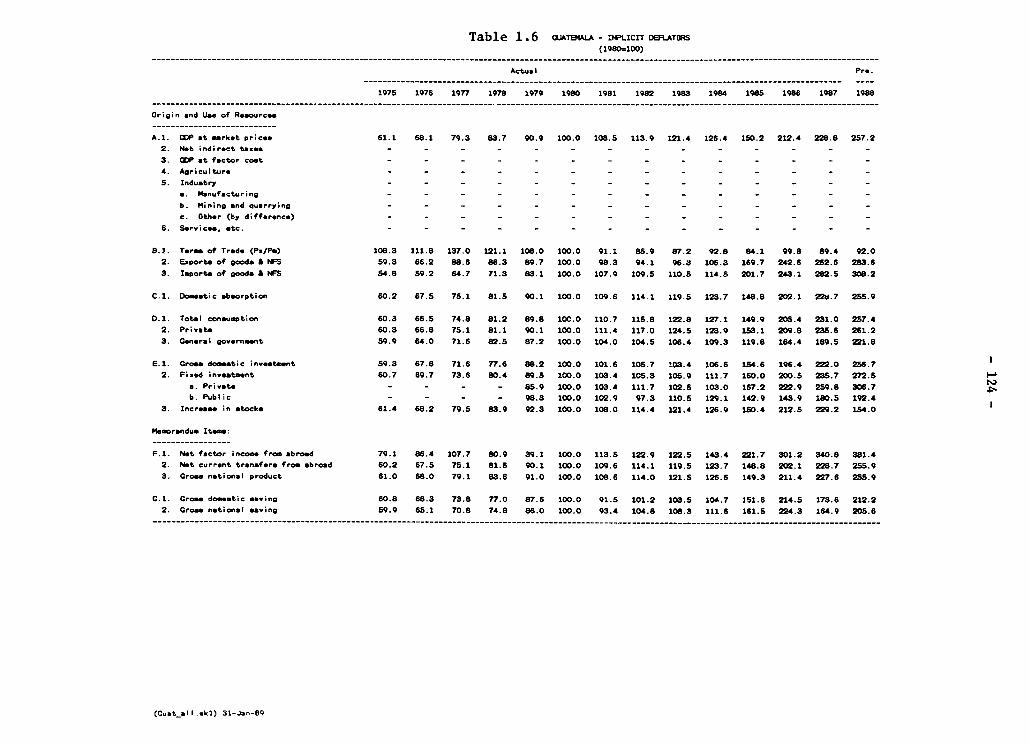
Table 1.6 auAT4mALA - IwPLICIT DaPLATaS(1980=100)
ActuaI Pl.
1975 1978 1977 1978 1979 1980 1981 1982 1983 1984 1985 1988 1987 1988
Origin *nd U-e of Resources
A.1. CDP at market price. 61.1 68.1 79.3 83.7 90.9 100.0 108.5 113.9 121.4 126.4 150.2 212.4 228.8 257.22. Net indirect tes - - - - - - - - - - - - - -
3. CDP at factor cost - - - - - - - - - - - - - -
4. Agriculture - - - - - - - - - - - - - -
5. Industry - - - - - - - - - - - - - -
a. Manufacturing - - - - - - - - - - - - - -
b. Mining and quarrying - - - - - - - - - - - - - -
c. Other (by difference) - - - - - - - - - - - - - -
6. Services, etc. - - - - - - - - - - - - - -
8.1. Terms of Trade (Pa/Pm) 108.3 111.8 137.0 121.1 108.0 100.0 91.1 85.9 87.2 92.8 84.1 99.8 89.4 92.02. Exports of goods A NFS 59.3 66.2 88.6 86.3 89.7 100.0 98.3 94.1 96.3 106.3 169.7 242.6 252.6 283.63. Imports of goode A NFS 54.8 59.2 64.7 71.3 83.1 100.0 107.9 109.5 110.5 114.5 201.7 243.1 282.S 308.2
C.1. Do_eetic absorption 60.2 67.5 75.1 81.5 90.1 100.0 109.6 114.1 119.5 123.7 148.8 202.1 22b.7 255.9
D.1. Total conauaption 60.3 66.5 74.8 81.2 89.8 100.0 110.7 115.8 122.8 127.1 149.9 205.4 231.0 257.42. Private 60.3 66.8 75.1 81.1 90.1 100.0 111.4 117.0 124.5 128.9 153.1 209.8 235.6 261.23. Ceneral go.ernment 59.9 64.0 71.6 82.5 87.2 100.0 104.0 104.5 106.4 109.3 119.8 164.4 189.5 221.8
E.1. Cro"- domestic investment 59.3 67.8 71.6 77.6 88.2 100.0 101.6 105.7 103.4 106.6 154.6 196.4 222.0 256.72. Fixed in.eatsent 60.7 69.7 73.6 80.4 89.5 100.0 103.4 105.3 105.9 111.7 160.0 200.5 235.7 272.5
a. Private - - - - 85.9 100.0 103.4 111.7 102.5 103.0 167.2 222.9 259.8 306.7 Sb. Public - - - - 98.3 100.0 102.9 97.3 110.5 129.1 142.9 143.9 180.5 192.4
3. Increase in stocks 61.4 68.2 79.5 83.9 92.3 100.0 108.0 114.4 121.4 126.9 150.4 212.5 229.2 154.0
Memorandum Itoe:
F.1. Net factor incose from abroad 79.1 86.4 107.7 80.9 39.1 100.0 113.5 1U2.9 122.5 143.4 221.7 301.2 340.8 381.42. Net current transfer* from abroad 60.2 67.5 75.1 81.5 90.1 100.0 109.6 114.1 119.5 123.7 148.8 202.1 228.7 255.93. Cross national product 61.0 68.0 79.1 83.6 91.0 100.0 108.6 114.0 121.5 126.6 149.3 211.4 227.6 255.9
0.1. Cross do_*tic aeving 60.8 68.3 73.8 77.0 87.6 100.0 91.5 101.2 103.5 104.7 251.6 214.5 173.6 212.22. Cross national saving 59.9 65.1 70.8 74.8 86.0 100.0 93.4 104.8 108.3 111.6 161.5 224.3 164.9 205.6
(C.._ 1 1 ..kl) 31-Jan-89
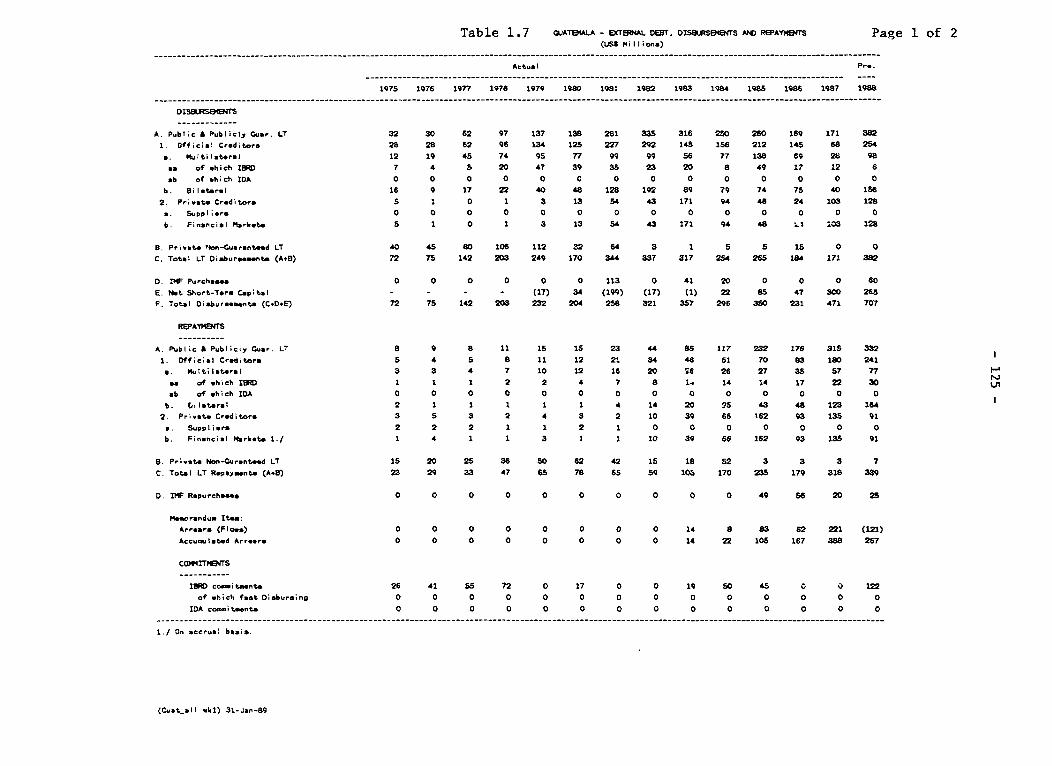
Table 1.7 CUATItALa - EXTgAL DEST, DISlMSBItNTS AND PEPAY4TS Page 1 of 2(US$ P4i II ion)
Actual P,-
1975 1976 1977 1978 1979 1980 1981 1982 1983 1984 1985 1988 1987 1988
DIS BtJiMEW_
A. Public & Publicly G.&,. LT 32 30 62 97 137 138 281 335 316 250 260 169 171 382
1. Official Coditor, 28 28 62 96 134 125 227 292 145 156 212 145 68 254
S. multilateral 12 19 45 74 95 77 99 99 56 77 138 69 28 98
as of which BRO 7 4 5 20 47 39 35 23 20 8 49 17 12 a
*b of ahich IDA 0 0 0 0 0 0 0 0 0 0 0 0 0 0
b. Bilateral 16 9 17 22 40 48 128 192 89 79 74 75 40 1S6
2. P,i,ate Ceditors 5 1 0 1 3 13 54 43 171 94 48 24 103 128
*. SuppIie*. 0 0 0 0 0 0 0 0 0 0 0 0 0 0
b. Financial Matk-t- 5 1 0 1 3 13 S4 43 171 94 48 i. ;03 128
D. P,ivate ion-C.uarantood LT 40 45 80 106 112 32 64 3 1 5 5 is 0 0
C. Total LT Diab.roo-.nt (A.8) 72 75 142 203 249 170 344 337 317 254 265 184 171 382
D. IW Purchase* 0 0 0 0 0 0 113 0 41 20 0 0 0 60
E. Nat Sho,t-Term Capitol - - - - (17) 34 (199) (17) (1) 22 8S 47 300 265
F. Total Diab.raee_nts (C.D.E) 72 75 142 203 232 204 258 321 357 296 350 231 471 707
REPAYMSJ
A. Public & Publicly Gusr LT 8 9 8 11 15 15 23 44 88 117 232 176 315 332
1. Official Creditors 5 4 5 8 11 12 21 34 46 51 70 83 18O 241
a aultilateral 3 3 4 7 10 12 16 20 26 26 27 35 57 77
as o wh i ch lBR 1 1 1 2 2 4 7 8 1. 14 14 17 22 30
ab of wh i ch DA 0 0 0 0 0 0 0 0 0 0 0 0 0 0
b. L latoral 2 1 1 1 1 1 4 14 20 25 43 48 123 164
2. P,ivat Creditors 3 5 3 2 4 3 2 10 39 66 162 93 135 91
a. Supplier& 2 2 2 1 1 2 1 0 0 0 0 0 0 0
b. Financial Markets 14I 1 4 1 1 3 1 1 10 39 66 162 93 135 91
S. Pri;ate Non-Cu,anteed LT 1S 20 25 36 SO 62 42 15 18 52 3 3 3 7
C. Total LT R.may.nts (A-B) 23 29 33 47 65 76 65 59 103 170 235 179 318 339
0.D I Repurchaa 0 0 0 0 0 0 0 0 0 0 49 56 20 25
Mast,andum Item:
Arrear (Flo.a) 0 0 0 0 0 0 0 0 14 8 83 62 221 (121)
Accumulatod Arrmrs 0 0 0 0 0 0 0 0 14 22 105 167 388 267
COMM4TMENTS
lBR1D co.ni taa nto 26 41 55 72 0 17 0 0 19 SO 45 0 0 122
of which fastODabu,aing 0 0 0 0 0 0 0 0 0 0 0 0 0 0
IDA cosi,tsent 0 0 0 0 0 0 0 0 0 0 0 0 0 0
1./ On accrual basis.
(Cust all *ki) 31-Jan-89
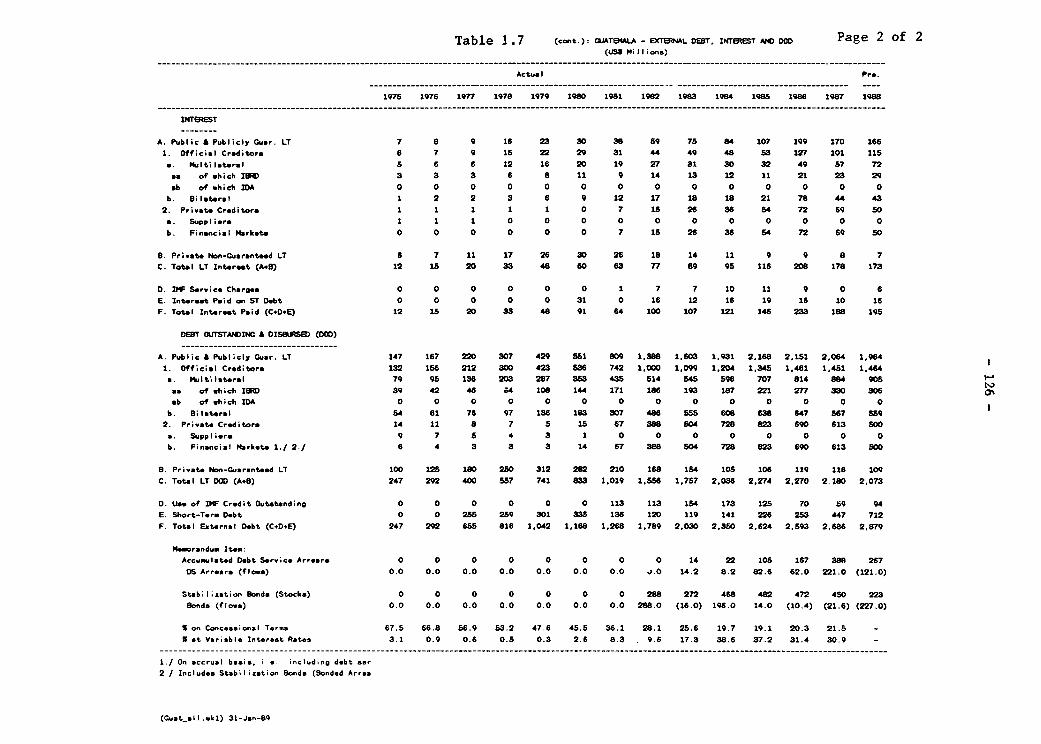
Table 1 .7 (cont): GUATEMALA - ECTE8RNAL DEBT INTBERST AG DM Page 2 of 2
Act.u I Pe..
1975 1976 1977 1978 1979 1980 1981 1982 1983 1984 1985 1Q8" 1987 1988
INTERST
A. Public A Publicly Cuar. LT 7 8 9 16 23 30 38 59 75 84 107 199 170 166
1. Official Creditors 6 7 9 15 22 29 31 4 49 48 53 127 101 115
D. Mtultilateral a 6 6 12 16 20 19 27 31 30 32 49 57 72na of which IFI 3 3 3 6 8 11 9 14 13 12 11 21 23 29
ab of which IDA 0 0 0 0 0 0 0 0 0 0 0 0 0 0
b. Bilateral 1 2 2 3 6 9 12 17 18 18 21 78 44 43
2. Pri.at. Creditora 1 1 1 1 1 0 7 15 26 38 54 72 69 s0
a. Supplier. 1 1 1 0 0 0 0 0 0 0 0 0 0 0
b. Financial Markets 0 0 0 0 0 0 7 15 26 36 54 72 69 so
B. Pri.ate Non-Guaranteed LT 6 7 11 17 26 30 26 18 14 11 9 9 8 7
C. Total LT Interest (A.8) 12 15 20 33 48 60 63 77 89 95 116 208 178 173
D. IW Sor,ice Charges 0 0 0 0 0 0 1 7 7 10 11 9 0 6
E. Intereat Paid on ST Debt 0 0 0 0 0 31 0 16 12 16 19 16 10 16
F. Total Interest Paid (C.O.E) 12 15 20 33 48 91 64 100 107 121 146 233 186 195
DEBrT OUrrSTAQDIC A DISRtSED (DOD)
A. Public & Publicly Cuar. LT 147 167 220 307 429 651 809 1.388 1.603 1.931 2.188 2.151 2.064 1.964
1. Official Creditors, 132 156 212 300 423 536 742 1,000 1,099 1.204 1.345 1.481 1,451 1.464
a. Mqulti.lateral 79 95 136 203 287 383 435 514 545 596 707 814 884 905
as of wh i ch IUNW 39 42 46 84 108 144 171 186 193 1617 221 277 330 306
ab of which DA 0 0 0 0 0 0 0 0 0 0 0 0 0 0
b. Bilateral 54 61 76 97 136 163 307 466 555 608 638 647 567 559
2. Pri,ate Creditors 14 11 8 7 5 15 67 386 504 728 623 690 613 500
a. Suppliera 9 7 5 4 3 1 0 0 0 0 0 0 0 0
b. Financial MarketelI./ 2./ 6 4 3 3 3 14 67 388 504 728 623 690 613 500
9. P,i,ate Non-Cuaranteed LT 100 12 180 250 312 282 210 168 154 105 108 119 118 109
C. Total LT DOD (A*S) 247 292 400 557 741 833 1.019 1.556 1.757 2,036 2.274 2.270 2,180 2.073
0. Uee of IMF Credit Outstanding 0 0 0 0 0 0 113 113 154 173 125 70 59 94
E. Sh.ort-Term Debt 0 0 255 259 301 333 136 120 119 141 226 253 447 7122
F. Total External Debt (C.D.E) 247 292 655 816 1.042 1.168 1.268 1.789 2.030 2,350 2.624 2.593 2.686 2.879
Memorandum Item:
Accumulated Debt Ser,ico Arrears 0 0 0 0 0 0 0 0 14 22 105 167 388 267
DS Arrears (flows) 0.0 0.0 0.0 0.0 0.0 0.0 0.0 '.O. 14.2 8.2 82.6 62.0 221.0 (121.0)
StabilIization Bond. (stocks) 0 0 0 0 0 0 0 288 272 468 482 472 450 223
Bonds (flows) 0.0 0.0 0.0 0.0 0.0 0.0 0.0 288.0 (16.0) 196.0 14.0 (10.4) (21.6) (227.0)
S on Conceasiomal Ter"s 67.5 66.8 56.9 53.2 47.6 45.5 36.1 28.1 25.6 19.7 19.1 20.3 21.5 -
5 at Variable Interact Rates 3.1 0.9 0.6 0.5 0.3 2.6 8.3 . 9.6 17.3 38.6 37.2 31.4 30.9 -
I./ On accrual basis, i a. includ.ng debt &ar
2 / Includes Stabilization Bonda (Bonded Arres
(Cuat-all..1,i) 31-Jan-89

Table 1.8 WATBIALA - DCTE8NAL TRAME
Act.,. I Pr..
1Q75 1976 1977 1978 1979 1980 1981 1982 1983 1984 1985 1988 1987 1988
EcPcRrS (FOB)-- -- - -- --- -- - -- -- - -- - -- -- - -- - -- -- - -- - -- -- - -- - ---- lil:.ion USI)…-- - - - - - - -- - - - - - - - -
Coffee ................. 168 244 526 476 433 464 296 359 351 366 452 502 355 384
Banana ................. 35 43 43 48 48 83 79 96 61 se 71 73 75 84
Cotton ................. 76 88 155 142 192 166 131 79 46 78 72 24 16 37
Sugar.................. 116 107 85 44 54 69 as 27 127 71 4 6 2 51 74
Other.................. 249 278 353 388 495 738 700 610 807 583 421 393 481 526
TOTAL................... 641 760 1,162 1,098 1,222 1,52 1,291 1,170 1,092 1,132 1,060 1,044 978 1,105
----------------------------- ---- (Volume Index 1980.100)…-- -- ------ ---
Coffee ................. 106 93 103 103 111 100 88 110 107 102 144 97 103 109
Banana ................. 60 76 72 72 67 100 90 117 64 69 82 as 92 90
Cotton .8............... 0 87 105 105 127 100 70 49 28 89 42 23 12 22
Sugar.................. 96 148 144 72 74 100 93 60 210 132 127 172 134 169
Other.................. - - - - - 100 85 80 e1 78 74 67 75 81
TOTAL................... 76 81 87 86 94 100 93 90 so 79 as 70 74 78
D9URTS (CIF)
-- - - - -- - - - - - -- - - - - - - - - - - - --…- - - - - - - - - - - -(Million USt)…-- - - - - - - -- - - - - - - - -
Non Durab lea,.............. - - - - 183 104 106 90 r 86 85 123 184 206 1
Ourablee ................ - - - - 110 241 220 201 1's6 182 152 35 70 81
Inter-mediat ............... - - - - 483 554 588 476 482 508 479 494 672 812
Fuole.................. 105 106 148 1S0 239 340 376 301 255 300 262 94 105 91
Capital A Conetruction......... - - - - 489 359 336 320 175 208 197 213 416 428
TOTAL................... 733 839 1,053 1,286 1,504 1,598 1,674 1,388 1,135 1,279 1,175 959 1,447 1,618
…--------------------------------(Volume Index 1980.100)…-------------
Non Durab lee .............. - - - - - 100 117 112 90 96 107 94 154 143
Durablee ................ - - - - - 100 91 84 71 79 66 42 52 58
Intermediate .............. - - - - - 100 105 87 86 97 90 80 98 113
Fuelse.................. - - - - - 100 99 82 79 94 85 99 76 76
Capital & Construction ......... - - - - - 100 107 90 51 60 57 47 73 73
TOTAL..80................ s 104 113 118 109 100 102 87 73 84 79 69 91 97
TERMS OF TRADE ItNDEX
-- - - - -- -- - - - - - -- - - - - - - -- - - - - - -- - - - --…-- - - - - - -(Price Index 1980=100).-- - - - - - - - - - - -
Nerchendise Export Price Index 55 61 se 84 85 100 91 85 90 95 82 99 87 93
M-rchendime Import Price Index 57 51 se 68 88 100 103 100 98 96 93 87 100 104
Merchandise Terms of Trade Index 96 121 152 123 99 100 88 85 92 99 Ss 114 as 90
(Cuet_vl1I mk1) 31-Jan-89

Table 1 . 9 GUATEMALA - CONSOLIDATED NMN FINANCIAL PUBLIC SECTOR
Actue i Pro.
1975 1976 1977 1978 1979 1980 1981 1982 1983 1984 1985 ,)86 1987 1988
…-…(-------l------------------------------------------------(million Quetzal**)…A. Total Curr-nt Revenue 424 521 725 821 892 963 974 1,012 984 985 1,182 1,751 2,144 2,649
1. Surplus from Public Enterprise. 1./ SO 41 23 31 36 42 37 82 94 103 121 172 145 2332. Tanes end Oth,r Revenue& 389 472 695 776 834 892 891 920 877 866 1,032 1,563 1.892 2.3043. Current Transfera 4 8 8 14 22 30 46 10 13 15 29 16 108 112
8. Total C&rront Expenditure 317 390 479 569 680 790 677 878 878 952 1.036 1,605 1.974 2,3971. Wages and Salaries 252 300 251 329 390 430 494 489 50. 529 585 789 996 1.1692. Coode and Services - - 228 129 155 182 212 190 170 195 208 348 452 4803. Interest Peysnta 24 31 39 sO 57 64 77 100 98 110 110 245 276 4264. Current Transfers 41 59 63 61 78 94 94 99 107 117 133 222 252 322
C. Current Balance 107 131 246 251 212 173 97 134 107 33 146 147 170 252
D. Capital Revnues 1 7 2 5 4 2 9 16 10 6 S 64 90 45E. Capital Expanditures 129 288 324 341 433 525 724 546 413 360 301 314 487 576
1. Fixed Capital Formation 99 162 230 278 373 468 682 S10 386 306 259 297 428 S362. Other Capital Expenditures 30 126 93 63 60 57 42 SD 26 54 42 17 E9 41
C. Overal l Balance (21) (150) (76) (84) (217) (3SO) (618) (396) (297) (322) (150) (103) (227) (279)1. Official Capital Crant* 0 1 1 0 0 0 1 1 1 2 1 0 198 1942. Net Foreign Financing 29 29 60 93 93 94 109 106 124 21 26 68 65 (6)3. Net Doretic Financing (a) 121 15 (8) 123 255 508 288 172 299 123 35 64 1694. Other 0 0 0 (0) (0) (0) 0 (0) (0) 0 (0) 0 (101) (78)
--- (----------------------------------------------------------(as percent of GDP)---------------------------- COA. Total Current Revenue 11.6 11.9 13.2 13.5 12.9 12.2 11.3 11.6 10.9 10.4 10.6 11.1 12.2 12.9
1. Surplus froe Public Enterprises 1./ 0.8 0.9 0.4 0.5 0.5 0.5 0.4 0.9 1.0 1.1 1.1 1.1 0.8 1.12. Taxes and Other Revenue* 10.7 10.8 12.7 12.8 12.1 11.3 10.4 10.D 9.7 9.1 9.2 9.9 10.8 11.33. Current Tranefer, 0.1 0.2 0.1 0.2 0.3 0.4 0.5 0.1 0.1 0.2 0.3 0.1 0.6 0.5
8. Total Current Expenditure 8.7 8.9 8.7 9.4 9.8 10.0 10.2 10.1 9.7 10.1 9.3 10.1 11.2 11.71. Wages end Salaries 6.9 6.9 4.6 5.4 5.6 5.7 5.7 5.6 6.6 5.6 5.2 5.0 5.7 5.72. Coods and Services 0.0 0.0 2.3 2.1 2.3 2.3 2.5 2.2 1.9 2.1 1.9 2.2 2.6 2.33. Interest Peyment- 0.7 0.7 0.7 0.8 0.8 0.8 0.9 1.1 :.1 1.2 1.0 1.5 1.6 2.14. Current Transfers 1.1 1.3 1.1 1.0 1.1 1.2 1.1 1.1 1.2 1.2 1.2 1.4 1.4 1.6
C. Current Balance 2.9 3.0 4.5 4.1 3.1 2.2 1.1 1.5 1.2 0.3 1.3 0.9 1.0 1.2
D. Capital Revenues 0.0 0.2 0.0 0.1 0.1 0.0 0.1 0.2 0.1 0.1 0.0 0.4 0.5 0.2E. Capital Expenditures 3.5 6.6 5.9 5.6 6.3 6.7 8.4 6.3 4.6 3.8 2.7 2.0 2.8 2.8
1. Fixed Capital Foration 2.7 3.7 4.2 4.6 5.4 5.9 7.9 5.9 4.3 3.2 2.3 1.9 2.4 2.62. Other Capital Expenditures 0.8 2.9 1.7 1.0 0.9 0.7 0.5 0.4 0.3 0.6 0.4 0.1 0.3 0.2
C. Overall Balance -0.6 -3.4 -1.4 -1.4 -3.1 -4.4 -7.2 -4.5 -3.3 -3.4 -1.3 -0.6 -1.3 -1.41. Official Capital Crants 0.0 0.0 0.0 0.0 0.0 0.0 0.0 0.0 0.0 0.0 0.0 0.0 1.1 0.92. Net Foreign Financing 0.8 0.7 1.1 1.5 1.4 1.2 1.3 1.2 1.4 0.2 0.2 0.4 0.4 0.03. Net Oocmetic Financing -0.2 2.8 0.3 -0.1 1.8 3.2 5 9 3.3 1.9 3.2 1.1 0.2 0.4 0.84. Other 0.0 0.0 0.0 0.0 0.0 0.0 0.0 0.0 0.0 0.0 0.0 0.0 -0.6 -0.4
1./ Surplus of Public Enterprises excludinginteraet payants eni tranafn rs.
(C.uat_li sk1) 31-Jan-89

Table 1.10 UATBIAL - 4ETARy SUvEv
Actu I Pro.
1975 1976 1977 1978 1979 1980 1981 1982 1983 1984 1985 1986 1987 1988
------------------------ (End of Period Stock. in Million Quot2rlr-)-----------
A. Foreign An"t (Net) 295 504 661 733 700 443 127 72 (222) (460) (334) (224) (305) -
B. Total Net Oosestic Credit 597 669 756 920 1,130 1,609 2.260 2.638 3.010 3,320 3,829 3,560 3,785 -
1. Claie on Government (net) 111 148 87 64 100 339 760 1,061 1,m 1,649 1.703 1,244 981 -
2. Claim on Private Sector 433 504 652 628 999 122 1,388 1.516 1,710 1,907 2.076 2,281 2.751 -
3. Claim on Other Financial Inst. 3 3 3 3 I 29 72 21 44 38 29 16 37 -
4. Other Claims s 13 14 26 17 19 41 39 34 25 21 19 17 -
C. Money 354 494 594 664 735 753 778 787 834 669 1,347 1,608 1,766 -
D. Qusimony 455 5S 656 760 602 940 1.129 1.404 1.321 1,530 1.848 2,267 2.402 -
E. Long Term Foreign Liabilities 37 60 68 79 74 130 255 313 460 544 640 599 600 -
F. Other Liabilities (Not) 46 60 1OO 1SO 220 229 225 205 174 117 (33a) (1,138) (1.287) -
Memorandum Item:
Money plus Qussimoney 809 1,052 1,249 1,424 1,537 1,692 1,907 2,191 2,155 2,399 3,193 3,875 4,16 -
------------------------ (Annual Flows in Million Qutztale)…--------------------- …-
A. Foreign Auot- (NMt) 108 209 157 72 (33) (257) (316) (55) (294) (238) 126 110 (81)
8. Total Met Dometic Credit 70 72 87 164 211 478 651 376 374 509 310 (269) 225
1. Claim on Government (not) (1) 37 (61) (23) s6 239 421 301 162 327 154 (459) (263)
2. Claims on Private Sector 47 71 148 176 171 223 166 128 194 198 169 205 469
S. Claim on Other Financial Inst. (1) 0 0 0 11 14 43 (51) 24 (6) (9) (13) 22
4. Other Claim 25 (36) 0 11 (8) 2 22 (2) (5) (9) (4) (2) (3)
C. Money 48 140 100 70 71 18 25 9 47 36 477 262 157
D. Quasi money 92 103 97 105 43 137 189 275 (83) 208 317 420 136
E. Long Term Foreign Liabilities 29 23 6 11 (5) 56 125 5a 147 84 96 (41) 0
F. Other Liabilitios (Net) 9 14 39 51 69 10 (4) (20) (31) (57) (455) (800) (149)
Memorandum Item:
Money plus Quasisoney 140 243 197 175 114 1SS 214 284 (3Z) 244 794 682 293
(Guasta... I ski) 31-Jan-89

- 130 -
Table 1.11 CA.TMswA - SETED ECWiIC INDICATORS
Actual Pro.
1976 1976 1977 1976 1979 1980 1981 1982 1988 1984 1986 1988 1987 1908
ANNUAL CROVTH RATES (in percent):
CDP 1.9 7.4 7.8 6.0 4.7 3.7 0.7 -S.5 -2.6 0.5 -0.6 0.1 3.1 8.6CDP per capits -0.9 4.4 4.6 2.0 1.8 0.8 -2.2 -6.8 -5.8 -2.4 -8.4 -2.6 0.4 0.8
Consumption 8.5 7.0 7.9 8.1 4.7 5.8 1.8 -2.9 -1.8 1.2 -0.6 1.2 3.7 4.0Consumption per capits 0.6 4.0 4.9 2.1 1.8 0.9 -1.2 -8.8 -4.0 -1.6 -8.3 -1.8 0.8 1.1
INVESTMENT-SAVINC (me percent of GDP
Total Inv1stoent 16.1 21.4 20.0 21.6 18.7 16.9 17.0 14.2 11.1 11.6 11.5 10.3 13.8 14.1
Private 12.6 14.8 14.1 18.0 12.6 9.2 8.6 7.9 6.6 7.8 8.0 8.4 ..1.0 11.3Public 3.6 6.6 5.9 6.6 8.3 6.7 8.4 8.3 4.6 3.8 2.7 2.0 2.8 2.8
Domestic Saving 14.3 15.4 18.2 15.8 14.2 13.1 10.6 10.2 9.6 9.4 9.9 11.8 7.3 8.0National Saving 14.6 18.2 19.4 17.3 16.9 13.6 10.4 9.6 8.6 7.6 7.1 9.4 6.9 6.9
Private 11.6 15.2 14.9 13.1 12.8 11.5 9.3 8.0 7.4 7.2 6.8 8.4 4.9 6.7Public 2.9 3.0 4.6 4.1 8.1 2.2 1.1 1.6 1.2 0.3 1.8 0.9 1.0 1.2
Foreign Saving 1.6 8.2 0.7 4.3 2.8 2.2 6.7 4.6 2.6 4.1 4.4 1.0 7.9 7.2
NON-FINANCIAL PUBLIC SECTOR (am perc
Current Rovenums 11.6 11.9 13.2 13.5 12.9 12.2 11.3 11.8 10.9 10.4 10.6 11.1 12.2 12.9Current Expenditurme 8.7 8.9 8.7 9.4 9.8 10.0 10.2 10.1 9.7 10.1 9.8 10.1 11.2 11.7
Current Balance 2.9 8.0 4.6 4.1 3.1 2.2 1.1 1.8 1.2 0.8 1.3 0.9 1.0 1.2
Capital Revenues 0.0 0.2 0.0 0.1 0.1 0.0 0.1 0.2 0.1 0.1 0.0 0.4 0.5 0.2
Capital Expenditures 3.6 6.6 6.9 6.6 6.8 6.7 8.4 6.3 4.6 8.8 2.7 2.0 2.8 2.8Overall Balance -0.8 -3.4 -1.4 -1.4 -3.1 -4.4 -7.2 -4.6 -8.8 -8.4 -1.8 -0.6 -1.8 -1.4
Domestic Financing, Net -0.2 2.8 0.3 -0.1 1.8 8.2 6.9 8.8 1.9 8.2 1.1 0.2 0.4 0.8External Financing, Nat 0.8 0.7 1.1 1.6 1.4 1.2 1.8 1.2 1.4 0.2 0.2 0.4 0.4 0.0
Foreign Crants 0.0 0.0 0.0 0.0 0.0 0.0 0.0 0.0 0.0 0.0 0.0 0.0 1.1 0.9Other Net 0.0 0.0 0.0 0.0 0.0 0.0 0.0 0.0 0.0 0.0 0.0 0.0 -0.6 -0.4
Foreign Exchange Losses - - - - - - - - - 0.7 4.6 1.9 2.0 -
BALANCE OF PAYMENTS:
Exports of 8WS real groeth rate 8.8 6.6 6.2 -0.1 8.8 6.4 -14.4 -8.5 -10.9 -8.2 8.1 -14.0 6.0 4.2
Imports of GiFS real growth rate -5.0 29.8 9.3 4.4 -7.4 -8.6 -4.1 -21.0 -19.9 7.2 -12.8 -14.7 47.1 5.4Resource Balmnce/0DP (L) -2.1 -5.8 -1.8 -6.0 -4.8 -2.7 -6.6 -8.9 -1.6 -2.1 -1.0 1.6 -6.5 -6.1Current Account Balance/0DP (2) -1.8 -1.8 -0.6 -4.4 -8.0 -2.2 -6.7 -4.6 -2.5 -4.0 -2.7 -0.6 -7.9 -7.2Terms o# Trade Index (1980=100) 108.8 111.8 187.0 121.1 108.0 100.0 91.1 83.9 87.2 92.8 84.1 99.8 89. 4 92.0
EXTERNAL DE0T:
MLT DOD (US1 million) 247 292 400 667 741 888 1,182 1.669 1,926 2,232 2,604 2,607 2,627 2,434
MLT DOD/CDP (6) 6.8 6.7 7.8 9.2 10.7 10.6 18.1 19.1 21.3 28.6 26.8 34.1 36.9 30.9MLT Debt Service (5) 4.4 4.4 3.9 8.8 7.8 7.6 8.4 10.8 16.9 21.0 29.5 32.4 42.5 39.1HLT Interest/Exports. GAS (5) 1.6 1.5 1.5 2.4 8.1 3.3 4.2 6.9 7.4 7.6 9.7 17.4 15.2 13.2KLT Interost/CDP (7) 0.3 0.3 0.4 0.6 0.7 0.8 0.7 0.9 1.0 1.0 1.2 2.9 2.5 2.2
PRICES AND WAaES:
Consumer Prics Index (1980=100) 60.2 66.6 74.8 81.0 90.2 100.0 111.4 111.8 116.8 120.8 143.4 196.4 211.0 234.6Real Effective Exchange Rate (198 - - - - - 100.0 106.0 112.3 120.9 118.2 77.4 82.7 80.9 86.5Real Wags Index (1980=100) - - - - - 100.0 117.7 124.8 126.8 114.9 99.2 81.0 - -
MONETARY SLPVEY (Annual percentege c
Foreign Assets (Not) 67.6 71.0 81.2 10.9 -4.4 -86.7 -71.3 -43.1 -406.9 107.6 -27.3 -3s.0 36.2 -
Total Nat Domestic Credit 13.4 12.0 18.0 21.7 22.9 42.3 40.5 16.7 14.2 16.9 8.8 -7.0 6.3 -
Claims on Government (not) -1.1 32.8 -41.4 -26.4 56.4 240.0 124.5 39.8 16.2 28.8 9.9 -27.0 -21.1 -
Claims on 'rivate Sector 12.1 16.4 29.8 26.9 20.7 22.3 13.5 9.2 12.8 11.6 8.9 9.9 20.6 -
Claims on Other Financial Inst. -16.2 6.6 0.0 3.0 885.3 95.8 147.4 -70.9 118.0 -14.2 -28.7 -46.6 136.7 -
Money 15.8 89.6 20.8 11.8 10.7 2.4 3.3 1.1 6.0 4.3 64.9 19.5 9.8 -
Quasimoney 25.4 22.7 17.4 16.0 8.6 17.1 20.1 24.4 -6.9 16.8 20.7 22.8 6.0 -
Lone Term Foreign Liabilities 385.8 68.0 12.9 15.4 -6.0 76.8 96.2 22.8 47.0 18.2 17.7 -6.4 0.0 -
Other Liabilities (Net) 26.1 80.7 64.5 60.9 46.2 4.6 -1.8 -9.1 -16.2 -32.6 -888.8 236.8 13.1 -
(Cuat_ 1 e.wk1) 31-Jan-89

- 131 -
Table 1.12 Non Finenciul Public Sector, lqt9
…-- - - - - - - - - - - - - - - - - - - - - - - - - - - - -- - - - - - - - - - - - - - - - - - - - - - - - - - - - - -Pro. Projected Pro. Projected
1988 1989 1990 1991 1988 1989 1990 1991
I-----(million Quetzaelee)…----- 1(ae I of current Q8P)-J
CENTRAL GOVERNMET:
I. Current Revenues 2,018 2,261 2,418 2,682 10.1 9.8 9.4 9.1
A. Tons* 1,803 1,957 2,075 2,274 8.8 8.5 8.0 7.8
1. Direct 447 55u 618 891 2.2 2.4 2.4 2.4
2. IndIrect 1,386 1.404 1,457 1.583 6.6 6.1 5.6 5 4
a. VAT 494 548 608 676 2.4 2.4 2,41 2.3
b. International Trade 489 476 425 429 2.4 2.1 1,8 1.5
c. other Indirect 373 381 424 475 1.8 1.7 1.6 1.6
B. Oth~er Non Tex Revenue 122 164 185 209 0.6 0.7 0.7 0.7
C. Current Tranefere 142 139 158 l7V 0.7 0.6 0.6 0.6
11. Current Expenditurese 2.082 2,461 2,739 3,045 10.2 10.7 10.6 10.4
A. Consumetiton 1,263 1,441 1,602 1,784 6.2 6.3 6.2 6.
8. Interest, Payment. 305 408 4.9 485 1.5 1.8 1.7 1.7
C. Current Transfer& 514 612 688 776 2.5 2.7 2.7 2.7
111. Current Account (14) (200) (321) (383) -0.1 -0.9 -1.2 -1.3
IV. Cepitaf Revenues 0 0 0 0 0.0 0.0 0.0 0.0
V. capital FExpenditurse 486 811 750 782 2.4 3.5 2.9 2.7
VI. Overall Balence (Deficit) (501) (1.011) (1.071) (1,165) -2.4 -4.4 -4.1 -4.0
A. Orents 194 219 229 229 0.9 1.0 0.9 0.8
8. Net. Esternel Flnenciong 1.1 21 383 275 292 0.1 1.7 1.1 1.0
C. Net Domestic Financing 177 6l 68 77 0.9 0.3 0.3 0.3
0. Other 109 349 499 587 0.5 1.5 1.9 1.9
NON4 FINANCIAL. PUBLIC SeCTOR (CONSOLIDATED)
I. Current Revenues 2,649 8,019 3,198 3.564 12.9 13.1 12.4 12.2
A. Operating Surplue of Public
Enterprises (etc. in. A t oen.) 233 846 326 400 1.1 1.5 1.3 1.4
B. Te..* 1.849 1,997 2.116 2.317 9.0 8.7 8.2 7.9
C. Other Non To. Revenue 455 546 612 6e8 2.2 2.4 2.4 2.4
0. Current Transfer* 112 130 143 159 0.5 0.6 0.6 0.5
II. Current Eupendituren 2,397 2,882 3,214 3,568 11.7 12.5 12.4 12.2
A. Consumption 1,649 1.863 2.062 2.285 8.1 8.1 8.0 7.8
S. Interest Payments 426 517 574 632 2.1 2 3 2.2 2.2
C. Current Trenefe,e 322 502 579 652 1.6 2.2 2 2 2 2
III. Current Account 252 136 (16) (5) 1 2 0 6 -0 1 0 0
TV. Capitol Re.enuee 45 30 30 30 0.2 0 1 0 1 0 1
V Capital EuPenditures 576 1.023 1,216 1.331 2.8 4 4 4 7 4 6
VI. Overall Balance (Deficit) (279) (857) (1.202) (1.306) -1.4 -3.7 -4 7 -4 5
A. Grant. 194 219 229 229 0.9 1 0 0.9 0.8
B. Net E.uternel Financing I./ (6) 392 4.53 543 0.0 1.7 1.8 1.9
C. Not Domneetic Financing 169 60 67 77 0.8 0.3 0.3 0.3
0. Other (78) 186 453 457 ..0.4 0.8 1.8 1.6
J./ Include. balance of paymento nupport.
Source: Ministry of Finance o., orld Bank estimate..
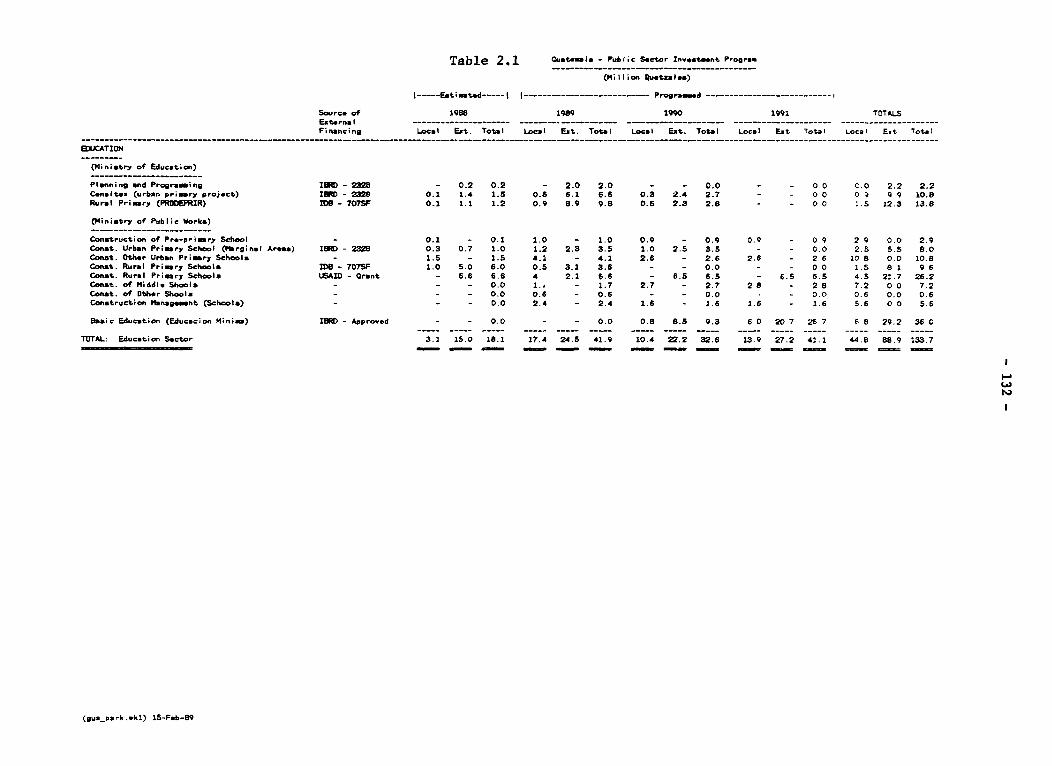
Table 2.1 Cuattoals - Public Sector Invu-at_nt Progrvm
(Million Qustzalea)
l…Eatimtd-----I I------------------------ Programed ---------------------------
Sourc. of 1988 1989 1990 1991 TOTALSExternal -------------------- ------- ----------- --------------------- ---------------------Financing Local Eat. Total Local Eat. Total Local Ext. Total Local Eat Total Local E.t T
otalEDUCATIONt
(Ministry of Education)____________________
Planning and Programing IBM - 2328 - 0.2 0.2 - 2.0 2.0 - - 0.0 - - 0.0 C.0 2.2 2.2Cenalte. (urban pri_mry project) Ilo - 2228 0.1 1.4 1.5 0.5 6.1 6.6 0.3 2.4 2.7 - - 0 0 0 a 9 9 10.8Rural Pri_mry (PRODMERIR) IOB - 707SF 0.1 1.1 1.2 0.9 8.9 9.8 0.5 2.3 2.8 - - 0 0 1.5 12.3 13.8(Miniatry of Public Works)______________________
Construction of Pro-primry School - 0.1 - 0.1 1.0 - 1.0 0.9 - 0.9 0.9 - 0 9 2 9 0.0 2.9Const. Urban Primry School (Vorginal Aras) I8RD - 2328 0.3 0.7 1.0 1.2 2.3 3.5 1.0 2.5 3.5 - - 0.0 2.5 5.5 8.0Const. Other Urban Primry Schools - 1.5 - 1.5 4.1 - 4.1 2.6 - 2.6 2.6 - 2 6 10 8 0.0 10.8Conat. Rural Primry Schools MO8- 707SF 1.0 5.0 6.0 0.5 3.1 3.6 - - 0.0 - - 0 0 1.5 8a1 9 6Const. Rural Primry Schools USAID - Crnt - 6.6 6.6 4 2.1 6.6 - 6.5 6.5 - 6.5 6.5 4.5 21.7 26.2Conat. of Middle Shool- - - - 0.0 1., - 1.7 2.7 - 2.7 2 8 - 2 8 7.2 0 0 7.2Const. of Other Shools - - - 0.0 0.6 - 0.6 - - 0.0 * - 0.0 0.6 0.0 0.6Construction Management (Schools) - _ _ 0.0 2.4 - 2.4 1.6 - 1.6 1.6 - 1.6 5.6 0 0 5.6%saic Education (Educacion Minim) 1BM - Appro-ed - - 0.0 - - 0.0 0.8 8.5 9.3 6 0 20 7 26 7 6 8 29.2 36 0
TOTAL: Education Sector 3.2 15.0 18.1 17.4 24.5 41.9 10.4 22.2 32.6 13.9 27.2 41.1 44.8 t8.9 133.7
(gua.Park skI) 15-Feb-89

Table 2.2 Cuat-'la - P .'ic sector I.et-. Progra.
(94 i ;or, QuetzalIaa)
I----Eatiatad --- II--------------- Programmed-------------- I
Sour,ce of 1986 1989 1990 1992 TOTAL-S
E.te-,al -- …--…-----…--- - - - -- - - - - - - - ---- -- - - - - - -- - - - - - -- - -- -
Financing Local Ext. 7otal Local Eat. Total Local Eaxt. Total LocalI Eat 'tota'I LoaI Eat Total
HEALTH
(Ministry of Health)
EQuipping of Health Cent.ers and Post. - .8 - 1.8 3.6 - 3.6 3.7 - 3.7 3.9 - 3.9 13.0 0.0 13.0
Immni.zation and Infant Sur"ival USAID - Grant - 7.0 7.0 - 8.3 8.3r - 8.5 8.8 - 9.0 9.0 0.0 33.0 33.0
Expansion of Rural Primery Cars Italy - Proposed - - 0.0 - - 0.0 - 11.0 11.0 - 11.0 11.0 0 0 22.0 22.0
Health Education ISAZD - Proposed - - 0.0 - - 0.0 - 3.0 3.0 - 3.0 3.0 0.0 6.0 8.0
Hespital Equipment (Rcieasvelt) France - 1.2 1.2 - - 0.0 - - 0.0 - - 0 0 0.0 1.2 1.2
Hospital Equpjpesnt (Quezaltenango) France - 13.8 15.8 - 8.2 8.2 - - 0.0 - - 0.0 1- 0 24.0 24.0
(Ministry of Public Vorks-kWEPSA)
Conatruction and ftintemanca of M.ospitals MO8 - 623SF 6.6 11.9 18.5 6.7 29.4 36.1 - - 0.0 - - 0.0 13.3 41.3 54.6
Conatruction and He1intanance, of Hoapitals USAI0-Crant-Propo.ed - - 0.0 - 4.2 4.1 - - 0.0 - - 0.0 0.0 4.1 4.1
Conatruction of flinics and Haalth Poste MD6 - 623SF 0.7 3.4 4.1 1.4 5.4 6.8 - - 0.0 - - 0.0 2.1 8.8 10.9
Conatruction of Clinics and Health posts LESAID-Crant-Propcoad - - 0.0 - 1.2 1.2 - - 0.0 - - 0.0 0.0 1.2 1.2
Specialized Medical Care - 0.2 - 0.2 - - 0.0 - - 0.0 - - 0 0 0.2 0.0 0.2
Supervision and 041nalgesent of Construction - 1.9 - 1.9 1.0 - 1.0 - - 0.0 - - 0 0 2.9 0.0 2.9
(General Di recterate-#OPT)
ARepair and Eapansion of Mospitals - 0.3 - 0.3 0.2 - 0.2 0.5 - 0.5 0.5 - 0.5 1.5 0.0 1.5
Repair Regional Hoepitel de Langerud - 0.1 - 0.1 - - 0.0 - - 0.0 - - 0.0 0.1 0.0 0.1
Reconetruction Reh~abilitation Certer - 0.3 - 0.3 0.3 - 0.3 - - 0.0 - - 0.0 0.6 0.0 0.6
Ccnat. and Repair Health Centers & posts USAID - rant 1.1 1.6 2.7 3.1 - 3.1 2.7 2.7 2.7 2.7 9 6 1.6 11.2
Construction and Repair of Health Facilities - 1.3.1 - 13.1 10.0 - 10.0 10.0 - 10.0 10.0 - 10.0 43.1 0.0 4.3.1
TOYTAL: Healtill Swctor 26.1 40.9 67.0 26.3 56.8 83.1 16.9 22.5 39.4 17.1 23.0 40.1 86 4 143.2 229.6
(gua._park .wkI) 13-Feb-89
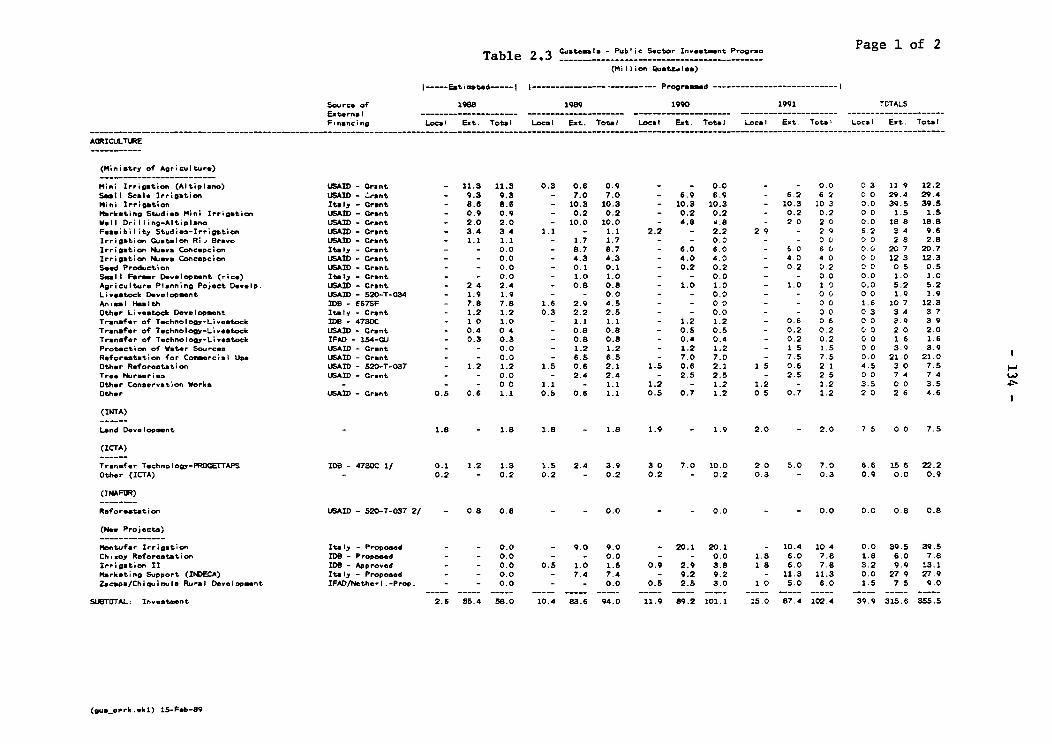
Quaem Ia -Pu Ii cSeto I.esmet Poq..Page 1 of 2Table 2*3 -u-t-ala---Pub!----- Seto Invest--e-t Program-
(MillI i on QuatzelIes)
I-Estimated-I I … - … -------- ~~Programe,d-------------- I
Source of 1988 1989 1990 1991 TOTALSExternal……-- - - - - - -- - - - - - - - - -- - - - - - - - ----- - - - - - - - - - - - - - - - - - - - - -
Financing Local Ext. Total Local Eat. Total Local Ext. Total Local Ext. Total Local Ext. Total
AORICULTLRtE
(Ministry of Agriculture)
Mini Irrigation (Altiplano) USAID - Grant - 11.3 11.3 0.3 0.6 0.9 - - 0.0 - - 0.0 0 3 11 9 12.2Sal I Scale Irrigation USAID - Zrant - 9.3 9.3 - 7.0 7.0 - 6.9 6.9 - 6.2 6 2 0 0 29.4 29.4Mini Irrigation Italy - Grant - 8.6 8.6 - 10.3 10.3 - 10.3 10.3 - 10.3 10 3 0.0 39.5 39.5Marketing Studies Mini Irrigation USArD - Grant - 0.9 0.9 - 0.2 0.2 - 0.2 0.2 - 0.2 0.2 0 0 1.5 1.5Well Drilling-Altiplano USAID - Grant - 2.0 2.0 - 10.0 10.0 - 4.8 4.8 - 2 0 2 0 0.0 188 18.8Feasibility Studies-Irrigation USAID - Grant - 3.4 3 4 1.1 - 1.1 2.2 - 2.2 2 9 - 2 9 6.2 3 4 9.6Irrigation Guetalon Ri, Bravo LSAID - Grant - 1.2 1.1 - 1.7 1.7 - - 0.0 - - 0c0 0 0 2 8 2.8Irrigation Nuteva Concepcion Italy - Grant - - 0.0 - 8.7 8.7 - 6.0 6.0 - 6.0 & 0 0.0 20 7 20.7Irrigation Nueva Concepcion ISAID - Grant - - 0.0 - 4.3 4.3 - 4.0 4.0 - 4.0 4 0 0 0 12 3 12.3Seed Production USAID - Grant - - 0.0 - 0.1 0.1 - 0.2 0.2 - 0.2 0.2 0 0 0 5 0.5Sel P1 arser Davelopsent (rice) Italy - Grant - - 0.0 - 1.0 1.0 - - 0.0 - - 0.0 0.0 1.0 1.0Agriculture Planning Posect Develp. LJSAID -CGrant - 2 4 2.4 - 0.8 0.8 - 1.0 1.0 - 1.0 1 0 0.0 5.2 5.2Livestock D-eveopeent USAID - 520-T-034 - 1.9 1.9 - - 0.0 - - 0.0 - - 0 0 0 0 1.9 1.9An.esl Healtht IDS -E67SF - 7.8 7.8 1.6 2.9 4.5 - - 0 0 - - 0 0 1.6 10 7 12.3Other Livestock Development Italy - Grant - 1.2 1.2 0.3 2.2 2.5 - - 0.0 - - 0 0 0 3 3 4 3 7Transfer of Technology-Livestock IDB - 4730C - 1 0 1.0 - 1.1 1.1 - 1.2 1.2 - 0.8 0 6 0 0 3.9 3 9Transfer of Technology-Livestock LISAID - Grant - 0.4 0 4 - 0.8 0.8 - 0.5 0.5 - 0.2 0.2 0i 0 2 0 2.0Transfer of Technology-Livestock IPFAD 154-0.) - 0.3 0.3 - 0.8 0.8 - 0.4 0.4 - 0.2 0.2 0 0 1 6 1.6Protection of Water Scurcam UISAID - Gran,t - - 0.0 - 1.2 1.2 - 1.2 1.2 - 1 5 1.5 0 0 3.9 3.9Reforestation for Commercial Use UISAID - Grant - - 0.0 - 8.5 6.5 - 7.0 7.0 - 7.5 7.5 0.0 21.0 21.0 Other Reforestation USArD - 520-T-037 - 1.2 1.2 1.5 0.6 2.1 1.5 0.6 2.1 1 5 0.6 2 1 4.5 3 0 7.5 -Tree Nurseries USAID -GCrnt - - 0.0 - 2.4 2.4 - 2.5 2.5 - 2.5 2 5 0 0 7 4 7 4 .Other Conservation Works -- - 0 0 1.1 - 1.1 1.2 - 1.2 1.2 - 1.2 3.5 0 0 3.5 DOther USArD - Grant 0.5 0.8 1.1 0.6 0.6 1.1 0.5 0.7 1.2 0 5 0.7 1.2 2 0 2 6 4.6
(INTA)
Land Development - .8 - 1.8 1.8 - 1.8 1.9 - 1.9 2.0 - 2.0 7 5 0 0 7.5
(ICTA)
Trans,lfer Technology-PROGETTAPS 10D 473CC 1/ 0.1 1.2 1.3 1.5 2.4 3.9 3 0 7.0 10.0 2 0 5.0 7.0 6.6 15 6 22.2Other (ICTA)- 0.2 - 0.2 0.2 - 0.2 0.2 - 0.2 0.3 - 0.3 0.9 0.0 0.9
(ItLAFDR)
Reforestation UJSAID - 520-T-037 2/ - 0.8 0.8 - - 0.0 - - 0.0 - - 0.0 0.0 0.8 0.8
(New Projects)
Montufar Irrigation Italy - proposed - - 0.0 - 9.0 9.0 - 20.1 20.1 - 10.4 10 4 0.0 39.5 39.5Chi.oy Reforestation IDB - Proposed - - 0.0 - - 0.0 - - 0.0 1.8 6.0 7.8 1.8 6.0 7.8Irrigation II ID8 - Approved - - 0.0 0.5 1.0 1.5 0.9 2.9 3.8 1 8 6.0 7.8 3.2 9.9 13.1Marketing Support (INDECA) Italy - Proposed - - 0.0 - 7.4 7.4 - 9.2 9.2 - 11.3 11.3 0.0 27 9 27.9lacapa/Chiquinula Rural Developeent IPAD/Netherl.-Prop. - - 0.0 - - 0.0 0.5 2.5 3.0 1 0 5.0 6.0 1.5 7 5 9.0
SLMBTOTAL: Investment 2.6 55.4 58.0 10.4 83.6 94.0 11.9 89.2 101.1 15.0 87.4 102.4 39.9 315.6 385.5
(guprr .wl)15-Feb-89
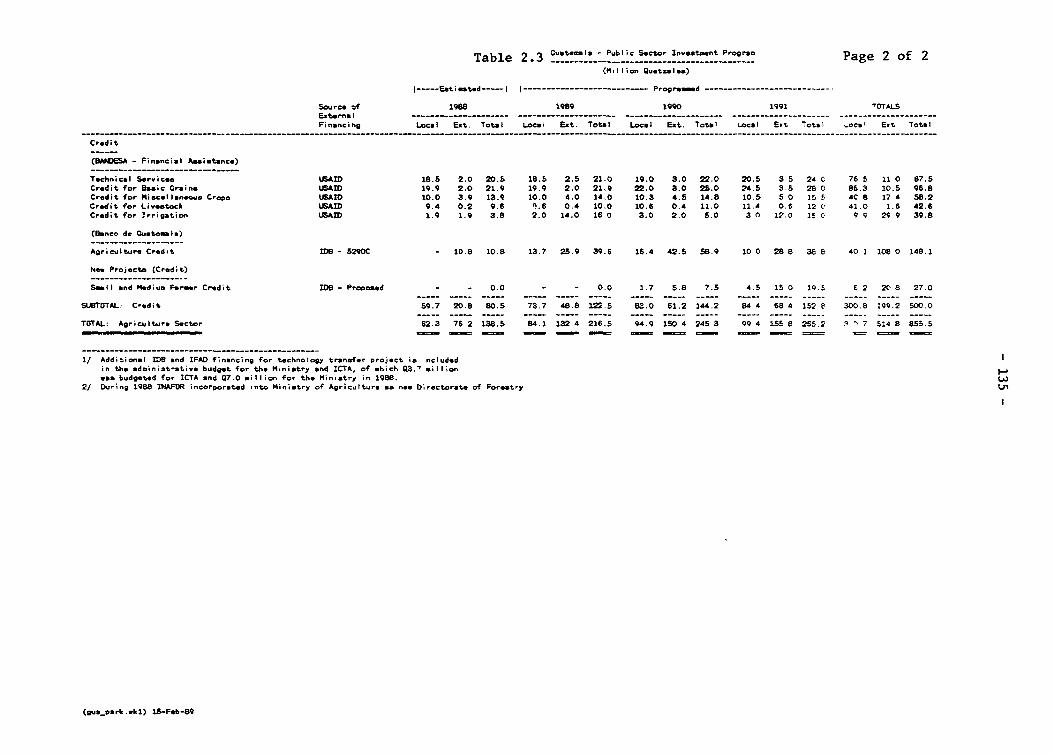
Table 2.3 CuGt a 1- Public Sector lnet.eetnt P,oar Page 2 of 2(., ll; on Quetza l*&)
----- Eatimated--_-_ l l --------------------------- Prograemed -----------------------
Source of 1988 1989 1990 1991 rOTALS
Eat rnsa I _________________Financing Local E.t. Total Local Eat. Total Local Ext.
Total Local E.t Total .Ocai E-t Total
Credit
(7ANDEiA - Financial Assistance)______________________________
Technical Ser,icee USAID 18.5 2.0 20.5 18.5 2.5 21.0 19.0 3.0 22.0 20.5 3 5 24 C 76 5 12 0 87.5
Credit for Basic Grain* USIA 19.9 2.0 21.9 19.9 2.0 21.9 22.0 a.0 25.0 24.5 3.5 28 0 86.3 10.5 96.8
Credit for Miscellaneous Crops USAX 10.0 3.9 13.9 10.0 4.0 14.0 10.3 4.5 14.8 10.5 5 0 15 f1 4C 8 17 4 58.2
Credit for Li,estock LSAID 9.4 0.2 9.6 n.6 0.4 10.0 10.6 0.4 11.0 11.4 0.6 12 C 41.0 1.6 42.6
Credit for Irrigation LSAWD 1.9 1.9 3.8 2.0 14.0 16 0 3.0 2.0 5.0 3 ( 12.0 lf C 9 9 27 9 39.8
(Banco d. Guatem la)
Agriculture Cred.t ID8 - 5290C - 10.8 10.8 13.7 25.9 39.6 16.4 42.5 S8.9 10 0 28 8 38 8 40 1 108 0 148.1
he Projects (Credit)
Small and Medium Farmer Credit ID9 - Proposed - - 0.0 - - 0.0 1.7 5.8 7.5 4.5 15 0 19).S e 2 20 8 27.0
SLUrr0TAL: Credit 59.7 20.8 80.5 73.7 48.8 122.5 83.0 61.2 144.2 84 4 68 4 152 e 300.8 199.2 500.0
TUTAL: Agriculture Sector 62.3 76 2 138.5 84.1 132 4 216.5 94.9 150 4 245 3 99 4 155 8 255.2 7 * 7 514 8 855.5
- - ---- --- --- -- --- --- -- --- --- -- --- --- --
1/ Additional MO8 end IFAD financing for technology transfer project ;a ncluded
in the administ-ati,e budget for the Ministry and ICTA, of *hich Q3.' miilion
was budgeted for ICTA and Q7.0 million for the Min.stry in 1988.
2/ During 1988 INAFOR> incorporated nto Ministry of Agriculture as new Directorate of Forestry. U1
(gum_parkl.kl) 1S-Feb-89
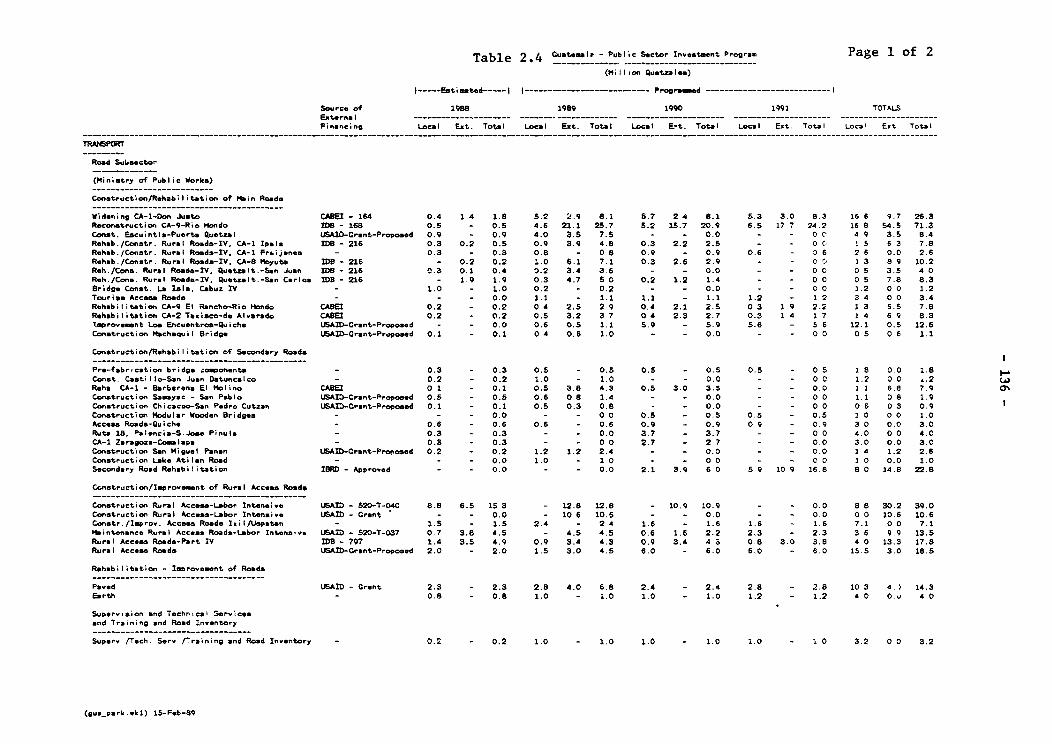
Table 2.4 CuatesalIt - Plublic Sector Investment Program Page 1 of 2(M ilIonm QuetzalIaa)
I---Estimated---- ---------------- Programed -------------- I
Source of 1958 1989 1990 1992 TOTALS
External ------------ …---------------------- ---------- ----------
Financing Local Ext. Total Local Ext. Total Local E-t. Total Local Ext. Total Local E.t Total
Road Sulisector
(Ministry of Public Works)
Construction/Rehabilitation of Main Roads
Wideniing CA-i-Don Juato CADET - 184 0.4 1.4 1.8 5.2 2.9 8.1 5.7 2 4 8.1 5.3 3.0 8.3 16 6 9.7 26.3
Reconstruction CA-9-Ric Hiondo Twe - 168 0.5 - 0.5 4.6 21.1 25.7 5.2 15.7 20.9 6.5 17 7 24.2 16 8 54.5 71.3
Conat. Escuintla-Puerta Quetzal ISAlD-Orant-Proposed 0.9 - 0.9 4.0 3.5 7.5 - - 0.0 - - 0 C' 4 9 3.5 8.4
Rahab./Constr. Rural Roads-Tv. CA-1 Trpals MOB - 216 0.3 0.2 0.5 0.9 3.9 4.8 0.3 2.2 2.5 - - 0 C' I 5 6 3 7.8
Rahab./Constr. Rural Roads-TV. CA-I Prsijanes - 0.3 - 0.5 0.8 - 0 a 0.9 - 0.9 0.6 - 0 6 2 6 0.0 2.6
Rehab./Conatr. Rural Rtoads-TV. CA-S Moyuta MOe - 216 - 0.2 0.2 1.0 6.1 7.1 0.3 2.6 2.9 - - 0 C' 1 3 5 9 10.2
Reh./Cons. Rural Roads-IV, Quetzalt.-San Juan MDB - 216 0.3 0.1 0.4 0.2 3.4 3.6 - - 0.0 - - 0 0 0 5 3.5 4 0
Reb./C-n Rural Roads-TV, Quetxalt.-San Carl"s MSB - 216 - 1.9 1.9 0.3 4.7 5 0 0.2 1.2 1.4 - - 0 0 0 5 7.8 8.3
Bridge Conat. La liss, Cabuz TV - 1.0 - 1.0 0.2 - 0.2 - - 0.0 - - 0 0 1.2 0 0 1.2
Tourism Access Roads - - - 0.0 1.1 - 1.1 1.1 - 1.1 1.2 - 1.2 3 4 0 0 3.4
Rehabilitation CA-9 El Rancho-Rio Hiondo CASE! 0.2 - 0.2 0 4 2.5 2 9 0.4 2.1 2.5 0 3 1 9 2.2 1 3 5.5 7.8
Rehabilitation CA-2 Taxisco-de Alvarado CASBO 0.2 - 0.2 0.5 3.2 3 7 0 4 2.3 2.7 0.3 1 4 1 7 1 4 6 9 8.3
Isprovesant Los Encuentroa-Quiche LGAID-Orant-Prcposed - - 0.0 0.6 0.5 1.1 5.9 - 5.9 5.6 - 5 6 12.1 0.5 12.6
Construction, M.chaquil Bridge USAID-Crant-Proposed 0.1 - 0.1 0 4 0.6 1.0 - - 0.0 - - 0 0 0 5 0 6 1.1
Construction/Rehabilitation of Secondary Roads
Pre-fab-ication bridge ,oinonsnts 0.3 - 0.3 0.5 - 0.5 0.5 - 0.S 0.5 - 0 5 I B 0.0 1.8
Const. Castilo-San Juan Datuncalco- 0.2 - 0.2 1.0 - 1.0 - - 0.0 - - 0 0 1.2 00c *-2
Reha CA-i - Sarberena El Molino CASBO 0 1 - 0.1 0.5 3.8 4.3 0.5 3.0 3.3 - - 0.0 1 1 6.8 7.9 0
Construction Sassyac - San Pablo UJSAD-Crant-Propcsed 0.5 - 0.5 0.6 0.8 1.4 - - 0.0 - - 0 0 1.1 0 8 1.9
Construction, Chicacco-San Pedro Cutzan USAID-Crant-Proposed 0.1 - 0.1 0.5 0.3 0.8 - - 0.0 - - 0 0 0 5 0 3 0.9
Construction Modular Wooden Bridges - - - 0.0 - - 0 0 0.5 - 0.3 0.5 - 0.5 1 0 0 0 1.0
Access Roads-Quiche - 0.6 - 0.6 0.6 - 0.8 0.9 - 0.9 0 9 - 0.9 3 0 0.0 3.0
Ruta 16. Palencis-S.Joee Pinula - 0.3 - 0.3 - - 0.0 3.7 - 3.7 - - 0 0 4.0 0 0 4.0
CA-i Zaragoza-Comsalapa - 0.3 - 0.3 - - 0 0 2.7 - 2 7 - - 0.0 3.0 0.0 3.0
Construction San Miguel Nanan USAIf-Crant-Proposed 0.2 - 0.2 1.2 1.2 2.4 - - 0.0 - - 0.0 1 4 1.2 2.6
Construction Lak. Atiian Road -- - 0.0 1.0 - 1 0 - - 0 0 - - 0 0 1 0 0.0 1.0
Secondary Road Rehabilitati on IBR - Approved - - 0.0 - - 0.0 2.1 3.9 6 0 5 9 10 9 16.8 5 0 14.8 22.8
Co,nstruction/lap rovesent of Rural Access Roads.
Construction Rural Access-Labor Intensive UISArD - 520-T-040 8.8 6.5 15 3 - 12.8 12.8 - 10.9 10.9 - - 0.0 8 5 30.2 39.0
Construction Rural Access-Labor Intensive USAID - Crant- - 0.0 - 10 6 10.5 - - 0.0 - - 0.0 0 0 10.6 10.6
Corxstr.fImpro-. Access Roads Ixil/Uspatan- 1.5 - 1.5 2.4 - 2 4 1.6 - 1.6 1.6 - 1.6 7.1 0 0 7.1
Maintenanca Rural Access Roads-Labor Intensive LEAID - 520-T-037 0.7 3.8 4.5 - 4.5 4.5 0.6 1.6 2.2 2.3 - 2.3 3 6 9.9 13.5
Rural Access Roads-Part TV MS5 - 797 1.4 3.5 4.9 0.9 3.4 4.3 0.9 3.4 4 3, 0.8 3.0 3.8 4 0 13.3 17.3
Rural Access Rdoad UZAID-rant-Propoaed 2.0 - 2.0 1.5 3.0 4.5 6.0 - 6.0 6.0 - 6.0 13.5 3.0 18.5
Rehabilitation - Improvement of Roads
Paved UJSAID - Crant 2.3 - 2.3 2.8 4.0 6.6 2.4 - 2.4 2.8 - 2.8 10 3 4. 1 14.3
Earth~ 0.6 - 0.8 1.0 - 1.0 1.0 - 1.0 1.2 - 1.2 4 0 0.ij 4 0
Supervision and Technical Siervicesand Training and Road Inventory
Supero /Tech. Serv fTraining and Road Inventory - 0.2 - 0.2 1.0 - 1.0 1.0 - 1.0 1.0 - 1 0 3.2 0 0 3.2
(gus_parIk.ski) 15-Feb-89
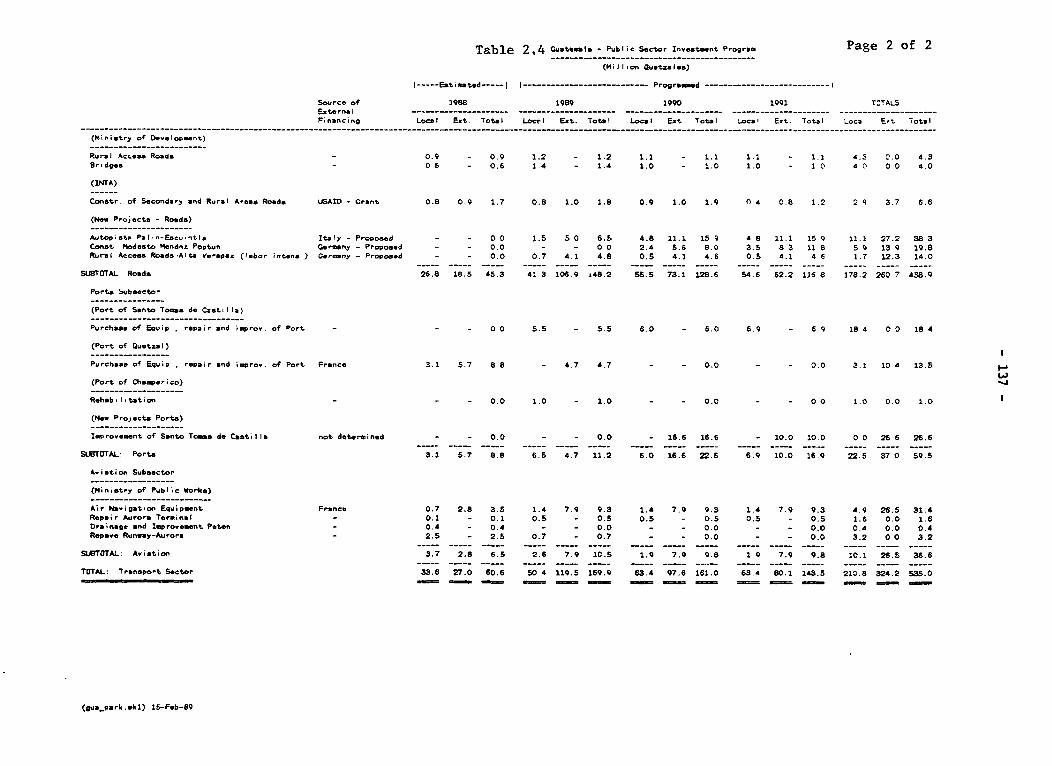
Table 2 . 4 Custemala - Public Sector Inmestment P,og,am, Page 2 of 2(Mi I'mon Qu-ta .-- )
I-----Esteated----- I 1--------------------------- Programmed --------------------------- I
Soure* of 1988 1989 1990 1991 TOTALSEat-rnal…- T__-LSF;nancing Local Ext. Total Locrt Eat. Total Local Eat Total Local E.t. Total Loca Ert
Total
(Miniatry of Doeelop-ent)
Rural Acea Road- - 0.9 - 0.9 1.2 - 1.2 1.1 - 1.1 1.1 - 1.1 4.3 0.0 4.3Br.dges - 06 - 0.6 1.4 - 1.4 1.0 - 1.0 1.0 - I0 4 0 0 0 4.0
(INTA)
Constr. of Secondary and Rural Areas Roads USAID - Crant 0.8 0.9 1.7 0.8 1.0 1.8 0.9 1.0 1.9 ( 4 0.8 1.2 2 9l 3.7 6.6
(Ne- Projsocts - Road-)
Autopist. Pal.n-Escuntla Italy - Proposed - - 0 0 1.5 5 0 6.5 4.8 11.1 15 9 4 8 11.1 15 9 11.1 27.2 38 3Con-t Modesto Mendn± Poptun Germany - Proposed - - 0.0 - - 0 0 2.4 5.6 8.0 3.5 8 3 11 8 5 0 13 9 19.8Rural Acces Road.-Alt. Verapez (labor intens ) Germany - Propoped - - 0.0 0.7 4.1 4.8 0.5 4.1 4.6 0.5 4.1 4 6 1.7 12.3 14.0
SUBTOTAL Road- 26.8 18.5 45.3 41 3 106.9 148.2 5S.S 73.1 128.6 54.6 62.2 116 8 178.2 260 7 438.9
Ports Subesetor
(Port of Santo Tosas de Crst, II a)
Purchase of Equip . repair and impro-. of Port - - - 0 0 5.5 - 5.5 6.0 - 6.0 6.9 - 6 9 18 4 0 0 18 4
(Port of Quetzal)
Purchase of Equip., repair end impro-. of Port France 3.1 5.7 8 8 - 4.7 4.7 - - 0.0 - - 0.0 3.1 10 4 13.5
(Port of Chmper ico)
Rehab.lhtatton _ 0.0 1.0 - 1.0 - - 0.0 - - 0 0 1.0 0.0 1.0 I
(New Projects Ports)
Iapro,oment of Santo Tomes de Casti Il not determined - - 0.0 - - 0.0 - 16.6 16.6 - 10.0 10.0 0 0 26 6 26.6
SUBTOTAL: Ports 3.1 5.7 8.8 6.5 4.7 11.2 6.0 16.6 22.6 6.9 10.0 16.9 22.5 37 0 59.5
A iati on Subeector
(Ministry of Public Works)
Air Nanigat.on Equipment France 0.7 2.8 3.5 1.4 7.9 9.3 1.4 7.9 9.3 1.4 7.9 9.3 4.9 26.5 31.4Repair Aurora Terminal _ 0.2 - 0.1 0.5 _ 0.5 0.5 - 0.5 0.5 - 0.5 1.6 0.0 1.6Drainage and Improosment Peten - 0.4 - 0.4 - - 0.0 - - 0.0 - - 0.0 0. 0.0 0.4Rep,ae Runway-Aurora _ 2.5 - 2.5 0.7 0.7 - - 0.0 - - 0.0 3.2 0 0 3.2
SUBTOTAL: A,iation 3.7 2.8 6.5 2.6 7.9 10.5 1.9 7.9 9.8 1 9 7.9 9.8 10.1 26.5 36.6
TOTAL: Transport Sector 33.6 27.0 60.6 50 4 119.5 169.9 63.4 97.6 161.0 63.4 80.1 143.5 210.8 324.2 535.0
(gu_vpark,wk1) 15-Feb-89

Table 2.5 Gu teastsI - Public Sector In,estworlt lP-ogrvm
(";I 1.mn Qsuetelsa)
I----Estimated----I ------------------- Programmd ----------------- I
Sourc. of i988 1989 1990 1991 TCTALSEaxternal-- - - - - - - - - - -- - - - - - - - - - - - - - - - - - - - -- - - - - - - - - - -- - - - - - - - - -Financing Local Est Total Local Est
Total Local Est. Total Local Est Total Local Est
Tctal
WATER 5lPPLII SerTOR
(Ministry of PabI,c Works)
Xa.ra-Piecays-Stage II US~AW - Crant 7.4 - 7.4 8.6 8.6 7.2 - - 0.0 - - 0.0 11.0 3.6 14.6Othe,e Vote, Suoely/Sanitation USAD - Grant 0.7 - 0.7 1.9 0.3 2.2 1.2 - 2.2 1.2 - 1.2 5.0 0.3 5.3
(Ministry of Health)
MEPAR - Adm.,s.tr*t;om/Teel.;csl Serc.cea MD6 - 719SF 1.2 1.5 2.7 1.5 1.8 3.3 1.8 1.5 3.3 - - 0 0 4.5 4 6 9.3LNEPMR - Co.str.ctio,l Rural Wote, Supply 10B - 719SF 0.3 23.7 24.0 2 7 17.8 20.5 - - 0.0 - - 0 0 3 C' 41 5 44 5LNjPAR - Constructionl Rural Weter Supply USAID - Grant - 1.5 1.5 - 1.9 1.9 - 1.9 1 9 - - 0 0 0 0 5 3 5.3UNEPAR - Rural Water Su,pply Germany - KFW - - 0.0 1 0 4.5 5.5 1.0 7.5 8.5 1.0 7 5 8 S 3 0 19 S 22.5UIEPAR - Rural l.'ate r-Spply, paten MSAID -Grant 0.1 0.5 0.6 0.2 0.7 0.9 0.2 0.7 0.9 0.2 0 7 0 9 0 7 2 6 3.3DSA- Rural Water Supply USAID- 520.-U-033A - 4.6 4 6 - 4.9 4.9 - 0.0 - - 0 0 0 0 9 5 9 5D54A Rural Water Supply UJSAID Crant - 4 6 4 6 - 4 9 4.9 - - 0.0 - - 0 0 0 0 9.5 9.50DSA R.ral Sanatation USAMC 520-U-033A - 0.5 0.5 - 0.5 0.5- 0.8 0.8 - - 0 0 0.0 1 6 1 6DSA- Rural San,tat.on USAID- Grant. - 0.5 0.5 - 1 0 1.0 - 0.6 0.6 - - 0 0 0 0 2 1 2 1
(M,ratry of De.olopeent)
R.ral water Supply 1 7 - 1 7 1.8 - 18 19 - 1 9 2.0 - 2.0 7 4 0 0 7 4Rural Son.tatla. 0.2 - 0.2 0.2 - 0.2 0.3 - 0.3 0.3 - 0.3 1 0 0 0 1 0
.ater SuPPlyfSae.erag -n Sacondory C.t-.a IDS 671SF 1 6 3 8 5 4 1 0 6 5 7.5 1.0 6 5 7.5 - - 0. 68 2
(EWA3JU)
Water Supply Rehab.l,tot,on IBRD 2759 - - 0 0 1.5 5.3 68a 2.9 9.9 1.2.8 3.5 1.2.0 15.5 79Q 27 2 35 1Puap.ng Stat'on Imoronerant CABEI 0 4 2.2 2 6 - - 0.0 - - 0.0 - - 0 0 0 4 2.2 2 6D0lstrbut,on Study France - I18 16a - 1 6 1.8 - - 0.0 - - 0.0 0 0 3.6 3 6
(New Projecto)
Sth Water Supply/Sewerage Sec C.t.es (INFON) IDS - Proposed - 0 0 - - 0 0 1 0 4 0 5.0 10 0 30.0 40.0 11 0 34 0 45 0Well 0rH1-9 (EMPAGUA) leper - P-opoaed - - 0 0 - - 0.0 2.0 6.4 8 4 2.8 8 4 11.2 48P 14 8 19.6Rural Water Supply (US) USAXD - Propoaed- - 0.0 - - 0.0 - 9.0 9.0 - 9.5 9.5 0.0 18.5 16.5Rural Water Sujpply (VNREPAR) 1DB - Proposed - 0.0 - - 0.0 1.0 7.5 8.5 5.0 20.0 25.0 6 0 '27 5 33.5
TOTAL, Water Swpply Sector 13 6 43.0 58 6 15.4 5-k5 70.9 14.3 56.1 70 4 26.0 as81 114.1 69.3 2447 314.0
(gu.._pa,k.wkl) 15-Feb-89

Table 2.6 "Ust""l- - PUbl c S.CtOr I'est"nt Program
(millII on Qu.tzalaa)
l-----Et-td--l 1---I - - Programd -------------------------- 1
SoUrce of 1988 1989 1990 1991 TOTALSEat-rn )… ------- …-----__------ --------------- _---- -------- _- - ---- _____________________F;nanc.nq Local Eat. Total Local Eat Total Locai Et. Total Local E.t Total Local Eat Total
CW9JICATION5
(Ministry of Publ*c WOrks)
4d-rn.zat,on of Telegraph Sste - 1.0 - 1.0 1.3 - 1.3 1.4 - 1.4 1.5 - 2 5 5.2 0.0 5.2Con.t.nct;on Pout and T-legraph Office - 0.3 - 0.3 0.8 - 0.8 0.8 - 0.8 0.8 - 0 8 2.7 0.0 2.7
(CATEL)
SuPer-o;ron and Tech-ncal Ser,-ces - 1.7 - 1.7 6.0 - 6.0 9.0 - 9.0 9.0 - 9 0 25 7 0 0 25.7Expa,.aon of Metrovol' ton TalephoneD8 I8R - 2385 4.2 7.0 11.2 8.e 6.2 14.2 - - 0.0 - - C. 0 12 2 13.2 25 4Eapono.on of Earth Staton - - - 0.0 7.1 - 7.1 - - 0.0 - - O 0 7.1 0 0 7.1E.Punoicr of Data Proces-ing Conte, IM - 2385 - - 0.0 0.1 0.2 0.3 - - 0.0 - - 0 0 0 1 0.2 0.3Rural Telephone Deo-lopment III ID8 - 7O0SF 1 0 4.3 5.3 5.7 18.- 24.0 12.1 12.0 24.1 9.0 10.0 19 0 27 8 44 6 72 4E.pans.on of Req,onol Systes IB - 2385 0 6 3.3 3.9 11 0 8.1 19.1 10.2 8.6 18.8 5.4 3.1 8 5 27.2 23.1 50.3E.Pan.,on of
Tele. Ser,,ce SyPtea I8R - 2385 - - 0.0 1.2 6.4 7.6 - - 0.0 - - 0 0 1.2 6 4 7.6
Expanason of Matrovol .tn System Cwmorc.-I - 10.0 10.0 9.0 10.5 19.5 11.0 19.0 30.0 5.0 5.5 10 5 25.0 45.0 70.0EsPana;on of Reg.onal Telophon.s CoDmc,aI 0.3 9.0 9.3 8 1 8 0 16.1 10.0 - 10.0 5.0 4 9 9 9 23 4 21 9 45.3Other Impro..monts tc Rog.onal\Rural System - - 0.0 1.2 - 1.2 - - 0.0 - - 0 0 I 2 0.0 1.2EaergenCy Worck (CkTEL) - 8 0 - 8.0 8.0 - 8.0 10.0 - 20.0 10.0 - IC 0 36 0 0.0 36 0Othr, ("AT_L) - 0.1 - 0.1 3.9 - 3 9 4.0 - 4.0 5.0 - 5C) 130 0 13.0
(N_ Proj *cto)
Eapa-nion Cuateaola C.ty (50.000 In-e) not det"ra;n.d - - 0.0 _ - 0 7.1 34.0 41.1 10 4 38.7 49.1 17 5 72 7 90.2Rural Telephones - IV IDB - Proposed - 0.0 - 0.0 1.0 2.B 3.8 1.0 2 8 3.8 2 0 S.6 7.6System E.panason (250.000 I nea) not deters-ned - - 0.0 - 0.0 1.8 - 1.8 14.2 57.5 71 7 16 0 57.5 73.5 WInternat.onal Sa-Ce .ot det*,*.n.d - - 0.0 - - 0.0 - 2.1 2.1 - 1.3 1 3 0 0 3 4 3.4
TOTAL. COG Un-t.on. Sector 17.2 33.6 50.8 71.4 57.7 129.1 78 4 78.5 1569. 73 23.8 200.1 243.3 293 6 536.9
(gri_park.wk1) 15-F".-69
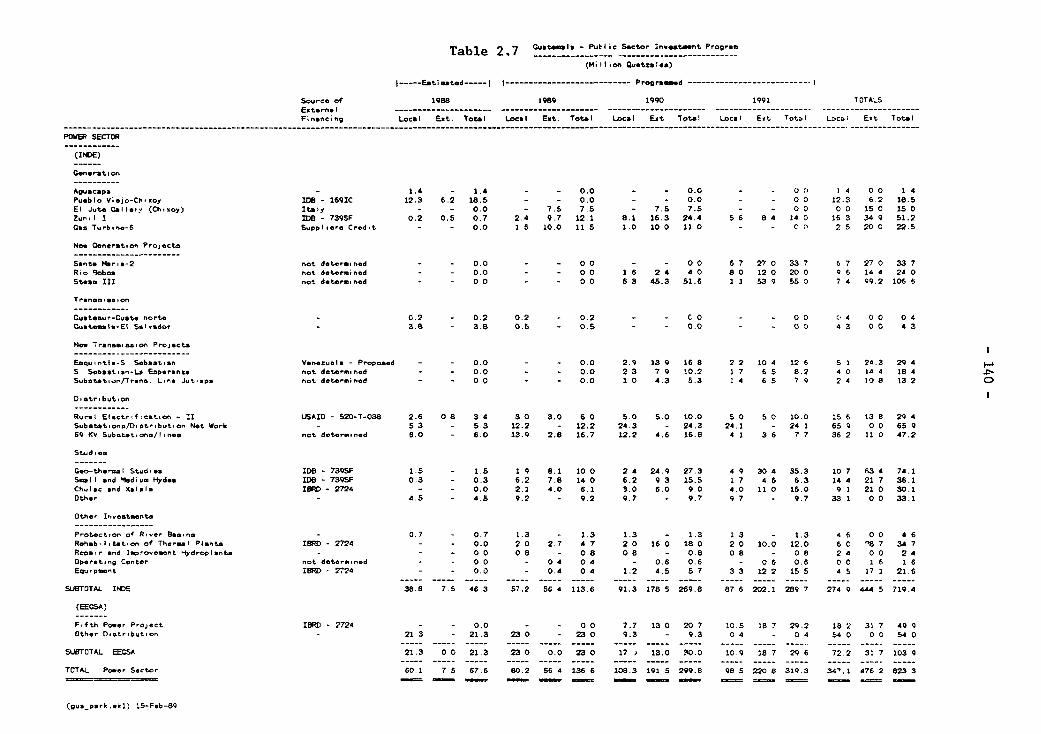
Table 2.7 G-uatml -PbicScorIvstetPrga
(M Ill ion Guetraes11)
Estimated-----------------Prograimeed ---------------
Source of 1988 i989 1990 1991 TOTALSExternal-- - - - - - - - - - -- - - - - - - - - - -- - - - - - - - - - -- - - - - - - - - - -- - - - - - - - - -Financing Local Ext. Total Local Ext. Total Local Ext Total Local Ext Total Local E.t Total
POWER SEaCTO
(INDE)
Goenarat on
Aguacapa 1.4 - 1.4 - - 0.0 - - 0.0 - - 0 1 4 0 0 1 4Pueblo Viajo-Chix,oy IDB l6Q1C 12.3 6.2 18.5 - - 0.0 - - 0.0 - - 0 0 12.3 6.2 18.5El JluteCGallary (Chiinoy) Italy - - 0.0 - 7.5 7.5 - 7.5 7.5- - 0 0 0 0 15 0 130Zunil I IDBe-7395P 0.2 0.5 0.7 2.4 9.7 12.1 8.1 16.3 24.4 5 6 84 14 0 16 3 34 9 51.2(Cam
Turb,ne-6 Suppliers Credit - - 0.0 1 6 10.0 11 S 1.0 10 0 11 0 - - 0 0 2 5 20 0 22.5
Nsa Generation Projecta
Santa Mar,a-2 not determined - - 0.0 - - 0 0 - - 0 0 6 7 27 0 33 7 6 7 27 0 33 7Rio 9oboo notd4etermi.d - - 0.0 - - 0 0 1 6 2 4 4 0 8 0 120 20 0 6 14 4 24 0Steam III not deteraied - - 0 0 - - 0 0 6 3 43.3 31.6 1 1 53 9 55 0 7 4 99.2 106 6
Tr...anm, aon
Guatemur-Guate norte 0.2 - 0.2 0.2 - 0.2 - - CO0 - - 0 0 0 4 0 0 0 4Guatoteml-El sSalnaor 3.8 - 3.8 0.5 - 0.5 - - 0.0 - - 0 0 4 3 0 0 4 3
Niow Transaission Projects
Eaot-intl-S Sebastian Venezuela - Proposed - - 0.0 - - 0.0 2.9 13 9 16 8 2 2 10 4 12 6 S 1 24.3 29 4S Sebastian-La Esparanza not datermied - - 0.0 - - 0.0 2 3 7 9 10.2 1 7 6 5 8.2 4 0 14 4 IS 4 CSubstati-nfr.an. Line Juta.pa not determinmd - - 0 0 - - 0.0 1 0 4.3 5.3 1 4 6 5 7 9 2 4 10 8 13 20
Distribution
Rural Electrification - II USAID - 520-T-038 2.6 0 8 3 4 3 0 3.0 6 0 5.0 5.0 10.0 5 0 5 0 10.0 15 6 13 8 29 4SubstationsffDistribution Net Work- 5 3 - .3 12.2 - 12.2 24.3 - 24.3 24.1 - 24 1 65 9 0 0 65 969 KV Substetions/linem not determine d 8.0 - 6.0 13.9 2.8 16.7 12.2 4.6 16.8 4 1 36 7 7 36 2 11 0 47.2
Geo-thermal Studies 208 -3S 1.5 - 1.5 1 9; 8.1 10 0 2 4 24.9 27.3 4 9 30 4 35.3 10 7 63 4 74.1Small and '4xdium Hydas 20B 739SF 0.3 - 0.3 6.2 7.6 14 0 6.2 9 3 15.5 1 7 4 6 6.3 14 4 21 7 36.1Chulac and Xelala IBM- 2724 - - 0.0 271 4.0 6.1 3.0 6.0 9.0 4.0 11 0 15.0 9 1 21 0 30.1Other 4.5 - 4.5 9.2 - 9.2 9.7 - 9.7 9 7 - 9.7 33 1 0 0 33.1
Other Inymetfetoft
Protection of R. ner Basin 0.7 - 0.7 1.3 - 1.3 1.3 - 1.3 1 3 - 1.3 4 6 0 0 4 6Rehabilitation of ThermalI Plants IBM- 2724 - - 0.0 2 0 2.7 4 7 2 0 16 0 18 0 2 0 10.0 12.0 6 0 "87 34 7Repair and Improvemnt Hidroplant. 0 0 0 8 - 0 8 0 8 - 0.8 0 6 - 0 6 2 4 0 0 2 4Operating Center not determined - - 0 0 - 0 4 0 4 - 0.6 0.6 - 0 6 0.6 0 0 1 6 1 6Equipment IBRD 2724 - - 0.0 - 0.4 0 4 1.2 4.5 5 7 3 3 12 2 15 5 4 5 17 1 21.6
SUBTOTAL JNIS .38.8 7.5 46 3 37.2 56 4 113.6 91.3 178 5 269.8 87 6 202.1 289 7 274 9 444 5 719.4
(EEGSA)
Fifth Poser Project IBMO 2724 - - 0.0 - - 0 0 7.7 13 0 20 7 10.3 18 7 29.2 16.2 31 7 49 9Other Distribution 21 3 - 21.3 23 0 - 23 0 9.3 - 9.3 0 4 - 0 4 5.4 0 0 0 54 0
SUBOTOTA,L EEGSA 21,.3 0 0 21.3 23 0 0.0 23 0 17 13.0 30O.0 10.9 18 7 29 6 72.2 31 7 103 9
TOTAL Pooer Sector 60.1 7 5 67.6 80.2 56 4 136 6 108.3 191 5 299.8 965S 2206 319.3 34'.1 476 2 8233
(gua-park-abl 15-Fxb-89

Table 2.8 OiI - bI! ;s-' Seto lnetet. -Pr-O- 0ae
(";II ion Qo.tzalIaa)
I----Estimamted --- I I -------------- P,0rags.d --------------
Source of 1988 2989 1990 1991 TOTALS
Financ;ng Local Ext. --otal Local Ext. T
otal Locol I Et. Total Local E.t. T
otal Local E.t Toto l
HOUSING AND2 URBAN DEVELOPMBir
(Nabt,o,ol Comitte. for Reconst,uct-on - CRN)
Ca,aurty, Devalopaent Projectts USAID - Proposed 2.0 - 2.0 2.0 3.0 5.0 2.0 - 2.0 2.0 - 2.0 a 0 3.0 11.0
H.4si ng Rhahb. Ii tat,o/Doeeelopset I~-- 0.0 2.4 5.2 7.6 4.2 7.6 21.8 3.6 6 2 9 a 10 2 19.0 29.2
Eaerg..cy Programs 2.0 - 2.0 2.0 - 2 0 2.0 - 2.0 2.0 - 2 0 a 0 0.0 8.0
(Hou~~s-9n Bank - BANVI)
So-. Houa,ng D-elpoosrt I139 - 8SF 1 4 1.0 2 4 12.3 20.0 32.3 14.3 48.9 63.2 1 8 37 3 39 1 29 8 107.2 137.0
Basc He,s-g (Hou..s,g Cred.t)- 11 4 - 11 4 18 0 - 18.0 22.0 - 22.0 25 0 - 2E. 0 76 4 C0 0 76 4
"4ddle I,con Hm.rgn (Hlous.ng Cred,t) -23.3 - 23.3 SB 0 - 36.0 48 0 - 48.0 45.0 - 45 0 152 3 0 0, 152 3
Mun-cipal B- ld-ns I0S - 736SF - 1.9 1.9 1.2 4.6 5.8- - 0.0 - - 0 0 1.2 6 5 7 7
Urbsa Street. D 0- 736SF - 4 8 4.83 2.3 5.4 7 7 - - 0 0 - - 0 0 2.3 10.2 12.5
P.bl~cMarkets !D - 736Sr - 3.2 3.2 214 6 7 8.1 - - 0 0 - - O c 1 4 9.9 11.3
Slaugh~ter Huses D 0- 736SF . 0 3 0.3 0 1 0.9 1 0 - - 0 0 - - 0 0 02a 1 2 1.3
Other Works -.08 - 736SF I J 1.8 0.1 0.2 0.3 - 5.3 5 3 - 3.1 3 2 0 2 10 4 10 5
Mur-cpal De.-lop,nrt IDB - Proposed - - 0.0 - - 0 0 1.0 4.0 5 0 2.8 11.2 14 0 .3 8 15.2 19.0
(Mr.-stry of PublIc Works)
Urbar Streets -3.5 - 3.5 4 3 - 4.3 4.0 - 4.0 4 0 - 4.0 158a 00 188a
Central Market I08 - 4430C 0.8 8 4 7.2 1 0 9) 3 10.3 1.0 2.0 3.0 - - 0 0 2 8 17 7 20.541
Cadvatre im- 1.0 1 0 - 2.0 2.0 - 0.9 0.9 - 0.5 0.5 0 0 4 4 4 4
Road limpr"onemets 188 0 7 2.0 2.7 1.3 3.1 4.4 1 4 3.6 5 0 1.8 3.8 5 4 5 0 12.5 17.5
Inast-tut-ral D-xelopsent IBFt - - 0.0 - 1.8 1.3 - 2.0 2.0 - 1.5 1.5 0.0 5 3 B 3
Other Irneetments- 11 9 - 11.9 13 4 - 13 4 15.0 - 15.0 18 8 - 16.8 57.1 0 0 57.1
TOTAL Housing an,d Urban D"eolopsent Sector S7.0 22.4 79 4 97.8 62.2 160.0 114 9 74.3 189.2 104.6 63.6 168.2 374 3 22.5 596.8
OTHER IPNYeTME4r
P'in,stry of Defense - 31.7 - 31.7 34.7 - 34.7 35.0 - 35.0 36.0 - 36.0 137 4 0 0 137.4
P'inetry of Interior - 4.2 - 4.2 3.6 - 3.6 4.2 - 4.2 4.4 - 4.4 16.4 0.0 16 4
P4 of Labor (Conat of Recreation Centers) - 0.5 - 0.5 1.5 - 1.5 1.5 - 1.$ 1.6 - 1.6 5.1 0.0 5.1
M4 oF Publ,c Works (Const of Pubhc Bu. dings) - 3.0 - 3 0 5.8 - S.8 8.0 - 6 0 2.0 - 2.0 16.8 0 0 16.8
M. ofr Pubtic Works (Wfg 8u;ldirg Materials) - 0.5 - 0.5 0.6 - 0.6 0.6 - 0.8 0.6 - 0.6 2 3 0.0 2.3
Mnatry of Energy and Mnes - 2.5 - 2.5 4.5 - 4.5 5.0 - 5.0 6.0 - 6.0 18 0 0 0 18.0
M4.of Culture and Sports (Rost of Su.ld /Mou.u - 4.8 - 4.8 3.3 - 5.3 5 0 - 5.0 4.6 - 4.6 19 7 0 0 19.7
M.af Cultur, and Sports (Sport Fac;lit,es) - 4.7 - 4 7 6.1 - 6.1 4.1 - 4.1 3.0D - 3.9 18 8 0 0 18.8
Mu,c,pal tam (Budgeted/811) - 78.1 - 78.1 98.9 - 96.9 115.2 - 115.2 139.7 - 138.7 428 9 0 0 428.9
TOTAL- Other In-s5t-et 130.0 0.0 130.0 159.0 0.0 159.0 176.6 0.0 176.6 197.8 0.0 197.8 663 4 0.0 663.4
ORAND TOTAL 4030O 267.6 670.6 602,0 .565.01167.0 678.1 693.11371.2 697.0 782.41479.4 23801i2308 14688.2
(qua._park ..kI) 15-Feb-89

Table 2.9 Custeala - Pubill: Sector xnceetmnt Progran
(101 l l on QAuetzal*s)
I-----Estiated- I…orlm1--------------------------- lrormsmed ----------------------------
Source of 1988 1969 1990 TOTALSEcternalt________Financing Local Eat. Total Loca' Eat Total Local Ext Total Local Eat 'ota. Local Ent
Total
TOTAL BY SECTORS 403.0 267.6 670.6 602.0 565.0 1167.0 678.1 693.1 1371.2 697.0 782.4 1479 4 2380 1 2308 1 4688.2
Educat,on 3.1 15.0 18.1 17.4 24.5 41.9 10.4 22.2 32.6 13.9 27.2 41 1 44 8 8 9 133.7Health 26.1 40.9 67.0 26.3 56.8 83.1 16.9 22.5 39.4 17.1 23.0 40 1 8G 4 143 2 229 6Agr cultu'e 62.3 76.2 138.5 84.1 132.4 216.5 94.9 150.4 245.3 99.4 155.8 255.2 340 7 514.8 835.5Tranaport 33.6 27.0 60.6 50.4 119.5 169 9 63.4 97.6 161.0 63.4 80.2 143 5 210 8 324.2 535 0Water supply 13.6 45.0 58.6 15.4 SS.5 70.9 14.3 56.1 70 4 26.0 88 1 114 1 69 3 244.7 314 0Commun'caton 17.2 33.6 50.8 71 4 57.7 129.1 78.4 78.5 156.9 76.3 123.8 200 1 243 3 293 6 536.9Poear 60.1 7.5 67.6 80.2 56 4 136.6 108.3 191.5 299.8 98.5 220.8 319 3 347 1 476 2 823.3Hou.ng and Urban Oecelopenv,t 57.0 22 4 79 4 97 8 62.2 160.0 114.9 74.3 189.2 104.6 63 6 168 2 374 3 222 5 596.8Dther 130 0 0 0 130.0 159.0 0.0 159.0 176.6 0.0 176.6 197.8 0 0 197 8 663 4 0 0 663 4
As Percent of Total by Sectors 100.0 100 0 100 0 100.0 100.0 100 0 100.0 100.0 100.0 100.0 100 0 100 0 100 0 100 0 100.0
Education 0 8 S.6 2.7 2.9 4.3 3.6 1.5 3.2 2 4 2.0 3.5 B 1 9 3 9 2 9Health 6 5 15 3 10.0 4 4 10.1 7.1 2.5 3.2 2.9 2.5 2 9 2 7 3 6 6 2 4.9Agricultur- 15.5 28 5 20.7 14.0 23 4 18 6 14.0 21.7 17 9 14.3 199 17 3 14 3 22 3 18.27 r-neport 8 3 10 1 9.0 8 4 21 1 14.6 9.3 14.1 11 7 9.1 10.2 9 7 9 9 14 0 11 4Water Supply 3.4 16 8 8.7 2.6 9 8 6.1 2.1 8.1 5.1 3.7 11.3 7 7 2 0 10 6 6.7CommunjCation 4.3 12 6 7.6 11.9 10.2 11.1 11.6 11.3 11.4 10.9 15.8 13 5 10 2 12 7 11.5Pomer 14 9 2 8 10.1 13 3 10.0 11 7 16.0 27.6 21 9 14.1 28.2 21 6 14 6 20 6 17 6Hou-ing and Urban Dr-lcp-.t 14.1 8 4 11.8 16.2 11.0 13 7 16.9 10.7 13.8 15.0 8.1 11 4 15 7 9 6 12.7Oth-r 32.3 0.0 19.4 26 4 0.0 13.6 26.0 0.0 129 28.4 0.0 13 4 27 9 0 0 14.2
A& Percent of Total Fnarcing 60.1 39.9 100.0 51.6 48.4 100.0 49.5 50.5 100 0 47.1 52.9 100 0 50 8 49.2 100.0 1.
Educat, on 17.1 82 0 100.0 41.5 58.5 100.0 31.9 68.1 100 0 33.8 66.2 100.0 33 5 66.5 100.0Health 39.0 61.0 100.0 3.6 68.4 100 0 42.9 57.1 100 0 42.6 57 4 100 0 37 6 62 4 100 0Ag-1 culture 45.0 55.0 100 0 38.8 61.2 100.0 38.7 61.3 100.0 38.9 61.1 100 0 39 8 60.2 100.0T
ranaport 55 4 44 6 100.0 29.7 70.3 100.0 39.4 60.6 100.0 44.2 55.8 100 0 39.4 60 6 100.0Water Supply 23.2 76.8 100.0 21 7 78.3 100.0 20.3 79.7 100.0 22.8 7'7.2 100 0 22 1 77 9 100.0Coeun.-ct,on 33 9 66.1 100.0 55.3 44.7 100.0 50.0 50.0 100.0 38.1 61 9 100 0 45 3 54 7 100.0Poeer 88.9 11.1 100.0 56.7 41.3 100.0 36.1 63.9 100 0 30.8 69.2 100 0 42.2 57.8 100.0Housing and Urban De,elopme,t 71.8 28.2 100.0 61.1 38.9 100 0 60.7 39.3 100.0 62.2 37 8 100 0 62 7 37 3 100.0Other 100 0 0 0 100 0 100.0 0.0 100 0 100.0 0.0 100.0 100.0 0 0 100 0 100 0 0 0 100.0
(gua_park akl) 15-Feb-89
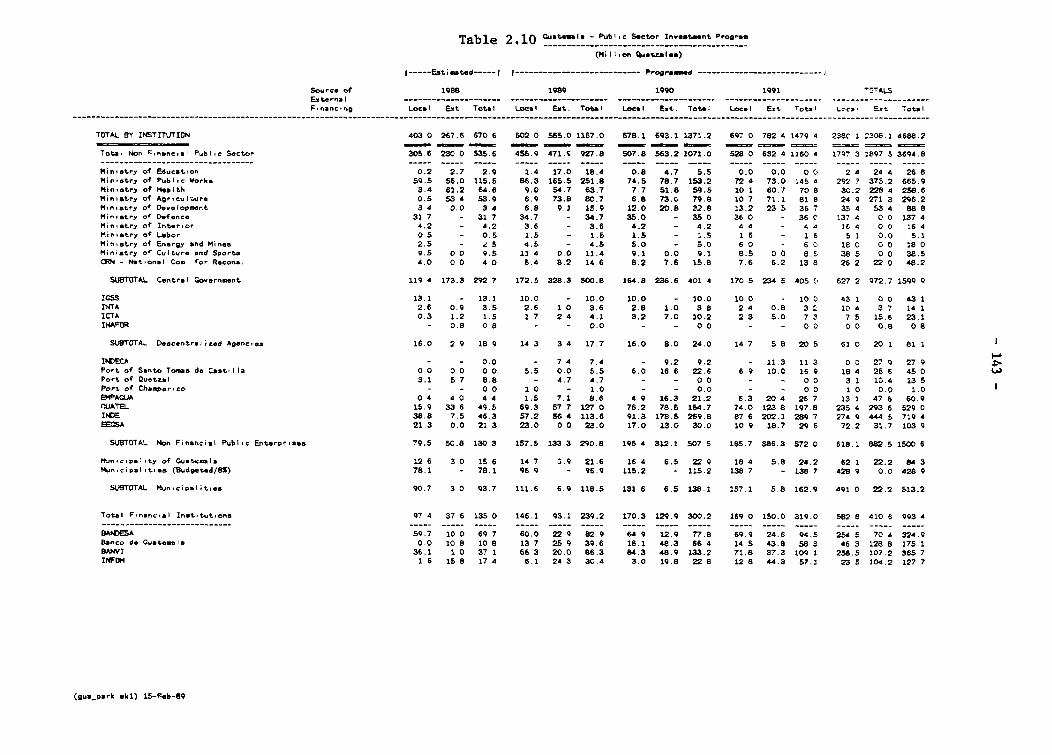
Table 2 .10 OusItemmla - PublIc, sector 1nvmstasent Program
(Million Quetralas)
I----Estimated ---- I ------------------ Progread -------------- I
Source of 1988 1989 1990 1991 T
L
Financin,g Local Ext Total Locsl Ext. Total Local Ent. Total Local Eat T
ot.i Lees Ext 7otal
TOTAL. BY INiSTfl.JION 403 0 267.6 670 6 602 0 585.0 1167.0 678.1 693.1 1371.2 697 0 782 4 1479 4 2367 I 1308.1 4688.2
Tota- Nov ti.nancial Public Sector 305 6 2300 35U6 453.9 471£4 927.8 507.8 563.2 1071.0 328 0 632 4 1160 4 1797 3 1897 5 3694.8
Ministry of Education 0.2 2.7 2.9 1.4 17.0 18.4 0.8 4.7 5.5 0.0 0.0 Qci 2 4 24 4 2668
Ministry of Public Worka 39.3 56.0 115.5 86.3 165.3 251.8 74.5 78.7 153.2 72 4 73.0 145 4 292 7 373.2 665.9
Ministry of Health 3.4 61.2 64.6 9.0 54.7 63.7 7.7 51.8 59.5 10 1 60.? 70 8 30.2 228 4 258.6
Ministry of Agricul'.wre 0.3 53 4 33.9 6.9 73.8 80.7 6.8 73.0 79.6 10 7 71.1 81 8 24 9 271 3 296.2
Ministry of Development 3 4 0.0 3 4 6.8 9.1 15.9 12.0 20.8 32.82 13.2 2335 36 7 35 4 53 4 888a
Ministry of Dmfence 31 7 - 31 7 34.7 - 34.7 35.0 - 35 0 36 0 - 367C 137 4 0 0137 4
Ministry of Interior 4.2 - 4.2 3.6 - 3.6 4.2 - 4.2 4 4 - 4 4 lf 4 0 0 16 4
Ministry o'f Labor 0 5 - 0.5 1.5 - 1.5 1.3 - 1.5 1 6 - 1 6 51I 0.0 5.1
Ministry of Energy and Mines 2.5 - z 5 4.5 - 4.5 5.0 - 5.0 6 0 - 6 C 16 0 0 0 18 0
Ministry of Culture and Sports 9.5 0 0 9.5 13 4 0.0 11.4 9.1 0.0 9.1 8.5 0 0 8.51 38 5 0 0 38.5
CRNu - National Coin for Recons. 4.0 0 0 4 0 6.4 8.2 14.6 8.2 7.6 15.8 7.6 6.2 13 6 26 2 22 0 48.2
SUBTOTAL. Central Government 119 4 173.3 292 7 172.5 328.3 300.8 164.8 236.6 401 4 170 5 234 5 405 Ci 627 2 972.7 1599 9
law3 13.1 - 13.1 10.0 - 10.0O 10.0 - 10.0 10.0 - 10 Cl 43 1 0 0 43 1
INTA 2.6 0.9 3.3 2.6 1 0 3.6 2.6 1.0 38a 2 4 0.8 3 1 10 4 3 7 14 1
ICTA 0.3 1.2 1.3 1 7 2 4 4.1 3.2 7.0 10.2 2.3 5.0 7 3 7 5 15.6 23.1
INAFOR - 0.8 08a - - 0.0 - - 00 - - 0 0 0 0 0.8 08a
SUBTOTAL Dea-entralized Agencies 16.0 2 9 18 9 14 3 3 4 17.7 16.0 8.0 24.0 14 7 5 8 20 5 61 0 20 1 61 1
INiCEA - - 0.0 - 7 4 7.4 - 9.2 9.2 - 11.3 11 3 0 C 27 9 27 9 1
Port of SartoTomas de Castlls 0 0 0 0 0 0 3.5 0.0 5.5 6.0 16 6 22.6 6 9 10.0 169o 18 4 26 6 4.5 0
Port of Qu-tzal 3.1 5 7 8.8 - 4.7 4.7 - - 00 - - 0 0 312 10.4 13 5
Port of Chavpeerco - - 0 0 1 0 - 1.0 - - 0.0 - - 0 0 1 0 0.0 1.0I
EWAOUA 0 4 4 0 4 4 1.5 7.1 8.6 4 9 16.3 21.2 6.3 20 4 26 7 13 1 478b 60.9
IIUATEL 15.9 33 6 49.5 69.3 57.7 127 0 76.2 78.5 15-4.7 74.0 123 8 197.8 235 4 293 6 329 0
INDE 38.8 7.5 46.3 57.2 58 4 113.6 91.3 178.5 269.8 87 6 202.1 289 7 274 9 444 5 719 4
88054 21.3 0.0 21 3 23.0 0 0 23.0 17.0 13.0 30.0 10 9 18.7 29 6 72.2 31.7 103 9
SUBTOTAL Non Financial Public Erterprises 79.5 5C.8 130 3 157.5 133.3 290.8 195 4 312.1 507 5 185.7 386.3 872 0 618.1 882.5 1500 6
Mun-cpaS-ty o-f Guatemala 12 6 3 0 16 6 14 7 1.9 21.6 16 4 6.5 22 9 18 4 5.8 24.2 62 1 22.2 84 3
MunCicPalties (Budgeted/SI) 78.1 - 78.1 96 9 - 96.9 115.2 - 115.2 138 7 - 138 7 428 9 0.0 428 9
SUBTOTAL Municipalities 90.7 3 0 93.7 111.6 6.9 118.3 131 6 6.5 138.1 137.1 3.8 162.9 491 0 22.2 513.2
Total Financial Institutions 97 4 37 6 135 0 146.1 93.1 239.2 170.3 129.9 300.2 169 0 150.0 319.0 582 8 410 6 993 A
BANDESA ~~~~~~~~~~59.7 10 0 69 7 60.0 22 9 82.9 64 9 12.9 77.8 69.9 24.6 94.5 254 5 70 4 324.9
Baec. de Guatemala 0.0 108a 10 8 13 7 25 9 39.6 18.1 48.3 66 4 14 5 43.8 58 3 46 3 123 8 173.1
BAWl 36.1 1 0 37 1 68 3 20.0 86.3 84.3 48.9 135.2 71.8 37.3 109 2 238.5 107.2 36537
INFIM 1 6 15 8 17 4 6.1 24 3 3C.4 3.0 19.8 228a 12 8 4.4.3 57.1' 23 5 104.2 127 7
(guassark ski) 15-Feb-89
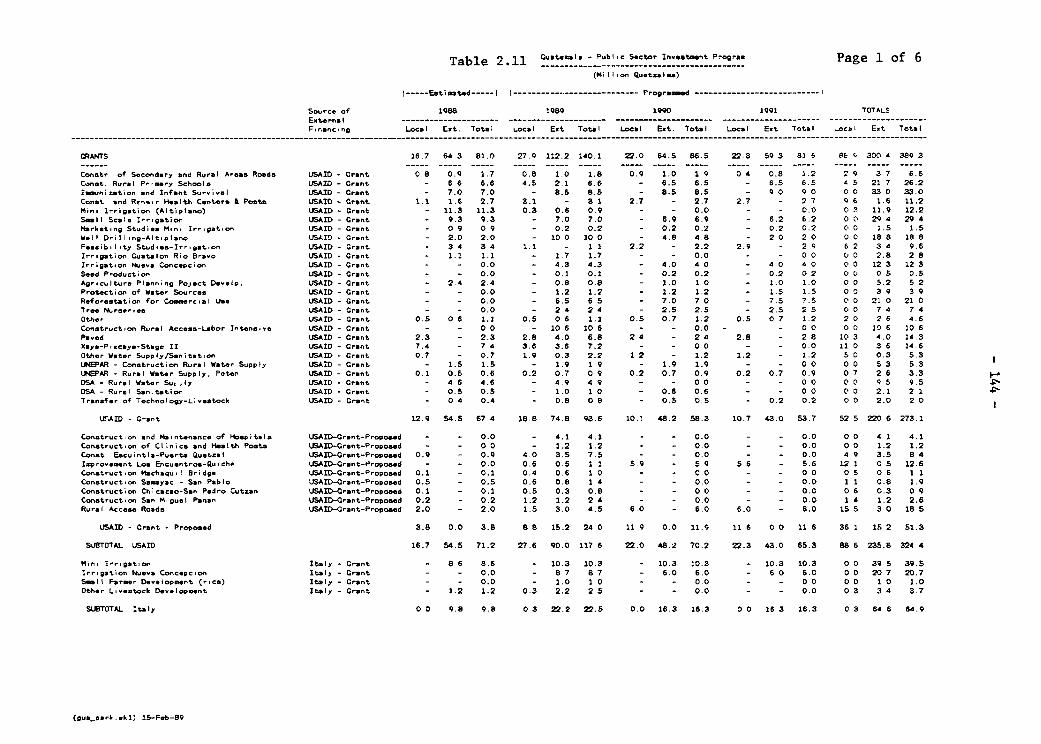
Table 2. 11 Guatea la - PubIc. Sector In.eatment P-agree Page 1 of 6
Estimated-I I-Programa.d-I Q..Z I**
SourCe of 1988 1989 1990 1991 TOTALSExternal…-- -- - -- - - - - - -- - -- - - -- - - --- - - - - - - - - - - - - - - - - - - - - - - - - - - -
Firanc-ng Local Ext. Total Local Ext Total Local Ext. Total Local Ext Total LoCa' Ext Eotal
CAUNTS 18.7 64 3 81.) 27.9 112.2 140.1 22.0 64.5 88.5 22.3 59 3 82 6 8E 14 300 4 389 3
Comestr of Secondary and Rural Areas Roads U.1AID Grant 0 8 0.9 1.7 0.8 1.0 1.8 0.9 1.0 1 9 0 4 0.8 1.2 2 9 3 7 8.8Cirnat. Rura Primay Schoo,ls L.1SAID -Crant - B 8 8.8 4.5 2.1 8.6 - 6.5 6.5 - 6.5 6.5 A 5 21 7 26.2Immunizati-n and Infant Surviva (SAID- Grant - 7.0 7.0 - 8.5 8.5 - 8.5 8.5 - 9 0 9 0 0 0 33 0 33.0Conet and Rr'-ar Health Centes- 3 Paste (sAID - Grnt 1.1 1.8 2.7 3.1 - 3 1 2.7 - 2.7 2.7 - 2 7 9 6 1.6 11.2Mini Irrigation (Altiplano) UOSAID -Grant - 11.3 11.3 0.3 0.6 0.9 - - 0.0 - - 0.0 0 3 11.9 12.2Small Scale Irrgatiol, USAID- Grant - 9.3 9.3 - 7.0 7.0 - 6.9 6.9 - 6.2 6.2 C, 29 4 29 4Marketing Studies Mini Irrigatio U.1AID Grant - 0 9 0 9 - 0.2 0.2 - 0.2 0.2 - 0.2 0.2 C 0 1.5 1.5Well Drilling-Altiplano US541D Grant - 2.0 2.0 - 10 0 10 0 - 4.8 4.8 - 2 0 2 0 0 0 188 is88Feasibility Studie-Irriatio 1.1SAID C rant - 3 4 3 4 1.1 - 1 1 2.2 - 2.2 2.9 - 2 9 6 2 3 4 9.8Irrigation Guatalor Rio Bravo (1S4ID C rant - 1.1 1.1 - 1.7 1.7 - - 0.0 - - 0 0 Ci 0 2.8 2 8Irrrigation hluevaConcepcion (SAID-Grant - - 0.0 - 4.3 4.3 - 4.0 4 0 - 40 4 0 0 0 12 3 12 3Seed Production USAID0 Grant - - 0.0 - 0.1 0.1 - 0.2 0.2 - 0.2 0 2 0 0 0 5 0.5Agriculture Planning Poject Develp. USAID- Grant - 2.4 2.4 - 0.8 0.8 - 1.0 1 0 - 1.0 1.0 0 0 5.2 5 2Protection of Water Sources LISAID -Crant - - 0.0 - 1.2 1.2 - 1.2 1.2 - 1.5 1.5 0 0 3 9 3 9Reforeatation for Cosmercial Use (154AID Grant - - 0.0 - 8.5 6 5 - 7.0 7 0 - 7.5 7.5 0 0 21 0 21 0Tree Nrseries 1.1SAID Grant - - 0.0 - 2 4 2 4 - 2.5 2.5 - 2.5 2 5 0,0 7 4 7 4Other U15AID-Grant 0.5 086 1.1 0.5 0 6 1.2 0.5 0.7 1.2 0.3 07 1.2 2 0 2 6 4.6Construction Rural Access-Labor Intensiv (OSAID -Crant - - 0 0 - 10 8 10 8 - - 0.0 - - 0 0 Ci 0 10 6 10 8Pared (ISAID-Grant 2.3 - 2.3 2.8 4.0 8.8 2 4 - 2 4 2.8 - 2.8 103 4.0 14.3Xaya-Pi-ccaya-Stage II (OSAID- Grant 7.4 - 7 4 3.8 3.6 7.2 - - 0 0 - - 0.0 11 0 3 8 14.8Other Water Supply/Sanitation USAID -Crant 0.7 - 0.7 1.9 0.3 2.2 1 2 - 1.2 1.2 - 1.2 5 0 0.3 5.3(5iEPAR Construction Rural Water Supply L15SA0 Grant - 1.5 1.5 - 1.9 1 9 - 1.9 1.9 - - 0 0 0 0 5 3 5.3 UNEPAR Rural Water Supply, Peter USAID- Grant 0.1 0.5 0.8 0.2 0.7 0 9 0.2 0.7 0.9 0.2 0.7 0.9 0 7 2 8 3.3D54A Rural Water Sut ily 1.1AID - Grnt - 4 8 4.8 - 4.9 4 9 - - 0 0 - - 0 0 0 0 9 5 9.5 4'D54 Rural Sen;tetion LUSAID C rant - 0.5 0.5 - 1.0 1 0 - 0.8 0.8 - - 0 0 C. 0 2.1 2 1 S-Transfer of Tech.Inoog-Linestock U.15ID -CGant - 0 4 0.4 - 0.8 0 8 - 0.5 0.5 - 0.2 0.2 0 0 2.0 2 0
U.'AID - Grant 12.9 54.5 87 4 18.8 74.8 93.6 10.i 48.2 58.3 10.7 43.0 53.7 52 5 220 8 273.1
Cons,truct-n and Maintenance of Hloapitals U5SAID-Crant-Propoaed - - 0.0 - 4.1 4.1 - - 0.0 - - 0.0 0 0 4 1 4.1Construction of Clinics and health Posts (SAID-Grant-Proposed - - 0 0 - 1.2 1.2 - - 0.0 - - 0.0 0 0 1.2 1.2Conet Eacuintla-Puerte Queczal (ISAID-Grant-Proposed 0.9 - 0.9 4.0 3.5 7.5 - - 0.0 - - 0.0 4 9 3.5 8 4Improvement Los Encuentros-Ouichr (ISAID-Grant-Proposed - - 0.0 0.8 0.5 1 1 5.9 - 5.9 5 8 - 5.8 1.21 0 5 12.8Construction Mechaqui 1 Bridge UJSAID-Grant-
0roposed 0.1 - 0.1 0.4 0.6 1 0 - - 0.0 - - 0 0 0 5 0 6 1 1
Constructio Samayac - San Pablo (SAID-Grant-Proposed 0.5 - 0.5 0.8 0.8 1 4 - - 0.0 - - 0.0 1 1 0.8 1.9Construction Chiicacao-San Pedro Cutzen (SAI:D-Grant-Proposed 0.1 - 0.1 0.5 0.3 0.8 - - 0 0 - - 0.0 0 6 0.3 0 9Construction San Miguel Panan USAID-Grant-Proposed 0.2 - 0.2 1.2 1.2 2 4 - - 0.0 - - 0.0 1 4 1.2 2.8Rural Akccess Roads (SAID-Grant-Proposwed 2.0 - 2.0 1.5 3.0 4.5 8.0 - 8.0 8.0 - 6.0 15.5 3 0 18 $
(ISAID - Grant - Proposed 3.8 0.0 3.8 8 8 15.2 24 0 11 9 0.0 11.9 1186 0 0 1186 361 13 2 31.3
SUBJTOTAL (ISAID 16.7 54.5 71.2 27.8 90.0 117 8 22.0 48.2 70.2 22.3 43.0 85.3 88 6 235.8 324 4
Mini Irrgatio Italy - Grant - 8 8 8.6 - 10.3 10.3 - 10.3 10.3 - 10.3 10.3 0 0 39 5 39.5Irrgation Nveva Concepcion Italy - Grant - - 0.0 - 6 7 8 7 - 8.0 6.0 - 6 0 8.0 0 0 20 7 20.7Small Parser Development (Cric) italy - Grant - - 0.0 - 1.0 1 0 - - 0.0 - - 0 0 0 0 1 0 1.0Other Livestock Development Italy - Grant - 1.2 1.2 0.3 2.2 2 5 - - 0.0 - - 0.0 0 3 3 4 3.7
SUJBTOTAL Italy 0 0 9.8 9.8 0 3 22.2 22.5 0.0 16.3 16.3 0 0 16 3 16.3 0 3 648 8 4.9
(gue_park .. k1) 15-Feb-89

Table 2.11 Outl - bl;c s5ctor In""st"t Prw"a Page 2 of 6(Fli II icr Qutz l--)
} ----- E tiaotad----- I I ------------------------- Progr_amd ----------- - ------- I
Soorce of 1988 1989 199O 1991 TSXTALS
EsXrn I ~---- ------- - ----- ------ - ---------- - --- --- ---- - ------ ------------ _---_----- --- _-----------_-----Firancing Local Ert. Total Local Ext.
Total LOcal Ext. Total Local Et
Tot.1 L.ocal E.t
total
IAUTILATER9AL IGNSTitrUrZ 38 8 127.0 165.8 112 4 306.8 421.2 124.6 333.9 458.5 121 9 362 0 483 q 397 . *131 7 1529 4
"ter Supply Rahmbilitation I, - 2759 - - 0.0 1.5 5.3 6.8 2.9 9.9 12.8 3 5 12 0 15 5 7 9 27.2 35.1
Ch.lac and Xalel IIDE - 2724 - - 0.0 2.1 4.0 6.1 3.0 6.0 9.0 4.0 .1.0 1s G 9 1 21.0 30.1
R.habilitation of Theaal Pla.ts 1BRD - 2724 - - 0.0 2.0 2.7 4.7 2.0 16.0 18.0 2.0 10 0 12 0 6 0 28 7 34.7
Eau;pmnt IDE - 2724 - - 0.0 - O.4 0.4 2 4.5 5.7 3.3 12.2 15 5 4 5 17.1 21.6
Fifth Po., PFrojact IDER - 2724 - - 0.0 - - 0.0 7.; 13.0 20.7 10.5 18.7 29.2 16.2 33.7 49.9
Expan-io, of Matvool ita Talaphonoa If - 2385 4.2 7.0 11.2 8.0 6.2 14.2 - - 0.0 - - 0 0 12.2 13.2 25 4
E.Pane..r- of Data Procaaing Cant,r ImD - 233 - - 0.0 0.1 0.2 0.3 - - 0.0 - - 0 0 0 1 0.2 0.3
Expanw*,o of Ragional System IRDE - 2385 0.6 3.3 3.9 11.0 8.1 19.1 10.2 8.6 18.6 5 4 3 1 8 5 27 2 23 1 5C 3
Eapansio. of Talea Sr.t-c Systat I8DE - 2385 - - 0.0 1.2 6 4 7.6 - - 0 0 - - 0 C 1 2 6 4 7 6
Planning and Pro.-maa.in I8R - 2328 - 0.2 0.2 - 2.0 2.0 - - 0.0 - - 0 0 0 2.2 2.2
Canalta. (orban prrery prejact) IiiR - 2328 0 1 1.4 1.5 0.5 6.1 6.6 0.3 2.4 2.7 -0 0 0 9 9 9 10 8
Cront. Urban Pr,m,y School (V.rginal Ara&) I0 - 2328 0.3 0.7 1.0 1.2 2.3 3.5 1.0 2.5 3.5 - - 0 0 2.5 5 5 8.D
8sic Ed.cation (Eduencion Mi4ni) I8R - Appro,od - - 0.0 - - 0.0 0.8 8.5 9.3 6.0 20 7 26 7 6 8 29.2 36 0
Secondary Road Rahabilitat;ion I8RD - Appmoned - - 0.0 - - 0.0 2.1 3.9 6.0 5 9 10 9 16 B 8.0 14 8 22.8
Hou.ing Rahabl,taion/D-ecploaant IDE - - 0.0 2.4 5.2 7.6 4.2 7.6 11.8 3.6 6.2 9 6 10 2 19 0 29.2
Cadastr Iwo - 1.0 1.0 - 2.0 2.0 - 0 9 0.9 - 0.5 0 5 C 0 4 4 4 4
Road lnpro,want. I8R 0 7 2.0 2.7 1.3 3.1 4.4 1.4 3.6 5.0 1.6 38 54 5 C 12 5 17.5
Inatitutional DO alopast II - - 0.0 - 1.8 1.8 - 2.0 2.0 - 1 5 1 5 0 0 5.3 5.3
SUDT07ALt IBM 5.9 15.6 21.5 31.3 55.8 87.1 36.8 89.4 126.2 45.8 110.6 156 4 119 8 .71 4 391.2
1n
(9u9-parkh.ll) 15-Fcb-89

Table 2.11 Cutsl-Pb.c .tenFrro Page 3 of 6(M iI I- QutZ" I..)
S-or. of 1988 1989 1990 1991 rlL
F;n--a ~L..*l E.t Tot1 LocalI Eat T
ots I LocalI Eat Tote, LoCs' E.t 'r.,. L-1. E-t 'ot.,
8 a.c Hou-9 De-epeent IDB- B04SF 1 4 1 0 2 4 12 3 20.0 32.3 14 3 48.9 63.2 1 8 37 3 3921 -; I'.F 1 1 l3'0Z-1i I IDS -739SF 0.2 0.3 0 7 2 4 9 7 1212 8.1 16.3 24 4 3 6 84 2414 162 3491 5.1.2Ge-th-res' Studies 1MS 739SF 1.5 - 1.5 1 9 8.1 10 0 2 4 24 9 27.3 4 9 30 4 33 3 IC 63 4 74.2Sin!I s.d Mod... Hyde. MS8 739SF 0.3 - 0.3 6.2 7.8 14 0 6.2 9.3 15.5 1 7 4 6 El 3 14 21 7 36 1M..,.-Pal B..', d.ng. MB8 736SF - 1.9 1.9 1.2 4.6 3.8 - - 0.0 - - 0 0 1 2 6.5 7 7Urban Ste.6.. to0ID- 736SF - 4.8 4.8 2.3 5.4 7.7 - - 0.0 - - 0 C' 3 10.2 12 5Public MaIk.t. MB8-736SF - 3.2 Z.2 1.4 6.7 8.1 - - 0.0 - - 0 1 4 9 9 11.3
Slaughter Houses MB8-7365F - 0.3 0.3 0.1 0.9 I10 - - 0 0 - - 0 0 1 1 2 1 3
Otu.- worba me8-736F - I8 a 1.8 0.1 0.2 0 3 - 5 3 5 3 - 31 3 1 0 1 10 4 10 5L*EPAF Ado.n-tratio./r.ch-c.I Serocee 1MD 719SF 1.2 1.5 2.7 1.5 1.8 3 3 1.8 1 5 3 3 - 0 0 4 -5. 4 8 9 3UNEPAR9 Co-st,uct.on R.ral Water Supply MD8 719SIF 0.3 23 7 24 0 2 7 17.8 20.5, - - 0 0- C, C' 3 2 41 5 44 5R-ra 7el.phoone Doscopmert III MB8 708SF I0 4.3 5 3 5 7 18.3 24 0 12.2. 12.0 24 2 9 0 20 0 29 0 27 8 44 6 72 4Rural P-mz.y (PR10DERR) MO8 - 70TSF 0.1 1 1 1.2 0.9 8.9 9 8 0 5 2.3 2 8 - - 0, 0 1 5 12 3 13 8C-..t Rural P,..-y Sckoola IDS 707SF 1 0 5 0 6 0 0.5 3 2 3 6 - - 0 0 C.- 0 1 5 8 1 9 6Weter SuPply/Seseras in Second-,, cities 108 671SF 1.6 3.8 S 4 1.0 6.3 7 5 1I0 8.5 7.3 - - 0 3 6 16 8 20 4A.. al H.asIth MS8 667SF - 7.8 7.8 1.6 2 9 4 5 - - 0 0 - - 0 0 2 & 20 7 12 3Conatruct,- and tntan of Hosp.t.10 rD9 - 623SF 6.6 11.9 18.5 6.7 29 4 36 2 - - 0 0 - 0 13 3 41 3 54.6Conetru-t-oof Cl.nicsand Health Posts MO8-62356 0.7 3.4 412 1 4 5 4 68a - - 0 0 - - 0 0 22 668 10 9r-Gat,on II MO8-Appro,ed - - 0.0 0 5 10 1.5 09 2 9 3.8 18a 6 0 758 3 2 9 9 13 1
Ag-c.1t.- Crad.t IDB-5290C - 10 8 10.8 13 7 25 9 39.6 16 4 42 5 589 IC 0 28 8 3858 40 1 1080 148 1Tr-n.f.r7ech.ology-PROGErrAPS MB8-4730C I/ 01 2 .2 1.3 1 5 2.4 3 9 3.0 7.0 10 0 2 0 5.0 7 0 5 6 1St6 22.27ranfer of T..hnolowY-Lmvsst-kl 108 4730C - 1.0 I 0 - 1.1 1 I - 1.2 -1.2 - 0 6 C 6 0 0 3 9 3 9Central Market r08 - 4.4.3C 0.8 6.4 7.2 1 0 9.3 10 3 1.0 2 0 3.0- 0 0 2 8 17 7 20.5Rehab /Conet-. Rural Rcad.-lW. CA-1 Ipala rD8 - 216 0.3 0.2 0.5 0.9 3 9 4 8 0.3 2.2 2.5 - 0 0 1 5 £ 3 7 aRehab /Conet, Rur1 Rosda-IV. CA-8 Mpy.ta 10O 216 - 0.2 0.2 1 0 6.1 7 1 0.3 2.6 2.9 - - 0 0 2 3 8 9 10.2Rob /Con. Rural Roads-TV. QuotzasIt -San Ju.n 108 216 0.3 0.1 0 4 0.2 3 4 3 6 - - 0.0- - 0 0 0 5 3 5 4 0 463Rob /Cons. R.rsi Roads-IV, Quetzslt.-Sen Carlo 108MO 216 - 1.9 I 9 0 3 4.7 5 0 0.2 1.2 1 4 - - 0 0 0 3 7 8 8 3R-ra Access Rooda-Pa-t IV' MO8 797 1.4 3.5 4.9 0 9 3 4 4 3 0.9 3.4 4 3 0 6 3 0 3 8 4 0 13 3 17.3Pueblo V ; j o-Cho. , MO8 -iEQic 12.3 6.2 18.5 - - 0.0 - - 0.0 - - 0 0 12 3 6 2 13 5Reconst-ution CA-9-R.o Hando 10O Ise6 0.5 - 0.5 4.6 21 1 25 7 5.2 15 7 20.9 6 5 17 7 24.2 26 8 5.4 5 71.3
1DB 31.6 107.5 189 1 74.5 239.8 314 3 74.6 207 7 282.3 4.41 154 9 199 0 2246 7099 93471
Chi.oyReforestation Me8-Proposad - - 0.0 - - 0.0 - - 0 0 28a 60 7 8 18 6 0 7 8Sml ionn. Medium Farmer Credit 108O Propos.ed - - 0.0 - - 0.0 1.7 36a 7.5 4.3 15 0 19.3 6 2 20 8 27 0St), Wete-S.pply/S.eerage So. Cit. as(IN*t8M) MS P-P posed - - 0.0 - - 0 0 1 0 4 0 5 0 10 0 30 0 40 0 11 0 34 0 45 0R.ral Water Supply (UNEPAR) 10O Proposed - - 0.0 - - 0.0 21.0 7.5 8.5 5 0 20 0 25 0 6 0 27.5 33.5Rural Telephonse - IV MB8-Propoasd - - 0.0 - - 0 0 1.0 2.8 3.8 1 0 28 3 8 2 0 5 6 7 6Munic,pvl Dsnelopment 10O Provo.ed - - 0.0 - - 0.0 1.0 4.0 3.0 2 8 11.2 14 0 3 6 15.2 19 0
MO8- Proposed 0.0 0.0 0.0 0.0 0 0 0 0 5 7 1'14.1 29.8 25.1 85S0 110 1 30 8 1092 139 9
SLUBTOTAL 108 31 6 107.5 139.1 74.5 239.8 314 3 80.3 231.8 312 1 69.2 239 9 3019.1 255 6 619 0 1074 6
T".nsf*r of Technology-L-eatocl rFAD - 154-w3 - 0.3 0.3 - 0.8 0.6 - 0 A 0 4 - 0 2 0.2 0 0 1 6 1.6ZacapmfChau.eomls Rural Denelopwent IFAD/Neth'erl -Prop. - - 0.0 - - 0 0 0.3 2.5 3 0 1 0 51 0 6 0 1 5 7 5 9 0
SUBTOTAL- IFAD 0.0 0.3 0.3 0 0 0.8 0.8 0.5 2 9 3 4 10D 5.2 6.2 1 5 9;1 10.6
W.den-ng CA-1-C)n Justo CABOI - 164 0 4 1 4 1 8 5.2 2 9 8.3 S.7 2 4 8 1 5.3 3 0 6 3 16 6 9 7 26.31R.h*b,l,t.t,on CA-9 El Ranclh-R,o Hondo CA8EI 0.2 - 0.2 0 4 2.5 2 9 0 4 2.1. 2.5 0 3 1.9 2.2 1 3 6 3 7 8R.hob,litat,on CA-2 Tainiaco-dle Alnarodo CASE! 0.2 - 0.2 0.5 3.2 3.7 0.4 2.3 2.7 0.3 I A ; 7 1 4 6 16 8.3Rohs CA-I - 8*,bsr-na El Holino CANT 0.1 - 0.1 0.5 3.8 4.3 0.5 3.0 3.5- - 0 0 I.I 6 B 7 9Pumping Stat.onImpro.:aent CA8EI 0 4 2.2 2.6 - - 0.0 - - 0 0 - - 0 0 0 4 2 2 2.6
SUBTOTAL- CASEI 1.3 3.6 4.9 6.6 1224 19.0 7.0 9.8 16.8 5 9 6.3 12.2 2068 32 1 52 9
(qus_park .. kI) 15-Feb-89

Table 2.*11 ruatopla - P *c, soctOr I,-"tnlt 6O Page 4 of 6CHMi on ipr Q..tzaI..)
Eati.atad - I~---------------FrogrOa.od--------------
Soo'.. of 1981989 1990 1991 TOTAISEat4r.al Financing Loco! Eat. Total Local Eat 'Tot.al Local Eat. Total LocalI Eat
Toto' -.o a E,t Total
BILATERAL 77.6 57.3 134.9 72.1 11.2.3 183 4 89.0 147.9; 236 9 96 9 133 1 23C 334 f 45 6 785.2
03A -Rra Iwatar Supply USAM0 - 520-U-.033A 6 4.6 - 4.9 4 9 - - 0.0 - - 0 0 0 0 9 5 9.5D5A - R.ral San,tat. on U.SAID - 520-U-033A - 0.5 0.5 - 0.5 0.5 - 0.8 0.6 - - u (C C.0 1 6 1.6Construction Ru,s l Acceas-Labor Intanain- LSAID - 520-T-040 8.6 6.5 I5.3 - 12.8 12.8 - 10.9 10.9 -- 0 0 8.8 30 2 39.0Rural USAri.ato -I 151 -S52-T-038 2.6 0.8 3.4 3.0 3.0 6.0 5.0 5.0 10.0 5.0 5 0 20 c' 25.65 13 8 29.4Rafc,aatati,n U.5AM - 520-T-037 21 - 0.8 0.8 - - 0.0 - - 0.0 - - 0 C' 0.0 0 6 0.8#ai.tnm.nece Rural Access Roada-Labor Int,o.*ine LISAID - 520-T-037 0.7 3.8 4 5 - 4.5 4.5 0.6 i.6 2.2 2.3 - 2 3 3 6 90 9 3.5Lna...tock Denlopa.ent USAM10-520-7-034 - 1.9 1 9 - - 0 0 - - 0 0 - - 0 0 0 0 10 1 9
OU,arReforatato., USAID - 520-T-037 - 1.2 1.2 1.5 0.6 2.1 . 0.6 21 15 06 2- 45 30 7.Techn,cal Sar.e.at USAM1 18.5 2 0 20.5 18.5 2.6 21 0 19.0 3.0 22 0 20 5 3 5 24 . 76 5 11 0 87 5Crad.t. for Ba.ic Criams LSAID 29.9 2.0 21.9 19 9 2.0 21.9 22 0 3.0 25 0 24..5 3.5 28 0 86 3 10 5 96 8Cred,t for Miscellaneoua Cropa USAW 20.0 3 9 13.9 10 0 4 0 14 0 10.3 4.5 14.6 10 5 5 0 25 5 40 6 17 4 58.2Cr-dit for LinOatock LISAID 9.4 0.2 9 8 9.6 0 4 10 0 10.8 0 4 11.0 11 4 0.6 12 C, 42 0 26 42 6Cred,t f.r 7-rgat, on USAID 1.9 1.9 3.8 2 0 14.0 16.0 3.0 2.0 5.0 3 v 12.0 150o 9 209 3989
SUBTOTAL; U54I0 71.8 30.0 101.8 64.5 49.2 113 7 72.0 31.6 103 6 78 30 2 106 Q 287 0 141 0428 0
toap.tal Eouipment (Rowoaenlt) Fro..o. - 1.2 1.2 - - 0 0 - - 0.0 - - C.' C, 12 1 2~na. ital Eq..pfent (Qs.qzalten&ngo) Franca - 15.8 1s 8 - 8.2 8.2 - 0 0 - - 0 C C. C' 24 0 24 0Pu-nhaae of Eq.ip., rapair' ald apron. of Fort. Franca 3.1 5 7 8.8 - 4 7 4 7 - - 0.0 - - 0 0 3 1 10 4 13 5Diratribut,ion EStd ntFay 07 28 . 79 93 1 4 7 9 9.3 1 4 7 9 9 3 4 9 26 5 31 4
Olatributbon Study ~~~~~~~Franca - 1.6 1.6 - 2.8 1 8 - - 0.0 - - 0 0 0 0 3 6 3 5,L%EPAR - Rural 'Water Supply Goreany -KFW - - 0 0 1 0 4.5 5.5 10 7.5 a. 5 3 0 19 5 22.5
El Juta0allery(Chiaoy) Italy - - ~~~~ ~~~~~~ ~~~0.0 - 7.5 7.5 - 7.5 7.5 - - 0 0 0 0 150 15 0I.
SU.BTOTAL: Dthnar Bilateral 3.8 27.3 31.1 2 4 34.6 37 0 2 4 22.9 25 3 2 4 15 4 17 8 12 0 100 2111.2 "'S
Health Ed.cati on U-AID-proposed - - 0.0 - - 0.0 - 3.0 3 0 - 30 3 0 0 0 60 8.0 Rural 'Water S..PPIY (05A) USAID P,Foposad - - 0.0 - - 0.0 - 9.0 9.0 - 9.5 9.5 0 0 18s 18.5Community De,.lopeant Projac~ta 1.5AID - Fropoaed 2.0 - 2.0 2 0 3.0 5.0 2 0 - 2.0 2 0 - 20 80 30 1.
Eaquntla-S.S.baatian Vnezuela - Foposad - - 0.0 - - 0.0 2.9 13.9 26.8 2.2 10 4 12 6 5 2 24 3 294'Wall Orflling; (EWAGUJA) Java, Proposed - - 0 0 - - 0 0 2.0 6 4 8 4 2 8 84 11.2 4.8 140 8 19 6EaPanalon of Rural Priaary Care ItalY p roposad - - 0.0 - - 0.0 - 11.0 11 0 - 11 0 11.0 0 0 Z 0 22.0l4ontuf.r 1rrigation Italy -propoasd - - 0.0 - 9.0 9.0 - 20.1 20.1 - 10 4 10 4 0 0 39.5 39.5Ma-kating Support (INDEA) Italy - Fopoaad - - f).0 - 7.4 7 4 - 9.2 9.2 - 11.3 t:. 3 0 0 27 9' 27 9Autopiota ai. Ecnl ItalY P Fopoaed - - 0.0 1.5 5 0 6.5 4.8 11.2 1.5.9 4 8 11I.1 15 9 11 1 27 2 38.3Conat. M4odesto Mendez Poptun Germany - Propopad - - 0.0 - - 0.0 2.4. 5.5 8 0 3 5 8.3 11.8 5 9 13 9 19.8Rural Acceaa Roada-Alta 'Warapax (labor intan..) Gar.anY - Prop,owad - - 0.0 0.7 4.1 4.8 0.5 4.1 4.6 0.5 4.1 4 8 1.7 12 3 14.0
SU.BTOTA.L PrOpoaad 2.0 0.0 2.0 4.2 28.5 32.7 14.6 93.4 108.0 15 6 87.5 103.3 36 6 20104 245 0
SUpPPLER CFtEDYT - - 0.0 1.5 10.0 11.5 1.0 10.0 11.0 - - 0 0 2.5 200 22.5
Gas Turb,ne-6 S.,ppliers Credit - - 0.0 1.5 i0.0 11.5 1.0 10.0 11.0 - - 0 0 2.5 20.0 23 5
COMMECIAL CFtWrTrFt 0.3 19.0 19.3 17.1 18.5 35.6 21.0 19.0 40.0 10 0 10.4 20.4 48 4 66 9 115.3
Eapanabon of Meatropolitan Systeo Commercial - 10.0 10.0 9.0 30.5 19.5 11.0 19.0 30.0 5 (1 5 5 i0.5 25.0 45 0 70.0
Expansion of Regional Talaphonas Comearcial 0.3 9.0 9.3 8.1 8.0 16.1 10.0 - 10.0 5 0 4.9 9.9 23 4 21 9 45.3
(gua_park ..kl) 18-Feb-89

Table 2.*11 I'll"n - Public "eCt"r Invetme Pro"" Page 5 of 6(M Illion Quetzal.s)
---- Estcmated…---I I…--------------Progras,ed …---------------
So ..rce 98 1969 1990 1991 TD'ALS
Fi,ancing Local Eat. Trotal Local Ext Total Local Ext. T
otal Local Ext Tot.' L-om Ext -ota
NOCr DIETUMINED FINANCINGC 6 0 0.0 6 0 13.9 3.2 17 1 32.3 117.8 150 1 47 6 217 6 265 2 048 3.38 6 438 4I.l-poeart of Santo Tsas de Castilia not deterimind - - 0.0 - 0.0 - 16 6 16 6 - 10 0 10 0 C L' 266 26.6Expansion Cueteaslo City (50.000 lines) not determned - - 0 0 - - 0.0 7.1 34.0 41.1 10 4 38 7 49 1 17 9. 72 7 90.2System Expansion (250,000 lines) not determined- - 0.0 - - 0.0 1.8 - 1.6 14.2 57 5 71 7 IC 1' 57 5 73.5International Serice not determined - - 0.0 - - 0.0 - 2.1 2.1 - 1.3 1.2 C' 0 3 4 3.4Sante Maria-2 not determind - - 0.0 - - 0.0 - - 0.0 6.7 27 0 33 7 6,' 270 33.7Ri.o Baomo not daterained - - 0.0 - - 0.0 1.6 2.4 4 0 8.0 12 0 20 0 9 6 244 24 0stama iir not determined - - 0.0 - - 0.0 6.3 45.3 51 6 1 1 53 9 55 O 7 4 96;2 106.6S. Sobastian-La Eaparanca not deterained - - 0.0 - - 0.0 2.3 7.9 10 2 1 7 6 5 8.12 4 0 14 4 16 4SubstatioviTra.- Line JutmaPa not determined - - 0.0 - - 0.0 1.0 4.3 5 3 1 4 6 5 7 9 7 A 10 6 13.269 KY Subetatimnsa/linae not determind 6 0 - 6.0 13.9 2.6 16 7 12.2 4.6 16 6 4 1 3 6 7 7, 36 2' 1: 0 47.2Operating Center not determined - - 0.0 - 0 4 0.4 - 0.6 0 6 - 0 6 0 6 0 0 1 6 1 6
LOCAL FINANCIOING 263.6 0 0263 6 358.1 0.0 358.1 368.2 0.0 388.2 398 3 00 396 3 1408 2 0 01408.2
Conatri.ctio of Pre-prieary SChool - 0.1 - 0.1 1.0 - I10 0.9 - 0 9 0 9 - 0 9 2 9 0 0 2 9Conet. Other Urban Primary SchoolIs - 1.5 - 1 5 4.1 - 4 1 2.6 - 2 6 2 6 - 2 6 1C 6 0 -' 10 aConat of Middle Sh,ools. - - 0 0 1.7 - 17 2.7 - 2 7 2.8 - 2 8 7 2 0 0 7 2Lonat of Other Shools - - 0 0 0 6 - 0.6 - - 0 0 - - 01 0 c6 0 0 0.6Construction IWnagement (Schools) - - - 0 0 2 4 - 2 4 1.6 - 1 6 1 6 - 1 6 5 6 0 0 S 6Equippirg o-fHelth Cavtersand Poeta - 1.6 - 18a 3.6 - 3 6 3.7 - 3 7 3.9 - 3 9 1.20C 0 0 13 0Spec,ialzed Madica1 Care 0.2 - 0.2 - - 0.0 - - 0.0 - - 0 0 1 2 0 0 0.2 aiseriinad Man-gaent of Construction - 1 9 - 1 9 1 0 . 1.0 - - 0 0 - - 0 0 2 9 0 0 2 9 Repair and Expansion of Hospitals - 0.3 - 0.3 0.2 - 0.2 0.5 - 0.5 0 5 - C 5 1.1 0' 0 1 5 4Repair Regonal Hoepitel da Langerud - 0.1 - 0.1 - - 0.0 - - 0.0 - - 0 0 02 0 0 0 1 00Reconstruction Rehabilitation Center - 0.3 - 0.3 0.3 - 0.3 - - 0 0 - - 0.0 06 00 08oConstruction and Repair of Health Faclities - 13.1 - 13 1 10.0 - 10.0 10.0 - 10 0 10.0 - 10 0 43 1 0 0 43 1Othar Conservtion Works - - 0.0 11 I 1.1 1.2 - 1.2 1.2 - 1.2 3 5 0.0 3.5Lend Davelopsant 1.8 - 1.8 1.8 - 1.6 1.9 - 1 9 2.0 - 2 0 765 0.0 7.5Other (ICTA) 0.2 - 0.2 0.2 - 0.2 0.2 - 0.2 0.3 - 0.3 0 9 0 0 0 9Rehab /Conetr. Rural Roads-IV, CA-I riae - 0.3 - 0.3 0.8 - 0.6 0.9 - 0 9 0.6 - 0 6 2 6 0 0 2.6Bridge Conat. La Jsai., Cabuz rV 1.0 - 1.0 0.2 - 0.2 - - 0 0 - 0.0 1.2 0 0 1.2Tourisae Access Roads - - 0.0 1.1 - 1.1 1.1 - I11 1.2 - 1.2 3 4 0 0 3 4Pro-fabrication bridge coqponents - 0.3 - 0.3 0.5 - 0.5 0.5 - 0 5 0.5 - 0.5 1.85 0 0 1.6C,onst Castillo-San Juan Gostuncaco. - 0.2 - 0.2 1.0 - I10 - - 0 0 - - 0 0 1.2 0 0 1.2Construction Modular Wooder Bridges - - - 0.0 - - 0.0 0.5 - 0.5 0.5 - 0.3 1 0 0.0 1 0Access Roads-Quiche 0.6 - 0.6 0 6 - 0.6 0.9 - 0 9 0 9 - 0.9; 3 0 0 0 3 0Rote 16, Paln-ia-S.Jxse PF.inua 0.3 - 0.3 - - 0.0 3.7 - 3.7 - - 0.0 4 0 0.0 4.0CA-1 Zaragoza-Coa lspa 0.3 - 0.3 - - 0.0 2.7 - 2.7 - - 0.0 3 0 0 0 3.0Construction Lake ~i i Ian Road - - 0.0 1.0 - 1.0 - - 0 0 - - 0.0 1 0 0 0 1.0Constr.flaprov Access Roads ail;/Upspten - 1.5 - 1.5 2 4 - 2.4 1.8 - 1 6 1.6 - 1.6 7 1 0 0 7.1Earth 0.6 - 0.6 1.0 - 1.0 1.0 - 1.0 1.2 - 1.2 4 0 0 0 4.0
(gua.v_park.ek1) 15-Feb-69
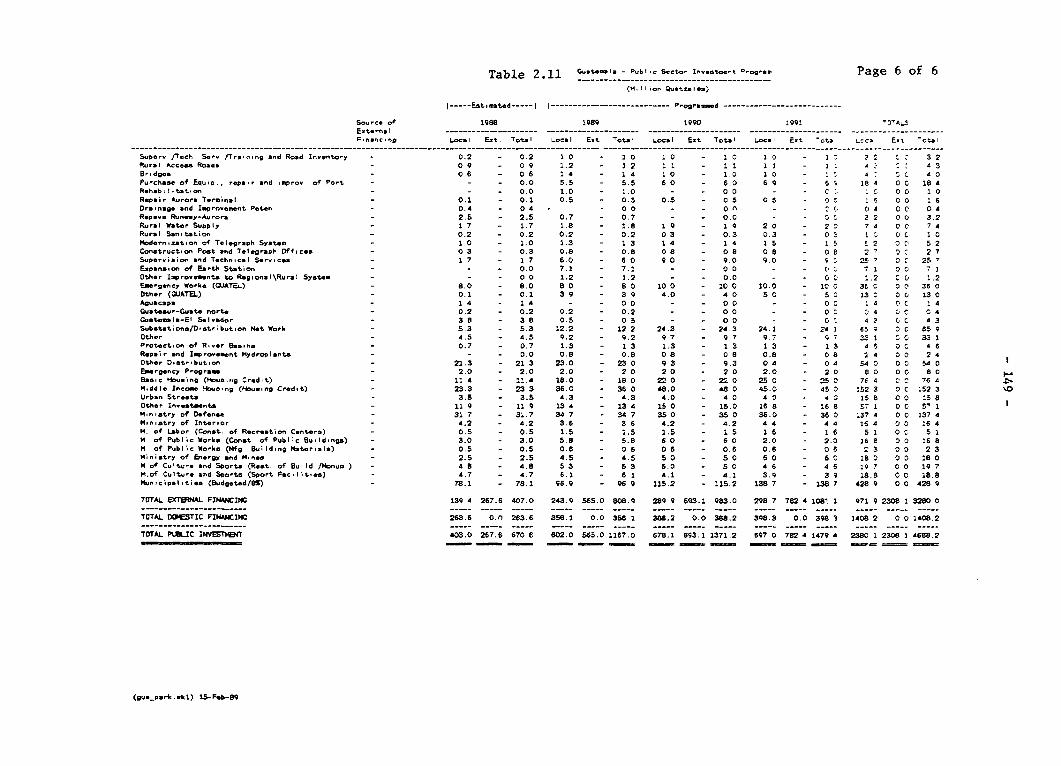
Table 2.11 1-oea- u'' eco natset. 0
-ogra Page 6 of 6
---- Eat-ated --- I I -------------- Prograed --------------
Sourc of 1988 1989 1990 1992 r..
p-n-nn Local Ext. Tot., Local Eat loa LocalI Eat
Tot., LocalI Ext ota Lnc- Ext c.te.
SuPer fl/ech Seru /Tra.-'nq and Road In-entory -0.2 - 0.2 1 0 - 2 0 1 0 - 1 0 2 0 2 3 2Rura A-ces Ro.e. 0 9 - 0 9 1.2 - 1 2 1 1 - 11 11 11 2 0 A 3Bi.dges 0.6 - 0 6 1 4 - 1 4 1 0 - 1.0 1 0 - 1t 4 S c 4 0PurChase, Of EQUip., repar and MP,o. of Port -- - 0.0 5.5 - 5.5 6 0 - 6.0 6 9 - 6 1 28 4 0 C 18 4Reheb,litati on - - 0.0 1.0 - 1.0 - - 0 0 - - c: 10 0 0 1 0Repair Aurora Tereinal 0.1 - 0.1 0.5 - 0.5 0.5 - 0.5 0 5 - D 1 6 0 0 1 6Dra.nage andlspr-eeent Paten 0.4 - 0 4 -- 0 0 - - 0" - - 00 0 4 0 0 0 4Rtesa.. Ru...ay-Anrore 2.5 - 2.5 0.7 - 0.7 - - 0.0 - - QC 32 0 0 3.2Rura Water Supply 1 7 - 1.7 1.6 - 1.8 10 - 1 9 2 0 - 21 7 4 00c 7 4Rural Sanitati on 0.2 - 0.2 0.2 - 0.2 03 - 0.3 0.3 - 035 :1 0 I 0Modernzatio of Telegraph Systee - 1.0 - 1.0 1.3 - 1 3 1 4 - 1 4 1 5 - I 5, 1 2 0 0 5 2Construction Post chd Telegraph, Dfficea - 0 3 - 0.3 0.0 - 0.8 0a8 - 0 a 0 6 - 0 6 2 ' 0 0 2 7Supe.- alec and Technical Ser-cs- 1 7 - 1 7 6.0 - 6 0 9 0 - 9.0 9.0 - 1 2.5 0 C 25'E.pas-cn of Eartls Station - - 0.0 7.2 - 7.1 - - 0 0 - - 0 7 1 0 0 7 1Other Imroveseetst to Regional\Rural Systee - - - 0 0 1.2 - 1.2 - - 0.0 - - 0 0~ 1.2 C 0 1.2fE-rgenY Wo-ke ((aJATE,) 8.0 - 8.0 8 0 - 6 0 100 - 10 0 10.0 le100 360 00C 36 0Other (WUATE.) 0.1 - 0.1 3 9 - 3 9 4.0 - 4 0 5 0 - 50 130c 00C 13 0Aguacapa 1 4 - 1 4 - - 0 0 - 0 - - 0 0 114 cC 1 4Guetesur-Guoet norte 0.2 - 0.2 0.2 - 0.2 - - 00 - 0C 4 00c 1 04Coaetesa la-El S.leader 38 a 3 8 0.5 - 0 5 - - 00 - 0 4 2 c 4 3Substationaf0istribution Not Work - 5.3 - 5.3 12.2 - 12 2 24.3 - 24.3 24.:1 24 2 65 1 0 C 85 9Other 4.5 - 4.5 9.2 - 9.2 9 7 - 9 7 9.7 - 9 7 3.31 0 0 3.11Protecti- of Rice Basins- 0.7 - 0.7 1.3 - 1 3 1.3 - 1 3 1 3 - 13 A45 00 4 6Repair and Iepronement Hlydroplants.- - - 0.0 0.8 - 0.8 0 8 - 0 8 0.8 - 0 8 2 4 0 0 2 4Other Dist-ibution 21.3 - 21 3 23.0 - 23 0 9 3 - 9.3 0 4 - 0 4 540 0 0 Sea Estergency Programs 2.0 - 2.0 2.0 - 2 0 2 0 - 2 0 2.0 - 2 0 6 0 00C 80Baaic lousingQlo-s-ngr.d,t) - 1':4 - 1.4 18.0 - 18 0 2230 - M30 25 0 - 25 0 764 C'C 7654 0Middle In,om Housin-q cn Credit) - 23.3 - 23 3 36.0 - 36 0 48.0 - 48 0 45.0 - 45 0 152 3 0 C 152 3 'Urban Streata 3.5 3.5 4.3 - 4.3 4.0 - 4 0 4 0 40 15i8 0 0 :158Other Inneatments, 11 9 - 11 9 13 4 - 13 4 15 0 - 15.0 166 a 168 5 71 0 0 5'1IMinistry of Defengse 31 7 - 3;,.7 34 7 - 34 7 35 0 - 35 0 36.0 - 36 0 !374 0 0 137 4Ministry of Interor., 4.2 - 4.2 3.6 - 3 6 4.2 - 4.2 4 4 - 4 4 164 0 0 18 4M. of Labor (Conat. of Recrea.tion Centers) - 0.5 - 0.5 1.5 - 1.5 1.5 - 1.5 1 6 - 1 6 5 1 0 C S IM of Public Works (Const. of Public Buildings) - 3.0 - 3.0 5.8 - 5.8 8 0 - 8 0 2.0 - 2.0 26 8 0 0 16.8M of Public Worka (MWg Building Mbterils) - 0.5 - 0.5 0.6 - 0 6 0 6 - 0.6 0.6 - 0 6 123 0 0 2 3Ministry of En-rgy and Mines 2.5 - 2.5 4.5 - 4.5 5 0 - 5 0 6 0 - 6 0 160 00D i 10M ol Cultire and Soorts. (Rest. of Bu Id IMonum - 4 8 - 4.8 5 3 - 5 3 5.0 - 5 0 4 6 - 4 6 19 7 0 0 19 7Mocf Culture and Sports (Sport Facilities) - 4.7 - 4.7 6.1 - 6 1 4.1 - 4.1 3.9 3 9 16.6 0 0 18.8Itnicipalities (udgeted/OS) 78.1 - 78.1 68.9 - 94 9 115.2 - 115.2 138 7 - 136 7 428 9 0 0 428 9
TOYTAL EXrERNAL FIN4AMINC 139 4 287.6 407.0 243.9 565.0 808.9 289 9 693.1 983.0 298 7 782 4 108'. 1 971 9 2308 13280 0
TOTAL DOMETIC F13N81C1WC 263.6 0.0 263.6 359.1 0.0 388 1 308.2 0.0 388.2 39B.3 0.0 398 3 1408 2 0 0 1400.2
TOrTAkL RELIC INVESTMENT 403.0 267.6 670 6 802.0 565.0 1167.0 678.1 893.1 1371.2 697 0 782 4 1479 4 2380 1 2308 2 4688.2
(gu pek .kl)15-Feb-89

- 150 -
Table 3.1
Government Expenditures on Agriculture, 1980
Country per hectare of cropland per person employed(current US$/hectare) in agriculture
(current USS/person)
Argentina 9 279Bolivia 181 136Brazil 169 485Chile 163 393Colombia 195 377Costa Rica 119 143Guatemala 18.7 85.1Mexico 296 663Peru 177 137Venezuela 538 1,004United States 244 9,412
Source: Governent Expenditures on Agriculture and Agricultural Growth inLatin America, by Victor J. Elias, International Food PolicyResearch Institute 1975-85, October 1985.
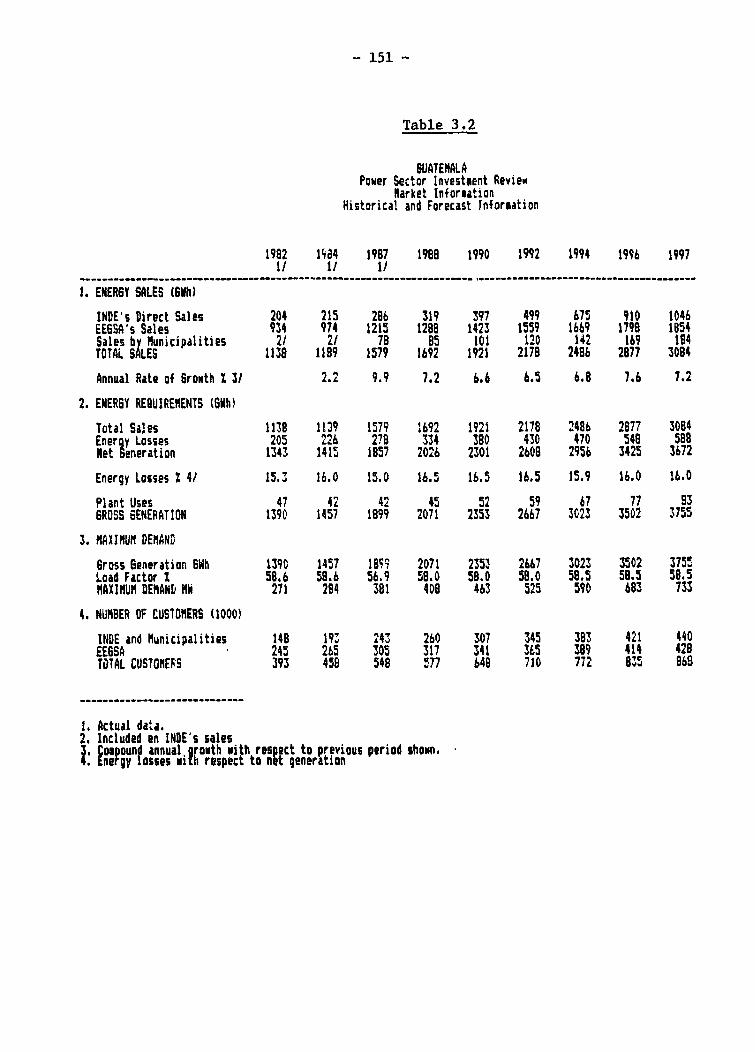
- 151 -
Table 3.2
GUATENALAPower Sector Investment Review
harket InforaationHistorical and Forecast Jnformation
1982 1584 1987 1988 1990 1992 1994 1996 19971/ 1/ 1/
1. ENERGY SALES (6h0)
INDE's Direct Sales 204 215 286 319 397 499 675 910 1046EE6SA's Sales 934 974 1215 1288 1423 1559 1669 1798 1854Sales by Municipalities 2/ 2/ 7B 85 101 120 142 169 194TOTAL SALES 1138 1189 1579 1692 1921 2178 2486 2877 3084
Annual Rate of GroNth X 31 2.2 9.9 7.2 6.6 6.5 6.8 7.6 7.2
2. ENERGY REQUIREMENTS (OWh)
Total Sales 1139 1139 1579 :692 1921 2178 2486 2877 3084Energy Losses 205 226 278 334 380 430 470 548 588Net Generation 1343 1415 1857 2026 2301 2608 2956 3425 3672
Energy Losses 2 4/ 15.3 16.0 15.0 16.5 16.5 16.5 15.9 16.0 16.0
Plant Uses 47 42 42 45 52 59 67 77 93GROSS GENERATION 1390 1457 1899 2071 2353 2667 3023 3502 3755
3. MAXIMUM DEMAND
Gross 6eneration 6Wh 1390 1457 1B85 2071 2353 2667 3023 3502 3755Load Factor % 58.6 58.6 56.9 58.0 58.0 58.0 58.5 59.5 58.5MAXIMUM DEMAND MW 271 2B4 381 408 463 525 590 683 733
4. NUMBER OF CUS7OMERS (1000)
INDE and Municipalities 14B 193 24' 260 307 345 383 421 440EE6SA 245 265 305 317 341 365 399 414 428TOTAL CUSTOMERS 393 458 548 577 648 710 772 9'5 868
1. Actual data.2. Included en INDE's sales3 mound annual arauth with respect to previous period shown.: Ene gy losses ui h respect to nit generation
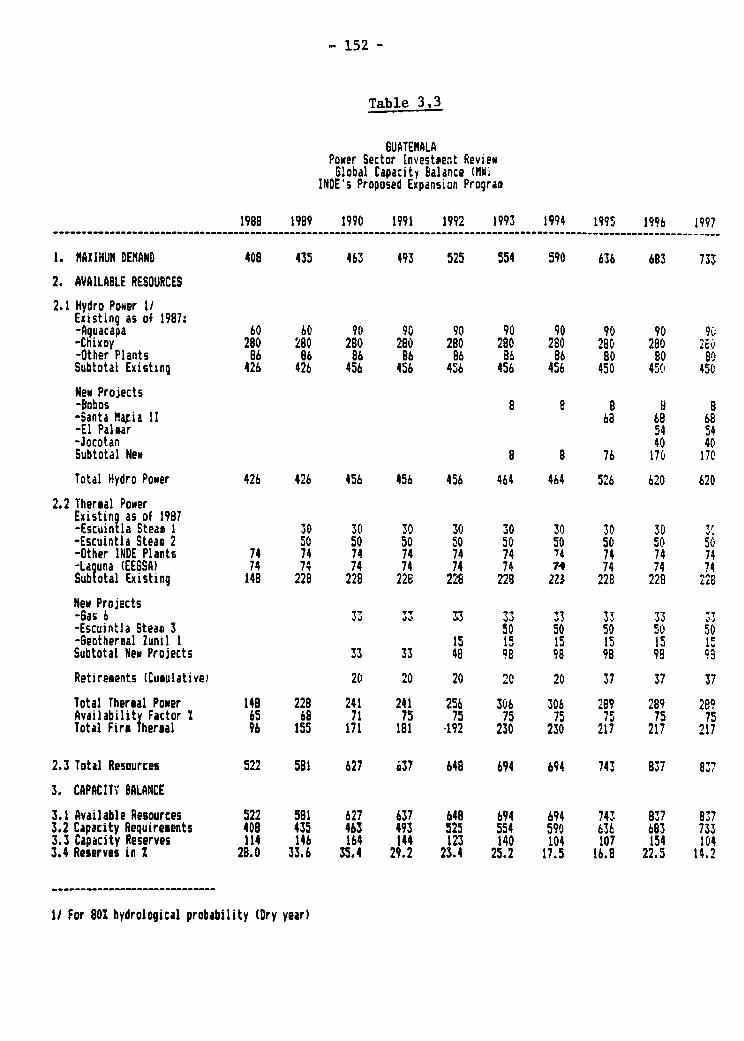
- 152 -
Table 3.3
GUATEMALAPower Sector Investment ReviewGlobal Capacity balance (MWi
INDE's Proposed Expansion Program
1988 1989 1990 1991 1992 1993 1994 19q9 1996 1997…~~~~~
1. NAXINUM DEMAND 408 435 463 493 525 554 590 636 683 733
2. AVAILABLE RESOURCES
2.1 Hydro Power 1/Existing as of 1987:-Aguacapa 60 60 90 90 90 90 90 90 90 9u-Chigcp 280 280 280 280 280 280 280 28C 280 I"-Other Plants 86 86 86 86 Bb 86 86 BO 80 80Subtotal Existing 426 426 456 456 456 456 456 450 450 450
New Projects-bobos 8 8 8 B 8-Santa MaPia II 68 68 68-El Palmar 54 54-Jocotan 40 40Subtotal New 8 8 76 170 170
Total Hydro Power 426 426 456 456 456 464 464 526 620 620
2.2 Thermal PowerExisting as of 1987-Escuin tla Steam 1 30 30 30 30 30 30 30 30 3-Escuintla Steam 2 50 50 50 50 50 50 50 50 5d-Other INDE Plants 74 74 74 74 74 74 '4 74 74 74-Ladguna (EE6SA) 74 74 74 74 74 74 74 74 74 74Subtotal Existing 148 228 228 22B 2 28 228 223 228 228 228
New Projects-Gas 6 .'3 33 3 33 33 33 33 i'-Escuintla Steam 3 50 50 50 50 50-Geothermal Zunil 1 15 15 15 15 15 isSubtotal New Projects 33 33 48 98 98 98 98
Retirements (Cumulative) 20 20 20 20 20 37 37 37
Total Thermal Power 140 228 241 241 256 306 306 289 289 289Availability Factor 1 65 6B 71 75 75 75 75 75 75Total Fire Thereal 96 155 171 181 192 230 230 217 217 217
2.3 Total Resources 522 581 627 o37 648 694 694 743 837 83'
3. CAPACITV BALANCE
3.1 Available Resources 522 581 627 637 648 694 694 743 8'7 8373.2 Capacity Requirements 408 435 463 493 525 554 590 636 683 7333.3 Capacity Reserves 114 146 164 144 123 140 104 107 154 1043.4 Reserves in 1 28.0 33.6 35.4 29.2 23.4 25.2 17.5 16.8 22.5 14.2
1/ For 80Z hydrological probability (Dry year)

- 153 -
Table 3.4
GUATE¢ALAPower Sector Investment Review
Globai Enr-y Balance (EWh)IN2E s ?r^oeJ Expansion Program
198E 196$ 1990i 1991 1992 1993 1994 1995 1996 199J
1. ENER6\ REQUIREMENTS 2070 2209 2352 2504 266 2B39 3022 3260 3501 3755
2. AVAILABLE RESOURCES
2.1 Hydro Powser 1/Existing as of 1987:Axiuacap as of 1987 238 238 238 238 238 238 238 238 238 23E-ChuXaY 1308 1308 1308 1308 1308 1308 1308 1308 I1NS 13~18-Other Plants 254 254 254 254 254 254 254 254 254 254Subtotal Existing 180P 1800 1800 1800 iaoo 1800 1600 18OQ 1800 18CO
New Projects-Babos Sb 56 5b Sb 56-Santa Maria 11 177 177 177-El Palear 180 180-Jocotan 132 132Subtotal Naw 56 5b 2'3 545 545
Total Hydra Power 180') 1800 1600 1800 1800 1856 1856 2033 2345 2345
2.2 Thersal Power 21Existing as of 1987-Escuintla Steam 1 139 216 216 216 216 216 216 2!6 216-Escuintla Steam 331 362 362 362 362 362 362 362 362-Other INDE Flants 407 407 407 407 407 407 407 401 407 407-La una (EE6Si) 563 563 563 563 563 563 563 5bT 563 563Subtotal E.istlng 97 144I0 1548 1548 154e 1548 154E I'4o 1548 154B
New Projects-6as 6 165 165 165 165 165 165 165 165-Escuintla Steam 3" 350 350 35' 350 350-Geothermal Zunil 1 69 164 164 164 164 164Subtotal New Projects 165 165 254 679 679 bg9 679 675
RetiromentF (Cumulative) 79 79 79 79 79 160 160 160
Total Thermal Power 970 1440 1634 1634 1723 2148 2148 2067 2067 2067Availibility Factor . 70 75 80 8 80 6O 80 80 80 80Total Fire Thersal 679 1080 1307 1307 1378 1718 1718 1654 1654 1654
2.3 Total Resources 2479 28B0 3107 3107 3178 3574 3574 36b. 3999 3999
3. ENER6Y BALANCE
3.1 Available Resources 2479 2B80 3107 3107 3178 3574 3574 3687 3999 39993.2 Energy Requirements 2070 2209 2352 2"04 2666 2839 3022 3260 3501 37553. Energy Reserves 409 671 755 603 512 735 55' 427 498 2413.4 Reserves in S 19.8 30.4 32.1 24.1 19.2 25.9 18.3 13.1 14.2 6.5
1/ For 80X hydrological probability (Dry year)2/ Excludes generation during scheduled maintenance

- 154 -
Table 3.5 Power Plant Additions
Capacity Cost INDE'sName and Type 14W US$ Mill. Program
Gas Turbine No. 6 (Thermal 33.0 20.0 1990Zunil 1 (Geothermal) 15.0 23.5 1992Steam Unit No. 3 (Thermal) 50.0 69.0 1993Rio Bobos (Hydro) 9.0 16.0 1993Santa Maria 2 (Hydro) 68.0 90.0 1995El Palmar (Hydro) 55.0 81.6 1996Jocoton (Hydro) 40.0 120.0 1996Serchil (Hydro) 80.0 240.0 1998Geothermal 2 55.0 90.0 1999Chulac (Hydro) 330.0 600.0 2001Xalala (Hydro) 320.0 600.0 2003
Source: INDE
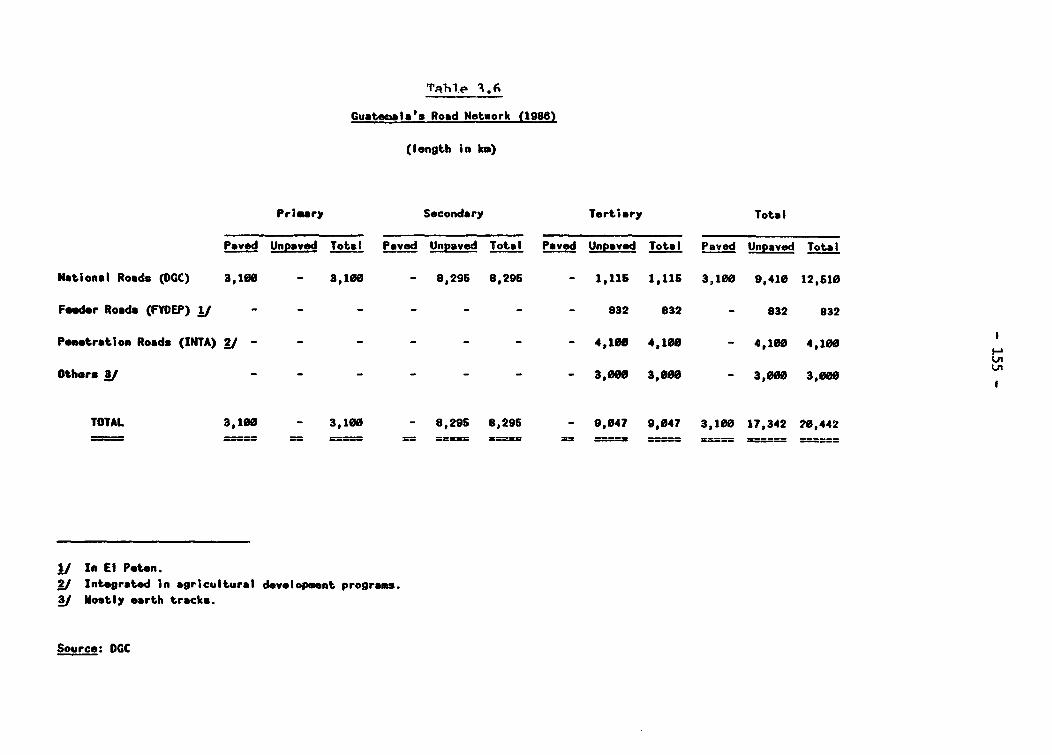
Tahle A.6
Guatemala's Road Network (1988)
(length in ki)
Primary Secondary Tertiary Total
Paved Unpaved Total Paved Unpaved Total Paved Unpaved Total Paved Unpaved Total
National Roads (DCC) 3,100 - 3,100 - 8,295 8,296 - 1,115 1,115 3,100 9,410 12,510
Feedtr Roads (fYDEP) j/ - - - - - - - 832 832 - 832 832
Penetration Roads (INTA) V - - - - - - - 4,100 4,100 - 4,100 4,100
OthersJ - - - - - - - 3,000 3,000 - 3,000 3,000
TOTAL 3,100 - 3,100 - 8,295 8,295 - 9,047 9,047 3,100 17,342 20,442
)J In El Peten.V Integrated In agricultural development programs.
PJ Uostly earth tracks.
Source: DGC
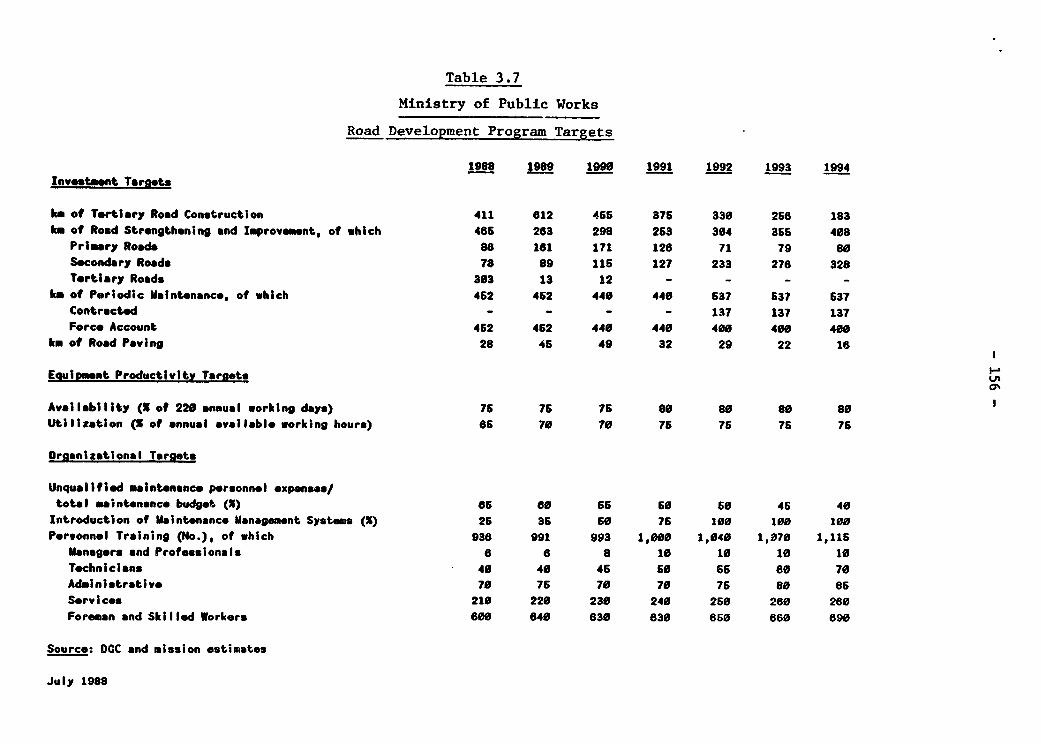
Table 3.7
Ministry of Public Works
Road Development Program Targets
1988 1986 1090 1991 1992 1993 1994Investment Targets
km of Tertiary Road Construction 411 612 455 375 330 25S 183km of Road Str.ngthening and Improvemnt, of which 465 263 298 253 304 355 408
Primary Roads 8 161 171 126 71 79 80Secondary Roads 78 89 115 127 233 276 328Tertiary Roads 363 13 12 - - - -
km of Periodic Maintenance, of which 462 462 440 440 637 537 637Contracted - - - - 137 137 137Force Account 462 462 440 440 400 400 400
km of Road Paving 28 45 49 32 29 22 18
Equipment Productivity Taractsa%
Availability (S of 220 annual working days) 76 76 76 80 80 80 80Utilization (X of annual available working hours) 65 70 70 75 76 7S 76
Oranizastional Targets
Unqualified maintenance personnel exponses/total maintenance budget (X) a6 60 66 50 50 46 40Introduction of Maintenance Managment Systems (X) 26 35 50 76 100 100 lOOPer.onnel Training (No.), of which 938 991 993 1,000 1,040 1,070 1,116
Managers and Professionals 6 6 8 10 10 10 10Technicians 40 40 46 50 66 60 70Administrotive 70 76 70 70 76 80 85Services 210 220 230 240 250 260 280Foreman and Skilled Workers 600 640 630 630 650 660 890
Source: DCC and mission estimates
July 1988
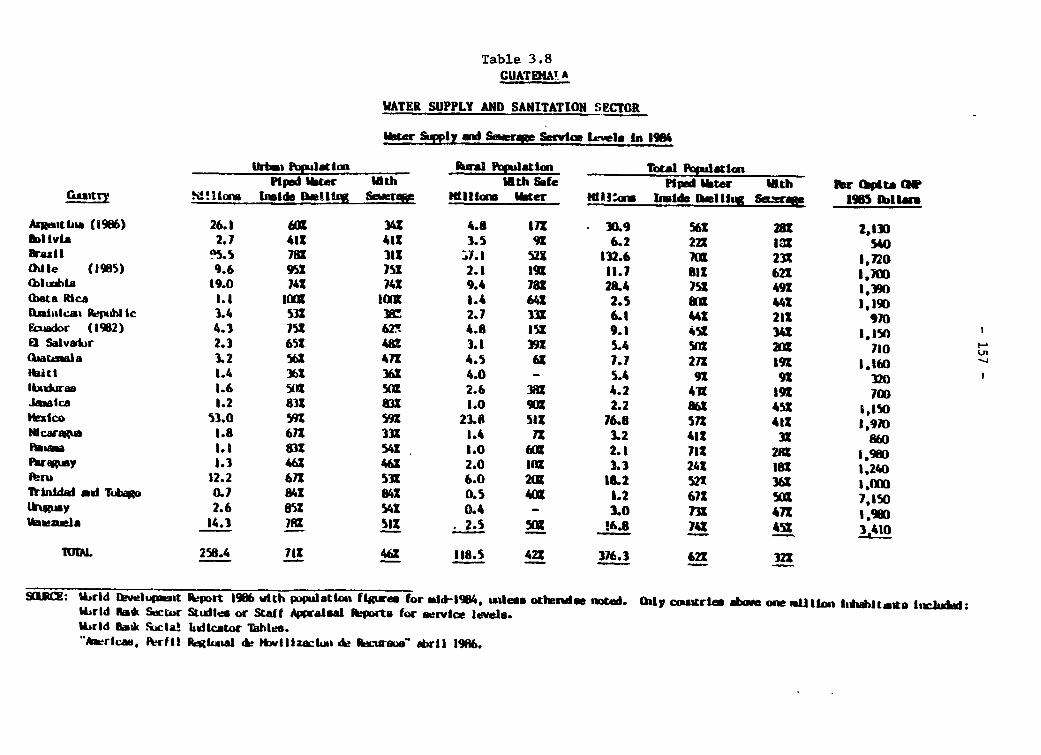
Table 3.8CUATEKA' A
WATER SUPPLY AND SANITATION SECTOR
Whar SuFply al Snrqp Servce Lav1g in 1984
1Ji ftipl tiJn hrkwal f4ulation Tot PapdatianPiped Water Nth Nth Saf. Pipd WIter 1th Per Ehita GW
(lwtry hMllon UWIdBe bmIIw Semroe Ni tem WIter N11h1aw Imiude b et DISl swer 190S Iblar
Aataulina (1986) 26.1 611 342 4.8 172 30.9 562 282 2,13DIbilvis 2.7 412 412 3.S 92 6.2 222 13 540hazil p5.5 781 3l1 W.1 521 132.6 70S 232 1.720aOlle (19S5) 9.6 951 751 2.1 192 11.7 all 621 1.700lla4bia 19.0 742 142 9.4 781 28.4 751 492 1.390(beta RIca 1.3 01 0ICll 1.4 6l 2.S 4 2 1,190IQklitca Reshblic 3.4 531 3r8 2.7 332 6.1 442 211 910Etador (19S2) 4.3 75S 62S 4. 135S 9.1 452 342 1,15n 5El Salvador 2.3 651 4s 3.1 392 5.4 52 2 710 I-
(kaatsla 3.2 562 472 4.5 6S 7.7 272 391 1.1601Ibitt 1.4 362 362 4.0 - S.4 9U 9 320I&xKkwas 1.6 02t SOS 2.6 381 4.2 41t 192 70DJaica 1.2 832 a3 1.0 9(1 2.2 a6u 452 9,3509n1co 53.0 59 592 23.8 SIx 76.8 571 41S 3,970Mlcareu 1.8 672 33S 1.4 72 3.2 412 32 860PIw 1.1 832 541 I.0 611 2.1 71S 2R8 I,98DParaguay 1.3 462 46Z 2.0 9(4 3.3 241 l82 1.240Pe-ru 12.2 672 532 6.0 20S 18.2 52W 36S 1,00lbrtdd ad T.j T o 0.7 842 842 O.S 4I 1.2 671 Msa 7,150tkomy 2.6 852 542 0.4 - 3.0 732 471 .lwainIa 14.3 781 Sl9 2.S 513 36.8 742 452 3.410
luW. 258.4 712 46S 118.5 422 376.3 622 322
QF3A2: %rid Ilve1upa3tt hpart 1986 wIth pVpatattu fI igwe for mid-1984, utiess otlwndm *mtM. hiy cma.trt abwe one mUIlnm 1ls'i tto 1l;l.wJ..W6rId flt Sectr Studles or Staff Appraisal ft*rts for eservice levels.Wr9d flmk .Sucia! l dlcator Tables."ricas, FLrf l Rkagal dk *bNIlizac"s de awwwe' abr11 1996.
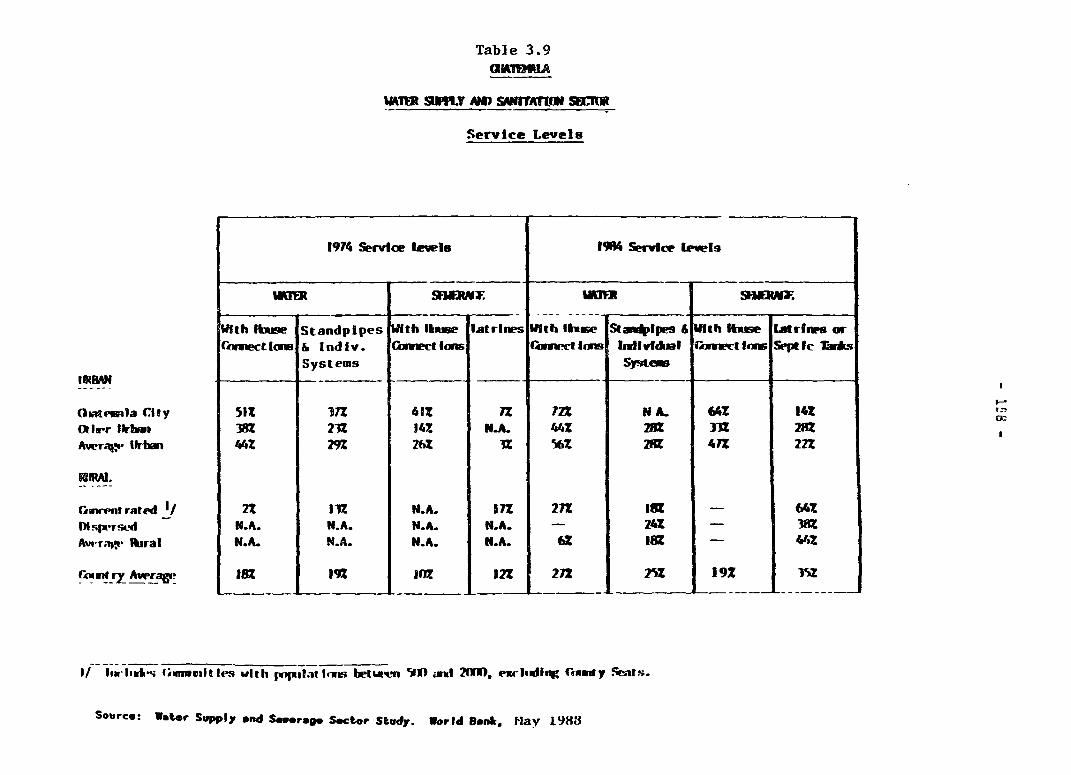
Table 3.9O*XIAWA
WIR SSUYT AM SM!AImNN M=
Service Levels
1974 Service levelo 19R4 ServIce [ewis
WRIM SOERME WK~~~MW %NE2WI.
W1ith lbse Standpipes Wi0th li,se latrines WIth l;me StaIlpes 6Wth l &se ltrEis orCiiiuect 1o & I nd iv. (Cxct lams Cnct wls llm vllidul CiwnctImSt Sq*Ic lsSystems Syst111*
---- ____ ___ __ __ . ._
Omate1a Ct:y 51% 37% 61S 7n 72? N A. 642 14%(ler lIlrbi 382 212 14% N.A. 44" 2 33? 282Aer.i-g. lIrlmn 44% 29% 26t 1% 56% 281 41? 22?
rAmrvnt rated I/ 22 112 N.A. £1? 272 Ila - 2AINsgwrsed N.A. N.A. N.A. N.A. _ 242 3_ Auvr."* IOural N.A. N.A. N.A. N.A. hZ 38? - 44zCr(UUin ry AvfrRG 18? 192 _ % 12? 212 5 192 I
l/i hl hm1s *_firvItles wIth r Iu.ululs betwen lIN) wst 21M1). exrismidir Gjwuty l;rai..
Source: Wettr Supply snd Sousrng. Sect.r Study. World Bano. Flay 1983

Table 3.10Selected Social Indicators
Middle Income Latin American Countries
Costa ElGuatemala Chile Rica Colombia Ecuador Salvador Honduras Jamiaca Nicaragua Paraguay Pert
GNP Per Capita (current USS) 940.0 1,310.0 1,590.0 1,220.0 1,040.0 850.0 780.0 960.0 830.0 1,000.,0 1,43Q.0
Population and Vital Statistics
Population Growth Rate (%) 2.8 1.7 2.6 1.9 2.9 1.S 3.6 1.4 3.1 3.3 2.6Life Expectancy at Birth 61.0 71.0 74.0 65.0 686.0 61.0 64.0 73.0 61.0 87.0 80.0Total Population (millions) 8.4 12.5 2.7 29.5 9.9 4.9 4.7 2.3 3.5 3.9 20.7Crude Birth Rate (per thous) 41.0 21.0 29.0 27.0 34.0 37.0 41.0 23.0 42.0 35.0 32.0Crude Death Rate (per thous) 9.0 6.0 4.0 7.0 7.0 9.0 8.0 6.0 9.0 6.0 IC0Infant Mortality Rate (per thous) 68.0 24.0 17.0 47.0 50.0 64.0 59.0 18.0 67.0 42.0 73.CChild Death Rate (per thous) 15.0 1.0 0.0 3.0 5.0 5.0 7.0 1.0 6.0 2.0 11.0
Food, Health and Nutrition
Per Capita Supply of Calories (per day) 2,345.0 2,544.0 2,807.0 2,588.0 2,005.0 2,155.0 2,224.0 2,578.0 2,464.0 2.873.0 2,120.0Pop. per Phyisician (per thous, 8.6 1.9 1.4 2.0 2.9 2.6 3.1 2.8 2.3 1.8 1.5 lPop, per Nurse (per thous) 1.4 - - - - - - - 0.6 0.7 -Pop. per Hospitat Bed (per thous) 0.6 0.3 0.3 0.8 - - 0.8 0.3 0.4 - 0.6 U'Access to Safe Water
(X of pop): Total 61.0 85.0 88.0 70.0 59.0 55.0 69.0 96.0 56.0 25.0 S2.0 lUrban 90.0 100.0 93.0 89.0 98.0 71.0 91.0 99.0 98.0 46.0 73.0Rural 26.0 18.0 86.0 30.0 21.0 43.0 55.0 93.0 9.0 10.0 18.0
Education
Enrollment RatesPrimary 76.0 109.0 101.0 117.0 114.0 70.0 102.0 106.0 101.0 101.0 122.0Secondary 17.0 69.0 41.0 50.0 66.0 24.0 36.0 58.0 39.0 31.0 65.0
Pupil-Teacher RatioPrimary 36.0 - 31.0 30.0 33.0 42.0 38.0 33.0 33.0 25.0 35.0Secondary 15.0 - 17.0 20.0 16.0 24.0 26.0 29.0 27.0 - -
Pupils Reac'Ning Grade 6 (m) 27.0 79.0 70.0 - 56.0 27.0 30.0 88.0 15.0 43.0 55.0Adult Literacy 1/ 55.0 84.0 90.0 81.0 81.0 62.0 60.0 90.0 90.0 84.0 80.0
Other
Energy Consumption per cap(Kg of oil equivalent) 176.0 726.0 534 0 755.0 720.0 186.0 201.0 954.0 259.0 281.0 543.r
1/ Basic Development Data, 1984. Literacy rate for Guatem la from Basic Education Sector Memorandum, 1986.Source: Social Indicators of Development, August 1987 and September 198.


![gu/fO{g gu/kflnsf - nagrainmun.gov.np · gu/fO{g gu/kflnsf gu/ sfo{kflnsfsf] sfof{no gu/fO{g, wg'iff kf]v/L 7]Ssf ;DaGwL ;"rgf k|sflzt ldlt @)&^÷)^÷)& ut] o; gu/kflnsf If]qleq /x]sf]](https://img.pdfslide.net/doc/110x75/6048d1d8ee41e10b706528b7/gufog-gukflnsf-gufog-gukflnsf-gu-sfokflnsfsf-sfofno-gufog-wgiff.jpg)


![jL/]Gb|gu/ gu/kflnsf :yfgLo /fhkq](https://img.pdfslide.net/doc/110x75/6271c26f6eef2f252a0b912c/jlgbgu-gukflnsf-yfglo-fhkq.jpg)

