Embed Size (px)
Citation preview

STATENS GEOTEKNISKA INSTITUT SWEDISH GEOTECHNICAL INSTITUTE
RAPPORT REPORT No26
STATENS GEOTEKNISKA INSTITUT SWEDISH GEOTECHNICAL INSTITUTE
RAPPORT REPORT No26
Large diameter bored piles in non-cohesive soils Determination of the bearing capacity and settlement from results of static penetration tests (CPT) and standard penetration test (SPT)
KAZIMIERZ GWIZDALA
LINKOPING 1984
ISSN 0348-0755
AS OSTGOTATRYCK UltPG 19amp4
3
P R E F A C E
The work was carried out at the Swedish Geotechnical
Institute in Linkoping during my stay in Sweden as a
scholar of the Swedish Institute
I wish to express my thanks to the Swedish Institute
for the possibility to stay and to research in Sweden
In my work and during the whole stay I have received
every possible support help and encouragement from
the Head of the Swedish Geotechnical Institute Dr Jan
Hartlen For this and for the possibility of studying
at the Swedish Geotechnical Institute I am extremely
grateful and wish to express my very best thanks
Special thanks are due to Dr Bo Berggren and Civing
Per-Evert Bengtsson for the constant and great help
given to me in the daily work at the Institute
I would like to thank all members of the staff at the
Swedish Geotechnical Institute who have helped me
during my stay in Sweden
AcKnowledgement is extended to Mrs Eva Dyrenas who typed
the manuscript a nd to Mrs Rutgerd Abrink and Mrs Irene
Aberg who made the drawings
Linkoping January 1983
Kazimierz Gwizdala
Institute of Hydro-tngineering
of the Gdansk Technical University
Poland
5
CONTENTS
Page
7SUMMARY
NOTATIONS AND SYMBOLS 9
1 LARGE DIAMETER BORED PILES IN NON-COHESIVE SOILS 11
11 Determination of bearing capacity of bored piles from results of Cone Penetration Test (CPT) 11
12 Determination of bearing capacity of the large diameter bored piles from results of the Standard Penetration Tests (SPT) 18
13 Allowable load of large diameter bored piles 22
14 Determination of settlement of large diameter bored piles based on static cone penetration tests CPT 27
15 Initial slope of pile point resistance shysettlement
REFERENCES
FIGURES
TABLES
APPENDIXES
curve 37
43
51
105
7
16 Summary
The work contains a study of the behaviour of l arge diameter
bored piles in non- cohesive soil The mai n attention was
paid to the determination of the bearin g capacity a nd
sett lement from results of Cone Penetration Test (CPT)
and Standard Penetration Test (SPT)
A new met hod to calculate bearing capacity on large bored
piles based on the in situ measurement is proposect taking
into account investigations made during the last years in
all the world The values based on the proposed method
are compar ed to field test results
The analysis of bearing capacity safety factors and loadshy
settlement curve allows to assume values individual safety
factors for resistance of pile point and shaft respectively
Based on a detailed investigation the pile point pressure
settlement curve and shaft resistance dependance during
loading a new method to predict the pile point pressure shy
displacement and load- settlement relationship is proposed
The initial slope of the point pressure- displacement curve
can be determined from in situ tests or laboratory test
based on the hyperbolic stress- strain parameters
9
Notations and symbols
Roman letters
a 1 Initial slope of the pile point resistance shysettlement curve
Ap Cross-sectional area of a pile
As Area of the pile shaft
CPT Static Penetration Test
D Diameter of pile shaft
Op Diameter of pile point
E Youngs modulus
fp Point resistance factor
fs Shaft resistance factor
F Universal safety factor
Fp Individual safety factor for ultimate resistance of pile point
Fs individual safety factor for ultimate resistance of pile shaft
K Dimensionless compression modulus
K At rest soil lateral stress coefficient0
Koc Lateral stress coefficient for fluid fresh concrete
Mo Constrained (oedometric) modulus
N30 Numbe r of blows for 030 m penetration in SPT
p Unit point resistance (contact pressure)
p (s) Unit point resistance versus settlement
Unit point resistance at failurePsf
Allowable unit point resistancePa
Sounding resistance
Average static cone penetrometer resistance close to tne pile point
qs Average static cone penetrometer resistance C along the pile
10
Ultimate point resistance of large diameter piles based on static sounding results
Ultimate skin friction resistance of large diameter piles based on static sounding results
Qa Allowable pile load
Qcp Point load of the static cone penetrometer
Qct Total load of the static cone penetrometer
Qpa Allowable point resistance of the pile
Qpu Ultimate point resistance of a pile
0 sa Allowable skin resistance of the pile
0su Ultimate bearing resistance of a pile
Qu Ultimate bearing resistance of a pile
s Settlement
sd Standard deviation
ss u Ultimate settlement for pile shaft
sv Standard variation
SPT Standard Penetration Test
t Unit shaft resistance
Ultimate unit shaft resistance
Circumference of the pile shaft
Circumference of the static penetrometer shaft
Greek letters
a Constant
B Constant
A Coefficient
microd Depth factor
v Poissonbulls ratio
v 1 Correction factor for hyperbola point resistance shysettlemen~ relationship
n Correlation coefficient
ahc Radial (horizontal stress in the concrete
ohs Radial (horizontal) stress in the soil
Ovc Vertical stress in the concrete
Ovs Vertical stress in the soil
11
1 LARGE DIAMETER BORED PILES IN NON-COHESIVE SOILS
11 peterminati on of bearing capacity of bored piles
from results of Cone Penetration Test (CPTl
The methods published in available literature up to 1976
were compiled by D Rollberg (1976 1977) It contains
totally 25 methods
- 22 use the results of static soundings (CPT)
3 use the results of standard soundings (SPT)
The failure load Qu of the pile is evaluated as the sum
of the pile point resistance Q and the pile skin reshypu sistance Qsu
(111)
Pile point resistance Q based on static soundina reshypu shysults can be expressed as
1- bull qP A ( 1 1 2)f C p
p
where
fp = point resistance factor
qP mean sounding resistance of static cone C
penetrometer in the area of the pile point
A cross-sectional area of the pilep
The pile skin resistance is expressed as
1 s -- bullq bullU middot Lih (113) fS C p
where
fs = shaft friction factor
sqc mean sounding resistance along the depth h
and skin surface area U middotLih p
1 2
The methods differ in
- the calculation of qPC
(074 to 40) Db below the pile base (Fig 11 1)
(10 to 80) Db above the pile base (Fig 1 11)
- the evaluation of the point resistance factor usually
values off gt 10 are used p
- the calculation of qsC
- the evaluation of the shaft friction factor
fs = 50-300 is applied
In Table 111 methods for determination of the bearing
capacity of bored piles are listed Rollberg 1977 The
point load the skin friction load and the ultimate total
load are evaluated for bored piles (shaft diameter D ~
03-090 m) from static sounding results in non-cohesive
soil
Calculation results based on static sounding measurements
are shown in Table 112 for pile point pile shaft and
total pile load respectively
The table shows that
- a ll methods overestimate the ultimate point resistance
- the best correlation for ultimate point resistance is
obtained with the Soviet method Trofimenkov 1974
n1 = 114
- there a re only five methods for evaluation of the ultimate
skin resistance
- all methods with exception of the Soviet norm Trofimenkov
1969 method overestimate the ultimate shaft resistance
- the Norwegian method Senneset 1974 gives the best
correlation for the ultimate shaft resistance =119n 2
- with exception of the Soviet methods the total ultimate
load is on the average overestimated by all methods
1 3
Taking into account the above results the Soviet and
the Norwegi an methods are presented below
The Soviet method JG TrofimenkgtV 1974
1 qP bullA + qsbullA (114a)Qu = Qpu+Qsu fp C p f C s s
where
11 40 DP 12 1 0 D p h+l1 qp r dhqcC l1+l2 h-12
0ct-0ceqs C u middoth s
f(qp) -+ see Fig 1 bull 1 2 fp C
f f ( qcs) -+ see Fig 1 1 3 s
The Norwegian methon K Senneset 1974
1 p A 1 s bullA ( 1 bull 1 bull 4b)-f-middotqcmiddot p + -f-q s p S C
where
11 30 D p
12 50 D p h+l11 f dhqP l1+l 2 qc
C h-12 h s 1
= f dhqc qch 0
f 20 p
f = f (q~ ) + see Fig 114 s
Note a ) The total skin friction -f-middotq~ is assumed to be
no less than 10 kPa even~ith a very little
cone penetrometer resistance
b) The poin t resistance -f-middotq~ is assumed to be
maximum 10 MPa even iJl case of very dense sand
14
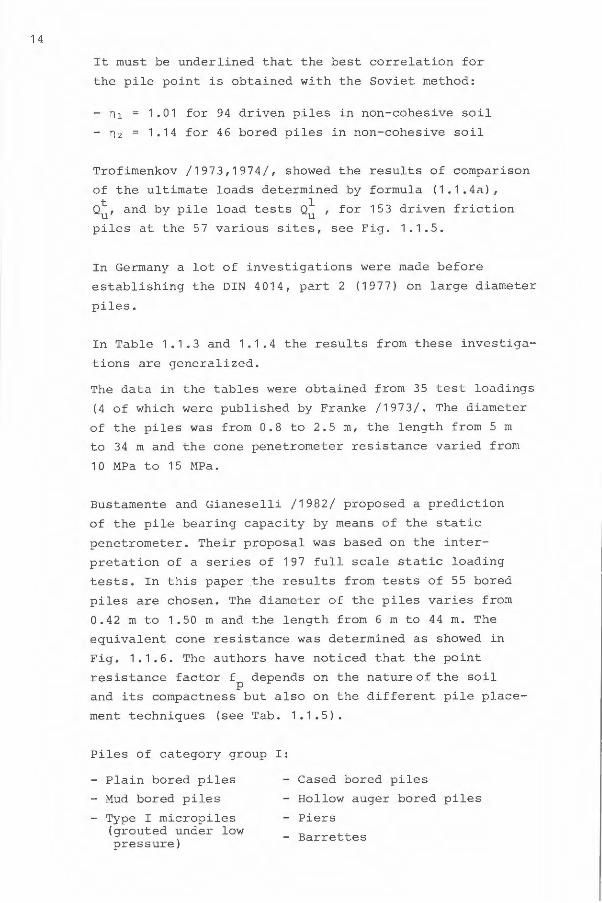
It must be underlined that the best correlation for
the pile point is obtained with the Soviet method
101 for 94 driven piles in non-cohesive soil
- 172 114 for 46 bored piles in non-cohesive soil
Trofimenkov 19731974 showed the results of comparison
of the ultimate loads determined by formula (114a)
Q~ and by pile load tests Q~ for 153 driven friction
piles at the 57 various sites see Fig 115
In Germany a lot of investigations were made before
establishing the DIN 4014 part 2 (1977) on large diameter
piles
In Table 113 and 114 the results from these investigashy
tions are generalized
The data in the tables were obtained from 35 test loadings
(4 of which were published by Franke 1973 The diameter
of the piles was from 08 to 25 m the length from 5 m
to 34 m and the cone penetrometer resistance varied from
10 MPa to 15 MPa
Bustamente and Gianeselli 1982 proposed a prediction
of the pile bearing capacity by means of the static
penetrometer Their proposal was based on the intershy
pretation of a series of 197 full scale static loading
tests In this paper the results from tests of 55 bored
piles are chosen The diameter of the piles varies from
042 m to 150 m and the length from 6 m to 44 m The
equivalent cone resistance was determined as showed in
Fig 116 The authors have noticed that the point
resistance factor f depends on the nature of the soil p and its compactness but also on the different pile placeshy
ment techniques (see Tab 115)
Piles of category group I
- Plain bored piles - Cased bored piles
- Mud bored piles - Hollow auger bored piles
- Type I micropiles - Piers (grouted under low - Barrettespressure)
15
In Tab 116 values of the shaft resistance factor
fs are given
Category IA
- Plain bored piles - Mud bored piles
- Hollow auger bored piles - Cast screwed piles
- Type I micropiles - Piers
- Barrettes
Category IB
- Cased bored piles - Driven cast piles (concrete or metal shaft)
Category IIA
- Driven precast piles - Prestressed tubular piles
- Jacked concrete piles
Category IIB
- Driven metal piles - Jacked metal piles
It can be noted that the values in Tab 116 are in
genera l of the same range for the driven and the
bored piles
According to the Polish Specification 1979 the point
and shaft resistance factor are given by
1-f- = kmiddota
p p
where
ap 035 for sand
k coefficent of unhomogeneity k qcp min
qcp
= 0065 for sandfrac12
1
16
Similar results can be observed in Fig 116a and
Fig 116b It was showed by Kerisel (1965) and Franke
(1973) that the harder soil the more loosening at
excavation and thus relatively smaller bearing capacity
Taking into account the Franke diagrams we will have
for D = 125mand settlements= 2 cm p
Cone resistance qc (MPa) 1 5 50 1 0 15 22
qc p for s=2 cm 3 6 8 12 14
(see Fia 1 1 6b )
taking safety factor for pile base F = 3 the point resis~ance
33-10 ~-05
380375 lo 212 bull lo 2114 bull
factors- shy are p
The above anal ysis shows that it is possible to determine
ultimate point and shaft resistance of bored piles from
static cone sounding But it is very important and must
be taken into account type of pile kind of soil and
degree of compaction
Bel ow calculation method for large diameter bored piles
based on the static cone penetrometer resistance (CPT)
is proposed Equation (117) can be used directly for
the base diameter D lt 15 m For larger diameters p shyD gt 15 m the values should be multiplied by the
p ff t ITscoe icen Y~ as pi
( 1 1 5 )
where
qcp = according to equation (117)
D = diameter of the pile base D gt 15 mpi pi
17
This value q~p should be put into equation 116
The value qc s in equation 118 is independent on the
pile diameter
Proposed calculation method
(116)
where)
1 1 40 ~ 11 3 for piles wit h a nd enlarged bases12 10 12 = ~
h+h
q (h) dh (117)qcp l1+l2 f -f- Ch-li p
h 1 f 1
qcs = o -f- qc (h) dh (118)h s
1 -f- = f(q kind of soil ) -+- see Fig 11 7 and Tab 1 1 7
C p
f (q kind of soil ) -+- see Fig 1 1 8 and Tab 1 1 8 fs C
Note
a) the point resistance q for qc gt 20 MPa is assumed cp to be maximum as
- Gravel 70 MPa - Coarse sand medium sand 55 MPa - Fine sand s il ty sand 40 MPa
b ) The shaft resistance qcs for qc gt 20 MPa is assumed to
be maximum as
- Gravel 110 kPa - Coarse sand medium sand 90 kPa - Fine sand s ilty sand 70 kPa
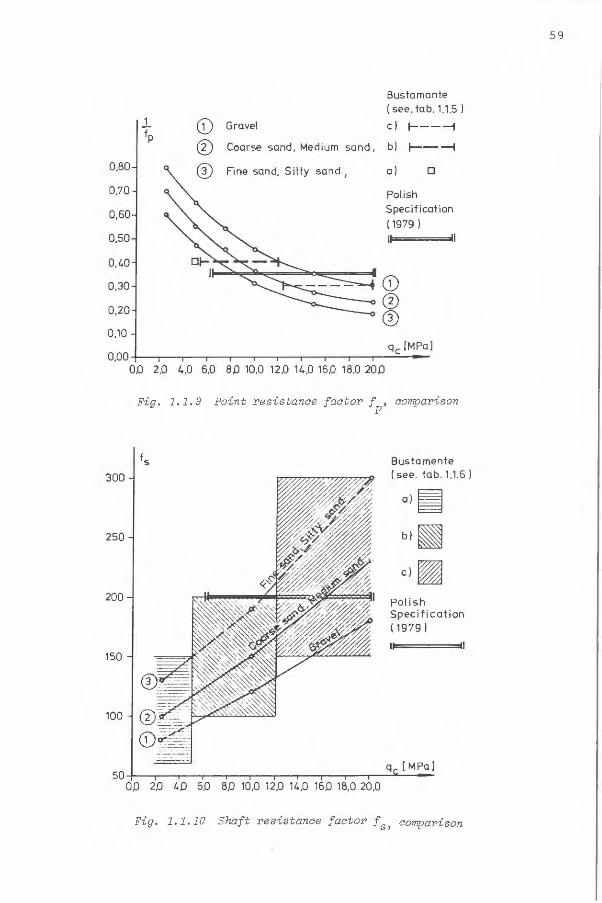
These proposed values are compared with results by
Bustamente (1 982) and the Polish Specification (1978)
Fig 11 9 and F i g 1110 A similar comparison for DIN
4014 1 977 is shown in Fig 1111 and Fig 1112
) In this paper was used the above values 1 1 and l z But it can be used in practice 11 =30 D and h =2Dp respectively The results shall be very simi l ar to the above onPs
18
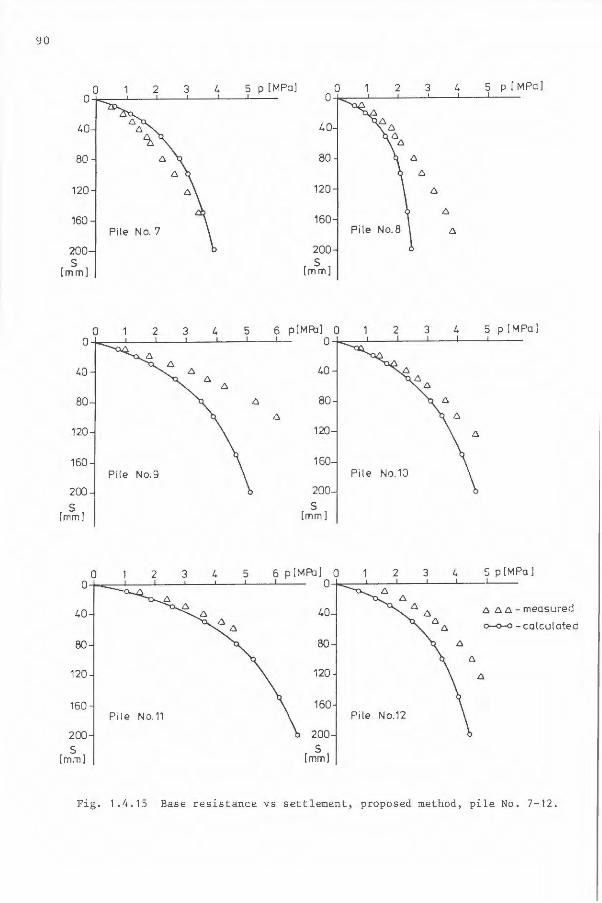
The proposed method has been examined with field test
results This is shown in Fig 1113 to Fig 1128
and Appendix 1 11 to 1110 and Tab 119
The comparison shows that the value of q in equationcp (117) corresponds to the settlement -10 of the base
diameter (s=010 DP) see Fig 1113 and Tab 119
(average sDp=88 and standard deviation sd=3)
Later in this paper the allowable load and dependence of
the load versus settlement will be determined
12 Determination of bearing capacity of the large
diameter bored piles from results of the Standard
Penetration Tests (SPT)
There are little published on pile tests coupled with
results from Standard Penetration Test (SPT) Among the
authors who have published material in the subject are
- Meyerhof 1956 1976
- Senneset 1974 (Norwegian method)
- Rodin Corbett Sherwood Thorburn 1974 (English method)
- Polish Specification 1975
- Weltman Healy 197 8
- Reese 1978
- Japanese Society 1981
- Decourt 1978 1982
The Norwegian method is valid o nly for concrete andor
wooden piles the English method only for gravel It is
very important to underline that the Norwegian a nd the
English methods use of the SPT resul ts intermediate by
the static cone penetrometer resistance (q ) as well C
Below methods are presented that are using the results of
SPT directly Meyerhof s method in total can also be used
on driven piles in non-cohesive soil Although we could
have found some proposes for bored piles Eqs (121 and
122) see Fig 121 and Fig 1 22 as well
19
Ultimate point resistance (psf)
12 N 3 omiddotH lt 120 N 30
(kPa) (1 2 1)Psf D
where
N30 the average standard penetration resistance
in blows per 03 m
H depth in bearing stratum
Ultimate skin friction tu
for bored piles tu N~ o (kPa) (1 22a)
for driven pil estu 2N30 (kPa) (1 2 2b)
where
N30 the average standard penetration resistance
in blows per 03 m within embedded length
of pile
Weltman and Healy (1978) taking into account Meherhofs
proposition for driven piles have introduced two coefshy
ficents for bored piles in gravels (glacial soil) Equ
123 and Fig 1 23
t = a 2 N30 (kPa ) (1 2 3)U 1
where
ai a 1 for impermeable gravels see Fig 123a
ai a 2 for permeable gravels see Fig 123b
The Polish Specification ( Specification for Design and
Construction of Large Diameter Bored Piles in Bridges
1975 Ministry of Transport) gives the ultimat e point
resistance in dependence of N30 base diameter and depth
see Tab 12 1 The Tab 121 contains values for coarse
and medium sand For other non-cohesive soils the following
coefficients are proposed
p f = S bull p f (medium sand) ( 1 2 4)S 1 S
20
where
S1 1 20 for grave lSi
f 132 080 for fine sand
13 3 070 for silty sand13i
In Fig 124 values of psf are shown for h = 10 m DP
06 m DP= 15 m and h = 20 m DP= 06 m DP 1 5 m
respectively
A few of the instrumented piles were tested and analyzed
by Wright and Reese (1979) The ultimate point and shaft
resistance in the fine and silty sand as a function of
blow count from SPT is shown in Fig 125 Results from
two additional tests reported by Koizumi (1971) are also
introduced in the figure The ultimate point resistance
is assumed to exist at a settlement equal to 5 of the
base diameter
Methods of prediction of the bearing capacity of piles
based exclusively on N30 values were presented by Decourt
1982 Below a proposition for high capacity piles excavated
and cast under bentoni te is presented
The ultimate skin friction is determined by the expression
(see Fig 126)
t = 33 N30 + 1 0 (kPa) ( 1 bull 2 5 ) u
where
N30 average value of N30 along the shaft
- for N30 lt 3 must be taken as = 3N30 - for N3o gt 5 0 must be taken as NJo= 50
The allowable point resistance can be obtained in a n
expedite way as
Psa = 33 N30 (kPa) (1 2 6)
where
N30 = average of Nat point level one metre above
and one metre below
Psa allowable point resistance
21
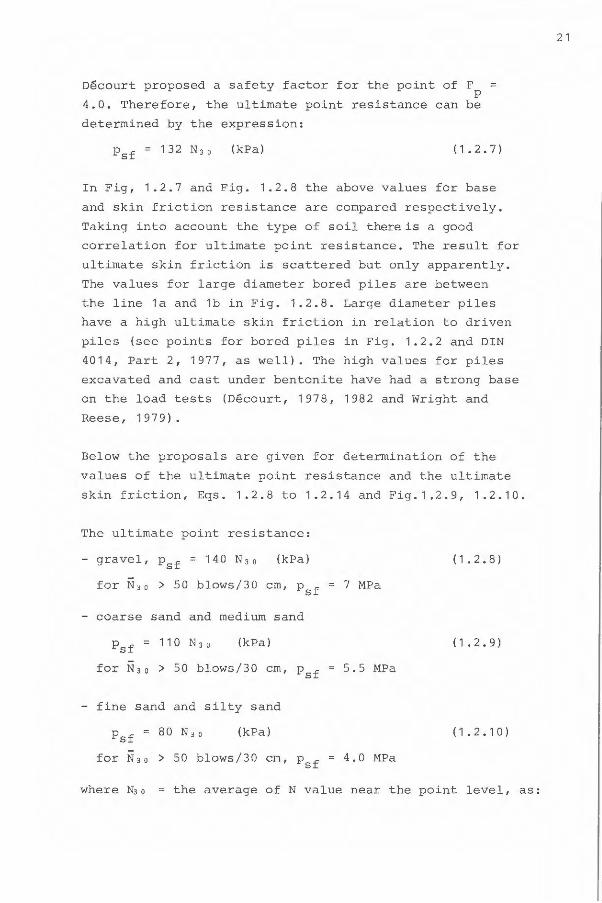
Decourt proposed a safety factor for the point of F = p
40 Therefore the ultimate point resistance can be
determined by the expression
(kPa) (1 2 7)
In Fig 12 7 and Fig 1 28 the above values for base
and skin friction resistance are compared respectively
Taking into account the type of soil thereis a good
correlation for ultimate point resistance The result for
ultimate skin friction is scattered but only apparently
The values for large diameter bored piles are between
the line 1a and 1b in Fig 128 Large diameter piles
have a high ultimate skin friction in relation to driven
piles (see points for bored piles in Fig 122 and DIN
4014 Part 2 1977 as well) The high values for piles
excavated and cast under bentonite have had a strong base
on the load tests (Decourt 1978 1982 and Wright and
Reese 1979)
Below the proposals are given for determination of the
values of the ultimate point resistance and the ultimate
skin friction Eqs 128 to 1214 and Fig129 1210
The ultimate point resistance
- gravel psf = 140 N30 (kPa) ( 1 bull 2 8)
for N~ 0 gt 50 blows3O cm Psf 7 MPa
- coarse sand and medium sand
(kPa) ( 1 2 9)
for N30 gt 50 blows3O cm Psf 55 MPa
- fine sand and silty sand
psf = 80 Nio (kPa ) (1210)
for N30 gt 50 blows3O cm p f = 40 MPa 5
where N3 o the average of N value near the point level as
22
h+l1
f N3o(h)dh ( 1 2 11 ) h-12
3DP see Fig 1 1 1 D
p
The ultimate skin friction for coarse sand and medium sand
tu = 1 8 N 3 o (kPa) (1212)
t (kPa) (excavated and cast (1213)u under bentonite)
where
N30= the average value of N along the shaft as h
N -
3 o = h1 f N 3 o ( h) dh ( 1 bull 2 bull 1 4 ) 0
The ultimate skin friction for N30 gt 50 blows30 cm is
assumed to be maximum as tu = 90 kPa and t = 150 kPa u
13 Allowable load of large diameter bored piles
The allowable load Qa of large diameter piles has been
expressed as
OuQa ( 1 3 1)Ft
Qa Q(s)=Qb(s) + Os(s) ( 1 3 2)
Opu + Osu (1 3 3)Qa Fp Fs
Qr lt mmiddotQf ( 1 bull 3 4)-
= universal safety factor
individual safety factor for ultimate resistance of the pile point
individual safety factor for ultimate resistance of the pile shaft
= load according to the allowable settlement
calculated load
m coefficient
calculated ultimate bearing load of the pile
23
The equations from (131) to (134) are used as
1) equation (131)
a) DIN 4014 - 1977 Ft= 2 175 15 (depending on the kind of load)
b) Polish Specification 1975 Ft = 18 16 ( -- )
1c) Trofimenkov 1974 Ft = 14307
2) equation (132)
a) DIN 4014-1977 i Q(s) = Qb(s) + Q (s) = A middotp(s) + E tAsmiddott(s)
s p 0
where Qbs) and Qs(s) are described in Fig 1423
3) equation (133)
a) Polish Specification 1974
F 25 22 depending on the kind of load p
F 1 bull 0 s
b) Wright SJ Reese LC 1979
The ultimate capacity or resistance is considered as a
random value and represented by a frequency distribution
The distribution can be described by a mean value and a
variance The distribution of the load applied to the
foundation can be described similarly The coefshy
ficients used to factor resistance and loads are called
partial safety factors Some recommended partial safety
factors for resistance under normal conditions of design
and construction are given in Tab 131 Normal control
is defined as a condition where the coefficient of variation
is less than about 035
Typical values for partial safety factors for loads are
in the range 1 to 2 depending on the type of load and
how it is applied The overall factor of safety Ft can
then be calculated from the equation
Ft = y RbullY S
24
where
YR the par tial sa f ety fac t or for resistance and
Ys the partial safety factor fo r load
The probability of fa i lur e of the foundation can be r eshy
lat ed to the factor of safety for a parti cular degree of
uncert ainty (see Tab 13 2)
c ) Tejchman Gwizdala 1979
The authors discuss adequate safety factors based on fie l d
test s by Spang (1 972) Franke (1976) Touma and Reese (1974)
Colombo (1971) Kerisel and Simons (1962) Appendirno (1973)
see Tab 1 33 Taking into account the universal safety
factor Ft= 2 0 for the tota l load settlement curves it
was estimated
i) F in the range of 111 to 237 with the average value s F = 166 and standard deviation sd = 034 s (see column 16 Tab 133)
ii) Fb in the range of 161 to 945 with the average
value Fb = 387 and standard deviation sd = 2 15
For model core d piles in laboratory conditions values of
Fs = 108 to 154 (average Fs = 132 s~ = 019) and
values of F = 280 to 5 94 (average F = 3 55 sd = 1 07)p p
see Tab 1 3 4
As a conclusion it was assumed that Fb = 40 and F 1 5 s
for l arge diameter bored piles
The investi gation has shown that for the above safety
factors settlements of piles under permissibl e loads are
10 to 20 mm There was assumed a maximum load on large
diameter piles corresponding to a settlement of 010
diameter of the piles
25
d) Bustamente Gianeselli 1 982
e) 0ecourt 1982
The safety factor is given by
F = FgmiddotFfmiddotFamiddotFw where
F 11 - skin friction g F 135 - point bearing capacity
g
Ff safety factor related to the formulation adapted
Ff= 10 for Decourts method
Fd safety factor related to excessive deformation
Fd = 10 for skin friction
As for the point Fa= 2 to 3 depending on the
pile diameter For usual cases 25 is suggested
Fw safety factor related to working load
Decourt recommends 12
Thus we will have
- for skin friction
Fs = 11bull10middot10middot12 132 - 13
- for the point
F = 135bull10bull25middot 1 2 = 405 = 40 p
4) equation (134)
a ) Polish Code 1983
Q lt mbullN r shy
where
total load coefficient (depending on the kind of load For foundation we can assume Yf = 12 )= code load
correction coeffic i ent
09 for pile foundations
m 08 for two piles
m 07 for single pile
26
N ymmiddotQu
ym material (soil) coefficient
ym 08 to 09 (Polish Code 1981)
Thus we will have
QnmiddotYf lt mmiddotym middotQu-
Yf9uFt = On m bull Ym
1 2 max = 2 14Ft 0 7 bull 0 8
1 2min = 1 48Ft 0909
The above analysis has shown different ways to determine
the allowable load The analysis is in direct connection
with mobilization of the load (versus settlement) The
dependence of total load point resistance and shaft reshy
sistance will be discussed in detail in Chapter 14
In the authors opinion taking into account the above
analysis the allowable load should be determined based
on the equation 133 ie based on individual safety
factors for ultimate point and shaft resistance Proposed
values of F and F in literature are shown in Tab 135 s p The average values are Fs = 145 and Fp = 3 38 respectively
Taking into account that the bearing capacity is determined
based on the results from sounding measurements direct from
a place near the piling without a ny indirect correlation
the allowable load of large diameter bored piles is given
by the equation (133a)
( 1 3 3a)
where F = 30 and F 13 are proposedp s
27
14 Determination of settlement of larqe diameter bored
piles based on static cone penetration tests CPT
Determination of ultimate point and skin friction resistance
based on static cone penetration tests has been discussed
in Chapter 11 above Based on the results of this calcushy
lation and on Chapter 13 we can establish an approximate
relation between point resistance shaft resistance and
total load on one hand and settlement on the other However
the approximation gives a wide scatter especially for base
resistance as can be observed in Fig 141 to Fig 144
Only the first part of the point resistance - settlement
curves are in good agreement with measured values It can
be observed in Fig 145 that the average correlation
coefficient n = 098 and standard deviation sd= 029
This way of calculation can be used only for rough calcushy
lation (see Chapter 13)
In Chapter 11 also measured point resistance - settlement
curves were shown The base resistance increases gradually
with increasing pressure and settlement Below the cur7
vature of the point resistance - settl ement curve will be
examined It is assumed that this curve can be described
as a part of the hyperbola curve Thus if the ratio of
the measured settlement (s ) to the point resistance (p)
is plotted against the measured settlement the result
will fall closely to a straight line with the equation
( 1 4 1)
where a 1 and b 1 are constants (see Fig 1 46a and Fig
14 6b)
Then the point resistance - settlement realtionship can be
expressed as a hyperbola
s p = ( 1 bull 4 2)
The constant is the initial s lope of the point resistanceshya 1
settlement curve ie a 1 = t~a The inverse of the constant
28
b 1 is the vertical tangent (asymptote) to the curve 1ie for s = 00
bf= ~ If the ultimate point reshy1
sistance psf is equal to bf (psf=bf) the whole point
resistance settlement curve will be a hyperbola type
Now the Eq 1 4 2 can be written as
s s ( 1 4 3)a) p s or b) p = a+__sect_a1 + 1 Psfbf
If the ultimate point resistance is smaller than bf only
a part of the hyperbola curve ought to be considered
Further the Eq 14 3 will be written as
p ( 1 4 4)
where
poundf_ correction factor for hyperbola point Psf resistance-settlement relationship
Taking into account the discussion in Chapter 11 the
ultimate point resistance psf = qcp based on the CPT measurements
Therefore the relationship between the point resistance
the sett l ement and the CPT result can be expressed as
s p (1 4 5)s
The correction coefficient v 1 will cause a change of the
position of the vertical asymptote bf in r elation to the
ultimate point resistance q bull This means that we take cp into account a different part of the hyperbola curve for
the description of the point resistance-settlement relationshy
ship
Now if we want to use the equation (145) in practice
we must determine the constant and the coefficienta 1 v 1 (assumed that q is determined ear l ier Chapter 11)cp
29
The constant a 1 and t h e coefficient Vi have been detershy
mined based on fi e ld tests according to pi l es No 1 - 20
see Tab 14 1 and Tab 1 1 9 as wel l The values of
a 1 versus the point diameter D and the ul timate pointp
resistance respectively are shown in F i g 147 and Fig
148 Fig 1 47 shows that a 1 is independent of the
point diameter D Based on Fig 148 it can be assumed p
that
28-4bullq (1 4 6)cp
This correlation has been examined with data of the
literature see Fig 1 49 and Appendix 141 to 1 45
(Note there were no static penetration tests and qcp was determined based on a correlation made by Bergdahl
(1982))
A good correlation with equation 146 can be seen taking
into account the safety factor in the DIN 4014 Part 2
(1977) bull
The correction factor v 1 versus the poi nt diameter is shown
in Fig 1410 I t is assumed that the correlation is
V1 = 3 0 - D ( 1 4 7)p
where D is in m p
The above equations ie 146 and 147 were assumed for
a later analyses see Fig 14 11 and Fig 1412 The
piles No 1 to 20 were examined taking into account Eqs
14 5 14 6 and 1 4 7 The result of this cal cul ation is
presented in Fig 1 413 to Fig 1 4 18 and in Tab 1 4 2
respectively In Fig 1413 the calculation way for pile
No 2 is shown as an example
In Fig 1414 to Fig 1 417 measured and calculated
values of the point resistance versus settl ement can be
compared In tota l good correlation exists for all the
30
pressure-settlement curves Values of q from static cp
cone penetration tests and generalized values of anda 1
v 1 were considered Only for piles No 17-20 qcp was
assumed as the point resistance for s = 010 D because p
the static penetration test results were inaccessible
The similar comparison is shown in Fig 1417a for piles
in sand based on experimental results (Tuoma Reese 1972
and Wright Reese 1979) where the ultimate case resistance
was assumed as the resistance at a base settlement of 005
D The relative base resistance is the mobilized base p resistance divided by the ultinate base resistance The
curvature of the proposed point resistance settlement shy
curve to mean value proposed by Wright and Reese is excellent
However the constant a 1 and the coefficient v 1 were
determined for sand only In the future they should be
examined especially for gravel and silty sand based on
field tests Until then in the authors opinion the
values of v 1 can be chosen from Eq 147 for all nonshy
cohesive soils But for a 1 there is proposed
at = gt bulla (1 4 8)1
where
gt- 1 = 080 for gravel
gt 2 120 for silty sand
This proposal is shown in Fig 14 11 as dashed lines
A good correlation can be seen with the investigation by I
Kiosimiddotnski for sandy gravel and on the safety side with
the investigation by Tuoma and Reese for silty sand (see
Fig 149)
In Fig 1418 all calcul ations for pile No 1 to 20 are
summarize d The correlation coefficient n is defined as
the calculated point resistance p(s) divided by measured
point resistance p(s) For totally 126 points from 20
curves an average of n = 098 with standard deviation
31
al= 023 was obtained see Fig 1418 A similar result
can be observed for the range usually assumed of the
allowable settlement for sinqle large diameter bored
piles as
for
- for
- for
s
s
s =
10
20
30
mm a
mm
mm
verage n10 II
II
mm 089
095
099
and sd =
and sd
and sd
031
027
026
It can be questioned whether the sonstant a 1 can be deshy
termined in different ways The constant a 1 is the initial
slope of the point resistance-settlement curve as menshy
tioned above Then we can use all methods for determination
of settlement of a pile point The range of validity of
these methods then must be determined This will be shown
later
In order to be able to design the total load settlement
curve the skin friction resistance-settlement relationshy
ship must be determined The ultimate skin resistance of
large diameter bored piles was determined in Chapter 11
(based on static penetration tests) and in Chapter 12
(based on standard penetration tests)
In the past a lot of field tests have been done on the
mobilization of the shaft resistance versus pile settleshy
ment In this subject there is a rather good agreement
in the whole investigation for cohesive and non-cohesive
soil
Some results and opinions on thispresented in the literashy
ture during the last few years are shown below
Ultimate shaft resistance versus settlement
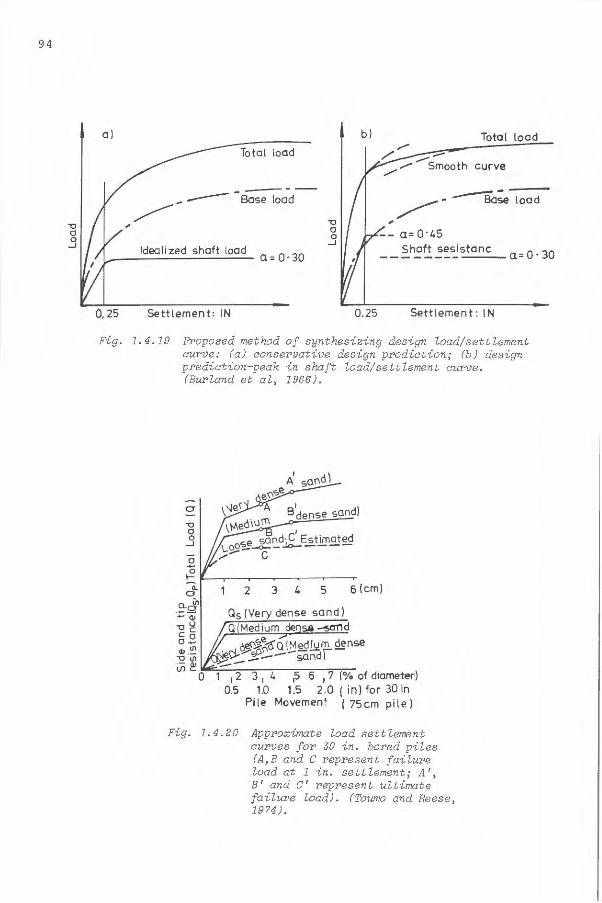
1) BurlandJB Butler FG Duncan P (1969)
-The shaft l oadsettlement curve is derived using a=0 3
with 90 ultimate load being mobilized at 025 in
settlement(~65 mm)
- soil London clay
- see Fig 1 419
32
2) Touma FT Reese LC (1974)
- The failure of the sides of the shaft takes place
at a downward movement of about 04 in (10 mm)
- soil sand
- see Fig 1420
3) Tomlinson HJ (1977)
- The maximum shaft resistance is mobilized at a
settlement of only 10 mm (or j in)
- soil stiff clay
- see Fig 1421
4) Klosinski B ( 1977)
- It was assumed that skin friction increased proshy
portionally to pile settlement up to the limit value
s bull This value depends on soil conditions and pile0 diameter and is usually from 3 to 8 mm For soft
compressible soil it may be grater than 10 mm
- soil cohesive soils
- see Fig 1422
5) Franke E Garbrecht D (1977)
- At settlement of 2 to 3 cm which are normally
allowed in Germany under working loads for buildings
not very sensitive to differential settlementsthe
skin friction is almost always fully mobilized
- soil sand
6) DIN 4014 part 2 (1977) and Franke E (1981)
- The skin friction Tm is approximated as diameter
independent having failure settlements of smf = 2 cm
in sand and 1 cm in clay
- soil sand and clay
- see Fig 1423
33
7) Reese By L (1978) Reese By L Wright SJ (1979)
(1978) The maximum skin friction being developed at
an average downward movement ranging from about 05shy
2 of the shaft diameter The average of six load tests
reported by Whitaker and Cooke (1966) are a lso plotted
for comparison
- soil stiff clays
- see Fig 1424 and Fig 1425a
(1979) The relative settlement is the average settleshy
ment of the butt and base devided by the shaft diameter
The mean curve maximises at a relative settlement of
about 002 D
- soil sand and clay
- see Fig 1425b
8) Tejchman A Gwizda3a K (1979)
- A clear differentiation of the distribution of shaft
and base resistances is observed for changing settleshy
ment For fairly small settlements the shaft resist shy
ance increases quite fast and the ultimate values
are reached soon while the base resistance increases
gradually with increasing loads and settlements withshy
out clearout ultimate values it can be assumed that
complete mobilization of shaft resistance corresponds
to settlements equal to 001 or 002 diameter of pile
- soil cohesive and non-cohesive soils
- see Tab 131 and Fig 1 426
9) Promboon S Brenner R P (1981)
- Load distribution and load transfer curves disclose
that most of the load is carried by shaft friction
which is developed at small displacements in the order
of 10 mm
- soil Bangkok clay
- see Fig 1427
34
10) Prodinger w Veder Ch (1981)
- The maximum value of skin friction resistance
occurred for a total settlement of 12 mm
- soil silty clay and sand
- see Fig 1428
11) Farr JS Aurora RP (1981)
- Ultimate load transfer was recehed (or nearly reached)
at a relative settlement of about 04 in (10 mm)
- soil gravelly sand
- see Fig 1429
12) Decourt (1982)
The skin friction resistance is totally mobilized
with deformations of about 10 mm or at the most 15
mm regardless of shaft dimensions This observation
of ours seems to clash with the opinions of other
authors who seek to relate the deformation necessary
for full skin friction mobilization with the shaft
diameter
- soil cohesive and non-cohesive soil
In Tab 143 all these results are shown Depending on
the kind of soil the following v a lue s of ultimate settleshy
ment for shaft can be assumed
- averages 142 mm (sd 5 3 mm) for sand
- averages 100 mm (sd = 21 mm) for cohesive soil
averages 726 mm (sd 67 mm) for claysand
It can be observed (see Fig 1419 to 1428) that the
shaft friction resistance increases proportionally to
the pile settlement up to the above limit value and
thereafter becomes constant
35
Taking into account what was mentioned earlier on point
resistance settlement relationship and the above results
a relationship between total load point resistance and
shaft resistance on one hand and settlement on the other
can be made see Fig 1430
It is assumed on the safety side that the following
ultimate settlement (S~) exists for the shaft resistance
of large diameter bored piles
SS1 ) 200 mm for non-cohesive soil u SS2) = 100 mm for cohesive soil u SS3) 15 0 mm for claysandu
In Fig 1 430 the curve Q (s) is calculated based on p
the equation 14 5 or 144
The values of psf in equation 144 can be calculated
based on other methods as well
The total load-settlement relationship is obtained by
summing up point and s haft resistance as
Q (s) = Q (s) + Q (s) (149)s p
for each point
Now the allowable load can be determined from equation
133a and versus the allowabl e settlement as
Q (s) = Q (s) + Q (s) (1410)s p
where s lt Sa
Sa= the allowable settlement of the pile
The analysis allows determination of the approximative
load settlement dependence without calculating the settleshy
ment for non-cohesive soil In Fig 1431 it is shown
36
In Tab 144 the settlement for allowable point reshy
sistance q5P according to equation 133a is shown
as well The average settlements= 198 mm (sd=78 mm)
is obtained This value is similar to the assumed ultimate
settlement of shaft for non-cohesive soil The ultimate
settlement for point resistance is assumed s = 010 Dp as mentioned earlier
37
15 Initial slope of pile point resistance shy
settlement curve
Settlement of piles and pile foundations can be cal culated
based on
- empirical correlations
load-transfer methods using measured relationships
between pile resistance and pile movement at various
points along the pile
- theory of elasticity that employs the equations of
Mindlin for subsurface loading within a semi-infinite
mass
- numerical methods and in particular the finite element
method
- use of in-situ tests (Cone Penetration Test Standard
Penetration Test Pressuremeter Test)
The critical slope of the pile point resistance-settlement
curve is important for calculation in chapter 14 The
constant a1 can be determined from all the above mentioned
methods
Comparison is made to Berggrens and Schmertmanns methods
below (see Berggren 1981 as well)
6sIn Tab 151 (No 1 2 3) the values of a 1 =~p for s =
10 mm and s = 20 mm (measured for large diameter bored
piles No 1 to 24) are compared to the calculated values
according to the modified hyperbola method (see Fig 14 6)
It can be seen that these calculated values are between
s = 1U-2u mm but rather closer the measured values for
the settlements= 10 mm see correlation coefficient n 6
and n 7 in Tab 151 respectively The average correlat i on
coefficent for the settlements= 10 mm is n9 = 108 and
the standard deviation is sct = 014 The comparison to
Berggrens and Schmertmanns methods for s = 20 mm ( see
Berggren 1~81 and Tab 151 as well) shows that the
results based om these methods give too high values of a 1 bull
38
The average values are ne= 143 sd = OJ3 and ng= 137
sd = 037 for Berggrens and Schmertmanns methods
respectively A bit better agreement can be observed
for Schmertmanns method
Taking into account the results in Tab 151 ana Tab
15l it must be assumed that for the determination of
a 1 the pile point contact pressure p(a1) should be
assumed as the ultimate point bearing capacity devided
by about 4
p(ai) - ( 1 bull 5 1 )
Most of the methods for determination of settlement are
based on the theory of elasticity The settlement ot the
pile point can be expressed as the average settlement of
a rigid circular foundation from the equation
11-Dp 1-v 2
s = p -4- -E-bull microd (1 ~ 2 J
where
p pile point contact pressure
E Youngs modulus
D diameter ot pile pointp ) = Poissons ratio
microd = depth factor
The range of validity of the pile point contact pressure
was determined in equation 151 Youngs modulus has an
important meaning lt can be determined from triaxial
tests or oedometer tests The relationship between the
constrained (oedometric) modulus Mo and Young s modulus
Eis dependent on Poissons ratio v as expressed by the
equation
E = l 1 + V ) ( 1 - 2 V ) Mo ( 1 bull 1 bull 1)- 1-v
39
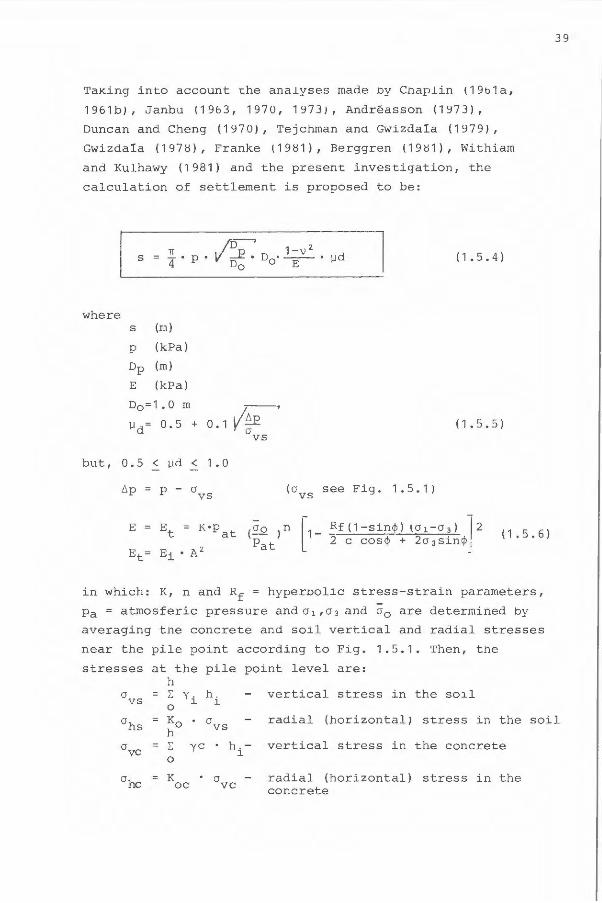
TaKing into account the analyses made ny Chaplin (19b1a
1 961bJ Janbu (1 963 1970 1973J Andreassen (1973)
Duncan and Cheng (1970) Tejchman anct Gwizdala (1979)
Gwizdala (1978) Franke (1981) Berggren (1981) Withiam
and Kulhawy (7981) and the present investigation the
calculation of settlement is proposed to be
s = 24 bull p bull ~ D bull 1-v 2 bull micro d (154)Do o E
where s (r1)
p (kPa)
Dp (m)
E (kPa)
D0 =10 m
micro = 05 + 01 vfrac34E (1 5 5)d vs
but 05 lt microd lt 10-tip= p - (J (ovs see Fig 151)vs
E =Et= Kbullpat (Oo )n [1- Rf(1-sinltj) 101 - 03 ) 12 (1 5 6)2 c cosltP + 2o 3 sinltP 1Pat
in which K n and Rf= hyperbolic stress-strain parameters
Pa= atmosferic pressure ando 1 o 3 and o0 are determined by
averaging the concrete and soil vertical and radial stresses
near the pile point according to Fig 151 Then the
stresses at the pile point level are h
(J vs = L
0 Yi h
l vertical stress in the soil
0 hs Ko h
0 vs radial (horizontal) stress in the soil
0 vc L ye h -l
vertical stress in the concrete 0
0 hc K oc a vc radial (horizontal)
concrete stress in the
40
K at rest soil lateral stress coefficient 0
K c lateral stress coefficient for fluid fresh concrete0
K 1 0 oc
and average values
a 05(a +a)V vc vs
1 1 - shy~ = -(a +a+a I = -3 (av+2ahJ the applied mean normal stress0 j Z X y
Assuming this model calculation results for piles No 1-24
(see Tab 11~ as well) are shown in Tab 153
The piles are embedded mainly in medium sand to fine sand
For this kind of soil it can be assumed (soil parameters
from field or laboratory tests were inaccessible)
~ = 35deg c = 0 R~ = 09 n 05 v = 025 K c 10l 0
K = 04 Pat= 1UO kPa ye 24 kNrn 3 y = 14 kNm 3 bull0 C
Moreover in Tab 153 the following symbols are used
p(a1 ) - pile point contact pressure according to equation
1 bull 5 1
s(a1) - settl ement of pi l e point according to equation
143 and Tab 141
pound TT ( 2E = s bull Dp bull i 1-v ) according to equa~ion 152t
E~ Et bull microltl
EI
K = ro~ - according to equation 1 bull 5 6 p bullO middotA2
a~ o
E = E voD middot D middot ~4 ( 1 - v 2 ) according to equationt S p O 0
1 5 4
Et= E microd
K = according to equation 156 V PatmiddotaomiddotA2
41
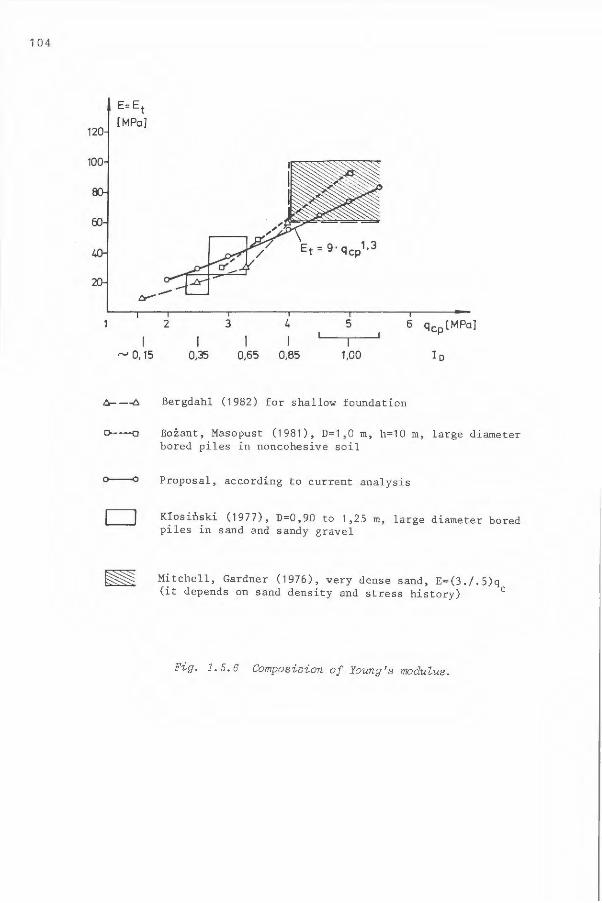
The calculation results of Youngs modulus E = Et and
dimensionless canpressionrro1ulus for piles to 1-24 are shown
in Fig 152 to 155 using equation 152 and 15b
or equation 1~4 and 156 respectively lt can be obshy
served that the scatter in Fig 153 and Fig 155
where the influence of tne pile diameter is reduced
compare equation 154 is less than in the other figures
The reduced influence was made after observations from
field and laboratory tests while the equation 152 is
taken direct from theory of elasticity These values of
E and K are in good correlation with published values in
literature The values of Youngs modulus versus the
relative density of soil are compared to literature values
see Fig 15b Based on the analysis in this chapter it
can be assumed that
E = 9-ql 3 ( 1 bull 5 7)cp
where qcp is in accordance with equation 117
The calculation results based on this proposal are incluced
in Tab 1 5 3
The c a lculate d s e ttlements based on e q ua tion 154 and
157 are shown in column 23 and the values of the
correlation coef f icie nt (n= Seal ) in column 24 respectshyimeas
ively
The dimensionless canpression modulus can be d e termined as
K = 15Ubullq (qcp in MPa) (1 5 8)cp
see column 25 Tab 153
The calculation results based on the K compression modulus
according to equation 158 156 and 1 5 4 are shown in
columns 25 26 2 7 28 and 29 in Tab 153
42
For comparison and for determination of the range of
validity of this method the caLculation results of
pile point pressure for settlements s = 10 mm s = 20 mm
s = 30 mm (see Tab 141) according to equation 157
and 154 are shown in columns 30 to 35
The results obtained in Tab 153 confirm the possibility
to use the proposed method to calculate the initial part
of the pile point resistance settlement curve of large
diameter bored piles in non-cohesive soil and the initial
slope of this curve as well
A simple model has been proposed based on the theory of
elasticity ana the tangent modulus defined by Janbu (1963)
and Duncan amp Chang (1970)
A new approach according to the pile diameter depth factor
and principal stress is proposed
The settlement of the pile point can be made up to a point
pressure according to equation 151 on up to a settlement
of about s ~ 20 mm (30 mm)
-- The application of v Op in equation 1 5 4 a llows us ing
Youngs modulus as independent of the pile diameter
opposed to Bazants a nd Mosopusts (1981) proposal where
Youngs modulus wa s determined versus the pile diameter
The equation 1 5 6 takes into account the dependence of
Youngs modulus on depth (or overburden pressure) as
well
In the method field test (Cone Penetration Test) or
laboratory tests (hyperbolic stress-strain parameters
can be used
Comparison of the method to 24 availa ble load test r e sults
or large diameter bored piles in sand shows good a greement
to calculated and measured values
43
REFERE~CES
Adamczyk J (1978) Okreslanie udzwigu pali wierconych
za pomoca sondy statycznej (Bearing capacity of bored
piles based on the static sounding) Inz i Bud No 7
pp 253-257
Andreasson L (1973) The compressibility of cohesionless
soils Thesis Chalmers University of Technology
G6teborg (in Swedish)
Appendino M (1973) Comportamento di un palo di grande
diametro strumentato Rivista Italiano di Geotechnica
No 3 pp 115-118
Butterfield R Banerjee P (1971) A rigid disc embedded
in an elastic half space Geotechnical Engineering
Vol 2 pp 35-49
Bozant z Mosopust J (1981) Drilled pier design based
on load settlement curve X ICSMFE Stockholm Vol 2
pp 615-619
Begemann HK (1982) Cone penetration tests pile bearing
capacity and the thesis of Rollberg Proc of the Second
European Symposium on Penetration Testing Amsterdam
pp 433-438
Berggren B (1981) Bored piles on non-cohesive soils shy
settlement and bearing capacity (in Sweden) Thesis
Department of Geotechnical Engineering Chalmers
University of Technology G6teborg
Bergdahl UB (1979 1982) Sonderingen und in situ Messungen
Wien 18-19 Juni 1979 - Private information 19821983
Bustamante M Giane selli L(1982) Pile bearing capacity
prediction by means of static penetrometer CPT Proc
of the Second Europ Symp on PenTest Amsterdam
Vol 2 pp 493-500
Chaplin TK (1961a) An experimental study of the settleshy
ment of footings in sand PhD Thesis Univ of
Birmingham
44
Chaplin TK (1961b) Compressibility of sands and settleshy
ments of model footings and piles in sand 5th Int
Conf on Soil Mech a Found Engng Vol 2 p 33 Paris
Colombo P (1971) Observazoni sul comportamento ltli pali
a grande diametro Rivista Italiana di Geotechnika
No 3 pp 163-172
Dahlberg R (1975) Settlement characteristics of preconshy
solidated natural sands Swedish Council for Building
Research D11975
De Beer EE (1964) Some considerations concerning the
point bearing capacity of piles Proc Syrop Bearing
Capacity of Piles Boorkee I pp 178-204
Decourt L Quaresma AR (1978) Capacidade de Carga de
Carga de Estacas a partir de Valores de SPT VI Conshy
gresso Brasilerio de Mecanica dos Solos e Engenharia
de Fundacoes - Rio de Janerio - ABNS
Decourt L (1982) Prediction of the bearing capacity of
piles based exclusively on N values of the SPT Proc
of the Second Europ Syrop on Penetration Testing
Amsterdam Vol 1 pp 29-34
Duncan MJ Chang CV (1970) Non-linear analysis of stress
and strain in soils Journal Soil Mech Found Div Vol
96 SM5 pp 1629-1651
Durgunoglu HT (1979) Effect of foundation embedment on
stress and deformation distributions Third Int Conf
on Num Meth in Geomechanics Aachen pp 925-928
Farr JS Aurora RP (1981) Behaviour of an instrumented
pier in gravelly sand Proc of a session Drived Piers
and Caissons sponsored by the Geotech Eng Div of the
ASCE Nat Convention St Louis Missouri pp 53-65
Franke E (1981) Point pressure versus length and diameter
of piles X ICSMFE Stockholm Vol 2 pp 717-722
45
Gregersen os Aas G and Dibiagio E (1973) Load tests
on friction piles in loose sand Proc of the Eigth
International Conference on Soil Mech Moscow USSR
Vol 21 pp 109-117
Gwizda1a K (1978) Behaviour of large diameter bored piles
in non-cohesive soil (in Polish) Archiwum Hydrotechniki
Vol XXV No 2 pp 183-217 (English summary)
Huizinga TK (1951) Application of Results of Deep
Penetration Tests to Foundation Piles Building Research
Congress Vol 1 p 173
Janbu N (1963) Soil compressibility as determined by
oedometer and triaxial tests Proc Europ Conf Soil
Mech and Found Eng Vol 1 p 19 Vol 2 (Discussion)
p 17 Wiesbaden
Janbu N (1970) Grunlung i geoteknikk Tapir Forlag NTH
Trondheim
Janbu N Bjerrum L Kjaernsli B (1973) Soil Mechanics
applied to some engineering problems Norw Inst Publ
No 16 Oslo
Japanese Society SMFE (1981) Present state and future trend
of penetration testing in Japan Separate report at
X ICSMFE Stockholm
Kjekstad O Lunne T (1979) Soil parameters used for design
of gravity platforms in the north sea Second Int Conf
on Behaviour of Off-shore structures London Vol 1
pp 175-192
Klosinski B (1977) Bearing capacity of large diameter bored
piles IX ICSMFE Tokyo Vol 1 pp 609-612
Laboratory for soil mechanics Delft (1936) The predetershy
mination of the required and the prediction of the
resistance of piles Proc 1 Int Conf on Soil Mech
and Found Engng Cambridge (Mass) I p 181
46
Matich M and Stermac A (1971) Settlement performance of
the Burlington Bay Skyway Canadian Geotechnical Journal
Val 8 pp 252-271
Mccammon NR and Golder HQ (1970) Some loading tests
on long pipe piles Geotechnique London England
Val 20 pp 171-184
Meigh AC (1971) Some driving and loading tests on piles
in gravel and chalk Proc of the conference on beshy
haviour of piles London England pp 9-16
Mitchell JK Gardner WS (1976) In situ measurement
of volume change characteristics American Society of
Civil Engineers Specialty Conference on In-situ
Measurements of Soil Properties Raleigh 1975 Proc
Val II pp 279-345
Mezenbach E (1961) The determination of the permissible
pointload of piles by means of static penetration tests
Proc 5 Int Conf on Soil Mech and Found Engng
Paris II pp 99-104
Meyerhof CG (1956) Penetration tests and bearing capacity
of cohesionless soils Proc Amer Society of Civ Engng
SM 1 Pap 866 pp 1-19
Meyherhof GG (1 976) Bearing capacity and settlement of
pile foundations Proc Amer Society of Civ Engng
Journal Geotechnical Engineering Division Val 102
No GT3 pp 197-227
Mohan D Jain GS and Kumar V (196 3 ) Load bearing capacity
of piles Geotechn Val XIII pp 76-86
Nixon I (1982) Standard penetration test State of the
art report Proc of the Second Europ Symp on Pen
Test Amsterdam Val 1 pp 3-20
47
Nunes A Vargas M (1953) Computed bearing capacity of
piles in residual soil compared with laboratory and
load tests Proc of the Third International Conference
on Soil Mechanics Zlirich Switzerland Vol 2 pp 75-79
Nordal S Grande L Janbu N (1982) Prediction of offshy
shore pile behaviour The Norwegian Institute of
Technology Trondheim
Ohde J (1939) Zur Theorie der Druckverteilung im Baugrund
Der Bauingenieur Vol 20 No 3334 p 451
Parroth E (1972) Einfache Formel zur Vorausbestimmung der
Tragfahigkeit von Standpfahlen mit Hilfe der Sande
Bautechn 9 pp 312-314
Poulos HG Davis EH (1980) Pile foundation analysis
and design New York - J Wiley and sons
Prodinger W Veder Ch (1981) Bearing capacity of floating
groups of diaphragm walls Proc X ICSMFE Stockholm
Vol 2 pp 809-814
Promboon S Brenner R (1981) Large diameter bored piles
in Bangkok Clay Proc X ICSMFE Stockholm Vol 2 pp
815-818
Reese L (1978) Design and construction of drilled shafts
ASCE JSMFD Vol 104 No OT1 pp 95-116
Rodin s Corbett BO et al (1974) Penetration testing in
United Kingdom state-of-the-art-report Proc Europ
Symp on Penetration Testing 1 Stockholm pp 139-146
Rollberg D (1976) Bestimmung des verhaltens von Pfahlen
aus sandier und rammengebnissen Heft 4 FBG Technische
Hochschule Aachen
Rollberg D (1977) Determination of the bearing capacity
and pile driving resistance of piles using soundings
Publications of the Institute for Found Eng Soil Mech
Rock Mech and Water Ways Construction Aachen Vol 3
48
Schmertmann J (1970) Static cone to compute static
settlement over sand Journal of the Soil Mech and
Found Division ASCE SM3 pp 1011-1043
Schmertmann J Hartman JP Brown PR (1978) Improved
strain influence factor diagrams Journal of the Soil
Mech and Found Division ASCE GT8 pp 1131-1135
Shibata T Hijikuro K and Fominerga M (1973) Settlement
of a blast furnace foundation Proc of the Eighth Int
Conf on Soil Mech Moscow USSR Vol 13 pp 239-242
Spang J (1972) Die Bestimmung der Tragfahigkeit von Grossshy
borhpfahlen (I) Strassen und Tiefbau No 2 pp 339-355
Senneset K (1974) Penetration testing in Norway State-ofshy
the-art-report Proc Europ Symp on Penetration Testing
Stockholm I pp 85-95
Tejchman A Gwizdala K (1979) Analysis of safety factors
of bearing capacity for large diameter piles Proc VII
ECSMFE Brighton Vol 1 pp 293-296
Thorburn s and Mac Vicar R (1971) Pile load tests to
f a ilure in the clyde alluvium Proc of the conference
on behaviour of pile s London England pp 1-7
Trof imenkov JG (1969) Accuracy of determining the bearing
capacity of piles based on results of static penetration
sounding of soils Osnovaniya Fundamenty i Mekhanika
Gruntov 4 (Translation Soil Mechanics and Foundation
Engineering 4 p 248)
Trofimenkov JG (1974) Penetration testing in USSR Stateshy
of-the-art report Proc Europ Symp on Penetration
Testing Stockholm I pp 147-154
Tuoma F and Reese L (1974) Behaviour of bored piles in
sand JSMFD ASCE Vol 100 No GT 7 Proc Paper 10651
July pp 749-761
49
Van der Veen C (1953) The bearing capacity of a pile
Proc 3 Int Conf on Soil Mech and Found Engng
Zlirich II pp 84-90
Van der Veen C and Boersma L (1957) The bearing capacity
of a pile predetermined by a cone penetration test
Proc 4 Int Conf on Soil Mech and Found Engng
London II pp 72-75
Weltrnan AJ Healy PR (1978) Piling in boulder clay
and other glacial tills Construction Industry Research
and Information Association UK-Report PG 5
Withiam J Kulhawy F (1981) Analysis prodecure for
drilled shaft uplift capacity Proc of a session
Drilled piers and caissons ASCE St Louis Missouri
pp 82-97
Woodward R Lundgren R Boitano J (1961) Pile loading
tests in stiff clays Proc of the Fifth International
Conference on Soil Mechanics Paris France Vol 2
pp 177-184
Wright SJ Reese LC (1979) Design of large diameter
bored piles Ground Engineering Vol 12 No 8 pp
17-22
DIN 4014 Cods Teil 2 (1977) Bohrpfahle Grossbohrpfahle
Herstellung Bemessung und zulassige Belastung
Polish Specification (1975) Specification for design and
construction of large diameter bored piles in bridges
Ministry of Transport Warsaw (in Polish)
Polish Specification (1979) Specification for prevision
bearing capacity of the piles on the presiometer test
and static sounding ENERGOPOL Warsaw (In Polish)
Polish Code (1983) Foundations Bearing capacity of piles
and pile foundations
5 1
FIGURES
bull bull
53
Ou
+ sect raquo iir 1
4 + D
h + +Osu
bull + t2 =n- Dp
LDpl r f 1
Opu
Fig 1 1 1 Bearing pi le in the soil
J_
fp
080
070
060
050
0 40
030
020
010
q~ [MPa ]000 -+--~-~-~-~------------------------=-shy
00 20 4fJ 60 80 10 0 120 14fJ 160 180 200
Fig 1 1 2 The point resistance factor fp
(Trofimenkov 1974)
54
ts
160
140
120
100
080
060
040
020
q~5 [ kPa)
0Q0--1------~-~-~-~-~-~ - - ---=- -- shy000 10 20 30 40 50 60 70 80 90 100
Fig 1 1 3 The shaft resistance factor fs middot (TYofimenkov 1974)
f s
200
180
160
140
120
100 2 3 4 5 6 7 8 9
Fig 1 1 4 Shaft friction factor f depenshys
ding of the soil density (Senneset 1974)
55
Q~ [kN]
1500
1000
500
0-r-----------r----~- Q~ [kN] 0 500 1000 1500
Fig 1 1 5 Comparison of the pile resisshytance determined by the results of static sounding and load tests (TYofimenkov 1974)
D f f
0
Fig 1 16 Equivalent cone resisshytance (Bustamante 1982)
56
E u shy0 ~
QI I ltII ltII
~ a C QI
O C
D
w gt
0
Cone res istance Point resistance
80 160 240 320
05
10
15
e d
20
ver y dense Cone resistance 300 kgcm2
Dpcm
a =45 b = 30 C 60 d = 100 e = 150
Fig 1 16a
Cone resistance _ qc
80 160 80 160 qc [ k g cm2 ]p
05
10 10
15 15 e d a
e d20
Dense Medium2 2200 kgcm 100 kgcm
Cone resistance and point resistance of piles versus overburden pressure (Kerisel 1965)
Point resi stance - p(for s=2cm) of the pi le for
15 sett Iement s = 2 cm
10
5
E u
uJ1 o-~----shya er O 804 2500
32 56
I 1
L oose50 -I =25 Very loose L
----~--shy5000 7500 80 98
~-----lmiddotI1--------2 10000 12500 31400 =Flcn)
112 123 200 =Dplcm)
Fig 1 1 6b Point resistance versus cone resistance and pile diameter (Franke 193)
57
1
fp
080 (D Gravel
0 Coarse sand Medium sand 070
reg Fine sond Silty sand
060
050
040
030
020
010
qc [MPa]000-+----r--~-~-~--------r----r----r-~-~-- -shy
oo 20 40 60 80 100 120 140 160 180 200
Fig 1 1 7 Point resistance factor f (proposal) p
58
300
250
200
150
100
qc [MPa I50-+---------------r---r---r---r----r------------- shy
oo 20 40 60 80 100 120 140 160 180 200
Fig 1 1 8 Shaft resistance factor fs (pr oposal)
59
Bustamante (seetab 115 I
l fp
G)
0 Gravel
Coarse sand Medium sand
cl
b)
t-----l
1----1
080 reg Fine sand Silty sand a) D
070 Polish
060 Specification
( 1979) 050
040
030 CD 020 0
reg 010
qc [MPa]0 00 -+-------------------------------------=--shy
oo 20 4o 5o 80 100 120 14o 15o 180 200
Fig 1 19 Point resistance factor f comparisonp
Bustamente ( see tab 116 I 300
a) ~
250 b)~
cl~
200 Polish Specification ( 1979 l
150
100
q [ MPa]504---~--~--~----- ---___
00 20 40 60 80 100 120 140 150 180 200
Fig 1 1 10 Shaft resistance factor fs comparison
60
1 fp
~
080 CD CD Gravel
070 0 reg Coarse sand Medium sand
060 0 Q) Fine sand Silty sand
05
040 Franke (1973)___
030 DIN 4014
020 Part 2 1977
( see tab113 l 0shy
--shy --a - 010 C---0 Piles without enlarged bases
D---0 Piles with enlarged bases qc [MPa ] 000
00 20 4JJ 60 80 90 100 120 140 160 200
Fig 11 11 Point resistance factor f comparison p
fs
DIN 4014 Part 2 1977 ( see tab 114 l
300
~ 5 lt qc lt 10 MPa 50
~ 10 lt qclt 15 MPa
~qcgt15MPa
200
150
CD
100 0 0
qc [ 1Pa] 50-t-----T-~----T-r-~----------------shy
OO 20 40 6JJ 80 100 120 14JJ 160 180 200
Fig 1 1 12 Shaft resistance factor fs comparison
61
Measured p [ MPa]
( s=010 Dp) 10
9
8
7
6
5 0
4 0 61
3
I 2
Calculated qcp [MPa]
0 0 2 3 4 5 6 7 8 9 10
Fig 1 1 13 Comparison of experimental and aomputed values of the pile point resistanae
62
Contact pressure ( MPa ]
2 I 6
50
100
E E 150 Ill
c QI
E Sett lement for QI
calculated qcpai V) 200
Fig 1114 Results from load tests on piles No 1 and 5
Contact pressure [ MPa I 0 2 I 6
01---------------------1
50
E E 100 Ill
Settlement forc QI calculated qcp E ~ ai
I V) 150
Fig 1 1 15 Results from load test on piles No 7 and 5
63
Contact pressure p [ MPa] 0 2 3 4 6
0-t=-----~-~-----
E E
100 1)
c CU E 2 QI V) 150
Fig 1 1 16 Results from load test on piles No 9 10 and 11
Contact pressured p [MPa] 0 1 2 3 4 5
o~~~=------------___-~-shy
50
100
E E
i 150
CU E CU
-a V) 200 2
Fig 1 1 17 Results from load test on piles No 12 and 13
c
-------------- -
64
Contact pressured
0 1 2 3 4 p [ MPo] ~o __L____1_____J_____L___
50
100
150
E
E
IJ) 200
c a
E a
~ 250
Fig 1 1 18 Results f Pom load tests on piles No 2 4 6 and 8
p [MPa]
60
50
tO
30
~
Pile Pile Pile Pile
Pile No18
------+ Pile No17 + ~_ ---0 Pile No 19
bullbull - --bull Pile No 20
- ~middot -shy-shy -(y I Settlement for
20 tO 60
No17 +-middotmiddot- V 70 No 18 bull--- V 9o No19-middot- V 120 No20bull---- V150
qcp 3
80 100 120 140 160 s (mm)
Bose resistance
Fig 1 1 lBa Point Pesistance vePsus settlement (Spang 1972J
65 Cone resistance qc [ MPa]
0 10 20 30
mud
5 ~ lll
0 c 0
c CD
peat
10 sand
Ill N
10=10
D=lOOOmm
1540=40
20__________________
[ml
Fig 1 119 Pile No 1 and results from static cone penetration test
Cone resistance qc [MPa l 0 10 20 30
7N V degW = 0+--------------------i
mud
5
lll
~ C 0
c peat~
10
sand lll N 1D15
15l lD=1500mm
40=60
20l---------=-------__J
[ml
Fig 1 1 20 Pile No 3 and results from static cone penetration test
66 Cone resistance qc [MPa]
10 20 II 3 igt pound ~
mud+peat
fine sand+ silt
50=11
l lo-11oomm
40= 44
10
15l____________c
[ml
Fig 1 1 21 Pile No 5 and results from static cone penetration test
Section Cone resistance Pile
0 0
5 10 15 20 25 30 qc [MPa] -----~-~shy~
Silt
[7r_ ___~ Medium Sand_~-----l
0 ltD
+shy4
0=11
9=
Fine sand + Silt t
30p=
middotmiddotmiddotmiddotmiddotmiddotmiddotmiddot1~11+-----E-----
[ml
Fig 1 1 22 Pile No 6 and results from static cone penetration test
Cone resistance qcmiddot 1MPuJ
0 10 20 30 67 01-+-------l--------------i
mud+ peat
fine sand
l1)
N
40=60
15L_____________
[ml Fig 1 1 23 PiZe No 7 and resuZts from static
cone penetr ation test
Section Cone resistance Pi le
0 5 10 15 20 25 30 qc [MPa 1 --~----Y-~-----~
Silt
Fine sand
Medium Sand Bentonite2----1~i
t 3
4
0
0=15
Fine iii ~~= 5
sand t ltD
6 +
Silt 7
3Dp=
63 g
10
11
12
13+------=~---l
[ml
Fig 1 1 24 PiZe No 8 and resuZts f rom static cone penetration test
68
I =3
Cone resistance qc [MPa]
0 10 20 30
C 0 C Cl
(I)
Said
Peat
Sand
l 0=110
D = 11
4 D = 44
Fig 1 125 Pile No 9 and results form static cone penetration test
69
Cone resistance qc[MPa)
0 10 20 30 I ~ II JE Ill= II=E IS
Fine sand QI
U) I
[- I C 0 + C Peat QI
CD
Fine sand 0
Ci D = 1 1
L l D= 110
4D= 4 4
Fig 1 1 25 Pile No 10 and results f rom static cone penetr ation test
70
Cone resistance 9c[MPa]
0 10 20 30
Sand
C 0 Mud peat
+shyc 5 ltII
co
Sand Op= 11
u 10 D= 110 4Dp=44
Fig 1 1 26 Pile No 11 and results foIm static cone penetration test
71
00 a_ N ~
middotu rr QI 0 u ~ C 0
QI ui C iij 0 QI U - 0
0 EN
d 2
Sll 1lOl
C
u (rr
C 0 u~
0
QI - C middot 0 C
U - O 0 EN
~ 0 2
E
ltD a---==-lr---___--~---6-l_-0_012 ~ Lr- - --1---------J J
S9l ls= apound QI -0 gtcc _gmiddot- 0 1) ui I
Fi g 1 1 2 Piles No 14 and 15 and results f r om stat i c cone penetr ation tests
72
Contact pressure p [ MPa] 2 4 6
01lt---------------~
50
E E
111 100 ~ (qcp=30 MPa for No16
~ iqcp =49 MPa for No14
~ 1so~--~~- _ _ __
I _ _
11 I lf--q = 32 MPa for No15
cp
Fig 1 1 28 Results f r om load tests on piles No 14 15 and 16
73
0300--------------~---~--~--shyE
Driven piles in ~ 0 bull Gravel
amp250 bull Sand L QJ X Silt a 1l o Bored piles in
sand -sect 200 0=-- shyC ~ ~ 10 unless ~~ middot D shown 1
ii O
~ ~ o 3 a 1501-----+-------I- --+---laquo-+-- -+------lt
~ sect 5 - 6 6middot 100t----+----+-----_-1---4--__co_--J~__j
-_
~ 0 t7
C
a 50 2 shyg ~ gt
0 20 30 40 50 60
Standard penetration resistanceN in blows per foot
(N 30
Fig 12 1 Emperical relation between ultimate point resistance of piles and standard penetrashytion test in cohesionless soil (Meyerhof 1976)
14 r-------------------r-------b-----q
References and symbols given in Fig121
121-----+---+----+----+------ll------j
- _sect ~ 10t----+----+-_--1-----+---lt~--~H---- 0 lt-~5- _-)0 I() l- I Q---+-----I[08 ~
H -(l () ltj-~C X bulls pound 061------lt----+-----i~- --+-- shy
- bull
-gt Q1pound--I---L---L---L---L--~ 0 10 20 30 40 50 60
Mean standard penetration resistance N in blows per foot ( N30 l
Fig 122 Empirical relation between ultimate skin friction of piles and standard penetration resistance in cohesionless soil (Meyerhof 1976)
74
a) b)0(1 0lt2
10 10
05 05
1 N30OD-+---------__ OD--t-----r-----r----------------ll--Nbull30~ 10 20 30 10 20 30 40 50
Fig 1 2 3 Reduction coefficient a) for impermeable gravels b) form permeablr gravels (Weltman and Healy 1978)
psf [MPo)
Fig 1 2 4 Relation between ultimate point resistance and SPT in cohesionless soil (Polish specification 1975)
75
30 35 40 45 Loo Med Dense Ver dense
50
40
~ E
l)
g 8 1)
middotu
1 ~
QI- bull Touma ~ bull Koizumi
(183)-depth base middotameter5
20 40 60 00 100 N30
30 35 40 45
OG2(294) bull G1 (183)
300 bull us 59 ( 102) bull 88(180)
bull 075 a GT (467)
150
~ 200-+--------+-- t--- --t-----i 130i 0 094 081
014 _- --- -- shy~ E 066bull bull 063 Note -~ ~m~r~s~ ~ 1001---1-r--t---1point is xh QI Ratio ~ Number in ( ) middotn key is h c Ratio s ~
0 20 40 60 00 100
~ig 1 2 5 Ultimate point and shaft resistance versus N30
(Wr ight and Reese 1979)
-----
76
tu Psa
[kPa] [MPa]
200 tu
------ shy150 Psa
1 1
1100 10 1 1
1 50
0+----------T----~---~-N-3J~shy0 20 40 60 80
Relation between ultimate skin friction and SPT (Decourt 1982)
Fig 1 2 6
Psa
[MPa]
8
0----Meyerhof 1976) 0 7
--- - --~ - copy Polish Specifcoti on 1975)6 ~-
~
reg- middot - Reese (1978) middot 5
f41- -- Decourt (1982) -I bull 4 2
----==---______z__ h25m Dp=12m
3 ---shybull
2 7
--shy ----shy~----shy0-t----i----------r-- ----------------------N3l~shy
0 10 20 30 40 so 60 70
Fig 1 2 7 Relation between ultimate point re~istance of large diameter piles and standard peneshytration test (SPT) in cohesionless soil
------
77
tu [kPa)
200 17 Cast under -J bentonite
~----Meyerhof (1976) ~copy -=middotmiddotmiddotmiddot== middotmiddot150 ~------- Wei tman (1978 ) middot Healy middotmiddot ___ Japanese ) 119810 Society
(0 -middotmiddot- Decourt (1982)middot Wright
100
- -middotmiddot -- 11979]reg Reesemiddot Bored piles
~shy50 1 -- shy
-- shy middotmiddot s-shy - --~ ------reg~~ ---~E_==---- ------- shy
N_ ---shy0-+--C--------------r---- ---------~---~-~shyo 10 20 30 40 50 60 70
Fig 12 8 Relation between ultimate skin friction of piles and standard penetration test (SPT)
78
Pst [MPa]
8
7 ---------ist=7MPa
6
5
4
3
2
I N30o~------------------------------+---------__=-shyo 10 20 30 40 50 60 70
Fig 12 9 Relation between ultimate point resistance of large diamter piles and standard peneshytration test (SPT) in cohesionless soil (proposal)
tu [MPa ]
( excavanted and cast
150 under bentonite ) tu=150 kPa
100 tu=90 kPa
I I
50 I I I I I N30
10 20 30 40 50 60 70
Fig 1 2 10 Relation between ultimate skin friction of large diameter piles and standard penetrashytion test (SPT) in sand (proposal)
79
2 3 4 5 p[MPa] 0 2 3 4 5 p[MPa]0
40 40 Cl
80 c 80
c 120 120
Pile No 1 PileNo216 160
200 2
s s c [mm] (mm]
0 2 3 4 5 p[MPa] 0 2 3 4 5 p [MPa]
40 40
00 80
120 120
16 160 Pile No 3 Pile No 4
200 200
s s [mm] (mm]
0 2 3 4 5 p[MPa] 0 2 3 4 5 p [MAJ]
tgt11 tgt- measured40 40
80 80
120 120
Pile No 5 Pile No 6 160 160
20 200 s s
[mm) [mm)
Fig 1 4 1 Base resistance vs settlement appoximative method piZe No 1- 6
80
0 2 3 6 5 p[MPa) 0 2 3 4 5 p[MPa]
40 40
80 80 6
120 120 6
6160 160
Pi le No 7 Pile No 8 6
200 3J s s
[mm] (mm]
0 2 3 4 5 4 p [ MPo)
6 6 40
6 6
6 80
6 6
6
Pi le No 9 Pile No 10
XJO s s
[mm] [mm]
0 2 3 4 5 p[MPa] 0 2 3 4 5 p [MPa)
6 6
40 40 6 6
6
00 80 6
6
12 1Xl 6
160 Pile No 11 160 Pile No 12
200 200 s s
[mm ] [mm]
Fig 1 4 2 Base resistance vs settlement approximative method pile No - 12
81
0 2 3 4 5 p[MPa] 0 2 3 4 5 p [MPa]
6 6
40 6 40 6
6
80 6 80 6
120 6 120
Pile No 13 Pile No 141fO 160
200 200 s s
[mm] [mm]
0 2 3 4 5 p [MPa) 0 2 3 4 5 p [MPa)
40 40
80 80
120 120
HiO 160
200 200Pile No 15 Pile No 16
s s (mm) [rrrn 1
0 2 3 4 5 p[MPa] 0 2 3 4 5 p[MPa)
40 40 A A A-measured
680 80 t t
120 c 120 c
1fil Pi le No 17 160 Pile No 18
200 200 s s
[mm] [mm]
Fig 1 4 3 Base r esistance vs settlement approximative method pile No 13- 18
82
0 2 3 4 5 p[MPal 0 2 3 4 5 p (MPa]
D D40 40 c c
80 c 80 c
120 120
160 160
Pile No 19 Pile No 20 200 200
~ml (mm]
Fig 1 4 4 Base resistance vs settlement approximative method pile No 19- 20
LlJ QI
0 average lJ = 098 E sd = 029 C
6 SY = 030
4
2
lJ calculated ________________________ _______ measu red
06 08 10 12 14 16
Fig 1 4 5 Calculated pressure divided by the measured pressure at 20 mn settlement for aZZowabZe
q Zoad Pa= ~p approximative method pile
No 1- 20
8 3
Point resistance p [ MPaJ
a)
p(s) = s a +--sshy1 y qcp
1
SQ100p -- --- ---shy
~ s
[mml
I- 01 s rmm]-l p LMPa b)
f~]
c Cll E ~ i s
[mm)
Fig 146 Definition of the point resistance - settlement curve according to the modified hyperbolic method
84
01 ~ 0
20 0 0
0
16 0
medium 0 value a1 = 905-+ 256 Op 0 0
12 (r=039)
0 0
----0 0
8 0
0 0
0 0
4 0
05 06 07 08 09 10 11 12 f3 14 15 16 17 18 19 20 2 1 Op (ml
Fig 1 4 Initial slope of the base resistance curve vs pile diameter
a1 [p] 0
0020
16 assumed a 1= 28 - 4 qcp
12 0
0 Ct) 0 a = 2659 - 369 qcp8 1
0 0 (r = 0188)0
4
2 3 4 5 (MPa]qcp
Fig 1 4 8 Initial slope of the point resistance curve vs ultimate point resistance on the static cone resistance for pile tests No 1 20
85
a [~ 28
24
20
16
12
8
4
0 2 3 4 5 6 Qcp [MPa]
~ Kiosinski (1977) sand and sandy gravel of mediwn density
~ Klosinski (1977) loose sand ID= 0 3 0 4
o US59 ] t HH Touma p and Reese L (1974) fine sand and silty sand OGl (US59 HH BB - very dense Cl - mediwn dense) 1 BB
DIN 4014 Part 2 (1977)
Fig 1 4 9 Initial s lope of the point res istance curve vs ultimate point resis tance
86
assumed [il =30 -10 Op but )1~ 10 )1 [1 I
u 311-10 Op ( r =0 368)4 1 0
3 0 0
02 0
0 0co 0 8 0 0
0
0
05 06 07 08 09 10 11 12 13 14 15 16 17 19 20 21 Dp [ ml
Fig 14 10 Correction factor for hyperbolic base resistance shysettlement relationship
87
a [~] 28
24
20
16
12
8
4
2 3 4 5 qcp [ MPa]
Fig 14 11 Initial slope of the base resistance curve vs ultimate base resistance (proposal)
v [ 1 ]
3
2 -----G- DP J l 1J I Op lm] J
for Dp ~ 2 0 m ~ u = 1 01
0 --------r----r---r----r-----------------r-------------------------r------r-~-~--shy
05 06 07 08 09 10 11 12 13 14 15 16 17 18 19 20 21 Dp[m)
Fig 1 4 12 Correction facto r for hyperbolic base resisshytance - settlement relationship (proposal)
s P ( s)
s +
u qcp
88
a) b)1
bt=o212= 47 MPa a1=1~32 tMWJ s 2 3 4 5 O 1 10 20 30 40 50 60 p [~a]0
0p [ MPa] 40 40
80 80
120 ~
160 b1 = ~ajtg ~= 0 212
~=1132 + 0212middot s
mJ 240 r=0994t t t measured s __ according to Jl s
o o o according to p (bull ll l[mm] [mm]
Pile No 2
slmm) 10 20 30 40 50 60 80 100 125 150 175 2)0 225 Note
p [ MPa] 09 14 17 20 22 24 27 30 32 34 36 38 39
measured
pibull) [ MPa] 074 128 169 202 228 249 282 307 330 347 360 371 380calculated
plbullbull1[MPal 070 125 168 203 233 257 297 327 356 378 396 410 422calculated
1) (bull) ij l099082 091 099 101 104 104 104 102 103 102 100 098 097 sd = 006
ij (HJ1041) (bull10) 078 089 099 102 106 107 110 109 111 111 110 10B 10B sd = 010
plbulll-according to a =1132 [ Jp(s) = s s for pile No21 0 1132 12 39
plbullbulll-according toa =1241 lmiddotGcp=39MPa1 0
~=14 see fig 1411 and fig 14 12 sp(S)=
124+ _ s_ 14middot39
11lbulll11l-J - correlation coefficient calculat~d P5 for
measure p s p(bull) and p(bull) respectively
Fig 1 41 3 Modified hyperboZic point resistance - settZement reZationship for piZe No 2
89
0 2 3 4 5 p(MA1] 0 2 3 4 5 p[MPa)
40 40
80 A 80 A
120 120
160 16 Pile No 1 Pile No 2
20 200 s s
[mm] rnm
0 2 3 4 5 0 2 3 4 5p [MPa] p [MPo]
40 40
80 80
120 1ZJ
lfpound) Pi le No 3 Pile No 4 A
200 A
s s A
[mm) [mm
0 2 3 4 5 p [MPa] 0 2 3 4 5 p [MPa]
40 40 A A A measured ~ calculated
80 80
12
160 160 Pi le No 5 Pile No 6
200 Z)Q
Fig 1 4 14 l3ase resmiddotistance vs settlement pr oposed method pile No 1- 6
90
2 3 4 5 p [MPa] 2 3 4 5 p [ MPa]
40 6
6 40
1 80 80
6
120 120 6
6 160 160
Pile No 7 6
200 200 s
[mm ] s
[mm]
0 2 3 4 5 6 p [MR] 0 2 3 4 5 p [MPa] 0 0
40 40 6
6
80 80
6
120 120
160 160 Pile No9 Pile No 10
200 200
s [mm] [msml I
0 2 3 4 5 6p[MR] 0 2 3 4 5 p [MPa]04--___ ____ ___ ___ ____
0+-=---------------~-~- shy
40 40 c 6 c - measured
0--0-0 shy calculated
80 80
120 120
160 160 Pile No11 Pi le No12
200 200
s [mm]
s [mm]
Fig 1415 Base resistance vs settlement proposed method pile No 7-12
91
0 2 3 4 5 p [MPal 0 2 3 4 5 p [MPa)
40 40
80 80
120
16 Pile No 13 Pile No 14
200 s
tnml [mm]
0 2 3 4 5 p [ MPa] 0 2 3 4 5 p [MPa)
40 40
80 80
120 120
160 1fD
Pi le No 15200 axJ s s
[mm] [mm]
0 2 3 4 5 p[MPa] 0 2 3 4 5 6 plMPa ]
A A A measured40 0---0-0 calculated
80
120 120
160 1ED Pile No 17 Pi le No 18
200 200
s s [mm] [mm]
Fig 1 4 16 Base resistance vs settlement proposed method pile No 13- 18
92
0 2 3 4 5 p [MFb] 0 2 3 4 5 p[MPa]
0 6 o -measured40 40 0 0 o -calculated
80 80
120 120
160 160 Pile No 19 Pile No 20
200 200 s s
[mm] [mnil
Fig 1 4 17 Base resistance vs settlement proposed method pile No 19-20
p(s~Psf
15 20
ean
-C 5 w u L Lower ~ confidence
linea 0
a IJl 10
o---o proposed
method I I I
15
Fig 1 4 17a Design curves for estimating developed base resistance in sand (Wr ight and Reese 1979)
93
n (number)
30
28
26
24
22
20
18
16
14
12
10
8
6
4
2
0 02 04
Fig 1 4 18
I= 126
Between 1] = 0 7 - 1 3--- I= 106 ( 84 frac34)
Average ~ = 098 Standard sd =023 deviation
Standard sv =023 veriation
1] (Coefficient Calculated Measured
06 08 10 12 14 16 18
Calculated pressur e divided by the measured pr essure for all pressure - settlement curves pr oposed method pile No 1- 20
94
a) b) Total load
Total load curve
---- _____-- shy- -- -Base load ~- Base load
-0-0 ~
00 00 J
ldeoli zed shaft load J
Shaft sesistanc1---------- 0=0middot30 a= 0 middot 30
025 Settlement IN 025 Settlement IN
Fig 1 419 Proposed method of synthesizing design loadsettlement curve (a) conservative design prodiction b) design prediction- peak in shaft loadsettlement curve (Burland et al 1966)
Cf
-0 0 0
J
0
~-----~--~-~ amp- 2 3 4 5 6 (cm)
a~middotltii -0 lt) cco2 41 -~ -0 1)
vi ~ llloli=----------- ---c~0 1 2 3 4 5 6 7 ( of diameter)1 1 1 1
05 10 15 20 ( in) for 30 in Pile Movemen~ ( 75cm pile)
Fig 1 4 20 Approximate load settlement curves for 30 in bored piles (AB and C represent failure load at 1 in settlement A B and C represent ultimate failure load) (Touma and Reese 194)
95
Load in MN 0 2 3 4 5
25
50E E C
-C 75
-~ ~
-Z 100 lJ
Shaft resistshy
125 once
15 Fig 1 4 21 Load-settlement relationships for largeshydiameter bored piles in stiff clay (Tomlinson 1977)
SettlementSo
Fig 1 4 22 Diagrams of s1iaft and base resistances versus settleshyment assumed in analysis (Kiosinski 1977)
96
0 0 1 ~ r- 025g ~~ 2
1- -shy3 03Sg 14 5 2
Qls =Qpls+Q5 (sQpls) Qs(s-3E
0
degsis __ -- Qpls) a~ C
4
t Sg l
5 Qu Is)
Q(s)in MN-l T
Ouls Q Is) in MN ---
Fig 1 4 23 Construction of load - settlement curves a) for sand b) for cohesive soil (DIN 4014 Part 2 1977 and Franke 1981)
-
s C 5C
Cl
3 0 00 05 10 15 20 Mean settlement I in)
Fig 1 4 24 Load- settlement curves for test shaft S4 (1 in = 25 4 mm 1 ton= 8 90 kN) (Reese 1978)
97
Relative side resistance
0 05 10 15 20 0E=--t----+---+--~
c QI lt) ~ 2 C
I itaker c
QI amp Cooke3E QI-j
c-en 4
C QI
E us 59o
5 QI gt
SA0 w 0 6
Fig 1425a Relative side resistance for clay vesus relative midlength settlement (Reese 1978)
degs (Osl u l t 0 05 10 15 2 0
Mean
2 Lower ~ C QI u
confidence line
~ 3 a
0
~4 E
()
5
6 __ _ ______ ________ __1
Fig 1 4 25b Design curves for esti mating developed side resistance (~Jy1nht ReertP- 1987 J
98 Load Q
8 - 15 mm
1- 2 of p ile diameter
100-200 10-15 of pile Os Ot diameter Shaft Total
Settlement S Resistshy Resist- Load ance once
Fig 1426 Dependence of total load base resistance and shaft resistance on settlement of lar-ge diameter pile (Tejchman Gwizdala 1979)
6
5 Shaft load
4
3
2
z ~
-0
g Pile EF- 56 J 0
0 0 20 30 Butt settlement (mm)
Fig 1 4 27 Deveiopment of shaft and base resistance with settiement (Promboon Brenner 1981)
99
0 1000 2000 3000 4000 5000 6000 7000 8000 9000 0 r-=-1---J__-----------------------~----_shy
Load [ k N l5
10
20
( I
Skin friction ----1 I I
~ 40 QI E
fQI
50 I
Q) I () ICOntinuos fost deolading
Fig 1428 Load-Settlement-Diagram Testelement III (Diaphragm-Wall 0515 m 244 m deep) Portion of Skin Friction and Base Resistance (Prodinger Veder 1981)
Qs (QJ max
0 05 10
Upper Limit of Data
Farr and Aurora (1981J C
~ 2 - shy -+shy - Mean of Data
I QI
Lower Limit of Data a
0 - 3 E
Vl
4
Smid = Approximate shaft buff movement ignoring the elastic compression of upper halt of the shaft
D = Shaft diameter
Q Mobi Ii zed shaft resistance
Qs1max = Maximum shaft resistance
Fig 1 4 29 Relative shaft resistance vs relative movement (Farr and Aurora 1981)
100 Load Q (s) [ MN]
Su5 s s 20 mm for non- cohesive soil u
s s 10 mm f or cohesive soil u
s s 15 mm for claysand u
Q (s) + Q (s)s p
Qs(s)
-C ltII E s ~- [mm]-ltII IJ)
Fig 1 430 Dependence of total load Q(s) point res i stance Q (s) and shaft resistance Q (s) versus settlement p s
~ 3 Usu Qpu Qu Q(s) [ MN]
Sus= 20
1J
60
80
100
120
degs (s ) 140
5 P=Ol Op
1EO
C -ltII E 180 ~ ] 200
s [mm]
Approximative dependence of total load point resistance and shaft resistance versus settlement fny non-cohesive soil
Fig 1 4 31
101
113 3 ~fic0P Ye hY
1 Ground water
D
I y
yh C
Fig 1 5 1 Determination of 01 and 03 for settlement analysis of lar ge diameter bored piles
102
I
E=Et [MPa]
160 0
140
120 0
100
80
6
40
--- --shy 0
0
8 0
0
0
20
2 3 4
I 0 15
Fig 1 5 2
E = Et [MPa]
120
100
80
60
40
I I 0 35 065 085
0
Et= 17 81 qcp0844
( r = 0 128)
5
100
6 qcplMPo]
Calculated values of Young s modulus for piles No 1shy24 according to equation 1 5 2 and 1 56
0
0 0
E =898qcp127 (r= 0314)
E = 9 middot qcp 13 0
20 shy 0
0 0
0 1 2
loJ
I 0 35
3 I
065
4
I 085
5
100
6 qcp [MPo]
Fig 1 5 3 Calculated valueBof Young s modulus for piles No 1shy24 according to equation 1 5 4 and 1 5 6
I K 10 3
( 1 ] 1832
1400 0
1200 0
0
1000 0
800 0
m=2821 qcp0621
600 0
(r=0057)
400 0 0 0 0 0
200
2 3 4 5 6 qcp (MPa]
I 035
I 065
I 085 100 Io
Fig 15 4 Calculated valuesof the dimensionless compress ion modulus K for piles No 1- 24 according to equation 1 5 2 and 1 56
K ( 1 ]
0
1400
1200 0 0
1000
800
600
0
0 0
0
0 0
0 K= 1422 qcpl05
(r=0181)
0 K= 150 qcp
400 0
3)0 0 0
2 3 4 5 6 qcp(MPa)
I I -J 035 065 085 100 Io
Fig 1 5 5 Calculated values of the dimensionless compression modulus K for pile~ No 1-24 according to equation 1 5 2 and 1 5 6
104
120
100
2 3 4 5
I I I rv 0 15 035 065 085 100 lo
Bergdahl (1982) for shallow foundation
o----o Bozant Masopust (1981) D= 1 0 rn h=10 rn large diameter bored piles in noncohesive so il
0----0 Proposal according to current anal ysis
Klosinski (1977) D=090 to 125 rn large diameter bored piles in sand and sandy grave l
Mitchell Gardner (1976) very dense sand E=(35)q (it depends on sand density and stress history) c
Fig 1 5 6 Composision of Young s moduius
105
TABLES
0 Tab 1 11 Methods for detemination of the bearing capacity of bored piles (Ro llberg 1977)
Cl
Nol -- I Soil Areas of Q) Q) Editor Determination of Coefficients 5 type influenceqP qs p ~ C C 11 12 fP I fs
1 all Lab f Soil Mech (1936) l qp at the elevashy 1 0
2 all Huizinga (1951) ~ t~on of the pile 14 point
3 all Van der Veen (1953) ) 18 1 h+l14 all Van der Veen 1 0 Dpl375 D~ 15-- J qcmiddotdhBoersma (1957)
~ 11 +12 h - 12
5 12 all Menzenbach ( 1961) qc at the elevashy~ tion of pile point
6 18 all Mohan Jain Kuman (1963)1 average of qc over 1 h Q) h ~qcmiddotdhl 10 Dpj 3 75 Dj 15 50_micro
and 1 2C 11
7 I amp all de Beer ( 1964) graphically from 10 Q) qc 0 1 h+l18 u C
sand Soviet norm SNIP II 9ct9cp I4 bull O Dp I10 DP l66-1 083shyu clay B5- 67 Trofimenkov (1969) 2 50 1 251 +l J qc middotdh micro middot h middot-l l 2h-~ _micro
9 _micro u all Paproth (1972) at the elevation 3 5 I shy
) of pile point (Dpgt0 5 m 7 D8DpE
E-lt p 1 h+l1 1 h Dplt 5 m u l+l J qcmiddotdh h f qcmiddotd~ 30 Dpl 50 Dp 2 0 100shy10 sand Norwegian method
0l 2 h-12 200Senneseth (1974)
11 lall Soviet method h+l (20-0lqgl - 101 1 q middotdhTrofimenkov (1974) -- f C UpUsmiddotQct
l1+l2 h - 1212 Qct-Qcp 40 D~ 10 Dp 1 33- 0 67shyUsbullh 4 00 2 50
13 English method 10 DFJ 375Dp 10 I
Rodin Corbett Shershywood Thorburn (1974)
3 7 5 Dcl 8 0 DP 10h+l1 _1_ J qcmiddotdh 1 h
qcmiddotdh 20011 +12 h - 12 hb
1 h qcmiddotdh 150hf
0
Observations
fp I f (qp)fs C
Dp E = 1 cm Qbu = 2 Qpa (approx )
s fs=f (qc)
q=~g Us 0 h
fp=f(q~)
fs=f(qgl
bull fine grained non- cohesive soil loosely packed
bull fine grained non- cohesive soil medium dense comp
fine grained non- cohesive soil
Tab 111 (cont)
h+h bE 14 non-cohe- Meyerhof ( 1956 poundti J N 3o middot dh CtME fN3 o dh 1 0 DP 4 0 DP 10 100 etM= l 2
sive soil 1976) lJ +12 h - li hE o hgp taken into consi der ~ Ul (I)
E-lt
C 0
~E = 1 kgbull 30 cm
(statistical limit depth of the pile) hE - clamping length of
pile micro rrJ l-l micro (I)
15 C (I) p
sand Norwegian method
- irm - - - 10 IT
m = diagram O l-l Senneset (1 974) rrJO C
16 rrJ micro gravel English meth it 3 middot N30 - - - 10 - Jf 3 + diagram U) ~
E-lt p U)
iiouiu Coruett Sherwood Thorshyburn (1974 )
(NJQat the elevashytion of pile point1
0 -i
108
Tab 11 2
Results of calculati o n of p i le point load pile shaft load and total pile load from static con e penetration test (Rol l berg 1977)
~ gt
~ gt Ultima te Ultimate Ult imate
No Method micro micro poi nt skin bearing 080lt17nlt1 50 Q) -l
-l middot-i resistanceuro resistance r esistancE
middot-i p 0
(J n1 n n2 n n3 n n1 n2 n3
1
2
Lab fSoil Mech
Hu izinga (1951)
(1936 ) 430
307 i 3 Van der Veen (1953) 239
49
4
5
Van der VeenBoersma
Menzenbach (1961)
(1957) -l middot-i 0
2 4 7
1 57 1-CJ)
6
7
8
Mohan Jain Kumen
de Beer (1964)
Sovi et Norm (1969)
(1963) CJ) Q)
-l middot-i 0
lJ Q)
Q)
gt- CJ) Q)
c 0
2 44
1 37
183
47
t I
49
487
0 18
47
16
3 02
0 85 1
47
16
137
08
9
10
Paproth ( 1972)
Norw Method (1974)
~ 0
0
u I
C 0 C
1 8 1
180 l 46
1- - -_L~ 46 167 46 1 19
1 1 Soviet Method ( 1974) [1 1 41 46 1 62 13 083 13 1 14 0 8
12 Engl Method (1974) 2 66 35 128 35 2 30 35 1 28
Note
cal Q a) n = --- mean value of the rat i o between calculat ed pile loads and those n Q determined f r om loading test
b) n = number of piles
109
Tab 113
Point resistance of large diameter piles (DIN 4014 Part 2 1977)
Settlement Point pressure 1 Factor -fshy
(cm) (MPa) cf=lOMPa I i=15 MPa C C
Piles without enlarged base
1 05 005 003 2 08 008 005 3 11 0 11 007
15 34 034 023
Piles with enlarged base
1 035 0 04 002 2 065 0 07 004 3 0 90 009 006
15 2 40 0 24 0 16
Note 10 lt qp lt 15 (MPa)C
Tab 114
Skin friction resistance of large diameter piles (DIN 4014 1977)
Strength Static cone pen- Depth below Skin frict ion Factor of sand etration resist surface
(MPa) (m) (MPa) fs
Very small lt 5 - 0
Small 5 to 10 0 to 2 0 2 to 5 003 ln6 to 333
gt 5 005 100 to 200
Medium I I 10 to 15 0 to 2 0 I
I 2 to 7 5
gt 75 I 0045 0075
222 to 133 to
333 200
High I I
i
l
gt 15 0 2
to 2 to 10 gt 10
I I I
I
i
0 006 0 10
gt gt
250 150
Note Skin friction is assumpted as linear until s =2 cm and constant for s gt 2 cm
11 0
Tab 115
Values of the inverse of the point resistance factor (Bustamante 1982) fp
Soil type qPC I 1
Factor - shyfp(MPa)
for piles group
a) Silt and loose sand lt 5 0 40 -b) Moderately compact
5 - 12 040sand and gravel
c) Compact to very gt 12 i 030compact sand and gravel I
Tab 116
Values of the shaft resistance factor fs (Bustamante 1982)
Factor fs
Soil type qs
C Category I(MPa) I A I B I II A III BI
I a) Silt and loose lt 5 60
i 150 I 60 I 120-
sand
b) Moderately corn- I pact sand and 5 - 12 100 200 100 200 gravel i
Icl Compact to very
compact sand gt 12 150 i I 300 150 I 200I
I I and gravel i
I
111
Tab 117
Point resistance factor (proposal)
-
1-fp
qc (MPa)
Gravel
Coarse sand Medium sand
Fine sand Silty sand
25
080
0 70
060
5 0
0 65
055
047
75
054
045
039
10 0
045
036
031
150
035
027
022
200
030
0 23
018
Tab 118
Shaf t r e sistance factor (proposal)
fs
qc (MPa)
Gravel
Coarse sand Medium sand
Fine sand Silty sand
25
80
100
130
10 0
120
150
190
I 200
180
230
300
11 2
Tab 119
Calculated values qcp
for large diameter piles
Pile Literature Length Diameter (m) Measured p Cr1 lcul Settlement Note Authcr(year) No (ml D Dp (MPa)
(s=0 10Dp) (MPa)p ~~JL__
s s ()(mm) Dp
1 Franke (1977) 1 13 11 36 38 117 106 Garbrecht
2
3
2
3
13
14
11
15
1 58 36
37
38
40
215
185
136
123
) qg accord to Franke
4 4 13 15 204 3 2 33 220 108 and Garshy
5 5 6 11 33 35 127 11 5 brecht (1977)
6 6 6 11 153 36 35 146 9 5
7 7 6 1 5 34 35 158 105
8 -shy 8 6 15 2 1 41 3 0 109 52
9 10 9 11 39 52 47
10 11 95 11 43 35 77 70
11 12 9 11 49 66 60
12 13 10 11 15 5 1 4 0 77 5 1
13 14 9 11 1 5 4 8 46 115 77--shy14 Pranke ( 1973) 15 115 18 4 9
) ) average 88
15 13$ 13 5 1 3 19 -2 5 3 2 sd=3 0
16 - - 165 16 5 13 19 30 sv=0 34
17
18
Spang (1972)
llXJ
V90
6 6
6 75
0 7
09
3 2
4 2
32X
42X
x) s =0 10 D p
19 VlaJ 720 1 2 39 3 9X
20 - - VlsJ 6 5 1 5 3 0 3 ox
21 Touma and US59 9 9 o 76 8 0 Reese ( 1977)
22 HH 75 0 61 8 0
23 Gl 180 091 - 2 5
24 BB 137 o 76
sd = standard deviation
sv = standard variation
Tab 1 2 1
Ultimate point resistance coarse and medium sand psf (MPal (Pol ish Specification 1975)
Depth h
Medium sand r = 0 40 N = 200 30 Base diam (Op) and depthbase diam (hDp)
Dense sand r 0 Base diam (Op)
= 0 80 = 50N30 and dpethbase diam (hDp)
(ml Dp = 0 6 m Dp = 1 0 m Dp =12 m Dp = 1 5 m Dp = 0 6 m DP = 10 m DP = 12 m DP = 15 m
Psf hDp Psf hDp Psf hDp Psf hDp Psf hDp Psf hDp Psf hDp Psf hDp
5 10 83 0 85 5 0 075 42 07 33 20 8 3 16 50 14 42 13 3 3
7 14 11 7 1 2 70 11 5 8 10 4 7 2 8 11 7 22 70 2 0 5 8 1 8 47
10 18 16 7 15 10 0 14 8 3 1 3 67 35 167 28 100 2 5 83 2 2 67
15 18 250 18 15 0 16 12 5 15 100 4 2 25 0 3 4 15 0 30 125 27 100
20 2 4 333 2 0 200 185 167 1 7 133 4 7 333 3 8 200 33 167 30 13 3
25 26 41 7 2 2 25 0 20 208 19 167 5 0 41 7 4 0 250 3 5 20 8 3 2 167
w
11 4
Tab 131
Partial safety factors for resistance to axial load for bored piles (Wright Reese 1979)
Partial safety Normal Poor factor for control control
Unit skin resistance 1 70 185
(no load test)
Unit skin resistance 160 1 70
(from load test)
End bearing 165 180
Tab 1 3 2
Probability of failure of bored piles under normal design conditions (Wright Reese 1979)
Probability of Factor of Structure failure safety classification
5 10-3 25 monumental
210shy 22 permanent- 2
5 middot 10 2 0 110shy 1 85
temporary 5 bull 10-l 165
11 5
Tab 133 Results of field tests (Tejchman Gwizdara 1979)
L
II C C C 0 0 0
micro micro
micro micro micro For universal safe~y F2u u CUNo micro C C ~ ~g~ middot- C
~ Permisible micro micro i ~c -i micro
cmiddot-~ micro~ L
micro oo ~ load ~t~ ~~ omicro micro ~ ~ 3Z~ ~ ~ micro
-~~
~ e ~ --middot--
middot- ~ obull 0
~ g ~~ ~~ ~
~ L
o Jl i5 sect~ =gt L Q~ = yen t p Qp Qp
D h Q~ Srrx s tm p s E~ iQ~lQ~cm ~~ KN X ll1l kPa kPa kN kN kN Jl ~e ~ 1 2 3 4 5 6 7 8 9 10 11 12 13 14 15 16 17
1 70 6 60 4081 1550 2531 38 0 1182 10 4040 175 2041 245 1796 632 141 120
2 90 6 75 5082 3041 2041 598 1785 10 4782 107 2541 1079 1462 282 140 42 5
3 120 720 7259 4041 3218 557 1035 10 3576 119 3630 2158 1472 187 2 19 594
4 150 650 8643 4454 4189 51 5 928 20 2521 136 4326 2158 2168 3 10 166 253
5 130190 195 7750 3011 4709 392 805 10 1075 - 3875 981 2894 3 10 166 253
6 130190 165 9516 5101 4415 536 522 20 1800 - 4758 1962 2796 260 158 412
7 130190 135 8044 5199 2845 646 114 4 15 1834 - 4022 2109 1913 2 47 149 524
8 180 115 11380 4415 6965 388 792 15 1735 - 5690 2747 2943 161 2 37 483
9 76 980 6867 4316 2551 628 110 13 9529 109 3534 1128 2306 383 111 32 8
10 61 7 60 7161 2747 44 14 383 67 15 9404 303 3581 392 3188 700 169 109
11 92 180 4807 883 3924 184 20 8 1329 76 2404 196 2207 450 178 82
12 76 24 5 6769 736 6033 109 20 8 1623 103 3385 147 3238 500 186 43
13 76 137 5396 2060 3336 38 2 63 8 4535 102 2698 589 1109 350 t 58 218
14 120 23 5297 1854 3443 35 0 960 10 1640 39 2649 196 2453 945 130 7 4
15 135 16 7 13489 7554 5935 560 181 10 5260 83 6749 2060 4689 367 127 305
16 170 46 0 8829 2943 5886 333 17 10 3466 39 4415 1373 3042 2 14 1 94 31 1
Average Fi 387 166 Standard deviation Sd 2 1 5 034 Standard variation sv= 0 56 0 20
1234 Spang1972 567 8 Franke 1976 9 10 111 2 1 3 Touma Reese 1974
14 Colombo 1971 15 Kerisel Simons 1962 16 Appendino 1973
11 6
Tab 134
Results of model
SafetyScheme factor
medium F ssand
F p
loose F s
samd Fp
F 3 55 sd _P F 1 32 sd
s
tests (Tejchman Gwizdara 1979)
Diameter D (mm)
30 60 90 133
145 129 108 112
280 3 08 307 294
140 154 153 112
594 3 04 324 426
107 sv 030
0 19 sv 0 14
117
Tab 135
Individual safety factors according to literature
Literature proposal ofLiterature individual safety factor
Fs Fb
Polish Specification (1974) 100 250
Tejchman Gwizdala (1979) 150 400
Bustamante Gianeselli 200 300 (1982)
Decourt ( 1982) 130 400
average 145 3 38
TAB 141 0)
Load settlement curves - measured
Pile No
Settlement 1 c 3 4 5 6 7 8 9 10 11 12
s p s p p s
p p s P
p s P
p s p p s
P p s
P p s
p p s p p S
p I i p s
p p s p
mm MPa rrrn lifl5a MPa mm
lifl5a MPa
mm lifl5a MPa mm
RPa mmMPa nwa MPa mm
RPa MPa mm RPa MPa mm
RPa MPa mm RPa MPa mm
RPa MPa mm RPa MPa mm
RPa 10 045 222 09 1 1 05 20 07 143 06 167 08 125 0 5 20 08 125 10 100 08 12 5 15 67 16 63 20 092 21 7 14 43 08 25 10 20 0 1 1 182 12 167 0 9 22 2 12 167 18 111 14 143 24 83 22 9 1 30 125 240 1 7 I 7 6 1 1 273 1 2 250 14 214 15 200 1 2 250 15 200 25 12 0 19 15 8 30 100 26 11 5 40 1ti 250 20 10 0 14 28 6 14 286 1 7 235 18 222 1 4 286 18 22 2 3 2 12 5 23 174 36 111 3 0 133 50 20 250 22 ~27 1 7 294 1 5 333 20 250 2 1 ~38 1 7 294 1 9 263 37 135 27 18 5 4 2 11 9 33 152 60 2 2 273 24 ~5o 20 300 1 7 353 23 61 22 ~73 18 333 21 286 43 140 30 20 0 46 13 0 36 16 7 80 271 295 27 796 24 333 20 400 27 ~96 25 1320 22 364 25 32 0 53 15 1 36 222 41 195
100 322 31 1 30 333 28 357 22 454 31 1323 29 345 26 385 28 357 60 16 7 40 25 0 45 22 2 125 38 329 32 391 32 391 25 500 32 139 1 30 41 7 32 39 1 4 6 272 48 ~6 0 150 14 2 357 34 1441 36 41 7 27 555 36 ~1 7 34 44 1 36 41 7 175 36 486 39 449 30 583 38 ~61 38 461 200 38 526 42 476 32 625 225 39 577 33 682
(mmMPa) ( 1 MPa)
1
1=2074
t 1=O ~01 =0 98S
a1=1132
b1 =0 212 V =0994
a1=2217
b1=O 131
V =Q 978
a1=1860 b1=0233
V =Q966
a1=1562
b1=0174 V =Q983
a1=1382
b1=O195
V =0975
a1 =20 37
b1 =C 174
V =0957
a1=1443
b1=(l 193 v =O 961
a1=965
b1= 0071 V =0 990
a1=1 91
b1 =o 128
V =0 993
a1=5 83
b1=C124
v =O 981
a1=6 1 4
b1=01 64 v =U 985
li(MPa) ~9 4 7 76 43 57 middot5 1 57 5 2 141 78 81 61 cp (MPa) B8 39 40 33 35 35 35 3 0 39 3 5 49 40 __Ef ~-6 1 2 1 9 1 3 16 15 16 1 7 36 22 16 15 qcp
TAB 141 (continue) Load settlement curves - measured
Pi le No 3ettlement 13 14 15 1 17 18 19 20 21 22 23 24
s p s T5
p s T5
p s T5
p s P
p s P
p s P
p s P
p s P
p s T5
p s T5
p s p p s
p mm MPa lll1l
HPa MPa mm HPa MPa mm
fWa MPa mm fWa MPa lll1l
HPa MPa mm HPa MPa mm
MPa MPa lll1l NT5a MPa HPa MPa 111111
HPa MPa 111111
HPa MPa 1)1111
mra 10 1 7 59 075 133 06 167 075 133 ~95 105 09 11 1 07 143 3 76 1 7 59 08 133 10 100 20 2 4 83 130 154 095 21 1 1 15 17 4 1 75 114 16 125 12 167 ~7 74 33 6 2 1 3 15 3 1 9 103 30 29 103 1 7 176 1 2 250 15 200 r55 118 22 136 16 18 8 38 79 46 66 1 7 182 27 110 40 33 12 1 20 200 1 35 29 6 1 75 229 ~O 133 26 154 175 229 49 82 58 6 9 1 9 21 1 35 115 50 36 139 235 21 3 145 34 5 1 95 256 24 208 ~-4 147 28 17 9 20 250 gt8 86 6 9 72 2 2 233 4 2 11 8 60 39 154 265 22 6 1 55 387 2 15 279 28 214 ~6 16 7 30 120 0 2 2 27 3 o 8 89 80 7 5 2 3 262 80 43 186 31 258 1 7 47 1 36 222 14 05 198 33 124 2 25 320 B 1 98 25 327
100 45 222 18 556 39~ 253 ~-5 222 36 1278 27 370 ~8 113 125 47 26 6 20 625 42 29 8 149 255 28 1446 t50 22 682 3 0 500 175 200 225
(mmMPa) a1=479 a1=1206 a1=14 51 a1=1113 a1=1406 ~=836 a1=843 a1=1176 ~=64 a =561 a1=10 0 a1=9 5 (1MPa) b1=0175 b1=0 178 b1=0 382 b=0287 b1=O 119 p 1=0 137 h1 =o 193 b=0258 p1=0 049 b1=0032 b1=0 276 b1 =0 048
hf (MPa)
v =0998 57
v =0-987 5 6
v =0989 26
v =0992 35
v =0933 Iv =0991 84 73
v =0993 5 2
v =0998 tJ
3 9 =0944 v =0998 v =0996 v =0981
qcp (MPa) 46 39 32 30 32 14 2 39 30
lL 12 1 1 08 12 26 1 7 1 3 13 qcp
lD
N 0
TAB 142
Calculated point resistance curves
Setlement (mm) p(s)
1
n p(s)
Calculated value of the p(s) for pile No
2 3 4 5
n p(s) n p(s) n p(s) n p(s) 6
(MPa)
n p(s)
7
n p(s) 8
n p(s) 9
n p(s)
10 20 30 50 80
100
150 200 225
070 128 177 253 335
375 446 493
157 140 141
127
123
1 16 106
070 1 25 168 232
297
327 378 410
422
078 089 099 1 06
1 10
109 1 11 108
108
073 1 30 176 246
315 349
405 441
146 163
160 145
1 32 125
113 105
056 096
1 26
167 205 222
249 265
271
0 80 096
105
1 11 100 101
092 0 83
082
065
118 162 233
308 345
412 456
108 108
1 16 116 114 111
064
1 12 151 2 10 2 69
298
346 3 76
078 P63 093 tt 13 101 tt 53 100 I 13
108 ~75
103 ~04 096 ~ 55
~ 87
1 26 125 127 126
125
1 17 1 04
052 088
1 15 153
188 2 03 227 242
065 0 74
o 77 0 81 0 75
0 73
063
072 122
1 83 262 347 388
463 5 11
073
0 74
073 0 71 0 65 065
064 1 18
162 233 309
3 46
41 3 4 57
Dp (m) 1 1 Qcp (MPa) 38 (mmMPa) h2 8 1 1 9 Qcpbullv1(MPa) 72
158
39
124 14 55
15
40
n20 15 60
204
33 148 10 33
1 1
35
tt 4o 1 9 67
1 53 3 5
tt 4 0 1 5 51
15
13 5
114 0 15 i-gt 3
2 1
30
tt 6 0 10 3 0
1 1
3 9
12 4 1 9 74
1 1
3 5 h40
1 9 67
Note n = condition coefficient calculated p(s) measured p(s)
10
n
081
084 0 85 0 86 0 85
087
TAB 142 (continue)
Calculated point resistance curves
Calculated value of the p(s) for pile No (MPa) Setlement 11 12 13 14 15 16 17 18 19 20
(mm) p(s) ll p(s) n p(s) ll p(s) n p(s) n p(s) n p(s) n p(s) n p(s n p(s) n
10 106 070 0 71 045 091 054 099 1 32 055 092 053 070 060 081 085 0 72 080 055 078
20 1 90 079 130 059 160 067 1 70 1 30 096 101 091 079 1 12 148 085 1 31 082 098 082
30 258 086 1 76 068 2 15 074 222 1 31 1 26 105 120 080 156 205 081 180 082 132 083
50 363 086 246 075 297 082 296 1 26 1 70 117 161 082 228 095 295 087 256 0 91 184 092
80 471 316 o 77 3 77 088 364 1 18 2 1 o 1 24 199 308 085 393 097 336 1 02 237 095
100 522 349 078 415 092 394 228 1 27 2 16 348 088 442 098 375 104 262 097
150 611 405 479 443 258 117 244 423 529 443 304 101
200 669 441 518 473 276 261 474 587 488 331
Dp (MPa) 1 1 1 5 1 5 18 1 9 19 070 090 12 15
qcp (MPa) 49 4 0 46 49 32 30 32 42 39 30 12 a1 mmMPa) 84 h20 96 84 152 160 152 124 160
IV1 1 9 1 5 15 12 11 1 1 23 21 18 15
qcpmiddotv1 (MPa) 93 60 69 59 35 33 74 88 70 45
- 12287 average = ~ = 098
standard deviation sd = 023 standard variation sv = 023
N
122
TAB 143 Ultimate settlement for shaft resistance - summing up
Ultimate settlements (mm)Literature sand cohesive claysand
soil
Burland Butler Dunican (1966) 7
Touma Reese (1974) 10 Tomlinson (1977) 10 Klosinski (1977) 8
Francke Gerbrecht (1977) 20-30 DIN 4014 part 2 (1977) 20 10 Francke (1981) Reese (1978) (1979) 05-2 of 05-2 of Farr Aurora (1981) shaft dia~ shaft diam
5-20 mm 5-20 mm Tejchman Gwizdala (1979) - Spang (1972) 10
10 10 20
- Francke (1976) 10 20 15 15
- Touma Reese (1974) 13 8 15 8
8 - Colombo (1971) 10
- Kerisel Simons (1962) 20 - Appendino (1973) 10 Promboon Brenner (1981) 10 Prodinger Veder (1981) 12 Decourt (1982) 10-15 10-15
-average s = 14 1 10 126
standard deviation sd = 53 2 1 47
standard variation sv = 038 021 037
123
TABLE 14 4 Al l owab l e base resistance versus sett lement
Pile Li terature ength Diameter (m) Calculated qcp=qcp Settl ement Fp-3- sa (mm)No Aut hor No (m) D DP qcp (MPa) for qcp3(MPa)
1 Francke ( 1977) 1 13 11 38 127 25 Garbrecht
II2 2 13 11 158 39 130 19
II3 3 14 15 40 133 33
II4 4 13 15 204 33 110 23
II5 5 6 11 35 117 22
II6 6 6 11 153 35 117 19
II
8
7 7 6 15 35 1 17 25
II 8 6 15 21 30 100 21
II9 10 9 11 39 130 13
II10 11 95 11 35 117 15
II11 12 9 11 39 163 11
II12 13 10 11 15 40 133 7
II13 14 9 11 15 46 153 9
14 Francke ( 1973) 115 11 5 18 30 100 15
II15 135 135 13 19 32 107 29
II16 165 165 13 19 49 163 35
17 Spang (1972) V70 660 070 32 107 28
18 II V90 675 0 90 42 140 16
II19 V120 720 1 20 3 9 130 16
II20 V15C 650 150 30 100 16 average for pi les 198
standard dev sd = 78
standard var sv = 039
)assumed qc = p for s = 010 Op sonding meRsurement were not availab le
IV
TA~LE 15 1
Comparison of the initial sl ope of the pile point resistance - settlement curve
Accardi ng to 1 2 3 4
In i t i ~l 5
slope a1 for the pile No
6 7 8 9
(mmMPa)
10 11 12 13 14 15 Note
a 1 for s=10 mm 222 11 1 a1 for s=20 mm 21 7 14 3 calculated 207 113see Tab 14 1 Bo Berggren (198 )230s=20 mm
Schmertmann s method (see 202B Berggren 1981)s=20 mm
No 1 _ llNo - 6 1 97 098
202 250
22 2
400
30 8
090
14 3
200
186
076
167
182 156
286
18 2
107
125
167 138
091
20 0
222
204
426
263
098
125
167
144
087
100
11 1 9 7
182
23 5
1 03
12 5
14 3
11 9
174
164
105
67 83
58
14 6
125
1 16
63
9 1
61
103
59
8 3 48
123
13 3
15 4 12 1
1 10
167 21 1
aceto hypershy14 5 bola type curve
1 15
No 2 NQj = n1
No 4Noz ~ na No 5Naz= T]g
105 1 27
106
093
1 13
160
1 23
108 1 17
157
100
121 109
1 92
118
1 16 1 14
164
2 12
120
122
1 15
143
1 76
151
149 1 73 1 27 146
TAllLE 151 (continue)
Compa ri son of the initial slope of the pile point resistance - settl ement curve
Initial slope a1 for the pile No (mmMPa)According Note to 16 17 18 19 20 21 22 23 24 -a1 for s=10 mm 133 - 105 11 1 143 76 59 133 100 a1 for s=20 mm 174 - 114 125 167 74 62 153 10 3 calculated see 11 1 146 84 84 118 64 56 100 95Tab 141
Bo Berggren 198 67 78 25 0 114s=20 mm Schmertmann s method (see B 136 67 250 146 Berggren 1981) s = 20 mm
nG = 108 No 1NoJ = n 1 20 125 1 32 121 1 19 105 1 33 105 sd = 0 14
SY= 013 No 2 i) = 1 29ro1 = n1 157 136 149 142 1 16 1 11 1 53 108 sd = 019
SY= 015 No 4 iis = 143 INo2 = ns 091 126 1 63 111 sd = 033
SY= 0 23 No 5 ii9 = 1 37183 108 163 142INoz = n9 sd = 0 37
SY = 027
N Vl
126
TABLE 152
Measured and calculated pile point resistance
Pile Calculated Measured Measured No qcp P for
s=10 mm P for s=20 mm
~ 10 mm ~ 20 mm
- (MPa) (MPa) (MPa) - -
1 38 045 092 84 41 2 39 09 14 43 28
3 40 05 08 80 50 4 33 07 10 47 33 5 35 06 11 58 30 6 35 08 12 44 29 7 35 05 09 70 39 8 30 08 12 38 25 9 39 10 18 39 22
10 35 08 14 44 25 11 49 15 24 33 20 12 40 16 22 25 18 13 46 1 7 2 4 27 19 14 30 075 13 40 23 15 32 06 095 53 34 16 49 075 115 65 43 17 32 - - - -18 42 095 1 75 44 24 19 39 09 160 4 3 23 20 3 0 07 12 43 25
average= 484 291
sd 163 088 sv 034 030
Tab 153 Results of calculation for piles No 1-24
Pile No
Length (m)
Overburden pressure 0 vs
0hs (kPa)
0ve (kPa)
0 nc (kPa)
- -ov=o1 (kPa)
- -OV=03 ( kPa)
00 (kPa)
p(a il ( kPa)
s (a 1) (mm)
A2 ( 1 )
E t
(kPa)
Md ( 1 )
K (1)
E I
t (kPa)
( kPa) 1 2 3 4 5 6 7 8 9 10 11 12 13 14 15 16
l 2 3 4 5 6 7 8 9
10 11 12 13 14 15 16 17 18 19 20 21 22 23 24
13 12 14 13 6 6 6 6 9 95 9
10 95
11 5 135 165 66 675 72 65 99 75
180 137
l 33 133 123 116
70 70 70 70
104 102 95
102 95 94
106 139 95
101 106 97
180 137 221 215
53 53 49 46 28 28 28 28 42 41 38 41 38 38 42 56 38 40 42 39 72 55 88 86
202 202 216 202 1114 104 104 104 146 153 146 160 153 181 209 251 120 128 134 123 238 180 305 277
202 202 216 202 104 104 104 104 146 153 146 160 153 181 209 251 120 128 134 123 238 180 305 277
168 Hi8 170 159 87 87 87 87
125 128 121 131 124 138 158 195 108 115 120 110 209 159 263 246
128 128 133 124 66 66 66 66 94 97 92
101 96
110 126 154 79 84 88 81
155 118 197 182
141 141 145 136
73 73 73 73
104 107 104 111 105 119 137 117 89 94 99 91
173 132 219 203
950 975
1000 825 875 875 875 750 975 875
1225 1000 1150 750 800
1225 800
1050 975 750
2000 2000 625
1500
218 139 255 190 16 1 146 210 12 7 10 1 11 7 84 73 69
104 167 210 124 103 10 1 109 142 120 76
153
0802 0802 0822 0820 0798 0798 0798 0798 0791 0798 0800 0811 0814 0837 0837 0830 0769 0 768 0771 0 775 0 780 0 781 0 788 o 779
35296 81603 43312 65222 44019 67515 4609 91313 78186 60572
118115 15129 5 184075 95577 67017 81607 33252 67554 85294 75994 78816 74857 55101 54862
075 075 0 77 075 084 084 084 081 079 078 084 080 083 076 076 078 0 77 081 079 076 082 087 064 0 74
278 643 337 512 542 832 567
1085 766 572
1216 1417 1832
796 520 709 353 735 878 781 630 726 302 366
26472 61202 33350 48917 36976 56713 38656 73964 61767 47246 99217
121036 152782
72639 51932 63653 25604 54719 67382 57755 64629 65126 35265 40598
a=282l a =l781 y=axs S=0621 B=0 844
V=0 057 V=0 128 _ Iv -J
~
N co
Tab l53 Results of calculation for piles No 7-24
Pile No
17
1 2 3 4 5 6 7 8 9
70 11 72 13 74 75 16 17 78 79 20 27 22 23 24
Ground water
18
-20 m b s
-28 m -335 m -330 m -3 15 m dry dry -53 m -85 m
E t (kPa)
19
33653 64979 35364 45664 47969 54583 37574 63072 74548 57753
71 2618 123531 150297
71239 48619 59204 39744 77208 77863 62049 90407 95844 57762 62937
vxEt=E Md (kPa)
20
25240 48689 27230 34248 35254 45849 31562 51040 58893 45047 94599 98825
724747 54142 36950 46179 30603 57678 61572 47157 47734 83384 36968 46569
a=898 S=l 27 =0314
K (l )
21
265 511 275 358 517 672 463 749 730 546
1160 1157 7496
593 377 514 422 775 802 638 723 929 377 420
a=l422 S=l 05 =0187
E=E = t1 3
g-gcp (kPa)
22
51046 52799 54566 42492 45870 45870 45870 37547 52799 45870 77039 54566 65438 52799 40826 71039 40926 58739 52799 37541 82549 82549 40826 59945
Calculated s
(mm)
23
708 128 72 7 15 3 724 146 144 17 3 71 3 11 5 11 2 732 13 2 707 1 5 1 13 7 93
102 118 137 728 12 l 69
11 9
s__caL n=smeos
() 24
050 092 050 087 0 77 7 00 069 l36 l 12 098 133 l81 l97 103 090 065 0 75 099 117 126 090 101 097 078
ri=l00 sd=035 sv=035
K = l50gcp
25
570 585 600 495 525 525 525 450 585 525 735 600 690 450 480 735 480 630 585 450 825 825 1180 645
E l
(kPa)
26
67684 69465 72250 57726 44856 44856 44856 38448 59659 54306 74956 63214 70704 49089 56783 79502 45283 61081 58207 42927
708572 94785 71033 91898
E = t E middotA2
l
(kPa)
27
54283 5571 l 59389 47336 35795 35795 35795 30682 47790 43336 59964 51266 57553 47088 47024 65987 34823 46970 44877 33269 84639 74027 55974 71589
Calculated s
(mm)
28
l O l 12 l 11 7 737 15 9 18 7 185 21 1 12 6 12 2 133 14 l 150 13 7 13 l 14 7 709 12 7 738 755 12 4 735 50
100
- -
Tab l53 Results of calculation for piles No l-24
Pile
29
l 2 3 4 5 6 7 8 9
10 ll 12 13 14 15 76 17 78 19 20 21 22 23 24
sea l n= middotshy
smeas
28 TT
30
0 46 087 046 0 72 099 l 28 088 l 66 l 25 l 04 l 58 l 93 2 17 l 32 078 0 70 088 l 23 l 37 l42 087 l l 3 066 065
n=l 10 sd=0 44 sv=040
s seal for p n=s=lOrnn ac cording to s = 70mm
(mm)
37 32
5 l 0 51 ll 8 l18 64 064
13 0 l30 85 0 85
13 3 l 33 83 0 83
184 l84 ll6 l l 6 105 l05 137 l 37 21 3 2 12 19 4 l94 107 l06 l l 3 l l 3 84 084
92 092 l 0 9 l09 128 l28 83 083
l 0 3 l03 88 088 79 0 79
n=1 73 sd=025 sv=027
s for p according to s = 20mm
(mm)
33
10 4 184 102 18 6 15 6 200 14 9 276 209 18 4 219 292 274 185 17 9 12 9 -
169 194 219 172 200 143 15 0
seal n=s=20rnn
34
052 092 051 093 078 l00 075 l 38 l 05 092 l l 0 l46 l 37 093 090 065
-085 097 l1 0 086 l00 072 075
n=093 sd=025 sv=0 27
s for p according to s = 30rnn
(mm)
35
142 223 14 l 22 3 198 249 142 34 5 290 249 274 345 33 l 243 22 6 168 -
24 7 26 6 293 24 3 279 187 213
seal n=s=30rnn
36
047 0 74 047 0 74 066 083 047 l 15 0 97 083 091 l 15 l10 0 81 075 056 -
082 089 098 081 093 062 0 71
n=o80 sd=020 _ sv=0 25 N
IO
APPENDIXES
APPENDIX 1 1 1
Pi le No 1 Length 13 m D 10 m
Areas of influence
-
qe
(MPa)
1 fp
___9c_ f
(MPR) zyen
(MPf) qcp (MPa)
Soil type
22 20 18 16 14 1 2
l 2 (m)
10
1 0 08 06
16 15 16
026 027 026
42 41 42 Sand
04 14 U28 39 02 14 028 39 41
02 16 0 26 42 04 16 026 42 06 16 026 42 08 14 028 39 Sand 1 0 13 030 39 12 15 027 4 1 38 14 13 030 39 16 12 032 38 18 12 032 38
40 20 10 036 36 22 10 036 36 24 9 U39 35 2 6 8 043 34 28 10 036 36 30 10 036 36 3 2 10 036 36 34 10 0 36 36 36 11 0 34 37 38 11 034 37
l 1 (m)
40
42 44
11 0 34 37 15 1
46 48 50 52 54 56 58 60 62 64 66 68 70 7 2 74 76 78 8 0
APPENDIX 112
Pile No 2
to little depth of sounding
q~ = middle values for 11 = 2 Op
q~ = 145 MAa (Francke Garbrecht 1977 Tab 2 p 50) (Fi g No 2)
for sand
qcp = 0275middot145 = 40 MPa q~p =V ~~s) middot 40 = 097middot40 = 39 MPa
Pile No 4
q~ = 120 MPa sand (Fig No 4)
q = 0 315middot12 = 3 8 MPa q bull 38 = 086middot38 = 33 MPa=V Jmiddot54
1
cp middot bull cp
Pile No 12
qg = 155 MPa sand (Fig No 13)
qcp = 026middot155 = 4 03 MPa
Pile No 13
q~ = 200 MPa sand (Fig No 14)
q = 0 23middot20 = 46 MPacp
APPENDIX 113
PileNo3 Length 14 m D 15 m
Areas of influence
-
qe
(MPa)
1 Tp
----9cf
(t-1Pf) r~
(MPf) qcp (MPa)
Soil type
22 2D 18 16 17 025 43 14 17 II II
L 2 17 II II
12 (m)
16 10 08 06
17 17 17
o
II
II
II
II
Sand 04 17 II II
02 19 024 46 b9
02 19 024 46 04 17 025 43 06 15 027 41 08 13 030 48 1 0 12 032 38 12 11 033 36 14 13 0 30 39 16 14 028 39 18 12 032 38 40 20 16 026 42 2 2 16 026 42 24 11 033 36 26 11 033 36
60 28 30
10 10
036 036
36 36
Sand
32 10 036 36 34 12 032 3 8 3 6 12 032 38 38 12 032 38
1 1 (m)
40
4 2 4 4
13
14 16
030
028 026
39
39 42
46 13 030 39 48 12 032 38 50 14 028 39 52 10 036 36 54 13 030 39 56 14 028 39 58 15 027 41 60 15 027 ~-1 236 62 64 66 68 70 72 74 76 7 8 80
APPENDIX 114
Pi l e No 5 Length 6 0m D 11 m Dp 11 m
Area s of i nfluence
-
qc
(MPa)
1 Tp
-3Lf
( MPf) l ~
(MP~) qcp (MPa)
Soil type
2 2 2 0 18 1 6 14 1 2 155 U i1 33
l 2 (m)
1 2 10 08 06
15 14 12
022 023 0 27
3 3 32 32
Fine sand
+ silt
04 125 026 33 02 16 0 21 34 39
02 16 021 34 04 13 025 33 06 08 10
15 5 17 20
022 0 20 018
34 34 36
35 Fi ne sand
1 2 20 0 18 36 14 20 018 36 + s ilt 16 20 0 18 36 18 165 020 32 20 165 0 20 32 22 17 0 20 34 24 26 2 8 30 32 3 36 38 4 0
19 21 5 21 5 21 5 20 19 5 19 5 20 215
01 9 ---
018 018 0 18 0 18 -
3 6 40 40 40 36 35 3 5 36 4 0
l 1 (m) 4 2
44 20 19
018 01 9
36 3 6 157
46 48 50 5 2 54 56 58 6 0 62 64 66 68 70 7 2 74 76 7 8 8 0
APPENDIX 1 15
Pi le No 6 Lengt h6 0 m D 11 m
Areas of qc 1 __9_c_ qcp Soil typei nfluence fp f 1 yen (MPa) (MPf ) (MPf) (MPa)
-2 2 20 18 16 t 4---0 14 75 038 29 L2 20 018 36 Fi ne sand
1ti 10 30 40 + s i lt12 08 19 0 19 36(m) 06 17 020 34 04 14 023 32 02 9 034 31 56
02 6 043 26 04 12 026 3 1 06 17 020 34 08 11 028 3 1 1 0 14 023 32 35 1 2 17 020 34 Fi ne sand14 19 019 35 16 20 018 36 + silt18 18 0 19 34 20 14 023 32
46 22 12 026 31 24 12 026 31 26 15 022 33 28 18 019 34 30 20 018 36 3 20 0 18 36 34 20 018 36 3G 20 018 36 38 20 018 36 4 0 20 018 36
l 1 42 22 40
(m) 44 22 40 46 L2 4 0 158 48 50 52 54 56 q =V ~ - 3 b =0 99middot35 = 35 MPp cp 53 58 6 0 62 64 66 68 70 72 74 76 78 80
APPENDIX 116
Pi leNo7 Length 60 m 0 15 m
Areas of influence
-
qe
(MPa)
1 Tp ~
(MPg) r~
(MPf) qcp (MPa)
Soil type
22 20 18 16 9 U33 30 14 10 031 31 12 135 024 32
l 2 (m)
16 10 08 06 04 02
13 12 6
10 175
025 026 043 0 31 020
33 31 26 3 1 35 50
Fine sand
+ silt
02 04 06
17 10 115
0 20 0 31 027
34 31 3 1
08 10
145 185
023 019
33 35 3 5
1 2 14
20 19
018 0 19
36 36 Fine sand
l 1 (m)
60
16 18 20 22 24 26 28 30 3 2 34 36 38 40
42 44 46 48 50 52 54 56 58 6 0
185 125 125 165 17 19 21 215 205 20 21 20 20
24 22 20 215 22 22 21 19 18 22
0 19 026 0 26 020 020 019 --
018 018 -
018 01 8 --
018 ----
0 19 0 19
35 33 33 33 34 36 40 40 37 36 40 36 36
40 40 36 40 40 40 40 36 34 40 219
+ silt
62 64 66 68 70 72 74 76 78 80
APPENDIX 117
Pile No 8 Length60 m D 15 m Dp 2 1 m
Areas of influence
-
qe
(MPa)
1 r +
(MPg) r~
(MPf) qcp (MPa)
Soil type
22 18 019 34 20 16 021 34 18 125 026 3 3 16 115 027 31 14 11 028 3 1 12 11 028 3 1
l 2 (m)
10 08 06
105 11 145
D29 028 023
30 31 33
Fine sand
+ silt
04 18 0 19 34 02 18 019 34 71
02 15 022 33 04 11 0 28 31 06 13 0 25 33 08 20 0 18 36 10 15 022 33 12 13 025 33 14 175 020 35 16 18 20 22
20 21 20 15
018 -
018 0 22
36 40 36 33
35 Fine sand
+ s i lt
24 26 28 30 3 =
13 16 175 19 20 20
025 021 020 0 18 018 018
33 34 3 5 34 36 36
36 38 4 0
20 20 21
018 0 18 -
36 36 40
11 (m)
4 2 4 4 4 6 48 50 5 2 5 4 56 5 8 60 6 2 6 4
20 20 21 22 21 20 19 175 19 20 25 28
018 0 18 ---
01 8 01 9 0 20 0 19 018
36 36 40 40 40 36 36 35 36 36 40 4 0 23 0
6 6 68 70 72 74 76 78
qcp 1f5=v 2T middot35 = b85 middot35 = 30 MPa
80
APPENDIX 118
Pi le No 9 Le ngth 90 m D 11 m m
Areas of 1Qe -9c qcp Soil typeinfluence Tp f ryen (MPa) (MPg) (MPf) (MPa)
-
2 2 2 0 18 16 14 lc 11 034 37
12 10 10 036 36 12 08 9 039 35 Medium(m) 06 10 036 36 sand04 10 036 36
02 11 034 37 43
02 12 032 38 04 12 0 32 38 06 12 0 32 38 08 13 030 39 10 13 030 39 12 13 030 39 14 14 028 39 16 14 028 39
44 18 14 028 39 20 14 028 39 39 Med ium 22 15 027 4 1 sand 24 16 026 4 2 26 17 025 43 28 13 0 30 39 3 0 9 039 35 32 13 030 39 34 16 026 42 36 17 025 43 38 17 025 43 40 19 024 4 6
11 42 17 025 43
(m) 44 15 027 41 17 7 46 48 50 52 54 56 58 60 6 2 64 66 68 7 0 7 2 74 76 78 80
APPENDIX 119
Pi 1 e No 10 Length 95m D 11 m m
Areas of influence
-
qe
(MPa)
1 fp
-9c f
(t-1Pf) [~
(MPf)
qcp
(MPa)
Soil type
22 20 1 8 16 14 L 2 13 Uti 3J
l 2 (m) 12
10 08 06 04
18 18 28 19
0 19 019 0 19 019
34 34 34 34
Fine
sand
02 21 40 42
02 20 4 0 04 17 020 34 06 21 40 0 8 10
23 22
40 40 Fine
1 2 14 16 18
21 20 16 15
0 21 022
4 0 4 0 34 33
sand
44
20 2 2 24 26 28 30 32 34 36 38 40
14 14 13 11 11 14 17 14 12 13 12
023 023 025 0 28 028 023 020 023 027 025 027
32 32 33 31 31 32 34 3 2 32 3 3 32
l 1 (m) 42
44 12 13
0 27 025
32 33 15 2
46 48 50 5 2 5 4 56 5 8 6 0 6 2 6 4 66 6 8 70 72 74 76 78 80
APPENDIX 11 10
Pi 1 e No 11 Lengt h 9 0m D 11 m m
Area s of influence
-
Qe
(MPa)
1 fp
__k_ f
(MP~) ryen
(MPf) qcp (MPa)
Soi l type
22 20 18 16 14 12 lb 55
12 (m)
1 0 08 06 04
23 19 20 21
024 023
55 46 46 55
Medium
sand
02 22 55 62
0 2 04
24 25
55 55
06 08
27 28
55 55
10 12 14
28 28 28
55 55 55 49
16 26 55
44
18 20 22 24 26 28 30 3 34 36 38 40
24 19 18 17 22 21 17 11 13 12 11 9
024 024 025
025 0 34 030 032 034 039
55 46 43 43 55 55 4 3 37 39 38 3 7 35
1 1 (m) 42
Ll Ll
12 16
032 0 26
38 4 2 209
46 48 50 5 2 54 56 58 60 62 64 66 68 70 72 74 76 78 80
APPENDIX 141
0 2 3 4 p [MPa)
PILES WITH 40 ENLARGED BASES
80
120
160 C----0
200 IN4014 s (1977)
[mm]
P s calculateds P p(s)(mm) (MPa)(mmMPa)(MPa) ()
10 035 286 046 20 065 308 080 30 090 333 104
150 24 625 214 200 229
ai = 2605 (mmMPa) b1 = 0243 1MPa V 1000 bi = 1b = 411 MPa
_ 411 MP Vi - 24 a
() assumed
average Dp = 18 m
qcp = 24 MPa ai = 184 (mmMPa) (28-4middot24)
Vi = 1 2 (3-18)
qcpmiddotvi = 29 MPa
40
80
120
160
200 s
[mm]
DIN 4014 Part 2 ( 1977)
0 1 2 3 4 5 p [MPal
PILES WITHOUT ENLARGED BASES
C----0
DIN 4014 ( 1977
s calculated s p -p- p(s)
(mm) (MPa)mmMPa)(MPa) ()
10 05 20 062 20 08 25 113 30 11 27 3 155
150 34 441 385 200 424
ai = 2085 (mmMPa) bi= 0 157 1MPa V = 0970
bi= 1s = 637 MPa
Vi 187=3f =
() assumed
average Dp = 12 m
qcp = 34 MPa a1 = 144 (mmMPa)
Vi = 18
qcpmiddotvi = 61 MPa
Range qc = 10-15 MPa
(28-4bull34)
(3-12)
1 1 q = r -r- = 036 for qc = 10 MPaCp p Ip+= 027 for qc = 15 MPa
qcp = 36-405 MPa P
APPENDIX 142
Touma F and Reese L (1974)
Soil parameters pile parameters and base resistance see fig bullbullbullbull
TAB
Measured load settlement curves
Settlement s
mm
10 20 30 40 50 60 80
100 120
a 1 (mmMPa) bi(MPa) V
N3u
q =04 -N30 (cMPa) ()
1 qCp=--rpbullqC
Pile No 21 (US 59) 22 (HH) 23 (G1) 24 (BB) Notep Sp p S p p S p f Sp MPa mmMPa MPa mmMPa MPa mmMPa Mla mmMPa
131 76 169 59 075 133 100 100 269 74 325 62 131 153 1 94 103 381 79 456 66 165 182 273 11 0 488 82 581 69 1 90 21 1 349 115 581 86 694 72 2 15 233 424 118 675 89 800 75 229 262 813 98 245 327 884 113 925 130
64 56 100 95 U049 0032 0276 0048 0944 0998 0996 0981
80 gt100 30 60 32 gt 40 12 24 ()
Bergdahl (1982)
gt5 5 gt55 32 4 3
(0 18middot32) (018middot40) (0265middot12) (018middot24)
CONTACT PRESSURE p [ MPa]
0 2 4 6 8 100 N-------r---------------(us 59) ( HH) ( BBi
E E SQ-------lt+-----+--------------lt
VI
1shyz UJ
~ 100 1---------i----+----+----+------l------I -J I shyI shyUJ V)
so~----~--~-- ~--~
APPENDIX 143
us 59 fYJo 0 50 00
ff-t r-=-~c~=~-r~c_---_---l-~e-J-C~ 0 ------
CLAY
FINE SANO
J lD- 760 mm
f5m~--~--~
Pile US 59 and results from penetration test
HH IV_l() so 100 r=-=-==-==-r-~--=-=- 0 0 II 15- flf ~ II~ Ibull If t f
CLAY SAND
Sm
)
= -middotl lo - GtOmm
~ JI
SILTY SANO tOm
Pile HH and results from penetration t est
APPENDIX 14 4
61 NJO 50 --------00
11 1 =f J - 1 -- 0
CLAYSILT
E ~ Sm ltrj
SILTY SAND
q I lDmiddot 910 mrn tom
I) t bull
Pile G1 and results from penetration test
88
0 50 too ~1-e I q 111bull - Q
CLAY
SIL TY SAND 5m
]
l lDmiddot760mrn
Om
Pile BB and results from penetration test
APPENDIX 145
Klosinski B (1977)
Loading tests 50 bored piles 09-125 m diameter average Op= 11 m On t he sett l ement of rigid pla te the settlement of t he pi le base is given by
PmiddotOSp = T-K b
where Mb - equivalent deformability modu lus
1) Sand and sandy gravel of medium density
Mb = 25-50 MPa
According to Bergdahl (1979) medium sand is between
q(l) 5 MPa (Io=035)c2)
ql = 10 MPa (Io=065)C
from fig 117 rp1 = 055 for qc = 5 MPa 1Tp = 036 for qc = 10 MPa
q(l)= 0 55middot5 = 2 75 MPacp bull
q(2= 0 36middot10 = 360 MPacp
allowable p~ 1)= ~p = yen = 092 MPa and p~2) = ~ = 120 MPa
settlement of the pi l e base
5(1)= o 92 middot 1bull1 = O 0135 m = 13 5 mm p 325 middot middot
5( 2)= 1bull2bull1middot 1 = O 0088 m = 8 8 m p 350 bull bull
1) _ s _ 135 _ 14 7 (mm) a(2) _ 88 _ a 1 - p - o---92 - bull NPa bull 1 - T-7 - 733 (Wa)
2) Loose sand lo= 030-040
Mb = 12- 25 MPa
q~l) = 44 MPa q~2)= 58 MPa
1Tp = 058 and 052
q(3) = 0 58middot4 4 = 2 55 MPa middot q( 4) = 0 52middot5 8 = 3 02 MPa cp bull middot bull cp bull middot middot
allowable p~ 3)= 4i = 085 MPa p~4)= yenl = 101 MPa
s(3)_ 085-11 = 26 mmmiddot s(4)_ 101middot11 = 148 mm p - 312 p - 3 25
STATENS GEOTEKNISKA INSTITUT Swedish Geotechnical Institute S-581 01 Linkoping Tel 01311 51 00
Serien Rapport ersatter vara tidigare serier Proceedings (27 nr) Sartryck och Preliminara rapporter (60 nr) samt Meddelanden (10 nr)
The series Report supersedes the previous series Proceedings (27 Nos) Reprints and Preliminary Reports (60 Nos) and Meddelanden (10 Nos)
RAPPORT REPORT Pris kr
No Ar (Swcrs)
1 Grundvattensankning till foljd av 1977 50shytunnelsprangning P Ahlberg T Lundgren
2 Pahangskrafter pa langa betongpalar 1977 50shyL Bjerin
3 Methods for reducing undrained 1977 30shyshear strength of soft clay K V Helenelund
4 Basic behaviour of Scandinavian soft 1977 40shyclays R Larsson
5 Snabba odometerforsok 1978 25 shyR Karlsson L Viberg
6 Skredriskbedomningar med hjalp av 1978 40shyelektromagnetisk faltstyrkematning - provning av ny metod J Ingands
7 Forebyggande av sattningar i 1979 40shyledningsgravar - en forstudie U Bergdahl R Fogelstrom K - G Larsson P Liljekvist
8 Grundlaggningskostnadernas fordelning 1979 25 shyB Carlsson
9 Horisontalarmerade fyllningar pa los 1981 50 shyjord J Belfrage
RAPPORTREPORT
No
10 Tuveskredet 1977-11-30 Inlagg om skredets orsaker
11a Tuveskredet geoteknik
l1b Tuveskredet geologi
11 c Tuveskredet hydrogeologi
12 Drained behaviour of Swedish clays
R Larsson
13 Long term consolidation beneath the test fills at Vasby Sweden YCE Chang
14 Bentonittatning mot lakvatten T Lundgren L Karlqvist U Qvarfort
15 Kartering och klassificering av leromradens stabilitetsforutshysattningar L Viberg
16 Geotekniska faltundersokningar Metoder - Erfarenheter - FoU-behov E Ottosson (red)
17 Symposium on Slopes on Soft Clays
18 The Landslide at Tuve November 30 1 977 R Larsson M Jansson
19 Slantstabilitetsberakningar i lera Skall man anvanda total spanningsanalys effektivspanningsanalys eller kombinerad analys R Larsson
20 Portrycksvariationer i leror i Gateshyborgsregionen J Berntson
21 Tekniska egenskaper hos restproshydukter fran kolforbranning shyen laboratoriestudie B Moller G Nilson
Ar
1981
1981
1981
1981
1981
1982
1982
1982
1983
1982
1983
1983
1983
Pris kr (Swcrs)
50shy
50shy
40shy
50shy
100shy
60shy
80shy
60shy
190shy
75shy
60shy
150shy
65shy
RAPPORTREPORT
No Ar Pri s kr (Sw crs)
22 Bestamning av jordegenskaper med sondering - en litteraturstudie U Bergdahl U Eriksson
1983 75 shy
23 Geobildtolkn ing L Vi berg
av grova moraner 1984 70 -
24 Radon i jord -Exhal ation- vatten kvot -Arstidsvariationer - Permeabilitet A Lindmar k B Rosen
1984 75 shy
25 Geoteknisk terrangklassificering for fysisk planering L Viber g
1984 120shy
26 Large diameter bored piles in nonshycohesive soils Determination of the bearing capacity and settlement from results of static penetration tests (CPT) and standard penetration test (SPT) K Gwizdala
1984 85shy

STATENS GEOTEKNISKA INSTITUT SWEDISH GEOTECHNICAL INSTITUTE
RAPPORT REPORT No26
Large diameter bored piles in non-cohesive soils Determination of the bearing capacity and settlement from results of static penetration tests (CPT) and standard penetration test (SPT)
KAZIMIERZ GWIZDALA
LINKOPING 1984
ISSN 0348-0755
AS OSTGOTATRYCK UltPG 19amp4
3
P R E F A C E
The work was carried out at the Swedish Geotechnical
Institute in Linkoping during my stay in Sweden as a
scholar of the Swedish Institute
I wish to express my thanks to the Swedish Institute
for the possibility to stay and to research in Sweden
In my work and during the whole stay I have received
every possible support help and encouragement from
the Head of the Swedish Geotechnical Institute Dr Jan
Hartlen For this and for the possibility of studying
at the Swedish Geotechnical Institute I am extremely
grateful and wish to express my very best thanks
Special thanks are due to Dr Bo Berggren and Civing
Per-Evert Bengtsson for the constant and great help
given to me in the daily work at the Institute
I would like to thank all members of the staff at the
Swedish Geotechnical Institute who have helped me
during my stay in Sweden
AcKnowledgement is extended to Mrs Eva Dyrenas who typed
the manuscript a nd to Mrs Rutgerd Abrink and Mrs Irene
Aberg who made the drawings
Linkoping January 1983
Kazimierz Gwizdala
Institute of Hydro-tngineering
of the Gdansk Technical University
Poland
5
CONTENTS
Page
7SUMMARY
NOTATIONS AND SYMBOLS 9
1 LARGE DIAMETER BORED PILES IN NON-COHESIVE SOILS 11
11 Determination of bearing capacity of bored piles from results of Cone Penetration Test (CPT) 11
12 Determination of bearing capacity of the large diameter bored piles from results of the Standard Penetration Tests (SPT) 18
13 Allowable load of large diameter bored piles 22
14 Determination of settlement of large diameter bored piles based on static cone penetration tests CPT 27
15 Initial slope of pile point resistance shysettlement
REFERENCES
FIGURES
TABLES
APPENDIXES
curve 37
43
51
105
7
16 Summary
The work contains a study of the behaviour of l arge diameter
bored piles in non- cohesive soil The mai n attention was
paid to the determination of the bearin g capacity a nd
sett lement from results of Cone Penetration Test (CPT)
and Standard Penetration Test (SPT)
A new met hod to calculate bearing capacity on large bored
piles based on the in situ measurement is proposect taking
into account investigations made during the last years in
all the world The values based on the proposed method
are compar ed to field test results
The analysis of bearing capacity safety factors and loadshy
settlement curve allows to assume values individual safety
factors for resistance of pile point and shaft respectively
Based on a detailed investigation the pile point pressure
settlement curve and shaft resistance dependance during
loading a new method to predict the pile point pressure shy
displacement and load- settlement relationship is proposed
The initial slope of the point pressure- displacement curve
can be determined from in situ tests or laboratory test
based on the hyperbolic stress- strain parameters
9
Notations and symbols
Roman letters
a 1 Initial slope of the pile point resistance shysettlement curve
Ap Cross-sectional area of a pile
As Area of the pile shaft
CPT Static Penetration Test
D Diameter of pile shaft
Op Diameter of pile point
E Youngs modulus
fp Point resistance factor
fs Shaft resistance factor
F Universal safety factor
Fp Individual safety factor for ultimate resistance of pile point
Fs individual safety factor for ultimate resistance of pile shaft
K Dimensionless compression modulus
K At rest soil lateral stress coefficient0
Koc Lateral stress coefficient for fluid fresh concrete
Mo Constrained (oedometric) modulus
N30 Numbe r of blows for 030 m penetration in SPT
p Unit point resistance (contact pressure)
p (s) Unit point resistance versus settlement
Unit point resistance at failurePsf
Allowable unit point resistancePa
Sounding resistance
Average static cone penetrometer resistance close to tne pile point
qs Average static cone penetrometer resistance C along the pile
10
Ultimate point resistance of large diameter piles based on static sounding results
Ultimate skin friction resistance of large diameter piles based on static sounding results
Qa Allowable pile load
Qcp Point load of the static cone penetrometer
Qct Total load of the static cone penetrometer
Qpa Allowable point resistance of the pile
Qpu Ultimate point resistance of a pile
0 sa Allowable skin resistance of the pile
0su Ultimate bearing resistance of a pile
Qu Ultimate bearing resistance of a pile
s Settlement
sd Standard deviation
ss u Ultimate settlement for pile shaft
sv Standard variation
SPT Standard Penetration Test
t Unit shaft resistance
Ultimate unit shaft resistance
Circumference of the pile shaft
Circumference of the static penetrometer shaft
Greek letters
a Constant
B Constant
A Coefficient
microd Depth factor
v Poissonbulls ratio
v 1 Correction factor for hyperbola point resistance shysettlemen~ relationship
n Correlation coefficient
ahc Radial (horizontal stress in the concrete
ohs Radial (horizontal) stress in the soil
Ovc Vertical stress in the concrete
Ovs Vertical stress in the soil
11
1 LARGE DIAMETER BORED PILES IN NON-COHESIVE SOILS
11 peterminati on of bearing capacity of bored piles
from results of Cone Penetration Test (CPTl
The methods published in available literature up to 1976
were compiled by D Rollberg (1976 1977) It contains
totally 25 methods
- 22 use the results of static soundings (CPT)
3 use the results of standard soundings (SPT)
The failure load Qu of the pile is evaluated as the sum
of the pile point resistance Q and the pile skin reshypu sistance Qsu
(111)
Pile point resistance Q based on static soundina reshypu shysults can be expressed as
1- bull qP A ( 1 1 2)f C p
p
where
fp = point resistance factor
qP mean sounding resistance of static cone C
penetrometer in the area of the pile point
A cross-sectional area of the pilep
The pile skin resistance is expressed as
1 s -- bullq bullU middot Lih (113) fS C p
where
fs = shaft friction factor
sqc mean sounding resistance along the depth h
and skin surface area U middotLih p
1 2
The methods differ in
- the calculation of qPC
(074 to 40) Db below the pile base (Fig 11 1)
(10 to 80) Db above the pile base (Fig 1 11)
- the evaluation of the point resistance factor usually
values off gt 10 are used p
- the calculation of qsC
- the evaluation of the shaft friction factor
fs = 50-300 is applied
In Table 111 methods for determination of the bearing
capacity of bored piles are listed Rollberg 1977 The
point load the skin friction load and the ultimate total
load are evaluated for bored piles (shaft diameter D ~
03-090 m) from static sounding results in non-cohesive
soil
Calculation results based on static sounding measurements
are shown in Table 112 for pile point pile shaft and
total pile load respectively
The table shows that
- a ll methods overestimate the ultimate point resistance
- the best correlation for ultimate point resistance is
obtained with the Soviet method Trofimenkov 1974
n1 = 114
- there a re only five methods for evaluation of the ultimate
skin resistance
- all methods with exception of the Soviet norm Trofimenkov
1969 method overestimate the ultimate shaft resistance
- the Norwegian method Senneset 1974 gives the best
correlation for the ultimate shaft resistance =119n 2
- with exception of the Soviet methods the total ultimate
load is on the average overestimated by all methods
1 3
Taking into account the above results the Soviet and
the Norwegi an methods are presented below
The Soviet method JG TrofimenkgtV 1974
1 qP bullA + qsbullA (114a)Qu = Qpu+Qsu fp C p f C s s
where
11 40 DP 12 1 0 D p h+l1 qp r dhqcC l1+l2 h-12
0ct-0ceqs C u middoth s
f(qp) -+ see Fig 1 bull 1 2 fp C
f f ( qcs) -+ see Fig 1 1 3 s
The Norwegian methon K Senneset 1974
1 p A 1 s bullA ( 1 bull 1 bull 4b)-f-middotqcmiddot p + -f-q s p S C
where
11 30 D p
12 50 D p h+l11 f dhqP l1+l 2 qc
C h-12 h s 1
= f dhqc qch 0
f 20 p
f = f (q~ ) + see Fig 114 s
Note a ) The total skin friction -f-middotq~ is assumed to be
no less than 10 kPa even~ith a very little
cone penetrometer resistance
b) The poin t resistance -f-middotq~ is assumed to be
maximum 10 MPa even iJl case of very dense sand
14
It must be underlined that the best correlation for
the pile point is obtained with the Soviet method
101 for 94 driven piles in non-cohesive soil
- 172 114 for 46 bored piles in non-cohesive soil
Trofimenkov 19731974 showed the results of comparison
of the ultimate loads determined by formula (114a)
Q~ and by pile load tests Q~ for 153 driven friction
piles at the 57 various sites see Fig 115
In Germany a lot of investigations were made before
establishing the DIN 4014 part 2 (1977) on large diameter
piles
In Table 113 and 114 the results from these investigashy
tions are generalized
The data in the tables were obtained from 35 test loadings
(4 of which were published by Franke 1973 The diameter
of the piles was from 08 to 25 m the length from 5 m
to 34 m and the cone penetrometer resistance varied from
10 MPa to 15 MPa
Bustamente and Gianeselli 1982 proposed a prediction
of the pile bearing capacity by means of the static
penetrometer Their proposal was based on the intershy
pretation of a series of 197 full scale static loading
tests In this paper the results from tests of 55 bored
piles are chosen The diameter of the piles varies from
042 m to 150 m and the length from 6 m to 44 m The
equivalent cone resistance was determined as showed in
Fig 116 The authors have noticed that the point
resistance factor f depends on the nature of the soil p and its compactness but also on the different pile placeshy
ment techniques (see Tab 115)
Piles of category group I
- Plain bored piles - Cased bored piles
- Mud bored piles - Hollow auger bored piles
- Type I micropiles - Piers (grouted under low - Barrettespressure)
15
In Tab 116 values of the shaft resistance factor
fs are given
Category IA
- Plain bored piles - Mud bored piles
- Hollow auger bored piles - Cast screwed piles
- Type I micropiles - Piers
- Barrettes
Category IB
- Cased bored piles - Driven cast piles (concrete or metal shaft)
Category IIA
- Driven precast piles - Prestressed tubular piles
- Jacked concrete piles
Category IIB
- Driven metal piles - Jacked metal piles
It can be noted that the values in Tab 116 are in
genera l of the same range for the driven and the
bored piles
According to the Polish Specification 1979 the point
and shaft resistance factor are given by
1-f- = kmiddota
p p
where
ap 035 for sand
k coefficent of unhomogeneity k qcp min
qcp
= 0065 for sandfrac12
1
16
Similar results can be observed in Fig 116a and
Fig 116b It was showed by Kerisel (1965) and Franke
(1973) that the harder soil the more loosening at
excavation and thus relatively smaller bearing capacity
Taking into account the Franke diagrams we will have
for D = 125mand settlements= 2 cm p
Cone resistance qc (MPa) 1 5 50 1 0 15 22
qc p for s=2 cm 3 6 8 12 14
(see Fia 1 1 6b )
taking safety factor for pile base F = 3 the point resis~ance
33-10 ~-05
380375 lo 212 bull lo 2114 bull
factors- shy are p
The above anal ysis shows that it is possible to determine
ultimate point and shaft resistance of bored piles from
static cone sounding But it is very important and must
be taken into account type of pile kind of soil and
degree of compaction
Bel ow calculation method for large diameter bored piles
based on the static cone penetrometer resistance (CPT)
is proposed Equation (117) can be used directly for
the base diameter D lt 15 m For larger diameters p shyD gt 15 m the values should be multiplied by the
p ff t ITscoe icen Y~ as pi
( 1 1 5 )
where
qcp = according to equation (117)
D = diameter of the pile base D gt 15 mpi pi
17
This value q~p should be put into equation 116
The value qc s in equation 118 is independent on the
pile diameter
Proposed calculation method
(116)
where)
1 1 40 ~ 11 3 for piles wit h a nd enlarged bases12 10 12 = ~
h+h
q (h) dh (117)qcp l1+l2 f -f- Ch-li p
h 1 f 1
qcs = o -f- qc (h) dh (118)h s
1 -f- = f(q kind of soil ) -+- see Fig 11 7 and Tab 1 1 7
C p
f (q kind of soil ) -+- see Fig 1 1 8 and Tab 1 1 8 fs C
Note
a) the point resistance q for qc gt 20 MPa is assumed cp to be maximum as
- Gravel 70 MPa - Coarse sand medium sand 55 MPa - Fine sand s il ty sand 40 MPa
b ) The shaft resistance qcs for qc gt 20 MPa is assumed to
be maximum as
- Gravel 110 kPa - Coarse sand medium sand 90 kPa - Fine sand s ilty sand 70 kPa
These proposed values are compared with results by
Bustamente (1 982) and the Polish Specification (1978)
Fig 11 9 and F i g 1110 A similar comparison for DIN
4014 1 977 is shown in Fig 1111 and Fig 1112
) In this paper was used the above values 1 1 and l z But it can be used in practice 11 =30 D and h =2Dp respectively The results shall be very simi l ar to the above onPs
18
The proposed method has been examined with field test
results This is shown in Fig 1113 to Fig 1128
and Appendix 1 11 to 1110 and Tab 119
The comparison shows that the value of q in equationcp (117) corresponds to the settlement -10 of the base
diameter (s=010 DP) see Fig 1113 and Tab 119
(average sDp=88 and standard deviation sd=3)
Later in this paper the allowable load and dependence of
the load versus settlement will be determined
12 Determination of bearing capacity of the large
diameter bored piles from results of the Standard
Penetration Tests (SPT)
There are little published on pile tests coupled with
results from Standard Penetration Test (SPT) Among the
authors who have published material in the subject are
- Meyerhof 1956 1976
- Senneset 1974 (Norwegian method)
- Rodin Corbett Sherwood Thorburn 1974 (English method)
- Polish Specification 1975
- Weltman Healy 197 8
- Reese 1978
- Japanese Society 1981
- Decourt 1978 1982
The Norwegian method is valid o nly for concrete andor
wooden piles the English method only for gravel It is
very important to underline that the Norwegian a nd the
English methods use of the SPT resul ts intermediate by
the static cone penetrometer resistance (q ) as well C
Below methods are presented that are using the results of
SPT directly Meyerhof s method in total can also be used
on driven piles in non-cohesive soil Although we could
have found some proposes for bored piles Eqs (121 and
122) see Fig 121 and Fig 1 22 as well
19
Ultimate point resistance (psf)
12 N 3 omiddotH lt 120 N 30
(kPa) (1 2 1)Psf D
where
N30 the average standard penetration resistance
in blows per 03 m
H depth in bearing stratum
Ultimate skin friction tu
for bored piles tu N~ o (kPa) (1 22a)
for driven pil estu 2N30 (kPa) (1 2 2b)
where
N30 the average standard penetration resistance
in blows per 03 m within embedded length
of pile
Weltman and Healy (1978) taking into account Meherhofs
proposition for driven piles have introduced two coefshy
ficents for bored piles in gravels (glacial soil) Equ
123 and Fig 1 23
t = a 2 N30 (kPa ) (1 2 3)U 1
where
ai a 1 for impermeable gravels see Fig 123a
ai a 2 for permeable gravels see Fig 123b
The Polish Specification ( Specification for Design and
Construction of Large Diameter Bored Piles in Bridges
1975 Ministry of Transport) gives the ultimat e point
resistance in dependence of N30 base diameter and depth
see Tab 12 1 The Tab 121 contains values for coarse
and medium sand For other non-cohesive soils the following
coefficients are proposed
p f = S bull p f (medium sand) ( 1 2 4)S 1 S
20
where
S1 1 20 for grave lSi
f 132 080 for fine sand
13 3 070 for silty sand13i
In Fig 124 values of psf are shown for h = 10 m DP
06 m DP= 15 m and h = 20 m DP= 06 m DP 1 5 m
respectively
A few of the instrumented piles were tested and analyzed
by Wright and Reese (1979) The ultimate point and shaft
resistance in the fine and silty sand as a function of
blow count from SPT is shown in Fig 125 Results from
two additional tests reported by Koizumi (1971) are also
introduced in the figure The ultimate point resistance
is assumed to exist at a settlement equal to 5 of the
base diameter
Methods of prediction of the bearing capacity of piles
based exclusively on N30 values were presented by Decourt
1982 Below a proposition for high capacity piles excavated
and cast under bentoni te is presented
The ultimate skin friction is determined by the expression
(see Fig 126)
t = 33 N30 + 1 0 (kPa) ( 1 bull 2 5 ) u
where
N30 average value of N30 along the shaft
- for N30 lt 3 must be taken as = 3N30 - for N3o gt 5 0 must be taken as NJo= 50
The allowable point resistance can be obtained in a n
expedite way as
Psa = 33 N30 (kPa) (1 2 6)
where
N30 = average of Nat point level one metre above
and one metre below
Psa allowable point resistance
21
Decourt proposed a safety factor for the point of F = p
40 Therefore the ultimate point resistance can be
determined by the expression
(kPa) (1 2 7)
In Fig 12 7 and Fig 1 28 the above values for base
and skin friction resistance are compared respectively
Taking into account the type of soil thereis a good
correlation for ultimate point resistance The result for
ultimate skin friction is scattered but only apparently
The values for large diameter bored piles are between
the line 1a and 1b in Fig 128 Large diameter piles
have a high ultimate skin friction in relation to driven
piles (see points for bored piles in Fig 122 and DIN
4014 Part 2 1977 as well) The high values for piles
excavated and cast under bentonite have had a strong base
on the load tests (Decourt 1978 1982 and Wright and
Reese 1979)
Below the proposals are given for determination of the
values of the ultimate point resistance and the ultimate
skin friction Eqs 128 to 1214 and Fig129 1210
The ultimate point resistance
- gravel psf = 140 N30 (kPa) ( 1 bull 2 8)
for N~ 0 gt 50 blows3O cm Psf 7 MPa
- coarse sand and medium sand
(kPa) ( 1 2 9)
for N30 gt 50 blows3O cm Psf 55 MPa
- fine sand and silty sand
psf = 80 Nio (kPa ) (1210)
for N30 gt 50 blows3O cm p f = 40 MPa 5
where N3 o the average of N value near the point level as
22
h+l1
f N3o(h)dh ( 1 2 11 ) h-12
3DP see Fig 1 1 1 D
p
The ultimate skin friction for coarse sand and medium sand
tu = 1 8 N 3 o (kPa) (1212)
t (kPa) (excavated and cast (1213)u under bentonite)
where
N30= the average value of N along the shaft as h
N -
3 o = h1 f N 3 o ( h) dh ( 1 bull 2 bull 1 4 ) 0
The ultimate skin friction for N30 gt 50 blows30 cm is
assumed to be maximum as tu = 90 kPa and t = 150 kPa u
13 Allowable load of large diameter bored piles
The allowable load Qa of large diameter piles has been
expressed as
OuQa ( 1 3 1)Ft
Qa Q(s)=Qb(s) + Os(s) ( 1 3 2)
Opu + Osu (1 3 3)Qa Fp Fs
Qr lt mmiddotQf ( 1 bull 3 4)-
= universal safety factor
individual safety factor for ultimate resistance of the pile point
individual safety factor for ultimate resistance of the pile shaft
= load according to the allowable settlement
calculated load
m coefficient
calculated ultimate bearing load of the pile
23
The equations from (131) to (134) are used as
1) equation (131)
a) DIN 4014 - 1977 Ft= 2 175 15 (depending on the kind of load)
b) Polish Specification 1975 Ft = 18 16 ( -- )
1c) Trofimenkov 1974 Ft = 14307
2) equation (132)
a) DIN 4014-1977 i Q(s) = Qb(s) + Q (s) = A middotp(s) + E tAsmiddott(s)
s p 0
where Qbs) and Qs(s) are described in Fig 1423
3) equation (133)
a) Polish Specification 1974
F 25 22 depending on the kind of load p
F 1 bull 0 s
b) Wright SJ Reese LC 1979
The ultimate capacity or resistance is considered as a
random value and represented by a frequency distribution
The distribution can be described by a mean value and a
variance The distribution of the load applied to the
foundation can be described similarly The coefshy
ficients used to factor resistance and loads are called
partial safety factors Some recommended partial safety
factors for resistance under normal conditions of design
and construction are given in Tab 131 Normal control
is defined as a condition where the coefficient of variation
is less than about 035
Typical values for partial safety factors for loads are
in the range 1 to 2 depending on the type of load and
how it is applied The overall factor of safety Ft can
then be calculated from the equation
Ft = y RbullY S
24
where
YR the par tial sa f ety fac t or for resistance and
Ys the partial safety factor fo r load
The probability of fa i lur e of the foundation can be r eshy
lat ed to the factor of safety for a parti cular degree of
uncert ainty (see Tab 13 2)
c ) Tejchman Gwizdala 1979
The authors discuss adequate safety factors based on fie l d
test s by Spang (1 972) Franke (1976) Touma and Reese (1974)
Colombo (1971) Kerisel and Simons (1962) Appendirno (1973)
see Tab 1 33 Taking into account the universal safety
factor Ft= 2 0 for the tota l load settlement curves it
was estimated
i) F in the range of 111 to 237 with the average value s F = 166 and standard deviation sd = 034 s (see column 16 Tab 133)
ii) Fb in the range of 161 to 945 with the average
value Fb = 387 and standard deviation sd = 2 15
For model core d piles in laboratory conditions values of
Fs = 108 to 154 (average Fs = 132 s~ = 019) and
values of F = 280 to 5 94 (average F = 3 55 sd = 1 07)p p
see Tab 1 3 4
As a conclusion it was assumed that Fb = 40 and F 1 5 s
for l arge diameter bored piles
The investi gation has shown that for the above safety
factors settlements of piles under permissibl e loads are
10 to 20 mm There was assumed a maximum load on large
diameter piles corresponding to a settlement of 010
diameter of the piles
25
d) Bustamente Gianeselli 1 982
e) 0ecourt 1982
The safety factor is given by
F = FgmiddotFfmiddotFamiddotFw where
F 11 - skin friction g F 135 - point bearing capacity
g
Ff safety factor related to the formulation adapted
Ff= 10 for Decourts method
Fd safety factor related to excessive deformation
Fd = 10 for skin friction
As for the point Fa= 2 to 3 depending on the
pile diameter For usual cases 25 is suggested
Fw safety factor related to working load
Decourt recommends 12
Thus we will have
- for skin friction
Fs = 11bull10middot10middot12 132 - 13
- for the point
F = 135bull10bull25middot 1 2 = 405 = 40 p
4) equation (134)
a ) Polish Code 1983
Q lt mbullN r shy
where
total load coefficient (depending on the kind of load For foundation we can assume Yf = 12 )= code load
correction coeffic i ent
09 for pile foundations
m 08 for two piles
m 07 for single pile
26
N ymmiddotQu
ym material (soil) coefficient
ym 08 to 09 (Polish Code 1981)
Thus we will have
QnmiddotYf lt mmiddotym middotQu-
Yf9uFt = On m bull Ym
1 2 max = 2 14Ft 0 7 bull 0 8
1 2min = 1 48Ft 0909
The above analysis has shown different ways to determine
the allowable load The analysis is in direct connection
with mobilization of the load (versus settlement) The
dependence of total load point resistance and shaft reshy
sistance will be discussed in detail in Chapter 14
In the authors opinion taking into account the above
analysis the allowable load should be determined based
on the equation 133 ie based on individual safety
factors for ultimate point and shaft resistance Proposed
values of F and F in literature are shown in Tab 135 s p The average values are Fs = 145 and Fp = 3 38 respectively
Taking into account that the bearing capacity is determined
based on the results from sounding measurements direct from
a place near the piling without a ny indirect correlation
the allowable load of large diameter bored piles is given
by the equation (133a)
( 1 3 3a)
where F = 30 and F 13 are proposedp s
27
14 Determination of settlement of larqe diameter bored
piles based on static cone penetration tests CPT
Determination of ultimate point and skin friction resistance
based on static cone penetration tests has been discussed
in Chapter 11 above Based on the results of this calcushy
lation and on Chapter 13 we can establish an approximate
relation between point resistance shaft resistance and
total load on one hand and settlement on the other However
the approximation gives a wide scatter especially for base
resistance as can be observed in Fig 141 to Fig 144
Only the first part of the point resistance - settlement
curves are in good agreement with measured values It can
be observed in Fig 145 that the average correlation
coefficient n = 098 and standard deviation sd= 029
This way of calculation can be used only for rough calcushy
lation (see Chapter 13)
In Chapter 11 also measured point resistance - settlement
curves were shown The base resistance increases gradually
with increasing pressure and settlement Below the cur7
vature of the point resistance - settl ement curve will be
examined It is assumed that this curve can be described
as a part of the hyperbola curve Thus if the ratio of
the measured settlement (s ) to the point resistance (p)
is plotted against the measured settlement the result
will fall closely to a straight line with the equation
( 1 4 1)
where a 1 and b 1 are constants (see Fig 1 46a and Fig
14 6b)
Then the point resistance - settlement realtionship can be
expressed as a hyperbola
s p = ( 1 bull 4 2)
The constant is the initial s lope of the point resistanceshya 1
settlement curve ie a 1 = t~a The inverse of the constant
28
b 1 is the vertical tangent (asymptote) to the curve 1ie for s = 00
bf= ~ If the ultimate point reshy1
sistance psf is equal to bf (psf=bf) the whole point
resistance settlement curve will be a hyperbola type
Now the Eq 1 4 2 can be written as
s s ( 1 4 3)a) p s or b) p = a+__sect_a1 + 1 Psfbf
If the ultimate point resistance is smaller than bf only
a part of the hyperbola curve ought to be considered
Further the Eq 14 3 will be written as
p ( 1 4 4)
where
poundf_ correction factor for hyperbola point Psf resistance-settlement relationship
Taking into account the discussion in Chapter 11 the
ultimate point resistance psf = qcp based on the CPT measurements
Therefore the relationship between the point resistance
the sett l ement and the CPT result can be expressed as
s p (1 4 5)s
The correction coefficient v 1 will cause a change of the
position of the vertical asymptote bf in r elation to the
ultimate point resistance q bull This means that we take cp into account a different part of the hyperbola curve for
the description of the point resistance-settlement relationshy
ship
Now if we want to use the equation (145) in practice
we must determine the constant and the coefficienta 1 v 1 (assumed that q is determined ear l ier Chapter 11)cp
29
The constant a 1 and t h e coefficient Vi have been detershy
mined based on fi e ld tests according to pi l es No 1 - 20
see Tab 14 1 and Tab 1 1 9 as wel l The values of
a 1 versus the point diameter D and the ul timate pointp
resistance respectively are shown in F i g 147 and Fig
148 Fig 1 47 shows that a 1 is independent of the
point diameter D Based on Fig 148 it can be assumed p
that
28-4bullq (1 4 6)cp
This correlation has been examined with data of the
literature see Fig 1 49 and Appendix 141 to 1 45
(Note there were no static penetration tests and qcp was determined based on a correlation made by Bergdahl
(1982))
A good correlation with equation 146 can be seen taking
into account the safety factor in the DIN 4014 Part 2
(1977) bull
The correction factor v 1 versus the poi nt diameter is shown
in Fig 1410 I t is assumed that the correlation is
V1 = 3 0 - D ( 1 4 7)p
where D is in m p
The above equations ie 146 and 147 were assumed for
a later analyses see Fig 14 11 and Fig 1412 The
piles No 1 to 20 were examined taking into account Eqs
14 5 14 6 and 1 4 7 The result of this cal cul ation is
presented in Fig 1 413 to Fig 1 4 18 and in Tab 1 4 2
respectively In Fig 1413 the calculation way for pile
No 2 is shown as an example
In Fig 1414 to Fig 1 417 measured and calculated
values of the point resistance versus settl ement can be
compared In tota l good correlation exists for all the
30
pressure-settlement curves Values of q from static cp
cone penetration tests and generalized values of anda 1
v 1 were considered Only for piles No 17-20 qcp was
assumed as the point resistance for s = 010 D because p
the static penetration test results were inaccessible
The similar comparison is shown in Fig 1417a for piles
in sand based on experimental results (Tuoma Reese 1972
and Wright Reese 1979) where the ultimate case resistance
was assumed as the resistance at a base settlement of 005
D The relative base resistance is the mobilized base p resistance divided by the ultinate base resistance The
curvature of the proposed point resistance settlement shy
curve to mean value proposed by Wright and Reese is excellent
However the constant a 1 and the coefficient v 1 were
determined for sand only In the future they should be
examined especially for gravel and silty sand based on
field tests Until then in the authors opinion the
values of v 1 can be chosen from Eq 147 for all nonshy
cohesive soils But for a 1 there is proposed
at = gt bulla (1 4 8)1
where
gt- 1 = 080 for gravel
gt 2 120 for silty sand
This proposal is shown in Fig 14 11 as dashed lines
A good correlation can be seen with the investigation by I
Kiosimiddotnski for sandy gravel and on the safety side with
the investigation by Tuoma and Reese for silty sand (see
Fig 149)
In Fig 1418 all calcul ations for pile No 1 to 20 are
summarize d The correlation coefficient n is defined as
the calculated point resistance p(s) divided by measured
point resistance p(s) For totally 126 points from 20
curves an average of n = 098 with standard deviation
31
al= 023 was obtained see Fig 1418 A similar result
can be observed for the range usually assumed of the
allowable settlement for sinqle large diameter bored
piles as
for
- for
- for
s
s
s =
10
20
30
mm a
mm
mm
verage n10 II
II
mm 089
095
099
and sd =
and sd
and sd
031
027
026
It can be questioned whether the sonstant a 1 can be deshy
termined in different ways The constant a 1 is the initial
slope of the point resistance-settlement curve as menshy
tioned above Then we can use all methods for determination
of settlement of a pile point The range of validity of
these methods then must be determined This will be shown
later
In order to be able to design the total load settlement
curve the skin friction resistance-settlement relationshy
ship must be determined The ultimate skin resistance of
large diameter bored piles was determined in Chapter 11
(based on static penetration tests) and in Chapter 12
(based on standard penetration tests)
In the past a lot of field tests have been done on the
mobilization of the shaft resistance versus pile settleshy
ment In this subject there is a rather good agreement
in the whole investigation for cohesive and non-cohesive
soil
Some results and opinions on thispresented in the literashy
ture during the last few years are shown below
Ultimate shaft resistance versus settlement
1) BurlandJB Butler FG Duncan P (1969)
-The shaft l oadsettlement curve is derived using a=0 3
with 90 ultimate load being mobilized at 025 in
settlement(~65 mm)
- soil London clay
- see Fig 1 419
32
2) Touma FT Reese LC (1974)
- The failure of the sides of the shaft takes place
at a downward movement of about 04 in (10 mm)
- soil sand
- see Fig 1420
3) Tomlinson HJ (1977)
- The maximum shaft resistance is mobilized at a
settlement of only 10 mm (or j in)
- soil stiff clay
- see Fig 1421
4) Klosinski B ( 1977)
- It was assumed that skin friction increased proshy
portionally to pile settlement up to the limit value
s bull This value depends on soil conditions and pile0 diameter and is usually from 3 to 8 mm For soft
compressible soil it may be grater than 10 mm
- soil cohesive soils
- see Fig 1422
5) Franke E Garbrecht D (1977)
- At settlement of 2 to 3 cm which are normally
allowed in Germany under working loads for buildings
not very sensitive to differential settlementsthe
skin friction is almost always fully mobilized
- soil sand
6) DIN 4014 part 2 (1977) and Franke E (1981)
- The skin friction Tm is approximated as diameter
independent having failure settlements of smf = 2 cm
in sand and 1 cm in clay
- soil sand and clay
- see Fig 1423
33
7) Reese By L (1978) Reese By L Wright SJ (1979)
(1978) The maximum skin friction being developed at
an average downward movement ranging from about 05shy
2 of the shaft diameter The average of six load tests
reported by Whitaker and Cooke (1966) are a lso plotted
for comparison
- soil stiff clays
- see Fig 1424 and Fig 1425a
(1979) The relative settlement is the average settleshy
ment of the butt and base devided by the shaft diameter
The mean curve maximises at a relative settlement of
about 002 D
- soil sand and clay
- see Fig 1425b
8) Tejchman A Gwizda3a K (1979)
- A clear differentiation of the distribution of shaft
and base resistances is observed for changing settleshy
ment For fairly small settlements the shaft resist shy
ance increases quite fast and the ultimate values
are reached soon while the base resistance increases
gradually with increasing loads and settlements withshy
out clearout ultimate values it can be assumed that
complete mobilization of shaft resistance corresponds
to settlements equal to 001 or 002 diameter of pile
- soil cohesive and non-cohesive soils
- see Tab 131 and Fig 1 426
9) Promboon S Brenner R P (1981)
- Load distribution and load transfer curves disclose
that most of the load is carried by shaft friction
which is developed at small displacements in the order
of 10 mm
- soil Bangkok clay
- see Fig 1427
34
10) Prodinger w Veder Ch (1981)
- The maximum value of skin friction resistance
occurred for a total settlement of 12 mm
- soil silty clay and sand
- see Fig 1428
11) Farr JS Aurora RP (1981)
- Ultimate load transfer was recehed (or nearly reached)
at a relative settlement of about 04 in (10 mm)
- soil gravelly sand
- see Fig 1429
12) Decourt (1982)
The skin friction resistance is totally mobilized
with deformations of about 10 mm or at the most 15
mm regardless of shaft dimensions This observation
of ours seems to clash with the opinions of other
authors who seek to relate the deformation necessary
for full skin friction mobilization with the shaft
diameter
- soil cohesive and non-cohesive soil
In Tab 143 all these results are shown Depending on
the kind of soil the following v a lue s of ultimate settleshy
ment for shaft can be assumed
- averages 142 mm (sd 5 3 mm) for sand
- averages 100 mm (sd = 21 mm) for cohesive soil
averages 726 mm (sd 67 mm) for claysand
It can be observed (see Fig 1419 to 1428) that the
shaft friction resistance increases proportionally to
the pile settlement up to the above limit value and
thereafter becomes constant
35
Taking into account what was mentioned earlier on point
resistance settlement relationship and the above results
a relationship between total load point resistance and
shaft resistance on one hand and settlement on the other
can be made see Fig 1430
It is assumed on the safety side that the following
ultimate settlement (S~) exists for the shaft resistance
of large diameter bored piles
SS1 ) 200 mm for non-cohesive soil u SS2) = 100 mm for cohesive soil u SS3) 15 0 mm for claysandu
In Fig 1 430 the curve Q (s) is calculated based on p
the equation 14 5 or 144
The values of psf in equation 144 can be calculated
based on other methods as well
The total load-settlement relationship is obtained by
summing up point and s haft resistance as
Q (s) = Q (s) + Q (s) (149)s p
for each point
Now the allowable load can be determined from equation
133a and versus the allowabl e settlement as
Q (s) = Q (s) + Q (s) (1410)s p
where s lt Sa
Sa= the allowable settlement of the pile
The analysis allows determination of the approximative
load settlement dependence without calculating the settleshy
ment for non-cohesive soil In Fig 1431 it is shown
36
In Tab 144 the settlement for allowable point reshy
sistance q5P according to equation 133a is shown
as well The average settlements= 198 mm (sd=78 mm)
is obtained This value is similar to the assumed ultimate
settlement of shaft for non-cohesive soil The ultimate
settlement for point resistance is assumed s = 010 Dp as mentioned earlier
37
15 Initial slope of pile point resistance shy
settlement curve
Settlement of piles and pile foundations can be cal culated
based on
- empirical correlations
load-transfer methods using measured relationships
between pile resistance and pile movement at various
points along the pile
- theory of elasticity that employs the equations of
Mindlin for subsurface loading within a semi-infinite
mass
- numerical methods and in particular the finite element
method
- use of in-situ tests (Cone Penetration Test Standard
Penetration Test Pressuremeter Test)
The critical slope of the pile point resistance-settlement
curve is important for calculation in chapter 14 The
constant a1 can be determined from all the above mentioned
methods
Comparison is made to Berggrens and Schmertmanns methods
below (see Berggren 1981 as well)
6sIn Tab 151 (No 1 2 3) the values of a 1 =~p for s =
10 mm and s = 20 mm (measured for large diameter bored
piles No 1 to 24) are compared to the calculated values
according to the modified hyperbola method (see Fig 14 6)
It can be seen that these calculated values are between
s = 1U-2u mm but rather closer the measured values for
the settlements= 10 mm see correlation coefficient n 6
and n 7 in Tab 151 respectively The average correlat i on
coefficent for the settlements= 10 mm is n9 = 108 and
the standard deviation is sct = 014 The comparison to
Berggrens and Schmertmanns methods for s = 20 mm ( see
Berggren 1~81 and Tab 151 as well) shows that the
results based om these methods give too high values of a 1 bull
38
The average values are ne= 143 sd = OJ3 and ng= 137
sd = 037 for Berggrens and Schmertmanns methods
respectively A bit better agreement can be observed
for Schmertmanns method
Taking into account the results in Tab 151 ana Tab
15l it must be assumed that for the determination of
a 1 the pile point contact pressure p(a1) should be
assumed as the ultimate point bearing capacity devided
by about 4
p(ai) - ( 1 bull 5 1 )
Most of the methods for determination of settlement are
based on the theory of elasticity The settlement ot the
pile point can be expressed as the average settlement of
a rigid circular foundation from the equation
11-Dp 1-v 2
s = p -4- -E-bull microd (1 ~ 2 J
where
p pile point contact pressure
E Youngs modulus
D diameter ot pile pointp ) = Poissons ratio
microd = depth factor
The range of validity of the pile point contact pressure
was determined in equation 151 Youngs modulus has an
important meaning lt can be determined from triaxial
tests or oedometer tests The relationship between the
constrained (oedometric) modulus Mo and Young s modulus
Eis dependent on Poissons ratio v as expressed by the
equation
E = l 1 + V ) ( 1 - 2 V ) Mo ( 1 bull 1 bull 1)- 1-v
39
TaKing into account the analyses made ny Chaplin (19b1a
1 961bJ Janbu (1 963 1970 1973J Andreassen (1973)
Duncan and Cheng (1970) Tejchman anct Gwizdala (1979)
Gwizdala (1978) Franke (1981) Berggren (1981) Withiam
and Kulhawy (7981) and the present investigation the
calculation of settlement is proposed to be
s = 24 bull p bull ~ D bull 1-v 2 bull micro d (154)Do o E
where s (r1)
p (kPa)
Dp (m)
E (kPa)
D0 =10 m
micro = 05 + 01 vfrac34E (1 5 5)d vs
but 05 lt microd lt 10-tip= p - (J (ovs see Fig 151)vs
E =Et= Kbullpat (Oo )n [1- Rf(1-sinltj) 101 - 03 ) 12 (1 5 6)2 c cosltP + 2o 3 sinltP 1Pat
in which K n and Rf= hyperbolic stress-strain parameters
Pa= atmosferic pressure ando 1 o 3 and o0 are determined by
averaging the concrete and soil vertical and radial stresses
near the pile point according to Fig 151 Then the
stresses at the pile point level are h
(J vs = L
0 Yi h
l vertical stress in the soil
0 hs Ko h
0 vs radial (horizontal) stress in the soil
0 vc L ye h -l
vertical stress in the concrete 0
0 hc K oc a vc radial (horizontal)
concrete stress in the
40
K at rest soil lateral stress coefficient 0
K c lateral stress coefficient for fluid fresh concrete0
K 1 0 oc
and average values
a 05(a +a)V vc vs
1 1 - shy~ = -(a +a+a I = -3 (av+2ahJ the applied mean normal stress0 j Z X y
Assuming this model calculation results for piles No 1-24
(see Tab 11~ as well) are shown in Tab 153
The piles are embedded mainly in medium sand to fine sand
For this kind of soil it can be assumed (soil parameters
from field or laboratory tests were inaccessible)
~ = 35deg c = 0 R~ = 09 n 05 v = 025 K c 10l 0
K = 04 Pat= 1UO kPa ye 24 kNrn 3 y = 14 kNm 3 bull0 C
Moreover in Tab 153 the following symbols are used
p(a1 ) - pile point contact pressure according to equation
1 bull 5 1
s(a1) - settl ement of pi l e point according to equation
143 and Tab 141
pound TT ( 2E = s bull Dp bull i 1-v ) according to equa~ion 152t
E~ Et bull microltl
EI
K = ro~ - according to equation 1 bull 5 6 p bullO middotA2
a~ o
E = E voD middot D middot ~4 ( 1 - v 2 ) according to equationt S p O 0
1 5 4
Et= E microd
K = according to equation 156 V PatmiddotaomiddotA2
41
The calculation results of Youngs modulus E = Et and
dimensionless canpressionrro1ulus for piles to 1-24 are shown
in Fig 152 to 155 using equation 152 and 15b
or equation 1~4 and 156 respectively lt can be obshy
served that the scatter in Fig 153 and Fig 155
where the influence of tne pile diameter is reduced
compare equation 154 is less than in the other figures
The reduced influence was made after observations from
field and laboratory tests while the equation 152 is
taken direct from theory of elasticity These values of
E and K are in good correlation with published values in
literature The values of Youngs modulus versus the
relative density of soil are compared to literature values
see Fig 15b Based on the analysis in this chapter it
can be assumed that
E = 9-ql 3 ( 1 bull 5 7)cp
where qcp is in accordance with equation 117
The calculation results based on this proposal are incluced
in Tab 1 5 3
The c a lculate d s e ttlements based on e q ua tion 154 and
157 are shown in column 23 and the values of the
correlation coef f icie nt (n= Seal ) in column 24 respectshyimeas
ively
The dimensionless canpression modulus can be d e termined as
K = 15Ubullq (qcp in MPa) (1 5 8)cp
see column 25 Tab 153
The calculation results based on the K compression modulus
according to equation 158 156 and 1 5 4 are shown in
columns 25 26 2 7 28 and 29 in Tab 153
42
For comparison and for determination of the range of
validity of this method the caLculation results of
pile point pressure for settlements s = 10 mm s = 20 mm
s = 30 mm (see Tab 141) according to equation 157
and 154 are shown in columns 30 to 35
The results obtained in Tab 153 confirm the possibility
to use the proposed method to calculate the initial part
of the pile point resistance settlement curve of large
diameter bored piles in non-cohesive soil and the initial
slope of this curve as well
A simple model has been proposed based on the theory of
elasticity ana the tangent modulus defined by Janbu (1963)
and Duncan amp Chang (1970)
A new approach according to the pile diameter depth factor
and principal stress is proposed
The settlement of the pile point can be made up to a point
pressure according to equation 151 on up to a settlement
of about s ~ 20 mm (30 mm)
-- The application of v Op in equation 1 5 4 a llows us ing
Youngs modulus as independent of the pile diameter
opposed to Bazants a nd Mosopusts (1981) proposal where
Youngs modulus wa s determined versus the pile diameter
The equation 1 5 6 takes into account the dependence of
Youngs modulus on depth (or overburden pressure) as
well
In the method field test (Cone Penetration Test) or
laboratory tests (hyperbolic stress-strain parameters
can be used
Comparison of the method to 24 availa ble load test r e sults
or large diameter bored piles in sand shows good a greement
to calculated and measured values
43
REFERE~CES
Adamczyk J (1978) Okreslanie udzwigu pali wierconych
za pomoca sondy statycznej (Bearing capacity of bored
piles based on the static sounding) Inz i Bud No 7
pp 253-257
Andreasson L (1973) The compressibility of cohesionless
soils Thesis Chalmers University of Technology
G6teborg (in Swedish)
Appendino M (1973) Comportamento di un palo di grande
diametro strumentato Rivista Italiano di Geotechnica
No 3 pp 115-118
Butterfield R Banerjee P (1971) A rigid disc embedded
in an elastic half space Geotechnical Engineering
Vol 2 pp 35-49
Bozant z Mosopust J (1981) Drilled pier design based
on load settlement curve X ICSMFE Stockholm Vol 2
pp 615-619
Begemann HK (1982) Cone penetration tests pile bearing
capacity and the thesis of Rollberg Proc of the Second
European Symposium on Penetration Testing Amsterdam
pp 433-438
Berggren B (1981) Bored piles on non-cohesive soils shy
settlement and bearing capacity (in Sweden) Thesis
Department of Geotechnical Engineering Chalmers
University of Technology G6teborg
Bergdahl UB (1979 1982) Sonderingen und in situ Messungen
Wien 18-19 Juni 1979 - Private information 19821983
Bustamante M Giane selli L(1982) Pile bearing capacity
prediction by means of static penetrometer CPT Proc
of the Second Europ Symp on PenTest Amsterdam
Vol 2 pp 493-500
Chaplin TK (1961a) An experimental study of the settleshy
ment of footings in sand PhD Thesis Univ of
Birmingham
44
Chaplin TK (1961b) Compressibility of sands and settleshy
ments of model footings and piles in sand 5th Int
Conf on Soil Mech a Found Engng Vol 2 p 33 Paris
Colombo P (1971) Observazoni sul comportamento ltli pali
a grande diametro Rivista Italiana di Geotechnika
No 3 pp 163-172
Dahlberg R (1975) Settlement characteristics of preconshy
solidated natural sands Swedish Council for Building
Research D11975
De Beer EE (1964) Some considerations concerning the
point bearing capacity of piles Proc Syrop Bearing
Capacity of Piles Boorkee I pp 178-204
Decourt L Quaresma AR (1978) Capacidade de Carga de
Carga de Estacas a partir de Valores de SPT VI Conshy
gresso Brasilerio de Mecanica dos Solos e Engenharia
de Fundacoes - Rio de Janerio - ABNS
Decourt L (1982) Prediction of the bearing capacity of
piles based exclusively on N values of the SPT Proc
of the Second Europ Syrop on Penetration Testing
Amsterdam Vol 1 pp 29-34
Duncan MJ Chang CV (1970) Non-linear analysis of stress
and strain in soils Journal Soil Mech Found Div Vol
96 SM5 pp 1629-1651
Durgunoglu HT (1979) Effect of foundation embedment on
stress and deformation distributions Third Int Conf
on Num Meth in Geomechanics Aachen pp 925-928
Farr JS Aurora RP (1981) Behaviour of an instrumented
pier in gravelly sand Proc of a session Drived Piers
and Caissons sponsored by the Geotech Eng Div of the
ASCE Nat Convention St Louis Missouri pp 53-65
Franke E (1981) Point pressure versus length and diameter
of piles X ICSMFE Stockholm Vol 2 pp 717-722
45
Gregersen os Aas G and Dibiagio E (1973) Load tests
on friction piles in loose sand Proc of the Eigth
International Conference on Soil Mech Moscow USSR
Vol 21 pp 109-117
Gwizda1a K (1978) Behaviour of large diameter bored piles
in non-cohesive soil (in Polish) Archiwum Hydrotechniki
Vol XXV No 2 pp 183-217 (English summary)
Huizinga TK (1951) Application of Results of Deep
Penetration Tests to Foundation Piles Building Research
Congress Vol 1 p 173
Janbu N (1963) Soil compressibility as determined by
oedometer and triaxial tests Proc Europ Conf Soil
Mech and Found Eng Vol 1 p 19 Vol 2 (Discussion)
p 17 Wiesbaden
Janbu N (1970) Grunlung i geoteknikk Tapir Forlag NTH
Trondheim
Janbu N Bjerrum L Kjaernsli B (1973) Soil Mechanics
applied to some engineering problems Norw Inst Publ
No 16 Oslo
Japanese Society SMFE (1981) Present state and future trend
of penetration testing in Japan Separate report at
X ICSMFE Stockholm
Kjekstad O Lunne T (1979) Soil parameters used for design
of gravity platforms in the north sea Second Int Conf
on Behaviour of Off-shore structures London Vol 1
pp 175-192
Klosinski B (1977) Bearing capacity of large diameter bored
piles IX ICSMFE Tokyo Vol 1 pp 609-612
Laboratory for soil mechanics Delft (1936) The predetershy
mination of the required and the prediction of the
resistance of piles Proc 1 Int Conf on Soil Mech
and Found Engng Cambridge (Mass) I p 181
46
Matich M and Stermac A (1971) Settlement performance of
the Burlington Bay Skyway Canadian Geotechnical Journal
Val 8 pp 252-271
Mccammon NR and Golder HQ (1970) Some loading tests
on long pipe piles Geotechnique London England
Val 20 pp 171-184
Meigh AC (1971) Some driving and loading tests on piles
in gravel and chalk Proc of the conference on beshy
haviour of piles London England pp 9-16
Mitchell JK Gardner WS (1976) In situ measurement
of volume change characteristics American Society of
Civil Engineers Specialty Conference on In-situ
Measurements of Soil Properties Raleigh 1975 Proc
Val II pp 279-345
Mezenbach E (1961) The determination of the permissible
pointload of piles by means of static penetration tests
Proc 5 Int Conf on Soil Mech and Found Engng
Paris II pp 99-104
Meyerhof CG (1956) Penetration tests and bearing capacity
of cohesionless soils Proc Amer Society of Civ Engng
SM 1 Pap 866 pp 1-19
Meyherhof GG (1 976) Bearing capacity and settlement of
pile foundations Proc Amer Society of Civ Engng
Journal Geotechnical Engineering Division Val 102
No GT3 pp 197-227
Mohan D Jain GS and Kumar V (196 3 ) Load bearing capacity
of piles Geotechn Val XIII pp 76-86
Nixon I (1982) Standard penetration test State of the
art report Proc of the Second Europ Symp on Pen
Test Amsterdam Val 1 pp 3-20
47
Nunes A Vargas M (1953) Computed bearing capacity of
piles in residual soil compared with laboratory and
load tests Proc of the Third International Conference
on Soil Mechanics Zlirich Switzerland Vol 2 pp 75-79
Nordal S Grande L Janbu N (1982) Prediction of offshy
shore pile behaviour The Norwegian Institute of
Technology Trondheim
Ohde J (1939) Zur Theorie der Druckverteilung im Baugrund
Der Bauingenieur Vol 20 No 3334 p 451
Parroth E (1972) Einfache Formel zur Vorausbestimmung der
Tragfahigkeit von Standpfahlen mit Hilfe der Sande
Bautechn 9 pp 312-314
Poulos HG Davis EH (1980) Pile foundation analysis
and design New York - J Wiley and sons
Prodinger W Veder Ch (1981) Bearing capacity of floating
groups of diaphragm walls Proc X ICSMFE Stockholm
Vol 2 pp 809-814
Promboon S Brenner R (1981) Large diameter bored piles
in Bangkok Clay Proc X ICSMFE Stockholm Vol 2 pp
815-818
Reese L (1978) Design and construction of drilled shafts
ASCE JSMFD Vol 104 No OT1 pp 95-116
Rodin s Corbett BO et al (1974) Penetration testing in
United Kingdom state-of-the-art-report Proc Europ
Symp on Penetration Testing 1 Stockholm pp 139-146
Rollberg D (1976) Bestimmung des verhaltens von Pfahlen
aus sandier und rammengebnissen Heft 4 FBG Technische
Hochschule Aachen
Rollberg D (1977) Determination of the bearing capacity
and pile driving resistance of piles using soundings
Publications of the Institute for Found Eng Soil Mech
Rock Mech and Water Ways Construction Aachen Vol 3
48
Schmertmann J (1970) Static cone to compute static
settlement over sand Journal of the Soil Mech and
Found Division ASCE SM3 pp 1011-1043
Schmertmann J Hartman JP Brown PR (1978) Improved
strain influence factor diagrams Journal of the Soil
Mech and Found Division ASCE GT8 pp 1131-1135
Shibata T Hijikuro K and Fominerga M (1973) Settlement
of a blast furnace foundation Proc of the Eighth Int
Conf on Soil Mech Moscow USSR Vol 13 pp 239-242
Spang J (1972) Die Bestimmung der Tragfahigkeit von Grossshy
borhpfahlen (I) Strassen und Tiefbau No 2 pp 339-355
Senneset K (1974) Penetration testing in Norway State-ofshy
the-art-report Proc Europ Symp on Penetration Testing
Stockholm I pp 85-95
Tejchman A Gwizdala K (1979) Analysis of safety factors
of bearing capacity for large diameter piles Proc VII
ECSMFE Brighton Vol 1 pp 293-296
Thorburn s and Mac Vicar R (1971) Pile load tests to
f a ilure in the clyde alluvium Proc of the conference
on behaviour of pile s London England pp 1-7
Trof imenkov JG (1969) Accuracy of determining the bearing
capacity of piles based on results of static penetration
sounding of soils Osnovaniya Fundamenty i Mekhanika
Gruntov 4 (Translation Soil Mechanics and Foundation
Engineering 4 p 248)
Trofimenkov JG (1974) Penetration testing in USSR Stateshy
of-the-art report Proc Europ Symp on Penetration
Testing Stockholm I pp 147-154
Tuoma F and Reese L (1974) Behaviour of bored piles in
sand JSMFD ASCE Vol 100 No GT 7 Proc Paper 10651
July pp 749-761
49
Van der Veen C (1953) The bearing capacity of a pile
Proc 3 Int Conf on Soil Mech and Found Engng
Zlirich II pp 84-90
Van der Veen C and Boersma L (1957) The bearing capacity
of a pile predetermined by a cone penetration test
Proc 4 Int Conf on Soil Mech and Found Engng
London II pp 72-75
Weltrnan AJ Healy PR (1978) Piling in boulder clay
and other glacial tills Construction Industry Research
and Information Association UK-Report PG 5
Withiam J Kulhawy F (1981) Analysis prodecure for
drilled shaft uplift capacity Proc of a session
Drilled piers and caissons ASCE St Louis Missouri
pp 82-97
Woodward R Lundgren R Boitano J (1961) Pile loading
tests in stiff clays Proc of the Fifth International
Conference on Soil Mechanics Paris France Vol 2
pp 177-184
Wright SJ Reese LC (1979) Design of large diameter
bored piles Ground Engineering Vol 12 No 8 pp
17-22
DIN 4014 Cods Teil 2 (1977) Bohrpfahle Grossbohrpfahle
Herstellung Bemessung und zulassige Belastung
Polish Specification (1975) Specification for design and
construction of large diameter bored piles in bridges
Ministry of Transport Warsaw (in Polish)
Polish Specification (1979) Specification for prevision
bearing capacity of the piles on the presiometer test
and static sounding ENERGOPOL Warsaw (In Polish)
Polish Code (1983) Foundations Bearing capacity of piles
and pile foundations
5 1
FIGURES
bull bull
53
Ou
+ sect raquo iir 1
4 + D
h + +Osu
bull + t2 =n- Dp
LDpl r f 1
Opu
Fig 1 1 1 Bearing pi le in the soil
J_
fp
080
070
060
050
0 40
030
020
010
q~ [MPa ]000 -+--~-~-~-~------------------------=-shy
00 20 4fJ 60 80 10 0 120 14fJ 160 180 200
Fig 1 1 2 The point resistance factor fp
(Trofimenkov 1974)
54
ts
160
140
120
100
080
060
040
020
q~5 [ kPa)
0Q0--1------~-~-~-~-~-~ - - ---=- -- shy000 10 20 30 40 50 60 70 80 90 100
Fig 1 1 3 The shaft resistance factor fs middot (TYofimenkov 1974)
f s
200
180
160
140
120
100 2 3 4 5 6 7 8 9
Fig 1 1 4 Shaft friction factor f depenshys
ding of the soil density (Senneset 1974)
55
Q~ [kN]
1500
1000
500
0-r-----------r----~- Q~ [kN] 0 500 1000 1500
Fig 1 1 5 Comparison of the pile resisshytance determined by the results of static sounding and load tests (TYofimenkov 1974)
D f f
0
Fig 1 16 Equivalent cone resisshytance (Bustamante 1982)
56
E u shy0 ~
QI I ltII ltII
~ a C QI
O C
D
w gt
0
Cone res istance Point resistance
80 160 240 320
05
10
15
e d
20
ver y dense Cone resistance 300 kgcm2
Dpcm
a =45 b = 30 C 60 d = 100 e = 150
Fig 1 16a
Cone resistance _ qc
80 160 80 160 qc [ k g cm2 ]p
05
10 10
15 15 e d a
e d20
Dense Medium2 2200 kgcm 100 kgcm
Cone resistance and point resistance of piles versus overburden pressure (Kerisel 1965)
Point resi stance - p(for s=2cm) of the pi le for
15 sett Iement s = 2 cm
10
5
E u
uJ1 o-~----shya er O 804 2500
32 56
I 1
L oose50 -I =25 Very loose L
----~--shy5000 7500 80 98
~-----lmiddotI1--------2 10000 12500 31400 =Flcn)
112 123 200 =Dplcm)
Fig 1 1 6b Point resistance versus cone resistance and pile diameter (Franke 193)
57
1
fp
080 (D Gravel
0 Coarse sand Medium sand 070
reg Fine sond Silty sand
060
050
040
030
020
010
qc [MPa]000-+----r--~-~-~--------r----r----r-~-~-- -shy
oo 20 40 60 80 100 120 140 160 180 200
Fig 1 1 7 Point resistance factor f (proposal) p
58
300
250
200
150
100
qc [MPa I50-+---------------r---r---r---r----r------------- shy
oo 20 40 60 80 100 120 140 160 180 200
Fig 1 1 8 Shaft resistance factor fs (pr oposal)
59
Bustamante (seetab 115 I
l fp
G)
0 Gravel
Coarse sand Medium sand
cl
b)
t-----l
1----1
080 reg Fine sand Silty sand a) D
070 Polish
060 Specification
( 1979) 050
040
030 CD 020 0
reg 010
qc [MPa]0 00 -+-------------------------------------=--shy
oo 20 4o 5o 80 100 120 14o 15o 180 200
Fig 1 19 Point resistance factor f comparisonp
Bustamente ( see tab 116 I 300
a) ~
250 b)~
cl~
200 Polish Specification ( 1979 l
150
100
q [ MPa]504---~--~--~----- ---___
00 20 40 60 80 100 120 140 150 180 200
Fig 1 1 10 Shaft resistance factor fs comparison
60
1 fp
~
080 CD CD Gravel
070 0 reg Coarse sand Medium sand
060 0 Q) Fine sand Silty sand
05
040 Franke (1973)___
030 DIN 4014
020 Part 2 1977
( see tab113 l 0shy
--shy --a - 010 C---0 Piles without enlarged bases
D---0 Piles with enlarged bases qc [MPa ] 000
00 20 4JJ 60 80 90 100 120 140 160 200
Fig 11 11 Point resistance factor f comparison p
fs
DIN 4014 Part 2 1977 ( see tab 114 l
300
~ 5 lt qc lt 10 MPa 50
~ 10 lt qclt 15 MPa
~qcgt15MPa
200
150
CD
100 0 0
qc [ 1Pa] 50-t-----T-~----T-r-~----------------shy
OO 20 40 6JJ 80 100 120 14JJ 160 180 200
Fig 1 1 12 Shaft resistance factor fs comparison
61
Measured p [ MPa]
( s=010 Dp) 10
9
8
7
6
5 0
4 0 61
3
I 2
Calculated qcp [MPa]
0 0 2 3 4 5 6 7 8 9 10
Fig 1 1 13 Comparison of experimental and aomputed values of the pile point resistanae
62
Contact pressure ( MPa ]
2 I 6
50
100
E E 150 Ill
c QI
E Sett lement for QI
calculated qcpai V) 200
Fig 1114 Results from load tests on piles No 1 and 5
Contact pressure [ MPa I 0 2 I 6
01---------------------1
50
E E 100 Ill
Settlement forc QI calculated qcp E ~ ai
I V) 150
Fig 1 1 15 Results from load test on piles No 7 and 5
63
Contact pressure p [ MPa] 0 2 3 4 6
0-t=-----~-~-----
E E
100 1)
c CU E 2 QI V) 150
Fig 1 1 16 Results from load test on piles No 9 10 and 11
Contact pressured p [MPa] 0 1 2 3 4 5
o~~~=------------___-~-shy
50
100
E E
i 150
CU E CU
-a V) 200 2
Fig 1 1 17 Results from load test on piles No 12 and 13
c
-------------- -
64
Contact pressured
0 1 2 3 4 p [ MPo] ~o __L____1_____J_____L___
50
100
150
E
E
IJ) 200
c a
E a
~ 250
Fig 1 1 18 Results f Pom load tests on piles No 2 4 6 and 8
p [MPa]
60
50
tO
30
~
Pile Pile Pile Pile
Pile No18
------+ Pile No17 + ~_ ---0 Pile No 19
bullbull - --bull Pile No 20
- ~middot -shy-shy -(y I Settlement for
20 tO 60
No17 +-middotmiddot- V 70 No 18 bull--- V 9o No19-middot- V 120 No20bull---- V150
qcp 3
80 100 120 140 160 s (mm)
Bose resistance
Fig 1 1 lBa Point Pesistance vePsus settlement (Spang 1972J
65 Cone resistance qc [ MPa]
0 10 20 30
mud
5 ~ lll
0 c 0
c CD
peat
10 sand
Ill N
10=10
D=lOOOmm
1540=40
20__________________
[ml
Fig 1 119 Pile No 1 and results from static cone penetration test
Cone resistance qc [MPa l 0 10 20 30
7N V degW = 0+--------------------i
mud
5
lll
~ C 0
c peat~
10
sand lll N 1D15
15l lD=1500mm
40=60
20l---------=-------__J
[ml
Fig 1 1 20 Pile No 3 and results from static cone penetration test
66 Cone resistance qc [MPa]
10 20 II 3 igt pound ~
mud+peat
fine sand+ silt
50=11
l lo-11oomm
40= 44
10
15l____________c
[ml
Fig 1 1 21 Pile No 5 and results from static cone penetration test
Section Cone resistance Pile
0 0
5 10 15 20 25 30 qc [MPa] -----~-~shy~
Silt
[7r_ ___~ Medium Sand_~-----l
0 ltD
+shy4
0=11
9=
Fine sand + Silt t
30p=
middotmiddotmiddotmiddotmiddotmiddotmiddotmiddot1~11+-----E-----
[ml
Fig 1 1 22 Pile No 6 and results from static cone penetration test
Cone resistance qcmiddot 1MPuJ
0 10 20 30 67 01-+-------l--------------i
mud+ peat
fine sand
l1)
N
40=60
15L_____________
[ml Fig 1 1 23 PiZe No 7 and resuZts from static
cone penetr ation test
Section Cone resistance Pi le
0 5 10 15 20 25 30 qc [MPa 1 --~----Y-~-----~
Silt
Fine sand
Medium Sand Bentonite2----1~i
t 3
4
0
0=15
Fine iii ~~= 5
sand t ltD
6 +
Silt 7
3Dp=
63 g
10
11
12
13+------=~---l
[ml
Fig 1 1 24 PiZe No 8 and resuZts f rom static cone penetration test
68
I =3
Cone resistance qc [MPa]
0 10 20 30
C 0 C Cl
(I)
Said
Peat
Sand
l 0=110
D = 11
4 D = 44
Fig 1 125 Pile No 9 and results form static cone penetration test
69
Cone resistance qc[MPa)
0 10 20 30 I ~ II JE Ill= II=E IS
Fine sand QI
U) I
[- I C 0 + C Peat QI
CD
Fine sand 0
Ci D = 1 1
L l D= 110
4D= 4 4
Fig 1 1 25 Pile No 10 and results f rom static cone penetr ation test
70
Cone resistance 9c[MPa]
0 10 20 30
Sand
C 0 Mud peat
+shyc 5 ltII
co
Sand Op= 11
u 10 D= 110 4Dp=44
Fig 1 1 26 Pile No 11 and results foIm static cone penetration test
71
00 a_ N ~
middotu rr QI 0 u ~ C 0
QI ui C iij 0 QI U - 0
0 EN
d 2
Sll 1lOl
C
u (rr
C 0 u~
0
QI - C middot 0 C
U - O 0 EN
~ 0 2
E
ltD a---==-lr---___--~---6-l_-0_012 ~ Lr- - --1---------J J
S9l ls= apound QI -0 gtcc _gmiddot- 0 1) ui I
Fi g 1 1 2 Piles No 14 and 15 and results f r om stat i c cone penetr ation tests
72
Contact pressure p [ MPa] 2 4 6
01lt---------------~
50
E E
111 100 ~ (qcp=30 MPa for No16
~ iqcp =49 MPa for No14
~ 1so~--~~- _ _ __
I _ _
11 I lf--q = 32 MPa for No15
cp
Fig 1 1 28 Results f r om load tests on piles No 14 15 and 16
73
0300--------------~---~--~--shyE
Driven piles in ~ 0 bull Gravel
amp250 bull Sand L QJ X Silt a 1l o Bored piles in
sand -sect 200 0=-- shyC ~ ~ 10 unless ~~ middot D shown 1
ii O
~ ~ o 3 a 1501-----+-------I- --+---laquo-+-- -+------lt
~ sect 5 - 6 6middot 100t----+----+-----_-1---4--__co_--J~__j
-_
~ 0 t7
C
a 50 2 shyg ~ gt
0 20 30 40 50 60
Standard penetration resistanceN in blows per foot
(N 30
Fig 12 1 Emperical relation between ultimate point resistance of piles and standard penetrashytion test in cohesionless soil (Meyerhof 1976)
14 r-------------------r-------b-----q
References and symbols given in Fig121
121-----+---+----+----+------ll------j
- _sect ~ 10t----+----+-_--1-----+---lt~--~H---- 0 lt-~5- _-)0 I() l- I Q---+-----I[08 ~
H -(l () ltj-~C X bulls pound 061------lt----+-----i~- --+-- shy
- bull
-gt Q1pound--I---L---L---L---L--~ 0 10 20 30 40 50 60
Mean standard penetration resistance N in blows per foot ( N30 l
Fig 122 Empirical relation between ultimate skin friction of piles and standard penetration resistance in cohesionless soil (Meyerhof 1976)
74
a) b)0(1 0lt2
10 10
05 05
1 N30OD-+---------__ OD--t-----r-----r----------------ll--Nbull30~ 10 20 30 10 20 30 40 50
Fig 1 2 3 Reduction coefficient a) for impermeable gravels b) form permeablr gravels (Weltman and Healy 1978)
psf [MPo)
Fig 1 2 4 Relation between ultimate point resistance and SPT in cohesionless soil (Polish specification 1975)
75
30 35 40 45 Loo Med Dense Ver dense
50
40
~ E
l)
g 8 1)
middotu
1 ~
QI- bull Touma ~ bull Koizumi
(183)-depth base middotameter5
20 40 60 00 100 N30
30 35 40 45
OG2(294) bull G1 (183)
300 bull us 59 ( 102) bull 88(180)
bull 075 a GT (467)
150
~ 200-+--------+-- t--- --t-----i 130i 0 094 081
014 _- --- -- shy~ E 066bull bull 063 Note -~ ~m~r~s~ ~ 1001---1-r--t---1point is xh QI Ratio ~ Number in ( ) middotn key is h c Ratio s ~
0 20 40 60 00 100
~ig 1 2 5 Ultimate point and shaft resistance versus N30
(Wr ight and Reese 1979)
-----
76
tu Psa
[kPa] [MPa]
200 tu
------ shy150 Psa
1 1
1100 10 1 1
1 50
0+----------T----~---~-N-3J~shy0 20 40 60 80
Relation between ultimate skin friction and SPT (Decourt 1982)
Fig 1 2 6
Psa
[MPa]
8
0----Meyerhof 1976) 0 7
--- - --~ - copy Polish Specifcoti on 1975)6 ~-
~
reg- middot - Reese (1978) middot 5
f41- -- Decourt (1982) -I bull 4 2
----==---______z__ h25m Dp=12m
3 ---shybull
2 7
--shy ----shy~----shy0-t----i----------r-- ----------------------N3l~shy
0 10 20 30 40 so 60 70
Fig 1 2 7 Relation between ultimate point re~istance of large diameter piles and standard peneshytration test (SPT) in cohesionless soil
------
77
tu [kPa)
200 17 Cast under -J bentonite
~----Meyerhof (1976) ~copy -=middotmiddotmiddotmiddot== middotmiddot150 ~------- Wei tman (1978 ) middot Healy middotmiddot ___ Japanese ) 119810 Society
(0 -middotmiddot- Decourt (1982)middot Wright
100
- -middotmiddot -- 11979]reg Reesemiddot Bored piles
~shy50 1 -- shy
-- shy middotmiddot s-shy - --~ ------reg~~ ---~E_==---- ------- shy
N_ ---shy0-+--C--------------r---- ---------~---~-~shyo 10 20 30 40 50 60 70
Fig 12 8 Relation between ultimate skin friction of piles and standard penetration test (SPT)
78
Pst [MPa]
8
7 ---------ist=7MPa
6
5
4
3
2
I N30o~------------------------------+---------__=-shyo 10 20 30 40 50 60 70
Fig 12 9 Relation between ultimate point resistance of large diamter piles and standard peneshytration test (SPT) in cohesionless soil (proposal)
tu [MPa ]
( excavanted and cast
150 under bentonite ) tu=150 kPa
100 tu=90 kPa
I I
50 I I I I I N30
10 20 30 40 50 60 70
Fig 1 2 10 Relation between ultimate skin friction of large diameter piles and standard penetrashytion test (SPT) in sand (proposal)
79
2 3 4 5 p[MPa] 0 2 3 4 5 p[MPa]0
40 40 Cl
80 c 80
c 120 120
Pile No 1 PileNo216 160
200 2
s s c [mm] (mm]
0 2 3 4 5 p[MPa] 0 2 3 4 5 p [MPa]
40 40
00 80
120 120
16 160 Pile No 3 Pile No 4
200 200
s s [mm] (mm]
0 2 3 4 5 p[MPa] 0 2 3 4 5 p [MAJ]
tgt11 tgt- measured40 40
80 80
120 120
Pile No 5 Pile No 6 160 160
20 200 s s
[mm) [mm)
Fig 1 4 1 Base resistance vs settlement appoximative method piZe No 1- 6
80
0 2 3 6 5 p[MPa) 0 2 3 4 5 p[MPa]
40 40
80 80 6
120 120 6
6160 160
Pi le No 7 Pile No 8 6
200 3J s s
[mm] (mm]
0 2 3 4 5 4 p [ MPo)
6 6 40
6 6
6 80
6 6
6
Pi le No 9 Pile No 10
XJO s s
[mm] [mm]
0 2 3 4 5 p[MPa] 0 2 3 4 5 p [MPa)
6 6
40 40 6 6
6
00 80 6
6
12 1Xl 6
160 Pile No 11 160 Pile No 12
200 200 s s
[mm ] [mm]
Fig 1 4 2 Base resistance vs settlement approximative method pile No - 12
81
0 2 3 4 5 p[MPa] 0 2 3 4 5 p [MPa]
6 6
40 6 40 6
6
80 6 80 6
120 6 120
Pile No 13 Pile No 141fO 160
200 200 s s
[mm] [mm]
0 2 3 4 5 p [MPa) 0 2 3 4 5 p [MPa)
40 40
80 80
120 120
HiO 160
200 200Pile No 15 Pile No 16
s s (mm) [rrrn 1
0 2 3 4 5 p[MPa] 0 2 3 4 5 p[MPa)
40 40 A A A-measured
680 80 t t
120 c 120 c
1fil Pi le No 17 160 Pile No 18
200 200 s s
[mm] [mm]
Fig 1 4 3 Base r esistance vs settlement approximative method pile No 13- 18
82
0 2 3 4 5 p[MPal 0 2 3 4 5 p (MPa]
D D40 40 c c
80 c 80 c
120 120
160 160
Pile No 19 Pile No 20 200 200
~ml (mm]
Fig 1 4 4 Base resistance vs settlement approximative method pile No 19- 20
LlJ QI
0 average lJ = 098 E sd = 029 C
6 SY = 030
4
2
lJ calculated ________________________ _______ measu red
06 08 10 12 14 16
Fig 1 4 5 Calculated pressure divided by the measured pressure at 20 mn settlement for aZZowabZe
q Zoad Pa= ~p approximative method pile
No 1- 20
8 3
Point resistance p [ MPaJ
a)
p(s) = s a +--sshy1 y qcp
1
SQ100p -- --- ---shy
~ s
[mml
I- 01 s rmm]-l p LMPa b)
f~]
c Cll E ~ i s
[mm)
Fig 146 Definition of the point resistance - settlement curve according to the modified hyperbolic method
84
01 ~ 0
20 0 0
0
16 0
medium 0 value a1 = 905-+ 256 Op 0 0
12 (r=039)
0 0
----0 0
8 0
0 0
0 0
4 0
05 06 07 08 09 10 11 12 f3 14 15 16 17 18 19 20 2 1 Op (ml
Fig 1 4 Initial slope of the base resistance curve vs pile diameter
a1 [p] 0
0020
16 assumed a 1= 28 - 4 qcp
12 0
0 Ct) 0 a = 2659 - 369 qcp8 1
0 0 (r = 0188)0
4
2 3 4 5 (MPa]qcp
Fig 1 4 8 Initial slope of the point resistance curve vs ultimate point resistance on the static cone resistance for pile tests No 1 20
85
a [~ 28
24
20
16
12
8
4
0 2 3 4 5 6 Qcp [MPa]
~ Kiosinski (1977) sand and sandy gravel of mediwn density
~ Klosinski (1977) loose sand ID= 0 3 0 4
o US59 ] t HH Touma p and Reese L (1974) fine sand and silty sand OGl (US59 HH BB - very dense Cl - mediwn dense) 1 BB
DIN 4014 Part 2 (1977)
Fig 1 4 9 Initial s lope of the point res istance curve vs ultimate point resis tance
86
assumed [il =30 -10 Op but )1~ 10 )1 [1 I
u 311-10 Op ( r =0 368)4 1 0
3 0 0
02 0
0 0co 0 8 0 0
0
0
05 06 07 08 09 10 11 12 13 14 15 16 17 19 20 21 Dp [ ml
Fig 14 10 Correction factor for hyperbolic base resistance shysettlement relationship
87
a [~] 28
24
20
16
12
8
4
2 3 4 5 qcp [ MPa]
Fig 14 11 Initial slope of the base resistance curve vs ultimate base resistance (proposal)
v [ 1 ]
3
2 -----G- DP J l 1J I Op lm] J
for Dp ~ 2 0 m ~ u = 1 01
0 --------r----r---r----r-----------------r-------------------------r------r-~-~--shy
05 06 07 08 09 10 11 12 13 14 15 16 17 18 19 20 21 Dp[m)
Fig 1 4 12 Correction facto r for hyperbolic base resisshytance - settlement relationship (proposal)
s P ( s)
s +
u qcp
88
a) b)1
bt=o212= 47 MPa a1=1~32 tMWJ s 2 3 4 5 O 1 10 20 30 40 50 60 p [~a]0
0p [ MPa] 40 40
80 80
120 ~
160 b1 = ~ajtg ~= 0 212
~=1132 + 0212middot s
mJ 240 r=0994t t t measured s __ according to Jl s
o o o according to p (bull ll l[mm] [mm]
Pile No 2
slmm) 10 20 30 40 50 60 80 100 125 150 175 2)0 225 Note
p [ MPa] 09 14 17 20 22 24 27 30 32 34 36 38 39
measured
pibull) [ MPa] 074 128 169 202 228 249 282 307 330 347 360 371 380calculated
plbullbull1[MPal 070 125 168 203 233 257 297 327 356 378 396 410 422calculated
1) (bull) ij l099082 091 099 101 104 104 104 102 103 102 100 098 097 sd = 006
ij (HJ1041) (bull10) 078 089 099 102 106 107 110 109 111 111 110 10B 10B sd = 010
plbulll-according to a =1132 [ Jp(s) = s s for pile No21 0 1132 12 39
plbullbulll-according toa =1241 lmiddotGcp=39MPa1 0
~=14 see fig 1411 and fig 14 12 sp(S)=
124+ _ s_ 14middot39
11lbulll11l-J - correlation coefficient calculat~d P5 for
measure p s p(bull) and p(bull) respectively
Fig 1 41 3 Modified hyperboZic point resistance - settZement reZationship for piZe No 2
89
0 2 3 4 5 p(MA1] 0 2 3 4 5 p[MPa)
40 40
80 A 80 A
120 120
160 16 Pile No 1 Pile No 2
20 200 s s
[mm] rnm
0 2 3 4 5 0 2 3 4 5p [MPa] p [MPo]
40 40
80 80
120 1ZJ
lfpound) Pi le No 3 Pile No 4 A
200 A
s s A
[mm) [mm
0 2 3 4 5 p [MPa] 0 2 3 4 5 p [MPa]
40 40 A A A measured ~ calculated
80 80
12
160 160 Pi le No 5 Pile No 6
200 Z)Q
Fig 1 4 14 l3ase resmiddotistance vs settlement pr oposed method pile No 1- 6
90
2 3 4 5 p [MPa] 2 3 4 5 p [ MPa]
40 6
6 40
1 80 80
6
120 120 6
6 160 160
Pile No 7 6
200 200 s
[mm ] s
[mm]
0 2 3 4 5 6 p [MR] 0 2 3 4 5 p [MPa] 0 0
40 40 6
6
80 80
6
120 120
160 160 Pile No9 Pile No 10
200 200
s [mm] [msml I
0 2 3 4 5 6p[MR] 0 2 3 4 5 p [MPa]04--___ ____ ___ ___ ____
0+-=---------------~-~- shy
40 40 c 6 c - measured
0--0-0 shy calculated
80 80
120 120
160 160 Pile No11 Pi le No12
200 200
s [mm]
s [mm]
Fig 1415 Base resistance vs settlement proposed method pile No 7-12
91
0 2 3 4 5 p [MPal 0 2 3 4 5 p [MPa)
40 40
80 80
120
16 Pile No 13 Pile No 14
200 s
tnml [mm]
0 2 3 4 5 p [ MPa] 0 2 3 4 5 p [MPa)
40 40
80 80
120 120
160 1fD
Pi le No 15200 axJ s s
[mm] [mm]
0 2 3 4 5 p[MPa] 0 2 3 4 5 6 plMPa ]
A A A measured40 0---0-0 calculated
80
120 120
160 1ED Pile No 17 Pi le No 18
200 200
s s [mm] [mm]
Fig 1 4 16 Base resistance vs settlement proposed method pile No 13- 18
92
0 2 3 4 5 p [MFb] 0 2 3 4 5 p[MPa]
0 6 o -measured40 40 0 0 o -calculated
80 80
120 120
160 160 Pile No 19 Pile No 20
200 200 s s
[mm] [mnil
Fig 1 4 17 Base resistance vs settlement proposed method pile No 19-20
p(s~Psf
15 20
ean
-C 5 w u L Lower ~ confidence
linea 0
a IJl 10
o---o proposed
method I I I
15
Fig 1 4 17a Design curves for estimating developed base resistance in sand (Wr ight and Reese 1979)
93
n (number)
30
28
26
24
22
20
18
16
14
12
10
8
6
4
2
0 02 04
Fig 1 4 18
I= 126
Between 1] = 0 7 - 1 3--- I= 106 ( 84 frac34)
Average ~ = 098 Standard sd =023 deviation
Standard sv =023 veriation
1] (Coefficient Calculated Measured
06 08 10 12 14 16 18
Calculated pressur e divided by the measured pr essure for all pressure - settlement curves pr oposed method pile No 1- 20
94
a) b) Total load
Total load curve
---- _____-- shy- -- -Base load ~- Base load
-0-0 ~
00 00 J
ldeoli zed shaft load J
Shaft sesistanc1---------- 0=0middot30 a= 0 middot 30
025 Settlement IN 025 Settlement IN
Fig 1 419 Proposed method of synthesizing design loadsettlement curve (a) conservative design prodiction b) design prediction- peak in shaft loadsettlement curve (Burland et al 1966)
Cf
-0 0 0
J
0
~-----~--~-~ amp- 2 3 4 5 6 (cm)
a~middotltii -0 lt) cco2 41 -~ -0 1)
vi ~ llloli=----------- ---c~0 1 2 3 4 5 6 7 ( of diameter)1 1 1 1
05 10 15 20 ( in) for 30 in Pile Movemen~ ( 75cm pile)
Fig 1 4 20 Approximate load settlement curves for 30 in bored piles (AB and C represent failure load at 1 in settlement A B and C represent ultimate failure load) (Touma and Reese 194)
95
Load in MN 0 2 3 4 5
25
50E E C
-C 75
-~ ~
-Z 100 lJ
Shaft resistshy
125 once
15 Fig 1 4 21 Load-settlement relationships for largeshydiameter bored piles in stiff clay (Tomlinson 1977)
SettlementSo
Fig 1 4 22 Diagrams of s1iaft and base resistances versus settleshyment assumed in analysis (Kiosinski 1977)
96
0 0 1 ~ r- 025g ~~ 2
1- -shy3 03Sg 14 5 2
Qls =Qpls+Q5 (sQpls) Qs(s-3E
0
degsis __ -- Qpls) a~ C
4
t Sg l
5 Qu Is)
Q(s)in MN-l T
Ouls Q Is) in MN ---
Fig 1 4 23 Construction of load - settlement curves a) for sand b) for cohesive soil (DIN 4014 Part 2 1977 and Franke 1981)
-
s C 5C
Cl
3 0 00 05 10 15 20 Mean settlement I in)
Fig 1 4 24 Load- settlement curves for test shaft S4 (1 in = 25 4 mm 1 ton= 8 90 kN) (Reese 1978)
97
Relative side resistance
0 05 10 15 20 0E=--t----+---+--~
c QI lt) ~ 2 C
I itaker c
QI amp Cooke3E QI-j
c-en 4
C QI
E us 59o
5 QI gt
SA0 w 0 6
Fig 1425a Relative side resistance for clay vesus relative midlength settlement (Reese 1978)
degs (Osl u l t 0 05 10 15 2 0
Mean
2 Lower ~ C QI u
confidence line
~ 3 a
0
~4 E
()
5
6 __ _ ______ ________ __1
Fig 1 4 25b Design curves for esti mating developed side resistance (~Jy1nht ReertP- 1987 J
98 Load Q
8 - 15 mm
1- 2 of p ile diameter
100-200 10-15 of pile Os Ot diameter Shaft Total
Settlement S Resistshy Resist- Load ance once
Fig 1426 Dependence of total load base resistance and shaft resistance on settlement of lar-ge diameter pile (Tejchman Gwizdala 1979)
6
5 Shaft load
4
3
2
z ~
-0
g Pile EF- 56 J 0
0 0 20 30 Butt settlement (mm)
Fig 1 4 27 Deveiopment of shaft and base resistance with settiement (Promboon Brenner 1981)
99
0 1000 2000 3000 4000 5000 6000 7000 8000 9000 0 r-=-1---J__-----------------------~----_shy
Load [ k N l5
10
20
( I
Skin friction ----1 I I
~ 40 QI E
fQI
50 I
Q) I () ICOntinuos fost deolading
Fig 1428 Load-Settlement-Diagram Testelement III (Diaphragm-Wall 0515 m 244 m deep) Portion of Skin Friction and Base Resistance (Prodinger Veder 1981)
Qs (QJ max
0 05 10
Upper Limit of Data
Farr and Aurora (1981J C
~ 2 - shy -+shy - Mean of Data
I QI
Lower Limit of Data a
0 - 3 E
Vl
4
Smid = Approximate shaft buff movement ignoring the elastic compression of upper halt of the shaft
D = Shaft diameter
Q Mobi Ii zed shaft resistance
Qs1max = Maximum shaft resistance
Fig 1 4 29 Relative shaft resistance vs relative movement (Farr and Aurora 1981)
100 Load Q (s) [ MN]
Su5 s s 20 mm for non- cohesive soil u
s s 10 mm f or cohesive soil u
s s 15 mm for claysand u
Q (s) + Q (s)s p
Qs(s)
-C ltII E s ~- [mm]-ltII IJ)
Fig 1 430 Dependence of total load Q(s) point res i stance Q (s) and shaft resistance Q (s) versus settlement p s
~ 3 Usu Qpu Qu Q(s) [ MN]
Sus= 20
1J
60
80
100
120
degs (s ) 140
5 P=Ol Op
1EO
C -ltII E 180 ~ ] 200
s [mm]
Approximative dependence of total load point resistance and shaft resistance versus settlement fny non-cohesive soil
Fig 1 4 31
101
113 3 ~fic0P Ye hY
1 Ground water
D
I y
yh C
Fig 1 5 1 Determination of 01 and 03 for settlement analysis of lar ge diameter bored piles
102
I
E=Et [MPa]
160 0
140
120 0
100
80
6
40
--- --shy 0
0
8 0
0
0
20
2 3 4
I 0 15
Fig 1 5 2
E = Et [MPa]
120
100
80
60
40
I I 0 35 065 085
0
Et= 17 81 qcp0844
( r = 0 128)
5
100
6 qcplMPo]
Calculated values of Young s modulus for piles No 1shy24 according to equation 1 5 2 and 1 56
0
0 0
E =898qcp127 (r= 0314)
E = 9 middot qcp 13 0
20 shy 0
0 0
0 1 2
loJ
I 0 35
3 I
065
4
I 085
5
100
6 qcp [MPo]
Fig 1 5 3 Calculated valueBof Young s modulus for piles No 1shy24 according to equation 1 5 4 and 1 5 6
I K 10 3
( 1 ] 1832
1400 0
1200 0
0
1000 0
800 0
m=2821 qcp0621
600 0
(r=0057)
400 0 0 0 0 0
200
2 3 4 5 6 qcp (MPa]
I 035
I 065
I 085 100 Io
Fig 15 4 Calculated valuesof the dimensionless compress ion modulus K for piles No 1- 24 according to equation 1 5 2 and 1 56
K ( 1 ]
0
1400
1200 0 0
1000
800
600
0
0 0
0
0 0
0 K= 1422 qcpl05
(r=0181)
0 K= 150 qcp
400 0
3)0 0 0
2 3 4 5 6 qcp(MPa)
I I -J 035 065 085 100 Io
Fig 1 5 5 Calculated values of the dimensionless compression modulus K for pile~ No 1-24 according to equation 1 5 2 and 1 5 6
104
120
100
2 3 4 5
I I I rv 0 15 035 065 085 100 lo
Bergdahl (1982) for shallow foundation
o----o Bozant Masopust (1981) D= 1 0 rn h=10 rn large diameter bored piles in noncohesive so il
0----0 Proposal according to current anal ysis
Klosinski (1977) D=090 to 125 rn large diameter bored piles in sand and sandy grave l
Mitchell Gardner (1976) very dense sand E=(35)q (it depends on sand density and stress history) c
Fig 1 5 6 Composision of Young s moduius
105
TABLES
0 Tab 1 11 Methods for detemination of the bearing capacity of bored piles (Ro llberg 1977)
Cl
Nol -- I Soil Areas of Q) Q) Editor Determination of Coefficients 5 type influenceqP qs p ~ C C 11 12 fP I fs
1 all Lab f Soil Mech (1936) l qp at the elevashy 1 0
2 all Huizinga (1951) ~ t~on of the pile 14 point
3 all Van der Veen (1953) ) 18 1 h+l14 all Van der Veen 1 0 Dpl375 D~ 15-- J qcmiddotdhBoersma (1957)
~ 11 +12 h - 12
5 12 all Menzenbach ( 1961) qc at the elevashy~ tion of pile point
6 18 all Mohan Jain Kuman (1963)1 average of qc over 1 h Q) h ~qcmiddotdhl 10 Dpj 3 75 Dj 15 50_micro
and 1 2C 11
7 I amp all de Beer ( 1964) graphically from 10 Q) qc 0 1 h+l18 u C
sand Soviet norm SNIP II 9ct9cp I4 bull O Dp I10 DP l66-1 083shyu clay B5- 67 Trofimenkov (1969) 2 50 1 251 +l J qc middotdh micro middot h middot-l l 2h-~ _micro
9 _micro u all Paproth (1972) at the elevation 3 5 I shy
) of pile point (Dpgt0 5 m 7 D8DpE
E-lt p 1 h+l1 1 h Dplt 5 m u l+l J qcmiddotdh h f qcmiddotd~ 30 Dpl 50 Dp 2 0 100shy10 sand Norwegian method
0l 2 h-12 200Senneseth (1974)
11 lall Soviet method h+l (20-0lqgl - 101 1 q middotdhTrofimenkov (1974) -- f C UpUsmiddotQct
l1+l2 h - 1212 Qct-Qcp 40 D~ 10 Dp 1 33- 0 67shyUsbullh 4 00 2 50
13 English method 10 DFJ 375Dp 10 I
Rodin Corbett Shershywood Thorburn (1974)
3 7 5 Dcl 8 0 DP 10h+l1 _1_ J qcmiddotdh 1 h
qcmiddotdh 20011 +12 h - 12 hb
1 h qcmiddotdh 150hf
0
Observations
fp I f (qp)fs C
Dp E = 1 cm Qbu = 2 Qpa (approx )
s fs=f (qc)
q=~g Us 0 h
fp=f(q~)
fs=f(qgl
bull fine grained non- cohesive soil loosely packed
bull fine grained non- cohesive soil medium dense comp
fine grained non- cohesive soil
Tab 111 (cont)
h+h bE 14 non-cohe- Meyerhof ( 1956 poundti J N 3o middot dh CtME fN3 o dh 1 0 DP 4 0 DP 10 100 etM= l 2
sive soil 1976) lJ +12 h - li hE o hgp taken into consi der ~ Ul (I)
E-lt
C 0
~E = 1 kgbull 30 cm
(statistical limit depth of the pile) hE - clamping length of
pile micro rrJ l-l micro (I)
15 C (I) p
sand Norwegian method
- irm - - - 10 IT
m = diagram O l-l Senneset (1 974) rrJO C
16 rrJ micro gravel English meth it 3 middot N30 - - - 10 - Jf 3 + diagram U) ~
E-lt p U)
iiouiu Coruett Sherwood Thorshyburn (1974 )
(NJQat the elevashytion of pile point1
0 -i
108
Tab 11 2
Results of calculati o n of p i le point load pile shaft load and total pile load from static con e penetration test (Rol l berg 1977)
~ gt
~ gt Ultima te Ultimate Ult imate
No Method micro micro poi nt skin bearing 080lt17nlt1 50 Q) -l
-l middot-i resistanceuro resistance r esistancE
middot-i p 0
(J n1 n n2 n n3 n n1 n2 n3
1
2
Lab fSoil Mech
Hu izinga (1951)
(1936 ) 430
307 i 3 Van der Veen (1953) 239
49
4
5
Van der VeenBoersma
Menzenbach (1961)
(1957) -l middot-i 0
2 4 7
1 57 1-CJ)
6
7
8
Mohan Jain Kumen
de Beer (1964)
Sovi et Norm (1969)
(1963) CJ) Q)
-l middot-i 0
lJ Q)
Q)
gt- CJ) Q)
c 0
2 44
1 37
183
47
t I
49
487
0 18
47
16
3 02
0 85 1
47
16
137
08
9
10
Paproth ( 1972)
Norw Method (1974)
~ 0
0
u I
C 0 C
1 8 1
180 l 46
1- - -_L~ 46 167 46 1 19
1 1 Soviet Method ( 1974) [1 1 41 46 1 62 13 083 13 1 14 0 8
12 Engl Method (1974) 2 66 35 128 35 2 30 35 1 28
Note
cal Q a) n = --- mean value of the rat i o between calculat ed pile loads and those n Q determined f r om loading test
b) n = number of piles
109
Tab 113
Point resistance of large diameter piles (DIN 4014 Part 2 1977)
Settlement Point pressure 1 Factor -fshy
(cm) (MPa) cf=lOMPa I i=15 MPa C C
Piles without enlarged base
1 05 005 003 2 08 008 005 3 11 0 11 007
15 34 034 023
Piles with enlarged base
1 035 0 04 002 2 065 0 07 004 3 0 90 009 006
15 2 40 0 24 0 16
Note 10 lt qp lt 15 (MPa)C
Tab 114
Skin friction resistance of large diameter piles (DIN 4014 1977)
Strength Static cone pen- Depth below Skin frict ion Factor of sand etration resist surface
(MPa) (m) (MPa) fs
Very small lt 5 - 0
Small 5 to 10 0 to 2 0 2 to 5 003 ln6 to 333
gt 5 005 100 to 200
Medium I I 10 to 15 0 to 2 0 I
I 2 to 7 5
gt 75 I 0045 0075
222 to 133 to
333 200
High I I
i
l
gt 15 0 2
to 2 to 10 gt 10
I I I
I
i
0 006 0 10
gt gt
250 150
Note Skin friction is assumpted as linear until s =2 cm and constant for s gt 2 cm
11 0
Tab 115
Values of the inverse of the point resistance factor (Bustamante 1982) fp
Soil type qPC I 1
Factor - shyfp(MPa)
for piles group
a) Silt and loose sand lt 5 0 40 -b) Moderately compact
5 - 12 040sand and gravel
c) Compact to very gt 12 i 030compact sand and gravel I
Tab 116
Values of the shaft resistance factor fs (Bustamante 1982)
Factor fs
Soil type qs
C Category I(MPa) I A I B I II A III BI
I a) Silt and loose lt 5 60
i 150 I 60 I 120-
sand
b) Moderately corn- I pact sand and 5 - 12 100 200 100 200 gravel i
Icl Compact to very
compact sand gt 12 150 i I 300 150 I 200I
I I and gravel i
I
111
Tab 117
Point resistance factor (proposal)
-
1-fp
qc (MPa)
Gravel
Coarse sand Medium sand
Fine sand Silty sand
25
080
0 70
060
5 0
0 65
055
047
75
054
045
039
10 0
045
036
031
150
035
027
022
200
030
0 23
018
Tab 118
Shaf t r e sistance factor (proposal)
fs
qc (MPa)
Gravel
Coarse sand Medium sand
Fine sand Silty sand
25
80
100
130
10 0
120
150
190
I 200
180
230
300
11 2
Tab 119
Calculated values qcp
for large diameter piles
Pile Literature Length Diameter (m) Measured p Cr1 lcul Settlement Note Authcr(year) No (ml D Dp (MPa)
(s=0 10Dp) (MPa)p ~~JL__
s s ()(mm) Dp
1 Franke (1977) 1 13 11 36 38 117 106 Garbrecht
2
3
2
3
13
14
11
15
1 58 36
37
38
40
215
185
136
123
) qg accord to Franke
4 4 13 15 204 3 2 33 220 108 and Garshy
5 5 6 11 33 35 127 11 5 brecht (1977)
6 6 6 11 153 36 35 146 9 5
7 7 6 1 5 34 35 158 105
8 -shy 8 6 15 2 1 41 3 0 109 52
9 10 9 11 39 52 47
10 11 95 11 43 35 77 70
11 12 9 11 49 66 60
12 13 10 11 15 5 1 4 0 77 5 1
13 14 9 11 1 5 4 8 46 115 77--shy14 Pranke ( 1973) 15 115 18 4 9
) ) average 88
15 13$ 13 5 1 3 19 -2 5 3 2 sd=3 0
16 - - 165 16 5 13 19 30 sv=0 34
17
18
Spang (1972)
llXJ
V90
6 6
6 75
0 7
09
3 2
4 2
32X
42X
x) s =0 10 D p
19 VlaJ 720 1 2 39 3 9X
20 - - VlsJ 6 5 1 5 3 0 3 ox
21 Touma and US59 9 9 o 76 8 0 Reese ( 1977)
22 HH 75 0 61 8 0
23 Gl 180 091 - 2 5
24 BB 137 o 76
sd = standard deviation
sv = standard variation
Tab 1 2 1
Ultimate point resistance coarse and medium sand psf (MPal (Pol ish Specification 1975)
Depth h
Medium sand r = 0 40 N = 200 30 Base diam (Op) and depthbase diam (hDp)
Dense sand r 0 Base diam (Op)
= 0 80 = 50N30 and dpethbase diam (hDp)
(ml Dp = 0 6 m Dp = 1 0 m Dp =12 m Dp = 1 5 m Dp = 0 6 m DP = 10 m DP = 12 m DP = 15 m
Psf hDp Psf hDp Psf hDp Psf hDp Psf hDp Psf hDp Psf hDp Psf hDp
5 10 83 0 85 5 0 075 42 07 33 20 8 3 16 50 14 42 13 3 3
7 14 11 7 1 2 70 11 5 8 10 4 7 2 8 11 7 22 70 2 0 5 8 1 8 47
10 18 16 7 15 10 0 14 8 3 1 3 67 35 167 28 100 2 5 83 2 2 67
15 18 250 18 15 0 16 12 5 15 100 4 2 25 0 3 4 15 0 30 125 27 100
20 2 4 333 2 0 200 185 167 1 7 133 4 7 333 3 8 200 33 167 30 13 3
25 26 41 7 2 2 25 0 20 208 19 167 5 0 41 7 4 0 250 3 5 20 8 3 2 167
w
11 4
Tab 131
Partial safety factors for resistance to axial load for bored piles (Wright Reese 1979)
Partial safety Normal Poor factor for control control
Unit skin resistance 1 70 185
(no load test)
Unit skin resistance 160 1 70
(from load test)
End bearing 165 180
Tab 1 3 2
Probability of failure of bored piles under normal design conditions (Wright Reese 1979)
Probability of Factor of Structure failure safety classification
5 10-3 25 monumental
210shy 22 permanent- 2
5 middot 10 2 0 110shy 1 85
temporary 5 bull 10-l 165
11 5
Tab 133 Results of field tests (Tejchman Gwizdara 1979)
L
II C C C 0 0 0
micro micro
micro micro micro For universal safe~y F2u u CUNo micro C C ~ ~g~ middot- C
~ Permisible micro micro i ~c -i micro
cmiddot-~ micro~ L
micro oo ~ load ~t~ ~~ omicro micro ~ ~ 3Z~ ~ ~ micro
-~~
~ e ~ --middot--
middot- ~ obull 0
~ g ~~ ~~ ~
~ L
o Jl i5 sect~ =gt L Q~ = yen t p Qp Qp
D h Q~ Srrx s tm p s E~ iQ~lQ~cm ~~ KN X ll1l kPa kPa kN kN kN Jl ~e ~ 1 2 3 4 5 6 7 8 9 10 11 12 13 14 15 16 17
1 70 6 60 4081 1550 2531 38 0 1182 10 4040 175 2041 245 1796 632 141 120
2 90 6 75 5082 3041 2041 598 1785 10 4782 107 2541 1079 1462 282 140 42 5
3 120 720 7259 4041 3218 557 1035 10 3576 119 3630 2158 1472 187 2 19 594
4 150 650 8643 4454 4189 51 5 928 20 2521 136 4326 2158 2168 3 10 166 253
5 130190 195 7750 3011 4709 392 805 10 1075 - 3875 981 2894 3 10 166 253
6 130190 165 9516 5101 4415 536 522 20 1800 - 4758 1962 2796 260 158 412
7 130190 135 8044 5199 2845 646 114 4 15 1834 - 4022 2109 1913 2 47 149 524
8 180 115 11380 4415 6965 388 792 15 1735 - 5690 2747 2943 161 2 37 483
9 76 980 6867 4316 2551 628 110 13 9529 109 3534 1128 2306 383 111 32 8
10 61 7 60 7161 2747 44 14 383 67 15 9404 303 3581 392 3188 700 169 109
11 92 180 4807 883 3924 184 20 8 1329 76 2404 196 2207 450 178 82
12 76 24 5 6769 736 6033 109 20 8 1623 103 3385 147 3238 500 186 43
13 76 137 5396 2060 3336 38 2 63 8 4535 102 2698 589 1109 350 t 58 218
14 120 23 5297 1854 3443 35 0 960 10 1640 39 2649 196 2453 945 130 7 4
15 135 16 7 13489 7554 5935 560 181 10 5260 83 6749 2060 4689 367 127 305
16 170 46 0 8829 2943 5886 333 17 10 3466 39 4415 1373 3042 2 14 1 94 31 1
Average Fi 387 166 Standard deviation Sd 2 1 5 034 Standard variation sv= 0 56 0 20
1234 Spang1972 567 8 Franke 1976 9 10 111 2 1 3 Touma Reese 1974
14 Colombo 1971 15 Kerisel Simons 1962 16 Appendino 1973
11 6
Tab 134
Results of model
SafetyScheme factor
medium F ssand
F p
loose F s
samd Fp
F 3 55 sd _P F 1 32 sd
s
tests (Tejchman Gwizdara 1979)
Diameter D (mm)
30 60 90 133
145 129 108 112
280 3 08 307 294
140 154 153 112
594 3 04 324 426
107 sv 030
0 19 sv 0 14
117
Tab 135
Individual safety factors according to literature
Literature proposal ofLiterature individual safety factor
Fs Fb
Polish Specification (1974) 100 250
Tejchman Gwizdala (1979) 150 400
Bustamante Gianeselli 200 300 (1982)
Decourt ( 1982) 130 400
average 145 3 38
TAB 141 0)
Load settlement curves - measured
Pile No
Settlement 1 c 3 4 5 6 7 8 9 10 11 12
s p s p p s
p p s P
p s P
p s p p s
P p s
P p s
p p s p p S
p I i p s
p p s p
mm MPa rrrn lifl5a MPa mm
lifl5a MPa
mm lifl5a MPa mm
RPa mmMPa nwa MPa mm
RPa MPa mm RPa MPa mm
RPa MPa mm RPa MPa mm
RPa MPa mm RPa MPa mm
RPa 10 045 222 09 1 1 05 20 07 143 06 167 08 125 0 5 20 08 125 10 100 08 12 5 15 67 16 63 20 092 21 7 14 43 08 25 10 20 0 1 1 182 12 167 0 9 22 2 12 167 18 111 14 143 24 83 22 9 1 30 125 240 1 7 I 7 6 1 1 273 1 2 250 14 214 15 200 1 2 250 15 200 25 12 0 19 15 8 30 100 26 11 5 40 1ti 250 20 10 0 14 28 6 14 286 1 7 235 18 222 1 4 286 18 22 2 3 2 12 5 23 174 36 111 3 0 133 50 20 250 22 ~27 1 7 294 1 5 333 20 250 2 1 ~38 1 7 294 1 9 263 37 135 27 18 5 4 2 11 9 33 152 60 2 2 273 24 ~5o 20 300 1 7 353 23 61 22 ~73 18 333 21 286 43 140 30 20 0 46 13 0 36 16 7 80 271 295 27 796 24 333 20 400 27 ~96 25 1320 22 364 25 32 0 53 15 1 36 222 41 195
100 322 31 1 30 333 28 357 22 454 31 1323 29 345 26 385 28 357 60 16 7 40 25 0 45 22 2 125 38 329 32 391 32 391 25 500 32 139 1 30 41 7 32 39 1 4 6 272 48 ~6 0 150 14 2 357 34 1441 36 41 7 27 555 36 ~1 7 34 44 1 36 41 7 175 36 486 39 449 30 583 38 ~61 38 461 200 38 526 42 476 32 625 225 39 577 33 682
(mmMPa) ( 1 MPa)
1
1=2074
t 1=O ~01 =0 98S
a1=1132
b1 =0 212 V =0994
a1=2217
b1=O 131
V =Q 978
a1=1860 b1=0233
V =Q966
a1=1562
b1=0174 V =Q983
a1=1382
b1=O195
V =0975
a1 =20 37
b1 =C 174
V =0957
a1=1443
b1=(l 193 v =O 961
a1=965
b1= 0071 V =0 990
a1=1 91
b1 =o 128
V =0 993
a1=5 83
b1=C124
v =O 981
a1=6 1 4
b1=01 64 v =U 985
li(MPa) ~9 4 7 76 43 57 middot5 1 57 5 2 141 78 81 61 cp (MPa) B8 39 40 33 35 35 35 3 0 39 3 5 49 40 __Ef ~-6 1 2 1 9 1 3 16 15 16 1 7 36 22 16 15 qcp
TAB 141 (continue) Load settlement curves - measured
Pi le No 3ettlement 13 14 15 1 17 18 19 20 21 22 23 24
s p s T5
p s T5
p s T5
p s P
p s P
p s P
p s P
p s P
p s T5
p s T5
p s p p s
p mm MPa lll1l
HPa MPa mm HPa MPa mm
fWa MPa mm fWa MPa lll1l
HPa MPa mm HPa MPa mm
MPa MPa lll1l NT5a MPa HPa MPa 111111
HPa MPa 111111
HPa MPa 1)1111
mra 10 1 7 59 075 133 06 167 075 133 ~95 105 09 11 1 07 143 3 76 1 7 59 08 133 10 100 20 2 4 83 130 154 095 21 1 1 15 17 4 1 75 114 16 125 12 167 ~7 74 33 6 2 1 3 15 3 1 9 103 30 29 103 1 7 176 1 2 250 15 200 r55 118 22 136 16 18 8 38 79 46 66 1 7 182 27 110 40 33 12 1 20 200 1 35 29 6 1 75 229 ~O 133 26 154 175 229 49 82 58 6 9 1 9 21 1 35 115 50 36 139 235 21 3 145 34 5 1 95 256 24 208 ~-4 147 28 17 9 20 250 gt8 86 6 9 72 2 2 233 4 2 11 8 60 39 154 265 22 6 1 55 387 2 15 279 28 214 ~6 16 7 30 120 0 2 2 27 3 o 8 89 80 7 5 2 3 262 80 43 186 31 258 1 7 47 1 36 222 14 05 198 33 124 2 25 320 B 1 98 25 327
100 45 222 18 556 39~ 253 ~-5 222 36 1278 27 370 ~8 113 125 47 26 6 20 625 42 29 8 149 255 28 1446 t50 22 682 3 0 500 175 200 225
(mmMPa) a1=479 a1=1206 a1=14 51 a1=1113 a1=1406 ~=836 a1=843 a1=1176 ~=64 a =561 a1=10 0 a1=9 5 (1MPa) b1=0175 b1=0 178 b1=0 382 b=0287 b1=O 119 p 1=0 137 h1 =o 193 b=0258 p1=0 049 b1=0032 b1=0 276 b1 =0 048
hf (MPa)
v =0998 57
v =0-987 5 6
v =0989 26
v =0992 35
v =0933 Iv =0991 84 73
v =0993 5 2
v =0998 tJ
3 9 =0944 v =0998 v =0996 v =0981
qcp (MPa) 46 39 32 30 32 14 2 39 30
lL 12 1 1 08 12 26 1 7 1 3 13 qcp
lD
N 0
TAB 142
Calculated point resistance curves
Setlement (mm) p(s)
1
n p(s)
Calculated value of the p(s) for pile No
2 3 4 5
n p(s) n p(s) n p(s) n p(s) 6
(MPa)
n p(s)
7
n p(s) 8
n p(s) 9
n p(s)
10 20 30 50 80
100
150 200 225
070 128 177 253 335
375 446 493
157 140 141
127
123
1 16 106
070 1 25 168 232
297
327 378 410
422
078 089 099 1 06
1 10
109 1 11 108
108
073 1 30 176 246
315 349
405 441
146 163
160 145
1 32 125
113 105
056 096
1 26
167 205 222
249 265
271
0 80 096
105
1 11 100 101
092 0 83
082
065
118 162 233
308 345
412 456
108 108
1 16 116 114 111
064
1 12 151 2 10 2 69
298
346 3 76
078 P63 093 tt 13 101 tt 53 100 I 13
108 ~75
103 ~04 096 ~ 55
~ 87
1 26 125 127 126
125
1 17 1 04
052 088
1 15 153
188 2 03 227 242
065 0 74
o 77 0 81 0 75
0 73
063
072 122
1 83 262 347 388
463 5 11
073
0 74
073 0 71 0 65 065
064 1 18
162 233 309
3 46
41 3 4 57
Dp (m) 1 1 Qcp (MPa) 38 (mmMPa) h2 8 1 1 9 Qcpbullv1(MPa) 72
158
39
124 14 55
15
40
n20 15 60
204
33 148 10 33
1 1
35
tt 4o 1 9 67
1 53 3 5
tt 4 0 1 5 51
15
13 5
114 0 15 i-gt 3
2 1
30
tt 6 0 10 3 0
1 1
3 9
12 4 1 9 74
1 1
3 5 h40
1 9 67
Note n = condition coefficient calculated p(s) measured p(s)
10
n
081
084 0 85 0 86 0 85
087
TAB 142 (continue)
Calculated point resistance curves
Calculated value of the p(s) for pile No (MPa) Setlement 11 12 13 14 15 16 17 18 19 20
(mm) p(s) ll p(s) n p(s) ll p(s) n p(s) n p(s) n p(s) n p(s) n p(s n p(s) n
10 106 070 0 71 045 091 054 099 1 32 055 092 053 070 060 081 085 0 72 080 055 078
20 1 90 079 130 059 160 067 1 70 1 30 096 101 091 079 1 12 148 085 1 31 082 098 082
30 258 086 1 76 068 2 15 074 222 1 31 1 26 105 120 080 156 205 081 180 082 132 083
50 363 086 246 075 297 082 296 1 26 1 70 117 161 082 228 095 295 087 256 0 91 184 092
80 471 316 o 77 3 77 088 364 1 18 2 1 o 1 24 199 308 085 393 097 336 1 02 237 095
100 522 349 078 415 092 394 228 1 27 2 16 348 088 442 098 375 104 262 097
150 611 405 479 443 258 117 244 423 529 443 304 101
200 669 441 518 473 276 261 474 587 488 331
Dp (MPa) 1 1 1 5 1 5 18 1 9 19 070 090 12 15
qcp (MPa) 49 4 0 46 49 32 30 32 42 39 30 12 a1 mmMPa) 84 h20 96 84 152 160 152 124 160
IV1 1 9 1 5 15 12 11 1 1 23 21 18 15
qcpmiddotv1 (MPa) 93 60 69 59 35 33 74 88 70 45
- 12287 average = ~ = 098
standard deviation sd = 023 standard variation sv = 023
N
122
TAB 143 Ultimate settlement for shaft resistance - summing up
Ultimate settlements (mm)Literature sand cohesive claysand
soil
Burland Butler Dunican (1966) 7
Touma Reese (1974) 10 Tomlinson (1977) 10 Klosinski (1977) 8
Francke Gerbrecht (1977) 20-30 DIN 4014 part 2 (1977) 20 10 Francke (1981) Reese (1978) (1979) 05-2 of 05-2 of Farr Aurora (1981) shaft dia~ shaft diam
5-20 mm 5-20 mm Tejchman Gwizdala (1979) - Spang (1972) 10
10 10 20
- Francke (1976) 10 20 15 15
- Touma Reese (1974) 13 8 15 8
8 - Colombo (1971) 10
- Kerisel Simons (1962) 20 - Appendino (1973) 10 Promboon Brenner (1981) 10 Prodinger Veder (1981) 12 Decourt (1982) 10-15 10-15
-average s = 14 1 10 126
standard deviation sd = 53 2 1 47
standard variation sv = 038 021 037
123
TABLE 14 4 Al l owab l e base resistance versus sett lement
Pile Li terature ength Diameter (m) Calculated qcp=qcp Settl ement Fp-3- sa (mm)No Aut hor No (m) D DP qcp (MPa) for qcp3(MPa)
1 Francke ( 1977) 1 13 11 38 127 25 Garbrecht
II2 2 13 11 158 39 130 19
II3 3 14 15 40 133 33
II4 4 13 15 204 33 110 23
II5 5 6 11 35 117 22
II6 6 6 11 153 35 117 19
II
8
7 7 6 15 35 1 17 25
II 8 6 15 21 30 100 21
II9 10 9 11 39 130 13
II10 11 95 11 35 117 15
II11 12 9 11 39 163 11
II12 13 10 11 15 40 133 7
II13 14 9 11 15 46 153 9
14 Francke ( 1973) 115 11 5 18 30 100 15
II15 135 135 13 19 32 107 29
II16 165 165 13 19 49 163 35
17 Spang (1972) V70 660 070 32 107 28
18 II V90 675 0 90 42 140 16
II19 V120 720 1 20 3 9 130 16
II20 V15C 650 150 30 100 16 average for pi les 198
standard dev sd = 78
standard var sv = 039
)assumed qc = p for s = 010 Op sonding meRsurement were not availab le
IV
TA~LE 15 1
Comparison of the initial sl ope of the pile point resistance - settlement curve
Accardi ng to 1 2 3 4
In i t i ~l 5
slope a1 for the pile No
6 7 8 9
(mmMPa)
10 11 12 13 14 15 Note
a 1 for s=10 mm 222 11 1 a1 for s=20 mm 21 7 14 3 calculated 207 113see Tab 14 1 Bo Berggren (198 )230s=20 mm
Schmertmann s method (see 202B Berggren 1981)s=20 mm
No 1 _ llNo - 6 1 97 098
202 250
22 2
400
30 8
090
14 3
200
186
076
167
182 156
286
18 2
107
125
167 138
091
20 0
222
204
426
263
098
125
167
144
087
100
11 1 9 7
182
23 5
1 03
12 5
14 3
11 9
174
164
105
67 83
58
14 6
125
1 16
63
9 1
61
103
59
8 3 48
123
13 3
15 4 12 1
1 10
167 21 1
aceto hypershy14 5 bola type curve
1 15
No 2 NQj = n1
No 4Noz ~ na No 5Naz= T]g
105 1 27
106
093
1 13
160
1 23
108 1 17
157
100
121 109
1 92
118
1 16 1 14
164
2 12
120
122
1 15
143
1 76
151
149 1 73 1 27 146
TAllLE 151 (continue)
Compa ri son of the initial slope of the pile point resistance - settl ement curve
Initial slope a1 for the pile No (mmMPa)According Note to 16 17 18 19 20 21 22 23 24 -a1 for s=10 mm 133 - 105 11 1 143 76 59 133 100 a1 for s=20 mm 174 - 114 125 167 74 62 153 10 3 calculated see 11 1 146 84 84 118 64 56 100 95Tab 141
Bo Berggren 198 67 78 25 0 114s=20 mm Schmertmann s method (see B 136 67 250 146 Berggren 1981) s = 20 mm
nG = 108 No 1NoJ = n 1 20 125 1 32 121 1 19 105 1 33 105 sd = 0 14
SY= 013 No 2 i) = 1 29ro1 = n1 157 136 149 142 1 16 1 11 1 53 108 sd = 019
SY= 015 No 4 iis = 143 INo2 = ns 091 126 1 63 111 sd = 033
SY= 0 23 No 5 ii9 = 1 37183 108 163 142INoz = n9 sd = 0 37
SY = 027
N Vl
126
TABLE 152
Measured and calculated pile point resistance
Pile Calculated Measured Measured No qcp P for
s=10 mm P for s=20 mm
~ 10 mm ~ 20 mm
- (MPa) (MPa) (MPa) - -
1 38 045 092 84 41 2 39 09 14 43 28
3 40 05 08 80 50 4 33 07 10 47 33 5 35 06 11 58 30 6 35 08 12 44 29 7 35 05 09 70 39 8 30 08 12 38 25 9 39 10 18 39 22
10 35 08 14 44 25 11 49 15 24 33 20 12 40 16 22 25 18 13 46 1 7 2 4 27 19 14 30 075 13 40 23 15 32 06 095 53 34 16 49 075 115 65 43 17 32 - - - -18 42 095 1 75 44 24 19 39 09 160 4 3 23 20 3 0 07 12 43 25
average= 484 291
sd 163 088 sv 034 030
Tab 153 Results of calculation for piles No 1-24
Pile No
Length (m)
Overburden pressure 0 vs
0hs (kPa)
0ve (kPa)
0 nc (kPa)
- -ov=o1 (kPa)
- -OV=03 ( kPa)
00 (kPa)
p(a il ( kPa)
s (a 1) (mm)
A2 ( 1 )
E t
(kPa)
Md ( 1 )
K (1)
E I
t (kPa)
( kPa) 1 2 3 4 5 6 7 8 9 10 11 12 13 14 15 16
l 2 3 4 5 6 7 8 9
10 11 12 13 14 15 16 17 18 19 20 21 22 23 24
13 12 14 13 6 6 6 6 9 95 9
10 95
11 5 135 165 66 675 72 65 99 75
180 137
l 33 133 123 116
70 70 70 70
104 102 95
102 95 94
106 139 95
101 106 97
180 137 221 215
53 53 49 46 28 28 28 28 42 41 38 41 38 38 42 56 38 40 42 39 72 55 88 86
202 202 216 202 1114 104 104 104 146 153 146 160 153 181 209 251 120 128 134 123 238 180 305 277
202 202 216 202 104 104 104 104 146 153 146 160 153 181 209 251 120 128 134 123 238 180 305 277
168 Hi8 170 159 87 87 87 87
125 128 121 131 124 138 158 195 108 115 120 110 209 159 263 246
128 128 133 124 66 66 66 66 94 97 92
101 96
110 126 154 79 84 88 81
155 118 197 182
141 141 145 136
73 73 73 73
104 107 104 111 105 119 137 117 89 94 99 91
173 132 219 203
950 975
1000 825 875 875 875 750 975 875
1225 1000 1150 750 800
1225 800
1050 975 750
2000 2000 625
1500
218 139 255 190 16 1 146 210 12 7 10 1 11 7 84 73 69
104 167 210 124 103 10 1 109 142 120 76
153
0802 0802 0822 0820 0798 0798 0798 0798 0791 0798 0800 0811 0814 0837 0837 0830 0769 0 768 0771 0 775 0 780 0 781 0 788 o 779
35296 81603 43312 65222 44019 67515 4609 91313 78186 60572
118115 15129 5 184075 95577 67017 81607 33252 67554 85294 75994 78816 74857 55101 54862
075 075 0 77 075 084 084 084 081 079 078 084 080 083 076 076 078 0 77 081 079 076 082 087 064 0 74
278 643 337 512 542 832 567
1085 766 572
1216 1417 1832
796 520 709 353 735 878 781 630 726 302 366
26472 61202 33350 48917 36976 56713 38656 73964 61767 47246 99217
121036 152782
72639 51932 63653 25604 54719 67382 57755 64629 65126 35265 40598
a=282l a =l781 y=axs S=0621 B=0 844
V=0 057 V=0 128 _ Iv -J
~
N co
Tab l53 Results of calculation for piles No 7-24
Pile No
17
1 2 3 4 5 6 7 8 9
70 11 72 13 74 75 16 17 78 79 20 27 22 23 24
Ground water
18
-20 m b s
-28 m -335 m -330 m -3 15 m dry dry -53 m -85 m
E t (kPa)
19
33653 64979 35364 45664 47969 54583 37574 63072 74548 57753
71 2618 123531 150297
71239 48619 59204 39744 77208 77863 62049 90407 95844 57762 62937
vxEt=E Md (kPa)
20
25240 48689 27230 34248 35254 45849 31562 51040 58893 45047 94599 98825
724747 54142 36950 46179 30603 57678 61572 47157 47734 83384 36968 46569
a=898 S=l 27 =0314
K (l )
21
265 511 275 358 517 672 463 749 730 546
1160 1157 7496
593 377 514 422 775 802 638 723 929 377 420
a=l422 S=l 05 =0187
E=E = t1 3
g-gcp (kPa)
22
51046 52799 54566 42492 45870 45870 45870 37547 52799 45870 77039 54566 65438 52799 40826 71039 40926 58739 52799 37541 82549 82549 40826 59945
Calculated s
(mm)
23
708 128 72 7 15 3 724 146 144 17 3 71 3 11 5 11 2 732 13 2 707 1 5 1 13 7 93
102 118 137 728 12 l 69
11 9
s__caL n=smeos
() 24
050 092 050 087 0 77 7 00 069 l36 l 12 098 133 l81 l97 103 090 065 0 75 099 117 126 090 101 097 078
ri=l00 sd=035 sv=035
K = l50gcp
25
570 585 600 495 525 525 525 450 585 525 735 600 690 450 480 735 480 630 585 450 825 825 1180 645
E l
(kPa)
26
67684 69465 72250 57726 44856 44856 44856 38448 59659 54306 74956 63214 70704 49089 56783 79502 45283 61081 58207 42927
708572 94785 71033 91898
E = t E middotA2
l
(kPa)
27
54283 5571 l 59389 47336 35795 35795 35795 30682 47790 43336 59964 51266 57553 47088 47024 65987 34823 46970 44877 33269 84639 74027 55974 71589
Calculated s
(mm)
28
l O l 12 l 11 7 737 15 9 18 7 185 21 1 12 6 12 2 133 14 l 150 13 7 13 l 14 7 709 12 7 738 755 12 4 735 50
100
- -
Tab l53 Results of calculation for piles No l-24
Pile
29
l 2 3 4 5 6 7 8 9
10 ll 12 13 14 15 76 17 78 19 20 21 22 23 24
sea l n= middotshy
smeas
28 TT
30
0 46 087 046 0 72 099 l 28 088 l 66 l 25 l 04 l 58 l 93 2 17 l 32 078 0 70 088 l 23 l 37 l42 087 l l 3 066 065
n=l 10 sd=0 44 sv=040
s seal for p n=s=lOrnn ac cording to s = 70mm
(mm)
37 32
5 l 0 51 ll 8 l18 64 064
13 0 l30 85 0 85
13 3 l 33 83 0 83
184 l84 ll6 l l 6 105 l05 137 l 37 21 3 2 12 19 4 l94 107 l06 l l 3 l l 3 84 084
92 092 l 0 9 l09 128 l28 83 083
l 0 3 l03 88 088 79 0 79
n=1 73 sd=025 sv=027
s for p according to s = 20mm
(mm)
33
10 4 184 102 18 6 15 6 200 14 9 276 209 18 4 219 292 274 185 17 9 12 9 -
169 194 219 172 200 143 15 0
seal n=s=20rnn
34
052 092 051 093 078 l00 075 l 38 l 05 092 l l 0 l46 l 37 093 090 065
-085 097 l1 0 086 l00 072 075
n=093 sd=025 sv=0 27
s for p according to s = 30rnn
(mm)
35
142 223 14 l 22 3 198 249 142 34 5 290 249 274 345 33 l 243 22 6 168 -
24 7 26 6 293 24 3 279 187 213
seal n=s=30rnn
36
047 0 74 047 0 74 066 083 047 l 15 0 97 083 091 l 15 l10 0 81 075 056 -
082 089 098 081 093 062 0 71
n=o80 sd=020 _ sv=0 25 N
IO
APPENDIXES
APPENDIX 1 1 1
Pi le No 1 Length 13 m D 10 m
Areas of influence
-
qe
(MPa)
1 fp
___9c_ f
(MPR) zyen
(MPf) qcp (MPa)
Soil type
22 20 18 16 14 1 2
l 2 (m)
10
1 0 08 06
16 15 16
026 027 026
42 41 42 Sand
04 14 U28 39 02 14 028 39 41
02 16 0 26 42 04 16 026 42 06 16 026 42 08 14 028 39 Sand 1 0 13 030 39 12 15 027 4 1 38 14 13 030 39 16 12 032 38 18 12 032 38
40 20 10 036 36 22 10 036 36 24 9 U39 35 2 6 8 043 34 28 10 036 36 30 10 036 36 3 2 10 036 36 34 10 0 36 36 36 11 0 34 37 38 11 034 37
l 1 (m)
40
42 44
11 0 34 37 15 1
46 48 50 52 54 56 58 60 62 64 66 68 70 7 2 74 76 78 8 0
APPENDIX 112
Pile No 2
to little depth of sounding
q~ = middle values for 11 = 2 Op
q~ = 145 MAa (Francke Garbrecht 1977 Tab 2 p 50) (Fi g No 2)
for sand
qcp = 0275middot145 = 40 MPa q~p =V ~~s) middot 40 = 097middot40 = 39 MPa
Pile No 4
q~ = 120 MPa sand (Fig No 4)
q = 0 315middot12 = 3 8 MPa q bull 38 = 086middot38 = 33 MPa=V Jmiddot54
1
cp middot bull cp
Pile No 12
qg = 155 MPa sand (Fig No 13)
qcp = 026middot155 = 4 03 MPa
Pile No 13
q~ = 200 MPa sand (Fig No 14)
q = 0 23middot20 = 46 MPacp
APPENDIX 113
PileNo3 Length 14 m D 15 m
Areas of influence
-
qe
(MPa)
1 Tp
----9cf
(t-1Pf) r~
(MPf) qcp (MPa)
Soil type
22 2D 18 16 17 025 43 14 17 II II
L 2 17 II II
12 (m)
16 10 08 06
17 17 17
o
II
II
II
II
Sand 04 17 II II
02 19 024 46 b9
02 19 024 46 04 17 025 43 06 15 027 41 08 13 030 48 1 0 12 032 38 12 11 033 36 14 13 0 30 39 16 14 028 39 18 12 032 38 40 20 16 026 42 2 2 16 026 42 24 11 033 36 26 11 033 36
60 28 30
10 10
036 036
36 36
Sand
32 10 036 36 34 12 032 3 8 3 6 12 032 38 38 12 032 38
1 1 (m)
40
4 2 4 4
13
14 16
030
028 026
39
39 42
46 13 030 39 48 12 032 38 50 14 028 39 52 10 036 36 54 13 030 39 56 14 028 39 58 15 027 41 60 15 027 ~-1 236 62 64 66 68 70 72 74 76 7 8 80
APPENDIX 114
Pi l e No 5 Length 6 0m D 11 m Dp 11 m
Area s of i nfluence
-
qc
(MPa)
1 Tp
-3Lf
( MPf) l ~
(MP~) qcp (MPa)
Soil type
2 2 2 0 18 1 6 14 1 2 155 U i1 33
l 2 (m)
1 2 10 08 06
15 14 12
022 023 0 27
3 3 32 32
Fine sand
+ silt
04 125 026 33 02 16 0 21 34 39
02 16 021 34 04 13 025 33 06 08 10
15 5 17 20
022 0 20 018
34 34 36
35 Fi ne sand
1 2 20 0 18 36 14 20 018 36 + s ilt 16 20 0 18 36 18 165 020 32 20 165 0 20 32 22 17 0 20 34 24 26 2 8 30 32 3 36 38 4 0
19 21 5 21 5 21 5 20 19 5 19 5 20 215
01 9 ---
018 018 0 18 0 18 -
3 6 40 40 40 36 35 3 5 36 4 0
l 1 (m) 4 2
44 20 19
018 01 9
36 3 6 157
46 48 50 5 2 54 56 58 6 0 62 64 66 68 70 7 2 74 76 7 8 8 0
APPENDIX 1 15
Pi le No 6 Lengt h6 0 m D 11 m
Areas of qc 1 __9_c_ qcp Soil typei nfluence fp f 1 yen (MPa) (MPf ) (MPf) (MPa)
-2 2 20 18 16 t 4---0 14 75 038 29 L2 20 018 36 Fi ne sand
1ti 10 30 40 + s i lt12 08 19 0 19 36(m) 06 17 020 34 04 14 023 32 02 9 034 31 56
02 6 043 26 04 12 026 3 1 06 17 020 34 08 11 028 3 1 1 0 14 023 32 35 1 2 17 020 34 Fi ne sand14 19 019 35 16 20 018 36 + silt18 18 0 19 34 20 14 023 32
46 22 12 026 31 24 12 026 31 26 15 022 33 28 18 019 34 30 20 018 36 3 20 0 18 36 34 20 018 36 3G 20 018 36 38 20 018 36 4 0 20 018 36
l 1 42 22 40
(m) 44 22 40 46 L2 4 0 158 48 50 52 54 56 q =V ~ - 3 b =0 99middot35 = 35 MPp cp 53 58 6 0 62 64 66 68 70 72 74 76 78 80
APPENDIX 116
Pi leNo7 Length 60 m 0 15 m
Areas of influence
-
qe
(MPa)
1 Tp ~
(MPg) r~
(MPf) qcp (MPa)
Soil type
22 20 18 16 9 U33 30 14 10 031 31 12 135 024 32
l 2 (m)
16 10 08 06 04 02
13 12 6
10 175
025 026 043 0 31 020
33 31 26 3 1 35 50
Fine sand
+ silt
02 04 06
17 10 115
0 20 0 31 027
34 31 3 1
08 10
145 185
023 019
33 35 3 5
1 2 14
20 19
018 0 19
36 36 Fine sand
l 1 (m)
60
16 18 20 22 24 26 28 30 3 2 34 36 38 40
42 44 46 48 50 52 54 56 58 6 0
185 125 125 165 17 19 21 215 205 20 21 20 20
24 22 20 215 22 22 21 19 18 22
0 19 026 0 26 020 020 019 --
018 018 -
018 01 8 --
018 ----
0 19 0 19
35 33 33 33 34 36 40 40 37 36 40 36 36
40 40 36 40 40 40 40 36 34 40 219
+ silt
62 64 66 68 70 72 74 76 78 80
APPENDIX 117
Pile No 8 Length60 m D 15 m Dp 2 1 m
Areas of influence
-
qe
(MPa)
1 r +
(MPg) r~
(MPf) qcp (MPa)
Soil type
22 18 019 34 20 16 021 34 18 125 026 3 3 16 115 027 31 14 11 028 3 1 12 11 028 3 1
l 2 (m)
10 08 06
105 11 145
D29 028 023
30 31 33
Fine sand
+ silt
04 18 0 19 34 02 18 019 34 71
02 15 022 33 04 11 0 28 31 06 13 0 25 33 08 20 0 18 36 10 15 022 33 12 13 025 33 14 175 020 35 16 18 20 22
20 21 20 15
018 -
018 0 22
36 40 36 33
35 Fine sand
+ s i lt
24 26 28 30 3 =
13 16 175 19 20 20
025 021 020 0 18 018 018
33 34 3 5 34 36 36
36 38 4 0
20 20 21
018 0 18 -
36 36 40
11 (m)
4 2 4 4 4 6 48 50 5 2 5 4 56 5 8 60 6 2 6 4
20 20 21 22 21 20 19 175 19 20 25 28
018 0 18 ---
01 8 01 9 0 20 0 19 018
36 36 40 40 40 36 36 35 36 36 40 4 0 23 0
6 6 68 70 72 74 76 78
qcp 1f5=v 2T middot35 = b85 middot35 = 30 MPa
80
APPENDIX 118
Pi le No 9 Le ngth 90 m D 11 m m
Areas of 1Qe -9c qcp Soil typeinfluence Tp f ryen (MPa) (MPg) (MPf) (MPa)
-
2 2 2 0 18 16 14 lc 11 034 37
12 10 10 036 36 12 08 9 039 35 Medium(m) 06 10 036 36 sand04 10 036 36
02 11 034 37 43
02 12 032 38 04 12 0 32 38 06 12 0 32 38 08 13 030 39 10 13 030 39 12 13 030 39 14 14 028 39 16 14 028 39
44 18 14 028 39 20 14 028 39 39 Med ium 22 15 027 4 1 sand 24 16 026 4 2 26 17 025 43 28 13 0 30 39 3 0 9 039 35 32 13 030 39 34 16 026 42 36 17 025 43 38 17 025 43 40 19 024 4 6
11 42 17 025 43
(m) 44 15 027 41 17 7 46 48 50 52 54 56 58 60 6 2 64 66 68 7 0 7 2 74 76 78 80
APPENDIX 119
Pi 1 e No 10 Length 95m D 11 m m
Areas of influence
-
qe
(MPa)
1 fp
-9c f
(t-1Pf) [~
(MPf)
qcp
(MPa)
Soil type
22 20 1 8 16 14 L 2 13 Uti 3J
l 2 (m) 12
10 08 06 04
18 18 28 19
0 19 019 0 19 019
34 34 34 34
Fine
sand
02 21 40 42
02 20 4 0 04 17 020 34 06 21 40 0 8 10
23 22
40 40 Fine
1 2 14 16 18
21 20 16 15
0 21 022
4 0 4 0 34 33
sand
44
20 2 2 24 26 28 30 32 34 36 38 40
14 14 13 11 11 14 17 14 12 13 12
023 023 025 0 28 028 023 020 023 027 025 027
32 32 33 31 31 32 34 3 2 32 3 3 32
l 1 (m) 42
44 12 13
0 27 025
32 33 15 2
46 48 50 5 2 5 4 56 5 8 6 0 6 2 6 4 66 6 8 70 72 74 76 78 80
APPENDIX 11 10
Pi 1 e No 11 Lengt h 9 0m D 11 m m
Area s of influence
-
Qe
(MPa)
1 fp
__k_ f
(MP~) ryen
(MPf) qcp (MPa)
Soi l type
22 20 18 16 14 12 lb 55
12 (m)
1 0 08 06 04
23 19 20 21
024 023
55 46 46 55
Medium
sand
02 22 55 62
0 2 04
24 25
55 55
06 08
27 28
55 55
10 12 14
28 28 28
55 55 55 49
16 26 55
44
18 20 22 24 26 28 30 3 34 36 38 40
24 19 18 17 22 21 17 11 13 12 11 9
024 024 025
025 0 34 030 032 034 039
55 46 43 43 55 55 4 3 37 39 38 3 7 35
1 1 (m) 42
Ll Ll
12 16
032 0 26
38 4 2 209
46 48 50 5 2 54 56 58 60 62 64 66 68 70 72 74 76 78 80
APPENDIX 141
0 2 3 4 p [MPa)
PILES WITH 40 ENLARGED BASES
80
120
160 C----0
200 IN4014 s (1977)
[mm]
P s calculateds P p(s)(mm) (MPa)(mmMPa)(MPa) ()
10 035 286 046 20 065 308 080 30 090 333 104
150 24 625 214 200 229
ai = 2605 (mmMPa) b1 = 0243 1MPa V 1000 bi = 1b = 411 MPa
_ 411 MP Vi - 24 a
() assumed
average Dp = 18 m
qcp = 24 MPa ai = 184 (mmMPa) (28-4middot24)
Vi = 1 2 (3-18)
qcpmiddotvi = 29 MPa
40
80
120
160
200 s
[mm]
DIN 4014 Part 2 ( 1977)
0 1 2 3 4 5 p [MPal
PILES WITHOUT ENLARGED BASES
C----0
DIN 4014 ( 1977
s calculated s p -p- p(s)
(mm) (MPa)mmMPa)(MPa) ()
10 05 20 062 20 08 25 113 30 11 27 3 155
150 34 441 385 200 424
ai = 2085 (mmMPa) bi= 0 157 1MPa V = 0970
bi= 1s = 637 MPa
Vi 187=3f =
() assumed
average Dp = 12 m
qcp = 34 MPa a1 = 144 (mmMPa)
Vi = 18
qcpmiddotvi = 61 MPa
Range qc = 10-15 MPa
(28-4bull34)
(3-12)
1 1 q = r -r- = 036 for qc = 10 MPaCp p Ip+= 027 for qc = 15 MPa
qcp = 36-405 MPa P
APPENDIX 142
Touma F and Reese L (1974)
Soil parameters pile parameters and base resistance see fig bullbullbullbull
TAB
Measured load settlement curves
Settlement s
mm
10 20 30 40 50 60 80
100 120
a 1 (mmMPa) bi(MPa) V
N3u
q =04 -N30 (cMPa) ()
1 qCp=--rpbullqC
Pile No 21 (US 59) 22 (HH) 23 (G1) 24 (BB) Notep Sp p S p p S p f Sp MPa mmMPa MPa mmMPa MPa mmMPa Mla mmMPa
131 76 169 59 075 133 100 100 269 74 325 62 131 153 1 94 103 381 79 456 66 165 182 273 11 0 488 82 581 69 1 90 21 1 349 115 581 86 694 72 2 15 233 424 118 675 89 800 75 229 262 813 98 245 327 884 113 925 130
64 56 100 95 U049 0032 0276 0048 0944 0998 0996 0981
80 gt100 30 60 32 gt 40 12 24 ()
Bergdahl (1982)
gt5 5 gt55 32 4 3
(0 18middot32) (018middot40) (0265middot12) (018middot24)
CONTACT PRESSURE p [ MPa]
0 2 4 6 8 100 N-------r---------------(us 59) ( HH) ( BBi
E E SQ-------lt+-----+--------------lt
VI
1shyz UJ
~ 100 1---------i----+----+----+------l------I -J I shyI shyUJ V)
so~----~--~-- ~--~
APPENDIX 143
us 59 fYJo 0 50 00
ff-t r-=-~c~=~-r~c_---_---l-~e-J-C~ 0 ------
CLAY
FINE SANO
J lD- 760 mm
f5m~--~--~
Pile US 59 and results from penetration test
HH IV_l() so 100 r=-=-==-==-r-~--=-=- 0 0 II 15- flf ~ II~ Ibull If t f
CLAY SAND
Sm
)
= -middotl lo - GtOmm
~ JI
SILTY SANO tOm
Pile HH and results from penetration t est
APPENDIX 14 4
61 NJO 50 --------00
11 1 =f J - 1 -- 0
CLAYSILT
E ~ Sm ltrj
SILTY SAND
q I lDmiddot 910 mrn tom
I) t bull
Pile G1 and results from penetration test
88
0 50 too ~1-e I q 111bull - Q
CLAY
SIL TY SAND 5m
]
l lDmiddot760mrn
Om
Pile BB and results from penetration test
APPENDIX 145
Klosinski B (1977)
Loading tests 50 bored piles 09-125 m diameter average Op= 11 m On t he sett l ement of rigid pla te the settlement of t he pi le base is given by
PmiddotOSp = T-K b
where Mb - equivalent deformability modu lus
1) Sand and sandy gravel of medium density
Mb = 25-50 MPa
According to Bergdahl (1979) medium sand is between
q(l) 5 MPa (Io=035)c2)
ql = 10 MPa (Io=065)C
from fig 117 rp1 = 055 for qc = 5 MPa 1Tp = 036 for qc = 10 MPa
q(l)= 0 55middot5 = 2 75 MPacp bull
q(2= 0 36middot10 = 360 MPacp
allowable p~ 1)= ~p = yen = 092 MPa and p~2) = ~ = 120 MPa
settlement of the pi l e base
5(1)= o 92 middot 1bull1 = O 0135 m = 13 5 mm p 325 middot middot
5( 2)= 1bull2bull1middot 1 = O 0088 m = 8 8 m p 350 bull bull
1) _ s _ 135 _ 14 7 (mm) a(2) _ 88 _ a 1 - p - o---92 - bull NPa bull 1 - T-7 - 733 (Wa)
2) Loose sand lo= 030-040
Mb = 12- 25 MPa
q~l) = 44 MPa q~2)= 58 MPa
1Tp = 058 and 052
q(3) = 0 58middot4 4 = 2 55 MPa middot q( 4) = 0 52middot5 8 = 3 02 MPa cp bull middot bull cp bull middot middot
allowable p~ 3)= 4i = 085 MPa p~4)= yenl = 101 MPa
s(3)_ 085-11 = 26 mmmiddot s(4)_ 101middot11 = 148 mm p - 312 p - 3 25
STATENS GEOTEKNISKA INSTITUT Swedish Geotechnical Institute S-581 01 Linkoping Tel 01311 51 00
Serien Rapport ersatter vara tidigare serier Proceedings (27 nr) Sartryck och Preliminara rapporter (60 nr) samt Meddelanden (10 nr)
The series Report supersedes the previous series Proceedings (27 Nos) Reprints and Preliminary Reports (60 Nos) and Meddelanden (10 Nos)
RAPPORT REPORT Pris kr
No Ar (Swcrs)
1 Grundvattensankning till foljd av 1977 50shytunnelsprangning P Ahlberg T Lundgren
2 Pahangskrafter pa langa betongpalar 1977 50shyL Bjerin
3 Methods for reducing undrained 1977 30shyshear strength of soft clay K V Helenelund
4 Basic behaviour of Scandinavian soft 1977 40shyclays R Larsson
5 Snabba odometerforsok 1978 25 shyR Karlsson L Viberg
6 Skredriskbedomningar med hjalp av 1978 40shyelektromagnetisk faltstyrkematning - provning av ny metod J Ingands
7 Forebyggande av sattningar i 1979 40shyledningsgravar - en forstudie U Bergdahl R Fogelstrom K - G Larsson P Liljekvist
8 Grundlaggningskostnadernas fordelning 1979 25 shyB Carlsson
9 Horisontalarmerade fyllningar pa los 1981 50 shyjord J Belfrage
RAPPORTREPORT
No
10 Tuveskredet 1977-11-30 Inlagg om skredets orsaker
11a Tuveskredet geoteknik
l1b Tuveskredet geologi
11 c Tuveskredet hydrogeologi
12 Drained behaviour of Swedish clays
R Larsson
13 Long term consolidation beneath the test fills at Vasby Sweden YCE Chang
14 Bentonittatning mot lakvatten T Lundgren L Karlqvist U Qvarfort
15 Kartering och klassificering av leromradens stabilitetsforutshysattningar L Viberg
16 Geotekniska faltundersokningar Metoder - Erfarenheter - FoU-behov E Ottosson (red)
17 Symposium on Slopes on Soft Clays
18 The Landslide at Tuve November 30 1 977 R Larsson M Jansson
19 Slantstabilitetsberakningar i lera Skall man anvanda total spanningsanalys effektivspanningsanalys eller kombinerad analys R Larsson
20 Portrycksvariationer i leror i Gateshyborgsregionen J Berntson
21 Tekniska egenskaper hos restproshydukter fran kolforbranning shyen laboratoriestudie B Moller G Nilson
Ar
1981
1981
1981
1981
1981
1982
1982
1982
1983
1982
1983
1983
1983
Pris kr (Swcrs)
50shy
50shy
40shy
50shy
100shy
60shy
80shy
60shy
190shy
75shy
60shy
150shy
65shy
RAPPORTREPORT
No Ar Pri s kr (Sw crs)
22 Bestamning av jordegenskaper med sondering - en litteraturstudie U Bergdahl U Eriksson
1983 75 shy
23 Geobildtolkn ing L Vi berg
av grova moraner 1984 70 -
24 Radon i jord -Exhal ation- vatten kvot -Arstidsvariationer - Permeabilitet A Lindmar k B Rosen
1984 75 shy
25 Geoteknisk terrangklassificering for fysisk planering L Viber g
1984 120shy
26 Large diameter bored piles in nonshycohesive soils Determination of the bearing capacity and settlement from results of static penetration tests (CPT) and standard penetration test (SPT) K Gwizdala
1984 85shy

3
P R E F A C E
The work was carried out at the Swedish Geotechnical
Institute in Linkoping during my stay in Sweden as a
scholar of the Swedish Institute
I wish to express my thanks to the Swedish Institute
for the possibility to stay and to research in Sweden
In my work and during the whole stay I have received
every possible support help and encouragement from
the Head of the Swedish Geotechnical Institute Dr Jan
Hartlen For this and for the possibility of studying
at the Swedish Geotechnical Institute I am extremely
grateful and wish to express my very best thanks
Special thanks are due to Dr Bo Berggren and Civing
Per-Evert Bengtsson for the constant and great help
given to me in the daily work at the Institute
I would like to thank all members of the staff at the
Swedish Geotechnical Institute who have helped me
during my stay in Sweden
AcKnowledgement is extended to Mrs Eva Dyrenas who typed
the manuscript a nd to Mrs Rutgerd Abrink and Mrs Irene
Aberg who made the drawings
Linkoping January 1983
Kazimierz Gwizdala
Institute of Hydro-tngineering
of the Gdansk Technical University
Poland
5
CONTENTS
Page
7SUMMARY
NOTATIONS AND SYMBOLS 9
1 LARGE DIAMETER BORED PILES IN NON-COHESIVE SOILS 11
11 Determination of bearing capacity of bored piles from results of Cone Penetration Test (CPT) 11
12 Determination of bearing capacity of the large diameter bored piles from results of the Standard Penetration Tests (SPT) 18
13 Allowable load of large diameter bored piles 22
14 Determination of settlement of large diameter bored piles based on static cone penetration tests CPT 27
15 Initial slope of pile point resistance shysettlement
REFERENCES
FIGURES
TABLES
APPENDIXES
curve 37
43
51
105
7
16 Summary
The work contains a study of the behaviour of l arge diameter
bored piles in non- cohesive soil The mai n attention was
paid to the determination of the bearin g capacity a nd
sett lement from results of Cone Penetration Test (CPT)
and Standard Penetration Test (SPT)
A new met hod to calculate bearing capacity on large bored
piles based on the in situ measurement is proposect taking
into account investigations made during the last years in
all the world The values based on the proposed method
are compar ed to field test results
The analysis of bearing capacity safety factors and loadshy
settlement curve allows to assume values individual safety
factors for resistance of pile point and shaft respectively
Based on a detailed investigation the pile point pressure
settlement curve and shaft resistance dependance during
loading a new method to predict the pile point pressure shy
displacement and load- settlement relationship is proposed
The initial slope of the point pressure- displacement curve
can be determined from in situ tests or laboratory test
based on the hyperbolic stress- strain parameters
9
Notations and symbols
Roman letters
a 1 Initial slope of the pile point resistance shysettlement curve
Ap Cross-sectional area of a pile
As Area of the pile shaft
CPT Static Penetration Test
D Diameter of pile shaft
Op Diameter of pile point
E Youngs modulus
fp Point resistance factor
fs Shaft resistance factor
F Universal safety factor
Fp Individual safety factor for ultimate resistance of pile point
Fs individual safety factor for ultimate resistance of pile shaft
K Dimensionless compression modulus
K At rest soil lateral stress coefficient0
Koc Lateral stress coefficient for fluid fresh concrete
Mo Constrained (oedometric) modulus
N30 Numbe r of blows for 030 m penetration in SPT
p Unit point resistance (contact pressure)
p (s) Unit point resistance versus settlement
Unit point resistance at failurePsf
Allowable unit point resistancePa
Sounding resistance
Average static cone penetrometer resistance close to tne pile point
qs Average static cone penetrometer resistance C along the pile
10
Ultimate point resistance of large diameter piles based on static sounding results
Ultimate skin friction resistance of large diameter piles based on static sounding results
Qa Allowable pile load
Qcp Point load of the static cone penetrometer
Qct Total load of the static cone penetrometer
Qpa Allowable point resistance of the pile
Qpu Ultimate point resistance of a pile
0 sa Allowable skin resistance of the pile
0su Ultimate bearing resistance of a pile
Qu Ultimate bearing resistance of a pile
s Settlement
sd Standard deviation
ss u Ultimate settlement for pile shaft
sv Standard variation
SPT Standard Penetration Test
t Unit shaft resistance
Ultimate unit shaft resistance
Circumference of the pile shaft
Circumference of the static penetrometer shaft
Greek letters
a Constant
B Constant
A Coefficient
microd Depth factor
v Poissonbulls ratio
v 1 Correction factor for hyperbola point resistance shysettlemen~ relationship
n Correlation coefficient
ahc Radial (horizontal stress in the concrete
ohs Radial (horizontal) stress in the soil
Ovc Vertical stress in the concrete
Ovs Vertical stress in the soil
11
1 LARGE DIAMETER BORED PILES IN NON-COHESIVE SOILS
11 peterminati on of bearing capacity of bored piles
from results of Cone Penetration Test (CPTl
The methods published in available literature up to 1976
were compiled by D Rollberg (1976 1977) It contains
totally 25 methods
- 22 use the results of static soundings (CPT)
3 use the results of standard soundings (SPT)
The failure load Qu of the pile is evaluated as the sum
of the pile point resistance Q and the pile skin reshypu sistance Qsu
(111)
Pile point resistance Q based on static soundina reshypu shysults can be expressed as
1- bull qP A ( 1 1 2)f C p
p
where
fp = point resistance factor
qP mean sounding resistance of static cone C
penetrometer in the area of the pile point
A cross-sectional area of the pilep
The pile skin resistance is expressed as
1 s -- bullq bullU middot Lih (113) fS C p
where
fs = shaft friction factor
sqc mean sounding resistance along the depth h
and skin surface area U middotLih p
1 2
The methods differ in
- the calculation of qPC
(074 to 40) Db below the pile base (Fig 11 1)
(10 to 80) Db above the pile base (Fig 1 11)
- the evaluation of the point resistance factor usually
values off gt 10 are used p
- the calculation of qsC
- the evaluation of the shaft friction factor
fs = 50-300 is applied
In Table 111 methods for determination of the bearing
capacity of bored piles are listed Rollberg 1977 The
point load the skin friction load and the ultimate total
load are evaluated for bored piles (shaft diameter D ~
03-090 m) from static sounding results in non-cohesive
soil
Calculation results based on static sounding measurements
are shown in Table 112 for pile point pile shaft and
total pile load respectively
The table shows that
- a ll methods overestimate the ultimate point resistance
- the best correlation for ultimate point resistance is
obtained with the Soviet method Trofimenkov 1974
n1 = 114
- there a re only five methods for evaluation of the ultimate
skin resistance
- all methods with exception of the Soviet norm Trofimenkov
1969 method overestimate the ultimate shaft resistance
- the Norwegian method Senneset 1974 gives the best
correlation for the ultimate shaft resistance =119n 2
- with exception of the Soviet methods the total ultimate
load is on the average overestimated by all methods
1 3
Taking into account the above results the Soviet and
the Norwegi an methods are presented below
The Soviet method JG TrofimenkgtV 1974
1 qP bullA + qsbullA (114a)Qu = Qpu+Qsu fp C p f C s s
where
11 40 DP 12 1 0 D p h+l1 qp r dhqcC l1+l2 h-12
0ct-0ceqs C u middoth s
f(qp) -+ see Fig 1 bull 1 2 fp C
f f ( qcs) -+ see Fig 1 1 3 s
The Norwegian methon K Senneset 1974
1 p A 1 s bullA ( 1 bull 1 bull 4b)-f-middotqcmiddot p + -f-q s p S C
where
11 30 D p
12 50 D p h+l11 f dhqP l1+l 2 qc
C h-12 h s 1
= f dhqc qch 0
f 20 p
f = f (q~ ) + see Fig 114 s
Note a ) The total skin friction -f-middotq~ is assumed to be
no less than 10 kPa even~ith a very little
cone penetrometer resistance
b) The poin t resistance -f-middotq~ is assumed to be
maximum 10 MPa even iJl case of very dense sand
14
It must be underlined that the best correlation for
the pile point is obtained with the Soviet method
101 for 94 driven piles in non-cohesive soil
- 172 114 for 46 bored piles in non-cohesive soil
Trofimenkov 19731974 showed the results of comparison
of the ultimate loads determined by formula (114a)
Q~ and by pile load tests Q~ for 153 driven friction
piles at the 57 various sites see Fig 115
In Germany a lot of investigations were made before
establishing the DIN 4014 part 2 (1977) on large diameter
piles
In Table 113 and 114 the results from these investigashy
tions are generalized
The data in the tables were obtained from 35 test loadings
(4 of which were published by Franke 1973 The diameter
of the piles was from 08 to 25 m the length from 5 m
to 34 m and the cone penetrometer resistance varied from
10 MPa to 15 MPa
Bustamente and Gianeselli 1982 proposed a prediction
of the pile bearing capacity by means of the static
penetrometer Their proposal was based on the intershy
pretation of a series of 197 full scale static loading
tests In this paper the results from tests of 55 bored
piles are chosen The diameter of the piles varies from
042 m to 150 m and the length from 6 m to 44 m The
equivalent cone resistance was determined as showed in
Fig 116 The authors have noticed that the point
resistance factor f depends on the nature of the soil p and its compactness but also on the different pile placeshy
ment techniques (see Tab 115)
Piles of category group I
- Plain bored piles - Cased bored piles
- Mud bored piles - Hollow auger bored piles
- Type I micropiles - Piers (grouted under low - Barrettespressure)
15
In Tab 116 values of the shaft resistance factor
fs are given
Category IA
- Plain bored piles - Mud bored piles
- Hollow auger bored piles - Cast screwed piles
- Type I micropiles - Piers
- Barrettes
Category IB
- Cased bored piles - Driven cast piles (concrete or metal shaft)
Category IIA
- Driven precast piles - Prestressed tubular piles
- Jacked concrete piles
Category IIB
- Driven metal piles - Jacked metal piles
It can be noted that the values in Tab 116 are in
genera l of the same range for the driven and the
bored piles
According to the Polish Specification 1979 the point
and shaft resistance factor are given by
1-f- = kmiddota
p p
where
ap 035 for sand
k coefficent of unhomogeneity k qcp min
qcp
= 0065 for sandfrac12
1
16
Similar results can be observed in Fig 116a and
Fig 116b It was showed by Kerisel (1965) and Franke
(1973) that the harder soil the more loosening at
excavation and thus relatively smaller bearing capacity
Taking into account the Franke diagrams we will have
for D = 125mand settlements= 2 cm p
Cone resistance qc (MPa) 1 5 50 1 0 15 22
qc p for s=2 cm 3 6 8 12 14
(see Fia 1 1 6b )
taking safety factor for pile base F = 3 the point resis~ance
33-10 ~-05
380375 lo 212 bull lo 2114 bull
factors- shy are p
The above anal ysis shows that it is possible to determine
ultimate point and shaft resistance of bored piles from
static cone sounding But it is very important and must
be taken into account type of pile kind of soil and
degree of compaction
Bel ow calculation method for large diameter bored piles
based on the static cone penetrometer resistance (CPT)
is proposed Equation (117) can be used directly for
the base diameter D lt 15 m For larger diameters p shyD gt 15 m the values should be multiplied by the
p ff t ITscoe icen Y~ as pi
( 1 1 5 )
where
qcp = according to equation (117)
D = diameter of the pile base D gt 15 mpi pi
17
This value q~p should be put into equation 116
The value qc s in equation 118 is independent on the
pile diameter
Proposed calculation method
(116)
where)
1 1 40 ~ 11 3 for piles wit h a nd enlarged bases12 10 12 = ~
h+h
q (h) dh (117)qcp l1+l2 f -f- Ch-li p
h 1 f 1
qcs = o -f- qc (h) dh (118)h s
1 -f- = f(q kind of soil ) -+- see Fig 11 7 and Tab 1 1 7
C p
f (q kind of soil ) -+- see Fig 1 1 8 and Tab 1 1 8 fs C
Note
a) the point resistance q for qc gt 20 MPa is assumed cp to be maximum as
- Gravel 70 MPa - Coarse sand medium sand 55 MPa - Fine sand s il ty sand 40 MPa
b ) The shaft resistance qcs for qc gt 20 MPa is assumed to
be maximum as
- Gravel 110 kPa - Coarse sand medium sand 90 kPa - Fine sand s ilty sand 70 kPa
These proposed values are compared with results by
Bustamente (1 982) and the Polish Specification (1978)
Fig 11 9 and F i g 1110 A similar comparison for DIN
4014 1 977 is shown in Fig 1111 and Fig 1112
) In this paper was used the above values 1 1 and l z But it can be used in practice 11 =30 D and h =2Dp respectively The results shall be very simi l ar to the above onPs
18
The proposed method has been examined with field test
results This is shown in Fig 1113 to Fig 1128
and Appendix 1 11 to 1110 and Tab 119
The comparison shows that the value of q in equationcp (117) corresponds to the settlement -10 of the base
diameter (s=010 DP) see Fig 1113 and Tab 119
(average sDp=88 and standard deviation sd=3)
Later in this paper the allowable load and dependence of
the load versus settlement will be determined
12 Determination of bearing capacity of the large
diameter bored piles from results of the Standard
Penetration Tests (SPT)
There are little published on pile tests coupled with
results from Standard Penetration Test (SPT) Among the
authors who have published material in the subject are
- Meyerhof 1956 1976
- Senneset 1974 (Norwegian method)
- Rodin Corbett Sherwood Thorburn 1974 (English method)
- Polish Specification 1975
- Weltman Healy 197 8
- Reese 1978
- Japanese Society 1981
- Decourt 1978 1982
The Norwegian method is valid o nly for concrete andor
wooden piles the English method only for gravel It is
very important to underline that the Norwegian a nd the
English methods use of the SPT resul ts intermediate by
the static cone penetrometer resistance (q ) as well C
Below methods are presented that are using the results of
SPT directly Meyerhof s method in total can also be used
on driven piles in non-cohesive soil Although we could
have found some proposes for bored piles Eqs (121 and
122) see Fig 121 and Fig 1 22 as well
19
Ultimate point resistance (psf)
12 N 3 omiddotH lt 120 N 30
(kPa) (1 2 1)Psf D
where
N30 the average standard penetration resistance
in blows per 03 m
H depth in bearing stratum
Ultimate skin friction tu
for bored piles tu N~ o (kPa) (1 22a)
for driven pil estu 2N30 (kPa) (1 2 2b)
where
N30 the average standard penetration resistance
in blows per 03 m within embedded length
of pile
Weltman and Healy (1978) taking into account Meherhofs
proposition for driven piles have introduced two coefshy
ficents for bored piles in gravels (glacial soil) Equ
123 and Fig 1 23
t = a 2 N30 (kPa ) (1 2 3)U 1
where
ai a 1 for impermeable gravels see Fig 123a
ai a 2 for permeable gravels see Fig 123b
The Polish Specification ( Specification for Design and
Construction of Large Diameter Bored Piles in Bridges
1975 Ministry of Transport) gives the ultimat e point
resistance in dependence of N30 base diameter and depth
see Tab 12 1 The Tab 121 contains values for coarse
and medium sand For other non-cohesive soils the following
coefficients are proposed
p f = S bull p f (medium sand) ( 1 2 4)S 1 S
20
where
S1 1 20 for grave lSi
f 132 080 for fine sand
13 3 070 for silty sand13i
In Fig 124 values of psf are shown for h = 10 m DP
06 m DP= 15 m and h = 20 m DP= 06 m DP 1 5 m
respectively
A few of the instrumented piles were tested and analyzed
by Wright and Reese (1979) The ultimate point and shaft
resistance in the fine and silty sand as a function of
blow count from SPT is shown in Fig 125 Results from
two additional tests reported by Koizumi (1971) are also
introduced in the figure The ultimate point resistance
is assumed to exist at a settlement equal to 5 of the
base diameter
Methods of prediction of the bearing capacity of piles
based exclusively on N30 values were presented by Decourt
1982 Below a proposition for high capacity piles excavated
and cast under bentoni te is presented
The ultimate skin friction is determined by the expression
(see Fig 126)
t = 33 N30 + 1 0 (kPa) ( 1 bull 2 5 ) u
where
N30 average value of N30 along the shaft
- for N30 lt 3 must be taken as = 3N30 - for N3o gt 5 0 must be taken as NJo= 50
The allowable point resistance can be obtained in a n
expedite way as
Psa = 33 N30 (kPa) (1 2 6)
where
N30 = average of Nat point level one metre above
and one metre below
Psa allowable point resistance
21
Decourt proposed a safety factor for the point of F = p
40 Therefore the ultimate point resistance can be
determined by the expression
(kPa) (1 2 7)
In Fig 12 7 and Fig 1 28 the above values for base
and skin friction resistance are compared respectively
Taking into account the type of soil thereis a good
correlation for ultimate point resistance The result for
ultimate skin friction is scattered but only apparently
The values for large diameter bored piles are between
the line 1a and 1b in Fig 128 Large diameter piles
have a high ultimate skin friction in relation to driven
piles (see points for bored piles in Fig 122 and DIN
4014 Part 2 1977 as well) The high values for piles
excavated and cast under bentonite have had a strong base
on the load tests (Decourt 1978 1982 and Wright and
Reese 1979)
Below the proposals are given for determination of the
values of the ultimate point resistance and the ultimate
skin friction Eqs 128 to 1214 and Fig129 1210
The ultimate point resistance
- gravel psf = 140 N30 (kPa) ( 1 bull 2 8)
for N~ 0 gt 50 blows3O cm Psf 7 MPa
- coarse sand and medium sand
(kPa) ( 1 2 9)
for N30 gt 50 blows3O cm Psf 55 MPa
- fine sand and silty sand
psf = 80 Nio (kPa ) (1210)
for N30 gt 50 blows3O cm p f = 40 MPa 5
where N3 o the average of N value near the point level as
22
h+l1
f N3o(h)dh ( 1 2 11 ) h-12
3DP see Fig 1 1 1 D
p
The ultimate skin friction for coarse sand and medium sand
tu = 1 8 N 3 o (kPa) (1212)
t (kPa) (excavated and cast (1213)u under bentonite)
where
N30= the average value of N along the shaft as h
N -
3 o = h1 f N 3 o ( h) dh ( 1 bull 2 bull 1 4 ) 0
The ultimate skin friction for N30 gt 50 blows30 cm is
assumed to be maximum as tu = 90 kPa and t = 150 kPa u
13 Allowable load of large diameter bored piles
The allowable load Qa of large diameter piles has been
expressed as
OuQa ( 1 3 1)Ft
Qa Q(s)=Qb(s) + Os(s) ( 1 3 2)
Opu + Osu (1 3 3)Qa Fp Fs
Qr lt mmiddotQf ( 1 bull 3 4)-
= universal safety factor
individual safety factor for ultimate resistance of the pile point
individual safety factor for ultimate resistance of the pile shaft
= load according to the allowable settlement
calculated load
m coefficient
calculated ultimate bearing load of the pile
23
The equations from (131) to (134) are used as
1) equation (131)
a) DIN 4014 - 1977 Ft= 2 175 15 (depending on the kind of load)
b) Polish Specification 1975 Ft = 18 16 ( -- )
1c) Trofimenkov 1974 Ft = 14307
2) equation (132)
a) DIN 4014-1977 i Q(s) = Qb(s) + Q (s) = A middotp(s) + E tAsmiddott(s)
s p 0
where Qbs) and Qs(s) are described in Fig 1423
3) equation (133)
a) Polish Specification 1974
F 25 22 depending on the kind of load p
F 1 bull 0 s
b) Wright SJ Reese LC 1979
The ultimate capacity or resistance is considered as a
random value and represented by a frequency distribution
The distribution can be described by a mean value and a
variance The distribution of the load applied to the
foundation can be described similarly The coefshy
ficients used to factor resistance and loads are called
partial safety factors Some recommended partial safety
factors for resistance under normal conditions of design
and construction are given in Tab 131 Normal control
is defined as a condition where the coefficient of variation
is less than about 035
Typical values for partial safety factors for loads are
in the range 1 to 2 depending on the type of load and
how it is applied The overall factor of safety Ft can
then be calculated from the equation
Ft = y RbullY S
24
where
YR the par tial sa f ety fac t or for resistance and
Ys the partial safety factor fo r load
The probability of fa i lur e of the foundation can be r eshy
lat ed to the factor of safety for a parti cular degree of
uncert ainty (see Tab 13 2)
c ) Tejchman Gwizdala 1979
The authors discuss adequate safety factors based on fie l d
test s by Spang (1 972) Franke (1976) Touma and Reese (1974)
Colombo (1971) Kerisel and Simons (1962) Appendirno (1973)
see Tab 1 33 Taking into account the universal safety
factor Ft= 2 0 for the tota l load settlement curves it
was estimated
i) F in the range of 111 to 237 with the average value s F = 166 and standard deviation sd = 034 s (see column 16 Tab 133)
ii) Fb in the range of 161 to 945 with the average
value Fb = 387 and standard deviation sd = 2 15
For model core d piles in laboratory conditions values of
Fs = 108 to 154 (average Fs = 132 s~ = 019) and
values of F = 280 to 5 94 (average F = 3 55 sd = 1 07)p p
see Tab 1 3 4
As a conclusion it was assumed that Fb = 40 and F 1 5 s
for l arge diameter bored piles
The investi gation has shown that for the above safety
factors settlements of piles under permissibl e loads are
10 to 20 mm There was assumed a maximum load on large
diameter piles corresponding to a settlement of 010
diameter of the piles
25
d) Bustamente Gianeselli 1 982
e) 0ecourt 1982
The safety factor is given by
F = FgmiddotFfmiddotFamiddotFw where
F 11 - skin friction g F 135 - point bearing capacity
g
Ff safety factor related to the formulation adapted
Ff= 10 for Decourts method
Fd safety factor related to excessive deformation
Fd = 10 for skin friction
As for the point Fa= 2 to 3 depending on the
pile diameter For usual cases 25 is suggested
Fw safety factor related to working load
Decourt recommends 12
Thus we will have
- for skin friction
Fs = 11bull10middot10middot12 132 - 13
- for the point
F = 135bull10bull25middot 1 2 = 405 = 40 p
4) equation (134)
a ) Polish Code 1983
Q lt mbullN r shy
where
total load coefficient (depending on the kind of load For foundation we can assume Yf = 12 )= code load
correction coeffic i ent
09 for pile foundations
m 08 for two piles
m 07 for single pile
26
N ymmiddotQu
ym material (soil) coefficient
ym 08 to 09 (Polish Code 1981)
Thus we will have
QnmiddotYf lt mmiddotym middotQu-
Yf9uFt = On m bull Ym
1 2 max = 2 14Ft 0 7 bull 0 8
1 2min = 1 48Ft 0909
The above analysis has shown different ways to determine
the allowable load The analysis is in direct connection
with mobilization of the load (versus settlement) The
dependence of total load point resistance and shaft reshy
sistance will be discussed in detail in Chapter 14
In the authors opinion taking into account the above
analysis the allowable load should be determined based
on the equation 133 ie based on individual safety
factors for ultimate point and shaft resistance Proposed
values of F and F in literature are shown in Tab 135 s p The average values are Fs = 145 and Fp = 3 38 respectively
Taking into account that the bearing capacity is determined
based on the results from sounding measurements direct from
a place near the piling without a ny indirect correlation
the allowable load of large diameter bored piles is given
by the equation (133a)
( 1 3 3a)
where F = 30 and F 13 are proposedp s
27
14 Determination of settlement of larqe diameter bored
piles based on static cone penetration tests CPT
Determination of ultimate point and skin friction resistance
based on static cone penetration tests has been discussed
in Chapter 11 above Based on the results of this calcushy
lation and on Chapter 13 we can establish an approximate
relation between point resistance shaft resistance and
total load on one hand and settlement on the other However
the approximation gives a wide scatter especially for base
resistance as can be observed in Fig 141 to Fig 144
Only the first part of the point resistance - settlement
curves are in good agreement with measured values It can
be observed in Fig 145 that the average correlation
coefficient n = 098 and standard deviation sd= 029
This way of calculation can be used only for rough calcushy
lation (see Chapter 13)
In Chapter 11 also measured point resistance - settlement
curves were shown The base resistance increases gradually
with increasing pressure and settlement Below the cur7
vature of the point resistance - settl ement curve will be
examined It is assumed that this curve can be described
as a part of the hyperbola curve Thus if the ratio of
the measured settlement (s ) to the point resistance (p)
is plotted against the measured settlement the result
will fall closely to a straight line with the equation
( 1 4 1)
where a 1 and b 1 are constants (see Fig 1 46a and Fig
14 6b)
Then the point resistance - settlement realtionship can be
expressed as a hyperbola
s p = ( 1 bull 4 2)
The constant is the initial s lope of the point resistanceshya 1
settlement curve ie a 1 = t~a The inverse of the constant
28
b 1 is the vertical tangent (asymptote) to the curve 1ie for s = 00
bf= ~ If the ultimate point reshy1
sistance psf is equal to bf (psf=bf) the whole point
resistance settlement curve will be a hyperbola type
Now the Eq 1 4 2 can be written as
s s ( 1 4 3)a) p s or b) p = a+__sect_a1 + 1 Psfbf
If the ultimate point resistance is smaller than bf only
a part of the hyperbola curve ought to be considered
Further the Eq 14 3 will be written as
p ( 1 4 4)
where
poundf_ correction factor for hyperbola point Psf resistance-settlement relationship
Taking into account the discussion in Chapter 11 the
ultimate point resistance psf = qcp based on the CPT measurements
Therefore the relationship between the point resistance
the sett l ement and the CPT result can be expressed as
s p (1 4 5)s
The correction coefficient v 1 will cause a change of the
position of the vertical asymptote bf in r elation to the
ultimate point resistance q bull This means that we take cp into account a different part of the hyperbola curve for
the description of the point resistance-settlement relationshy
ship
Now if we want to use the equation (145) in practice
we must determine the constant and the coefficienta 1 v 1 (assumed that q is determined ear l ier Chapter 11)cp
29
The constant a 1 and t h e coefficient Vi have been detershy
mined based on fi e ld tests according to pi l es No 1 - 20
see Tab 14 1 and Tab 1 1 9 as wel l The values of
a 1 versus the point diameter D and the ul timate pointp
resistance respectively are shown in F i g 147 and Fig
148 Fig 1 47 shows that a 1 is independent of the
point diameter D Based on Fig 148 it can be assumed p
that
28-4bullq (1 4 6)cp
This correlation has been examined with data of the
literature see Fig 1 49 and Appendix 141 to 1 45
(Note there were no static penetration tests and qcp was determined based on a correlation made by Bergdahl
(1982))
A good correlation with equation 146 can be seen taking
into account the safety factor in the DIN 4014 Part 2
(1977) bull
The correction factor v 1 versus the poi nt diameter is shown
in Fig 1410 I t is assumed that the correlation is
V1 = 3 0 - D ( 1 4 7)p
where D is in m p
The above equations ie 146 and 147 were assumed for
a later analyses see Fig 14 11 and Fig 1412 The
piles No 1 to 20 were examined taking into account Eqs
14 5 14 6 and 1 4 7 The result of this cal cul ation is
presented in Fig 1 413 to Fig 1 4 18 and in Tab 1 4 2
respectively In Fig 1413 the calculation way for pile
No 2 is shown as an example
In Fig 1414 to Fig 1 417 measured and calculated
values of the point resistance versus settl ement can be
compared In tota l good correlation exists for all the
30
pressure-settlement curves Values of q from static cp
cone penetration tests and generalized values of anda 1
v 1 were considered Only for piles No 17-20 qcp was
assumed as the point resistance for s = 010 D because p
the static penetration test results were inaccessible
The similar comparison is shown in Fig 1417a for piles
in sand based on experimental results (Tuoma Reese 1972
and Wright Reese 1979) where the ultimate case resistance
was assumed as the resistance at a base settlement of 005
D The relative base resistance is the mobilized base p resistance divided by the ultinate base resistance The
curvature of the proposed point resistance settlement shy
curve to mean value proposed by Wright and Reese is excellent
However the constant a 1 and the coefficient v 1 were
determined for sand only In the future they should be
examined especially for gravel and silty sand based on
field tests Until then in the authors opinion the
values of v 1 can be chosen from Eq 147 for all nonshy
cohesive soils But for a 1 there is proposed
at = gt bulla (1 4 8)1
where
gt- 1 = 080 for gravel
gt 2 120 for silty sand
This proposal is shown in Fig 14 11 as dashed lines
A good correlation can be seen with the investigation by I
Kiosimiddotnski for sandy gravel and on the safety side with
the investigation by Tuoma and Reese for silty sand (see
Fig 149)
In Fig 1418 all calcul ations for pile No 1 to 20 are
summarize d The correlation coefficient n is defined as
the calculated point resistance p(s) divided by measured
point resistance p(s) For totally 126 points from 20
curves an average of n = 098 with standard deviation
31
al= 023 was obtained see Fig 1418 A similar result
can be observed for the range usually assumed of the
allowable settlement for sinqle large diameter bored
piles as
for
- for
- for
s
s
s =
10
20
30
mm a
mm
mm
verage n10 II
II
mm 089
095
099
and sd =
and sd
and sd
031
027
026
It can be questioned whether the sonstant a 1 can be deshy
termined in different ways The constant a 1 is the initial
slope of the point resistance-settlement curve as menshy
tioned above Then we can use all methods for determination
of settlement of a pile point The range of validity of
these methods then must be determined This will be shown
later
In order to be able to design the total load settlement
curve the skin friction resistance-settlement relationshy
ship must be determined The ultimate skin resistance of
large diameter bored piles was determined in Chapter 11
(based on static penetration tests) and in Chapter 12
(based on standard penetration tests)
In the past a lot of field tests have been done on the
mobilization of the shaft resistance versus pile settleshy
ment In this subject there is a rather good agreement
in the whole investigation for cohesive and non-cohesive
soil
Some results and opinions on thispresented in the literashy
ture during the last few years are shown below
Ultimate shaft resistance versus settlement
1) BurlandJB Butler FG Duncan P (1969)
-The shaft l oadsettlement curve is derived using a=0 3
with 90 ultimate load being mobilized at 025 in
settlement(~65 mm)
- soil London clay
- see Fig 1 419
32
2) Touma FT Reese LC (1974)
- The failure of the sides of the shaft takes place
at a downward movement of about 04 in (10 mm)
- soil sand
- see Fig 1420
3) Tomlinson HJ (1977)
- The maximum shaft resistance is mobilized at a
settlement of only 10 mm (or j in)
- soil stiff clay
- see Fig 1421
4) Klosinski B ( 1977)
- It was assumed that skin friction increased proshy
portionally to pile settlement up to the limit value
s bull This value depends on soil conditions and pile0 diameter and is usually from 3 to 8 mm For soft
compressible soil it may be grater than 10 mm
- soil cohesive soils
- see Fig 1422
5) Franke E Garbrecht D (1977)
- At settlement of 2 to 3 cm which are normally
allowed in Germany under working loads for buildings
not very sensitive to differential settlementsthe
skin friction is almost always fully mobilized
- soil sand
6) DIN 4014 part 2 (1977) and Franke E (1981)
- The skin friction Tm is approximated as diameter
independent having failure settlements of smf = 2 cm
in sand and 1 cm in clay
- soil sand and clay
- see Fig 1423
33
7) Reese By L (1978) Reese By L Wright SJ (1979)
(1978) The maximum skin friction being developed at
an average downward movement ranging from about 05shy
2 of the shaft diameter The average of six load tests
reported by Whitaker and Cooke (1966) are a lso plotted
for comparison
- soil stiff clays
- see Fig 1424 and Fig 1425a
(1979) The relative settlement is the average settleshy
ment of the butt and base devided by the shaft diameter
The mean curve maximises at a relative settlement of
about 002 D
- soil sand and clay
- see Fig 1425b
8) Tejchman A Gwizda3a K (1979)
- A clear differentiation of the distribution of shaft
and base resistances is observed for changing settleshy
ment For fairly small settlements the shaft resist shy
ance increases quite fast and the ultimate values
are reached soon while the base resistance increases
gradually with increasing loads and settlements withshy
out clearout ultimate values it can be assumed that
complete mobilization of shaft resistance corresponds
to settlements equal to 001 or 002 diameter of pile
- soil cohesive and non-cohesive soils
- see Tab 131 and Fig 1 426
9) Promboon S Brenner R P (1981)
- Load distribution and load transfer curves disclose
that most of the load is carried by shaft friction
which is developed at small displacements in the order
of 10 mm
- soil Bangkok clay
- see Fig 1427
34
10) Prodinger w Veder Ch (1981)
- The maximum value of skin friction resistance
occurred for a total settlement of 12 mm
- soil silty clay and sand
- see Fig 1428
11) Farr JS Aurora RP (1981)
- Ultimate load transfer was recehed (or nearly reached)
at a relative settlement of about 04 in (10 mm)
- soil gravelly sand
- see Fig 1429
12) Decourt (1982)
The skin friction resistance is totally mobilized
with deformations of about 10 mm or at the most 15
mm regardless of shaft dimensions This observation
of ours seems to clash with the opinions of other
authors who seek to relate the deformation necessary
for full skin friction mobilization with the shaft
diameter
- soil cohesive and non-cohesive soil
In Tab 143 all these results are shown Depending on
the kind of soil the following v a lue s of ultimate settleshy
ment for shaft can be assumed
- averages 142 mm (sd 5 3 mm) for sand
- averages 100 mm (sd = 21 mm) for cohesive soil
averages 726 mm (sd 67 mm) for claysand
It can be observed (see Fig 1419 to 1428) that the
shaft friction resistance increases proportionally to
the pile settlement up to the above limit value and
thereafter becomes constant
35
Taking into account what was mentioned earlier on point
resistance settlement relationship and the above results
a relationship between total load point resistance and
shaft resistance on one hand and settlement on the other
can be made see Fig 1430
It is assumed on the safety side that the following
ultimate settlement (S~) exists for the shaft resistance
of large diameter bored piles
SS1 ) 200 mm for non-cohesive soil u SS2) = 100 mm for cohesive soil u SS3) 15 0 mm for claysandu
In Fig 1 430 the curve Q (s) is calculated based on p
the equation 14 5 or 144
The values of psf in equation 144 can be calculated
based on other methods as well
The total load-settlement relationship is obtained by
summing up point and s haft resistance as
Q (s) = Q (s) + Q (s) (149)s p
for each point
Now the allowable load can be determined from equation
133a and versus the allowabl e settlement as
Q (s) = Q (s) + Q (s) (1410)s p
where s lt Sa
Sa= the allowable settlement of the pile
The analysis allows determination of the approximative
load settlement dependence without calculating the settleshy
ment for non-cohesive soil In Fig 1431 it is shown
36
In Tab 144 the settlement for allowable point reshy
sistance q5P according to equation 133a is shown
as well The average settlements= 198 mm (sd=78 mm)
is obtained This value is similar to the assumed ultimate
settlement of shaft for non-cohesive soil The ultimate
settlement for point resistance is assumed s = 010 Dp as mentioned earlier
37
15 Initial slope of pile point resistance shy
settlement curve
Settlement of piles and pile foundations can be cal culated
based on
- empirical correlations
load-transfer methods using measured relationships
between pile resistance and pile movement at various
points along the pile
- theory of elasticity that employs the equations of
Mindlin for subsurface loading within a semi-infinite
mass
- numerical methods and in particular the finite element
method
- use of in-situ tests (Cone Penetration Test Standard
Penetration Test Pressuremeter Test)
The critical slope of the pile point resistance-settlement
curve is important for calculation in chapter 14 The
constant a1 can be determined from all the above mentioned
methods
Comparison is made to Berggrens and Schmertmanns methods
below (see Berggren 1981 as well)
6sIn Tab 151 (No 1 2 3) the values of a 1 =~p for s =
10 mm and s = 20 mm (measured for large diameter bored
piles No 1 to 24) are compared to the calculated values
according to the modified hyperbola method (see Fig 14 6)
It can be seen that these calculated values are between
s = 1U-2u mm but rather closer the measured values for
the settlements= 10 mm see correlation coefficient n 6
and n 7 in Tab 151 respectively The average correlat i on
coefficent for the settlements= 10 mm is n9 = 108 and
the standard deviation is sct = 014 The comparison to
Berggrens and Schmertmanns methods for s = 20 mm ( see
Berggren 1~81 and Tab 151 as well) shows that the
results based om these methods give too high values of a 1 bull
38
The average values are ne= 143 sd = OJ3 and ng= 137
sd = 037 for Berggrens and Schmertmanns methods
respectively A bit better agreement can be observed
for Schmertmanns method
Taking into account the results in Tab 151 ana Tab
15l it must be assumed that for the determination of
a 1 the pile point contact pressure p(a1) should be
assumed as the ultimate point bearing capacity devided
by about 4
p(ai) - ( 1 bull 5 1 )
Most of the methods for determination of settlement are
based on the theory of elasticity The settlement ot the
pile point can be expressed as the average settlement of
a rigid circular foundation from the equation
11-Dp 1-v 2
s = p -4- -E-bull microd (1 ~ 2 J
where
p pile point contact pressure
E Youngs modulus
D diameter ot pile pointp ) = Poissons ratio
microd = depth factor
The range of validity of the pile point contact pressure
was determined in equation 151 Youngs modulus has an
important meaning lt can be determined from triaxial
tests or oedometer tests The relationship between the
constrained (oedometric) modulus Mo and Young s modulus
Eis dependent on Poissons ratio v as expressed by the
equation
E = l 1 + V ) ( 1 - 2 V ) Mo ( 1 bull 1 bull 1)- 1-v
39
TaKing into account the analyses made ny Chaplin (19b1a
1 961bJ Janbu (1 963 1970 1973J Andreassen (1973)
Duncan and Cheng (1970) Tejchman anct Gwizdala (1979)
Gwizdala (1978) Franke (1981) Berggren (1981) Withiam
and Kulhawy (7981) and the present investigation the
calculation of settlement is proposed to be
s = 24 bull p bull ~ D bull 1-v 2 bull micro d (154)Do o E
where s (r1)
p (kPa)
Dp (m)
E (kPa)
D0 =10 m
micro = 05 + 01 vfrac34E (1 5 5)d vs
but 05 lt microd lt 10-tip= p - (J (ovs see Fig 151)vs
E =Et= Kbullpat (Oo )n [1- Rf(1-sinltj) 101 - 03 ) 12 (1 5 6)2 c cosltP + 2o 3 sinltP 1Pat
in which K n and Rf= hyperbolic stress-strain parameters
Pa= atmosferic pressure ando 1 o 3 and o0 are determined by
averaging the concrete and soil vertical and radial stresses
near the pile point according to Fig 151 Then the
stresses at the pile point level are h
(J vs = L
0 Yi h
l vertical stress in the soil
0 hs Ko h
0 vs radial (horizontal) stress in the soil
0 vc L ye h -l
vertical stress in the concrete 0
0 hc K oc a vc radial (horizontal)
concrete stress in the
40
K at rest soil lateral stress coefficient 0
K c lateral stress coefficient for fluid fresh concrete0
K 1 0 oc
and average values
a 05(a +a)V vc vs
1 1 - shy~ = -(a +a+a I = -3 (av+2ahJ the applied mean normal stress0 j Z X y
Assuming this model calculation results for piles No 1-24
(see Tab 11~ as well) are shown in Tab 153
The piles are embedded mainly in medium sand to fine sand
For this kind of soil it can be assumed (soil parameters
from field or laboratory tests were inaccessible)
~ = 35deg c = 0 R~ = 09 n 05 v = 025 K c 10l 0
K = 04 Pat= 1UO kPa ye 24 kNrn 3 y = 14 kNm 3 bull0 C
Moreover in Tab 153 the following symbols are used
p(a1 ) - pile point contact pressure according to equation
1 bull 5 1
s(a1) - settl ement of pi l e point according to equation
143 and Tab 141
pound TT ( 2E = s bull Dp bull i 1-v ) according to equa~ion 152t
E~ Et bull microltl
EI
K = ro~ - according to equation 1 bull 5 6 p bullO middotA2
a~ o
E = E voD middot D middot ~4 ( 1 - v 2 ) according to equationt S p O 0
1 5 4
Et= E microd
K = according to equation 156 V PatmiddotaomiddotA2
41
The calculation results of Youngs modulus E = Et and
dimensionless canpressionrro1ulus for piles to 1-24 are shown
in Fig 152 to 155 using equation 152 and 15b
or equation 1~4 and 156 respectively lt can be obshy
served that the scatter in Fig 153 and Fig 155
where the influence of tne pile diameter is reduced
compare equation 154 is less than in the other figures
The reduced influence was made after observations from
field and laboratory tests while the equation 152 is
taken direct from theory of elasticity These values of
E and K are in good correlation with published values in
literature The values of Youngs modulus versus the
relative density of soil are compared to literature values
see Fig 15b Based on the analysis in this chapter it
can be assumed that
E = 9-ql 3 ( 1 bull 5 7)cp
where qcp is in accordance with equation 117
The calculation results based on this proposal are incluced
in Tab 1 5 3
The c a lculate d s e ttlements based on e q ua tion 154 and
157 are shown in column 23 and the values of the
correlation coef f icie nt (n= Seal ) in column 24 respectshyimeas
ively
The dimensionless canpression modulus can be d e termined as
K = 15Ubullq (qcp in MPa) (1 5 8)cp
see column 25 Tab 153
The calculation results based on the K compression modulus
according to equation 158 156 and 1 5 4 are shown in
columns 25 26 2 7 28 and 29 in Tab 153
42
For comparison and for determination of the range of
validity of this method the caLculation results of
pile point pressure for settlements s = 10 mm s = 20 mm
s = 30 mm (see Tab 141) according to equation 157
and 154 are shown in columns 30 to 35
The results obtained in Tab 153 confirm the possibility
to use the proposed method to calculate the initial part
of the pile point resistance settlement curve of large
diameter bored piles in non-cohesive soil and the initial
slope of this curve as well
A simple model has been proposed based on the theory of
elasticity ana the tangent modulus defined by Janbu (1963)
and Duncan amp Chang (1970)
A new approach according to the pile diameter depth factor
and principal stress is proposed
The settlement of the pile point can be made up to a point
pressure according to equation 151 on up to a settlement
of about s ~ 20 mm (30 mm)
-- The application of v Op in equation 1 5 4 a llows us ing
Youngs modulus as independent of the pile diameter
opposed to Bazants a nd Mosopusts (1981) proposal where
Youngs modulus wa s determined versus the pile diameter
The equation 1 5 6 takes into account the dependence of
Youngs modulus on depth (or overburden pressure) as
well
In the method field test (Cone Penetration Test) or
laboratory tests (hyperbolic stress-strain parameters
can be used
Comparison of the method to 24 availa ble load test r e sults
or large diameter bored piles in sand shows good a greement
to calculated and measured values
43
REFERE~CES
Adamczyk J (1978) Okreslanie udzwigu pali wierconych
za pomoca sondy statycznej (Bearing capacity of bored
piles based on the static sounding) Inz i Bud No 7
pp 253-257
Andreasson L (1973) The compressibility of cohesionless
soils Thesis Chalmers University of Technology
G6teborg (in Swedish)
Appendino M (1973) Comportamento di un palo di grande
diametro strumentato Rivista Italiano di Geotechnica
No 3 pp 115-118
Butterfield R Banerjee P (1971) A rigid disc embedded
in an elastic half space Geotechnical Engineering
Vol 2 pp 35-49
Bozant z Mosopust J (1981) Drilled pier design based
on load settlement curve X ICSMFE Stockholm Vol 2
pp 615-619
Begemann HK (1982) Cone penetration tests pile bearing
capacity and the thesis of Rollberg Proc of the Second
European Symposium on Penetration Testing Amsterdam
pp 433-438
Berggren B (1981) Bored piles on non-cohesive soils shy
settlement and bearing capacity (in Sweden) Thesis
Department of Geotechnical Engineering Chalmers
University of Technology G6teborg
Bergdahl UB (1979 1982) Sonderingen und in situ Messungen
Wien 18-19 Juni 1979 - Private information 19821983
Bustamante M Giane selli L(1982) Pile bearing capacity
prediction by means of static penetrometer CPT Proc
of the Second Europ Symp on PenTest Amsterdam
Vol 2 pp 493-500
Chaplin TK (1961a) An experimental study of the settleshy
ment of footings in sand PhD Thesis Univ of
Birmingham
44
Chaplin TK (1961b) Compressibility of sands and settleshy
ments of model footings and piles in sand 5th Int
Conf on Soil Mech a Found Engng Vol 2 p 33 Paris
Colombo P (1971) Observazoni sul comportamento ltli pali
a grande diametro Rivista Italiana di Geotechnika
No 3 pp 163-172
Dahlberg R (1975) Settlement characteristics of preconshy
solidated natural sands Swedish Council for Building
Research D11975
De Beer EE (1964) Some considerations concerning the
point bearing capacity of piles Proc Syrop Bearing
Capacity of Piles Boorkee I pp 178-204
Decourt L Quaresma AR (1978) Capacidade de Carga de
Carga de Estacas a partir de Valores de SPT VI Conshy
gresso Brasilerio de Mecanica dos Solos e Engenharia
de Fundacoes - Rio de Janerio - ABNS
Decourt L (1982) Prediction of the bearing capacity of
piles based exclusively on N values of the SPT Proc
of the Second Europ Syrop on Penetration Testing
Amsterdam Vol 1 pp 29-34
Duncan MJ Chang CV (1970) Non-linear analysis of stress
and strain in soils Journal Soil Mech Found Div Vol
96 SM5 pp 1629-1651
Durgunoglu HT (1979) Effect of foundation embedment on
stress and deformation distributions Third Int Conf
on Num Meth in Geomechanics Aachen pp 925-928
Farr JS Aurora RP (1981) Behaviour of an instrumented
pier in gravelly sand Proc of a session Drived Piers
and Caissons sponsored by the Geotech Eng Div of the
ASCE Nat Convention St Louis Missouri pp 53-65
Franke E (1981) Point pressure versus length and diameter
of piles X ICSMFE Stockholm Vol 2 pp 717-722
45
Gregersen os Aas G and Dibiagio E (1973) Load tests
on friction piles in loose sand Proc of the Eigth
International Conference on Soil Mech Moscow USSR
Vol 21 pp 109-117
Gwizda1a K (1978) Behaviour of large diameter bored piles
in non-cohesive soil (in Polish) Archiwum Hydrotechniki
Vol XXV No 2 pp 183-217 (English summary)
Huizinga TK (1951) Application of Results of Deep
Penetration Tests to Foundation Piles Building Research
Congress Vol 1 p 173
Janbu N (1963) Soil compressibility as determined by
oedometer and triaxial tests Proc Europ Conf Soil
Mech and Found Eng Vol 1 p 19 Vol 2 (Discussion)
p 17 Wiesbaden
Janbu N (1970) Grunlung i geoteknikk Tapir Forlag NTH
Trondheim
Janbu N Bjerrum L Kjaernsli B (1973) Soil Mechanics
applied to some engineering problems Norw Inst Publ
No 16 Oslo
Japanese Society SMFE (1981) Present state and future trend
of penetration testing in Japan Separate report at
X ICSMFE Stockholm
Kjekstad O Lunne T (1979) Soil parameters used for design
of gravity platforms in the north sea Second Int Conf
on Behaviour of Off-shore structures London Vol 1
pp 175-192
Klosinski B (1977) Bearing capacity of large diameter bored
piles IX ICSMFE Tokyo Vol 1 pp 609-612
Laboratory for soil mechanics Delft (1936) The predetershy
mination of the required and the prediction of the
resistance of piles Proc 1 Int Conf on Soil Mech
and Found Engng Cambridge (Mass) I p 181
46
Matich M and Stermac A (1971) Settlement performance of
the Burlington Bay Skyway Canadian Geotechnical Journal
Val 8 pp 252-271
Mccammon NR and Golder HQ (1970) Some loading tests
on long pipe piles Geotechnique London England
Val 20 pp 171-184
Meigh AC (1971) Some driving and loading tests on piles
in gravel and chalk Proc of the conference on beshy
haviour of piles London England pp 9-16
Mitchell JK Gardner WS (1976) In situ measurement
of volume change characteristics American Society of
Civil Engineers Specialty Conference on In-situ
Measurements of Soil Properties Raleigh 1975 Proc
Val II pp 279-345
Mezenbach E (1961) The determination of the permissible
pointload of piles by means of static penetration tests
Proc 5 Int Conf on Soil Mech and Found Engng
Paris II pp 99-104
Meyerhof CG (1956) Penetration tests and bearing capacity
of cohesionless soils Proc Amer Society of Civ Engng
SM 1 Pap 866 pp 1-19
Meyherhof GG (1 976) Bearing capacity and settlement of
pile foundations Proc Amer Society of Civ Engng
Journal Geotechnical Engineering Division Val 102
No GT3 pp 197-227
Mohan D Jain GS and Kumar V (196 3 ) Load bearing capacity
of piles Geotechn Val XIII pp 76-86
Nixon I (1982) Standard penetration test State of the
art report Proc of the Second Europ Symp on Pen
Test Amsterdam Val 1 pp 3-20
47
Nunes A Vargas M (1953) Computed bearing capacity of
piles in residual soil compared with laboratory and
load tests Proc of the Third International Conference
on Soil Mechanics Zlirich Switzerland Vol 2 pp 75-79
Nordal S Grande L Janbu N (1982) Prediction of offshy
shore pile behaviour The Norwegian Institute of
Technology Trondheim
Ohde J (1939) Zur Theorie der Druckverteilung im Baugrund
Der Bauingenieur Vol 20 No 3334 p 451
Parroth E (1972) Einfache Formel zur Vorausbestimmung der
Tragfahigkeit von Standpfahlen mit Hilfe der Sande
Bautechn 9 pp 312-314
Poulos HG Davis EH (1980) Pile foundation analysis
and design New York - J Wiley and sons
Prodinger W Veder Ch (1981) Bearing capacity of floating
groups of diaphragm walls Proc X ICSMFE Stockholm
Vol 2 pp 809-814
Promboon S Brenner R (1981) Large diameter bored piles
in Bangkok Clay Proc X ICSMFE Stockholm Vol 2 pp
815-818
Reese L (1978) Design and construction of drilled shafts
ASCE JSMFD Vol 104 No OT1 pp 95-116
Rodin s Corbett BO et al (1974) Penetration testing in
United Kingdom state-of-the-art-report Proc Europ
Symp on Penetration Testing 1 Stockholm pp 139-146
Rollberg D (1976) Bestimmung des verhaltens von Pfahlen
aus sandier und rammengebnissen Heft 4 FBG Technische
Hochschule Aachen
Rollberg D (1977) Determination of the bearing capacity
and pile driving resistance of piles using soundings
Publications of the Institute for Found Eng Soil Mech
Rock Mech and Water Ways Construction Aachen Vol 3
48
Schmertmann J (1970) Static cone to compute static
settlement over sand Journal of the Soil Mech and
Found Division ASCE SM3 pp 1011-1043
Schmertmann J Hartman JP Brown PR (1978) Improved
strain influence factor diagrams Journal of the Soil
Mech and Found Division ASCE GT8 pp 1131-1135
Shibata T Hijikuro K and Fominerga M (1973) Settlement
of a blast furnace foundation Proc of the Eighth Int
Conf on Soil Mech Moscow USSR Vol 13 pp 239-242
Spang J (1972) Die Bestimmung der Tragfahigkeit von Grossshy
borhpfahlen (I) Strassen und Tiefbau No 2 pp 339-355
Senneset K (1974) Penetration testing in Norway State-ofshy
the-art-report Proc Europ Symp on Penetration Testing
Stockholm I pp 85-95
Tejchman A Gwizdala K (1979) Analysis of safety factors
of bearing capacity for large diameter piles Proc VII
ECSMFE Brighton Vol 1 pp 293-296
Thorburn s and Mac Vicar R (1971) Pile load tests to
f a ilure in the clyde alluvium Proc of the conference
on behaviour of pile s London England pp 1-7
Trof imenkov JG (1969) Accuracy of determining the bearing
capacity of piles based on results of static penetration
sounding of soils Osnovaniya Fundamenty i Mekhanika
Gruntov 4 (Translation Soil Mechanics and Foundation
Engineering 4 p 248)
Trofimenkov JG (1974) Penetration testing in USSR Stateshy
of-the-art report Proc Europ Symp on Penetration
Testing Stockholm I pp 147-154
Tuoma F and Reese L (1974) Behaviour of bored piles in
sand JSMFD ASCE Vol 100 No GT 7 Proc Paper 10651
July pp 749-761
49
Van der Veen C (1953) The bearing capacity of a pile
Proc 3 Int Conf on Soil Mech and Found Engng
Zlirich II pp 84-90
Van der Veen C and Boersma L (1957) The bearing capacity
of a pile predetermined by a cone penetration test
Proc 4 Int Conf on Soil Mech and Found Engng
London II pp 72-75
Weltrnan AJ Healy PR (1978) Piling in boulder clay
and other glacial tills Construction Industry Research
and Information Association UK-Report PG 5
Withiam J Kulhawy F (1981) Analysis prodecure for
drilled shaft uplift capacity Proc of a session
Drilled piers and caissons ASCE St Louis Missouri
pp 82-97
Woodward R Lundgren R Boitano J (1961) Pile loading
tests in stiff clays Proc of the Fifth International
Conference on Soil Mechanics Paris France Vol 2
pp 177-184
Wright SJ Reese LC (1979) Design of large diameter
bored piles Ground Engineering Vol 12 No 8 pp
17-22
DIN 4014 Cods Teil 2 (1977) Bohrpfahle Grossbohrpfahle
Herstellung Bemessung und zulassige Belastung
Polish Specification (1975) Specification for design and
construction of large diameter bored piles in bridges
Ministry of Transport Warsaw (in Polish)
Polish Specification (1979) Specification for prevision
bearing capacity of the piles on the presiometer test
and static sounding ENERGOPOL Warsaw (In Polish)
Polish Code (1983) Foundations Bearing capacity of piles
and pile foundations
5 1
FIGURES
bull bull
53
Ou
+ sect raquo iir 1
4 + D
h + +Osu
bull + t2 =n- Dp
LDpl r f 1
Opu
Fig 1 1 1 Bearing pi le in the soil
J_
fp
080
070
060
050
0 40
030
020
010
q~ [MPa ]000 -+--~-~-~-~------------------------=-shy
00 20 4fJ 60 80 10 0 120 14fJ 160 180 200
Fig 1 1 2 The point resistance factor fp
(Trofimenkov 1974)
54
ts
160
140
120
100
080
060
040
020
q~5 [ kPa)
0Q0--1------~-~-~-~-~-~ - - ---=- -- shy000 10 20 30 40 50 60 70 80 90 100
Fig 1 1 3 The shaft resistance factor fs middot (TYofimenkov 1974)
f s
200
180
160
140
120
100 2 3 4 5 6 7 8 9
Fig 1 1 4 Shaft friction factor f depenshys
ding of the soil density (Senneset 1974)
55
Q~ [kN]
1500
1000
500
0-r-----------r----~- Q~ [kN] 0 500 1000 1500
Fig 1 1 5 Comparison of the pile resisshytance determined by the results of static sounding and load tests (TYofimenkov 1974)
D f f
0
Fig 1 16 Equivalent cone resisshytance (Bustamante 1982)
56
E u shy0 ~
QI I ltII ltII
~ a C QI
O C
D
w gt
0
Cone res istance Point resistance
80 160 240 320
05
10
15
e d
20
ver y dense Cone resistance 300 kgcm2
Dpcm
a =45 b = 30 C 60 d = 100 e = 150
Fig 1 16a
Cone resistance _ qc
80 160 80 160 qc [ k g cm2 ]p
05
10 10
15 15 e d a
e d20
Dense Medium2 2200 kgcm 100 kgcm
Cone resistance and point resistance of piles versus overburden pressure (Kerisel 1965)
Point resi stance - p(for s=2cm) of the pi le for
15 sett Iement s = 2 cm
10
5
E u
uJ1 o-~----shya er O 804 2500
32 56
I 1
L oose50 -I =25 Very loose L
----~--shy5000 7500 80 98
~-----lmiddotI1--------2 10000 12500 31400 =Flcn)
112 123 200 =Dplcm)
Fig 1 1 6b Point resistance versus cone resistance and pile diameter (Franke 193)
57
1
fp
080 (D Gravel
0 Coarse sand Medium sand 070
reg Fine sond Silty sand
060
050
040
030
020
010
qc [MPa]000-+----r--~-~-~--------r----r----r-~-~-- -shy
oo 20 40 60 80 100 120 140 160 180 200
Fig 1 1 7 Point resistance factor f (proposal) p
58
300
250
200
150
100
qc [MPa I50-+---------------r---r---r---r----r------------- shy
oo 20 40 60 80 100 120 140 160 180 200
Fig 1 1 8 Shaft resistance factor fs (pr oposal)
59
Bustamante (seetab 115 I
l fp
G)
0 Gravel
Coarse sand Medium sand
cl
b)
t-----l
1----1
080 reg Fine sand Silty sand a) D
070 Polish
060 Specification
( 1979) 050
040
030 CD 020 0
reg 010
qc [MPa]0 00 -+-------------------------------------=--shy
oo 20 4o 5o 80 100 120 14o 15o 180 200
Fig 1 19 Point resistance factor f comparisonp
Bustamente ( see tab 116 I 300
a) ~
250 b)~
cl~
200 Polish Specification ( 1979 l
150
100
q [ MPa]504---~--~--~----- ---___
00 20 40 60 80 100 120 140 150 180 200
Fig 1 1 10 Shaft resistance factor fs comparison
60
1 fp
~
080 CD CD Gravel
070 0 reg Coarse sand Medium sand
060 0 Q) Fine sand Silty sand
05
040 Franke (1973)___
030 DIN 4014
020 Part 2 1977
( see tab113 l 0shy
--shy --a - 010 C---0 Piles without enlarged bases
D---0 Piles with enlarged bases qc [MPa ] 000
00 20 4JJ 60 80 90 100 120 140 160 200
Fig 11 11 Point resistance factor f comparison p
fs
DIN 4014 Part 2 1977 ( see tab 114 l
300
~ 5 lt qc lt 10 MPa 50
~ 10 lt qclt 15 MPa
~qcgt15MPa
200
150
CD
100 0 0
qc [ 1Pa] 50-t-----T-~----T-r-~----------------shy
OO 20 40 6JJ 80 100 120 14JJ 160 180 200
Fig 1 1 12 Shaft resistance factor fs comparison
61
Measured p [ MPa]
( s=010 Dp) 10
9
8
7
6
5 0
4 0 61
3
I 2
Calculated qcp [MPa]
0 0 2 3 4 5 6 7 8 9 10
Fig 1 1 13 Comparison of experimental and aomputed values of the pile point resistanae
62
Contact pressure ( MPa ]
2 I 6
50
100
E E 150 Ill
c QI
E Sett lement for QI
calculated qcpai V) 200
Fig 1114 Results from load tests on piles No 1 and 5
Contact pressure [ MPa I 0 2 I 6
01---------------------1
50
E E 100 Ill
Settlement forc QI calculated qcp E ~ ai
I V) 150
Fig 1 1 15 Results from load test on piles No 7 and 5
63
Contact pressure p [ MPa] 0 2 3 4 6
0-t=-----~-~-----
E E
100 1)
c CU E 2 QI V) 150
Fig 1 1 16 Results from load test on piles No 9 10 and 11
Contact pressured p [MPa] 0 1 2 3 4 5
o~~~=------------___-~-shy
50
100
E E
i 150
CU E CU
-a V) 200 2
Fig 1 1 17 Results from load test on piles No 12 and 13
c
-------------- -
64
Contact pressured
0 1 2 3 4 p [ MPo] ~o __L____1_____J_____L___
50
100
150
E
E
IJ) 200
c a
E a
~ 250
Fig 1 1 18 Results f Pom load tests on piles No 2 4 6 and 8
p [MPa]
60
50
tO
30
~
Pile Pile Pile Pile
Pile No18
------+ Pile No17 + ~_ ---0 Pile No 19
bullbull - --bull Pile No 20
- ~middot -shy-shy -(y I Settlement for
20 tO 60
No17 +-middotmiddot- V 70 No 18 bull--- V 9o No19-middot- V 120 No20bull---- V150
qcp 3
80 100 120 140 160 s (mm)
Bose resistance
Fig 1 1 lBa Point Pesistance vePsus settlement (Spang 1972J
65 Cone resistance qc [ MPa]
0 10 20 30
mud
5 ~ lll
0 c 0
c CD
peat
10 sand
Ill N
10=10
D=lOOOmm
1540=40
20__________________
[ml
Fig 1 119 Pile No 1 and results from static cone penetration test
Cone resistance qc [MPa l 0 10 20 30
7N V degW = 0+--------------------i
mud
5
lll
~ C 0
c peat~
10
sand lll N 1D15
15l lD=1500mm
40=60
20l---------=-------__J
[ml
Fig 1 1 20 Pile No 3 and results from static cone penetration test
66 Cone resistance qc [MPa]
10 20 II 3 igt pound ~
mud+peat
fine sand+ silt
50=11
l lo-11oomm
40= 44
10
15l____________c
[ml
Fig 1 1 21 Pile No 5 and results from static cone penetration test
Section Cone resistance Pile
0 0
5 10 15 20 25 30 qc [MPa] -----~-~shy~
Silt
[7r_ ___~ Medium Sand_~-----l
0 ltD
+shy4
0=11
9=
Fine sand + Silt t
30p=
middotmiddotmiddotmiddotmiddotmiddotmiddotmiddot1~11+-----E-----
[ml
Fig 1 1 22 Pile No 6 and results from static cone penetration test
Cone resistance qcmiddot 1MPuJ
0 10 20 30 67 01-+-------l--------------i
mud+ peat
fine sand
l1)
N
40=60
15L_____________
[ml Fig 1 1 23 PiZe No 7 and resuZts from static
cone penetr ation test
Section Cone resistance Pi le
0 5 10 15 20 25 30 qc [MPa 1 --~----Y-~-----~
Silt
Fine sand
Medium Sand Bentonite2----1~i
t 3
4
0
0=15
Fine iii ~~= 5
sand t ltD
6 +
Silt 7
3Dp=
63 g
10
11
12
13+------=~---l
[ml
Fig 1 1 24 PiZe No 8 and resuZts f rom static cone penetration test
68
I =3
Cone resistance qc [MPa]
0 10 20 30
C 0 C Cl
(I)
Said
Peat
Sand
l 0=110
D = 11
4 D = 44
Fig 1 125 Pile No 9 and results form static cone penetration test
69
Cone resistance qc[MPa)
0 10 20 30 I ~ II JE Ill= II=E IS
Fine sand QI
U) I
[- I C 0 + C Peat QI
CD
Fine sand 0
Ci D = 1 1
L l D= 110
4D= 4 4
Fig 1 1 25 Pile No 10 and results f rom static cone penetr ation test
70
Cone resistance 9c[MPa]
0 10 20 30
Sand
C 0 Mud peat
+shyc 5 ltII
co
Sand Op= 11
u 10 D= 110 4Dp=44
Fig 1 1 26 Pile No 11 and results foIm static cone penetration test
71
00 a_ N ~
middotu rr QI 0 u ~ C 0
QI ui C iij 0 QI U - 0
0 EN
d 2
Sll 1lOl
C
u (rr
C 0 u~
0
QI - C middot 0 C
U - O 0 EN
~ 0 2
E
ltD a---==-lr---___--~---6-l_-0_012 ~ Lr- - --1---------J J
S9l ls= apound QI -0 gtcc _gmiddot- 0 1) ui I
Fi g 1 1 2 Piles No 14 and 15 and results f r om stat i c cone penetr ation tests
72
Contact pressure p [ MPa] 2 4 6
01lt---------------~
50
E E
111 100 ~ (qcp=30 MPa for No16
~ iqcp =49 MPa for No14
~ 1so~--~~- _ _ __
I _ _
11 I lf--q = 32 MPa for No15
cp
Fig 1 1 28 Results f r om load tests on piles No 14 15 and 16
73
0300--------------~---~--~--shyE
Driven piles in ~ 0 bull Gravel
amp250 bull Sand L QJ X Silt a 1l o Bored piles in
sand -sect 200 0=-- shyC ~ ~ 10 unless ~~ middot D shown 1
ii O
~ ~ o 3 a 1501-----+-------I- --+---laquo-+-- -+------lt
~ sect 5 - 6 6middot 100t----+----+-----_-1---4--__co_--J~__j
-_
~ 0 t7
C
a 50 2 shyg ~ gt
0 20 30 40 50 60
Standard penetration resistanceN in blows per foot
(N 30
Fig 12 1 Emperical relation between ultimate point resistance of piles and standard penetrashytion test in cohesionless soil (Meyerhof 1976)
14 r-------------------r-------b-----q
References and symbols given in Fig121
121-----+---+----+----+------ll------j
- _sect ~ 10t----+----+-_--1-----+---lt~--~H---- 0 lt-~5- _-)0 I() l- I Q---+-----I[08 ~
H -(l () ltj-~C X bulls pound 061------lt----+-----i~- --+-- shy
- bull
-gt Q1pound--I---L---L---L---L--~ 0 10 20 30 40 50 60
Mean standard penetration resistance N in blows per foot ( N30 l
Fig 122 Empirical relation between ultimate skin friction of piles and standard penetration resistance in cohesionless soil (Meyerhof 1976)
74
a) b)0(1 0lt2
10 10
05 05
1 N30OD-+---------__ OD--t-----r-----r----------------ll--Nbull30~ 10 20 30 10 20 30 40 50
Fig 1 2 3 Reduction coefficient a) for impermeable gravels b) form permeablr gravels (Weltman and Healy 1978)
psf [MPo)
Fig 1 2 4 Relation between ultimate point resistance and SPT in cohesionless soil (Polish specification 1975)
75
30 35 40 45 Loo Med Dense Ver dense
50
40
~ E
l)
g 8 1)
middotu
1 ~
QI- bull Touma ~ bull Koizumi
(183)-depth base middotameter5
20 40 60 00 100 N30
30 35 40 45
OG2(294) bull G1 (183)
300 bull us 59 ( 102) bull 88(180)
bull 075 a GT (467)
150
~ 200-+--------+-- t--- --t-----i 130i 0 094 081
014 _- --- -- shy~ E 066bull bull 063 Note -~ ~m~r~s~ ~ 1001---1-r--t---1point is xh QI Ratio ~ Number in ( ) middotn key is h c Ratio s ~
0 20 40 60 00 100
~ig 1 2 5 Ultimate point and shaft resistance versus N30
(Wr ight and Reese 1979)
-----
76
tu Psa
[kPa] [MPa]
200 tu
------ shy150 Psa
1 1
1100 10 1 1
1 50
0+----------T----~---~-N-3J~shy0 20 40 60 80
Relation between ultimate skin friction and SPT (Decourt 1982)
Fig 1 2 6
Psa
[MPa]
8
0----Meyerhof 1976) 0 7
--- - --~ - copy Polish Specifcoti on 1975)6 ~-
~
reg- middot - Reese (1978) middot 5
f41- -- Decourt (1982) -I bull 4 2
----==---______z__ h25m Dp=12m
3 ---shybull
2 7
--shy ----shy~----shy0-t----i----------r-- ----------------------N3l~shy
0 10 20 30 40 so 60 70
Fig 1 2 7 Relation between ultimate point re~istance of large diameter piles and standard peneshytration test (SPT) in cohesionless soil
------
77
tu [kPa)
200 17 Cast under -J bentonite
~----Meyerhof (1976) ~copy -=middotmiddotmiddotmiddot== middotmiddot150 ~------- Wei tman (1978 ) middot Healy middotmiddot ___ Japanese ) 119810 Society
(0 -middotmiddot- Decourt (1982)middot Wright
100
- -middotmiddot -- 11979]reg Reesemiddot Bored piles
~shy50 1 -- shy
-- shy middotmiddot s-shy - --~ ------reg~~ ---~E_==---- ------- shy
N_ ---shy0-+--C--------------r---- ---------~---~-~shyo 10 20 30 40 50 60 70
Fig 12 8 Relation between ultimate skin friction of piles and standard penetration test (SPT)
78
Pst [MPa]
8
7 ---------ist=7MPa
6
5
4
3
2
I N30o~------------------------------+---------__=-shyo 10 20 30 40 50 60 70
Fig 12 9 Relation between ultimate point resistance of large diamter piles and standard peneshytration test (SPT) in cohesionless soil (proposal)
tu [MPa ]
( excavanted and cast
150 under bentonite ) tu=150 kPa
100 tu=90 kPa
I I
50 I I I I I N30
10 20 30 40 50 60 70
Fig 1 2 10 Relation between ultimate skin friction of large diameter piles and standard penetrashytion test (SPT) in sand (proposal)
79
2 3 4 5 p[MPa] 0 2 3 4 5 p[MPa]0
40 40 Cl
80 c 80
c 120 120
Pile No 1 PileNo216 160
200 2
s s c [mm] (mm]
0 2 3 4 5 p[MPa] 0 2 3 4 5 p [MPa]
40 40
00 80
120 120
16 160 Pile No 3 Pile No 4
200 200
s s [mm] (mm]
0 2 3 4 5 p[MPa] 0 2 3 4 5 p [MAJ]
tgt11 tgt- measured40 40
80 80
120 120
Pile No 5 Pile No 6 160 160
20 200 s s
[mm) [mm)
Fig 1 4 1 Base resistance vs settlement appoximative method piZe No 1- 6
80
0 2 3 6 5 p[MPa) 0 2 3 4 5 p[MPa]
40 40
80 80 6
120 120 6
6160 160
Pi le No 7 Pile No 8 6
200 3J s s
[mm] (mm]
0 2 3 4 5 4 p [ MPo)
6 6 40
6 6
6 80
6 6
6
Pi le No 9 Pile No 10
XJO s s
[mm] [mm]
0 2 3 4 5 p[MPa] 0 2 3 4 5 p [MPa)
6 6
40 40 6 6
6
00 80 6
6
12 1Xl 6
160 Pile No 11 160 Pile No 12
200 200 s s
[mm ] [mm]
Fig 1 4 2 Base resistance vs settlement approximative method pile No - 12
81
0 2 3 4 5 p[MPa] 0 2 3 4 5 p [MPa]
6 6
40 6 40 6
6
80 6 80 6
120 6 120
Pile No 13 Pile No 141fO 160
200 200 s s
[mm] [mm]
0 2 3 4 5 p [MPa) 0 2 3 4 5 p [MPa)
40 40
80 80
120 120
HiO 160
200 200Pile No 15 Pile No 16
s s (mm) [rrrn 1
0 2 3 4 5 p[MPa] 0 2 3 4 5 p[MPa)
40 40 A A A-measured
680 80 t t
120 c 120 c
1fil Pi le No 17 160 Pile No 18
200 200 s s
[mm] [mm]
Fig 1 4 3 Base r esistance vs settlement approximative method pile No 13- 18
82
0 2 3 4 5 p[MPal 0 2 3 4 5 p (MPa]
D D40 40 c c
80 c 80 c
120 120
160 160
Pile No 19 Pile No 20 200 200
~ml (mm]
Fig 1 4 4 Base resistance vs settlement approximative method pile No 19- 20
LlJ QI
0 average lJ = 098 E sd = 029 C
6 SY = 030
4
2
lJ calculated ________________________ _______ measu red
06 08 10 12 14 16
Fig 1 4 5 Calculated pressure divided by the measured pressure at 20 mn settlement for aZZowabZe
q Zoad Pa= ~p approximative method pile
No 1- 20
8 3
Point resistance p [ MPaJ
a)
p(s) = s a +--sshy1 y qcp
1
SQ100p -- --- ---shy
~ s
[mml
I- 01 s rmm]-l p LMPa b)
f~]
c Cll E ~ i s
[mm)
Fig 146 Definition of the point resistance - settlement curve according to the modified hyperbolic method
84
01 ~ 0
20 0 0
0
16 0
medium 0 value a1 = 905-+ 256 Op 0 0
12 (r=039)
0 0
----0 0
8 0
0 0
0 0
4 0
05 06 07 08 09 10 11 12 f3 14 15 16 17 18 19 20 2 1 Op (ml
Fig 1 4 Initial slope of the base resistance curve vs pile diameter
a1 [p] 0
0020
16 assumed a 1= 28 - 4 qcp
12 0
0 Ct) 0 a = 2659 - 369 qcp8 1
0 0 (r = 0188)0
4
2 3 4 5 (MPa]qcp
Fig 1 4 8 Initial slope of the point resistance curve vs ultimate point resistance on the static cone resistance for pile tests No 1 20
85
a [~ 28
24
20
16
12
8
4
0 2 3 4 5 6 Qcp [MPa]
~ Kiosinski (1977) sand and sandy gravel of mediwn density
~ Klosinski (1977) loose sand ID= 0 3 0 4
o US59 ] t HH Touma p and Reese L (1974) fine sand and silty sand OGl (US59 HH BB - very dense Cl - mediwn dense) 1 BB
DIN 4014 Part 2 (1977)
Fig 1 4 9 Initial s lope of the point res istance curve vs ultimate point resis tance
86
assumed [il =30 -10 Op but )1~ 10 )1 [1 I
u 311-10 Op ( r =0 368)4 1 0
3 0 0
02 0
0 0co 0 8 0 0
0
0
05 06 07 08 09 10 11 12 13 14 15 16 17 19 20 21 Dp [ ml
Fig 14 10 Correction factor for hyperbolic base resistance shysettlement relationship
87
a [~] 28
24
20
16
12
8
4
2 3 4 5 qcp [ MPa]
Fig 14 11 Initial slope of the base resistance curve vs ultimate base resistance (proposal)
v [ 1 ]
3
2 -----G- DP J l 1J I Op lm] J
for Dp ~ 2 0 m ~ u = 1 01
0 --------r----r---r----r-----------------r-------------------------r------r-~-~--shy
05 06 07 08 09 10 11 12 13 14 15 16 17 18 19 20 21 Dp[m)
Fig 1 4 12 Correction facto r for hyperbolic base resisshytance - settlement relationship (proposal)
s P ( s)
s +
u qcp
88
a) b)1
bt=o212= 47 MPa a1=1~32 tMWJ s 2 3 4 5 O 1 10 20 30 40 50 60 p [~a]0
0p [ MPa] 40 40
80 80
120 ~
160 b1 = ~ajtg ~= 0 212
~=1132 + 0212middot s
mJ 240 r=0994t t t measured s __ according to Jl s
o o o according to p (bull ll l[mm] [mm]
Pile No 2
slmm) 10 20 30 40 50 60 80 100 125 150 175 2)0 225 Note
p [ MPa] 09 14 17 20 22 24 27 30 32 34 36 38 39
measured
pibull) [ MPa] 074 128 169 202 228 249 282 307 330 347 360 371 380calculated
plbullbull1[MPal 070 125 168 203 233 257 297 327 356 378 396 410 422calculated
1) (bull) ij l099082 091 099 101 104 104 104 102 103 102 100 098 097 sd = 006
ij (HJ1041) (bull10) 078 089 099 102 106 107 110 109 111 111 110 10B 10B sd = 010
plbulll-according to a =1132 [ Jp(s) = s s for pile No21 0 1132 12 39
plbullbulll-according toa =1241 lmiddotGcp=39MPa1 0
~=14 see fig 1411 and fig 14 12 sp(S)=
124+ _ s_ 14middot39
11lbulll11l-J - correlation coefficient calculat~d P5 for
measure p s p(bull) and p(bull) respectively
Fig 1 41 3 Modified hyperboZic point resistance - settZement reZationship for piZe No 2
89
0 2 3 4 5 p(MA1] 0 2 3 4 5 p[MPa)
40 40
80 A 80 A
120 120
160 16 Pile No 1 Pile No 2
20 200 s s
[mm] rnm
0 2 3 4 5 0 2 3 4 5p [MPa] p [MPo]
40 40
80 80
120 1ZJ
lfpound) Pi le No 3 Pile No 4 A
200 A
s s A
[mm) [mm
0 2 3 4 5 p [MPa] 0 2 3 4 5 p [MPa]
40 40 A A A measured ~ calculated
80 80
12
160 160 Pi le No 5 Pile No 6
200 Z)Q
Fig 1 4 14 l3ase resmiddotistance vs settlement pr oposed method pile No 1- 6
90
2 3 4 5 p [MPa] 2 3 4 5 p [ MPa]
40 6
6 40
1 80 80
6
120 120 6
6 160 160
Pile No 7 6
200 200 s
[mm ] s
[mm]
0 2 3 4 5 6 p [MR] 0 2 3 4 5 p [MPa] 0 0
40 40 6
6
80 80
6
120 120
160 160 Pile No9 Pile No 10
200 200
s [mm] [msml I
0 2 3 4 5 6p[MR] 0 2 3 4 5 p [MPa]04--___ ____ ___ ___ ____
0+-=---------------~-~- shy
40 40 c 6 c - measured
0--0-0 shy calculated
80 80
120 120
160 160 Pile No11 Pi le No12
200 200
s [mm]
s [mm]
Fig 1415 Base resistance vs settlement proposed method pile No 7-12
91
0 2 3 4 5 p [MPal 0 2 3 4 5 p [MPa)
40 40
80 80
120
16 Pile No 13 Pile No 14
200 s
tnml [mm]
0 2 3 4 5 p [ MPa] 0 2 3 4 5 p [MPa)
40 40
80 80
120 120
160 1fD
Pi le No 15200 axJ s s
[mm] [mm]
0 2 3 4 5 p[MPa] 0 2 3 4 5 6 plMPa ]
A A A measured40 0---0-0 calculated
80
120 120
160 1ED Pile No 17 Pi le No 18
200 200
s s [mm] [mm]
Fig 1 4 16 Base resistance vs settlement proposed method pile No 13- 18
92
0 2 3 4 5 p [MFb] 0 2 3 4 5 p[MPa]
0 6 o -measured40 40 0 0 o -calculated
80 80
120 120
160 160 Pile No 19 Pile No 20
200 200 s s
[mm] [mnil
Fig 1 4 17 Base resistance vs settlement proposed method pile No 19-20
p(s~Psf
15 20
ean
-C 5 w u L Lower ~ confidence
linea 0
a IJl 10
o---o proposed
method I I I
15
Fig 1 4 17a Design curves for estimating developed base resistance in sand (Wr ight and Reese 1979)
93
n (number)
30
28
26
24
22
20
18
16
14
12
10
8
6
4
2
0 02 04
Fig 1 4 18
I= 126
Between 1] = 0 7 - 1 3--- I= 106 ( 84 frac34)
Average ~ = 098 Standard sd =023 deviation
Standard sv =023 veriation
1] (Coefficient Calculated Measured
06 08 10 12 14 16 18
Calculated pressur e divided by the measured pr essure for all pressure - settlement curves pr oposed method pile No 1- 20
94
a) b) Total load
Total load curve
---- _____-- shy- -- -Base load ~- Base load
-0-0 ~
00 00 J
ldeoli zed shaft load J
Shaft sesistanc1---------- 0=0middot30 a= 0 middot 30
025 Settlement IN 025 Settlement IN
Fig 1 419 Proposed method of synthesizing design loadsettlement curve (a) conservative design prodiction b) design prediction- peak in shaft loadsettlement curve (Burland et al 1966)
Cf
-0 0 0
J
0
~-----~--~-~ amp- 2 3 4 5 6 (cm)
a~middotltii -0 lt) cco2 41 -~ -0 1)
vi ~ llloli=----------- ---c~0 1 2 3 4 5 6 7 ( of diameter)1 1 1 1
05 10 15 20 ( in) for 30 in Pile Movemen~ ( 75cm pile)
Fig 1 4 20 Approximate load settlement curves for 30 in bored piles (AB and C represent failure load at 1 in settlement A B and C represent ultimate failure load) (Touma and Reese 194)
95
Load in MN 0 2 3 4 5
25
50E E C
-C 75
-~ ~
-Z 100 lJ
Shaft resistshy
125 once
15 Fig 1 4 21 Load-settlement relationships for largeshydiameter bored piles in stiff clay (Tomlinson 1977)
SettlementSo
Fig 1 4 22 Diagrams of s1iaft and base resistances versus settleshyment assumed in analysis (Kiosinski 1977)
96
0 0 1 ~ r- 025g ~~ 2
1- -shy3 03Sg 14 5 2
Qls =Qpls+Q5 (sQpls) Qs(s-3E
0
degsis __ -- Qpls) a~ C
4
t Sg l
5 Qu Is)
Q(s)in MN-l T
Ouls Q Is) in MN ---
Fig 1 4 23 Construction of load - settlement curves a) for sand b) for cohesive soil (DIN 4014 Part 2 1977 and Franke 1981)
-
s C 5C
Cl
3 0 00 05 10 15 20 Mean settlement I in)
Fig 1 4 24 Load- settlement curves for test shaft S4 (1 in = 25 4 mm 1 ton= 8 90 kN) (Reese 1978)
97
Relative side resistance
0 05 10 15 20 0E=--t----+---+--~
c QI lt) ~ 2 C
I itaker c
QI amp Cooke3E QI-j
c-en 4
C QI
E us 59o
5 QI gt
SA0 w 0 6
Fig 1425a Relative side resistance for clay vesus relative midlength settlement (Reese 1978)
degs (Osl u l t 0 05 10 15 2 0
Mean
2 Lower ~ C QI u
confidence line
~ 3 a
0
~4 E
()
5
6 __ _ ______ ________ __1
Fig 1 4 25b Design curves for esti mating developed side resistance (~Jy1nht ReertP- 1987 J
98 Load Q
8 - 15 mm
1- 2 of p ile diameter
100-200 10-15 of pile Os Ot diameter Shaft Total
Settlement S Resistshy Resist- Load ance once
Fig 1426 Dependence of total load base resistance and shaft resistance on settlement of lar-ge diameter pile (Tejchman Gwizdala 1979)
6
5 Shaft load
4
3
2
z ~
-0
g Pile EF- 56 J 0
0 0 20 30 Butt settlement (mm)
Fig 1 4 27 Deveiopment of shaft and base resistance with settiement (Promboon Brenner 1981)
99
0 1000 2000 3000 4000 5000 6000 7000 8000 9000 0 r-=-1---J__-----------------------~----_shy
Load [ k N l5
10
20
( I
Skin friction ----1 I I
~ 40 QI E
fQI
50 I
Q) I () ICOntinuos fost deolading
Fig 1428 Load-Settlement-Diagram Testelement III (Diaphragm-Wall 0515 m 244 m deep) Portion of Skin Friction and Base Resistance (Prodinger Veder 1981)
Qs (QJ max
0 05 10
Upper Limit of Data
Farr and Aurora (1981J C
~ 2 - shy -+shy - Mean of Data
I QI
Lower Limit of Data a
0 - 3 E
Vl
4
Smid = Approximate shaft buff movement ignoring the elastic compression of upper halt of the shaft
D = Shaft diameter
Q Mobi Ii zed shaft resistance
Qs1max = Maximum shaft resistance
Fig 1 4 29 Relative shaft resistance vs relative movement (Farr and Aurora 1981)
100 Load Q (s) [ MN]
Su5 s s 20 mm for non- cohesive soil u
s s 10 mm f or cohesive soil u
s s 15 mm for claysand u
Q (s) + Q (s)s p
Qs(s)
-C ltII E s ~- [mm]-ltII IJ)
Fig 1 430 Dependence of total load Q(s) point res i stance Q (s) and shaft resistance Q (s) versus settlement p s
~ 3 Usu Qpu Qu Q(s) [ MN]
Sus= 20
1J
60
80
100
120
degs (s ) 140
5 P=Ol Op
1EO
C -ltII E 180 ~ ] 200
s [mm]
Approximative dependence of total load point resistance and shaft resistance versus settlement fny non-cohesive soil
Fig 1 4 31
101
113 3 ~fic0P Ye hY
1 Ground water
D
I y
yh C
Fig 1 5 1 Determination of 01 and 03 for settlement analysis of lar ge diameter bored piles
102
I
E=Et [MPa]
160 0
140
120 0
100
80
6
40
--- --shy 0
0
8 0
0
0
20
2 3 4
I 0 15
Fig 1 5 2
E = Et [MPa]
120
100
80
60
40
I I 0 35 065 085
0
Et= 17 81 qcp0844
( r = 0 128)
5
100
6 qcplMPo]
Calculated values of Young s modulus for piles No 1shy24 according to equation 1 5 2 and 1 56
0
0 0
E =898qcp127 (r= 0314)
E = 9 middot qcp 13 0
20 shy 0
0 0
0 1 2
loJ
I 0 35
3 I
065
4
I 085
5
100
6 qcp [MPo]
Fig 1 5 3 Calculated valueBof Young s modulus for piles No 1shy24 according to equation 1 5 4 and 1 5 6
I K 10 3
( 1 ] 1832
1400 0
1200 0
0
1000 0
800 0
m=2821 qcp0621
600 0
(r=0057)
400 0 0 0 0 0
200
2 3 4 5 6 qcp (MPa]
I 035
I 065
I 085 100 Io
Fig 15 4 Calculated valuesof the dimensionless compress ion modulus K for piles No 1- 24 according to equation 1 5 2 and 1 56
K ( 1 ]
0
1400
1200 0 0
1000
800
600
0
0 0
0
0 0
0 K= 1422 qcpl05
(r=0181)
0 K= 150 qcp
400 0
3)0 0 0
2 3 4 5 6 qcp(MPa)
I I -J 035 065 085 100 Io
Fig 1 5 5 Calculated values of the dimensionless compression modulus K for pile~ No 1-24 according to equation 1 5 2 and 1 5 6
104
120
100
2 3 4 5
I I I rv 0 15 035 065 085 100 lo
Bergdahl (1982) for shallow foundation
o----o Bozant Masopust (1981) D= 1 0 rn h=10 rn large diameter bored piles in noncohesive so il
0----0 Proposal according to current anal ysis
Klosinski (1977) D=090 to 125 rn large diameter bored piles in sand and sandy grave l
Mitchell Gardner (1976) very dense sand E=(35)q (it depends on sand density and stress history) c
Fig 1 5 6 Composision of Young s moduius
105
TABLES
0 Tab 1 11 Methods for detemination of the bearing capacity of bored piles (Ro llberg 1977)
Cl
Nol -- I Soil Areas of Q) Q) Editor Determination of Coefficients 5 type influenceqP qs p ~ C C 11 12 fP I fs
1 all Lab f Soil Mech (1936) l qp at the elevashy 1 0
2 all Huizinga (1951) ~ t~on of the pile 14 point
3 all Van der Veen (1953) ) 18 1 h+l14 all Van der Veen 1 0 Dpl375 D~ 15-- J qcmiddotdhBoersma (1957)
~ 11 +12 h - 12
5 12 all Menzenbach ( 1961) qc at the elevashy~ tion of pile point
6 18 all Mohan Jain Kuman (1963)1 average of qc over 1 h Q) h ~qcmiddotdhl 10 Dpj 3 75 Dj 15 50_micro
and 1 2C 11
7 I amp all de Beer ( 1964) graphically from 10 Q) qc 0 1 h+l18 u C
sand Soviet norm SNIP II 9ct9cp I4 bull O Dp I10 DP l66-1 083shyu clay B5- 67 Trofimenkov (1969) 2 50 1 251 +l J qc middotdh micro middot h middot-l l 2h-~ _micro
9 _micro u all Paproth (1972) at the elevation 3 5 I shy
) of pile point (Dpgt0 5 m 7 D8DpE
E-lt p 1 h+l1 1 h Dplt 5 m u l+l J qcmiddotdh h f qcmiddotd~ 30 Dpl 50 Dp 2 0 100shy10 sand Norwegian method
0l 2 h-12 200Senneseth (1974)
11 lall Soviet method h+l (20-0lqgl - 101 1 q middotdhTrofimenkov (1974) -- f C UpUsmiddotQct
l1+l2 h - 1212 Qct-Qcp 40 D~ 10 Dp 1 33- 0 67shyUsbullh 4 00 2 50
13 English method 10 DFJ 375Dp 10 I
Rodin Corbett Shershywood Thorburn (1974)
3 7 5 Dcl 8 0 DP 10h+l1 _1_ J qcmiddotdh 1 h
qcmiddotdh 20011 +12 h - 12 hb
1 h qcmiddotdh 150hf
0
Observations
fp I f (qp)fs C
Dp E = 1 cm Qbu = 2 Qpa (approx )
s fs=f (qc)
q=~g Us 0 h
fp=f(q~)
fs=f(qgl
bull fine grained non- cohesive soil loosely packed
bull fine grained non- cohesive soil medium dense comp
fine grained non- cohesive soil
Tab 111 (cont)
h+h bE 14 non-cohe- Meyerhof ( 1956 poundti J N 3o middot dh CtME fN3 o dh 1 0 DP 4 0 DP 10 100 etM= l 2
sive soil 1976) lJ +12 h - li hE o hgp taken into consi der ~ Ul (I)
E-lt
C 0
~E = 1 kgbull 30 cm
(statistical limit depth of the pile) hE - clamping length of
pile micro rrJ l-l micro (I)
15 C (I) p
sand Norwegian method
- irm - - - 10 IT
m = diagram O l-l Senneset (1 974) rrJO C
16 rrJ micro gravel English meth it 3 middot N30 - - - 10 - Jf 3 + diagram U) ~
E-lt p U)
iiouiu Coruett Sherwood Thorshyburn (1974 )
(NJQat the elevashytion of pile point1
0 -i
108
Tab 11 2
Results of calculati o n of p i le point load pile shaft load and total pile load from static con e penetration test (Rol l berg 1977)
~ gt
~ gt Ultima te Ultimate Ult imate
No Method micro micro poi nt skin bearing 080lt17nlt1 50 Q) -l
-l middot-i resistanceuro resistance r esistancE
middot-i p 0
(J n1 n n2 n n3 n n1 n2 n3
1
2
Lab fSoil Mech
Hu izinga (1951)
(1936 ) 430
307 i 3 Van der Veen (1953) 239
49
4
5
Van der VeenBoersma
Menzenbach (1961)
(1957) -l middot-i 0
2 4 7
1 57 1-CJ)
6
7
8
Mohan Jain Kumen
de Beer (1964)
Sovi et Norm (1969)
(1963) CJ) Q)
-l middot-i 0
lJ Q)
Q)
gt- CJ) Q)
c 0
2 44
1 37
183
47
t I
49
487
0 18
47
16
3 02
0 85 1
47
16
137
08
9
10
Paproth ( 1972)
Norw Method (1974)
~ 0
0
u I
C 0 C
1 8 1
180 l 46
1- - -_L~ 46 167 46 1 19
1 1 Soviet Method ( 1974) [1 1 41 46 1 62 13 083 13 1 14 0 8
12 Engl Method (1974) 2 66 35 128 35 2 30 35 1 28
Note
cal Q a) n = --- mean value of the rat i o between calculat ed pile loads and those n Q determined f r om loading test
b) n = number of piles
109
Tab 113
Point resistance of large diameter piles (DIN 4014 Part 2 1977)
Settlement Point pressure 1 Factor -fshy
(cm) (MPa) cf=lOMPa I i=15 MPa C C
Piles without enlarged base
1 05 005 003 2 08 008 005 3 11 0 11 007
15 34 034 023
Piles with enlarged base
1 035 0 04 002 2 065 0 07 004 3 0 90 009 006
15 2 40 0 24 0 16
Note 10 lt qp lt 15 (MPa)C
Tab 114
Skin friction resistance of large diameter piles (DIN 4014 1977)
Strength Static cone pen- Depth below Skin frict ion Factor of sand etration resist surface
(MPa) (m) (MPa) fs
Very small lt 5 - 0
Small 5 to 10 0 to 2 0 2 to 5 003 ln6 to 333
gt 5 005 100 to 200
Medium I I 10 to 15 0 to 2 0 I
I 2 to 7 5
gt 75 I 0045 0075
222 to 133 to
333 200
High I I
i
l
gt 15 0 2
to 2 to 10 gt 10
I I I
I
i
0 006 0 10
gt gt
250 150
Note Skin friction is assumpted as linear until s =2 cm and constant for s gt 2 cm
11 0
Tab 115
Values of the inverse of the point resistance factor (Bustamante 1982) fp
Soil type qPC I 1
Factor - shyfp(MPa)
for piles group
a) Silt and loose sand lt 5 0 40 -b) Moderately compact
5 - 12 040sand and gravel
c) Compact to very gt 12 i 030compact sand and gravel I
Tab 116
Values of the shaft resistance factor fs (Bustamante 1982)
Factor fs
Soil type qs
C Category I(MPa) I A I B I II A III BI
I a) Silt and loose lt 5 60
i 150 I 60 I 120-
sand
b) Moderately corn- I pact sand and 5 - 12 100 200 100 200 gravel i
Icl Compact to very
compact sand gt 12 150 i I 300 150 I 200I
I I and gravel i
I
111
Tab 117
Point resistance factor (proposal)
-
1-fp
qc (MPa)
Gravel
Coarse sand Medium sand
Fine sand Silty sand
25
080
0 70
060
5 0
0 65
055
047
75
054
045
039
10 0
045
036
031
150
035
027
022
200
030
0 23
018
Tab 118
Shaf t r e sistance factor (proposal)
fs
qc (MPa)
Gravel
Coarse sand Medium sand
Fine sand Silty sand
25
80
100
130
10 0
120
150
190
I 200
180
230
300
11 2
Tab 119
Calculated values qcp
for large diameter piles
Pile Literature Length Diameter (m) Measured p Cr1 lcul Settlement Note Authcr(year) No (ml D Dp (MPa)
(s=0 10Dp) (MPa)p ~~JL__
s s ()(mm) Dp
1 Franke (1977) 1 13 11 36 38 117 106 Garbrecht
2
3
2
3
13
14
11
15
1 58 36
37
38
40
215
185
136
123
) qg accord to Franke
4 4 13 15 204 3 2 33 220 108 and Garshy
5 5 6 11 33 35 127 11 5 brecht (1977)
6 6 6 11 153 36 35 146 9 5
7 7 6 1 5 34 35 158 105
8 -shy 8 6 15 2 1 41 3 0 109 52
9 10 9 11 39 52 47
10 11 95 11 43 35 77 70
11 12 9 11 49 66 60
12 13 10 11 15 5 1 4 0 77 5 1
13 14 9 11 1 5 4 8 46 115 77--shy14 Pranke ( 1973) 15 115 18 4 9
) ) average 88
15 13$ 13 5 1 3 19 -2 5 3 2 sd=3 0
16 - - 165 16 5 13 19 30 sv=0 34
17
18
Spang (1972)
llXJ
V90
6 6
6 75
0 7
09
3 2
4 2
32X
42X
x) s =0 10 D p
19 VlaJ 720 1 2 39 3 9X
20 - - VlsJ 6 5 1 5 3 0 3 ox
21 Touma and US59 9 9 o 76 8 0 Reese ( 1977)
22 HH 75 0 61 8 0
23 Gl 180 091 - 2 5
24 BB 137 o 76
sd = standard deviation
sv = standard variation
Tab 1 2 1
Ultimate point resistance coarse and medium sand psf (MPal (Pol ish Specification 1975)
Depth h
Medium sand r = 0 40 N = 200 30 Base diam (Op) and depthbase diam (hDp)
Dense sand r 0 Base diam (Op)
= 0 80 = 50N30 and dpethbase diam (hDp)
(ml Dp = 0 6 m Dp = 1 0 m Dp =12 m Dp = 1 5 m Dp = 0 6 m DP = 10 m DP = 12 m DP = 15 m
Psf hDp Psf hDp Psf hDp Psf hDp Psf hDp Psf hDp Psf hDp Psf hDp
5 10 83 0 85 5 0 075 42 07 33 20 8 3 16 50 14 42 13 3 3
7 14 11 7 1 2 70 11 5 8 10 4 7 2 8 11 7 22 70 2 0 5 8 1 8 47
10 18 16 7 15 10 0 14 8 3 1 3 67 35 167 28 100 2 5 83 2 2 67
15 18 250 18 15 0 16 12 5 15 100 4 2 25 0 3 4 15 0 30 125 27 100
20 2 4 333 2 0 200 185 167 1 7 133 4 7 333 3 8 200 33 167 30 13 3
25 26 41 7 2 2 25 0 20 208 19 167 5 0 41 7 4 0 250 3 5 20 8 3 2 167
w
11 4
Tab 131
Partial safety factors for resistance to axial load for bored piles (Wright Reese 1979)
Partial safety Normal Poor factor for control control
Unit skin resistance 1 70 185
(no load test)
Unit skin resistance 160 1 70
(from load test)
End bearing 165 180
Tab 1 3 2
Probability of failure of bored piles under normal design conditions (Wright Reese 1979)
Probability of Factor of Structure failure safety classification
5 10-3 25 monumental
210shy 22 permanent- 2
5 middot 10 2 0 110shy 1 85
temporary 5 bull 10-l 165
11 5
Tab 133 Results of field tests (Tejchman Gwizdara 1979)
L
II C C C 0 0 0
micro micro
micro micro micro For universal safe~y F2u u CUNo micro C C ~ ~g~ middot- C
~ Permisible micro micro i ~c -i micro
cmiddot-~ micro~ L
micro oo ~ load ~t~ ~~ omicro micro ~ ~ 3Z~ ~ ~ micro
-~~
~ e ~ --middot--
middot- ~ obull 0
~ g ~~ ~~ ~
~ L
o Jl i5 sect~ =gt L Q~ = yen t p Qp Qp
D h Q~ Srrx s tm p s E~ iQ~lQ~cm ~~ KN X ll1l kPa kPa kN kN kN Jl ~e ~ 1 2 3 4 5 6 7 8 9 10 11 12 13 14 15 16 17
1 70 6 60 4081 1550 2531 38 0 1182 10 4040 175 2041 245 1796 632 141 120
2 90 6 75 5082 3041 2041 598 1785 10 4782 107 2541 1079 1462 282 140 42 5
3 120 720 7259 4041 3218 557 1035 10 3576 119 3630 2158 1472 187 2 19 594
4 150 650 8643 4454 4189 51 5 928 20 2521 136 4326 2158 2168 3 10 166 253
5 130190 195 7750 3011 4709 392 805 10 1075 - 3875 981 2894 3 10 166 253
6 130190 165 9516 5101 4415 536 522 20 1800 - 4758 1962 2796 260 158 412
7 130190 135 8044 5199 2845 646 114 4 15 1834 - 4022 2109 1913 2 47 149 524
8 180 115 11380 4415 6965 388 792 15 1735 - 5690 2747 2943 161 2 37 483
9 76 980 6867 4316 2551 628 110 13 9529 109 3534 1128 2306 383 111 32 8
10 61 7 60 7161 2747 44 14 383 67 15 9404 303 3581 392 3188 700 169 109
11 92 180 4807 883 3924 184 20 8 1329 76 2404 196 2207 450 178 82
12 76 24 5 6769 736 6033 109 20 8 1623 103 3385 147 3238 500 186 43
13 76 137 5396 2060 3336 38 2 63 8 4535 102 2698 589 1109 350 t 58 218
14 120 23 5297 1854 3443 35 0 960 10 1640 39 2649 196 2453 945 130 7 4
15 135 16 7 13489 7554 5935 560 181 10 5260 83 6749 2060 4689 367 127 305
16 170 46 0 8829 2943 5886 333 17 10 3466 39 4415 1373 3042 2 14 1 94 31 1
Average Fi 387 166 Standard deviation Sd 2 1 5 034 Standard variation sv= 0 56 0 20
1234 Spang1972 567 8 Franke 1976 9 10 111 2 1 3 Touma Reese 1974
14 Colombo 1971 15 Kerisel Simons 1962 16 Appendino 1973
11 6
Tab 134
Results of model
SafetyScheme factor
medium F ssand
F p
loose F s
samd Fp
F 3 55 sd _P F 1 32 sd
s
tests (Tejchman Gwizdara 1979)
Diameter D (mm)
30 60 90 133
145 129 108 112
280 3 08 307 294
140 154 153 112
594 3 04 324 426
107 sv 030
0 19 sv 0 14
117
Tab 135
Individual safety factors according to literature
Literature proposal ofLiterature individual safety factor
Fs Fb
Polish Specification (1974) 100 250
Tejchman Gwizdala (1979) 150 400
Bustamante Gianeselli 200 300 (1982)
Decourt ( 1982) 130 400
average 145 3 38
TAB 141 0)
Load settlement curves - measured
Pile No
Settlement 1 c 3 4 5 6 7 8 9 10 11 12
s p s p p s
p p s P
p s P
p s p p s
P p s
P p s
p p s p p S
p I i p s
p p s p
mm MPa rrrn lifl5a MPa mm
lifl5a MPa
mm lifl5a MPa mm
RPa mmMPa nwa MPa mm
RPa MPa mm RPa MPa mm
RPa MPa mm RPa MPa mm
RPa MPa mm RPa MPa mm
RPa 10 045 222 09 1 1 05 20 07 143 06 167 08 125 0 5 20 08 125 10 100 08 12 5 15 67 16 63 20 092 21 7 14 43 08 25 10 20 0 1 1 182 12 167 0 9 22 2 12 167 18 111 14 143 24 83 22 9 1 30 125 240 1 7 I 7 6 1 1 273 1 2 250 14 214 15 200 1 2 250 15 200 25 12 0 19 15 8 30 100 26 11 5 40 1ti 250 20 10 0 14 28 6 14 286 1 7 235 18 222 1 4 286 18 22 2 3 2 12 5 23 174 36 111 3 0 133 50 20 250 22 ~27 1 7 294 1 5 333 20 250 2 1 ~38 1 7 294 1 9 263 37 135 27 18 5 4 2 11 9 33 152 60 2 2 273 24 ~5o 20 300 1 7 353 23 61 22 ~73 18 333 21 286 43 140 30 20 0 46 13 0 36 16 7 80 271 295 27 796 24 333 20 400 27 ~96 25 1320 22 364 25 32 0 53 15 1 36 222 41 195
100 322 31 1 30 333 28 357 22 454 31 1323 29 345 26 385 28 357 60 16 7 40 25 0 45 22 2 125 38 329 32 391 32 391 25 500 32 139 1 30 41 7 32 39 1 4 6 272 48 ~6 0 150 14 2 357 34 1441 36 41 7 27 555 36 ~1 7 34 44 1 36 41 7 175 36 486 39 449 30 583 38 ~61 38 461 200 38 526 42 476 32 625 225 39 577 33 682
(mmMPa) ( 1 MPa)
1
1=2074
t 1=O ~01 =0 98S
a1=1132
b1 =0 212 V =0994
a1=2217
b1=O 131
V =Q 978
a1=1860 b1=0233
V =Q966
a1=1562
b1=0174 V =Q983
a1=1382
b1=O195
V =0975
a1 =20 37
b1 =C 174
V =0957
a1=1443
b1=(l 193 v =O 961
a1=965
b1= 0071 V =0 990
a1=1 91
b1 =o 128
V =0 993
a1=5 83
b1=C124
v =O 981
a1=6 1 4
b1=01 64 v =U 985
li(MPa) ~9 4 7 76 43 57 middot5 1 57 5 2 141 78 81 61 cp (MPa) B8 39 40 33 35 35 35 3 0 39 3 5 49 40 __Ef ~-6 1 2 1 9 1 3 16 15 16 1 7 36 22 16 15 qcp
TAB 141 (continue) Load settlement curves - measured
Pi le No 3ettlement 13 14 15 1 17 18 19 20 21 22 23 24
s p s T5
p s T5
p s T5
p s P
p s P
p s P
p s P
p s P
p s T5
p s T5
p s p p s
p mm MPa lll1l
HPa MPa mm HPa MPa mm
fWa MPa mm fWa MPa lll1l
HPa MPa mm HPa MPa mm
MPa MPa lll1l NT5a MPa HPa MPa 111111
HPa MPa 111111
HPa MPa 1)1111
mra 10 1 7 59 075 133 06 167 075 133 ~95 105 09 11 1 07 143 3 76 1 7 59 08 133 10 100 20 2 4 83 130 154 095 21 1 1 15 17 4 1 75 114 16 125 12 167 ~7 74 33 6 2 1 3 15 3 1 9 103 30 29 103 1 7 176 1 2 250 15 200 r55 118 22 136 16 18 8 38 79 46 66 1 7 182 27 110 40 33 12 1 20 200 1 35 29 6 1 75 229 ~O 133 26 154 175 229 49 82 58 6 9 1 9 21 1 35 115 50 36 139 235 21 3 145 34 5 1 95 256 24 208 ~-4 147 28 17 9 20 250 gt8 86 6 9 72 2 2 233 4 2 11 8 60 39 154 265 22 6 1 55 387 2 15 279 28 214 ~6 16 7 30 120 0 2 2 27 3 o 8 89 80 7 5 2 3 262 80 43 186 31 258 1 7 47 1 36 222 14 05 198 33 124 2 25 320 B 1 98 25 327
100 45 222 18 556 39~ 253 ~-5 222 36 1278 27 370 ~8 113 125 47 26 6 20 625 42 29 8 149 255 28 1446 t50 22 682 3 0 500 175 200 225
(mmMPa) a1=479 a1=1206 a1=14 51 a1=1113 a1=1406 ~=836 a1=843 a1=1176 ~=64 a =561 a1=10 0 a1=9 5 (1MPa) b1=0175 b1=0 178 b1=0 382 b=0287 b1=O 119 p 1=0 137 h1 =o 193 b=0258 p1=0 049 b1=0032 b1=0 276 b1 =0 048
hf (MPa)
v =0998 57
v =0-987 5 6
v =0989 26
v =0992 35
v =0933 Iv =0991 84 73
v =0993 5 2
v =0998 tJ
3 9 =0944 v =0998 v =0996 v =0981
qcp (MPa) 46 39 32 30 32 14 2 39 30
lL 12 1 1 08 12 26 1 7 1 3 13 qcp
lD
N 0
TAB 142
Calculated point resistance curves
Setlement (mm) p(s)
1
n p(s)
Calculated value of the p(s) for pile No
2 3 4 5
n p(s) n p(s) n p(s) n p(s) 6
(MPa)
n p(s)
7
n p(s) 8
n p(s) 9
n p(s)
10 20 30 50 80
100
150 200 225
070 128 177 253 335
375 446 493
157 140 141
127
123
1 16 106
070 1 25 168 232
297
327 378 410
422
078 089 099 1 06
1 10
109 1 11 108
108
073 1 30 176 246
315 349
405 441
146 163
160 145
1 32 125
113 105
056 096
1 26
167 205 222
249 265
271
0 80 096
105
1 11 100 101
092 0 83
082
065
118 162 233
308 345
412 456
108 108
1 16 116 114 111
064
1 12 151 2 10 2 69
298
346 3 76
078 P63 093 tt 13 101 tt 53 100 I 13
108 ~75
103 ~04 096 ~ 55
~ 87
1 26 125 127 126
125
1 17 1 04
052 088
1 15 153
188 2 03 227 242
065 0 74
o 77 0 81 0 75
0 73
063
072 122
1 83 262 347 388
463 5 11
073
0 74
073 0 71 0 65 065
064 1 18
162 233 309
3 46
41 3 4 57
Dp (m) 1 1 Qcp (MPa) 38 (mmMPa) h2 8 1 1 9 Qcpbullv1(MPa) 72
158
39
124 14 55
15
40
n20 15 60
204
33 148 10 33
1 1
35
tt 4o 1 9 67
1 53 3 5
tt 4 0 1 5 51
15
13 5
114 0 15 i-gt 3
2 1
30
tt 6 0 10 3 0
1 1
3 9
12 4 1 9 74
1 1
3 5 h40
1 9 67
Note n = condition coefficient calculated p(s) measured p(s)
10
n
081
084 0 85 0 86 0 85
087
TAB 142 (continue)
Calculated point resistance curves
Calculated value of the p(s) for pile No (MPa) Setlement 11 12 13 14 15 16 17 18 19 20
(mm) p(s) ll p(s) n p(s) ll p(s) n p(s) n p(s) n p(s) n p(s) n p(s n p(s) n
10 106 070 0 71 045 091 054 099 1 32 055 092 053 070 060 081 085 0 72 080 055 078
20 1 90 079 130 059 160 067 1 70 1 30 096 101 091 079 1 12 148 085 1 31 082 098 082
30 258 086 1 76 068 2 15 074 222 1 31 1 26 105 120 080 156 205 081 180 082 132 083
50 363 086 246 075 297 082 296 1 26 1 70 117 161 082 228 095 295 087 256 0 91 184 092
80 471 316 o 77 3 77 088 364 1 18 2 1 o 1 24 199 308 085 393 097 336 1 02 237 095
100 522 349 078 415 092 394 228 1 27 2 16 348 088 442 098 375 104 262 097
150 611 405 479 443 258 117 244 423 529 443 304 101
200 669 441 518 473 276 261 474 587 488 331
Dp (MPa) 1 1 1 5 1 5 18 1 9 19 070 090 12 15
qcp (MPa) 49 4 0 46 49 32 30 32 42 39 30 12 a1 mmMPa) 84 h20 96 84 152 160 152 124 160
IV1 1 9 1 5 15 12 11 1 1 23 21 18 15
qcpmiddotv1 (MPa) 93 60 69 59 35 33 74 88 70 45
- 12287 average = ~ = 098
standard deviation sd = 023 standard variation sv = 023
N
122
TAB 143 Ultimate settlement for shaft resistance - summing up
Ultimate settlements (mm)Literature sand cohesive claysand
soil
Burland Butler Dunican (1966) 7
Touma Reese (1974) 10 Tomlinson (1977) 10 Klosinski (1977) 8
Francke Gerbrecht (1977) 20-30 DIN 4014 part 2 (1977) 20 10 Francke (1981) Reese (1978) (1979) 05-2 of 05-2 of Farr Aurora (1981) shaft dia~ shaft diam
5-20 mm 5-20 mm Tejchman Gwizdala (1979) - Spang (1972) 10
10 10 20
- Francke (1976) 10 20 15 15
- Touma Reese (1974) 13 8 15 8
8 - Colombo (1971) 10
- Kerisel Simons (1962) 20 - Appendino (1973) 10 Promboon Brenner (1981) 10 Prodinger Veder (1981) 12 Decourt (1982) 10-15 10-15
-average s = 14 1 10 126
standard deviation sd = 53 2 1 47
standard variation sv = 038 021 037
123
TABLE 14 4 Al l owab l e base resistance versus sett lement
Pile Li terature ength Diameter (m) Calculated qcp=qcp Settl ement Fp-3- sa (mm)No Aut hor No (m) D DP qcp (MPa) for qcp3(MPa)
1 Francke ( 1977) 1 13 11 38 127 25 Garbrecht
II2 2 13 11 158 39 130 19
II3 3 14 15 40 133 33
II4 4 13 15 204 33 110 23
II5 5 6 11 35 117 22
II6 6 6 11 153 35 117 19
II
8
7 7 6 15 35 1 17 25
II 8 6 15 21 30 100 21
II9 10 9 11 39 130 13
II10 11 95 11 35 117 15
II11 12 9 11 39 163 11
II12 13 10 11 15 40 133 7
II13 14 9 11 15 46 153 9
14 Francke ( 1973) 115 11 5 18 30 100 15
II15 135 135 13 19 32 107 29
II16 165 165 13 19 49 163 35
17 Spang (1972) V70 660 070 32 107 28
18 II V90 675 0 90 42 140 16
II19 V120 720 1 20 3 9 130 16
II20 V15C 650 150 30 100 16 average for pi les 198
standard dev sd = 78
standard var sv = 039
)assumed qc = p for s = 010 Op sonding meRsurement were not availab le
IV
TA~LE 15 1
Comparison of the initial sl ope of the pile point resistance - settlement curve
Accardi ng to 1 2 3 4
In i t i ~l 5
slope a1 for the pile No
6 7 8 9
(mmMPa)
10 11 12 13 14 15 Note
a 1 for s=10 mm 222 11 1 a1 for s=20 mm 21 7 14 3 calculated 207 113see Tab 14 1 Bo Berggren (198 )230s=20 mm
Schmertmann s method (see 202B Berggren 1981)s=20 mm
No 1 _ llNo - 6 1 97 098
202 250
22 2
400
30 8
090
14 3
200
186
076
167
182 156
286
18 2
107
125
167 138
091
20 0
222
204
426
263
098
125
167
144
087
100
11 1 9 7
182
23 5
1 03
12 5
14 3
11 9
174
164
105
67 83
58
14 6
125
1 16
63
9 1
61
103
59
8 3 48
123
13 3
15 4 12 1
1 10
167 21 1
aceto hypershy14 5 bola type curve
1 15
No 2 NQj = n1
No 4Noz ~ na No 5Naz= T]g
105 1 27
106
093
1 13
160
1 23
108 1 17
157
100
121 109
1 92
118
1 16 1 14
164
2 12
120
122
1 15
143
1 76
151
149 1 73 1 27 146
TAllLE 151 (continue)
Compa ri son of the initial slope of the pile point resistance - settl ement curve
Initial slope a1 for the pile No (mmMPa)According Note to 16 17 18 19 20 21 22 23 24 -a1 for s=10 mm 133 - 105 11 1 143 76 59 133 100 a1 for s=20 mm 174 - 114 125 167 74 62 153 10 3 calculated see 11 1 146 84 84 118 64 56 100 95Tab 141
Bo Berggren 198 67 78 25 0 114s=20 mm Schmertmann s method (see B 136 67 250 146 Berggren 1981) s = 20 mm
nG = 108 No 1NoJ = n 1 20 125 1 32 121 1 19 105 1 33 105 sd = 0 14
SY= 013 No 2 i) = 1 29ro1 = n1 157 136 149 142 1 16 1 11 1 53 108 sd = 019
SY= 015 No 4 iis = 143 INo2 = ns 091 126 1 63 111 sd = 033
SY= 0 23 No 5 ii9 = 1 37183 108 163 142INoz = n9 sd = 0 37
SY = 027
N Vl
126
TABLE 152
Measured and calculated pile point resistance
Pile Calculated Measured Measured No qcp P for
s=10 mm P for s=20 mm
~ 10 mm ~ 20 mm
- (MPa) (MPa) (MPa) - -
1 38 045 092 84 41 2 39 09 14 43 28
3 40 05 08 80 50 4 33 07 10 47 33 5 35 06 11 58 30 6 35 08 12 44 29 7 35 05 09 70 39 8 30 08 12 38 25 9 39 10 18 39 22
10 35 08 14 44 25 11 49 15 24 33 20 12 40 16 22 25 18 13 46 1 7 2 4 27 19 14 30 075 13 40 23 15 32 06 095 53 34 16 49 075 115 65 43 17 32 - - - -18 42 095 1 75 44 24 19 39 09 160 4 3 23 20 3 0 07 12 43 25
average= 484 291
sd 163 088 sv 034 030
Tab 153 Results of calculation for piles No 1-24
Pile No
Length (m)
Overburden pressure 0 vs
0hs (kPa)
0ve (kPa)
0 nc (kPa)
- -ov=o1 (kPa)
- -OV=03 ( kPa)
00 (kPa)
p(a il ( kPa)
s (a 1) (mm)
A2 ( 1 )
E t
(kPa)
Md ( 1 )
K (1)
E I
t (kPa)
( kPa) 1 2 3 4 5 6 7 8 9 10 11 12 13 14 15 16
l 2 3 4 5 6 7 8 9
10 11 12 13 14 15 16 17 18 19 20 21 22 23 24
13 12 14 13 6 6 6 6 9 95 9
10 95
11 5 135 165 66 675 72 65 99 75
180 137
l 33 133 123 116
70 70 70 70
104 102 95
102 95 94
106 139 95
101 106 97
180 137 221 215
53 53 49 46 28 28 28 28 42 41 38 41 38 38 42 56 38 40 42 39 72 55 88 86
202 202 216 202 1114 104 104 104 146 153 146 160 153 181 209 251 120 128 134 123 238 180 305 277
202 202 216 202 104 104 104 104 146 153 146 160 153 181 209 251 120 128 134 123 238 180 305 277
168 Hi8 170 159 87 87 87 87
125 128 121 131 124 138 158 195 108 115 120 110 209 159 263 246
128 128 133 124 66 66 66 66 94 97 92
101 96
110 126 154 79 84 88 81
155 118 197 182
141 141 145 136
73 73 73 73
104 107 104 111 105 119 137 117 89 94 99 91
173 132 219 203
950 975
1000 825 875 875 875 750 975 875
1225 1000 1150 750 800
1225 800
1050 975 750
2000 2000 625
1500
218 139 255 190 16 1 146 210 12 7 10 1 11 7 84 73 69
104 167 210 124 103 10 1 109 142 120 76
153
0802 0802 0822 0820 0798 0798 0798 0798 0791 0798 0800 0811 0814 0837 0837 0830 0769 0 768 0771 0 775 0 780 0 781 0 788 o 779
35296 81603 43312 65222 44019 67515 4609 91313 78186 60572
118115 15129 5 184075 95577 67017 81607 33252 67554 85294 75994 78816 74857 55101 54862
075 075 0 77 075 084 084 084 081 079 078 084 080 083 076 076 078 0 77 081 079 076 082 087 064 0 74
278 643 337 512 542 832 567
1085 766 572
1216 1417 1832
796 520 709 353 735 878 781 630 726 302 366
26472 61202 33350 48917 36976 56713 38656 73964 61767 47246 99217
121036 152782
72639 51932 63653 25604 54719 67382 57755 64629 65126 35265 40598
a=282l a =l781 y=axs S=0621 B=0 844
V=0 057 V=0 128 _ Iv -J
~
N co
Tab l53 Results of calculation for piles No 7-24
Pile No
17
1 2 3 4 5 6 7 8 9
70 11 72 13 74 75 16 17 78 79 20 27 22 23 24
Ground water
18
-20 m b s
-28 m -335 m -330 m -3 15 m dry dry -53 m -85 m
E t (kPa)
19
33653 64979 35364 45664 47969 54583 37574 63072 74548 57753
71 2618 123531 150297
71239 48619 59204 39744 77208 77863 62049 90407 95844 57762 62937
vxEt=E Md (kPa)
20
25240 48689 27230 34248 35254 45849 31562 51040 58893 45047 94599 98825
724747 54142 36950 46179 30603 57678 61572 47157 47734 83384 36968 46569
a=898 S=l 27 =0314
K (l )
21
265 511 275 358 517 672 463 749 730 546
1160 1157 7496
593 377 514 422 775 802 638 723 929 377 420
a=l422 S=l 05 =0187
E=E = t1 3
g-gcp (kPa)
22
51046 52799 54566 42492 45870 45870 45870 37547 52799 45870 77039 54566 65438 52799 40826 71039 40926 58739 52799 37541 82549 82549 40826 59945
Calculated s
(mm)
23
708 128 72 7 15 3 724 146 144 17 3 71 3 11 5 11 2 732 13 2 707 1 5 1 13 7 93
102 118 137 728 12 l 69
11 9
s__caL n=smeos
() 24
050 092 050 087 0 77 7 00 069 l36 l 12 098 133 l81 l97 103 090 065 0 75 099 117 126 090 101 097 078
ri=l00 sd=035 sv=035
K = l50gcp
25
570 585 600 495 525 525 525 450 585 525 735 600 690 450 480 735 480 630 585 450 825 825 1180 645
E l
(kPa)
26
67684 69465 72250 57726 44856 44856 44856 38448 59659 54306 74956 63214 70704 49089 56783 79502 45283 61081 58207 42927
708572 94785 71033 91898
E = t E middotA2
l
(kPa)
27
54283 5571 l 59389 47336 35795 35795 35795 30682 47790 43336 59964 51266 57553 47088 47024 65987 34823 46970 44877 33269 84639 74027 55974 71589
Calculated s
(mm)
28
l O l 12 l 11 7 737 15 9 18 7 185 21 1 12 6 12 2 133 14 l 150 13 7 13 l 14 7 709 12 7 738 755 12 4 735 50
100
- -
Tab l53 Results of calculation for piles No l-24
Pile
29
l 2 3 4 5 6 7 8 9
10 ll 12 13 14 15 76 17 78 19 20 21 22 23 24
sea l n= middotshy
smeas
28 TT
30
0 46 087 046 0 72 099 l 28 088 l 66 l 25 l 04 l 58 l 93 2 17 l 32 078 0 70 088 l 23 l 37 l42 087 l l 3 066 065
n=l 10 sd=0 44 sv=040
s seal for p n=s=lOrnn ac cording to s = 70mm
(mm)
37 32
5 l 0 51 ll 8 l18 64 064
13 0 l30 85 0 85
13 3 l 33 83 0 83
184 l84 ll6 l l 6 105 l05 137 l 37 21 3 2 12 19 4 l94 107 l06 l l 3 l l 3 84 084
92 092 l 0 9 l09 128 l28 83 083
l 0 3 l03 88 088 79 0 79
n=1 73 sd=025 sv=027
s for p according to s = 20mm
(mm)
33
10 4 184 102 18 6 15 6 200 14 9 276 209 18 4 219 292 274 185 17 9 12 9 -
169 194 219 172 200 143 15 0
seal n=s=20rnn
34
052 092 051 093 078 l00 075 l 38 l 05 092 l l 0 l46 l 37 093 090 065
-085 097 l1 0 086 l00 072 075
n=093 sd=025 sv=0 27
s for p according to s = 30rnn
(mm)
35
142 223 14 l 22 3 198 249 142 34 5 290 249 274 345 33 l 243 22 6 168 -
24 7 26 6 293 24 3 279 187 213
seal n=s=30rnn
36
047 0 74 047 0 74 066 083 047 l 15 0 97 083 091 l 15 l10 0 81 075 056 -
082 089 098 081 093 062 0 71
n=o80 sd=020 _ sv=0 25 N
IO
APPENDIXES
APPENDIX 1 1 1
Pi le No 1 Length 13 m D 10 m
Areas of influence
-
qe
(MPa)
1 fp
___9c_ f
(MPR) zyen
(MPf) qcp (MPa)
Soil type
22 20 18 16 14 1 2
l 2 (m)
10
1 0 08 06
16 15 16
026 027 026
42 41 42 Sand
04 14 U28 39 02 14 028 39 41
02 16 0 26 42 04 16 026 42 06 16 026 42 08 14 028 39 Sand 1 0 13 030 39 12 15 027 4 1 38 14 13 030 39 16 12 032 38 18 12 032 38
40 20 10 036 36 22 10 036 36 24 9 U39 35 2 6 8 043 34 28 10 036 36 30 10 036 36 3 2 10 036 36 34 10 0 36 36 36 11 0 34 37 38 11 034 37
l 1 (m)
40
42 44
11 0 34 37 15 1
46 48 50 52 54 56 58 60 62 64 66 68 70 7 2 74 76 78 8 0
APPENDIX 112
Pile No 2
to little depth of sounding
q~ = middle values for 11 = 2 Op
q~ = 145 MAa (Francke Garbrecht 1977 Tab 2 p 50) (Fi g No 2)
for sand
qcp = 0275middot145 = 40 MPa q~p =V ~~s) middot 40 = 097middot40 = 39 MPa
Pile No 4
q~ = 120 MPa sand (Fig No 4)
q = 0 315middot12 = 3 8 MPa q bull 38 = 086middot38 = 33 MPa=V Jmiddot54
1
cp middot bull cp
Pile No 12
qg = 155 MPa sand (Fig No 13)
qcp = 026middot155 = 4 03 MPa
Pile No 13
q~ = 200 MPa sand (Fig No 14)
q = 0 23middot20 = 46 MPacp
APPENDIX 113
PileNo3 Length 14 m D 15 m
Areas of influence
-
qe
(MPa)
1 Tp
----9cf
(t-1Pf) r~
(MPf) qcp (MPa)
Soil type
22 2D 18 16 17 025 43 14 17 II II
L 2 17 II II
12 (m)
16 10 08 06
17 17 17
o
II
II
II
II
Sand 04 17 II II
02 19 024 46 b9
02 19 024 46 04 17 025 43 06 15 027 41 08 13 030 48 1 0 12 032 38 12 11 033 36 14 13 0 30 39 16 14 028 39 18 12 032 38 40 20 16 026 42 2 2 16 026 42 24 11 033 36 26 11 033 36
60 28 30
10 10
036 036
36 36
Sand
32 10 036 36 34 12 032 3 8 3 6 12 032 38 38 12 032 38
1 1 (m)
40
4 2 4 4
13
14 16
030
028 026
39
39 42
46 13 030 39 48 12 032 38 50 14 028 39 52 10 036 36 54 13 030 39 56 14 028 39 58 15 027 41 60 15 027 ~-1 236 62 64 66 68 70 72 74 76 7 8 80
APPENDIX 114
Pi l e No 5 Length 6 0m D 11 m Dp 11 m
Area s of i nfluence
-
qc
(MPa)
1 Tp
-3Lf
( MPf) l ~
(MP~) qcp (MPa)
Soil type
2 2 2 0 18 1 6 14 1 2 155 U i1 33
l 2 (m)
1 2 10 08 06
15 14 12
022 023 0 27
3 3 32 32
Fine sand
+ silt
04 125 026 33 02 16 0 21 34 39
02 16 021 34 04 13 025 33 06 08 10
15 5 17 20
022 0 20 018
34 34 36
35 Fi ne sand
1 2 20 0 18 36 14 20 018 36 + s ilt 16 20 0 18 36 18 165 020 32 20 165 0 20 32 22 17 0 20 34 24 26 2 8 30 32 3 36 38 4 0
19 21 5 21 5 21 5 20 19 5 19 5 20 215
01 9 ---
018 018 0 18 0 18 -
3 6 40 40 40 36 35 3 5 36 4 0
l 1 (m) 4 2
44 20 19
018 01 9
36 3 6 157
46 48 50 5 2 54 56 58 6 0 62 64 66 68 70 7 2 74 76 7 8 8 0
APPENDIX 1 15
Pi le No 6 Lengt h6 0 m D 11 m
Areas of qc 1 __9_c_ qcp Soil typei nfluence fp f 1 yen (MPa) (MPf ) (MPf) (MPa)
-2 2 20 18 16 t 4---0 14 75 038 29 L2 20 018 36 Fi ne sand
1ti 10 30 40 + s i lt12 08 19 0 19 36(m) 06 17 020 34 04 14 023 32 02 9 034 31 56
02 6 043 26 04 12 026 3 1 06 17 020 34 08 11 028 3 1 1 0 14 023 32 35 1 2 17 020 34 Fi ne sand14 19 019 35 16 20 018 36 + silt18 18 0 19 34 20 14 023 32
46 22 12 026 31 24 12 026 31 26 15 022 33 28 18 019 34 30 20 018 36 3 20 0 18 36 34 20 018 36 3G 20 018 36 38 20 018 36 4 0 20 018 36
l 1 42 22 40
(m) 44 22 40 46 L2 4 0 158 48 50 52 54 56 q =V ~ - 3 b =0 99middot35 = 35 MPp cp 53 58 6 0 62 64 66 68 70 72 74 76 78 80
APPENDIX 116
Pi leNo7 Length 60 m 0 15 m
Areas of influence
-
qe
(MPa)
1 Tp ~
(MPg) r~
(MPf) qcp (MPa)
Soil type
22 20 18 16 9 U33 30 14 10 031 31 12 135 024 32
l 2 (m)
16 10 08 06 04 02
13 12 6
10 175
025 026 043 0 31 020
33 31 26 3 1 35 50
Fine sand
+ silt
02 04 06
17 10 115
0 20 0 31 027
34 31 3 1
08 10
145 185
023 019
33 35 3 5
1 2 14
20 19
018 0 19
36 36 Fine sand
l 1 (m)
60
16 18 20 22 24 26 28 30 3 2 34 36 38 40
42 44 46 48 50 52 54 56 58 6 0
185 125 125 165 17 19 21 215 205 20 21 20 20
24 22 20 215 22 22 21 19 18 22
0 19 026 0 26 020 020 019 --
018 018 -
018 01 8 --
018 ----
0 19 0 19
35 33 33 33 34 36 40 40 37 36 40 36 36
40 40 36 40 40 40 40 36 34 40 219
+ silt
62 64 66 68 70 72 74 76 78 80
APPENDIX 117
Pile No 8 Length60 m D 15 m Dp 2 1 m
Areas of influence
-
qe
(MPa)
1 r +
(MPg) r~
(MPf) qcp (MPa)
Soil type
22 18 019 34 20 16 021 34 18 125 026 3 3 16 115 027 31 14 11 028 3 1 12 11 028 3 1
l 2 (m)
10 08 06
105 11 145
D29 028 023
30 31 33
Fine sand
+ silt
04 18 0 19 34 02 18 019 34 71
02 15 022 33 04 11 0 28 31 06 13 0 25 33 08 20 0 18 36 10 15 022 33 12 13 025 33 14 175 020 35 16 18 20 22
20 21 20 15
018 -
018 0 22
36 40 36 33
35 Fine sand
+ s i lt
24 26 28 30 3 =
13 16 175 19 20 20
025 021 020 0 18 018 018
33 34 3 5 34 36 36
36 38 4 0
20 20 21
018 0 18 -
36 36 40
11 (m)
4 2 4 4 4 6 48 50 5 2 5 4 56 5 8 60 6 2 6 4
20 20 21 22 21 20 19 175 19 20 25 28
018 0 18 ---
01 8 01 9 0 20 0 19 018
36 36 40 40 40 36 36 35 36 36 40 4 0 23 0
6 6 68 70 72 74 76 78
qcp 1f5=v 2T middot35 = b85 middot35 = 30 MPa
80
APPENDIX 118
Pi le No 9 Le ngth 90 m D 11 m m
Areas of 1Qe -9c qcp Soil typeinfluence Tp f ryen (MPa) (MPg) (MPf) (MPa)
-
2 2 2 0 18 16 14 lc 11 034 37
12 10 10 036 36 12 08 9 039 35 Medium(m) 06 10 036 36 sand04 10 036 36
02 11 034 37 43
02 12 032 38 04 12 0 32 38 06 12 0 32 38 08 13 030 39 10 13 030 39 12 13 030 39 14 14 028 39 16 14 028 39
44 18 14 028 39 20 14 028 39 39 Med ium 22 15 027 4 1 sand 24 16 026 4 2 26 17 025 43 28 13 0 30 39 3 0 9 039 35 32 13 030 39 34 16 026 42 36 17 025 43 38 17 025 43 40 19 024 4 6
11 42 17 025 43
(m) 44 15 027 41 17 7 46 48 50 52 54 56 58 60 6 2 64 66 68 7 0 7 2 74 76 78 80
APPENDIX 119
Pi 1 e No 10 Length 95m D 11 m m
Areas of influence
-
qe
(MPa)
1 fp
-9c f
(t-1Pf) [~
(MPf)
qcp
(MPa)
Soil type
22 20 1 8 16 14 L 2 13 Uti 3J
l 2 (m) 12
10 08 06 04
18 18 28 19
0 19 019 0 19 019
34 34 34 34
Fine
sand
02 21 40 42
02 20 4 0 04 17 020 34 06 21 40 0 8 10
23 22
40 40 Fine
1 2 14 16 18
21 20 16 15
0 21 022
4 0 4 0 34 33
sand
44
20 2 2 24 26 28 30 32 34 36 38 40
14 14 13 11 11 14 17 14 12 13 12
023 023 025 0 28 028 023 020 023 027 025 027
32 32 33 31 31 32 34 3 2 32 3 3 32
l 1 (m) 42
44 12 13
0 27 025
32 33 15 2
46 48 50 5 2 5 4 56 5 8 6 0 6 2 6 4 66 6 8 70 72 74 76 78 80
APPENDIX 11 10
Pi 1 e No 11 Lengt h 9 0m D 11 m m
Area s of influence
-
Qe
(MPa)
1 fp
__k_ f
(MP~) ryen
(MPf) qcp (MPa)
Soi l type
22 20 18 16 14 12 lb 55
12 (m)
1 0 08 06 04
23 19 20 21
024 023
55 46 46 55
Medium
sand
02 22 55 62
0 2 04
24 25
55 55
06 08
27 28
55 55
10 12 14
28 28 28
55 55 55 49
16 26 55
44
18 20 22 24 26 28 30 3 34 36 38 40
24 19 18 17 22 21 17 11 13 12 11 9
024 024 025
025 0 34 030 032 034 039
55 46 43 43 55 55 4 3 37 39 38 3 7 35
1 1 (m) 42
Ll Ll
12 16
032 0 26
38 4 2 209
46 48 50 5 2 54 56 58 60 62 64 66 68 70 72 74 76 78 80
APPENDIX 141
0 2 3 4 p [MPa)
PILES WITH 40 ENLARGED BASES
80
120
160 C----0
200 IN4014 s (1977)
[mm]
P s calculateds P p(s)(mm) (MPa)(mmMPa)(MPa) ()
10 035 286 046 20 065 308 080 30 090 333 104
150 24 625 214 200 229
ai = 2605 (mmMPa) b1 = 0243 1MPa V 1000 bi = 1b = 411 MPa
_ 411 MP Vi - 24 a
() assumed
average Dp = 18 m
qcp = 24 MPa ai = 184 (mmMPa) (28-4middot24)
Vi = 1 2 (3-18)
qcpmiddotvi = 29 MPa
40
80
120
160
200 s
[mm]
DIN 4014 Part 2 ( 1977)
0 1 2 3 4 5 p [MPal
PILES WITHOUT ENLARGED BASES
C----0
DIN 4014 ( 1977
s calculated s p -p- p(s)
(mm) (MPa)mmMPa)(MPa) ()
10 05 20 062 20 08 25 113 30 11 27 3 155
150 34 441 385 200 424
ai = 2085 (mmMPa) bi= 0 157 1MPa V = 0970
bi= 1s = 637 MPa
Vi 187=3f =
() assumed
average Dp = 12 m
qcp = 34 MPa a1 = 144 (mmMPa)
Vi = 18
qcpmiddotvi = 61 MPa
Range qc = 10-15 MPa
(28-4bull34)
(3-12)
1 1 q = r -r- = 036 for qc = 10 MPaCp p Ip+= 027 for qc = 15 MPa
qcp = 36-405 MPa P
APPENDIX 142
Touma F and Reese L (1974)
Soil parameters pile parameters and base resistance see fig bullbullbullbull
TAB
Measured load settlement curves
Settlement s
mm
10 20 30 40 50 60 80
100 120
a 1 (mmMPa) bi(MPa) V
N3u
q =04 -N30 (cMPa) ()
1 qCp=--rpbullqC
Pile No 21 (US 59) 22 (HH) 23 (G1) 24 (BB) Notep Sp p S p p S p f Sp MPa mmMPa MPa mmMPa MPa mmMPa Mla mmMPa
131 76 169 59 075 133 100 100 269 74 325 62 131 153 1 94 103 381 79 456 66 165 182 273 11 0 488 82 581 69 1 90 21 1 349 115 581 86 694 72 2 15 233 424 118 675 89 800 75 229 262 813 98 245 327 884 113 925 130
64 56 100 95 U049 0032 0276 0048 0944 0998 0996 0981
80 gt100 30 60 32 gt 40 12 24 ()
Bergdahl (1982)
gt5 5 gt55 32 4 3
(0 18middot32) (018middot40) (0265middot12) (018middot24)
CONTACT PRESSURE p [ MPa]
0 2 4 6 8 100 N-------r---------------(us 59) ( HH) ( BBi
E E SQ-------lt+-----+--------------lt
VI
1shyz UJ
~ 100 1---------i----+----+----+------l------I -J I shyI shyUJ V)
so~----~--~-- ~--~
APPENDIX 143
us 59 fYJo 0 50 00
ff-t r-=-~c~=~-r~c_---_---l-~e-J-C~ 0 ------
CLAY
FINE SANO
J lD- 760 mm
f5m~--~--~
Pile US 59 and results from penetration test
HH IV_l() so 100 r=-=-==-==-r-~--=-=- 0 0 II 15- flf ~ II~ Ibull If t f
CLAY SAND
Sm
)
= -middotl lo - GtOmm
~ JI
SILTY SANO tOm
Pile HH and results from penetration t est
APPENDIX 14 4
61 NJO 50 --------00
11 1 =f J - 1 -- 0
CLAYSILT
E ~ Sm ltrj
SILTY SAND
q I lDmiddot 910 mrn tom
I) t bull
Pile G1 and results from penetration test
88
0 50 too ~1-e I q 111bull - Q
CLAY
SIL TY SAND 5m
]
l lDmiddot760mrn
Om
Pile BB and results from penetration test
APPENDIX 145
Klosinski B (1977)
Loading tests 50 bored piles 09-125 m diameter average Op= 11 m On t he sett l ement of rigid pla te the settlement of t he pi le base is given by
PmiddotOSp = T-K b
where Mb - equivalent deformability modu lus
1) Sand and sandy gravel of medium density
Mb = 25-50 MPa
According to Bergdahl (1979) medium sand is between
q(l) 5 MPa (Io=035)c2)
ql = 10 MPa (Io=065)C
from fig 117 rp1 = 055 for qc = 5 MPa 1Tp = 036 for qc = 10 MPa
q(l)= 0 55middot5 = 2 75 MPacp bull
q(2= 0 36middot10 = 360 MPacp
allowable p~ 1)= ~p = yen = 092 MPa and p~2) = ~ = 120 MPa
settlement of the pi l e base
5(1)= o 92 middot 1bull1 = O 0135 m = 13 5 mm p 325 middot middot
5( 2)= 1bull2bull1middot 1 = O 0088 m = 8 8 m p 350 bull bull
1) _ s _ 135 _ 14 7 (mm) a(2) _ 88 _ a 1 - p - o---92 - bull NPa bull 1 - T-7 - 733 (Wa)
2) Loose sand lo= 030-040
Mb = 12- 25 MPa
q~l) = 44 MPa q~2)= 58 MPa
1Tp = 058 and 052
q(3) = 0 58middot4 4 = 2 55 MPa middot q( 4) = 0 52middot5 8 = 3 02 MPa cp bull middot bull cp bull middot middot
allowable p~ 3)= 4i = 085 MPa p~4)= yenl = 101 MPa
s(3)_ 085-11 = 26 mmmiddot s(4)_ 101middot11 = 148 mm p - 312 p - 3 25
STATENS GEOTEKNISKA INSTITUT Swedish Geotechnical Institute S-581 01 Linkoping Tel 01311 51 00
Serien Rapport ersatter vara tidigare serier Proceedings (27 nr) Sartryck och Preliminara rapporter (60 nr) samt Meddelanden (10 nr)
The series Report supersedes the previous series Proceedings (27 Nos) Reprints and Preliminary Reports (60 Nos) and Meddelanden (10 Nos)
RAPPORT REPORT Pris kr
No Ar (Swcrs)
1 Grundvattensankning till foljd av 1977 50shytunnelsprangning P Ahlberg T Lundgren
2 Pahangskrafter pa langa betongpalar 1977 50shyL Bjerin
3 Methods for reducing undrained 1977 30shyshear strength of soft clay K V Helenelund
4 Basic behaviour of Scandinavian soft 1977 40shyclays R Larsson
5 Snabba odometerforsok 1978 25 shyR Karlsson L Viberg
6 Skredriskbedomningar med hjalp av 1978 40shyelektromagnetisk faltstyrkematning - provning av ny metod J Ingands
7 Forebyggande av sattningar i 1979 40shyledningsgravar - en forstudie U Bergdahl R Fogelstrom K - G Larsson P Liljekvist
8 Grundlaggningskostnadernas fordelning 1979 25 shyB Carlsson
9 Horisontalarmerade fyllningar pa los 1981 50 shyjord J Belfrage
RAPPORTREPORT
No
10 Tuveskredet 1977-11-30 Inlagg om skredets orsaker
11a Tuveskredet geoteknik
l1b Tuveskredet geologi
11 c Tuveskredet hydrogeologi
12 Drained behaviour of Swedish clays
R Larsson
13 Long term consolidation beneath the test fills at Vasby Sweden YCE Chang
14 Bentonittatning mot lakvatten T Lundgren L Karlqvist U Qvarfort
15 Kartering och klassificering av leromradens stabilitetsforutshysattningar L Viberg
16 Geotekniska faltundersokningar Metoder - Erfarenheter - FoU-behov E Ottosson (red)
17 Symposium on Slopes on Soft Clays
18 The Landslide at Tuve November 30 1 977 R Larsson M Jansson
19 Slantstabilitetsberakningar i lera Skall man anvanda total spanningsanalys effektivspanningsanalys eller kombinerad analys R Larsson
20 Portrycksvariationer i leror i Gateshyborgsregionen J Berntson
21 Tekniska egenskaper hos restproshydukter fran kolforbranning shyen laboratoriestudie B Moller G Nilson
Ar
1981
1981
1981
1981
1981
1982
1982
1982
1983
1982
1983
1983
1983
Pris kr (Swcrs)
50shy
50shy
40shy
50shy
100shy
60shy
80shy
60shy
190shy
75shy
60shy
150shy
65shy
RAPPORTREPORT
No Ar Pri s kr (Sw crs)
22 Bestamning av jordegenskaper med sondering - en litteraturstudie U Bergdahl U Eriksson
1983 75 shy
23 Geobildtolkn ing L Vi berg
av grova moraner 1984 70 -
24 Radon i jord -Exhal ation- vatten kvot -Arstidsvariationer - Permeabilitet A Lindmar k B Rosen
1984 75 shy
25 Geoteknisk terrangklassificering for fysisk planering L Viber g
1984 120shy
26 Large diameter bored piles in nonshycohesive soils Determination of the bearing capacity and settlement from results of static penetration tests (CPT) and standard penetration test (SPT) K Gwizdala
1984 85shy

5
CONTENTS
Page
7SUMMARY
NOTATIONS AND SYMBOLS 9
1 LARGE DIAMETER BORED PILES IN NON-COHESIVE SOILS 11
11 Determination of bearing capacity of bored piles from results of Cone Penetration Test (CPT) 11
12 Determination of bearing capacity of the large diameter bored piles from results of the Standard Penetration Tests (SPT) 18
13 Allowable load of large diameter bored piles 22
14 Determination of settlement of large diameter bored piles based on static cone penetration tests CPT 27
15 Initial slope of pile point resistance shysettlement
REFERENCES
FIGURES
TABLES
APPENDIXES
curve 37
43
51
105
7
16 Summary
The work contains a study of the behaviour of l arge diameter
bored piles in non- cohesive soil The mai n attention was
paid to the determination of the bearin g capacity a nd
sett lement from results of Cone Penetration Test (CPT)
and Standard Penetration Test (SPT)
A new met hod to calculate bearing capacity on large bored
piles based on the in situ measurement is proposect taking
into account investigations made during the last years in
all the world The values based on the proposed method
are compar ed to field test results
The analysis of bearing capacity safety factors and loadshy
settlement curve allows to assume values individual safety
factors for resistance of pile point and shaft respectively
Based on a detailed investigation the pile point pressure
settlement curve and shaft resistance dependance during
loading a new method to predict the pile point pressure shy
displacement and load- settlement relationship is proposed
The initial slope of the point pressure- displacement curve
can be determined from in situ tests or laboratory test
based on the hyperbolic stress- strain parameters
9
Notations and symbols
Roman letters
a 1 Initial slope of the pile point resistance shysettlement curve
Ap Cross-sectional area of a pile
As Area of the pile shaft
CPT Static Penetration Test
D Diameter of pile shaft
Op Diameter of pile point
E Youngs modulus
fp Point resistance factor
fs Shaft resistance factor
F Universal safety factor
Fp Individual safety factor for ultimate resistance of pile point
Fs individual safety factor for ultimate resistance of pile shaft
K Dimensionless compression modulus
K At rest soil lateral stress coefficient0
Koc Lateral stress coefficient for fluid fresh concrete
Mo Constrained (oedometric) modulus
N30 Numbe r of blows for 030 m penetration in SPT
p Unit point resistance (contact pressure)
p (s) Unit point resistance versus settlement
Unit point resistance at failurePsf
Allowable unit point resistancePa
Sounding resistance
Average static cone penetrometer resistance close to tne pile point
qs Average static cone penetrometer resistance C along the pile
10
Ultimate point resistance of large diameter piles based on static sounding results
Ultimate skin friction resistance of large diameter piles based on static sounding results
Qa Allowable pile load
Qcp Point load of the static cone penetrometer
Qct Total load of the static cone penetrometer
Qpa Allowable point resistance of the pile
Qpu Ultimate point resistance of a pile
0 sa Allowable skin resistance of the pile
0su Ultimate bearing resistance of a pile
Qu Ultimate bearing resistance of a pile
s Settlement
sd Standard deviation
ss u Ultimate settlement for pile shaft
sv Standard variation
SPT Standard Penetration Test
t Unit shaft resistance
Ultimate unit shaft resistance
Circumference of the pile shaft
Circumference of the static penetrometer shaft
Greek letters
a Constant
B Constant
A Coefficient
microd Depth factor
v Poissonbulls ratio
v 1 Correction factor for hyperbola point resistance shysettlemen~ relationship
n Correlation coefficient
ahc Radial (horizontal stress in the concrete
ohs Radial (horizontal) stress in the soil
Ovc Vertical stress in the concrete
Ovs Vertical stress in the soil
11
1 LARGE DIAMETER BORED PILES IN NON-COHESIVE SOILS
11 peterminati on of bearing capacity of bored piles
from results of Cone Penetration Test (CPTl
The methods published in available literature up to 1976
were compiled by D Rollberg (1976 1977) It contains
totally 25 methods
- 22 use the results of static soundings (CPT)
3 use the results of standard soundings (SPT)
The failure load Qu of the pile is evaluated as the sum
of the pile point resistance Q and the pile skin reshypu sistance Qsu
(111)
Pile point resistance Q based on static soundina reshypu shysults can be expressed as
1- bull qP A ( 1 1 2)f C p
p
where
fp = point resistance factor
qP mean sounding resistance of static cone C
penetrometer in the area of the pile point
A cross-sectional area of the pilep
The pile skin resistance is expressed as
1 s -- bullq bullU middot Lih (113) fS C p
where
fs = shaft friction factor
sqc mean sounding resistance along the depth h
and skin surface area U middotLih p
1 2
The methods differ in
- the calculation of qPC
(074 to 40) Db below the pile base (Fig 11 1)
(10 to 80) Db above the pile base (Fig 1 11)
- the evaluation of the point resistance factor usually
values off gt 10 are used p
- the calculation of qsC
- the evaluation of the shaft friction factor
fs = 50-300 is applied
In Table 111 methods for determination of the bearing
capacity of bored piles are listed Rollberg 1977 The
point load the skin friction load and the ultimate total
load are evaluated for bored piles (shaft diameter D ~
03-090 m) from static sounding results in non-cohesive
soil
Calculation results based on static sounding measurements
are shown in Table 112 for pile point pile shaft and
total pile load respectively
The table shows that
- a ll methods overestimate the ultimate point resistance
- the best correlation for ultimate point resistance is
obtained with the Soviet method Trofimenkov 1974
n1 = 114
- there a re only five methods for evaluation of the ultimate
skin resistance
- all methods with exception of the Soviet norm Trofimenkov
1969 method overestimate the ultimate shaft resistance
- the Norwegian method Senneset 1974 gives the best
correlation for the ultimate shaft resistance =119n 2
- with exception of the Soviet methods the total ultimate
load is on the average overestimated by all methods
1 3
Taking into account the above results the Soviet and
the Norwegi an methods are presented below
The Soviet method JG TrofimenkgtV 1974
1 qP bullA + qsbullA (114a)Qu = Qpu+Qsu fp C p f C s s
where
11 40 DP 12 1 0 D p h+l1 qp r dhqcC l1+l2 h-12
0ct-0ceqs C u middoth s
f(qp) -+ see Fig 1 bull 1 2 fp C
f f ( qcs) -+ see Fig 1 1 3 s
The Norwegian methon K Senneset 1974
1 p A 1 s bullA ( 1 bull 1 bull 4b)-f-middotqcmiddot p + -f-q s p S C
where
11 30 D p
12 50 D p h+l11 f dhqP l1+l 2 qc
C h-12 h s 1
= f dhqc qch 0
f 20 p
f = f (q~ ) + see Fig 114 s
Note a ) The total skin friction -f-middotq~ is assumed to be
no less than 10 kPa even~ith a very little
cone penetrometer resistance
b) The poin t resistance -f-middotq~ is assumed to be
maximum 10 MPa even iJl case of very dense sand
14
It must be underlined that the best correlation for
the pile point is obtained with the Soviet method
101 for 94 driven piles in non-cohesive soil
- 172 114 for 46 bored piles in non-cohesive soil
Trofimenkov 19731974 showed the results of comparison
of the ultimate loads determined by formula (114a)
Q~ and by pile load tests Q~ for 153 driven friction
piles at the 57 various sites see Fig 115
In Germany a lot of investigations were made before
establishing the DIN 4014 part 2 (1977) on large diameter
piles
In Table 113 and 114 the results from these investigashy
tions are generalized
The data in the tables were obtained from 35 test loadings
(4 of which were published by Franke 1973 The diameter
of the piles was from 08 to 25 m the length from 5 m
to 34 m and the cone penetrometer resistance varied from
10 MPa to 15 MPa
Bustamente and Gianeselli 1982 proposed a prediction
of the pile bearing capacity by means of the static
penetrometer Their proposal was based on the intershy
pretation of a series of 197 full scale static loading
tests In this paper the results from tests of 55 bored
piles are chosen The diameter of the piles varies from
042 m to 150 m and the length from 6 m to 44 m The
equivalent cone resistance was determined as showed in
Fig 116 The authors have noticed that the point
resistance factor f depends on the nature of the soil p and its compactness but also on the different pile placeshy
ment techniques (see Tab 115)
Piles of category group I
- Plain bored piles - Cased bored piles
- Mud bored piles - Hollow auger bored piles
- Type I micropiles - Piers (grouted under low - Barrettespressure)
15
In Tab 116 values of the shaft resistance factor
fs are given
Category IA
- Plain bored piles - Mud bored piles
- Hollow auger bored piles - Cast screwed piles
- Type I micropiles - Piers
- Barrettes
Category IB
- Cased bored piles - Driven cast piles (concrete or metal shaft)
Category IIA
- Driven precast piles - Prestressed tubular piles
- Jacked concrete piles
Category IIB
- Driven metal piles - Jacked metal piles
It can be noted that the values in Tab 116 are in
genera l of the same range for the driven and the
bored piles
According to the Polish Specification 1979 the point
and shaft resistance factor are given by
1-f- = kmiddota
p p
where
ap 035 for sand
k coefficent of unhomogeneity k qcp min
qcp
= 0065 for sandfrac12
1
16
Similar results can be observed in Fig 116a and
Fig 116b It was showed by Kerisel (1965) and Franke
(1973) that the harder soil the more loosening at
excavation and thus relatively smaller bearing capacity
Taking into account the Franke diagrams we will have
for D = 125mand settlements= 2 cm p
Cone resistance qc (MPa) 1 5 50 1 0 15 22
qc p for s=2 cm 3 6 8 12 14
(see Fia 1 1 6b )
taking safety factor for pile base F = 3 the point resis~ance
33-10 ~-05
380375 lo 212 bull lo 2114 bull
factors- shy are p
The above anal ysis shows that it is possible to determine
ultimate point and shaft resistance of bored piles from
static cone sounding But it is very important and must
be taken into account type of pile kind of soil and
degree of compaction
Bel ow calculation method for large diameter bored piles
based on the static cone penetrometer resistance (CPT)
is proposed Equation (117) can be used directly for
the base diameter D lt 15 m For larger diameters p shyD gt 15 m the values should be multiplied by the
p ff t ITscoe icen Y~ as pi
( 1 1 5 )
where
qcp = according to equation (117)
D = diameter of the pile base D gt 15 mpi pi
17
This value q~p should be put into equation 116
The value qc s in equation 118 is independent on the
pile diameter
Proposed calculation method
(116)
where)
1 1 40 ~ 11 3 for piles wit h a nd enlarged bases12 10 12 = ~
h+h
q (h) dh (117)qcp l1+l2 f -f- Ch-li p
h 1 f 1
qcs = o -f- qc (h) dh (118)h s
1 -f- = f(q kind of soil ) -+- see Fig 11 7 and Tab 1 1 7
C p
f (q kind of soil ) -+- see Fig 1 1 8 and Tab 1 1 8 fs C
Note
a) the point resistance q for qc gt 20 MPa is assumed cp to be maximum as
- Gravel 70 MPa - Coarse sand medium sand 55 MPa - Fine sand s il ty sand 40 MPa
b ) The shaft resistance qcs for qc gt 20 MPa is assumed to
be maximum as
- Gravel 110 kPa - Coarse sand medium sand 90 kPa - Fine sand s ilty sand 70 kPa
These proposed values are compared with results by
Bustamente (1 982) and the Polish Specification (1978)
Fig 11 9 and F i g 1110 A similar comparison for DIN
4014 1 977 is shown in Fig 1111 and Fig 1112
) In this paper was used the above values 1 1 and l z But it can be used in practice 11 =30 D and h =2Dp respectively The results shall be very simi l ar to the above onPs
18
The proposed method has been examined with field test
results This is shown in Fig 1113 to Fig 1128
and Appendix 1 11 to 1110 and Tab 119
The comparison shows that the value of q in equationcp (117) corresponds to the settlement -10 of the base
diameter (s=010 DP) see Fig 1113 and Tab 119
(average sDp=88 and standard deviation sd=3)
Later in this paper the allowable load and dependence of
the load versus settlement will be determined
12 Determination of bearing capacity of the large
diameter bored piles from results of the Standard
Penetration Tests (SPT)
There are little published on pile tests coupled with
results from Standard Penetration Test (SPT) Among the
authors who have published material in the subject are
- Meyerhof 1956 1976
- Senneset 1974 (Norwegian method)
- Rodin Corbett Sherwood Thorburn 1974 (English method)
- Polish Specification 1975
- Weltman Healy 197 8
- Reese 1978
- Japanese Society 1981
- Decourt 1978 1982
The Norwegian method is valid o nly for concrete andor
wooden piles the English method only for gravel It is
very important to underline that the Norwegian a nd the
English methods use of the SPT resul ts intermediate by
the static cone penetrometer resistance (q ) as well C
Below methods are presented that are using the results of
SPT directly Meyerhof s method in total can also be used
on driven piles in non-cohesive soil Although we could
have found some proposes for bored piles Eqs (121 and
122) see Fig 121 and Fig 1 22 as well
19
Ultimate point resistance (psf)
12 N 3 omiddotH lt 120 N 30
(kPa) (1 2 1)Psf D
where
N30 the average standard penetration resistance
in blows per 03 m
H depth in bearing stratum
Ultimate skin friction tu
for bored piles tu N~ o (kPa) (1 22a)
for driven pil estu 2N30 (kPa) (1 2 2b)
where
N30 the average standard penetration resistance
in blows per 03 m within embedded length
of pile
Weltman and Healy (1978) taking into account Meherhofs
proposition for driven piles have introduced two coefshy
ficents for bored piles in gravels (glacial soil) Equ
123 and Fig 1 23
t = a 2 N30 (kPa ) (1 2 3)U 1
where
ai a 1 for impermeable gravels see Fig 123a
ai a 2 for permeable gravels see Fig 123b
The Polish Specification ( Specification for Design and
Construction of Large Diameter Bored Piles in Bridges
1975 Ministry of Transport) gives the ultimat e point
resistance in dependence of N30 base diameter and depth
see Tab 12 1 The Tab 121 contains values for coarse
and medium sand For other non-cohesive soils the following
coefficients are proposed
p f = S bull p f (medium sand) ( 1 2 4)S 1 S
20
where
S1 1 20 for grave lSi
f 132 080 for fine sand
13 3 070 for silty sand13i
In Fig 124 values of psf are shown for h = 10 m DP
06 m DP= 15 m and h = 20 m DP= 06 m DP 1 5 m
respectively
A few of the instrumented piles were tested and analyzed
by Wright and Reese (1979) The ultimate point and shaft
resistance in the fine and silty sand as a function of
blow count from SPT is shown in Fig 125 Results from
two additional tests reported by Koizumi (1971) are also
introduced in the figure The ultimate point resistance
is assumed to exist at a settlement equal to 5 of the
base diameter
Methods of prediction of the bearing capacity of piles
based exclusively on N30 values were presented by Decourt
1982 Below a proposition for high capacity piles excavated
and cast under bentoni te is presented
The ultimate skin friction is determined by the expression
(see Fig 126)
t = 33 N30 + 1 0 (kPa) ( 1 bull 2 5 ) u
where
N30 average value of N30 along the shaft
- for N30 lt 3 must be taken as = 3N30 - for N3o gt 5 0 must be taken as NJo= 50
The allowable point resistance can be obtained in a n
expedite way as
Psa = 33 N30 (kPa) (1 2 6)
where
N30 = average of Nat point level one metre above
and one metre below
Psa allowable point resistance
21
Decourt proposed a safety factor for the point of F = p
40 Therefore the ultimate point resistance can be
determined by the expression
(kPa) (1 2 7)
In Fig 12 7 and Fig 1 28 the above values for base
and skin friction resistance are compared respectively
Taking into account the type of soil thereis a good
correlation for ultimate point resistance The result for
ultimate skin friction is scattered but only apparently
The values for large diameter bored piles are between
the line 1a and 1b in Fig 128 Large diameter piles
have a high ultimate skin friction in relation to driven
piles (see points for bored piles in Fig 122 and DIN
4014 Part 2 1977 as well) The high values for piles
excavated and cast under bentonite have had a strong base
on the load tests (Decourt 1978 1982 and Wright and
Reese 1979)
Below the proposals are given for determination of the
values of the ultimate point resistance and the ultimate
skin friction Eqs 128 to 1214 and Fig129 1210
The ultimate point resistance
- gravel psf = 140 N30 (kPa) ( 1 bull 2 8)
for N~ 0 gt 50 blows3O cm Psf 7 MPa
- coarse sand and medium sand
(kPa) ( 1 2 9)
for N30 gt 50 blows3O cm Psf 55 MPa
- fine sand and silty sand
psf = 80 Nio (kPa ) (1210)
for N30 gt 50 blows3O cm p f = 40 MPa 5
where N3 o the average of N value near the point level as
22
h+l1
f N3o(h)dh ( 1 2 11 ) h-12
3DP see Fig 1 1 1 D
p
The ultimate skin friction for coarse sand and medium sand
tu = 1 8 N 3 o (kPa) (1212)
t (kPa) (excavated and cast (1213)u under bentonite)
where
N30= the average value of N along the shaft as h
N -
3 o = h1 f N 3 o ( h) dh ( 1 bull 2 bull 1 4 ) 0
The ultimate skin friction for N30 gt 50 blows30 cm is
assumed to be maximum as tu = 90 kPa and t = 150 kPa u
13 Allowable load of large diameter bored piles
The allowable load Qa of large diameter piles has been
expressed as
OuQa ( 1 3 1)Ft
Qa Q(s)=Qb(s) + Os(s) ( 1 3 2)
Opu + Osu (1 3 3)Qa Fp Fs
Qr lt mmiddotQf ( 1 bull 3 4)-
= universal safety factor
individual safety factor for ultimate resistance of the pile point
individual safety factor for ultimate resistance of the pile shaft
= load according to the allowable settlement
calculated load
m coefficient
calculated ultimate bearing load of the pile
23
The equations from (131) to (134) are used as
1) equation (131)
a) DIN 4014 - 1977 Ft= 2 175 15 (depending on the kind of load)
b) Polish Specification 1975 Ft = 18 16 ( -- )
1c) Trofimenkov 1974 Ft = 14307
2) equation (132)
a) DIN 4014-1977 i Q(s) = Qb(s) + Q (s) = A middotp(s) + E tAsmiddott(s)
s p 0
where Qbs) and Qs(s) are described in Fig 1423
3) equation (133)
a) Polish Specification 1974
F 25 22 depending on the kind of load p
F 1 bull 0 s
b) Wright SJ Reese LC 1979
The ultimate capacity or resistance is considered as a
random value and represented by a frequency distribution
The distribution can be described by a mean value and a
variance The distribution of the load applied to the
foundation can be described similarly The coefshy
ficients used to factor resistance and loads are called
partial safety factors Some recommended partial safety
factors for resistance under normal conditions of design
and construction are given in Tab 131 Normal control
is defined as a condition where the coefficient of variation
is less than about 035
Typical values for partial safety factors for loads are
in the range 1 to 2 depending on the type of load and
how it is applied The overall factor of safety Ft can
then be calculated from the equation
Ft = y RbullY S
24
where
YR the par tial sa f ety fac t or for resistance and
Ys the partial safety factor fo r load
The probability of fa i lur e of the foundation can be r eshy
lat ed to the factor of safety for a parti cular degree of
uncert ainty (see Tab 13 2)
c ) Tejchman Gwizdala 1979
The authors discuss adequate safety factors based on fie l d
test s by Spang (1 972) Franke (1976) Touma and Reese (1974)
Colombo (1971) Kerisel and Simons (1962) Appendirno (1973)
see Tab 1 33 Taking into account the universal safety
factor Ft= 2 0 for the tota l load settlement curves it
was estimated
i) F in the range of 111 to 237 with the average value s F = 166 and standard deviation sd = 034 s (see column 16 Tab 133)
ii) Fb in the range of 161 to 945 with the average
value Fb = 387 and standard deviation sd = 2 15
For model core d piles in laboratory conditions values of
Fs = 108 to 154 (average Fs = 132 s~ = 019) and
values of F = 280 to 5 94 (average F = 3 55 sd = 1 07)p p
see Tab 1 3 4
As a conclusion it was assumed that Fb = 40 and F 1 5 s
for l arge diameter bored piles
The investi gation has shown that for the above safety
factors settlements of piles under permissibl e loads are
10 to 20 mm There was assumed a maximum load on large
diameter piles corresponding to a settlement of 010
diameter of the piles
25
d) Bustamente Gianeselli 1 982
e) 0ecourt 1982
The safety factor is given by
F = FgmiddotFfmiddotFamiddotFw where
F 11 - skin friction g F 135 - point bearing capacity
g
Ff safety factor related to the formulation adapted
Ff= 10 for Decourts method
Fd safety factor related to excessive deformation
Fd = 10 for skin friction
As for the point Fa= 2 to 3 depending on the
pile diameter For usual cases 25 is suggested
Fw safety factor related to working load
Decourt recommends 12
Thus we will have
- for skin friction
Fs = 11bull10middot10middot12 132 - 13
- for the point
F = 135bull10bull25middot 1 2 = 405 = 40 p
4) equation (134)
a ) Polish Code 1983
Q lt mbullN r shy
where
total load coefficient (depending on the kind of load For foundation we can assume Yf = 12 )= code load
correction coeffic i ent
09 for pile foundations
m 08 for two piles
m 07 for single pile
26
N ymmiddotQu
ym material (soil) coefficient
ym 08 to 09 (Polish Code 1981)
Thus we will have
QnmiddotYf lt mmiddotym middotQu-
Yf9uFt = On m bull Ym
1 2 max = 2 14Ft 0 7 bull 0 8
1 2min = 1 48Ft 0909
The above analysis has shown different ways to determine
the allowable load The analysis is in direct connection
with mobilization of the load (versus settlement) The
dependence of total load point resistance and shaft reshy
sistance will be discussed in detail in Chapter 14
In the authors opinion taking into account the above
analysis the allowable load should be determined based
on the equation 133 ie based on individual safety
factors for ultimate point and shaft resistance Proposed
values of F and F in literature are shown in Tab 135 s p The average values are Fs = 145 and Fp = 3 38 respectively
Taking into account that the bearing capacity is determined
based on the results from sounding measurements direct from
a place near the piling without a ny indirect correlation
the allowable load of large diameter bored piles is given
by the equation (133a)
( 1 3 3a)
where F = 30 and F 13 are proposedp s
27
14 Determination of settlement of larqe diameter bored
piles based on static cone penetration tests CPT
Determination of ultimate point and skin friction resistance
based on static cone penetration tests has been discussed
in Chapter 11 above Based on the results of this calcushy
lation and on Chapter 13 we can establish an approximate
relation between point resistance shaft resistance and
total load on one hand and settlement on the other However
the approximation gives a wide scatter especially for base
resistance as can be observed in Fig 141 to Fig 144
Only the first part of the point resistance - settlement
curves are in good agreement with measured values It can
be observed in Fig 145 that the average correlation
coefficient n = 098 and standard deviation sd= 029
This way of calculation can be used only for rough calcushy
lation (see Chapter 13)
In Chapter 11 also measured point resistance - settlement
curves were shown The base resistance increases gradually
with increasing pressure and settlement Below the cur7
vature of the point resistance - settl ement curve will be
examined It is assumed that this curve can be described
as a part of the hyperbola curve Thus if the ratio of
the measured settlement (s ) to the point resistance (p)
is plotted against the measured settlement the result
will fall closely to a straight line with the equation
( 1 4 1)
where a 1 and b 1 are constants (see Fig 1 46a and Fig
14 6b)
Then the point resistance - settlement realtionship can be
expressed as a hyperbola
s p = ( 1 bull 4 2)
The constant is the initial s lope of the point resistanceshya 1
settlement curve ie a 1 = t~a The inverse of the constant
28
b 1 is the vertical tangent (asymptote) to the curve 1ie for s = 00
bf= ~ If the ultimate point reshy1
sistance psf is equal to bf (psf=bf) the whole point
resistance settlement curve will be a hyperbola type
Now the Eq 1 4 2 can be written as
s s ( 1 4 3)a) p s or b) p = a+__sect_a1 + 1 Psfbf
If the ultimate point resistance is smaller than bf only
a part of the hyperbola curve ought to be considered
Further the Eq 14 3 will be written as
p ( 1 4 4)
where
poundf_ correction factor for hyperbola point Psf resistance-settlement relationship
Taking into account the discussion in Chapter 11 the
ultimate point resistance psf = qcp based on the CPT measurements
Therefore the relationship between the point resistance
the sett l ement and the CPT result can be expressed as
s p (1 4 5)s
The correction coefficient v 1 will cause a change of the
position of the vertical asymptote bf in r elation to the
ultimate point resistance q bull This means that we take cp into account a different part of the hyperbola curve for
the description of the point resistance-settlement relationshy
ship
Now if we want to use the equation (145) in practice
we must determine the constant and the coefficienta 1 v 1 (assumed that q is determined ear l ier Chapter 11)cp
29
The constant a 1 and t h e coefficient Vi have been detershy
mined based on fi e ld tests according to pi l es No 1 - 20
see Tab 14 1 and Tab 1 1 9 as wel l The values of
a 1 versus the point diameter D and the ul timate pointp
resistance respectively are shown in F i g 147 and Fig
148 Fig 1 47 shows that a 1 is independent of the
point diameter D Based on Fig 148 it can be assumed p
that
28-4bullq (1 4 6)cp
This correlation has been examined with data of the
literature see Fig 1 49 and Appendix 141 to 1 45
(Note there were no static penetration tests and qcp was determined based on a correlation made by Bergdahl
(1982))
A good correlation with equation 146 can be seen taking
into account the safety factor in the DIN 4014 Part 2
(1977) bull
The correction factor v 1 versus the poi nt diameter is shown
in Fig 1410 I t is assumed that the correlation is
V1 = 3 0 - D ( 1 4 7)p
where D is in m p
The above equations ie 146 and 147 were assumed for
a later analyses see Fig 14 11 and Fig 1412 The
piles No 1 to 20 were examined taking into account Eqs
14 5 14 6 and 1 4 7 The result of this cal cul ation is
presented in Fig 1 413 to Fig 1 4 18 and in Tab 1 4 2
respectively In Fig 1413 the calculation way for pile
No 2 is shown as an example
In Fig 1414 to Fig 1 417 measured and calculated
values of the point resistance versus settl ement can be
compared In tota l good correlation exists for all the
30
pressure-settlement curves Values of q from static cp
cone penetration tests and generalized values of anda 1
v 1 were considered Only for piles No 17-20 qcp was
assumed as the point resistance for s = 010 D because p
the static penetration test results were inaccessible
The similar comparison is shown in Fig 1417a for piles
in sand based on experimental results (Tuoma Reese 1972
and Wright Reese 1979) where the ultimate case resistance
was assumed as the resistance at a base settlement of 005
D The relative base resistance is the mobilized base p resistance divided by the ultinate base resistance The
curvature of the proposed point resistance settlement shy
curve to mean value proposed by Wright and Reese is excellent
However the constant a 1 and the coefficient v 1 were
determined for sand only In the future they should be
examined especially for gravel and silty sand based on
field tests Until then in the authors opinion the
values of v 1 can be chosen from Eq 147 for all nonshy
cohesive soils But for a 1 there is proposed
at = gt bulla (1 4 8)1
where
gt- 1 = 080 for gravel
gt 2 120 for silty sand
This proposal is shown in Fig 14 11 as dashed lines
A good correlation can be seen with the investigation by I
Kiosimiddotnski for sandy gravel and on the safety side with
the investigation by Tuoma and Reese for silty sand (see
Fig 149)
In Fig 1418 all calcul ations for pile No 1 to 20 are
summarize d The correlation coefficient n is defined as
the calculated point resistance p(s) divided by measured
point resistance p(s) For totally 126 points from 20
curves an average of n = 098 with standard deviation
31
al= 023 was obtained see Fig 1418 A similar result
can be observed for the range usually assumed of the
allowable settlement for sinqle large diameter bored
piles as
for
- for
- for
s
s
s =
10
20
30
mm a
mm
mm
verage n10 II
II
mm 089
095
099
and sd =
and sd
and sd
031
027
026
It can be questioned whether the sonstant a 1 can be deshy
termined in different ways The constant a 1 is the initial
slope of the point resistance-settlement curve as menshy
tioned above Then we can use all methods for determination
of settlement of a pile point The range of validity of
these methods then must be determined This will be shown
later
In order to be able to design the total load settlement
curve the skin friction resistance-settlement relationshy
ship must be determined The ultimate skin resistance of
large diameter bored piles was determined in Chapter 11
(based on static penetration tests) and in Chapter 12
(based on standard penetration tests)
In the past a lot of field tests have been done on the
mobilization of the shaft resistance versus pile settleshy
ment In this subject there is a rather good agreement
in the whole investigation for cohesive and non-cohesive
soil
Some results and opinions on thispresented in the literashy
ture during the last few years are shown below
Ultimate shaft resistance versus settlement
1) BurlandJB Butler FG Duncan P (1969)
-The shaft l oadsettlement curve is derived using a=0 3
with 90 ultimate load being mobilized at 025 in
settlement(~65 mm)
- soil London clay
- see Fig 1 419
32
2) Touma FT Reese LC (1974)
- The failure of the sides of the shaft takes place
at a downward movement of about 04 in (10 mm)
- soil sand
- see Fig 1420
3) Tomlinson HJ (1977)
- The maximum shaft resistance is mobilized at a
settlement of only 10 mm (or j in)
- soil stiff clay
- see Fig 1421
4) Klosinski B ( 1977)
- It was assumed that skin friction increased proshy
portionally to pile settlement up to the limit value
s bull This value depends on soil conditions and pile0 diameter and is usually from 3 to 8 mm For soft
compressible soil it may be grater than 10 mm
- soil cohesive soils
- see Fig 1422
5) Franke E Garbrecht D (1977)
- At settlement of 2 to 3 cm which are normally
allowed in Germany under working loads for buildings
not very sensitive to differential settlementsthe
skin friction is almost always fully mobilized
- soil sand
6) DIN 4014 part 2 (1977) and Franke E (1981)
- The skin friction Tm is approximated as diameter
independent having failure settlements of smf = 2 cm
in sand and 1 cm in clay
- soil sand and clay
- see Fig 1423
33
7) Reese By L (1978) Reese By L Wright SJ (1979)
(1978) The maximum skin friction being developed at
an average downward movement ranging from about 05shy
2 of the shaft diameter The average of six load tests
reported by Whitaker and Cooke (1966) are a lso plotted
for comparison
- soil stiff clays
- see Fig 1424 and Fig 1425a
(1979) The relative settlement is the average settleshy
ment of the butt and base devided by the shaft diameter
The mean curve maximises at a relative settlement of
about 002 D
- soil sand and clay
- see Fig 1425b
8) Tejchman A Gwizda3a K (1979)
- A clear differentiation of the distribution of shaft
and base resistances is observed for changing settleshy
ment For fairly small settlements the shaft resist shy
ance increases quite fast and the ultimate values
are reached soon while the base resistance increases
gradually with increasing loads and settlements withshy
out clearout ultimate values it can be assumed that
complete mobilization of shaft resistance corresponds
to settlements equal to 001 or 002 diameter of pile
- soil cohesive and non-cohesive soils
- see Tab 131 and Fig 1 426
9) Promboon S Brenner R P (1981)
- Load distribution and load transfer curves disclose
that most of the load is carried by shaft friction
which is developed at small displacements in the order
of 10 mm
- soil Bangkok clay
- see Fig 1427
34
10) Prodinger w Veder Ch (1981)
- The maximum value of skin friction resistance
occurred for a total settlement of 12 mm
- soil silty clay and sand
- see Fig 1428
11) Farr JS Aurora RP (1981)
- Ultimate load transfer was recehed (or nearly reached)
at a relative settlement of about 04 in (10 mm)
- soil gravelly sand
- see Fig 1429
12) Decourt (1982)
The skin friction resistance is totally mobilized
with deformations of about 10 mm or at the most 15
mm regardless of shaft dimensions This observation
of ours seems to clash with the opinions of other
authors who seek to relate the deformation necessary
for full skin friction mobilization with the shaft
diameter
- soil cohesive and non-cohesive soil
In Tab 143 all these results are shown Depending on
the kind of soil the following v a lue s of ultimate settleshy
ment for shaft can be assumed
- averages 142 mm (sd 5 3 mm) for sand
- averages 100 mm (sd = 21 mm) for cohesive soil
averages 726 mm (sd 67 mm) for claysand
It can be observed (see Fig 1419 to 1428) that the
shaft friction resistance increases proportionally to
the pile settlement up to the above limit value and
thereafter becomes constant
35
Taking into account what was mentioned earlier on point
resistance settlement relationship and the above results
a relationship between total load point resistance and
shaft resistance on one hand and settlement on the other
can be made see Fig 1430
It is assumed on the safety side that the following
ultimate settlement (S~) exists for the shaft resistance
of large diameter bored piles
SS1 ) 200 mm for non-cohesive soil u SS2) = 100 mm for cohesive soil u SS3) 15 0 mm for claysandu
In Fig 1 430 the curve Q (s) is calculated based on p
the equation 14 5 or 144
The values of psf in equation 144 can be calculated
based on other methods as well
The total load-settlement relationship is obtained by
summing up point and s haft resistance as
Q (s) = Q (s) + Q (s) (149)s p
for each point
Now the allowable load can be determined from equation
133a and versus the allowabl e settlement as
Q (s) = Q (s) + Q (s) (1410)s p
where s lt Sa
Sa= the allowable settlement of the pile
The analysis allows determination of the approximative
load settlement dependence without calculating the settleshy
ment for non-cohesive soil In Fig 1431 it is shown
36
In Tab 144 the settlement for allowable point reshy
sistance q5P according to equation 133a is shown
as well The average settlements= 198 mm (sd=78 mm)
is obtained This value is similar to the assumed ultimate
settlement of shaft for non-cohesive soil The ultimate
settlement for point resistance is assumed s = 010 Dp as mentioned earlier
37
15 Initial slope of pile point resistance shy
settlement curve
Settlement of piles and pile foundations can be cal culated
based on
- empirical correlations
load-transfer methods using measured relationships
between pile resistance and pile movement at various
points along the pile
- theory of elasticity that employs the equations of
Mindlin for subsurface loading within a semi-infinite
mass
- numerical methods and in particular the finite element
method
- use of in-situ tests (Cone Penetration Test Standard
Penetration Test Pressuremeter Test)
The critical slope of the pile point resistance-settlement
curve is important for calculation in chapter 14 The
constant a1 can be determined from all the above mentioned
methods
Comparison is made to Berggrens and Schmertmanns methods
below (see Berggren 1981 as well)
6sIn Tab 151 (No 1 2 3) the values of a 1 =~p for s =
10 mm and s = 20 mm (measured for large diameter bored
piles No 1 to 24) are compared to the calculated values
according to the modified hyperbola method (see Fig 14 6)
It can be seen that these calculated values are between
s = 1U-2u mm but rather closer the measured values for
the settlements= 10 mm see correlation coefficient n 6
and n 7 in Tab 151 respectively The average correlat i on
coefficent for the settlements= 10 mm is n9 = 108 and
the standard deviation is sct = 014 The comparison to
Berggrens and Schmertmanns methods for s = 20 mm ( see
Berggren 1~81 and Tab 151 as well) shows that the
results based om these methods give too high values of a 1 bull
38
The average values are ne= 143 sd = OJ3 and ng= 137
sd = 037 for Berggrens and Schmertmanns methods
respectively A bit better agreement can be observed
for Schmertmanns method
Taking into account the results in Tab 151 ana Tab
15l it must be assumed that for the determination of
a 1 the pile point contact pressure p(a1) should be
assumed as the ultimate point bearing capacity devided
by about 4
p(ai) - ( 1 bull 5 1 )
Most of the methods for determination of settlement are
based on the theory of elasticity The settlement ot the
pile point can be expressed as the average settlement of
a rigid circular foundation from the equation
11-Dp 1-v 2
s = p -4- -E-bull microd (1 ~ 2 J
where
p pile point contact pressure
E Youngs modulus
D diameter ot pile pointp ) = Poissons ratio
microd = depth factor
The range of validity of the pile point contact pressure
was determined in equation 151 Youngs modulus has an
important meaning lt can be determined from triaxial
tests or oedometer tests The relationship between the
constrained (oedometric) modulus Mo and Young s modulus
Eis dependent on Poissons ratio v as expressed by the
equation
E = l 1 + V ) ( 1 - 2 V ) Mo ( 1 bull 1 bull 1)- 1-v
39
TaKing into account the analyses made ny Chaplin (19b1a
1 961bJ Janbu (1 963 1970 1973J Andreassen (1973)
Duncan and Cheng (1970) Tejchman anct Gwizdala (1979)
Gwizdala (1978) Franke (1981) Berggren (1981) Withiam
and Kulhawy (7981) and the present investigation the
calculation of settlement is proposed to be
s = 24 bull p bull ~ D bull 1-v 2 bull micro d (154)Do o E
where s (r1)
p (kPa)
Dp (m)
E (kPa)
D0 =10 m
micro = 05 + 01 vfrac34E (1 5 5)d vs
but 05 lt microd lt 10-tip= p - (J (ovs see Fig 151)vs
E =Et= Kbullpat (Oo )n [1- Rf(1-sinltj) 101 - 03 ) 12 (1 5 6)2 c cosltP + 2o 3 sinltP 1Pat
in which K n and Rf= hyperbolic stress-strain parameters
Pa= atmosferic pressure ando 1 o 3 and o0 are determined by
averaging the concrete and soil vertical and radial stresses
near the pile point according to Fig 151 Then the
stresses at the pile point level are h
(J vs = L
0 Yi h
l vertical stress in the soil
0 hs Ko h
0 vs radial (horizontal) stress in the soil
0 vc L ye h -l
vertical stress in the concrete 0
0 hc K oc a vc radial (horizontal)
concrete stress in the
40
K at rest soil lateral stress coefficient 0
K c lateral stress coefficient for fluid fresh concrete0
K 1 0 oc
and average values
a 05(a +a)V vc vs
1 1 - shy~ = -(a +a+a I = -3 (av+2ahJ the applied mean normal stress0 j Z X y
Assuming this model calculation results for piles No 1-24
(see Tab 11~ as well) are shown in Tab 153
The piles are embedded mainly in medium sand to fine sand
For this kind of soil it can be assumed (soil parameters
from field or laboratory tests were inaccessible)
~ = 35deg c = 0 R~ = 09 n 05 v = 025 K c 10l 0
K = 04 Pat= 1UO kPa ye 24 kNrn 3 y = 14 kNm 3 bull0 C
Moreover in Tab 153 the following symbols are used
p(a1 ) - pile point contact pressure according to equation
1 bull 5 1
s(a1) - settl ement of pi l e point according to equation
143 and Tab 141
pound TT ( 2E = s bull Dp bull i 1-v ) according to equa~ion 152t
E~ Et bull microltl
EI
K = ro~ - according to equation 1 bull 5 6 p bullO middotA2
a~ o
E = E voD middot D middot ~4 ( 1 - v 2 ) according to equationt S p O 0
1 5 4
Et= E microd
K = according to equation 156 V PatmiddotaomiddotA2
41
The calculation results of Youngs modulus E = Et and
dimensionless canpressionrro1ulus for piles to 1-24 are shown
in Fig 152 to 155 using equation 152 and 15b
or equation 1~4 and 156 respectively lt can be obshy
served that the scatter in Fig 153 and Fig 155
where the influence of tne pile diameter is reduced
compare equation 154 is less than in the other figures
The reduced influence was made after observations from
field and laboratory tests while the equation 152 is
taken direct from theory of elasticity These values of
E and K are in good correlation with published values in
literature The values of Youngs modulus versus the
relative density of soil are compared to literature values
see Fig 15b Based on the analysis in this chapter it
can be assumed that
E = 9-ql 3 ( 1 bull 5 7)cp
where qcp is in accordance with equation 117
The calculation results based on this proposal are incluced
in Tab 1 5 3
The c a lculate d s e ttlements based on e q ua tion 154 and
157 are shown in column 23 and the values of the
correlation coef f icie nt (n= Seal ) in column 24 respectshyimeas
ively
The dimensionless canpression modulus can be d e termined as
K = 15Ubullq (qcp in MPa) (1 5 8)cp
see column 25 Tab 153
The calculation results based on the K compression modulus
according to equation 158 156 and 1 5 4 are shown in
columns 25 26 2 7 28 and 29 in Tab 153
42
For comparison and for determination of the range of
validity of this method the caLculation results of
pile point pressure for settlements s = 10 mm s = 20 mm
s = 30 mm (see Tab 141) according to equation 157
and 154 are shown in columns 30 to 35
The results obtained in Tab 153 confirm the possibility
to use the proposed method to calculate the initial part
of the pile point resistance settlement curve of large
diameter bored piles in non-cohesive soil and the initial
slope of this curve as well
A simple model has been proposed based on the theory of
elasticity ana the tangent modulus defined by Janbu (1963)
and Duncan amp Chang (1970)
A new approach according to the pile diameter depth factor
and principal stress is proposed
The settlement of the pile point can be made up to a point
pressure according to equation 151 on up to a settlement
of about s ~ 20 mm (30 mm)
-- The application of v Op in equation 1 5 4 a llows us ing
Youngs modulus as independent of the pile diameter
opposed to Bazants a nd Mosopusts (1981) proposal where
Youngs modulus wa s determined versus the pile diameter
The equation 1 5 6 takes into account the dependence of
Youngs modulus on depth (or overburden pressure) as
well
In the method field test (Cone Penetration Test) or
laboratory tests (hyperbolic stress-strain parameters
can be used
Comparison of the method to 24 availa ble load test r e sults
or large diameter bored piles in sand shows good a greement
to calculated and measured values
43
REFERE~CES
Adamczyk J (1978) Okreslanie udzwigu pali wierconych
za pomoca sondy statycznej (Bearing capacity of bored
piles based on the static sounding) Inz i Bud No 7
pp 253-257
Andreasson L (1973) The compressibility of cohesionless
soils Thesis Chalmers University of Technology
G6teborg (in Swedish)
Appendino M (1973) Comportamento di un palo di grande
diametro strumentato Rivista Italiano di Geotechnica
No 3 pp 115-118
Butterfield R Banerjee P (1971) A rigid disc embedded
in an elastic half space Geotechnical Engineering
Vol 2 pp 35-49
Bozant z Mosopust J (1981) Drilled pier design based
on load settlement curve X ICSMFE Stockholm Vol 2
pp 615-619
Begemann HK (1982) Cone penetration tests pile bearing
capacity and the thesis of Rollberg Proc of the Second
European Symposium on Penetration Testing Amsterdam
pp 433-438
Berggren B (1981) Bored piles on non-cohesive soils shy
settlement and bearing capacity (in Sweden) Thesis
Department of Geotechnical Engineering Chalmers
University of Technology G6teborg
Bergdahl UB (1979 1982) Sonderingen und in situ Messungen
Wien 18-19 Juni 1979 - Private information 19821983
Bustamante M Giane selli L(1982) Pile bearing capacity
prediction by means of static penetrometer CPT Proc
of the Second Europ Symp on PenTest Amsterdam
Vol 2 pp 493-500
Chaplin TK (1961a) An experimental study of the settleshy
ment of footings in sand PhD Thesis Univ of
Birmingham
44
Chaplin TK (1961b) Compressibility of sands and settleshy
ments of model footings and piles in sand 5th Int
Conf on Soil Mech a Found Engng Vol 2 p 33 Paris
Colombo P (1971) Observazoni sul comportamento ltli pali
a grande diametro Rivista Italiana di Geotechnika
No 3 pp 163-172
Dahlberg R (1975) Settlement characteristics of preconshy
solidated natural sands Swedish Council for Building
Research D11975
De Beer EE (1964) Some considerations concerning the
point bearing capacity of piles Proc Syrop Bearing
Capacity of Piles Boorkee I pp 178-204
Decourt L Quaresma AR (1978) Capacidade de Carga de
Carga de Estacas a partir de Valores de SPT VI Conshy
gresso Brasilerio de Mecanica dos Solos e Engenharia
de Fundacoes - Rio de Janerio - ABNS
Decourt L (1982) Prediction of the bearing capacity of
piles based exclusively on N values of the SPT Proc
of the Second Europ Syrop on Penetration Testing
Amsterdam Vol 1 pp 29-34
Duncan MJ Chang CV (1970) Non-linear analysis of stress
and strain in soils Journal Soil Mech Found Div Vol
96 SM5 pp 1629-1651
Durgunoglu HT (1979) Effect of foundation embedment on
stress and deformation distributions Third Int Conf
on Num Meth in Geomechanics Aachen pp 925-928
Farr JS Aurora RP (1981) Behaviour of an instrumented
pier in gravelly sand Proc of a session Drived Piers
and Caissons sponsored by the Geotech Eng Div of the
ASCE Nat Convention St Louis Missouri pp 53-65
Franke E (1981) Point pressure versus length and diameter
of piles X ICSMFE Stockholm Vol 2 pp 717-722
45
Gregersen os Aas G and Dibiagio E (1973) Load tests
on friction piles in loose sand Proc of the Eigth
International Conference on Soil Mech Moscow USSR
Vol 21 pp 109-117
Gwizda1a K (1978) Behaviour of large diameter bored piles
in non-cohesive soil (in Polish) Archiwum Hydrotechniki
Vol XXV No 2 pp 183-217 (English summary)
Huizinga TK (1951) Application of Results of Deep
Penetration Tests to Foundation Piles Building Research
Congress Vol 1 p 173
Janbu N (1963) Soil compressibility as determined by
oedometer and triaxial tests Proc Europ Conf Soil
Mech and Found Eng Vol 1 p 19 Vol 2 (Discussion)
p 17 Wiesbaden
Janbu N (1970) Grunlung i geoteknikk Tapir Forlag NTH
Trondheim
Janbu N Bjerrum L Kjaernsli B (1973) Soil Mechanics
applied to some engineering problems Norw Inst Publ
No 16 Oslo
Japanese Society SMFE (1981) Present state and future trend
of penetration testing in Japan Separate report at
X ICSMFE Stockholm
Kjekstad O Lunne T (1979) Soil parameters used for design
of gravity platforms in the north sea Second Int Conf
on Behaviour of Off-shore structures London Vol 1
pp 175-192
Klosinski B (1977) Bearing capacity of large diameter bored
piles IX ICSMFE Tokyo Vol 1 pp 609-612
Laboratory for soil mechanics Delft (1936) The predetershy
mination of the required and the prediction of the
resistance of piles Proc 1 Int Conf on Soil Mech
and Found Engng Cambridge (Mass) I p 181
46
Matich M and Stermac A (1971) Settlement performance of
the Burlington Bay Skyway Canadian Geotechnical Journal
Val 8 pp 252-271
Mccammon NR and Golder HQ (1970) Some loading tests
on long pipe piles Geotechnique London England
Val 20 pp 171-184
Meigh AC (1971) Some driving and loading tests on piles
in gravel and chalk Proc of the conference on beshy
haviour of piles London England pp 9-16
Mitchell JK Gardner WS (1976) In situ measurement
of volume change characteristics American Society of
Civil Engineers Specialty Conference on In-situ
Measurements of Soil Properties Raleigh 1975 Proc
Val II pp 279-345
Mezenbach E (1961) The determination of the permissible
pointload of piles by means of static penetration tests
Proc 5 Int Conf on Soil Mech and Found Engng
Paris II pp 99-104
Meyerhof CG (1956) Penetration tests and bearing capacity
of cohesionless soils Proc Amer Society of Civ Engng
SM 1 Pap 866 pp 1-19
Meyherhof GG (1 976) Bearing capacity and settlement of
pile foundations Proc Amer Society of Civ Engng
Journal Geotechnical Engineering Division Val 102
No GT3 pp 197-227
Mohan D Jain GS and Kumar V (196 3 ) Load bearing capacity
of piles Geotechn Val XIII pp 76-86
Nixon I (1982) Standard penetration test State of the
art report Proc of the Second Europ Symp on Pen
Test Amsterdam Val 1 pp 3-20
47
Nunes A Vargas M (1953) Computed bearing capacity of
piles in residual soil compared with laboratory and
load tests Proc of the Third International Conference
on Soil Mechanics Zlirich Switzerland Vol 2 pp 75-79
Nordal S Grande L Janbu N (1982) Prediction of offshy
shore pile behaviour The Norwegian Institute of
Technology Trondheim
Ohde J (1939) Zur Theorie der Druckverteilung im Baugrund
Der Bauingenieur Vol 20 No 3334 p 451
Parroth E (1972) Einfache Formel zur Vorausbestimmung der
Tragfahigkeit von Standpfahlen mit Hilfe der Sande
Bautechn 9 pp 312-314
Poulos HG Davis EH (1980) Pile foundation analysis
and design New York - J Wiley and sons
Prodinger W Veder Ch (1981) Bearing capacity of floating
groups of diaphragm walls Proc X ICSMFE Stockholm
Vol 2 pp 809-814
Promboon S Brenner R (1981) Large diameter bored piles
in Bangkok Clay Proc X ICSMFE Stockholm Vol 2 pp
815-818
Reese L (1978) Design and construction of drilled shafts
ASCE JSMFD Vol 104 No OT1 pp 95-116
Rodin s Corbett BO et al (1974) Penetration testing in
United Kingdom state-of-the-art-report Proc Europ
Symp on Penetration Testing 1 Stockholm pp 139-146
Rollberg D (1976) Bestimmung des verhaltens von Pfahlen
aus sandier und rammengebnissen Heft 4 FBG Technische
Hochschule Aachen
Rollberg D (1977) Determination of the bearing capacity
and pile driving resistance of piles using soundings
Publications of the Institute for Found Eng Soil Mech
Rock Mech and Water Ways Construction Aachen Vol 3
48
Schmertmann J (1970) Static cone to compute static
settlement over sand Journal of the Soil Mech and
Found Division ASCE SM3 pp 1011-1043
Schmertmann J Hartman JP Brown PR (1978) Improved
strain influence factor diagrams Journal of the Soil
Mech and Found Division ASCE GT8 pp 1131-1135
Shibata T Hijikuro K and Fominerga M (1973) Settlement
of a blast furnace foundation Proc of the Eighth Int
Conf on Soil Mech Moscow USSR Vol 13 pp 239-242
Spang J (1972) Die Bestimmung der Tragfahigkeit von Grossshy
borhpfahlen (I) Strassen und Tiefbau No 2 pp 339-355
Senneset K (1974) Penetration testing in Norway State-ofshy
the-art-report Proc Europ Symp on Penetration Testing
Stockholm I pp 85-95
Tejchman A Gwizdala K (1979) Analysis of safety factors
of bearing capacity for large diameter piles Proc VII
ECSMFE Brighton Vol 1 pp 293-296
Thorburn s and Mac Vicar R (1971) Pile load tests to
f a ilure in the clyde alluvium Proc of the conference
on behaviour of pile s London England pp 1-7
Trof imenkov JG (1969) Accuracy of determining the bearing
capacity of piles based on results of static penetration
sounding of soils Osnovaniya Fundamenty i Mekhanika
Gruntov 4 (Translation Soil Mechanics and Foundation
Engineering 4 p 248)
Trofimenkov JG (1974) Penetration testing in USSR Stateshy
of-the-art report Proc Europ Symp on Penetration
Testing Stockholm I pp 147-154
Tuoma F and Reese L (1974) Behaviour of bored piles in
sand JSMFD ASCE Vol 100 No GT 7 Proc Paper 10651
July pp 749-761
49
Van der Veen C (1953) The bearing capacity of a pile
Proc 3 Int Conf on Soil Mech and Found Engng
Zlirich II pp 84-90
Van der Veen C and Boersma L (1957) The bearing capacity
of a pile predetermined by a cone penetration test
Proc 4 Int Conf on Soil Mech and Found Engng
London II pp 72-75
Weltrnan AJ Healy PR (1978) Piling in boulder clay
and other glacial tills Construction Industry Research
and Information Association UK-Report PG 5
Withiam J Kulhawy F (1981) Analysis prodecure for
drilled shaft uplift capacity Proc of a session
Drilled piers and caissons ASCE St Louis Missouri
pp 82-97
Woodward R Lundgren R Boitano J (1961) Pile loading
tests in stiff clays Proc of the Fifth International
Conference on Soil Mechanics Paris France Vol 2
pp 177-184
Wright SJ Reese LC (1979) Design of large diameter
bored piles Ground Engineering Vol 12 No 8 pp
17-22
DIN 4014 Cods Teil 2 (1977) Bohrpfahle Grossbohrpfahle
Herstellung Bemessung und zulassige Belastung
Polish Specification (1975) Specification for design and
construction of large diameter bored piles in bridges
Ministry of Transport Warsaw (in Polish)
Polish Specification (1979) Specification for prevision
bearing capacity of the piles on the presiometer test
and static sounding ENERGOPOL Warsaw (In Polish)
Polish Code (1983) Foundations Bearing capacity of piles
and pile foundations
5 1
FIGURES
bull bull
53
Ou
+ sect raquo iir 1
4 + D
h + +Osu
bull + t2 =n- Dp
LDpl r f 1
Opu
Fig 1 1 1 Bearing pi le in the soil
J_
fp
080
070
060
050
0 40
030
020
010
q~ [MPa ]000 -+--~-~-~-~------------------------=-shy
00 20 4fJ 60 80 10 0 120 14fJ 160 180 200
Fig 1 1 2 The point resistance factor fp
(Trofimenkov 1974)
54
ts
160
140
120
100
080
060
040
020
q~5 [ kPa)
0Q0--1------~-~-~-~-~-~ - - ---=- -- shy000 10 20 30 40 50 60 70 80 90 100
Fig 1 1 3 The shaft resistance factor fs middot (TYofimenkov 1974)
f s
200
180
160
140
120
100 2 3 4 5 6 7 8 9
Fig 1 1 4 Shaft friction factor f depenshys
ding of the soil density (Senneset 1974)
55
Q~ [kN]
1500
1000
500
0-r-----------r----~- Q~ [kN] 0 500 1000 1500
Fig 1 1 5 Comparison of the pile resisshytance determined by the results of static sounding and load tests (TYofimenkov 1974)
D f f
0
Fig 1 16 Equivalent cone resisshytance (Bustamante 1982)
56
E u shy0 ~
QI I ltII ltII
~ a C QI
O C
D
w gt
0
Cone res istance Point resistance
80 160 240 320
05
10
15
e d
20
ver y dense Cone resistance 300 kgcm2
Dpcm
a =45 b = 30 C 60 d = 100 e = 150
Fig 1 16a
Cone resistance _ qc
80 160 80 160 qc [ k g cm2 ]p
05
10 10
15 15 e d a
e d20
Dense Medium2 2200 kgcm 100 kgcm
Cone resistance and point resistance of piles versus overburden pressure (Kerisel 1965)
Point resi stance - p(for s=2cm) of the pi le for
15 sett Iement s = 2 cm
10
5
E u
uJ1 o-~----shya er O 804 2500
32 56
I 1
L oose50 -I =25 Very loose L
----~--shy5000 7500 80 98
~-----lmiddotI1--------2 10000 12500 31400 =Flcn)
112 123 200 =Dplcm)
Fig 1 1 6b Point resistance versus cone resistance and pile diameter (Franke 193)
57
1
fp
080 (D Gravel
0 Coarse sand Medium sand 070
reg Fine sond Silty sand
060
050
040
030
020
010
qc [MPa]000-+----r--~-~-~--------r----r----r-~-~-- -shy
oo 20 40 60 80 100 120 140 160 180 200
Fig 1 1 7 Point resistance factor f (proposal) p
58
300
250
200
150
100
qc [MPa I50-+---------------r---r---r---r----r------------- shy
oo 20 40 60 80 100 120 140 160 180 200
Fig 1 1 8 Shaft resistance factor fs (pr oposal)
59
Bustamante (seetab 115 I
l fp
G)
0 Gravel
Coarse sand Medium sand
cl
b)
t-----l
1----1
080 reg Fine sand Silty sand a) D
070 Polish
060 Specification
( 1979) 050
040
030 CD 020 0
reg 010
qc [MPa]0 00 -+-------------------------------------=--shy
oo 20 4o 5o 80 100 120 14o 15o 180 200
Fig 1 19 Point resistance factor f comparisonp
Bustamente ( see tab 116 I 300
a) ~
250 b)~
cl~
200 Polish Specification ( 1979 l
150
100
q [ MPa]504---~--~--~----- ---___
00 20 40 60 80 100 120 140 150 180 200
Fig 1 1 10 Shaft resistance factor fs comparison
60
1 fp
~
080 CD CD Gravel
070 0 reg Coarse sand Medium sand
060 0 Q) Fine sand Silty sand
05
040 Franke (1973)___
030 DIN 4014
020 Part 2 1977
( see tab113 l 0shy
--shy --a - 010 C---0 Piles without enlarged bases
D---0 Piles with enlarged bases qc [MPa ] 000
00 20 4JJ 60 80 90 100 120 140 160 200
Fig 11 11 Point resistance factor f comparison p
fs
DIN 4014 Part 2 1977 ( see tab 114 l
300
~ 5 lt qc lt 10 MPa 50
~ 10 lt qclt 15 MPa
~qcgt15MPa
200
150
CD
100 0 0
qc [ 1Pa] 50-t-----T-~----T-r-~----------------shy
OO 20 40 6JJ 80 100 120 14JJ 160 180 200
Fig 1 1 12 Shaft resistance factor fs comparison
61
Measured p [ MPa]
( s=010 Dp) 10
9
8
7
6
5 0
4 0 61
3
I 2
Calculated qcp [MPa]
0 0 2 3 4 5 6 7 8 9 10
Fig 1 1 13 Comparison of experimental and aomputed values of the pile point resistanae
62
Contact pressure ( MPa ]
2 I 6
50
100
E E 150 Ill
c QI
E Sett lement for QI
calculated qcpai V) 200
Fig 1114 Results from load tests on piles No 1 and 5
Contact pressure [ MPa I 0 2 I 6
01---------------------1
50
E E 100 Ill
Settlement forc QI calculated qcp E ~ ai
I V) 150
Fig 1 1 15 Results from load test on piles No 7 and 5
63
Contact pressure p [ MPa] 0 2 3 4 6
0-t=-----~-~-----
E E
100 1)
c CU E 2 QI V) 150
Fig 1 1 16 Results from load test on piles No 9 10 and 11
Contact pressured p [MPa] 0 1 2 3 4 5
o~~~=------------___-~-shy
50
100
E E
i 150
CU E CU
-a V) 200 2
Fig 1 1 17 Results from load test on piles No 12 and 13
c
-------------- -
64
Contact pressured
0 1 2 3 4 p [ MPo] ~o __L____1_____J_____L___
50
100
150
E
E
IJ) 200
c a
E a
~ 250
Fig 1 1 18 Results f Pom load tests on piles No 2 4 6 and 8
p [MPa]
60
50
tO
30
~
Pile Pile Pile Pile
Pile No18
------+ Pile No17 + ~_ ---0 Pile No 19
bullbull - --bull Pile No 20
- ~middot -shy-shy -(y I Settlement for
20 tO 60
No17 +-middotmiddot- V 70 No 18 bull--- V 9o No19-middot- V 120 No20bull---- V150
qcp 3
80 100 120 140 160 s (mm)
Bose resistance
Fig 1 1 lBa Point Pesistance vePsus settlement (Spang 1972J
65 Cone resistance qc [ MPa]
0 10 20 30
mud
5 ~ lll
0 c 0
c CD
peat
10 sand
Ill N
10=10
D=lOOOmm
1540=40
20__________________
[ml
Fig 1 119 Pile No 1 and results from static cone penetration test
Cone resistance qc [MPa l 0 10 20 30
7N V degW = 0+--------------------i
mud
5
lll
~ C 0
c peat~
10
sand lll N 1D15
15l lD=1500mm
40=60
20l---------=-------__J
[ml
Fig 1 1 20 Pile No 3 and results from static cone penetration test
66 Cone resistance qc [MPa]
10 20 II 3 igt pound ~
mud+peat
fine sand+ silt
50=11
l lo-11oomm
40= 44
10
15l____________c
[ml
Fig 1 1 21 Pile No 5 and results from static cone penetration test
Section Cone resistance Pile
0 0
5 10 15 20 25 30 qc [MPa] -----~-~shy~
Silt
[7r_ ___~ Medium Sand_~-----l
0 ltD
+shy4
0=11
9=
Fine sand + Silt t
30p=
middotmiddotmiddotmiddotmiddotmiddotmiddotmiddot1~11+-----E-----
[ml
Fig 1 1 22 Pile No 6 and results from static cone penetration test
Cone resistance qcmiddot 1MPuJ
0 10 20 30 67 01-+-------l--------------i
mud+ peat
fine sand
l1)
N
40=60
15L_____________
[ml Fig 1 1 23 PiZe No 7 and resuZts from static
cone penetr ation test
Section Cone resistance Pi le
0 5 10 15 20 25 30 qc [MPa 1 --~----Y-~-----~
Silt
Fine sand
Medium Sand Bentonite2----1~i
t 3
4
0
0=15
Fine iii ~~= 5
sand t ltD
6 +
Silt 7
3Dp=
63 g
10
11
12
13+------=~---l
[ml
Fig 1 1 24 PiZe No 8 and resuZts f rom static cone penetration test
68
I =3
Cone resistance qc [MPa]
0 10 20 30
C 0 C Cl
(I)
Said
Peat
Sand
l 0=110
D = 11
4 D = 44
Fig 1 125 Pile No 9 and results form static cone penetration test
69
Cone resistance qc[MPa)
0 10 20 30 I ~ II JE Ill= II=E IS
Fine sand QI
U) I
[- I C 0 + C Peat QI
CD
Fine sand 0
Ci D = 1 1
L l D= 110
4D= 4 4
Fig 1 1 25 Pile No 10 and results f rom static cone penetr ation test
70
Cone resistance 9c[MPa]
0 10 20 30
Sand
C 0 Mud peat
+shyc 5 ltII
co
Sand Op= 11
u 10 D= 110 4Dp=44
Fig 1 1 26 Pile No 11 and results foIm static cone penetration test
71
00 a_ N ~
middotu rr QI 0 u ~ C 0
QI ui C iij 0 QI U - 0
0 EN
d 2
Sll 1lOl
C
u (rr
C 0 u~
0
QI - C middot 0 C
U - O 0 EN
~ 0 2
E
ltD a---==-lr---___--~---6-l_-0_012 ~ Lr- - --1---------J J
S9l ls= apound QI -0 gtcc _gmiddot- 0 1) ui I
Fi g 1 1 2 Piles No 14 and 15 and results f r om stat i c cone penetr ation tests
72
Contact pressure p [ MPa] 2 4 6
01lt---------------~
50
E E
111 100 ~ (qcp=30 MPa for No16
~ iqcp =49 MPa for No14
~ 1so~--~~- _ _ __
I _ _
11 I lf--q = 32 MPa for No15
cp
Fig 1 1 28 Results f r om load tests on piles No 14 15 and 16
73
0300--------------~---~--~--shyE
Driven piles in ~ 0 bull Gravel
amp250 bull Sand L QJ X Silt a 1l o Bored piles in
sand -sect 200 0=-- shyC ~ ~ 10 unless ~~ middot D shown 1
ii O
~ ~ o 3 a 1501-----+-------I- --+---laquo-+-- -+------lt
~ sect 5 - 6 6middot 100t----+----+-----_-1---4--__co_--J~__j
-_
~ 0 t7
C
a 50 2 shyg ~ gt
0 20 30 40 50 60
Standard penetration resistanceN in blows per foot
(N 30
Fig 12 1 Emperical relation between ultimate point resistance of piles and standard penetrashytion test in cohesionless soil (Meyerhof 1976)
14 r-------------------r-------b-----q
References and symbols given in Fig121
121-----+---+----+----+------ll------j
- _sect ~ 10t----+----+-_--1-----+---lt~--~H---- 0 lt-~5- _-)0 I() l- I Q---+-----I[08 ~
H -(l () ltj-~C X bulls pound 061------lt----+-----i~- --+-- shy
- bull
-gt Q1pound--I---L---L---L---L--~ 0 10 20 30 40 50 60
Mean standard penetration resistance N in blows per foot ( N30 l
Fig 122 Empirical relation between ultimate skin friction of piles and standard penetration resistance in cohesionless soil (Meyerhof 1976)
74
a) b)0(1 0lt2
10 10
05 05
1 N30OD-+---------__ OD--t-----r-----r----------------ll--Nbull30~ 10 20 30 10 20 30 40 50
Fig 1 2 3 Reduction coefficient a) for impermeable gravels b) form permeablr gravels (Weltman and Healy 1978)
psf [MPo)
Fig 1 2 4 Relation between ultimate point resistance and SPT in cohesionless soil (Polish specification 1975)
75
30 35 40 45 Loo Med Dense Ver dense
50
40
~ E
l)
g 8 1)
middotu
1 ~
QI- bull Touma ~ bull Koizumi
(183)-depth base middotameter5
20 40 60 00 100 N30
30 35 40 45
OG2(294) bull G1 (183)
300 bull us 59 ( 102) bull 88(180)
bull 075 a GT (467)
150
~ 200-+--------+-- t--- --t-----i 130i 0 094 081
014 _- --- -- shy~ E 066bull bull 063 Note -~ ~m~r~s~ ~ 1001---1-r--t---1point is xh QI Ratio ~ Number in ( ) middotn key is h c Ratio s ~
0 20 40 60 00 100
~ig 1 2 5 Ultimate point and shaft resistance versus N30
(Wr ight and Reese 1979)
-----
76
tu Psa
[kPa] [MPa]
200 tu
------ shy150 Psa
1 1
1100 10 1 1
1 50
0+----------T----~---~-N-3J~shy0 20 40 60 80
Relation between ultimate skin friction and SPT (Decourt 1982)
Fig 1 2 6
Psa
[MPa]
8
0----Meyerhof 1976) 0 7
--- - --~ - copy Polish Specifcoti on 1975)6 ~-
~
reg- middot - Reese (1978) middot 5
f41- -- Decourt (1982) -I bull 4 2
----==---______z__ h25m Dp=12m
3 ---shybull
2 7
--shy ----shy~----shy0-t----i----------r-- ----------------------N3l~shy
0 10 20 30 40 so 60 70
Fig 1 2 7 Relation between ultimate point re~istance of large diameter piles and standard peneshytration test (SPT) in cohesionless soil
------
77
tu [kPa)
200 17 Cast under -J bentonite
~----Meyerhof (1976) ~copy -=middotmiddotmiddotmiddot== middotmiddot150 ~------- Wei tman (1978 ) middot Healy middotmiddot ___ Japanese ) 119810 Society
(0 -middotmiddot- Decourt (1982)middot Wright
100
- -middotmiddot -- 11979]reg Reesemiddot Bored piles
~shy50 1 -- shy
-- shy middotmiddot s-shy - --~ ------reg~~ ---~E_==---- ------- shy
N_ ---shy0-+--C--------------r---- ---------~---~-~shyo 10 20 30 40 50 60 70
Fig 12 8 Relation between ultimate skin friction of piles and standard penetration test (SPT)
78
Pst [MPa]
8
7 ---------ist=7MPa
6
5
4
3
2
I N30o~------------------------------+---------__=-shyo 10 20 30 40 50 60 70
Fig 12 9 Relation between ultimate point resistance of large diamter piles and standard peneshytration test (SPT) in cohesionless soil (proposal)
tu [MPa ]
( excavanted and cast
150 under bentonite ) tu=150 kPa
100 tu=90 kPa
I I
50 I I I I I N30
10 20 30 40 50 60 70
Fig 1 2 10 Relation between ultimate skin friction of large diameter piles and standard penetrashytion test (SPT) in sand (proposal)
79
2 3 4 5 p[MPa] 0 2 3 4 5 p[MPa]0
40 40 Cl
80 c 80
c 120 120
Pile No 1 PileNo216 160
200 2
s s c [mm] (mm]
0 2 3 4 5 p[MPa] 0 2 3 4 5 p [MPa]
40 40
00 80
120 120
16 160 Pile No 3 Pile No 4
200 200
s s [mm] (mm]
0 2 3 4 5 p[MPa] 0 2 3 4 5 p [MAJ]
tgt11 tgt- measured40 40
80 80
120 120
Pile No 5 Pile No 6 160 160
20 200 s s
[mm) [mm)
Fig 1 4 1 Base resistance vs settlement appoximative method piZe No 1- 6
80
0 2 3 6 5 p[MPa) 0 2 3 4 5 p[MPa]
40 40
80 80 6
120 120 6
6160 160
Pi le No 7 Pile No 8 6
200 3J s s
[mm] (mm]
0 2 3 4 5 4 p [ MPo)
6 6 40
6 6
6 80
6 6
6
Pi le No 9 Pile No 10
XJO s s
[mm] [mm]
0 2 3 4 5 p[MPa] 0 2 3 4 5 p [MPa)
6 6
40 40 6 6
6
00 80 6
6
12 1Xl 6
160 Pile No 11 160 Pile No 12
200 200 s s
[mm ] [mm]
Fig 1 4 2 Base resistance vs settlement approximative method pile No - 12
81
0 2 3 4 5 p[MPa] 0 2 3 4 5 p [MPa]
6 6
40 6 40 6
6
80 6 80 6
120 6 120
Pile No 13 Pile No 141fO 160
200 200 s s
[mm] [mm]
0 2 3 4 5 p [MPa) 0 2 3 4 5 p [MPa)
40 40
80 80
120 120
HiO 160
200 200Pile No 15 Pile No 16
s s (mm) [rrrn 1
0 2 3 4 5 p[MPa] 0 2 3 4 5 p[MPa)
40 40 A A A-measured
680 80 t t
120 c 120 c
1fil Pi le No 17 160 Pile No 18
200 200 s s
[mm] [mm]
Fig 1 4 3 Base r esistance vs settlement approximative method pile No 13- 18
82
0 2 3 4 5 p[MPal 0 2 3 4 5 p (MPa]
D D40 40 c c
80 c 80 c
120 120
160 160
Pile No 19 Pile No 20 200 200
~ml (mm]
Fig 1 4 4 Base resistance vs settlement approximative method pile No 19- 20
LlJ QI
0 average lJ = 098 E sd = 029 C
6 SY = 030
4
2
lJ calculated ________________________ _______ measu red
06 08 10 12 14 16
Fig 1 4 5 Calculated pressure divided by the measured pressure at 20 mn settlement for aZZowabZe
q Zoad Pa= ~p approximative method pile
No 1- 20
8 3
Point resistance p [ MPaJ
a)
p(s) = s a +--sshy1 y qcp
1
SQ100p -- --- ---shy
~ s
[mml
I- 01 s rmm]-l p LMPa b)
f~]
c Cll E ~ i s
[mm)
Fig 146 Definition of the point resistance - settlement curve according to the modified hyperbolic method
84
01 ~ 0
20 0 0
0
16 0
medium 0 value a1 = 905-+ 256 Op 0 0
12 (r=039)
0 0
----0 0
8 0
0 0
0 0
4 0
05 06 07 08 09 10 11 12 f3 14 15 16 17 18 19 20 2 1 Op (ml
Fig 1 4 Initial slope of the base resistance curve vs pile diameter
a1 [p] 0
0020
16 assumed a 1= 28 - 4 qcp
12 0
0 Ct) 0 a = 2659 - 369 qcp8 1
0 0 (r = 0188)0
4
2 3 4 5 (MPa]qcp
Fig 1 4 8 Initial slope of the point resistance curve vs ultimate point resistance on the static cone resistance for pile tests No 1 20
85
a [~ 28
24
20
16
12
8
4
0 2 3 4 5 6 Qcp [MPa]
~ Kiosinski (1977) sand and sandy gravel of mediwn density
~ Klosinski (1977) loose sand ID= 0 3 0 4
o US59 ] t HH Touma p and Reese L (1974) fine sand and silty sand OGl (US59 HH BB - very dense Cl - mediwn dense) 1 BB
DIN 4014 Part 2 (1977)
Fig 1 4 9 Initial s lope of the point res istance curve vs ultimate point resis tance
86
assumed [il =30 -10 Op but )1~ 10 )1 [1 I
u 311-10 Op ( r =0 368)4 1 0
3 0 0
02 0
0 0co 0 8 0 0
0
0
05 06 07 08 09 10 11 12 13 14 15 16 17 19 20 21 Dp [ ml
Fig 14 10 Correction factor for hyperbolic base resistance shysettlement relationship
87
a [~] 28
24
20
16
12
8
4
2 3 4 5 qcp [ MPa]
Fig 14 11 Initial slope of the base resistance curve vs ultimate base resistance (proposal)
v [ 1 ]
3
2 -----G- DP J l 1J I Op lm] J
for Dp ~ 2 0 m ~ u = 1 01
0 --------r----r---r----r-----------------r-------------------------r------r-~-~--shy
05 06 07 08 09 10 11 12 13 14 15 16 17 18 19 20 21 Dp[m)
Fig 1 4 12 Correction facto r for hyperbolic base resisshytance - settlement relationship (proposal)
s P ( s)
s +
u qcp
88
a) b)1
bt=o212= 47 MPa a1=1~32 tMWJ s 2 3 4 5 O 1 10 20 30 40 50 60 p [~a]0
0p [ MPa] 40 40
80 80
120 ~
160 b1 = ~ajtg ~= 0 212
~=1132 + 0212middot s
mJ 240 r=0994t t t measured s __ according to Jl s
o o o according to p (bull ll l[mm] [mm]
Pile No 2
slmm) 10 20 30 40 50 60 80 100 125 150 175 2)0 225 Note
p [ MPa] 09 14 17 20 22 24 27 30 32 34 36 38 39
measured
pibull) [ MPa] 074 128 169 202 228 249 282 307 330 347 360 371 380calculated
plbullbull1[MPal 070 125 168 203 233 257 297 327 356 378 396 410 422calculated
1) (bull) ij l099082 091 099 101 104 104 104 102 103 102 100 098 097 sd = 006
ij (HJ1041) (bull10) 078 089 099 102 106 107 110 109 111 111 110 10B 10B sd = 010
plbulll-according to a =1132 [ Jp(s) = s s for pile No21 0 1132 12 39
plbullbulll-according toa =1241 lmiddotGcp=39MPa1 0
~=14 see fig 1411 and fig 14 12 sp(S)=
124+ _ s_ 14middot39
11lbulll11l-J - correlation coefficient calculat~d P5 for
measure p s p(bull) and p(bull) respectively
Fig 1 41 3 Modified hyperboZic point resistance - settZement reZationship for piZe No 2
89
0 2 3 4 5 p(MA1] 0 2 3 4 5 p[MPa)
40 40
80 A 80 A
120 120
160 16 Pile No 1 Pile No 2
20 200 s s
[mm] rnm
0 2 3 4 5 0 2 3 4 5p [MPa] p [MPo]
40 40
80 80
120 1ZJ
lfpound) Pi le No 3 Pile No 4 A
200 A
s s A
[mm) [mm
0 2 3 4 5 p [MPa] 0 2 3 4 5 p [MPa]
40 40 A A A measured ~ calculated
80 80
12
160 160 Pi le No 5 Pile No 6
200 Z)Q
Fig 1 4 14 l3ase resmiddotistance vs settlement pr oposed method pile No 1- 6
90
2 3 4 5 p [MPa] 2 3 4 5 p [ MPa]
40 6
6 40
1 80 80
6
120 120 6
6 160 160
Pile No 7 6
200 200 s
[mm ] s
[mm]
0 2 3 4 5 6 p [MR] 0 2 3 4 5 p [MPa] 0 0
40 40 6
6
80 80
6
120 120
160 160 Pile No9 Pile No 10
200 200
s [mm] [msml I
0 2 3 4 5 6p[MR] 0 2 3 4 5 p [MPa]04--___ ____ ___ ___ ____
0+-=---------------~-~- shy
40 40 c 6 c - measured
0--0-0 shy calculated
80 80
120 120
160 160 Pile No11 Pi le No12
200 200
s [mm]
s [mm]
Fig 1415 Base resistance vs settlement proposed method pile No 7-12
91
0 2 3 4 5 p [MPal 0 2 3 4 5 p [MPa)
40 40
80 80
120
16 Pile No 13 Pile No 14
200 s
tnml [mm]
0 2 3 4 5 p [ MPa] 0 2 3 4 5 p [MPa)
40 40
80 80
120 120
160 1fD
Pi le No 15200 axJ s s
[mm] [mm]
0 2 3 4 5 p[MPa] 0 2 3 4 5 6 plMPa ]
A A A measured40 0---0-0 calculated
80
120 120
160 1ED Pile No 17 Pi le No 18
200 200
s s [mm] [mm]
Fig 1 4 16 Base resistance vs settlement proposed method pile No 13- 18
92
0 2 3 4 5 p [MFb] 0 2 3 4 5 p[MPa]
0 6 o -measured40 40 0 0 o -calculated
80 80
120 120
160 160 Pile No 19 Pile No 20
200 200 s s
[mm] [mnil
Fig 1 4 17 Base resistance vs settlement proposed method pile No 19-20
p(s~Psf
15 20
ean
-C 5 w u L Lower ~ confidence
linea 0
a IJl 10
o---o proposed
method I I I
15
Fig 1 4 17a Design curves for estimating developed base resistance in sand (Wr ight and Reese 1979)
93
n (number)
30
28
26
24
22
20
18
16
14
12
10
8
6
4
2
0 02 04
Fig 1 4 18
I= 126
Between 1] = 0 7 - 1 3--- I= 106 ( 84 frac34)
Average ~ = 098 Standard sd =023 deviation
Standard sv =023 veriation
1] (Coefficient Calculated Measured
06 08 10 12 14 16 18
Calculated pressur e divided by the measured pr essure for all pressure - settlement curves pr oposed method pile No 1- 20
94
a) b) Total load
Total load curve
---- _____-- shy- -- -Base load ~- Base load
-0-0 ~
00 00 J
ldeoli zed shaft load J
Shaft sesistanc1---------- 0=0middot30 a= 0 middot 30
025 Settlement IN 025 Settlement IN
Fig 1 419 Proposed method of synthesizing design loadsettlement curve (a) conservative design prodiction b) design prediction- peak in shaft loadsettlement curve (Burland et al 1966)
Cf
-0 0 0
J
0
~-----~--~-~ amp- 2 3 4 5 6 (cm)
a~middotltii -0 lt) cco2 41 -~ -0 1)
vi ~ llloli=----------- ---c~0 1 2 3 4 5 6 7 ( of diameter)1 1 1 1
05 10 15 20 ( in) for 30 in Pile Movemen~ ( 75cm pile)
Fig 1 4 20 Approximate load settlement curves for 30 in bored piles (AB and C represent failure load at 1 in settlement A B and C represent ultimate failure load) (Touma and Reese 194)
95
Load in MN 0 2 3 4 5
25
50E E C
-C 75
-~ ~
-Z 100 lJ
Shaft resistshy
125 once
15 Fig 1 4 21 Load-settlement relationships for largeshydiameter bored piles in stiff clay (Tomlinson 1977)
SettlementSo
Fig 1 4 22 Diagrams of s1iaft and base resistances versus settleshyment assumed in analysis (Kiosinski 1977)
96
0 0 1 ~ r- 025g ~~ 2
1- -shy3 03Sg 14 5 2
Qls =Qpls+Q5 (sQpls) Qs(s-3E
0
degsis __ -- Qpls) a~ C
4
t Sg l
5 Qu Is)
Q(s)in MN-l T
Ouls Q Is) in MN ---
Fig 1 4 23 Construction of load - settlement curves a) for sand b) for cohesive soil (DIN 4014 Part 2 1977 and Franke 1981)
-
s C 5C
Cl
3 0 00 05 10 15 20 Mean settlement I in)
Fig 1 4 24 Load- settlement curves for test shaft S4 (1 in = 25 4 mm 1 ton= 8 90 kN) (Reese 1978)
97
Relative side resistance
0 05 10 15 20 0E=--t----+---+--~
c QI lt) ~ 2 C
I itaker c
QI amp Cooke3E QI-j
c-en 4
C QI
E us 59o
5 QI gt
SA0 w 0 6
Fig 1425a Relative side resistance for clay vesus relative midlength settlement (Reese 1978)
degs (Osl u l t 0 05 10 15 2 0
Mean
2 Lower ~ C QI u
confidence line
~ 3 a
0
~4 E
()
5
6 __ _ ______ ________ __1
Fig 1 4 25b Design curves for esti mating developed side resistance (~Jy1nht ReertP- 1987 J
98 Load Q
8 - 15 mm
1- 2 of p ile diameter
100-200 10-15 of pile Os Ot diameter Shaft Total
Settlement S Resistshy Resist- Load ance once
Fig 1426 Dependence of total load base resistance and shaft resistance on settlement of lar-ge diameter pile (Tejchman Gwizdala 1979)
6
5 Shaft load
4
3
2
z ~
-0
g Pile EF- 56 J 0
0 0 20 30 Butt settlement (mm)
Fig 1 4 27 Deveiopment of shaft and base resistance with settiement (Promboon Brenner 1981)
99
0 1000 2000 3000 4000 5000 6000 7000 8000 9000 0 r-=-1---J__-----------------------~----_shy
Load [ k N l5
10
20
( I
Skin friction ----1 I I
~ 40 QI E
fQI
50 I
Q) I () ICOntinuos fost deolading
Fig 1428 Load-Settlement-Diagram Testelement III (Diaphragm-Wall 0515 m 244 m deep) Portion of Skin Friction and Base Resistance (Prodinger Veder 1981)
Qs (QJ max
0 05 10
Upper Limit of Data
Farr and Aurora (1981J C
~ 2 - shy -+shy - Mean of Data
I QI
Lower Limit of Data a
0 - 3 E
Vl
4
Smid = Approximate shaft buff movement ignoring the elastic compression of upper halt of the shaft
D = Shaft diameter
Q Mobi Ii zed shaft resistance
Qs1max = Maximum shaft resistance
Fig 1 4 29 Relative shaft resistance vs relative movement (Farr and Aurora 1981)
100 Load Q (s) [ MN]
Su5 s s 20 mm for non- cohesive soil u
s s 10 mm f or cohesive soil u
s s 15 mm for claysand u
Q (s) + Q (s)s p
Qs(s)
-C ltII E s ~- [mm]-ltII IJ)
Fig 1 430 Dependence of total load Q(s) point res i stance Q (s) and shaft resistance Q (s) versus settlement p s
~ 3 Usu Qpu Qu Q(s) [ MN]
Sus= 20
1J
60
80
100
120
degs (s ) 140
5 P=Ol Op
1EO
C -ltII E 180 ~ ] 200
s [mm]
Approximative dependence of total load point resistance and shaft resistance versus settlement fny non-cohesive soil
Fig 1 4 31
101
113 3 ~fic0P Ye hY
1 Ground water
D
I y
yh C
Fig 1 5 1 Determination of 01 and 03 for settlement analysis of lar ge diameter bored piles
102
I
E=Et [MPa]
160 0
140
120 0
100
80
6
40
--- --shy 0
0
8 0
0
0
20
2 3 4
I 0 15
Fig 1 5 2
E = Et [MPa]
120
100
80
60
40
I I 0 35 065 085
0
Et= 17 81 qcp0844
( r = 0 128)
5
100
6 qcplMPo]
Calculated values of Young s modulus for piles No 1shy24 according to equation 1 5 2 and 1 56
0
0 0
E =898qcp127 (r= 0314)
E = 9 middot qcp 13 0
20 shy 0
0 0
0 1 2
loJ
I 0 35
3 I
065
4
I 085
5
100
6 qcp [MPo]
Fig 1 5 3 Calculated valueBof Young s modulus for piles No 1shy24 according to equation 1 5 4 and 1 5 6
I K 10 3
( 1 ] 1832
1400 0
1200 0
0
1000 0
800 0
m=2821 qcp0621
600 0
(r=0057)
400 0 0 0 0 0
200
2 3 4 5 6 qcp (MPa]
I 035
I 065
I 085 100 Io
Fig 15 4 Calculated valuesof the dimensionless compress ion modulus K for piles No 1- 24 according to equation 1 5 2 and 1 56
K ( 1 ]
0
1400
1200 0 0
1000
800
600
0
0 0
0
0 0
0 K= 1422 qcpl05
(r=0181)
0 K= 150 qcp
400 0
3)0 0 0
2 3 4 5 6 qcp(MPa)
I I -J 035 065 085 100 Io
Fig 1 5 5 Calculated values of the dimensionless compression modulus K for pile~ No 1-24 according to equation 1 5 2 and 1 5 6
104
120
100
2 3 4 5
I I I rv 0 15 035 065 085 100 lo
Bergdahl (1982) for shallow foundation
o----o Bozant Masopust (1981) D= 1 0 rn h=10 rn large diameter bored piles in noncohesive so il
0----0 Proposal according to current anal ysis
Klosinski (1977) D=090 to 125 rn large diameter bored piles in sand and sandy grave l
Mitchell Gardner (1976) very dense sand E=(35)q (it depends on sand density and stress history) c
Fig 1 5 6 Composision of Young s moduius
105
TABLES
0 Tab 1 11 Methods for detemination of the bearing capacity of bored piles (Ro llberg 1977)
Cl
Nol -- I Soil Areas of Q) Q) Editor Determination of Coefficients 5 type influenceqP qs p ~ C C 11 12 fP I fs
1 all Lab f Soil Mech (1936) l qp at the elevashy 1 0
2 all Huizinga (1951) ~ t~on of the pile 14 point
3 all Van der Veen (1953) ) 18 1 h+l14 all Van der Veen 1 0 Dpl375 D~ 15-- J qcmiddotdhBoersma (1957)
~ 11 +12 h - 12
5 12 all Menzenbach ( 1961) qc at the elevashy~ tion of pile point
6 18 all Mohan Jain Kuman (1963)1 average of qc over 1 h Q) h ~qcmiddotdhl 10 Dpj 3 75 Dj 15 50_micro
and 1 2C 11
7 I amp all de Beer ( 1964) graphically from 10 Q) qc 0 1 h+l18 u C
sand Soviet norm SNIP II 9ct9cp I4 bull O Dp I10 DP l66-1 083shyu clay B5- 67 Trofimenkov (1969) 2 50 1 251 +l J qc middotdh micro middot h middot-l l 2h-~ _micro
9 _micro u all Paproth (1972) at the elevation 3 5 I shy
) of pile point (Dpgt0 5 m 7 D8DpE
E-lt p 1 h+l1 1 h Dplt 5 m u l+l J qcmiddotdh h f qcmiddotd~ 30 Dpl 50 Dp 2 0 100shy10 sand Norwegian method
0l 2 h-12 200Senneseth (1974)
11 lall Soviet method h+l (20-0lqgl - 101 1 q middotdhTrofimenkov (1974) -- f C UpUsmiddotQct
l1+l2 h - 1212 Qct-Qcp 40 D~ 10 Dp 1 33- 0 67shyUsbullh 4 00 2 50
13 English method 10 DFJ 375Dp 10 I
Rodin Corbett Shershywood Thorburn (1974)
3 7 5 Dcl 8 0 DP 10h+l1 _1_ J qcmiddotdh 1 h
qcmiddotdh 20011 +12 h - 12 hb
1 h qcmiddotdh 150hf
0
Observations
fp I f (qp)fs C
Dp E = 1 cm Qbu = 2 Qpa (approx )
s fs=f (qc)
q=~g Us 0 h
fp=f(q~)
fs=f(qgl
bull fine grained non- cohesive soil loosely packed
bull fine grained non- cohesive soil medium dense comp
fine grained non- cohesive soil
Tab 111 (cont)
h+h bE 14 non-cohe- Meyerhof ( 1956 poundti J N 3o middot dh CtME fN3 o dh 1 0 DP 4 0 DP 10 100 etM= l 2
sive soil 1976) lJ +12 h - li hE o hgp taken into consi der ~ Ul (I)
E-lt
C 0
~E = 1 kgbull 30 cm
(statistical limit depth of the pile) hE - clamping length of
pile micro rrJ l-l micro (I)
15 C (I) p
sand Norwegian method
- irm - - - 10 IT
m = diagram O l-l Senneset (1 974) rrJO C
16 rrJ micro gravel English meth it 3 middot N30 - - - 10 - Jf 3 + diagram U) ~
E-lt p U)
iiouiu Coruett Sherwood Thorshyburn (1974 )
(NJQat the elevashytion of pile point1
0 -i
108
Tab 11 2
Results of calculati o n of p i le point load pile shaft load and total pile load from static con e penetration test (Rol l berg 1977)
~ gt
~ gt Ultima te Ultimate Ult imate
No Method micro micro poi nt skin bearing 080lt17nlt1 50 Q) -l
-l middot-i resistanceuro resistance r esistancE
middot-i p 0
(J n1 n n2 n n3 n n1 n2 n3
1
2
Lab fSoil Mech
Hu izinga (1951)
(1936 ) 430
307 i 3 Van der Veen (1953) 239
49
4
5
Van der VeenBoersma
Menzenbach (1961)
(1957) -l middot-i 0
2 4 7
1 57 1-CJ)
6
7
8
Mohan Jain Kumen
de Beer (1964)
Sovi et Norm (1969)
(1963) CJ) Q)
-l middot-i 0
lJ Q)
Q)
gt- CJ) Q)
c 0
2 44
1 37
183
47
t I
49
487
0 18
47
16
3 02
0 85 1
47
16
137
08
9
10
Paproth ( 1972)
Norw Method (1974)
~ 0
0
u I
C 0 C
1 8 1
180 l 46
1- - -_L~ 46 167 46 1 19
1 1 Soviet Method ( 1974) [1 1 41 46 1 62 13 083 13 1 14 0 8
12 Engl Method (1974) 2 66 35 128 35 2 30 35 1 28
Note
cal Q a) n = --- mean value of the rat i o between calculat ed pile loads and those n Q determined f r om loading test
b) n = number of piles
109
Tab 113
Point resistance of large diameter piles (DIN 4014 Part 2 1977)
Settlement Point pressure 1 Factor -fshy
(cm) (MPa) cf=lOMPa I i=15 MPa C C
Piles without enlarged base
1 05 005 003 2 08 008 005 3 11 0 11 007
15 34 034 023
Piles with enlarged base
1 035 0 04 002 2 065 0 07 004 3 0 90 009 006
15 2 40 0 24 0 16
Note 10 lt qp lt 15 (MPa)C
Tab 114
Skin friction resistance of large diameter piles (DIN 4014 1977)
Strength Static cone pen- Depth below Skin frict ion Factor of sand etration resist surface
(MPa) (m) (MPa) fs
Very small lt 5 - 0
Small 5 to 10 0 to 2 0 2 to 5 003 ln6 to 333
gt 5 005 100 to 200
Medium I I 10 to 15 0 to 2 0 I
I 2 to 7 5
gt 75 I 0045 0075
222 to 133 to
333 200
High I I
i
l
gt 15 0 2
to 2 to 10 gt 10
I I I
I
i
0 006 0 10
gt gt
250 150
Note Skin friction is assumpted as linear until s =2 cm and constant for s gt 2 cm
11 0
Tab 115
Values of the inverse of the point resistance factor (Bustamante 1982) fp
Soil type qPC I 1
Factor - shyfp(MPa)
for piles group
a) Silt and loose sand lt 5 0 40 -b) Moderately compact
5 - 12 040sand and gravel
c) Compact to very gt 12 i 030compact sand and gravel I
Tab 116
Values of the shaft resistance factor fs (Bustamante 1982)
Factor fs
Soil type qs
C Category I(MPa) I A I B I II A III BI
I a) Silt and loose lt 5 60
i 150 I 60 I 120-
sand
b) Moderately corn- I pact sand and 5 - 12 100 200 100 200 gravel i
Icl Compact to very
compact sand gt 12 150 i I 300 150 I 200I
I I and gravel i
I
111
Tab 117
Point resistance factor (proposal)
-
1-fp
qc (MPa)
Gravel
Coarse sand Medium sand
Fine sand Silty sand
25
080
0 70
060
5 0
0 65
055
047
75
054
045
039
10 0
045
036
031
150
035
027
022
200
030
0 23
018
Tab 118
Shaf t r e sistance factor (proposal)
fs
qc (MPa)
Gravel
Coarse sand Medium sand
Fine sand Silty sand
25
80
100
130
10 0
120
150
190
I 200
180
230
300
11 2
Tab 119
Calculated values qcp
for large diameter piles
Pile Literature Length Diameter (m) Measured p Cr1 lcul Settlement Note Authcr(year) No (ml D Dp (MPa)
(s=0 10Dp) (MPa)p ~~JL__
s s ()(mm) Dp
1 Franke (1977) 1 13 11 36 38 117 106 Garbrecht
2
3
2
3
13
14
11
15
1 58 36
37
38
40
215
185
136
123
) qg accord to Franke
4 4 13 15 204 3 2 33 220 108 and Garshy
5 5 6 11 33 35 127 11 5 brecht (1977)
6 6 6 11 153 36 35 146 9 5
7 7 6 1 5 34 35 158 105
8 -shy 8 6 15 2 1 41 3 0 109 52
9 10 9 11 39 52 47
10 11 95 11 43 35 77 70
11 12 9 11 49 66 60
12 13 10 11 15 5 1 4 0 77 5 1
13 14 9 11 1 5 4 8 46 115 77--shy14 Pranke ( 1973) 15 115 18 4 9
) ) average 88
15 13$ 13 5 1 3 19 -2 5 3 2 sd=3 0
16 - - 165 16 5 13 19 30 sv=0 34
17
18
Spang (1972)
llXJ
V90
6 6
6 75
0 7
09
3 2
4 2
32X
42X
x) s =0 10 D p
19 VlaJ 720 1 2 39 3 9X
20 - - VlsJ 6 5 1 5 3 0 3 ox
21 Touma and US59 9 9 o 76 8 0 Reese ( 1977)
22 HH 75 0 61 8 0
23 Gl 180 091 - 2 5
24 BB 137 o 76
sd = standard deviation
sv = standard variation
Tab 1 2 1
Ultimate point resistance coarse and medium sand psf (MPal (Pol ish Specification 1975)
Depth h
Medium sand r = 0 40 N = 200 30 Base diam (Op) and depthbase diam (hDp)
Dense sand r 0 Base diam (Op)
= 0 80 = 50N30 and dpethbase diam (hDp)
(ml Dp = 0 6 m Dp = 1 0 m Dp =12 m Dp = 1 5 m Dp = 0 6 m DP = 10 m DP = 12 m DP = 15 m
Psf hDp Psf hDp Psf hDp Psf hDp Psf hDp Psf hDp Psf hDp Psf hDp
5 10 83 0 85 5 0 075 42 07 33 20 8 3 16 50 14 42 13 3 3
7 14 11 7 1 2 70 11 5 8 10 4 7 2 8 11 7 22 70 2 0 5 8 1 8 47
10 18 16 7 15 10 0 14 8 3 1 3 67 35 167 28 100 2 5 83 2 2 67
15 18 250 18 15 0 16 12 5 15 100 4 2 25 0 3 4 15 0 30 125 27 100
20 2 4 333 2 0 200 185 167 1 7 133 4 7 333 3 8 200 33 167 30 13 3
25 26 41 7 2 2 25 0 20 208 19 167 5 0 41 7 4 0 250 3 5 20 8 3 2 167
w
11 4
Tab 131
Partial safety factors for resistance to axial load for bored piles (Wright Reese 1979)
Partial safety Normal Poor factor for control control
Unit skin resistance 1 70 185
(no load test)
Unit skin resistance 160 1 70
(from load test)
End bearing 165 180
Tab 1 3 2
Probability of failure of bored piles under normal design conditions (Wright Reese 1979)
Probability of Factor of Structure failure safety classification
5 10-3 25 monumental
210shy 22 permanent- 2
5 middot 10 2 0 110shy 1 85
temporary 5 bull 10-l 165
11 5
Tab 133 Results of field tests (Tejchman Gwizdara 1979)
L
II C C C 0 0 0
micro micro
micro micro micro For universal safe~y F2u u CUNo micro C C ~ ~g~ middot- C
~ Permisible micro micro i ~c -i micro
cmiddot-~ micro~ L
micro oo ~ load ~t~ ~~ omicro micro ~ ~ 3Z~ ~ ~ micro
-~~
~ e ~ --middot--
middot- ~ obull 0
~ g ~~ ~~ ~
~ L
o Jl i5 sect~ =gt L Q~ = yen t p Qp Qp
D h Q~ Srrx s tm p s E~ iQ~lQ~cm ~~ KN X ll1l kPa kPa kN kN kN Jl ~e ~ 1 2 3 4 5 6 7 8 9 10 11 12 13 14 15 16 17
1 70 6 60 4081 1550 2531 38 0 1182 10 4040 175 2041 245 1796 632 141 120
2 90 6 75 5082 3041 2041 598 1785 10 4782 107 2541 1079 1462 282 140 42 5
3 120 720 7259 4041 3218 557 1035 10 3576 119 3630 2158 1472 187 2 19 594
4 150 650 8643 4454 4189 51 5 928 20 2521 136 4326 2158 2168 3 10 166 253
5 130190 195 7750 3011 4709 392 805 10 1075 - 3875 981 2894 3 10 166 253
6 130190 165 9516 5101 4415 536 522 20 1800 - 4758 1962 2796 260 158 412
7 130190 135 8044 5199 2845 646 114 4 15 1834 - 4022 2109 1913 2 47 149 524
8 180 115 11380 4415 6965 388 792 15 1735 - 5690 2747 2943 161 2 37 483
9 76 980 6867 4316 2551 628 110 13 9529 109 3534 1128 2306 383 111 32 8
10 61 7 60 7161 2747 44 14 383 67 15 9404 303 3581 392 3188 700 169 109
11 92 180 4807 883 3924 184 20 8 1329 76 2404 196 2207 450 178 82
12 76 24 5 6769 736 6033 109 20 8 1623 103 3385 147 3238 500 186 43
13 76 137 5396 2060 3336 38 2 63 8 4535 102 2698 589 1109 350 t 58 218
14 120 23 5297 1854 3443 35 0 960 10 1640 39 2649 196 2453 945 130 7 4
15 135 16 7 13489 7554 5935 560 181 10 5260 83 6749 2060 4689 367 127 305
16 170 46 0 8829 2943 5886 333 17 10 3466 39 4415 1373 3042 2 14 1 94 31 1
Average Fi 387 166 Standard deviation Sd 2 1 5 034 Standard variation sv= 0 56 0 20
1234 Spang1972 567 8 Franke 1976 9 10 111 2 1 3 Touma Reese 1974
14 Colombo 1971 15 Kerisel Simons 1962 16 Appendino 1973
11 6
Tab 134
Results of model
SafetyScheme factor
medium F ssand
F p
loose F s
samd Fp
F 3 55 sd _P F 1 32 sd
s
tests (Tejchman Gwizdara 1979)
Diameter D (mm)
30 60 90 133
145 129 108 112
280 3 08 307 294
140 154 153 112
594 3 04 324 426
107 sv 030
0 19 sv 0 14
117
Tab 135
Individual safety factors according to literature
Literature proposal ofLiterature individual safety factor
Fs Fb
Polish Specification (1974) 100 250
Tejchman Gwizdala (1979) 150 400
Bustamante Gianeselli 200 300 (1982)
Decourt ( 1982) 130 400
average 145 3 38
TAB 141 0)
Load settlement curves - measured
Pile No
Settlement 1 c 3 4 5 6 7 8 9 10 11 12
s p s p p s
p p s P
p s P
p s p p s
P p s
P p s
p p s p p S
p I i p s
p p s p
mm MPa rrrn lifl5a MPa mm
lifl5a MPa
mm lifl5a MPa mm
RPa mmMPa nwa MPa mm
RPa MPa mm RPa MPa mm
RPa MPa mm RPa MPa mm
RPa MPa mm RPa MPa mm
RPa 10 045 222 09 1 1 05 20 07 143 06 167 08 125 0 5 20 08 125 10 100 08 12 5 15 67 16 63 20 092 21 7 14 43 08 25 10 20 0 1 1 182 12 167 0 9 22 2 12 167 18 111 14 143 24 83 22 9 1 30 125 240 1 7 I 7 6 1 1 273 1 2 250 14 214 15 200 1 2 250 15 200 25 12 0 19 15 8 30 100 26 11 5 40 1ti 250 20 10 0 14 28 6 14 286 1 7 235 18 222 1 4 286 18 22 2 3 2 12 5 23 174 36 111 3 0 133 50 20 250 22 ~27 1 7 294 1 5 333 20 250 2 1 ~38 1 7 294 1 9 263 37 135 27 18 5 4 2 11 9 33 152 60 2 2 273 24 ~5o 20 300 1 7 353 23 61 22 ~73 18 333 21 286 43 140 30 20 0 46 13 0 36 16 7 80 271 295 27 796 24 333 20 400 27 ~96 25 1320 22 364 25 32 0 53 15 1 36 222 41 195
100 322 31 1 30 333 28 357 22 454 31 1323 29 345 26 385 28 357 60 16 7 40 25 0 45 22 2 125 38 329 32 391 32 391 25 500 32 139 1 30 41 7 32 39 1 4 6 272 48 ~6 0 150 14 2 357 34 1441 36 41 7 27 555 36 ~1 7 34 44 1 36 41 7 175 36 486 39 449 30 583 38 ~61 38 461 200 38 526 42 476 32 625 225 39 577 33 682
(mmMPa) ( 1 MPa)
1
1=2074
t 1=O ~01 =0 98S
a1=1132
b1 =0 212 V =0994
a1=2217
b1=O 131
V =Q 978
a1=1860 b1=0233
V =Q966
a1=1562
b1=0174 V =Q983
a1=1382
b1=O195
V =0975
a1 =20 37
b1 =C 174
V =0957
a1=1443
b1=(l 193 v =O 961
a1=965
b1= 0071 V =0 990
a1=1 91
b1 =o 128
V =0 993
a1=5 83
b1=C124
v =O 981
a1=6 1 4
b1=01 64 v =U 985
li(MPa) ~9 4 7 76 43 57 middot5 1 57 5 2 141 78 81 61 cp (MPa) B8 39 40 33 35 35 35 3 0 39 3 5 49 40 __Ef ~-6 1 2 1 9 1 3 16 15 16 1 7 36 22 16 15 qcp
TAB 141 (continue) Load settlement curves - measured
Pi le No 3ettlement 13 14 15 1 17 18 19 20 21 22 23 24
s p s T5
p s T5
p s T5
p s P
p s P
p s P
p s P
p s P
p s T5
p s T5
p s p p s
p mm MPa lll1l
HPa MPa mm HPa MPa mm
fWa MPa mm fWa MPa lll1l
HPa MPa mm HPa MPa mm
MPa MPa lll1l NT5a MPa HPa MPa 111111
HPa MPa 111111
HPa MPa 1)1111
mra 10 1 7 59 075 133 06 167 075 133 ~95 105 09 11 1 07 143 3 76 1 7 59 08 133 10 100 20 2 4 83 130 154 095 21 1 1 15 17 4 1 75 114 16 125 12 167 ~7 74 33 6 2 1 3 15 3 1 9 103 30 29 103 1 7 176 1 2 250 15 200 r55 118 22 136 16 18 8 38 79 46 66 1 7 182 27 110 40 33 12 1 20 200 1 35 29 6 1 75 229 ~O 133 26 154 175 229 49 82 58 6 9 1 9 21 1 35 115 50 36 139 235 21 3 145 34 5 1 95 256 24 208 ~-4 147 28 17 9 20 250 gt8 86 6 9 72 2 2 233 4 2 11 8 60 39 154 265 22 6 1 55 387 2 15 279 28 214 ~6 16 7 30 120 0 2 2 27 3 o 8 89 80 7 5 2 3 262 80 43 186 31 258 1 7 47 1 36 222 14 05 198 33 124 2 25 320 B 1 98 25 327
100 45 222 18 556 39~ 253 ~-5 222 36 1278 27 370 ~8 113 125 47 26 6 20 625 42 29 8 149 255 28 1446 t50 22 682 3 0 500 175 200 225
(mmMPa) a1=479 a1=1206 a1=14 51 a1=1113 a1=1406 ~=836 a1=843 a1=1176 ~=64 a =561 a1=10 0 a1=9 5 (1MPa) b1=0175 b1=0 178 b1=0 382 b=0287 b1=O 119 p 1=0 137 h1 =o 193 b=0258 p1=0 049 b1=0032 b1=0 276 b1 =0 048
hf (MPa)
v =0998 57
v =0-987 5 6
v =0989 26
v =0992 35
v =0933 Iv =0991 84 73
v =0993 5 2
v =0998 tJ
3 9 =0944 v =0998 v =0996 v =0981
qcp (MPa) 46 39 32 30 32 14 2 39 30
lL 12 1 1 08 12 26 1 7 1 3 13 qcp
lD
N 0
TAB 142
Calculated point resistance curves
Setlement (mm) p(s)
1
n p(s)
Calculated value of the p(s) for pile No
2 3 4 5
n p(s) n p(s) n p(s) n p(s) 6
(MPa)
n p(s)
7
n p(s) 8
n p(s) 9
n p(s)
10 20 30 50 80
100
150 200 225
070 128 177 253 335
375 446 493
157 140 141
127
123
1 16 106
070 1 25 168 232
297
327 378 410
422
078 089 099 1 06
1 10
109 1 11 108
108
073 1 30 176 246
315 349
405 441
146 163
160 145
1 32 125
113 105
056 096
1 26
167 205 222
249 265
271
0 80 096
105
1 11 100 101
092 0 83
082
065
118 162 233
308 345
412 456
108 108
1 16 116 114 111
064
1 12 151 2 10 2 69
298
346 3 76
078 P63 093 tt 13 101 tt 53 100 I 13
108 ~75
103 ~04 096 ~ 55
~ 87
1 26 125 127 126
125
1 17 1 04
052 088
1 15 153
188 2 03 227 242
065 0 74
o 77 0 81 0 75
0 73
063
072 122
1 83 262 347 388
463 5 11
073
0 74
073 0 71 0 65 065
064 1 18
162 233 309
3 46
41 3 4 57
Dp (m) 1 1 Qcp (MPa) 38 (mmMPa) h2 8 1 1 9 Qcpbullv1(MPa) 72
158
39
124 14 55
15
40
n20 15 60
204
33 148 10 33
1 1
35
tt 4o 1 9 67
1 53 3 5
tt 4 0 1 5 51
15
13 5
114 0 15 i-gt 3
2 1
30
tt 6 0 10 3 0
1 1
3 9
12 4 1 9 74
1 1
3 5 h40
1 9 67
Note n = condition coefficient calculated p(s) measured p(s)
10
n
081
084 0 85 0 86 0 85
087
TAB 142 (continue)
Calculated point resistance curves
Calculated value of the p(s) for pile No (MPa) Setlement 11 12 13 14 15 16 17 18 19 20
(mm) p(s) ll p(s) n p(s) ll p(s) n p(s) n p(s) n p(s) n p(s) n p(s n p(s) n
10 106 070 0 71 045 091 054 099 1 32 055 092 053 070 060 081 085 0 72 080 055 078
20 1 90 079 130 059 160 067 1 70 1 30 096 101 091 079 1 12 148 085 1 31 082 098 082
30 258 086 1 76 068 2 15 074 222 1 31 1 26 105 120 080 156 205 081 180 082 132 083
50 363 086 246 075 297 082 296 1 26 1 70 117 161 082 228 095 295 087 256 0 91 184 092
80 471 316 o 77 3 77 088 364 1 18 2 1 o 1 24 199 308 085 393 097 336 1 02 237 095
100 522 349 078 415 092 394 228 1 27 2 16 348 088 442 098 375 104 262 097
150 611 405 479 443 258 117 244 423 529 443 304 101
200 669 441 518 473 276 261 474 587 488 331
Dp (MPa) 1 1 1 5 1 5 18 1 9 19 070 090 12 15
qcp (MPa) 49 4 0 46 49 32 30 32 42 39 30 12 a1 mmMPa) 84 h20 96 84 152 160 152 124 160
IV1 1 9 1 5 15 12 11 1 1 23 21 18 15
qcpmiddotv1 (MPa) 93 60 69 59 35 33 74 88 70 45
- 12287 average = ~ = 098
standard deviation sd = 023 standard variation sv = 023
N
122
TAB 143 Ultimate settlement for shaft resistance - summing up
Ultimate settlements (mm)Literature sand cohesive claysand
soil
Burland Butler Dunican (1966) 7
Touma Reese (1974) 10 Tomlinson (1977) 10 Klosinski (1977) 8
Francke Gerbrecht (1977) 20-30 DIN 4014 part 2 (1977) 20 10 Francke (1981) Reese (1978) (1979) 05-2 of 05-2 of Farr Aurora (1981) shaft dia~ shaft diam
5-20 mm 5-20 mm Tejchman Gwizdala (1979) - Spang (1972) 10
10 10 20
- Francke (1976) 10 20 15 15
- Touma Reese (1974) 13 8 15 8
8 - Colombo (1971) 10
- Kerisel Simons (1962) 20 - Appendino (1973) 10 Promboon Brenner (1981) 10 Prodinger Veder (1981) 12 Decourt (1982) 10-15 10-15
-average s = 14 1 10 126
standard deviation sd = 53 2 1 47
standard variation sv = 038 021 037
123
TABLE 14 4 Al l owab l e base resistance versus sett lement
Pile Li terature ength Diameter (m) Calculated qcp=qcp Settl ement Fp-3- sa (mm)No Aut hor No (m) D DP qcp (MPa) for qcp3(MPa)
1 Francke ( 1977) 1 13 11 38 127 25 Garbrecht
II2 2 13 11 158 39 130 19
II3 3 14 15 40 133 33
II4 4 13 15 204 33 110 23
II5 5 6 11 35 117 22
II6 6 6 11 153 35 117 19
II
8
7 7 6 15 35 1 17 25
II 8 6 15 21 30 100 21
II9 10 9 11 39 130 13
II10 11 95 11 35 117 15
II11 12 9 11 39 163 11
II12 13 10 11 15 40 133 7
II13 14 9 11 15 46 153 9
14 Francke ( 1973) 115 11 5 18 30 100 15
II15 135 135 13 19 32 107 29
II16 165 165 13 19 49 163 35
17 Spang (1972) V70 660 070 32 107 28
18 II V90 675 0 90 42 140 16
II19 V120 720 1 20 3 9 130 16
II20 V15C 650 150 30 100 16 average for pi les 198
standard dev sd = 78
standard var sv = 039
)assumed qc = p for s = 010 Op sonding meRsurement were not availab le
IV
TA~LE 15 1
Comparison of the initial sl ope of the pile point resistance - settlement curve
Accardi ng to 1 2 3 4
In i t i ~l 5
slope a1 for the pile No
6 7 8 9
(mmMPa)
10 11 12 13 14 15 Note
a 1 for s=10 mm 222 11 1 a1 for s=20 mm 21 7 14 3 calculated 207 113see Tab 14 1 Bo Berggren (198 )230s=20 mm
Schmertmann s method (see 202B Berggren 1981)s=20 mm
No 1 _ llNo - 6 1 97 098
202 250
22 2
400
30 8
090
14 3
200
186
076
167
182 156
286
18 2
107
125
167 138
091
20 0
222
204
426
263
098
125
167
144
087
100
11 1 9 7
182
23 5
1 03
12 5
14 3
11 9
174
164
105
67 83
58
14 6
125
1 16
63
9 1
61
103
59
8 3 48
123
13 3
15 4 12 1
1 10
167 21 1
aceto hypershy14 5 bola type curve
1 15
No 2 NQj = n1
No 4Noz ~ na No 5Naz= T]g
105 1 27
106
093
1 13
160
1 23
108 1 17
157
100
121 109
1 92
118
1 16 1 14
164
2 12
120
122
1 15
143
1 76
151
149 1 73 1 27 146
TAllLE 151 (continue)
Compa ri son of the initial slope of the pile point resistance - settl ement curve
Initial slope a1 for the pile No (mmMPa)According Note to 16 17 18 19 20 21 22 23 24 -a1 for s=10 mm 133 - 105 11 1 143 76 59 133 100 a1 for s=20 mm 174 - 114 125 167 74 62 153 10 3 calculated see 11 1 146 84 84 118 64 56 100 95Tab 141
Bo Berggren 198 67 78 25 0 114s=20 mm Schmertmann s method (see B 136 67 250 146 Berggren 1981) s = 20 mm
nG = 108 No 1NoJ = n 1 20 125 1 32 121 1 19 105 1 33 105 sd = 0 14
SY= 013 No 2 i) = 1 29ro1 = n1 157 136 149 142 1 16 1 11 1 53 108 sd = 019
SY= 015 No 4 iis = 143 INo2 = ns 091 126 1 63 111 sd = 033
SY= 0 23 No 5 ii9 = 1 37183 108 163 142INoz = n9 sd = 0 37
SY = 027
N Vl
126
TABLE 152
Measured and calculated pile point resistance
Pile Calculated Measured Measured No qcp P for
s=10 mm P for s=20 mm
~ 10 mm ~ 20 mm
- (MPa) (MPa) (MPa) - -
1 38 045 092 84 41 2 39 09 14 43 28
3 40 05 08 80 50 4 33 07 10 47 33 5 35 06 11 58 30 6 35 08 12 44 29 7 35 05 09 70 39 8 30 08 12 38 25 9 39 10 18 39 22
10 35 08 14 44 25 11 49 15 24 33 20 12 40 16 22 25 18 13 46 1 7 2 4 27 19 14 30 075 13 40 23 15 32 06 095 53 34 16 49 075 115 65 43 17 32 - - - -18 42 095 1 75 44 24 19 39 09 160 4 3 23 20 3 0 07 12 43 25
average= 484 291
sd 163 088 sv 034 030
Tab 153 Results of calculation for piles No 1-24
Pile No
Length (m)
Overburden pressure 0 vs
0hs (kPa)
0ve (kPa)
0 nc (kPa)
- -ov=o1 (kPa)
- -OV=03 ( kPa)
00 (kPa)
p(a il ( kPa)
s (a 1) (mm)
A2 ( 1 )
E t
(kPa)
Md ( 1 )
K (1)
E I
t (kPa)
( kPa) 1 2 3 4 5 6 7 8 9 10 11 12 13 14 15 16
l 2 3 4 5 6 7 8 9
10 11 12 13 14 15 16 17 18 19 20 21 22 23 24
13 12 14 13 6 6 6 6 9 95 9
10 95
11 5 135 165 66 675 72 65 99 75
180 137
l 33 133 123 116
70 70 70 70
104 102 95
102 95 94
106 139 95
101 106 97
180 137 221 215
53 53 49 46 28 28 28 28 42 41 38 41 38 38 42 56 38 40 42 39 72 55 88 86
202 202 216 202 1114 104 104 104 146 153 146 160 153 181 209 251 120 128 134 123 238 180 305 277
202 202 216 202 104 104 104 104 146 153 146 160 153 181 209 251 120 128 134 123 238 180 305 277
168 Hi8 170 159 87 87 87 87
125 128 121 131 124 138 158 195 108 115 120 110 209 159 263 246
128 128 133 124 66 66 66 66 94 97 92
101 96
110 126 154 79 84 88 81
155 118 197 182
141 141 145 136
73 73 73 73
104 107 104 111 105 119 137 117 89 94 99 91
173 132 219 203
950 975
1000 825 875 875 875 750 975 875
1225 1000 1150 750 800
1225 800
1050 975 750
2000 2000 625
1500
218 139 255 190 16 1 146 210 12 7 10 1 11 7 84 73 69
104 167 210 124 103 10 1 109 142 120 76
153
0802 0802 0822 0820 0798 0798 0798 0798 0791 0798 0800 0811 0814 0837 0837 0830 0769 0 768 0771 0 775 0 780 0 781 0 788 o 779
35296 81603 43312 65222 44019 67515 4609 91313 78186 60572
118115 15129 5 184075 95577 67017 81607 33252 67554 85294 75994 78816 74857 55101 54862
075 075 0 77 075 084 084 084 081 079 078 084 080 083 076 076 078 0 77 081 079 076 082 087 064 0 74
278 643 337 512 542 832 567
1085 766 572
1216 1417 1832
796 520 709 353 735 878 781 630 726 302 366
26472 61202 33350 48917 36976 56713 38656 73964 61767 47246 99217
121036 152782
72639 51932 63653 25604 54719 67382 57755 64629 65126 35265 40598
a=282l a =l781 y=axs S=0621 B=0 844
V=0 057 V=0 128 _ Iv -J
~
N co
Tab l53 Results of calculation for piles No 7-24
Pile No
17
1 2 3 4 5 6 7 8 9
70 11 72 13 74 75 16 17 78 79 20 27 22 23 24
Ground water
18
-20 m b s
-28 m -335 m -330 m -3 15 m dry dry -53 m -85 m
E t (kPa)
19
33653 64979 35364 45664 47969 54583 37574 63072 74548 57753
71 2618 123531 150297
71239 48619 59204 39744 77208 77863 62049 90407 95844 57762 62937
vxEt=E Md (kPa)
20
25240 48689 27230 34248 35254 45849 31562 51040 58893 45047 94599 98825
724747 54142 36950 46179 30603 57678 61572 47157 47734 83384 36968 46569
a=898 S=l 27 =0314
K (l )
21
265 511 275 358 517 672 463 749 730 546
1160 1157 7496
593 377 514 422 775 802 638 723 929 377 420
a=l422 S=l 05 =0187
E=E = t1 3
g-gcp (kPa)
22
51046 52799 54566 42492 45870 45870 45870 37547 52799 45870 77039 54566 65438 52799 40826 71039 40926 58739 52799 37541 82549 82549 40826 59945
Calculated s
(mm)
23
708 128 72 7 15 3 724 146 144 17 3 71 3 11 5 11 2 732 13 2 707 1 5 1 13 7 93
102 118 137 728 12 l 69
11 9
s__caL n=smeos
() 24
050 092 050 087 0 77 7 00 069 l36 l 12 098 133 l81 l97 103 090 065 0 75 099 117 126 090 101 097 078
ri=l00 sd=035 sv=035
K = l50gcp
25
570 585 600 495 525 525 525 450 585 525 735 600 690 450 480 735 480 630 585 450 825 825 1180 645
E l
(kPa)
26
67684 69465 72250 57726 44856 44856 44856 38448 59659 54306 74956 63214 70704 49089 56783 79502 45283 61081 58207 42927
708572 94785 71033 91898
E = t E middotA2
l
(kPa)
27
54283 5571 l 59389 47336 35795 35795 35795 30682 47790 43336 59964 51266 57553 47088 47024 65987 34823 46970 44877 33269 84639 74027 55974 71589
Calculated s
(mm)
28
l O l 12 l 11 7 737 15 9 18 7 185 21 1 12 6 12 2 133 14 l 150 13 7 13 l 14 7 709 12 7 738 755 12 4 735 50
100
- -
Tab l53 Results of calculation for piles No l-24
Pile
29
l 2 3 4 5 6 7 8 9
10 ll 12 13 14 15 76 17 78 19 20 21 22 23 24
sea l n= middotshy
smeas
28 TT
30
0 46 087 046 0 72 099 l 28 088 l 66 l 25 l 04 l 58 l 93 2 17 l 32 078 0 70 088 l 23 l 37 l42 087 l l 3 066 065
n=l 10 sd=0 44 sv=040
s seal for p n=s=lOrnn ac cording to s = 70mm
(mm)
37 32
5 l 0 51 ll 8 l18 64 064
13 0 l30 85 0 85
13 3 l 33 83 0 83
184 l84 ll6 l l 6 105 l05 137 l 37 21 3 2 12 19 4 l94 107 l06 l l 3 l l 3 84 084
92 092 l 0 9 l09 128 l28 83 083
l 0 3 l03 88 088 79 0 79
n=1 73 sd=025 sv=027
s for p according to s = 20mm
(mm)
33
10 4 184 102 18 6 15 6 200 14 9 276 209 18 4 219 292 274 185 17 9 12 9 -
169 194 219 172 200 143 15 0
seal n=s=20rnn
34
052 092 051 093 078 l00 075 l 38 l 05 092 l l 0 l46 l 37 093 090 065
-085 097 l1 0 086 l00 072 075
n=093 sd=025 sv=0 27
s for p according to s = 30rnn
(mm)
35
142 223 14 l 22 3 198 249 142 34 5 290 249 274 345 33 l 243 22 6 168 -
24 7 26 6 293 24 3 279 187 213
seal n=s=30rnn
36
047 0 74 047 0 74 066 083 047 l 15 0 97 083 091 l 15 l10 0 81 075 056 -
082 089 098 081 093 062 0 71
n=o80 sd=020 _ sv=0 25 N
IO
APPENDIXES
APPENDIX 1 1 1
Pi le No 1 Length 13 m D 10 m
Areas of influence
-
qe
(MPa)
1 fp
___9c_ f
(MPR) zyen
(MPf) qcp (MPa)
Soil type
22 20 18 16 14 1 2
l 2 (m)
10
1 0 08 06
16 15 16
026 027 026
42 41 42 Sand
04 14 U28 39 02 14 028 39 41
02 16 0 26 42 04 16 026 42 06 16 026 42 08 14 028 39 Sand 1 0 13 030 39 12 15 027 4 1 38 14 13 030 39 16 12 032 38 18 12 032 38
40 20 10 036 36 22 10 036 36 24 9 U39 35 2 6 8 043 34 28 10 036 36 30 10 036 36 3 2 10 036 36 34 10 0 36 36 36 11 0 34 37 38 11 034 37
l 1 (m)
40
42 44
11 0 34 37 15 1
46 48 50 52 54 56 58 60 62 64 66 68 70 7 2 74 76 78 8 0
APPENDIX 112
Pile No 2
to little depth of sounding
q~ = middle values for 11 = 2 Op
q~ = 145 MAa (Francke Garbrecht 1977 Tab 2 p 50) (Fi g No 2)
for sand
qcp = 0275middot145 = 40 MPa q~p =V ~~s) middot 40 = 097middot40 = 39 MPa
Pile No 4
q~ = 120 MPa sand (Fig No 4)
q = 0 315middot12 = 3 8 MPa q bull 38 = 086middot38 = 33 MPa=V Jmiddot54
1
cp middot bull cp
Pile No 12
qg = 155 MPa sand (Fig No 13)
qcp = 026middot155 = 4 03 MPa
Pile No 13
q~ = 200 MPa sand (Fig No 14)
q = 0 23middot20 = 46 MPacp
APPENDIX 113
PileNo3 Length 14 m D 15 m
Areas of influence
-
qe
(MPa)
1 Tp
----9cf
(t-1Pf) r~
(MPf) qcp (MPa)
Soil type
22 2D 18 16 17 025 43 14 17 II II
L 2 17 II II
12 (m)
16 10 08 06
17 17 17
o
II
II
II
II
Sand 04 17 II II
02 19 024 46 b9
02 19 024 46 04 17 025 43 06 15 027 41 08 13 030 48 1 0 12 032 38 12 11 033 36 14 13 0 30 39 16 14 028 39 18 12 032 38 40 20 16 026 42 2 2 16 026 42 24 11 033 36 26 11 033 36
60 28 30
10 10
036 036
36 36
Sand
32 10 036 36 34 12 032 3 8 3 6 12 032 38 38 12 032 38
1 1 (m)
40
4 2 4 4
13
14 16
030
028 026
39
39 42
46 13 030 39 48 12 032 38 50 14 028 39 52 10 036 36 54 13 030 39 56 14 028 39 58 15 027 41 60 15 027 ~-1 236 62 64 66 68 70 72 74 76 7 8 80
APPENDIX 114
Pi l e No 5 Length 6 0m D 11 m Dp 11 m
Area s of i nfluence
-
qc
(MPa)
1 Tp
-3Lf
( MPf) l ~
(MP~) qcp (MPa)
Soil type
2 2 2 0 18 1 6 14 1 2 155 U i1 33
l 2 (m)
1 2 10 08 06
15 14 12
022 023 0 27
3 3 32 32
Fine sand
+ silt
04 125 026 33 02 16 0 21 34 39
02 16 021 34 04 13 025 33 06 08 10
15 5 17 20
022 0 20 018
34 34 36
35 Fi ne sand
1 2 20 0 18 36 14 20 018 36 + s ilt 16 20 0 18 36 18 165 020 32 20 165 0 20 32 22 17 0 20 34 24 26 2 8 30 32 3 36 38 4 0
19 21 5 21 5 21 5 20 19 5 19 5 20 215
01 9 ---
018 018 0 18 0 18 -
3 6 40 40 40 36 35 3 5 36 4 0
l 1 (m) 4 2
44 20 19
018 01 9
36 3 6 157
46 48 50 5 2 54 56 58 6 0 62 64 66 68 70 7 2 74 76 7 8 8 0
APPENDIX 1 15
Pi le No 6 Lengt h6 0 m D 11 m
Areas of qc 1 __9_c_ qcp Soil typei nfluence fp f 1 yen (MPa) (MPf ) (MPf) (MPa)
-2 2 20 18 16 t 4---0 14 75 038 29 L2 20 018 36 Fi ne sand
1ti 10 30 40 + s i lt12 08 19 0 19 36(m) 06 17 020 34 04 14 023 32 02 9 034 31 56
02 6 043 26 04 12 026 3 1 06 17 020 34 08 11 028 3 1 1 0 14 023 32 35 1 2 17 020 34 Fi ne sand14 19 019 35 16 20 018 36 + silt18 18 0 19 34 20 14 023 32
46 22 12 026 31 24 12 026 31 26 15 022 33 28 18 019 34 30 20 018 36 3 20 0 18 36 34 20 018 36 3G 20 018 36 38 20 018 36 4 0 20 018 36
l 1 42 22 40
(m) 44 22 40 46 L2 4 0 158 48 50 52 54 56 q =V ~ - 3 b =0 99middot35 = 35 MPp cp 53 58 6 0 62 64 66 68 70 72 74 76 78 80
APPENDIX 116
Pi leNo7 Length 60 m 0 15 m
Areas of influence
-
qe
(MPa)
1 Tp ~
(MPg) r~
(MPf) qcp (MPa)
Soil type
22 20 18 16 9 U33 30 14 10 031 31 12 135 024 32
l 2 (m)
16 10 08 06 04 02
13 12 6
10 175
025 026 043 0 31 020
33 31 26 3 1 35 50
Fine sand
+ silt
02 04 06
17 10 115
0 20 0 31 027
34 31 3 1
08 10
145 185
023 019
33 35 3 5
1 2 14
20 19
018 0 19
36 36 Fine sand
l 1 (m)
60
16 18 20 22 24 26 28 30 3 2 34 36 38 40
42 44 46 48 50 52 54 56 58 6 0
185 125 125 165 17 19 21 215 205 20 21 20 20
24 22 20 215 22 22 21 19 18 22
0 19 026 0 26 020 020 019 --
018 018 -
018 01 8 --
018 ----
0 19 0 19
35 33 33 33 34 36 40 40 37 36 40 36 36
40 40 36 40 40 40 40 36 34 40 219
+ silt
62 64 66 68 70 72 74 76 78 80
APPENDIX 117
Pile No 8 Length60 m D 15 m Dp 2 1 m
Areas of influence
-
qe
(MPa)
1 r +
(MPg) r~
(MPf) qcp (MPa)
Soil type
22 18 019 34 20 16 021 34 18 125 026 3 3 16 115 027 31 14 11 028 3 1 12 11 028 3 1
l 2 (m)
10 08 06
105 11 145
D29 028 023
30 31 33
Fine sand
+ silt
04 18 0 19 34 02 18 019 34 71
02 15 022 33 04 11 0 28 31 06 13 0 25 33 08 20 0 18 36 10 15 022 33 12 13 025 33 14 175 020 35 16 18 20 22
20 21 20 15
018 -
018 0 22
36 40 36 33
35 Fine sand
+ s i lt
24 26 28 30 3 =
13 16 175 19 20 20
025 021 020 0 18 018 018
33 34 3 5 34 36 36
36 38 4 0
20 20 21
018 0 18 -
36 36 40
11 (m)
4 2 4 4 4 6 48 50 5 2 5 4 56 5 8 60 6 2 6 4
20 20 21 22 21 20 19 175 19 20 25 28
018 0 18 ---
01 8 01 9 0 20 0 19 018
36 36 40 40 40 36 36 35 36 36 40 4 0 23 0
6 6 68 70 72 74 76 78
qcp 1f5=v 2T middot35 = b85 middot35 = 30 MPa
80
APPENDIX 118
Pi le No 9 Le ngth 90 m D 11 m m
Areas of 1Qe -9c qcp Soil typeinfluence Tp f ryen (MPa) (MPg) (MPf) (MPa)
-
2 2 2 0 18 16 14 lc 11 034 37
12 10 10 036 36 12 08 9 039 35 Medium(m) 06 10 036 36 sand04 10 036 36
02 11 034 37 43
02 12 032 38 04 12 0 32 38 06 12 0 32 38 08 13 030 39 10 13 030 39 12 13 030 39 14 14 028 39 16 14 028 39
44 18 14 028 39 20 14 028 39 39 Med ium 22 15 027 4 1 sand 24 16 026 4 2 26 17 025 43 28 13 0 30 39 3 0 9 039 35 32 13 030 39 34 16 026 42 36 17 025 43 38 17 025 43 40 19 024 4 6
11 42 17 025 43
(m) 44 15 027 41 17 7 46 48 50 52 54 56 58 60 6 2 64 66 68 7 0 7 2 74 76 78 80
APPENDIX 119
Pi 1 e No 10 Length 95m D 11 m m
Areas of influence
-
qe
(MPa)
1 fp
-9c f
(t-1Pf) [~
(MPf)
qcp
(MPa)
Soil type
22 20 1 8 16 14 L 2 13 Uti 3J
l 2 (m) 12
10 08 06 04
18 18 28 19
0 19 019 0 19 019
34 34 34 34
Fine
sand
02 21 40 42
02 20 4 0 04 17 020 34 06 21 40 0 8 10
23 22
40 40 Fine
1 2 14 16 18
21 20 16 15
0 21 022
4 0 4 0 34 33
sand
44
20 2 2 24 26 28 30 32 34 36 38 40
14 14 13 11 11 14 17 14 12 13 12
023 023 025 0 28 028 023 020 023 027 025 027
32 32 33 31 31 32 34 3 2 32 3 3 32
l 1 (m) 42
44 12 13
0 27 025
32 33 15 2
46 48 50 5 2 5 4 56 5 8 6 0 6 2 6 4 66 6 8 70 72 74 76 78 80
APPENDIX 11 10
Pi 1 e No 11 Lengt h 9 0m D 11 m m
Area s of influence
-
Qe
(MPa)
1 fp
__k_ f
(MP~) ryen
(MPf) qcp (MPa)
Soi l type
22 20 18 16 14 12 lb 55
12 (m)
1 0 08 06 04
23 19 20 21
024 023
55 46 46 55
Medium
sand
02 22 55 62
0 2 04
24 25
55 55
06 08
27 28
55 55
10 12 14
28 28 28
55 55 55 49
16 26 55
44
18 20 22 24 26 28 30 3 34 36 38 40
24 19 18 17 22 21 17 11 13 12 11 9
024 024 025
025 0 34 030 032 034 039
55 46 43 43 55 55 4 3 37 39 38 3 7 35
1 1 (m) 42
Ll Ll
12 16
032 0 26
38 4 2 209
46 48 50 5 2 54 56 58 60 62 64 66 68 70 72 74 76 78 80
APPENDIX 141
0 2 3 4 p [MPa)
PILES WITH 40 ENLARGED BASES
80
120
160 C----0
200 IN4014 s (1977)
[mm]
P s calculateds P p(s)(mm) (MPa)(mmMPa)(MPa) ()
10 035 286 046 20 065 308 080 30 090 333 104
150 24 625 214 200 229
ai = 2605 (mmMPa) b1 = 0243 1MPa V 1000 bi = 1b = 411 MPa
_ 411 MP Vi - 24 a
() assumed
average Dp = 18 m
qcp = 24 MPa ai = 184 (mmMPa) (28-4middot24)
Vi = 1 2 (3-18)
qcpmiddotvi = 29 MPa
40
80
120
160
200 s
[mm]
DIN 4014 Part 2 ( 1977)
0 1 2 3 4 5 p [MPal
PILES WITHOUT ENLARGED BASES
C----0
DIN 4014 ( 1977
s calculated s p -p- p(s)
(mm) (MPa)mmMPa)(MPa) ()
10 05 20 062 20 08 25 113 30 11 27 3 155
150 34 441 385 200 424
ai = 2085 (mmMPa) bi= 0 157 1MPa V = 0970
bi= 1s = 637 MPa
Vi 187=3f =
() assumed
average Dp = 12 m
qcp = 34 MPa a1 = 144 (mmMPa)
Vi = 18
qcpmiddotvi = 61 MPa
Range qc = 10-15 MPa
(28-4bull34)
(3-12)
1 1 q = r -r- = 036 for qc = 10 MPaCp p Ip+= 027 for qc = 15 MPa
qcp = 36-405 MPa P
APPENDIX 142
Touma F and Reese L (1974)
Soil parameters pile parameters and base resistance see fig bullbullbullbull
TAB
Measured load settlement curves
Settlement s
mm
10 20 30 40 50 60 80
100 120
a 1 (mmMPa) bi(MPa) V
N3u
q =04 -N30 (cMPa) ()
1 qCp=--rpbullqC
Pile No 21 (US 59) 22 (HH) 23 (G1) 24 (BB) Notep Sp p S p p S p f Sp MPa mmMPa MPa mmMPa MPa mmMPa Mla mmMPa
131 76 169 59 075 133 100 100 269 74 325 62 131 153 1 94 103 381 79 456 66 165 182 273 11 0 488 82 581 69 1 90 21 1 349 115 581 86 694 72 2 15 233 424 118 675 89 800 75 229 262 813 98 245 327 884 113 925 130
64 56 100 95 U049 0032 0276 0048 0944 0998 0996 0981
80 gt100 30 60 32 gt 40 12 24 ()
Bergdahl (1982)
gt5 5 gt55 32 4 3
(0 18middot32) (018middot40) (0265middot12) (018middot24)
CONTACT PRESSURE p [ MPa]
0 2 4 6 8 100 N-------r---------------(us 59) ( HH) ( BBi
E E SQ-------lt+-----+--------------lt
VI
1shyz UJ
~ 100 1---------i----+----+----+------l------I -J I shyI shyUJ V)
so~----~--~-- ~--~
APPENDIX 143
us 59 fYJo 0 50 00
ff-t r-=-~c~=~-r~c_---_---l-~e-J-C~ 0 ------
CLAY
FINE SANO
J lD- 760 mm
f5m~--~--~
Pile US 59 and results from penetration test
HH IV_l() so 100 r=-=-==-==-r-~--=-=- 0 0 II 15- flf ~ II~ Ibull If t f
CLAY SAND
Sm
)
= -middotl lo - GtOmm
~ JI
SILTY SANO tOm
Pile HH and results from penetration t est
APPENDIX 14 4
61 NJO 50 --------00
11 1 =f J - 1 -- 0
CLAYSILT
E ~ Sm ltrj
SILTY SAND
q I lDmiddot 910 mrn tom
I) t bull
Pile G1 and results from penetration test
88
0 50 too ~1-e I q 111bull - Q
CLAY
SIL TY SAND 5m
]
l lDmiddot760mrn
Om
Pile BB and results from penetration test
APPENDIX 145
Klosinski B (1977)
Loading tests 50 bored piles 09-125 m diameter average Op= 11 m On t he sett l ement of rigid pla te the settlement of t he pi le base is given by
PmiddotOSp = T-K b
where Mb - equivalent deformability modu lus
1) Sand and sandy gravel of medium density
Mb = 25-50 MPa
According to Bergdahl (1979) medium sand is between
q(l) 5 MPa (Io=035)c2)
ql = 10 MPa (Io=065)C
from fig 117 rp1 = 055 for qc = 5 MPa 1Tp = 036 for qc = 10 MPa
q(l)= 0 55middot5 = 2 75 MPacp bull
q(2= 0 36middot10 = 360 MPacp
allowable p~ 1)= ~p = yen = 092 MPa and p~2) = ~ = 120 MPa
settlement of the pi l e base
5(1)= o 92 middot 1bull1 = O 0135 m = 13 5 mm p 325 middot middot
5( 2)= 1bull2bull1middot 1 = O 0088 m = 8 8 m p 350 bull bull
1) _ s _ 135 _ 14 7 (mm) a(2) _ 88 _ a 1 - p - o---92 - bull NPa bull 1 - T-7 - 733 (Wa)
2) Loose sand lo= 030-040
Mb = 12- 25 MPa
q~l) = 44 MPa q~2)= 58 MPa
1Tp = 058 and 052
q(3) = 0 58middot4 4 = 2 55 MPa middot q( 4) = 0 52middot5 8 = 3 02 MPa cp bull middot bull cp bull middot middot
allowable p~ 3)= 4i = 085 MPa p~4)= yenl = 101 MPa
s(3)_ 085-11 = 26 mmmiddot s(4)_ 101middot11 = 148 mm p - 312 p - 3 25
STATENS GEOTEKNISKA INSTITUT Swedish Geotechnical Institute S-581 01 Linkoping Tel 01311 51 00
Serien Rapport ersatter vara tidigare serier Proceedings (27 nr) Sartryck och Preliminara rapporter (60 nr) samt Meddelanden (10 nr)
The series Report supersedes the previous series Proceedings (27 Nos) Reprints and Preliminary Reports (60 Nos) and Meddelanden (10 Nos)
RAPPORT REPORT Pris kr
No Ar (Swcrs)
1 Grundvattensankning till foljd av 1977 50shytunnelsprangning P Ahlberg T Lundgren
2 Pahangskrafter pa langa betongpalar 1977 50shyL Bjerin
3 Methods for reducing undrained 1977 30shyshear strength of soft clay K V Helenelund
4 Basic behaviour of Scandinavian soft 1977 40shyclays R Larsson
5 Snabba odometerforsok 1978 25 shyR Karlsson L Viberg
6 Skredriskbedomningar med hjalp av 1978 40shyelektromagnetisk faltstyrkematning - provning av ny metod J Ingands
7 Forebyggande av sattningar i 1979 40shyledningsgravar - en forstudie U Bergdahl R Fogelstrom K - G Larsson P Liljekvist
8 Grundlaggningskostnadernas fordelning 1979 25 shyB Carlsson
9 Horisontalarmerade fyllningar pa los 1981 50 shyjord J Belfrage
RAPPORTREPORT
No
10 Tuveskredet 1977-11-30 Inlagg om skredets orsaker
11a Tuveskredet geoteknik
l1b Tuveskredet geologi
11 c Tuveskredet hydrogeologi
12 Drained behaviour of Swedish clays
R Larsson
13 Long term consolidation beneath the test fills at Vasby Sweden YCE Chang
14 Bentonittatning mot lakvatten T Lundgren L Karlqvist U Qvarfort
15 Kartering och klassificering av leromradens stabilitetsforutshysattningar L Viberg
16 Geotekniska faltundersokningar Metoder - Erfarenheter - FoU-behov E Ottosson (red)
17 Symposium on Slopes on Soft Clays
18 The Landslide at Tuve November 30 1 977 R Larsson M Jansson
19 Slantstabilitetsberakningar i lera Skall man anvanda total spanningsanalys effektivspanningsanalys eller kombinerad analys R Larsson
20 Portrycksvariationer i leror i Gateshyborgsregionen J Berntson
21 Tekniska egenskaper hos restproshydukter fran kolforbranning shyen laboratoriestudie B Moller G Nilson
Ar
1981
1981
1981
1981
1981
1982
1982
1982
1983
1982
1983
1983
1983
Pris kr (Swcrs)
50shy
50shy
40shy
50shy
100shy
60shy
80shy
60shy
190shy
75shy
60shy
150shy
65shy
RAPPORTREPORT
No Ar Pri s kr (Sw crs)
22 Bestamning av jordegenskaper med sondering - en litteraturstudie U Bergdahl U Eriksson
1983 75 shy
23 Geobildtolkn ing L Vi berg
av grova moraner 1984 70 -
24 Radon i jord -Exhal ation- vatten kvot -Arstidsvariationer - Permeabilitet A Lindmar k B Rosen
1984 75 shy
25 Geoteknisk terrangklassificering for fysisk planering L Viber g
1984 120shy
26 Large diameter bored piles in nonshycohesive soils Determination of the bearing capacity and settlement from results of static penetration tests (CPT) and standard penetration test (SPT) K Gwizdala
1984 85shy

7
16 Summary
The work contains a study of the behaviour of l arge diameter
bored piles in non- cohesive soil The mai n attention was
paid to the determination of the bearin g capacity a nd
sett lement from results of Cone Penetration Test (CPT)
and Standard Penetration Test (SPT)
A new met hod to calculate bearing capacity on large bored
piles based on the in situ measurement is proposect taking
into account investigations made during the last years in
all the world The values based on the proposed method
are compar ed to field test results
The analysis of bearing capacity safety factors and loadshy
settlement curve allows to assume values individual safety
factors for resistance of pile point and shaft respectively
Based on a detailed investigation the pile point pressure
settlement curve and shaft resistance dependance during
loading a new method to predict the pile point pressure shy
displacement and load- settlement relationship is proposed
The initial slope of the point pressure- displacement curve
can be determined from in situ tests or laboratory test
based on the hyperbolic stress- strain parameters
9
Notations and symbols
Roman letters
a 1 Initial slope of the pile point resistance shysettlement curve
Ap Cross-sectional area of a pile
As Area of the pile shaft
CPT Static Penetration Test
D Diameter of pile shaft
Op Diameter of pile point
E Youngs modulus
fp Point resistance factor
fs Shaft resistance factor
F Universal safety factor
Fp Individual safety factor for ultimate resistance of pile point
Fs individual safety factor for ultimate resistance of pile shaft
K Dimensionless compression modulus
K At rest soil lateral stress coefficient0
Koc Lateral stress coefficient for fluid fresh concrete
Mo Constrained (oedometric) modulus
N30 Numbe r of blows for 030 m penetration in SPT
p Unit point resistance (contact pressure)
p (s) Unit point resistance versus settlement
Unit point resistance at failurePsf
Allowable unit point resistancePa
Sounding resistance
Average static cone penetrometer resistance close to tne pile point
qs Average static cone penetrometer resistance C along the pile
10
Ultimate point resistance of large diameter piles based on static sounding results
Ultimate skin friction resistance of large diameter piles based on static sounding results
Qa Allowable pile load
Qcp Point load of the static cone penetrometer
Qct Total load of the static cone penetrometer
Qpa Allowable point resistance of the pile
Qpu Ultimate point resistance of a pile
0 sa Allowable skin resistance of the pile
0su Ultimate bearing resistance of a pile
Qu Ultimate bearing resistance of a pile
s Settlement
sd Standard deviation
ss u Ultimate settlement for pile shaft
sv Standard variation
SPT Standard Penetration Test
t Unit shaft resistance
Ultimate unit shaft resistance
Circumference of the pile shaft
Circumference of the static penetrometer shaft
Greek letters
a Constant
B Constant
A Coefficient
microd Depth factor
v Poissonbulls ratio
v 1 Correction factor for hyperbola point resistance shysettlemen~ relationship
n Correlation coefficient
ahc Radial (horizontal stress in the concrete
ohs Radial (horizontal) stress in the soil
Ovc Vertical stress in the concrete
Ovs Vertical stress in the soil
11
1 LARGE DIAMETER BORED PILES IN NON-COHESIVE SOILS
11 peterminati on of bearing capacity of bored piles
from results of Cone Penetration Test (CPTl
The methods published in available literature up to 1976
were compiled by D Rollberg (1976 1977) It contains
totally 25 methods
- 22 use the results of static soundings (CPT)
3 use the results of standard soundings (SPT)
The failure load Qu of the pile is evaluated as the sum
of the pile point resistance Q and the pile skin reshypu sistance Qsu
(111)
Pile point resistance Q based on static soundina reshypu shysults can be expressed as
1- bull qP A ( 1 1 2)f C p
p
where
fp = point resistance factor
qP mean sounding resistance of static cone C
penetrometer in the area of the pile point
A cross-sectional area of the pilep
The pile skin resistance is expressed as
1 s -- bullq bullU middot Lih (113) fS C p
where
fs = shaft friction factor
sqc mean sounding resistance along the depth h
and skin surface area U middotLih p
1 2
The methods differ in
- the calculation of qPC
(074 to 40) Db below the pile base (Fig 11 1)
(10 to 80) Db above the pile base (Fig 1 11)
- the evaluation of the point resistance factor usually
values off gt 10 are used p
- the calculation of qsC
- the evaluation of the shaft friction factor
fs = 50-300 is applied
In Table 111 methods for determination of the bearing
capacity of bored piles are listed Rollberg 1977 The
point load the skin friction load and the ultimate total
load are evaluated for bored piles (shaft diameter D ~
03-090 m) from static sounding results in non-cohesive
soil
Calculation results based on static sounding measurements
are shown in Table 112 for pile point pile shaft and
total pile load respectively
The table shows that
- a ll methods overestimate the ultimate point resistance
- the best correlation for ultimate point resistance is
obtained with the Soviet method Trofimenkov 1974
n1 = 114
- there a re only five methods for evaluation of the ultimate
skin resistance
- all methods with exception of the Soviet norm Trofimenkov
1969 method overestimate the ultimate shaft resistance
- the Norwegian method Senneset 1974 gives the best
correlation for the ultimate shaft resistance =119n 2
- with exception of the Soviet methods the total ultimate
load is on the average overestimated by all methods
1 3
Taking into account the above results the Soviet and
the Norwegi an methods are presented below
The Soviet method JG TrofimenkgtV 1974
1 qP bullA + qsbullA (114a)Qu = Qpu+Qsu fp C p f C s s
where
11 40 DP 12 1 0 D p h+l1 qp r dhqcC l1+l2 h-12
0ct-0ceqs C u middoth s
f(qp) -+ see Fig 1 bull 1 2 fp C
f f ( qcs) -+ see Fig 1 1 3 s
The Norwegian methon K Senneset 1974
1 p A 1 s bullA ( 1 bull 1 bull 4b)-f-middotqcmiddot p + -f-q s p S C
where
11 30 D p
12 50 D p h+l11 f dhqP l1+l 2 qc
C h-12 h s 1
= f dhqc qch 0
f 20 p
f = f (q~ ) + see Fig 114 s
Note a ) The total skin friction -f-middotq~ is assumed to be
no less than 10 kPa even~ith a very little
cone penetrometer resistance
b) The poin t resistance -f-middotq~ is assumed to be
maximum 10 MPa even iJl case of very dense sand
14
It must be underlined that the best correlation for
the pile point is obtained with the Soviet method
101 for 94 driven piles in non-cohesive soil
- 172 114 for 46 bored piles in non-cohesive soil
Trofimenkov 19731974 showed the results of comparison
of the ultimate loads determined by formula (114a)
Q~ and by pile load tests Q~ for 153 driven friction
piles at the 57 various sites see Fig 115
In Germany a lot of investigations were made before
establishing the DIN 4014 part 2 (1977) on large diameter
piles
In Table 113 and 114 the results from these investigashy
tions are generalized
The data in the tables were obtained from 35 test loadings
(4 of which were published by Franke 1973 The diameter
of the piles was from 08 to 25 m the length from 5 m
to 34 m and the cone penetrometer resistance varied from
10 MPa to 15 MPa
Bustamente and Gianeselli 1982 proposed a prediction
of the pile bearing capacity by means of the static
penetrometer Their proposal was based on the intershy
pretation of a series of 197 full scale static loading
tests In this paper the results from tests of 55 bored
piles are chosen The diameter of the piles varies from
042 m to 150 m and the length from 6 m to 44 m The
equivalent cone resistance was determined as showed in
Fig 116 The authors have noticed that the point
resistance factor f depends on the nature of the soil p and its compactness but also on the different pile placeshy
ment techniques (see Tab 115)
Piles of category group I
- Plain bored piles - Cased bored piles
- Mud bored piles - Hollow auger bored piles
- Type I micropiles - Piers (grouted under low - Barrettespressure)
15
In Tab 116 values of the shaft resistance factor
fs are given
Category IA
- Plain bored piles - Mud bored piles
- Hollow auger bored piles - Cast screwed piles
- Type I micropiles - Piers
- Barrettes
Category IB
- Cased bored piles - Driven cast piles (concrete or metal shaft)
Category IIA
- Driven precast piles - Prestressed tubular piles
- Jacked concrete piles
Category IIB
- Driven metal piles - Jacked metal piles
It can be noted that the values in Tab 116 are in
genera l of the same range for the driven and the
bored piles
According to the Polish Specification 1979 the point
and shaft resistance factor are given by
1-f- = kmiddota
p p
where
ap 035 for sand
k coefficent of unhomogeneity k qcp min
qcp
= 0065 for sandfrac12
1
16
Similar results can be observed in Fig 116a and
Fig 116b It was showed by Kerisel (1965) and Franke
(1973) that the harder soil the more loosening at
excavation and thus relatively smaller bearing capacity
Taking into account the Franke diagrams we will have
for D = 125mand settlements= 2 cm p
Cone resistance qc (MPa) 1 5 50 1 0 15 22
qc p for s=2 cm 3 6 8 12 14
(see Fia 1 1 6b )
taking safety factor for pile base F = 3 the point resis~ance
33-10 ~-05
380375 lo 212 bull lo 2114 bull
factors- shy are p
The above anal ysis shows that it is possible to determine
ultimate point and shaft resistance of bored piles from
static cone sounding But it is very important and must
be taken into account type of pile kind of soil and
degree of compaction
Bel ow calculation method for large diameter bored piles
based on the static cone penetrometer resistance (CPT)
is proposed Equation (117) can be used directly for
the base diameter D lt 15 m For larger diameters p shyD gt 15 m the values should be multiplied by the
p ff t ITscoe icen Y~ as pi
( 1 1 5 )
where
qcp = according to equation (117)
D = diameter of the pile base D gt 15 mpi pi
17
This value q~p should be put into equation 116
The value qc s in equation 118 is independent on the
pile diameter
Proposed calculation method
(116)
where)
1 1 40 ~ 11 3 for piles wit h a nd enlarged bases12 10 12 = ~
h+h
q (h) dh (117)qcp l1+l2 f -f- Ch-li p
h 1 f 1
qcs = o -f- qc (h) dh (118)h s
1 -f- = f(q kind of soil ) -+- see Fig 11 7 and Tab 1 1 7
C p
f (q kind of soil ) -+- see Fig 1 1 8 and Tab 1 1 8 fs C
Note
a) the point resistance q for qc gt 20 MPa is assumed cp to be maximum as
- Gravel 70 MPa - Coarse sand medium sand 55 MPa - Fine sand s il ty sand 40 MPa
b ) The shaft resistance qcs for qc gt 20 MPa is assumed to
be maximum as
- Gravel 110 kPa - Coarse sand medium sand 90 kPa - Fine sand s ilty sand 70 kPa
These proposed values are compared with results by
Bustamente (1 982) and the Polish Specification (1978)
Fig 11 9 and F i g 1110 A similar comparison for DIN
4014 1 977 is shown in Fig 1111 and Fig 1112
) In this paper was used the above values 1 1 and l z But it can be used in practice 11 =30 D and h =2Dp respectively The results shall be very simi l ar to the above onPs
18
The proposed method has been examined with field test
results This is shown in Fig 1113 to Fig 1128
and Appendix 1 11 to 1110 and Tab 119
The comparison shows that the value of q in equationcp (117) corresponds to the settlement -10 of the base
diameter (s=010 DP) see Fig 1113 and Tab 119
(average sDp=88 and standard deviation sd=3)
Later in this paper the allowable load and dependence of
the load versus settlement will be determined
12 Determination of bearing capacity of the large
diameter bored piles from results of the Standard
Penetration Tests (SPT)
There are little published on pile tests coupled with
results from Standard Penetration Test (SPT) Among the
authors who have published material in the subject are
- Meyerhof 1956 1976
- Senneset 1974 (Norwegian method)
- Rodin Corbett Sherwood Thorburn 1974 (English method)
- Polish Specification 1975
- Weltman Healy 197 8
- Reese 1978
- Japanese Society 1981
- Decourt 1978 1982
The Norwegian method is valid o nly for concrete andor
wooden piles the English method only for gravel It is
very important to underline that the Norwegian a nd the
English methods use of the SPT resul ts intermediate by
the static cone penetrometer resistance (q ) as well C
Below methods are presented that are using the results of
SPT directly Meyerhof s method in total can also be used
on driven piles in non-cohesive soil Although we could
have found some proposes for bored piles Eqs (121 and
122) see Fig 121 and Fig 1 22 as well
19
Ultimate point resistance (psf)
12 N 3 omiddotH lt 120 N 30
(kPa) (1 2 1)Psf D
where
N30 the average standard penetration resistance
in blows per 03 m
H depth in bearing stratum
Ultimate skin friction tu
for bored piles tu N~ o (kPa) (1 22a)
for driven pil estu 2N30 (kPa) (1 2 2b)
where
N30 the average standard penetration resistance
in blows per 03 m within embedded length
of pile
Weltman and Healy (1978) taking into account Meherhofs
proposition for driven piles have introduced two coefshy
ficents for bored piles in gravels (glacial soil) Equ
123 and Fig 1 23
t = a 2 N30 (kPa ) (1 2 3)U 1
where
ai a 1 for impermeable gravels see Fig 123a
ai a 2 for permeable gravels see Fig 123b
The Polish Specification ( Specification for Design and
Construction of Large Diameter Bored Piles in Bridges
1975 Ministry of Transport) gives the ultimat e point
resistance in dependence of N30 base diameter and depth
see Tab 12 1 The Tab 121 contains values for coarse
and medium sand For other non-cohesive soils the following
coefficients are proposed
p f = S bull p f (medium sand) ( 1 2 4)S 1 S
20
where
S1 1 20 for grave lSi
f 132 080 for fine sand
13 3 070 for silty sand13i
In Fig 124 values of psf are shown for h = 10 m DP
06 m DP= 15 m and h = 20 m DP= 06 m DP 1 5 m
respectively
A few of the instrumented piles were tested and analyzed
by Wright and Reese (1979) The ultimate point and shaft
resistance in the fine and silty sand as a function of
blow count from SPT is shown in Fig 125 Results from
two additional tests reported by Koizumi (1971) are also
introduced in the figure The ultimate point resistance
is assumed to exist at a settlement equal to 5 of the
base diameter
Methods of prediction of the bearing capacity of piles
based exclusively on N30 values were presented by Decourt
1982 Below a proposition for high capacity piles excavated
and cast under bentoni te is presented
The ultimate skin friction is determined by the expression
(see Fig 126)
t = 33 N30 + 1 0 (kPa) ( 1 bull 2 5 ) u
where
N30 average value of N30 along the shaft
- for N30 lt 3 must be taken as = 3N30 - for N3o gt 5 0 must be taken as NJo= 50
The allowable point resistance can be obtained in a n
expedite way as
Psa = 33 N30 (kPa) (1 2 6)
where
N30 = average of Nat point level one metre above
and one metre below
Psa allowable point resistance
21
Decourt proposed a safety factor for the point of F = p
40 Therefore the ultimate point resistance can be
determined by the expression
(kPa) (1 2 7)
In Fig 12 7 and Fig 1 28 the above values for base
and skin friction resistance are compared respectively
Taking into account the type of soil thereis a good
correlation for ultimate point resistance The result for
ultimate skin friction is scattered but only apparently
The values for large diameter bored piles are between
the line 1a and 1b in Fig 128 Large diameter piles
have a high ultimate skin friction in relation to driven
piles (see points for bored piles in Fig 122 and DIN
4014 Part 2 1977 as well) The high values for piles
excavated and cast under bentonite have had a strong base
on the load tests (Decourt 1978 1982 and Wright and
Reese 1979)
Below the proposals are given for determination of the
values of the ultimate point resistance and the ultimate
skin friction Eqs 128 to 1214 and Fig129 1210
The ultimate point resistance
- gravel psf = 140 N30 (kPa) ( 1 bull 2 8)
for N~ 0 gt 50 blows3O cm Psf 7 MPa
- coarse sand and medium sand
(kPa) ( 1 2 9)
for N30 gt 50 blows3O cm Psf 55 MPa
- fine sand and silty sand
psf = 80 Nio (kPa ) (1210)
for N30 gt 50 blows3O cm p f = 40 MPa 5
where N3 o the average of N value near the point level as
22
h+l1
f N3o(h)dh ( 1 2 11 ) h-12
3DP see Fig 1 1 1 D
p
The ultimate skin friction for coarse sand and medium sand
tu = 1 8 N 3 o (kPa) (1212)
t (kPa) (excavated and cast (1213)u under bentonite)
where
N30= the average value of N along the shaft as h
N -
3 o = h1 f N 3 o ( h) dh ( 1 bull 2 bull 1 4 ) 0
The ultimate skin friction for N30 gt 50 blows30 cm is
assumed to be maximum as tu = 90 kPa and t = 150 kPa u
13 Allowable load of large diameter bored piles
The allowable load Qa of large diameter piles has been
expressed as
OuQa ( 1 3 1)Ft
Qa Q(s)=Qb(s) + Os(s) ( 1 3 2)
Opu + Osu (1 3 3)Qa Fp Fs
Qr lt mmiddotQf ( 1 bull 3 4)-
= universal safety factor
individual safety factor for ultimate resistance of the pile point
individual safety factor for ultimate resistance of the pile shaft
= load according to the allowable settlement
calculated load
m coefficient
calculated ultimate bearing load of the pile
23
The equations from (131) to (134) are used as
1) equation (131)
a) DIN 4014 - 1977 Ft= 2 175 15 (depending on the kind of load)
b) Polish Specification 1975 Ft = 18 16 ( -- )
1c) Trofimenkov 1974 Ft = 14307
2) equation (132)
a) DIN 4014-1977 i Q(s) = Qb(s) + Q (s) = A middotp(s) + E tAsmiddott(s)
s p 0
where Qbs) and Qs(s) are described in Fig 1423
3) equation (133)
a) Polish Specification 1974
F 25 22 depending on the kind of load p
F 1 bull 0 s
b) Wright SJ Reese LC 1979
The ultimate capacity or resistance is considered as a
random value and represented by a frequency distribution
The distribution can be described by a mean value and a
variance The distribution of the load applied to the
foundation can be described similarly The coefshy
ficients used to factor resistance and loads are called
partial safety factors Some recommended partial safety
factors for resistance under normal conditions of design
and construction are given in Tab 131 Normal control
is defined as a condition where the coefficient of variation
is less than about 035
Typical values for partial safety factors for loads are
in the range 1 to 2 depending on the type of load and
how it is applied The overall factor of safety Ft can
then be calculated from the equation
Ft = y RbullY S
24
where
YR the par tial sa f ety fac t or for resistance and
Ys the partial safety factor fo r load
The probability of fa i lur e of the foundation can be r eshy
lat ed to the factor of safety for a parti cular degree of
uncert ainty (see Tab 13 2)
c ) Tejchman Gwizdala 1979
The authors discuss adequate safety factors based on fie l d
test s by Spang (1 972) Franke (1976) Touma and Reese (1974)
Colombo (1971) Kerisel and Simons (1962) Appendirno (1973)
see Tab 1 33 Taking into account the universal safety
factor Ft= 2 0 for the tota l load settlement curves it
was estimated
i) F in the range of 111 to 237 with the average value s F = 166 and standard deviation sd = 034 s (see column 16 Tab 133)
ii) Fb in the range of 161 to 945 with the average
value Fb = 387 and standard deviation sd = 2 15
For model core d piles in laboratory conditions values of
Fs = 108 to 154 (average Fs = 132 s~ = 019) and
values of F = 280 to 5 94 (average F = 3 55 sd = 1 07)p p
see Tab 1 3 4
As a conclusion it was assumed that Fb = 40 and F 1 5 s
for l arge diameter bored piles
The investi gation has shown that for the above safety
factors settlements of piles under permissibl e loads are
10 to 20 mm There was assumed a maximum load on large
diameter piles corresponding to a settlement of 010
diameter of the piles
25
d) Bustamente Gianeselli 1 982
e) 0ecourt 1982
The safety factor is given by
F = FgmiddotFfmiddotFamiddotFw where
F 11 - skin friction g F 135 - point bearing capacity
g
Ff safety factor related to the formulation adapted
Ff= 10 for Decourts method
Fd safety factor related to excessive deformation
Fd = 10 for skin friction
As for the point Fa= 2 to 3 depending on the
pile diameter For usual cases 25 is suggested
Fw safety factor related to working load
Decourt recommends 12
Thus we will have
- for skin friction
Fs = 11bull10middot10middot12 132 - 13
- for the point
F = 135bull10bull25middot 1 2 = 405 = 40 p
4) equation (134)
a ) Polish Code 1983
Q lt mbullN r shy
where
total load coefficient (depending on the kind of load For foundation we can assume Yf = 12 )= code load
correction coeffic i ent
09 for pile foundations
m 08 for two piles
m 07 for single pile
26
N ymmiddotQu
ym material (soil) coefficient
ym 08 to 09 (Polish Code 1981)
Thus we will have
QnmiddotYf lt mmiddotym middotQu-
Yf9uFt = On m bull Ym
1 2 max = 2 14Ft 0 7 bull 0 8
1 2min = 1 48Ft 0909
The above analysis has shown different ways to determine
the allowable load The analysis is in direct connection
with mobilization of the load (versus settlement) The
dependence of total load point resistance and shaft reshy
sistance will be discussed in detail in Chapter 14
In the authors opinion taking into account the above
analysis the allowable load should be determined based
on the equation 133 ie based on individual safety
factors for ultimate point and shaft resistance Proposed
values of F and F in literature are shown in Tab 135 s p The average values are Fs = 145 and Fp = 3 38 respectively
Taking into account that the bearing capacity is determined
based on the results from sounding measurements direct from
a place near the piling without a ny indirect correlation
the allowable load of large diameter bored piles is given
by the equation (133a)
( 1 3 3a)
where F = 30 and F 13 are proposedp s
27
14 Determination of settlement of larqe diameter bored
piles based on static cone penetration tests CPT
Determination of ultimate point and skin friction resistance
based on static cone penetration tests has been discussed
in Chapter 11 above Based on the results of this calcushy
lation and on Chapter 13 we can establish an approximate
relation between point resistance shaft resistance and
total load on one hand and settlement on the other However
the approximation gives a wide scatter especially for base
resistance as can be observed in Fig 141 to Fig 144
Only the first part of the point resistance - settlement
curves are in good agreement with measured values It can
be observed in Fig 145 that the average correlation
coefficient n = 098 and standard deviation sd= 029
This way of calculation can be used only for rough calcushy
lation (see Chapter 13)
In Chapter 11 also measured point resistance - settlement
curves were shown The base resistance increases gradually
with increasing pressure and settlement Below the cur7
vature of the point resistance - settl ement curve will be
examined It is assumed that this curve can be described
as a part of the hyperbola curve Thus if the ratio of
the measured settlement (s ) to the point resistance (p)
is plotted against the measured settlement the result
will fall closely to a straight line with the equation
( 1 4 1)
where a 1 and b 1 are constants (see Fig 1 46a and Fig
14 6b)
Then the point resistance - settlement realtionship can be
expressed as a hyperbola
s p = ( 1 bull 4 2)
The constant is the initial s lope of the point resistanceshya 1
settlement curve ie a 1 = t~a The inverse of the constant
28
b 1 is the vertical tangent (asymptote) to the curve 1ie for s = 00
bf= ~ If the ultimate point reshy1
sistance psf is equal to bf (psf=bf) the whole point
resistance settlement curve will be a hyperbola type
Now the Eq 1 4 2 can be written as
s s ( 1 4 3)a) p s or b) p = a+__sect_a1 + 1 Psfbf
If the ultimate point resistance is smaller than bf only
a part of the hyperbola curve ought to be considered
Further the Eq 14 3 will be written as
p ( 1 4 4)
where
poundf_ correction factor for hyperbola point Psf resistance-settlement relationship
Taking into account the discussion in Chapter 11 the
ultimate point resistance psf = qcp based on the CPT measurements
Therefore the relationship between the point resistance
the sett l ement and the CPT result can be expressed as
s p (1 4 5)s
The correction coefficient v 1 will cause a change of the
position of the vertical asymptote bf in r elation to the
ultimate point resistance q bull This means that we take cp into account a different part of the hyperbola curve for
the description of the point resistance-settlement relationshy
ship
Now if we want to use the equation (145) in practice
we must determine the constant and the coefficienta 1 v 1 (assumed that q is determined ear l ier Chapter 11)cp
29
The constant a 1 and t h e coefficient Vi have been detershy
mined based on fi e ld tests according to pi l es No 1 - 20
see Tab 14 1 and Tab 1 1 9 as wel l The values of
a 1 versus the point diameter D and the ul timate pointp
resistance respectively are shown in F i g 147 and Fig
148 Fig 1 47 shows that a 1 is independent of the
point diameter D Based on Fig 148 it can be assumed p
that
28-4bullq (1 4 6)cp
This correlation has been examined with data of the
literature see Fig 1 49 and Appendix 141 to 1 45
(Note there were no static penetration tests and qcp was determined based on a correlation made by Bergdahl
(1982))
A good correlation with equation 146 can be seen taking
into account the safety factor in the DIN 4014 Part 2
(1977) bull
The correction factor v 1 versus the poi nt diameter is shown
in Fig 1410 I t is assumed that the correlation is
V1 = 3 0 - D ( 1 4 7)p
where D is in m p
The above equations ie 146 and 147 were assumed for
a later analyses see Fig 14 11 and Fig 1412 The
piles No 1 to 20 were examined taking into account Eqs
14 5 14 6 and 1 4 7 The result of this cal cul ation is
presented in Fig 1 413 to Fig 1 4 18 and in Tab 1 4 2
respectively In Fig 1413 the calculation way for pile
No 2 is shown as an example
In Fig 1414 to Fig 1 417 measured and calculated
values of the point resistance versus settl ement can be
compared In tota l good correlation exists for all the
30
pressure-settlement curves Values of q from static cp
cone penetration tests and generalized values of anda 1
v 1 were considered Only for piles No 17-20 qcp was
assumed as the point resistance for s = 010 D because p
the static penetration test results were inaccessible
The similar comparison is shown in Fig 1417a for piles
in sand based on experimental results (Tuoma Reese 1972
and Wright Reese 1979) where the ultimate case resistance
was assumed as the resistance at a base settlement of 005
D The relative base resistance is the mobilized base p resistance divided by the ultinate base resistance The
curvature of the proposed point resistance settlement shy
curve to mean value proposed by Wright and Reese is excellent
However the constant a 1 and the coefficient v 1 were
determined for sand only In the future they should be
examined especially for gravel and silty sand based on
field tests Until then in the authors opinion the
values of v 1 can be chosen from Eq 147 for all nonshy
cohesive soils But for a 1 there is proposed
at = gt bulla (1 4 8)1
where
gt- 1 = 080 for gravel
gt 2 120 for silty sand
This proposal is shown in Fig 14 11 as dashed lines
A good correlation can be seen with the investigation by I
Kiosimiddotnski for sandy gravel and on the safety side with
the investigation by Tuoma and Reese for silty sand (see
Fig 149)
In Fig 1418 all calcul ations for pile No 1 to 20 are
summarize d The correlation coefficient n is defined as
the calculated point resistance p(s) divided by measured
point resistance p(s) For totally 126 points from 20
curves an average of n = 098 with standard deviation
31
al= 023 was obtained see Fig 1418 A similar result
can be observed for the range usually assumed of the
allowable settlement for sinqle large diameter bored
piles as
for
- for
- for
s
s
s =
10
20
30
mm a
mm
mm
verage n10 II
II
mm 089
095
099
and sd =
and sd
and sd
031
027
026
It can be questioned whether the sonstant a 1 can be deshy
termined in different ways The constant a 1 is the initial
slope of the point resistance-settlement curve as menshy
tioned above Then we can use all methods for determination
of settlement of a pile point The range of validity of
these methods then must be determined This will be shown
later
In order to be able to design the total load settlement
curve the skin friction resistance-settlement relationshy
ship must be determined The ultimate skin resistance of
large diameter bored piles was determined in Chapter 11
(based on static penetration tests) and in Chapter 12
(based on standard penetration tests)
In the past a lot of field tests have been done on the
mobilization of the shaft resistance versus pile settleshy
ment In this subject there is a rather good agreement
in the whole investigation for cohesive and non-cohesive
soil
Some results and opinions on thispresented in the literashy
ture during the last few years are shown below
Ultimate shaft resistance versus settlement
1) BurlandJB Butler FG Duncan P (1969)
-The shaft l oadsettlement curve is derived using a=0 3
with 90 ultimate load being mobilized at 025 in
settlement(~65 mm)
- soil London clay
- see Fig 1 419
32
2) Touma FT Reese LC (1974)
- The failure of the sides of the shaft takes place
at a downward movement of about 04 in (10 mm)
- soil sand
- see Fig 1420
3) Tomlinson HJ (1977)
- The maximum shaft resistance is mobilized at a
settlement of only 10 mm (or j in)
- soil stiff clay
- see Fig 1421
4) Klosinski B ( 1977)
- It was assumed that skin friction increased proshy
portionally to pile settlement up to the limit value
s bull This value depends on soil conditions and pile0 diameter and is usually from 3 to 8 mm For soft
compressible soil it may be grater than 10 mm
- soil cohesive soils
- see Fig 1422
5) Franke E Garbrecht D (1977)
- At settlement of 2 to 3 cm which are normally
allowed in Germany under working loads for buildings
not very sensitive to differential settlementsthe
skin friction is almost always fully mobilized
- soil sand
6) DIN 4014 part 2 (1977) and Franke E (1981)
- The skin friction Tm is approximated as diameter
independent having failure settlements of smf = 2 cm
in sand and 1 cm in clay
- soil sand and clay
- see Fig 1423
33
7) Reese By L (1978) Reese By L Wright SJ (1979)
(1978) The maximum skin friction being developed at
an average downward movement ranging from about 05shy
2 of the shaft diameter The average of six load tests
reported by Whitaker and Cooke (1966) are a lso plotted
for comparison
- soil stiff clays
- see Fig 1424 and Fig 1425a
(1979) The relative settlement is the average settleshy
ment of the butt and base devided by the shaft diameter
The mean curve maximises at a relative settlement of
about 002 D
- soil sand and clay
- see Fig 1425b
8) Tejchman A Gwizda3a K (1979)
- A clear differentiation of the distribution of shaft
and base resistances is observed for changing settleshy
ment For fairly small settlements the shaft resist shy
ance increases quite fast and the ultimate values
are reached soon while the base resistance increases
gradually with increasing loads and settlements withshy
out clearout ultimate values it can be assumed that
complete mobilization of shaft resistance corresponds
to settlements equal to 001 or 002 diameter of pile
- soil cohesive and non-cohesive soils
- see Tab 131 and Fig 1 426
9) Promboon S Brenner R P (1981)
- Load distribution and load transfer curves disclose
that most of the load is carried by shaft friction
which is developed at small displacements in the order
of 10 mm
- soil Bangkok clay
- see Fig 1427
34
10) Prodinger w Veder Ch (1981)
- The maximum value of skin friction resistance
occurred for a total settlement of 12 mm
- soil silty clay and sand
- see Fig 1428
11) Farr JS Aurora RP (1981)
- Ultimate load transfer was recehed (or nearly reached)
at a relative settlement of about 04 in (10 mm)
- soil gravelly sand
- see Fig 1429
12) Decourt (1982)
The skin friction resistance is totally mobilized
with deformations of about 10 mm or at the most 15
mm regardless of shaft dimensions This observation
of ours seems to clash with the opinions of other
authors who seek to relate the deformation necessary
for full skin friction mobilization with the shaft
diameter
- soil cohesive and non-cohesive soil
In Tab 143 all these results are shown Depending on
the kind of soil the following v a lue s of ultimate settleshy
ment for shaft can be assumed
- averages 142 mm (sd 5 3 mm) for sand
- averages 100 mm (sd = 21 mm) for cohesive soil
averages 726 mm (sd 67 mm) for claysand
It can be observed (see Fig 1419 to 1428) that the
shaft friction resistance increases proportionally to
the pile settlement up to the above limit value and
thereafter becomes constant
35
Taking into account what was mentioned earlier on point
resistance settlement relationship and the above results
a relationship between total load point resistance and
shaft resistance on one hand and settlement on the other
can be made see Fig 1430
It is assumed on the safety side that the following
ultimate settlement (S~) exists for the shaft resistance
of large diameter bored piles
SS1 ) 200 mm for non-cohesive soil u SS2) = 100 mm for cohesive soil u SS3) 15 0 mm for claysandu
In Fig 1 430 the curve Q (s) is calculated based on p
the equation 14 5 or 144
The values of psf in equation 144 can be calculated
based on other methods as well
The total load-settlement relationship is obtained by
summing up point and s haft resistance as
Q (s) = Q (s) + Q (s) (149)s p
for each point
Now the allowable load can be determined from equation
133a and versus the allowabl e settlement as
Q (s) = Q (s) + Q (s) (1410)s p
where s lt Sa
Sa= the allowable settlement of the pile
The analysis allows determination of the approximative
load settlement dependence without calculating the settleshy
ment for non-cohesive soil In Fig 1431 it is shown
36
In Tab 144 the settlement for allowable point reshy
sistance q5P according to equation 133a is shown
as well The average settlements= 198 mm (sd=78 mm)
is obtained This value is similar to the assumed ultimate
settlement of shaft for non-cohesive soil The ultimate
settlement for point resistance is assumed s = 010 Dp as mentioned earlier
37
15 Initial slope of pile point resistance shy
settlement curve
Settlement of piles and pile foundations can be cal culated
based on
- empirical correlations
load-transfer methods using measured relationships
between pile resistance and pile movement at various
points along the pile
- theory of elasticity that employs the equations of
Mindlin for subsurface loading within a semi-infinite
mass
- numerical methods and in particular the finite element
method
- use of in-situ tests (Cone Penetration Test Standard
Penetration Test Pressuremeter Test)
The critical slope of the pile point resistance-settlement
curve is important for calculation in chapter 14 The
constant a1 can be determined from all the above mentioned
methods
Comparison is made to Berggrens and Schmertmanns methods
below (see Berggren 1981 as well)
6sIn Tab 151 (No 1 2 3) the values of a 1 =~p for s =
10 mm and s = 20 mm (measured for large diameter bored
piles No 1 to 24) are compared to the calculated values
according to the modified hyperbola method (see Fig 14 6)
It can be seen that these calculated values are between
s = 1U-2u mm but rather closer the measured values for
the settlements= 10 mm see correlation coefficient n 6
and n 7 in Tab 151 respectively The average correlat i on
coefficent for the settlements= 10 mm is n9 = 108 and
the standard deviation is sct = 014 The comparison to
Berggrens and Schmertmanns methods for s = 20 mm ( see
Berggren 1~81 and Tab 151 as well) shows that the
results based om these methods give too high values of a 1 bull
38
The average values are ne= 143 sd = OJ3 and ng= 137
sd = 037 for Berggrens and Schmertmanns methods
respectively A bit better agreement can be observed
for Schmertmanns method
Taking into account the results in Tab 151 ana Tab
15l it must be assumed that for the determination of
a 1 the pile point contact pressure p(a1) should be
assumed as the ultimate point bearing capacity devided
by about 4
p(ai) - ( 1 bull 5 1 )
Most of the methods for determination of settlement are
based on the theory of elasticity The settlement ot the
pile point can be expressed as the average settlement of
a rigid circular foundation from the equation
11-Dp 1-v 2
s = p -4- -E-bull microd (1 ~ 2 J
where
p pile point contact pressure
E Youngs modulus
D diameter ot pile pointp ) = Poissons ratio
microd = depth factor
The range of validity of the pile point contact pressure
was determined in equation 151 Youngs modulus has an
important meaning lt can be determined from triaxial
tests or oedometer tests The relationship between the
constrained (oedometric) modulus Mo and Young s modulus
Eis dependent on Poissons ratio v as expressed by the
equation
E = l 1 + V ) ( 1 - 2 V ) Mo ( 1 bull 1 bull 1)- 1-v
39
TaKing into account the analyses made ny Chaplin (19b1a
1 961bJ Janbu (1 963 1970 1973J Andreassen (1973)
Duncan and Cheng (1970) Tejchman anct Gwizdala (1979)
Gwizdala (1978) Franke (1981) Berggren (1981) Withiam
and Kulhawy (7981) and the present investigation the
calculation of settlement is proposed to be
s = 24 bull p bull ~ D bull 1-v 2 bull micro d (154)Do o E
where s (r1)
p (kPa)
Dp (m)
E (kPa)
D0 =10 m
micro = 05 + 01 vfrac34E (1 5 5)d vs
but 05 lt microd lt 10-tip= p - (J (ovs see Fig 151)vs
E =Et= Kbullpat (Oo )n [1- Rf(1-sinltj) 101 - 03 ) 12 (1 5 6)2 c cosltP + 2o 3 sinltP 1Pat
in which K n and Rf= hyperbolic stress-strain parameters
Pa= atmosferic pressure ando 1 o 3 and o0 are determined by
averaging the concrete and soil vertical and radial stresses
near the pile point according to Fig 151 Then the
stresses at the pile point level are h
(J vs = L
0 Yi h
l vertical stress in the soil
0 hs Ko h
0 vs radial (horizontal) stress in the soil
0 vc L ye h -l
vertical stress in the concrete 0
0 hc K oc a vc radial (horizontal)
concrete stress in the
40
K at rest soil lateral stress coefficient 0
K c lateral stress coefficient for fluid fresh concrete0
K 1 0 oc
and average values
a 05(a +a)V vc vs
1 1 - shy~ = -(a +a+a I = -3 (av+2ahJ the applied mean normal stress0 j Z X y
Assuming this model calculation results for piles No 1-24
(see Tab 11~ as well) are shown in Tab 153
The piles are embedded mainly in medium sand to fine sand
For this kind of soil it can be assumed (soil parameters
from field or laboratory tests were inaccessible)
~ = 35deg c = 0 R~ = 09 n 05 v = 025 K c 10l 0
K = 04 Pat= 1UO kPa ye 24 kNrn 3 y = 14 kNm 3 bull0 C
Moreover in Tab 153 the following symbols are used
p(a1 ) - pile point contact pressure according to equation
1 bull 5 1
s(a1) - settl ement of pi l e point according to equation
143 and Tab 141
pound TT ( 2E = s bull Dp bull i 1-v ) according to equa~ion 152t
E~ Et bull microltl
EI
K = ro~ - according to equation 1 bull 5 6 p bullO middotA2
a~ o
E = E voD middot D middot ~4 ( 1 - v 2 ) according to equationt S p O 0
1 5 4
Et= E microd
K = according to equation 156 V PatmiddotaomiddotA2
41
The calculation results of Youngs modulus E = Et and
dimensionless canpressionrro1ulus for piles to 1-24 are shown
in Fig 152 to 155 using equation 152 and 15b
or equation 1~4 and 156 respectively lt can be obshy
served that the scatter in Fig 153 and Fig 155
where the influence of tne pile diameter is reduced
compare equation 154 is less than in the other figures
The reduced influence was made after observations from
field and laboratory tests while the equation 152 is
taken direct from theory of elasticity These values of
E and K are in good correlation with published values in
literature The values of Youngs modulus versus the
relative density of soil are compared to literature values
see Fig 15b Based on the analysis in this chapter it
can be assumed that
E = 9-ql 3 ( 1 bull 5 7)cp
where qcp is in accordance with equation 117
The calculation results based on this proposal are incluced
in Tab 1 5 3
The c a lculate d s e ttlements based on e q ua tion 154 and
157 are shown in column 23 and the values of the
correlation coef f icie nt (n= Seal ) in column 24 respectshyimeas
ively
The dimensionless canpression modulus can be d e termined as
K = 15Ubullq (qcp in MPa) (1 5 8)cp
see column 25 Tab 153
The calculation results based on the K compression modulus
according to equation 158 156 and 1 5 4 are shown in
columns 25 26 2 7 28 and 29 in Tab 153
42
For comparison and for determination of the range of
validity of this method the caLculation results of
pile point pressure for settlements s = 10 mm s = 20 mm
s = 30 mm (see Tab 141) according to equation 157
and 154 are shown in columns 30 to 35
The results obtained in Tab 153 confirm the possibility
to use the proposed method to calculate the initial part
of the pile point resistance settlement curve of large
diameter bored piles in non-cohesive soil and the initial
slope of this curve as well
A simple model has been proposed based on the theory of
elasticity ana the tangent modulus defined by Janbu (1963)
and Duncan amp Chang (1970)
A new approach according to the pile diameter depth factor
and principal stress is proposed
The settlement of the pile point can be made up to a point
pressure according to equation 151 on up to a settlement
of about s ~ 20 mm (30 mm)
-- The application of v Op in equation 1 5 4 a llows us ing
Youngs modulus as independent of the pile diameter
opposed to Bazants a nd Mosopusts (1981) proposal where
Youngs modulus wa s determined versus the pile diameter
The equation 1 5 6 takes into account the dependence of
Youngs modulus on depth (or overburden pressure) as
well
In the method field test (Cone Penetration Test) or
laboratory tests (hyperbolic stress-strain parameters
can be used
Comparison of the method to 24 availa ble load test r e sults
or large diameter bored piles in sand shows good a greement
to calculated and measured values
43
REFERE~CES
Adamczyk J (1978) Okreslanie udzwigu pali wierconych
za pomoca sondy statycznej (Bearing capacity of bored
piles based on the static sounding) Inz i Bud No 7
pp 253-257
Andreasson L (1973) The compressibility of cohesionless
soils Thesis Chalmers University of Technology
G6teborg (in Swedish)
Appendino M (1973) Comportamento di un palo di grande
diametro strumentato Rivista Italiano di Geotechnica
No 3 pp 115-118
Butterfield R Banerjee P (1971) A rigid disc embedded
in an elastic half space Geotechnical Engineering
Vol 2 pp 35-49
Bozant z Mosopust J (1981) Drilled pier design based
on load settlement curve X ICSMFE Stockholm Vol 2
pp 615-619
Begemann HK (1982) Cone penetration tests pile bearing
capacity and the thesis of Rollberg Proc of the Second
European Symposium on Penetration Testing Amsterdam
pp 433-438
Berggren B (1981) Bored piles on non-cohesive soils shy
settlement and bearing capacity (in Sweden) Thesis
Department of Geotechnical Engineering Chalmers
University of Technology G6teborg
Bergdahl UB (1979 1982) Sonderingen und in situ Messungen
Wien 18-19 Juni 1979 - Private information 19821983
Bustamante M Giane selli L(1982) Pile bearing capacity
prediction by means of static penetrometer CPT Proc
of the Second Europ Symp on PenTest Amsterdam
Vol 2 pp 493-500
Chaplin TK (1961a) An experimental study of the settleshy
ment of footings in sand PhD Thesis Univ of
Birmingham
44
Chaplin TK (1961b) Compressibility of sands and settleshy
ments of model footings and piles in sand 5th Int
Conf on Soil Mech a Found Engng Vol 2 p 33 Paris
Colombo P (1971) Observazoni sul comportamento ltli pali
a grande diametro Rivista Italiana di Geotechnika
No 3 pp 163-172
Dahlberg R (1975) Settlement characteristics of preconshy
solidated natural sands Swedish Council for Building
Research D11975
De Beer EE (1964) Some considerations concerning the
point bearing capacity of piles Proc Syrop Bearing
Capacity of Piles Boorkee I pp 178-204
Decourt L Quaresma AR (1978) Capacidade de Carga de
Carga de Estacas a partir de Valores de SPT VI Conshy
gresso Brasilerio de Mecanica dos Solos e Engenharia
de Fundacoes - Rio de Janerio - ABNS
Decourt L (1982) Prediction of the bearing capacity of
piles based exclusively on N values of the SPT Proc
of the Second Europ Syrop on Penetration Testing
Amsterdam Vol 1 pp 29-34
Duncan MJ Chang CV (1970) Non-linear analysis of stress
and strain in soils Journal Soil Mech Found Div Vol
96 SM5 pp 1629-1651
Durgunoglu HT (1979) Effect of foundation embedment on
stress and deformation distributions Third Int Conf
on Num Meth in Geomechanics Aachen pp 925-928
Farr JS Aurora RP (1981) Behaviour of an instrumented
pier in gravelly sand Proc of a session Drived Piers
and Caissons sponsored by the Geotech Eng Div of the
ASCE Nat Convention St Louis Missouri pp 53-65
Franke E (1981) Point pressure versus length and diameter
of piles X ICSMFE Stockholm Vol 2 pp 717-722
45
Gregersen os Aas G and Dibiagio E (1973) Load tests
on friction piles in loose sand Proc of the Eigth
International Conference on Soil Mech Moscow USSR
Vol 21 pp 109-117
Gwizda1a K (1978) Behaviour of large diameter bored piles
in non-cohesive soil (in Polish) Archiwum Hydrotechniki
Vol XXV No 2 pp 183-217 (English summary)
Huizinga TK (1951) Application of Results of Deep
Penetration Tests to Foundation Piles Building Research
Congress Vol 1 p 173
Janbu N (1963) Soil compressibility as determined by
oedometer and triaxial tests Proc Europ Conf Soil
Mech and Found Eng Vol 1 p 19 Vol 2 (Discussion)
p 17 Wiesbaden
Janbu N (1970) Grunlung i geoteknikk Tapir Forlag NTH
Trondheim
Janbu N Bjerrum L Kjaernsli B (1973) Soil Mechanics
applied to some engineering problems Norw Inst Publ
No 16 Oslo
Japanese Society SMFE (1981) Present state and future trend
of penetration testing in Japan Separate report at
X ICSMFE Stockholm
Kjekstad O Lunne T (1979) Soil parameters used for design
of gravity platforms in the north sea Second Int Conf
on Behaviour of Off-shore structures London Vol 1
pp 175-192
Klosinski B (1977) Bearing capacity of large diameter bored
piles IX ICSMFE Tokyo Vol 1 pp 609-612
Laboratory for soil mechanics Delft (1936) The predetershy
mination of the required and the prediction of the
resistance of piles Proc 1 Int Conf on Soil Mech
and Found Engng Cambridge (Mass) I p 181
46
Matich M and Stermac A (1971) Settlement performance of
the Burlington Bay Skyway Canadian Geotechnical Journal
Val 8 pp 252-271
Mccammon NR and Golder HQ (1970) Some loading tests
on long pipe piles Geotechnique London England
Val 20 pp 171-184
Meigh AC (1971) Some driving and loading tests on piles
in gravel and chalk Proc of the conference on beshy
haviour of piles London England pp 9-16
Mitchell JK Gardner WS (1976) In situ measurement
of volume change characteristics American Society of
Civil Engineers Specialty Conference on In-situ
Measurements of Soil Properties Raleigh 1975 Proc
Val II pp 279-345
Mezenbach E (1961) The determination of the permissible
pointload of piles by means of static penetration tests
Proc 5 Int Conf on Soil Mech and Found Engng
Paris II pp 99-104
Meyerhof CG (1956) Penetration tests and bearing capacity
of cohesionless soils Proc Amer Society of Civ Engng
SM 1 Pap 866 pp 1-19
Meyherhof GG (1 976) Bearing capacity and settlement of
pile foundations Proc Amer Society of Civ Engng
Journal Geotechnical Engineering Division Val 102
No GT3 pp 197-227
Mohan D Jain GS and Kumar V (196 3 ) Load bearing capacity
of piles Geotechn Val XIII pp 76-86
Nixon I (1982) Standard penetration test State of the
art report Proc of the Second Europ Symp on Pen
Test Amsterdam Val 1 pp 3-20
47
Nunes A Vargas M (1953) Computed bearing capacity of
piles in residual soil compared with laboratory and
load tests Proc of the Third International Conference
on Soil Mechanics Zlirich Switzerland Vol 2 pp 75-79
Nordal S Grande L Janbu N (1982) Prediction of offshy
shore pile behaviour The Norwegian Institute of
Technology Trondheim
Ohde J (1939) Zur Theorie der Druckverteilung im Baugrund
Der Bauingenieur Vol 20 No 3334 p 451
Parroth E (1972) Einfache Formel zur Vorausbestimmung der
Tragfahigkeit von Standpfahlen mit Hilfe der Sande
Bautechn 9 pp 312-314
Poulos HG Davis EH (1980) Pile foundation analysis
and design New York - J Wiley and sons
Prodinger W Veder Ch (1981) Bearing capacity of floating
groups of diaphragm walls Proc X ICSMFE Stockholm
Vol 2 pp 809-814
Promboon S Brenner R (1981) Large diameter bored piles
in Bangkok Clay Proc X ICSMFE Stockholm Vol 2 pp
815-818
Reese L (1978) Design and construction of drilled shafts
ASCE JSMFD Vol 104 No OT1 pp 95-116
Rodin s Corbett BO et al (1974) Penetration testing in
United Kingdom state-of-the-art-report Proc Europ
Symp on Penetration Testing 1 Stockholm pp 139-146
Rollberg D (1976) Bestimmung des verhaltens von Pfahlen
aus sandier und rammengebnissen Heft 4 FBG Technische
Hochschule Aachen
Rollberg D (1977) Determination of the bearing capacity
and pile driving resistance of piles using soundings
Publications of the Institute for Found Eng Soil Mech
Rock Mech and Water Ways Construction Aachen Vol 3
48
Schmertmann J (1970) Static cone to compute static
settlement over sand Journal of the Soil Mech and
Found Division ASCE SM3 pp 1011-1043
Schmertmann J Hartman JP Brown PR (1978) Improved
strain influence factor diagrams Journal of the Soil
Mech and Found Division ASCE GT8 pp 1131-1135
Shibata T Hijikuro K and Fominerga M (1973) Settlement
of a blast furnace foundation Proc of the Eighth Int
Conf on Soil Mech Moscow USSR Vol 13 pp 239-242
Spang J (1972) Die Bestimmung der Tragfahigkeit von Grossshy
borhpfahlen (I) Strassen und Tiefbau No 2 pp 339-355
Senneset K (1974) Penetration testing in Norway State-ofshy
the-art-report Proc Europ Symp on Penetration Testing
Stockholm I pp 85-95
Tejchman A Gwizdala K (1979) Analysis of safety factors
of bearing capacity for large diameter piles Proc VII
ECSMFE Brighton Vol 1 pp 293-296
Thorburn s and Mac Vicar R (1971) Pile load tests to
f a ilure in the clyde alluvium Proc of the conference
on behaviour of pile s London England pp 1-7
Trof imenkov JG (1969) Accuracy of determining the bearing
capacity of piles based on results of static penetration
sounding of soils Osnovaniya Fundamenty i Mekhanika
Gruntov 4 (Translation Soil Mechanics and Foundation
Engineering 4 p 248)
Trofimenkov JG (1974) Penetration testing in USSR Stateshy
of-the-art report Proc Europ Symp on Penetration
Testing Stockholm I pp 147-154
Tuoma F and Reese L (1974) Behaviour of bored piles in
sand JSMFD ASCE Vol 100 No GT 7 Proc Paper 10651
July pp 749-761
49
Van der Veen C (1953) The bearing capacity of a pile
Proc 3 Int Conf on Soil Mech and Found Engng
Zlirich II pp 84-90
Van der Veen C and Boersma L (1957) The bearing capacity
of a pile predetermined by a cone penetration test
Proc 4 Int Conf on Soil Mech and Found Engng
London II pp 72-75
Weltrnan AJ Healy PR (1978) Piling in boulder clay
and other glacial tills Construction Industry Research
and Information Association UK-Report PG 5
Withiam J Kulhawy F (1981) Analysis prodecure for
drilled shaft uplift capacity Proc of a session
Drilled piers and caissons ASCE St Louis Missouri
pp 82-97
Woodward R Lundgren R Boitano J (1961) Pile loading
tests in stiff clays Proc of the Fifth International
Conference on Soil Mechanics Paris France Vol 2
pp 177-184
Wright SJ Reese LC (1979) Design of large diameter
bored piles Ground Engineering Vol 12 No 8 pp
17-22
DIN 4014 Cods Teil 2 (1977) Bohrpfahle Grossbohrpfahle
Herstellung Bemessung und zulassige Belastung
Polish Specification (1975) Specification for design and
construction of large diameter bored piles in bridges
Ministry of Transport Warsaw (in Polish)
Polish Specification (1979) Specification for prevision
bearing capacity of the piles on the presiometer test
and static sounding ENERGOPOL Warsaw (In Polish)
Polish Code (1983) Foundations Bearing capacity of piles
and pile foundations
5 1
FIGURES
bull bull
53
Ou
+ sect raquo iir 1
4 + D
h + +Osu
bull + t2 =n- Dp
LDpl r f 1
Opu
Fig 1 1 1 Bearing pi le in the soil
J_
fp
080
070
060
050
0 40
030
020
010
q~ [MPa ]000 -+--~-~-~-~------------------------=-shy
00 20 4fJ 60 80 10 0 120 14fJ 160 180 200
Fig 1 1 2 The point resistance factor fp
(Trofimenkov 1974)
54
ts
160
140
120
100
080
060
040
020
q~5 [ kPa)
0Q0--1------~-~-~-~-~-~ - - ---=- -- shy000 10 20 30 40 50 60 70 80 90 100
Fig 1 1 3 The shaft resistance factor fs middot (TYofimenkov 1974)
f s
200
180
160
140
120
100 2 3 4 5 6 7 8 9
Fig 1 1 4 Shaft friction factor f depenshys
ding of the soil density (Senneset 1974)
55
Q~ [kN]
1500
1000
500
0-r-----------r----~- Q~ [kN] 0 500 1000 1500
Fig 1 1 5 Comparison of the pile resisshytance determined by the results of static sounding and load tests (TYofimenkov 1974)
D f f
0
Fig 1 16 Equivalent cone resisshytance (Bustamante 1982)
56
E u shy0 ~
QI I ltII ltII
~ a C QI
O C
D
w gt
0
Cone res istance Point resistance
80 160 240 320
05
10
15
e d
20
ver y dense Cone resistance 300 kgcm2
Dpcm
a =45 b = 30 C 60 d = 100 e = 150
Fig 1 16a
Cone resistance _ qc
80 160 80 160 qc [ k g cm2 ]p
05
10 10
15 15 e d a
e d20
Dense Medium2 2200 kgcm 100 kgcm
Cone resistance and point resistance of piles versus overburden pressure (Kerisel 1965)
Point resi stance - p(for s=2cm) of the pi le for
15 sett Iement s = 2 cm
10
5
E u
uJ1 o-~----shya er O 804 2500
32 56
I 1
L oose50 -I =25 Very loose L
----~--shy5000 7500 80 98
~-----lmiddotI1--------2 10000 12500 31400 =Flcn)
112 123 200 =Dplcm)
Fig 1 1 6b Point resistance versus cone resistance and pile diameter (Franke 193)
57
1
fp
080 (D Gravel
0 Coarse sand Medium sand 070
reg Fine sond Silty sand
060
050
040
030
020
010
qc [MPa]000-+----r--~-~-~--------r----r----r-~-~-- -shy
oo 20 40 60 80 100 120 140 160 180 200
Fig 1 1 7 Point resistance factor f (proposal) p
58
300
250
200
150
100
qc [MPa I50-+---------------r---r---r---r----r------------- shy
oo 20 40 60 80 100 120 140 160 180 200
Fig 1 1 8 Shaft resistance factor fs (pr oposal)
59
Bustamante (seetab 115 I
l fp
G)
0 Gravel
Coarse sand Medium sand
cl
b)
t-----l
1----1
080 reg Fine sand Silty sand a) D
070 Polish
060 Specification
( 1979) 050
040
030 CD 020 0
reg 010
qc [MPa]0 00 -+-------------------------------------=--shy
oo 20 4o 5o 80 100 120 14o 15o 180 200
Fig 1 19 Point resistance factor f comparisonp
Bustamente ( see tab 116 I 300
a) ~
250 b)~
cl~
200 Polish Specification ( 1979 l
150
100
q [ MPa]504---~--~--~----- ---___
00 20 40 60 80 100 120 140 150 180 200
Fig 1 1 10 Shaft resistance factor fs comparison
60
1 fp
~
080 CD CD Gravel
070 0 reg Coarse sand Medium sand
060 0 Q) Fine sand Silty sand
05
040 Franke (1973)___
030 DIN 4014
020 Part 2 1977
( see tab113 l 0shy
--shy --a - 010 C---0 Piles without enlarged bases
D---0 Piles with enlarged bases qc [MPa ] 000
00 20 4JJ 60 80 90 100 120 140 160 200
Fig 11 11 Point resistance factor f comparison p
fs
DIN 4014 Part 2 1977 ( see tab 114 l
300
~ 5 lt qc lt 10 MPa 50
~ 10 lt qclt 15 MPa
~qcgt15MPa
200
150
CD
100 0 0
qc [ 1Pa] 50-t-----T-~----T-r-~----------------shy
OO 20 40 6JJ 80 100 120 14JJ 160 180 200
Fig 1 1 12 Shaft resistance factor fs comparison
61
Measured p [ MPa]
( s=010 Dp) 10
9
8
7
6
5 0
4 0 61
3
I 2
Calculated qcp [MPa]
0 0 2 3 4 5 6 7 8 9 10
Fig 1 1 13 Comparison of experimental and aomputed values of the pile point resistanae
62
Contact pressure ( MPa ]
2 I 6
50
100
E E 150 Ill
c QI
E Sett lement for QI
calculated qcpai V) 200
Fig 1114 Results from load tests on piles No 1 and 5
Contact pressure [ MPa I 0 2 I 6
01---------------------1
50
E E 100 Ill
Settlement forc QI calculated qcp E ~ ai
I V) 150
Fig 1 1 15 Results from load test on piles No 7 and 5
63
Contact pressure p [ MPa] 0 2 3 4 6
0-t=-----~-~-----
E E
100 1)
c CU E 2 QI V) 150
Fig 1 1 16 Results from load test on piles No 9 10 and 11
Contact pressured p [MPa] 0 1 2 3 4 5
o~~~=------------___-~-shy
50
100
E E
i 150
CU E CU
-a V) 200 2
Fig 1 1 17 Results from load test on piles No 12 and 13
c
-------------- -
64
Contact pressured
0 1 2 3 4 p [ MPo] ~o __L____1_____J_____L___
50
100
150
E
E
IJ) 200
c a
E a
~ 250
Fig 1 1 18 Results f Pom load tests on piles No 2 4 6 and 8
p [MPa]
60
50
tO
30
~
Pile Pile Pile Pile
Pile No18
------+ Pile No17 + ~_ ---0 Pile No 19
bullbull - --bull Pile No 20
- ~middot -shy-shy -(y I Settlement for
20 tO 60
No17 +-middotmiddot- V 70 No 18 bull--- V 9o No19-middot- V 120 No20bull---- V150
qcp 3
80 100 120 140 160 s (mm)
Bose resistance
Fig 1 1 lBa Point Pesistance vePsus settlement (Spang 1972J
65 Cone resistance qc [ MPa]
0 10 20 30
mud
5 ~ lll
0 c 0
c CD
peat
10 sand
Ill N
10=10
D=lOOOmm
1540=40
20__________________
[ml
Fig 1 119 Pile No 1 and results from static cone penetration test
Cone resistance qc [MPa l 0 10 20 30
7N V degW = 0+--------------------i
mud
5
lll
~ C 0
c peat~
10
sand lll N 1D15
15l lD=1500mm
40=60
20l---------=-------__J
[ml
Fig 1 1 20 Pile No 3 and results from static cone penetration test
66 Cone resistance qc [MPa]
10 20 II 3 igt pound ~
mud+peat
fine sand+ silt
50=11
l lo-11oomm
40= 44
10
15l____________c
[ml
Fig 1 1 21 Pile No 5 and results from static cone penetration test
Section Cone resistance Pile
0 0
5 10 15 20 25 30 qc [MPa] -----~-~shy~
Silt
[7r_ ___~ Medium Sand_~-----l
0 ltD
+shy4
0=11
9=
Fine sand + Silt t
30p=
middotmiddotmiddotmiddotmiddotmiddotmiddotmiddot1~11+-----E-----
[ml
Fig 1 1 22 Pile No 6 and results from static cone penetration test
Cone resistance qcmiddot 1MPuJ
0 10 20 30 67 01-+-------l--------------i
mud+ peat
fine sand
l1)
N
40=60
15L_____________
[ml Fig 1 1 23 PiZe No 7 and resuZts from static
cone penetr ation test
Section Cone resistance Pi le
0 5 10 15 20 25 30 qc [MPa 1 --~----Y-~-----~
Silt
Fine sand
Medium Sand Bentonite2----1~i
t 3
4
0
0=15
Fine iii ~~= 5
sand t ltD
6 +
Silt 7
3Dp=
63 g
10
11
12
13+------=~---l
[ml
Fig 1 1 24 PiZe No 8 and resuZts f rom static cone penetration test
68
I =3
Cone resistance qc [MPa]
0 10 20 30
C 0 C Cl
(I)
Said
Peat
Sand
l 0=110
D = 11
4 D = 44
Fig 1 125 Pile No 9 and results form static cone penetration test
69
Cone resistance qc[MPa)
0 10 20 30 I ~ II JE Ill= II=E IS
Fine sand QI
U) I
[- I C 0 + C Peat QI
CD
Fine sand 0
Ci D = 1 1
L l D= 110
4D= 4 4
Fig 1 1 25 Pile No 10 and results f rom static cone penetr ation test
70
Cone resistance 9c[MPa]
0 10 20 30
Sand
C 0 Mud peat
+shyc 5 ltII
co
Sand Op= 11
u 10 D= 110 4Dp=44
Fig 1 1 26 Pile No 11 and results foIm static cone penetration test
71
00 a_ N ~
middotu rr QI 0 u ~ C 0
QI ui C iij 0 QI U - 0
0 EN
d 2
Sll 1lOl
C
u (rr
C 0 u~
0
QI - C middot 0 C
U - O 0 EN
~ 0 2
E
ltD a---==-lr---___--~---6-l_-0_012 ~ Lr- - --1---------J J
S9l ls= apound QI -0 gtcc _gmiddot- 0 1) ui I
Fi g 1 1 2 Piles No 14 and 15 and results f r om stat i c cone penetr ation tests
72
Contact pressure p [ MPa] 2 4 6
01lt---------------~
50
E E
111 100 ~ (qcp=30 MPa for No16
~ iqcp =49 MPa for No14
~ 1so~--~~- _ _ __
I _ _
11 I lf--q = 32 MPa for No15
cp
Fig 1 1 28 Results f r om load tests on piles No 14 15 and 16
73
0300--------------~---~--~--shyE
Driven piles in ~ 0 bull Gravel
amp250 bull Sand L QJ X Silt a 1l o Bored piles in
sand -sect 200 0=-- shyC ~ ~ 10 unless ~~ middot D shown 1
ii O
~ ~ o 3 a 1501-----+-------I- --+---laquo-+-- -+------lt
~ sect 5 - 6 6middot 100t----+----+-----_-1---4--__co_--J~__j
-_
~ 0 t7
C
a 50 2 shyg ~ gt
0 20 30 40 50 60
Standard penetration resistanceN in blows per foot
(N 30
Fig 12 1 Emperical relation between ultimate point resistance of piles and standard penetrashytion test in cohesionless soil (Meyerhof 1976)
14 r-------------------r-------b-----q
References and symbols given in Fig121
121-----+---+----+----+------ll------j
- _sect ~ 10t----+----+-_--1-----+---lt~--~H---- 0 lt-~5- _-)0 I() l- I Q---+-----I[08 ~
H -(l () ltj-~C X bulls pound 061------lt----+-----i~- --+-- shy
- bull
-gt Q1pound--I---L---L---L---L--~ 0 10 20 30 40 50 60
Mean standard penetration resistance N in blows per foot ( N30 l
Fig 122 Empirical relation between ultimate skin friction of piles and standard penetration resistance in cohesionless soil (Meyerhof 1976)
74
a) b)0(1 0lt2
10 10
05 05
1 N30OD-+---------__ OD--t-----r-----r----------------ll--Nbull30~ 10 20 30 10 20 30 40 50
Fig 1 2 3 Reduction coefficient a) for impermeable gravels b) form permeablr gravels (Weltman and Healy 1978)
psf [MPo)
Fig 1 2 4 Relation between ultimate point resistance and SPT in cohesionless soil (Polish specification 1975)
75
30 35 40 45 Loo Med Dense Ver dense
50
40
~ E
l)
g 8 1)
middotu
1 ~
QI- bull Touma ~ bull Koizumi
(183)-depth base middotameter5
20 40 60 00 100 N30
30 35 40 45
OG2(294) bull G1 (183)
300 bull us 59 ( 102) bull 88(180)
bull 075 a GT (467)
150
~ 200-+--------+-- t--- --t-----i 130i 0 094 081
014 _- --- -- shy~ E 066bull bull 063 Note -~ ~m~r~s~ ~ 1001---1-r--t---1point is xh QI Ratio ~ Number in ( ) middotn key is h c Ratio s ~
0 20 40 60 00 100
~ig 1 2 5 Ultimate point and shaft resistance versus N30
(Wr ight and Reese 1979)
-----
76
tu Psa
[kPa] [MPa]
200 tu
------ shy150 Psa
1 1
1100 10 1 1
1 50
0+----------T----~---~-N-3J~shy0 20 40 60 80
Relation between ultimate skin friction and SPT (Decourt 1982)
Fig 1 2 6
Psa
[MPa]
8
0----Meyerhof 1976) 0 7
--- - --~ - copy Polish Specifcoti on 1975)6 ~-
~
reg- middot - Reese (1978) middot 5
f41- -- Decourt (1982) -I bull 4 2
----==---______z__ h25m Dp=12m
3 ---shybull
2 7
--shy ----shy~----shy0-t----i----------r-- ----------------------N3l~shy
0 10 20 30 40 so 60 70
Fig 1 2 7 Relation between ultimate point re~istance of large diameter piles and standard peneshytration test (SPT) in cohesionless soil
------
77
tu [kPa)
200 17 Cast under -J bentonite
~----Meyerhof (1976) ~copy -=middotmiddotmiddotmiddot== middotmiddot150 ~------- Wei tman (1978 ) middot Healy middotmiddot ___ Japanese ) 119810 Society
(0 -middotmiddot- Decourt (1982)middot Wright
100
- -middotmiddot -- 11979]reg Reesemiddot Bored piles
~shy50 1 -- shy
-- shy middotmiddot s-shy - --~ ------reg~~ ---~E_==---- ------- shy
N_ ---shy0-+--C--------------r---- ---------~---~-~shyo 10 20 30 40 50 60 70
Fig 12 8 Relation between ultimate skin friction of piles and standard penetration test (SPT)
78
Pst [MPa]
8
7 ---------ist=7MPa
6
5
4
3
2
I N30o~------------------------------+---------__=-shyo 10 20 30 40 50 60 70
Fig 12 9 Relation between ultimate point resistance of large diamter piles and standard peneshytration test (SPT) in cohesionless soil (proposal)
tu [MPa ]
( excavanted and cast
150 under bentonite ) tu=150 kPa
100 tu=90 kPa
I I
50 I I I I I N30
10 20 30 40 50 60 70
Fig 1 2 10 Relation between ultimate skin friction of large diameter piles and standard penetrashytion test (SPT) in sand (proposal)
79
2 3 4 5 p[MPa] 0 2 3 4 5 p[MPa]0
40 40 Cl
80 c 80
c 120 120
Pile No 1 PileNo216 160
200 2
s s c [mm] (mm]
0 2 3 4 5 p[MPa] 0 2 3 4 5 p [MPa]
40 40
00 80
120 120
16 160 Pile No 3 Pile No 4
200 200
s s [mm] (mm]
0 2 3 4 5 p[MPa] 0 2 3 4 5 p [MAJ]
tgt11 tgt- measured40 40
80 80
120 120
Pile No 5 Pile No 6 160 160
20 200 s s
[mm) [mm)
Fig 1 4 1 Base resistance vs settlement appoximative method piZe No 1- 6
80
0 2 3 6 5 p[MPa) 0 2 3 4 5 p[MPa]
40 40
80 80 6
120 120 6
6160 160
Pi le No 7 Pile No 8 6
200 3J s s
[mm] (mm]
0 2 3 4 5 4 p [ MPo)
6 6 40
6 6
6 80
6 6
6
Pi le No 9 Pile No 10
XJO s s
[mm] [mm]
0 2 3 4 5 p[MPa] 0 2 3 4 5 p [MPa)
6 6
40 40 6 6
6
00 80 6
6
12 1Xl 6
160 Pile No 11 160 Pile No 12
200 200 s s
[mm ] [mm]
Fig 1 4 2 Base resistance vs settlement approximative method pile No - 12
81
0 2 3 4 5 p[MPa] 0 2 3 4 5 p [MPa]
6 6
40 6 40 6
6
80 6 80 6
120 6 120
Pile No 13 Pile No 141fO 160
200 200 s s
[mm] [mm]
0 2 3 4 5 p [MPa) 0 2 3 4 5 p [MPa)
40 40
80 80
120 120
HiO 160
200 200Pile No 15 Pile No 16
s s (mm) [rrrn 1
0 2 3 4 5 p[MPa] 0 2 3 4 5 p[MPa)
40 40 A A A-measured
680 80 t t
120 c 120 c
1fil Pi le No 17 160 Pile No 18
200 200 s s
[mm] [mm]
Fig 1 4 3 Base r esistance vs settlement approximative method pile No 13- 18
82
0 2 3 4 5 p[MPal 0 2 3 4 5 p (MPa]
D D40 40 c c
80 c 80 c
120 120
160 160
Pile No 19 Pile No 20 200 200
~ml (mm]
Fig 1 4 4 Base resistance vs settlement approximative method pile No 19- 20
LlJ QI
0 average lJ = 098 E sd = 029 C
6 SY = 030
4
2
lJ calculated ________________________ _______ measu red
06 08 10 12 14 16
Fig 1 4 5 Calculated pressure divided by the measured pressure at 20 mn settlement for aZZowabZe
q Zoad Pa= ~p approximative method pile
No 1- 20
8 3
Point resistance p [ MPaJ
a)
p(s) = s a +--sshy1 y qcp
1
SQ100p -- --- ---shy
~ s
[mml
I- 01 s rmm]-l p LMPa b)
f~]
c Cll E ~ i s
[mm)
Fig 146 Definition of the point resistance - settlement curve according to the modified hyperbolic method
84
01 ~ 0
20 0 0
0
16 0
medium 0 value a1 = 905-+ 256 Op 0 0
12 (r=039)
0 0
----0 0
8 0
0 0
0 0
4 0
05 06 07 08 09 10 11 12 f3 14 15 16 17 18 19 20 2 1 Op (ml
Fig 1 4 Initial slope of the base resistance curve vs pile diameter
a1 [p] 0
0020
16 assumed a 1= 28 - 4 qcp
12 0
0 Ct) 0 a = 2659 - 369 qcp8 1
0 0 (r = 0188)0
4
2 3 4 5 (MPa]qcp
Fig 1 4 8 Initial slope of the point resistance curve vs ultimate point resistance on the static cone resistance for pile tests No 1 20
85
a [~ 28
24
20
16
12
8
4
0 2 3 4 5 6 Qcp [MPa]
~ Kiosinski (1977) sand and sandy gravel of mediwn density
~ Klosinski (1977) loose sand ID= 0 3 0 4
o US59 ] t HH Touma p and Reese L (1974) fine sand and silty sand OGl (US59 HH BB - very dense Cl - mediwn dense) 1 BB
DIN 4014 Part 2 (1977)
Fig 1 4 9 Initial s lope of the point res istance curve vs ultimate point resis tance
86
assumed [il =30 -10 Op but )1~ 10 )1 [1 I
u 311-10 Op ( r =0 368)4 1 0
3 0 0
02 0
0 0co 0 8 0 0
0
0
05 06 07 08 09 10 11 12 13 14 15 16 17 19 20 21 Dp [ ml
Fig 14 10 Correction factor for hyperbolic base resistance shysettlement relationship
87
a [~] 28
24
20
16
12
8
4
2 3 4 5 qcp [ MPa]
Fig 14 11 Initial slope of the base resistance curve vs ultimate base resistance (proposal)
v [ 1 ]
3
2 -----G- DP J l 1J I Op lm] J
for Dp ~ 2 0 m ~ u = 1 01
0 --------r----r---r----r-----------------r-------------------------r------r-~-~--shy
05 06 07 08 09 10 11 12 13 14 15 16 17 18 19 20 21 Dp[m)
Fig 1 4 12 Correction facto r for hyperbolic base resisshytance - settlement relationship (proposal)
s P ( s)
s +
u qcp
88
a) b)1
bt=o212= 47 MPa a1=1~32 tMWJ s 2 3 4 5 O 1 10 20 30 40 50 60 p [~a]0
0p [ MPa] 40 40
80 80
120 ~
160 b1 = ~ajtg ~= 0 212
~=1132 + 0212middot s
mJ 240 r=0994t t t measured s __ according to Jl s
o o o according to p (bull ll l[mm] [mm]
Pile No 2
slmm) 10 20 30 40 50 60 80 100 125 150 175 2)0 225 Note
p [ MPa] 09 14 17 20 22 24 27 30 32 34 36 38 39
measured
pibull) [ MPa] 074 128 169 202 228 249 282 307 330 347 360 371 380calculated
plbullbull1[MPal 070 125 168 203 233 257 297 327 356 378 396 410 422calculated
1) (bull) ij l099082 091 099 101 104 104 104 102 103 102 100 098 097 sd = 006
ij (HJ1041) (bull10) 078 089 099 102 106 107 110 109 111 111 110 10B 10B sd = 010
plbulll-according to a =1132 [ Jp(s) = s s for pile No21 0 1132 12 39
plbullbulll-according toa =1241 lmiddotGcp=39MPa1 0
~=14 see fig 1411 and fig 14 12 sp(S)=
124+ _ s_ 14middot39
11lbulll11l-J - correlation coefficient calculat~d P5 for
measure p s p(bull) and p(bull) respectively
Fig 1 41 3 Modified hyperboZic point resistance - settZement reZationship for piZe No 2
89
0 2 3 4 5 p(MA1] 0 2 3 4 5 p[MPa)
40 40
80 A 80 A
120 120
160 16 Pile No 1 Pile No 2
20 200 s s
[mm] rnm
0 2 3 4 5 0 2 3 4 5p [MPa] p [MPo]
40 40
80 80
120 1ZJ
lfpound) Pi le No 3 Pile No 4 A
200 A
s s A
[mm) [mm
0 2 3 4 5 p [MPa] 0 2 3 4 5 p [MPa]
40 40 A A A measured ~ calculated
80 80
12
160 160 Pi le No 5 Pile No 6
200 Z)Q
Fig 1 4 14 l3ase resmiddotistance vs settlement pr oposed method pile No 1- 6
90
2 3 4 5 p [MPa] 2 3 4 5 p [ MPa]
40 6
6 40
1 80 80
6
120 120 6
6 160 160
Pile No 7 6
200 200 s
[mm ] s
[mm]
0 2 3 4 5 6 p [MR] 0 2 3 4 5 p [MPa] 0 0
40 40 6
6
80 80
6
120 120
160 160 Pile No9 Pile No 10
200 200
s [mm] [msml I
0 2 3 4 5 6p[MR] 0 2 3 4 5 p [MPa]04--___ ____ ___ ___ ____
0+-=---------------~-~- shy
40 40 c 6 c - measured
0--0-0 shy calculated
80 80
120 120
160 160 Pile No11 Pi le No12
200 200
s [mm]
s [mm]
Fig 1415 Base resistance vs settlement proposed method pile No 7-12
91
0 2 3 4 5 p [MPal 0 2 3 4 5 p [MPa)
40 40
80 80
120
16 Pile No 13 Pile No 14
200 s
tnml [mm]
0 2 3 4 5 p [ MPa] 0 2 3 4 5 p [MPa)
40 40
80 80
120 120
160 1fD
Pi le No 15200 axJ s s
[mm] [mm]
0 2 3 4 5 p[MPa] 0 2 3 4 5 6 plMPa ]
A A A measured40 0---0-0 calculated
80
120 120
160 1ED Pile No 17 Pi le No 18
200 200
s s [mm] [mm]
Fig 1 4 16 Base resistance vs settlement proposed method pile No 13- 18
92
0 2 3 4 5 p [MFb] 0 2 3 4 5 p[MPa]
0 6 o -measured40 40 0 0 o -calculated
80 80
120 120
160 160 Pile No 19 Pile No 20
200 200 s s
[mm] [mnil
Fig 1 4 17 Base resistance vs settlement proposed method pile No 19-20
p(s~Psf
15 20
ean
-C 5 w u L Lower ~ confidence
linea 0
a IJl 10
o---o proposed
method I I I
15
Fig 1 4 17a Design curves for estimating developed base resistance in sand (Wr ight and Reese 1979)
93
n (number)
30
28
26
24
22
20
18
16
14
12
10
8
6
4
2
0 02 04
Fig 1 4 18
I= 126
Between 1] = 0 7 - 1 3--- I= 106 ( 84 frac34)
Average ~ = 098 Standard sd =023 deviation
Standard sv =023 veriation
1] (Coefficient Calculated Measured
06 08 10 12 14 16 18
Calculated pressur e divided by the measured pr essure for all pressure - settlement curves pr oposed method pile No 1- 20
94
a) b) Total load
Total load curve
---- _____-- shy- -- -Base load ~- Base load
-0-0 ~
00 00 J
ldeoli zed shaft load J
Shaft sesistanc1---------- 0=0middot30 a= 0 middot 30
025 Settlement IN 025 Settlement IN
Fig 1 419 Proposed method of synthesizing design loadsettlement curve (a) conservative design prodiction b) design prediction- peak in shaft loadsettlement curve (Burland et al 1966)
Cf
-0 0 0
J
0
~-----~--~-~ amp- 2 3 4 5 6 (cm)
a~middotltii -0 lt) cco2 41 -~ -0 1)
vi ~ llloli=----------- ---c~0 1 2 3 4 5 6 7 ( of diameter)1 1 1 1
05 10 15 20 ( in) for 30 in Pile Movemen~ ( 75cm pile)
Fig 1 4 20 Approximate load settlement curves for 30 in bored piles (AB and C represent failure load at 1 in settlement A B and C represent ultimate failure load) (Touma and Reese 194)
95
Load in MN 0 2 3 4 5
25
50E E C
-C 75
-~ ~
-Z 100 lJ
Shaft resistshy
125 once
15 Fig 1 4 21 Load-settlement relationships for largeshydiameter bored piles in stiff clay (Tomlinson 1977)
SettlementSo
Fig 1 4 22 Diagrams of s1iaft and base resistances versus settleshyment assumed in analysis (Kiosinski 1977)
96
0 0 1 ~ r- 025g ~~ 2
1- -shy3 03Sg 14 5 2
Qls =Qpls+Q5 (sQpls) Qs(s-3E
0
degsis __ -- Qpls) a~ C
4
t Sg l
5 Qu Is)
Q(s)in MN-l T
Ouls Q Is) in MN ---
Fig 1 4 23 Construction of load - settlement curves a) for sand b) for cohesive soil (DIN 4014 Part 2 1977 and Franke 1981)
-
s C 5C
Cl
3 0 00 05 10 15 20 Mean settlement I in)
Fig 1 4 24 Load- settlement curves for test shaft S4 (1 in = 25 4 mm 1 ton= 8 90 kN) (Reese 1978)
97
Relative side resistance
0 05 10 15 20 0E=--t----+---+--~
c QI lt) ~ 2 C
I itaker c
QI amp Cooke3E QI-j
c-en 4
C QI
E us 59o
5 QI gt
SA0 w 0 6
Fig 1425a Relative side resistance for clay vesus relative midlength settlement (Reese 1978)
degs (Osl u l t 0 05 10 15 2 0
Mean
2 Lower ~ C QI u
confidence line
~ 3 a
0
~4 E
()
5
6 __ _ ______ ________ __1
Fig 1 4 25b Design curves for esti mating developed side resistance (~Jy1nht ReertP- 1987 J
98 Load Q
8 - 15 mm
1- 2 of p ile diameter
100-200 10-15 of pile Os Ot diameter Shaft Total
Settlement S Resistshy Resist- Load ance once
Fig 1426 Dependence of total load base resistance and shaft resistance on settlement of lar-ge diameter pile (Tejchman Gwizdala 1979)
6
5 Shaft load
4
3
2
z ~
-0
g Pile EF- 56 J 0
0 0 20 30 Butt settlement (mm)
Fig 1 4 27 Deveiopment of shaft and base resistance with settiement (Promboon Brenner 1981)
99
0 1000 2000 3000 4000 5000 6000 7000 8000 9000 0 r-=-1---J__-----------------------~----_shy
Load [ k N l5
10
20
( I
Skin friction ----1 I I
~ 40 QI E
fQI
50 I
Q) I () ICOntinuos fost deolading
Fig 1428 Load-Settlement-Diagram Testelement III (Diaphragm-Wall 0515 m 244 m deep) Portion of Skin Friction and Base Resistance (Prodinger Veder 1981)
Qs (QJ max
0 05 10
Upper Limit of Data
Farr and Aurora (1981J C
~ 2 - shy -+shy - Mean of Data
I QI
Lower Limit of Data a
0 - 3 E
Vl
4
Smid = Approximate shaft buff movement ignoring the elastic compression of upper halt of the shaft
D = Shaft diameter
Q Mobi Ii zed shaft resistance
Qs1max = Maximum shaft resistance
Fig 1 4 29 Relative shaft resistance vs relative movement (Farr and Aurora 1981)
100 Load Q (s) [ MN]
Su5 s s 20 mm for non- cohesive soil u
s s 10 mm f or cohesive soil u
s s 15 mm for claysand u
Q (s) + Q (s)s p
Qs(s)
-C ltII E s ~- [mm]-ltII IJ)
Fig 1 430 Dependence of total load Q(s) point res i stance Q (s) and shaft resistance Q (s) versus settlement p s
~ 3 Usu Qpu Qu Q(s) [ MN]
Sus= 20
1J
60
80
100
120
degs (s ) 140
5 P=Ol Op
1EO
C -ltII E 180 ~ ] 200
s [mm]
Approximative dependence of total load point resistance and shaft resistance versus settlement fny non-cohesive soil
Fig 1 4 31
101
113 3 ~fic0P Ye hY
1 Ground water
D
I y
yh C
Fig 1 5 1 Determination of 01 and 03 for settlement analysis of lar ge diameter bored piles
102
I
E=Et [MPa]
160 0
140
120 0
100
80
6
40
--- --shy 0
0
8 0
0
0
20
2 3 4
I 0 15
Fig 1 5 2
E = Et [MPa]
120
100
80
60
40
I I 0 35 065 085
0
Et= 17 81 qcp0844
( r = 0 128)
5
100
6 qcplMPo]
Calculated values of Young s modulus for piles No 1shy24 according to equation 1 5 2 and 1 56
0
0 0
E =898qcp127 (r= 0314)
E = 9 middot qcp 13 0
20 shy 0
0 0
0 1 2
loJ
I 0 35
3 I
065
4
I 085
5
100
6 qcp [MPo]
Fig 1 5 3 Calculated valueBof Young s modulus for piles No 1shy24 according to equation 1 5 4 and 1 5 6
I K 10 3
( 1 ] 1832
1400 0
1200 0
0
1000 0
800 0
m=2821 qcp0621
600 0
(r=0057)
400 0 0 0 0 0
200
2 3 4 5 6 qcp (MPa]
I 035
I 065
I 085 100 Io
Fig 15 4 Calculated valuesof the dimensionless compress ion modulus K for piles No 1- 24 according to equation 1 5 2 and 1 56
K ( 1 ]
0
1400
1200 0 0
1000
800
600
0
0 0
0
0 0
0 K= 1422 qcpl05
(r=0181)
0 K= 150 qcp
400 0
3)0 0 0
2 3 4 5 6 qcp(MPa)
I I -J 035 065 085 100 Io
Fig 1 5 5 Calculated values of the dimensionless compression modulus K for pile~ No 1-24 according to equation 1 5 2 and 1 5 6
104
120
100
2 3 4 5
I I I rv 0 15 035 065 085 100 lo
Bergdahl (1982) for shallow foundation
o----o Bozant Masopust (1981) D= 1 0 rn h=10 rn large diameter bored piles in noncohesive so il
0----0 Proposal according to current anal ysis
Klosinski (1977) D=090 to 125 rn large diameter bored piles in sand and sandy grave l
Mitchell Gardner (1976) very dense sand E=(35)q (it depends on sand density and stress history) c
Fig 1 5 6 Composision of Young s moduius
105
TABLES
0 Tab 1 11 Methods for detemination of the bearing capacity of bored piles (Ro llberg 1977)
Cl
Nol -- I Soil Areas of Q) Q) Editor Determination of Coefficients 5 type influenceqP qs p ~ C C 11 12 fP I fs
1 all Lab f Soil Mech (1936) l qp at the elevashy 1 0
2 all Huizinga (1951) ~ t~on of the pile 14 point
3 all Van der Veen (1953) ) 18 1 h+l14 all Van der Veen 1 0 Dpl375 D~ 15-- J qcmiddotdhBoersma (1957)
~ 11 +12 h - 12
5 12 all Menzenbach ( 1961) qc at the elevashy~ tion of pile point
6 18 all Mohan Jain Kuman (1963)1 average of qc over 1 h Q) h ~qcmiddotdhl 10 Dpj 3 75 Dj 15 50_micro
and 1 2C 11
7 I amp all de Beer ( 1964) graphically from 10 Q) qc 0 1 h+l18 u C
sand Soviet norm SNIP II 9ct9cp I4 bull O Dp I10 DP l66-1 083shyu clay B5- 67 Trofimenkov (1969) 2 50 1 251 +l J qc middotdh micro middot h middot-l l 2h-~ _micro
9 _micro u all Paproth (1972) at the elevation 3 5 I shy
) of pile point (Dpgt0 5 m 7 D8DpE
E-lt p 1 h+l1 1 h Dplt 5 m u l+l J qcmiddotdh h f qcmiddotd~ 30 Dpl 50 Dp 2 0 100shy10 sand Norwegian method
0l 2 h-12 200Senneseth (1974)
11 lall Soviet method h+l (20-0lqgl - 101 1 q middotdhTrofimenkov (1974) -- f C UpUsmiddotQct
l1+l2 h - 1212 Qct-Qcp 40 D~ 10 Dp 1 33- 0 67shyUsbullh 4 00 2 50
13 English method 10 DFJ 375Dp 10 I
Rodin Corbett Shershywood Thorburn (1974)
3 7 5 Dcl 8 0 DP 10h+l1 _1_ J qcmiddotdh 1 h
qcmiddotdh 20011 +12 h - 12 hb
1 h qcmiddotdh 150hf
0
Observations
fp I f (qp)fs C
Dp E = 1 cm Qbu = 2 Qpa (approx )
s fs=f (qc)
q=~g Us 0 h
fp=f(q~)
fs=f(qgl
bull fine grained non- cohesive soil loosely packed
bull fine grained non- cohesive soil medium dense comp
fine grained non- cohesive soil
Tab 111 (cont)
h+h bE 14 non-cohe- Meyerhof ( 1956 poundti J N 3o middot dh CtME fN3 o dh 1 0 DP 4 0 DP 10 100 etM= l 2
sive soil 1976) lJ +12 h - li hE o hgp taken into consi der ~ Ul (I)
E-lt
C 0
~E = 1 kgbull 30 cm
(statistical limit depth of the pile) hE - clamping length of
pile micro rrJ l-l micro (I)
15 C (I) p
sand Norwegian method
- irm - - - 10 IT
m = diagram O l-l Senneset (1 974) rrJO C
16 rrJ micro gravel English meth it 3 middot N30 - - - 10 - Jf 3 + diagram U) ~
E-lt p U)
iiouiu Coruett Sherwood Thorshyburn (1974 )
(NJQat the elevashytion of pile point1
0 -i
108
Tab 11 2
Results of calculati o n of p i le point load pile shaft load and total pile load from static con e penetration test (Rol l berg 1977)
~ gt
~ gt Ultima te Ultimate Ult imate
No Method micro micro poi nt skin bearing 080lt17nlt1 50 Q) -l
-l middot-i resistanceuro resistance r esistancE
middot-i p 0
(J n1 n n2 n n3 n n1 n2 n3
1
2
Lab fSoil Mech
Hu izinga (1951)
(1936 ) 430
307 i 3 Van der Veen (1953) 239
49
4
5
Van der VeenBoersma
Menzenbach (1961)
(1957) -l middot-i 0
2 4 7
1 57 1-CJ)
6
7
8
Mohan Jain Kumen
de Beer (1964)
Sovi et Norm (1969)
(1963) CJ) Q)
-l middot-i 0
lJ Q)
Q)
gt- CJ) Q)
c 0
2 44
1 37
183
47
t I
49
487
0 18
47
16
3 02
0 85 1
47
16
137
08
9
10
Paproth ( 1972)
Norw Method (1974)
~ 0
0
u I
C 0 C
1 8 1
180 l 46
1- - -_L~ 46 167 46 1 19
1 1 Soviet Method ( 1974) [1 1 41 46 1 62 13 083 13 1 14 0 8
12 Engl Method (1974) 2 66 35 128 35 2 30 35 1 28
Note
cal Q a) n = --- mean value of the rat i o between calculat ed pile loads and those n Q determined f r om loading test
b) n = number of piles
109
Tab 113
Point resistance of large diameter piles (DIN 4014 Part 2 1977)
Settlement Point pressure 1 Factor -fshy
(cm) (MPa) cf=lOMPa I i=15 MPa C C
Piles without enlarged base
1 05 005 003 2 08 008 005 3 11 0 11 007
15 34 034 023
Piles with enlarged base
1 035 0 04 002 2 065 0 07 004 3 0 90 009 006
15 2 40 0 24 0 16
Note 10 lt qp lt 15 (MPa)C
Tab 114
Skin friction resistance of large diameter piles (DIN 4014 1977)
Strength Static cone pen- Depth below Skin frict ion Factor of sand etration resist surface
(MPa) (m) (MPa) fs
Very small lt 5 - 0
Small 5 to 10 0 to 2 0 2 to 5 003 ln6 to 333
gt 5 005 100 to 200
Medium I I 10 to 15 0 to 2 0 I
I 2 to 7 5
gt 75 I 0045 0075
222 to 133 to
333 200
High I I
i
l
gt 15 0 2
to 2 to 10 gt 10
I I I
I
i
0 006 0 10
gt gt
250 150
Note Skin friction is assumpted as linear until s =2 cm and constant for s gt 2 cm
11 0
Tab 115
Values of the inverse of the point resistance factor (Bustamante 1982) fp
Soil type qPC I 1
Factor - shyfp(MPa)
for piles group
a) Silt and loose sand lt 5 0 40 -b) Moderately compact
5 - 12 040sand and gravel
c) Compact to very gt 12 i 030compact sand and gravel I
Tab 116
Values of the shaft resistance factor fs (Bustamante 1982)
Factor fs
Soil type qs
C Category I(MPa) I A I B I II A III BI
I a) Silt and loose lt 5 60
i 150 I 60 I 120-
sand
b) Moderately corn- I pact sand and 5 - 12 100 200 100 200 gravel i
Icl Compact to very
compact sand gt 12 150 i I 300 150 I 200I
I I and gravel i
I
111
Tab 117
Point resistance factor (proposal)
-
1-fp
qc (MPa)
Gravel
Coarse sand Medium sand
Fine sand Silty sand
25
080
0 70
060
5 0
0 65
055
047
75
054
045
039
10 0
045
036
031
150
035
027
022
200
030
0 23
018
Tab 118
Shaf t r e sistance factor (proposal)
fs
qc (MPa)
Gravel
Coarse sand Medium sand
Fine sand Silty sand
25
80
100
130
10 0
120
150
190
I 200
180
230
300
11 2
Tab 119
Calculated values qcp
for large diameter piles
Pile Literature Length Diameter (m) Measured p Cr1 lcul Settlement Note Authcr(year) No (ml D Dp (MPa)
(s=0 10Dp) (MPa)p ~~JL__
s s ()(mm) Dp
1 Franke (1977) 1 13 11 36 38 117 106 Garbrecht
2
3
2
3
13
14
11
15
1 58 36
37
38
40
215
185
136
123
) qg accord to Franke
4 4 13 15 204 3 2 33 220 108 and Garshy
5 5 6 11 33 35 127 11 5 brecht (1977)
6 6 6 11 153 36 35 146 9 5
7 7 6 1 5 34 35 158 105
8 -shy 8 6 15 2 1 41 3 0 109 52
9 10 9 11 39 52 47
10 11 95 11 43 35 77 70
11 12 9 11 49 66 60
12 13 10 11 15 5 1 4 0 77 5 1
13 14 9 11 1 5 4 8 46 115 77--shy14 Pranke ( 1973) 15 115 18 4 9
) ) average 88
15 13$ 13 5 1 3 19 -2 5 3 2 sd=3 0
16 - - 165 16 5 13 19 30 sv=0 34
17
18
Spang (1972)
llXJ
V90
6 6
6 75
0 7
09
3 2
4 2
32X
42X
x) s =0 10 D p
19 VlaJ 720 1 2 39 3 9X
20 - - VlsJ 6 5 1 5 3 0 3 ox
21 Touma and US59 9 9 o 76 8 0 Reese ( 1977)
22 HH 75 0 61 8 0
23 Gl 180 091 - 2 5
24 BB 137 o 76
sd = standard deviation
sv = standard variation
Tab 1 2 1
Ultimate point resistance coarse and medium sand psf (MPal (Pol ish Specification 1975)
Depth h
Medium sand r = 0 40 N = 200 30 Base diam (Op) and depthbase diam (hDp)
Dense sand r 0 Base diam (Op)
= 0 80 = 50N30 and dpethbase diam (hDp)
(ml Dp = 0 6 m Dp = 1 0 m Dp =12 m Dp = 1 5 m Dp = 0 6 m DP = 10 m DP = 12 m DP = 15 m
Psf hDp Psf hDp Psf hDp Psf hDp Psf hDp Psf hDp Psf hDp Psf hDp
5 10 83 0 85 5 0 075 42 07 33 20 8 3 16 50 14 42 13 3 3
7 14 11 7 1 2 70 11 5 8 10 4 7 2 8 11 7 22 70 2 0 5 8 1 8 47
10 18 16 7 15 10 0 14 8 3 1 3 67 35 167 28 100 2 5 83 2 2 67
15 18 250 18 15 0 16 12 5 15 100 4 2 25 0 3 4 15 0 30 125 27 100
20 2 4 333 2 0 200 185 167 1 7 133 4 7 333 3 8 200 33 167 30 13 3
25 26 41 7 2 2 25 0 20 208 19 167 5 0 41 7 4 0 250 3 5 20 8 3 2 167
w
11 4
Tab 131
Partial safety factors for resistance to axial load for bored piles (Wright Reese 1979)
Partial safety Normal Poor factor for control control
Unit skin resistance 1 70 185
(no load test)
Unit skin resistance 160 1 70
(from load test)
End bearing 165 180
Tab 1 3 2
Probability of failure of bored piles under normal design conditions (Wright Reese 1979)
Probability of Factor of Structure failure safety classification
5 10-3 25 monumental
210shy 22 permanent- 2
5 middot 10 2 0 110shy 1 85
temporary 5 bull 10-l 165
11 5
Tab 133 Results of field tests (Tejchman Gwizdara 1979)
L
II C C C 0 0 0
micro micro
micro micro micro For universal safe~y F2u u CUNo micro C C ~ ~g~ middot- C
~ Permisible micro micro i ~c -i micro
cmiddot-~ micro~ L
micro oo ~ load ~t~ ~~ omicro micro ~ ~ 3Z~ ~ ~ micro
-~~
~ e ~ --middot--
middot- ~ obull 0
~ g ~~ ~~ ~
~ L
o Jl i5 sect~ =gt L Q~ = yen t p Qp Qp
D h Q~ Srrx s tm p s E~ iQ~lQ~cm ~~ KN X ll1l kPa kPa kN kN kN Jl ~e ~ 1 2 3 4 5 6 7 8 9 10 11 12 13 14 15 16 17
1 70 6 60 4081 1550 2531 38 0 1182 10 4040 175 2041 245 1796 632 141 120
2 90 6 75 5082 3041 2041 598 1785 10 4782 107 2541 1079 1462 282 140 42 5
3 120 720 7259 4041 3218 557 1035 10 3576 119 3630 2158 1472 187 2 19 594
4 150 650 8643 4454 4189 51 5 928 20 2521 136 4326 2158 2168 3 10 166 253
5 130190 195 7750 3011 4709 392 805 10 1075 - 3875 981 2894 3 10 166 253
6 130190 165 9516 5101 4415 536 522 20 1800 - 4758 1962 2796 260 158 412
7 130190 135 8044 5199 2845 646 114 4 15 1834 - 4022 2109 1913 2 47 149 524
8 180 115 11380 4415 6965 388 792 15 1735 - 5690 2747 2943 161 2 37 483
9 76 980 6867 4316 2551 628 110 13 9529 109 3534 1128 2306 383 111 32 8
10 61 7 60 7161 2747 44 14 383 67 15 9404 303 3581 392 3188 700 169 109
11 92 180 4807 883 3924 184 20 8 1329 76 2404 196 2207 450 178 82
12 76 24 5 6769 736 6033 109 20 8 1623 103 3385 147 3238 500 186 43
13 76 137 5396 2060 3336 38 2 63 8 4535 102 2698 589 1109 350 t 58 218
14 120 23 5297 1854 3443 35 0 960 10 1640 39 2649 196 2453 945 130 7 4
15 135 16 7 13489 7554 5935 560 181 10 5260 83 6749 2060 4689 367 127 305
16 170 46 0 8829 2943 5886 333 17 10 3466 39 4415 1373 3042 2 14 1 94 31 1
Average Fi 387 166 Standard deviation Sd 2 1 5 034 Standard variation sv= 0 56 0 20
1234 Spang1972 567 8 Franke 1976 9 10 111 2 1 3 Touma Reese 1974
14 Colombo 1971 15 Kerisel Simons 1962 16 Appendino 1973
11 6
Tab 134
Results of model
SafetyScheme factor
medium F ssand
F p
loose F s
samd Fp
F 3 55 sd _P F 1 32 sd
s
tests (Tejchman Gwizdara 1979)
Diameter D (mm)
30 60 90 133
145 129 108 112
280 3 08 307 294
140 154 153 112
594 3 04 324 426
107 sv 030
0 19 sv 0 14
117
Tab 135
Individual safety factors according to literature
Literature proposal ofLiterature individual safety factor
Fs Fb
Polish Specification (1974) 100 250
Tejchman Gwizdala (1979) 150 400
Bustamante Gianeselli 200 300 (1982)
Decourt ( 1982) 130 400
average 145 3 38
TAB 141 0)
Load settlement curves - measured
Pile No
Settlement 1 c 3 4 5 6 7 8 9 10 11 12
s p s p p s
p p s P
p s P
p s p p s
P p s
P p s
p p s p p S
p I i p s
p p s p
mm MPa rrrn lifl5a MPa mm
lifl5a MPa
mm lifl5a MPa mm
RPa mmMPa nwa MPa mm
RPa MPa mm RPa MPa mm
RPa MPa mm RPa MPa mm
RPa MPa mm RPa MPa mm
RPa 10 045 222 09 1 1 05 20 07 143 06 167 08 125 0 5 20 08 125 10 100 08 12 5 15 67 16 63 20 092 21 7 14 43 08 25 10 20 0 1 1 182 12 167 0 9 22 2 12 167 18 111 14 143 24 83 22 9 1 30 125 240 1 7 I 7 6 1 1 273 1 2 250 14 214 15 200 1 2 250 15 200 25 12 0 19 15 8 30 100 26 11 5 40 1ti 250 20 10 0 14 28 6 14 286 1 7 235 18 222 1 4 286 18 22 2 3 2 12 5 23 174 36 111 3 0 133 50 20 250 22 ~27 1 7 294 1 5 333 20 250 2 1 ~38 1 7 294 1 9 263 37 135 27 18 5 4 2 11 9 33 152 60 2 2 273 24 ~5o 20 300 1 7 353 23 61 22 ~73 18 333 21 286 43 140 30 20 0 46 13 0 36 16 7 80 271 295 27 796 24 333 20 400 27 ~96 25 1320 22 364 25 32 0 53 15 1 36 222 41 195
100 322 31 1 30 333 28 357 22 454 31 1323 29 345 26 385 28 357 60 16 7 40 25 0 45 22 2 125 38 329 32 391 32 391 25 500 32 139 1 30 41 7 32 39 1 4 6 272 48 ~6 0 150 14 2 357 34 1441 36 41 7 27 555 36 ~1 7 34 44 1 36 41 7 175 36 486 39 449 30 583 38 ~61 38 461 200 38 526 42 476 32 625 225 39 577 33 682
(mmMPa) ( 1 MPa)
1
1=2074
t 1=O ~01 =0 98S
a1=1132
b1 =0 212 V =0994
a1=2217
b1=O 131
V =Q 978
a1=1860 b1=0233
V =Q966
a1=1562
b1=0174 V =Q983
a1=1382
b1=O195
V =0975
a1 =20 37
b1 =C 174
V =0957
a1=1443
b1=(l 193 v =O 961
a1=965
b1= 0071 V =0 990
a1=1 91
b1 =o 128
V =0 993
a1=5 83
b1=C124
v =O 981
a1=6 1 4
b1=01 64 v =U 985
li(MPa) ~9 4 7 76 43 57 middot5 1 57 5 2 141 78 81 61 cp (MPa) B8 39 40 33 35 35 35 3 0 39 3 5 49 40 __Ef ~-6 1 2 1 9 1 3 16 15 16 1 7 36 22 16 15 qcp
TAB 141 (continue) Load settlement curves - measured
Pi le No 3ettlement 13 14 15 1 17 18 19 20 21 22 23 24
s p s T5
p s T5
p s T5
p s P
p s P
p s P
p s P
p s P
p s T5
p s T5
p s p p s
p mm MPa lll1l
HPa MPa mm HPa MPa mm
fWa MPa mm fWa MPa lll1l
HPa MPa mm HPa MPa mm
MPa MPa lll1l NT5a MPa HPa MPa 111111
HPa MPa 111111
HPa MPa 1)1111
mra 10 1 7 59 075 133 06 167 075 133 ~95 105 09 11 1 07 143 3 76 1 7 59 08 133 10 100 20 2 4 83 130 154 095 21 1 1 15 17 4 1 75 114 16 125 12 167 ~7 74 33 6 2 1 3 15 3 1 9 103 30 29 103 1 7 176 1 2 250 15 200 r55 118 22 136 16 18 8 38 79 46 66 1 7 182 27 110 40 33 12 1 20 200 1 35 29 6 1 75 229 ~O 133 26 154 175 229 49 82 58 6 9 1 9 21 1 35 115 50 36 139 235 21 3 145 34 5 1 95 256 24 208 ~-4 147 28 17 9 20 250 gt8 86 6 9 72 2 2 233 4 2 11 8 60 39 154 265 22 6 1 55 387 2 15 279 28 214 ~6 16 7 30 120 0 2 2 27 3 o 8 89 80 7 5 2 3 262 80 43 186 31 258 1 7 47 1 36 222 14 05 198 33 124 2 25 320 B 1 98 25 327
100 45 222 18 556 39~ 253 ~-5 222 36 1278 27 370 ~8 113 125 47 26 6 20 625 42 29 8 149 255 28 1446 t50 22 682 3 0 500 175 200 225
(mmMPa) a1=479 a1=1206 a1=14 51 a1=1113 a1=1406 ~=836 a1=843 a1=1176 ~=64 a =561 a1=10 0 a1=9 5 (1MPa) b1=0175 b1=0 178 b1=0 382 b=0287 b1=O 119 p 1=0 137 h1 =o 193 b=0258 p1=0 049 b1=0032 b1=0 276 b1 =0 048
hf (MPa)
v =0998 57
v =0-987 5 6
v =0989 26
v =0992 35
v =0933 Iv =0991 84 73
v =0993 5 2
v =0998 tJ
3 9 =0944 v =0998 v =0996 v =0981
qcp (MPa) 46 39 32 30 32 14 2 39 30
lL 12 1 1 08 12 26 1 7 1 3 13 qcp
lD
N 0
TAB 142
Calculated point resistance curves
Setlement (mm) p(s)
1
n p(s)
Calculated value of the p(s) for pile No
2 3 4 5
n p(s) n p(s) n p(s) n p(s) 6
(MPa)
n p(s)
7
n p(s) 8
n p(s) 9
n p(s)
10 20 30 50 80
100
150 200 225
070 128 177 253 335
375 446 493
157 140 141
127
123
1 16 106
070 1 25 168 232
297
327 378 410
422
078 089 099 1 06
1 10
109 1 11 108
108
073 1 30 176 246
315 349
405 441
146 163
160 145
1 32 125
113 105
056 096
1 26
167 205 222
249 265
271
0 80 096
105
1 11 100 101
092 0 83
082
065
118 162 233
308 345
412 456
108 108
1 16 116 114 111
064
1 12 151 2 10 2 69
298
346 3 76
078 P63 093 tt 13 101 tt 53 100 I 13
108 ~75
103 ~04 096 ~ 55
~ 87
1 26 125 127 126
125
1 17 1 04
052 088
1 15 153
188 2 03 227 242
065 0 74
o 77 0 81 0 75
0 73
063
072 122
1 83 262 347 388
463 5 11
073
0 74
073 0 71 0 65 065
064 1 18
162 233 309
3 46
41 3 4 57
Dp (m) 1 1 Qcp (MPa) 38 (mmMPa) h2 8 1 1 9 Qcpbullv1(MPa) 72
158
39
124 14 55
15
40
n20 15 60
204
33 148 10 33
1 1
35
tt 4o 1 9 67
1 53 3 5
tt 4 0 1 5 51
15
13 5
114 0 15 i-gt 3
2 1
30
tt 6 0 10 3 0
1 1
3 9
12 4 1 9 74
1 1
3 5 h40
1 9 67
Note n = condition coefficient calculated p(s) measured p(s)
10
n
081
084 0 85 0 86 0 85
087
TAB 142 (continue)
Calculated point resistance curves
Calculated value of the p(s) for pile No (MPa) Setlement 11 12 13 14 15 16 17 18 19 20
(mm) p(s) ll p(s) n p(s) ll p(s) n p(s) n p(s) n p(s) n p(s) n p(s n p(s) n
10 106 070 0 71 045 091 054 099 1 32 055 092 053 070 060 081 085 0 72 080 055 078
20 1 90 079 130 059 160 067 1 70 1 30 096 101 091 079 1 12 148 085 1 31 082 098 082
30 258 086 1 76 068 2 15 074 222 1 31 1 26 105 120 080 156 205 081 180 082 132 083
50 363 086 246 075 297 082 296 1 26 1 70 117 161 082 228 095 295 087 256 0 91 184 092
80 471 316 o 77 3 77 088 364 1 18 2 1 o 1 24 199 308 085 393 097 336 1 02 237 095
100 522 349 078 415 092 394 228 1 27 2 16 348 088 442 098 375 104 262 097
150 611 405 479 443 258 117 244 423 529 443 304 101
200 669 441 518 473 276 261 474 587 488 331
Dp (MPa) 1 1 1 5 1 5 18 1 9 19 070 090 12 15
qcp (MPa) 49 4 0 46 49 32 30 32 42 39 30 12 a1 mmMPa) 84 h20 96 84 152 160 152 124 160
IV1 1 9 1 5 15 12 11 1 1 23 21 18 15
qcpmiddotv1 (MPa) 93 60 69 59 35 33 74 88 70 45
- 12287 average = ~ = 098
standard deviation sd = 023 standard variation sv = 023
N
122
TAB 143 Ultimate settlement for shaft resistance - summing up
Ultimate settlements (mm)Literature sand cohesive claysand
soil
Burland Butler Dunican (1966) 7
Touma Reese (1974) 10 Tomlinson (1977) 10 Klosinski (1977) 8
Francke Gerbrecht (1977) 20-30 DIN 4014 part 2 (1977) 20 10 Francke (1981) Reese (1978) (1979) 05-2 of 05-2 of Farr Aurora (1981) shaft dia~ shaft diam
5-20 mm 5-20 mm Tejchman Gwizdala (1979) - Spang (1972) 10
10 10 20
- Francke (1976) 10 20 15 15
- Touma Reese (1974) 13 8 15 8
8 - Colombo (1971) 10
- Kerisel Simons (1962) 20 - Appendino (1973) 10 Promboon Brenner (1981) 10 Prodinger Veder (1981) 12 Decourt (1982) 10-15 10-15
-average s = 14 1 10 126
standard deviation sd = 53 2 1 47
standard variation sv = 038 021 037
123
TABLE 14 4 Al l owab l e base resistance versus sett lement
Pile Li terature ength Diameter (m) Calculated qcp=qcp Settl ement Fp-3- sa (mm)No Aut hor No (m) D DP qcp (MPa) for qcp3(MPa)
1 Francke ( 1977) 1 13 11 38 127 25 Garbrecht
II2 2 13 11 158 39 130 19
II3 3 14 15 40 133 33
II4 4 13 15 204 33 110 23
II5 5 6 11 35 117 22
II6 6 6 11 153 35 117 19
II
8
7 7 6 15 35 1 17 25
II 8 6 15 21 30 100 21
II9 10 9 11 39 130 13
II10 11 95 11 35 117 15
II11 12 9 11 39 163 11
II12 13 10 11 15 40 133 7
II13 14 9 11 15 46 153 9
14 Francke ( 1973) 115 11 5 18 30 100 15
II15 135 135 13 19 32 107 29
II16 165 165 13 19 49 163 35
17 Spang (1972) V70 660 070 32 107 28
18 II V90 675 0 90 42 140 16
II19 V120 720 1 20 3 9 130 16
II20 V15C 650 150 30 100 16 average for pi les 198
standard dev sd = 78
standard var sv = 039
)assumed qc = p for s = 010 Op sonding meRsurement were not availab le
IV
TA~LE 15 1
Comparison of the initial sl ope of the pile point resistance - settlement curve
Accardi ng to 1 2 3 4
In i t i ~l 5
slope a1 for the pile No
6 7 8 9
(mmMPa)
10 11 12 13 14 15 Note
a 1 for s=10 mm 222 11 1 a1 for s=20 mm 21 7 14 3 calculated 207 113see Tab 14 1 Bo Berggren (198 )230s=20 mm
Schmertmann s method (see 202B Berggren 1981)s=20 mm
No 1 _ llNo - 6 1 97 098
202 250
22 2
400
30 8
090
14 3
200
186
076
167
182 156
286
18 2
107
125
167 138
091
20 0
222
204
426
263
098
125
167
144
087
100
11 1 9 7
182
23 5
1 03
12 5
14 3
11 9
174
164
105
67 83
58
14 6
125
1 16
63
9 1
61
103
59
8 3 48
123
13 3
15 4 12 1
1 10
167 21 1
aceto hypershy14 5 bola type curve
1 15
No 2 NQj = n1
No 4Noz ~ na No 5Naz= T]g
105 1 27
106
093
1 13
160
1 23
108 1 17
157
100
121 109
1 92
118
1 16 1 14
164
2 12
120
122
1 15
143
1 76
151
149 1 73 1 27 146
TAllLE 151 (continue)
Compa ri son of the initial slope of the pile point resistance - settl ement curve
Initial slope a1 for the pile No (mmMPa)According Note to 16 17 18 19 20 21 22 23 24 -a1 for s=10 mm 133 - 105 11 1 143 76 59 133 100 a1 for s=20 mm 174 - 114 125 167 74 62 153 10 3 calculated see 11 1 146 84 84 118 64 56 100 95Tab 141
Bo Berggren 198 67 78 25 0 114s=20 mm Schmertmann s method (see B 136 67 250 146 Berggren 1981) s = 20 mm
nG = 108 No 1NoJ = n 1 20 125 1 32 121 1 19 105 1 33 105 sd = 0 14
SY= 013 No 2 i) = 1 29ro1 = n1 157 136 149 142 1 16 1 11 1 53 108 sd = 019
SY= 015 No 4 iis = 143 INo2 = ns 091 126 1 63 111 sd = 033
SY= 0 23 No 5 ii9 = 1 37183 108 163 142INoz = n9 sd = 0 37
SY = 027
N Vl
126
TABLE 152
Measured and calculated pile point resistance
Pile Calculated Measured Measured No qcp P for
s=10 mm P for s=20 mm
~ 10 mm ~ 20 mm
- (MPa) (MPa) (MPa) - -
1 38 045 092 84 41 2 39 09 14 43 28
3 40 05 08 80 50 4 33 07 10 47 33 5 35 06 11 58 30 6 35 08 12 44 29 7 35 05 09 70 39 8 30 08 12 38 25 9 39 10 18 39 22
10 35 08 14 44 25 11 49 15 24 33 20 12 40 16 22 25 18 13 46 1 7 2 4 27 19 14 30 075 13 40 23 15 32 06 095 53 34 16 49 075 115 65 43 17 32 - - - -18 42 095 1 75 44 24 19 39 09 160 4 3 23 20 3 0 07 12 43 25
average= 484 291
sd 163 088 sv 034 030
Tab 153 Results of calculation for piles No 1-24
Pile No
Length (m)
Overburden pressure 0 vs
0hs (kPa)
0ve (kPa)
0 nc (kPa)
- -ov=o1 (kPa)
- -OV=03 ( kPa)
00 (kPa)
p(a il ( kPa)
s (a 1) (mm)
A2 ( 1 )
E t
(kPa)
Md ( 1 )
K (1)
E I
t (kPa)
( kPa) 1 2 3 4 5 6 7 8 9 10 11 12 13 14 15 16
l 2 3 4 5 6 7 8 9
10 11 12 13 14 15 16 17 18 19 20 21 22 23 24
13 12 14 13 6 6 6 6 9 95 9
10 95
11 5 135 165 66 675 72 65 99 75
180 137
l 33 133 123 116
70 70 70 70
104 102 95
102 95 94
106 139 95
101 106 97
180 137 221 215
53 53 49 46 28 28 28 28 42 41 38 41 38 38 42 56 38 40 42 39 72 55 88 86
202 202 216 202 1114 104 104 104 146 153 146 160 153 181 209 251 120 128 134 123 238 180 305 277
202 202 216 202 104 104 104 104 146 153 146 160 153 181 209 251 120 128 134 123 238 180 305 277
168 Hi8 170 159 87 87 87 87
125 128 121 131 124 138 158 195 108 115 120 110 209 159 263 246
128 128 133 124 66 66 66 66 94 97 92
101 96
110 126 154 79 84 88 81
155 118 197 182
141 141 145 136
73 73 73 73
104 107 104 111 105 119 137 117 89 94 99 91
173 132 219 203
950 975
1000 825 875 875 875 750 975 875
1225 1000 1150 750 800
1225 800
1050 975 750
2000 2000 625
1500
218 139 255 190 16 1 146 210 12 7 10 1 11 7 84 73 69
104 167 210 124 103 10 1 109 142 120 76
153
0802 0802 0822 0820 0798 0798 0798 0798 0791 0798 0800 0811 0814 0837 0837 0830 0769 0 768 0771 0 775 0 780 0 781 0 788 o 779
35296 81603 43312 65222 44019 67515 4609 91313 78186 60572
118115 15129 5 184075 95577 67017 81607 33252 67554 85294 75994 78816 74857 55101 54862
075 075 0 77 075 084 084 084 081 079 078 084 080 083 076 076 078 0 77 081 079 076 082 087 064 0 74
278 643 337 512 542 832 567
1085 766 572
1216 1417 1832
796 520 709 353 735 878 781 630 726 302 366
26472 61202 33350 48917 36976 56713 38656 73964 61767 47246 99217
121036 152782
72639 51932 63653 25604 54719 67382 57755 64629 65126 35265 40598
a=282l a =l781 y=axs S=0621 B=0 844
V=0 057 V=0 128 _ Iv -J
~
N co
Tab l53 Results of calculation for piles No 7-24
Pile No
17
1 2 3 4 5 6 7 8 9
70 11 72 13 74 75 16 17 78 79 20 27 22 23 24
Ground water
18
-20 m b s
-28 m -335 m -330 m -3 15 m dry dry -53 m -85 m
E t (kPa)
19
33653 64979 35364 45664 47969 54583 37574 63072 74548 57753
71 2618 123531 150297
71239 48619 59204 39744 77208 77863 62049 90407 95844 57762 62937
vxEt=E Md (kPa)
20
25240 48689 27230 34248 35254 45849 31562 51040 58893 45047 94599 98825
724747 54142 36950 46179 30603 57678 61572 47157 47734 83384 36968 46569
a=898 S=l 27 =0314
K (l )
21
265 511 275 358 517 672 463 749 730 546
1160 1157 7496
593 377 514 422 775 802 638 723 929 377 420
a=l422 S=l 05 =0187
E=E = t1 3
g-gcp (kPa)
22
51046 52799 54566 42492 45870 45870 45870 37547 52799 45870 77039 54566 65438 52799 40826 71039 40926 58739 52799 37541 82549 82549 40826 59945
Calculated s
(mm)
23
708 128 72 7 15 3 724 146 144 17 3 71 3 11 5 11 2 732 13 2 707 1 5 1 13 7 93
102 118 137 728 12 l 69
11 9
s__caL n=smeos
() 24
050 092 050 087 0 77 7 00 069 l36 l 12 098 133 l81 l97 103 090 065 0 75 099 117 126 090 101 097 078
ri=l00 sd=035 sv=035
K = l50gcp
25
570 585 600 495 525 525 525 450 585 525 735 600 690 450 480 735 480 630 585 450 825 825 1180 645
E l
(kPa)
26
67684 69465 72250 57726 44856 44856 44856 38448 59659 54306 74956 63214 70704 49089 56783 79502 45283 61081 58207 42927
708572 94785 71033 91898
E = t E middotA2
l
(kPa)
27
54283 5571 l 59389 47336 35795 35795 35795 30682 47790 43336 59964 51266 57553 47088 47024 65987 34823 46970 44877 33269 84639 74027 55974 71589
Calculated s
(mm)
28
l O l 12 l 11 7 737 15 9 18 7 185 21 1 12 6 12 2 133 14 l 150 13 7 13 l 14 7 709 12 7 738 755 12 4 735 50
100
- -
Tab l53 Results of calculation for piles No l-24
Pile
29
l 2 3 4 5 6 7 8 9
10 ll 12 13 14 15 76 17 78 19 20 21 22 23 24
sea l n= middotshy
smeas
28 TT
30
0 46 087 046 0 72 099 l 28 088 l 66 l 25 l 04 l 58 l 93 2 17 l 32 078 0 70 088 l 23 l 37 l42 087 l l 3 066 065
n=l 10 sd=0 44 sv=040
s seal for p n=s=lOrnn ac cording to s = 70mm
(mm)
37 32
5 l 0 51 ll 8 l18 64 064
13 0 l30 85 0 85
13 3 l 33 83 0 83
184 l84 ll6 l l 6 105 l05 137 l 37 21 3 2 12 19 4 l94 107 l06 l l 3 l l 3 84 084
92 092 l 0 9 l09 128 l28 83 083
l 0 3 l03 88 088 79 0 79
n=1 73 sd=025 sv=027
s for p according to s = 20mm
(mm)
33
10 4 184 102 18 6 15 6 200 14 9 276 209 18 4 219 292 274 185 17 9 12 9 -
169 194 219 172 200 143 15 0
seal n=s=20rnn
34
052 092 051 093 078 l00 075 l 38 l 05 092 l l 0 l46 l 37 093 090 065
-085 097 l1 0 086 l00 072 075
n=093 sd=025 sv=0 27
s for p according to s = 30rnn
(mm)
35
142 223 14 l 22 3 198 249 142 34 5 290 249 274 345 33 l 243 22 6 168 -
24 7 26 6 293 24 3 279 187 213
seal n=s=30rnn
36
047 0 74 047 0 74 066 083 047 l 15 0 97 083 091 l 15 l10 0 81 075 056 -
082 089 098 081 093 062 0 71
n=o80 sd=020 _ sv=0 25 N
IO
APPENDIXES
APPENDIX 1 1 1
Pi le No 1 Length 13 m D 10 m
Areas of influence
-
qe
(MPa)
1 fp
___9c_ f
(MPR) zyen
(MPf) qcp (MPa)
Soil type
22 20 18 16 14 1 2
l 2 (m)
10
1 0 08 06
16 15 16
026 027 026
42 41 42 Sand
04 14 U28 39 02 14 028 39 41
02 16 0 26 42 04 16 026 42 06 16 026 42 08 14 028 39 Sand 1 0 13 030 39 12 15 027 4 1 38 14 13 030 39 16 12 032 38 18 12 032 38
40 20 10 036 36 22 10 036 36 24 9 U39 35 2 6 8 043 34 28 10 036 36 30 10 036 36 3 2 10 036 36 34 10 0 36 36 36 11 0 34 37 38 11 034 37
l 1 (m)
40
42 44
11 0 34 37 15 1
46 48 50 52 54 56 58 60 62 64 66 68 70 7 2 74 76 78 8 0
APPENDIX 112
Pile No 2
to little depth of sounding
q~ = middle values for 11 = 2 Op
q~ = 145 MAa (Francke Garbrecht 1977 Tab 2 p 50) (Fi g No 2)
for sand
qcp = 0275middot145 = 40 MPa q~p =V ~~s) middot 40 = 097middot40 = 39 MPa
Pile No 4
q~ = 120 MPa sand (Fig No 4)
q = 0 315middot12 = 3 8 MPa q bull 38 = 086middot38 = 33 MPa=V Jmiddot54
1
cp middot bull cp
Pile No 12
qg = 155 MPa sand (Fig No 13)
qcp = 026middot155 = 4 03 MPa
Pile No 13
q~ = 200 MPa sand (Fig No 14)
q = 0 23middot20 = 46 MPacp
APPENDIX 113
PileNo3 Length 14 m D 15 m
Areas of influence
-
qe
(MPa)
1 Tp
----9cf
(t-1Pf) r~
(MPf) qcp (MPa)
Soil type
22 2D 18 16 17 025 43 14 17 II II
L 2 17 II II
12 (m)
16 10 08 06
17 17 17
o
II
II
II
II
Sand 04 17 II II
02 19 024 46 b9
02 19 024 46 04 17 025 43 06 15 027 41 08 13 030 48 1 0 12 032 38 12 11 033 36 14 13 0 30 39 16 14 028 39 18 12 032 38 40 20 16 026 42 2 2 16 026 42 24 11 033 36 26 11 033 36
60 28 30
10 10
036 036
36 36
Sand
32 10 036 36 34 12 032 3 8 3 6 12 032 38 38 12 032 38
1 1 (m)
40
4 2 4 4
13
14 16
030
028 026
39
39 42
46 13 030 39 48 12 032 38 50 14 028 39 52 10 036 36 54 13 030 39 56 14 028 39 58 15 027 41 60 15 027 ~-1 236 62 64 66 68 70 72 74 76 7 8 80
APPENDIX 114
Pi l e No 5 Length 6 0m D 11 m Dp 11 m
Area s of i nfluence
-
qc
(MPa)
1 Tp
-3Lf
( MPf) l ~
(MP~) qcp (MPa)
Soil type
2 2 2 0 18 1 6 14 1 2 155 U i1 33
l 2 (m)
1 2 10 08 06
15 14 12
022 023 0 27
3 3 32 32
Fine sand
+ silt
04 125 026 33 02 16 0 21 34 39
02 16 021 34 04 13 025 33 06 08 10
15 5 17 20
022 0 20 018
34 34 36
35 Fi ne sand
1 2 20 0 18 36 14 20 018 36 + s ilt 16 20 0 18 36 18 165 020 32 20 165 0 20 32 22 17 0 20 34 24 26 2 8 30 32 3 36 38 4 0
19 21 5 21 5 21 5 20 19 5 19 5 20 215
01 9 ---
018 018 0 18 0 18 -
3 6 40 40 40 36 35 3 5 36 4 0
l 1 (m) 4 2
44 20 19
018 01 9
36 3 6 157
46 48 50 5 2 54 56 58 6 0 62 64 66 68 70 7 2 74 76 7 8 8 0
APPENDIX 1 15
Pi le No 6 Lengt h6 0 m D 11 m
Areas of qc 1 __9_c_ qcp Soil typei nfluence fp f 1 yen (MPa) (MPf ) (MPf) (MPa)
-2 2 20 18 16 t 4---0 14 75 038 29 L2 20 018 36 Fi ne sand
1ti 10 30 40 + s i lt12 08 19 0 19 36(m) 06 17 020 34 04 14 023 32 02 9 034 31 56
02 6 043 26 04 12 026 3 1 06 17 020 34 08 11 028 3 1 1 0 14 023 32 35 1 2 17 020 34 Fi ne sand14 19 019 35 16 20 018 36 + silt18 18 0 19 34 20 14 023 32
46 22 12 026 31 24 12 026 31 26 15 022 33 28 18 019 34 30 20 018 36 3 20 0 18 36 34 20 018 36 3G 20 018 36 38 20 018 36 4 0 20 018 36
l 1 42 22 40
(m) 44 22 40 46 L2 4 0 158 48 50 52 54 56 q =V ~ - 3 b =0 99middot35 = 35 MPp cp 53 58 6 0 62 64 66 68 70 72 74 76 78 80
APPENDIX 116
Pi leNo7 Length 60 m 0 15 m
Areas of influence
-
qe
(MPa)
1 Tp ~
(MPg) r~
(MPf) qcp (MPa)
Soil type
22 20 18 16 9 U33 30 14 10 031 31 12 135 024 32
l 2 (m)
16 10 08 06 04 02
13 12 6
10 175
025 026 043 0 31 020
33 31 26 3 1 35 50
Fine sand
+ silt
02 04 06
17 10 115
0 20 0 31 027
34 31 3 1
08 10
145 185
023 019
33 35 3 5
1 2 14
20 19
018 0 19
36 36 Fine sand
l 1 (m)
60
16 18 20 22 24 26 28 30 3 2 34 36 38 40
42 44 46 48 50 52 54 56 58 6 0
185 125 125 165 17 19 21 215 205 20 21 20 20
24 22 20 215 22 22 21 19 18 22
0 19 026 0 26 020 020 019 --
018 018 -
018 01 8 --
018 ----
0 19 0 19
35 33 33 33 34 36 40 40 37 36 40 36 36
40 40 36 40 40 40 40 36 34 40 219
+ silt
62 64 66 68 70 72 74 76 78 80
APPENDIX 117
Pile No 8 Length60 m D 15 m Dp 2 1 m
Areas of influence
-
qe
(MPa)
1 r +
(MPg) r~
(MPf) qcp (MPa)
Soil type
22 18 019 34 20 16 021 34 18 125 026 3 3 16 115 027 31 14 11 028 3 1 12 11 028 3 1
l 2 (m)
10 08 06
105 11 145
D29 028 023
30 31 33
Fine sand
+ silt
04 18 0 19 34 02 18 019 34 71
02 15 022 33 04 11 0 28 31 06 13 0 25 33 08 20 0 18 36 10 15 022 33 12 13 025 33 14 175 020 35 16 18 20 22
20 21 20 15
018 -
018 0 22
36 40 36 33
35 Fine sand
+ s i lt
24 26 28 30 3 =
13 16 175 19 20 20
025 021 020 0 18 018 018
33 34 3 5 34 36 36
36 38 4 0
20 20 21
018 0 18 -
36 36 40
11 (m)
4 2 4 4 4 6 48 50 5 2 5 4 56 5 8 60 6 2 6 4
20 20 21 22 21 20 19 175 19 20 25 28
018 0 18 ---
01 8 01 9 0 20 0 19 018
36 36 40 40 40 36 36 35 36 36 40 4 0 23 0
6 6 68 70 72 74 76 78
qcp 1f5=v 2T middot35 = b85 middot35 = 30 MPa
80
APPENDIX 118
Pi le No 9 Le ngth 90 m D 11 m m
Areas of 1Qe -9c qcp Soil typeinfluence Tp f ryen (MPa) (MPg) (MPf) (MPa)
-
2 2 2 0 18 16 14 lc 11 034 37
12 10 10 036 36 12 08 9 039 35 Medium(m) 06 10 036 36 sand04 10 036 36
02 11 034 37 43
02 12 032 38 04 12 0 32 38 06 12 0 32 38 08 13 030 39 10 13 030 39 12 13 030 39 14 14 028 39 16 14 028 39
44 18 14 028 39 20 14 028 39 39 Med ium 22 15 027 4 1 sand 24 16 026 4 2 26 17 025 43 28 13 0 30 39 3 0 9 039 35 32 13 030 39 34 16 026 42 36 17 025 43 38 17 025 43 40 19 024 4 6
11 42 17 025 43
(m) 44 15 027 41 17 7 46 48 50 52 54 56 58 60 6 2 64 66 68 7 0 7 2 74 76 78 80
APPENDIX 119
Pi 1 e No 10 Length 95m D 11 m m
Areas of influence
-
qe
(MPa)
1 fp
-9c f
(t-1Pf) [~
(MPf)
qcp
(MPa)
Soil type
22 20 1 8 16 14 L 2 13 Uti 3J
l 2 (m) 12
10 08 06 04
18 18 28 19
0 19 019 0 19 019
34 34 34 34
Fine
sand
02 21 40 42
02 20 4 0 04 17 020 34 06 21 40 0 8 10
23 22
40 40 Fine
1 2 14 16 18
21 20 16 15
0 21 022
4 0 4 0 34 33
sand
44
20 2 2 24 26 28 30 32 34 36 38 40
14 14 13 11 11 14 17 14 12 13 12
023 023 025 0 28 028 023 020 023 027 025 027
32 32 33 31 31 32 34 3 2 32 3 3 32
l 1 (m) 42
44 12 13
0 27 025
32 33 15 2
46 48 50 5 2 5 4 56 5 8 6 0 6 2 6 4 66 6 8 70 72 74 76 78 80
APPENDIX 11 10
Pi 1 e No 11 Lengt h 9 0m D 11 m m
Area s of influence
-
Qe
(MPa)
1 fp
__k_ f
(MP~) ryen
(MPf) qcp (MPa)
Soi l type
22 20 18 16 14 12 lb 55
12 (m)
1 0 08 06 04
23 19 20 21
024 023
55 46 46 55
Medium
sand
02 22 55 62
0 2 04
24 25
55 55
06 08
27 28
55 55
10 12 14
28 28 28
55 55 55 49
16 26 55
44
18 20 22 24 26 28 30 3 34 36 38 40
24 19 18 17 22 21 17 11 13 12 11 9
024 024 025
025 0 34 030 032 034 039
55 46 43 43 55 55 4 3 37 39 38 3 7 35
1 1 (m) 42
Ll Ll
12 16
032 0 26
38 4 2 209
46 48 50 5 2 54 56 58 60 62 64 66 68 70 72 74 76 78 80
APPENDIX 141
0 2 3 4 p [MPa)
PILES WITH 40 ENLARGED BASES
80
120
160 C----0
200 IN4014 s (1977)
[mm]
P s calculateds P p(s)(mm) (MPa)(mmMPa)(MPa) ()
10 035 286 046 20 065 308 080 30 090 333 104
150 24 625 214 200 229
ai = 2605 (mmMPa) b1 = 0243 1MPa V 1000 bi = 1b = 411 MPa
_ 411 MP Vi - 24 a
() assumed
average Dp = 18 m
qcp = 24 MPa ai = 184 (mmMPa) (28-4middot24)
Vi = 1 2 (3-18)
qcpmiddotvi = 29 MPa
40
80
120
160
200 s
[mm]
DIN 4014 Part 2 ( 1977)
0 1 2 3 4 5 p [MPal
PILES WITHOUT ENLARGED BASES
C----0
DIN 4014 ( 1977
s calculated s p -p- p(s)
(mm) (MPa)mmMPa)(MPa) ()
10 05 20 062 20 08 25 113 30 11 27 3 155
150 34 441 385 200 424
ai = 2085 (mmMPa) bi= 0 157 1MPa V = 0970
bi= 1s = 637 MPa
Vi 187=3f =
() assumed
average Dp = 12 m
qcp = 34 MPa a1 = 144 (mmMPa)
Vi = 18
qcpmiddotvi = 61 MPa
Range qc = 10-15 MPa
(28-4bull34)
(3-12)
1 1 q = r -r- = 036 for qc = 10 MPaCp p Ip+= 027 for qc = 15 MPa
qcp = 36-405 MPa P
APPENDIX 142
Touma F and Reese L (1974)
Soil parameters pile parameters and base resistance see fig bullbullbullbull
TAB
Measured load settlement curves
Settlement s
mm
10 20 30 40 50 60 80
100 120
a 1 (mmMPa) bi(MPa) V
N3u
q =04 -N30 (cMPa) ()
1 qCp=--rpbullqC
Pile No 21 (US 59) 22 (HH) 23 (G1) 24 (BB) Notep Sp p S p p S p f Sp MPa mmMPa MPa mmMPa MPa mmMPa Mla mmMPa
131 76 169 59 075 133 100 100 269 74 325 62 131 153 1 94 103 381 79 456 66 165 182 273 11 0 488 82 581 69 1 90 21 1 349 115 581 86 694 72 2 15 233 424 118 675 89 800 75 229 262 813 98 245 327 884 113 925 130
64 56 100 95 U049 0032 0276 0048 0944 0998 0996 0981
80 gt100 30 60 32 gt 40 12 24 ()
Bergdahl (1982)
gt5 5 gt55 32 4 3
(0 18middot32) (018middot40) (0265middot12) (018middot24)
CONTACT PRESSURE p [ MPa]
0 2 4 6 8 100 N-------r---------------(us 59) ( HH) ( BBi
E E SQ-------lt+-----+--------------lt
VI
1shyz UJ
~ 100 1---------i----+----+----+------l------I -J I shyI shyUJ V)
so~----~--~-- ~--~
APPENDIX 143
us 59 fYJo 0 50 00
ff-t r-=-~c~=~-r~c_---_---l-~e-J-C~ 0 ------
CLAY
FINE SANO
J lD- 760 mm
f5m~--~--~
Pile US 59 and results from penetration test
HH IV_l() so 100 r=-=-==-==-r-~--=-=- 0 0 II 15- flf ~ II~ Ibull If t f
CLAY SAND
Sm
)
= -middotl lo - GtOmm
~ JI
SILTY SANO tOm
Pile HH and results from penetration t est
APPENDIX 14 4
61 NJO 50 --------00
11 1 =f J - 1 -- 0
CLAYSILT
E ~ Sm ltrj
SILTY SAND
q I lDmiddot 910 mrn tom
I) t bull
Pile G1 and results from penetration test
88
0 50 too ~1-e I q 111bull - Q
CLAY
SIL TY SAND 5m
]
l lDmiddot760mrn
Om
Pile BB and results from penetration test
APPENDIX 145
Klosinski B (1977)
Loading tests 50 bored piles 09-125 m diameter average Op= 11 m On t he sett l ement of rigid pla te the settlement of t he pi le base is given by
PmiddotOSp = T-K b
where Mb - equivalent deformability modu lus
1) Sand and sandy gravel of medium density
Mb = 25-50 MPa
According to Bergdahl (1979) medium sand is between
q(l) 5 MPa (Io=035)c2)
ql = 10 MPa (Io=065)C
from fig 117 rp1 = 055 for qc = 5 MPa 1Tp = 036 for qc = 10 MPa
q(l)= 0 55middot5 = 2 75 MPacp bull
q(2= 0 36middot10 = 360 MPacp
allowable p~ 1)= ~p = yen = 092 MPa and p~2) = ~ = 120 MPa
settlement of the pi l e base
5(1)= o 92 middot 1bull1 = O 0135 m = 13 5 mm p 325 middot middot
5( 2)= 1bull2bull1middot 1 = O 0088 m = 8 8 m p 350 bull bull
1) _ s _ 135 _ 14 7 (mm) a(2) _ 88 _ a 1 - p - o---92 - bull NPa bull 1 - T-7 - 733 (Wa)
2) Loose sand lo= 030-040
Mb = 12- 25 MPa
q~l) = 44 MPa q~2)= 58 MPa
1Tp = 058 and 052
q(3) = 0 58middot4 4 = 2 55 MPa middot q( 4) = 0 52middot5 8 = 3 02 MPa cp bull middot bull cp bull middot middot
allowable p~ 3)= 4i = 085 MPa p~4)= yenl = 101 MPa
s(3)_ 085-11 = 26 mmmiddot s(4)_ 101middot11 = 148 mm p - 312 p - 3 25
STATENS GEOTEKNISKA INSTITUT Swedish Geotechnical Institute S-581 01 Linkoping Tel 01311 51 00
Serien Rapport ersatter vara tidigare serier Proceedings (27 nr) Sartryck och Preliminara rapporter (60 nr) samt Meddelanden (10 nr)
The series Report supersedes the previous series Proceedings (27 Nos) Reprints and Preliminary Reports (60 Nos) and Meddelanden (10 Nos)
RAPPORT REPORT Pris kr
No Ar (Swcrs)
1 Grundvattensankning till foljd av 1977 50shytunnelsprangning P Ahlberg T Lundgren
2 Pahangskrafter pa langa betongpalar 1977 50shyL Bjerin
3 Methods for reducing undrained 1977 30shyshear strength of soft clay K V Helenelund
4 Basic behaviour of Scandinavian soft 1977 40shyclays R Larsson
5 Snabba odometerforsok 1978 25 shyR Karlsson L Viberg
6 Skredriskbedomningar med hjalp av 1978 40shyelektromagnetisk faltstyrkematning - provning av ny metod J Ingands
7 Forebyggande av sattningar i 1979 40shyledningsgravar - en forstudie U Bergdahl R Fogelstrom K - G Larsson P Liljekvist
8 Grundlaggningskostnadernas fordelning 1979 25 shyB Carlsson
9 Horisontalarmerade fyllningar pa los 1981 50 shyjord J Belfrage
RAPPORTREPORT
No
10 Tuveskredet 1977-11-30 Inlagg om skredets orsaker
11a Tuveskredet geoteknik
l1b Tuveskredet geologi
11 c Tuveskredet hydrogeologi
12 Drained behaviour of Swedish clays
R Larsson
13 Long term consolidation beneath the test fills at Vasby Sweden YCE Chang
14 Bentonittatning mot lakvatten T Lundgren L Karlqvist U Qvarfort
15 Kartering och klassificering av leromradens stabilitetsforutshysattningar L Viberg
16 Geotekniska faltundersokningar Metoder - Erfarenheter - FoU-behov E Ottosson (red)
17 Symposium on Slopes on Soft Clays
18 The Landslide at Tuve November 30 1 977 R Larsson M Jansson
19 Slantstabilitetsberakningar i lera Skall man anvanda total spanningsanalys effektivspanningsanalys eller kombinerad analys R Larsson
20 Portrycksvariationer i leror i Gateshyborgsregionen J Berntson
21 Tekniska egenskaper hos restproshydukter fran kolforbranning shyen laboratoriestudie B Moller G Nilson
Ar
1981
1981
1981
1981
1981
1982
1982
1982
1983
1982
1983
1983
1983
Pris kr (Swcrs)
50shy
50shy
40shy
50shy
100shy
60shy
80shy
60shy
190shy
75shy
60shy
150shy
65shy
RAPPORTREPORT
No Ar Pri s kr (Sw crs)
22 Bestamning av jordegenskaper med sondering - en litteraturstudie U Bergdahl U Eriksson
1983 75 shy
23 Geobildtolkn ing L Vi berg
av grova moraner 1984 70 -
24 Radon i jord -Exhal ation- vatten kvot -Arstidsvariationer - Permeabilitet A Lindmar k B Rosen
1984 75 shy
25 Geoteknisk terrangklassificering for fysisk planering L Viber g
1984 120shy
26 Large diameter bored piles in nonshycohesive soils Determination of the bearing capacity and settlement from results of static penetration tests (CPT) and standard penetration test (SPT) K Gwizdala
1984 85shy

9
Notations and symbols
Roman letters
a 1 Initial slope of the pile point resistance shysettlement curve
Ap Cross-sectional area of a pile
As Area of the pile shaft
CPT Static Penetration Test
D Diameter of pile shaft
Op Diameter of pile point
E Youngs modulus
fp Point resistance factor
fs Shaft resistance factor
F Universal safety factor
Fp Individual safety factor for ultimate resistance of pile point
Fs individual safety factor for ultimate resistance of pile shaft
K Dimensionless compression modulus
K At rest soil lateral stress coefficient0
Koc Lateral stress coefficient for fluid fresh concrete
Mo Constrained (oedometric) modulus
N30 Numbe r of blows for 030 m penetration in SPT
p Unit point resistance (contact pressure)
p (s) Unit point resistance versus settlement
Unit point resistance at failurePsf
Allowable unit point resistancePa
Sounding resistance
Average static cone penetrometer resistance close to tne pile point
qs Average static cone penetrometer resistance C along the pile
10
Ultimate point resistance of large diameter piles based on static sounding results
Ultimate skin friction resistance of large diameter piles based on static sounding results
Qa Allowable pile load
Qcp Point load of the static cone penetrometer
Qct Total load of the static cone penetrometer
Qpa Allowable point resistance of the pile
Qpu Ultimate point resistance of a pile
0 sa Allowable skin resistance of the pile
0su Ultimate bearing resistance of a pile
Qu Ultimate bearing resistance of a pile
s Settlement
sd Standard deviation
ss u Ultimate settlement for pile shaft
sv Standard variation
SPT Standard Penetration Test
t Unit shaft resistance
Ultimate unit shaft resistance
Circumference of the pile shaft
Circumference of the static penetrometer shaft
Greek letters
a Constant
B Constant
A Coefficient
microd Depth factor
v Poissonbulls ratio
v 1 Correction factor for hyperbola point resistance shysettlemen~ relationship
n Correlation coefficient
ahc Radial (horizontal stress in the concrete
ohs Radial (horizontal) stress in the soil
Ovc Vertical stress in the concrete
Ovs Vertical stress in the soil
11
1 LARGE DIAMETER BORED PILES IN NON-COHESIVE SOILS
11 peterminati on of bearing capacity of bored piles
from results of Cone Penetration Test (CPTl
The methods published in available literature up to 1976
were compiled by D Rollberg (1976 1977) It contains
totally 25 methods
- 22 use the results of static soundings (CPT)
3 use the results of standard soundings (SPT)
The failure load Qu of the pile is evaluated as the sum
of the pile point resistance Q and the pile skin reshypu sistance Qsu
(111)
Pile point resistance Q based on static soundina reshypu shysults can be expressed as
1- bull qP A ( 1 1 2)f C p
p
where
fp = point resistance factor
qP mean sounding resistance of static cone C
penetrometer in the area of the pile point
A cross-sectional area of the pilep
The pile skin resistance is expressed as
1 s -- bullq bullU middot Lih (113) fS C p
where
fs = shaft friction factor
sqc mean sounding resistance along the depth h
and skin surface area U middotLih p
1 2
The methods differ in
- the calculation of qPC
(074 to 40) Db below the pile base (Fig 11 1)
(10 to 80) Db above the pile base (Fig 1 11)
- the evaluation of the point resistance factor usually
values off gt 10 are used p
- the calculation of qsC
- the evaluation of the shaft friction factor
fs = 50-300 is applied
In Table 111 methods for determination of the bearing
capacity of bored piles are listed Rollberg 1977 The
point load the skin friction load and the ultimate total
load are evaluated for bored piles (shaft diameter D ~
03-090 m) from static sounding results in non-cohesive
soil
Calculation results based on static sounding measurements
are shown in Table 112 for pile point pile shaft and
total pile load respectively
The table shows that
- a ll methods overestimate the ultimate point resistance
- the best correlation for ultimate point resistance is
obtained with the Soviet method Trofimenkov 1974
n1 = 114
- there a re only five methods for evaluation of the ultimate
skin resistance
- all methods with exception of the Soviet norm Trofimenkov
1969 method overestimate the ultimate shaft resistance
- the Norwegian method Senneset 1974 gives the best
correlation for the ultimate shaft resistance =119n 2
- with exception of the Soviet methods the total ultimate
load is on the average overestimated by all methods
1 3
Taking into account the above results the Soviet and
the Norwegi an methods are presented below
The Soviet method JG TrofimenkgtV 1974
1 qP bullA + qsbullA (114a)Qu = Qpu+Qsu fp C p f C s s
where
11 40 DP 12 1 0 D p h+l1 qp r dhqcC l1+l2 h-12
0ct-0ceqs C u middoth s
f(qp) -+ see Fig 1 bull 1 2 fp C
f f ( qcs) -+ see Fig 1 1 3 s
The Norwegian methon K Senneset 1974
1 p A 1 s bullA ( 1 bull 1 bull 4b)-f-middotqcmiddot p + -f-q s p S C
where
11 30 D p
12 50 D p h+l11 f dhqP l1+l 2 qc
C h-12 h s 1
= f dhqc qch 0
f 20 p
f = f (q~ ) + see Fig 114 s
Note a ) The total skin friction -f-middotq~ is assumed to be
no less than 10 kPa even~ith a very little
cone penetrometer resistance
b) The poin t resistance -f-middotq~ is assumed to be
maximum 10 MPa even iJl case of very dense sand
14
It must be underlined that the best correlation for
the pile point is obtained with the Soviet method
101 for 94 driven piles in non-cohesive soil
- 172 114 for 46 bored piles in non-cohesive soil
Trofimenkov 19731974 showed the results of comparison
of the ultimate loads determined by formula (114a)
Q~ and by pile load tests Q~ for 153 driven friction
piles at the 57 various sites see Fig 115
In Germany a lot of investigations were made before
establishing the DIN 4014 part 2 (1977) on large diameter
piles
In Table 113 and 114 the results from these investigashy
tions are generalized
The data in the tables were obtained from 35 test loadings
(4 of which were published by Franke 1973 The diameter
of the piles was from 08 to 25 m the length from 5 m
to 34 m and the cone penetrometer resistance varied from
10 MPa to 15 MPa
Bustamente and Gianeselli 1982 proposed a prediction
of the pile bearing capacity by means of the static
penetrometer Their proposal was based on the intershy
pretation of a series of 197 full scale static loading
tests In this paper the results from tests of 55 bored
piles are chosen The diameter of the piles varies from
042 m to 150 m and the length from 6 m to 44 m The
equivalent cone resistance was determined as showed in
Fig 116 The authors have noticed that the point
resistance factor f depends on the nature of the soil p and its compactness but also on the different pile placeshy
ment techniques (see Tab 115)
Piles of category group I
- Plain bored piles - Cased bored piles
- Mud bored piles - Hollow auger bored piles
- Type I micropiles - Piers (grouted under low - Barrettespressure)
15
In Tab 116 values of the shaft resistance factor
fs are given
Category IA
- Plain bored piles - Mud bored piles
- Hollow auger bored piles - Cast screwed piles
- Type I micropiles - Piers
- Barrettes
Category IB
- Cased bored piles - Driven cast piles (concrete or metal shaft)
Category IIA
- Driven precast piles - Prestressed tubular piles
- Jacked concrete piles
Category IIB
- Driven metal piles - Jacked metal piles
It can be noted that the values in Tab 116 are in
genera l of the same range for the driven and the
bored piles
According to the Polish Specification 1979 the point
and shaft resistance factor are given by
1-f- = kmiddota
p p
where
ap 035 for sand
k coefficent of unhomogeneity k qcp min
qcp
= 0065 for sandfrac12
1
16
Similar results can be observed in Fig 116a and
Fig 116b It was showed by Kerisel (1965) and Franke
(1973) that the harder soil the more loosening at
excavation and thus relatively smaller bearing capacity
Taking into account the Franke diagrams we will have
for D = 125mand settlements= 2 cm p
Cone resistance qc (MPa) 1 5 50 1 0 15 22
qc p for s=2 cm 3 6 8 12 14
(see Fia 1 1 6b )
taking safety factor for pile base F = 3 the point resis~ance
33-10 ~-05
380375 lo 212 bull lo 2114 bull
factors- shy are p
The above anal ysis shows that it is possible to determine
ultimate point and shaft resistance of bored piles from
static cone sounding But it is very important and must
be taken into account type of pile kind of soil and
degree of compaction
Bel ow calculation method for large diameter bored piles
based on the static cone penetrometer resistance (CPT)
is proposed Equation (117) can be used directly for
the base diameter D lt 15 m For larger diameters p shyD gt 15 m the values should be multiplied by the
p ff t ITscoe icen Y~ as pi
( 1 1 5 )
where
qcp = according to equation (117)
D = diameter of the pile base D gt 15 mpi pi
17
This value q~p should be put into equation 116
The value qc s in equation 118 is independent on the
pile diameter
Proposed calculation method
(116)
where)
1 1 40 ~ 11 3 for piles wit h a nd enlarged bases12 10 12 = ~
h+h
q (h) dh (117)qcp l1+l2 f -f- Ch-li p
h 1 f 1
qcs = o -f- qc (h) dh (118)h s
1 -f- = f(q kind of soil ) -+- see Fig 11 7 and Tab 1 1 7
C p
f (q kind of soil ) -+- see Fig 1 1 8 and Tab 1 1 8 fs C
Note
a) the point resistance q for qc gt 20 MPa is assumed cp to be maximum as
- Gravel 70 MPa - Coarse sand medium sand 55 MPa - Fine sand s il ty sand 40 MPa
b ) The shaft resistance qcs for qc gt 20 MPa is assumed to
be maximum as
- Gravel 110 kPa - Coarse sand medium sand 90 kPa - Fine sand s ilty sand 70 kPa
These proposed values are compared with results by
Bustamente (1 982) and the Polish Specification (1978)
Fig 11 9 and F i g 1110 A similar comparison for DIN
4014 1 977 is shown in Fig 1111 and Fig 1112
) In this paper was used the above values 1 1 and l z But it can be used in practice 11 =30 D and h =2Dp respectively The results shall be very simi l ar to the above onPs
18
The proposed method has been examined with field test
results This is shown in Fig 1113 to Fig 1128
and Appendix 1 11 to 1110 and Tab 119
The comparison shows that the value of q in equationcp (117) corresponds to the settlement -10 of the base
diameter (s=010 DP) see Fig 1113 and Tab 119
(average sDp=88 and standard deviation sd=3)
Later in this paper the allowable load and dependence of
the load versus settlement will be determined
12 Determination of bearing capacity of the large
diameter bored piles from results of the Standard
Penetration Tests (SPT)
There are little published on pile tests coupled with
results from Standard Penetration Test (SPT) Among the
authors who have published material in the subject are
- Meyerhof 1956 1976
- Senneset 1974 (Norwegian method)
- Rodin Corbett Sherwood Thorburn 1974 (English method)
- Polish Specification 1975
- Weltman Healy 197 8
- Reese 1978
- Japanese Society 1981
- Decourt 1978 1982
The Norwegian method is valid o nly for concrete andor
wooden piles the English method only for gravel It is
very important to underline that the Norwegian a nd the
English methods use of the SPT resul ts intermediate by
the static cone penetrometer resistance (q ) as well C
Below methods are presented that are using the results of
SPT directly Meyerhof s method in total can also be used
on driven piles in non-cohesive soil Although we could
have found some proposes for bored piles Eqs (121 and
122) see Fig 121 and Fig 1 22 as well
19
Ultimate point resistance (psf)
12 N 3 omiddotH lt 120 N 30
(kPa) (1 2 1)Psf D
where
N30 the average standard penetration resistance
in blows per 03 m
H depth in bearing stratum
Ultimate skin friction tu
for bored piles tu N~ o (kPa) (1 22a)
for driven pil estu 2N30 (kPa) (1 2 2b)
where
N30 the average standard penetration resistance
in blows per 03 m within embedded length
of pile
Weltman and Healy (1978) taking into account Meherhofs
proposition for driven piles have introduced two coefshy
ficents for bored piles in gravels (glacial soil) Equ
123 and Fig 1 23
t = a 2 N30 (kPa ) (1 2 3)U 1
where
ai a 1 for impermeable gravels see Fig 123a
ai a 2 for permeable gravels see Fig 123b
The Polish Specification ( Specification for Design and
Construction of Large Diameter Bored Piles in Bridges
1975 Ministry of Transport) gives the ultimat e point
resistance in dependence of N30 base diameter and depth
see Tab 12 1 The Tab 121 contains values for coarse
and medium sand For other non-cohesive soils the following
coefficients are proposed
p f = S bull p f (medium sand) ( 1 2 4)S 1 S
20
where
S1 1 20 for grave lSi
f 132 080 for fine sand
13 3 070 for silty sand13i
In Fig 124 values of psf are shown for h = 10 m DP
06 m DP= 15 m and h = 20 m DP= 06 m DP 1 5 m
respectively
A few of the instrumented piles were tested and analyzed
by Wright and Reese (1979) The ultimate point and shaft
resistance in the fine and silty sand as a function of
blow count from SPT is shown in Fig 125 Results from
two additional tests reported by Koizumi (1971) are also
introduced in the figure The ultimate point resistance
is assumed to exist at a settlement equal to 5 of the
base diameter
Methods of prediction of the bearing capacity of piles
based exclusively on N30 values were presented by Decourt
1982 Below a proposition for high capacity piles excavated
and cast under bentoni te is presented
The ultimate skin friction is determined by the expression
(see Fig 126)
t = 33 N30 + 1 0 (kPa) ( 1 bull 2 5 ) u
where
N30 average value of N30 along the shaft
- for N30 lt 3 must be taken as = 3N30 - for N3o gt 5 0 must be taken as NJo= 50
The allowable point resistance can be obtained in a n
expedite way as
Psa = 33 N30 (kPa) (1 2 6)
where
N30 = average of Nat point level one metre above
and one metre below
Psa allowable point resistance
21
Decourt proposed a safety factor for the point of F = p
40 Therefore the ultimate point resistance can be
determined by the expression
(kPa) (1 2 7)
In Fig 12 7 and Fig 1 28 the above values for base
and skin friction resistance are compared respectively
Taking into account the type of soil thereis a good
correlation for ultimate point resistance The result for
ultimate skin friction is scattered but only apparently
The values for large diameter bored piles are between
the line 1a and 1b in Fig 128 Large diameter piles
have a high ultimate skin friction in relation to driven
piles (see points for bored piles in Fig 122 and DIN
4014 Part 2 1977 as well) The high values for piles
excavated and cast under bentonite have had a strong base
on the load tests (Decourt 1978 1982 and Wright and
Reese 1979)
Below the proposals are given for determination of the
values of the ultimate point resistance and the ultimate
skin friction Eqs 128 to 1214 and Fig129 1210
The ultimate point resistance
- gravel psf = 140 N30 (kPa) ( 1 bull 2 8)
for N~ 0 gt 50 blows3O cm Psf 7 MPa
- coarse sand and medium sand
(kPa) ( 1 2 9)
for N30 gt 50 blows3O cm Psf 55 MPa
- fine sand and silty sand
psf = 80 Nio (kPa ) (1210)
for N30 gt 50 blows3O cm p f = 40 MPa 5
where N3 o the average of N value near the point level as
22
h+l1
f N3o(h)dh ( 1 2 11 ) h-12
3DP see Fig 1 1 1 D
p
The ultimate skin friction for coarse sand and medium sand
tu = 1 8 N 3 o (kPa) (1212)
t (kPa) (excavated and cast (1213)u under bentonite)
where
N30= the average value of N along the shaft as h
N -
3 o = h1 f N 3 o ( h) dh ( 1 bull 2 bull 1 4 ) 0
The ultimate skin friction for N30 gt 50 blows30 cm is
assumed to be maximum as tu = 90 kPa and t = 150 kPa u
13 Allowable load of large diameter bored piles
The allowable load Qa of large diameter piles has been
expressed as
OuQa ( 1 3 1)Ft
Qa Q(s)=Qb(s) + Os(s) ( 1 3 2)
Opu + Osu (1 3 3)Qa Fp Fs
Qr lt mmiddotQf ( 1 bull 3 4)-
= universal safety factor
individual safety factor for ultimate resistance of the pile point
individual safety factor for ultimate resistance of the pile shaft
= load according to the allowable settlement
calculated load
m coefficient
calculated ultimate bearing load of the pile
23
The equations from (131) to (134) are used as
1) equation (131)
a) DIN 4014 - 1977 Ft= 2 175 15 (depending on the kind of load)
b) Polish Specification 1975 Ft = 18 16 ( -- )
1c) Trofimenkov 1974 Ft = 14307
2) equation (132)
a) DIN 4014-1977 i Q(s) = Qb(s) + Q (s) = A middotp(s) + E tAsmiddott(s)
s p 0
where Qbs) and Qs(s) are described in Fig 1423
3) equation (133)
a) Polish Specification 1974
F 25 22 depending on the kind of load p
F 1 bull 0 s
b) Wright SJ Reese LC 1979
The ultimate capacity or resistance is considered as a
random value and represented by a frequency distribution
The distribution can be described by a mean value and a
variance The distribution of the load applied to the
foundation can be described similarly The coefshy
ficients used to factor resistance and loads are called
partial safety factors Some recommended partial safety
factors for resistance under normal conditions of design
and construction are given in Tab 131 Normal control
is defined as a condition where the coefficient of variation
is less than about 035
Typical values for partial safety factors for loads are
in the range 1 to 2 depending on the type of load and
how it is applied The overall factor of safety Ft can
then be calculated from the equation
Ft = y RbullY S
24
where
YR the par tial sa f ety fac t or for resistance and
Ys the partial safety factor fo r load
The probability of fa i lur e of the foundation can be r eshy
lat ed to the factor of safety for a parti cular degree of
uncert ainty (see Tab 13 2)
c ) Tejchman Gwizdala 1979
The authors discuss adequate safety factors based on fie l d
test s by Spang (1 972) Franke (1976) Touma and Reese (1974)
Colombo (1971) Kerisel and Simons (1962) Appendirno (1973)
see Tab 1 33 Taking into account the universal safety
factor Ft= 2 0 for the tota l load settlement curves it
was estimated
i) F in the range of 111 to 237 with the average value s F = 166 and standard deviation sd = 034 s (see column 16 Tab 133)
ii) Fb in the range of 161 to 945 with the average
value Fb = 387 and standard deviation sd = 2 15
For model core d piles in laboratory conditions values of
Fs = 108 to 154 (average Fs = 132 s~ = 019) and
values of F = 280 to 5 94 (average F = 3 55 sd = 1 07)p p
see Tab 1 3 4
As a conclusion it was assumed that Fb = 40 and F 1 5 s
for l arge diameter bored piles
The investi gation has shown that for the above safety
factors settlements of piles under permissibl e loads are
10 to 20 mm There was assumed a maximum load on large
diameter piles corresponding to a settlement of 010
diameter of the piles
25
d) Bustamente Gianeselli 1 982
e) 0ecourt 1982
The safety factor is given by
F = FgmiddotFfmiddotFamiddotFw where
F 11 - skin friction g F 135 - point bearing capacity
g
Ff safety factor related to the formulation adapted
Ff= 10 for Decourts method
Fd safety factor related to excessive deformation
Fd = 10 for skin friction
As for the point Fa= 2 to 3 depending on the
pile diameter For usual cases 25 is suggested
Fw safety factor related to working load
Decourt recommends 12
Thus we will have
- for skin friction
Fs = 11bull10middot10middot12 132 - 13
- for the point
F = 135bull10bull25middot 1 2 = 405 = 40 p
4) equation (134)
a ) Polish Code 1983
Q lt mbullN r shy
where
total load coefficient (depending on the kind of load For foundation we can assume Yf = 12 )= code load
correction coeffic i ent
09 for pile foundations
m 08 for two piles
m 07 for single pile
26
N ymmiddotQu
ym material (soil) coefficient
ym 08 to 09 (Polish Code 1981)
Thus we will have
QnmiddotYf lt mmiddotym middotQu-
Yf9uFt = On m bull Ym
1 2 max = 2 14Ft 0 7 bull 0 8
1 2min = 1 48Ft 0909
The above analysis has shown different ways to determine
the allowable load The analysis is in direct connection
with mobilization of the load (versus settlement) The
dependence of total load point resistance and shaft reshy
sistance will be discussed in detail in Chapter 14
In the authors opinion taking into account the above
analysis the allowable load should be determined based
on the equation 133 ie based on individual safety
factors for ultimate point and shaft resistance Proposed
values of F and F in literature are shown in Tab 135 s p The average values are Fs = 145 and Fp = 3 38 respectively
Taking into account that the bearing capacity is determined
based on the results from sounding measurements direct from
a place near the piling without a ny indirect correlation
the allowable load of large diameter bored piles is given
by the equation (133a)
( 1 3 3a)
where F = 30 and F 13 are proposedp s
27
14 Determination of settlement of larqe diameter bored
piles based on static cone penetration tests CPT
Determination of ultimate point and skin friction resistance
based on static cone penetration tests has been discussed
in Chapter 11 above Based on the results of this calcushy
lation and on Chapter 13 we can establish an approximate
relation between point resistance shaft resistance and
total load on one hand and settlement on the other However
the approximation gives a wide scatter especially for base
resistance as can be observed in Fig 141 to Fig 144
Only the first part of the point resistance - settlement
curves are in good agreement with measured values It can
be observed in Fig 145 that the average correlation
coefficient n = 098 and standard deviation sd= 029
This way of calculation can be used only for rough calcushy
lation (see Chapter 13)
In Chapter 11 also measured point resistance - settlement
curves were shown The base resistance increases gradually
with increasing pressure and settlement Below the cur7
vature of the point resistance - settl ement curve will be
examined It is assumed that this curve can be described
as a part of the hyperbola curve Thus if the ratio of
the measured settlement (s ) to the point resistance (p)
is plotted against the measured settlement the result
will fall closely to a straight line with the equation
( 1 4 1)
where a 1 and b 1 are constants (see Fig 1 46a and Fig
14 6b)
Then the point resistance - settlement realtionship can be
expressed as a hyperbola
s p = ( 1 bull 4 2)
The constant is the initial s lope of the point resistanceshya 1
settlement curve ie a 1 = t~a The inverse of the constant
28
b 1 is the vertical tangent (asymptote) to the curve 1ie for s = 00
bf= ~ If the ultimate point reshy1
sistance psf is equal to bf (psf=bf) the whole point
resistance settlement curve will be a hyperbola type
Now the Eq 1 4 2 can be written as
s s ( 1 4 3)a) p s or b) p = a+__sect_a1 + 1 Psfbf
If the ultimate point resistance is smaller than bf only
a part of the hyperbola curve ought to be considered
Further the Eq 14 3 will be written as
p ( 1 4 4)
where
poundf_ correction factor for hyperbola point Psf resistance-settlement relationship
Taking into account the discussion in Chapter 11 the
ultimate point resistance psf = qcp based on the CPT measurements
Therefore the relationship between the point resistance
the sett l ement and the CPT result can be expressed as
s p (1 4 5)s
The correction coefficient v 1 will cause a change of the
position of the vertical asymptote bf in r elation to the
ultimate point resistance q bull This means that we take cp into account a different part of the hyperbola curve for
the description of the point resistance-settlement relationshy
ship
Now if we want to use the equation (145) in practice
we must determine the constant and the coefficienta 1 v 1 (assumed that q is determined ear l ier Chapter 11)cp
29
The constant a 1 and t h e coefficient Vi have been detershy
mined based on fi e ld tests according to pi l es No 1 - 20
see Tab 14 1 and Tab 1 1 9 as wel l The values of
a 1 versus the point diameter D and the ul timate pointp
resistance respectively are shown in F i g 147 and Fig
148 Fig 1 47 shows that a 1 is independent of the
point diameter D Based on Fig 148 it can be assumed p
that
28-4bullq (1 4 6)cp
This correlation has been examined with data of the
literature see Fig 1 49 and Appendix 141 to 1 45
(Note there were no static penetration tests and qcp was determined based on a correlation made by Bergdahl
(1982))
A good correlation with equation 146 can be seen taking
into account the safety factor in the DIN 4014 Part 2
(1977) bull
The correction factor v 1 versus the poi nt diameter is shown
in Fig 1410 I t is assumed that the correlation is
V1 = 3 0 - D ( 1 4 7)p
where D is in m p
The above equations ie 146 and 147 were assumed for
a later analyses see Fig 14 11 and Fig 1412 The
piles No 1 to 20 were examined taking into account Eqs
14 5 14 6 and 1 4 7 The result of this cal cul ation is
presented in Fig 1 413 to Fig 1 4 18 and in Tab 1 4 2
respectively In Fig 1413 the calculation way for pile
No 2 is shown as an example
In Fig 1414 to Fig 1 417 measured and calculated
values of the point resistance versus settl ement can be
compared In tota l good correlation exists for all the
30
pressure-settlement curves Values of q from static cp
cone penetration tests and generalized values of anda 1
v 1 were considered Only for piles No 17-20 qcp was
assumed as the point resistance for s = 010 D because p
the static penetration test results were inaccessible
The similar comparison is shown in Fig 1417a for piles
in sand based on experimental results (Tuoma Reese 1972
and Wright Reese 1979) where the ultimate case resistance
was assumed as the resistance at a base settlement of 005
D The relative base resistance is the mobilized base p resistance divided by the ultinate base resistance The
curvature of the proposed point resistance settlement shy
curve to mean value proposed by Wright and Reese is excellent
However the constant a 1 and the coefficient v 1 were
determined for sand only In the future they should be
examined especially for gravel and silty sand based on
field tests Until then in the authors opinion the
values of v 1 can be chosen from Eq 147 for all nonshy
cohesive soils But for a 1 there is proposed
at = gt bulla (1 4 8)1
where
gt- 1 = 080 for gravel
gt 2 120 for silty sand
This proposal is shown in Fig 14 11 as dashed lines
A good correlation can be seen with the investigation by I
Kiosimiddotnski for sandy gravel and on the safety side with
the investigation by Tuoma and Reese for silty sand (see
Fig 149)
In Fig 1418 all calcul ations for pile No 1 to 20 are
summarize d The correlation coefficient n is defined as
the calculated point resistance p(s) divided by measured
point resistance p(s) For totally 126 points from 20
curves an average of n = 098 with standard deviation
31
al= 023 was obtained see Fig 1418 A similar result
can be observed for the range usually assumed of the
allowable settlement for sinqle large diameter bored
piles as
for
- for
- for
s
s
s =
10
20
30
mm a
mm
mm
verage n10 II
II
mm 089
095
099
and sd =
and sd
and sd
031
027
026
It can be questioned whether the sonstant a 1 can be deshy
termined in different ways The constant a 1 is the initial
slope of the point resistance-settlement curve as menshy
tioned above Then we can use all methods for determination
of settlement of a pile point The range of validity of
these methods then must be determined This will be shown
later
In order to be able to design the total load settlement
curve the skin friction resistance-settlement relationshy
ship must be determined The ultimate skin resistance of
large diameter bored piles was determined in Chapter 11
(based on static penetration tests) and in Chapter 12
(based on standard penetration tests)
In the past a lot of field tests have been done on the
mobilization of the shaft resistance versus pile settleshy
ment In this subject there is a rather good agreement
in the whole investigation for cohesive and non-cohesive
soil
Some results and opinions on thispresented in the literashy
ture during the last few years are shown below
Ultimate shaft resistance versus settlement
1) BurlandJB Butler FG Duncan P (1969)
-The shaft l oadsettlement curve is derived using a=0 3
with 90 ultimate load being mobilized at 025 in
settlement(~65 mm)
- soil London clay
- see Fig 1 419
32
2) Touma FT Reese LC (1974)
- The failure of the sides of the shaft takes place
at a downward movement of about 04 in (10 mm)
- soil sand
- see Fig 1420
3) Tomlinson HJ (1977)
- The maximum shaft resistance is mobilized at a
settlement of only 10 mm (or j in)
- soil stiff clay
- see Fig 1421
4) Klosinski B ( 1977)
- It was assumed that skin friction increased proshy
portionally to pile settlement up to the limit value
s bull This value depends on soil conditions and pile0 diameter and is usually from 3 to 8 mm For soft
compressible soil it may be grater than 10 mm
- soil cohesive soils
- see Fig 1422
5) Franke E Garbrecht D (1977)
- At settlement of 2 to 3 cm which are normally
allowed in Germany under working loads for buildings
not very sensitive to differential settlementsthe
skin friction is almost always fully mobilized
- soil sand
6) DIN 4014 part 2 (1977) and Franke E (1981)
- The skin friction Tm is approximated as diameter
independent having failure settlements of smf = 2 cm
in sand and 1 cm in clay
- soil sand and clay
- see Fig 1423
33
7) Reese By L (1978) Reese By L Wright SJ (1979)
(1978) The maximum skin friction being developed at
an average downward movement ranging from about 05shy
2 of the shaft diameter The average of six load tests
reported by Whitaker and Cooke (1966) are a lso plotted
for comparison
- soil stiff clays
- see Fig 1424 and Fig 1425a
(1979) The relative settlement is the average settleshy
ment of the butt and base devided by the shaft diameter
The mean curve maximises at a relative settlement of
about 002 D
- soil sand and clay
- see Fig 1425b
8) Tejchman A Gwizda3a K (1979)
- A clear differentiation of the distribution of shaft
and base resistances is observed for changing settleshy
ment For fairly small settlements the shaft resist shy
ance increases quite fast and the ultimate values
are reached soon while the base resistance increases
gradually with increasing loads and settlements withshy
out clearout ultimate values it can be assumed that
complete mobilization of shaft resistance corresponds
to settlements equal to 001 or 002 diameter of pile
- soil cohesive and non-cohesive soils
- see Tab 131 and Fig 1 426
9) Promboon S Brenner R P (1981)
- Load distribution and load transfer curves disclose
that most of the load is carried by shaft friction
which is developed at small displacements in the order
of 10 mm
- soil Bangkok clay
- see Fig 1427
34
10) Prodinger w Veder Ch (1981)
- The maximum value of skin friction resistance
occurred for a total settlement of 12 mm
- soil silty clay and sand
- see Fig 1428
11) Farr JS Aurora RP (1981)
- Ultimate load transfer was recehed (or nearly reached)
at a relative settlement of about 04 in (10 mm)
- soil gravelly sand
- see Fig 1429
12) Decourt (1982)
The skin friction resistance is totally mobilized
with deformations of about 10 mm or at the most 15
mm regardless of shaft dimensions This observation
of ours seems to clash with the opinions of other
authors who seek to relate the deformation necessary
for full skin friction mobilization with the shaft
diameter
- soil cohesive and non-cohesive soil
In Tab 143 all these results are shown Depending on
the kind of soil the following v a lue s of ultimate settleshy
ment for shaft can be assumed
- averages 142 mm (sd 5 3 mm) for sand
- averages 100 mm (sd = 21 mm) for cohesive soil
averages 726 mm (sd 67 mm) for claysand
It can be observed (see Fig 1419 to 1428) that the
shaft friction resistance increases proportionally to
the pile settlement up to the above limit value and
thereafter becomes constant
35
Taking into account what was mentioned earlier on point
resistance settlement relationship and the above results
a relationship between total load point resistance and
shaft resistance on one hand and settlement on the other
can be made see Fig 1430
It is assumed on the safety side that the following
ultimate settlement (S~) exists for the shaft resistance
of large diameter bored piles
SS1 ) 200 mm for non-cohesive soil u SS2) = 100 mm for cohesive soil u SS3) 15 0 mm for claysandu
In Fig 1 430 the curve Q (s) is calculated based on p
the equation 14 5 or 144
The values of psf in equation 144 can be calculated
based on other methods as well
The total load-settlement relationship is obtained by
summing up point and s haft resistance as
Q (s) = Q (s) + Q (s) (149)s p
for each point
Now the allowable load can be determined from equation
133a and versus the allowabl e settlement as
Q (s) = Q (s) + Q (s) (1410)s p
where s lt Sa
Sa= the allowable settlement of the pile
The analysis allows determination of the approximative
load settlement dependence without calculating the settleshy
ment for non-cohesive soil In Fig 1431 it is shown
36
In Tab 144 the settlement for allowable point reshy
sistance q5P according to equation 133a is shown
as well The average settlements= 198 mm (sd=78 mm)
is obtained This value is similar to the assumed ultimate
settlement of shaft for non-cohesive soil The ultimate
settlement for point resistance is assumed s = 010 Dp as mentioned earlier
37
15 Initial slope of pile point resistance shy
settlement curve
Settlement of piles and pile foundations can be cal culated
based on
- empirical correlations
load-transfer methods using measured relationships
between pile resistance and pile movement at various
points along the pile
- theory of elasticity that employs the equations of
Mindlin for subsurface loading within a semi-infinite
mass
- numerical methods and in particular the finite element
method
- use of in-situ tests (Cone Penetration Test Standard
Penetration Test Pressuremeter Test)
The critical slope of the pile point resistance-settlement
curve is important for calculation in chapter 14 The
constant a1 can be determined from all the above mentioned
methods
Comparison is made to Berggrens and Schmertmanns methods
below (see Berggren 1981 as well)
6sIn Tab 151 (No 1 2 3) the values of a 1 =~p for s =
10 mm and s = 20 mm (measured for large diameter bored
piles No 1 to 24) are compared to the calculated values
according to the modified hyperbola method (see Fig 14 6)
It can be seen that these calculated values are between
s = 1U-2u mm but rather closer the measured values for
the settlements= 10 mm see correlation coefficient n 6
and n 7 in Tab 151 respectively The average correlat i on
coefficent for the settlements= 10 mm is n9 = 108 and
the standard deviation is sct = 014 The comparison to
Berggrens and Schmertmanns methods for s = 20 mm ( see
Berggren 1~81 and Tab 151 as well) shows that the
results based om these methods give too high values of a 1 bull
38
The average values are ne= 143 sd = OJ3 and ng= 137
sd = 037 for Berggrens and Schmertmanns methods
respectively A bit better agreement can be observed
for Schmertmanns method
Taking into account the results in Tab 151 ana Tab
15l it must be assumed that for the determination of
a 1 the pile point contact pressure p(a1) should be
assumed as the ultimate point bearing capacity devided
by about 4
p(ai) - ( 1 bull 5 1 )
Most of the methods for determination of settlement are
based on the theory of elasticity The settlement ot the
pile point can be expressed as the average settlement of
a rigid circular foundation from the equation
11-Dp 1-v 2
s = p -4- -E-bull microd (1 ~ 2 J
where
p pile point contact pressure
E Youngs modulus
D diameter ot pile pointp ) = Poissons ratio
microd = depth factor
The range of validity of the pile point contact pressure
was determined in equation 151 Youngs modulus has an
important meaning lt can be determined from triaxial
tests or oedometer tests The relationship between the
constrained (oedometric) modulus Mo and Young s modulus
Eis dependent on Poissons ratio v as expressed by the
equation
E = l 1 + V ) ( 1 - 2 V ) Mo ( 1 bull 1 bull 1)- 1-v
39
TaKing into account the analyses made ny Chaplin (19b1a
1 961bJ Janbu (1 963 1970 1973J Andreassen (1973)
Duncan and Cheng (1970) Tejchman anct Gwizdala (1979)
Gwizdala (1978) Franke (1981) Berggren (1981) Withiam
and Kulhawy (7981) and the present investigation the
calculation of settlement is proposed to be
s = 24 bull p bull ~ D bull 1-v 2 bull micro d (154)Do o E
where s (r1)
p (kPa)
Dp (m)
E (kPa)
D0 =10 m
micro = 05 + 01 vfrac34E (1 5 5)d vs
but 05 lt microd lt 10-tip= p - (J (ovs see Fig 151)vs
E =Et= Kbullpat (Oo )n [1- Rf(1-sinltj) 101 - 03 ) 12 (1 5 6)2 c cosltP + 2o 3 sinltP 1Pat
in which K n and Rf= hyperbolic stress-strain parameters
Pa= atmosferic pressure ando 1 o 3 and o0 are determined by
averaging the concrete and soil vertical and radial stresses
near the pile point according to Fig 151 Then the
stresses at the pile point level are h
(J vs = L
0 Yi h
l vertical stress in the soil
0 hs Ko h
0 vs radial (horizontal) stress in the soil
0 vc L ye h -l
vertical stress in the concrete 0
0 hc K oc a vc radial (horizontal)
concrete stress in the
40
K at rest soil lateral stress coefficient 0
K c lateral stress coefficient for fluid fresh concrete0
K 1 0 oc
and average values
a 05(a +a)V vc vs
1 1 - shy~ = -(a +a+a I = -3 (av+2ahJ the applied mean normal stress0 j Z X y
Assuming this model calculation results for piles No 1-24
(see Tab 11~ as well) are shown in Tab 153
The piles are embedded mainly in medium sand to fine sand
For this kind of soil it can be assumed (soil parameters
from field or laboratory tests were inaccessible)
~ = 35deg c = 0 R~ = 09 n 05 v = 025 K c 10l 0
K = 04 Pat= 1UO kPa ye 24 kNrn 3 y = 14 kNm 3 bull0 C
Moreover in Tab 153 the following symbols are used
p(a1 ) - pile point contact pressure according to equation
1 bull 5 1
s(a1) - settl ement of pi l e point according to equation
143 and Tab 141
pound TT ( 2E = s bull Dp bull i 1-v ) according to equa~ion 152t
E~ Et bull microltl
EI
K = ro~ - according to equation 1 bull 5 6 p bullO middotA2
a~ o
E = E voD middot D middot ~4 ( 1 - v 2 ) according to equationt S p O 0
1 5 4
Et= E microd
K = according to equation 156 V PatmiddotaomiddotA2
41
The calculation results of Youngs modulus E = Et and
dimensionless canpressionrro1ulus for piles to 1-24 are shown
in Fig 152 to 155 using equation 152 and 15b
or equation 1~4 and 156 respectively lt can be obshy
served that the scatter in Fig 153 and Fig 155
where the influence of tne pile diameter is reduced
compare equation 154 is less than in the other figures
The reduced influence was made after observations from
field and laboratory tests while the equation 152 is
taken direct from theory of elasticity These values of
E and K are in good correlation with published values in
literature The values of Youngs modulus versus the
relative density of soil are compared to literature values
see Fig 15b Based on the analysis in this chapter it
can be assumed that
E = 9-ql 3 ( 1 bull 5 7)cp
where qcp is in accordance with equation 117
The calculation results based on this proposal are incluced
in Tab 1 5 3
The c a lculate d s e ttlements based on e q ua tion 154 and
157 are shown in column 23 and the values of the
correlation coef f icie nt (n= Seal ) in column 24 respectshyimeas
ively
The dimensionless canpression modulus can be d e termined as
K = 15Ubullq (qcp in MPa) (1 5 8)cp
see column 25 Tab 153
The calculation results based on the K compression modulus
according to equation 158 156 and 1 5 4 are shown in
columns 25 26 2 7 28 and 29 in Tab 153
42
For comparison and for determination of the range of
validity of this method the caLculation results of
pile point pressure for settlements s = 10 mm s = 20 mm
s = 30 mm (see Tab 141) according to equation 157
and 154 are shown in columns 30 to 35
The results obtained in Tab 153 confirm the possibility
to use the proposed method to calculate the initial part
of the pile point resistance settlement curve of large
diameter bored piles in non-cohesive soil and the initial
slope of this curve as well
A simple model has been proposed based on the theory of
elasticity ana the tangent modulus defined by Janbu (1963)
and Duncan amp Chang (1970)
A new approach according to the pile diameter depth factor
and principal stress is proposed
The settlement of the pile point can be made up to a point
pressure according to equation 151 on up to a settlement
of about s ~ 20 mm (30 mm)
-- The application of v Op in equation 1 5 4 a llows us ing
Youngs modulus as independent of the pile diameter
opposed to Bazants a nd Mosopusts (1981) proposal where
Youngs modulus wa s determined versus the pile diameter
The equation 1 5 6 takes into account the dependence of
Youngs modulus on depth (or overburden pressure) as
well
In the method field test (Cone Penetration Test) or
laboratory tests (hyperbolic stress-strain parameters
can be used
Comparison of the method to 24 availa ble load test r e sults
or large diameter bored piles in sand shows good a greement
to calculated and measured values
43
REFERE~CES
Adamczyk J (1978) Okreslanie udzwigu pali wierconych
za pomoca sondy statycznej (Bearing capacity of bored
piles based on the static sounding) Inz i Bud No 7
pp 253-257
Andreasson L (1973) The compressibility of cohesionless
soils Thesis Chalmers University of Technology
G6teborg (in Swedish)
Appendino M (1973) Comportamento di un palo di grande
diametro strumentato Rivista Italiano di Geotechnica
No 3 pp 115-118
Butterfield R Banerjee P (1971) A rigid disc embedded
in an elastic half space Geotechnical Engineering
Vol 2 pp 35-49
Bozant z Mosopust J (1981) Drilled pier design based
on load settlement curve X ICSMFE Stockholm Vol 2
pp 615-619
Begemann HK (1982) Cone penetration tests pile bearing
capacity and the thesis of Rollberg Proc of the Second
European Symposium on Penetration Testing Amsterdam
pp 433-438
Berggren B (1981) Bored piles on non-cohesive soils shy
settlement and bearing capacity (in Sweden) Thesis
Department of Geotechnical Engineering Chalmers
University of Technology G6teborg
Bergdahl UB (1979 1982) Sonderingen und in situ Messungen
Wien 18-19 Juni 1979 - Private information 19821983
Bustamante M Giane selli L(1982) Pile bearing capacity
prediction by means of static penetrometer CPT Proc
of the Second Europ Symp on PenTest Amsterdam
Vol 2 pp 493-500
Chaplin TK (1961a) An experimental study of the settleshy
ment of footings in sand PhD Thesis Univ of
Birmingham
44
Chaplin TK (1961b) Compressibility of sands and settleshy
ments of model footings and piles in sand 5th Int
Conf on Soil Mech a Found Engng Vol 2 p 33 Paris
Colombo P (1971) Observazoni sul comportamento ltli pali
a grande diametro Rivista Italiana di Geotechnika
No 3 pp 163-172
Dahlberg R (1975) Settlement characteristics of preconshy
solidated natural sands Swedish Council for Building
Research D11975
De Beer EE (1964) Some considerations concerning the
point bearing capacity of piles Proc Syrop Bearing
Capacity of Piles Boorkee I pp 178-204
Decourt L Quaresma AR (1978) Capacidade de Carga de
Carga de Estacas a partir de Valores de SPT VI Conshy
gresso Brasilerio de Mecanica dos Solos e Engenharia
de Fundacoes - Rio de Janerio - ABNS
Decourt L (1982) Prediction of the bearing capacity of
piles based exclusively on N values of the SPT Proc
of the Second Europ Syrop on Penetration Testing
Amsterdam Vol 1 pp 29-34
Duncan MJ Chang CV (1970) Non-linear analysis of stress
and strain in soils Journal Soil Mech Found Div Vol
96 SM5 pp 1629-1651
Durgunoglu HT (1979) Effect of foundation embedment on
stress and deformation distributions Third Int Conf
on Num Meth in Geomechanics Aachen pp 925-928
Farr JS Aurora RP (1981) Behaviour of an instrumented
pier in gravelly sand Proc of a session Drived Piers
and Caissons sponsored by the Geotech Eng Div of the
ASCE Nat Convention St Louis Missouri pp 53-65
Franke E (1981) Point pressure versus length and diameter
of piles X ICSMFE Stockholm Vol 2 pp 717-722
45
Gregersen os Aas G and Dibiagio E (1973) Load tests
on friction piles in loose sand Proc of the Eigth
International Conference on Soil Mech Moscow USSR
Vol 21 pp 109-117
Gwizda1a K (1978) Behaviour of large diameter bored piles
in non-cohesive soil (in Polish) Archiwum Hydrotechniki
Vol XXV No 2 pp 183-217 (English summary)
Huizinga TK (1951) Application of Results of Deep
Penetration Tests to Foundation Piles Building Research
Congress Vol 1 p 173
Janbu N (1963) Soil compressibility as determined by
oedometer and triaxial tests Proc Europ Conf Soil
Mech and Found Eng Vol 1 p 19 Vol 2 (Discussion)
p 17 Wiesbaden
Janbu N (1970) Grunlung i geoteknikk Tapir Forlag NTH
Trondheim
Janbu N Bjerrum L Kjaernsli B (1973) Soil Mechanics
applied to some engineering problems Norw Inst Publ
No 16 Oslo
Japanese Society SMFE (1981) Present state and future trend
of penetration testing in Japan Separate report at
X ICSMFE Stockholm
Kjekstad O Lunne T (1979) Soil parameters used for design
of gravity platforms in the north sea Second Int Conf
on Behaviour of Off-shore structures London Vol 1
pp 175-192
Klosinski B (1977) Bearing capacity of large diameter bored
piles IX ICSMFE Tokyo Vol 1 pp 609-612
Laboratory for soil mechanics Delft (1936) The predetershy
mination of the required and the prediction of the
resistance of piles Proc 1 Int Conf on Soil Mech
and Found Engng Cambridge (Mass) I p 181
46
Matich M and Stermac A (1971) Settlement performance of
the Burlington Bay Skyway Canadian Geotechnical Journal
Val 8 pp 252-271
Mccammon NR and Golder HQ (1970) Some loading tests
on long pipe piles Geotechnique London England
Val 20 pp 171-184
Meigh AC (1971) Some driving and loading tests on piles
in gravel and chalk Proc of the conference on beshy
haviour of piles London England pp 9-16
Mitchell JK Gardner WS (1976) In situ measurement
of volume change characteristics American Society of
Civil Engineers Specialty Conference on In-situ
Measurements of Soil Properties Raleigh 1975 Proc
Val II pp 279-345
Mezenbach E (1961) The determination of the permissible
pointload of piles by means of static penetration tests
Proc 5 Int Conf on Soil Mech and Found Engng
Paris II pp 99-104
Meyerhof CG (1956) Penetration tests and bearing capacity
of cohesionless soils Proc Amer Society of Civ Engng
SM 1 Pap 866 pp 1-19
Meyherhof GG (1 976) Bearing capacity and settlement of
pile foundations Proc Amer Society of Civ Engng
Journal Geotechnical Engineering Division Val 102
No GT3 pp 197-227
Mohan D Jain GS and Kumar V (196 3 ) Load bearing capacity
of piles Geotechn Val XIII pp 76-86
Nixon I (1982) Standard penetration test State of the
art report Proc of the Second Europ Symp on Pen
Test Amsterdam Val 1 pp 3-20
47
Nunes A Vargas M (1953) Computed bearing capacity of
piles in residual soil compared with laboratory and
load tests Proc of the Third International Conference
on Soil Mechanics Zlirich Switzerland Vol 2 pp 75-79
Nordal S Grande L Janbu N (1982) Prediction of offshy
shore pile behaviour The Norwegian Institute of
Technology Trondheim
Ohde J (1939) Zur Theorie der Druckverteilung im Baugrund
Der Bauingenieur Vol 20 No 3334 p 451
Parroth E (1972) Einfache Formel zur Vorausbestimmung der
Tragfahigkeit von Standpfahlen mit Hilfe der Sande
Bautechn 9 pp 312-314
Poulos HG Davis EH (1980) Pile foundation analysis
and design New York - J Wiley and sons
Prodinger W Veder Ch (1981) Bearing capacity of floating
groups of diaphragm walls Proc X ICSMFE Stockholm
Vol 2 pp 809-814
Promboon S Brenner R (1981) Large diameter bored piles
in Bangkok Clay Proc X ICSMFE Stockholm Vol 2 pp
815-818
Reese L (1978) Design and construction of drilled shafts
ASCE JSMFD Vol 104 No OT1 pp 95-116
Rodin s Corbett BO et al (1974) Penetration testing in
United Kingdom state-of-the-art-report Proc Europ
Symp on Penetration Testing 1 Stockholm pp 139-146
Rollberg D (1976) Bestimmung des verhaltens von Pfahlen
aus sandier und rammengebnissen Heft 4 FBG Technische
Hochschule Aachen
Rollberg D (1977) Determination of the bearing capacity
and pile driving resistance of piles using soundings
Publications of the Institute for Found Eng Soil Mech
Rock Mech and Water Ways Construction Aachen Vol 3
48
Schmertmann J (1970) Static cone to compute static
settlement over sand Journal of the Soil Mech and
Found Division ASCE SM3 pp 1011-1043
Schmertmann J Hartman JP Brown PR (1978) Improved
strain influence factor diagrams Journal of the Soil
Mech and Found Division ASCE GT8 pp 1131-1135
Shibata T Hijikuro K and Fominerga M (1973) Settlement
of a blast furnace foundation Proc of the Eighth Int
Conf on Soil Mech Moscow USSR Vol 13 pp 239-242
Spang J (1972) Die Bestimmung der Tragfahigkeit von Grossshy
borhpfahlen (I) Strassen und Tiefbau No 2 pp 339-355
Senneset K (1974) Penetration testing in Norway State-ofshy
the-art-report Proc Europ Symp on Penetration Testing
Stockholm I pp 85-95
Tejchman A Gwizdala K (1979) Analysis of safety factors
of bearing capacity for large diameter piles Proc VII
ECSMFE Brighton Vol 1 pp 293-296
Thorburn s and Mac Vicar R (1971) Pile load tests to
f a ilure in the clyde alluvium Proc of the conference
on behaviour of pile s London England pp 1-7
Trof imenkov JG (1969) Accuracy of determining the bearing
capacity of piles based on results of static penetration
sounding of soils Osnovaniya Fundamenty i Mekhanika
Gruntov 4 (Translation Soil Mechanics and Foundation
Engineering 4 p 248)
Trofimenkov JG (1974) Penetration testing in USSR Stateshy
of-the-art report Proc Europ Symp on Penetration
Testing Stockholm I pp 147-154
Tuoma F and Reese L (1974) Behaviour of bored piles in
sand JSMFD ASCE Vol 100 No GT 7 Proc Paper 10651
July pp 749-761
49
Van der Veen C (1953) The bearing capacity of a pile
Proc 3 Int Conf on Soil Mech and Found Engng
Zlirich II pp 84-90
Van der Veen C and Boersma L (1957) The bearing capacity
of a pile predetermined by a cone penetration test
Proc 4 Int Conf on Soil Mech and Found Engng
London II pp 72-75
Weltrnan AJ Healy PR (1978) Piling in boulder clay
and other glacial tills Construction Industry Research
and Information Association UK-Report PG 5
Withiam J Kulhawy F (1981) Analysis prodecure for
drilled shaft uplift capacity Proc of a session
Drilled piers and caissons ASCE St Louis Missouri
pp 82-97
Woodward R Lundgren R Boitano J (1961) Pile loading
tests in stiff clays Proc of the Fifth International
Conference on Soil Mechanics Paris France Vol 2
pp 177-184
Wright SJ Reese LC (1979) Design of large diameter
bored piles Ground Engineering Vol 12 No 8 pp
17-22
DIN 4014 Cods Teil 2 (1977) Bohrpfahle Grossbohrpfahle
Herstellung Bemessung und zulassige Belastung
Polish Specification (1975) Specification for design and
construction of large diameter bored piles in bridges
Ministry of Transport Warsaw (in Polish)
Polish Specification (1979) Specification for prevision
bearing capacity of the piles on the presiometer test
and static sounding ENERGOPOL Warsaw (In Polish)
Polish Code (1983) Foundations Bearing capacity of piles
and pile foundations
5 1
FIGURES
bull bull
53
Ou
+ sect raquo iir 1
4 + D
h + +Osu
bull + t2 =n- Dp
LDpl r f 1
Opu
Fig 1 1 1 Bearing pi le in the soil
J_
fp
080
070
060
050
0 40
030
020
010
q~ [MPa ]000 -+--~-~-~-~------------------------=-shy
00 20 4fJ 60 80 10 0 120 14fJ 160 180 200
Fig 1 1 2 The point resistance factor fp
(Trofimenkov 1974)
54
ts
160
140
120
100
080
060
040
020
q~5 [ kPa)
0Q0--1------~-~-~-~-~-~ - - ---=- -- shy000 10 20 30 40 50 60 70 80 90 100
Fig 1 1 3 The shaft resistance factor fs middot (TYofimenkov 1974)
f s
200
180
160
140
120
100 2 3 4 5 6 7 8 9
Fig 1 1 4 Shaft friction factor f depenshys
ding of the soil density (Senneset 1974)
55
Q~ [kN]
1500
1000
500
0-r-----------r----~- Q~ [kN] 0 500 1000 1500
Fig 1 1 5 Comparison of the pile resisshytance determined by the results of static sounding and load tests (TYofimenkov 1974)
D f f
0
Fig 1 16 Equivalent cone resisshytance (Bustamante 1982)
56
E u shy0 ~
QI I ltII ltII
~ a C QI
O C
D
w gt
0
Cone res istance Point resistance
80 160 240 320
05
10
15
e d
20
ver y dense Cone resistance 300 kgcm2
Dpcm
a =45 b = 30 C 60 d = 100 e = 150
Fig 1 16a
Cone resistance _ qc
80 160 80 160 qc [ k g cm2 ]p
05
10 10
15 15 e d a
e d20
Dense Medium2 2200 kgcm 100 kgcm
Cone resistance and point resistance of piles versus overburden pressure (Kerisel 1965)
Point resi stance - p(for s=2cm) of the pi le for
15 sett Iement s = 2 cm
10
5
E u
uJ1 o-~----shya er O 804 2500
32 56
I 1
L oose50 -I =25 Very loose L
----~--shy5000 7500 80 98
~-----lmiddotI1--------2 10000 12500 31400 =Flcn)
112 123 200 =Dplcm)
Fig 1 1 6b Point resistance versus cone resistance and pile diameter (Franke 193)
57
1
fp
080 (D Gravel
0 Coarse sand Medium sand 070
reg Fine sond Silty sand
060
050
040
030
020
010
qc [MPa]000-+----r--~-~-~--------r----r----r-~-~-- -shy
oo 20 40 60 80 100 120 140 160 180 200
Fig 1 1 7 Point resistance factor f (proposal) p
58
300
250
200
150
100
qc [MPa I50-+---------------r---r---r---r----r------------- shy
oo 20 40 60 80 100 120 140 160 180 200
Fig 1 1 8 Shaft resistance factor fs (pr oposal)
59
Bustamante (seetab 115 I
l fp
G)
0 Gravel
Coarse sand Medium sand
cl
b)
t-----l
1----1
080 reg Fine sand Silty sand a) D
070 Polish
060 Specification
( 1979) 050
040
030 CD 020 0
reg 010
qc [MPa]0 00 -+-------------------------------------=--shy
oo 20 4o 5o 80 100 120 14o 15o 180 200
Fig 1 19 Point resistance factor f comparisonp
Bustamente ( see tab 116 I 300
a) ~
250 b)~
cl~
200 Polish Specification ( 1979 l
150
100
q [ MPa]504---~--~--~----- ---___
00 20 40 60 80 100 120 140 150 180 200
Fig 1 1 10 Shaft resistance factor fs comparison
60
1 fp
~
080 CD CD Gravel
070 0 reg Coarse sand Medium sand
060 0 Q) Fine sand Silty sand
05
040 Franke (1973)___
030 DIN 4014
020 Part 2 1977
( see tab113 l 0shy
--shy --a - 010 C---0 Piles without enlarged bases
D---0 Piles with enlarged bases qc [MPa ] 000
00 20 4JJ 60 80 90 100 120 140 160 200
Fig 11 11 Point resistance factor f comparison p
fs
DIN 4014 Part 2 1977 ( see tab 114 l
300
~ 5 lt qc lt 10 MPa 50
~ 10 lt qclt 15 MPa
~qcgt15MPa
200
150
CD
100 0 0
qc [ 1Pa] 50-t-----T-~----T-r-~----------------shy
OO 20 40 6JJ 80 100 120 14JJ 160 180 200
Fig 1 1 12 Shaft resistance factor fs comparison
61
Measured p [ MPa]
( s=010 Dp) 10
9
8
7
6
5 0
4 0 61
3
I 2
Calculated qcp [MPa]
0 0 2 3 4 5 6 7 8 9 10
Fig 1 1 13 Comparison of experimental and aomputed values of the pile point resistanae
62
Contact pressure ( MPa ]
2 I 6
50
100
E E 150 Ill
c QI
E Sett lement for QI
calculated qcpai V) 200
Fig 1114 Results from load tests on piles No 1 and 5
Contact pressure [ MPa I 0 2 I 6
01---------------------1
50
E E 100 Ill
Settlement forc QI calculated qcp E ~ ai
I V) 150
Fig 1 1 15 Results from load test on piles No 7 and 5
63
Contact pressure p [ MPa] 0 2 3 4 6
0-t=-----~-~-----
E E
100 1)
c CU E 2 QI V) 150
Fig 1 1 16 Results from load test on piles No 9 10 and 11
Contact pressured p [MPa] 0 1 2 3 4 5
o~~~=------------___-~-shy
50
100
E E
i 150
CU E CU
-a V) 200 2
Fig 1 1 17 Results from load test on piles No 12 and 13
c
-------------- -
64
Contact pressured
0 1 2 3 4 p [ MPo] ~o __L____1_____J_____L___
50
100
150
E
E
IJ) 200
c a
E a
~ 250
Fig 1 1 18 Results f Pom load tests on piles No 2 4 6 and 8
p [MPa]
60
50
tO
30
~
Pile Pile Pile Pile
Pile No18
------+ Pile No17 + ~_ ---0 Pile No 19
bullbull - --bull Pile No 20
- ~middot -shy-shy -(y I Settlement for
20 tO 60
No17 +-middotmiddot- V 70 No 18 bull--- V 9o No19-middot- V 120 No20bull---- V150
qcp 3
80 100 120 140 160 s (mm)
Bose resistance
Fig 1 1 lBa Point Pesistance vePsus settlement (Spang 1972J
65 Cone resistance qc [ MPa]
0 10 20 30
mud
5 ~ lll
0 c 0
c CD
peat
10 sand
Ill N
10=10
D=lOOOmm
1540=40
20__________________
[ml
Fig 1 119 Pile No 1 and results from static cone penetration test
Cone resistance qc [MPa l 0 10 20 30
7N V degW = 0+--------------------i
mud
5
lll
~ C 0
c peat~
10
sand lll N 1D15
15l lD=1500mm
40=60
20l---------=-------__J
[ml
Fig 1 1 20 Pile No 3 and results from static cone penetration test
66 Cone resistance qc [MPa]
10 20 II 3 igt pound ~
mud+peat
fine sand+ silt
50=11
l lo-11oomm
40= 44
10
15l____________c
[ml
Fig 1 1 21 Pile No 5 and results from static cone penetration test
Section Cone resistance Pile
0 0
5 10 15 20 25 30 qc [MPa] -----~-~shy~
Silt
[7r_ ___~ Medium Sand_~-----l
0 ltD
+shy4
0=11
9=
Fine sand + Silt t
30p=
middotmiddotmiddotmiddotmiddotmiddotmiddotmiddot1~11+-----E-----
[ml
Fig 1 1 22 Pile No 6 and results from static cone penetration test
Cone resistance qcmiddot 1MPuJ
0 10 20 30 67 01-+-------l--------------i
mud+ peat
fine sand
l1)
N
40=60
15L_____________
[ml Fig 1 1 23 PiZe No 7 and resuZts from static
cone penetr ation test
Section Cone resistance Pi le
0 5 10 15 20 25 30 qc [MPa 1 --~----Y-~-----~
Silt
Fine sand
Medium Sand Bentonite2----1~i
t 3
4
0
0=15
Fine iii ~~= 5
sand t ltD
6 +
Silt 7
3Dp=
63 g
10
11
12
13+------=~---l
[ml
Fig 1 1 24 PiZe No 8 and resuZts f rom static cone penetration test
68
I =3
Cone resistance qc [MPa]
0 10 20 30
C 0 C Cl
(I)
Said
Peat
Sand
l 0=110
D = 11
4 D = 44
Fig 1 125 Pile No 9 and results form static cone penetration test
69
Cone resistance qc[MPa)
0 10 20 30 I ~ II JE Ill= II=E IS
Fine sand QI
U) I
[- I C 0 + C Peat QI
CD
Fine sand 0
Ci D = 1 1
L l D= 110
4D= 4 4
Fig 1 1 25 Pile No 10 and results f rom static cone penetr ation test
70
Cone resistance 9c[MPa]
0 10 20 30
Sand
C 0 Mud peat
+shyc 5 ltII
co
Sand Op= 11
u 10 D= 110 4Dp=44
Fig 1 1 26 Pile No 11 and results foIm static cone penetration test
71
00 a_ N ~
middotu rr QI 0 u ~ C 0
QI ui C iij 0 QI U - 0
0 EN
d 2
Sll 1lOl
C
u (rr
C 0 u~
0
QI - C middot 0 C
U - O 0 EN
~ 0 2
E
ltD a---==-lr---___--~---6-l_-0_012 ~ Lr- - --1---------J J
S9l ls= apound QI -0 gtcc _gmiddot- 0 1) ui I
Fi g 1 1 2 Piles No 14 and 15 and results f r om stat i c cone penetr ation tests
72
Contact pressure p [ MPa] 2 4 6
01lt---------------~
50
E E
111 100 ~ (qcp=30 MPa for No16
~ iqcp =49 MPa for No14
~ 1so~--~~- _ _ __
I _ _
11 I lf--q = 32 MPa for No15
cp
Fig 1 1 28 Results f r om load tests on piles No 14 15 and 16
73
0300--------------~---~--~--shyE
Driven piles in ~ 0 bull Gravel
amp250 bull Sand L QJ X Silt a 1l o Bored piles in
sand -sect 200 0=-- shyC ~ ~ 10 unless ~~ middot D shown 1
ii O
~ ~ o 3 a 1501-----+-------I- --+---laquo-+-- -+------lt
~ sect 5 - 6 6middot 100t----+----+-----_-1---4--__co_--J~__j
-_
~ 0 t7
C
a 50 2 shyg ~ gt
0 20 30 40 50 60
Standard penetration resistanceN in blows per foot
(N 30
Fig 12 1 Emperical relation between ultimate point resistance of piles and standard penetrashytion test in cohesionless soil (Meyerhof 1976)
14 r-------------------r-------b-----q
References and symbols given in Fig121
121-----+---+----+----+------ll------j
- _sect ~ 10t----+----+-_--1-----+---lt~--~H---- 0 lt-~5- _-)0 I() l- I Q---+-----I[08 ~
H -(l () ltj-~C X bulls pound 061------lt----+-----i~- --+-- shy
- bull
-gt Q1pound--I---L---L---L---L--~ 0 10 20 30 40 50 60
Mean standard penetration resistance N in blows per foot ( N30 l
Fig 122 Empirical relation between ultimate skin friction of piles and standard penetration resistance in cohesionless soil (Meyerhof 1976)
74
a) b)0(1 0lt2
10 10
05 05
1 N30OD-+---------__ OD--t-----r-----r----------------ll--Nbull30~ 10 20 30 10 20 30 40 50
Fig 1 2 3 Reduction coefficient a) for impermeable gravels b) form permeablr gravels (Weltman and Healy 1978)
psf [MPo)
Fig 1 2 4 Relation between ultimate point resistance and SPT in cohesionless soil (Polish specification 1975)
75
30 35 40 45 Loo Med Dense Ver dense
50
40
~ E
l)
g 8 1)
middotu
1 ~
QI- bull Touma ~ bull Koizumi
(183)-depth base middotameter5
20 40 60 00 100 N30
30 35 40 45
OG2(294) bull G1 (183)
300 bull us 59 ( 102) bull 88(180)
bull 075 a GT (467)
150
~ 200-+--------+-- t--- --t-----i 130i 0 094 081
014 _- --- -- shy~ E 066bull bull 063 Note -~ ~m~r~s~ ~ 1001---1-r--t---1point is xh QI Ratio ~ Number in ( ) middotn key is h c Ratio s ~
0 20 40 60 00 100
~ig 1 2 5 Ultimate point and shaft resistance versus N30
(Wr ight and Reese 1979)
-----
76
tu Psa
[kPa] [MPa]
200 tu
------ shy150 Psa
1 1
1100 10 1 1
1 50
0+----------T----~---~-N-3J~shy0 20 40 60 80
Relation between ultimate skin friction and SPT (Decourt 1982)
Fig 1 2 6
Psa
[MPa]
8
0----Meyerhof 1976) 0 7
--- - --~ - copy Polish Specifcoti on 1975)6 ~-
~
reg- middot - Reese (1978) middot 5
f41- -- Decourt (1982) -I bull 4 2
----==---______z__ h25m Dp=12m
3 ---shybull
2 7
--shy ----shy~----shy0-t----i----------r-- ----------------------N3l~shy
0 10 20 30 40 so 60 70
Fig 1 2 7 Relation between ultimate point re~istance of large diameter piles and standard peneshytration test (SPT) in cohesionless soil
------
77
tu [kPa)
200 17 Cast under -J bentonite
~----Meyerhof (1976) ~copy -=middotmiddotmiddotmiddot== middotmiddot150 ~------- Wei tman (1978 ) middot Healy middotmiddot ___ Japanese ) 119810 Society
(0 -middotmiddot- Decourt (1982)middot Wright
100
- -middotmiddot -- 11979]reg Reesemiddot Bored piles
~shy50 1 -- shy
-- shy middotmiddot s-shy - --~ ------reg~~ ---~E_==---- ------- shy
N_ ---shy0-+--C--------------r---- ---------~---~-~shyo 10 20 30 40 50 60 70
Fig 12 8 Relation between ultimate skin friction of piles and standard penetration test (SPT)
78
Pst [MPa]
8
7 ---------ist=7MPa
6
5
4
3
2
I N30o~------------------------------+---------__=-shyo 10 20 30 40 50 60 70
Fig 12 9 Relation between ultimate point resistance of large diamter piles and standard peneshytration test (SPT) in cohesionless soil (proposal)
tu [MPa ]
( excavanted and cast
150 under bentonite ) tu=150 kPa
100 tu=90 kPa
I I
50 I I I I I N30
10 20 30 40 50 60 70
Fig 1 2 10 Relation between ultimate skin friction of large diameter piles and standard penetrashytion test (SPT) in sand (proposal)
79
2 3 4 5 p[MPa] 0 2 3 4 5 p[MPa]0
40 40 Cl
80 c 80
c 120 120
Pile No 1 PileNo216 160
200 2
s s c [mm] (mm]
0 2 3 4 5 p[MPa] 0 2 3 4 5 p [MPa]
40 40
00 80
120 120
16 160 Pile No 3 Pile No 4
200 200
s s [mm] (mm]
0 2 3 4 5 p[MPa] 0 2 3 4 5 p [MAJ]
tgt11 tgt- measured40 40
80 80
120 120
Pile No 5 Pile No 6 160 160
20 200 s s
[mm) [mm)
Fig 1 4 1 Base resistance vs settlement appoximative method piZe No 1- 6
80
0 2 3 6 5 p[MPa) 0 2 3 4 5 p[MPa]
40 40
80 80 6
120 120 6
6160 160
Pi le No 7 Pile No 8 6
200 3J s s
[mm] (mm]
0 2 3 4 5 4 p [ MPo)
6 6 40
6 6
6 80
6 6
6
Pi le No 9 Pile No 10
XJO s s
[mm] [mm]
0 2 3 4 5 p[MPa] 0 2 3 4 5 p [MPa)
6 6
40 40 6 6
6
00 80 6
6
12 1Xl 6
160 Pile No 11 160 Pile No 12
200 200 s s
[mm ] [mm]
Fig 1 4 2 Base resistance vs settlement approximative method pile No - 12
81
0 2 3 4 5 p[MPa] 0 2 3 4 5 p [MPa]
6 6
40 6 40 6
6
80 6 80 6
120 6 120
Pile No 13 Pile No 141fO 160
200 200 s s
[mm] [mm]
0 2 3 4 5 p [MPa) 0 2 3 4 5 p [MPa)
40 40
80 80
120 120
HiO 160
200 200Pile No 15 Pile No 16
s s (mm) [rrrn 1
0 2 3 4 5 p[MPa] 0 2 3 4 5 p[MPa)
40 40 A A A-measured
680 80 t t
120 c 120 c
1fil Pi le No 17 160 Pile No 18
200 200 s s
[mm] [mm]
Fig 1 4 3 Base r esistance vs settlement approximative method pile No 13- 18
82
0 2 3 4 5 p[MPal 0 2 3 4 5 p (MPa]
D D40 40 c c
80 c 80 c
120 120
160 160
Pile No 19 Pile No 20 200 200
~ml (mm]
Fig 1 4 4 Base resistance vs settlement approximative method pile No 19- 20
LlJ QI
0 average lJ = 098 E sd = 029 C
6 SY = 030
4
2
lJ calculated ________________________ _______ measu red
06 08 10 12 14 16
Fig 1 4 5 Calculated pressure divided by the measured pressure at 20 mn settlement for aZZowabZe
q Zoad Pa= ~p approximative method pile
No 1- 20
8 3
Point resistance p [ MPaJ
a)
p(s) = s a +--sshy1 y qcp
1
SQ100p -- --- ---shy
~ s
[mml
I- 01 s rmm]-l p LMPa b)
f~]
c Cll E ~ i s
[mm)
Fig 146 Definition of the point resistance - settlement curve according to the modified hyperbolic method
84
01 ~ 0
20 0 0
0
16 0
medium 0 value a1 = 905-+ 256 Op 0 0
12 (r=039)
0 0
----0 0
8 0
0 0
0 0
4 0
05 06 07 08 09 10 11 12 f3 14 15 16 17 18 19 20 2 1 Op (ml
Fig 1 4 Initial slope of the base resistance curve vs pile diameter
a1 [p] 0
0020
16 assumed a 1= 28 - 4 qcp
12 0
0 Ct) 0 a = 2659 - 369 qcp8 1
0 0 (r = 0188)0
4
2 3 4 5 (MPa]qcp
Fig 1 4 8 Initial slope of the point resistance curve vs ultimate point resistance on the static cone resistance for pile tests No 1 20
85
a [~ 28
24
20
16
12
8
4
0 2 3 4 5 6 Qcp [MPa]
~ Kiosinski (1977) sand and sandy gravel of mediwn density
~ Klosinski (1977) loose sand ID= 0 3 0 4
o US59 ] t HH Touma p and Reese L (1974) fine sand and silty sand OGl (US59 HH BB - very dense Cl - mediwn dense) 1 BB
DIN 4014 Part 2 (1977)
Fig 1 4 9 Initial s lope of the point res istance curve vs ultimate point resis tance
86
assumed [il =30 -10 Op but )1~ 10 )1 [1 I
u 311-10 Op ( r =0 368)4 1 0
3 0 0
02 0
0 0co 0 8 0 0
0
0
05 06 07 08 09 10 11 12 13 14 15 16 17 19 20 21 Dp [ ml
Fig 14 10 Correction factor for hyperbolic base resistance shysettlement relationship
87
a [~] 28
24
20
16
12
8
4
2 3 4 5 qcp [ MPa]
Fig 14 11 Initial slope of the base resistance curve vs ultimate base resistance (proposal)
v [ 1 ]
3
2 -----G- DP J l 1J I Op lm] J
for Dp ~ 2 0 m ~ u = 1 01
0 --------r----r---r----r-----------------r-------------------------r------r-~-~--shy
05 06 07 08 09 10 11 12 13 14 15 16 17 18 19 20 21 Dp[m)
Fig 1 4 12 Correction facto r for hyperbolic base resisshytance - settlement relationship (proposal)
s P ( s)
s +
u qcp
88
a) b)1
bt=o212= 47 MPa a1=1~32 tMWJ s 2 3 4 5 O 1 10 20 30 40 50 60 p [~a]0
0p [ MPa] 40 40
80 80
120 ~
160 b1 = ~ajtg ~= 0 212
~=1132 + 0212middot s
mJ 240 r=0994t t t measured s __ according to Jl s
o o o according to p (bull ll l[mm] [mm]
Pile No 2
slmm) 10 20 30 40 50 60 80 100 125 150 175 2)0 225 Note
p [ MPa] 09 14 17 20 22 24 27 30 32 34 36 38 39
measured
pibull) [ MPa] 074 128 169 202 228 249 282 307 330 347 360 371 380calculated
plbullbull1[MPal 070 125 168 203 233 257 297 327 356 378 396 410 422calculated
1) (bull) ij l099082 091 099 101 104 104 104 102 103 102 100 098 097 sd = 006
ij (HJ1041) (bull10) 078 089 099 102 106 107 110 109 111 111 110 10B 10B sd = 010
plbulll-according to a =1132 [ Jp(s) = s s for pile No21 0 1132 12 39
plbullbulll-according toa =1241 lmiddotGcp=39MPa1 0
~=14 see fig 1411 and fig 14 12 sp(S)=
124+ _ s_ 14middot39
11lbulll11l-J - correlation coefficient calculat~d P5 for
measure p s p(bull) and p(bull) respectively
Fig 1 41 3 Modified hyperboZic point resistance - settZement reZationship for piZe No 2
89
0 2 3 4 5 p(MA1] 0 2 3 4 5 p[MPa)
40 40
80 A 80 A
120 120
160 16 Pile No 1 Pile No 2
20 200 s s
[mm] rnm
0 2 3 4 5 0 2 3 4 5p [MPa] p [MPo]
40 40
80 80
120 1ZJ
lfpound) Pi le No 3 Pile No 4 A
200 A
s s A
[mm) [mm
0 2 3 4 5 p [MPa] 0 2 3 4 5 p [MPa]
40 40 A A A measured ~ calculated
80 80
12
160 160 Pi le No 5 Pile No 6
200 Z)Q
Fig 1 4 14 l3ase resmiddotistance vs settlement pr oposed method pile No 1- 6
90
2 3 4 5 p [MPa] 2 3 4 5 p [ MPa]
40 6
6 40
1 80 80
6
120 120 6
6 160 160
Pile No 7 6
200 200 s
[mm ] s
[mm]
0 2 3 4 5 6 p [MR] 0 2 3 4 5 p [MPa] 0 0
40 40 6
6
80 80
6
120 120
160 160 Pile No9 Pile No 10
200 200
s [mm] [msml I
0 2 3 4 5 6p[MR] 0 2 3 4 5 p [MPa]04--___ ____ ___ ___ ____
0+-=---------------~-~- shy
40 40 c 6 c - measured
0--0-0 shy calculated
80 80
120 120
160 160 Pile No11 Pi le No12
200 200
s [mm]
s [mm]
Fig 1415 Base resistance vs settlement proposed method pile No 7-12
91
0 2 3 4 5 p [MPal 0 2 3 4 5 p [MPa)
40 40
80 80
120
16 Pile No 13 Pile No 14
200 s
tnml [mm]
0 2 3 4 5 p [ MPa] 0 2 3 4 5 p [MPa)
40 40
80 80
120 120
160 1fD
Pi le No 15200 axJ s s
[mm] [mm]
0 2 3 4 5 p[MPa] 0 2 3 4 5 6 plMPa ]
A A A measured40 0---0-0 calculated
80
120 120
160 1ED Pile No 17 Pi le No 18
200 200
s s [mm] [mm]
Fig 1 4 16 Base resistance vs settlement proposed method pile No 13- 18
92
0 2 3 4 5 p [MFb] 0 2 3 4 5 p[MPa]
0 6 o -measured40 40 0 0 o -calculated
80 80
120 120
160 160 Pile No 19 Pile No 20
200 200 s s
[mm] [mnil
Fig 1 4 17 Base resistance vs settlement proposed method pile No 19-20
p(s~Psf
15 20
ean
-C 5 w u L Lower ~ confidence
linea 0
a IJl 10
o---o proposed
method I I I
15
Fig 1 4 17a Design curves for estimating developed base resistance in sand (Wr ight and Reese 1979)
93
n (number)
30
28
26
24
22
20
18
16
14
12
10
8
6
4
2
0 02 04
Fig 1 4 18
I= 126
Between 1] = 0 7 - 1 3--- I= 106 ( 84 frac34)
Average ~ = 098 Standard sd =023 deviation
Standard sv =023 veriation
1] (Coefficient Calculated Measured
06 08 10 12 14 16 18
Calculated pressur e divided by the measured pr essure for all pressure - settlement curves pr oposed method pile No 1- 20
94
a) b) Total load
Total load curve
---- _____-- shy- -- -Base load ~- Base load
-0-0 ~
00 00 J
ldeoli zed shaft load J
Shaft sesistanc1---------- 0=0middot30 a= 0 middot 30
025 Settlement IN 025 Settlement IN
Fig 1 419 Proposed method of synthesizing design loadsettlement curve (a) conservative design prodiction b) design prediction- peak in shaft loadsettlement curve (Burland et al 1966)
Cf
-0 0 0
J
0
~-----~--~-~ amp- 2 3 4 5 6 (cm)
a~middotltii -0 lt) cco2 41 -~ -0 1)
vi ~ llloli=----------- ---c~0 1 2 3 4 5 6 7 ( of diameter)1 1 1 1
05 10 15 20 ( in) for 30 in Pile Movemen~ ( 75cm pile)
Fig 1 4 20 Approximate load settlement curves for 30 in bored piles (AB and C represent failure load at 1 in settlement A B and C represent ultimate failure load) (Touma and Reese 194)
95
Load in MN 0 2 3 4 5
25
50E E C
-C 75
-~ ~
-Z 100 lJ
Shaft resistshy
125 once
15 Fig 1 4 21 Load-settlement relationships for largeshydiameter bored piles in stiff clay (Tomlinson 1977)
SettlementSo
Fig 1 4 22 Diagrams of s1iaft and base resistances versus settleshyment assumed in analysis (Kiosinski 1977)
96
0 0 1 ~ r- 025g ~~ 2
1- -shy3 03Sg 14 5 2
Qls =Qpls+Q5 (sQpls) Qs(s-3E
0
degsis __ -- Qpls) a~ C
4
t Sg l
5 Qu Is)
Q(s)in MN-l T
Ouls Q Is) in MN ---
Fig 1 4 23 Construction of load - settlement curves a) for sand b) for cohesive soil (DIN 4014 Part 2 1977 and Franke 1981)
-
s C 5C
Cl
3 0 00 05 10 15 20 Mean settlement I in)
Fig 1 4 24 Load- settlement curves for test shaft S4 (1 in = 25 4 mm 1 ton= 8 90 kN) (Reese 1978)
97
Relative side resistance
0 05 10 15 20 0E=--t----+---+--~
c QI lt) ~ 2 C
I itaker c
QI amp Cooke3E QI-j
c-en 4
C QI
E us 59o
5 QI gt
SA0 w 0 6
Fig 1425a Relative side resistance for clay vesus relative midlength settlement (Reese 1978)
degs (Osl u l t 0 05 10 15 2 0
Mean
2 Lower ~ C QI u
confidence line
~ 3 a
0
~4 E
()
5
6 __ _ ______ ________ __1
Fig 1 4 25b Design curves for esti mating developed side resistance (~Jy1nht ReertP- 1987 J
98 Load Q
8 - 15 mm
1- 2 of p ile diameter
100-200 10-15 of pile Os Ot diameter Shaft Total
Settlement S Resistshy Resist- Load ance once
Fig 1426 Dependence of total load base resistance and shaft resistance on settlement of lar-ge diameter pile (Tejchman Gwizdala 1979)
6
5 Shaft load
4
3
2
z ~
-0
g Pile EF- 56 J 0
0 0 20 30 Butt settlement (mm)
Fig 1 4 27 Deveiopment of shaft and base resistance with settiement (Promboon Brenner 1981)
99
0 1000 2000 3000 4000 5000 6000 7000 8000 9000 0 r-=-1---J__-----------------------~----_shy
Load [ k N l5
10
20
( I
Skin friction ----1 I I
~ 40 QI E
fQI
50 I
Q) I () ICOntinuos fost deolading
Fig 1428 Load-Settlement-Diagram Testelement III (Diaphragm-Wall 0515 m 244 m deep) Portion of Skin Friction and Base Resistance (Prodinger Veder 1981)
Qs (QJ max
0 05 10
Upper Limit of Data
Farr and Aurora (1981J C
~ 2 - shy -+shy - Mean of Data
I QI
Lower Limit of Data a
0 - 3 E
Vl
4
Smid = Approximate shaft buff movement ignoring the elastic compression of upper halt of the shaft
D = Shaft diameter
Q Mobi Ii zed shaft resistance
Qs1max = Maximum shaft resistance
Fig 1 4 29 Relative shaft resistance vs relative movement (Farr and Aurora 1981)
100 Load Q (s) [ MN]
Su5 s s 20 mm for non- cohesive soil u
s s 10 mm f or cohesive soil u
s s 15 mm for claysand u
Q (s) + Q (s)s p
Qs(s)
-C ltII E s ~- [mm]-ltII IJ)
Fig 1 430 Dependence of total load Q(s) point res i stance Q (s) and shaft resistance Q (s) versus settlement p s
~ 3 Usu Qpu Qu Q(s) [ MN]
Sus= 20
1J
60
80
100
120
degs (s ) 140
5 P=Ol Op
1EO
C -ltII E 180 ~ ] 200
s [mm]
Approximative dependence of total load point resistance and shaft resistance versus settlement fny non-cohesive soil
Fig 1 4 31
101
113 3 ~fic0P Ye hY
1 Ground water
D
I y
yh C
Fig 1 5 1 Determination of 01 and 03 for settlement analysis of lar ge diameter bored piles
102
I
E=Et [MPa]
160 0
140
120 0
100
80
6
40
--- --shy 0
0
8 0
0
0
20
2 3 4
I 0 15
Fig 1 5 2
E = Et [MPa]
120
100
80
60
40
I I 0 35 065 085
0
Et= 17 81 qcp0844
( r = 0 128)
5
100
6 qcplMPo]
Calculated values of Young s modulus for piles No 1shy24 according to equation 1 5 2 and 1 56
0
0 0
E =898qcp127 (r= 0314)
E = 9 middot qcp 13 0
20 shy 0
0 0
0 1 2
loJ
I 0 35
3 I
065
4
I 085
5
100
6 qcp [MPo]
Fig 1 5 3 Calculated valueBof Young s modulus for piles No 1shy24 according to equation 1 5 4 and 1 5 6
I K 10 3
( 1 ] 1832
1400 0
1200 0
0
1000 0
800 0
m=2821 qcp0621
600 0
(r=0057)
400 0 0 0 0 0
200
2 3 4 5 6 qcp (MPa]
I 035
I 065
I 085 100 Io
Fig 15 4 Calculated valuesof the dimensionless compress ion modulus K for piles No 1- 24 according to equation 1 5 2 and 1 56
K ( 1 ]
0
1400
1200 0 0
1000
800
600
0
0 0
0
0 0
0 K= 1422 qcpl05
(r=0181)
0 K= 150 qcp
400 0
3)0 0 0
2 3 4 5 6 qcp(MPa)
I I -J 035 065 085 100 Io
Fig 1 5 5 Calculated values of the dimensionless compression modulus K for pile~ No 1-24 according to equation 1 5 2 and 1 5 6
104
120
100
2 3 4 5
I I I rv 0 15 035 065 085 100 lo
Bergdahl (1982) for shallow foundation
o----o Bozant Masopust (1981) D= 1 0 rn h=10 rn large diameter bored piles in noncohesive so il
0----0 Proposal according to current anal ysis
Klosinski (1977) D=090 to 125 rn large diameter bored piles in sand and sandy grave l
Mitchell Gardner (1976) very dense sand E=(35)q (it depends on sand density and stress history) c
Fig 1 5 6 Composision of Young s moduius
105
TABLES
0 Tab 1 11 Methods for detemination of the bearing capacity of bored piles (Ro llberg 1977)
Cl
Nol -- I Soil Areas of Q) Q) Editor Determination of Coefficients 5 type influenceqP qs p ~ C C 11 12 fP I fs
1 all Lab f Soil Mech (1936) l qp at the elevashy 1 0
2 all Huizinga (1951) ~ t~on of the pile 14 point
3 all Van der Veen (1953) ) 18 1 h+l14 all Van der Veen 1 0 Dpl375 D~ 15-- J qcmiddotdhBoersma (1957)
~ 11 +12 h - 12
5 12 all Menzenbach ( 1961) qc at the elevashy~ tion of pile point
6 18 all Mohan Jain Kuman (1963)1 average of qc over 1 h Q) h ~qcmiddotdhl 10 Dpj 3 75 Dj 15 50_micro
and 1 2C 11
7 I amp all de Beer ( 1964) graphically from 10 Q) qc 0 1 h+l18 u C
sand Soviet norm SNIP II 9ct9cp I4 bull O Dp I10 DP l66-1 083shyu clay B5- 67 Trofimenkov (1969) 2 50 1 251 +l J qc middotdh micro middot h middot-l l 2h-~ _micro
9 _micro u all Paproth (1972) at the elevation 3 5 I shy
) of pile point (Dpgt0 5 m 7 D8DpE
E-lt p 1 h+l1 1 h Dplt 5 m u l+l J qcmiddotdh h f qcmiddotd~ 30 Dpl 50 Dp 2 0 100shy10 sand Norwegian method
0l 2 h-12 200Senneseth (1974)
11 lall Soviet method h+l (20-0lqgl - 101 1 q middotdhTrofimenkov (1974) -- f C UpUsmiddotQct
l1+l2 h - 1212 Qct-Qcp 40 D~ 10 Dp 1 33- 0 67shyUsbullh 4 00 2 50
13 English method 10 DFJ 375Dp 10 I
Rodin Corbett Shershywood Thorburn (1974)
3 7 5 Dcl 8 0 DP 10h+l1 _1_ J qcmiddotdh 1 h
qcmiddotdh 20011 +12 h - 12 hb
1 h qcmiddotdh 150hf
0
Observations
fp I f (qp)fs C
Dp E = 1 cm Qbu = 2 Qpa (approx )
s fs=f (qc)
q=~g Us 0 h
fp=f(q~)
fs=f(qgl
bull fine grained non- cohesive soil loosely packed
bull fine grained non- cohesive soil medium dense comp
fine grained non- cohesive soil
Tab 111 (cont)
h+h bE 14 non-cohe- Meyerhof ( 1956 poundti J N 3o middot dh CtME fN3 o dh 1 0 DP 4 0 DP 10 100 etM= l 2
sive soil 1976) lJ +12 h - li hE o hgp taken into consi der ~ Ul (I)
E-lt
C 0
~E = 1 kgbull 30 cm
(statistical limit depth of the pile) hE - clamping length of
pile micro rrJ l-l micro (I)
15 C (I) p
sand Norwegian method
- irm - - - 10 IT
m = diagram O l-l Senneset (1 974) rrJO C
16 rrJ micro gravel English meth it 3 middot N30 - - - 10 - Jf 3 + diagram U) ~
E-lt p U)
iiouiu Coruett Sherwood Thorshyburn (1974 )
(NJQat the elevashytion of pile point1
0 -i
108
Tab 11 2
Results of calculati o n of p i le point load pile shaft load and total pile load from static con e penetration test (Rol l berg 1977)
~ gt
~ gt Ultima te Ultimate Ult imate
No Method micro micro poi nt skin bearing 080lt17nlt1 50 Q) -l
-l middot-i resistanceuro resistance r esistancE
middot-i p 0
(J n1 n n2 n n3 n n1 n2 n3
1
2
Lab fSoil Mech
Hu izinga (1951)
(1936 ) 430
307 i 3 Van der Veen (1953) 239
49
4
5
Van der VeenBoersma
Menzenbach (1961)
(1957) -l middot-i 0
2 4 7
1 57 1-CJ)
6
7
8
Mohan Jain Kumen
de Beer (1964)
Sovi et Norm (1969)
(1963) CJ) Q)
-l middot-i 0
lJ Q)
Q)
gt- CJ) Q)
c 0
2 44
1 37
183
47
t I
49
487
0 18
47
16
3 02
0 85 1
47
16
137
08
9
10
Paproth ( 1972)
Norw Method (1974)
~ 0
0
u I
C 0 C
1 8 1
180 l 46
1- - -_L~ 46 167 46 1 19
1 1 Soviet Method ( 1974) [1 1 41 46 1 62 13 083 13 1 14 0 8
12 Engl Method (1974) 2 66 35 128 35 2 30 35 1 28
Note
cal Q a) n = --- mean value of the rat i o between calculat ed pile loads and those n Q determined f r om loading test
b) n = number of piles
109
Tab 113
Point resistance of large diameter piles (DIN 4014 Part 2 1977)
Settlement Point pressure 1 Factor -fshy
(cm) (MPa) cf=lOMPa I i=15 MPa C C
Piles without enlarged base
1 05 005 003 2 08 008 005 3 11 0 11 007
15 34 034 023
Piles with enlarged base
1 035 0 04 002 2 065 0 07 004 3 0 90 009 006
15 2 40 0 24 0 16
Note 10 lt qp lt 15 (MPa)C
Tab 114
Skin friction resistance of large diameter piles (DIN 4014 1977)
Strength Static cone pen- Depth below Skin frict ion Factor of sand etration resist surface
(MPa) (m) (MPa) fs
Very small lt 5 - 0
Small 5 to 10 0 to 2 0 2 to 5 003 ln6 to 333
gt 5 005 100 to 200
Medium I I 10 to 15 0 to 2 0 I
I 2 to 7 5
gt 75 I 0045 0075
222 to 133 to
333 200
High I I
i
l
gt 15 0 2
to 2 to 10 gt 10
I I I
I
i
0 006 0 10
gt gt
250 150
Note Skin friction is assumpted as linear until s =2 cm and constant for s gt 2 cm
11 0
Tab 115
Values of the inverse of the point resistance factor (Bustamante 1982) fp
Soil type qPC I 1
Factor - shyfp(MPa)
for piles group
a) Silt and loose sand lt 5 0 40 -b) Moderately compact
5 - 12 040sand and gravel
c) Compact to very gt 12 i 030compact sand and gravel I
Tab 116
Values of the shaft resistance factor fs (Bustamante 1982)
Factor fs
Soil type qs
C Category I(MPa) I A I B I II A III BI
I a) Silt and loose lt 5 60
i 150 I 60 I 120-
sand
b) Moderately corn- I pact sand and 5 - 12 100 200 100 200 gravel i
Icl Compact to very
compact sand gt 12 150 i I 300 150 I 200I
I I and gravel i
I
111
Tab 117
Point resistance factor (proposal)
-
1-fp
qc (MPa)
Gravel
Coarse sand Medium sand
Fine sand Silty sand
25
080
0 70
060
5 0
0 65
055
047
75
054
045
039
10 0
045
036
031
150
035
027
022
200
030
0 23
018
Tab 118
Shaf t r e sistance factor (proposal)
fs
qc (MPa)
Gravel
Coarse sand Medium sand
Fine sand Silty sand
25
80
100
130
10 0
120
150
190
I 200
180
230
300
11 2
Tab 119
Calculated values qcp
for large diameter piles
Pile Literature Length Diameter (m) Measured p Cr1 lcul Settlement Note Authcr(year) No (ml D Dp (MPa)
(s=0 10Dp) (MPa)p ~~JL__
s s ()(mm) Dp
1 Franke (1977) 1 13 11 36 38 117 106 Garbrecht
2
3
2
3
13
14
11
15
1 58 36
37
38
40
215
185
136
123
) qg accord to Franke
4 4 13 15 204 3 2 33 220 108 and Garshy
5 5 6 11 33 35 127 11 5 brecht (1977)
6 6 6 11 153 36 35 146 9 5
7 7 6 1 5 34 35 158 105
8 -shy 8 6 15 2 1 41 3 0 109 52
9 10 9 11 39 52 47
10 11 95 11 43 35 77 70
11 12 9 11 49 66 60
12 13 10 11 15 5 1 4 0 77 5 1
13 14 9 11 1 5 4 8 46 115 77--shy14 Pranke ( 1973) 15 115 18 4 9
) ) average 88
15 13$ 13 5 1 3 19 -2 5 3 2 sd=3 0
16 - - 165 16 5 13 19 30 sv=0 34
17
18
Spang (1972)
llXJ
V90
6 6
6 75
0 7
09
3 2
4 2
32X
42X
x) s =0 10 D p
19 VlaJ 720 1 2 39 3 9X
20 - - VlsJ 6 5 1 5 3 0 3 ox
21 Touma and US59 9 9 o 76 8 0 Reese ( 1977)
22 HH 75 0 61 8 0
23 Gl 180 091 - 2 5
24 BB 137 o 76
sd = standard deviation
sv = standard variation
Tab 1 2 1
Ultimate point resistance coarse and medium sand psf (MPal (Pol ish Specification 1975)
Depth h
Medium sand r = 0 40 N = 200 30 Base diam (Op) and depthbase diam (hDp)
Dense sand r 0 Base diam (Op)
= 0 80 = 50N30 and dpethbase diam (hDp)
(ml Dp = 0 6 m Dp = 1 0 m Dp =12 m Dp = 1 5 m Dp = 0 6 m DP = 10 m DP = 12 m DP = 15 m
Psf hDp Psf hDp Psf hDp Psf hDp Psf hDp Psf hDp Psf hDp Psf hDp
5 10 83 0 85 5 0 075 42 07 33 20 8 3 16 50 14 42 13 3 3
7 14 11 7 1 2 70 11 5 8 10 4 7 2 8 11 7 22 70 2 0 5 8 1 8 47
10 18 16 7 15 10 0 14 8 3 1 3 67 35 167 28 100 2 5 83 2 2 67
15 18 250 18 15 0 16 12 5 15 100 4 2 25 0 3 4 15 0 30 125 27 100
20 2 4 333 2 0 200 185 167 1 7 133 4 7 333 3 8 200 33 167 30 13 3
25 26 41 7 2 2 25 0 20 208 19 167 5 0 41 7 4 0 250 3 5 20 8 3 2 167
w
11 4
Tab 131
Partial safety factors for resistance to axial load for bored piles (Wright Reese 1979)
Partial safety Normal Poor factor for control control
Unit skin resistance 1 70 185
(no load test)
Unit skin resistance 160 1 70
(from load test)
End bearing 165 180
Tab 1 3 2
Probability of failure of bored piles under normal design conditions (Wright Reese 1979)
Probability of Factor of Structure failure safety classification
5 10-3 25 monumental
210shy 22 permanent- 2
5 middot 10 2 0 110shy 1 85
temporary 5 bull 10-l 165
11 5
Tab 133 Results of field tests (Tejchman Gwizdara 1979)
L
II C C C 0 0 0
micro micro
micro micro micro For universal safe~y F2u u CUNo micro C C ~ ~g~ middot- C
~ Permisible micro micro i ~c -i micro
cmiddot-~ micro~ L
micro oo ~ load ~t~ ~~ omicro micro ~ ~ 3Z~ ~ ~ micro
-~~
~ e ~ --middot--
middot- ~ obull 0
~ g ~~ ~~ ~
~ L
o Jl i5 sect~ =gt L Q~ = yen t p Qp Qp
D h Q~ Srrx s tm p s E~ iQ~lQ~cm ~~ KN X ll1l kPa kPa kN kN kN Jl ~e ~ 1 2 3 4 5 6 7 8 9 10 11 12 13 14 15 16 17
1 70 6 60 4081 1550 2531 38 0 1182 10 4040 175 2041 245 1796 632 141 120
2 90 6 75 5082 3041 2041 598 1785 10 4782 107 2541 1079 1462 282 140 42 5
3 120 720 7259 4041 3218 557 1035 10 3576 119 3630 2158 1472 187 2 19 594
4 150 650 8643 4454 4189 51 5 928 20 2521 136 4326 2158 2168 3 10 166 253
5 130190 195 7750 3011 4709 392 805 10 1075 - 3875 981 2894 3 10 166 253
6 130190 165 9516 5101 4415 536 522 20 1800 - 4758 1962 2796 260 158 412
7 130190 135 8044 5199 2845 646 114 4 15 1834 - 4022 2109 1913 2 47 149 524
8 180 115 11380 4415 6965 388 792 15 1735 - 5690 2747 2943 161 2 37 483
9 76 980 6867 4316 2551 628 110 13 9529 109 3534 1128 2306 383 111 32 8
10 61 7 60 7161 2747 44 14 383 67 15 9404 303 3581 392 3188 700 169 109
11 92 180 4807 883 3924 184 20 8 1329 76 2404 196 2207 450 178 82
12 76 24 5 6769 736 6033 109 20 8 1623 103 3385 147 3238 500 186 43
13 76 137 5396 2060 3336 38 2 63 8 4535 102 2698 589 1109 350 t 58 218
14 120 23 5297 1854 3443 35 0 960 10 1640 39 2649 196 2453 945 130 7 4
15 135 16 7 13489 7554 5935 560 181 10 5260 83 6749 2060 4689 367 127 305
16 170 46 0 8829 2943 5886 333 17 10 3466 39 4415 1373 3042 2 14 1 94 31 1
Average Fi 387 166 Standard deviation Sd 2 1 5 034 Standard variation sv= 0 56 0 20
1234 Spang1972 567 8 Franke 1976 9 10 111 2 1 3 Touma Reese 1974
14 Colombo 1971 15 Kerisel Simons 1962 16 Appendino 1973
11 6
Tab 134
Results of model
SafetyScheme factor
medium F ssand
F p
loose F s
samd Fp
F 3 55 sd _P F 1 32 sd
s
tests (Tejchman Gwizdara 1979)
Diameter D (mm)
30 60 90 133
145 129 108 112
280 3 08 307 294
140 154 153 112
594 3 04 324 426
107 sv 030
0 19 sv 0 14
117
Tab 135
Individual safety factors according to literature
Literature proposal ofLiterature individual safety factor
Fs Fb
Polish Specification (1974) 100 250
Tejchman Gwizdala (1979) 150 400
Bustamante Gianeselli 200 300 (1982)
Decourt ( 1982) 130 400
average 145 3 38
TAB 141 0)
Load settlement curves - measured
Pile No
Settlement 1 c 3 4 5 6 7 8 9 10 11 12
s p s p p s
p p s P
p s P
p s p p s
P p s
P p s
p p s p p S
p I i p s
p p s p
mm MPa rrrn lifl5a MPa mm
lifl5a MPa
mm lifl5a MPa mm
RPa mmMPa nwa MPa mm
RPa MPa mm RPa MPa mm
RPa MPa mm RPa MPa mm
RPa MPa mm RPa MPa mm
RPa 10 045 222 09 1 1 05 20 07 143 06 167 08 125 0 5 20 08 125 10 100 08 12 5 15 67 16 63 20 092 21 7 14 43 08 25 10 20 0 1 1 182 12 167 0 9 22 2 12 167 18 111 14 143 24 83 22 9 1 30 125 240 1 7 I 7 6 1 1 273 1 2 250 14 214 15 200 1 2 250 15 200 25 12 0 19 15 8 30 100 26 11 5 40 1ti 250 20 10 0 14 28 6 14 286 1 7 235 18 222 1 4 286 18 22 2 3 2 12 5 23 174 36 111 3 0 133 50 20 250 22 ~27 1 7 294 1 5 333 20 250 2 1 ~38 1 7 294 1 9 263 37 135 27 18 5 4 2 11 9 33 152 60 2 2 273 24 ~5o 20 300 1 7 353 23 61 22 ~73 18 333 21 286 43 140 30 20 0 46 13 0 36 16 7 80 271 295 27 796 24 333 20 400 27 ~96 25 1320 22 364 25 32 0 53 15 1 36 222 41 195
100 322 31 1 30 333 28 357 22 454 31 1323 29 345 26 385 28 357 60 16 7 40 25 0 45 22 2 125 38 329 32 391 32 391 25 500 32 139 1 30 41 7 32 39 1 4 6 272 48 ~6 0 150 14 2 357 34 1441 36 41 7 27 555 36 ~1 7 34 44 1 36 41 7 175 36 486 39 449 30 583 38 ~61 38 461 200 38 526 42 476 32 625 225 39 577 33 682
(mmMPa) ( 1 MPa)
1
1=2074
t 1=O ~01 =0 98S
a1=1132
b1 =0 212 V =0994
a1=2217
b1=O 131
V =Q 978
a1=1860 b1=0233
V =Q966
a1=1562
b1=0174 V =Q983
a1=1382
b1=O195
V =0975
a1 =20 37
b1 =C 174
V =0957
a1=1443
b1=(l 193 v =O 961
a1=965
b1= 0071 V =0 990
a1=1 91
b1 =o 128
V =0 993
a1=5 83
b1=C124
v =O 981
a1=6 1 4
b1=01 64 v =U 985
li(MPa) ~9 4 7 76 43 57 middot5 1 57 5 2 141 78 81 61 cp (MPa) B8 39 40 33 35 35 35 3 0 39 3 5 49 40 __Ef ~-6 1 2 1 9 1 3 16 15 16 1 7 36 22 16 15 qcp
TAB 141 (continue) Load settlement curves - measured
Pi le No 3ettlement 13 14 15 1 17 18 19 20 21 22 23 24
s p s T5
p s T5
p s T5
p s P
p s P
p s P
p s P
p s P
p s T5
p s T5
p s p p s
p mm MPa lll1l
HPa MPa mm HPa MPa mm
fWa MPa mm fWa MPa lll1l
HPa MPa mm HPa MPa mm
MPa MPa lll1l NT5a MPa HPa MPa 111111
HPa MPa 111111
HPa MPa 1)1111
mra 10 1 7 59 075 133 06 167 075 133 ~95 105 09 11 1 07 143 3 76 1 7 59 08 133 10 100 20 2 4 83 130 154 095 21 1 1 15 17 4 1 75 114 16 125 12 167 ~7 74 33 6 2 1 3 15 3 1 9 103 30 29 103 1 7 176 1 2 250 15 200 r55 118 22 136 16 18 8 38 79 46 66 1 7 182 27 110 40 33 12 1 20 200 1 35 29 6 1 75 229 ~O 133 26 154 175 229 49 82 58 6 9 1 9 21 1 35 115 50 36 139 235 21 3 145 34 5 1 95 256 24 208 ~-4 147 28 17 9 20 250 gt8 86 6 9 72 2 2 233 4 2 11 8 60 39 154 265 22 6 1 55 387 2 15 279 28 214 ~6 16 7 30 120 0 2 2 27 3 o 8 89 80 7 5 2 3 262 80 43 186 31 258 1 7 47 1 36 222 14 05 198 33 124 2 25 320 B 1 98 25 327
100 45 222 18 556 39~ 253 ~-5 222 36 1278 27 370 ~8 113 125 47 26 6 20 625 42 29 8 149 255 28 1446 t50 22 682 3 0 500 175 200 225
(mmMPa) a1=479 a1=1206 a1=14 51 a1=1113 a1=1406 ~=836 a1=843 a1=1176 ~=64 a =561 a1=10 0 a1=9 5 (1MPa) b1=0175 b1=0 178 b1=0 382 b=0287 b1=O 119 p 1=0 137 h1 =o 193 b=0258 p1=0 049 b1=0032 b1=0 276 b1 =0 048
hf (MPa)
v =0998 57
v =0-987 5 6
v =0989 26
v =0992 35
v =0933 Iv =0991 84 73
v =0993 5 2
v =0998 tJ
3 9 =0944 v =0998 v =0996 v =0981
qcp (MPa) 46 39 32 30 32 14 2 39 30
lL 12 1 1 08 12 26 1 7 1 3 13 qcp
lD
N 0
TAB 142
Calculated point resistance curves
Setlement (mm) p(s)
1
n p(s)
Calculated value of the p(s) for pile No
2 3 4 5
n p(s) n p(s) n p(s) n p(s) 6
(MPa)
n p(s)
7
n p(s) 8
n p(s) 9
n p(s)
10 20 30 50 80
100
150 200 225
070 128 177 253 335
375 446 493
157 140 141
127
123
1 16 106
070 1 25 168 232
297
327 378 410
422
078 089 099 1 06
1 10
109 1 11 108
108
073 1 30 176 246
315 349
405 441
146 163
160 145
1 32 125
113 105
056 096
1 26
167 205 222
249 265
271
0 80 096
105
1 11 100 101
092 0 83
082
065
118 162 233
308 345
412 456
108 108
1 16 116 114 111
064
1 12 151 2 10 2 69
298
346 3 76
078 P63 093 tt 13 101 tt 53 100 I 13
108 ~75
103 ~04 096 ~ 55
~ 87
1 26 125 127 126
125
1 17 1 04
052 088
1 15 153
188 2 03 227 242
065 0 74
o 77 0 81 0 75
0 73
063
072 122
1 83 262 347 388
463 5 11
073
0 74
073 0 71 0 65 065
064 1 18
162 233 309
3 46
41 3 4 57
Dp (m) 1 1 Qcp (MPa) 38 (mmMPa) h2 8 1 1 9 Qcpbullv1(MPa) 72
158
39
124 14 55
15
40
n20 15 60
204
33 148 10 33
1 1
35
tt 4o 1 9 67
1 53 3 5
tt 4 0 1 5 51
15
13 5
114 0 15 i-gt 3
2 1
30
tt 6 0 10 3 0
1 1
3 9
12 4 1 9 74
1 1
3 5 h40
1 9 67
Note n = condition coefficient calculated p(s) measured p(s)
10
n
081
084 0 85 0 86 0 85
087
TAB 142 (continue)
Calculated point resistance curves
Calculated value of the p(s) for pile No (MPa) Setlement 11 12 13 14 15 16 17 18 19 20
(mm) p(s) ll p(s) n p(s) ll p(s) n p(s) n p(s) n p(s) n p(s) n p(s n p(s) n
10 106 070 0 71 045 091 054 099 1 32 055 092 053 070 060 081 085 0 72 080 055 078
20 1 90 079 130 059 160 067 1 70 1 30 096 101 091 079 1 12 148 085 1 31 082 098 082
30 258 086 1 76 068 2 15 074 222 1 31 1 26 105 120 080 156 205 081 180 082 132 083
50 363 086 246 075 297 082 296 1 26 1 70 117 161 082 228 095 295 087 256 0 91 184 092
80 471 316 o 77 3 77 088 364 1 18 2 1 o 1 24 199 308 085 393 097 336 1 02 237 095
100 522 349 078 415 092 394 228 1 27 2 16 348 088 442 098 375 104 262 097
150 611 405 479 443 258 117 244 423 529 443 304 101
200 669 441 518 473 276 261 474 587 488 331
Dp (MPa) 1 1 1 5 1 5 18 1 9 19 070 090 12 15
qcp (MPa) 49 4 0 46 49 32 30 32 42 39 30 12 a1 mmMPa) 84 h20 96 84 152 160 152 124 160
IV1 1 9 1 5 15 12 11 1 1 23 21 18 15
qcpmiddotv1 (MPa) 93 60 69 59 35 33 74 88 70 45
- 12287 average = ~ = 098
standard deviation sd = 023 standard variation sv = 023
N
122
TAB 143 Ultimate settlement for shaft resistance - summing up
Ultimate settlements (mm)Literature sand cohesive claysand
soil
Burland Butler Dunican (1966) 7
Touma Reese (1974) 10 Tomlinson (1977) 10 Klosinski (1977) 8
Francke Gerbrecht (1977) 20-30 DIN 4014 part 2 (1977) 20 10 Francke (1981) Reese (1978) (1979) 05-2 of 05-2 of Farr Aurora (1981) shaft dia~ shaft diam
5-20 mm 5-20 mm Tejchman Gwizdala (1979) - Spang (1972) 10
10 10 20
- Francke (1976) 10 20 15 15
- Touma Reese (1974) 13 8 15 8
8 - Colombo (1971) 10
- Kerisel Simons (1962) 20 - Appendino (1973) 10 Promboon Brenner (1981) 10 Prodinger Veder (1981) 12 Decourt (1982) 10-15 10-15
-average s = 14 1 10 126
standard deviation sd = 53 2 1 47
standard variation sv = 038 021 037
123
TABLE 14 4 Al l owab l e base resistance versus sett lement
Pile Li terature ength Diameter (m) Calculated qcp=qcp Settl ement Fp-3- sa (mm)No Aut hor No (m) D DP qcp (MPa) for qcp3(MPa)
1 Francke ( 1977) 1 13 11 38 127 25 Garbrecht
II2 2 13 11 158 39 130 19
II3 3 14 15 40 133 33
II4 4 13 15 204 33 110 23
II5 5 6 11 35 117 22
II6 6 6 11 153 35 117 19
II
8
7 7 6 15 35 1 17 25
II 8 6 15 21 30 100 21
II9 10 9 11 39 130 13
II10 11 95 11 35 117 15
II11 12 9 11 39 163 11
II12 13 10 11 15 40 133 7
II13 14 9 11 15 46 153 9
14 Francke ( 1973) 115 11 5 18 30 100 15
II15 135 135 13 19 32 107 29
II16 165 165 13 19 49 163 35
17 Spang (1972) V70 660 070 32 107 28
18 II V90 675 0 90 42 140 16
II19 V120 720 1 20 3 9 130 16
II20 V15C 650 150 30 100 16 average for pi les 198
standard dev sd = 78
standard var sv = 039
)assumed qc = p for s = 010 Op sonding meRsurement were not availab le
IV
TA~LE 15 1
Comparison of the initial sl ope of the pile point resistance - settlement curve
Accardi ng to 1 2 3 4
In i t i ~l 5
slope a1 for the pile No
6 7 8 9
(mmMPa)
10 11 12 13 14 15 Note
a 1 for s=10 mm 222 11 1 a1 for s=20 mm 21 7 14 3 calculated 207 113see Tab 14 1 Bo Berggren (198 )230s=20 mm
Schmertmann s method (see 202B Berggren 1981)s=20 mm
No 1 _ llNo - 6 1 97 098
202 250
22 2
400
30 8
090
14 3
200
186
076
167
182 156
286
18 2
107
125
167 138
091
20 0
222
204
426
263
098
125
167
144
087
100
11 1 9 7
182
23 5
1 03
12 5
14 3
11 9
174
164
105
67 83
58
14 6
125
1 16
63
9 1
61
103
59
8 3 48
123
13 3
15 4 12 1
1 10
167 21 1
aceto hypershy14 5 bola type curve
1 15
No 2 NQj = n1
No 4Noz ~ na No 5Naz= T]g
105 1 27
106
093
1 13
160
1 23
108 1 17
157
100
121 109
1 92
118
1 16 1 14
164
2 12
120
122
1 15
143
1 76
151
149 1 73 1 27 146
TAllLE 151 (continue)
Compa ri son of the initial slope of the pile point resistance - settl ement curve
Initial slope a1 for the pile No (mmMPa)According Note to 16 17 18 19 20 21 22 23 24 -a1 for s=10 mm 133 - 105 11 1 143 76 59 133 100 a1 for s=20 mm 174 - 114 125 167 74 62 153 10 3 calculated see 11 1 146 84 84 118 64 56 100 95Tab 141
Bo Berggren 198 67 78 25 0 114s=20 mm Schmertmann s method (see B 136 67 250 146 Berggren 1981) s = 20 mm
nG = 108 No 1NoJ = n 1 20 125 1 32 121 1 19 105 1 33 105 sd = 0 14
SY= 013 No 2 i) = 1 29ro1 = n1 157 136 149 142 1 16 1 11 1 53 108 sd = 019
SY= 015 No 4 iis = 143 INo2 = ns 091 126 1 63 111 sd = 033
SY= 0 23 No 5 ii9 = 1 37183 108 163 142INoz = n9 sd = 0 37
SY = 027
N Vl
126
TABLE 152
Measured and calculated pile point resistance
Pile Calculated Measured Measured No qcp P for
s=10 mm P for s=20 mm
~ 10 mm ~ 20 mm
- (MPa) (MPa) (MPa) - -
1 38 045 092 84 41 2 39 09 14 43 28
3 40 05 08 80 50 4 33 07 10 47 33 5 35 06 11 58 30 6 35 08 12 44 29 7 35 05 09 70 39 8 30 08 12 38 25 9 39 10 18 39 22
10 35 08 14 44 25 11 49 15 24 33 20 12 40 16 22 25 18 13 46 1 7 2 4 27 19 14 30 075 13 40 23 15 32 06 095 53 34 16 49 075 115 65 43 17 32 - - - -18 42 095 1 75 44 24 19 39 09 160 4 3 23 20 3 0 07 12 43 25
average= 484 291
sd 163 088 sv 034 030
Tab 153 Results of calculation for piles No 1-24
Pile No
Length (m)
Overburden pressure 0 vs
0hs (kPa)
0ve (kPa)
0 nc (kPa)
- -ov=o1 (kPa)
- -OV=03 ( kPa)
00 (kPa)
p(a il ( kPa)
s (a 1) (mm)
A2 ( 1 )
E t
(kPa)
Md ( 1 )
K (1)
E I
t (kPa)
( kPa) 1 2 3 4 5 6 7 8 9 10 11 12 13 14 15 16
l 2 3 4 5 6 7 8 9
10 11 12 13 14 15 16 17 18 19 20 21 22 23 24
13 12 14 13 6 6 6 6 9 95 9
10 95
11 5 135 165 66 675 72 65 99 75
180 137
l 33 133 123 116
70 70 70 70
104 102 95
102 95 94
106 139 95
101 106 97
180 137 221 215
53 53 49 46 28 28 28 28 42 41 38 41 38 38 42 56 38 40 42 39 72 55 88 86
202 202 216 202 1114 104 104 104 146 153 146 160 153 181 209 251 120 128 134 123 238 180 305 277
202 202 216 202 104 104 104 104 146 153 146 160 153 181 209 251 120 128 134 123 238 180 305 277
168 Hi8 170 159 87 87 87 87
125 128 121 131 124 138 158 195 108 115 120 110 209 159 263 246
128 128 133 124 66 66 66 66 94 97 92
101 96
110 126 154 79 84 88 81
155 118 197 182
141 141 145 136
73 73 73 73
104 107 104 111 105 119 137 117 89 94 99 91
173 132 219 203
950 975
1000 825 875 875 875 750 975 875
1225 1000 1150 750 800
1225 800
1050 975 750
2000 2000 625
1500
218 139 255 190 16 1 146 210 12 7 10 1 11 7 84 73 69
104 167 210 124 103 10 1 109 142 120 76
153
0802 0802 0822 0820 0798 0798 0798 0798 0791 0798 0800 0811 0814 0837 0837 0830 0769 0 768 0771 0 775 0 780 0 781 0 788 o 779
35296 81603 43312 65222 44019 67515 4609 91313 78186 60572
118115 15129 5 184075 95577 67017 81607 33252 67554 85294 75994 78816 74857 55101 54862
075 075 0 77 075 084 084 084 081 079 078 084 080 083 076 076 078 0 77 081 079 076 082 087 064 0 74
278 643 337 512 542 832 567
1085 766 572
1216 1417 1832
796 520 709 353 735 878 781 630 726 302 366
26472 61202 33350 48917 36976 56713 38656 73964 61767 47246 99217
121036 152782
72639 51932 63653 25604 54719 67382 57755 64629 65126 35265 40598
a=282l a =l781 y=axs S=0621 B=0 844
V=0 057 V=0 128 _ Iv -J
~
N co
Tab l53 Results of calculation for piles No 7-24
Pile No
17
1 2 3 4 5 6 7 8 9
70 11 72 13 74 75 16 17 78 79 20 27 22 23 24
Ground water
18
-20 m b s
-28 m -335 m -330 m -3 15 m dry dry -53 m -85 m
E t (kPa)
19
33653 64979 35364 45664 47969 54583 37574 63072 74548 57753
71 2618 123531 150297
71239 48619 59204 39744 77208 77863 62049 90407 95844 57762 62937
vxEt=E Md (kPa)
20
25240 48689 27230 34248 35254 45849 31562 51040 58893 45047 94599 98825
724747 54142 36950 46179 30603 57678 61572 47157 47734 83384 36968 46569
a=898 S=l 27 =0314
K (l )
21
265 511 275 358 517 672 463 749 730 546
1160 1157 7496
593 377 514 422 775 802 638 723 929 377 420
a=l422 S=l 05 =0187
E=E = t1 3
g-gcp (kPa)
22
51046 52799 54566 42492 45870 45870 45870 37547 52799 45870 77039 54566 65438 52799 40826 71039 40926 58739 52799 37541 82549 82549 40826 59945
Calculated s
(mm)
23
708 128 72 7 15 3 724 146 144 17 3 71 3 11 5 11 2 732 13 2 707 1 5 1 13 7 93
102 118 137 728 12 l 69
11 9
s__caL n=smeos
() 24
050 092 050 087 0 77 7 00 069 l36 l 12 098 133 l81 l97 103 090 065 0 75 099 117 126 090 101 097 078
ri=l00 sd=035 sv=035
K = l50gcp
25
570 585 600 495 525 525 525 450 585 525 735 600 690 450 480 735 480 630 585 450 825 825 1180 645
E l
(kPa)
26
67684 69465 72250 57726 44856 44856 44856 38448 59659 54306 74956 63214 70704 49089 56783 79502 45283 61081 58207 42927
708572 94785 71033 91898
E = t E middotA2
l
(kPa)
27
54283 5571 l 59389 47336 35795 35795 35795 30682 47790 43336 59964 51266 57553 47088 47024 65987 34823 46970 44877 33269 84639 74027 55974 71589
Calculated s
(mm)
28
l O l 12 l 11 7 737 15 9 18 7 185 21 1 12 6 12 2 133 14 l 150 13 7 13 l 14 7 709 12 7 738 755 12 4 735 50
100
- -
Tab l53 Results of calculation for piles No l-24
Pile
29
l 2 3 4 5 6 7 8 9
10 ll 12 13 14 15 76 17 78 19 20 21 22 23 24
sea l n= middotshy
smeas
28 TT
30
0 46 087 046 0 72 099 l 28 088 l 66 l 25 l 04 l 58 l 93 2 17 l 32 078 0 70 088 l 23 l 37 l42 087 l l 3 066 065
n=l 10 sd=0 44 sv=040
s seal for p n=s=lOrnn ac cording to s = 70mm
(mm)
37 32
5 l 0 51 ll 8 l18 64 064
13 0 l30 85 0 85
13 3 l 33 83 0 83
184 l84 ll6 l l 6 105 l05 137 l 37 21 3 2 12 19 4 l94 107 l06 l l 3 l l 3 84 084
92 092 l 0 9 l09 128 l28 83 083
l 0 3 l03 88 088 79 0 79
n=1 73 sd=025 sv=027
s for p according to s = 20mm
(mm)
33
10 4 184 102 18 6 15 6 200 14 9 276 209 18 4 219 292 274 185 17 9 12 9 -
169 194 219 172 200 143 15 0
seal n=s=20rnn
34
052 092 051 093 078 l00 075 l 38 l 05 092 l l 0 l46 l 37 093 090 065
-085 097 l1 0 086 l00 072 075
n=093 sd=025 sv=0 27
s for p according to s = 30rnn
(mm)
35
142 223 14 l 22 3 198 249 142 34 5 290 249 274 345 33 l 243 22 6 168 -
24 7 26 6 293 24 3 279 187 213
seal n=s=30rnn
36
047 0 74 047 0 74 066 083 047 l 15 0 97 083 091 l 15 l10 0 81 075 056 -
082 089 098 081 093 062 0 71
n=o80 sd=020 _ sv=0 25 N
IO
APPENDIXES
APPENDIX 1 1 1
Pi le No 1 Length 13 m D 10 m
Areas of influence
-
qe
(MPa)
1 fp
___9c_ f
(MPR) zyen
(MPf) qcp (MPa)
Soil type
22 20 18 16 14 1 2
l 2 (m)
10
1 0 08 06
16 15 16
026 027 026
42 41 42 Sand
04 14 U28 39 02 14 028 39 41
02 16 0 26 42 04 16 026 42 06 16 026 42 08 14 028 39 Sand 1 0 13 030 39 12 15 027 4 1 38 14 13 030 39 16 12 032 38 18 12 032 38
40 20 10 036 36 22 10 036 36 24 9 U39 35 2 6 8 043 34 28 10 036 36 30 10 036 36 3 2 10 036 36 34 10 0 36 36 36 11 0 34 37 38 11 034 37
l 1 (m)
40
42 44
11 0 34 37 15 1
46 48 50 52 54 56 58 60 62 64 66 68 70 7 2 74 76 78 8 0
APPENDIX 112
Pile No 2
to little depth of sounding
q~ = middle values for 11 = 2 Op
q~ = 145 MAa (Francke Garbrecht 1977 Tab 2 p 50) (Fi g No 2)
for sand
qcp = 0275middot145 = 40 MPa q~p =V ~~s) middot 40 = 097middot40 = 39 MPa
Pile No 4
q~ = 120 MPa sand (Fig No 4)
q = 0 315middot12 = 3 8 MPa q bull 38 = 086middot38 = 33 MPa=V Jmiddot54
1
cp middot bull cp
Pile No 12
qg = 155 MPa sand (Fig No 13)
qcp = 026middot155 = 4 03 MPa
Pile No 13
q~ = 200 MPa sand (Fig No 14)
q = 0 23middot20 = 46 MPacp
APPENDIX 113
PileNo3 Length 14 m D 15 m
Areas of influence
-
qe
(MPa)
1 Tp
----9cf
(t-1Pf) r~
(MPf) qcp (MPa)
Soil type
22 2D 18 16 17 025 43 14 17 II II
L 2 17 II II
12 (m)
16 10 08 06
17 17 17
o
II
II
II
II
Sand 04 17 II II
02 19 024 46 b9
02 19 024 46 04 17 025 43 06 15 027 41 08 13 030 48 1 0 12 032 38 12 11 033 36 14 13 0 30 39 16 14 028 39 18 12 032 38 40 20 16 026 42 2 2 16 026 42 24 11 033 36 26 11 033 36
60 28 30
10 10
036 036
36 36
Sand
32 10 036 36 34 12 032 3 8 3 6 12 032 38 38 12 032 38
1 1 (m)
40
4 2 4 4
13
14 16
030
028 026
39
39 42
46 13 030 39 48 12 032 38 50 14 028 39 52 10 036 36 54 13 030 39 56 14 028 39 58 15 027 41 60 15 027 ~-1 236 62 64 66 68 70 72 74 76 7 8 80
APPENDIX 114
Pi l e No 5 Length 6 0m D 11 m Dp 11 m
Area s of i nfluence
-
qc
(MPa)
1 Tp
-3Lf
( MPf) l ~
(MP~) qcp (MPa)
Soil type
2 2 2 0 18 1 6 14 1 2 155 U i1 33
l 2 (m)
1 2 10 08 06
15 14 12
022 023 0 27
3 3 32 32
Fine sand
+ silt
04 125 026 33 02 16 0 21 34 39
02 16 021 34 04 13 025 33 06 08 10
15 5 17 20
022 0 20 018
34 34 36
35 Fi ne sand
1 2 20 0 18 36 14 20 018 36 + s ilt 16 20 0 18 36 18 165 020 32 20 165 0 20 32 22 17 0 20 34 24 26 2 8 30 32 3 36 38 4 0
19 21 5 21 5 21 5 20 19 5 19 5 20 215
01 9 ---
018 018 0 18 0 18 -
3 6 40 40 40 36 35 3 5 36 4 0
l 1 (m) 4 2
44 20 19
018 01 9
36 3 6 157
46 48 50 5 2 54 56 58 6 0 62 64 66 68 70 7 2 74 76 7 8 8 0
APPENDIX 1 15
Pi le No 6 Lengt h6 0 m D 11 m
Areas of qc 1 __9_c_ qcp Soil typei nfluence fp f 1 yen (MPa) (MPf ) (MPf) (MPa)
-2 2 20 18 16 t 4---0 14 75 038 29 L2 20 018 36 Fi ne sand
1ti 10 30 40 + s i lt12 08 19 0 19 36(m) 06 17 020 34 04 14 023 32 02 9 034 31 56
02 6 043 26 04 12 026 3 1 06 17 020 34 08 11 028 3 1 1 0 14 023 32 35 1 2 17 020 34 Fi ne sand14 19 019 35 16 20 018 36 + silt18 18 0 19 34 20 14 023 32
46 22 12 026 31 24 12 026 31 26 15 022 33 28 18 019 34 30 20 018 36 3 20 0 18 36 34 20 018 36 3G 20 018 36 38 20 018 36 4 0 20 018 36
l 1 42 22 40
(m) 44 22 40 46 L2 4 0 158 48 50 52 54 56 q =V ~ - 3 b =0 99middot35 = 35 MPp cp 53 58 6 0 62 64 66 68 70 72 74 76 78 80
APPENDIX 116
Pi leNo7 Length 60 m 0 15 m
Areas of influence
-
qe
(MPa)
1 Tp ~
(MPg) r~
(MPf) qcp (MPa)
Soil type
22 20 18 16 9 U33 30 14 10 031 31 12 135 024 32
l 2 (m)
16 10 08 06 04 02
13 12 6
10 175
025 026 043 0 31 020
33 31 26 3 1 35 50
Fine sand
+ silt
02 04 06
17 10 115
0 20 0 31 027
34 31 3 1
08 10
145 185
023 019
33 35 3 5
1 2 14
20 19
018 0 19
36 36 Fine sand
l 1 (m)
60
16 18 20 22 24 26 28 30 3 2 34 36 38 40
42 44 46 48 50 52 54 56 58 6 0
185 125 125 165 17 19 21 215 205 20 21 20 20
24 22 20 215 22 22 21 19 18 22
0 19 026 0 26 020 020 019 --
018 018 -
018 01 8 --
018 ----
0 19 0 19
35 33 33 33 34 36 40 40 37 36 40 36 36
40 40 36 40 40 40 40 36 34 40 219
+ silt
62 64 66 68 70 72 74 76 78 80
APPENDIX 117
Pile No 8 Length60 m D 15 m Dp 2 1 m
Areas of influence
-
qe
(MPa)
1 r +
(MPg) r~
(MPf) qcp (MPa)
Soil type
22 18 019 34 20 16 021 34 18 125 026 3 3 16 115 027 31 14 11 028 3 1 12 11 028 3 1
l 2 (m)
10 08 06
105 11 145
D29 028 023
30 31 33
Fine sand
+ silt
04 18 0 19 34 02 18 019 34 71
02 15 022 33 04 11 0 28 31 06 13 0 25 33 08 20 0 18 36 10 15 022 33 12 13 025 33 14 175 020 35 16 18 20 22
20 21 20 15
018 -
018 0 22
36 40 36 33
35 Fine sand
+ s i lt
24 26 28 30 3 =
13 16 175 19 20 20
025 021 020 0 18 018 018
33 34 3 5 34 36 36
36 38 4 0
20 20 21
018 0 18 -
36 36 40
11 (m)
4 2 4 4 4 6 48 50 5 2 5 4 56 5 8 60 6 2 6 4
20 20 21 22 21 20 19 175 19 20 25 28
018 0 18 ---
01 8 01 9 0 20 0 19 018
36 36 40 40 40 36 36 35 36 36 40 4 0 23 0
6 6 68 70 72 74 76 78
qcp 1f5=v 2T middot35 = b85 middot35 = 30 MPa
80
APPENDIX 118
Pi le No 9 Le ngth 90 m D 11 m m
Areas of 1Qe -9c qcp Soil typeinfluence Tp f ryen (MPa) (MPg) (MPf) (MPa)
-
2 2 2 0 18 16 14 lc 11 034 37
12 10 10 036 36 12 08 9 039 35 Medium(m) 06 10 036 36 sand04 10 036 36
02 11 034 37 43
02 12 032 38 04 12 0 32 38 06 12 0 32 38 08 13 030 39 10 13 030 39 12 13 030 39 14 14 028 39 16 14 028 39
44 18 14 028 39 20 14 028 39 39 Med ium 22 15 027 4 1 sand 24 16 026 4 2 26 17 025 43 28 13 0 30 39 3 0 9 039 35 32 13 030 39 34 16 026 42 36 17 025 43 38 17 025 43 40 19 024 4 6
11 42 17 025 43
(m) 44 15 027 41 17 7 46 48 50 52 54 56 58 60 6 2 64 66 68 7 0 7 2 74 76 78 80
APPENDIX 119
Pi 1 e No 10 Length 95m D 11 m m
Areas of influence
-
qe
(MPa)
1 fp
-9c f
(t-1Pf) [~
(MPf)
qcp
(MPa)
Soil type
22 20 1 8 16 14 L 2 13 Uti 3J
l 2 (m) 12
10 08 06 04
18 18 28 19
0 19 019 0 19 019
34 34 34 34
Fine
sand
02 21 40 42
02 20 4 0 04 17 020 34 06 21 40 0 8 10
23 22
40 40 Fine
1 2 14 16 18
21 20 16 15
0 21 022
4 0 4 0 34 33
sand
44
20 2 2 24 26 28 30 32 34 36 38 40
14 14 13 11 11 14 17 14 12 13 12
023 023 025 0 28 028 023 020 023 027 025 027
32 32 33 31 31 32 34 3 2 32 3 3 32
l 1 (m) 42
44 12 13
0 27 025
32 33 15 2
46 48 50 5 2 5 4 56 5 8 6 0 6 2 6 4 66 6 8 70 72 74 76 78 80
APPENDIX 11 10
Pi 1 e No 11 Lengt h 9 0m D 11 m m
Area s of influence
-
Qe
(MPa)
1 fp
__k_ f
(MP~) ryen
(MPf) qcp (MPa)
Soi l type
22 20 18 16 14 12 lb 55
12 (m)
1 0 08 06 04
23 19 20 21
024 023
55 46 46 55
Medium
sand
02 22 55 62
0 2 04
24 25
55 55
06 08
27 28
55 55
10 12 14
28 28 28
55 55 55 49
16 26 55
44
18 20 22 24 26 28 30 3 34 36 38 40
24 19 18 17 22 21 17 11 13 12 11 9
024 024 025
025 0 34 030 032 034 039
55 46 43 43 55 55 4 3 37 39 38 3 7 35
1 1 (m) 42
Ll Ll
12 16
032 0 26
38 4 2 209
46 48 50 5 2 54 56 58 60 62 64 66 68 70 72 74 76 78 80
APPENDIX 141
0 2 3 4 p [MPa)
PILES WITH 40 ENLARGED BASES
80
120
160 C----0
200 IN4014 s (1977)
[mm]
P s calculateds P p(s)(mm) (MPa)(mmMPa)(MPa) ()
10 035 286 046 20 065 308 080 30 090 333 104
150 24 625 214 200 229
ai = 2605 (mmMPa) b1 = 0243 1MPa V 1000 bi = 1b = 411 MPa
_ 411 MP Vi - 24 a
() assumed
average Dp = 18 m
qcp = 24 MPa ai = 184 (mmMPa) (28-4middot24)
Vi = 1 2 (3-18)
qcpmiddotvi = 29 MPa
40
80
120
160
200 s
[mm]
DIN 4014 Part 2 ( 1977)
0 1 2 3 4 5 p [MPal
PILES WITHOUT ENLARGED BASES
C----0
DIN 4014 ( 1977
s calculated s p -p- p(s)
(mm) (MPa)mmMPa)(MPa) ()
10 05 20 062 20 08 25 113 30 11 27 3 155
150 34 441 385 200 424
ai = 2085 (mmMPa) bi= 0 157 1MPa V = 0970
bi= 1s = 637 MPa
Vi 187=3f =
() assumed
average Dp = 12 m
qcp = 34 MPa a1 = 144 (mmMPa)
Vi = 18
qcpmiddotvi = 61 MPa
Range qc = 10-15 MPa
(28-4bull34)
(3-12)
1 1 q = r -r- = 036 for qc = 10 MPaCp p Ip+= 027 for qc = 15 MPa
qcp = 36-405 MPa P
APPENDIX 142
Touma F and Reese L (1974)
Soil parameters pile parameters and base resistance see fig bullbullbullbull
TAB
Measured load settlement curves
Settlement s
mm
10 20 30 40 50 60 80
100 120
a 1 (mmMPa) bi(MPa) V
N3u
q =04 -N30 (cMPa) ()
1 qCp=--rpbullqC
Pile No 21 (US 59) 22 (HH) 23 (G1) 24 (BB) Notep Sp p S p p S p f Sp MPa mmMPa MPa mmMPa MPa mmMPa Mla mmMPa
131 76 169 59 075 133 100 100 269 74 325 62 131 153 1 94 103 381 79 456 66 165 182 273 11 0 488 82 581 69 1 90 21 1 349 115 581 86 694 72 2 15 233 424 118 675 89 800 75 229 262 813 98 245 327 884 113 925 130
64 56 100 95 U049 0032 0276 0048 0944 0998 0996 0981
80 gt100 30 60 32 gt 40 12 24 ()
Bergdahl (1982)
gt5 5 gt55 32 4 3
(0 18middot32) (018middot40) (0265middot12) (018middot24)
CONTACT PRESSURE p [ MPa]
0 2 4 6 8 100 N-------r---------------(us 59) ( HH) ( BBi
E E SQ-------lt+-----+--------------lt
VI
1shyz UJ
~ 100 1---------i----+----+----+------l------I -J I shyI shyUJ V)
so~----~--~-- ~--~
APPENDIX 143
us 59 fYJo 0 50 00
ff-t r-=-~c~=~-r~c_---_---l-~e-J-C~ 0 ------
CLAY
FINE SANO
J lD- 760 mm
f5m~--~--~
Pile US 59 and results from penetration test
HH IV_l() so 100 r=-=-==-==-r-~--=-=- 0 0 II 15- flf ~ II~ Ibull If t f
CLAY SAND
Sm
)
= -middotl lo - GtOmm
~ JI
SILTY SANO tOm
Pile HH and results from penetration t est
APPENDIX 14 4
61 NJO 50 --------00
11 1 =f J - 1 -- 0
CLAYSILT
E ~ Sm ltrj
SILTY SAND
q I lDmiddot 910 mrn tom
I) t bull
Pile G1 and results from penetration test
88
0 50 too ~1-e I q 111bull - Q
CLAY
SIL TY SAND 5m
]
l lDmiddot760mrn
Om
Pile BB and results from penetration test
APPENDIX 145
Klosinski B (1977)
Loading tests 50 bored piles 09-125 m diameter average Op= 11 m On t he sett l ement of rigid pla te the settlement of t he pi le base is given by
PmiddotOSp = T-K b
where Mb - equivalent deformability modu lus
1) Sand and sandy gravel of medium density
Mb = 25-50 MPa
According to Bergdahl (1979) medium sand is between
q(l) 5 MPa (Io=035)c2)
ql = 10 MPa (Io=065)C
from fig 117 rp1 = 055 for qc = 5 MPa 1Tp = 036 for qc = 10 MPa
q(l)= 0 55middot5 = 2 75 MPacp bull
q(2= 0 36middot10 = 360 MPacp
allowable p~ 1)= ~p = yen = 092 MPa and p~2) = ~ = 120 MPa
settlement of the pi l e base
5(1)= o 92 middot 1bull1 = O 0135 m = 13 5 mm p 325 middot middot
5( 2)= 1bull2bull1middot 1 = O 0088 m = 8 8 m p 350 bull bull
1) _ s _ 135 _ 14 7 (mm) a(2) _ 88 _ a 1 - p - o---92 - bull NPa bull 1 - T-7 - 733 (Wa)
2) Loose sand lo= 030-040
Mb = 12- 25 MPa
q~l) = 44 MPa q~2)= 58 MPa
1Tp = 058 and 052
q(3) = 0 58middot4 4 = 2 55 MPa middot q( 4) = 0 52middot5 8 = 3 02 MPa cp bull middot bull cp bull middot middot
allowable p~ 3)= 4i = 085 MPa p~4)= yenl = 101 MPa
s(3)_ 085-11 = 26 mmmiddot s(4)_ 101middot11 = 148 mm p - 312 p - 3 25
STATENS GEOTEKNISKA INSTITUT Swedish Geotechnical Institute S-581 01 Linkoping Tel 01311 51 00
Serien Rapport ersatter vara tidigare serier Proceedings (27 nr) Sartryck och Preliminara rapporter (60 nr) samt Meddelanden (10 nr)
The series Report supersedes the previous series Proceedings (27 Nos) Reprints and Preliminary Reports (60 Nos) and Meddelanden (10 Nos)
RAPPORT REPORT Pris kr
No Ar (Swcrs)
1 Grundvattensankning till foljd av 1977 50shytunnelsprangning P Ahlberg T Lundgren
2 Pahangskrafter pa langa betongpalar 1977 50shyL Bjerin
3 Methods for reducing undrained 1977 30shyshear strength of soft clay K V Helenelund
4 Basic behaviour of Scandinavian soft 1977 40shyclays R Larsson
5 Snabba odometerforsok 1978 25 shyR Karlsson L Viberg
6 Skredriskbedomningar med hjalp av 1978 40shyelektromagnetisk faltstyrkematning - provning av ny metod J Ingands
7 Forebyggande av sattningar i 1979 40shyledningsgravar - en forstudie U Bergdahl R Fogelstrom K - G Larsson P Liljekvist
8 Grundlaggningskostnadernas fordelning 1979 25 shyB Carlsson
9 Horisontalarmerade fyllningar pa los 1981 50 shyjord J Belfrage
RAPPORTREPORT
No
10 Tuveskredet 1977-11-30 Inlagg om skredets orsaker
11a Tuveskredet geoteknik
l1b Tuveskredet geologi
11 c Tuveskredet hydrogeologi
12 Drained behaviour of Swedish clays
R Larsson
13 Long term consolidation beneath the test fills at Vasby Sweden YCE Chang
14 Bentonittatning mot lakvatten T Lundgren L Karlqvist U Qvarfort
15 Kartering och klassificering av leromradens stabilitetsforutshysattningar L Viberg
16 Geotekniska faltundersokningar Metoder - Erfarenheter - FoU-behov E Ottosson (red)
17 Symposium on Slopes on Soft Clays
18 The Landslide at Tuve November 30 1 977 R Larsson M Jansson
19 Slantstabilitetsberakningar i lera Skall man anvanda total spanningsanalys effektivspanningsanalys eller kombinerad analys R Larsson
20 Portrycksvariationer i leror i Gateshyborgsregionen J Berntson
21 Tekniska egenskaper hos restproshydukter fran kolforbranning shyen laboratoriestudie B Moller G Nilson
Ar
1981
1981
1981
1981
1981
1982
1982
1982
1983
1982
1983
1983
1983
Pris kr (Swcrs)
50shy
50shy
40shy
50shy
100shy
60shy
80shy
60shy
190shy
75shy
60shy
150shy
65shy
RAPPORTREPORT
No Ar Pri s kr (Sw crs)
22 Bestamning av jordegenskaper med sondering - en litteraturstudie U Bergdahl U Eriksson
1983 75 shy
23 Geobildtolkn ing L Vi berg
av grova moraner 1984 70 -
24 Radon i jord -Exhal ation- vatten kvot -Arstidsvariationer - Permeabilitet A Lindmar k B Rosen
1984 75 shy
25 Geoteknisk terrangklassificering for fysisk planering L Viber g
1984 120shy
26 Large diameter bored piles in nonshycohesive soils Determination of the bearing capacity and settlement from results of static penetration tests (CPT) and standard penetration test (SPT) K Gwizdala
1984 85shy

10
Ultimate point resistance of large diameter piles based on static sounding results
Ultimate skin friction resistance of large diameter piles based on static sounding results
Qa Allowable pile load
Qcp Point load of the static cone penetrometer
Qct Total load of the static cone penetrometer
Qpa Allowable point resistance of the pile
Qpu Ultimate point resistance of a pile
0 sa Allowable skin resistance of the pile
0su Ultimate bearing resistance of a pile
Qu Ultimate bearing resistance of a pile
s Settlement
sd Standard deviation
ss u Ultimate settlement for pile shaft
sv Standard variation
SPT Standard Penetration Test
t Unit shaft resistance
Ultimate unit shaft resistance
Circumference of the pile shaft
Circumference of the static penetrometer shaft
Greek letters
a Constant
B Constant
A Coefficient
microd Depth factor
v Poissonbulls ratio
v 1 Correction factor for hyperbola point resistance shysettlemen~ relationship
n Correlation coefficient
ahc Radial (horizontal stress in the concrete
ohs Radial (horizontal) stress in the soil
Ovc Vertical stress in the concrete
Ovs Vertical stress in the soil
11
1 LARGE DIAMETER BORED PILES IN NON-COHESIVE SOILS
11 peterminati on of bearing capacity of bored piles
from results of Cone Penetration Test (CPTl
The methods published in available literature up to 1976
were compiled by D Rollberg (1976 1977) It contains
totally 25 methods
- 22 use the results of static soundings (CPT)
3 use the results of standard soundings (SPT)
The failure load Qu of the pile is evaluated as the sum
of the pile point resistance Q and the pile skin reshypu sistance Qsu
(111)
Pile point resistance Q based on static soundina reshypu shysults can be expressed as
1- bull qP A ( 1 1 2)f C p
p
where
fp = point resistance factor
qP mean sounding resistance of static cone C
penetrometer in the area of the pile point
A cross-sectional area of the pilep
The pile skin resistance is expressed as
1 s -- bullq bullU middot Lih (113) fS C p
where
fs = shaft friction factor
sqc mean sounding resistance along the depth h
and skin surface area U middotLih p
1 2
The methods differ in
- the calculation of qPC
(074 to 40) Db below the pile base (Fig 11 1)
(10 to 80) Db above the pile base (Fig 1 11)
- the evaluation of the point resistance factor usually
values off gt 10 are used p
- the calculation of qsC
- the evaluation of the shaft friction factor
fs = 50-300 is applied
In Table 111 methods for determination of the bearing
capacity of bored piles are listed Rollberg 1977 The
point load the skin friction load and the ultimate total
load are evaluated for bored piles (shaft diameter D ~
03-090 m) from static sounding results in non-cohesive
soil
Calculation results based on static sounding measurements
are shown in Table 112 for pile point pile shaft and
total pile load respectively
The table shows that
- a ll methods overestimate the ultimate point resistance
- the best correlation for ultimate point resistance is
obtained with the Soviet method Trofimenkov 1974
n1 = 114
- there a re only five methods for evaluation of the ultimate
skin resistance
- all methods with exception of the Soviet norm Trofimenkov
1969 method overestimate the ultimate shaft resistance
- the Norwegian method Senneset 1974 gives the best
correlation for the ultimate shaft resistance =119n 2
- with exception of the Soviet methods the total ultimate
load is on the average overestimated by all methods
1 3
Taking into account the above results the Soviet and
the Norwegi an methods are presented below
The Soviet method JG TrofimenkgtV 1974
1 qP bullA + qsbullA (114a)Qu = Qpu+Qsu fp C p f C s s
where
11 40 DP 12 1 0 D p h+l1 qp r dhqcC l1+l2 h-12
0ct-0ceqs C u middoth s
f(qp) -+ see Fig 1 bull 1 2 fp C
f f ( qcs) -+ see Fig 1 1 3 s
The Norwegian methon K Senneset 1974
1 p A 1 s bullA ( 1 bull 1 bull 4b)-f-middotqcmiddot p + -f-q s p S C
where
11 30 D p
12 50 D p h+l11 f dhqP l1+l 2 qc
C h-12 h s 1
= f dhqc qch 0
f 20 p
f = f (q~ ) + see Fig 114 s
Note a ) The total skin friction -f-middotq~ is assumed to be
no less than 10 kPa even~ith a very little
cone penetrometer resistance
b) The poin t resistance -f-middotq~ is assumed to be
maximum 10 MPa even iJl case of very dense sand
14
It must be underlined that the best correlation for
the pile point is obtained with the Soviet method
101 for 94 driven piles in non-cohesive soil
- 172 114 for 46 bored piles in non-cohesive soil
Trofimenkov 19731974 showed the results of comparison
of the ultimate loads determined by formula (114a)
Q~ and by pile load tests Q~ for 153 driven friction
piles at the 57 various sites see Fig 115
In Germany a lot of investigations were made before
establishing the DIN 4014 part 2 (1977) on large diameter
piles
In Table 113 and 114 the results from these investigashy
tions are generalized
The data in the tables were obtained from 35 test loadings
(4 of which were published by Franke 1973 The diameter
of the piles was from 08 to 25 m the length from 5 m
to 34 m and the cone penetrometer resistance varied from
10 MPa to 15 MPa
Bustamente and Gianeselli 1982 proposed a prediction
of the pile bearing capacity by means of the static
penetrometer Their proposal was based on the intershy
pretation of a series of 197 full scale static loading
tests In this paper the results from tests of 55 bored
piles are chosen The diameter of the piles varies from
042 m to 150 m and the length from 6 m to 44 m The
equivalent cone resistance was determined as showed in
Fig 116 The authors have noticed that the point
resistance factor f depends on the nature of the soil p and its compactness but also on the different pile placeshy
ment techniques (see Tab 115)
Piles of category group I
- Plain bored piles - Cased bored piles
- Mud bored piles - Hollow auger bored piles
- Type I micropiles - Piers (grouted under low - Barrettespressure)
15
In Tab 116 values of the shaft resistance factor
fs are given
Category IA
- Plain bored piles - Mud bored piles
- Hollow auger bored piles - Cast screwed piles
- Type I micropiles - Piers
- Barrettes
Category IB
- Cased bored piles - Driven cast piles (concrete or metal shaft)
Category IIA
- Driven precast piles - Prestressed tubular piles
- Jacked concrete piles
Category IIB
- Driven metal piles - Jacked metal piles
It can be noted that the values in Tab 116 are in
genera l of the same range for the driven and the
bored piles
According to the Polish Specification 1979 the point
and shaft resistance factor are given by
1-f- = kmiddota
p p
where
ap 035 for sand
k coefficent of unhomogeneity k qcp min
qcp
= 0065 for sandfrac12
1
16
Similar results can be observed in Fig 116a and
Fig 116b It was showed by Kerisel (1965) and Franke
(1973) that the harder soil the more loosening at
excavation and thus relatively smaller bearing capacity
Taking into account the Franke diagrams we will have
for D = 125mand settlements= 2 cm p
Cone resistance qc (MPa) 1 5 50 1 0 15 22
qc p for s=2 cm 3 6 8 12 14
(see Fia 1 1 6b )
taking safety factor for pile base F = 3 the point resis~ance
33-10 ~-05
380375 lo 212 bull lo 2114 bull
factors- shy are p
The above anal ysis shows that it is possible to determine
ultimate point and shaft resistance of bored piles from
static cone sounding But it is very important and must
be taken into account type of pile kind of soil and
degree of compaction
Bel ow calculation method for large diameter bored piles
based on the static cone penetrometer resistance (CPT)
is proposed Equation (117) can be used directly for
the base diameter D lt 15 m For larger diameters p shyD gt 15 m the values should be multiplied by the
p ff t ITscoe icen Y~ as pi
( 1 1 5 )
where
qcp = according to equation (117)
D = diameter of the pile base D gt 15 mpi pi
17
This value q~p should be put into equation 116
The value qc s in equation 118 is independent on the
pile diameter
Proposed calculation method
(116)
where)
1 1 40 ~ 11 3 for piles wit h a nd enlarged bases12 10 12 = ~
h+h
q (h) dh (117)qcp l1+l2 f -f- Ch-li p
h 1 f 1
qcs = o -f- qc (h) dh (118)h s
1 -f- = f(q kind of soil ) -+- see Fig 11 7 and Tab 1 1 7
C p
f (q kind of soil ) -+- see Fig 1 1 8 and Tab 1 1 8 fs C
Note
a) the point resistance q for qc gt 20 MPa is assumed cp to be maximum as
- Gravel 70 MPa - Coarse sand medium sand 55 MPa - Fine sand s il ty sand 40 MPa
b ) The shaft resistance qcs for qc gt 20 MPa is assumed to
be maximum as
- Gravel 110 kPa - Coarse sand medium sand 90 kPa - Fine sand s ilty sand 70 kPa
These proposed values are compared with results by
Bustamente (1 982) and the Polish Specification (1978)
Fig 11 9 and F i g 1110 A similar comparison for DIN
4014 1 977 is shown in Fig 1111 and Fig 1112
) In this paper was used the above values 1 1 and l z But it can be used in practice 11 =30 D and h =2Dp respectively The results shall be very simi l ar to the above onPs
18
The proposed method has been examined with field test
results This is shown in Fig 1113 to Fig 1128
and Appendix 1 11 to 1110 and Tab 119
The comparison shows that the value of q in equationcp (117) corresponds to the settlement -10 of the base
diameter (s=010 DP) see Fig 1113 and Tab 119
(average sDp=88 and standard deviation sd=3)
Later in this paper the allowable load and dependence of
the load versus settlement will be determined
12 Determination of bearing capacity of the large
diameter bored piles from results of the Standard
Penetration Tests (SPT)
There are little published on pile tests coupled with
results from Standard Penetration Test (SPT) Among the
authors who have published material in the subject are
- Meyerhof 1956 1976
- Senneset 1974 (Norwegian method)
- Rodin Corbett Sherwood Thorburn 1974 (English method)
- Polish Specification 1975
- Weltman Healy 197 8
- Reese 1978
- Japanese Society 1981
- Decourt 1978 1982
The Norwegian method is valid o nly for concrete andor
wooden piles the English method only for gravel It is
very important to underline that the Norwegian a nd the
English methods use of the SPT resul ts intermediate by
the static cone penetrometer resistance (q ) as well C
Below methods are presented that are using the results of
SPT directly Meyerhof s method in total can also be used
on driven piles in non-cohesive soil Although we could
have found some proposes for bored piles Eqs (121 and
122) see Fig 121 and Fig 1 22 as well
19
Ultimate point resistance (psf)
12 N 3 omiddotH lt 120 N 30
(kPa) (1 2 1)Psf D
where
N30 the average standard penetration resistance
in blows per 03 m
H depth in bearing stratum
Ultimate skin friction tu
for bored piles tu N~ o (kPa) (1 22a)
for driven pil estu 2N30 (kPa) (1 2 2b)
where
N30 the average standard penetration resistance
in blows per 03 m within embedded length
of pile
Weltman and Healy (1978) taking into account Meherhofs
proposition for driven piles have introduced two coefshy
ficents for bored piles in gravels (glacial soil) Equ
123 and Fig 1 23
t = a 2 N30 (kPa ) (1 2 3)U 1
where
ai a 1 for impermeable gravels see Fig 123a
ai a 2 for permeable gravels see Fig 123b
The Polish Specification ( Specification for Design and
Construction of Large Diameter Bored Piles in Bridges
1975 Ministry of Transport) gives the ultimat e point
resistance in dependence of N30 base diameter and depth
see Tab 12 1 The Tab 121 contains values for coarse
and medium sand For other non-cohesive soils the following
coefficients are proposed
p f = S bull p f (medium sand) ( 1 2 4)S 1 S
20
where
S1 1 20 for grave lSi
f 132 080 for fine sand
13 3 070 for silty sand13i
In Fig 124 values of psf are shown for h = 10 m DP
06 m DP= 15 m and h = 20 m DP= 06 m DP 1 5 m
respectively
A few of the instrumented piles were tested and analyzed
by Wright and Reese (1979) The ultimate point and shaft
resistance in the fine and silty sand as a function of
blow count from SPT is shown in Fig 125 Results from
two additional tests reported by Koizumi (1971) are also
introduced in the figure The ultimate point resistance
is assumed to exist at a settlement equal to 5 of the
base diameter
Methods of prediction of the bearing capacity of piles
based exclusively on N30 values were presented by Decourt
1982 Below a proposition for high capacity piles excavated
and cast under bentoni te is presented
The ultimate skin friction is determined by the expression
(see Fig 126)
t = 33 N30 + 1 0 (kPa) ( 1 bull 2 5 ) u
where
N30 average value of N30 along the shaft
- for N30 lt 3 must be taken as = 3N30 - for N3o gt 5 0 must be taken as NJo= 50
The allowable point resistance can be obtained in a n
expedite way as
Psa = 33 N30 (kPa) (1 2 6)
where
N30 = average of Nat point level one metre above
and one metre below
Psa allowable point resistance
21
Decourt proposed a safety factor for the point of F = p
40 Therefore the ultimate point resistance can be
determined by the expression
(kPa) (1 2 7)
In Fig 12 7 and Fig 1 28 the above values for base
and skin friction resistance are compared respectively
Taking into account the type of soil thereis a good
correlation for ultimate point resistance The result for
ultimate skin friction is scattered but only apparently
The values for large diameter bored piles are between
the line 1a and 1b in Fig 128 Large diameter piles
have a high ultimate skin friction in relation to driven
piles (see points for bored piles in Fig 122 and DIN
4014 Part 2 1977 as well) The high values for piles
excavated and cast under bentonite have had a strong base
on the load tests (Decourt 1978 1982 and Wright and
Reese 1979)
Below the proposals are given for determination of the
values of the ultimate point resistance and the ultimate
skin friction Eqs 128 to 1214 and Fig129 1210
The ultimate point resistance
- gravel psf = 140 N30 (kPa) ( 1 bull 2 8)
for N~ 0 gt 50 blows3O cm Psf 7 MPa
- coarse sand and medium sand
(kPa) ( 1 2 9)
for N30 gt 50 blows3O cm Psf 55 MPa
- fine sand and silty sand
psf = 80 Nio (kPa ) (1210)
for N30 gt 50 blows3O cm p f = 40 MPa 5
where N3 o the average of N value near the point level as
22
h+l1
f N3o(h)dh ( 1 2 11 ) h-12
3DP see Fig 1 1 1 D
p
The ultimate skin friction for coarse sand and medium sand
tu = 1 8 N 3 o (kPa) (1212)
t (kPa) (excavated and cast (1213)u under bentonite)
where
N30= the average value of N along the shaft as h
N -
3 o = h1 f N 3 o ( h) dh ( 1 bull 2 bull 1 4 ) 0
The ultimate skin friction for N30 gt 50 blows30 cm is
assumed to be maximum as tu = 90 kPa and t = 150 kPa u
13 Allowable load of large diameter bored piles
The allowable load Qa of large diameter piles has been
expressed as
OuQa ( 1 3 1)Ft
Qa Q(s)=Qb(s) + Os(s) ( 1 3 2)
Opu + Osu (1 3 3)Qa Fp Fs
Qr lt mmiddotQf ( 1 bull 3 4)-
= universal safety factor
individual safety factor for ultimate resistance of the pile point
individual safety factor for ultimate resistance of the pile shaft
= load according to the allowable settlement
calculated load
m coefficient
calculated ultimate bearing load of the pile
23
The equations from (131) to (134) are used as
1) equation (131)
a) DIN 4014 - 1977 Ft= 2 175 15 (depending on the kind of load)
b) Polish Specification 1975 Ft = 18 16 ( -- )
1c) Trofimenkov 1974 Ft = 14307
2) equation (132)
a) DIN 4014-1977 i Q(s) = Qb(s) + Q (s) = A middotp(s) + E tAsmiddott(s)
s p 0
where Qbs) and Qs(s) are described in Fig 1423
3) equation (133)
a) Polish Specification 1974
F 25 22 depending on the kind of load p
F 1 bull 0 s
b) Wright SJ Reese LC 1979
The ultimate capacity or resistance is considered as a
random value and represented by a frequency distribution
The distribution can be described by a mean value and a
variance The distribution of the load applied to the
foundation can be described similarly The coefshy
ficients used to factor resistance and loads are called
partial safety factors Some recommended partial safety
factors for resistance under normal conditions of design
and construction are given in Tab 131 Normal control
is defined as a condition where the coefficient of variation
is less than about 035
Typical values for partial safety factors for loads are
in the range 1 to 2 depending on the type of load and
how it is applied The overall factor of safety Ft can
then be calculated from the equation
Ft = y RbullY S
24
where
YR the par tial sa f ety fac t or for resistance and
Ys the partial safety factor fo r load
The probability of fa i lur e of the foundation can be r eshy
lat ed to the factor of safety for a parti cular degree of
uncert ainty (see Tab 13 2)
c ) Tejchman Gwizdala 1979
The authors discuss adequate safety factors based on fie l d
test s by Spang (1 972) Franke (1976) Touma and Reese (1974)
Colombo (1971) Kerisel and Simons (1962) Appendirno (1973)
see Tab 1 33 Taking into account the universal safety
factor Ft= 2 0 for the tota l load settlement curves it
was estimated
i) F in the range of 111 to 237 with the average value s F = 166 and standard deviation sd = 034 s (see column 16 Tab 133)
ii) Fb in the range of 161 to 945 with the average
value Fb = 387 and standard deviation sd = 2 15
For model core d piles in laboratory conditions values of
Fs = 108 to 154 (average Fs = 132 s~ = 019) and
values of F = 280 to 5 94 (average F = 3 55 sd = 1 07)p p
see Tab 1 3 4
As a conclusion it was assumed that Fb = 40 and F 1 5 s
for l arge diameter bored piles
The investi gation has shown that for the above safety
factors settlements of piles under permissibl e loads are
10 to 20 mm There was assumed a maximum load on large
diameter piles corresponding to a settlement of 010
diameter of the piles
25
d) Bustamente Gianeselli 1 982
e) 0ecourt 1982
The safety factor is given by
F = FgmiddotFfmiddotFamiddotFw where
F 11 - skin friction g F 135 - point bearing capacity
g
Ff safety factor related to the formulation adapted
Ff= 10 for Decourts method
Fd safety factor related to excessive deformation
Fd = 10 for skin friction
As for the point Fa= 2 to 3 depending on the
pile diameter For usual cases 25 is suggested
Fw safety factor related to working load
Decourt recommends 12
Thus we will have
- for skin friction
Fs = 11bull10middot10middot12 132 - 13
- for the point
F = 135bull10bull25middot 1 2 = 405 = 40 p
4) equation (134)
a ) Polish Code 1983
Q lt mbullN r shy
where
total load coefficient (depending on the kind of load For foundation we can assume Yf = 12 )= code load
correction coeffic i ent
09 for pile foundations
m 08 for two piles
m 07 for single pile
26
N ymmiddotQu
ym material (soil) coefficient
ym 08 to 09 (Polish Code 1981)
Thus we will have
QnmiddotYf lt mmiddotym middotQu-
Yf9uFt = On m bull Ym
1 2 max = 2 14Ft 0 7 bull 0 8
1 2min = 1 48Ft 0909
The above analysis has shown different ways to determine
the allowable load The analysis is in direct connection
with mobilization of the load (versus settlement) The
dependence of total load point resistance and shaft reshy
sistance will be discussed in detail in Chapter 14
In the authors opinion taking into account the above
analysis the allowable load should be determined based
on the equation 133 ie based on individual safety
factors for ultimate point and shaft resistance Proposed
values of F and F in literature are shown in Tab 135 s p The average values are Fs = 145 and Fp = 3 38 respectively
Taking into account that the bearing capacity is determined
based on the results from sounding measurements direct from
a place near the piling without a ny indirect correlation
the allowable load of large diameter bored piles is given
by the equation (133a)
( 1 3 3a)
where F = 30 and F 13 are proposedp s
27
14 Determination of settlement of larqe diameter bored
piles based on static cone penetration tests CPT
Determination of ultimate point and skin friction resistance
based on static cone penetration tests has been discussed
in Chapter 11 above Based on the results of this calcushy
lation and on Chapter 13 we can establish an approximate
relation between point resistance shaft resistance and
total load on one hand and settlement on the other However
the approximation gives a wide scatter especially for base
resistance as can be observed in Fig 141 to Fig 144
Only the first part of the point resistance - settlement
curves are in good agreement with measured values It can
be observed in Fig 145 that the average correlation
coefficient n = 098 and standard deviation sd= 029
This way of calculation can be used only for rough calcushy
lation (see Chapter 13)
In Chapter 11 also measured point resistance - settlement
curves were shown The base resistance increases gradually
with increasing pressure and settlement Below the cur7
vature of the point resistance - settl ement curve will be
examined It is assumed that this curve can be described
as a part of the hyperbola curve Thus if the ratio of
the measured settlement (s ) to the point resistance (p)
is plotted against the measured settlement the result
will fall closely to a straight line with the equation
( 1 4 1)
where a 1 and b 1 are constants (see Fig 1 46a and Fig
14 6b)
Then the point resistance - settlement realtionship can be
expressed as a hyperbola
s p = ( 1 bull 4 2)
The constant is the initial s lope of the point resistanceshya 1
settlement curve ie a 1 = t~a The inverse of the constant
28
b 1 is the vertical tangent (asymptote) to the curve 1ie for s = 00
bf= ~ If the ultimate point reshy1
sistance psf is equal to bf (psf=bf) the whole point
resistance settlement curve will be a hyperbola type
Now the Eq 1 4 2 can be written as
s s ( 1 4 3)a) p s or b) p = a+__sect_a1 + 1 Psfbf
If the ultimate point resistance is smaller than bf only
a part of the hyperbola curve ought to be considered
Further the Eq 14 3 will be written as
p ( 1 4 4)
where
poundf_ correction factor for hyperbola point Psf resistance-settlement relationship
Taking into account the discussion in Chapter 11 the
ultimate point resistance psf = qcp based on the CPT measurements
Therefore the relationship between the point resistance
the sett l ement and the CPT result can be expressed as
s p (1 4 5)s
The correction coefficient v 1 will cause a change of the
position of the vertical asymptote bf in r elation to the
ultimate point resistance q bull This means that we take cp into account a different part of the hyperbola curve for
the description of the point resistance-settlement relationshy
ship
Now if we want to use the equation (145) in practice
we must determine the constant and the coefficienta 1 v 1 (assumed that q is determined ear l ier Chapter 11)cp
29
The constant a 1 and t h e coefficient Vi have been detershy
mined based on fi e ld tests according to pi l es No 1 - 20
see Tab 14 1 and Tab 1 1 9 as wel l The values of
a 1 versus the point diameter D and the ul timate pointp
resistance respectively are shown in F i g 147 and Fig
148 Fig 1 47 shows that a 1 is independent of the
point diameter D Based on Fig 148 it can be assumed p
that
28-4bullq (1 4 6)cp
This correlation has been examined with data of the
literature see Fig 1 49 and Appendix 141 to 1 45
(Note there were no static penetration tests and qcp was determined based on a correlation made by Bergdahl
(1982))
A good correlation with equation 146 can be seen taking
into account the safety factor in the DIN 4014 Part 2
(1977) bull
The correction factor v 1 versus the poi nt diameter is shown
in Fig 1410 I t is assumed that the correlation is
V1 = 3 0 - D ( 1 4 7)p
where D is in m p
The above equations ie 146 and 147 were assumed for
a later analyses see Fig 14 11 and Fig 1412 The
piles No 1 to 20 were examined taking into account Eqs
14 5 14 6 and 1 4 7 The result of this cal cul ation is
presented in Fig 1 413 to Fig 1 4 18 and in Tab 1 4 2
respectively In Fig 1413 the calculation way for pile
No 2 is shown as an example
In Fig 1414 to Fig 1 417 measured and calculated
values of the point resistance versus settl ement can be
compared In tota l good correlation exists for all the
30
pressure-settlement curves Values of q from static cp
cone penetration tests and generalized values of anda 1
v 1 were considered Only for piles No 17-20 qcp was
assumed as the point resistance for s = 010 D because p
the static penetration test results were inaccessible
The similar comparison is shown in Fig 1417a for piles
in sand based on experimental results (Tuoma Reese 1972
and Wright Reese 1979) where the ultimate case resistance
was assumed as the resistance at a base settlement of 005
D The relative base resistance is the mobilized base p resistance divided by the ultinate base resistance The
curvature of the proposed point resistance settlement shy
curve to mean value proposed by Wright and Reese is excellent
However the constant a 1 and the coefficient v 1 were
determined for sand only In the future they should be
examined especially for gravel and silty sand based on
field tests Until then in the authors opinion the
values of v 1 can be chosen from Eq 147 for all nonshy
cohesive soils But for a 1 there is proposed
at = gt bulla (1 4 8)1
where
gt- 1 = 080 for gravel
gt 2 120 for silty sand
This proposal is shown in Fig 14 11 as dashed lines
A good correlation can be seen with the investigation by I
Kiosimiddotnski for sandy gravel and on the safety side with
the investigation by Tuoma and Reese for silty sand (see
Fig 149)
In Fig 1418 all calcul ations for pile No 1 to 20 are
summarize d The correlation coefficient n is defined as
the calculated point resistance p(s) divided by measured
point resistance p(s) For totally 126 points from 20
curves an average of n = 098 with standard deviation
31
al= 023 was obtained see Fig 1418 A similar result
can be observed for the range usually assumed of the
allowable settlement for sinqle large diameter bored
piles as
for
- for
- for
s
s
s =
10
20
30
mm a
mm
mm
verage n10 II
II
mm 089
095
099
and sd =
and sd
and sd
031
027
026
It can be questioned whether the sonstant a 1 can be deshy
termined in different ways The constant a 1 is the initial
slope of the point resistance-settlement curve as menshy
tioned above Then we can use all methods for determination
of settlement of a pile point The range of validity of
these methods then must be determined This will be shown
later
In order to be able to design the total load settlement
curve the skin friction resistance-settlement relationshy
ship must be determined The ultimate skin resistance of
large diameter bored piles was determined in Chapter 11
(based on static penetration tests) and in Chapter 12
(based on standard penetration tests)
In the past a lot of field tests have been done on the
mobilization of the shaft resistance versus pile settleshy
ment In this subject there is a rather good agreement
in the whole investigation for cohesive and non-cohesive
soil
Some results and opinions on thispresented in the literashy
ture during the last few years are shown below
Ultimate shaft resistance versus settlement
1) BurlandJB Butler FG Duncan P (1969)
-The shaft l oadsettlement curve is derived using a=0 3
with 90 ultimate load being mobilized at 025 in
settlement(~65 mm)
- soil London clay
- see Fig 1 419
32
2) Touma FT Reese LC (1974)
- The failure of the sides of the shaft takes place
at a downward movement of about 04 in (10 mm)
- soil sand
- see Fig 1420
3) Tomlinson HJ (1977)
- The maximum shaft resistance is mobilized at a
settlement of only 10 mm (or j in)
- soil stiff clay
- see Fig 1421
4) Klosinski B ( 1977)
- It was assumed that skin friction increased proshy
portionally to pile settlement up to the limit value
s bull This value depends on soil conditions and pile0 diameter and is usually from 3 to 8 mm For soft
compressible soil it may be grater than 10 mm
- soil cohesive soils
- see Fig 1422
5) Franke E Garbrecht D (1977)
- At settlement of 2 to 3 cm which are normally
allowed in Germany under working loads for buildings
not very sensitive to differential settlementsthe
skin friction is almost always fully mobilized
- soil sand
6) DIN 4014 part 2 (1977) and Franke E (1981)
- The skin friction Tm is approximated as diameter
independent having failure settlements of smf = 2 cm
in sand and 1 cm in clay
- soil sand and clay
- see Fig 1423
33
7) Reese By L (1978) Reese By L Wright SJ (1979)
(1978) The maximum skin friction being developed at
an average downward movement ranging from about 05shy
2 of the shaft diameter The average of six load tests
reported by Whitaker and Cooke (1966) are a lso plotted
for comparison
- soil stiff clays
- see Fig 1424 and Fig 1425a
(1979) The relative settlement is the average settleshy
ment of the butt and base devided by the shaft diameter
The mean curve maximises at a relative settlement of
about 002 D
- soil sand and clay
- see Fig 1425b
8) Tejchman A Gwizda3a K (1979)
- A clear differentiation of the distribution of shaft
and base resistances is observed for changing settleshy
ment For fairly small settlements the shaft resist shy
ance increases quite fast and the ultimate values
are reached soon while the base resistance increases
gradually with increasing loads and settlements withshy
out clearout ultimate values it can be assumed that
complete mobilization of shaft resistance corresponds
to settlements equal to 001 or 002 diameter of pile
- soil cohesive and non-cohesive soils
- see Tab 131 and Fig 1 426
9) Promboon S Brenner R P (1981)
- Load distribution and load transfer curves disclose
that most of the load is carried by shaft friction
which is developed at small displacements in the order
of 10 mm
- soil Bangkok clay
- see Fig 1427
34
10) Prodinger w Veder Ch (1981)
- The maximum value of skin friction resistance
occurred for a total settlement of 12 mm
- soil silty clay and sand
- see Fig 1428
11) Farr JS Aurora RP (1981)
- Ultimate load transfer was recehed (or nearly reached)
at a relative settlement of about 04 in (10 mm)
- soil gravelly sand
- see Fig 1429
12) Decourt (1982)
The skin friction resistance is totally mobilized
with deformations of about 10 mm or at the most 15
mm regardless of shaft dimensions This observation
of ours seems to clash with the opinions of other
authors who seek to relate the deformation necessary
for full skin friction mobilization with the shaft
diameter
- soil cohesive and non-cohesive soil
In Tab 143 all these results are shown Depending on
the kind of soil the following v a lue s of ultimate settleshy
ment for shaft can be assumed
- averages 142 mm (sd 5 3 mm) for sand
- averages 100 mm (sd = 21 mm) for cohesive soil
averages 726 mm (sd 67 mm) for claysand
It can be observed (see Fig 1419 to 1428) that the
shaft friction resistance increases proportionally to
the pile settlement up to the above limit value and
thereafter becomes constant
35
Taking into account what was mentioned earlier on point
resistance settlement relationship and the above results
a relationship between total load point resistance and
shaft resistance on one hand and settlement on the other
can be made see Fig 1430
It is assumed on the safety side that the following
ultimate settlement (S~) exists for the shaft resistance
of large diameter bored piles
SS1 ) 200 mm for non-cohesive soil u SS2) = 100 mm for cohesive soil u SS3) 15 0 mm for claysandu
In Fig 1 430 the curve Q (s) is calculated based on p
the equation 14 5 or 144
The values of psf in equation 144 can be calculated
based on other methods as well
The total load-settlement relationship is obtained by
summing up point and s haft resistance as
Q (s) = Q (s) + Q (s) (149)s p
for each point
Now the allowable load can be determined from equation
133a and versus the allowabl e settlement as
Q (s) = Q (s) + Q (s) (1410)s p
where s lt Sa
Sa= the allowable settlement of the pile
The analysis allows determination of the approximative
load settlement dependence without calculating the settleshy
ment for non-cohesive soil In Fig 1431 it is shown
36
In Tab 144 the settlement for allowable point reshy
sistance q5P according to equation 133a is shown
as well The average settlements= 198 mm (sd=78 mm)
is obtained This value is similar to the assumed ultimate
settlement of shaft for non-cohesive soil The ultimate
settlement for point resistance is assumed s = 010 Dp as mentioned earlier
37
15 Initial slope of pile point resistance shy
settlement curve
Settlement of piles and pile foundations can be cal culated
based on
- empirical correlations
load-transfer methods using measured relationships
between pile resistance and pile movement at various
points along the pile
- theory of elasticity that employs the equations of
Mindlin for subsurface loading within a semi-infinite
mass
- numerical methods and in particular the finite element
method
- use of in-situ tests (Cone Penetration Test Standard
Penetration Test Pressuremeter Test)
The critical slope of the pile point resistance-settlement
curve is important for calculation in chapter 14 The
constant a1 can be determined from all the above mentioned
methods
Comparison is made to Berggrens and Schmertmanns methods
below (see Berggren 1981 as well)
6sIn Tab 151 (No 1 2 3) the values of a 1 =~p for s =
10 mm and s = 20 mm (measured for large diameter bored
piles No 1 to 24) are compared to the calculated values
according to the modified hyperbola method (see Fig 14 6)
It can be seen that these calculated values are between
s = 1U-2u mm but rather closer the measured values for
the settlements= 10 mm see correlation coefficient n 6
and n 7 in Tab 151 respectively The average correlat i on
coefficent for the settlements= 10 mm is n9 = 108 and
the standard deviation is sct = 014 The comparison to
Berggrens and Schmertmanns methods for s = 20 mm ( see
Berggren 1~81 and Tab 151 as well) shows that the
results based om these methods give too high values of a 1 bull
38
The average values are ne= 143 sd = OJ3 and ng= 137
sd = 037 for Berggrens and Schmertmanns methods
respectively A bit better agreement can be observed
for Schmertmanns method
Taking into account the results in Tab 151 ana Tab
15l it must be assumed that for the determination of
a 1 the pile point contact pressure p(a1) should be
assumed as the ultimate point bearing capacity devided
by about 4
p(ai) - ( 1 bull 5 1 )
Most of the methods for determination of settlement are
based on the theory of elasticity The settlement ot the
pile point can be expressed as the average settlement of
a rigid circular foundation from the equation
11-Dp 1-v 2
s = p -4- -E-bull microd (1 ~ 2 J
where
p pile point contact pressure
E Youngs modulus
D diameter ot pile pointp ) = Poissons ratio
microd = depth factor
The range of validity of the pile point contact pressure
was determined in equation 151 Youngs modulus has an
important meaning lt can be determined from triaxial
tests or oedometer tests The relationship between the
constrained (oedometric) modulus Mo and Young s modulus
Eis dependent on Poissons ratio v as expressed by the
equation
E = l 1 + V ) ( 1 - 2 V ) Mo ( 1 bull 1 bull 1)- 1-v
39
TaKing into account the analyses made ny Chaplin (19b1a
1 961bJ Janbu (1 963 1970 1973J Andreassen (1973)
Duncan and Cheng (1970) Tejchman anct Gwizdala (1979)
Gwizdala (1978) Franke (1981) Berggren (1981) Withiam
and Kulhawy (7981) and the present investigation the
calculation of settlement is proposed to be
s = 24 bull p bull ~ D bull 1-v 2 bull micro d (154)Do o E
where s (r1)
p (kPa)
Dp (m)
E (kPa)
D0 =10 m
micro = 05 + 01 vfrac34E (1 5 5)d vs
but 05 lt microd lt 10-tip= p - (J (ovs see Fig 151)vs
E =Et= Kbullpat (Oo )n [1- Rf(1-sinltj) 101 - 03 ) 12 (1 5 6)2 c cosltP + 2o 3 sinltP 1Pat
in which K n and Rf= hyperbolic stress-strain parameters
Pa= atmosferic pressure ando 1 o 3 and o0 are determined by
averaging the concrete and soil vertical and radial stresses
near the pile point according to Fig 151 Then the
stresses at the pile point level are h
(J vs = L
0 Yi h
l vertical stress in the soil
0 hs Ko h
0 vs radial (horizontal) stress in the soil
0 vc L ye h -l
vertical stress in the concrete 0
0 hc K oc a vc radial (horizontal)
concrete stress in the
40
K at rest soil lateral stress coefficient 0
K c lateral stress coefficient for fluid fresh concrete0
K 1 0 oc
and average values
a 05(a +a)V vc vs
1 1 - shy~ = -(a +a+a I = -3 (av+2ahJ the applied mean normal stress0 j Z X y
Assuming this model calculation results for piles No 1-24
(see Tab 11~ as well) are shown in Tab 153
The piles are embedded mainly in medium sand to fine sand
For this kind of soil it can be assumed (soil parameters
from field or laboratory tests were inaccessible)
~ = 35deg c = 0 R~ = 09 n 05 v = 025 K c 10l 0
K = 04 Pat= 1UO kPa ye 24 kNrn 3 y = 14 kNm 3 bull0 C
Moreover in Tab 153 the following symbols are used
p(a1 ) - pile point contact pressure according to equation
1 bull 5 1
s(a1) - settl ement of pi l e point according to equation
143 and Tab 141
pound TT ( 2E = s bull Dp bull i 1-v ) according to equa~ion 152t
E~ Et bull microltl
EI
K = ro~ - according to equation 1 bull 5 6 p bullO middotA2
a~ o
E = E voD middot D middot ~4 ( 1 - v 2 ) according to equationt S p O 0
1 5 4
Et= E microd
K = according to equation 156 V PatmiddotaomiddotA2
41
The calculation results of Youngs modulus E = Et and
dimensionless canpressionrro1ulus for piles to 1-24 are shown
in Fig 152 to 155 using equation 152 and 15b
or equation 1~4 and 156 respectively lt can be obshy
served that the scatter in Fig 153 and Fig 155
where the influence of tne pile diameter is reduced
compare equation 154 is less than in the other figures
The reduced influence was made after observations from
field and laboratory tests while the equation 152 is
taken direct from theory of elasticity These values of
E and K are in good correlation with published values in
literature The values of Youngs modulus versus the
relative density of soil are compared to literature values
see Fig 15b Based on the analysis in this chapter it
can be assumed that
E = 9-ql 3 ( 1 bull 5 7)cp
where qcp is in accordance with equation 117
The calculation results based on this proposal are incluced
in Tab 1 5 3
The c a lculate d s e ttlements based on e q ua tion 154 and
157 are shown in column 23 and the values of the
correlation coef f icie nt (n= Seal ) in column 24 respectshyimeas
ively
The dimensionless canpression modulus can be d e termined as
K = 15Ubullq (qcp in MPa) (1 5 8)cp
see column 25 Tab 153
The calculation results based on the K compression modulus
according to equation 158 156 and 1 5 4 are shown in
columns 25 26 2 7 28 and 29 in Tab 153
42
For comparison and for determination of the range of
validity of this method the caLculation results of
pile point pressure for settlements s = 10 mm s = 20 mm
s = 30 mm (see Tab 141) according to equation 157
and 154 are shown in columns 30 to 35
The results obtained in Tab 153 confirm the possibility
to use the proposed method to calculate the initial part
of the pile point resistance settlement curve of large
diameter bored piles in non-cohesive soil and the initial
slope of this curve as well
A simple model has been proposed based on the theory of
elasticity ana the tangent modulus defined by Janbu (1963)
and Duncan amp Chang (1970)
A new approach according to the pile diameter depth factor
and principal stress is proposed
The settlement of the pile point can be made up to a point
pressure according to equation 151 on up to a settlement
of about s ~ 20 mm (30 mm)
-- The application of v Op in equation 1 5 4 a llows us ing
Youngs modulus as independent of the pile diameter
opposed to Bazants a nd Mosopusts (1981) proposal where
Youngs modulus wa s determined versus the pile diameter
The equation 1 5 6 takes into account the dependence of
Youngs modulus on depth (or overburden pressure) as
well
In the method field test (Cone Penetration Test) or
laboratory tests (hyperbolic stress-strain parameters
can be used
Comparison of the method to 24 availa ble load test r e sults
or large diameter bored piles in sand shows good a greement
to calculated and measured values
43
REFERE~CES
Adamczyk J (1978) Okreslanie udzwigu pali wierconych
za pomoca sondy statycznej (Bearing capacity of bored
piles based on the static sounding) Inz i Bud No 7
pp 253-257
Andreasson L (1973) The compressibility of cohesionless
soils Thesis Chalmers University of Technology
G6teborg (in Swedish)
Appendino M (1973) Comportamento di un palo di grande
diametro strumentato Rivista Italiano di Geotechnica
No 3 pp 115-118
Butterfield R Banerjee P (1971) A rigid disc embedded
in an elastic half space Geotechnical Engineering
Vol 2 pp 35-49
Bozant z Mosopust J (1981) Drilled pier design based
on load settlement curve X ICSMFE Stockholm Vol 2
pp 615-619
Begemann HK (1982) Cone penetration tests pile bearing
capacity and the thesis of Rollberg Proc of the Second
European Symposium on Penetration Testing Amsterdam
pp 433-438
Berggren B (1981) Bored piles on non-cohesive soils shy
settlement and bearing capacity (in Sweden) Thesis
Department of Geotechnical Engineering Chalmers
University of Technology G6teborg
Bergdahl UB (1979 1982) Sonderingen und in situ Messungen
Wien 18-19 Juni 1979 - Private information 19821983
Bustamante M Giane selli L(1982) Pile bearing capacity
prediction by means of static penetrometer CPT Proc
of the Second Europ Symp on PenTest Amsterdam
Vol 2 pp 493-500
Chaplin TK (1961a) An experimental study of the settleshy
ment of footings in sand PhD Thesis Univ of
Birmingham
44
Chaplin TK (1961b) Compressibility of sands and settleshy
ments of model footings and piles in sand 5th Int
Conf on Soil Mech a Found Engng Vol 2 p 33 Paris
Colombo P (1971) Observazoni sul comportamento ltli pali
a grande diametro Rivista Italiana di Geotechnika
No 3 pp 163-172
Dahlberg R (1975) Settlement characteristics of preconshy
solidated natural sands Swedish Council for Building
Research D11975
De Beer EE (1964) Some considerations concerning the
point bearing capacity of piles Proc Syrop Bearing
Capacity of Piles Boorkee I pp 178-204
Decourt L Quaresma AR (1978) Capacidade de Carga de
Carga de Estacas a partir de Valores de SPT VI Conshy
gresso Brasilerio de Mecanica dos Solos e Engenharia
de Fundacoes - Rio de Janerio - ABNS
Decourt L (1982) Prediction of the bearing capacity of
piles based exclusively on N values of the SPT Proc
of the Second Europ Syrop on Penetration Testing
Amsterdam Vol 1 pp 29-34
Duncan MJ Chang CV (1970) Non-linear analysis of stress
and strain in soils Journal Soil Mech Found Div Vol
96 SM5 pp 1629-1651
Durgunoglu HT (1979) Effect of foundation embedment on
stress and deformation distributions Third Int Conf
on Num Meth in Geomechanics Aachen pp 925-928
Farr JS Aurora RP (1981) Behaviour of an instrumented
pier in gravelly sand Proc of a session Drived Piers
and Caissons sponsored by the Geotech Eng Div of the
ASCE Nat Convention St Louis Missouri pp 53-65
Franke E (1981) Point pressure versus length and diameter
of piles X ICSMFE Stockholm Vol 2 pp 717-722
45
Gregersen os Aas G and Dibiagio E (1973) Load tests
on friction piles in loose sand Proc of the Eigth
International Conference on Soil Mech Moscow USSR
Vol 21 pp 109-117
Gwizda1a K (1978) Behaviour of large diameter bored piles
in non-cohesive soil (in Polish) Archiwum Hydrotechniki
Vol XXV No 2 pp 183-217 (English summary)
Huizinga TK (1951) Application of Results of Deep
Penetration Tests to Foundation Piles Building Research
Congress Vol 1 p 173
Janbu N (1963) Soil compressibility as determined by
oedometer and triaxial tests Proc Europ Conf Soil
Mech and Found Eng Vol 1 p 19 Vol 2 (Discussion)
p 17 Wiesbaden
Janbu N (1970) Grunlung i geoteknikk Tapir Forlag NTH
Trondheim
Janbu N Bjerrum L Kjaernsli B (1973) Soil Mechanics
applied to some engineering problems Norw Inst Publ
No 16 Oslo
Japanese Society SMFE (1981) Present state and future trend
of penetration testing in Japan Separate report at
X ICSMFE Stockholm
Kjekstad O Lunne T (1979) Soil parameters used for design
of gravity platforms in the north sea Second Int Conf
on Behaviour of Off-shore structures London Vol 1
pp 175-192
Klosinski B (1977) Bearing capacity of large diameter bored
piles IX ICSMFE Tokyo Vol 1 pp 609-612
Laboratory for soil mechanics Delft (1936) The predetershy
mination of the required and the prediction of the
resistance of piles Proc 1 Int Conf on Soil Mech
and Found Engng Cambridge (Mass) I p 181
46
Matich M and Stermac A (1971) Settlement performance of
the Burlington Bay Skyway Canadian Geotechnical Journal
Val 8 pp 252-271
Mccammon NR and Golder HQ (1970) Some loading tests
on long pipe piles Geotechnique London England
Val 20 pp 171-184
Meigh AC (1971) Some driving and loading tests on piles
in gravel and chalk Proc of the conference on beshy
haviour of piles London England pp 9-16
Mitchell JK Gardner WS (1976) In situ measurement
of volume change characteristics American Society of
Civil Engineers Specialty Conference on In-situ
Measurements of Soil Properties Raleigh 1975 Proc
Val II pp 279-345
Mezenbach E (1961) The determination of the permissible
pointload of piles by means of static penetration tests
Proc 5 Int Conf on Soil Mech and Found Engng
Paris II pp 99-104
Meyerhof CG (1956) Penetration tests and bearing capacity
of cohesionless soils Proc Amer Society of Civ Engng
SM 1 Pap 866 pp 1-19
Meyherhof GG (1 976) Bearing capacity and settlement of
pile foundations Proc Amer Society of Civ Engng
Journal Geotechnical Engineering Division Val 102
No GT3 pp 197-227
Mohan D Jain GS and Kumar V (196 3 ) Load bearing capacity
of piles Geotechn Val XIII pp 76-86
Nixon I (1982) Standard penetration test State of the
art report Proc of the Second Europ Symp on Pen
Test Amsterdam Val 1 pp 3-20
47
Nunes A Vargas M (1953) Computed bearing capacity of
piles in residual soil compared with laboratory and
load tests Proc of the Third International Conference
on Soil Mechanics Zlirich Switzerland Vol 2 pp 75-79
Nordal S Grande L Janbu N (1982) Prediction of offshy
shore pile behaviour The Norwegian Institute of
Technology Trondheim
Ohde J (1939) Zur Theorie der Druckverteilung im Baugrund
Der Bauingenieur Vol 20 No 3334 p 451
Parroth E (1972) Einfache Formel zur Vorausbestimmung der
Tragfahigkeit von Standpfahlen mit Hilfe der Sande
Bautechn 9 pp 312-314
Poulos HG Davis EH (1980) Pile foundation analysis
and design New York - J Wiley and sons
Prodinger W Veder Ch (1981) Bearing capacity of floating
groups of diaphragm walls Proc X ICSMFE Stockholm
Vol 2 pp 809-814
Promboon S Brenner R (1981) Large diameter bored piles
in Bangkok Clay Proc X ICSMFE Stockholm Vol 2 pp
815-818
Reese L (1978) Design and construction of drilled shafts
ASCE JSMFD Vol 104 No OT1 pp 95-116
Rodin s Corbett BO et al (1974) Penetration testing in
United Kingdom state-of-the-art-report Proc Europ
Symp on Penetration Testing 1 Stockholm pp 139-146
Rollberg D (1976) Bestimmung des verhaltens von Pfahlen
aus sandier und rammengebnissen Heft 4 FBG Technische
Hochschule Aachen
Rollberg D (1977) Determination of the bearing capacity
and pile driving resistance of piles using soundings
Publications of the Institute for Found Eng Soil Mech
Rock Mech and Water Ways Construction Aachen Vol 3
48
Schmertmann J (1970) Static cone to compute static
settlement over sand Journal of the Soil Mech and
Found Division ASCE SM3 pp 1011-1043
Schmertmann J Hartman JP Brown PR (1978) Improved
strain influence factor diagrams Journal of the Soil
Mech and Found Division ASCE GT8 pp 1131-1135
Shibata T Hijikuro K and Fominerga M (1973) Settlement
of a blast furnace foundation Proc of the Eighth Int
Conf on Soil Mech Moscow USSR Vol 13 pp 239-242
Spang J (1972) Die Bestimmung der Tragfahigkeit von Grossshy
borhpfahlen (I) Strassen und Tiefbau No 2 pp 339-355
Senneset K (1974) Penetration testing in Norway State-ofshy
the-art-report Proc Europ Symp on Penetration Testing
Stockholm I pp 85-95
Tejchman A Gwizdala K (1979) Analysis of safety factors
of bearing capacity for large diameter piles Proc VII
ECSMFE Brighton Vol 1 pp 293-296
Thorburn s and Mac Vicar R (1971) Pile load tests to
f a ilure in the clyde alluvium Proc of the conference
on behaviour of pile s London England pp 1-7
Trof imenkov JG (1969) Accuracy of determining the bearing
capacity of piles based on results of static penetration
sounding of soils Osnovaniya Fundamenty i Mekhanika
Gruntov 4 (Translation Soil Mechanics and Foundation
Engineering 4 p 248)
Trofimenkov JG (1974) Penetration testing in USSR Stateshy
of-the-art report Proc Europ Symp on Penetration
Testing Stockholm I pp 147-154
Tuoma F and Reese L (1974) Behaviour of bored piles in
sand JSMFD ASCE Vol 100 No GT 7 Proc Paper 10651
July pp 749-761
49
Van der Veen C (1953) The bearing capacity of a pile
Proc 3 Int Conf on Soil Mech and Found Engng
Zlirich II pp 84-90
Van der Veen C and Boersma L (1957) The bearing capacity
of a pile predetermined by a cone penetration test
Proc 4 Int Conf on Soil Mech and Found Engng
London II pp 72-75
Weltrnan AJ Healy PR (1978) Piling in boulder clay
and other glacial tills Construction Industry Research
and Information Association UK-Report PG 5
Withiam J Kulhawy F (1981) Analysis prodecure for
drilled shaft uplift capacity Proc of a session
Drilled piers and caissons ASCE St Louis Missouri
pp 82-97
Woodward R Lundgren R Boitano J (1961) Pile loading
tests in stiff clays Proc of the Fifth International
Conference on Soil Mechanics Paris France Vol 2
pp 177-184
Wright SJ Reese LC (1979) Design of large diameter
bored piles Ground Engineering Vol 12 No 8 pp
17-22
DIN 4014 Cods Teil 2 (1977) Bohrpfahle Grossbohrpfahle
Herstellung Bemessung und zulassige Belastung
Polish Specification (1975) Specification for design and
construction of large diameter bored piles in bridges
Ministry of Transport Warsaw (in Polish)
Polish Specification (1979) Specification for prevision
bearing capacity of the piles on the presiometer test
and static sounding ENERGOPOL Warsaw (In Polish)
Polish Code (1983) Foundations Bearing capacity of piles
and pile foundations
5 1
FIGURES
bull bull
53
Ou
+ sect raquo iir 1
4 + D
h + +Osu
bull + t2 =n- Dp
LDpl r f 1
Opu
Fig 1 1 1 Bearing pi le in the soil
J_
fp
080
070
060
050
0 40
030
020
010
q~ [MPa ]000 -+--~-~-~-~------------------------=-shy
00 20 4fJ 60 80 10 0 120 14fJ 160 180 200
Fig 1 1 2 The point resistance factor fp
(Trofimenkov 1974)
54
ts
160
140
120
100
080
060
040
020
q~5 [ kPa)
0Q0--1------~-~-~-~-~-~ - - ---=- -- shy000 10 20 30 40 50 60 70 80 90 100
Fig 1 1 3 The shaft resistance factor fs middot (TYofimenkov 1974)
f s
200
180
160
140
120
100 2 3 4 5 6 7 8 9
Fig 1 1 4 Shaft friction factor f depenshys
ding of the soil density (Senneset 1974)
55
Q~ [kN]
1500
1000
500
0-r-----------r----~- Q~ [kN] 0 500 1000 1500
Fig 1 1 5 Comparison of the pile resisshytance determined by the results of static sounding and load tests (TYofimenkov 1974)
D f f
0
Fig 1 16 Equivalent cone resisshytance (Bustamante 1982)
56
E u shy0 ~
QI I ltII ltII
~ a C QI
O C
D
w gt
0
Cone res istance Point resistance
80 160 240 320
05
10
15
e d
20
ver y dense Cone resistance 300 kgcm2
Dpcm
a =45 b = 30 C 60 d = 100 e = 150
Fig 1 16a
Cone resistance _ qc
80 160 80 160 qc [ k g cm2 ]p
05
10 10
15 15 e d a
e d20
Dense Medium2 2200 kgcm 100 kgcm
Cone resistance and point resistance of piles versus overburden pressure (Kerisel 1965)
Point resi stance - p(for s=2cm) of the pi le for
15 sett Iement s = 2 cm
10
5
E u
uJ1 o-~----shya er O 804 2500
32 56
I 1
L oose50 -I =25 Very loose L
----~--shy5000 7500 80 98
~-----lmiddotI1--------2 10000 12500 31400 =Flcn)
112 123 200 =Dplcm)
Fig 1 1 6b Point resistance versus cone resistance and pile diameter (Franke 193)
57
1
fp
080 (D Gravel
0 Coarse sand Medium sand 070
reg Fine sond Silty sand
060
050
040
030
020
010
qc [MPa]000-+----r--~-~-~--------r----r----r-~-~-- -shy
oo 20 40 60 80 100 120 140 160 180 200
Fig 1 1 7 Point resistance factor f (proposal) p
58
300
250
200
150
100
qc [MPa I50-+---------------r---r---r---r----r------------- shy
oo 20 40 60 80 100 120 140 160 180 200
Fig 1 1 8 Shaft resistance factor fs (pr oposal)
59
Bustamante (seetab 115 I
l fp
G)
0 Gravel
Coarse sand Medium sand
cl
b)
t-----l
1----1
080 reg Fine sand Silty sand a) D
070 Polish
060 Specification
( 1979) 050
040
030 CD 020 0
reg 010
qc [MPa]0 00 -+-------------------------------------=--shy
oo 20 4o 5o 80 100 120 14o 15o 180 200
Fig 1 19 Point resistance factor f comparisonp
Bustamente ( see tab 116 I 300
a) ~
250 b)~
cl~
200 Polish Specification ( 1979 l
150
100
q [ MPa]504---~--~--~----- ---___
00 20 40 60 80 100 120 140 150 180 200
Fig 1 1 10 Shaft resistance factor fs comparison
60
1 fp
~
080 CD CD Gravel
070 0 reg Coarse sand Medium sand
060 0 Q) Fine sand Silty sand
05
040 Franke (1973)___
030 DIN 4014
020 Part 2 1977
( see tab113 l 0shy
--shy --a - 010 C---0 Piles without enlarged bases
D---0 Piles with enlarged bases qc [MPa ] 000
00 20 4JJ 60 80 90 100 120 140 160 200
Fig 11 11 Point resistance factor f comparison p
fs
DIN 4014 Part 2 1977 ( see tab 114 l
300
~ 5 lt qc lt 10 MPa 50
~ 10 lt qclt 15 MPa
~qcgt15MPa
200
150
CD
100 0 0
qc [ 1Pa] 50-t-----T-~----T-r-~----------------shy
OO 20 40 6JJ 80 100 120 14JJ 160 180 200
Fig 1 1 12 Shaft resistance factor fs comparison
61
Measured p [ MPa]
( s=010 Dp) 10
9
8
7
6
5 0
4 0 61
3
I 2
Calculated qcp [MPa]
0 0 2 3 4 5 6 7 8 9 10
Fig 1 1 13 Comparison of experimental and aomputed values of the pile point resistanae
62
Contact pressure ( MPa ]
2 I 6
50
100
E E 150 Ill
c QI
E Sett lement for QI
calculated qcpai V) 200
Fig 1114 Results from load tests on piles No 1 and 5
Contact pressure [ MPa I 0 2 I 6
01---------------------1
50
E E 100 Ill
Settlement forc QI calculated qcp E ~ ai
I V) 150
Fig 1 1 15 Results from load test on piles No 7 and 5
63
Contact pressure p [ MPa] 0 2 3 4 6
0-t=-----~-~-----
E E
100 1)
c CU E 2 QI V) 150
Fig 1 1 16 Results from load test on piles No 9 10 and 11
Contact pressured p [MPa] 0 1 2 3 4 5
o~~~=------------___-~-shy
50
100
E E
i 150
CU E CU
-a V) 200 2
Fig 1 1 17 Results from load test on piles No 12 and 13
c
-------------- -
64
Contact pressured
0 1 2 3 4 p [ MPo] ~o __L____1_____J_____L___
50
100
150
E
E
IJ) 200
c a
E a
~ 250
Fig 1 1 18 Results f Pom load tests on piles No 2 4 6 and 8
p [MPa]
60
50
tO
30
~
Pile Pile Pile Pile
Pile No18
------+ Pile No17 + ~_ ---0 Pile No 19
bullbull - --bull Pile No 20
- ~middot -shy-shy -(y I Settlement for
20 tO 60
No17 +-middotmiddot- V 70 No 18 bull--- V 9o No19-middot- V 120 No20bull---- V150
qcp 3
80 100 120 140 160 s (mm)
Bose resistance
Fig 1 1 lBa Point Pesistance vePsus settlement (Spang 1972J
65 Cone resistance qc [ MPa]
0 10 20 30
mud
5 ~ lll
0 c 0
c CD
peat
10 sand
Ill N
10=10
D=lOOOmm
1540=40
20__________________
[ml
Fig 1 119 Pile No 1 and results from static cone penetration test
Cone resistance qc [MPa l 0 10 20 30
7N V degW = 0+--------------------i
mud
5
lll
~ C 0
c peat~
10
sand lll N 1D15
15l lD=1500mm
40=60
20l---------=-------__J
[ml
Fig 1 1 20 Pile No 3 and results from static cone penetration test
66 Cone resistance qc [MPa]
10 20 II 3 igt pound ~
mud+peat
fine sand+ silt
50=11
l lo-11oomm
40= 44
10
15l____________c
[ml
Fig 1 1 21 Pile No 5 and results from static cone penetration test
Section Cone resistance Pile
0 0
5 10 15 20 25 30 qc [MPa] -----~-~shy~
Silt
[7r_ ___~ Medium Sand_~-----l
0 ltD
+shy4
0=11
9=
Fine sand + Silt t
30p=
middotmiddotmiddotmiddotmiddotmiddotmiddotmiddot1~11+-----E-----
[ml
Fig 1 1 22 Pile No 6 and results from static cone penetration test
Cone resistance qcmiddot 1MPuJ
0 10 20 30 67 01-+-------l--------------i
mud+ peat
fine sand
l1)
N
40=60
15L_____________
[ml Fig 1 1 23 PiZe No 7 and resuZts from static
cone penetr ation test
Section Cone resistance Pi le
0 5 10 15 20 25 30 qc [MPa 1 --~----Y-~-----~
Silt
Fine sand
Medium Sand Bentonite2----1~i
t 3
4
0
0=15
Fine iii ~~= 5
sand t ltD
6 +
Silt 7
3Dp=
63 g
10
11
12
13+------=~---l
[ml
Fig 1 1 24 PiZe No 8 and resuZts f rom static cone penetration test
68
I =3
Cone resistance qc [MPa]
0 10 20 30
C 0 C Cl
(I)
Said
Peat
Sand
l 0=110
D = 11
4 D = 44
Fig 1 125 Pile No 9 and results form static cone penetration test
69
Cone resistance qc[MPa)
0 10 20 30 I ~ II JE Ill= II=E IS
Fine sand QI
U) I
[- I C 0 + C Peat QI
CD
Fine sand 0
Ci D = 1 1
L l D= 110
4D= 4 4
Fig 1 1 25 Pile No 10 and results f rom static cone penetr ation test
70
Cone resistance 9c[MPa]
0 10 20 30
Sand
C 0 Mud peat
+shyc 5 ltII
co
Sand Op= 11
u 10 D= 110 4Dp=44
Fig 1 1 26 Pile No 11 and results foIm static cone penetration test
71
00 a_ N ~
middotu rr QI 0 u ~ C 0
QI ui C iij 0 QI U - 0
0 EN
d 2
Sll 1lOl
C
u (rr
C 0 u~
0
QI - C middot 0 C
U - O 0 EN
~ 0 2
E
ltD a---==-lr---___--~---6-l_-0_012 ~ Lr- - --1---------J J
S9l ls= apound QI -0 gtcc _gmiddot- 0 1) ui I
Fi g 1 1 2 Piles No 14 and 15 and results f r om stat i c cone penetr ation tests
72
Contact pressure p [ MPa] 2 4 6
01lt---------------~
50
E E
111 100 ~ (qcp=30 MPa for No16
~ iqcp =49 MPa for No14
~ 1so~--~~- _ _ __
I _ _
11 I lf--q = 32 MPa for No15
cp
Fig 1 1 28 Results f r om load tests on piles No 14 15 and 16
73
0300--------------~---~--~--shyE
Driven piles in ~ 0 bull Gravel
amp250 bull Sand L QJ X Silt a 1l o Bored piles in
sand -sect 200 0=-- shyC ~ ~ 10 unless ~~ middot D shown 1
ii O
~ ~ o 3 a 1501-----+-------I- --+---laquo-+-- -+------lt
~ sect 5 - 6 6middot 100t----+----+-----_-1---4--__co_--J~__j
-_
~ 0 t7
C
a 50 2 shyg ~ gt
0 20 30 40 50 60
Standard penetration resistanceN in blows per foot
(N 30
Fig 12 1 Emperical relation between ultimate point resistance of piles and standard penetrashytion test in cohesionless soil (Meyerhof 1976)
14 r-------------------r-------b-----q
References and symbols given in Fig121
121-----+---+----+----+------ll------j
- _sect ~ 10t----+----+-_--1-----+---lt~--~H---- 0 lt-~5- _-)0 I() l- I Q---+-----I[08 ~
H -(l () ltj-~C X bulls pound 061------lt----+-----i~- --+-- shy
- bull
-gt Q1pound--I---L---L---L---L--~ 0 10 20 30 40 50 60
Mean standard penetration resistance N in blows per foot ( N30 l
Fig 122 Empirical relation between ultimate skin friction of piles and standard penetration resistance in cohesionless soil (Meyerhof 1976)
74
a) b)0(1 0lt2
10 10
05 05
1 N30OD-+---------__ OD--t-----r-----r----------------ll--Nbull30~ 10 20 30 10 20 30 40 50
Fig 1 2 3 Reduction coefficient a) for impermeable gravels b) form permeablr gravels (Weltman and Healy 1978)
psf [MPo)
Fig 1 2 4 Relation between ultimate point resistance and SPT in cohesionless soil (Polish specification 1975)
75
30 35 40 45 Loo Med Dense Ver dense
50
40
~ E
l)
g 8 1)
middotu
1 ~
QI- bull Touma ~ bull Koizumi
(183)-depth base middotameter5
20 40 60 00 100 N30
30 35 40 45
OG2(294) bull G1 (183)
300 bull us 59 ( 102) bull 88(180)
bull 075 a GT (467)
150
~ 200-+--------+-- t--- --t-----i 130i 0 094 081
014 _- --- -- shy~ E 066bull bull 063 Note -~ ~m~r~s~ ~ 1001---1-r--t---1point is xh QI Ratio ~ Number in ( ) middotn key is h c Ratio s ~
0 20 40 60 00 100
~ig 1 2 5 Ultimate point and shaft resistance versus N30
(Wr ight and Reese 1979)
-----
76
tu Psa
[kPa] [MPa]
200 tu
------ shy150 Psa
1 1
1100 10 1 1
1 50
0+----------T----~---~-N-3J~shy0 20 40 60 80
Relation between ultimate skin friction and SPT (Decourt 1982)
Fig 1 2 6
Psa
[MPa]
8
0----Meyerhof 1976) 0 7
--- - --~ - copy Polish Specifcoti on 1975)6 ~-
~
reg- middot - Reese (1978) middot 5
f41- -- Decourt (1982) -I bull 4 2
----==---______z__ h25m Dp=12m
3 ---shybull
2 7
--shy ----shy~----shy0-t----i----------r-- ----------------------N3l~shy
0 10 20 30 40 so 60 70
Fig 1 2 7 Relation between ultimate point re~istance of large diameter piles and standard peneshytration test (SPT) in cohesionless soil
------
77
tu [kPa)
200 17 Cast under -J bentonite
~----Meyerhof (1976) ~copy -=middotmiddotmiddotmiddot== middotmiddot150 ~------- Wei tman (1978 ) middot Healy middotmiddot ___ Japanese ) 119810 Society
(0 -middotmiddot- Decourt (1982)middot Wright
100
- -middotmiddot -- 11979]reg Reesemiddot Bored piles
~shy50 1 -- shy
-- shy middotmiddot s-shy - --~ ------reg~~ ---~E_==---- ------- shy
N_ ---shy0-+--C--------------r---- ---------~---~-~shyo 10 20 30 40 50 60 70
Fig 12 8 Relation between ultimate skin friction of piles and standard penetration test (SPT)
78
Pst [MPa]
8
7 ---------ist=7MPa
6
5
4
3
2
I N30o~------------------------------+---------__=-shyo 10 20 30 40 50 60 70
Fig 12 9 Relation between ultimate point resistance of large diamter piles and standard peneshytration test (SPT) in cohesionless soil (proposal)
tu [MPa ]
( excavanted and cast
150 under bentonite ) tu=150 kPa
100 tu=90 kPa
I I
50 I I I I I N30
10 20 30 40 50 60 70
Fig 1 2 10 Relation between ultimate skin friction of large diameter piles and standard penetrashytion test (SPT) in sand (proposal)
79
2 3 4 5 p[MPa] 0 2 3 4 5 p[MPa]0
40 40 Cl
80 c 80
c 120 120
Pile No 1 PileNo216 160
200 2
s s c [mm] (mm]
0 2 3 4 5 p[MPa] 0 2 3 4 5 p [MPa]
40 40
00 80
120 120
16 160 Pile No 3 Pile No 4
200 200
s s [mm] (mm]
0 2 3 4 5 p[MPa] 0 2 3 4 5 p [MAJ]
tgt11 tgt- measured40 40
80 80
120 120
Pile No 5 Pile No 6 160 160
20 200 s s
[mm) [mm)
Fig 1 4 1 Base resistance vs settlement appoximative method piZe No 1- 6
80
0 2 3 6 5 p[MPa) 0 2 3 4 5 p[MPa]
40 40
80 80 6
120 120 6
6160 160
Pi le No 7 Pile No 8 6
200 3J s s
[mm] (mm]
0 2 3 4 5 4 p [ MPo)
6 6 40
6 6
6 80
6 6
6
Pi le No 9 Pile No 10
XJO s s
[mm] [mm]
0 2 3 4 5 p[MPa] 0 2 3 4 5 p [MPa)
6 6
40 40 6 6
6
00 80 6
6
12 1Xl 6
160 Pile No 11 160 Pile No 12
200 200 s s
[mm ] [mm]
Fig 1 4 2 Base resistance vs settlement approximative method pile No - 12
81
0 2 3 4 5 p[MPa] 0 2 3 4 5 p [MPa]
6 6
40 6 40 6
6
80 6 80 6
120 6 120
Pile No 13 Pile No 141fO 160
200 200 s s
[mm] [mm]
0 2 3 4 5 p [MPa) 0 2 3 4 5 p [MPa)
40 40
80 80
120 120
HiO 160
200 200Pile No 15 Pile No 16
s s (mm) [rrrn 1
0 2 3 4 5 p[MPa] 0 2 3 4 5 p[MPa)
40 40 A A A-measured
680 80 t t
120 c 120 c
1fil Pi le No 17 160 Pile No 18
200 200 s s
[mm] [mm]
Fig 1 4 3 Base r esistance vs settlement approximative method pile No 13- 18
82
0 2 3 4 5 p[MPal 0 2 3 4 5 p (MPa]
D D40 40 c c
80 c 80 c
120 120
160 160
Pile No 19 Pile No 20 200 200
~ml (mm]
Fig 1 4 4 Base resistance vs settlement approximative method pile No 19- 20
LlJ QI
0 average lJ = 098 E sd = 029 C
6 SY = 030
4
2
lJ calculated ________________________ _______ measu red
06 08 10 12 14 16
Fig 1 4 5 Calculated pressure divided by the measured pressure at 20 mn settlement for aZZowabZe
q Zoad Pa= ~p approximative method pile
No 1- 20
8 3
Point resistance p [ MPaJ
a)
p(s) = s a +--sshy1 y qcp
1
SQ100p -- --- ---shy
~ s
[mml
I- 01 s rmm]-l p LMPa b)
f~]
c Cll E ~ i s
[mm)
Fig 146 Definition of the point resistance - settlement curve according to the modified hyperbolic method
84
01 ~ 0
20 0 0
0
16 0
medium 0 value a1 = 905-+ 256 Op 0 0
12 (r=039)
0 0
----0 0
8 0
0 0
0 0
4 0
05 06 07 08 09 10 11 12 f3 14 15 16 17 18 19 20 2 1 Op (ml
Fig 1 4 Initial slope of the base resistance curve vs pile diameter
a1 [p] 0
0020
16 assumed a 1= 28 - 4 qcp
12 0
0 Ct) 0 a = 2659 - 369 qcp8 1
0 0 (r = 0188)0
4
2 3 4 5 (MPa]qcp
Fig 1 4 8 Initial slope of the point resistance curve vs ultimate point resistance on the static cone resistance for pile tests No 1 20
85
a [~ 28
24
20
16
12
8
4
0 2 3 4 5 6 Qcp [MPa]
~ Kiosinski (1977) sand and sandy gravel of mediwn density
~ Klosinski (1977) loose sand ID= 0 3 0 4
o US59 ] t HH Touma p and Reese L (1974) fine sand and silty sand OGl (US59 HH BB - very dense Cl - mediwn dense) 1 BB
DIN 4014 Part 2 (1977)
Fig 1 4 9 Initial s lope of the point res istance curve vs ultimate point resis tance
86
assumed [il =30 -10 Op but )1~ 10 )1 [1 I
u 311-10 Op ( r =0 368)4 1 0
3 0 0
02 0
0 0co 0 8 0 0
0
0
05 06 07 08 09 10 11 12 13 14 15 16 17 19 20 21 Dp [ ml
Fig 14 10 Correction factor for hyperbolic base resistance shysettlement relationship
87
a [~] 28
24
20
16
12
8
4
2 3 4 5 qcp [ MPa]
Fig 14 11 Initial slope of the base resistance curve vs ultimate base resistance (proposal)
v [ 1 ]
3
2 -----G- DP J l 1J I Op lm] J
for Dp ~ 2 0 m ~ u = 1 01
0 --------r----r---r----r-----------------r-------------------------r------r-~-~--shy
05 06 07 08 09 10 11 12 13 14 15 16 17 18 19 20 21 Dp[m)
Fig 1 4 12 Correction facto r for hyperbolic base resisshytance - settlement relationship (proposal)
s P ( s)
s +
u qcp
88
a) b)1
bt=o212= 47 MPa a1=1~32 tMWJ s 2 3 4 5 O 1 10 20 30 40 50 60 p [~a]0
0p [ MPa] 40 40
80 80
120 ~
160 b1 = ~ajtg ~= 0 212
~=1132 + 0212middot s
mJ 240 r=0994t t t measured s __ according to Jl s
o o o according to p (bull ll l[mm] [mm]
Pile No 2
slmm) 10 20 30 40 50 60 80 100 125 150 175 2)0 225 Note
p [ MPa] 09 14 17 20 22 24 27 30 32 34 36 38 39
measured
pibull) [ MPa] 074 128 169 202 228 249 282 307 330 347 360 371 380calculated
plbullbull1[MPal 070 125 168 203 233 257 297 327 356 378 396 410 422calculated
1) (bull) ij l099082 091 099 101 104 104 104 102 103 102 100 098 097 sd = 006
ij (HJ1041) (bull10) 078 089 099 102 106 107 110 109 111 111 110 10B 10B sd = 010
plbulll-according to a =1132 [ Jp(s) = s s for pile No21 0 1132 12 39
plbullbulll-according toa =1241 lmiddotGcp=39MPa1 0
~=14 see fig 1411 and fig 14 12 sp(S)=
124+ _ s_ 14middot39
11lbulll11l-J - correlation coefficient calculat~d P5 for
measure p s p(bull) and p(bull) respectively
Fig 1 41 3 Modified hyperboZic point resistance - settZement reZationship for piZe No 2
89
0 2 3 4 5 p(MA1] 0 2 3 4 5 p[MPa)
40 40
80 A 80 A
120 120
160 16 Pile No 1 Pile No 2
20 200 s s
[mm] rnm
0 2 3 4 5 0 2 3 4 5p [MPa] p [MPo]
40 40
80 80
120 1ZJ
lfpound) Pi le No 3 Pile No 4 A
200 A
s s A
[mm) [mm
0 2 3 4 5 p [MPa] 0 2 3 4 5 p [MPa]
40 40 A A A measured ~ calculated
80 80
12
160 160 Pi le No 5 Pile No 6
200 Z)Q
Fig 1 4 14 l3ase resmiddotistance vs settlement pr oposed method pile No 1- 6
90
2 3 4 5 p [MPa] 2 3 4 5 p [ MPa]
40 6
6 40
1 80 80
6
120 120 6
6 160 160
Pile No 7 6
200 200 s
[mm ] s
[mm]
0 2 3 4 5 6 p [MR] 0 2 3 4 5 p [MPa] 0 0
40 40 6
6
80 80
6
120 120
160 160 Pile No9 Pile No 10
200 200
s [mm] [msml I
0 2 3 4 5 6p[MR] 0 2 3 4 5 p [MPa]04--___ ____ ___ ___ ____
0+-=---------------~-~- shy
40 40 c 6 c - measured
0--0-0 shy calculated
80 80
120 120
160 160 Pile No11 Pi le No12
200 200
s [mm]
s [mm]
Fig 1415 Base resistance vs settlement proposed method pile No 7-12
91
0 2 3 4 5 p [MPal 0 2 3 4 5 p [MPa)
40 40
80 80
120
16 Pile No 13 Pile No 14
200 s
tnml [mm]
0 2 3 4 5 p [ MPa] 0 2 3 4 5 p [MPa)
40 40
80 80
120 120
160 1fD
Pi le No 15200 axJ s s
[mm] [mm]
0 2 3 4 5 p[MPa] 0 2 3 4 5 6 plMPa ]
A A A measured40 0---0-0 calculated
80
120 120
160 1ED Pile No 17 Pi le No 18
200 200
s s [mm] [mm]
Fig 1 4 16 Base resistance vs settlement proposed method pile No 13- 18
92
0 2 3 4 5 p [MFb] 0 2 3 4 5 p[MPa]
0 6 o -measured40 40 0 0 o -calculated
80 80
120 120
160 160 Pile No 19 Pile No 20
200 200 s s
[mm] [mnil
Fig 1 4 17 Base resistance vs settlement proposed method pile No 19-20
p(s~Psf
15 20
ean
-C 5 w u L Lower ~ confidence
linea 0
a IJl 10
o---o proposed
method I I I
15
Fig 1 4 17a Design curves for estimating developed base resistance in sand (Wr ight and Reese 1979)
93
n (number)
30
28
26
24
22
20
18
16
14
12
10
8
6
4
2
0 02 04
Fig 1 4 18
I= 126
Between 1] = 0 7 - 1 3--- I= 106 ( 84 frac34)
Average ~ = 098 Standard sd =023 deviation
Standard sv =023 veriation
1] (Coefficient Calculated Measured
06 08 10 12 14 16 18
Calculated pressur e divided by the measured pr essure for all pressure - settlement curves pr oposed method pile No 1- 20
94
a) b) Total load
Total load curve
---- _____-- shy- -- -Base load ~- Base load
-0-0 ~
00 00 J
ldeoli zed shaft load J
Shaft sesistanc1---------- 0=0middot30 a= 0 middot 30
025 Settlement IN 025 Settlement IN
Fig 1 419 Proposed method of synthesizing design loadsettlement curve (a) conservative design prodiction b) design prediction- peak in shaft loadsettlement curve (Burland et al 1966)
Cf
-0 0 0
J
0
~-----~--~-~ amp- 2 3 4 5 6 (cm)
a~middotltii -0 lt) cco2 41 -~ -0 1)
vi ~ llloli=----------- ---c~0 1 2 3 4 5 6 7 ( of diameter)1 1 1 1
05 10 15 20 ( in) for 30 in Pile Movemen~ ( 75cm pile)
Fig 1 4 20 Approximate load settlement curves for 30 in bored piles (AB and C represent failure load at 1 in settlement A B and C represent ultimate failure load) (Touma and Reese 194)
95
Load in MN 0 2 3 4 5
25
50E E C
-C 75
-~ ~
-Z 100 lJ
Shaft resistshy
125 once
15 Fig 1 4 21 Load-settlement relationships for largeshydiameter bored piles in stiff clay (Tomlinson 1977)
SettlementSo
Fig 1 4 22 Diagrams of s1iaft and base resistances versus settleshyment assumed in analysis (Kiosinski 1977)
96
0 0 1 ~ r- 025g ~~ 2
1- -shy3 03Sg 14 5 2
Qls =Qpls+Q5 (sQpls) Qs(s-3E
0
degsis __ -- Qpls) a~ C
4
t Sg l
5 Qu Is)
Q(s)in MN-l T
Ouls Q Is) in MN ---
Fig 1 4 23 Construction of load - settlement curves a) for sand b) for cohesive soil (DIN 4014 Part 2 1977 and Franke 1981)
-
s C 5C
Cl
3 0 00 05 10 15 20 Mean settlement I in)
Fig 1 4 24 Load- settlement curves for test shaft S4 (1 in = 25 4 mm 1 ton= 8 90 kN) (Reese 1978)
97
Relative side resistance
0 05 10 15 20 0E=--t----+---+--~
c QI lt) ~ 2 C
I itaker c
QI amp Cooke3E QI-j
c-en 4
C QI
E us 59o
5 QI gt
SA0 w 0 6
Fig 1425a Relative side resistance for clay vesus relative midlength settlement (Reese 1978)
degs (Osl u l t 0 05 10 15 2 0
Mean
2 Lower ~ C QI u
confidence line
~ 3 a
0
~4 E
()
5
6 __ _ ______ ________ __1
Fig 1 4 25b Design curves for esti mating developed side resistance (~Jy1nht ReertP- 1987 J
98 Load Q
8 - 15 mm
1- 2 of p ile diameter
100-200 10-15 of pile Os Ot diameter Shaft Total
Settlement S Resistshy Resist- Load ance once
Fig 1426 Dependence of total load base resistance and shaft resistance on settlement of lar-ge diameter pile (Tejchman Gwizdala 1979)
6
5 Shaft load
4
3
2
z ~
-0
g Pile EF- 56 J 0
0 0 20 30 Butt settlement (mm)
Fig 1 4 27 Deveiopment of shaft and base resistance with settiement (Promboon Brenner 1981)
99
0 1000 2000 3000 4000 5000 6000 7000 8000 9000 0 r-=-1---J__-----------------------~----_shy
Load [ k N l5
10
20
( I
Skin friction ----1 I I
~ 40 QI E
fQI
50 I
Q) I () ICOntinuos fost deolading
Fig 1428 Load-Settlement-Diagram Testelement III (Diaphragm-Wall 0515 m 244 m deep) Portion of Skin Friction and Base Resistance (Prodinger Veder 1981)
Qs (QJ max
0 05 10
Upper Limit of Data
Farr and Aurora (1981J C
~ 2 - shy -+shy - Mean of Data
I QI
Lower Limit of Data a
0 - 3 E
Vl
4
Smid = Approximate shaft buff movement ignoring the elastic compression of upper halt of the shaft
D = Shaft diameter
Q Mobi Ii zed shaft resistance
Qs1max = Maximum shaft resistance
Fig 1 4 29 Relative shaft resistance vs relative movement (Farr and Aurora 1981)
100 Load Q (s) [ MN]
Su5 s s 20 mm for non- cohesive soil u
s s 10 mm f or cohesive soil u
s s 15 mm for claysand u
Q (s) + Q (s)s p
Qs(s)
-C ltII E s ~- [mm]-ltII IJ)
Fig 1 430 Dependence of total load Q(s) point res i stance Q (s) and shaft resistance Q (s) versus settlement p s
~ 3 Usu Qpu Qu Q(s) [ MN]
Sus= 20
1J
60
80
100
120
degs (s ) 140
5 P=Ol Op
1EO
C -ltII E 180 ~ ] 200
s [mm]
Approximative dependence of total load point resistance and shaft resistance versus settlement fny non-cohesive soil
Fig 1 4 31
101
113 3 ~fic0P Ye hY
1 Ground water
D
I y
yh C
Fig 1 5 1 Determination of 01 and 03 for settlement analysis of lar ge diameter bored piles
102
I
E=Et [MPa]
160 0
140
120 0
100
80
6
40
--- --shy 0
0
8 0
0
0
20
2 3 4
I 0 15
Fig 1 5 2
E = Et [MPa]
120
100
80
60
40
I I 0 35 065 085
0
Et= 17 81 qcp0844
( r = 0 128)
5
100
6 qcplMPo]
Calculated values of Young s modulus for piles No 1shy24 according to equation 1 5 2 and 1 56
0
0 0
E =898qcp127 (r= 0314)
E = 9 middot qcp 13 0
20 shy 0
0 0
0 1 2
loJ
I 0 35
3 I
065
4
I 085
5
100
6 qcp [MPo]
Fig 1 5 3 Calculated valueBof Young s modulus for piles No 1shy24 according to equation 1 5 4 and 1 5 6
I K 10 3
( 1 ] 1832
1400 0
1200 0
0
1000 0
800 0
m=2821 qcp0621
600 0
(r=0057)
400 0 0 0 0 0
200
2 3 4 5 6 qcp (MPa]
I 035
I 065
I 085 100 Io
Fig 15 4 Calculated valuesof the dimensionless compress ion modulus K for piles No 1- 24 according to equation 1 5 2 and 1 56
K ( 1 ]
0
1400
1200 0 0
1000
800
600
0
0 0
0
0 0
0 K= 1422 qcpl05
(r=0181)
0 K= 150 qcp
400 0
3)0 0 0
2 3 4 5 6 qcp(MPa)
I I -J 035 065 085 100 Io
Fig 1 5 5 Calculated values of the dimensionless compression modulus K for pile~ No 1-24 according to equation 1 5 2 and 1 5 6
104
120
100
2 3 4 5
I I I rv 0 15 035 065 085 100 lo
Bergdahl (1982) for shallow foundation
o----o Bozant Masopust (1981) D= 1 0 rn h=10 rn large diameter bored piles in noncohesive so il
0----0 Proposal according to current anal ysis
Klosinski (1977) D=090 to 125 rn large diameter bored piles in sand and sandy grave l
Mitchell Gardner (1976) very dense sand E=(35)q (it depends on sand density and stress history) c
Fig 1 5 6 Composision of Young s moduius
105
TABLES
0 Tab 1 11 Methods for detemination of the bearing capacity of bored piles (Ro llberg 1977)
Cl
Nol -- I Soil Areas of Q) Q) Editor Determination of Coefficients 5 type influenceqP qs p ~ C C 11 12 fP I fs
1 all Lab f Soil Mech (1936) l qp at the elevashy 1 0
2 all Huizinga (1951) ~ t~on of the pile 14 point
3 all Van der Veen (1953) ) 18 1 h+l14 all Van der Veen 1 0 Dpl375 D~ 15-- J qcmiddotdhBoersma (1957)
~ 11 +12 h - 12
5 12 all Menzenbach ( 1961) qc at the elevashy~ tion of pile point
6 18 all Mohan Jain Kuman (1963)1 average of qc over 1 h Q) h ~qcmiddotdhl 10 Dpj 3 75 Dj 15 50_micro
and 1 2C 11
7 I amp all de Beer ( 1964) graphically from 10 Q) qc 0 1 h+l18 u C
sand Soviet norm SNIP II 9ct9cp I4 bull O Dp I10 DP l66-1 083shyu clay B5- 67 Trofimenkov (1969) 2 50 1 251 +l J qc middotdh micro middot h middot-l l 2h-~ _micro
9 _micro u all Paproth (1972) at the elevation 3 5 I shy
) of pile point (Dpgt0 5 m 7 D8DpE
E-lt p 1 h+l1 1 h Dplt 5 m u l+l J qcmiddotdh h f qcmiddotd~ 30 Dpl 50 Dp 2 0 100shy10 sand Norwegian method
0l 2 h-12 200Senneseth (1974)
11 lall Soviet method h+l (20-0lqgl - 101 1 q middotdhTrofimenkov (1974) -- f C UpUsmiddotQct
l1+l2 h - 1212 Qct-Qcp 40 D~ 10 Dp 1 33- 0 67shyUsbullh 4 00 2 50
13 English method 10 DFJ 375Dp 10 I
Rodin Corbett Shershywood Thorburn (1974)
3 7 5 Dcl 8 0 DP 10h+l1 _1_ J qcmiddotdh 1 h
qcmiddotdh 20011 +12 h - 12 hb
1 h qcmiddotdh 150hf
0
Observations
fp I f (qp)fs C
Dp E = 1 cm Qbu = 2 Qpa (approx )
s fs=f (qc)
q=~g Us 0 h
fp=f(q~)
fs=f(qgl
bull fine grained non- cohesive soil loosely packed
bull fine grained non- cohesive soil medium dense comp
fine grained non- cohesive soil
Tab 111 (cont)
h+h bE 14 non-cohe- Meyerhof ( 1956 poundti J N 3o middot dh CtME fN3 o dh 1 0 DP 4 0 DP 10 100 etM= l 2
sive soil 1976) lJ +12 h - li hE o hgp taken into consi der ~ Ul (I)
E-lt
C 0
~E = 1 kgbull 30 cm
(statistical limit depth of the pile) hE - clamping length of
pile micro rrJ l-l micro (I)
15 C (I) p
sand Norwegian method
- irm - - - 10 IT
m = diagram O l-l Senneset (1 974) rrJO C
16 rrJ micro gravel English meth it 3 middot N30 - - - 10 - Jf 3 + diagram U) ~
E-lt p U)
iiouiu Coruett Sherwood Thorshyburn (1974 )
(NJQat the elevashytion of pile point1
0 -i
108
Tab 11 2
Results of calculati o n of p i le point load pile shaft load and total pile load from static con e penetration test (Rol l berg 1977)
~ gt
~ gt Ultima te Ultimate Ult imate
No Method micro micro poi nt skin bearing 080lt17nlt1 50 Q) -l
-l middot-i resistanceuro resistance r esistancE
middot-i p 0
(J n1 n n2 n n3 n n1 n2 n3
1
2
Lab fSoil Mech
Hu izinga (1951)
(1936 ) 430
307 i 3 Van der Veen (1953) 239
49
4
5
Van der VeenBoersma
Menzenbach (1961)
(1957) -l middot-i 0
2 4 7
1 57 1-CJ)
6
7
8
Mohan Jain Kumen
de Beer (1964)
Sovi et Norm (1969)
(1963) CJ) Q)
-l middot-i 0
lJ Q)
Q)
gt- CJ) Q)
c 0
2 44
1 37
183
47
t I
49
487
0 18
47
16
3 02
0 85 1
47
16
137
08
9
10
Paproth ( 1972)
Norw Method (1974)
~ 0
0
u I
C 0 C
1 8 1
180 l 46
1- - -_L~ 46 167 46 1 19
1 1 Soviet Method ( 1974) [1 1 41 46 1 62 13 083 13 1 14 0 8
12 Engl Method (1974) 2 66 35 128 35 2 30 35 1 28
Note
cal Q a) n = --- mean value of the rat i o between calculat ed pile loads and those n Q determined f r om loading test
b) n = number of piles
109
Tab 113
Point resistance of large diameter piles (DIN 4014 Part 2 1977)
Settlement Point pressure 1 Factor -fshy
(cm) (MPa) cf=lOMPa I i=15 MPa C C
Piles without enlarged base
1 05 005 003 2 08 008 005 3 11 0 11 007
15 34 034 023
Piles with enlarged base
1 035 0 04 002 2 065 0 07 004 3 0 90 009 006
15 2 40 0 24 0 16
Note 10 lt qp lt 15 (MPa)C
Tab 114
Skin friction resistance of large diameter piles (DIN 4014 1977)
Strength Static cone pen- Depth below Skin frict ion Factor of sand etration resist surface
(MPa) (m) (MPa) fs
Very small lt 5 - 0
Small 5 to 10 0 to 2 0 2 to 5 003 ln6 to 333
gt 5 005 100 to 200
Medium I I 10 to 15 0 to 2 0 I
I 2 to 7 5
gt 75 I 0045 0075
222 to 133 to
333 200
High I I
i
l
gt 15 0 2
to 2 to 10 gt 10
I I I
I
i
0 006 0 10
gt gt
250 150
Note Skin friction is assumpted as linear until s =2 cm and constant for s gt 2 cm
11 0
Tab 115
Values of the inverse of the point resistance factor (Bustamante 1982) fp
Soil type qPC I 1
Factor - shyfp(MPa)
for piles group
a) Silt and loose sand lt 5 0 40 -b) Moderately compact
5 - 12 040sand and gravel
c) Compact to very gt 12 i 030compact sand and gravel I
Tab 116
Values of the shaft resistance factor fs (Bustamante 1982)
Factor fs
Soil type qs
C Category I(MPa) I A I B I II A III BI
I a) Silt and loose lt 5 60
i 150 I 60 I 120-
sand
b) Moderately corn- I pact sand and 5 - 12 100 200 100 200 gravel i
Icl Compact to very
compact sand gt 12 150 i I 300 150 I 200I
I I and gravel i
I
111
Tab 117
Point resistance factor (proposal)
-
1-fp
qc (MPa)
Gravel
Coarse sand Medium sand
Fine sand Silty sand
25
080
0 70
060
5 0
0 65
055
047
75
054
045
039
10 0
045
036
031
150
035
027
022
200
030
0 23
018
Tab 118
Shaf t r e sistance factor (proposal)
fs
qc (MPa)
Gravel
Coarse sand Medium sand
Fine sand Silty sand
25
80
100
130
10 0
120
150
190
I 200
180
230
300
11 2
Tab 119
Calculated values qcp
for large diameter piles
Pile Literature Length Diameter (m) Measured p Cr1 lcul Settlement Note Authcr(year) No (ml D Dp (MPa)
(s=0 10Dp) (MPa)p ~~JL__
s s ()(mm) Dp
1 Franke (1977) 1 13 11 36 38 117 106 Garbrecht
2
3
2
3
13
14
11
15
1 58 36
37
38
40
215
185
136
123
) qg accord to Franke
4 4 13 15 204 3 2 33 220 108 and Garshy
5 5 6 11 33 35 127 11 5 brecht (1977)
6 6 6 11 153 36 35 146 9 5
7 7 6 1 5 34 35 158 105
8 -shy 8 6 15 2 1 41 3 0 109 52
9 10 9 11 39 52 47
10 11 95 11 43 35 77 70
11 12 9 11 49 66 60
12 13 10 11 15 5 1 4 0 77 5 1
13 14 9 11 1 5 4 8 46 115 77--shy14 Pranke ( 1973) 15 115 18 4 9
) ) average 88
15 13$ 13 5 1 3 19 -2 5 3 2 sd=3 0
16 - - 165 16 5 13 19 30 sv=0 34
17
18
Spang (1972)
llXJ
V90
6 6
6 75
0 7
09
3 2
4 2
32X
42X
x) s =0 10 D p
19 VlaJ 720 1 2 39 3 9X
20 - - VlsJ 6 5 1 5 3 0 3 ox
21 Touma and US59 9 9 o 76 8 0 Reese ( 1977)
22 HH 75 0 61 8 0
23 Gl 180 091 - 2 5
24 BB 137 o 76
sd = standard deviation
sv = standard variation
Tab 1 2 1
Ultimate point resistance coarse and medium sand psf (MPal (Pol ish Specification 1975)
Depth h
Medium sand r = 0 40 N = 200 30 Base diam (Op) and depthbase diam (hDp)
Dense sand r 0 Base diam (Op)
= 0 80 = 50N30 and dpethbase diam (hDp)
(ml Dp = 0 6 m Dp = 1 0 m Dp =12 m Dp = 1 5 m Dp = 0 6 m DP = 10 m DP = 12 m DP = 15 m
Psf hDp Psf hDp Psf hDp Psf hDp Psf hDp Psf hDp Psf hDp Psf hDp
5 10 83 0 85 5 0 075 42 07 33 20 8 3 16 50 14 42 13 3 3
7 14 11 7 1 2 70 11 5 8 10 4 7 2 8 11 7 22 70 2 0 5 8 1 8 47
10 18 16 7 15 10 0 14 8 3 1 3 67 35 167 28 100 2 5 83 2 2 67
15 18 250 18 15 0 16 12 5 15 100 4 2 25 0 3 4 15 0 30 125 27 100
20 2 4 333 2 0 200 185 167 1 7 133 4 7 333 3 8 200 33 167 30 13 3
25 26 41 7 2 2 25 0 20 208 19 167 5 0 41 7 4 0 250 3 5 20 8 3 2 167
w
11 4
Tab 131
Partial safety factors for resistance to axial load for bored piles (Wright Reese 1979)
Partial safety Normal Poor factor for control control
Unit skin resistance 1 70 185
(no load test)
Unit skin resistance 160 1 70
(from load test)
End bearing 165 180
Tab 1 3 2
Probability of failure of bored piles under normal design conditions (Wright Reese 1979)
Probability of Factor of Structure failure safety classification
5 10-3 25 monumental
210shy 22 permanent- 2
5 middot 10 2 0 110shy 1 85
temporary 5 bull 10-l 165
11 5
Tab 133 Results of field tests (Tejchman Gwizdara 1979)
L
II C C C 0 0 0
micro micro
micro micro micro For universal safe~y F2u u CUNo micro C C ~ ~g~ middot- C
~ Permisible micro micro i ~c -i micro
cmiddot-~ micro~ L
micro oo ~ load ~t~ ~~ omicro micro ~ ~ 3Z~ ~ ~ micro
-~~
~ e ~ --middot--
middot- ~ obull 0
~ g ~~ ~~ ~
~ L
o Jl i5 sect~ =gt L Q~ = yen t p Qp Qp
D h Q~ Srrx s tm p s E~ iQ~lQ~cm ~~ KN X ll1l kPa kPa kN kN kN Jl ~e ~ 1 2 3 4 5 6 7 8 9 10 11 12 13 14 15 16 17
1 70 6 60 4081 1550 2531 38 0 1182 10 4040 175 2041 245 1796 632 141 120
2 90 6 75 5082 3041 2041 598 1785 10 4782 107 2541 1079 1462 282 140 42 5
3 120 720 7259 4041 3218 557 1035 10 3576 119 3630 2158 1472 187 2 19 594
4 150 650 8643 4454 4189 51 5 928 20 2521 136 4326 2158 2168 3 10 166 253
5 130190 195 7750 3011 4709 392 805 10 1075 - 3875 981 2894 3 10 166 253
6 130190 165 9516 5101 4415 536 522 20 1800 - 4758 1962 2796 260 158 412
7 130190 135 8044 5199 2845 646 114 4 15 1834 - 4022 2109 1913 2 47 149 524
8 180 115 11380 4415 6965 388 792 15 1735 - 5690 2747 2943 161 2 37 483
9 76 980 6867 4316 2551 628 110 13 9529 109 3534 1128 2306 383 111 32 8
10 61 7 60 7161 2747 44 14 383 67 15 9404 303 3581 392 3188 700 169 109
11 92 180 4807 883 3924 184 20 8 1329 76 2404 196 2207 450 178 82
12 76 24 5 6769 736 6033 109 20 8 1623 103 3385 147 3238 500 186 43
13 76 137 5396 2060 3336 38 2 63 8 4535 102 2698 589 1109 350 t 58 218
14 120 23 5297 1854 3443 35 0 960 10 1640 39 2649 196 2453 945 130 7 4
15 135 16 7 13489 7554 5935 560 181 10 5260 83 6749 2060 4689 367 127 305
16 170 46 0 8829 2943 5886 333 17 10 3466 39 4415 1373 3042 2 14 1 94 31 1
Average Fi 387 166 Standard deviation Sd 2 1 5 034 Standard variation sv= 0 56 0 20
1234 Spang1972 567 8 Franke 1976 9 10 111 2 1 3 Touma Reese 1974
14 Colombo 1971 15 Kerisel Simons 1962 16 Appendino 1973
11 6
Tab 134
Results of model
SafetyScheme factor
medium F ssand
F p
loose F s
samd Fp
F 3 55 sd _P F 1 32 sd
s
tests (Tejchman Gwizdara 1979)
Diameter D (mm)
30 60 90 133
145 129 108 112
280 3 08 307 294
140 154 153 112
594 3 04 324 426
107 sv 030
0 19 sv 0 14
117
Tab 135
Individual safety factors according to literature
Literature proposal ofLiterature individual safety factor
Fs Fb
Polish Specification (1974) 100 250
Tejchman Gwizdala (1979) 150 400
Bustamante Gianeselli 200 300 (1982)
Decourt ( 1982) 130 400
average 145 3 38
TAB 141 0)
Load settlement curves - measured
Pile No
Settlement 1 c 3 4 5 6 7 8 9 10 11 12
s p s p p s
p p s P
p s P
p s p p s
P p s
P p s
p p s p p S
p I i p s
p p s p
mm MPa rrrn lifl5a MPa mm
lifl5a MPa
mm lifl5a MPa mm
RPa mmMPa nwa MPa mm
RPa MPa mm RPa MPa mm
RPa MPa mm RPa MPa mm
RPa MPa mm RPa MPa mm
RPa 10 045 222 09 1 1 05 20 07 143 06 167 08 125 0 5 20 08 125 10 100 08 12 5 15 67 16 63 20 092 21 7 14 43 08 25 10 20 0 1 1 182 12 167 0 9 22 2 12 167 18 111 14 143 24 83 22 9 1 30 125 240 1 7 I 7 6 1 1 273 1 2 250 14 214 15 200 1 2 250 15 200 25 12 0 19 15 8 30 100 26 11 5 40 1ti 250 20 10 0 14 28 6 14 286 1 7 235 18 222 1 4 286 18 22 2 3 2 12 5 23 174 36 111 3 0 133 50 20 250 22 ~27 1 7 294 1 5 333 20 250 2 1 ~38 1 7 294 1 9 263 37 135 27 18 5 4 2 11 9 33 152 60 2 2 273 24 ~5o 20 300 1 7 353 23 61 22 ~73 18 333 21 286 43 140 30 20 0 46 13 0 36 16 7 80 271 295 27 796 24 333 20 400 27 ~96 25 1320 22 364 25 32 0 53 15 1 36 222 41 195
100 322 31 1 30 333 28 357 22 454 31 1323 29 345 26 385 28 357 60 16 7 40 25 0 45 22 2 125 38 329 32 391 32 391 25 500 32 139 1 30 41 7 32 39 1 4 6 272 48 ~6 0 150 14 2 357 34 1441 36 41 7 27 555 36 ~1 7 34 44 1 36 41 7 175 36 486 39 449 30 583 38 ~61 38 461 200 38 526 42 476 32 625 225 39 577 33 682
(mmMPa) ( 1 MPa)
1
1=2074
t 1=O ~01 =0 98S
a1=1132
b1 =0 212 V =0994
a1=2217
b1=O 131
V =Q 978
a1=1860 b1=0233
V =Q966
a1=1562
b1=0174 V =Q983
a1=1382
b1=O195
V =0975
a1 =20 37
b1 =C 174
V =0957
a1=1443
b1=(l 193 v =O 961
a1=965
b1= 0071 V =0 990
a1=1 91
b1 =o 128
V =0 993
a1=5 83
b1=C124
v =O 981
a1=6 1 4
b1=01 64 v =U 985
li(MPa) ~9 4 7 76 43 57 middot5 1 57 5 2 141 78 81 61 cp (MPa) B8 39 40 33 35 35 35 3 0 39 3 5 49 40 __Ef ~-6 1 2 1 9 1 3 16 15 16 1 7 36 22 16 15 qcp
TAB 141 (continue) Load settlement curves - measured
Pi le No 3ettlement 13 14 15 1 17 18 19 20 21 22 23 24
s p s T5
p s T5
p s T5
p s P
p s P
p s P
p s P
p s P
p s T5
p s T5
p s p p s
p mm MPa lll1l
HPa MPa mm HPa MPa mm
fWa MPa mm fWa MPa lll1l
HPa MPa mm HPa MPa mm
MPa MPa lll1l NT5a MPa HPa MPa 111111
HPa MPa 111111
HPa MPa 1)1111
mra 10 1 7 59 075 133 06 167 075 133 ~95 105 09 11 1 07 143 3 76 1 7 59 08 133 10 100 20 2 4 83 130 154 095 21 1 1 15 17 4 1 75 114 16 125 12 167 ~7 74 33 6 2 1 3 15 3 1 9 103 30 29 103 1 7 176 1 2 250 15 200 r55 118 22 136 16 18 8 38 79 46 66 1 7 182 27 110 40 33 12 1 20 200 1 35 29 6 1 75 229 ~O 133 26 154 175 229 49 82 58 6 9 1 9 21 1 35 115 50 36 139 235 21 3 145 34 5 1 95 256 24 208 ~-4 147 28 17 9 20 250 gt8 86 6 9 72 2 2 233 4 2 11 8 60 39 154 265 22 6 1 55 387 2 15 279 28 214 ~6 16 7 30 120 0 2 2 27 3 o 8 89 80 7 5 2 3 262 80 43 186 31 258 1 7 47 1 36 222 14 05 198 33 124 2 25 320 B 1 98 25 327
100 45 222 18 556 39~ 253 ~-5 222 36 1278 27 370 ~8 113 125 47 26 6 20 625 42 29 8 149 255 28 1446 t50 22 682 3 0 500 175 200 225
(mmMPa) a1=479 a1=1206 a1=14 51 a1=1113 a1=1406 ~=836 a1=843 a1=1176 ~=64 a =561 a1=10 0 a1=9 5 (1MPa) b1=0175 b1=0 178 b1=0 382 b=0287 b1=O 119 p 1=0 137 h1 =o 193 b=0258 p1=0 049 b1=0032 b1=0 276 b1 =0 048
hf (MPa)
v =0998 57
v =0-987 5 6
v =0989 26
v =0992 35
v =0933 Iv =0991 84 73
v =0993 5 2
v =0998 tJ
3 9 =0944 v =0998 v =0996 v =0981
qcp (MPa) 46 39 32 30 32 14 2 39 30
lL 12 1 1 08 12 26 1 7 1 3 13 qcp
lD
N 0
TAB 142
Calculated point resistance curves
Setlement (mm) p(s)
1
n p(s)
Calculated value of the p(s) for pile No
2 3 4 5
n p(s) n p(s) n p(s) n p(s) 6
(MPa)
n p(s)
7
n p(s) 8
n p(s) 9
n p(s)
10 20 30 50 80
100
150 200 225
070 128 177 253 335
375 446 493
157 140 141
127
123
1 16 106
070 1 25 168 232
297
327 378 410
422
078 089 099 1 06
1 10
109 1 11 108
108
073 1 30 176 246
315 349
405 441
146 163
160 145
1 32 125
113 105
056 096
1 26
167 205 222
249 265
271
0 80 096
105
1 11 100 101
092 0 83
082
065
118 162 233
308 345
412 456
108 108
1 16 116 114 111
064
1 12 151 2 10 2 69
298
346 3 76
078 P63 093 tt 13 101 tt 53 100 I 13
108 ~75
103 ~04 096 ~ 55
~ 87
1 26 125 127 126
125
1 17 1 04
052 088
1 15 153
188 2 03 227 242
065 0 74
o 77 0 81 0 75
0 73
063
072 122
1 83 262 347 388
463 5 11
073
0 74
073 0 71 0 65 065
064 1 18
162 233 309
3 46
41 3 4 57
Dp (m) 1 1 Qcp (MPa) 38 (mmMPa) h2 8 1 1 9 Qcpbullv1(MPa) 72
158
39
124 14 55
15
40
n20 15 60
204
33 148 10 33
1 1
35
tt 4o 1 9 67
1 53 3 5
tt 4 0 1 5 51
15
13 5
114 0 15 i-gt 3
2 1
30
tt 6 0 10 3 0
1 1
3 9
12 4 1 9 74
1 1
3 5 h40
1 9 67
Note n = condition coefficient calculated p(s) measured p(s)
10
n
081
084 0 85 0 86 0 85
087
TAB 142 (continue)
Calculated point resistance curves
Calculated value of the p(s) for pile No (MPa) Setlement 11 12 13 14 15 16 17 18 19 20
(mm) p(s) ll p(s) n p(s) ll p(s) n p(s) n p(s) n p(s) n p(s) n p(s n p(s) n
10 106 070 0 71 045 091 054 099 1 32 055 092 053 070 060 081 085 0 72 080 055 078
20 1 90 079 130 059 160 067 1 70 1 30 096 101 091 079 1 12 148 085 1 31 082 098 082
30 258 086 1 76 068 2 15 074 222 1 31 1 26 105 120 080 156 205 081 180 082 132 083
50 363 086 246 075 297 082 296 1 26 1 70 117 161 082 228 095 295 087 256 0 91 184 092
80 471 316 o 77 3 77 088 364 1 18 2 1 o 1 24 199 308 085 393 097 336 1 02 237 095
100 522 349 078 415 092 394 228 1 27 2 16 348 088 442 098 375 104 262 097
150 611 405 479 443 258 117 244 423 529 443 304 101
200 669 441 518 473 276 261 474 587 488 331
Dp (MPa) 1 1 1 5 1 5 18 1 9 19 070 090 12 15
qcp (MPa) 49 4 0 46 49 32 30 32 42 39 30 12 a1 mmMPa) 84 h20 96 84 152 160 152 124 160
IV1 1 9 1 5 15 12 11 1 1 23 21 18 15
qcpmiddotv1 (MPa) 93 60 69 59 35 33 74 88 70 45
- 12287 average = ~ = 098
standard deviation sd = 023 standard variation sv = 023
N
122
TAB 143 Ultimate settlement for shaft resistance - summing up
Ultimate settlements (mm)Literature sand cohesive claysand
soil
Burland Butler Dunican (1966) 7
Touma Reese (1974) 10 Tomlinson (1977) 10 Klosinski (1977) 8
Francke Gerbrecht (1977) 20-30 DIN 4014 part 2 (1977) 20 10 Francke (1981) Reese (1978) (1979) 05-2 of 05-2 of Farr Aurora (1981) shaft dia~ shaft diam
5-20 mm 5-20 mm Tejchman Gwizdala (1979) - Spang (1972) 10
10 10 20
- Francke (1976) 10 20 15 15
- Touma Reese (1974) 13 8 15 8
8 - Colombo (1971) 10
- Kerisel Simons (1962) 20 - Appendino (1973) 10 Promboon Brenner (1981) 10 Prodinger Veder (1981) 12 Decourt (1982) 10-15 10-15
-average s = 14 1 10 126
standard deviation sd = 53 2 1 47
standard variation sv = 038 021 037
123
TABLE 14 4 Al l owab l e base resistance versus sett lement
Pile Li terature ength Diameter (m) Calculated qcp=qcp Settl ement Fp-3- sa (mm)No Aut hor No (m) D DP qcp (MPa) for qcp3(MPa)
1 Francke ( 1977) 1 13 11 38 127 25 Garbrecht
II2 2 13 11 158 39 130 19
II3 3 14 15 40 133 33
II4 4 13 15 204 33 110 23
II5 5 6 11 35 117 22
II6 6 6 11 153 35 117 19
II
8
7 7 6 15 35 1 17 25
II 8 6 15 21 30 100 21
II9 10 9 11 39 130 13
II10 11 95 11 35 117 15
II11 12 9 11 39 163 11
II12 13 10 11 15 40 133 7
II13 14 9 11 15 46 153 9
14 Francke ( 1973) 115 11 5 18 30 100 15
II15 135 135 13 19 32 107 29
II16 165 165 13 19 49 163 35
17 Spang (1972) V70 660 070 32 107 28
18 II V90 675 0 90 42 140 16
II19 V120 720 1 20 3 9 130 16
II20 V15C 650 150 30 100 16 average for pi les 198
standard dev sd = 78
standard var sv = 039
)assumed qc = p for s = 010 Op sonding meRsurement were not availab le
IV
TA~LE 15 1
Comparison of the initial sl ope of the pile point resistance - settlement curve
Accardi ng to 1 2 3 4
In i t i ~l 5
slope a1 for the pile No
6 7 8 9
(mmMPa)
10 11 12 13 14 15 Note
a 1 for s=10 mm 222 11 1 a1 for s=20 mm 21 7 14 3 calculated 207 113see Tab 14 1 Bo Berggren (198 )230s=20 mm
Schmertmann s method (see 202B Berggren 1981)s=20 mm
No 1 _ llNo - 6 1 97 098
202 250
22 2
400
30 8
090
14 3
200
186
076
167
182 156
286
18 2
107
125
167 138
091
20 0
222
204
426
263
098
125
167
144
087
100
11 1 9 7
182
23 5
1 03
12 5
14 3
11 9
174
164
105
67 83
58
14 6
125
1 16
63
9 1
61
103
59
8 3 48
123
13 3
15 4 12 1
1 10
167 21 1
aceto hypershy14 5 bola type curve
1 15
No 2 NQj = n1
No 4Noz ~ na No 5Naz= T]g
105 1 27
106
093
1 13
160
1 23
108 1 17
157
100
121 109
1 92
118
1 16 1 14
164
2 12
120
122
1 15
143
1 76
151
149 1 73 1 27 146
TAllLE 151 (continue)
Compa ri son of the initial slope of the pile point resistance - settl ement curve
Initial slope a1 for the pile No (mmMPa)According Note to 16 17 18 19 20 21 22 23 24 -a1 for s=10 mm 133 - 105 11 1 143 76 59 133 100 a1 for s=20 mm 174 - 114 125 167 74 62 153 10 3 calculated see 11 1 146 84 84 118 64 56 100 95Tab 141
Bo Berggren 198 67 78 25 0 114s=20 mm Schmertmann s method (see B 136 67 250 146 Berggren 1981) s = 20 mm
nG = 108 No 1NoJ = n 1 20 125 1 32 121 1 19 105 1 33 105 sd = 0 14
SY= 013 No 2 i) = 1 29ro1 = n1 157 136 149 142 1 16 1 11 1 53 108 sd = 019
SY= 015 No 4 iis = 143 INo2 = ns 091 126 1 63 111 sd = 033
SY= 0 23 No 5 ii9 = 1 37183 108 163 142INoz = n9 sd = 0 37
SY = 027
N Vl
126
TABLE 152
Measured and calculated pile point resistance
Pile Calculated Measured Measured No qcp P for
s=10 mm P for s=20 mm
~ 10 mm ~ 20 mm
- (MPa) (MPa) (MPa) - -
1 38 045 092 84 41 2 39 09 14 43 28
3 40 05 08 80 50 4 33 07 10 47 33 5 35 06 11 58 30 6 35 08 12 44 29 7 35 05 09 70 39 8 30 08 12 38 25 9 39 10 18 39 22
10 35 08 14 44 25 11 49 15 24 33 20 12 40 16 22 25 18 13 46 1 7 2 4 27 19 14 30 075 13 40 23 15 32 06 095 53 34 16 49 075 115 65 43 17 32 - - - -18 42 095 1 75 44 24 19 39 09 160 4 3 23 20 3 0 07 12 43 25
average= 484 291
sd 163 088 sv 034 030
Tab 153 Results of calculation for piles No 1-24
Pile No
Length (m)
Overburden pressure 0 vs
0hs (kPa)
0ve (kPa)
0 nc (kPa)
- -ov=o1 (kPa)
- -OV=03 ( kPa)
00 (kPa)
p(a il ( kPa)
s (a 1) (mm)
A2 ( 1 )
E t
(kPa)
Md ( 1 )
K (1)
E I
t (kPa)
( kPa) 1 2 3 4 5 6 7 8 9 10 11 12 13 14 15 16
l 2 3 4 5 6 7 8 9
10 11 12 13 14 15 16 17 18 19 20 21 22 23 24
13 12 14 13 6 6 6 6 9 95 9
10 95
11 5 135 165 66 675 72 65 99 75
180 137
l 33 133 123 116
70 70 70 70
104 102 95
102 95 94
106 139 95
101 106 97
180 137 221 215
53 53 49 46 28 28 28 28 42 41 38 41 38 38 42 56 38 40 42 39 72 55 88 86
202 202 216 202 1114 104 104 104 146 153 146 160 153 181 209 251 120 128 134 123 238 180 305 277
202 202 216 202 104 104 104 104 146 153 146 160 153 181 209 251 120 128 134 123 238 180 305 277
168 Hi8 170 159 87 87 87 87
125 128 121 131 124 138 158 195 108 115 120 110 209 159 263 246
128 128 133 124 66 66 66 66 94 97 92
101 96
110 126 154 79 84 88 81
155 118 197 182
141 141 145 136
73 73 73 73
104 107 104 111 105 119 137 117 89 94 99 91
173 132 219 203
950 975
1000 825 875 875 875 750 975 875
1225 1000 1150 750 800
1225 800
1050 975 750
2000 2000 625
1500
218 139 255 190 16 1 146 210 12 7 10 1 11 7 84 73 69
104 167 210 124 103 10 1 109 142 120 76
153
0802 0802 0822 0820 0798 0798 0798 0798 0791 0798 0800 0811 0814 0837 0837 0830 0769 0 768 0771 0 775 0 780 0 781 0 788 o 779
35296 81603 43312 65222 44019 67515 4609 91313 78186 60572
118115 15129 5 184075 95577 67017 81607 33252 67554 85294 75994 78816 74857 55101 54862
075 075 0 77 075 084 084 084 081 079 078 084 080 083 076 076 078 0 77 081 079 076 082 087 064 0 74
278 643 337 512 542 832 567
1085 766 572
1216 1417 1832
796 520 709 353 735 878 781 630 726 302 366
26472 61202 33350 48917 36976 56713 38656 73964 61767 47246 99217
121036 152782
72639 51932 63653 25604 54719 67382 57755 64629 65126 35265 40598
a=282l a =l781 y=axs S=0621 B=0 844
V=0 057 V=0 128 _ Iv -J
~
N co
Tab l53 Results of calculation for piles No 7-24
Pile No
17
1 2 3 4 5 6 7 8 9
70 11 72 13 74 75 16 17 78 79 20 27 22 23 24
Ground water
18
-20 m b s
-28 m -335 m -330 m -3 15 m dry dry -53 m -85 m
E t (kPa)
19
33653 64979 35364 45664 47969 54583 37574 63072 74548 57753
71 2618 123531 150297
71239 48619 59204 39744 77208 77863 62049 90407 95844 57762 62937
vxEt=E Md (kPa)
20
25240 48689 27230 34248 35254 45849 31562 51040 58893 45047 94599 98825
724747 54142 36950 46179 30603 57678 61572 47157 47734 83384 36968 46569
a=898 S=l 27 =0314
K (l )
21
265 511 275 358 517 672 463 749 730 546
1160 1157 7496
593 377 514 422 775 802 638 723 929 377 420
a=l422 S=l 05 =0187
E=E = t1 3
g-gcp (kPa)
22
51046 52799 54566 42492 45870 45870 45870 37547 52799 45870 77039 54566 65438 52799 40826 71039 40926 58739 52799 37541 82549 82549 40826 59945
Calculated s
(mm)
23
708 128 72 7 15 3 724 146 144 17 3 71 3 11 5 11 2 732 13 2 707 1 5 1 13 7 93
102 118 137 728 12 l 69
11 9
s__caL n=smeos
() 24
050 092 050 087 0 77 7 00 069 l36 l 12 098 133 l81 l97 103 090 065 0 75 099 117 126 090 101 097 078
ri=l00 sd=035 sv=035
K = l50gcp
25
570 585 600 495 525 525 525 450 585 525 735 600 690 450 480 735 480 630 585 450 825 825 1180 645
E l
(kPa)
26
67684 69465 72250 57726 44856 44856 44856 38448 59659 54306 74956 63214 70704 49089 56783 79502 45283 61081 58207 42927
708572 94785 71033 91898
E = t E middotA2
l
(kPa)
27
54283 5571 l 59389 47336 35795 35795 35795 30682 47790 43336 59964 51266 57553 47088 47024 65987 34823 46970 44877 33269 84639 74027 55974 71589
Calculated s
(mm)
28
l O l 12 l 11 7 737 15 9 18 7 185 21 1 12 6 12 2 133 14 l 150 13 7 13 l 14 7 709 12 7 738 755 12 4 735 50
100
- -
Tab l53 Results of calculation for piles No l-24
Pile
29
l 2 3 4 5 6 7 8 9
10 ll 12 13 14 15 76 17 78 19 20 21 22 23 24
sea l n= middotshy
smeas
28 TT
30
0 46 087 046 0 72 099 l 28 088 l 66 l 25 l 04 l 58 l 93 2 17 l 32 078 0 70 088 l 23 l 37 l42 087 l l 3 066 065
n=l 10 sd=0 44 sv=040
s seal for p n=s=lOrnn ac cording to s = 70mm
(mm)
37 32
5 l 0 51 ll 8 l18 64 064
13 0 l30 85 0 85
13 3 l 33 83 0 83
184 l84 ll6 l l 6 105 l05 137 l 37 21 3 2 12 19 4 l94 107 l06 l l 3 l l 3 84 084
92 092 l 0 9 l09 128 l28 83 083
l 0 3 l03 88 088 79 0 79
n=1 73 sd=025 sv=027
s for p according to s = 20mm
(mm)
33
10 4 184 102 18 6 15 6 200 14 9 276 209 18 4 219 292 274 185 17 9 12 9 -
169 194 219 172 200 143 15 0
seal n=s=20rnn
34
052 092 051 093 078 l00 075 l 38 l 05 092 l l 0 l46 l 37 093 090 065
-085 097 l1 0 086 l00 072 075
n=093 sd=025 sv=0 27
s for p according to s = 30rnn
(mm)
35
142 223 14 l 22 3 198 249 142 34 5 290 249 274 345 33 l 243 22 6 168 -
24 7 26 6 293 24 3 279 187 213
seal n=s=30rnn
36
047 0 74 047 0 74 066 083 047 l 15 0 97 083 091 l 15 l10 0 81 075 056 -
082 089 098 081 093 062 0 71
n=o80 sd=020 _ sv=0 25 N
IO
APPENDIXES
APPENDIX 1 1 1
Pi le No 1 Length 13 m D 10 m
Areas of influence
-
qe
(MPa)
1 fp
___9c_ f
(MPR) zyen
(MPf) qcp (MPa)
Soil type
22 20 18 16 14 1 2
l 2 (m)
10
1 0 08 06
16 15 16
026 027 026
42 41 42 Sand
04 14 U28 39 02 14 028 39 41
02 16 0 26 42 04 16 026 42 06 16 026 42 08 14 028 39 Sand 1 0 13 030 39 12 15 027 4 1 38 14 13 030 39 16 12 032 38 18 12 032 38
40 20 10 036 36 22 10 036 36 24 9 U39 35 2 6 8 043 34 28 10 036 36 30 10 036 36 3 2 10 036 36 34 10 0 36 36 36 11 0 34 37 38 11 034 37
l 1 (m)
40
42 44
11 0 34 37 15 1
46 48 50 52 54 56 58 60 62 64 66 68 70 7 2 74 76 78 8 0
APPENDIX 112
Pile No 2
to little depth of sounding
q~ = middle values for 11 = 2 Op
q~ = 145 MAa (Francke Garbrecht 1977 Tab 2 p 50) (Fi g No 2)
for sand
qcp = 0275middot145 = 40 MPa q~p =V ~~s) middot 40 = 097middot40 = 39 MPa
Pile No 4
q~ = 120 MPa sand (Fig No 4)
q = 0 315middot12 = 3 8 MPa q bull 38 = 086middot38 = 33 MPa=V Jmiddot54
1
cp middot bull cp
Pile No 12
qg = 155 MPa sand (Fig No 13)
qcp = 026middot155 = 4 03 MPa
Pile No 13
q~ = 200 MPa sand (Fig No 14)
q = 0 23middot20 = 46 MPacp
APPENDIX 113
PileNo3 Length 14 m D 15 m
Areas of influence
-
qe
(MPa)
1 Tp
----9cf
(t-1Pf) r~
(MPf) qcp (MPa)
Soil type
22 2D 18 16 17 025 43 14 17 II II
L 2 17 II II
12 (m)
16 10 08 06
17 17 17
o
II
II
II
II
Sand 04 17 II II
02 19 024 46 b9
02 19 024 46 04 17 025 43 06 15 027 41 08 13 030 48 1 0 12 032 38 12 11 033 36 14 13 0 30 39 16 14 028 39 18 12 032 38 40 20 16 026 42 2 2 16 026 42 24 11 033 36 26 11 033 36
60 28 30
10 10
036 036
36 36
Sand
32 10 036 36 34 12 032 3 8 3 6 12 032 38 38 12 032 38
1 1 (m)
40
4 2 4 4
13
14 16
030
028 026
39
39 42
46 13 030 39 48 12 032 38 50 14 028 39 52 10 036 36 54 13 030 39 56 14 028 39 58 15 027 41 60 15 027 ~-1 236 62 64 66 68 70 72 74 76 7 8 80
APPENDIX 114
Pi l e No 5 Length 6 0m D 11 m Dp 11 m
Area s of i nfluence
-
qc
(MPa)
1 Tp
-3Lf
( MPf) l ~
(MP~) qcp (MPa)
Soil type
2 2 2 0 18 1 6 14 1 2 155 U i1 33
l 2 (m)
1 2 10 08 06
15 14 12
022 023 0 27
3 3 32 32
Fine sand
+ silt
04 125 026 33 02 16 0 21 34 39
02 16 021 34 04 13 025 33 06 08 10
15 5 17 20
022 0 20 018
34 34 36
35 Fi ne sand
1 2 20 0 18 36 14 20 018 36 + s ilt 16 20 0 18 36 18 165 020 32 20 165 0 20 32 22 17 0 20 34 24 26 2 8 30 32 3 36 38 4 0
19 21 5 21 5 21 5 20 19 5 19 5 20 215
01 9 ---
018 018 0 18 0 18 -
3 6 40 40 40 36 35 3 5 36 4 0
l 1 (m) 4 2
44 20 19
018 01 9
36 3 6 157
46 48 50 5 2 54 56 58 6 0 62 64 66 68 70 7 2 74 76 7 8 8 0
APPENDIX 1 15
Pi le No 6 Lengt h6 0 m D 11 m
Areas of qc 1 __9_c_ qcp Soil typei nfluence fp f 1 yen (MPa) (MPf ) (MPf) (MPa)
-2 2 20 18 16 t 4---0 14 75 038 29 L2 20 018 36 Fi ne sand
1ti 10 30 40 + s i lt12 08 19 0 19 36(m) 06 17 020 34 04 14 023 32 02 9 034 31 56
02 6 043 26 04 12 026 3 1 06 17 020 34 08 11 028 3 1 1 0 14 023 32 35 1 2 17 020 34 Fi ne sand14 19 019 35 16 20 018 36 + silt18 18 0 19 34 20 14 023 32
46 22 12 026 31 24 12 026 31 26 15 022 33 28 18 019 34 30 20 018 36 3 20 0 18 36 34 20 018 36 3G 20 018 36 38 20 018 36 4 0 20 018 36
l 1 42 22 40
(m) 44 22 40 46 L2 4 0 158 48 50 52 54 56 q =V ~ - 3 b =0 99middot35 = 35 MPp cp 53 58 6 0 62 64 66 68 70 72 74 76 78 80
APPENDIX 116
Pi leNo7 Length 60 m 0 15 m
Areas of influence
-
qe
(MPa)
1 Tp ~
(MPg) r~
(MPf) qcp (MPa)
Soil type
22 20 18 16 9 U33 30 14 10 031 31 12 135 024 32
l 2 (m)
16 10 08 06 04 02
13 12 6
10 175
025 026 043 0 31 020
33 31 26 3 1 35 50
Fine sand
+ silt
02 04 06
17 10 115
0 20 0 31 027
34 31 3 1
08 10
145 185
023 019
33 35 3 5
1 2 14
20 19
018 0 19
36 36 Fine sand
l 1 (m)
60
16 18 20 22 24 26 28 30 3 2 34 36 38 40
42 44 46 48 50 52 54 56 58 6 0
185 125 125 165 17 19 21 215 205 20 21 20 20
24 22 20 215 22 22 21 19 18 22
0 19 026 0 26 020 020 019 --
018 018 -
018 01 8 --
018 ----
0 19 0 19
35 33 33 33 34 36 40 40 37 36 40 36 36
40 40 36 40 40 40 40 36 34 40 219
+ silt
62 64 66 68 70 72 74 76 78 80
APPENDIX 117
Pile No 8 Length60 m D 15 m Dp 2 1 m
Areas of influence
-
qe
(MPa)
1 r +
(MPg) r~
(MPf) qcp (MPa)
Soil type
22 18 019 34 20 16 021 34 18 125 026 3 3 16 115 027 31 14 11 028 3 1 12 11 028 3 1
l 2 (m)
10 08 06
105 11 145
D29 028 023
30 31 33
Fine sand
+ silt
04 18 0 19 34 02 18 019 34 71
02 15 022 33 04 11 0 28 31 06 13 0 25 33 08 20 0 18 36 10 15 022 33 12 13 025 33 14 175 020 35 16 18 20 22
20 21 20 15
018 -
018 0 22
36 40 36 33
35 Fine sand
+ s i lt
24 26 28 30 3 =
13 16 175 19 20 20
025 021 020 0 18 018 018
33 34 3 5 34 36 36
36 38 4 0
20 20 21
018 0 18 -
36 36 40
11 (m)
4 2 4 4 4 6 48 50 5 2 5 4 56 5 8 60 6 2 6 4
20 20 21 22 21 20 19 175 19 20 25 28
018 0 18 ---
01 8 01 9 0 20 0 19 018
36 36 40 40 40 36 36 35 36 36 40 4 0 23 0
6 6 68 70 72 74 76 78
qcp 1f5=v 2T middot35 = b85 middot35 = 30 MPa
80
APPENDIX 118
Pi le No 9 Le ngth 90 m D 11 m m
Areas of 1Qe -9c qcp Soil typeinfluence Tp f ryen (MPa) (MPg) (MPf) (MPa)
-
2 2 2 0 18 16 14 lc 11 034 37
12 10 10 036 36 12 08 9 039 35 Medium(m) 06 10 036 36 sand04 10 036 36
02 11 034 37 43
02 12 032 38 04 12 0 32 38 06 12 0 32 38 08 13 030 39 10 13 030 39 12 13 030 39 14 14 028 39 16 14 028 39
44 18 14 028 39 20 14 028 39 39 Med ium 22 15 027 4 1 sand 24 16 026 4 2 26 17 025 43 28 13 0 30 39 3 0 9 039 35 32 13 030 39 34 16 026 42 36 17 025 43 38 17 025 43 40 19 024 4 6
11 42 17 025 43
(m) 44 15 027 41 17 7 46 48 50 52 54 56 58 60 6 2 64 66 68 7 0 7 2 74 76 78 80
APPENDIX 119
Pi 1 e No 10 Length 95m D 11 m m
Areas of influence
-
qe
(MPa)
1 fp
-9c f
(t-1Pf) [~
(MPf)
qcp
(MPa)
Soil type
22 20 1 8 16 14 L 2 13 Uti 3J
l 2 (m) 12
10 08 06 04
18 18 28 19
0 19 019 0 19 019
34 34 34 34
Fine
sand
02 21 40 42
02 20 4 0 04 17 020 34 06 21 40 0 8 10
23 22
40 40 Fine
1 2 14 16 18
21 20 16 15
0 21 022
4 0 4 0 34 33
sand
44
20 2 2 24 26 28 30 32 34 36 38 40
14 14 13 11 11 14 17 14 12 13 12
023 023 025 0 28 028 023 020 023 027 025 027
32 32 33 31 31 32 34 3 2 32 3 3 32
l 1 (m) 42
44 12 13
0 27 025
32 33 15 2
46 48 50 5 2 5 4 56 5 8 6 0 6 2 6 4 66 6 8 70 72 74 76 78 80
APPENDIX 11 10
Pi 1 e No 11 Lengt h 9 0m D 11 m m
Area s of influence
-
Qe
(MPa)
1 fp
__k_ f
(MP~) ryen
(MPf) qcp (MPa)
Soi l type
22 20 18 16 14 12 lb 55
12 (m)
1 0 08 06 04
23 19 20 21
024 023
55 46 46 55
Medium
sand
02 22 55 62
0 2 04
24 25
55 55
06 08
27 28
55 55
10 12 14
28 28 28
55 55 55 49
16 26 55
44
18 20 22 24 26 28 30 3 34 36 38 40
24 19 18 17 22 21 17 11 13 12 11 9
024 024 025
025 0 34 030 032 034 039
55 46 43 43 55 55 4 3 37 39 38 3 7 35
1 1 (m) 42
Ll Ll
12 16
032 0 26
38 4 2 209
46 48 50 5 2 54 56 58 60 62 64 66 68 70 72 74 76 78 80
APPENDIX 141
0 2 3 4 p [MPa)
PILES WITH 40 ENLARGED BASES
80
120
160 C----0
200 IN4014 s (1977)
[mm]
P s calculateds P p(s)(mm) (MPa)(mmMPa)(MPa) ()
10 035 286 046 20 065 308 080 30 090 333 104
150 24 625 214 200 229
ai = 2605 (mmMPa) b1 = 0243 1MPa V 1000 bi = 1b = 411 MPa
_ 411 MP Vi - 24 a
() assumed
average Dp = 18 m
qcp = 24 MPa ai = 184 (mmMPa) (28-4middot24)
Vi = 1 2 (3-18)
qcpmiddotvi = 29 MPa
40
80
120
160
200 s
[mm]
DIN 4014 Part 2 ( 1977)
0 1 2 3 4 5 p [MPal
PILES WITHOUT ENLARGED BASES
C----0
DIN 4014 ( 1977
s calculated s p -p- p(s)
(mm) (MPa)mmMPa)(MPa) ()
10 05 20 062 20 08 25 113 30 11 27 3 155
150 34 441 385 200 424
ai = 2085 (mmMPa) bi= 0 157 1MPa V = 0970
bi= 1s = 637 MPa
Vi 187=3f =
() assumed
average Dp = 12 m
qcp = 34 MPa a1 = 144 (mmMPa)
Vi = 18
qcpmiddotvi = 61 MPa
Range qc = 10-15 MPa
(28-4bull34)
(3-12)
1 1 q = r -r- = 036 for qc = 10 MPaCp p Ip+= 027 for qc = 15 MPa
qcp = 36-405 MPa P
APPENDIX 142
Touma F and Reese L (1974)
Soil parameters pile parameters and base resistance see fig bullbullbullbull
TAB
Measured load settlement curves
Settlement s
mm
10 20 30 40 50 60 80
100 120
a 1 (mmMPa) bi(MPa) V
N3u
q =04 -N30 (cMPa) ()
1 qCp=--rpbullqC
Pile No 21 (US 59) 22 (HH) 23 (G1) 24 (BB) Notep Sp p S p p S p f Sp MPa mmMPa MPa mmMPa MPa mmMPa Mla mmMPa
131 76 169 59 075 133 100 100 269 74 325 62 131 153 1 94 103 381 79 456 66 165 182 273 11 0 488 82 581 69 1 90 21 1 349 115 581 86 694 72 2 15 233 424 118 675 89 800 75 229 262 813 98 245 327 884 113 925 130
64 56 100 95 U049 0032 0276 0048 0944 0998 0996 0981
80 gt100 30 60 32 gt 40 12 24 ()
Bergdahl (1982)
gt5 5 gt55 32 4 3
(0 18middot32) (018middot40) (0265middot12) (018middot24)
CONTACT PRESSURE p [ MPa]
0 2 4 6 8 100 N-------r---------------(us 59) ( HH) ( BBi
E E SQ-------lt+-----+--------------lt
VI
1shyz UJ
~ 100 1---------i----+----+----+------l------I -J I shyI shyUJ V)
so~----~--~-- ~--~
APPENDIX 143
us 59 fYJo 0 50 00
ff-t r-=-~c~=~-r~c_---_---l-~e-J-C~ 0 ------
CLAY
FINE SANO
J lD- 760 mm
f5m~--~--~
Pile US 59 and results from penetration test
HH IV_l() so 100 r=-=-==-==-r-~--=-=- 0 0 II 15- flf ~ II~ Ibull If t f
CLAY SAND
Sm
)
= -middotl lo - GtOmm
~ JI
SILTY SANO tOm
Pile HH and results from penetration t est
APPENDIX 14 4
61 NJO 50 --------00
11 1 =f J - 1 -- 0
CLAYSILT
E ~ Sm ltrj
SILTY SAND
q I lDmiddot 910 mrn tom
I) t bull
Pile G1 and results from penetration test
88
0 50 too ~1-e I q 111bull - Q
CLAY
SIL TY SAND 5m
]
l lDmiddot760mrn
Om
Pile BB and results from penetration test
APPENDIX 145
Klosinski B (1977)
Loading tests 50 bored piles 09-125 m diameter average Op= 11 m On t he sett l ement of rigid pla te the settlement of t he pi le base is given by
PmiddotOSp = T-K b
where Mb - equivalent deformability modu lus
1) Sand and sandy gravel of medium density
Mb = 25-50 MPa
According to Bergdahl (1979) medium sand is between
q(l) 5 MPa (Io=035)c2)
ql = 10 MPa (Io=065)C
from fig 117 rp1 = 055 for qc = 5 MPa 1Tp = 036 for qc = 10 MPa
q(l)= 0 55middot5 = 2 75 MPacp bull
q(2= 0 36middot10 = 360 MPacp
allowable p~ 1)= ~p = yen = 092 MPa and p~2) = ~ = 120 MPa
settlement of the pi l e base
5(1)= o 92 middot 1bull1 = O 0135 m = 13 5 mm p 325 middot middot
5( 2)= 1bull2bull1middot 1 = O 0088 m = 8 8 m p 350 bull bull
1) _ s _ 135 _ 14 7 (mm) a(2) _ 88 _ a 1 - p - o---92 - bull NPa bull 1 - T-7 - 733 (Wa)
2) Loose sand lo= 030-040
Mb = 12- 25 MPa
q~l) = 44 MPa q~2)= 58 MPa
1Tp = 058 and 052
q(3) = 0 58middot4 4 = 2 55 MPa middot q( 4) = 0 52middot5 8 = 3 02 MPa cp bull middot bull cp bull middot middot
allowable p~ 3)= 4i = 085 MPa p~4)= yenl = 101 MPa
s(3)_ 085-11 = 26 mmmiddot s(4)_ 101middot11 = 148 mm p - 312 p - 3 25
STATENS GEOTEKNISKA INSTITUT Swedish Geotechnical Institute S-581 01 Linkoping Tel 01311 51 00
Serien Rapport ersatter vara tidigare serier Proceedings (27 nr) Sartryck och Preliminara rapporter (60 nr) samt Meddelanden (10 nr)
The series Report supersedes the previous series Proceedings (27 Nos) Reprints and Preliminary Reports (60 Nos) and Meddelanden (10 Nos)
RAPPORT REPORT Pris kr
No Ar (Swcrs)
1 Grundvattensankning till foljd av 1977 50shytunnelsprangning P Ahlberg T Lundgren
2 Pahangskrafter pa langa betongpalar 1977 50shyL Bjerin
3 Methods for reducing undrained 1977 30shyshear strength of soft clay K V Helenelund
4 Basic behaviour of Scandinavian soft 1977 40shyclays R Larsson
5 Snabba odometerforsok 1978 25 shyR Karlsson L Viberg
6 Skredriskbedomningar med hjalp av 1978 40shyelektromagnetisk faltstyrkematning - provning av ny metod J Ingands
7 Forebyggande av sattningar i 1979 40shyledningsgravar - en forstudie U Bergdahl R Fogelstrom K - G Larsson P Liljekvist
8 Grundlaggningskostnadernas fordelning 1979 25 shyB Carlsson
9 Horisontalarmerade fyllningar pa los 1981 50 shyjord J Belfrage
RAPPORTREPORT
No
10 Tuveskredet 1977-11-30 Inlagg om skredets orsaker
11a Tuveskredet geoteknik
l1b Tuveskredet geologi
11 c Tuveskredet hydrogeologi
12 Drained behaviour of Swedish clays
R Larsson
13 Long term consolidation beneath the test fills at Vasby Sweden YCE Chang
14 Bentonittatning mot lakvatten T Lundgren L Karlqvist U Qvarfort
15 Kartering och klassificering av leromradens stabilitetsforutshysattningar L Viberg
16 Geotekniska faltundersokningar Metoder - Erfarenheter - FoU-behov E Ottosson (red)
17 Symposium on Slopes on Soft Clays
18 The Landslide at Tuve November 30 1 977 R Larsson M Jansson
19 Slantstabilitetsberakningar i lera Skall man anvanda total spanningsanalys effektivspanningsanalys eller kombinerad analys R Larsson
20 Portrycksvariationer i leror i Gateshyborgsregionen J Berntson
21 Tekniska egenskaper hos restproshydukter fran kolforbranning shyen laboratoriestudie B Moller G Nilson
Ar
1981
1981
1981
1981
1981
1982
1982
1982
1983
1982
1983
1983
1983
Pris kr (Swcrs)
50shy
50shy
40shy
50shy
100shy
60shy
80shy
60shy
190shy
75shy
60shy
150shy
65shy
RAPPORTREPORT
No Ar Pri s kr (Sw crs)
22 Bestamning av jordegenskaper med sondering - en litteraturstudie U Bergdahl U Eriksson
1983 75 shy
23 Geobildtolkn ing L Vi berg
av grova moraner 1984 70 -
24 Radon i jord -Exhal ation- vatten kvot -Arstidsvariationer - Permeabilitet A Lindmar k B Rosen
1984 75 shy
25 Geoteknisk terrangklassificering for fysisk planering L Viber g
1984 120shy
26 Large diameter bored piles in nonshycohesive soils Determination of the bearing capacity and settlement from results of static penetration tests (CPT) and standard penetration test (SPT) K Gwizdala
1984 85shy

11
1 LARGE DIAMETER BORED PILES IN NON-COHESIVE SOILS
11 peterminati on of bearing capacity of bored piles
from results of Cone Penetration Test (CPTl
The methods published in available literature up to 1976
were compiled by D Rollberg (1976 1977) It contains
totally 25 methods
- 22 use the results of static soundings (CPT)
3 use the results of standard soundings (SPT)
The failure load Qu of the pile is evaluated as the sum
of the pile point resistance Q and the pile skin reshypu sistance Qsu
(111)
Pile point resistance Q based on static soundina reshypu shysults can be expressed as
1- bull qP A ( 1 1 2)f C p
p
where
fp = point resistance factor
qP mean sounding resistance of static cone C
penetrometer in the area of the pile point
A cross-sectional area of the pilep
The pile skin resistance is expressed as
1 s -- bullq bullU middot Lih (113) fS C p
where
fs = shaft friction factor
sqc mean sounding resistance along the depth h
and skin surface area U middotLih p
1 2
The methods differ in
- the calculation of qPC
(074 to 40) Db below the pile base (Fig 11 1)
(10 to 80) Db above the pile base (Fig 1 11)
- the evaluation of the point resistance factor usually
values off gt 10 are used p
- the calculation of qsC
- the evaluation of the shaft friction factor
fs = 50-300 is applied
In Table 111 methods for determination of the bearing
capacity of bored piles are listed Rollberg 1977 The
point load the skin friction load and the ultimate total
load are evaluated for bored piles (shaft diameter D ~
03-090 m) from static sounding results in non-cohesive
soil
Calculation results based on static sounding measurements
are shown in Table 112 for pile point pile shaft and
total pile load respectively
The table shows that
- a ll methods overestimate the ultimate point resistance
- the best correlation for ultimate point resistance is
obtained with the Soviet method Trofimenkov 1974
n1 = 114
- there a re only five methods for evaluation of the ultimate
skin resistance
- all methods with exception of the Soviet norm Trofimenkov
1969 method overestimate the ultimate shaft resistance
- the Norwegian method Senneset 1974 gives the best
correlation for the ultimate shaft resistance =119n 2
- with exception of the Soviet methods the total ultimate
load is on the average overestimated by all methods
1 3
Taking into account the above results the Soviet and
the Norwegi an methods are presented below
The Soviet method JG TrofimenkgtV 1974
1 qP bullA + qsbullA (114a)Qu = Qpu+Qsu fp C p f C s s
where
11 40 DP 12 1 0 D p h+l1 qp r dhqcC l1+l2 h-12
0ct-0ceqs C u middoth s
f(qp) -+ see Fig 1 bull 1 2 fp C
f f ( qcs) -+ see Fig 1 1 3 s
The Norwegian methon K Senneset 1974
1 p A 1 s bullA ( 1 bull 1 bull 4b)-f-middotqcmiddot p + -f-q s p S C
where
11 30 D p
12 50 D p h+l11 f dhqP l1+l 2 qc
C h-12 h s 1
= f dhqc qch 0
f 20 p
f = f (q~ ) + see Fig 114 s
Note a ) The total skin friction -f-middotq~ is assumed to be
no less than 10 kPa even~ith a very little
cone penetrometer resistance
b) The poin t resistance -f-middotq~ is assumed to be
maximum 10 MPa even iJl case of very dense sand
14
It must be underlined that the best correlation for
the pile point is obtained with the Soviet method
101 for 94 driven piles in non-cohesive soil
- 172 114 for 46 bored piles in non-cohesive soil
Trofimenkov 19731974 showed the results of comparison
of the ultimate loads determined by formula (114a)
Q~ and by pile load tests Q~ for 153 driven friction
piles at the 57 various sites see Fig 115
In Germany a lot of investigations were made before
establishing the DIN 4014 part 2 (1977) on large diameter
piles
In Table 113 and 114 the results from these investigashy
tions are generalized
The data in the tables were obtained from 35 test loadings
(4 of which were published by Franke 1973 The diameter
of the piles was from 08 to 25 m the length from 5 m
to 34 m and the cone penetrometer resistance varied from
10 MPa to 15 MPa
Bustamente and Gianeselli 1982 proposed a prediction
of the pile bearing capacity by means of the static
penetrometer Their proposal was based on the intershy
pretation of a series of 197 full scale static loading
tests In this paper the results from tests of 55 bored
piles are chosen The diameter of the piles varies from
042 m to 150 m and the length from 6 m to 44 m The
equivalent cone resistance was determined as showed in
Fig 116 The authors have noticed that the point
resistance factor f depends on the nature of the soil p and its compactness but also on the different pile placeshy
ment techniques (see Tab 115)
Piles of category group I
- Plain bored piles - Cased bored piles
- Mud bored piles - Hollow auger bored piles
- Type I micropiles - Piers (grouted under low - Barrettespressure)
15
In Tab 116 values of the shaft resistance factor
fs are given
Category IA
- Plain bored piles - Mud bored piles
- Hollow auger bored piles - Cast screwed piles
- Type I micropiles - Piers
- Barrettes
Category IB
- Cased bored piles - Driven cast piles (concrete or metal shaft)
Category IIA
- Driven precast piles - Prestressed tubular piles
- Jacked concrete piles
Category IIB
- Driven metal piles - Jacked metal piles
It can be noted that the values in Tab 116 are in
genera l of the same range for the driven and the
bored piles
According to the Polish Specification 1979 the point
and shaft resistance factor are given by
1-f- = kmiddota
p p
where
ap 035 for sand
k coefficent of unhomogeneity k qcp min
qcp
= 0065 for sandfrac12
1
16
Similar results can be observed in Fig 116a and
Fig 116b It was showed by Kerisel (1965) and Franke
(1973) that the harder soil the more loosening at
excavation and thus relatively smaller bearing capacity
Taking into account the Franke diagrams we will have
for D = 125mand settlements= 2 cm p
Cone resistance qc (MPa) 1 5 50 1 0 15 22
qc p for s=2 cm 3 6 8 12 14
(see Fia 1 1 6b )
taking safety factor for pile base F = 3 the point resis~ance
33-10 ~-05
380375 lo 212 bull lo 2114 bull
factors- shy are p
The above anal ysis shows that it is possible to determine
ultimate point and shaft resistance of bored piles from
static cone sounding But it is very important and must
be taken into account type of pile kind of soil and
degree of compaction
Bel ow calculation method for large diameter bored piles
based on the static cone penetrometer resistance (CPT)
is proposed Equation (117) can be used directly for
the base diameter D lt 15 m For larger diameters p shyD gt 15 m the values should be multiplied by the
p ff t ITscoe icen Y~ as pi
( 1 1 5 )
where
qcp = according to equation (117)
D = diameter of the pile base D gt 15 mpi pi
17
This value q~p should be put into equation 116
The value qc s in equation 118 is independent on the
pile diameter
Proposed calculation method
(116)
where)
1 1 40 ~ 11 3 for piles wit h a nd enlarged bases12 10 12 = ~
h+h
q (h) dh (117)qcp l1+l2 f -f- Ch-li p
h 1 f 1
qcs = o -f- qc (h) dh (118)h s
1 -f- = f(q kind of soil ) -+- see Fig 11 7 and Tab 1 1 7
C p
f (q kind of soil ) -+- see Fig 1 1 8 and Tab 1 1 8 fs C
Note
a) the point resistance q for qc gt 20 MPa is assumed cp to be maximum as
- Gravel 70 MPa - Coarse sand medium sand 55 MPa - Fine sand s il ty sand 40 MPa
b ) The shaft resistance qcs for qc gt 20 MPa is assumed to
be maximum as
- Gravel 110 kPa - Coarse sand medium sand 90 kPa - Fine sand s ilty sand 70 kPa
These proposed values are compared with results by
Bustamente (1 982) and the Polish Specification (1978)
Fig 11 9 and F i g 1110 A similar comparison for DIN
4014 1 977 is shown in Fig 1111 and Fig 1112
) In this paper was used the above values 1 1 and l z But it can be used in practice 11 =30 D and h =2Dp respectively The results shall be very simi l ar to the above onPs
18
The proposed method has been examined with field test
results This is shown in Fig 1113 to Fig 1128
and Appendix 1 11 to 1110 and Tab 119
The comparison shows that the value of q in equationcp (117) corresponds to the settlement -10 of the base
diameter (s=010 DP) see Fig 1113 and Tab 119
(average sDp=88 and standard deviation sd=3)
Later in this paper the allowable load and dependence of
the load versus settlement will be determined
12 Determination of bearing capacity of the large
diameter bored piles from results of the Standard
Penetration Tests (SPT)
There are little published on pile tests coupled with
results from Standard Penetration Test (SPT) Among the
authors who have published material in the subject are
- Meyerhof 1956 1976
- Senneset 1974 (Norwegian method)
- Rodin Corbett Sherwood Thorburn 1974 (English method)
- Polish Specification 1975
- Weltman Healy 197 8
- Reese 1978
- Japanese Society 1981
- Decourt 1978 1982
The Norwegian method is valid o nly for concrete andor
wooden piles the English method only for gravel It is
very important to underline that the Norwegian a nd the
English methods use of the SPT resul ts intermediate by
the static cone penetrometer resistance (q ) as well C
Below methods are presented that are using the results of
SPT directly Meyerhof s method in total can also be used
on driven piles in non-cohesive soil Although we could
have found some proposes for bored piles Eqs (121 and
122) see Fig 121 and Fig 1 22 as well
19
Ultimate point resistance (psf)
12 N 3 omiddotH lt 120 N 30
(kPa) (1 2 1)Psf D
where
N30 the average standard penetration resistance
in blows per 03 m
H depth in bearing stratum
Ultimate skin friction tu
for bored piles tu N~ o (kPa) (1 22a)
for driven pil estu 2N30 (kPa) (1 2 2b)
where
N30 the average standard penetration resistance
in blows per 03 m within embedded length
of pile
Weltman and Healy (1978) taking into account Meherhofs
proposition for driven piles have introduced two coefshy
ficents for bored piles in gravels (glacial soil) Equ
123 and Fig 1 23
t = a 2 N30 (kPa ) (1 2 3)U 1
where
ai a 1 for impermeable gravels see Fig 123a
ai a 2 for permeable gravels see Fig 123b
The Polish Specification ( Specification for Design and
Construction of Large Diameter Bored Piles in Bridges
1975 Ministry of Transport) gives the ultimat e point
resistance in dependence of N30 base diameter and depth
see Tab 12 1 The Tab 121 contains values for coarse
and medium sand For other non-cohesive soils the following
coefficients are proposed
p f = S bull p f (medium sand) ( 1 2 4)S 1 S
20
where
S1 1 20 for grave lSi
f 132 080 for fine sand
13 3 070 for silty sand13i
In Fig 124 values of psf are shown for h = 10 m DP
06 m DP= 15 m and h = 20 m DP= 06 m DP 1 5 m
respectively
A few of the instrumented piles were tested and analyzed
by Wright and Reese (1979) The ultimate point and shaft
resistance in the fine and silty sand as a function of
blow count from SPT is shown in Fig 125 Results from
two additional tests reported by Koizumi (1971) are also
introduced in the figure The ultimate point resistance
is assumed to exist at a settlement equal to 5 of the
base diameter
Methods of prediction of the bearing capacity of piles
based exclusively on N30 values were presented by Decourt
1982 Below a proposition for high capacity piles excavated
and cast under bentoni te is presented
The ultimate skin friction is determined by the expression
(see Fig 126)
t = 33 N30 + 1 0 (kPa) ( 1 bull 2 5 ) u
where
N30 average value of N30 along the shaft
- for N30 lt 3 must be taken as = 3N30 - for N3o gt 5 0 must be taken as NJo= 50
The allowable point resistance can be obtained in a n
expedite way as
Psa = 33 N30 (kPa) (1 2 6)
where
N30 = average of Nat point level one metre above
and one metre below
Psa allowable point resistance
21
Decourt proposed a safety factor for the point of F = p
40 Therefore the ultimate point resistance can be
determined by the expression
(kPa) (1 2 7)
In Fig 12 7 and Fig 1 28 the above values for base
and skin friction resistance are compared respectively
Taking into account the type of soil thereis a good
correlation for ultimate point resistance The result for
ultimate skin friction is scattered but only apparently
The values for large diameter bored piles are between
the line 1a and 1b in Fig 128 Large diameter piles
have a high ultimate skin friction in relation to driven
piles (see points for bored piles in Fig 122 and DIN
4014 Part 2 1977 as well) The high values for piles
excavated and cast under bentonite have had a strong base
on the load tests (Decourt 1978 1982 and Wright and
Reese 1979)
Below the proposals are given for determination of the
values of the ultimate point resistance and the ultimate
skin friction Eqs 128 to 1214 and Fig129 1210
The ultimate point resistance
- gravel psf = 140 N30 (kPa) ( 1 bull 2 8)
for N~ 0 gt 50 blows3O cm Psf 7 MPa
- coarse sand and medium sand
(kPa) ( 1 2 9)
for N30 gt 50 blows3O cm Psf 55 MPa
- fine sand and silty sand
psf = 80 Nio (kPa ) (1210)
for N30 gt 50 blows3O cm p f = 40 MPa 5
where N3 o the average of N value near the point level as
22
h+l1
f N3o(h)dh ( 1 2 11 ) h-12
3DP see Fig 1 1 1 D
p
The ultimate skin friction for coarse sand and medium sand
tu = 1 8 N 3 o (kPa) (1212)
t (kPa) (excavated and cast (1213)u under bentonite)
where
N30= the average value of N along the shaft as h
N -
3 o = h1 f N 3 o ( h) dh ( 1 bull 2 bull 1 4 ) 0
The ultimate skin friction for N30 gt 50 blows30 cm is
assumed to be maximum as tu = 90 kPa and t = 150 kPa u
13 Allowable load of large diameter bored piles
The allowable load Qa of large diameter piles has been
expressed as
OuQa ( 1 3 1)Ft
Qa Q(s)=Qb(s) + Os(s) ( 1 3 2)
Opu + Osu (1 3 3)Qa Fp Fs
Qr lt mmiddotQf ( 1 bull 3 4)-
= universal safety factor
individual safety factor for ultimate resistance of the pile point
individual safety factor for ultimate resistance of the pile shaft
= load according to the allowable settlement
calculated load
m coefficient
calculated ultimate bearing load of the pile
23
The equations from (131) to (134) are used as
1) equation (131)
a) DIN 4014 - 1977 Ft= 2 175 15 (depending on the kind of load)
b) Polish Specification 1975 Ft = 18 16 ( -- )
1c) Trofimenkov 1974 Ft = 14307
2) equation (132)
a) DIN 4014-1977 i Q(s) = Qb(s) + Q (s) = A middotp(s) + E tAsmiddott(s)
s p 0
where Qbs) and Qs(s) are described in Fig 1423
3) equation (133)
a) Polish Specification 1974
F 25 22 depending on the kind of load p
F 1 bull 0 s
b) Wright SJ Reese LC 1979
The ultimate capacity or resistance is considered as a
random value and represented by a frequency distribution
The distribution can be described by a mean value and a
variance The distribution of the load applied to the
foundation can be described similarly The coefshy
ficients used to factor resistance and loads are called
partial safety factors Some recommended partial safety
factors for resistance under normal conditions of design
and construction are given in Tab 131 Normal control
is defined as a condition where the coefficient of variation
is less than about 035
Typical values for partial safety factors for loads are
in the range 1 to 2 depending on the type of load and
how it is applied The overall factor of safety Ft can
then be calculated from the equation
Ft = y RbullY S
24
where
YR the par tial sa f ety fac t or for resistance and
Ys the partial safety factor fo r load
The probability of fa i lur e of the foundation can be r eshy
lat ed to the factor of safety for a parti cular degree of
uncert ainty (see Tab 13 2)
c ) Tejchman Gwizdala 1979
The authors discuss adequate safety factors based on fie l d
test s by Spang (1 972) Franke (1976) Touma and Reese (1974)
Colombo (1971) Kerisel and Simons (1962) Appendirno (1973)
see Tab 1 33 Taking into account the universal safety
factor Ft= 2 0 for the tota l load settlement curves it
was estimated
i) F in the range of 111 to 237 with the average value s F = 166 and standard deviation sd = 034 s (see column 16 Tab 133)
ii) Fb in the range of 161 to 945 with the average
value Fb = 387 and standard deviation sd = 2 15
For model core d piles in laboratory conditions values of
Fs = 108 to 154 (average Fs = 132 s~ = 019) and
values of F = 280 to 5 94 (average F = 3 55 sd = 1 07)p p
see Tab 1 3 4
As a conclusion it was assumed that Fb = 40 and F 1 5 s
for l arge diameter bored piles
The investi gation has shown that for the above safety
factors settlements of piles under permissibl e loads are
10 to 20 mm There was assumed a maximum load on large
diameter piles corresponding to a settlement of 010
diameter of the piles
25
d) Bustamente Gianeselli 1 982
e) 0ecourt 1982
The safety factor is given by
F = FgmiddotFfmiddotFamiddotFw where
F 11 - skin friction g F 135 - point bearing capacity
g
Ff safety factor related to the formulation adapted
Ff= 10 for Decourts method
Fd safety factor related to excessive deformation
Fd = 10 for skin friction
As for the point Fa= 2 to 3 depending on the
pile diameter For usual cases 25 is suggested
Fw safety factor related to working load
Decourt recommends 12
Thus we will have
- for skin friction
Fs = 11bull10middot10middot12 132 - 13
- for the point
F = 135bull10bull25middot 1 2 = 405 = 40 p
4) equation (134)
a ) Polish Code 1983
Q lt mbullN r shy
where
total load coefficient (depending on the kind of load For foundation we can assume Yf = 12 )= code load
correction coeffic i ent
09 for pile foundations
m 08 for two piles
m 07 for single pile
26
N ymmiddotQu
ym material (soil) coefficient
ym 08 to 09 (Polish Code 1981)
Thus we will have
QnmiddotYf lt mmiddotym middotQu-
Yf9uFt = On m bull Ym
1 2 max = 2 14Ft 0 7 bull 0 8
1 2min = 1 48Ft 0909
The above analysis has shown different ways to determine
the allowable load The analysis is in direct connection
with mobilization of the load (versus settlement) The
dependence of total load point resistance and shaft reshy
sistance will be discussed in detail in Chapter 14
In the authors opinion taking into account the above
analysis the allowable load should be determined based
on the equation 133 ie based on individual safety
factors for ultimate point and shaft resistance Proposed
values of F and F in literature are shown in Tab 135 s p The average values are Fs = 145 and Fp = 3 38 respectively
Taking into account that the bearing capacity is determined
based on the results from sounding measurements direct from
a place near the piling without a ny indirect correlation
the allowable load of large diameter bored piles is given
by the equation (133a)
( 1 3 3a)
where F = 30 and F 13 are proposedp s
27
14 Determination of settlement of larqe diameter bored
piles based on static cone penetration tests CPT
Determination of ultimate point and skin friction resistance
based on static cone penetration tests has been discussed
in Chapter 11 above Based on the results of this calcushy
lation and on Chapter 13 we can establish an approximate
relation between point resistance shaft resistance and
total load on one hand and settlement on the other However
the approximation gives a wide scatter especially for base
resistance as can be observed in Fig 141 to Fig 144
Only the first part of the point resistance - settlement
curves are in good agreement with measured values It can
be observed in Fig 145 that the average correlation
coefficient n = 098 and standard deviation sd= 029
This way of calculation can be used only for rough calcushy
lation (see Chapter 13)
In Chapter 11 also measured point resistance - settlement
curves were shown The base resistance increases gradually
with increasing pressure and settlement Below the cur7
vature of the point resistance - settl ement curve will be
examined It is assumed that this curve can be described
as a part of the hyperbola curve Thus if the ratio of
the measured settlement (s ) to the point resistance (p)
is plotted against the measured settlement the result
will fall closely to a straight line with the equation
( 1 4 1)
where a 1 and b 1 are constants (see Fig 1 46a and Fig
14 6b)
Then the point resistance - settlement realtionship can be
expressed as a hyperbola
s p = ( 1 bull 4 2)
The constant is the initial s lope of the point resistanceshya 1
settlement curve ie a 1 = t~a The inverse of the constant
28
b 1 is the vertical tangent (asymptote) to the curve 1ie for s = 00
bf= ~ If the ultimate point reshy1
sistance psf is equal to bf (psf=bf) the whole point
resistance settlement curve will be a hyperbola type
Now the Eq 1 4 2 can be written as
s s ( 1 4 3)a) p s or b) p = a+__sect_a1 + 1 Psfbf
If the ultimate point resistance is smaller than bf only
a part of the hyperbola curve ought to be considered
Further the Eq 14 3 will be written as
p ( 1 4 4)
where
poundf_ correction factor for hyperbola point Psf resistance-settlement relationship
Taking into account the discussion in Chapter 11 the
ultimate point resistance psf = qcp based on the CPT measurements
Therefore the relationship between the point resistance
the sett l ement and the CPT result can be expressed as
s p (1 4 5)s
The correction coefficient v 1 will cause a change of the
position of the vertical asymptote bf in r elation to the
ultimate point resistance q bull This means that we take cp into account a different part of the hyperbola curve for
the description of the point resistance-settlement relationshy
ship
Now if we want to use the equation (145) in practice
we must determine the constant and the coefficienta 1 v 1 (assumed that q is determined ear l ier Chapter 11)cp
29
The constant a 1 and t h e coefficient Vi have been detershy
mined based on fi e ld tests according to pi l es No 1 - 20
see Tab 14 1 and Tab 1 1 9 as wel l The values of
a 1 versus the point diameter D and the ul timate pointp
resistance respectively are shown in F i g 147 and Fig
148 Fig 1 47 shows that a 1 is independent of the
point diameter D Based on Fig 148 it can be assumed p
that
28-4bullq (1 4 6)cp
This correlation has been examined with data of the
literature see Fig 1 49 and Appendix 141 to 1 45
(Note there were no static penetration tests and qcp was determined based on a correlation made by Bergdahl
(1982))
A good correlation with equation 146 can be seen taking
into account the safety factor in the DIN 4014 Part 2
(1977) bull
The correction factor v 1 versus the poi nt diameter is shown
in Fig 1410 I t is assumed that the correlation is
V1 = 3 0 - D ( 1 4 7)p
where D is in m p
The above equations ie 146 and 147 were assumed for
a later analyses see Fig 14 11 and Fig 1412 The
piles No 1 to 20 were examined taking into account Eqs
14 5 14 6 and 1 4 7 The result of this cal cul ation is
presented in Fig 1 413 to Fig 1 4 18 and in Tab 1 4 2
respectively In Fig 1413 the calculation way for pile
No 2 is shown as an example
In Fig 1414 to Fig 1 417 measured and calculated
values of the point resistance versus settl ement can be
compared In tota l good correlation exists for all the
30
pressure-settlement curves Values of q from static cp
cone penetration tests and generalized values of anda 1
v 1 were considered Only for piles No 17-20 qcp was
assumed as the point resistance for s = 010 D because p
the static penetration test results were inaccessible
The similar comparison is shown in Fig 1417a for piles
in sand based on experimental results (Tuoma Reese 1972
and Wright Reese 1979) where the ultimate case resistance
was assumed as the resistance at a base settlement of 005
D The relative base resistance is the mobilized base p resistance divided by the ultinate base resistance The
curvature of the proposed point resistance settlement shy
curve to mean value proposed by Wright and Reese is excellent
However the constant a 1 and the coefficient v 1 were
determined for sand only In the future they should be
examined especially for gravel and silty sand based on
field tests Until then in the authors opinion the
values of v 1 can be chosen from Eq 147 for all nonshy
cohesive soils But for a 1 there is proposed
at = gt bulla (1 4 8)1
where
gt- 1 = 080 for gravel
gt 2 120 for silty sand
This proposal is shown in Fig 14 11 as dashed lines
A good correlation can be seen with the investigation by I
Kiosimiddotnski for sandy gravel and on the safety side with
the investigation by Tuoma and Reese for silty sand (see
Fig 149)
In Fig 1418 all calcul ations for pile No 1 to 20 are
summarize d The correlation coefficient n is defined as
the calculated point resistance p(s) divided by measured
point resistance p(s) For totally 126 points from 20
curves an average of n = 098 with standard deviation
31
al= 023 was obtained see Fig 1418 A similar result
can be observed for the range usually assumed of the
allowable settlement for sinqle large diameter bored
piles as
for
- for
- for
s
s
s =
10
20
30
mm a
mm
mm
verage n10 II
II
mm 089
095
099
and sd =
and sd
and sd
031
027
026
It can be questioned whether the sonstant a 1 can be deshy
termined in different ways The constant a 1 is the initial
slope of the point resistance-settlement curve as menshy
tioned above Then we can use all methods for determination
of settlement of a pile point The range of validity of
these methods then must be determined This will be shown
later
In order to be able to design the total load settlement
curve the skin friction resistance-settlement relationshy
ship must be determined The ultimate skin resistance of
large diameter bored piles was determined in Chapter 11
(based on static penetration tests) and in Chapter 12
(based on standard penetration tests)
In the past a lot of field tests have been done on the
mobilization of the shaft resistance versus pile settleshy
ment In this subject there is a rather good agreement
in the whole investigation for cohesive and non-cohesive
soil
Some results and opinions on thispresented in the literashy
ture during the last few years are shown below
Ultimate shaft resistance versus settlement
1) BurlandJB Butler FG Duncan P (1969)
-The shaft l oadsettlement curve is derived using a=0 3
with 90 ultimate load being mobilized at 025 in
settlement(~65 mm)
- soil London clay
- see Fig 1 419
32
2) Touma FT Reese LC (1974)
- The failure of the sides of the shaft takes place
at a downward movement of about 04 in (10 mm)
- soil sand
- see Fig 1420
3) Tomlinson HJ (1977)
- The maximum shaft resistance is mobilized at a
settlement of only 10 mm (or j in)
- soil stiff clay
- see Fig 1421
4) Klosinski B ( 1977)
- It was assumed that skin friction increased proshy
portionally to pile settlement up to the limit value
s bull This value depends on soil conditions and pile0 diameter and is usually from 3 to 8 mm For soft
compressible soil it may be grater than 10 mm
- soil cohesive soils
- see Fig 1422
5) Franke E Garbrecht D (1977)
- At settlement of 2 to 3 cm which are normally
allowed in Germany under working loads for buildings
not very sensitive to differential settlementsthe
skin friction is almost always fully mobilized
- soil sand
6) DIN 4014 part 2 (1977) and Franke E (1981)
- The skin friction Tm is approximated as diameter
independent having failure settlements of smf = 2 cm
in sand and 1 cm in clay
- soil sand and clay
- see Fig 1423
33
7) Reese By L (1978) Reese By L Wright SJ (1979)
(1978) The maximum skin friction being developed at
an average downward movement ranging from about 05shy
2 of the shaft diameter The average of six load tests
reported by Whitaker and Cooke (1966) are a lso plotted
for comparison
- soil stiff clays
- see Fig 1424 and Fig 1425a
(1979) The relative settlement is the average settleshy
ment of the butt and base devided by the shaft diameter
The mean curve maximises at a relative settlement of
about 002 D
- soil sand and clay
- see Fig 1425b
8) Tejchman A Gwizda3a K (1979)
- A clear differentiation of the distribution of shaft
and base resistances is observed for changing settleshy
ment For fairly small settlements the shaft resist shy
ance increases quite fast and the ultimate values
are reached soon while the base resistance increases
gradually with increasing loads and settlements withshy
out clearout ultimate values it can be assumed that
complete mobilization of shaft resistance corresponds
to settlements equal to 001 or 002 diameter of pile
- soil cohesive and non-cohesive soils
- see Tab 131 and Fig 1 426
9) Promboon S Brenner R P (1981)
- Load distribution and load transfer curves disclose
that most of the load is carried by shaft friction
which is developed at small displacements in the order
of 10 mm
- soil Bangkok clay
- see Fig 1427
34
10) Prodinger w Veder Ch (1981)
- The maximum value of skin friction resistance
occurred for a total settlement of 12 mm
- soil silty clay and sand
- see Fig 1428
11) Farr JS Aurora RP (1981)
- Ultimate load transfer was recehed (or nearly reached)
at a relative settlement of about 04 in (10 mm)
- soil gravelly sand
- see Fig 1429
12) Decourt (1982)
The skin friction resistance is totally mobilized
with deformations of about 10 mm or at the most 15
mm regardless of shaft dimensions This observation
of ours seems to clash with the opinions of other
authors who seek to relate the deformation necessary
for full skin friction mobilization with the shaft
diameter
- soil cohesive and non-cohesive soil
In Tab 143 all these results are shown Depending on
the kind of soil the following v a lue s of ultimate settleshy
ment for shaft can be assumed
- averages 142 mm (sd 5 3 mm) for sand
- averages 100 mm (sd = 21 mm) for cohesive soil
averages 726 mm (sd 67 mm) for claysand
It can be observed (see Fig 1419 to 1428) that the
shaft friction resistance increases proportionally to
the pile settlement up to the above limit value and
thereafter becomes constant
35
Taking into account what was mentioned earlier on point
resistance settlement relationship and the above results
a relationship between total load point resistance and
shaft resistance on one hand and settlement on the other
can be made see Fig 1430
It is assumed on the safety side that the following
ultimate settlement (S~) exists for the shaft resistance
of large diameter bored piles
SS1 ) 200 mm for non-cohesive soil u SS2) = 100 mm for cohesive soil u SS3) 15 0 mm for claysandu
In Fig 1 430 the curve Q (s) is calculated based on p
the equation 14 5 or 144
The values of psf in equation 144 can be calculated
based on other methods as well
The total load-settlement relationship is obtained by
summing up point and s haft resistance as
Q (s) = Q (s) + Q (s) (149)s p
for each point
Now the allowable load can be determined from equation
133a and versus the allowabl e settlement as
Q (s) = Q (s) + Q (s) (1410)s p
where s lt Sa
Sa= the allowable settlement of the pile
The analysis allows determination of the approximative
load settlement dependence without calculating the settleshy
ment for non-cohesive soil In Fig 1431 it is shown
36
In Tab 144 the settlement for allowable point reshy
sistance q5P according to equation 133a is shown
as well The average settlements= 198 mm (sd=78 mm)
is obtained This value is similar to the assumed ultimate
settlement of shaft for non-cohesive soil The ultimate
settlement for point resistance is assumed s = 010 Dp as mentioned earlier
37
15 Initial slope of pile point resistance shy
settlement curve
Settlement of piles and pile foundations can be cal culated
based on
- empirical correlations
load-transfer methods using measured relationships
between pile resistance and pile movement at various
points along the pile
- theory of elasticity that employs the equations of
Mindlin for subsurface loading within a semi-infinite
mass
- numerical methods and in particular the finite element
method
- use of in-situ tests (Cone Penetration Test Standard
Penetration Test Pressuremeter Test)
The critical slope of the pile point resistance-settlement
curve is important for calculation in chapter 14 The
constant a1 can be determined from all the above mentioned
methods
Comparison is made to Berggrens and Schmertmanns methods
below (see Berggren 1981 as well)
6sIn Tab 151 (No 1 2 3) the values of a 1 =~p for s =
10 mm and s = 20 mm (measured for large diameter bored
piles No 1 to 24) are compared to the calculated values
according to the modified hyperbola method (see Fig 14 6)
It can be seen that these calculated values are between
s = 1U-2u mm but rather closer the measured values for
the settlements= 10 mm see correlation coefficient n 6
and n 7 in Tab 151 respectively The average correlat i on
coefficent for the settlements= 10 mm is n9 = 108 and
the standard deviation is sct = 014 The comparison to
Berggrens and Schmertmanns methods for s = 20 mm ( see
Berggren 1~81 and Tab 151 as well) shows that the
results based om these methods give too high values of a 1 bull
38
The average values are ne= 143 sd = OJ3 and ng= 137
sd = 037 for Berggrens and Schmertmanns methods
respectively A bit better agreement can be observed
for Schmertmanns method
Taking into account the results in Tab 151 ana Tab
15l it must be assumed that for the determination of
a 1 the pile point contact pressure p(a1) should be
assumed as the ultimate point bearing capacity devided
by about 4
p(ai) - ( 1 bull 5 1 )
Most of the methods for determination of settlement are
based on the theory of elasticity The settlement ot the
pile point can be expressed as the average settlement of
a rigid circular foundation from the equation
11-Dp 1-v 2
s = p -4- -E-bull microd (1 ~ 2 J
where
p pile point contact pressure
E Youngs modulus
D diameter ot pile pointp ) = Poissons ratio
microd = depth factor
The range of validity of the pile point contact pressure
was determined in equation 151 Youngs modulus has an
important meaning lt can be determined from triaxial
tests or oedometer tests The relationship between the
constrained (oedometric) modulus Mo and Young s modulus
Eis dependent on Poissons ratio v as expressed by the
equation
E = l 1 + V ) ( 1 - 2 V ) Mo ( 1 bull 1 bull 1)- 1-v
39
TaKing into account the analyses made ny Chaplin (19b1a
1 961bJ Janbu (1 963 1970 1973J Andreassen (1973)
Duncan and Cheng (1970) Tejchman anct Gwizdala (1979)
Gwizdala (1978) Franke (1981) Berggren (1981) Withiam
and Kulhawy (7981) and the present investigation the
calculation of settlement is proposed to be
s = 24 bull p bull ~ D bull 1-v 2 bull micro d (154)Do o E
where s (r1)
p (kPa)
Dp (m)
E (kPa)
D0 =10 m
micro = 05 + 01 vfrac34E (1 5 5)d vs
but 05 lt microd lt 10-tip= p - (J (ovs see Fig 151)vs
E =Et= Kbullpat (Oo )n [1- Rf(1-sinltj) 101 - 03 ) 12 (1 5 6)2 c cosltP + 2o 3 sinltP 1Pat
in which K n and Rf= hyperbolic stress-strain parameters
Pa= atmosferic pressure ando 1 o 3 and o0 are determined by
averaging the concrete and soil vertical and radial stresses
near the pile point according to Fig 151 Then the
stresses at the pile point level are h
(J vs = L
0 Yi h
l vertical stress in the soil
0 hs Ko h
0 vs radial (horizontal) stress in the soil
0 vc L ye h -l
vertical stress in the concrete 0
0 hc K oc a vc radial (horizontal)
concrete stress in the
40
K at rest soil lateral stress coefficient 0
K c lateral stress coefficient for fluid fresh concrete0
K 1 0 oc
and average values
a 05(a +a)V vc vs
1 1 - shy~ = -(a +a+a I = -3 (av+2ahJ the applied mean normal stress0 j Z X y
Assuming this model calculation results for piles No 1-24
(see Tab 11~ as well) are shown in Tab 153
The piles are embedded mainly in medium sand to fine sand
For this kind of soil it can be assumed (soil parameters
from field or laboratory tests were inaccessible)
~ = 35deg c = 0 R~ = 09 n 05 v = 025 K c 10l 0
K = 04 Pat= 1UO kPa ye 24 kNrn 3 y = 14 kNm 3 bull0 C
Moreover in Tab 153 the following symbols are used
p(a1 ) - pile point contact pressure according to equation
1 bull 5 1
s(a1) - settl ement of pi l e point according to equation
143 and Tab 141
pound TT ( 2E = s bull Dp bull i 1-v ) according to equa~ion 152t
E~ Et bull microltl
EI
K = ro~ - according to equation 1 bull 5 6 p bullO middotA2
a~ o
E = E voD middot D middot ~4 ( 1 - v 2 ) according to equationt S p O 0
1 5 4
Et= E microd
K = according to equation 156 V PatmiddotaomiddotA2
41
The calculation results of Youngs modulus E = Et and
dimensionless canpressionrro1ulus for piles to 1-24 are shown
in Fig 152 to 155 using equation 152 and 15b
or equation 1~4 and 156 respectively lt can be obshy
served that the scatter in Fig 153 and Fig 155
where the influence of tne pile diameter is reduced
compare equation 154 is less than in the other figures
The reduced influence was made after observations from
field and laboratory tests while the equation 152 is
taken direct from theory of elasticity These values of
E and K are in good correlation with published values in
literature The values of Youngs modulus versus the
relative density of soil are compared to literature values
see Fig 15b Based on the analysis in this chapter it
can be assumed that
E = 9-ql 3 ( 1 bull 5 7)cp
where qcp is in accordance with equation 117
The calculation results based on this proposal are incluced
in Tab 1 5 3
The c a lculate d s e ttlements based on e q ua tion 154 and
157 are shown in column 23 and the values of the
correlation coef f icie nt (n= Seal ) in column 24 respectshyimeas
ively
The dimensionless canpression modulus can be d e termined as
K = 15Ubullq (qcp in MPa) (1 5 8)cp
see column 25 Tab 153
The calculation results based on the K compression modulus
according to equation 158 156 and 1 5 4 are shown in
columns 25 26 2 7 28 and 29 in Tab 153
42
For comparison and for determination of the range of
validity of this method the caLculation results of
pile point pressure for settlements s = 10 mm s = 20 mm
s = 30 mm (see Tab 141) according to equation 157
and 154 are shown in columns 30 to 35
The results obtained in Tab 153 confirm the possibility
to use the proposed method to calculate the initial part
of the pile point resistance settlement curve of large
diameter bored piles in non-cohesive soil and the initial
slope of this curve as well
A simple model has been proposed based on the theory of
elasticity ana the tangent modulus defined by Janbu (1963)
and Duncan amp Chang (1970)
A new approach according to the pile diameter depth factor
and principal stress is proposed
The settlement of the pile point can be made up to a point
pressure according to equation 151 on up to a settlement
of about s ~ 20 mm (30 mm)
-- The application of v Op in equation 1 5 4 a llows us ing
Youngs modulus as independent of the pile diameter
opposed to Bazants a nd Mosopusts (1981) proposal where
Youngs modulus wa s determined versus the pile diameter
The equation 1 5 6 takes into account the dependence of
Youngs modulus on depth (or overburden pressure) as
well
In the method field test (Cone Penetration Test) or
laboratory tests (hyperbolic stress-strain parameters
can be used
Comparison of the method to 24 availa ble load test r e sults
or large diameter bored piles in sand shows good a greement
to calculated and measured values
43
REFERE~CES
Adamczyk J (1978) Okreslanie udzwigu pali wierconych
za pomoca sondy statycznej (Bearing capacity of bored
piles based on the static sounding) Inz i Bud No 7
pp 253-257
Andreasson L (1973) The compressibility of cohesionless
soils Thesis Chalmers University of Technology
G6teborg (in Swedish)
Appendino M (1973) Comportamento di un palo di grande
diametro strumentato Rivista Italiano di Geotechnica
No 3 pp 115-118
Butterfield R Banerjee P (1971) A rigid disc embedded
in an elastic half space Geotechnical Engineering
Vol 2 pp 35-49
Bozant z Mosopust J (1981) Drilled pier design based
on load settlement curve X ICSMFE Stockholm Vol 2
pp 615-619
Begemann HK (1982) Cone penetration tests pile bearing
capacity and the thesis of Rollberg Proc of the Second
European Symposium on Penetration Testing Amsterdam
pp 433-438
Berggren B (1981) Bored piles on non-cohesive soils shy
settlement and bearing capacity (in Sweden) Thesis
Department of Geotechnical Engineering Chalmers
University of Technology G6teborg
Bergdahl UB (1979 1982) Sonderingen und in situ Messungen
Wien 18-19 Juni 1979 - Private information 19821983
Bustamante M Giane selli L(1982) Pile bearing capacity
prediction by means of static penetrometer CPT Proc
of the Second Europ Symp on PenTest Amsterdam
Vol 2 pp 493-500
Chaplin TK (1961a) An experimental study of the settleshy
ment of footings in sand PhD Thesis Univ of
Birmingham
44
Chaplin TK (1961b) Compressibility of sands and settleshy
ments of model footings and piles in sand 5th Int
Conf on Soil Mech a Found Engng Vol 2 p 33 Paris
Colombo P (1971) Observazoni sul comportamento ltli pali
a grande diametro Rivista Italiana di Geotechnika
No 3 pp 163-172
Dahlberg R (1975) Settlement characteristics of preconshy
solidated natural sands Swedish Council for Building
Research D11975
De Beer EE (1964) Some considerations concerning the
point bearing capacity of piles Proc Syrop Bearing
Capacity of Piles Boorkee I pp 178-204
Decourt L Quaresma AR (1978) Capacidade de Carga de
Carga de Estacas a partir de Valores de SPT VI Conshy
gresso Brasilerio de Mecanica dos Solos e Engenharia
de Fundacoes - Rio de Janerio - ABNS
Decourt L (1982) Prediction of the bearing capacity of
piles based exclusively on N values of the SPT Proc
of the Second Europ Syrop on Penetration Testing
Amsterdam Vol 1 pp 29-34
Duncan MJ Chang CV (1970) Non-linear analysis of stress
and strain in soils Journal Soil Mech Found Div Vol
96 SM5 pp 1629-1651
Durgunoglu HT (1979) Effect of foundation embedment on
stress and deformation distributions Third Int Conf
on Num Meth in Geomechanics Aachen pp 925-928
Farr JS Aurora RP (1981) Behaviour of an instrumented
pier in gravelly sand Proc of a session Drived Piers
and Caissons sponsored by the Geotech Eng Div of the
ASCE Nat Convention St Louis Missouri pp 53-65
Franke E (1981) Point pressure versus length and diameter
of piles X ICSMFE Stockholm Vol 2 pp 717-722
45
Gregersen os Aas G and Dibiagio E (1973) Load tests
on friction piles in loose sand Proc of the Eigth
International Conference on Soil Mech Moscow USSR
Vol 21 pp 109-117
Gwizda1a K (1978) Behaviour of large diameter bored piles
in non-cohesive soil (in Polish) Archiwum Hydrotechniki
Vol XXV No 2 pp 183-217 (English summary)
Huizinga TK (1951) Application of Results of Deep
Penetration Tests to Foundation Piles Building Research
Congress Vol 1 p 173
Janbu N (1963) Soil compressibility as determined by
oedometer and triaxial tests Proc Europ Conf Soil
Mech and Found Eng Vol 1 p 19 Vol 2 (Discussion)
p 17 Wiesbaden
Janbu N (1970) Grunlung i geoteknikk Tapir Forlag NTH
Trondheim
Janbu N Bjerrum L Kjaernsli B (1973) Soil Mechanics
applied to some engineering problems Norw Inst Publ
No 16 Oslo
Japanese Society SMFE (1981) Present state and future trend
of penetration testing in Japan Separate report at
X ICSMFE Stockholm
Kjekstad O Lunne T (1979) Soil parameters used for design
of gravity platforms in the north sea Second Int Conf
on Behaviour of Off-shore structures London Vol 1
pp 175-192
Klosinski B (1977) Bearing capacity of large diameter bored
piles IX ICSMFE Tokyo Vol 1 pp 609-612
Laboratory for soil mechanics Delft (1936) The predetershy
mination of the required and the prediction of the
resistance of piles Proc 1 Int Conf on Soil Mech
and Found Engng Cambridge (Mass) I p 181
46
Matich M and Stermac A (1971) Settlement performance of
the Burlington Bay Skyway Canadian Geotechnical Journal
Val 8 pp 252-271
Mccammon NR and Golder HQ (1970) Some loading tests
on long pipe piles Geotechnique London England
Val 20 pp 171-184
Meigh AC (1971) Some driving and loading tests on piles
in gravel and chalk Proc of the conference on beshy
haviour of piles London England pp 9-16
Mitchell JK Gardner WS (1976) In situ measurement
of volume change characteristics American Society of
Civil Engineers Specialty Conference on In-situ
Measurements of Soil Properties Raleigh 1975 Proc
Val II pp 279-345
Mezenbach E (1961) The determination of the permissible
pointload of piles by means of static penetration tests
Proc 5 Int Conf on Soil Mech and Found Engng
Paris II pp 99-104
Meyerhof CG (1956) Penetration tests and bearing capacity
of cohesionless soils Proc Amer Society of Civ Engng
SM 1 Pap 866 pp 1-19
Meyherhof GG (1 976) Bearing capacity and settlement of
pile foundations Proc Amer Society of Civ Engng
Journal Geotechnical Engineering Division Val 102
No GT3 pp 197-227
Mohan D Jain GS and Kumar V (196 3 ) Load bearing capacity
of piles Geotechn Val XIII pp 76-86
Nixon I (1982) Standard penetration test State of the
art report Proc of the Second Europ Symp on Pen
Test Amsterdam Val 1 pp 3-20
47
Nunes A Vargas M (1953) Computed bearing capacity of
piles in residual soil compared with laboratory and
load tests Proc of the Third International Conference
on Soil Mechanics Zlirich Switzerland Vol 2 pp 75-79
Nordal S Grande L Janbu N (1982) Prediction of offshy
shore pile behaviour The Norwegian Institute of
Technology Trondheim
Ohde J (1939) Zur Theorie der Druckverteilung im Baugrund
Der Bauingenieur Vol 20 No 3334 p 451
Parroth E (1972) Einfache Formel zur Vorausbestimmung der
Tragfahigkeit von Standpfahlen mit Hilfe der Sande
Bautechn 9 pp 312-314
Poulos HG Davis EH (1980) Pile foundation analysis
and design New York - J Wiley and sons
Prodinger W Veder Ch (1981) Bearing capacity of floating
groups of diaphragm walls Proc X ICSMFE Stockholm
Vol 2 pp 809-814
Promboon S Brenner R (1981) Large diameter bored piles
in Bangkok Clay Proc X ICSMFE Stockholm Vol 2 pp
815-818
Reese L (1978) Design and construction of drilled shafts
ASCE JSMFD Vol 104 No OT1 pp 95-116
Rodin s Corbett BO et al (1974) Penetration testing in
United Kingdom state-of-the-art-report Proc Europ
Symp on Penetration Testing 1 Stockholm pp 139-146
Rollberg D (1976) Bestimmung des verhaltens von Pfahlen
aus sandier und rammengebnissen Heft 4 FBG Technische
Hochschule Aachen
Rollberg D (1977) Determination of the bearing capacity
and pile driving resistance of piles using soundings
Publications of the Institute for Found Eng Soil Mech
Rock Mech and Water Ways Construction Aachen Vol 3
48
Schmertmann J (1970) Static cone to compute static
settlement over sand Journal of the Soil Mech and
Found Division ASCE SM3 pp 1011-1043
Schmertmann J Hartman JP Brown PR (1978) Improved
strain influence factor diagrams Journal of the Soil
Mech and Found Division ASCE GT8 pp 1131-1135
Shibata T Hijikuro K and Fominerga M (1973) Settlement
of a blast furnace foundation Proc of the Eighth Int
Conf on Soil Mech Moscow USSR Vol 13 pp 239-242
Spang J (1972) Die Bestimmung der Tragfahigkeit von Grossshy
borhpfahlen (I) Strassen und Tiefbau No 2 pp 339-355
Senneset K (1974) Penetration testing in Norway State-ofshy
the-art-report Proc Europ Symp on Penetration Testing
Stockholm I pp 85-95
Tejchman A Gwizdala K (1979) Analysis of safety factors
of bearing capacity for large diameter piles Proc VII
ECSMFE Brighton Vol 1 pp 293-296
Thorburn s and Mac Vicar R (1971) Pile load tests to
f a ilure in the clyde alluvium Proc of the conference
on behaviour of pile s London England pp 1-7
Trof imenkov JG (1969) Accuracy of determining the bearing
capacity of piles based on results of static penetration
sounding of soils Osnovaniya Fundamenty i Mekhanika
Gruntov 4 (Translation Soil Mechanics and Foundation
Engineering 4 p 248)
Trofimenkov JG (1974) Penetration testing in USSR Stateshy
of-the-art report Proc Europ Symp on Penetration
Testing Stockholm I pp 147-154
Tuoma F and Reese L (1974) Behaviour of bored piles in
sand JSMFD ASCE Vol 100 No GT 7 Proc Paper 10651
July pp 749-761
49
Van der Veen C (1953) The bearing capacity of a pile
Proc 3 Int Conf on Soil Mech and Found Engng
Zlirich II pp 84-90
Van der Veen C and Boersma L (1957) The bearing capacity
of a pile predetermined by a cone penetration test
Proc 4 Int Conf on Soil Mech and Found Engng
London II pp 72-75
Weltrnan AJ Healy PR (1978) Piling in boulder clay
and other glacial tills Construction Industry Research
and Information Association UK-Report PG 5
Withiam J Kulhawy F (1981) Analysis prodecure for
drilled shaft uplift capacity Proc of a session
Drilled piers and caissons ASCE St Louis Missouri
pp 82-97
Woodward R Lundgren R Boitano J (1961) Pile loading
tests in stiff clays Proc of the Fifth International
Conference on Soil Mechanics Paris France Vol 2
pp 177-184
Wright SJ Reese LC (1979) Design of large diameter
bored piles Ground Engineering Vol 12 No 8 pp
17-22
DIN 4014 Cods Teil 2 (1977) Bohrpfahle Grossbohrpfahle
Herstellung Bemessung und zulassige Belastung
Polish Specification (1975) Specification for design and
construction of large diameter bored piles in bridges
Ministry of Transport Warsaw (in Polish)
Polish Specification (1979) Specification for prevision
bearing capacity of the piles on the presiometer test
and static sounding ENERGOPOL Warsaw (In Polish)
Polish Code (1983) Foundations Bearing capacity of piles
and pile foundations
5 1
FIGURES
bull bull
53
Ou
+ sect raquo iir 1
4 + D
h + +Osu
bull + t2 =n- Dp
LDpl r f 1
Opu
Fig 1 1 1 Bearing pi le in the soil
J_
fp
080
070
060
050
0 40
030
020
010
q~ [MPa ]000 -+--~-~-~-~------------------------=-shy
00 20 4fJ 60 80 10 0 120 14fJ 160 180 200
Fig 1 1 2 The point resistance factor fp
(Trofimenkov 1974)
54
ts
160
140
120
100
080
060
040
020
q~5 [ kPa)
0Q0--1------~-~-~-~-~-~ - - ---=- -- shy000 10 20 30 40 50 60 70 80 90 100
Fig 1 1 3 The shaft resistance factor fs middot (TYofimenkov 1974)
f s
200
180
160
140
120
100 2 3 4 5 6 7 8 9
Fig 1 1 4 Shaft friction factor f depenshys
ding of the soil density (Senneset 1974)
55
Q~ [kN]
1500
1000
500
0-r-----------r----~- Q~ [kN] 0 500 1000 1500
Fig 1 1 5 Comparison of the pile resisshytance determined by the results of static sounding and load tests (TYofimenkov 1974)
D f f
0
Fig 1 16 Equivalent cone resisshytance (Bustamante 1982)
56
E u shy0 ~
QI I ltII ltII
~ a C QI
O C
D
w gt
0
Cone res istance Point resistance
80 160 240 320
05
10
15
e d
20
ver y dense Cone resistance 300 kgcm2
Dpcm
a =45 b = 30 C 60 d = 100 e = 150
Fig 1 16a
Cone resistance _ qc
80 160 80 160 qc [ k g cm2 ]p
05
10 10
15 15 e d a
e d20
Dense Medium2 2200 kgcm 100 kgcm
Cone resistance and point resistance of piles versus overburden pressure (Kerisel 1965)
Point resi stance - p(for s=2cm) of the pi le for
15 sett Iement s = 2 cm
10
5
E u
uJ1 o-~----shya er O 804 2500
32 56
I 1
L oose50 -I =25 Very loose L
----~--shy5000 7500 80 98
~-----lmiddotI1--------2 10000 12500 31400 =Flcn)
112 123 200 =Dplcm)
Fig 1 1 6b Point resistance versus cone resistance and pile diameter (Franke 193)
57
1
fp
080 (D Gravel
0 Coarse sand Medium sand 070
reg Fine sond Silty sand
060
050
040
030
020
010
qc [MPa]000-+----r--~-~-~--------r----r----r-~-~-- -shy
oo 20 40 60 80 100 120 140 160 180 200
Fig 1 1 7 Point resistance factor f (proposal) p
58
300
250
200
150
100
qc [MPa I50-+---------------r---r---r---r----r------------- shy
oo 20 40 60 80 100 120 140 160 180 200
Fig 1 1 8 Shaft resistance factor fs (pr oposal)
59
Bustamante (seetab 115 I
l fp
G)
0 Gravel
Coarse sand Medium sand
cl
b)
t-----l
1----1
080 reg Fine sand Silty sand a) D
070 Polish
060 Specification
( 1979) 050
040
030 CD 020 0
reg 010
qc [MPa]0 00 -+-------------------------------------=--shy
oo 20 4o 5o 80 100 120 14o 15o 180 200
Fig 1 19 Point resistance factor f comparisonp
Bustamente ( see tab 116 I 300
a) ~
250 b)~
cl~
200 Polish Specification ( 1979 l
150
100
q [ MPa]504---~--~--~----- ---___
00 20 40 60 80 100 120 140 150 180 200
Fig 1 1 10 Shaft resistance factor fs comparison
60
1 fp
~
080 CD CD Gravel
070 0 reg Coarse sand Medium sand
060 0 Q) Fine sand Silty sand
05
040 Franke (1973)___
030 DIN 4014
020 Part 2 1977
( see tab113 l 0shy
--shy --a - 010 C---0 Piles without enlarged bases
D---0 Piles with enlarged bases qc [MPa ] 000
00 20 4JJ 60 80 90 100 120 140 160 200
Fig 11 11 Point resistance factor f comparison p
fs
DIN 4014 Part 2 1977 ( see tab 114 l
300
~ 5 lt qc lt 10 MPa 50
~ 10 lt qclt 15 MPa
~qcgt15MPa
200
150
CD
100 0 0
qc [ 1Pa] 50-t-----T-~----T-r-~----------------shy
OO 20 40 6JJ 80 100 120 14JJ 160 180 200
Fig 1 1 12 Shaft resistance factor fs comparison
61
Measured p [ MPa]
( s=010 Dp) 10
9
8
7
6
5 0
4 0 61
3
I 2
Calculated qcp [MPa]
0 0 2 3 4 5 6 7 8 9 10
Fig 1 1 13 Comparison of experimental and aomputed values of the pile point resistanae
62
Contact pressure ( MPa ]
2 I 6
50
100
E E 150 Ill
c QI
E Sett lement for QI
calculated qcpai V) 200
Fig 1114 Results from load tests on piles No 1 and 5
Contact pressure [ MPa I 0 2 I 6
01---------------------1
50
E E 100 Ill
Settlement forc QI calculated qcp E ~ ai
I V) 150
Fig 1 1 15 Results from load test on piles No 7 and 5
63
Contact pressure p [ MPa] 0 2 3 4 6
0-t=-----~-~-----
E E
100 1)
c CU E 2 QI V) 150
Fig 1 1 16 Results from load test on piles No 9 10 and 11
Contact pressured p [MPa] 0 1 2 3 4 5
o~~~=------------___-~-shy
50
100
E E
i 150
CU E CU
-a V) 200 2
Fig 1 1 17 Results from load test on piles No 12 and 13
c
-------------- -
64
Contact pressured
0 1 2 3 4 p [ MPo] ~o __L____1_____J_____L___
50
100
150
E
E
IJ) 200
c a
E a
~ 250
Fig 1 1 18 Results f Pom load tests on piles No 2 4 6 and 8
p [MPa]
60
50
tO
30
~
Pile Pile Pile Pile
Pile No18
------+ Pile No17 + ~_ ---0 Pile No 19
bullbull - --bull Pile No 20
- ~middot -shy-shy -(y I Settlement for
20 tO 60
No17 +-middotmiddot- V 70 No 18 bull--- V 9o No19-middot- V 120 No20bull---- V150
qcp 3
80 100 120 140 160 s (mm)
Bose resistance
Fig 1 1 lBa Point Pesistance vePsus settlement (Spang 1972J
65 Cone resistance qc [ MPa]
0 10 20 30
mud
5 ~ lll
0 c 0
c CD
peat
10 sand
Ill N
10=10
D=lOOOmm
1540=40
20__________________
[ml
Fig 1 119 Pile No 1 and results from static cone penetration test
Cone resistance qc [MPa l 0 10 20 30
7N V degW = 0+--------------------i
mud
5
lll
~ C 0
c peat~
10
sand lll N 1D15
15l lD=1500mm
40=60
20l---------=-------__J
[ml
Fig 1 1 20 Pile No 3 and results from static cone penetration test
66 Cone resistance qc [MPa]
10 20 II 3 igt pound ~
mud+peat
fine sand+ silt
50=11
l lo-11oomm
40= 44
10
15l____________c
[ml
Fig 1 1 21 Pile No 5 and results from static cone penetration test
Section Cone resistance Pile
0 0
5 10 15 20 25 30 qc [MPa] -----~-~shy~
Silt
[7r_ ___~ Medium Sand_~-----l
0 ltD
+shy4
0=11
9=
Fine sand + Silt t
30p=
middotmiddotmiddotmiddotmiddotmiddotmiddotmiddot1~11+-----E-----
[ml
Fig 1 1 22 Pile No 6 and results from static cone penetration test
Cone resistance qcmiddot 1MPuJ
0 10 20 30 67 01-+-------l--------------i
mud+ peat
fine sand
l1)
N
40=60
15L_____________
[ml Fig 1 1 23 PiZe No 7 and resuZts from static
cone penetr ation test
Section Cone resistance Pi le
0 5 10 15 20 25 30 qc [MPa 1 --~----Y-~-----~
Silt
Fine sand
Medium Sand Bentonite2----1~i
t 3
4
0
0=15
Fine iii ~~= 5
sand t ltD
6 +
Silt 7
3Dp=
63 g
10
11
12
13+------=~---l
[ml
Fig 1 1 24 PiZe No 8 and resuZts f rom static cone penetration test
68
I =3
Cone resistance qc [MPa]
0 10 20 30
C 0 C Cl
(I)
Said
Peat
Sand
l 0=110
D = 11
4 D = 44
Fig 1 125 Pile No 9 and results form static cone penetration test
69
Cone resistance qc[MPa)
0 10 20 30 I ~ II JE Ill= II=E IS
Fine sand QI
U) I
[- I C 0 + C Peat QI
CD
Fine sand 0
Ci D = 1 1
L l D= 110
4D= 4 4
Fig 1 1 25 Pile No 10 and results f rom static cone penetr ation test
70
Cone resistance 9c[MPa]
0 10 20 30
Sand
C 0 Mud peat
+shyc 5 ltII
co
Sand Op= 11
u 10 D= 110 4Dp=44
Fig 1 1 26 Pile No 11 and results foIm static cone penetration test
71
00 a_ N ~
middotu rr QI 0 u ~ C 0
QI ui C iij 0 QI U - 0
0 EN
d 2
Sll 1lOl
C
u (rr
C 0 u~
0
QI - C middot 0 C
U - O 0 EN
~ 0 2
E
ltD a---==-lr---___--~---6-l_-0_012 ~ Lr- - --1---------J J
S9l ls= apound QI -0 gtcc _gmiddot- 0 1) ui I
Fi g 1 1 2 Piles No 14 and 15 and results f r om stat i c cone penetr ation tests
72
Contact pressure p [ MPa] 2 4 6
01lt---------------~
50
E E
111 100 ~ (qcp=30 MPa for No16
~ iqcp =49 MPa for No14
~ 1so~--~~- _ _ __
I _ _
11 I lf--q = 32 MPa for No15
cp
Fig 1 1 28 Results f r om load tests on piles No 14 15 and 16
73
0300--------------~---~--~--shyE
Driven piles in ~ 0 bull Gravel
amp250 bull Sand L QJ X Silt a 1l o Bored piles in
sand -sect 200 0=-- shyC ~ ~ 10 unless ~~ middot D shown 1
ii O
~ ~ o 3 a 1501-----+-------I- --+---laquo-+-- -+------lt
~ sect 5 - 6 6middot 100t----+----+-----_-1---4--__co_--J~__j
-_
~ 0 t7
C
a 50 2 shyg ~ gt
0 20 30 40 50 60
Standard penetration resistanceN in blows per foot
(N 30
Fig 12 1 Emperical relation between ultimate point resistance of piles and standard penetrashytion test in cohesionless soil (Meyerhof 1976)
14 r-------------------r-------b-----q
References and symbols given in Fig121
121-----+---+----+----+------ll------j
- _sect ~ 10t----+----+-_--1-----+---lt~--~H---- 0 lt-~5- _-)0 I() l- I Q---+-----I[08 ~
H -(l () ltj-~C X bulls pound 061------lt----+-----i~- --+-- shy
- bull
-gt Q1pound--I---L---L---L---L--~ 0 10 20 30 40 50 60
Mean standard penetration resistance N in blows per foot ( N30 l
Fig 122 Empirical relation between ultimate skin friction of piles and standard penetration resistance in cohesionless soil (Meyerhof 1976)
74
a) b)0(1 0lt2
10 10
05 05
1 N30OD-+---------__ OD--t-----r-----r----------------ll--Nbull30~ 10 20 30 10 20 30 40 50
Fig 1 2 3 Reduction coefficient a) for impermeable gravels b) form permeablr gravels (Weltman and Healy 1978)
psf [MPo)
Fig 1 2 4 Relation between ultimate point resistance and SPT in cohesionless soil (Polish specification 1975)
75
30 35 40 45 Loo Med Dense Ver dense
50
40
~ E
l)
g 8 1)
middotu
1 ~
QI- bull Touma ~ bull Koizumi
(183)-depth base middotameter5
20 40 60 00 100 N30
30 35 40 45
OG2(294) bull G1 (183)
300 bull us 59 ( 102) bull 88(180)
bull 075 a GT (467)
150
~ 200-+--------+-- t--- --t-----i 130i 0 094 081
014 _- --- -- shy~ E 066bull bull 063 Note -~ ~m~r~s~ ~ 1001---1-r--t---1point is xh QI Ratio ~ Number in ( ) middotn key is h c Ratio s ~
0 20 40 60 00 100
~ig 1 2 5 Ultimate point and shaft resistance versus N30
(Wr ight and Reese 1979)
-----
76
tu Psa
[kPa] [MPa]
200 tu
------ shy150 Psa
1 1
1100 10 1 1
1 50
0+----------T----~---~-N-3J~shy0 20 40 60 80
Relation between ultimate skin friction and SPT (Decourt 1982)
Fig 1 2 6
Psa
[MPa]
8
0----Meyerhof 1976) 0 7
--- - --~ - copy Polish Specifcoti on 1975)6 ~-
~
reg- middot - Reese (1978) middot 5
f41- -- Decourt (1982) -I bull 4 2
----==---______z__ h25m Dp=12m
3 ---shybull
2 7
--shy ----shy~----shy0-t----i----------r-- ----------------------N3l~shy
0 10 20 30 40 so 60 70
Fig 1 2 7 Relation between ultimate point re~istance of large diameter piles and standard peneshytration test (SPT) in cohesionless soil
------
77
tu [kPa)
200 17 Cast under -J bentonite
~----Meyerhof (1976) ~copy -=middotmiddotmiddotmiddot== middotmiddot150 ~------- Wei tman (1978 ) middot Healy middotmiddot ___ Japanese ) 119810 Society
(0 -middotmiddot- Decourt (1982)middot Wright
100
- -middotmiddot -- 11979]reg Reesemiddot Bored piles
~shy50 1 -- shy
-- shy middotmiddot s-shy - --~ ------reg~~ ---~E_==---- ------- shy
N_ ---shy0-+--C--------------r---- ---------~---~-~shyo 10 20 30 40 50 60 70
Fig 12 8 Relation between ultimate skin friction of piles and standard penetration test (SPT)
78
Pst [MPa]
8
7 ---------ist=7MPa
6
5
4
3
2
I N30o~------------------------------+---------__=-shyo 10 20 30 40 50 60 70
Fig 12 9 Relation between ultimate point resistance of large diamter piles and standard peneshytration test (SPT) in cohesionless soil (proposal)
tu [MPa ]
( excavanted and cast
150 under bentonite ) tu=150 kPa
100 tu=90 kPa
I I
50 I I I I I N30
10 20 30 40 50 60 70
Fig 1 2 10 Relation between ultimate skin friction of large diameter piles and standard penetrashytion test (SPT) in sand (proposal)
79
2 3 4 5 p[MPa] 0 2 3 4 5 p[MPa]0
40 40 Cl
80 c 80
c 120 120
Pile No 1 PileNo216 160
200 2
s s c [mm] (mm]
0 2 3 4 5 p[MPa] 0 2 3 4 5 p [MPa]
40 40
00 80
120 120
16 160 Pile No 3 Pile No 4
200 200
s s [mm] (mm]
0 2 3 4 5 p[MPa] 0 2 3 4 5 p [MAJ]
tgt11 tgt- measured40 40
80 80
120 120
Pile No 5 Pile No 6 160 160
20 200 s s
[mm) [mm)
Fig 1 4 1 Base resistance vs settlement appoximative method piZe No 1- 6
80
0 2 3 6 5 p[MPa) 0 2 3 4 5 p[MPa]
40 40
80 80 6
120 120 6
6160 160
Pi le No 7 Pile No 8 6
200 3J s s
[mm] (mm]
0 2 3 4 5 4 p [ MPo)
6 6 40
6 6
6 80
6 6
6
Pi le No 9 Pile No 10
XJO s s
[mm] [mm]
0 2 3 4 5 p[MPa] 0 2 3 4 5 p [MPa)
6 6
40 40 6 6
6
00 80 6
6
12 1Xl 6
160 Pile No 11 160 Pile No 12
200 200 s s
[mm ] [mm]
Fig 1 4 2 Base resistance vs settlement approximative method pile No - 12
81
0 2 3 4 5 p[MPa] 0 2 3 4 5 p [MPa]
6 6
40 6 40 6
6
80 6 80 6
120 6 120
Pile No 13 Pile No 141fO 160
200 200 s s
[mm] [mm]
0 2 3 4 5 p [MPa) 0 2 3 4 5 p [MPa)
40 40
80 80
120 120
HiO 160
200 200Pile No 15 Pile No 16
s s (mm) [rrrn 1
0 2 3 4 5 p[MPa] 0 2 3 4 5 p[MPa)
40 40 A A A-measured
680 80 t t
120 c 120 c
1fil Pi le No 17 160 Pile No 18
200 200 s s
[mm] [mm]
Fig 1 4 3 Base r esistance vs settlement approximative method pile No 13- 18
82
0 2 3 4 5 p[MPal 0 2 3 4 5 p (MPa]
D D40 40 c c
80 c 80 c
120 120
160 160
Pile No 19 Pile No 20 200 200
~ml (mm]
Fig 1 4 4 Base resistance vs settlement approximative method pile No 19- 20
LlJ QI
0 average lJ = 098 E sd = 029 C
6 SY = 030
4
2
lJ calculated ________________________ _______ measu red
06 08 10 12 14 16
Fig 1 4 5 Calculated pressure divided by the measured pressure at 20 mn settlement for aZZowabZe
q Zoad Pa= ~p approximative method pile
No 1- 20
8 3
Point resistance p [ MPaJ
a)
p(s) = s a +--sshy1 y qcp
1
SQ100p -- --- ---shy
~ s
[mml
I- 01 s rmm]-l p LMPa b)
f~]
c Cll E ~ i s
[mm)
Fig 146 Definition of the point resistance - settlement curve according to the modified hyperbolic method
84
01 ~ 0
20 0 0
0
16 0
medium 0 value a1 = 905-+ 256 Op 0 0
12 (r=039)
0 0
----0 0
8 0
0 0
0 0
4 0
05 06 07 08 09 10 11 12 f3 14 15 16 17 18 19 20 2 1 Op (ml
Fig 1 4 Initial slope of the base resistance curve vs pile diameter
a1 [p] 0
0020
16 assumed a 1= 28 - 4 qcp
12 0
0 Ct) 0 a = 2659 - 369 qcp8 1
0 0 (r = 0188)0
4
2 3 4 5 (MPa]qcp
Fig 1 4 8 Initial slope of the point resistance curve vs ultimate point resistance on the static cone resistance for pile tests No 1 20
85
a [~ 28
24
20
16
12
8
4
0 2 3 4 5 6 Qcp [MPa]
~ Kiosinski (1977) sand and sandy gravel of mediwn density
~ Klosinski (1977) loose sand ID= 0 3 0 4
o US59 ] t HH Touma p and Reese L (1974) fine sand and silty sand OGl (US59 HH BB - very dense Cl - mediwn dense) 1 BB
DIN 4014 Part 2 (1977)
Fig 1 4 9 Initial s lope of the point res istance curve vs ultimate point resis tance
86
assumed [il =30 -10 Op but )1~ 10 )1 [1 I
u 311-10 Op ( r =0 368)4 1 0
3 0 0
02 0
0 0co 0 8 0 0
0
0
05 06 07 08 09 10 11 12 13 14 15 16 17 19 20 21 Dp [ ml
Fig 14 10 Correction factor for hyperbolic base resistance shysettlement relationship
87
a [~] 28
24
20
16
12
8
4
2 3 4 5 qcp [ MPa]
Fig 14 11 Initial slope of the base resistance curve vs ultimate base resistance (proposal)
v [ 1 ]
3
2 -----G- DP J l 1J I Op lm] J
for Dp ~ 2 0 m ~ u = 1 01
0 --------r----r---r----r-----------------r-------------------------r------r-~-~--shy
05 06 07 08 09 10 11 12 13 14 15 16 17 18 19 20 21 Dp[m)
Fig 1 4 12 Correction facto r for hyperbolic base resisshytance - settlement relationship (proposal)
s P ( s)
s +
u qcp
88
a) b)1
bt=o212= 47 MPa a1=1~32 tMWJ s 2 3 4 5 O 1 10 20 30 40 50 60 p [~a]0
0p [ MPa] 40 40
80 80
120 ~
160 b1 = ~ajtg ~= 0 212
~=1132 + 0212middot s
mJ 240 r=0994t t t measured s __ according to Jl s
o o o according to p (bull ll l[mm] [mm]
Pile No 2
slmm) 10 20 30 40 50 60 80 100 125 150 175 2)0 225 Note
p [ MPa] 09 14 17 20 22 24 27 30 32 34 36 38 39
measured
pibull) [ MPa] 074 128 169 202 228 249 282 307 330 347 360 371 380calculated
plbullbull1[MPal 070 125 168 203 233 257 297 327 356 378 396 410 422calculated
1) (bull) ij l099082 091 099 101 104 104 104 102 103 102 100 098 097 sd = 006
ij (HJ1041) (bull10) 078 089 099 102 106 107 110 109 111 111 110 10B 10B sd = 010
plbulll-according to a =1132 [ Jp(s) = s s for pile No21 0 1132 12 39
plbullbulll-according toa =1241 lmiddotGcp=39MPa1 0
~=14 see fig 1411 and fig 14 12 sp(S)=
124+ _ s_ 14middot39
11lbulll11l-J - correlation coefficient calculat~d P5 for
measure p s p(bull) and p(bull) respectively
Fig 1 41 3 Modified hyperboZic point resistance - settZement reZationship for piZe No 2
89
0 2 3 4 5 p(MA1] 0 2 3 4 5 p[MPa)
40 40
80 A 80 A
120 120
160 16 Pile No 1 Pile No 2
20 200 s s
[mm] rnm
0 2 3 4 5 0 2 3 4 5p [MPa] p [MPo]
40 40
80 80
120 1ZJ
lfpound) Pi le No 3 Pile No 4 A
200 A
s s A
[mm) [mm
0 2 3 4 5 p [MPa] 0 2 3 4 5 p [MPa]
40 40 A A A measured ~ calculated
80 80
12
160 160 Pi le No 5 Pile No 6
200 Z)Q
Fig 1 4 14 l3ase resmiddotistance vs settlement pr oposed method pile No 1- 6
90
2 3 4 5 p [MPa] 2 3 4 5 p [ MPa]
40 6
6 40
1 80 80
6
120 120 6
6 160 160
Pile No 7 6
200 200 s
[mm ] s
[mm]
0 2 3 4 5 6 p [MR] 0 2 3 4 5 p [MPa] 0 0
40 40 6
6
80 80
6
120 120
160 160 Pile No9 Pile No 10
200 200
s [mm] [msml I
0 2 3 4 5 6p[MR] 0 2 3 4 5 p [MPa]04--___ ____ ___ ___ ____
0+-=---------------~-~- shy
40 40 c 6 c - measured
0--0-0 shy calculated
80 80
120 120
160 160 Pile No11 Pi le No12
200 200
s [mm]
s [mm]
Fig 1415 Base resistance vs settlement proposed method pile No 7-12
91
0 2 3 4 5 p [MPal 0 2 3 4 5 p [MPa)
40 40
80 80
120
16 Pile No 13 Pile No 14
200 s
tnml [mm]
0 2 3 4 5 p [ MPa] 0 2 3 4 5 p [MPa)
40 40
80 80
120 120
160 1fD
Pi le No 15200 axJ s s
[mm] [mm]
0 2 3 4 5 p[MPa] 0 2 3 4 5 6 plMPa ]
A A A measured40 0---0-0 calculated
80
120 120
160 1ED Pile No 17 Pi le No 18
200 200
s s [mm] [mm]
Fig 1 4 16 Base resistance vs settlement proposed method pile No 13- 18
92
0 2 3 4 5 p [MFb] 0 2 3 4 5 p[MPa]
0 6 o -measured40 40 0 0 o -calculated
80 80
120 120
160 160 Pile No 19 Pile No 20
200 200 s s
[mm] [mnil
Fig 1 4 17 Base resistance vs settlement proposed method pile No 19-20
p(s~Psf
15 20
ean
-C 5 w u L Lower ~ confidence
linea 0
a IJl 10
o---o proposed
method I I I
15
Fig 1 4 17a Design curves for estimating developed base resistance in sand (Wr ight and Reese 1979)
93
n (number)
30
28
26
24
22
20
18
16
14
12
10
8
6
4
2
0 02 04
Fig 1 4 18
I= 126
Between 1] = 0 7 - 1 3--- I= 106 ( 84 frac34)
Average ~ = 098 Standard sd =023 deviation
Standard sv =023 veriation
1] (Coefficient Calculated Measured
06 08 10 12 14 16 18
Calculated pressur e divided by the measured pr essure for all pressure - settlement curves pr oposed method pile No 1- 20
94
a) b) Total load
Total load curve
---- _____-- shy- -- -Base load ~- Base load
-0-0 ~
00 00 J
ldeoli zed shaft load J
Shaft sesistanc1---------- 0=0middot30 a= 0 middot 30
025 Settlement IN 025 Settlement IN
Fig 1 419 Proposed method of synthesizing design loadsettlement curve (a) conservative design prodiction b) design prediction- peak in shaft loadsettlement curve (Burland et al 1966)
Cf
-0 0 0
J
0
~-----~--~-~ amp- 2 3 4 5 6 (cm)
a~middotltii -0 lt) cco2 41 -~ -0 1)
vi ~ llloli=----------- ---c~0 1 2 3 4 5 6 7 ( of diameter)1 1 1 1
05 10 15 20 ( in) for 30 in Pile Movemen~ ( 75cm pile)
Fig 1 4 20 Approximate load settlement curves for 30 in bored piles (AB and C represent failure load at 1 in settlement A B and C represent ultimate failure load) (Touma and Reese 194)
95
Load in MN 0 2 3 4 5
25
50E E C
-C 75
-~ ~
-Z 100 lJ
Shaft resistshy
125 once
15 Fig 1 4 21 Load-settlement relationships for largeshydiameter bored piles in stiff clay (Tomlinson 1977)
SettlementSo
Fig 1 4 22 Diagrams of s1iaft and base resistances versus settleshyment assumed in analysis (Kiosinski 1977)
96
0 0 1 ~ r- 025g ~~ 2
1- -shy3 03Sg 14 5 2
Qls =Qpls+Q5 (sQpls) Qs(s-3E
0
degsis __ -- Qpls) a~ C
4
t Sg l
5 Qu Is)
Q(s)in MN-l T
Ouls Q Is) in MN ---
Fig 1 4 23 Construction of load - settlement curves a) for sand b) for cohesive soil (DIN 4014 Part 2 1977 and Franke 1981)
-
s C 5C
Cl
3 0 00 05 10 15 20 Mean settlement I in)
Fig 1 4 24 Load- settlement curves for test shaft S4 (1 in = 25 4 mm 1 ton= 8 90 kN) (Reese 1978)
97
Relative side resistance
0 05 10 15 20 0E=--t----+---+--~
c QI lt) ~ 2 C
I itaker c
QI amp Cooke3E QI-j
c-en 4
C QI
E us 59o
5 QI gt
SA0 w 0 6
Fig 1425a Relative side resistance for clay vesus relative midlength settlement (Reese 1978)
degs (Osl u l t 0 05 10 15 2 0
Mean
2 Lower ~ C QI u
confidence line
~ 3 a
0
~4 E
()
5
6 __ _ ______ ________ __1
Fig 1 4 25b Design curves for esti mating developed side resistance (~Jy1nht ReertP- 1987 J
98 Load Q
8 - 15 mm
1- 2 of p ile diameter
100-200 10-15 of pile Os Ot diameter Shaft Total
Settlement S Resistshy Resist- Load ance once
Fig 1426 Dependence of total load base resistance and shaft resistance on settlement of lar-ge diameter pile (Tejchman Gwizdala 1979)
6
5 Shaft load
4
3
2
z ~
-0
g Pile EF- 56 J 0
0 0 20 30 Butt settlement (mm)
Fig 1 4 27 Deveiopment of shaft and base resistance with settiement (Promboon Brenner 1981)
99
0 1000 2000 3000 4000 5000 6000 7000 8000 9000 0 r-=-1---J__-----------------------~----_shy
Load [ k N l5
10
20
( I
Skin friction ----1 I I
~ 40 QI E
fQI
50 I
Q) I () ICOntinuos fost deolading
Fig 1428 Load-Settlement-Diagram Testelement III (Diaphragm-Wall 0515 m 244 m deep) Portion of Skin Friction and Base Resistance (Prodinger Veder 1981)
Qs (QJ max
0 05 10
Upper Limit of Data
Farr and Aurora (1981J C
~ 2 - shy -+shy - Mean of Data
I QI
Lower Limit of Data a
0 - 3 E
Vl
4
Smid = Approximate shaft buff movement ignoring the elastic compression of upper halt of the shaft
D = Shaft diameter
Q Mobi Ii zed shaft resistance
Qs1max = Maximum shaft resistance
Fig 1 4 29 Relative shaft resistance vs relative movement (Farr and Aurora 1981)
100 Load Q (s) [ MN]
Su5 s s 20 mm for non- cohesive soil u
s s 10 mm f or cohesive soil u
s s 15 mm for claysand u
Q (s) + Q (s)s p
Qs(s)
-C ltII E s ~- [mm]-ltII IJ)
Fig 1 430 Dependence of total load Q(s) point res i stance Q (s) and shaft resistance Q (s) versus settlement p s
~ 3 Usu Qpu Qu Q(s) [ MN]
Sus= 20
1J
60
80
100
120
degs (s ) 140
5 P=Ol Op
1EO
C -ltII E 180 ~ ] 200
s [mm]
Approximative dependence of total load point resistance and shaft resistance versus settlement fny non-cohesive soil
Fig 1 4 31
101
113 3 ~fic0P Ye hY
1 Ground water
D
I y
yh C
Fig 1 5 1 Determination of 01 and 03 for settlement analysis of lar ge diameter bored piles
102
I
E=Et [MPa]
160 0
140
120 0
100
80
6
40
--- --shy 0
0
8 0
0
0
20
2 3 4
I 0 15
Fig 1 5 2
E = Et [MPa]
120
100
80
60
40
I I 0 35 065 085
0
Et= 17 81 qcp0844
( r = 0 128)
5
100
6 qcplMPo]
Calculated values of Young s modulus for piles No 1shy24 according to equation 1 5 2 and 1 56
0
0 0
E =898qcp127 (r= 0314)
E = 9 middot qcp 13 0
20 shy 0
0 0
0 1 2
loJ
I 0 35
3 I
065
4
I 085
5
100
6 qcp [MPo]
Fig 1 5 3 Calculated valueBof Young s modulus for piles No 1shy24 according to equation 1 5 4 and 1 5 6
I K 10 3
( 1 ] 1832
1400 0
1200 0
0
1000 0
800 0
m=2821 qcp0621
600 0
(r=0057)
400 0 0 0 0 0
200
2 3 4 5 6 qcp (MPa]
I 035
I 065
I 085 100 Io
Fig 15 4 Calculated valuesof the dimensionless compress ion modulus K for piles No 1- 24 according to equation 1 5 2 and 1 56
K ( 1 ]
0
1400
1200 0 0
1000
800
600
0
0 0
0
0 0
0 K= 1422 qcpl05
(r=0181)
0 K= 150 qcp
400 0
3)0 0 0
2 3 4 5 6 qcp(MPa)
I I -J 035 065 085 100 Io
Fig 1 5 5 Calculated values of the dimensionless compression modulus K for pile~ No 1-24 according to equation 1 5 2 and 1 5 6
104
120
100
2 3 4 5
I I I rv 0 15 035 065 085 100 lo
Bergdahl (1982) for shallow foundation
o----o Bozant Masopust (1981) D= 1 0 rn h=10 rn large diameter bored piles in noncohesive so il
0----0 Proposal according to current anal ysis
Klosinski (1977) D=090 to 125 rn large diameter bored piles in sand and sandy grave l
Mitchell Gardner (1976) very dense sand E=(35)q (it depends on sand density and stress history) c
Fig 1 5 6 Composision of Young s moduius
105
TABLES
0 Tab 1 11 Methods for detemination of the bearing capacity of bored piles (Ro llberg 1977)
Cl
Nol -- I Soil Areas of Q) Q) Editor Determination of Coefficients 5 type influenceqP qs p ~ C C 11 12 fP I fs
1 all Lab f Soil Mech (1936) l qp at the elevashy 1 0
2 all Huizinga (1951) ~ t~on of the pile 14 point
3 all Van der Veen (1953) ) 18 1 h+l14 all Van der Veen 1 0 Dpl375 D~ 15-- J qcmiddotdhBoersma (1957)
~ 11 +12 h - 12
5 12 all Menzenbach ( 1961) qc at the elevashy~ tion of pile point
6 18 all Mohan Jain Kuman (1963)1 average of qc over 1 h Q) h ~qcmiddotdhl 10 Dpj 3 75 Dj 15 50_micro
and 1 2C 11
7 I amp all de Beer ( 1964) graphically from 10 Q) qc 0 1 h+l18 u C
sand Soviet norm SNIP II 9ct9cp I4 bull O Dp I10 DP l66-1 083shyu clay B5- 67 Trofimenkov (1969) 2 50 1 251 +l J qc middotdh micro middot h middot-l l 2h-~ _micro
9 _micro u all Paproth (1972) at the elevation 3 5 I shy
) of pile point (Dpgt0 5 m 7 D8DpE
E-lt p 1 h+l1 1 h Dplt 5 m u l+l J qcmiddotdh h f qcmiddotd~ 30 Dpl 50 Dp 2 0 100shy10 sand Norwegian method
0l 2 h-12 200Senneseth (1974)
11 lall Soviet method h+l (20-0lqgl - 101 1 q middotdhTrofimenkov (1974) -- f C UpUsmiddotQct
l1+l2 h - 1212 Qct-Qcp 40 D~ 10 Dp 1 33- 0 67shyUsbullh 4 00 2 50
13 English method 10 DFJ 375Dp 10 I
Rodin Corbett Shershywood Thorburn (1974)
3 7 5 Dcl 8 0 DP 10h+l1 _1_ J qcmiddotdh 1 h
qcmiddotdh 20011 +12 h - 12 hb
1 h qcmiddotdh 150hf
0
Observations
fp I f (qp)fs C
Dp E = 1 cm Qbu = 2 Qpa (approx )
s fs=f (qc)
q=~g Us 0 h
fp=f(q~)
fs=f(qgl
bull fine grained non- cohesive soil loosely packed
bull fine grained non- cohesive soil medium dense comp
fine grained non- cohesive soil
Tab 111 (cont)
h+h bE 14 non-cohe- Meyerhof ( 1956 poundti J N 3o middot dh CtME fN3 o dh 1 0 DP 4 0 DP 10 100 etM= l 2
sive soil 1976) lJ +12 h - li hE o hgp taken into consi der ~ Ul (I)
E-lt
C 0
~E = 1 kgbull 30 cm
(statistical limit depth of the pile) hE - clamping length of
pile micro rrJ l-l micro (I)
15 C (I) p
sand Norwegian method
- irm - - - 10 IT
m = diagram O l-l Senneset (1 974) rrJO C
16 rrJ micro gravel English meth it 3 middot N30 - - - 10 - Jf 3 + diagram U) ~
E-lt p U)
iiouiu Coruett Sherwood Thorshyburn (1974 )
(NJQat the elevashytion of pile point1
0 -i
108
Tab 11 2
Results of calculati o n of p i le point load pile shaft load and total pile load from static con e penetration test (Rol l berg 1977)
~ gt
~ gt Ultima te Ultimate Ult imate
No Method micro micro poi nt skin bearing 080lt17nlt1 50 Q) -l
-l middot-i resistanceuro resistance r esistancE
middot-i p 0
(J n1 n n2 n n3 n n1 n2 n3
1
2
Lab fSoil Mech
Hu izinga (1951)
(1936 ) 430
307 i 3 Van der Veen (1953) 239
49
4
5
Van der VeenBoersma
Menzenbach (1961)
(1957) -l middot-i 0
2 4 7
1 57 1-CJ)
6
7
8
Mohan Jain Kumen
de Beer (1964)
Sovi et Norm (1969)
(1963) CJ) Q)
-l middot-i 0
lJ Q)
Q)
gt- CJ) Q)
c 0
2 44
1 37
183
47
t I
49
487
0 18
47
16
3 02
0 85 1
47
16
137
08
9
10
Paproth ( 1972)
Norw Method (1974)
~ 0
0
u I
C 0 C
1 8 1
180 l 46
1- - -_L~ 46 167 46 1 19
1 1 Soviet Method ( 1974) [1 1 41 46 1 62 13 083 13 1 14 0 8
12 Engl Method (1974) 2 66 35 128 35 2 30 35 1 28
Note
cal Q a) n = --- mean value of the rat i o between calculat ed pile loads and those n Q determined f r om loading test
b) n = number of piles
109
Tab 113
Point resistance of large diameter piles (DIN 4014 Part 2 1977)
Settlement Point pressure 1 Factor -fshy
(cm) (MPa) cf=lOMPa I i=15 MPa C C
Piles without enlarged base
1 05 005 003 2 08 008 005 3 11 0 11 007
15 34 034 023
Piles with enlarged base
1 035 0 04 002 2 065 0 07 004 3 0 90 009 006
15 2 40 0 24 0 16
Note 10 lt qp lt 15 (MPa)C
Tab 114
Skin friction resistance of large diameter piles (DIN 4014 1977)
Strength Static cone pen- Depth below Skin frict ion Factor of sand etration resist surface
(MPa) (m) (MPa) fs
Very small lt 5 - 0
Small 5 to 10 0 to 2 0 2 to 5 003 ln6 to 333
gt 5 005 100 to 200
Medium I I 10 to 15 0 to 2 0 I
I 2 to 7 5
gt 75 I 0045 0075
222 to 133 to
333 200
High I I
i
l
gt 15 0 2
to 2 to 10 gt 10
I I I
I
i
0 006 0 10
gt gt
250 150
Note Skin friction is assumpted as linear until s =2 cm and constant for s gt 2 cm
11 0
Tab 115
Values of the inverse of the point resistance factor (Bustamante 1982) fp
Soil type qPC I 1
Factor - shyfp(MPa)
for piles group
a) Silt and loose sand lt 5 0 40 -b) Moderately compact
5 - 12 040sand and gravel
c) Compact to very gt 12 i 030compact sand and gravel I
Tab 116
Values of the shaft resistance factor fs (Bustamante 1982)
Factor fs
Soil type qs
C Category I(MPa) I A I B I II A III BI
I a) Silt and loose lt 5 60
i 150 I 60 I 120-
sand
b) Moderately corn- I pact sand and 5 - 12 100 200 100 200 gravel i
Icl Compact to very
compact sand gt 12 150 i I 300 150 I 200I
I I and gravel i
I
111
Tab 117
Point resistance factor (proposal)
-
1-fp
qc (MPa)
Gravel
Coarse sand Medium sand
Fine sand Silty sand
25
080
0 70
060
5 0
0 65
055
047
75
054
045
039
10 0
045
036
031
150
035
027
022
200
030
0 23
018
Tab 118
Shaf t r e sistance factor (proposal)
fs
qc (MPa)
Gravel
Coarse sand Medium sand
Fine sand Silty sand
25
80
100
130
10 0
120
150
190
I 200
180
230
300
11 2
Tab 119
Calculated values qcp
for large diameter piles
Pile Literature Length Diameter (m) Measured p Cr1 lcul Settlement Note Authcr(year) No (ml D Dp (MPa)
(s=0 10Dp) (MPa)p ~~JL__
s s ()(mm) Dp
1 Franke (1977) 1 13 11 36 38 117 106 Garbrecht
2
3
2
3
13
14
11
15
1 58 36
37
38
40
215
185
136
123
) qg accord to Franke
4 4 13 15 204 3 2 33 220 108 and Garshy
5 5 6 11 33 35 127 11 5 brecht (1977)
6 6 6 11 153 36 35 146 9 5
7 7 6 1 5 34 35 158 105
8 -shy 8 6 15 2 1 41 3 0 109 52
9 10 9 11 39 52 47
10 11 95 11 43 35 77 70
11 12 9 11 49 66 60
12 13 10 11 15 5 1 4 0 77 5 1
13 14 9 11 1 5 4 8 46 115 77--shy14 Pranke ( 1973) 15 115 18 4 9
) ) average 88
15 13$ 13 5 1 3 19 -2 5 3 2 sd=3 0
16 - - 165 16 5 13 19 30 sv=0 34
17
18
Spang (1972)
llXJ
V90
6 6
6 75
0 7
09
3 2
4 2
32X
42X
x) s =0 10 D p
19 VlaJ 720 1 2 39 3 9X
20 - - VlsJ 6 5 1 5 3 0 3 ox
21 Touma and US59 9 9 o 76 8 0 Reese ( 1977)
22 HH 75 0 61 8 0
23 Gl 180 091 - 2 5
24 BB 137 o 76
sd = standard deviation
sv = standard variation
Tab 1 2 1
Ultimate point resistance coarse and medium sand psf (MPal (Pol ish Specification 1975)
Depth h
Medium sand r = 0 40 N = 200 30 Base diam (Op) and depthbase diam (hDp)
Dense sand r 0 Base diam (Op)
= 0 80 = 50N30 and dpethbase diam (hDp)
(ml Dp = 0 6 m Dp = 1 0 m Dp =12 m Dp = 1 5 m Dp = 0 6 m DP = 10 m DP = 12 m DP = 15 m
Psf hDp Psf hDp Psf hDp Psf hDp Psf hDp Psf hDp Psf hDp Psf hDp
5 10 83 0 85 5 0 075 42 07 33 20 8 3 16 50 14 42 13 3 3
7 14 11 7 1 2 70 11 5 8 10 4 7 2 8 11 7 22 70 2 0 5 8 1 8 47
10 18 16 7 15 10 0 14 8 3 1 3 67 35 167 28 100 2 5 83 2 2 67
15 18 250 18 15 0 16 12 5 15 100 4 2 25 0 3 4 15 0 30 125 27 100
20 2 4 333 2 0 200 185 167 1 7 133 4 7 333 3 8 200 33 167 30 13 3
25 26 41 7 2 2 25 0 20 208 19 167 5 0 41 7 4 0 250 3 5 20 8 3 2 167
w
11 4
Tab 131
Partial safety factors for resistance to axial load for bored piles (Wright Reese 1979)
Partial safety Normal Poor factor for control control
Unit skin resistance 1 70 185
(no load test)
Unit skin resistance 160 1 70
(from load test)
End bearing 165 180
Tab 1 3 2
Probability of failure of bored piles under normal design conditions (Wright Reese 1979)
Probability of Factor of Structure failure safety classification
5 10-3 25 monumental
210shy 22 permanent- 2
5 middot 10 2 0 110shy 1 85
temporary 5 bull 10-l 165
11 5
Tab 133 Results of field tests (Tejchman Gwizdara 1979)
L
II C C C 0 0 0
micro micro
micro micro micro For universal safe~y F2u u CUNo micro C C ~ ~g~ middot- C
~ Permisible micro micro i ~c -i micro
cmiddot-~ micro~ L
micro oo ~ load ~t~ ~~ omicro micro ~ ~ 3Z~ ~ ~ micro
-~~
~ e ~ --middot--
middot- ~ obull 0
~ g ~~ ~~ ~
~ L
o Jl i5 sect~ =gt L Q~ = yen t p Qp Qp
D h Q~ Srrx s tm p s E~ iQ~lQ~cm ~~ KN X ll1l kPa kPa kN kN kN Jl ~e ~ 1 2 3 4 5 6 7 8 9 10 11 12 13 14 15 16 17
1 70 6 60 4081 1550 2531 38 0 1182 10 4040 175 2041 245 1796 632 141 120
2 90 6 75 5082 3041 2041 598 1785 10 4782 107 2541 1079 1462 282 140 42 5
3 120 720 7259 4041 3218 557 1035 10 3576 119 3630 2158 1472 187 2 19 594
4 150 650 8643 4454 4189 51 5 928 20 2521 136 4326 2158 2168 3 10 166 253
5 130190 195 7750 3011 4709 392 805 10 1075 - 3875 981 2894 3 10 166 253
6 130190 165 9516 5101 4415 536 522 20 1800 - 4758 1962 2796 260 158 412
7 130190 135 8044 5199 2845 646 114 4 15 1834 - 4022 2109 1913 2 47 149 524
8 180 115 11380 4415 6965 388 792 15 1735 - 5690 2747 2943 161 2 37 483
9 76 980 6867 4316 2551 628 110 13 9529 109 3534 1128 2306 383 111 32 8
10 61 7 60 7161 2747 44 14 383 67 15 9404 303 3581 392 3188 700 169 109
11 92 180 4807 883 3924 184 20 8 1329 76 2404 196 2207 450 178 82
12 76 24 5 6769 736 6033 109 20 8 1623 103 3385 147 3238 500 186 43
13 76 137 5396 2060 3336 38 2 63 8 4535 102 2698 589 1109 350 t 58 218
14 120 23 5297 1854 3443 35 0 960 10 1640 39 2649 196 2453 945 130 7 4
15 135 16 7 13489 7554 5935 560 181 10 5260 83 6749 2060 4689 367 127 305
16 170 46 0 8829 2943 5886 333 17 10 3466 39 4415 1373 3042 2 14 1 94 31 1
Average Fi 387 166 Standard deviation Sd 2 1 5 034 Standard variation sv= 0 56 0 20
1234 Spang1972 567 8 Franke 1976 9 10 111 2 1 3 Touma Reese 1974
14 Colombo 1971 15 Kerisel Simons 1962 16 Appendino 1973
11 6
Tab 134
Results of model
SafetyScheme factor
medium F ssand
F p
loose F s
samd Fp
F 3 55 sd _P F 1 32 sd
s
tests (Tejchman Gwizdara 1979)
Diameter D (mm)
30 60 90 133
145 129 108 112
280 3 08 307 294
140 154 153 112
594 3 04 324 426
107 sv 030
0 19 sv 0 14
117
Tab 135
Individual safety factors according to literature
Literature proposal ofLiterature individual safety factor
Fs Fb
Polish Specification (1974) 100 250
Tejchman Gwizdala (1979) 150 400
Bustamante Gianeselli 200 300 (1982)
Decourt ( 1982) 130 400
average 145 3 38
TAB 141 0)
Load settlement curves - measured
Pile No
Settlement 1 c 3 4 5 6 7 8 9 10 11 12
s p s p p s
p p s P
p s P
p s p p s
P p s
P p s
p p s p p S
p I i p s
p p s p
mm MPa rrrn lifl5a MPa mm
lifl5a MPa
mm lifl5a MPa mm
RPa mmMPa nwa MPa mm
RPa MPa mm RPa MPa mm
RPa MPa mm RPa MPa mm
RPa MPa mm RPa MPa mm
RPa 10 045 222 09 1 1 05 20 07 143 06 167 08 125 0 5 20 08 125 10 100 08 12 5 15 67 16 63 20 092 21 7 14 43 08 25 10 20 0 1 1 182 12 167 0 9 22 2 12 167 18 111 14 143 24 83 22 9 1 30 125 240 1 7 I 7 6 1 1 273 1 2 250 14 214 15 200 1 2 250 15 200 25 12 0 19 15 8 30 100 26 11 5 40 1ti 250 20 10 0 14 28 6 14 286 1 7 235 18 222 1 4 286 18 22 2 3 2 12 5 23 174 36 111 3 0 133 50 20 250 22 ~27 1 7 294 1 5 333 20 250 2 1 ~38 1 7 294 1 9 263 37 135 27 18 5 4 2 11 9 33 152 60 2 2 273 24 ~5o 20 300 1 7 353 23 61 22 ~73 18 333 21 286 43 140 30 20 0 46 13 0 36 16 7 80 271 295 27 796 24 333 20 400 27 ~96 25 1320 22 364 25 32 0 53 15 1 36 222 41 195
100 322 31 1 30 333 28 357 22 454 31 1323 29 345 26 385 28 357 60 16 7 40 25 0 45 22 2 125 38 329 32 391 32 391 25 500 32 139 1 30 41 7 32 39 1 4 6 272 48 ~6 0 150 14 2 357 34 1441 36 41 7 27 555 36 ~1 7 34 44 1 36 41 7 175 36 486 39 449 30 583 38 ~61 38 461 200 38 526 42 476 32 625 225 39 577 33 682
(mmMPa) ( 1 MPa)
1
1=2074
t 1=O ~01 =0 98S
a1=1132
b1 =0 212 V =0994
a1=2217
b1=O 131
V =Q 978
a1=1860 b1=0233
V =Q966
a1=1562
b1=0174 V =Q983
a1=1382
b1=O195
V =0975
a1 =20 37
b1 =C 174
V =0957
a1=1443
b1=(l 193 v =O 961
a1=965
b1= 0071 V =0 990
a1=1 91
b1 =o 128
V =0 993
a1=5 83
b1=C124
v =O 981
a1=6 1 4
b1=01 64 v =U 985
li(MPa) ~9 4 7 76 43 57 middot5 1 57 5 2 141 78 81 61 cp (MPa) B8 39 40 33 35 35 35 3 0 39 3 5 49 40 __Ef ~-6 1 2 1 9 1 3 16 15 16 1 7 36 22 16 15 qcp
TAB 141 (continue) Load settlement curves - measured
Pi le No 3ettlement 13 14 15 1 17 18 19 20 21 22 23 24
s p s T5
p s T5
p s T5
p s P
p s P
p s P
p s P
p s P
p s T5
p s T5
p s p p s
p mm MPa lll1l
HPa MPa mm HPa MPa mm
fWa MPa mm fWa MPa lll1l
HPa MPa mm HPa MPa mm
MPa MPa lll1l NT5a MPa HPa MPa 111111
HPa MPa 111111
HPa MPa 1)1111
mra 10 1 7 59 075 133 06 167 075 133 ~95 105 09 11 1 07 143 3 76 1 7 59 08 133 10 100 20 2 4 83 130 154 095 21 1 1 15 17 4 1 75 114 16 125 12 167 ~7 74 33 6 2 1 3 15 3 1 9 103 30 29 103 1 7 176 1 2 250 15 200 r55 118 22 136 16 18 8 38 79 46 66 1 7 182 27 110 40 33 12 1 20 200 1 35 29 6 1 75 229 ~O 133 26 154 175 229 49 82 58 6 9 1 9 21 1 35 115 50 36 139 235 21 3 145 34 5 1 95 256 24 208 ~-4 147 28 17 9 20 250 gt8 86 6 9 72 2 2 233 4 2 11 8 60 39 154 265 22 6 1 55 387 2 15 279 28 214 ~6 16 7 30 120 0 2 2 27 3 o 8 89 80 7 5 2 3 262 80 43 186 31 258 1 7 47 1 36 222 14 05 198 33 124 2 25 320 B 1 98 25 327
100 45 222 18 556 39~ 253 ~-5 222 36 1278 27 370 ~8 113 125 47 26 6 20 625 42 29 8 149 255 28 1446 t50 22 682 3 0 500 175 200 225
(mmMPa) a1=479 a1=1206 a1=14 51 a1=1113 a1=1406 ~=836 a1=843 a1=1176 ~=64 a =561 a1=10 0 a1=9 5 (1MPa) b1=0175 b1=0 178 b1=0 382 b=0287 b1=O 119 p 1=0 137 h1 =o 193 b=0258 p1=0 049 b1=0032 b1=0 276 b1 =0 048
hf (MPa)
v =0998 57
v =0-987 5 6
v =0989 26
v =0992 35
v =0933 Iv =0991 84 73
v =0993 5 2
v =0998 tJ
3 9 =0944 v =0998 v =0996 v =0981
qcp (MPa) 46 39 32 30 32 14 2 39 30
lL 12 1 1 08 12 26 1 7 1 3 13 qcp
lD
N 0
TAB 142
Calculated point resistance curves
Setlement (mm) p(s)
1
n p(s)
Calculated value of the p(s) for pile No
2 3 4 5
n p(s) n p(s) n p(s) n p(s) 6
(MPa)
n p(s)
7
n p(s) 8
n p(s) 9
n p(s)
10 20 30 50 80
100
150 200 225
070 128 177 253 335
375 446 493
157 140 141
127
123
1 16 106
070 1 25 168 232
297
327 378 410
422
078 089 099 1 06
1 10
109 1 11 108
108
073 1 30 176 246
315 349
405 441
146 163
160 145
1 32 125
113 105
056 096
1 26
167 205 222
249 265
271
0 80 096
105
1 11 100 101
092 0 83
082
065
118 162 233
308 345
412 456
108 108
1 16 116 114 111
064
1 12 151 2 10 2 69
298
346 3 76
078 P63 093 tt 13 101 tt 53 100 I 13
108 ~75
103 ~04 096 ~ 55
~ 87
1 26 125 127 126
125
1 17 1 04
052 088
1 15 153
188 2 03 227 242
065 0 74
o 77 0 81 0 75
0 73
063
072 122
1 83 262 347 388
463 5 11
073
0 74
073 0 71 0 65 065
064 1 18
162 233 309
3 46
41 3 4 57
Dp (m) 1 1 Qcp (MPa) 38 (mmMPa) h2 8 1 1 9 Qcpbullv1(MPa) 72
158
39
124 14 55
15
40
n20 15 60
204
33 148 10 33
1 1
35
tt 4o 1 9 67
1 53 3 5
tt 4 0 1 5 51
15
13 5
114 0 15 i-gt 3
2 1
30
tt 6 0 10 3 0
1 1
3 9
12 4 1 9 74
1 1
3 5 h40
1 9 67
Note n = condition coefficient calculated p(s) measured p(s)
10
n
081
084 0 85 0 86 0 85
087
TAB 142 (continue)
Calculated point resistance curves
Calculated value of the p(s) for pile No (MPa) Setlement 11 12 13 14 15 16 17 18 19 20
(mm) p(s) ll p(s) n p(s) ll p(s) n p(s) n p(s) n p(s) n p(s) n p(s n p(s) n
10 106 070 0 71 045 091 054 099 1 32 055 092 053 070 060 081 085 0 72 080 055 078
20 1 90 079 130 059 160 067 1 70 1 30 096 101 091 079 1 12 148 085 1 31 082 098 082
30 258 086 1 76 068 2 15 074 222 1 31 1 26 105 120 080 156 205 081 180 082 132 083
50 363 086 246 075 297 082 296 1 26 1 70 117 161 082 228 095 295 087 256 0 91 184 092
80 471 316 o 77 3 77 088 364 1 18 2 1 o 1 24 199 308 085 393 097 336 1 02 237 095
100 522 349 078 415 092 394 228 1 27 2 16 348 088 442 098 375 104 262 097
150 611 405 479 443 258 117 244 423 529 443 304 101
200 669 441 518 473 276 261 474 587 488 331
Dp (MPa) 1 1 1 5 1 5 18 1 9 19 070 090 12 15
qcp (MPa) 49 4 0 46 49 32 30 32 42 39 30 12 a1 mmMPa) 84 h20 96 84 152 160 152 124 160
IV1 1 9 1 5 15 12 11 1 1 23 21 18 15
qcpmiddotv1 (MPa) 93 60 69 59 35 33 74 88 70 45
- 12287 average = ~ = 098
standard deviation sd = 023 standard variation sv = 023
N
122
TAB 143 Ultimate settlement for shaft resistance - summing up
Ultimate settlements (mm)Literature sand cohesive claysand
soil
Burland Butler Dunican (1966) 7
Touma Reese (1974) 10 Tomlinson (1977) 10 Klosinski (1977) 8
Francke Gerbrecht (1977) 20-30 DIN 4014 part 2 (1977) 20 10 Francke (1981) Reese (1978) (1979) 05-2 of 05-2 of Farr Aurora (1981) shaft dia~ shaft diam
5-20 mm 5-20 mm Tejchman Gwizdala (1979) - Spang (1972) 10
10 10 20
- Francke (1976) 10 20 15 15
- Touma Reese (1974) 13 8 15 8
8 - Colombo (1971) 10
- Kerisel Simons (1962) 20 - Appendino (1973) 10 Promboon Brenner (1981) 10 Prodinger Veder (1981) 12 Decourt (1982) 10-15 10-15
-average s = 14 1 10 126
standard deviation sd = 53 2 1 47
standard variation sv = 038 021 037
123
TABLE 14 4 Al l owab l e base resistance versus sett lement
Pile Li terature ength Diameter (m) Calculated qcp=qcp Settl ement Fp-3- sa (mm)No Aut hor No (m) D DP qcp (MPa) for qcp3(MPa)
1 Francke ( 1977) 1 13 11 38 127 25 Garbrecht
II2 2 13 11 158 39 130 19
II3 3 14 15 40 133 33
II4 4 13 15 204 33 110 23
II5 5 6 11 35 117 22
II6 6 6 11 153 35 117 19
II
8
7 7 6 15 35 1 17 25
II 8 6 15 21 30 100 21
II9 10 9 11 39 130 13
II10 11 95 11 35 117 15
II11 12 9 11 39 163 11
II12 13 10 11 15 40 133 7
II13 14 9 11 15 46 153 9
14 Francke ( 1973) 115 11 5 18 30 100 15
II15 135 135 13 19 32 107 29
II16 165 165 13 19 49 163 35
17 Spang (1972) V70 660 070 32 107 28
18 II V90 675 0 90 42 140 16
II19 V120 720 1 20 3 9 130 16
II20 V15C 650 150 30 100 16 average for pi les 198
standard dev sd = 78
standard var sv = 039
)assumed qc = p for s = 010 Op sonding meRsurement were not availab le
IV
TA~LE 15 1
Comparison of the initial sl ope of the pile point resistance - settlement curve
Accardi ng to 1 2 3 4
In i t i ~l 5
slope a1 for the pile No
6 7 8 9
(mmMPa)
10 11 12 13 14 15 Note
a 1 for s=10 mm 222 11 1 a1 for s=20 mm 21 7 14 3 calculated 207 113see Tab 14 1 Bo Berggren (198 )230s=20 mm
Schmertmann s method (see 202B Berggren 1981)s=20 mm
No 1 _ llNo - 6 1 97 098
202 250
22 2
400
30 8
090
14 3
200
186
076
167
182 156
286
18 2
107
125
167 138
091
20 0
222
204
426
263
098
125
167
144
087
100
11 1 9 7
182
23 5
1 03
12 5
14 3
11 9
174
164
105
67 83
58
14 6
125
1 16
63
9 1
61
103
59
8 3 48
123
13 3
15 4 12 1
1 10
167 21 1
aceto hypershy14 5 bola type curve
1 15
No 2 NQj = n1
No 4Noz ~ na No 5Naz= T]g
105 1 27
106
093
1 13
160
1 23
108 1 17
157
100
121 109
1 92
118
1 16 1 14
164
2 12
120
122
1 15
143
1 76
151
149 1 73 1 27 146
TAllLE 151 (continue)
Compa ri son of the initial slope of the pile point resistance - settl ement curve
Initial slope a1 for the pile No (mmMPa)According Note to 16 17 18 19 20 21 22 23 24 -a1 for s=10 mm 133 - 105 11 1 143 76 59 133 100 a1 for s=20 mm 174 - 114 125 167 74 62 153 10 3 calculated see 11 1 146 84 84 118 64 56 100 95Tab 141
Bo Berggren 198 67 78 25 0 114s=20 mm Schmertmann s method (see B 136 67 250 146 Berggren 1981) s = 20 mm
nG = 108 No 1NoJ = n 1 20 125 1 32 121 1 19 105 1 33 105 sd = 0 14
SY= 013 No 2 i) = 1 29ro1 = n1 157 136 149 142 1 16 1 11 1 53 108 sd = 019
SY= 015 No 4 iis = 143 INo2 = ns 091 126 1 63 111 sd = 033
SY= 0 23 No 5 ii9 = 1 37183 108 163 142INoz = n9 sd = 0 37
SY = 027
N Vl
126
TABLE 152
Measured and calculated pile point resistance
Pile Calculated Measured Measured No qcp P for
s=10 mm P for s=20 mm
~ 10 mm ~ 20 mm
- (MPa) (MPa) (MPa) - -
1 38 045 092 84 41 2 39 09 14 43 28
3 40 05 08 80 50 4 33 07 10 47 33 5 35 06 11 58 30 6 35 08 12 44 29 7 35 05 09 70 39 8 30 08 12 38 25 9 39 10 18 39 22
10 35 08 14 44 25 11 49 15 24 33 20 12 40 16 22 25 18 13 46 1 7 2 4 27 19 14 30 075 13 40 23 15 32 06 095 53 34 16 49 075 115 65 43 17 32 - - - -18 42 095 1 75 44 24 19 39 09 160 4 3 23 20 3 0 07 12 43 25
average= 484 291
sd 163 088 sv 034 030
Tab 153 Results of calculation for piles No 1-24
Pile No
Length (m)
Overburden pressure 0 vs
0hs (kPa)
0ve (kPa)
0 nc (kPa)
- -ov=o1 (kPa)
- -OV=03 ( kPa)
00 (kPa)
p(a il ( kPa)
s (a 1) (mm)
A2 ( 1 )
E t
(kPa)
Md ( 1 )
K (1)
E I
t (kPa)
( kPa) 1 2 3 4 5 6 7 8 9 10 11 12 13 14 15 16
l 2 3 4 5 6 7 8 9
10 11 12 13 14 15 16 17 18 19 20 21 22 23 24
13 12 14 13 6 6 6 6 9 95 9
10 95
11 5 135 165 66 675 72 65 99 75
180 137
l 33 133 123 116
70 70 70 70
104 102 95
102 95 94
106 139 95
101 106 97
180 137 221 215
53 53 49 46 28 28 28 28 42 41 38 41 38 38 42 56 38 40 42 39 72 55 88 86
202 202 216 202 1114 104 104 104 146 153 146 160 153 181 209 251 120 128 134 123 238 180 305 277
202 202 216 202 104 104 104 104 146 153 146 160 153 181 209 251 120 128 134 123 238 180 305 277
168 Hi8 170 159 87 87 87 87
125 128 121 131 124 138 158 195 108 115 120 110 209 159 263 246
128 128 133 124 66 66 66 66 94 97 92
101 96
110 126 154 79 84 88 81
155 118 197 182
141 141 145 136
73 73 73 73
104 107 104 111 105 119 137 117 89 94 99 91
173 132 219 203
950 975
1000 825 875 875 875 750 975 875
1225 1000 1150 750 800
1225 800
1050 975 750
2000 2000 625
1500
218 139 255 190 16 1 146 210 12 7 10 1 11 7 84 73 69
104 167 210 124 103 10 1 109 142 120 76
153
0802 0802 0822 0820 0798 0798 0798 0798 0791 0798 0800 0811 0814 0837 0837 0830 0769 0 768 0771 0 775 0 780 0 781 0 788 o 779
35296 81603 43312 65222 44019 67515 4609 91313 78186 60572
118115 15129 5 184075 95577 67017 81607 33252 67554 85294 75994 78816 74857 55101 54862
075 075 0 77 075 084 084 084 081 079 078 084 080 083 076 076 078 0 77 081 079 076 082 087 064 0 74
278 643 337 512 542 832 567
1085 766 572
1216 1417 1832
796 520 709 353 735 878 781 630 726 302 366
26472 61202 33350 48917 36976 56713 38656 73964 61767 47246 99217
121036 152782
72639 51932 63653 25604 54719 67382 57755 64629 65126 35265 40598
a=282l a =l781 y=axs S=0621 B=0 844
V=0 057 V=0 128 _ Iv -J
~
N co
Tab l53 Results of calculation for piles No 7-24
Pile No
17
1 2 3 4 5 6 7 8 9
70 11 72 13 74 75 16 17 78 79 20 27 22 23 24
Ground water
18
-20 m b s
-28 m -335 m -330 m -3 15 m dry dry -53 m -85 m
E t (kPa)
19
33653 64979 35364 45664 47969 54583 37574 63072 74548 57753
71 2618 123531 150297
71239 48619 59204 39744 77208 77863 62049 90407 95844 57762 62937
vxEt=E Md (kPa)
20
25240 48689 27230 34248 35254 45849 31562 51040 58893 45047 94599 98825
724747 54142 36950 46179 30603 57678 61572 47157 47734 83384 36968 46569
a=898 S=l 27 =0314
K (l )
21
265 511 275 358 517 672 463 749 730 546
1160 1157 7496
593 377 514 422 775 802 638 723 929 377 420
a=l422 S=l 05 =0187
E=E = t1 3
g-gcp (kPa)
22
51046 52799 54566 42492 45870 45870 45870 37547 52799 45870 77039 54566 65438 52799 40826 71039 40926 58739 52799 37541 82549 82549 40826 59945
Calculated s
(mm)
23
708 128 72 7 15 3 724 146 144 17 3 71 3 11 5 11 2 732 13 2 707 1 5 1 13 7 93
102 118 137 728 12 l 69
11 9
s__caL n=smeos
() 24
050 092 050 087 0 77 7 00 069 l36 l 12 098 133 l81 l97 103 090 065 0 75 099 117 126 090 101 097 078
ri=l00 sd=035 sv=035
K = l50gcp
25
570 585 600 495 525 525 525 450 585 525 735 600 690 450 480 735 480 630 585 450 825 825 1180 645
E l
(kPa)
26
67684 69465 72250 57726 44856 44856 44856 38448 59659 54306 74956 63214 70704 49089 56783 79502 45283 61081 58207 42927
708572 94785 71033 91898
E = t E middotA2
l
(kPa)
27
54283 5571 l 59389 47336 35795 35795 35795 30682 47790 43336 59964 51266 57553 47088 47024 65987 34823 46970 44877 33269 84639 74027 55974 71589
Calculated s
(mm)
28
l O l 12 l 11 7 737 15 9 18 7 185 21 1 12 6 12 2 133 14 l 150 13 7 13 l 14 7 709 12 7 738 755 12 4 735 50
100
- -
Tab l53 Results of calculation for piles No l-24
Pile
29
l 2 3 4 5 6 7 8 9
10 ll 12 13 14 15 76 17 78 19 20 21 22 23 24
sea l n= middotshy
smeas
28 TT
30
0 46 087 046 0 72 099 l 28 088 l 66 l 25 l 04 l 58 l 93 2 17 l 32 078 0 70 088 l 23 l 37 l42 087 l l 3 066 065
n=l 10 sd=0 44 sv=040
s seal for p n=s=lOrnn ac cording to s = 70mm
(mm)
37 32
5 l 0 51 ll 8 l18 64 064
13 0 l30 85 0 85
13 3 l 33 83 0 83
184 l84 ll6 l l 6 105 l05 137 l 37 21 3 2 12 19 4 l94 107 l06 l l 3 l l 3 84 084
92 092 l 0 9 l09 128 l28 83 083
l 0 3 l03 88 088 79 0 79
n=1 73 sd=025 sv=027
s for p according to s = 20mm
(mm)
33
10 4 184 102 18 6 15 6 200 14 9 276 209 18 4 219 292 274 185 17 9 12 9 -
169 194 219 172 200 143 15 0
seal n=s=20rnn
34
052 092 051 093 078 l00 075 l 38 l 05 092 l l 0 l46 l 37 093 090 065
-085 097 l1 0 086 l00 072 075
n=093 sd=025 sv=0 27
s for p according to s = 30rnn
(mm)
35
142 223 14 l 22 3 198 249 142 34 5 290 249 274 345 33 l 243 22 6 168 -
24 7 26 6 293 24 3 279 187 213
seal n=s=30rnn
36
047 0 74 047 0 74 066 083 047 l 15 0 97 083 091 l 15 l10 0 81 075 056 -
082 089 098 081 093 062 0 71
n=o80 sd=020 _ sv=0 25 N
IO
APPENDIXES
APPENDIX 1 1 1
Pi le No 1 Length 13 m D 10 m
Areas of influence
-
qe
(MPa)
1 fp
___9c_ f
(MPR) zyen
(MPf) qcp (MPa)
Soil type
22 20 18 16 14 1 2
l 2 (m)
10
1 0 08 06
16 15 16
026 027 026
42 41 42 Sand
04 14 U28 39 02 14 028 39 41
02 16 0 26 42 04 16 026 42 06 16 026 42 08 14 028 39 Sand 1 0 13 030 39 12 15 027 4 1 38 14 13 030 39 16 12 032 38 18 12 032 38
40 20 10 036 36 22 10 036 36 24 9 U39 35 2 6 8 043 34 28 10 036 36 30 10 036 36 3 2 10 036 36 34 10 0 36 36 36 11 0 34 37 38 11 034 37
l 1 (m)
40
42 44
11 0 34 37 15 1
46 48 50 52 54 56 58 60 62 64 66 68 70 7 2 74 76 78 8 0
APPENDIX 112
Pile No 2
to little depth of sounding
q~ = middle values for 11 = 2 Op
q~ = 145 MAa (Francke Garbrecht 1977 Tab 2 p 50) (Fi g No 2)
for sand
qcp = 0275middot145 = 40 MPa q~p =V ~~s) middot 40 = 097middot40 = 39 MPa
Pile No 4
q~ = 120 MPa sand (Fig No 4)
q = 0 315middot12 = 3 8 MPa q bull 38 = 086middot38 = 33 MPa=V Jmiddot54
1
cp middot bull cp
Pile No 12
qg = 155 MPa sand (Fig No 13)
qcp = 026middot155 = 4 03 MPa
Pile No 13
q~ = 200 MPa sand (Fig No 14)
q = 0 23middot20 = 46 MPacp
APPENDIX 113
PileNo3 Length 14 m D 15 m
Areas of influence
-
qe
(MPa)
1 Tp
----9cf
(t-1Pf) r~
(MPf) qcp (MPa)
Soil type
22 2D 18 16 17 025 43 14 17 II II
L 2 17 II II
12 (m)
16 10 08 06
17 17 17
o
II
II
II
II
Sand 04 17 II II
02 19 024 46 b9
02 19 024 46 04 17 025 43 06 15 027 41 08 13 030 48 1 0 12 032 38 12 11 033 36 14 13 0 30 39 16 14 028 39 18 12 032 38 40 20 16 026 42 2 2 16 026 42 24 11 033 36 26 11 033 36
60 28 30
10 10
036 036
36 36
Sand
32 10 036 36 34 12 032 3 8 3 6 12 032 38 38 12 032 38
1 1 (m)
40
4 2 4 4
13
14 16
030
028 026
39
39 42
46 13 030 39 48 12 032 38 50 14 028 39 52 10 036 36 54 13 030 39 56 14 028 39 58 15 027 41 60 15 027 ~-1 236 62 64 66 68 70 72 74 76 7 8 80
APPENDIX 114
Pi l e No 5 Length 6 0m D 11 m Dp 11 m
Area s of i nfluence
-
qc
(MPa)
1 Tp
-3Lf
( MPf) l ~
(MP~) qcp (MPa)
Soil type
2 2 2 0 18 1 6 14 1 2 155 U i1 33
l 2 (m)
1 2 10 08 06
15 14 12
022 023 0 27
3 3 32 32
Fine sand
+ silt
04 125 026 33 02 16 0 21 34 39
02 16 021 34 04 13 025 33 06 08 10
15 5 17 20
022 0 20 018
34 34 36
35 Fi ne sand
1 2 20 0 18 36 14 20 018 36 + s ilt 16 20 0 18 36 18 165 020 32 20 165 0 20 32 22 17 0 20 34 24 26 2 8 30 32 3 36 38 4 0
19 21 5 21 5 21 5 20 19 5 19 5 20 215
01 9 ---
018 018 0 18 0 18 -
3 6 40 40 40 36 35 3 5 36 4 0
l 1 (m) 4 2
44 20 19
018 01 9
36 3 6 157
46 48 50 5 2 54 56 58 6 0 62 64 66 68 70 7 2 74 76 7 8 8 0
APPENDIX 1 15
Pi le No 6 Lengt h6 0 m D 11 m
Areas of qc 1 __9_c_ qcp Soil typei nfluence fp f 1 yen (MPa) (MPf ) (MPf) (MPa)
-2 2 20 18 16 t 4---0 14 75 038 29 L2 20 018 36 Fi ne sand
1ti 10 30 40 + s i lt12 08 19 0 19 36(m) 06 17 020 34 04 14 023 32 02 9 034 31 56
02 6 043 26 04 12 026 3 1 06 17 020 34 08 11 028 3 1 1 0 14 023 32 35 1 2 17 020 34 Fi ne sand14 19 019 35 16 20 018 36 + silt18 18 0 19 34 20 14 023 32
46 22 12 026 31 24 12 026 31 26 15 022 33 28 18 019 34 30 20 018 36 3 20 0 18 36 34 20 018 36 3G 20 018 36 38 20 018 36 4 0 20 018 36
l 1 42 22 40
(m) 44 22 40 46 L2 4 0 158 48 50 52 54 56 q =V ~ - 3 b =0 99middot35 = 35 MPp cp 53 58 6 0 62 64 66 68 70 72 74 76 78 80
APPENDIX 116
Pi leNo7 Length 60 m 0 15 m
Areas of influence
-
qe
(MPa)
1 Tp ~
(MPg) r~
(MPf) qcp (MPa)
Soil type
22 20 18 16 9 U33 30 14 10 031 31 12 135 024 32
l 2 (m)
16 10 08 06 04 02
13 12 6
10 175
025 026 043 0 31 020
33 31 26 3 1 35 50
Fine sand
+ silt
02 04 06
17 10 115
0 20 0 31 027
34 31 3 1
08 10
145 185
023 019
33 35 3 5
1 2 14
20 19
018 0 19
36 36 Fine sand
l 1 (m)
60
16 18 20 22 24 26 28 30 3 2 34 36 38 40
42 44 46 48 50 52 54 56 58 6 0
185 125 125 165 17 19 21 215 205 20 21 20 20
24 22 20 215 22 22 21 19 18 22
0 19 026 0 26 020 020 019 --
018 018 -
018 01 8 --
018 ----
0 19 0 19
35 33 33 33 34 36 40 40 37 36 40 36 36
40 40 36 40 40 40 40 36 34 40 219
+ silt
62 64 66 68 70 72 74 76 78 80
APPENDIX 117
Pile No 8 Length60 m D 15 m Dp 2 1 m
Areas of influence
-
qe
(MPa)
1 r +
(MPg) r~
(MPf) qcp (MPa)
Soil type
22 18 019 34 20 16 021 34 18 125 026 3 3 16 115 027 31 14 11 028 3 1 12 11 028 3 1
l 2 (m)
10 08 06
105 11 145
D29 028 023
30 31 33
Fine sand
+ silt
04 18 0 19 34 02 18 019 34 71
02 15 022 33 04 11 0 28 31 06 13 0 25 33 08 20 0 18 36 10 15 022 33 12 13 025 33 14 175 020 35 16 18 20 22
20 21 20 15
018 -
018 0 22
36 40 36 33
35 Fine sand
+ s i lt
24 26 28 30 3 =
13 16 175 19 20 20
025 021 020 0 18 018 018
33 34 3 5 34 36 36
36 38 4 0
20 20 21
018 0 18 -
36 36 40
11 (m)
4 2 4 4 4 6 48 50 5 2 5 4 56 5 8 60 6 2 6 4
20 20 21 22 21 20 19 175 19 20 25 28
018 0 18 ---
01 8 01 9 0 20 0 19 018
36 36 40 40 40 36 36 35 36 36 40 4 0 23 0
6 6 68 70 72 74 76 78
qcp 1f5=v 2T middot35 = b85 middot35 = 30 MPa
80
APPENDIX 118
Pi le No 9 Le ngth 90 m D 11 m m
Areas of 1Qe -9c qcp Soil typeinfluence Tp f ryen (MPa) (MPg) (MPf) (MPa)
-
2 2 2 0 18 16 14 lc 11 034 37
12 10 10 036 36 12 08 9 039 35 Medium(m) 06 10 036 36 sand04 10 036 36
02 11 034 37 43
02 12 032 38 04 12 0 32 38 06 12 0 32 38 08 13 030 39 10 13 030 39 12 13 030 39 14 14 028 39 16 14 028 39
44 18 14 028 39 20 14 028 39 39 Med ium 22 15 027 4 1 sand 24 16 026 4 2 26 17 025 43 28 13 0 30 39 3 0 9 039 35 32 13 030 39 34 16 026 42 36 17 025 43 38 17 025 43 40 19 024 4 6
11 42 17 025 43
(m) 44 15 027 41 17 7 46 48 50 52 54 56 58 60 6 2 64 66 68 7 0 7 2 74 76 78 80
APPENDIX 119
Pi 1 e No 10 Length 95m D 11 m m
Areas of influence
-
qe
(MPa)
1 fp
-9c f
(t-1Pf) [~
(MPf)
qcp
(MPa)
Soil type
22 20 1 8 16 14 L 2 13 Uti 3J
l 2 (m) 12
10 08 06 04
18 18 28 19
0 19 019 0 19 019
34 34 34 34
Fine
sand
02 21 40 42
02 20 4 0 04 17 020 34 06 21 40 0 8 10
23 22
40 40 Fine
1 2 14 16 18
21 20 16 15
0 21 022
4 0 4 0 34 33
sand
44
20 2 2 24 26 28 30 32 34 36 38 40
14 14 13 11 11 14 17 14 12 13 12
023 023 025 0 28 028 023 020 023 027 025 027
32 32 33 31 31 32 34 3 2 32 3 3 32
l 1 (m) 42
44 12 13
0 27 025
32 33 15 2
46 48 50 5 2 5 4 56 5 8 6 0 6 2 6 4 66 6 8 70 72 74 76 78 80
APPENDIX 11 10
Pi 1 e No 11 Lengt h 9 0m D 11 m m
Area s of influence
-
Qe
(MPa)
1 fp
__k_ f
(MP~) ryen
(MPf) qcp (MPa)
Soi l type
22 20 18 16 14 12 lb 55
12 (m)
1 0 08 06 04
23 19 20 21
024 023
55 46 46 55
Medium
sand
02 22 55 62
0 2 04
24 25
55 55
06 08
27 28
55 55
10 12 14
28 28 28
55 55 55 49
16 26 55
44
18 20 22 24 26 28 30 3 34 36 38 40
24 19 18 17 22 21 17 11 13 12 11 9
024 024 025
025 0 34 030 032 034 039
55 46 43 43 55 55 4 3 37 39 38 3 7 35
1 1 (m) 42
Ll Ll
12 16
032 0 26
38 4 2 209
46 48 50 5 2 54 56 58 60 62 64 66 68 70 72 74 76 78 80
APPENDIX 141
0 2 3 4 p [MPa)
PILES WITH 40 ENLARGED BASES
80
120
160 C----0
200 IN4014 s (1977)
[mm]
P s calculateds P p(s)(mm) (MPa)(mmMPa)(MPa) ()
10 035 286 046 20 065 308 080 30 090 333 104
150 24 625 214 200 229
ai = 2605 (mmMPa) b1 = 0243 1MPa V 1000 bi = 1b = 411 MPa
_ 411 MP Vi - 24 a
() assumed
average Dp = 18 m
qcp = 24 MPa ai = 184 (mmMPa) (28-4middot24)
Vi = 1 2 (3-18)
qcpmiddotvi = 29 MPa
40
80
120
160
200 s
[mm]
DIN 4014 Part 2 ( 1977)
0 1 2 3 4 5 p [MPal
PILES WITHOUT ENLARGED BASES
C----0
DIN 4014 ( 1977
s calculated s p -p- p(s)
(mm) (MPa)mmMPa)(MPa) ()
10 05 20 062 20 08 25 113 30 11 27 3 155
150 34 441 385 200 424
ai = 2085 (mmMPa) bi= 0 157 1MPa V = 0970
bi= 1s = 637 MPa
Vi 187=3f =
() assumed
average Dp = 12 m
qcp = 34 MPa a1 = 144 (mmMPa)
Vi = 18
qcpmiddotvi = 61 MPa
Range qc = 10-15 MPa
(28-4bull34)
(3-12)
1 1 q = r -r- = 036 for qc = 10 MPaCp p Ip+= 027 for qc = 15 MPa
qcp = 36-405 MPa P
APPENDIX 142
Touma F and Reese L (1974)
Soil parameters pile parameters and base resistance see fig bullbullbullbull
TAB
Measured load settlement curves
Settlement s
mm
10 20 30 40 50 60 80
100 120
a 1 (mmMPa) bi(MPa) V
N3u
q =04 -N30 (cMPa) ()
1 qCp=--rpbullqC
Pile No 21 (US 59) 22 (HH) 23 (G1) 24 (BB) Notep Sp p S p p S p f Sp MPa mmMPa MPa mmMPa MPa mmMPa Mla mmMPa
131 76 169 59 075 133 100 100 269 74 325 62 131 153 1 94 103 381 79 456 66 165 182 273 11 0 488 82 581 69 1 90 21 1 349 115 581 86 694 72 2 15 233 424 118 675 89 800 75 229 262 813 98 245 327 884 113 925 130
64 56 100 95 U049 0032 0276 0048 0944 0998 0996 0981
80 gt100 30 60 32 gt 40 12 24 ()
Bergdahl (1982)
gt5 5 gt55 32 4 3
(0 18middot32) (018middot40) (0265middot12) (018middot24)
CONTACT PRESSURE p [ MPa]
0 2 4 6 8 100 N-------r---------------(us 59) ( HH) ( BBi
E E SQ-------lt+-----+--------------lt
VI
1shyz UJ
~ 100 1---------i----+----+----+------l------I -J I shyI shyUJ V)
so~----~--~-- ~--~
APPENDIX 143
us 59 fYJo 0 50 00
ff-t r-=-~c~=~-r~c_---_---l-~e-J-C~ 0 ------
CLAY
FINE SANO
J lD- 760 mm
f5m~--~--~
Pile US 59 and results from penetration test
HH IV_l() so 100 r=-=-==-==-r-~--=-=- 0 0 II 15- flf ~ II~ Ibull If t f
CLAY SAND
Sm
)
= -middotl lo - GtOmm
~ JI
SILTY SANO tOm
Pile HH and results from penetration t est
APPENDIX 14 4
61 NJO 50 --------00
11 1 =f J - 1 -- 0
CLAYSILT
E ~ Sm ltrj
SILTY SAND
q I lDmiddot 910 mrn tom
I) t bull
Pile G1 and results from penetration test
88
0 50 too ~1-e I q 111bull - Q
CLAY
SIL TY SAND 5m
]
l lDmiddot760mrn
Om
Pile BB and results from penetration test
APPENDIX 145
Klosinski B (1977)
Loading tests 50 bored piles 09-125 m diameter average Op= 11 m On t he sett l ement of rigid pla te the settlement of t he pi le base is given by
PmiddotOSp = T-K b
where Mb - equivalent deformability modu lus
1) Sand and sandy gravel of medium density
Mb = 25-50 MPa
According to Bergdahl (1979) medium sand is between
q(l) 5 MPa (Io=035)c2)
ql = 10 MPa (Io=065)C
from fig 117 rp1 = 055 for qc = 5 MPa 1Tp = 036 for qc = 10 MPa
q(l)= 0 55middot5 = 2 75 MPacp bull
q(2= 0 36middot10 = 360 MPacp
allowable p~ 1)= ~p = yen = 092 MPa and p~2) = ~ = 120 MPa
settlement of the pi l e base
5(1)= o 92 middot 1bull1 = O 0135 m = 13 5 mm p 325 middot middot
5( 2)= 1bull2bull1middot 1 = O 0088 m = 8 8 m p 350 bull bull
1) _ s _ 135 _ 14 7 (mm) a(2) _ 88 _ a 1 - p - o---92 - bull NPa bull 1 - T-7 - 733 (Wa)
2) Loose sand lo= 030-040
Mb = 12- 25 MPa
q~l) = 44 MPa q~2)= 58 MPa
1Tp = 058 and 052
q(3) = 0 58middot4 4 = 2 55 MPa middot q( 4) = 0 52middot5 8 = 3 02 MPa cp bull middot bull cp bull middot middot
allowable p~ 3)= 4i = 085 MPa p~4)= yenl = 101 MPa
s(3)_ 085-11 = 26 mmmiddot s(4)_ 101middot11 = 148 mm p - 312 p - 3 25
STATENS GEOTEKNISKA INSTITUT Swedish Geotechnical Institute S-581 01 Linkoping Tel 01311 51 00
Serien Rapport ersatter vara tidigare serier Proceedings (27 nr) Sartryck och Preliminara rapporter (60 nr) samt Meddelanden (10 nr)
The series Report supersedes the previous series Proceedings (27 Nos) Reprints and Preliminary Reports (60 Nos) and Meddelanden (10 Nos)
RAPPORT REPORT Pris kr
No Ar (Swcrs)
1 Grundvattensankning till foljd av 1977 50shytunnelsprangning P Ahlberg T Lundgren
2 Pahangskrafter pa langa betongpalar 1977 50shyL Bjerin
3 Methods for reducing undrained 1977 30shyshear strength of soft clay K V Helenelund
4 Basic behaviour of Scandinavian soft 1977 40shyclays R Larsson
5 Snabba odometerforsok 1978 25 shyR Karlsson L Viberg
6 Skredriskbedomningar med hjalp av 1978 40shyelektromagnetisk faltstyrkematning - provning av ny metod J Ingands
7 Forebyggande av sattningar i 1979 40shyledningsgravar - en forstudie U Bergdahl R Fogelstrom K - G Larsson P Liljekvist
8 Grundlaggningskostnadernas fordelning 1979 25 shyB Carlsson
9 Horisontalarmerade fyllningar pa los 1981 50 shyjord J Belfrage
RAPPORTREPORT
No
10 Tuveskredet 1977-11-30 Inlagg om skredets orsaker
11a Tuveskredet geoteknik
l1b Tuveskredet geologi
11 c Tuveskredet hydrogeologi
12 Drained behaviour of Swedish clays
R Larsson
13 Long term consolidation beneath the test fills at Vasby Sweden YCE Chang
14 Bentonittatning mot lakvatten T Lundgren L Karlqvist U Qvarfort
15 Kartering och klassificering av leromradens stabilitetsforutshysattningar L Viberg
16 Geotekniska faltundersokningar Metoder - Erfarenheter - FoU-behov E Ottosson (red)
17 Symposium on Slopes on Soft Clays
18 The Landslide at Tuve November 30 1 977 R Larsson M Jansson
19 Slantstabilitetsberakningar i lera Skall man anvanda total spanningsanalys effektivspanningsanalys eller kombinerad analys R Larsson
20 Portrycksvariationer i leror i Gateshyborgsregionen J Berntson
21 Tekniska egenskaper hos restproshydukter fran kolforbranning shyen laboratoriestudie B Moller G Nilson
Ar
1981
1981
1981
1981
1981
1982
1982
1982
1983
1982
1983
1983
1983
Pris kr (Swcrs)
50shy
50shy
40shy
50shy
100shy
60shy
80shy
60shy
190shy
75shy
60shy
150shy
65shy
RAPPORTREPORT
No Ar Pri s kr (Sw crs)
22 Bestamning av jordegenskaper med sondering - en litteraturstudie U Bergdahl U Eriksson
1983 75 shy
23 Geobildtolkn ing L Vi berg
av grova moraner 1984 70 -
24 Radon i jord -Exhal ation- vatten kvot -Arstidsvariationer - Permeabilitet A Lindmar k B Rosen
1984 75 shy
25 Geoteknisk terrangklassificering for fysisk planering L Viber g
1984 120shy
26 Large diameter bored piles in nonshycohesive soils Determination of the bearing capacity and settlement from results of static penetration tests (CPT) and standard penetration test (SPT) K Gwizdala
1984 85shy

14
It must be underlined that the best correlation for
the pile point is obtained with the Soviet method
101 for 94 driven piles in non-cohesive soil
- 172 114 for 46 bored piles in non-cohesive soil
Trofimenkov 19731974 showed the results of comparison
of the ultimate loads determined by formula (114a)
Q~ and by pile load tests Q~ for 153 driven friction
piles at the 57 various sites see Fig 115
In Germany a lot of investigations were made before
establishing the DIN 4014 part 2 (1977) on large diameter
piles
In Table 113 and 114 the results from these investigashy
tions are generalized
The data in the tables were obtained from 35 test loadings
(4 of which were published by Franke 1973 The diameter
of the piles was from 08 to 25 m the length from 5 m
to 34 m and the cone penetrometer resistance varied from
10 MPa to 15 MPa
Bustamente and Gianeselli 1982 proposed a prediction
of the pile bearing capacity by means of the static
penetrometer Their proposal was based on the intershy
pretation of a series of 197 full scale static loading
tests In this paper the results from tests of 55 bored
piles are chosen The diameter of the piles varies from
042 m to 150 m and the length from 6 m to 44 m The
equivalent cone resistance was determined as showed in
Fig 116 The authors have noticed that the point
resistance factor f depends on the nature of the soil p and its compactness but also on the different pile placeshy
ment techniques (see Tab 115)
Piles of category group I
- Plain bored piles - Cased bored piles
- Mud bored piles - Hollow auger bored piles
- Type I micropiles - Piers (grouted under low - Barrettespressure)
15
In Tab 116 values of the shaft resistance factor
fs are given
Category IA
- Plain bored piles - Mud bored piles
- Hollow auger bored piles - Cast screwed piles
- Type I micropiles - Piers
- Barrettes
Category IB
- Cased bored piles - Driven cast piles (concrete or metal shaft)
Category IIA
- Driven precast piles - Prestressed tubular piles
- Jacked concrete piles
Category IIB
- Driven metal piles - Jacked metal piles
It can be noted that the values in Tab 116 are in
genera l of the same range for the driven and the
bored piles
According to the Polish Specification 1979 the point
and shaft resistance factor are given by
1-f- = kmiddota
p p
where
ap 035 for sand
k coefficent of unhomogeneity k qcp min
qcp
= 0065 for sandfrac12
1
16
Similar results can be observed in Fig 116a and
Fig 116b It was showed by Kerisel (1965) and Franke
(1973) that the harder soil the more loosening at
excavation and thus relatively smaller bearing capacity
Taking into account the Franke diagrams we will have
for D = 125mand settlements= 2 cm p
Cone resistance qc (MPa) 1 5 50 1 0 15 22
qc p for s=2 cm 3 6 8 12 14
(see Fia 1 1 6b )
taking safety factor for pile base F = 3 the point resis~ance
33-10 ~-05
380375 lo 212 bull lo 2114 bull
factors- shy are p
The above anal ysis shows that it is possible to determine
ultimate point and shaft resistance of bored piles from
static cone sounding But it is very important and must
be taken into account type of pile kind of soil and
degree of compaction
Bel ow calculation method for large diameter bored piles
based on the static cone penetrometer resistance (CPT)
is proposed Equation (117) can be used directly for
the base diameter D lt 15 m For larger diameters p shyD gt 15 m the values should be multiplied by the
p ff t ITscoe icen Y~ as pi
( 1 1 5 )
where
qcp = according to equation (117)
D = diameter of the pile base D gt 15 mpi pi
17
This value q~p should be put into equation 116
The value qc s in equation 118 is independent on the
pile diameter
Proposed calculation method
(116)
where)
1 1 40 ~ 11 3 for piles wit h a nd enlarged bases12 10 12 = ~
h+h
q (h) dh (117)qcp l1+l2 f -f- Ch-li p
h 1 f 1
qcs = o -f- qc (h) dh (118)h s
1 -f- = f(q kind of soil ) -+- see Fig 11 7 and Tab 1 1 7
C p
f (q kind of soil ) -+- see Fig 1 1 8 and Tab 1 1 8 fs C
Note
a) the point resistance q for qc gt 20 MPa is assumed cp to be maximum as
- Gravel 70 MPa - Coarse sand medium sand 55 MPa - Fine sand s il ty sand 40 MPa
b ) The shaft resistance qcs for qc gt 20 MPa is assumed to
be maximum as
- Gravel 110 kPa - Coarse sand medium sand 90 kPa - Fine sand s ilty sand 70 kPa
These proposed values are compared with results by
Bustamente (1 982) and the Polish Specification (1978)
Fig 11 9 and F i g 1110 A similar comparison for DIN
4014 1 977 is shown in Fig 1111 and Fig 1112
) In this paper was used the above values 1 1 and l z But it can be used in practice 11 =30 D and h =2Dp respectively The results shall be very simi l ar to the above onPs
18
The proposed method has been examined with field test
results This is shown in Fig 1113 to Fig 1128
and Appendix 1 11 to 1110 and Tab 119
The comparison shows that the value of q in equationcp (117) corresponds to the settlement -10 of the base
diameter (s=010 DP) see Fig 1113 and Tab 119
(average sDp=88 and standard deviation sd=3)
Later in this paper the allowable load and dependence of
the load versus settlement will be determined
12 Determination of bearing capacity of the large
diameter bored piles from results of the Standard
Penetration Tests (SPT)
There are little published on pile tests coupled with
results from Standard Penetration Test (SPT) Among the
authors who have published material in the subject are
- Meyerhof 1956 1976
- Senneset 1974 (Norwegian method)
- Rodin Corbett Sherwood Thorburn 1974 (English method)
- Polish Specification 1975
- Weltman Healy 197 8
- Reese 1978
- Japanese Society 1981
- Decourt 1978 1982
The Norwegian method is valid o nly for concrete andor
wooden piles the English method only for gravel It is
very important to underline that the Norwegian a nd the
English methods use of the SPT resul ts intermediate by
the static cone penetrometer resistance (q ) as well C
Below methods are presented that are using the results of
SPT directly Meyerhof s method in total can also be used
on driven piles in non-cohesive soil Although we could
have found some proposes for bored piles Eqs (121 and
122) see Fig 121 and Fig 1 22 as well
19
Ultimate point resistance (psf)
12 N 3 omiddotH lt 120 N 30
(kPa) (1 2 1)Psf D
where
N30 the average standard penetration resistance
in blows per 03 m
H depth in bearing stratum
Ultimate skin friction tu
for bored piles tu N~ o (kPa) (1 22a)
for driven pil estu 2N30 (kPa) (1 2 2b)
where
N30 the average standard penetration resistance
in blows per 03 m within embedded length
of pile
Weltman and Healy (1978) taking into account Meherhofs
proposition for driven piles have introduced two coefshy
ficents for bored piles in gravels (glacial soil) Equ
123 and Fig 1 23
t = a 2 N30 (kPa ) (1 2 3)U 1
where
ai a 1 for impermeable gravels see Fig 123a
ai a 2 for permeable gravels see Fig 123b
The Polish Specification ( Specification for Design and
Construction of Large Diameter Bored Piles in Bridges
1975 Ministry of Transport) gives the ultimat e point
resistance in dependence of N30 base diameter and depth
see Tab 12 1 The Tab 121 contains values for coarse
and medium sand For other non-cohesive soils the following
coefficients are proposed
p f = S bull p f (medium sand) ( 1 2 4)S 1 S
20
where
S1 1 20 for grave lSi
f 132 080 for fine sand
13 3 070 for silty sand13i
In Fig 124 values of psf are shown for h = 10 m DP
06 m DP= 15 m and h = 20 m DP= 06 m DP 1 5 m
respectively
A few of the instrumented piles were tested and analyzed
by Wright and Reese (1979) The ultimate point and shaft
resistance in the fine and silty sand as a function of
blow count from SPT is shown in Fig 125 Results from
two additional tests reported by Koizumi (1971) are also
introduced in the figure The ultimate point resistance
is assumed to exist at a settlement equal to 5 of the
base diameter
Methods of prediction of the bearing capacity of piles
based exclusively on N30 values were presented by Decourt
1982 Below a proposition for high capacity piles excavated
and cast under bentoni te is presented
The ultimate skin friction is determined by the expression
(see Fig 126)
t = 33 N30 + 1 0 (kPa) ( 1 bull 2 5 ) u
where
N30 average value of N30 along the shaft
- for N30 lt 3 must be taken as = 3N30 - for N3o gt 5 0 must be taken as NJo= 50
The allowable point resistance can be obtained in a n
expedite way as
Psa = 33 N30 (kPa) (1 2 6)
where
N30 = average of Nat point level one metre above
and one metre below
Psa allowable point resistance
21
Decourt proposed a safety factor for the point of F = p
40 Therefore the ultimate point resistance can be
determined by the expression
(kPa) (1 2 7)
In Fig 12 7 and Fig 1 28 the above values for base
and skin friction resistance are compared respectively
Taking into account the type of soil thereis a good
correlation for ultimate point resistance The result for
ultimate skin friction is scattered but only apparently
The values for large diameter bored piles are between
the line 1a and 1b in Fig 128 Large diameter piles
have a high ultimate skin friction in relation to driven
piles (see points for bored piles in Fig 122 and DIN
4014 Part 2 1977 as well) The high values for piles
excavated and cast under bentonite have had a strong base
on the load tests (Decourt 1978 1982 and Wright and
Reese 1979)
Below the proposals are given for determination of the
values of the ultimate point resistance and the ultimate
skin friction Eqs 128 to 1214 and Fig129 1210
The ultimate point resistance
- gravel psf = 140 N30 (kPa) ( 1 bull 2 8)
for N~ 0 gt 50 blows3O cm Psf 7 MPa
- coarse sand and medium sand
(kPa) ( 1 2 9)
for N30 gt 50 blows3O cm Psf 55 MPa
- fine sand and silty sand
psf = 80 Nio (kPa ) (1210)
for N30 gt 50 blows3O cm p f = 40 MPa 5
where N3 o the average of N value near the point level as
22
h+l1
f N3o(h)dh ( 1 2 11 ) h-12
3DP see Fig 1 1 1 D
p
The ultimate skin friction for coarse sand and medium sand
tu = 1 8 N 3 o (kPa) (1212)
t (kPa) (excavated and cast (1213)u under bentonite)
where
N30= the average value of N along the shaft as h
N -
3 o = h1 f N 3 o ( h) dh ( 1 bull 2 bull 1 4 ) 0
The ultimate skin friction for N30 gt 50 blows30 cm is
assumed to be maximum as tu = 90 kPa and t = 150 kPa u
13 Allowable load of large diameter bored piles
The allowable load Qa of large diameter piles has been
expressed as
OuQa ( 1 3 1)Ft
Qa Q(s)=Qb(s) + Os(s) ( 1 3 2)
Opu + Osu (1 3 3)Qa Fp Fs
Qr lt mmiddotQf ( 1 bull 3 4)-
= universal safety factor
individual safety factor for ultimate resistance of the pile point
individual safety factor for ultimate resistance of the pile shaft
= load according to the allowable settlement
calculated load
m coefficient
calculated ultimate bearing load of the pile
23
The equations from (131) to (134) are used as
1) equation (131)
a) DIN 4014 - 1977 Ft= 2 175 15 (depending on the kind of load)
b) Polish Specification 1975 Ft = 18 16 ( -- )
1c) Trofimenkov 1974 Ft = 14307
2) equation (132)
a) DIN 4014-1977 i Q(s) = Qb(s) + Q (s) = A middotp(s) + E tAsmiddott(s)
s p 0
where Qbs) and Qs(s) are described in Fig 1423
3) equation (133)
a) Polish Specification 1974
F 25 22 depending on the kind of load p
F 1 bull 0 s
b) Wright SJ Reese LC 1979
The ultimate capacity or resistance is considered as a
random value and represented by a frequency distribution
The distribution can be described by a mean value and a
variance The distribution of the load applied to the
foundation can be described similarly The coefshy
ficients used to factor resistance and loads are called
partial safety factors Some recommended partial safety
factors for resistance under normal conditions of design
and construction are given in Tab 131 Normal control
is defined as a condition where the coefficient of variation
is less than about 035
Typical values for partial safety factors for loads are
in the range 1 to 2 depending on the type of load and
how it is applied The overall factor of safety Ft can
then be calculated from the equation
Ft = y RbullY S
24
where
YR the par tial sa f ety fac t or for resistance and
Ys the partial safety factor fo r load
The probability of fa i lur e of the foundation can be r eshy
lat ed to the factor of safety for a parti cular degree of
uncert ainty (see Tab 13 2)
c ) Tejchman Gwizdala 1979
The authors discuss adequate safety factors based on fie l d
test s by Spang (1 972) Franke (1976) Touma and Reese (1974)
Colombo (1971) Kerisel and Simons (1962) Appendirno (1973)
see Tab 1 33 Taking into account the universal safety
factor Ft= 2 0 for the tota l load settlement curves it
was estimated
i) F in the range of 111 to 237 with the average value s F = 166 and standard deviation sd = 034 s (see column 16 Tab 133)
ii) Fb in the range of 161 to 945 with the average
value Fb = 387 and standard deviation sd = 2 15
For model core d piles in laboratory conditions values of
Fs = 108 to 154 (average Fs = 132 s~ = 019) and
values of F = 280 to 5 94 (average F = 3 55 sd = 1 07)p p
see Tab 1 3 4
As a conclusion it was assumed that Fb = 40 and F 1 5 s
for l arge diameter bored piles
The investi gation has shown that for the above safety
factors settlements of piles under permissibl e loads are
10 to 20 mm There was assumed a maximum load on large
diameter piles corresponding to a settlement of 010
diameter of the piles
25
d) Bustamente Gianeselli 1 982
e) 0ecourt 1982
The safety factor is given by
F = FgmiddotFfmiddotFamiddotFw where
F 11 - skin friction g F 135 - point bearing capacity
g
Ff safety factor related to the formulation adapted
Ff= 10 for Decourts method
Fd safety factor related to excessive deformation
Fd = 10 for skin friction
As for the point Fa= 2 to 3 depending on the
pile diameter For usual cases 25 is suggested
Fw safety factor related to working load
Decourt recommends 12
Thus we will have
- for skin friction
Fs = 11bull10middot10middot12 132 - 13
- for the point
F = 135bull10bull25middot 1 2 = 405 = 40 p
4) equation (134)
a ) Polish Code 1983
Q lt mbullN r shy
where
total load coefficient (depending on the kind of load For foundation we can assume Yf = 12 )= code load
correction coeffic i ent
09 for pile foundations
m 08 for two piles
m 07 for single pile
26
N ymmiddotQu
ym material (soil) coefficient
ym 08 to 09 (Polish Code 1981)
Thus we will have
QnmiddotYf lt mmiddotym middotQu-
Yf9uFt = On m bull Ym
1 2 max = 2 14Ft 0 7 bull 0 8
1 2min = 1 48Ft 0909
The above analysis has shown different ways to determine
the allowable load The analysis is in direct connection
with mobilization of the load (versus settlement) The
dependence of total load point resistance and shaft reshy
sistance will be discussed in detail in Chapter 14
In the authors opinion taking into account the above
analysis the allowable load should be determined based
on the equation 133 ie based on individual safety
factors for ultimate point and shaft resistance Proposed
values of F and F in literature are shown in Tab 135 s p The average values are Fs = 145 and Fp = 3 38 respectively
Taking into account that the bearing capacity is determined
based on the results from sounding measurements direct from
a place near the piling without a ny indirect correlation
the allowable load of large diameter bored piles is given
by the equation (133a)
( 1 3 3a)
where F = 30 and F 13 are proposedp s
27
14 Determination of settlement of larqe diameter bored
piles based on static cone penetration tests CPT
Determination of ultimate point and skin friction resistance
based on static cone penetration tests has been discussed
in Chapter 11 above Based on the results of this calcushy
lation and on Chapter 13 we can establish an approximate
relation between point resistance shaft resistance and
total load on one hand and settlement on the other However
the approximation gives a wide scatter especially for base
resistance as can be observed in Fig 141 to Fig 144
Only the first part of the point resistance - settlement
curves are in good agreement with measured values It can
be observed in Fig 145 that the average correlation
coefficient n = 098 and standard deviation sd= 029
This way of calculation can be used only for rough calcushy
lation (see Chapter 13)
In Chapter 11 also measured point resistance - settlement
curves were shown The base resistance increases gradually
with increasing pressure and settlement Below the cur7
vature of the point resistance - settl ement curve will be
examined It is assumed that this curve can be described
as a part of the hyperbola curve Thus if the ratio of
the measured settlement (s ) to the point resistance (p)
is plotted against the measured settlement the result
will fall closely to a straight line with the equation
( 1 4 1)
where a 1 and b 1 are constants (see Fig 1 46a and Fig
14 6b)
Then the point resistance - settlement realtionship can be
expressed as a hyperbola
s p = ( 1 bull 4 2)
The constant is the initial s lope of the point resistanceshya 1
settlement curve ie a 1 = t~a The inverse of the constant
28
b 1 is the vertical tangent (asymptote) to the curve 1ie for s = 00
bf= ~ If the ultimate point reshy1
sistance psf is equal to bf (psf=bf) the whole point
resistance settlement curve will be a hyperbola type
Now the Eq 1 4 2 can be written as
s s ( 1 4 3)a) p s or b) p = a+__sect_a1 + 1 Psfbf
If the ultimate point resistance is smaller than bf only
a part of the hyperbola curve ought to be considered
Further the Eq 14 3 will be written as
p ( 1 4 4)
where
poundf_ correction factor for hyperbola point Psf resistance-settlement relationship
Taking into account the discussion in Chapter 11 the
ultimate point resistance psf = qcp based on the CPT measurements
Therefore the relationship between the point resistance
the sett l ement and the CPT result can be expressed as
s p (1 4 5)s
The correction coefficient v 1 will cause a change of the
position of the vertical asymptote bf in r elation to the
ultimate point resistance q bull This means that we take cp into account a different part of the hyperbola curve for
the description of the point resistance-settlement relationshy
ship
Now if we want to use the equation (145) in practice
we must determine the constant and the coefficienta 1 v 1 (assumed that q is determined ear l ier Chapter 11)cp
29
The constant a 1 and t h e coefficient Vi have been detershy
mined based on fi e ld tests according to pi l es No 1 - 20
see Tab 14 1 and Tab 1 1 9 as wel l The values of
a 1 versus the point diameter D and the ul timate pointp
resistance respectively are shown in F i g 147 and Fig
148 Fig 1 47 shows that a 1 is independent of the
point diameter D Based on Fig 148 it can be assumed p
that
28-4bullq (1 4 6)cp
This correlation has been examined with data of the
literature see Fig 1 49 and Appendix 141 to 1 45
(Note there were no static penetration tests and qcp was determined based on a correlation made by Bergdahl
(1982))
A good correlation with equation 146 can be seen taking
into account the safety factor in the DIN 4014 Part 2
(1977) bull
The correction factor v 1 versus the poi nt diameter is shown
in Fig 1410 I t is assumed that the correlation is
V1 = 3 0 - D ( 1 4 7)p
where D is in m p
The above equations ie 146 and 147 were assumed for
a later analyses see Fig 14 11 and Fig 1412 The
piles No 1 to 20 were examined taking into account Eqs
14 5 14 6 and 1 4 7 The result of this cal cul ation is
presented in Fig 1 413 to Fig 1 4 18 and in Tab 1 4 2
respectively In Fig 1413 the calculation way for pile
No 2 is shown as an example
In Fig 1414 to Fig 1 417 measured and calculated
values of the point resistance versus settl ement can be
compared In tota l good correlation exists for all the
30
pressure-settlement curves Values of q from static cp
cone penetration tests and generalized values of anda 1
v 1 were considered Only for piles No 17-20 qcp was
assumed as the point resistance for s = 010 D because p
the static penetration test results were inaccessible
The similar comparison is shown in Fig 1417a for piles
in sand based on experimental results (Tuoma Reese 1972
and Wright Reese 1979) where the ultimate case resistance
was assumed as the resistance at a base settlement of 005
D The relative base resistance is the mobilized base p resistance divided by the ultinate base resistance The
curvature of the proposed point resistance settlement shy
curve to mean value proposed by Wright and Reese is excellent
However the constant a 1 and the coefficient v 1 were
determined for sand only In the future they should be
examined especially for gravel and silty sand based on
field tests Until then in the authors opinion the
values of v 1 can be chosen from Eq 147 for all nonshy
cohesive soils But for a 1 there is proposed
at = gt bulla (1 4 8)1
where
gt- 1 = 080 for gravel
gt 2 120 for silty sand
This proposal is shown in Fig 14 11 as dashed lines
A good correlation can be seen with the investigation by I
Kiosimiddotnski for sandy gravel and on the safety side with
the investigation by Tuoma and Reese for silty sand (see
Fig 149)
In Fig 1418 all calcul ations for pile No 1 to 20 are
summarize d The correlation coefficient n is defined as
the calculated point resistance p(s) divided by measured
point resistance p(s) For totally 126 points from 20
curves an average of n = 098 with standard deviation
31
al= 023 was obtained see Fig 1418 A similar result
can be observed for the range usually assumed of the
allowable settlement for sinqle large diameter bored
piles as
for
- for
- for
s
s
s =
10
20
30
mm a
mm
mm
verage n10 II
II
mm 089
095
099
and sd =
and sd
and sd
031
027
026
It can be questioned whether the sonstant a 1 can be deshy
termined in different ways The constant a 1 is the initial
slope of the point resistance-settlement curve as menshy
tioned above Then we can use all methods for determination
of settlement of a pile point The range of validity of
these methods then must be determined This will be shown
later
In order to be able to design the total load settlement
curve the skin friction resistance-settlement relationshy
ship must be determined The ultimate skin resistance of
large diameter bored piles was determined in Chapter 11
(based on static penetration tests) and in Chapter 12
(based on standard penetration tests)
In the past a lot of field tests have been done on the
mobilization of the shaft resistance versus pile settleshy
ment In this subject there is a rather good agreement
in the whole investigation for cohesive and non-cohesive
soil
Some results and opinions on thispresented in the literashy
ture during the last few years are shown below
Ultimate shaft resistance versus settlement
1) BurlandJB Butler FG Duncan P (1969)
-The shaft l oadsettlement curve is derived using a=0 3
with 90 ultimate load being mobilized at 025 in
settlement(~65 mm)
- soil London clay
- see Fig 1 419
32
2) Touma FT Reese LC (1974)
- The failure of the sides of the shaft takes place
at a downward movement of about 04 in (10 mm)
- soil sand
- see Fig 1420
3) Tomlinson HJ (1977)
- The maximum shaft resistance is mobilized at a
settlement of only 10 mm (or j in)
- soil stiff clay
- see Fig 1421
4) Klosinski B ( 1977)
- It was assumed that skin friction increased proshy
portionally to pile settlement up to the limit value
s bull This value depends on soil conditions and pile0 diameter and is usually from 3 to 8 mm For soft
compressible soil it may be grater than 10 mm
- soil cohesive soils
- see Fig 1422
5) Franke E Garbrecht D (1977)
- At settlement of 2 to 3 cm which are normally
allowed in Germany under working loads for buildings
not very sensitive to differential settlementsthe
skin friction is almost always fully mobilized
- soil sand
6) DIN 4014 part 2 (1977) and Franke E (1981)
- The skin friction Tm is approximated as diameter
independent having failure settlements of smf = 2 cm
in sand and 1 cm in clay
- soil sand and clay
- see Fig 1423
33
7) Reese By L (1978) Reese By L Wright SJ (1979)
(1978) The maximum skin friction being developed at
an average downward movement ranging from about 05shy
2 of the shaft diameter The average of six load tests
reported by Whitaker and Cooke (1966) are a lso plotted
for comparison
- soil stiff clays
- see Fig 1424 and Fig 1425a
(1979) The relative settlement is the average settleshy
ment of the butt and base devided by the shaft diameter
The mean curve maximises at a relative settlement of
about 002 D
- soil sand and clay
- see Fig 1425b
8) Tejchman A Gwizda3a K (1979)
- A clear differentiation of the distribution of shaft
and base resistances is observed for changing settleshy
ment For fairly small settlements the shaft resist shy
ance increases quite fast and the ultimate values
are reached soon while the base resistance increases
gradually with increasing loads and settlements withshy
out clearout ultimate values it can be assumed that
complete mobilization of shaft resistance corresponds
to settlements equal to 001 or 002 diameter of pile
- soil cohesive and non-cohesive soils
- see Tab 131 and Fig 1 426
9) Promboon S Brenner R P (1981)
- Load distribution and load transfer curves disclose
that most of the load is carried by shaft friction
which is developed at small displacements in the order
of 10 mm
- soil Bangkok clay
- see Fig 1427
34
10) Prodinger w Veder Ch (1981)
- The maximum value of skin friction resistance
occurred for a total settlement of 12 mm
- soil silty clay and sand
- see Fig 1428
11) Farr JS Aurora RP (1981)
- Ultimate load transfer was recehed (or nearly reached)
at a relative settlement of about 04 in (10 mm)
- soil gravelly sand
- see Fig 1429
12) Decourt (1982)
The skin friction resistance is totally mobilized
with deformations of about 10 mm or at the most 15
mm regardless of shaft dimensions This observation
of ours seems to clash with the opinions of other
authors who seek to relate the deformation necessary
for full skin friction mobilization with the shaft
diameter
- soil cohesive and non-cohesive soil
In Tab 143 all these results are shown Depending on
the kind of soil the following v a lue s of ultimate settleshy
ment for shaft can be assumed
- averages 142 mm (sd 5 3 mm) for sand
- averages 100 mm (sd = 21 mm) for cohesive soil
averages 726 mm (sd 67 mm) for claysand
It can be observed (see Fig 1419 to 1428) that the
shaft friction resistance increases proportionally to
the pile settlement up to the above limit value and
thereafter becomes constant
35
Taking into account what was mentioned earlier on point
resistance settlement relationship and the above results
a relationship between total load point resistance and
shaft resistance on one hand and settlement on the other
can be made see Fig 1430
It is assumed on the safety side that the following
ultimate settlement (S~) exists for the shaft resistance
of large diameter bored piles
SS1 ) 200 mm for non-cohesive soil u SS2) = 100 mm for cohesive soil u SS3) 15 0 mm for claysandu
In Fig 1 430 the curve Q (s) is calculated based on p
the equation 14 5 or 144
The values of psf in equation 144 can be calculated
based on other methods as well
The total load-settlement relationship is obtained by
summing up point and s haft resistance as
Q (s) = Q (s) + Q (s) (149)s p
for each point
Now the allowable load can be determined from equation
133a and versus the allowabl e settlement as
Q (s) = Q (s) + Q (s) (1410)s p
where s lt Sa
Sa= the allowable settlement of the pile
The analysis allows determination of the approximative
load settlement dependence without calculating the settleshy
ment for non-cohesive soil In Fig 1431 it is shown
36
In Tab 144 the settlement for allowable point reshy
sistance q5P according to equation 133a is shown
as well The average settlements= 198 mm (sd=78 mm)
is obtained This value is similar to the assumed ultimate
settlement of shaft for non-cohesive soil The ultimate
settlement for point resistance is assumed s = 010 Dp as mentioned earlier
37
15 Initial slope of pile point resistance shy
settlement curve
Settlement of piles and pile foundations can be cal culated
based on
- empirical correlations
load-transfer methods using measured relationships
between pile resistance and pile movement at various
points along the pile
- theory of elasticity that employs the equations of
Mindlin for subsurface loading within a semi-infinite
mass
- numerical methods and in particular the finite element
method
- use of in-situ tests (Cone Penetration Test Standard
Penetration Test Pressuremeter Test)
The critical slope of the pile point resistance-settlement
curve is important for calculation in chapter 14 The
constant a1 can be determined from all the above mentioned
methods
Comparison is made to Berggrens and Schmertmanns methods
below (see Berggren 1981 as well)
6sIn Tab 151 (No 1 2 3) the values of a 1 =~p for s =
10 mm and s = 20 mm (measured for large diameter bored
piles No 1 to 24) are compared to the calculated values
according to the modified hyperbola method (see Fig 14 6)
It can be seen that these calculated values are between
s = 1U-2u mm but rather closer the measured values for
the settlements= 10 mm see correlation coefficient n 6
and n 7 in Tab 151 respectively The average correlat i on
coefficent for the settlements= 10 mm is n9 = 108 and
the standard deviation is sct = 014 The comparison to
Berggrens and Schmertmanns methods for s = 20 mm ( see
Berggren 1~81 and Tab 151 as well) shows that the
results based om these methods give too high values of a 1 bull
38
The average values are ne= 143 sd = OJ3 and ng= 137
sd = 037 for Berggrens and Schmertmanns methods
respectively A bit better agreement can be observed
for Schmertmanns method
Taking into account the results in Tab 151 ana Tab
15l it must be assumed that for the determination of
a 1 the pile point contact pressure p(a1) should be
assumed as the ultimate point bearing capacity devided
by about 4
p(ai) - ( 1 bull 5 1 )
Most of the methods for determination of settlement are
based on the theory of elasticity The settlement ot the
pile point can be expressed as the average settlement of
a rigid circular foundation from the equation
11-Dp 1-v 2
s = p -4- -E-bull microd (1 ~ 2 J
where
p pile point contact pressure
E Youngs modulus
D diameter ot pile pointp ) = Poissons ratio
microd = depth factor
The range of validity of the pile point contact pressure
was determined in equation 151 Youngs modulus has an
important meaning lt can be determined from triaxial
tests or oedometer tests The relationship between the
constrained (oedometric) modulus Mo and Young s modulus
Eis dependent on Poissons ratio v as expressed by the
equation
E = l 1 + V ) ( 1 - 2 V ) Mo ( 1 bull 1 bull 1)- 1-v
39
TaKing into account the analyses made ny Chaplin (19b1a
1 961bJ Janbu (1 963 1970 1973J Andreassen (1973)
Duncan and Cheng (1970) Tejchman anct Gwizdala (1979)
Gwizdala (1978) Franke (1981) Berggren (1981) Withiam
and Kulhawy (7981) and the present investigation the
calculation of settlement is proposed to be
s = 24 bull p bull ~ D bull 1-v 2 bull micro d (154)Do o E
where s (r1)
p (kPa)
Dp (m)
E (kPa)
D0 =10 m
micro = 05 + 01 vfrac34E (1 5 5)d vs
but 05 lt microd lt 10-tip= p - (J (ovs see Fig 151)vs
E =Et= Kbullpat (Oo )n [1- Rf(1-sinltj) 101 - 03 ) 12 (1 5 6)2 c cosltP + 2o 3 sinltP 1Pat
in which K n and Rf= hyperbolic stress-strain parameters
Pa= atmosferic pressure ando 1 o 3 and o0 are determined by
averaging the concrete and soil vertical and radial stresses
near the pile point according to Fig 151 Then the
stresses at the pile point level are h
(J vs = L
0 Yi h
l vertical stress in the soil
0 hs Ko h
0 vs radial (horizontal) stress in the soil
0 vc L ye h -l
vertical stress in the concrete 0
0 hc K oc a vc radial (horizontal)
concrete stress in the
40
K at rest soil lateral stress coefficient 0
K c lateral stress coefficient for fluid fresh concrete0
K 1 0 oc
and average values
a 05(a +a)V vc vs
1 1 - shy~ = -(a +a+a I = -3 (av+2ahJ the applied mean normal stress0 j Z X y
Assuming this model calculation results for piles No 1-24
(see Tab 11~ as well) are shown in Tab 153
The piles are embedded mainly in medium sand to fine sand
For this kind of soil it can be assumed (soil parameters
from field or laboratory tests were inaccessible)
~ = 35deg c = 0 R~ = 09 n 05 v = 025 K c 10l 0
K = 04 Pat= 1UO kPa ye 24 kNrn 3 y = 14 kNm 3 bull0 C
Moreover in Tab 153 the following symbols are used
p(a1 ) - pile point contact pressure according to equation
1 bull 5 1
s(a1) - settl ement of pi l e point according to equation
143 and Tab 141
pound TT ( 2E = s bull Dp bull i 1-v ) according to equa~ion 152t
E~ Et bull microltl
EI
K = ro~ - according to equation 1 bull 5 6 p bullO middotA2
a~ o
E = E voD middot D middot ~4 ( 1 - v 2 ) according to equationt S p O 0
1 5 4
Et= E microd
K = according to equation 156 V PatmiddotaomiddotA2
41
The calculation results of Youngs modulus E = Et and
dimensionless canpressionrro1ulus for piles to 1-24 are shown
in Fig 152 to 155 using equation 152 and 15b
or equation 1~4 and 156 respectively lt can be obshy
served that the scatter in Fig 153 and Fig 155
where the influence of tne pile diameter is reduced
compare equation 154 is less than in the other figures
The reduced influence was made after observations from
field and laboratory tests while the equation 152 is
taken direct from theory of elasticity These values of
E and K are in good correlation with published values in
literature The values of Youngs modulus versus the
relative density of soil are compared to literature values
see Fig 15b Based on the analysis in this chapter it
can be assumed that
E = 9-ql 3 ( 1 bull 5 7)cp
where qcp is in accordance with equation 117
The calculation results based on this proposal are incluced
in Tab 1 5 3
The c a lculate d s e ttlements based on e q ua tion 154 and
157 are shown in column 23 and the values of the
correlation coef f icie nt (n= Seal ) in column 24 respectshyimeas
ively
The dimensionless canpression modulus can be d e termined as
K = 15Ubullq (qcp in MPa) (1 5 8)cp
see column 25 Tab 153
The calculation results based on the K compression modulus
according to equation 158 156 and 1 5 4 are shown in
columns 25 26 2 7 28 and 29 in Tab 153
42
For comparison and for determination of the range of
validity of this method the caLculation results of
pile point pressure for settlements s = 10 mm s = 20 mm
s = 30 mm (see Tab 141) according to equation 157
and 154 are shown in columns 30 to 35
The results obtained in Tab 153 confirm the possibility
to use the proposed method to calculate the initial part
of the pile point resistance settlement curve of large
diameter bored piles in non-cohesive soil and the initial
slope of this curve as well
A simple model has been proposed based on the theory of
elasticity ana the tangent modulus defined by Janbu (1963)
and Duncan amp Chang (1970)
A new approach according to the pile diameter depth factor
and principal stress is proposed
The settlement of the pile point can be made up to a point
pressure according to equation 151 on up to a settlement
of about s ~ 20 mm (30 mm)
-- The application of v Op in equation 1 5 4 a llows us ing
Youngs modulus as independent of the pile diameter
opposed to Bazants a nd Mosopusts (1981) proposal where
Youngs modulus wa s determined versus the pile diameter
The equation 1 5 6 takes into account the dependence of
Youngs modulus on depth (or overburden pressure) as
well
In the method field test (Cone Penetration Test) or
laboratory tests (hyperbolic stress-strain parameters
can be used
Comparison of the method to 24 availa ble load test r e sults
or large diameter bored piles in sand shows good a greement
to calculated and measured values
43
REFERE~CES
Adamczyk J (1978) Okreslanie udzwigu pali wierconych
za pomoca sondy statycznej (Bearing capacity of bored
piles based on the static sounding) Inz i Bud No 7
pp 253-257
Andreasson L (1973) The compressibility of cohesionless
soils Thesis Chalmers University of Technology
G6teborg (in Swedish)
Appendino M (1973) Comportamento di un palo di grande
diametro strumentato Rivista Italiano di Geotechnica
No 3 pp 115-118
Butterfield R Banerjee P (1971) A rigid disc embedded
in an elastic half space Geotechnical Engineering
Vol 2 pp 35-49
Bozant z Mosopust J (1981) Drilled pier design based
on load settlement curve X ICSMFE Stockholm Vol 2
pp 615-619
Begemann HK (1982) Cone penetration tests pile bearing
capacity and the thesis of Rollberg Proc of the Second
European Symposium on Penetration Testing Amsterdam
pp 433-438
Berggren B (1981) Bored piles on non-cohesive soils shy
settlement and bearing capacity (in Sweden) Thesis
Department of Geotechnical Engineering Chalmers
University of Technology G6teborg
Bergdahl UB (1979 1982) Sonderingen und in situ Messungen
Wien 18-19 Juni 1979 - Private information 19821983
Bustamante M Giane selli L(1982) Pile bearing capacity
prediction by means of static penetrometer CPT Proc
of the Second Europ Symp on PenTest Amsterdam
Vol 2 pp 493-500
Chaplin TK (1961a) An experimental study of the settleshy
ment of footings in sand PhD Thesis Univ of
Birmingham
44
Chaplin TK (1961b) Compressibility of sands and settleshy
ments of model footings and piles in sand 5th Int
Conf on Soil Mech a Found Engng Vol 2 p 33 Paris
Colombo P (1971) Observazoni sul comportamento ltli pali
a grande diametro Rivista Italiana di Geotechnika
No 3 pp 163-172
Dahlberg R (1975) Settlement characteristics of preconshy
solidated natural sands Swedish Council for Building
Research D11975
De Beer EE (1964) Some considerations concerning the
point bearing capacity of piles Proc Syrop Bearing
Capacity of Piles Boorkee I pp 178-204
Decourt L Quaresma AR (1978) Capacidade de Carga de
Carga de Estacas a partir de Valores de SPT VI Conshy
gresso Brasilerio de Mecanica dos Solos e Engenharia
de Fundacoes - Rio de Janerio - ABNS
Decourt L (1982) Prediction of the bearing capacity of
piles based exclusively on N values of the SPT Proc
of the Second Europ Syrop on Penetration Testing
Amsterdam Vol 1 pp 29-34
Duncan MJ Chang CV (1970) Non-linear analysis of stress
and strain in soils Journal Soil Mech Found Div Vol
96 SM5 pp 1629-1651
Durgunoglu HT (1979) Effect of foundation embedment on
stress and deformation distributions Third Int Conf
on Num Meth in Geomechanics Aachen pp 925-928
Farr JS Aurora RP (1981) Behaviour of an instrumented
pier in gravelly sand Proc of a session Drived Piers
and Caissons sponsored by the Geotech Eng Div of the
ASCE Nat Convention St Louis Missouri pp 53-65
Franke E (1981) Point pressure versus length and diameter
of piles X ICSMFE Stockholm Vol 2 pp 717-722
45
Gregersen os Aas G and Dibiagio E (1973) Load tests
on friction piles in loose sand Proc of the Eigth
International Conference on Soil Mech Moscow USSR
Vol 21 pp 109-117
Gwizda1a K (1978) Behaviour of large diameter bored piles
in non-cohesive soil (in Polish) Archiwum Hydrotechniki
Vol XXV No 2 pp 183-217 (English summary)
Huizinga TK (1951) Application of Results of Deep
Penetration Tests to Foundation Piles Building Research
Congress Vol 1 p 173
Janbu N (1963) Soil compressibility as determined by
oedometer and triaxial tests Proc Europ Conf Soil
Mech and Found Eng Vol 1 p 19 Vol 2 (Discussion)
p 17 Wiesbaden
Janbu N (1970) Grunlung i geoteknikk Tapir Forlag NTH
Trondheim
Janbu N Bjerrum L Kjaernsli B (1973) Soil Mechanics
applied to some engineering problems Norw Inst Publ
No 16 Oslo
Japanese Society SMFE (1981) Present state and future trend
of penetration testing in Japan Separate report at
X ICSMFE Stockholm
Kjekstad O Lunne T (1979) Soil parameters used for design
of gravity platforms in the north sea Second Int Conf
on Behaviour of Off-shore structures London Vol 1
pp 175-192
Klosinski B (1977) Bearing capacity of large diameter bored
piles IX ICSMFE Tokyo Vol 1 pp 609-612
Laboratory for soil mechanics Delft (1936) The predetershy
mination of the required and the prediction of the
resistance of piles Proc 1 Int Conf on Soil Mech
and Found Engng Cambridge (Mass) I p 181
46
Matich M and Stermac A (1971) Settlement performance of
the Burlington Bay Skyway Canadian Geotechnical Journal
Val 8 pp 252-271
Mccammon NR and Golder HQ (1970) Some loading tests
on long pipe piles Geotechnique London England
Val 20 pp 171-184
Meigh AC (1971) Some driving and loading tests on piles
in gravel and chalk Proc of the conference on beshy
haviour of piles London England pp 9-16
Mitchell JK Gardner WS (1976) In situ measurement
of volume change characteristics American Society of
Civil Engineers Specialty Conference on In-situ
Measurements of Soil Properties Raleigh 1975 Proc
Val II pp 279-345
Mezenbach E (1961) The determination of the permissible
pointload of piles by means of static penetration tests
Proc 5 Int Conf on Soil Mech and Found Engng
Paris II pp 99-104
Meyerhof CG (1956) Penetration tests and bearing capacity
of cohesionless soils Proc Amer Society of Civ Engng
SM 1 Pap 866 pp 1-19
Meyherhof GG (1 976) Bearing capacity and settlement of
pile foundations Proc Amer Society of Civ Engng
Journal Geotechnical Engineering Division Val 102
No GT3 pp 197-227
Mohan D Jain GS and Kumar V (196 3 ) Load bearing capacity
of piles Geotechn Val XIII pp 76-86
Nixon I (1982) Standard penetration test State of the
art report Proc of the Second Europ Symp on Pen
Test Amsterdam Val 1 pp 3-20
47
Nunes A Vargas M (1953) Computed bearing capacity of
piles in residual soil compared with laboratory and
load tests Proc of the Third International Conference
on Soil Mechanics Zlirich Switzerland Vol 2 pp 75-79
Nordal S Grande L Janbu N (1982) Prediction of offshy
shore pile behaviour The Norwegian Institute of
Technology Trondheim
Ohde J (1939) Zur Theorie der Druckverteilung im Baugrund
Der Bauingenieur Vol 20 No 3334 p 451
Parroth E (1972) Einfache Formel zur Vorausbestimmung der
Tragfahigkeit von Standpfahlen mit Hilfe der Sande
Bautechn 9 pp 312-314
Poulos HG Davis EH (1980) Pile foundation analysis
and design New York - J Wiley and sons
Prodinger W Veder Ch (1981) Bearing capacity of floating
groups of diaphragm walls Proc X ICSMFE Stockholm
Vol 2 pp 809-814
Promboon S Brenner R (1981) Large diameter bored piles
in Bangkok Clay Proc X ICSMFE Stockholm Vol 2 pp
815-818
Reese L (1978) Design and construction of drilled shafts
ASCE JSMFD Vol 104 No OT1 pp 95-116
Rodin s Corbett BO et al (1974) Penetration testing in
United Kingdom state-of-the-art-report Proc Europ
Symp on Penetration Testing 1 Stockholm pp 139-146
Rollberg D (1976) Bestimmung des verhaltens von Pfahlen
aus sandier und rammengebnissen Heft 4 FBG Technische
Hochschule Aachen
Rollberg D (1977) Determination of the bearing capacity
and pile driving resistance of piles using soundings
Publications of the Institute for Found Eng Soil Mech
Rock Mech and Water Ways Construction Aachen Vol 3
48
Schmertmann J (1970) Static cone to compute static
settlement over sand Journal of the Soil Mech and
Found Division ASCE SM3 pp 1011-1043
Schmertmann J Hartman JP Brown PR (1978) Improved
strain influence factor diagrams Journal of the Soil
Mech and Found Division ASCE GT8 pp 1131-1135
Shibata T Hijikuro K and Fominerga M (1973) Settlement
of a blast furnace foundation Proc of the Eighth Int
Conf on Soil Mech Moscow USSR Vol 13 pp 239-242
Spang J (1972) Die Bestimmung der Tragfahigkeit von Grossshy
borhpfahlen (I) Strassen und Tiefbau No 2 pp 339-355
Senneset K (1974) Penetration testing in Norway State-ofshy
the-art-report Proc Europ Symp on Penetration Testing
Stockholm I pp 85-95
Tejchman A Gwizdala K (1979) Analysis of safety factors
of bearing capacity for large diameter piles Proc VII
ECSMFE Brighton Vol 1 pp 293-296
Thorburn s and Mac Vicar R (1971) Pile load tests to
f a ilure in the clyde alluvium Proc of the conference
on behaviour of pile s London England pp 1-7
Trof imenkov JG (1969) Accuracy of determining the bearing
capacity of piles based on results of static penetration
sounding of soils Osnovaniya Fundamenty i Mekhanika
Gruntov 4 (Translation Soil Mechanics and Foundation
Engineering 4 p 248)
Trofimenkov JG (1974) Penetration testing in USSR Stateshy
of-the-art report Proc Europ Symp on Penetration
Testing Stockholm I pp 147-154
Tuoma F and Reese L (1974) Behaviour of bored piles in
sand JSMFD ASCE Vol 100 No GT 7 Proc Paper 10651
July pp 749-761
49
Van der Veen C (1953) The bearing capacity of a pile
Proc 3 Int Conf on Soil Mech and Found Engng
Zlirich II pp 84-90
Van der Veen C and Boersma L (1957) The bearing capacity
of a pile predetermined by a cone penetration test
Proc 4 Int Conf on Soil Mech and Found Engng
London II pp 72-75
Weltrnan AJ Healy PR (1978) Piling in boulder clay
and other glacial tills Construction Industry Research
and Information Association UK-Report PG 5
Withiam J Kulhawy F (1981) Analysis prodecure for
drilled shaft uplift capacity Proc of a session
Drilled piers and caissons ASCE St Louis Missouri
pp 82-97
Woodward R Lundgren R Boitano J (1961) Pile loading
tests in stiff clays Proc of the Fifth International
Conference on Soil Mechanics Paris France Vol 2
pp 177-184
Wright SJ Reese LC (1979) Design of large diameter
bored piles Ground Engineering Vol 12 No 8 pp
17-22
DIN 4014 Cods Teil 2 (1977) Bohrpfahle Grossbohrpfahle
Herstellung Bemessung und zulassige Belastung
Polish Specification (1975) Specification for design and
construction of large diameter bored piles in bridges
Ministry of Transport Warsaw (in Polish)
Polish Specification (1979) Specification for prevision
bearing capacity of the piles on the presiometer test
and static sounding ENERGOPOL Warsaw (In Polish)
Polish Code (1983) Foundations Bearing capacity of piles
and pile foundations
5 1
FIGURES
bull bull
53
Ou
+ sect raquo iir 1
4 + D
h + +Osu
bull + t2 =n- Dp
LDpl r f 1
Opu
Fig 1 1 1 Bearing pi le in the soil
J_
fp
080
070
060
050
0 40
030
020
010
q~ [MPa ]000 -+--~-~-~-~------------------------=-shy
00 20 4fJ 60 80 10 0 120 14fJ 160 180 200
Fig 1 1 2 The point resistance factor fp
(Trofimenkov 1974)
54
ts
160
140
120
100
080
060
040
020
q~5 [ kPa)
0Q0--1------~-~-~-~-~-~ - - ---=- -- shy000 10 20 30 40 50 60 70 80 90 100
Fig 1 1 3 The shaft resistance factor fs middot (TYofimenkov 1974)
f s
200
180
160
140
120
100 2 3 4 5 6 7 8 9
Fig 1 1 4 Shaft friction factor f depenshys
ding of the soil density (Senneset 1974)
55
Q~ [kN]
1500
1000
500
0-r-----------r----~- Q~ [kN] 0 500 1000 1500
Fig 1 1 5 Comparison of the pile resisshytance determined by the results of static sounding and load tests (TYofimenkov 1974)
D f f
0
Fig 1 16 Equivalent cone resisshytance (Bustamante 1982)
56
E u shy0 ~
QI I ltII ltII
~ a C QI
O C
D
w gt
0
Cone res istance Point resistance
80 160 240 320
05
10
15
e d
20
ver y dense Cone resistance 300 kgcm2
Dpcm
a =45 b = 30 C 60 d = 100 e = 150
Fig 1 16a
Cone resistance _ qc
80 160 80 160 qc [ k g cm2 ]p
05
10 10
15 15 e d a
e d20
Dense Medium2 2200 kgcm 100 kgcm
Cone resistance and point resistance of piles versus overburden pressure (Kerisel 1965)
Point resi stance - p(for s=2cm) of the pi le for
15 sett Iement s = 2 cm
10
5
E u
uJ1 o-~----shya er O 804 2500
32 56
I 1
L oose50 -I =25 Very loose L
----~--shy5000 7500 80 98
~-----lmiddotI1--------2 10000 12500 31400 =Flcn)
112 123 200 =Dplcm)
Fig 1 1 6b Point resistance versus cone resistance and pile diameter (Franke 193)
57
1
fp
080 (D Gravel
0 Coarse sand Medium sand 070
reg Fine sond Silty sand
060
050
040
030
020
010
qc [MPa]000-+----r--~-~-~--------r----r----r-~-~-- -shy
oo 20 40 60 80 100 120 140 160 180 200
Fig 1 1 7 Point resistance factor f (proposal) p
58
300
250
200
150
100
qc [MPa I50-+---------------r---r---r---r----r------------- shy
oo 20 40 60 80 100 120 140 160 180 200
Fig 1 1 8 Shaft resistance factor fs (pr oposal)
59
Bustamante (seetab 115 I
l fp
G)
0 Gravel
Coarse sand Medium sand
cl
b)
t-----l
1----1
080 reg Fine sand Silty sand a) D
070 Polish
060 Specification
( 1979) 050
040
030 CD 020 0
reg 010
qc [MPa]0 00 -+-------------------------------------=--shy
oo 20 4o 5o 80 100 120 14o 15o 180 200
Fig 1 19 Point resistance factor f comparisonp
Bustamente ( see tab 116 I 300
a) ~
250 b)~
cl~
200 Polish Specification ( 1979 l
150
100
q [ MPa]504---~--~--~----- ---___
00 20 40 60 80 100 120 140 150 180 200
Fig 1 1 10 Shaft resistance factor fs comparison
60
1 fp
~
080 CD CD Gravel
070 0 reg Coarse sand Medium sand
060 0 Q) Fine sand Silty sand
05
040 Franke (1973)___
030 DIN 4014
020 Part 2 1977
( see tab113 l 0shy
--shy --a - 010 C---0 Piles without enlarged bases
D---0 Piles with enlarged bases qc [MPa ] 000
00 20 4JJ 60 80 90 100 120 140 160 200
Fig 11 11 Point resistance factor f comparison p
fs
DIN 4014 Part 2 1977 ( see tab 114 l
300
~ 5 lt qc lt 10 MPa 50
~ 10 lt qclt 15 MPa
~qcgt15MPa
200
150
CD
100 0 0
qc [ 1Pa] 50-t-----T-~----T-r-~----------------shy
OO 20 40 6JJ 80 100 120 14JJ 160 180 200
Fig 1 1 12 Shaft resistance factor fs comparison
61
Measured p [ MPa]
( s=010 Dp) 10
9
8
7
6
5 0
4 0 61
3
I 2
Calculated qcp [MPa]
0 0 2 3 4 5 6 7 8 9 10
Fig 1 1 13 Comparison of experimental and aomputed values of the pile point resistanae
62
Contact pressure ( MPa ]
2 I 6
50
100
E E 150 Ill
c QI
E Sett lement for QI
calculated qcpai V) 200
Fig 1114 Results from load tests on piles No 1 and 5
Contact pressure [ MPa I 0 2 I 6
01---------------------1
50
E E 100 Ill
Settlement forc QI calculated qcp E ~ ai
I V) 150
Fig 1 1 15 Results from load test on piles No 7 and 5
63
Contact pressure p [ MPa] 0 2 3 4 6
0-t=-----~-~-----
E E
100 1)
c CU E 2 QI V) 150
Fig 1 1 16 Results from load test on piles No 9 10 and 11
Contact pressured p [MPa] 0 1 2 3 4 5
o~~~=------------___-~-shy
50
100
E E
i 150
CU E CU
-a V) 200 2
Fig 1 1 17 Results from load test on piles No 12 and 13
c
-------------- -
64
Contact pressured
0 1 2 3 4 p [ MPo] ~o __L____1_____J_____L___
50
100
150
E
E
IJ) 200
c a
E a
~ 250
Fig 1 1 18 Results f Pom load tests on piles No 2 4 6 and 8
p [MPa]
60
50
tO
30
~
Pile Pile Pile Pile
Pile No18
------+ Pile No17 + ~_ ---0 Pile No 19
bullbull - --bull Pile No 20
- ~middot -shy-shy -(y I Settlement for
20 tO 60
No17 +-middotmiddot- V 70 No 18 bull--- V 9o No19-middot- V 120 No20bull---- V150
qcp 3
80 100 120 140 160 s (mm)
Bose resistance
Fig 1 1 lBa Point Pesistance vePsus settlement (Spang 1972J
65 Cone resistance qc [ MPa]
0 10 20 30
mud
5 ~ lll
0 c 0
c CD
peat
10 sand
Ill N
10=10
D=lOOOmm
1540=40
20__________________
[ml
Fig 1 119 Pile No 1 and results from static cone penetration test
Cone resistance qc [MPa l 0 10 20 30
7N V degW = 0+--------------------i
mud
5
lll
~ C 0
c peat~
10
sand lll N 1D15
15l lD=1500mm
40=60
20l---------=-------__J
[ml
Fig 1 1 20 Pile No 3 and results from static cone penetration test
66 Cone resistance qc [MPa]
10 20 II 3 igt pound ~
mud+peat
fine sand+ silt
50=11
l lo-11oomm
40= 44
10
15l____________c
[ml
Fig 1 1 21 Pile No 5 and results from static cone penetration test
Section Cone resistance Pile
0 0
5 10 15 20 25 30 qc [MPa] -----~-~shy~
Silt
[7r_ ___~ Medium Sand_~-----l
0 ltD
+shy4
0=11
9=
Fine sand + Silt t
30p=
middotmiddotmiddotmiddotmiddotmiddotmiddotmiddot1~11+-----E-----
[ml
Fig 1 1 22 Pile No 6 and results from static cone penetration test
Cone resistance qcmiddot 1MPuJ
0 10 20 30 67 01-+-------l--------------i
mud+ peat
fine sand
l1)
N
40=60
15L_____________
[ml Fig 1 1 23 PiZe No 7 and resuZts from static
cone penetr ation test
Section Cone resistance Pi le
0 5 10 15 20 25 30 qc [MPa 1 --~----Y-~-----~
Silt
Fine sand
Medium Sand Bentonite2----1~i
t 3
4
0
0=15
Fine iii ~~= 5
sand t ltD
6 +
Silt 7
3Dp=
63 g
10
11
12
13+------=~---l
[ml
Fig 1 1 24 PiZe No 8 and resuZts f rom static cone penetration test
68
I =3
Cone resistance qc [MPa]
0 10 20 30
C 0 C Cl
(I)
Said
Peat
Sand
l 0=110
D = 11
4 D = 44
Fig 1 125 Pile No 9 and results form static cone penetration test
69
Cone resistance qc[MPa)
0 10 20 30 I ~ II JE Ill= II=E IS
Fine sand QI
U) I
[- I C 0 + C Peat QI
CD
Fine sand 0
Ci D = 1 1
L l D= 110
4D= 4 4
Fig 1 1 25 Pile No 10 and results f rom static cone penetr ation test
70
Cone resistance 9c[MPa]
0 10 20 30
Sand
C 0 Mud peat
+shyc 5 ltII
co
Sand Op= 11
u 10 D= 110 4Dp=44
Fig 1 1 26 Pile No 11 and results foIm static cone penetration test
71
00 a_ N ~
middotu rr QI 0 u ~ C 0
QI ui C iij 0 QI U - 0
0 EN
d 2
Sll 1lOl
C
u (rr
C 0 u~
0
QI - C middot 0 C
U - O 0 EN
~ 0 2
E
ltD a---==-lr---___--~---6-l_-0_012 ~ Lr- - --1---------J J
S9l ls= apound QI -0 gtcc _gmiddot- 0 1) ui I
Fi g 1 1 2 Piles No 14 and 15 and results f r om stat i c cone penetr ation tests
72
Contact pressure p [ MPa] 2 4 6
01lt---------------~
50
E E
111 100 ~ (qcp=30 MPa for No16
~ iqcp =49 MPa for No14
~ 1so~--~~- _ _ __
I _ _
11 I lf--q = 32 MPa for No15
cp
Fig 1 1 28 Results f r om load tests on piles No 14 15 and 16
73
0300--------------~---~--~--shyE
Driven piles in ~ 0 bull Gravel
amp250 bull Sand L QJ X Silt a 1l o Bored piles in
sand -sect 200 0=-- shyC ~ ~ 10 unless ~~ middot D shown 1
ii O
~ ~ o 3 a 1501-----+-------I- --+---laquo-+-- -+------lt
~ sect 5 - 6 6middot 100t----+----+-----_-1---4--__co_--J~__j
-_
~ 0 t7
C
a 50 2 shyg ~ gt
0 20 30 40 50 60
Standard penetration resistanceN in blows per foot
(N 30
Fig 12 1 Emperical relation between ultimate point resistance of piles and standard penetrashytion test in cohesionless soil (Meyerhof 1976)
14 r-------------------r-------b-----q
References and symbols given in Fig121
121-----+---+----+----+------ll------j
- _sect ~ 10t----+----+-_--1-----+---lt~--~H---- 0 lt-~5- _-)0 I() l- I Q---+-----I[08 ~
H -(l () ltj-~C X bulls pound 061------lt----+-----i~- --+-- shy
- bull
-gt Q1pound--I---L---L---L---L--~ 0 10 20 30 40 50 60
Mean standard penetration resistance N in blows per foot ( N30 l
Fig 122 Empirical relation between ultimate skin friction of piles and standard penetration resistance in cohesionless soil (Meyerhof 1976)
74
a) b)0(1 0lt2
10 10
05 05
1 N30OD-+---------__ OD--t-----r-----r----------------ll--Nbull30~ 10 20 30 10 20 30 40 50
Fig 1 2 3 Reduction coefficient a) for impermeable gravels b) form permeablr gravels (Weltman and Healy 1978)
psf [MPo)
Fig 1 2 4 Relation between ultimate point resistance and SPT in cohesionless soil (Polish specification 1975)
75
30 35 40 45 Loo Med Dense Ver dense
50
40
~ E
l)
g 8 1)
middotu
1 ~
QI- bull Touma ~ bull Koizumi
(183)-depth base middotameter5
20 40 60 00 100 N30
30 35 40 45
OG2(294) bull G1 (183)
300 bull us 59 ( 102) bull 88(180)
bull 075 a GT (467)
150
~ 200-+--------+-- t--- --t-----i 130i 0 094 081
014 _- --- -- shy~ E 066bull bull 063 Note -~ ~m~r~s~ ~ 1001---1-r--t---1point is xh QI Ratio ~ Number in ( ) middotn key is h c Ratio s ~
0 20 40 60 00 100
~ig 1 2 5 Ultimate point and shaft resistance versus N30
(Wr ight and Reese 1979)
-----
76
tu Psa
[kPa] [MPa]
200 tu
------ shy150 Psa
1 1
1100 10 1 1
1 50
0+----------T----~---~-N-3J~shy0 20 40 60 80
Relation between ultimate skin friction and SPT (Decourt 1982)
Fig 1 2 6
Psa
[MPa]
8
0----Meyerhof 1976) 0 7
--- - --~ - copy Polish Specifcoti on 1975)6 ~-
~
reg- middot - Reese (1978) middot 5
f41- -- Decourt (1982) -I bull 4 2
----==---______z__ h25m Dp=12m
3 ---shybull
2 7
--shy ----shy~----shy0-t----i----------r-- ----------------------N3l~shy
0 10 20 30 40 so 60 70
Fig 1 2 7 Relation between ultimate point re~istance of large diameter piles and standard peneshytration test (SPT) in cohesionless soil
------
77
tu [kPa)
200 17 Cast under -J bentonite
~----Meyerhof (1976) ~copy -=middotmiddotmiddotmiddot== middotmiddot150 ~------- Wei tman (1978 ) middot Healy middotmiddot ___ Japanese ) 119810 Society
(0 -middotmiddot- Decourt (1982)middot Wright
100
- -middotmiddot -- 11979]reg Reesemiddot Bored piles
~shy50 1 -- shy
-- shy middotmiddot s-shy - --~ ------reg~~ ---~E_==---- ------- shy
N_ ---shy0-+--C--------------r---- ---------~---~-~shyo 10 20 30 40 50 60 70
Fig 12 8 Relation between ultimate skin friction of piles and standard penetration test (SPT)
78
Pst [MPa]
8
7 ---------ist=7MPa
6
5
4
3
2
I N30o~------------------------------+---------__=-shyo 10 20 30 40 50 60 70
Fig 12 9 Relation between ultimate point resistance of large diamter piles and standard peneshytration test (SPT) in cohesionless soil (proposal)
tu [MPa ]
( excavanted and cast
150 under bentonite ) tu=150 kPa
100 tu=90 kPa
I I
50 I I I I I N30
10 20 30 40 50 60 70
Fig 1 2 10 Relation between ultimate skin friction of large diameter piles and standard penetrashytion test (SPT) in sand (proposal)
79
2 3 4 5 p[MPa] 0 2 3 4 5 p[MPa]0
40 40 Cl
80 c 80
c 120 120
Pile No 1 PileNo216 160
200 2
s s c [mm] (mm]
0 2 3 4 5 p[MPa] 0 2 3 4 5 p [MPa]
40 40
00 80
120 120
16 160 Pile No 3 Pile No 4
200 200
s s [mm] (mm]
0 2 3 4 5 p[MPa] 0 2 3 4 5 p [MAJ]
tgt11 tgt- measured40 40
80 80
120 120
Pile No 5 Pile No 6 160 160
20 200 s s
[mm) [mm)
Fig 1 4 1 Base resistance vs settlement appoximative method piZe No 1- 6
80
0 2 3 6 5 p[MPa) 0 2 3 4 5 p[MPa]
40 40
80 80 6
120 120 6
6160 160
Pi le No 7 Pile No 8 6
200 3J s s
[mm] (mm]
0 2 3 4 5 4 p [ MPo)
6 6 40
6 6
6 80
6 6
6
Pi le No 9 Pile No 10
XJO s s
[mm] [mm]
0 2 3 4 5 p[MPa] 0 2 3 4 5 p [MPa)
6 6
40 40 6 6
6
00 80 6
6
12 1Xl 6
160 Pile No 11 160 Pile No 12
200 200 s s
[mm ] [mm]
Fig 1 4 2 Base resistance vs settlement approximative method pile No - 12
81
0 2 3 4 5 p[MPa] 0 2 3 4 5 p [MPa]
6 6
40 6 40 6
6
80 6 80 6
120 6 120
Pile No 13 Pile No 141fO 160
200 200 s s
[mm] [mm]
0 2 3 4 5 p [MPa) 0 2 3 4 5 p [MPa)
40 40
80 80
120 120
HiO 160
200 200Pile No 15 Pile No 16
s s (mm) [rrrn 1
0 2 3 4 5 p[MPa] 0 2 3 4 5 p[MPa)
40 40 A A A-measured
680 80 t t
120 c 120 c
1fil Pi le No 17 160 Pile No 18
200 200 s s
[mm] [mm]
Fig 1 4 3 Base r esistance vs settlement approximative method pile No 13- 18
82
0 2 3 4 5 p[MPal 0 2 3 4 5 p (MPa]
D D40 40 c c
80 c 80 c
120 120
160 160
Pile No 19 Pile No 20 200 200
~ml (mm]
Fig 1 4 4 Base resistance vs settlement approximative method pile No 19- 20
LlJ QI
0 average lJ = 098 E sd = 029 C
6 SY = 030
4
2
lJ calculated ________________________ _______ measu red
06 08 10 12 14 16
Fig 1 4 5 Calculated pressure divided by the measured pressure at 20 mn settlement for aZZowabZe
q Zoad Pa= ~p approximative method pile
No 1- 20
8 3
Point resistance p [ MPaJ
a)
p(s) = s a +--sshy1 y qcp
1
SQ100p -- --- ---shy
~ s
[mml
I- 01 s rmm]-l p LMPa b)
f~]
c Cll E ~ i s
[mm)
Fig 146 Definition of the point resistance - settlement curve according to the modified hyperbolic method
84
01 ~ 0
20 0 0
0
16 0
medium 0 value a1 = 905-+ 256 Op 0 0
12 (r=039)
0 0
----0 0
8 0
0 0
0 0
4 0
05 06 07 08 09 10 11 12 f3 14 15 16 17 18 19 20 2 1 Op (ml
Fig 1 4 Initial slope of the base resistance curve vs pile diameter
a1 [p] 0
0020
16 assumed a 1= 28 - 4 qcp
12 0
0 Ct) 0 a = 2659 - 369 qcp8 1
0 0 (r = 0188)0
4
2 3 4 5 (MPa]qcp
Fig 1 4 8 Initial slope of the point resistance curve vs ultimate point resistance on the static cone resistance for pile tests No 1 20
85
a [~ 28
24
20
16
12
8
4
0 2 3 4 5 6 Qcp [MPa]
~ Kiosinski (1977) sand and sandy gravel of mediwn density
~ Klosinski (1977) loose sand ID= 0 3 0 4
o US59 ] t HH Touma p and Reese L (1974) fine sand and silty sand OGl (US59 HH BB - very dense Cl - mediwn dense) 1 BB
DIN 4014 Part 2 (1977)
Fig 1 4 9 Initial s lope of the point res istance curve vs ultimate point resis tance
86
assumed [il =30 -10 Op but )1~ 10 )1 [1 I
u 311-10 Op ( r =0 368)4 1 0
3 0 0
02 0
0 0co 0 8 0 0
0
0
05 06 07 08 09 10 11 12 13 14 15 16 17 19 20 21 Dp [ ml
Fig 14 10 Correction factor for hyperbolic base resistance shysettlement relationship
87
a [~] 28
24
20
16
12
8
4
2 3 4 5 qcp [ MPa]
Fig 14 11 Initial slope of the base resistance curve vs ultimate base resistance (proposal)
v [ 1 ]
3
2 -----G- DP J l 1J I Op lm] J
for Dp ~ 2 0 m ~ u = 1 01
0 --------r----r---r----r-----------------r-------------------------r------r-~-~--shy
05 06 07 08 09 10 11 12 13 14 15 16 17 18 19 20 21 Dp[m)
Fig 1 4 12 Correction facto r for hyperbolic base resisshytance - settlement relationship (proposal)
s P ( s)
s +
u qcp
88
a) b)1
bt=o212= 47 MPa a1=1~32 tMWJ s 2 3 4 5 O 1 10 20 30 40 50 60 p [~a]0
0p [ MPa] 40 40
80 80
120 ~
160 b1 = ~ajtg ~= 0 212
~=1132 + 0212middot s
mJ 240 r=0994t t t measured s __ according to Jl s
o o o according to p (bull ll l[mm] [mm]
Pile No 2
slmm) 10 20 30 40 50 60 80 100 125 150 175 2)0 225 Note
p [ MPa] 09 14 17 20 22 24 27 30 32 34 36 38 39
measured
pibull) [ MPa] 074 128 169 202 228 249 282 307 330 347 360 371 380calculated
plbullbull1[MPal 070 125 168 203 233 257 297 327 356 378 396 410 422calculated
1) (bull) ij l099082 091 099 101 104 104 104 102 103 102 100 098 097 sd = 006
ij (HJ1041) (bull10) 078 089 099 102 106 107 110 109 111 111 110 10B 10B sd = 010
plbulll-according to a =1132 [ Jp(s) = s s for pile No21 0 1132 12 39
plbullbulll-according toa =1241 lmiddotGcp=39MPa1 0
~=14 see fig 1411 and fig 14 12 sp(S)=
124+ _ s_ 14middot39
11lbulll11l-J - correlation coefficient calculat~d P5 for
measure p s p(bull) and p(bull) respectively
Fig 1 41 3 Modified hyperboZic point resistance - settZement reZationship for piZe No 2
89
0 2 3 4 5 p(MA1] 0 2 3 4 5 p[MPa)
40 40
80 A 80 A
120 120
160 16 Pile No 1 Pile No 2
20 200 s s
[mm] rnm
0 2 3 4 5 0 2 3 4 5p [MPa] p [MPo]
40 40
80 80
120 1ZJ
lfpound) Pi le No 3 Pile No 4 A
200 A
s s A
[mm) [mm
0 2 3 4 5 p [MPa] 0 2 3 4 5 p [MPa]
40 40 A A A measured ~ calculated
80 80
12
160 160 Pi le No 5 Pile No 6
200 Z)Q
Fig 1 4 14 l3ase resmiddotistance vs settlement pr oposed method pile No 1- 6
90
2 3 4 5 p [MPa] 2 3 4 5 p [ MPa]
40 6
6 40
1 80 80
6
120 120 6
6 160 160
Pile No 7 6
200 200 s
[mm ] s
[mm]
0 2 3 4 5 6 p [MR] 0 2 3 4 5 p [MPa] 0 0
40 40 6
6
80 80
6
120 120
160 160 Pile No9 Pile No 10
200 200
s [mm] [msml I
0 2 3 4 5 6p[MR] 0 2 3 4 5 p [MPa]04--___ ____ ___ ___ ____
0+-=---------------~-~- shy
40 40 c 6 c - measured
0--0-0 shy calculated
80 80
120 120
160 160 Pile No11 Pi le No12
200 200
s [mm]
s [mm]
Fig 1415 Base resistance vs settlement proposed method pile No 7-12
91
0 2 3 4 5 p [MPal 0 2 3 4 5 p [MPa)
40 40
80 80
120
16 Pile No 13 Pile No 14
200 s
tnml [mm]
0 2 3 4 5 p [ MPa] 0 2 3 4 5 p [MPa)
40 40
80 80
120 120
160 1fD
Pi le No 15200 axJ s s
[mm] [mm]
0 2 3 4 5 p[MPa] 0 2 3 4 5 6 plMPa ]
A A A measured40 0---0-0 calculated
80
120 120
160 1ED Pile No 17 Pi le No 18
200 200
s s [mm] [mm]
Fig 1 4 16 Base resistance vs settlement proposed method pile No 13- 18
92
0 2 3 4 5 p [MFb] 0 2 3 4 5 p[MPa]
0 6 o -measured40 40 0 0 o -calculated
80 80
120 120
160 160 Pile No 19 Pile No 20
200 200 s s
[mm] [mnil
Fig 1 4 17 Base resistance vs settlement proposed method pile No 19-20
p(s~Psf
15 20
ean
-C 5 w u L Lower ~ confidence
linea 0
a IJl 10
o---o proposed
method I I I
15
Fig 1 4 17a Design curves for estimating developed base resistance in sand (Wr ight and Reese 1979)
93
n (number)
30
28
26
24
22
20
18
16
14
12
10
8
6
4
2
0 02 04
Fig 1 4 18
I= 126
Between 1] = 0 7 - 1 3--- I= 106 ( 84 frac34)
Average ~ = 098 Standard sd =023 deviation
Standard sv =023 veriation
1] (Coefficient Calculated Measured
06 08 10 12 14 16 18
Calculated pressur e divided by the measured pr essure for all pressure - settlement curves pr oposed method pile No 1- 20
94
a) b) Total load
Total load curve
---- _____-- shy- -- -Base load ~- Base load
-0-0 ~
00 00 J
ldeoli zed shaft load J
Shaft sesistanc1---------- 0=0middot30 a= 0 middot 30
025 Settlement IN 025 Settlement IN
Fig 1 419 Proposed method of synthesizing design loadsettlement curve (a) conservative design prodiction b) design prediction- peak in shaft loadsettlement curve (Burland et al 1966)
Cf
-0 0 0
J
0
~-----~--~-~ amp- 2 3 4 5 6 (cm)
a~middotltii -0 lt) cco2 41 -~ -0 1)
vi ~ llloli=----------- ---c~0 1 2 3 4 5 6 7 ( of diameter)1 1 1 1
05 10 15 20 ( in) for 30 in Pile Movemen~ ( 75cm pile)
Fig 1 4 20 Approximate load settlement curves for 30 in bored piles (AB and C represent failure load at 1 in settlement A B and C represent ultimate failure load) (Touma and Reese 194)
95
Load in MN 0 2 3 4 5
25
50E E C
-C 75
-~ ~
-Z 100 lJ
Shaft resistshy
125 once
15 Fig 1 4 21 Load-settlement relationships for largeshydiameter bored piles in stiff clay (Tomlinson 1977)
SettlementSo
Fig 1 4 22 Diagrams of s1iaft and base resistances versus settleshyment assumed in analysis (Kiosinski 1977)
96
0 0 1 ~ r- 025g ~~ 2
1- -shy3 03Sg 14 5 2
Qls =Qpls+Q5 (sQpls) Qs(s-3E
0
degsis __ -- Qpls) a~ C
4
t Sg l
5 Qu Is)
Q(s)in MN-l T
Ouls Q Is) in MN ---
Fig 1 4 23 Construction of load - settlement curves a) for sand b) for cohesive soil (DIN 4014 Part 2 1977 and Franke 1981)
-
s C 5C
Cl
3 0 00 05 10 15 20 Mean settlement I in)
Fig 1 4 24 Load- settlement curves for test shaft S4 (1 in = 25 4 mm 1 ton= 8 90 kN) (Reese 1978)
97
Relative side resistance
0 05 10 15 20 0E=--t----+---+--~
c QI lt) ~ 2 C
I itaker c
QI amp Cooke3E QI-j
c-en 4
C QI
E us 59o
5 QI gt
SA0 w 0 6
Fig 1425a Relative side resistance for clay vesus relative midlength settlement (Reese 1978)
degs (Osl u l t 0 05 10 15 2 0
Mean
2 Lower ~ C QI u
confidence line
~ 3 a
0
~4 E
()
5
6 __ _ ______ ________ __1
Fig 1 4 25b Design curves for esti mating developed side resistance (~Jy1nht ReertP- 1987 J
98 Load Q
8 - 15 mm
1- 2 of p ile diameter
100-200 10-15 of pile Os Ot diameter Shaft Total
Settlement S Resistshy Resist- Load ance once
Fig 1426 Dependence of total load base resistance and shaft resistance on settlement of lar-ge diameter pile (Tejchman Gwizdala 1979)
6
5 Shaft load
4
3
2
z ~
-0
g Pile EF- 56 J 0
0 0 20 30 Butt settlement (mm)
Fig 1 4 27 Deveiopment of shaft and base resistance with settiement (Promboon Brenner 1981)
99
0 1000 2000 3000 4000 5000 6000 7000 8000 9000 0 r-=-1---J__-----------------------~----_shy
Load [ k N l5
10
20
( I
Skin friction ----1 I I
~ 40 QI E
fQI
50 I
Q) I () ICOntinuos fost deolading
Fig 1428 Load-Settlement-Diagram Testelement III (Diaphragm-Wall 0515 m 244 m deep) Portion of Skin Friction and Base Resistance (Prodinger Veder 1981)
Qs (QJ max
0 05 10
Upper Limit of Data
Farr and Aurora (1981J C
~ 2 - shy -+shy - Mean of Data
I QI
Lower Limit of Data a
0 - 3 E
Vl
4
Smid = Approximate shaft buff movement ignoring the elastic compression of upper halt of the shaft
D = Shaft diameter
Q Mobi Ii zed shaft resistance
Qs1max = Maximum shaft resistance
Fig 1 4 29 Relative shaft resistance vs relative movement (Farr and Aurora 1981)
100 Load Q (s) [ MN]
Su5 s s 20 mm for non- cohesive soil u
s s 10 mm f or cohesive soil u
s s 15 mm for claysand u
Q (s) + Q (s)s p
Qs(s)
-C ltII E s ~- [mm]-ltII IJ)
Fig 1 430 Dependence of total load Q(s) point res i stance Q (s) and shaft resistance Q (s) versus settlement p s
~ 3 Usu Qpu Qu Q(s) [ MN]
Sus= 20
1J
60
80
100
120
degs (s ) 140
5 P=Ol Op
1EO
C -ltII E 180 ~ ] 200
s [mm]
Approximative dependence of total load point resistance and shaft resistance versus settlement fny non-cohesive soil
Fig 1 4 31
101
113 3 ~fic0P Ye hY
1 Ground water
D
I y
yh C
Fig 1 5 1 Determination of 01 and 03 for settlement analysis of lar ge diameter bored piles
102
I
E=Et [MPa]
160 0
140
120 0
100
80
6
40
--- --shy 0
0
8 0
0
0
20
2 3 4
I 0 15
Fig 1 5 2
E = Et [MPa]
120
100
80
60
40
I I 0 35 065 085
0
Et= 17 81 qcp0844
( r = 0 128)
5
100
6 qcplMPo]
Calculated values of Young s modulus for piles No 1shy24 according to equation 1 5 2 and 1 56
0
0 0
E =898qcp127 (r= 0314)
E = 9 middot qcp 13 0
20 shy 0
0 0
0 1 2
loJ
I 0 35
3 I
065
4
I 085
5
100
6 qcp [MPo]
Fig 1 5 3 Calculated valueBof Young s modulus for piles No 1shy24 according to equation 1 5 4 and 1 5 6
I K 10 3
( 1 ] 1832
1400 0
1200 0
0
1000 0
800 0
m=2821 qcp0621
600 0
(r=0057)
400 0 0 0 0 0
200
2 3 4 5 6 qcp (MPa]
I 035
I 065
I 085 100 Io
Fig 15 4 Calculated valuesof the dimensionless compress ion modulus K for piles No 1- 24 according to equation 1 5 2 and 1 56
K ( 1 ]
0
1400
1200 0 0
1000
800
600
0
0 0
0
0 0
0 K= 1422 qcpl05
(r=0181)
0 K= 150 qcp
400 0
3)0 0 0
2 3 4 5 6 qcp(MPa)
I I -J 035 065 085 100 Io
Fig 1 5 5 Calculated values of the dimensionless compression modulus K for pile~ No 1-24 according to equation 1 5 2 and 1 5 6
104
120
100
2 3 4 5
I I I rv 0 15 035 065 085 100 lo
Bergdahl (1982) for shallow foundation
o----o Bozant Masopust (1981) D= 1 0 rn h=10 rn large diameter bored piles in noncohesive so il
0----0 Proposal according to current anal ysis
Klosinski (1977) D=090 to 125 rn large diameter bored piles in sand and sandy grave l
Mitchell Gardner (1976) very dense sand E=(35)q (it depends on sand density and stress history) c
Fig 1 5 6 Composision of Young s moduius
105
TABLES
0 Tab 1 11 Methods for detemination of the bearing capacity of bored piles (Ro llberg 1977)
Cl
Nol -- I Soil Areas of Q) Q) Editor Determination of Coefficients 5 type influenceqP qs p ~ C C 11 12 fP I fs
1 all Lab f Soil Mech (1936) l qp at the elevashy 1 0
2 all Huizinga (1951) ~ t~on of the pile 14 point
3 all Van der Veen (1953) ) 18 1 h+l14 all Van der Veen 1 0 Dpl375 D~ 15-- J qcmiddotdhBoersma (1957)
~ 11 +12 h - 12
5 12 all Menzenbach ( 1961) qc at the elevashy~ tion of pile point
6 18 all Mohan Jain Kuman (1963)1 average of qc over 1 h Q) h ~qcmiddotdhl 10 Dpj 3 75 Dj 15 50_micro
and 1 2C 11
7 I amp all de Beer ( 1964) graphically from 10 Q) qc 0 1 h+l18 u C
sand Soviet norm SNIP II 9ct9cp I4 bull O Dp I10 DP l66-1 083shyu clay B5- 67 Trofimenkov (1969) 2 50 1 251 +l J qc middotdh micro middot h middot-l l 2h-~ _micro
9 _micro u all Paproth (1972) at the elevation 3 5 I shy
) of pile point (Dpgt0 5 m 7 D8DpE
E-lt p 1 h+l1 1 h Dplt 5 m u l+l J qcmiddotdh h f qcmiddotd~ 30 Dpl 50 Dp 2 0 100shy10 sand Norwegian method
0l 2 h-12 200Senneseth (1974)
11 lall Soviet method h+l (20-0lqgl - 101 1 q middotdhTrofimenkov (1974) -- f C UpUsmiddotQct
l1+l2 h - 1212 Qct-Qcp 40 D~ 10 Dp 1 33- 0 67shyUsbullh 4 00 2 50
13 English method 10 DFJ 375Dp 10 I
Rodin Corbett Shershywood Thorburn (1974)
3 7 5 Dcl 8 0 DP 10h+l1 _1_ J qcmiddotdh 1 h
qcmiddotdh 20011 +12 h - 12 hb
1 h qcmiddotdh 150hf
0
Observations
fp I f (qp)fs C
Dp E = 1 cm Qbu = 2 Qpa (approx )
s fs=f (qc)
q=~g Us 0 h
fp=f(q~)
fs=f(qgl
bull fine grained non- cohesive soil loosely packed
bull fine grained non- cohesive soil medium dense comp
fine grained non- cohesive soil
Tab 111 (cont)
h+h bE 14 non-cohe- Meyerhof ( 1956 poundti J N 3o middot dh CtME fN3 o dh 1 0 DP 4 0 DP 10 100 etM= l 2
sive soil 1976) lJ +12 h - li hE o hgp taken into consi der ~ Ul (I)
E-lt
C 0
~E = 1 kgbull 30 cm
(statistical limit depth of the pile) hE - clamping length of
pile micro rrJ l-l micro (I)
15 C (I) p
sand Norwegian method
- irm - - - 10 IT
m = diagram O l-l Senneset (1 974) rrJO C
16 rrJ micro gravel English meth it 3 middot N30 - - - 10 - Jf 3 + diagram U) ~
E-lt p U)
iiouiu Coruett Sherwood Thorshyburn (1974 )
(NJQat the elevashytion of pile point1
0 -i
108
Tab 11 2
Results of calculati o n of p i le point load pile shaft load and total pile load from static con e penetration test (Rol l berg 1977)
~ gt
~ gt Ultima te Ultimate Ult imate
No Method micro micro poi nt skin bearing 080lt17nlt1 50 Q) -l
-l middot-i resistanceuro resistance r esistancE
middot-i p 0
(J n1 n n2 n n3 n n1 n2 n3
1
2
Lab fSoil Mech
Hu izinga (1951)
(1936 ) 430
307 i 3 Van der Veen (1953) 239
49
4
5
Van der VeenBoersma
Menzenbach (1961)
(1957) -l middot-i 0
2 4 7
1 57 1-CJ)
6
7
8
Mohan Jain Kumen
de Beer (1964)
Sovi et Norm (1969)
(1963) CJ) Q)
-l middot-i 0
lJ Q)
Q)
gt- CJ) Q)
c 0
2 44
1 37
183
47
t I
49
487
0 18
47
16
3 02
0 85 1
47
16
137
08
9
10
Paproth ( 1972)
Norw Method (1974)
~ 0
0
u I
C 0 C
1 8 1
180 l 46
1- - -_L~ 46 167 46 1 19
1 1 Soviet Method ( 1974) [1 1 41 46 1 62 13 083 13 1 14 0 8
12 Engl Method (1974) 2 66 35 128 35 2 30 35 1 28
Note
cal Q a) n = --- mean value of the rat i o between calculat ed pile loads and those n Q determined f r om loading test
b) n = number of piles
109
Tab 113
Point resistance of large diameter piles (DIN 4014 Part 2 1977)
Settlement Point pressure 1 Factor -fshy
(cm) (MPa) cf=lOMPa I i=15 MPa C C
Piles without enlarged base
1 05 005 003 2 08 008 005 3 11 0 11 007
15 34 034 023
Piles with enlarged base
1 035 0 04 002 2 065 0 07 004 3 0 90 009 006
15 2 40 0 24 0 16
Note 10 lt qp lt 15 (MPa)C
Tab 114
Skin friction resistance of large diameter piles (DIN 4014 1977)
Strength Static cone pen- Depth below Skin frict ion Factor of sand etration resist surface
(MPa) (m) (MPa) fs
Very small lt 5 - 0
Small 5 to 10 0 to 2 0 2 to 5 003 ln6 to 333
gt 5 005 100 to 200
Medium I I 10 to 15 0 to 2 0 I
I 2 to 7 5
gt 75 I 0045 0075
222 to 133 to
333 200
High I I
i
l
gt 15 0 2
to 2 to 10 gt 10
I I I
I
i
0 006 0 10
gt gt
250 150
Note Skin friction is assumpted as linear until s =2 cm and constant for s gt 2 cm
11 0
Tab 115
Values of the inverse of the point resistance factor (Bustamante 1982) fp
Soil type qPC I 1
Factor - shyfp(MPa)
for piles group
a) Silt and loose sand lt 5 0 40 -b) Moderately compact
5 - 12 040sand and gravel
c) Compact to very gt 12 i 030compact sand and gravel I
Tab 116
Values of the shaft resistance factor fs (Bustamante 1982)
Factor fs
Soil type qs
C Category I(MPa) I A I B I II A III BI
I a) Silt and loose lt 5 60
i 150 I 60 I 120-
sand
b) Moderately corn- I pact sand and 5 - 12 100 200 100 200 gravel i
Icl Compact to very
compact sand gt 12 150 i I 300 150 I 200I
I I and gravel i
I
111
Tab 117
Point resistance factor (proposal)
-
1-fp
qc (MPa)
Gravel
Coarse sand Medium sand
Fine sand Silty sand
25
080
0 70
060
5 0
0 65
055
047
75
054
045
039
10 0
045
036
031
150
035
027
022
200
030
0 23
018
Tab 118
Shaf t r e sistance factor (proposal)
fs
qc (MPa)
Gravel
Coarse sand Medium sand
Fine sand Silty sand
25
80
100
130
10 0
120
150
190
I 200
180
230
300
11 2
Tab 119
Calculated values qcp
for large diameter piles
Pile Literature Length Diameter (m) Measured p Cr1 lcul Settlement Note Authcr(year) No (ml D Dp (MPa)
(s=0 10Dp) (MPa)p ~~JL__
s s ()(mm) Dp
1 Franke (1977) 1 13 11 36 38 117 106 Garbrecht
2
3
2
3
13
14
11
15
1 58 36
37
38
40
215
185
136
123
) qg accord to Franke
4 4 13 15 204 3 2 33 220 108 and Garshy
5 5 6 11 33 35 127 11 5 brecht (1977)
6 6 6 11 153 36 35 146 9 5
7 7 6 1 5 34 35 158 105
8 -shy 8 6 15 2 1 41 3 0 109 52
9 10 9 11 39 52 47
10 11 95 11 43 35 77 70
11 12 9 11 49 66 60
12 13 10 11 15 5 1 4 0 77 5 1
13 14 9 11 1 5 4 8 46 115 77--shy14 Pranke ( 1973) 15 115 18 4 9
) ) average 88
15 13$ 13 5 1 3 19 -2 5 3 2 sd=3 0
16 - - 165 16 5 13 19 30 sv=0 34
17
18
Spang (1972)
llXJ
V90
6 6
6 75
0 7
09
3 2
4 2
32X
42X
x) s =0 10 D p
19 VlaJ 720 1 2 39 3 9X
20 - - VlsJ 6 5 1 5 3 0 3 ox
21 Touma and US59 9 9 o 76 8 0 Reese ( 1977)
22 HH 75 0 61 8 0
23 Gl 180 091 - 2 5
24 BB 137 o 76
sd = standard deviation
sv = standard variation
Tab 1 2 1
Ultimate point resistance coarse and medium sand psf (MPal (Pol ish Specification 1975)
Depth h
Medium sand r = 0 40 N = 200 30 Base diam (Op) and depthbase diam (hDp)
Dense sand r 0 Base diam (Op)
= 0 80 = 50N30 and dpethbase diam (hDp)
(ml Dp = 0 6 m Dp = 1 0 m Dp =12 m Dp = 1 5 m Dp = 0 6 m DP = 10 m DP = 12 m DP = 15 m
Psf hDp Psf hDp Psf hDp Psf hDp Psf hDp Psf hDp Psf hDp Psf hDp
5 10 83 0 85 5 0 075 42 07 33 20 8 3 16 50 14 42 13 3 3
7 14 11 7 1 2 70 11 5 8 10 4 7 2 8 11 7 22 70 2 0 5 8 1 8 47
10 18 16 7 15 10 0 14 8 3 1 3 67 35 167 28 100 2 5 83 2 2 67
15 18 250 18 15 0 16 12 5 15 100 4 2 25 0 3 4 15 0 30 125 27 100
20 2 4 333 2 0 200 185 167 1 7 133 4 7 333 3 8 200 33 167 30 13 3
25 26 41 7 2 2 25 0 20 208 19 167 5 0 41 7 4 0 250 3 5 20 8 3 2 167
w
11 4
Tab 131
Partial safety factors for resistance to axial load for bored piles (Wright Reese 1979)
Partial safety Normal Poor factor for control control
Unit skin resistance 1 70 185
(no load test)
Unit skin resistance 160 1 70
(from load test)
End bearing 165 180
Tab 1 3 2
Probability of failure of bored piles under normal design conditions (Wright Reese 1979)
Probability of Factor of Structure failure safety classification
5 10-3 25 monumental
210shy 22 permanent- 2
5 middot 10 2 0 110shy 1 85
temporary 5 bull 10-l 165
11 5
Tab 133 Results of field tests (Tejchman Gwizdara 1979)
L
II C C C 0 0 0
micro micro
micro micro micro For universal safe~y F2u u CUNo micro C C ~ ~g~ middot- C
~ Permisible micro micro i ~c -i micro
cmiddot-~ micro~ L
micro oo ~ load ~t~ ~~ omicro micro ~ ~ 3Z~ ~ ~ micro
-~~
~ e ~ --middot--
middot- ~ obull 0
~ g ~~ ~~ ~
~ L
o Jl i5 sect~ =gt L Q~ = yen t p Qp Qp
D h Q~ Srrx s tm p s E~ iQ~lQ~cm ~~ KN X ll1l kPa kPa kN kN kN Jl ~e ~ 1 2 3 4 5 6 7 8 9 10 11 12 13 14 15 16 17
1 70 6 60 4081 1550 2531 38 0 1182 10 4040 175 2041 245 1796 632 141 120
2 90 6 75 5082 3041 2041 598 1785 10 4782 107 2541 1079 1462 282 140 42 5
3 120 720 7259 4041 3218 557 1035 10 3576 119 3630 2158 1472 187 2 19 594
4 150 650 8643 4454 4189 51 5 928 20 2521 136 4326 2158 2168 3 10 166 253
5 130190 195 7750 3011 4709 392 805 10 1075 - 3875 981 2894 3 10 166 253
6 130190 165 9516 5101 4415 536 522 20 1800 - 4758 1962 2796 260 158 412
7 130190 135 8044 5199 2845 646 114 4 15 1834 - 4022 2109 1913 2 47 149 524
8 180 115 11380 4415 6965 388 792 15 1735 - 5690 2747 2943 161 2 37 483
9 76 980 6867 4316 2551 628 110 13 9529 109 3534 1128 2306 383 111 32 8
10 61 7 60 7161 2747 44 14 383 67 15 9404 303 3581 392 3188 700 169 109
11 92 180 4807 883 3924 184 20 8 1329 76 2404 196 2207 450 178 82
12 76 24 5 6769 736 6033 109 20 8 1623 103 3385 147 3238 500 186 43
13 76 137 5396 2060 3336 38 2 63 8 4535 102 2698 589 1109 350 t 58 218
14 120 23 5297 1854 3443 35 0 960 10 1640 39 2649 196 2453 945 130 7 4
15 135 16 7 13489 7554 5935 560 181 10 5260 83 6749 2060 4689 367 127 305
16 170 46 0 8829 2943 5886 333 17 10 3466 39 4415 1373 3042 2 14 1 94 31 1
Average Fi 387 166 Standard deviation Sd 2 1 5 034 Standard variation sv= 0 56 0 20
1234 Spang1972 567 8 Franke 1976 9 10 111 2 1 3 Touma Reese 1974
14 Colombo 1971 15 Kerisel Simons 1962 16 Appendino 1973
11 6
Tab 134
Results of model
SafetyScheme factor
medium F ssand
F p
loose F s
samd Fp
F 3 55 sd _P F 1 32 sd
s
tests (Tejchman Gwizdara 1979)
Diameter D (mm)
30 60 90 133
145 129 108 112
280 3 08 307 294
140 154 153 112
594 3 04 324 426
107 sv 030
0 19 sv 0 14
117
Tab 135
Individual safety factors according to literature
Literature proposal ofLiterature individual safety factor
Fs Fb
Polish Specification (1974) 100 250
Tejchman Gwizdala (1979) 150 400
Bustamante Gianeselli 200 300 (1982)
Decourt ( 1982) 130 400
average 145 3 38
TAB 141 0)
Load settlement curves - measured
Pile No
Settlement 1 c 3 4 5 6 7 8 9 10 11 12
s p s p p s
p p s P
p s P
p s p p s
P p s
P p s
p p s p p S
p I i p s
p p s p
mm MPa rrrn lifl5a MPa mm
lifl5a MPa
mm lifl5a MPa mm
RPa mmMPa nwa MPa mm
RPa MPa mm RPa MPa mm
RPa MPa mm RPa MPa mm
RPa MPa mm RPa MPa mm
RPa 10 045 222 09 1 1 05 20 07 143 06 167 08 125 0 5 20 08 125 10 100 08 12 5 15 67 16 63 20 092 21 7 14 43 08 25 10 20 0 1 1 182 12 167 0 9 22 2 12 167 18 111 14 143 24 83 22 9 1 30 125 240 1 7 I 7 6 1 1 273 1 2 250 14 214 15 200 1 2 250 15 200 25 12 0 19 15 8 30 100 26 11 5 40 1ti 250 20 10 0 14 28 6 14 286 1 7 235 18 222 1 4 286 18 22 2 3 2 12 5 23 174 36 111 3 0 133 50 20 250 22 ~27 1 7 294 1 5 333 20 250 2 1 ~38 1 7 294 1 9 263 37 135 27 18 5 4 2 11 9 33 152 60 2 2 273 24 ~5o 20 300 1 7 353 23 61 22 ~73 18 333 21 286 43 140 30 20 0 46 13 0 36 16 7 80 271 295 27 796 24 333 20 400 27 ~96 25 1320 22 364 25 32 0 53 15 1 36 222 41 195
100 322 31 1 30 333 28 357 22 454 31 1323 29 345 26 385 28 357 60 16 7 40 25 0 45 22 2 125 38 329 32 391 32 391 25 500 32 139 1 30 41 7 32 39 1 4 6 272 48 ~6 0 150 14 2 357 34 1441 36 41 7 27 555 36 ~1 7 34 44 1 36 41 7 175 36 486 39 449 30 583 38 ~61 38 461 200 38 526 42 476 32 625 225 39 577 33 682
(mmMPa) ( 1 MPa)
1
1=2074
t 1=O ~01 =0 98S
a1=1132
b1 =0 212 V =0994
a1=2217
b1=O 131
V =Q 978
a1=1860 b1=0233
V =Q966
a1=1562
b1=0174 V =Q983
a1=1382
b1=O195
V =0975
a1 =20 37
b1 =C 174
V =0957
a1=1443
b1=(l 193 v =O 961
a1=965
b1= 0071 V =0 990
a1=1 91
b1 =o 128
V =0 993
a1=5 83
b1=C124
v =O 981
a1=6 1 4
b1=01 64 v =U 985
li(MPa) ~9 4 7 76 43 57 middot5 1 57 5 2 141 78 81 61 cp (MPa) B8 39 40 33 35 35 35 3 0 39 3 5 49 40 __Ef ~-6 1 2 1 9 1 3 16 15 16 1 7 36 22 16 15 qcp
TAB 141 (continue) Load settlement curves - measured
Pi le No 3ettlement 13 14 15 1 17 18 19 20 21 22 23 24
s p s T5
p s T5
p s T5
p s P
p s P
p s P
p s P
p s P
p s T5
p s T5
p s p p s
p mm MPa lll1l
HPa MPa mm HPa MPa mm
fWa MPa mm fWa MPa lll1l
HPa MPa mm HPa MPa mm
MPa MPa lll1l NT5a MPa HPa MPa 111111
HPa MPa 111111
HPa MPa 1)1111
mra 10 1 7 59 075 133 06 167 075 133 ~95 105 09 11 1 07 143 3 76 1 7 59 08 133 10 100 20 2 4 83 130 154 095 21 1 1 15 17 4 1 75 114 16 125 12 167 ~7 74 33 6 2 1 3 15 3 1 9 103 30 29 103 1 7 176 1 2 250 15 200 r55 118 22 136 16 18 8 38 79 46 66 1 7 182 27 110 40 33 12 1 20 200 1 35 29 6 1 75 229 ~O 133 26 154 175 229 49 82 58 6 9 1 9 21 1 35 115 50 36 139 235 21 3 145 34 5 1 95 256 24 208 ~-4 147 28 17 9 20 250 gt8 86 6 9 72 2 2 233 4 2 11 8 60 39 154 265 22 6 1 55 387 2 15 279 28 214 ~6 16 7 30 120 0 2 2 27 3 o 8 89 80 7 5 2 3 262 80 43 186 31 258 1 7 47 1 36 222 14 05 198 33 124 2 25 320 B 1 98 25 327
100 45 222 18 556 39~ 253 ~-5 222 36 1278 27 370 ~8 113 125 47 26 6 20 625 42 29 8 149 255 28 1446 t50 22 682 3 0 500 175 200 225
(mmMPa) a1=479 a1=1206 a1=14 51 a1=1113 a1=1406 ~=836 a1=843 a1=1176 ~=64 a =561 a1=10 0 a1=9 5 (1MPa) b1=0175 b1=0 178 b1=0 382 b=0287 b1=O 119 p 1=0 137 h1 =o 193 b=0258 p1=0 049 b1=0032 b1=0 276 b1 =0 048
hf (MPa)
v =0998 57
v =0-987 5 6
v =0989 26
v =0992 35
v =0933 Iv =0991 84 73
v =0993 5 2
v =0998 tJ
3 9 =0944 v =0998 v =0996 v =0981
qcp (MPa) 46 39 32 30 32 14 2 39 30
lL 12 1 1 08 12 26 1 7 1 3 13 qcp
lD
N 0
TAB 142
Calculated point resistance curves
Setlement (mm) p(s)
1
n p(s)
Calculated value of the p(s) for pile No
2 3 4 5
n p(s) n p(s) n p(s) n p(s) 6
(MPa)
n p(s)
7
n p(s) 8
n p(s) 9
n p(s)
10 20 30 50 80
100
150 200 225
070 128 177 253 335
375 446 493
157 140 141
127
123
1 16 106
070 1 25 168 232
297
327 378 410
422
078 089 099 1 06
1 10
109 1 11 108
108
073 1 30 176 246
315 349
405 441
146 163
160 145
1 32 125
113 105
056 096
1 26
167 205 222
249 265
271
0 80 096
105
1 11 100 101
092 0 83
082
065
118 162 233
308 345
412 456
108 108
1 16 116 114 111
064
1 12 151 2 10 2 69
298
346 3 76
078 P63 093 tt 13 101 tt 53 100 I 13
108 ~75
103 ~04 096 ~ 55
~ 87
1 26 125 127 126
125
1 17 1 04
052 088
1 15 153
188 2 03 227 242
065 0 74
o 77 0 81 0 75
0 73
063
072 122
1 83 262 347 388
463 5 11
073
0 74
073 0 71 0 65 065
064 1 18
162 233 309
3 46
41 3 4 57
Dp (m) 1 1 Qcp (MPa) 38 (mmMPa) h2 8 1 1 9 Qcpbullv1(MPa) 72
158
39
124 14 55
15
40
n20 15 60
204
33 148 10 33
1 1
35
tt 4o 1 9 67
1 53 3 5
tt 4 0 1 5 51
15
13 5
114 0 15 i-gt 3
2 1
30
tt 6 0 10 3 0
1 1
3 9
12 4 1 9 74
1 1
3 5 h40
1 9 67
Note n = condition coefficient calculated p(s) measured p(s)
10
n
081
084 0 85 0 86 0 85
087
TAB 142 (continue)
Calculated point resistance curves
Calculated value of the p(s) for pile No (MPa) Setlement 11 12 13 14 15 16 17 18 19 20
(mm) p(s) ll p(s) n p(s) ll p(s) n p(s) n p(s) n p(s) n p(s) n p(s n p(s) n
10 106 070 0 71 045 091 054 099 1 32 055 092 053 070 060 081 085 0 72 080 055 078
20 1 90 079 130 059 160 067 1 70 1 30 096 101 091 079 1 12 148 085 1 31 082 098 082
30 258 086 1 76 068 2 15 074 222 1 31 1 26 105 120 080 156 205 081 180 082 132 083
50 363 086 246 075 297 082 296 1 26 1 70 117 161 082 228 095 295 087 256 0 91 184 092
80 471 316 o 77 3 77 088 364 1 18 2 1 o 1 24 199 308 085 393 097 336 1 02 237 095
100 522 349 078 415 092 394 228 1 27 2 16 348 088 442 098 375 104 262 097
150 611 405 479 443 258 117 244 423 529 443 304 101
200 669 441 518 473 276 261 474 587 488 331
Dp (MPa) 1 1 1 5 1 5 18 1 9 19 070 090 12 15
qcp (MPa) 49 4 0 46 49 32 30 32 42 39 30 12 a1 mmMPa) 84 h20 96 84 152 160 152 124 160
IV1 1 9 1 5 15 12 11 1 1 23 21 18 15
qcpmiddotv1 (MPa) 93 60 69 59 35 33 74 88 70 45
- 12287 average = ~ = 098
standard deviation sd = 023 standard variation sv = 023
N
122
TAB 143 Ultimate settlement for shaft resistance - summing up
Ultimate settlements (mm)Literature sand cohesive claysand
soil
Burland Butler Dunican (1966) 7
Touma Reese (1974) 10 Tomlinson (1977) 10 Klosinski (1977) 8
Francke Gerbrecht (1977) 20-30 DIN 4014 part 2 (1977) 20 10 Francke (1981) Reese (1978) (1979) 05-2 of 05-2 of Farr Aurora (1981) shaft dia~ shaft diam
5-20 mm 5-20 mm Tejchman Gwizdala (1979) - Spang (1972) 10
10 10 20
- Francke (1976) 10 20 15 15
- Touma Reese (1974) 13 8 15 8
8 - Colombo (1971) 10
- Kerisel Simons (1962) 20 - Appendino (1973) 10 Promboon Brenner (1981) 10 Prodinger Veder (1981) 12 Decourt (1982) 10-15 10-15
-average s = 14 1 10 126
standard deviation sd = 53 2 1 47
standard variation sv = 038 021 037
123
TABLE 14 4 Al l owab l e base resistance versus sett lement
Pile Li terature ength Diameter (m) Calculated qcp=qcp Settl ement Fp-3- sa (mm)No Aut hor No (m) D DP qcp (MPa) for qcp3(MPa)
1 Francke ( 1977) 1 13 11 38 127 25 Garbrecht
II2 2 13 11 158 39 130 19
II3 3 14 15 40 133 33
II4 4 13 15 204 33 110 23
II5 5 6 11 35 117 22
II6 6 6 11 153 35 117 19
II
8
7 7 6 15 35 1 17 25
II 8 6 15 21 30 100 21
II9 10 9 11 39 130 13
II10 11 95 11 35 117 15
II11 12 9 11 39 163 11
II12 13 10 11 15 40 133 7
II13 14 9 11 15 46 153 9
14 Francke ( 1973) 115 11 5 18 30 100 15
II15 135 135 13 19 32 107 29
II16 165 165 13 19 49 163 35
17 Spang (1972) V70 660 070 32 107 28
18 II V90 675 0 90 42 140 16
II19 V120 720 1 20 3 9 130 16
II20 V15C 650 150 30 100 16 average for pi les 198
standard dev sd = 78
standard var sv = 039
)assumed qc = p for s = 010 Op sonding meRsurement were not availab le
IV
TA~LE 15 1
Comparison of the initial sl ope of the pile point resistance - settlement curve
Accardi ng to 1 2 3 4
In i t i ~l 5
slope a1 for the pile No
6 7 8 9
(mmMPa)
10 11 12 13 14 15 Note
a 1 for s=10 mm 222 11 1 a1 for s=20 mm 21 7 14 3 calculated 207 113see Tab 14 1 Bo Berggren (198 )230s=20 mm
Schmertmann s method (see 202B Berggren 1981)s=20 mm
No 1 _ llNo - 6 1 97 098
202 250
22 2
400
30 8
090
14 3
200
186
076
167
182 156
286
18 2
107
125
167 138
091
20 0
222
204
426
263
098
125
167
144
087
100
11 1 9 7
182
23 5
1 03
12 5
14 3
11 9
174
164
105
67 83
58
14 6
125
1 16
63
9 1
61
103
59
8 3 48
123
13 3
15 4 12 1
1 10
167 21 1
aceto hypershy14 5 bola type curve
1 15
No 2 NQj = n1
No 4Noz ~ na No 5Naz= T]g
105 1 27
106
093
1 13
160
1 23
108 1 17
157
100
121 109
1 92
118
1 16 1 14
164
2 12
120
122
1 15
143
1 76
151
149 1 73 1 27 146
TAllLE 151 (continue)
Compa ri son of the initial slope of the pile point resistance - settl ement curve
Initial slope a1 for the pile No (mmMPa)According Note to 16 17 18 19 20 21 22 23 24 -a1 for s=10 mm 133 - 105 11 1 143 76 59 133 100 a1 for s=20 mm 174 - 114 125 167 74 62 153 10 3 calculated see 11 1 146 84 84 118 64 56 100 95Tab 141
Bo Berggren 198 67 78 25 0 114s=20 mm Schmertmann s method (see B 136 67 250 146 Berggren 1981) s = 20 mm
nG = 108 No 1NoJ = n 1 20 125 1 32 121 1 19 105 1 33 105 sd = 0 14
SY= 013 No 2 i) = 1 29ro1 = n1 157 136 149 142 1 16 1 11 1 53 108 sd = 019
SY= 015 No 4 iis = 143 INo2 = ns 091 126 1 63 111 sd = 033
SY= 0 23 No 5 ii9 = 1 37183 108 163 142INoz = n9 sd = 0 37
SY = 027
N Vl
126
TABLE 152
Measured and calculated pile point resistance
Pile Calculated Measured Measured No qcp P for
s=10 mm P for s=20 mm
~ 10 mm ~ 20 mm
- (MPa) (MPa) (MPa) - -
1 38 045 092 84 41 2 39 09 14 43 28
3 40 05 08 80 50 4 33 07 10 47 33 5 35 06 11 58 30 6 35 08 12 44 29 7 35 05 09 70 39 8 30 08 12 38 25 9 39 10 18 39 22
10 35 08 14 44 25 11 49 15 24 33 20 12 40 16 22 25 18 13 46 1 7 2 4 27 19 14 30 075 13 40 23 15 32 06 095 53 34 16 49 075 115 65 43 17 32 - - - -18 42 095 1 75 44 24 19 39 09 160 4 3 23 20 3 0 07 12 43 25
average= 484 291
sd 163 088 sv 034 030
Tab 153 Results of calculation for piles No 1-24
Pile No
Length (m)
Overburden pressure 0 vs
0hs (kPa)
0ve (kPa)
0 nc (kPa)
- -ov=o1 (kPa)
- -OV=03 ( kPa)
00 (kPa)
p(a il ( kPa)
s (a 1) (mm)
A2 ( 1 )
E t
(kPa)
Md ( 1 )
K (1)
E I
t (kPa)
( kPa) 1 2 3 4 5 6 7 8 9 10 11 12 13 14 15 16
l 2 3 4 5 6 7 8 9
10 11 12 13 14 15 16 17 18 19 20 21 22 23 24
13 12 14 13 6 6 6 6 9 95 9
10 95
11 5 135 165 66 675 72 65 99 75
180 137
l 33 133 123 116
70 70 70 70
104 102 95
102 95 94
106 139 95
101 106 97
180 137 221 215
53 53 49 46 28 28 28 28 42 41 38 41 38 38 42 56 38 40 42 39 72 55 88 86
202 202 216 202 1114 104 104 104 146 153 146 160 153 181 209 251 120 128 134 123 238 180 305 277
202 202 216 202 104 104 104 104 146 153 146 160 153 181 209 251 120 128 134 123 238 180 305 277
168 Hi8 170 159 87 87 87 87
125 128 121 131 124 138 158 195 108 115 120 110 209 159 263 246
128 128 133 124 66 66 66 66 94 97 92
101 96
110 126 154 79 84 88 81
155 118 197 182
141 141 145 136
73 73 73 73
104 107 104 111 105 119 137 117 89 94 99 91
173 132 219 203
950 975
1000 825 875 875 875 750 975 875
1225 1000 1150 750 800
1225 800
1050 975 750
2000 2000 625
1500
218 139 255 190 16 1 146 210 12 7 10 1 11 7 84 73 69
104 167 210 124 103 10 1 109 142 120 76
153
0802 0802 0822 0820 0798 0798 0798 0798 0791 0798 0800 0811 0814 0837 0837 0830 0769 0 768 0771 0 775 0 780 0 781 0 788 o 779
35296 81603 43312 65222 44019 67515 4609 91313 78186 60572
118115 15129 5 184075 95577 67017 81607 33252 67554 85294 75994 78816 74857 55101 54862
075 075 0 77 075 084 084 084 081 079 078 084 080 083 076 076 078 0 77 081 079 076 082 087 064 0 74
278 643 337 512 542 832 567
1085 766 572
1216 1417 1832
796 520 709 353 735 878 781 630 726 302 366
26472 61202 33350 48917 36976 56713 38656 73964 61767 47246 99217
121036 152782
72639 51932 63653 25604 54719 67382 57755 64629 65126 35265 40598
a=282l a =l781 y=axs S=0621 B=0 844
V=0 057 V=0 128 _ Iv -J
~
N co
Tab l53 Results of calculation for piles No 7-24
Pile No
17
1 2 3 4 5 6 7 8 9
70 11 72 13 74 75 16 17 78 79 20 27 22 23 24
Ground water
18
-20 m b s
-28 m -335 m -330 m -3 15 m dry dry -53 m -85 m
E t (kPa)
19
33653 64979 35364 45664 47969 54583 37574 63072 74548 57753
71 2618 123531 150297
71239 48619 59204 39744 77208 77863 62049 90407 95844 57762 62937
vxEt=E Md (kPa)
20
25240 48689 27230 34248 35254 45849 31562 51040 58893 45047 94599 98825
724747 54142 36950 46179 30603 57678 61572 47157 47734 83384 36968 46569
a=898 S=l 27 =0314
K (l )
21
265 511 275 358 517 672 463 749 730 546
1160 1157 7496
593 377 514 422 775 802 638 723 929 377 420
a=l422 S=l 05 =0187
E=E = t1 3
g-gcp (kPa)
22
51046 52799 54566 42492 45870 45870 45870 37547 52799 45870 77039 54566 65438 52799 40826 71039 40926 58739 52799 37541 82549 82549 40826 59945
Calculated s
(mm)
23
708 128 72 7 15 3 724 146 144 17 3 71 3 11 5 11 2 732 13 2 707 1 5 1 13 7 93
102 118 137 728 12 l 69
11 9
s__caL n=smeos
() 24
050 092 050 087 0 77 7 00 069 l36 l 12 098 133 l81 l97 103 090 065 0 75 099 117 126 090 101 097 078
ri=l00 sd=035 sv=035
K = l50gcp
25
570 585 600 495 525 525 525 450 585 525 735 600 690 450 480 735 480 630 585 450 825 825 1180 645
E l
(kPa)
26
67684 69465 72250 57726 44856 44856 44856 38448 59659 54306 74956 63214 70704 49089 56783 79502 45283 61081 58207 42927
708572 94785 71033 91898
E = t E middotA2
l
(kPa)
27
54283 5571 l 59389 47336 35795 35795 35795 30682 47790 43336 59964 51266 57553 47088 47024 65987 34823 46970 44877 33269 84639 74027 55974 71589
Calculated s
(mm)
28
l O l 12 l 11 7 737 15 9 18 7 185 21 1 12 6 12 2 133 14 l 150 13 7 13 l 14 7 709 12 7 738 755 12 4 735 50
100
- -
Tab l53 Results of calculation for piles No l-24
Pile
29
l 2 3 4 5 6 7 8 9
10 ll 12 13 14 15 76 17 78 19 20 21 22 23 24
sea l n= middotshy
smeas
28 TT
30
0 46 087 046 0 72 099 l 28 088 l 66 l 25 l 04 l 58 l 93 2 17 l 32 078 0 70 088 l 23 l 37 l42 087 l l 3 066 065
n=l 10 sd=0 44 sv=040
s seal for p n=s=lOrnn ac cording to s = 70mm
(mm)
37 32
5 l 0 51 ll 8 l18 64 064
13 0 l30 85 0 85
13 3 l 33 83 0 83
184 l84 ll6 l l 6 105 l05 137 l 37 21 3 2 12 19 4 l94 107 l06 l l 3 l l 3 84 084
92 092 l 0 9 l09 128 l28 83 083
l 0 3 l03 88 088 79 0 79
n=1 73 sd=025 sv=027
s for p according to s = 20mm
(mm)
33
10 4 184 102 18 6 15 6 200 14 9 276 209 18 4 219 292 274 185 17 9 12 9 -
169 194 219 172 200 143 15 0
seal n=s=20rnn
34
052 092 051 093 078 l00 075 l 38 l 05 092 l l 0 l46 l 37 093 090 065
-085 097 l1 0 086 l00 072 075
n=093 sd=025 sv=0 27
s for p according to s = 30rnn
(mm)
35
142 223 14 l 22 3 198 249 142 34 5 290 249 274 345 33 l 243 22 6 168 -
24 7 26 6 293 24 3 279 187 213
seal n=s=30rnn
36
047 0 74 047 0 74 066 083 047 l 15 0 97 083 091 l 15 l10 0 81 075 056 -
082 089 098 081 093 062 0 71
n=o80 sd=020 _ sv=0 25 N
IO
APPENDIXES
APPENDIX 1 1 1
Pi le No 1 Length 13 m D 10 m
Areas of influence
-
qe
(MPa)
1 fp
___9c_ f
(MPR) zyen
(MPf) qcp (MPa)
Soil type
22 20 18 16 14 1 2
l 2 (m)
10
1 0 08 06
16 15 16
026 027 026
42 41 42 Sand
04 14 U28 39 02 14 028 39 41
02 16 0 26 42 04 16 026 42 06 16 026 42 08 14 028 39 Sand 1 0 13 030 39 12 15 027 4 1 38 14 13 030 39 16 12 032 38 18 12 032 38
40 20 10 036 36 22 10 036 36 24 9 U39 35 2 6 8 043 34 28 10 036 36 30 10 036 36 3 2 10 036 36 34 10 0 36 36 36 11 0 34 37 38 11 034 37
l 1 (m)
40
42 44
11 0 34 37 15 1
46 48 50 52 54 56 58 60 62 64 66 68 70 7 2 74 76 78 8 0
APPENDIX 112
Pile No 2
to little depth of sounding
q~ = middle values for 11 = 2 Op
q~ = 145 MAa (Francke Garbrecht 1977 Tab 2 p 50) (Fi g No 2)
for sand
qcp = 0275middot145 = 40 MPa q~p =V ~~s) middot 40 = 097middot40 = 39 MPa
Pile No 4
q~ = 120 MPa sand (Fig No 4)
q = 0 315middot12 = 3 8 MPa q bull 38 = 086middot38 = 33 MPa=V Jmiddot54
1
cp middot bull cp
Pile No 12
qg = 155 MPa sand (Fig No 13)
qcp = 026middot155 = 4 03 MPa
Pile No 13
q~ = 200 MPa sand (Fig No 14)
q = 0 23middot20 = 46 MPacp
APPENDIX 113
PileNo3 Length 14 m D 15 m
Areas of influence
-
qe
(MPa)
1 Tp
----9cf
(t-1Pf) r~
(MPf) qcp (MPa)
Soil type
22 2D 18 16 17 025 43 14 17 II II
L 2 17 II II
12 (m)
16 10 08 06
17 17 17
o
II
II
II
II
Sand 04 17 II II
02 19 024 46 b9
02 19 024 46 04 17 025 43 06 15 027 41 08 13 030 48 1 0 12 032 38 12 11 033 36 14 13 0 30 39 16 14 028 39 18 12 032 38 40 20 16 026 42 2 2 16 026 42 24 11 033 36 26 11 033 36
60 28 30
10 10
036 036
36 36
Sand
32 10 036 36 34 12 032 3 8 3 6 12 032 38 38 12 032 38
1 1 (m)
40
4 2 4 4
13
14 16
030
028 026
39
39 42
46 13 030 39 48 12 032 38 50 14 028 39 52 10 036 36 54 13 030 39 56 14 028 39 58 15 027 41 60 15 027 ~-1 236 62 64 66 68 70 72 74 76 7 8 80
APPENDIX 114
Pi l e No 5 Length 6 0m D 11 m Dp 11 m
Area s of i nfluence
-
qc
(MPa)
1 Tp
-3Lf
( MPf) l ~
(MP~) qcp (MPa)
Soil type
2 2 2 0 18 1 6 14 1 2 155 U i1 33
l 2 (m)
1 2 10 08 06
15 14 12
022 023 0 27
3 3 32 32
Fine sand
+ silt
04 125 026 33 02 16 0 21 34 39
02 16 021 34 04 13 025 33 06 08 10
15 5 17 20
022 0 20 018
34 34 36
35 Fi ne sand
1 2 20 0 18 36 14 20 018 36 + s ilt 16 20 0 18 36 18 165 020 32 20 165 0 20 32 22 17 0 20 34 24 26 2 8 30 32 3 36 38 4 0
19 21 5 21 5 21 5 20 19 5 19 5 20 215
01 9 ---
018 018 0 18 0 18 -
3 6 40 40 40 36 35 3 5 36 4 0
l 1 (m) 4 2
44 20 19
018 01 9
36 3 6 157
46 48 50 5 2 54 56 58 6 0 62 64 66 68 70 7 2 74 76 7 8 8 0
APPENDIX 1 15
Pi le No 6 Lengt h6 0 m D 11 m
Areas of qc 1 __9_c_ qcp Soil typei nfluence fp f 1 yen (MPa) (MPf ) (MPf) (MPa)
-2 2 20 18 16 t 4---0 14 75 038 29 L2 20 018 36 Fi ne sand
1ti 10 30 40 + s i lt12 08 19 0 19 36(m) 06 17 020 34 04 14 023 32 02 9 034 31 56
02 6 043 26 04 12 026 3 1 06 17 020 34 08 11 028 3 1 1 0 14 023 32 35 1 2 17 020 34 Fi ne sand14 19 019 35 16 20 018 36 + silt18 18 0 19 34 20 14 023 32
46 22 12 026 31 24 12 026 31 26 15 022 33 28 18 019 34 30 20 018 36 3 20 0 18 36 34 20 018 36 3G 20 018 36 38 20 018 36 4 0 20 018 36
l 1 42 22 40
(m) 44 22 40 46 L2 4 0 158 48 50 52 54 56 q =V ~ - 3 b =0 99middot35 = 35 MPp cp 53 58 6 0 62 64 66 68 70 72 74 76 78 80
APPENDIX 116
Pi leNo7 Length 60 m 0 15 m
Areas of influence
-
qe
(MPa)
1 Tp ~
(MPg) r~
(MPf) qcp (MPa)
Soil type
22 20 18 16 9 U33 30 14 10 031 31 12 135 024 32
l 2 (m)
16 10 08 06 04 02
13 12 6
10 175
025 026 043 0 31 020
33 31 26 3 1 35 50
Fine sand
+ silt
02 04 06
17 10 115
0 20 0 31 027
34 31 3 1
08 10
145 185
023 019
33 35 3 5
1 2 14
20 19
018 0 19
36 36 Fine sand
l 1 (m)
60
16 18 20 22 24 26 28 30 3 2 34 36 38 40
42 44 46 48 50 52 54 56 58 6 0
185 125 125 165 17 19 21 215 205 20 21 20 20
24 22 20 215 22 22 21 19 18 22
0 19 026 0 26 020 020 019 --
018 018 -
018 01 8 --
018 ----
0 19 0 19
35 33 33 33 34 36 40 40 37 36 40 36 36
40 40 36 40 40 40 40 36 34 40 219
+ silt
62 64 66 68 70 72 74 76 78 80
APPENDIX 117
Pile No 8 Length60 m D 15 m Dp 2 1 m
Areas of influence
-
qe
(MPa)
1 r +
(MPg) r~
(MPf) qcp (MPa)
Soil type
22 18 019 34 20 16 021 34 18 125 026 3 3 16 115 027 31 14 11 028 3 1 12 11 028 3 1
l 2 (m)
10 08 06
105 11 145
D29 028 023
30 31 33
Fine sand
+ silt
04 18 0 19 34 02 18 019 34 71
02 15 022 33 04 11 0 28 31 06 13 0 25 33 08 20 0 18 36 10 15 022 33 12 13 025 33 14 175 020 35 16 18 20 22
20 21 20 15
018 -
018 0 22
36 40 36 33
35 Fine sand
+ s i lt
24 26 28 30 3 =
13 16 175 19 20 20
025 021 020 0 18 018 018
33 34 3 5 34 36 36
36 38 4 0
20 20 21
018 0 18 -
36 36 40
11 (m)
4 2 4 4 4 6 48 50 5 2 5 4 56 5 8 60 6 2 6 4
20 20 21 22 21 20 19 175 19 20 25 28
018 0 18 ---
01 8 01 9 0 20 0 19 018
36 36 40 40 40 36 36 35 36 36 40 4 0 23 0
6 6 68 70 72 74 76 78
qcp 1f5=v 2T middot35 = b85 middot35 = 30 MPa
80
APPENDIX 118
Pi le No 9 Le ngth 90 m D 11 m m
Areas of 1Qe -9c qcp Soil typeinfluence Tp f ryen (MPa) (MPg) (MPf) (MPa)
-
2 2 2 0 18 16 14 lc 11 034 37
12 10 10 036 36 12 08 9 039 35 Medium(m) 06 10 036 36 sand04 10 036 36
02 11 034 37 43
02 12 032 38 04 12 0 32 38 06 12 0 32 38 08 13 030 39 10 13 030 39 12 13 030 39 14 14 028 39 16 14 028 39
44 18 14 028 39 20 14 028 39 39 Med ium 22 15 027 4 1 sand 24 16 026 4 2 26 17 025 43 28 13 0 30 39 3 0 9 039 35 32 13 030 39 34 16 026 42 36 17 025 43 38 17 025 43 40 19 024 4 6
11 42 17 025 43
(m) 44 15 027 41 17 7 46 48 50 52 54 56 58 60 6 2 64 66 68 7 0 7 2 74 76 78 80
APPENDIX 119
Pi 1 e No 10 Length 95m D 11 m m
Areas of influence
-
qe
(MPa)
1 fp
-9c f
(t-1Pf) [~
(MPf)
qcp
(MPa)
Soil type
22 20 1 8 16 14 L 2 13 Uti 3J
l 2 (m) 12
10 08 06 04
18 18 28 19
0 19 019 0 19 019
34 34 34 34
Fine
sand
02 21 40 42
02 20 4 0 04 17 020 34 06 21 40 0 8 10
23 22
40 40 Fine
1 2 14 16 18
21 20 16 15
0 21 022
4 0 4 0 34 33
sand
44
20 2 2 24 26 28 30 32 34 36 38 40
14 14 13 11 11 14 17 14 12 13 12
023 023 025 0 28 028 023 020 023 027 025 027
32 32 33 31 31 32 34 3 2 32 3 3 32
l 1 (m) 42
44 12 13
0 27 025
32 33 15 2
46 48 50 5 2 5 4 56 5 8 6 0 6 2 6 4 66 6 8 70 72 74 76 78 80
APPENDIX 11 10
Pi 1 e No 11 Lengt h 9 0m D 11 m m
Area s of influence
-
Qe
(MPa)
1 fp
__k_ f
(MP~) ryen
(MPf) qcp (MPa)
Soi l type
22 20 18 16 14 12 lb 55
12 (m)
1 0 08 06 04
23 19 20 21
024 023
55 46 46 55
Medium
sand
02 22 55 62
0 2 04
24 25
55 55
06 08
27 28
55 55
10 12 14
28 28 28
55 55 55 49
16 26 55
44
18 20 22 24 26 28 30 3 34 36 38 40
24 19 18 17 22 21 17 11 13 12 11 9
024 024 025
025 0 34 030 032 034 039
55 46 43 43 55 55 4 3 37 39 38 3 7 35
1 1 (m) 42
Ll Ll
12 16
032 0 26
38 4 2 209
46 48 50 5 2 54 56 58 60 62 64 66 68 70 72 74 76 78 80
APPENDIX 141
0 2 3 4 p [MPa)
PILES WITH 40 ENLARGED BASES
80
120
160 C----0
200 IN4014 s (1977)
[mm]
P s calculateds P p(s)(mm) (MPa)(mmMPa)(MPa) ()
10 035 286 046 20 065 308 080 30 090 333 104
150 24 625 214 200 229
ai = 2605 (mmMPa) b1 = 0243 1MPa V 1000 bi = 1b = 411 MPa
_ 411 MP Vi - 24 a
() assumed
average Dp = 18 m
qcp = 24 MPa ai = 184 (mmMPa) (28-4middot24)
Vi = 1 2 (3-18)
qcpmiddotvi = 29 MPa
40
80
120
160
200 s
[mm]
DIN 4014 Part 2 ( 1977)
0 1 2 3 4 5 p [MPal
PILES WITHOUT ENLARGED BASES
C----0
DIN 4014 ( 1977
s calculated s p -p- p(s)
(mm) (MPa)mmMPa)(MPa) ()
10 05 20 062 20 08 25 113 30 11 27 3 155
150 34 441 385 200 424
ai = 2085 (mmMPa) bi= 0 157 1MPa V = 0970
bi= 1s = 637 MPa
Vi 187=3f =
() assumed
average Dp = 12 m
qcp = 34 MPa a1 = 144 (mmMPa)
Vi = 18
qcpmiddotvi = 61 MPa
Range qc = 10-15 MPa
(28-4bull34)
(3-12)
1 1 q = r -r- = 036 for qc = 10 MPaCp p Ip+= 027 for qc = 15 MPa
qcp = 36-405 MPa P
APPENDIX 142
Touma F and Reese L (1974)
Soil parameters pile parameters and base resistance see fig bullbullbullbull
TAB
Measured load settlement curves
Settlement s
mm
10 20 30 40 50 60 80
100 120
a 1 (mmMPa) bi(MPa) V
N3u
q =04 -N30 (cMPa) ()
1 qCp=--rpbullqC
Pile No 21 (US 59) 22 (HH) 23 (G1) 24 (BB) Notep Sp p S p p S p f Sp MPa mmMPa MPa mmMPa MPa mmMPa Mla mmMPa
131 76 169 59 075 133 100 100 269 74 325 62 131 153 1 94 103 381 79 456 66 165 182 273 11 0 488 82 581 69 1 90 21 1 349 115 581 86 694 72 2 15 233 424 118 675 89 800 75 229 262 813 98 245 327 884 113 925 130
64 56 100 95 U049 0032 0276 0048 0944 0998 0996 0981
80 gt100 30 60 32 gt 40 12 24 ()
Bergdahl (1982)
gt5 5 gt55 32 4 3
(0 18middot32) (018middot40) (0265middot12) (018middot24)
CONTACT PRESSURE p [ MPa]
0 2 4 6 8 100 N-------r---------------(us 59) ( HH) ( BBi
E E SQ-------lt+-----+--------------lt
VI
1shyz UJ
~ 100 1---------i----+----+----+------l------I -J I shyI shyUJ V)
so~----~--~-- ~--~
APPENDIX 143
us 59 fYJo 0 50 00
ff-t r-=-~c~=~-r~c_---_---l-~e-J-C~ 0 ------
CLAY
FINE SANO
J lD- 760 mm
f5m~--~--~
Pile US 59 and results from penetration test
HH IV_l() so 100 r=-=-==-==-r-~--=-=- 0 0 II 15- flf ~ II~ Ibull If t f
CLAY SAND
Sm
)
= -middotl lo - GtOmm
~ JI
SILTY SANO tOm
Pile HH and results from penetration t est
APPENDIX 14 4
61 NJO 50 --------00
11 1 =f J - 1 -- 0
CLAYSILT
E ~ Sm ltrj
SILTY SAND
q I lDmiddot 910 mrn tom
I) t bull
Pile G1 and results from penetration test
88
0 50 too ~1-e I q 111bull - Q
CLAY
SIL TY SAND 5m
]
l lDmiddot760mrn
Om
Pile BB and results from penetration test
APPENDIX 145
Klosinski B (1977)
Loading tests 50 bored piles 09-125 m diameter average Op= 11 m On t he sett l ement of rigid pla te the settlement of t he pi le base is given by
PmiddotOSp = T-K b
where Mb - equivalent deformability modu lus
1) Sand and sandy gravel of medium density
Mb = 25-50 MPa
According to Bergdahl (1979) medium sand is between
q(l) 5 MPa (Io=035)c2)
ql = 10 MPa (Io=065)C
from fig 117 rp1 = 055 for qc = 5 MPa 1Tp = 036 for qc = 10 MPa
q(l)= 0 55middot5 = 2 75 MPacp bull
q(2= 0 36middot10 = 360 MPacp
allowable p~ 1)= ~p = yen = 092 MPa and p~2) = ~ = 120 MPa
settlement of the pi l e base
5(1)= o 92 middot 1bull1 = O 0135 m = 13 5 mm p 325 middot middot
5( 2)= 1bull2bull1middot 1 = O 0088 m = 8 8 m p 350 bull bull
1) _ s _ 135 _ 14 7 (mm) a(2) _ 88 _ a 1 - p - o---92 - bull NPa bull 1 - T-7 - 733 (Wa)
2) Loose sand lo= 030-040
Mb = 12- 25 MPa
q~l) = 44 MPa q~2)= 58 MPa
1Tp = 058 and 052
q(3) = 0 58middot4 4 = 2 55 MPa middot q( 4) = 0 52middot5 8 = 3 02 MPa cp bull middot bull cp bull middot middot
allowable p~ 3)= 4i = 085 MPa p~4)= yenl = 101 MPa
s(3)_ 085-11 = 26 mmmiddot s(4)_ 101middot11 = 148 mm p - 312 p - 3 25
STATENS GEOTEKNISKA INSTITUT Swedish Geotechnical Institute S-581 01 Linkoping Tel 01311 51 00
Serien Rapport ersatter vara tidigare serier Proceedings (27 nr) Sartryck och Preliminara rapporter (60 nr) samt Meddelanden (10 nr)
The series Report supersedes the previous series Proceedings (27 Nos) Reprints and Preliminary Reports (60 Nos) and Meddelanden (10 Nos)
RAPPORT REPORT Pris kr
No Ar (Swcrs)
1 Grundvattensankning till foljd av 1977 50shytunnelsprangning P Ahlberg T Lundgren
2 Pahangskrafter pa langa betongpalar 1977 50shyL Bjerin
3 Methods for reducing undrained 1977 30shyshear strength of soft clay K V Helenelund
4 Basic behaviour of Scandinavian soft 1977 40shyclays R Larsson
5 Snabba odometerforsok 1978 25 shyR Karlsson L Viberg
6 Skredriskbedomningar med hjalp av 1978 40shyelektromagnetisk faltstyrkematning - provning av ny metod J Ingands
7 Forebyggande av sattningar i 1979 40shyledningsgravar - en forstudie U Bergdahl R Fogelstrom K - G Larsson P Liljekvist
8 Grundlaggningskostnadernas fordelning 1979 25 shyB Carlsson
9 Horisontalarmerade fyllningar pa los 1981 50 shyjord J Belfrage
RAPPORTREPORT
No
10 Tuveskredet 1977-11-30 Inlagg om skredets orsaker
11a Tuveskredet geoteknik
l1b Tuveskredet geologi
11 c Tuveskredet hydrogeologi
12 Drained behaviour of Swedish clays
R Larsson
13 Long term consolidation beneath the test fills at Vasby Sweden YCE Chang
14 Bentonittatning mot lakvatten T Lundgren L Karlqvist U Qvarfort
15 Kartering och klassificering av leromradens stabilitetsforutshysattningar L Viberg
16 Geotekniska faltundersokningar Metoder - Erfarenheter - FoU-behov E Ottosson (red)
17 Symposium on Slopes on Soft Clays
18 The Landslide at Tuve November 30 1 977 R Larsson M Jansson
19 Slantstabilitetsberakningar i lera Skall man anvanda total spanningsanalys effektivspanningsanalys eller kombinerad analys R Larsson
20 Portrycksvariationer i leror i Gateshyborgsregionen J Berntson
21 Tekniska egenskaper hos restproshydukter fran kolforbranning shyen laboratoriestudie B Moller G Nilson
Ar
1981
1981
1981
1981
1981
1982
1982
1982
1983
1982
1983
1983
1983
Pris kr (Swcrs)
50shy
50shy
40shy
50shy
100shy
60shy
80shy
60shy
190shy
75shy
60shy
150shy
65shy
RAPPORTREPORT
No Ar Pri s kr (Sw crs)
22 Bestamning av jordegenskaper med sondering - en litteraturstudie U Bergdahl U Eriksson
1983 75 shy
23 Geobildtolkn ing L Vi berg
av grova moraner 1984 70 -
24 Radon i jord -Exhal ation- vatten kvot -Arstidsvariationer - Permeabilitet A Lindmar k B Rosen
1984 75 shy
25 Geoteknisk terrangklassificering for fysisk planering L Viber g
1984 120shy
26 Large diameter bored piles in nonshycohesive soils Determination of the bearing capacity and settlement from results of static penetration tests (CPT) and standard penetration test (SPT) K Gwizdala
1984 85shy

15
In Tab 116 values of the shaft resistance factor
fs are given
Category IA
- Plain bored piles - Mud bored piles
- Hollow auger bored piles - Cast screwed piles
- Type I micropiles - Piers
- Barrettes
Category IB
- Cased bored piles - Driven cast piles (concrete or metal shaft)
Category IIA
- Driven precast piles - Prestressed tubular piles
- Jacked concrete piles
Category IIB
- Driven metal piles - Jacked metal piles
It can be noted that the values in Tab 116 are in
genera l of the same range for the driven and the
bored piles
According to the Polish Specification 1979 the point
and shaft resistance factor are given by
1-f- = kmiddota
p p
where
ap 035 for sand
k coefficent of unhomogeneity k qcp min
qcp
= 0065 for sandfrac12
1
16
Similar results can be observed in Fig 116a and
Fig 116b It was showed by Kerisel (1965) and Franke
(1973) that the harder soil the more loosening at
excavation and thus relatively smaller bearing capacity
Taking into account the Franke diagrams we will have
for D = 125mand settlements= 2 cm p
Cone resistance qc (MPa) 1 5 50 1 0 15 22
qc p for s=2 cm 3 6 8 12 14
(see Fia 1 1 6b )
taking safety factor for pile base F = 3 the point resis~ance
33-10 ~-05
380375 lo 212 bull lo 2114 bull
factors- shy are p
The above anal ysis shows that it is possible to determine
ultimate point and shaft resistance of bored piles from
static cone sounding But it is very important and must
be taken into account type of pile kind of soil and
degree of compaction
Bel ow calculation method for large diameter bored piles
based on the static cone penetrometer resistance (CPT)
is proposed Equation (117) can be used directly for
the base diameter D lt 15 m For larger diameters p shyD gt 15 m the values should be multiplied by the
p ff t ITscoe icen Y~ as pi
( 1 1 5 )
where
qcp = according to equation (117)
D = diameter of the pile base D gt 15 mpi pi
17
This value q~p should be put into equation 116
The value qc s in equation 118 is independent on the
pile diameter
Proposed calculation method
(116)
where)
1 1 40 ~ 11 3 for piles wit h a nd enlarged bases12 10 12 = ~
h+h
q (h) dh (117)qcp l1+l2 f -f- Ch-li p
h 1 f 1
qcs = o -f- qc (h) dh (118)h s
1 -f- = f(q kind of soil ) -+- see Fig 11 7 and Tab 1 1 7
C p
f (q kind of soil ) -+- see Fig 1 1 8 and Tab 1 1 8 fs C
Note
a) the point resistance q for qc gt 20 MPa is assumed cp to be maximum as
- Gravel 70 MPa - Coarse sand medium sand 55 MPa - Fine sand s il ty sand 40 MPa
b ) The shaft resistance qcs for qc gt 20 MPa is assumed to
be maximum as
- Gravel 110 kPa - Coarse sand medium sand 90 kPa - Fine sand s ilty sand 70 kPa
These proposed values are compared with results by
Bustamente (1 982) and the Polish Specification (1978)
Fig 11 9 and F i g 1110 A similar comparison for DIN
4014 1 977 is shown in Fig 1111 and Fig 1112
) In this paper was used the above values 1 1 and l z But it can be used in practice 11 =30 D and h =2Dp respectively The results shall be very simi l ar to the above onPs
18
The proposed method has been examined with field test
results This is shown in Fig 1113 to Fig 1128
and Appendix 1 11 to 1110 and Tab 119
The comparison shows that the value of q in equationcp (117) corresponds to the settlement -10 of the base
diameter (s=010 DP) see Fig 1113 and Tab 119
(average sDp=88 and standard deviation sd=3)
Later in this paper the allowable load and dependence of
the load versus settlement will be determined
12 Determination of bearing capacity of the large
diameter bored piles from results of the Standard
Penetration Tests (SPT)
There are little published on pile tests coupled with
results from Standard Penetration Test (SPT) Among the
authors who have published material in the subject are
- Meyerhof 1956 1976
- Senneset 1974 (Norwegian method)
- Rodin Corbett Sherwood Thorburn 1974 (English method)
- Polish Specification 1975
- Weltman Healy 197 8
- Reese 1978
- Japanese Society 1981
- Decourt 1978 1982
The Norwegian method is valid o nly for concrete andor
wooden piles the English method only for gravel It is
very important to underline that the Norwegian a nd the
English methods use of the SPT resul ts intermediate by
the static cone penetrometer resistance (q ) as well C
Below methods are presented that are using the results of
SPT directly Meyerhof s method in total can also be used
on driven piles in non-cohesive soil Although we could
have found some proposes for bored piles Eqs (121 and
122) see Fig 121 and Fig 1 22 as well
19
Ultimate point resistance (psf)
12 N 3 omiddotH lt 120 N 30
(kPa) (1 2 1)Psf D
where
N30 the average standard penetration resistance
in blows per 03 m
H depth in bearing stratum
Ultimate skin friction tu
for bored piles tu N~ o (kPa) (1 22a)
for driven pil estu 2N30 (kPa) (1 2 2b)
where
N30 the average standard penetration resistance
in blows per 03 m within embedded length
of pile
Weltman and Healy (1978) taking into account Meherhofs
proposition for driven piles have introduced two coefshy
ficents for bored piles in gravels (glacial soil) Equ
123 and Fig 1 23
t = a 2 N30 (kPa ) (1 2 3)U 1
where
ai a 1 for impermeable gravels see Fig 123a
ai a 2 for permeable gravels see Fig 123b
The Polish Specification ( Specification for Design and
Construction of Large Diameter Bored Piles in Bridges
1975 Ministry of Transport) gives the ultimat e point
resistance in dependence of N30 base diameter and depth
see Tab 12 1 The Tab 121 contains values for coarse
and medium sand For other non-cohesive soils the following
coefficients are proposed
p f = S bull p f (medium sand) ( 1 2 4)S 1 S
20
where
S1 1 20 for grave lSi
f 132 080 for fine sand
13 3 070 for silty sand13i
In Fig 124 values of psf are shown for h = 10 m DP
06 m DP= 15 m and h = 20 m DP= 06 m DP 1 5 m
respectively
A few of the instrumented piles were tested and analyzed
by Wright and Reese (1979) The ultimate point and shaft
resistance in the fine and silty sand as a function of
blow count from SPT is shown in Fig 125 Results from
two additional tests reported by Koizumi (1971) are also
introduced in the figure The ultimate point resistance
is assumed to exist at a settlement equal to 5 of the
base diameter
Methods of prediction of the bearing capacity of piles
based exclusively on N30 values were presented by Decourt
1982 Below a proposition for high capacity piles excavated
and cast under bentoni te is presented
The ultimate skin friction is determined by the expression
(see Fig 126)
t = 33 N30 + 1 0 (kPa) ( 1 bull 2 5 ) u
where
N30 average value of N30 along the shaft
- for N30 lt 3 must be taken as = 3N30 - for N3o gt 5 0 must be taken as NJo= 50
The allowable point resistance can be obtained in a n
expedite way as
Psa = 33 N30 (kPa) (1 2 6)
where
N30 = average of Nat point level one metre above
and one metre below
Psa allowable point resistance
21
Decourt proposed a safety factor for the point of F = p
40 Therefore the ultimate point resistance can be
determined by the expression
(kPa) (1 2 7)
In Fig 12 7 and Fig 1 28 the above values for base
and skin friction resistance are compared respectively
Taking into account the type of soil thereis a good
correlation for ultimate point resistance The result for
ultimate skin friction is scattered but only apparently
The values for large diameter bored piles are between
the line 1a and 1b in Fig 128 Large diameter piles
have a high ultimate skin friction in relation to driven
piles (see points for bored piles in Fig 122 and DIN
4014 Part 2 1977 as well) The high values for piles
excavated and cast under bentonite have had a strong base
on the load tests (Decourt 1978 1982 and Wright and
Reese 1979)
Below the proposals are given for determination of the
values of the ultimate point resistance and the ultimate
skin friction Eqs 128 to 1214 and Fig129 1210
The ultimate point resistance
- gravel psf = 140 N30 (kPa) ( 1 bull 2 8)
for N~ 0 gt 50 blows3O cm Psf 7 MPa
- coarse sand and medium sand
(kPa) ( 1 2 9)
for N30 gt 50 blows3O cm Psf 55 MPa
- fine sand and silty sand
psf = 80 Nio (kPa ) (1210)
for N30 gt 50 blows3O cm p f = 40 MPa 5
where N3 o the average of N value near the point level as
22
h+l1
f N3o(h)dh ( 1 2 11 ) h-12
3DP see Fig 1 1 1 D
p
The ultimate skin friction for coarse sand and medium sand
tu = 1 8 N 3 o (kPa) (1212)
t (kPa) (excavated and cast (1213)u under bentonite)
where
N30= the average value of N along the shaft as h
N -
3 o = h1 f N 3 o ( h) dh ( 1 bull 2 bull 1 4 ) 0
The ultimate skin friction for N30 gt 50 blows30 cm is
assumed to be maximum as tu = 90 kPa and t = 150 kPa u
13 Allowable load of large diameter bored piles
The allowable load Qa of large diameter piles has been
expressed as
OuQa ( 1 3 1)Ft
Qa Q(s)=Qb(s) + Os(s) ( 1 3 2)
Opu + Osu (1 3 3)Qa Fp Fs
Qr lt mmiddotQf ( 1 bull 3 4)-
= universal safety factor
individual safety factor for ultimate resistance of the pile point
individual safety factor for ultimate resistance of the pile shaft
= load according to the allowable settlement
calculated load
m coefficient
calculated ultimate bearing load of the pile
23
The equations from (131) to (134) are used as
1) equation (131)
a) DIN 4014 - 1977 Ft= 2 175 15 (depending on the kind of load)
b) Polish Specification 1975 Ft = 18 16 ( -- )
1c) Trofimenkov 1974 Ft = 14307
2) equation (132)
a) DIN 4014-1977 i Q(s) = Qb(s) + Q (s) = A middotp(s) + E tAsmiddott(s)
s p 0
where Qbs) and Qs(s) are described in Fig 1423
3) equation (133)
a) Polish Specification 1974
F 25 22 depending on the kind of load p
F 1 bull 0 s
b) Wright SJ Reese LC 1979
The ultimate capacity or resistance is considered as a
random value and represented by a frequency distribution
The distribution can be described by a mean value and a
variance The distribution of the load applied to the
foundation can be described similarly The coefshy
ficients used to factor resistance and loads are called
partial safety factors Some recommended partial safety
factors for resistance under normal conditions of design
and construction are given in Tab 131 Normal control
is defined as a condition where the coefficient of variation
is less than about 035
Typical values for partial safety factors for loads are
in the range 1 to 2 depending on the type of load and
how it is applied The overall factor of safety Ft can
then be calculated from the equation
Ft = y RbullY S
24
where
YR the par tial sa f ety fac t or for resistance and
Ys the partial safety factor fo r load
The probability of fa i lur e of the foundation can be r eshy
lat ed to the factor of safety for a parti cular degree of
uncert ainty (see Tab 13 2)
c ) Tejchman Gwizdala 1979
The authors discuss adequate safety factors based on fie l d
test s by Spang (1 972) Franke (1976) Touma and Reese (1974)
Colombo (1971) Kerisel and Simons (1962) Appendirno (1973)
see Tab 1 33 Taking into account the universal safety
factor Ft= 2 0 for the tota l load settlement curves it
was estimated
i) F in the range of 111 to 237 with the average value s F = 166 and standard deviation sd = 034 s (see column 16 Tab 133)
ii) Fb in the range of 161 to 945 with the average
value Fb = 387 and standard deviation sd = 2 15
For model core d piles in laboratory conditions values of
Fs = 108 to 154 (average Fs = 132 s~ = 019) and
values of F = 280 to 5 94 (average F = 3 55 sd = 1 07)p p
see Tab 1 3 4
As a conclusion it was assumed that Fb = 40 and F 1 5 s
for l arge diameter bored piles
The investi gation has shown that for the above safety
factors settlements of piles under permissibl e loads are
10 to 20 mm There was assumed a maximum load on large
diameter piles corresponding to a settlement of 010
diameter of the piles
25
d) Bustamente Gianeselli 1 982
e) 0ecourt 1982
The safety factor is given by
F = FgmiddotFfmiddotFamiddotFw where
F 11 - skin friction g F 135 - point bearing capacity
g
Ff safety factor related to the formulation adapted
Ff= 10 for Decourts method
Fd safety factor related to excessive deformation
Fd = 10 for skin friction
As for the point Fa= 2 to 3 depending on the
pile diameter For usual cases 25 is suggested
Fw safety factor related to working load
Decourt recommends 12
Thus we will have
- for skin friction
Fs = 11bull10middot10middot12 132 - 13
- for the point
F = 135bull10bull25middot 1 2 = 405 = 40 p
4) equation (134)
a ) Polish Code 1983
Q lt mbullN r shy
where
total load coefficient (depending on the kind of load For foundation we can assume Yf = 12 )= code load
correction coeffic i ent
09 for pile foundations
m 08 for two piles
m 07 for single pile
26
N ymmiddotQu
ym material (soil) coefficient
ym 08 to 09 (Polish Code 1981)
Thus we will have
QnmiddotYf lt mmiddotym middotQu-
Yf9uFt = On m bull Ym
1 2 max = 2 14Ft 0 7 bull 0 8
1 2min = 1 48Ft 0909
The above analysis has shown different ways to determine
the allowable load The analysis is in direct connection
with mobilization of the load (versus settlement) The
dependence of total load point resistance and shaft reshy
sistance will be discussed in detail in Chapter 14
In the authors opinion taking into account the above
analysis the allowable load should be determined based
on the equation 133 ie based on individual safety
factors for ultimate point and shaft resistance Proposed
values of F and F in literature are shown in Tab 135 s p The average values are Fs = 145 and Fp = 3 38 respectively
Taking into account that the bearing capacity is determined
based on the results from sounding measurements direct from
a place near the piling without a ny indirect correlation
the allowable load of large diameter bored piles is given
by the equation (133a)
( 1 3 3a)
where F = 30 and F 13 are proposedp s
27
14 Determination of settlement of larqe diameter bored
piles based on static cone penetration tests CPT
Determination of ultimate point and skin friction resistance
based on static cone penetration tests has been discussed
in Chapter 11 above Based on the results of this calcushy
lation and on Chapter 13 we can establish an approximate
relation between point resistance shaft resistance and
total load on one hand and settlement on the other However
the approximation gives a wide scatter especially for base
resistance as can be observed in Fig 141 to Fig 144
Only the first part of the point resistance - settlement
curves are in good agreement with measured values It can
be observed in Fig 145 that the average correlation
coefficient n = 098 and standard deviation sd= 029
This way of calculation can be used only for rough calcushy
lation (see Chapter 13)
In Chapter 11 also measured point resistance - settlement
curves were shown The base resistance increases gradually
with increasing pressure and settlement Below the cur7
vature of the point resistance - settl ement curve will be
examined It is assumed that this curve can be described
as a part of the hyperbola curve Thus if the ratio of
the measured settlement (s ) to the point resistance (p)
is plotted against the measured settlement the result
will fall closely to a straight line with the equation
( 1 4 1)
where a 1 and b 1 are constants (see Fig 1 46a and Fig
14 6b)
Then the point resistance - settlement realtionship can be
expressed as a hyperbola
s p = ( 1 bull 4 2)
The constant is the initial s lope of the point resistanceshya 1
settlement curve ie a 1 = t~a The inverse of the constant
28
b 1 is the vertical tangent (asymptote) to the curve 1ie for s = 00
bf= ~ If the ultimate point reshy1
sistance psf is equal to bf (psf=bf) the whole point
resistance settlement curve will be a hyperbola type
Now the Eq 1 4 2 can be written as
s s ( 1 4 3)a) p s or b) p = a+__sect_a1 + 1 Psfbf
If the ultimate point resistance is smaller than bf only
a part of the hyperbola curve ought to be considered
Further the Eq 14 3 will be written as
p ( 1 4 4)
where
poundf_ correction factor for hyperbola point Psf resistance-settlement relationship
Taking into account the discussion in Chapter 11 the
ultimate point resistance psf = qcp based on the CPT measurements
Therefore the relationship between the point resistance
the sett l ement and the CPT result can be expressed as
s p (1 4 5)s
The correction coefficient v 1 will cause a change of the
position of the vertical asymptote bf in r elation to the
ultimate point resistance q bull This means that we take cp into account a different part of the hyperbola curve for
the description of the point resistance-settlement relationshy
ship
Now if we want to use the equation (145) in practice
we must determine the constant and the coefficienta 1 v 1 (assumed that q is determined ear l ier Chapter 11)cp
29
The constant a 1 and t h e coefficient Vi have been detershy
mined based on fi e ld tests according to pi l es No 1 - 20
see Tab 14 1 and Tab 1 1 9 as wel l The values of
a 1 versus the point diameter D and the ul timate pointp
resistance respectively are shown in F i g 147 and Fig
148 Fig 1 47 shows that a 1 is independent of the
point diameter D Based on Fig 148 it can be assumed p
that
28-4bullq (1 4 6)cp
This correlation has been examined with data of the
literature see Fig 1 49 and Appendix 141 to 1 45
(Note there were no static penetration tests and qcp was determined based on a correlation made by Bergdahl
(1982))
A good correlation with equation 146 can be seen taking
into account the safety factor in the DIN 4014 Part 2
(1977) bull
The correction factor v 1 versus the poi nt diameter is shown
in Fig 1410 I t is assumed that the correlation is
V1 = 3 0 - D ( 1 4 7)p
where D is in m p
The above equations ie 146 and 147 were assumed for
a later analyses see Fig 14 11 and Fig 1412 The
piles No 1 to 20 were examined taking into account Eqs
14 5 14 6 and 1 4 7 The result of this cal cul ation is
presented in Fig 1 413 to Fig 1 4 18 and in Tab 1 4 2
respectively In Fig 1413 the calculation way for pile
No 2 is shown as an example
In Fig 1414 to Fig 1 417 measured and calculated
values of the point resistance versus settl ement can be
compared In tota l good correlation exists for all the
30
pressure-settlement curves Values of q from static cp
cone penetration tests and generalized values of anda 1
v 1 were considered Only for piles No 17-20 qcp was
assumed as the point resistance for s = 010 D because p
the static penetration test results were inaccessible
The similar comparison is shown in Fig 1417a for piles
in sand based on experimental results (Tuoma Reese 1972
and Wright Reese 1979) where the ultimate case resistance
was assumed as the resistance at a base settlement of 005
D The relative base resistance is the mobilized base p resistance divided by the ultinate base resistance The
curvature of the proposed point resistance settlement shy
curve to mean value proposed by Wright and Reese is excellent
However the constant a 1 and the coefficient v 1 were
determined for sand only In the future they should be
examined especially for gravel and silty sand based on
field tests Until then in the authors opinion the
values of v 1 can be chosen from Eq 147 for all nonshy
cohesive soils But for a 1 there is proposed
at = gt bulla (1 4 8)1
where
gt- 1 = 080 for gravel
gt 2 120 for silty sand
This proposal is shown in Fig 14 11 as dashed lines
A good correlation can be seen with the investigation by I
Kiosimiddotnski for sandy gravel and on the safety side with
the investigation by Tuoma and Reese for silty sand (see
Fig 149)
In Fig 1418 all calcul ations for pile No 1 to 20 are
summarize d The correlation coefficient n is defined as
the calculated point resistance p(s) divided by measured
point resistance p(s) For totally 126 points from 20
curves an average of n = 098 with standard deviation
31
al= 023 was obtained see Fig 1418 A similar result
can be observed for the range usually assumed of the
allowable settlement for sinqle large diameter bored
piles as
for
- for
- for
s
s
s =
10
20
30
mm a
mm
mm
verage n10 II
II
mm 089
095
099
and sd =
and sd
and sd
031
027
026
It can be questioned whether the sonstant a 1 can be deshy
termined in different ways The constant a 1 is the initial
slope of the point resistance-settlement curve as menshy
tioned above Then we can use all methods for determination
of settlement of a pile point The range of validity of
these methods then must be determined This will be shown
later
In order to be able to design the total load settlement
curve the skin friction resistance-settlement relationshy
ship must be determined The ultimate skin resistance of
large diameter bored piles was determined in Chapter 11
(based on static penetration tests) and in Chapter 12
(based on standard penetration tests)
In the past a lot of field tests have been done on the
mobilization of the shaft resistance versus pile settleshy
ment In this subject there is a rather good agreement
in the whole investigation for cohesive and non-cohesive
soil
Some results and opinions on thispresented in the literashy
ture during the last few years are shown below
Ultimate shaft resistance versus settlement
1) BurlandJB Butler FG Duncan P (1969)
-The shaft l oadsettlement curve is derived using a=0 3
with 90 ultimate load being mobilized at 025 in
settlement(~65 mm)
- soil London clay
- see Fig 1 419
32
2) Touma FT Reese LC (1974)
- The failure of the sides of the shaft takes place
at a downward movement of about 04 in (10 mm)
- soil sand
- see Fig 1420
3) Tomlinson HJ (1977)
- The maximum shaft resistance is mobilized at a
settlement of only 10 mm (or j in)
- soil stiff clay
- see Fig 1421
4) Klosinski B ( 1977)
- It was assumed that skin friction increased proshy
portionally to pile settlement up to the limit value
s bull This value depends on soil conditions and pile0 diameter and is usually from 3 to 8 mm For soft
compressible soil it may be grater than 10 mm
- soil cohesive soils
- see Fig 1422
5) Franke E Garbrecht D (1977)
- At settlement of 2 to 3 cm which are normally
allowed in Germany under working loads for buildings
not very sensitive to differential settlementsthe
skin friction is almost always fully mobilized
- soil sand
6) DIN 4014 part 2 (1977) and Franke E (1981)
- The skin friction Tm is approximated as diameter
independent having failure settlements of smf = 2 cm
in sand and 1 cm in clay
- soil sand and clay
- see Fig 1423
33
7) Reese By L (1978) Reese By L Wright SJ (1979)
(1978) The maximum skin friction being developed at
an average downward movement ranging from about 05shy
2 of the shaft diameter The average of six load tests
reported by Whitaker and Cooke (1966) are a lso plotted
for comparison
- soil stiff clays
- see Fig 1424 and Fig 1425a
(1979) The relative settlement is the average settleshy
ment of the butt and base devided by the shaft diameter
The mean curve maximises at a relative settlement of
about 002 D
- soil sand and clay
- see Fig 1425b
8) Tejchman A Gwizda3a K (1979)
- A clear differentiation of the distribution of shaft
and base resistances is observed for changing settleshy
ment For fairly small settlements the shaft resist shy
ance increases quite fast and the ultimate values
are reached soon while the base resistance increases
gradually with increasing loads and settlements withshy
out clearout ultimate values it can be assumed that
complete mobilization of shaft resistance corresponds
to settlements equal to 001 or 002 diameter of pile
- soil cohesive and non-cohesive soils
- see Tab 131 and Fig 1 426
9) Promboon S Brenner R P (1981)
- Load distribution and load transfer curves disclose
that most of the load is carried by shaft friction
which is developed at small displacements in the order
of 10 mm
- soil Bangkok clay
- see Fig 1427
34
10) Prodinger w Veder Ch (1981)
- The maximum value of skin friction resistance
occurred for a total settlement of 12 mm
- soil silty clay and sand
- see Fig 1428
11) Farr JS Aurora RP (1981)
- Ultimate load transfer was recehed (or nearly reached)
at a relative settlement of about 04 in (10 mm)
- soil gravelly sand
- see Fig 1429
12) Decourt (1982)
The skin friction resistance is totally mobilized
with deformations of about 10 mm or at the most 15
mm regardless of shaft dimensions This observation
of ours seems to clash with the opinions of other
authors who seek to relate the deformation necessary
for full skin friction mobilization with the shaft
diameter
- soil cohesive and non-cohesive soil
In Tab 143 all these results are shown Depending on
the kind of soil the following v a lue s of ultimate settleshy
ment for shaft can be assumed
- averages 142 mm (sd 5 3 mm) for sand
- averages 100 mm (sd = 21 mm) for cohesive soil
averages 726 mm (sd 67 mm) for claysand
It can be observed (see Fig 1419 to 1428) that the
shaft friction resistance increases proportionally to
the pile settlement up to the above limit value and
thereafter becomes constant
35
Taking into account what was mentioned earlier on point
resistance settlement relationship and the above results
a relationship between total load point resistance and
shaft resistance on one hand and settlement on the other
can be made see Fig 1430
It is assumed on the safety side that the following
ultimate settlement (S~) exists for the shaft resistance
of large diameter bored piles
SS1 ) 200 mm for non-cohesive soil u SS2) = 100 mm for cohesive soil u SS3) 15 0 mm for claysandu
In Fig 1 430 the curve Q (s) is calculated based on p
the equation 14 5 or 144
The values of psf in equation 144 can be calculated
based on other methods as well
The total load-settlement relationship is obtained by
summing up point and s haft resistance as
Q (s) = Q (s) + Q (s) (149)s p
for each point
Now the allowable load can be determined from equation
133a and versus the allowabl e settlement as
Q (s) = Q (s) + Q (s) (1410)s p
where s lt Sa
Sa= the allowable settlement of the pile
The analysis allows determination of the approximative
load settlement dependence without calculating the settleshy
ment for non-cohesive soil In Fig 1431 it is shown
36
In Tab 144 the settlement for allowable point reshy
sistance q5P according to equation 133a is shown
as well The average settlements= 198 mm (sd=78 mm)
is obtained This value is similar to the assumed ultimate
settlement of shaft for non-cohesive soil The ultimate
settlement for point resistance is assumed s = 010 Dp as mentioned earlier
37
15 Initial slope of pile point resistance shy
settlement curve
Settlement of piles and pile foundations can be cal culated
based on
- empirical correlations
load-transfer methods using measured relationships
between pile resistance and pile movement at various
points along the pile
- theory of elasticity that employs the equations of
Mindlin for subsurface loading within a semi-infinite
mass
- numerical methods and in particular the finite element
method
- use of in-situ tests (Cone Penetration Test Standard
Penetration Test Pressuremeter Test)
The critical slope of the pile point resistance-settlement
curve is important for calculation in chapter 14 The
constant a1 can be determined from all the above mentioned
methods
Comparison is made to Berggrens and Schmertmanns methods
below (see Berggren 1981 as well)
6sIn Tab 151 (No 1 2 3) the values of a 1 =~p for s =
10 mm and s = 20 mm (measured for large diameter bored
piles No 1 to 24) are compared to the calculated values
according to the modified hyperbola method (see Fig 14 6)
It can be seen that these calculated values are between
s = 1U-2u mm but rather closer the measured values for
the settlements= 10 mm see correlation coefficient n 6
and n 7 in Tab 151 respectively The average correlat i on
coefficent for the settlements= 10 mm is n9 = 108 and
the standard deviation is sct = 014 The comparison to
Berggrens and Schmertmanns methods for s = 20 mm ( see
Berggren 1~81 and Tab 151 as well) shows that the
results based om these methods give too high values of a 1 bull
38
The average values are ne= 143 sd = OJ3 and ng= 137
sd = 037 for Berggrens and Schmertmanns methods
respectively A bit better agreement can be observed
for Schmertmanns method
Taking into account the results in Tab 151 ana Tab
15l it must be assumed that for the determination of
a 1 the pile point contact pressure p(a1) should be
assumed as the ultimate point bearing capacity devided
by about 4
p(ai) - ( 1 bull 5 1 )
Most of the methods for determination of settlement are
based on the theory of elasticity The settlement ot the
pile point can be expressed as the average settlement of
a rigid circular foundation from the equation
11-Dp 1-v 2
s = p -4- -E-bull microd (1 ~ 2 J
where
p pile point contact pressure
E Youngs modulus
D diameter ot pile pointp ) = Poissons ratio
microd = depth factor
The range of validity of the pile point contact pressure
was determined in equation 151 Youngs modulus has an
important meaning lt can be determined from triaxial
tests or oedometer tests The relationship between the
constrained (oedometric) modulus Mo and Young s modulus
Eis dependent on Poissons ratio v as expressed by the
equation
E = l 1 + V ) ( 1 - 2 V ) Mo ( 1 bull 1 bull 1)- 1-v
39
TaKing into account the analyses made ny Chaplin (19b1a
1 961bJ Janbu (1 963 1970 1973J Andreassen (1973)
Duncan and Cheng (1970) Tejchman anct Gwizdala (1979)
Gwizdala (1978) Franke (1981) Berggren (1981) Withiam
and Kulhawy (7981) and the present investigation the
calculation of settlement is proposed to be
s = 24 bull p bull ~ D bull 1-v 2 bull micro d (154)Do o E
where s (r1)
p (kPa)
Dp (m)
E (kPa)
D0 =10 m
micro = 05 + 01 vfrac34E (1 5 5)d vs
but 05 lt microd lt 10-tip= p - (J (ovs see Fig 151)vs
E =Et= Kbullpat (Oo )n [1- Rf(1-sinltj) 101 - 03 ) 12 (1 5 6)2 c cosltP + 2o 3 sinltP 1Pat
in which K n and Rf= hyperbolic stress-strain parameters
Pa= atmosferic pressure ando 1 o 3 and o0 are determined by
averaging the concrete and soil vertical and radial stresses
near the pile point according to Fig 151 Then the
stresses at the pile point level are h
(J vs = L
0 Yi h
l vertical stress in the soil
0 hs Ko h
0 vs radial (horizontal) stress in the soil
0 vc L ye h -l
vertical stress in the concrete 0
0 hc K oc a vc radial (horizontal)
concrete stress in the
40
K at rest soil lateral stress coefficient 0
K c lateral stress coefficient for fluid fresh concrete0
K 1 0 oc
and average values
a 05(a +a)V vc vs
1 1 - shy~ = -(a +a+a I = -3 (av+2ahJ the applied mean normal stress0 j Z X y
Assuming this model calculation results for piles No 1-24
(see Tab 11~ as well) are shown in Tab 153
The piles are embedded mainly in medium sand to fine sand
For this kind of soil it can be assumed (soil parameters
from field or laboratory tests were inaccessible)
~ = 35deg c = 0 R~ = 09 n 05 v = 025 K c 10l 0
K = 04 Pat= 1UO kPa ye 24 kNrn 3 y = 14 kNm 3 bull0 C
Moreover in Tab 153 the following symbols are used
p(a1 ) - pile point contact pressure according to equation
1 bull 5 1
s(a1) - settl ement of pi l e point according to equation
143 and Tab 141
pound TT ( 2E = s bull Dp bull i 1-v ) according to equa~ion 152t
E~ Et bull microltl
EI
K = ro~ - according to equation 1 bull 5 6 p bullO middotA2
a~ o
E = E voD middot D middot ~4 ( 1 - v 2 ) according to equationt S p O 0
1 5 4
Et= E microd
K = according to equation 156 V PatmiddotaomiddotA2
41
The calculation results of Youngs modulus E = Et and
dimensionless canpressionrro1ulus for piles to 1-24 are shown
in Fig 152 to 155 using equation 152 and 15b
or equation 1~4 and 156 respectively lt can be obshy
served that the scatter in Fig 153 and Fig 155
where the influence of tne pile diameter is reduced
compare equation 154 is less than in the other figures
The reduced influence was made after observations from
field and laboratory tests while the equation 152 is
taken direct from theory of elasticity These values of
E and K are in good correlation with published values in
literature The values of Youngs modulus versus the
relative density of soil are compared to literature values
see Fig 15b Based on the analysis in this chapter it
can be assumed that
E = 9-ql 3 ( 1 bull 5 7)cp
where qcp is in accordance with equation 117
The calculation results based on this proposal are incluced
in Tab 1 5 3
The c a lculate d s e ttlements based on e q ua tion 154 and
157 are shown in column 23 and the values of the
correlation coef f icie nt (n= Seal ) in column 24 respectshyimeas
ively
The dimensionless canpression modulus can be d e termined as
K = 15Ubullq (qcp in MPa) (1 5 8)cp
see column 25 Tab 153
The calculation results based on the K compression modulus
according to equation 158 156 and 1 5 4 are shown in
columns 25 26 2 7 28 and 29 in Tab 153
42
For comparison and for determination of the range of
validity of this method the caLculation results of
pile point pressure for settlements s = 10 mm s = 20 mm
s = 30 mm (see Tab 141) according to equation 157
and 154 are shown in columns 30 to 35
The results obtained in Tab 153 confirm the possibility
to use the proposed method to calculate the initial part
of the pile point resistance settlement curve of large
diameter bored piles in non-cohesive soil and the initial
slope of this curve as well
A simple model has been proposed based on the theory of
elasticity ana the tangent modulus defined by Janbu (1963)
and Duncan amp Chang (1970)
A new approach according to the pile diameter depth factor
and principal stress is proposed
The settlement of the pile point can be made up to a point
pressure according to equation 151 on up to a settlement
of about s ~ 20 mm (30 mm)
-- The application of v Op in equation 1 5 4 a llows us ing
Youngs modulus as independent of the pile diameter
opposed to Bazants a nd Mosopusts (1981) proposal where
Youngs modulus wa s determined versus the pile diameter
The equation 1 5 6 takes into account the dependence of
Youngs modulus on depth (or overburden pressure) as
well
In the method field test (Cone Penetration Test) or
laboratory tests (hyperbolic stress-strain parameters
can be used
Comparison of the method to 24 availa ble load test r e sults
or large diameter bored piles in sand shows good a greement
to calculated and measured values
43
REFERE~CES
Adamczyk J (1978) Okreslanie udzwigu pali wierconych
za pomoca sondy statycznej (Bearing capacity of bored
piles based on the static sounding) Inz i Bud No 7
pp 253-257
Andreasson L (1973) The compressibility of cohesionless
soils Thesis Chalmers University of Technology
G6teborg (in Swedish)
Appendino M (1973) Comportamento di un palo di grande
diametro strumentato Rivista Italiano di Geotechnica
No 3 pp 115-118
Butterfield R Banerjee P (1971) A rigid disc embedded
in an elastic half space Geotechnical Engineering
Vol 2 pp 35-49
Bozant z Mosopust J (1981) Drilled pier design based
on load settlement curve X ICSMFE Stockholm Vol 2
pp 615-619
Begemann HK (1982) Cone penetration tests pile bearing
capacity and the thesis of Rollberg Proc of the Second
European Symposium on Penetration Testing Amsterdam
pp 433-438
Berggren B (1981) Bored piles on non-cohesive soils shy
settlement and bearing capacity (in Sweden) Thesis
Department of Geotechnical Engineering Chalmers
University of Technology G6teborg
Bergdahl UB (1979 1982) Sonderingen und in situ Messungen
Wien 18-19 Juni 1979 - Private information 19821983
Bustamante M Giane selli L(1982) Pile bearing capacity
prediction by means of static penetrometer CPT Proc
of the Second Europ Symp on PenTest Amsterdam
Vol 2 pp 493-500
Chaplin TK (1961a) An experimental study of the settleshy
ment of footings in sand PhD Thesis Univ of
Birmingham
44
Chaplin TK (1961b) Compressibility of sands and settleshy
ments of model footings and piles in sand 5th Int
Conf on Soil Mech a Found Engng Vol 2 p 33 Paris
Colombo P (1971) Observazoni sul comportamento ltli pali
a grande diametro Rivista Italiana di Geotechnika
No 3 pp 163-172
Dahlberg R (1975) Settlement characteristics of preconshy
solidated natural sands Swedish Council for Building
Research D11975
De Beer EE (1964) Some considerations concerning the
point bearing capacity of piles Proc Syrop Bearing
Capacity of Piles Boorkee I pp 178-204
Decourt L Quaresma AR (1978) Capacidade de Carga de
Carga de Estacas a partir de Valores de SPT VI Conshy
gresso Brasilerio de Mecanica dos Solos e Engenharia
de Fundacoes - Rio de Janerio - ABNS
Decourt L (1982) Prediction of the bearing capacity of
piles based exclusively on N values of the SPT Proc
of the Second Europ Syrop on Penetration Testing
Amsterdam Vol 1 pp 29-34
Duncan MJ Chang CV (1970) Non-linear analysis of stress
and strain in soils Journal Soil Mech Found Div Vol
96 SM5 pp 1629-1651
Durgunoglu HT (1979) Effect of foundation embedment on
stress and deformation distributions Third Int Conf
on Num Meth in Geomechanics Aachen pp 925-928
Farr JS Aurora RP (1981) Behaviour of an instrumented
pier in gravelly sand Proc of a session Drived Piers
and Caissons sponsored by the Geotech Eng Div of the
ASCE Nat Convention St Louis Missouri pp 53-65
Franke E (1981) Point pressure versus length and diameter
of piles X ICSMFE Stockholm Vol 2 pp 717-722
45
Gregersen os Aas G and Dibiagio E (1973) Load tests
on friction piles in loose sand Proc of the Eigth
International Conference on Soil Mech Moscow USSR
Vol 21 pp 109-117
Gwizda1a K (1978) Behaviour of large diameter bored piles
in non-cohesive soil (in Polish) Archiwum Hydrotechniki
Vol XXV No 2 pp 183-217 (English summary)
Huizinga TK (1951) Application of Results of Deep
Penetration Tests to Foundation Piles Building Research
Congress Vol 1 p 173
Janbu N (1963) Soil compressibility as determined by
oedometer and triaxial tests Proc Europ Conf Soil
Mech and Found Eng Vol 1 p 19 Vol 2 (Discussion)
p 17 Wiesbaden
Janbu N (1970) Grunlung i geoteknikk Tapir Forlag NTH
Trondheim
Janbu N Bjerrum L Kjaernsli B (1973) Soil Mechanics
applied to some engineering problems Norw Inst Publ
No 16 Oslo
Japanese Society SMFE (1981) Present state and future trend
of penetration testing in Japan Separate report at
X ICSMFE Stockholm
Kjekstad O Lunne T (1979) Soil parameters used for design
of gravity platforms in the north sea Second Int Conf
on Behaviour of Off-shore structures London Vol 1
pp 175-192
Klosinski B (1977) Bearing capacity of large diameter bored
piles IX ICSMFE Tokyo Vol 1 pp 609-612
Laboratory for soil mechanics Delft (1936) The predetershy
mination of the required and the prediction of the
resistance of piles Proc 1 Int Conf on Soil Mech
and Found Engng Cambridge (Mass) I p 181
46
Matich M and Stermac A (1971) Settlement performance of
the Burlington Bay Skyway Canadian Geotechnical Journal
Val 8 pp 252-271
Mccammon NR and Golder HQ (1970) Some loading tests
on long pipe piles Geotechnique London England
Val 20 pp 171-184
Meigh AC (1971) Some driving and loading tests on piles
in gravel and chalk Proc of the conference on beshy
haviour of piles London England pp 9-16
Mitchell JK Gardner WS (1976) In situ measurement
of volume change characteristics American Society of
Civil Engineers Specialty Conference on In-situ
Measurements of Soil Properties Raleigh 1975 Proc
Val II pp 279-345
Mezenbach E (1961) The determination of the permissible
pointload of piles by means of static penetration tests
Proc 5 Int Conf on Soil Mech and Found Engng
Paris II pp 99-104
Meyerhof CG (1956) Penetration tests and bearing capacity
of cohesionless soils Proc Amer Society of Civ Engng
SM 1 Pap 866 pp 1-19
Meyherhof GG (1 976) Bearing capacity and settlement of
pile foundations Proc Amer Society of Civ Engng
Journal Geotechnical Engineering Division Val 102
No GT3 pp 197-227
Mohan D Jain GS and Kumar V (196 3 ) Load bearing capacity
of piles Geotechn Val XIII pp 76-86
Nixon I (1982) Standard penetration test State of the
art report Proc of the Second Europ Symp on Pen
Test Amsterdam Val 1 pp 3-20
47
Nunes A Vargas M (1953) Computed bearing capacity of
piles in residual soil compared with laboratory and
load tests Proc of the Third International Conference
on Soil Mechanics Zlirich Switzerland Vol 2 pp 75-79
Nordal S Grande L Janbu N (1982) Prediction of offshy
shore pile behaviour The Norwegian Institute of
Technology Trondheim
Ohde J (1939) Zur Theorie der Druckverteilung im Baugrund
Der Bauingenieur Vol 20 No 3334 p 451
Parroth E (1972) Einfache Formel zur Vorausbestimmung der
Tragfahigkeit von Standpfahlen mit Hilfe der Sande
Bautechn 9 pp 312-314
Poulos HG Davis EH (1980) Pile foundation analysis
and design New York - J Wiley and sons
Prodinger W Veder Ch (1981) Bearing capacity of floating
groups of diaphragm walls Proc X ICSMFE Stockholm
Vol 2 pp 809-814
Promboon S Brenner R (1981) Large diameter bored piles
in Bangkok Clay Proc X ICSMFE Stockholm Vol 2 pp
815-818
Reese L (1978) Design and construction of drilled shafts
ASCE JSMFD Vol 104 No OT1 pp 95-116
Rodin s Corbett BO et al (1974) Penetration testing in
United Kingdom state-of-the-art-report Proc Europ
Symp on Penetration Testing 1 Stockholm pp 139-146
Rollberg D (1976) Bestimmung des verhaltens von Pfahlen
aus sandier und rammengebnissen Heft 4 FBG Technische
Hochschule Aachen
Rollberg D (1977) Determination of the bearing capacity
and pile driving resistance of piles using soundings
Publications of the Institute for Found Eng Soil Mech
Rock Mech and Water Ways Construction Aachen Vol 3
48
Schmertmann J (1970) Static cone to compute static
settlement over sand Journal of the Soil Mech and
Found Division ASCE SM3 pp 1011-1043
Schmertmann J Hartman JP Brown PR (1978) Improved
strain influence factor diagrams Journal of the Soil
Mech and Found Division ASCE GT8 pp 1131-1135
Shibata T Hijikuro K and Fominerga M (1973) Settlement
of a blast furnace foundation Proc of the Eighth Int
Conf on Soil Mech Moscow USSR Vol 13 pp 239-242
Spang J (1972) Die Bestimmung der Tragfahigkeit von Grossshy
borhpfahlen (I) Strassen und Tiefbau No 2 pp 339-355
Senneset K (1974) Penetration testing in Norway State-ofshy
the-art-report Proc Europ Symp on Penetration Testing
Stockholm I pp 85-95
Tejchman A Gwizdala K (1979) Analysis of safety factors
of bearing capacity for large diameter piles Proc VII
ECSMFE Brighton Vol 1 pp 293-296
Thorburn s and Mac Vicar R (1971) Pile load tests to
f a ilure in the clyde alluvium Proc of the conference
on behaviour of pile s London England pp 1-7
Trof imenkov JG (1969) Accuracy of determining the bearing
capacity of piles based on results of static penetration
sounding of soils Osnovaniya Fundamenty i Mekhanika
Gruntov 4 (Translation Soil Mechanics and Foundation
Engineering 4 p 248)
Trofimenkov JG (1974) Penetration testing in USSR Stateshy
of-the-art report Proc Europ Symp on Penetration
Testing Stockholm I pp 147-154
Tuoma F and Reese L (1974) Behaviour of bored piles in
sand JSMFD ASCE Vol 100 No GT 7 Proc Paper 10651
July pp 749-761
49
Van der Veen C (1953) The bearing capacity of a pile
Proc 3 Int Conf on Soil Mech and Found Engng
Zlirich II pp 84-90
Van der Veen C and Boersma L (1957) The bearing capacity
of a pile predetermined by a cone penetration test
Proc 4 Int Conf on Soil Mech and Found Engng
London II pp 72-75
Weltrnan AJ Healy PR (1978) Piling in boulder clay
and other glacial tills Construction Industry Research
and Information Association UK-Report PG 5
Withiam J Kulhawy F (1981) Analysis prodecure for
drilled shaft uplift capacity Proc of a session
Drilled piers and caissons ASCE St Louis Missouri
pp 82-97
Woodward R Lundgren R Boitano J (1961) Pile loading
tests in stiff clays Proc of the Fifth International
Conference on Soil Mechanics Paris France Vol 2
pp 177-184
Wright SJ Reese LC (1979) Design of large diameter
bored piles Ground Engineering Vol 12 No 8 pp
17-22
DIN 4014 Cods Teil 2 (1977) Bohrpfahle Grossbohrpfahle
Herstellung Bemessung und zulassige Belastung
Polish Specification (1975) Specification for design and
construction of large diameter bored piles in bridges
Ministry of Transport Warsaw (in Polish)
Polish Specification (1979) Specification for prevision
bearing capacity of the piles on the presiometer test
and static sounding ENERGOPOL Warsaw (In Polish)
Polish Code (1983) Foundations Bearing capacity of piles
and pile foundations
5 1
FIGURES
bull bull
53
Ou
+ sect raquo iir 1
4 + D
h + +Osu
bull + t2 =n- Dp
LDpl r f 1
Opu
Fig 1 1 1 Bearing pi le in the soil
J_
fp
080
070
060
050
0 40
030
020
010
q~ [MPa ]000 -+--~-~-~-~------------------------=-shy
00 20 4fJ 60 80 10 0 120 14fJ 160 180 200
Fig 1 1 2 The point resistance factor fp
(Trofimenkov 1974)
54
ts
160
140
120
100
080
060
040
020
q~5 [ kPa)
0Q0--1------~-~-~-~-~-~ - - ---=- -- shy000 10 20 30 40 50 60 70 80 90 100
Fig 1 1 3 The shaft resistance factor fs middot (TYofimenkov 1974)
f s
200
180
160
140
120
100 2 3 4 5 6 7 8 9
Fig 1 1 4 Shaft friction factor f depenshys
ding of the soil density (Senneset 1974)
55
Q~ [kN]
1500
1000
500
0-r-----------r----~- Q~ [kN] 0 500 1000 1500
Fig 1 1 5 Comparison of the pile resisshytance determined by the results of static sounding and load tests (TYofimenkov 1974)
D f f
0
Fig 1 16 Equivalent cone resisshytance (Bustamante 1982)
56
E u shy0 ~
QI I ltII ltII
~ a C QI
O C
D
w gt
0
Cone res istance Point resistance
80 160 240 320
05
10
15
e d
20
ver y dense Cone resistance 300 kgcm2
Dpcm
a =45 b = 30 C 60 d = 100 e = 150
Fig 1 16a
Cone resistance _ qc
80 160 80 160 qc [ k g cm2 ]p
05
10 10
15 15 e d a
e d20
Dense Medium2 2200 kgcm 100 kgcm
Cone resistance and point resistance of piles versus overburden pressure (Kerisel 1965)
Point resi stance - p(for s=2cm) of the pi le for
15 sett Iement s = 2 cm
10
5
E u
uJ1 o-~----shya er O 804 2500
32 56
I 1
L oose50 -I =25 Very loose L
----~--shy5000 7500 80 98
~-----lmiddotI1--------2 10000 12500 31400 =Flcn)
112 123 200 =Dplcm)
Fig 1 1 6b Point resistance versus cone resistance and pile diameter (Franke 193)
57
1
fp
080 (D Gravel
0 Coarse sand Medium sand 070
reg Fine sond Silty sand
060
050
040
030
020
010
qc [MPa]000-+----r--~-~-~--------r----r----r-~-~-- -shy
oo 20 40 60 80 100 120 140 160 180 200
Fig 1 1 7 Point resistance factor f (proposal) p
58
300
250
200
150
100
qc [MPa I50-+---------------r---r---r---r----r------------- shy
oo 20 40 60 80 100 120 140 160 180 200
Fig 1 1 8 Shaft resistance factor fs (pr oposal)
59
Bustamante (seetab 115 I
l fp
G)
0 Gravel
Coarse sand Medium sand
cl
b)
t-----l
1----1
080 reg Fine sand Silty sand a) D
070 Polish
060 Specification
( 1979) 050
040
030 CD 020 0
reg 010
qc [MPa]0 00 -+-------------------------------------=--shy
oo 20 4o 5o 80 100 120 14o 15o 180 200
Fig 1 19 Point resistance factor f comparisonp
Bustamente ( see tab 116 I 300
a) ~
250 b)~
cl~
200 Polish Specification ( 1979 l
150
100
q [ MPa]504---~--~--~----- ---___
00 20 40 60 80 100 120 140 150 180 200
Fig 1 1 10 Shaft resistance factor fs comparison
60
1 fp
~
080 CD CD Gravel
070 0 reg Coarse sand Medium sand
060 0 Q) Fine sand Silty sand
05
040 Franke (1973)___
030 DIN 4014
020 Part 2 1977
( see tab113 l 0shy
--shy --a - 010 C---0 Piles without enlarged bases
D---0 Piles with enlarged bases qc [MPa ] 000
00 20 4JJ 60 80 90 100 120 140 160 200
Fig 11 11 Point resistance factor f comparison p
fs
DIN 4014 Part 2 1977 ( see tab 114 l
300
~ 5 lt qc lt 10 MPa 50
~ 10 lt qclt 15 MPa
~qcgt15MPa
200
150
CD
100 0 0
qc [ 1Pa] 50-t-----T-~----T-r-~----------------shy
OO 20 40 6JJ 80 100 120 14JJ 160 180 200
Fig 1 1 12 Shaft resistance factor fs comparison
61
Measured p [ MPa]
( s=010 Dp) 10
9
8
7
6
5 0
4 0 61
3
I 2
Calculated qcp [MPa]
0 0 2 3 4 5 6 7 8 9 10
Fig 1 1 13 Comparison of experimental and aomputed values of the pile point resistanae
62
Contact pressure ( MPa ]
2 I 6
50
100
E E 150 Ill
c QI
E Sett lement for QI
calculated qcpai V) 200
Fig 1114 Results from load tests on piles No 1 and 5
Contact pressure [ MPa I 0 2 I 6
01---------------------1
50
E E 100 Ill
Settlement forc QI calculated qcp E ~ ai
I V) 150
Fig 1 1 15 Results from load test on piles No 7 and 5
63
Contact pressure p [ MPa] 0 2 3 4 6
0-t=-----~-~-----
E E
100 1)
c CU E 2 QI V) 150
Fig 1 1 16 Results from load test on piles No 9 10 and 11
Contact pressured p [MPa] 0 1 2 3 4 5
o~~~=------------___-~-shy
50
100
E E
i 150
CU E CU
-a V) 200 2
Fig 1 1 17 Results from load test on piles No 12 and 13
c
-------------- -
64
Contact pressured
0 1 2 3 4 p [ MPo] ~o __L____1_____J_____L___
50
100
150
E
E
IJ) 200
c a
E a
~ 250
Fig 1 1 18 Results f Pom load tests on piles No 2 4 6 and 8
p [MPa]
60
50
tO
30
~
Pile Pile Pile Pile
Pile No18
------+ Pile No17 + ~_ ---0 Pile No 19
bullbull - --bull Pile No 20
- ~middot -shy-shy -(y I Settlement for
20 tO 60
No17 +-middotmiddot- V 70 No 18 bull--- V 9o No19-middot- V 120 No20bull---- V150
qcp 3
80 100 120 140 160 s (mm)
Bose resistance
Fig 1 1 lBa Point Pesistance vePsus settlement (Spang 1972J
65 Cone resistance qc [ MPa]
0 10 20 30
mud
5 ~ lll
0 c 0
c CD
peat
10 sand
Ill N
10=10
D=lOOOmm
1540=40
20__________________
[ml
Fig 1 119 Pile No 1 and results from static cone penetration test
Cone resistance qc [MPa l 0 10 20 30
7N V degW = 0+--------------------i
mud
5
lll
~ C 0
c peat~
10
sand lll N 1D15
15l lD=1500mm
40=60
20l---------=-------__J
[ml
Fig 1 1 20 Pile No 3 and results from static cone penetration test
66 Cone resistance qc [MPa]
10 20 II 3 igt pound ~
mud+peat
fine sand+ silt
50=11
l lo-11oomm
40= 44
10
15l____________c
[ml
Fig 1 1 21 Pile No 5 and results from static cone penetration test
Section Cone resistance Pile
0 0
5 10 15 20 25 30 qc [MPa] -----~-~shy~
Silt
[7r_ ___~ Medium Sand_~-----l
0 ltD
+shy4
0=11
9=
Fine sand + Silt t
30p=
middotmiddotmiddotmiddotmiddotmiddotmiddotmiddot1~11+-----E-----
[ml
Fig 1 1 22 Pile No 6 and results from static cone penetration test
Cone resistance qcmiddot 1MPuJ
0 10 20 30 67 01-+-------l--------------i
mud+ peat
fine sand
l1)
N
40=60
15L_____________
[ml Fig 1 1 23 PiZe No 7 and resuZts from static
cone penetr ation test
Section Cone resistance Pi le
0 5 10 15 20 25 30 qc [MPa 1 --~----Y-~-----~
Silt
Fine sand
Medium Sand Bentonite2----1~i
t 3
4
0
0=15
Fine iii ~~= 5
sand t ltD
6 +
Silt 7
3Dp=
63 g
10
11
12
13+------=~---l
[ml
Fig 1 1 24 PiZe No 8 and resuZts f rom static cone penetration test
68
I =3
Cone resistance qc [MPa]
0 10 20 30
C 0 C Cl
(I)
Said
Peat
Sand
l 0=110
D = 11
4 D = 44
Fig 1 125 Pile No 9 and results form static cone penetration test
69
Cone resistance qc[MPa)
0 10 20 30 I ~ II JE Ill= II=E IS
Fine sand QI
U) I
[- I C 0 + C Peat QI
CD
Fine sand 0
Ci D = 1 1
L l D= 110
4D= 4 4
Fig 1 1 25 Pile No 10 and results f rom static cone penetr ation test
70
Cone resistance 9c[MPa]
0 10 20 30
Sand
C 0 Mud peat
+shyc 5 ltII
co
Sand Op= 11
u 10 D= 110 4Dp=44
Fig 1 1 26 Pile No 11 and results foIm static cone penetration test
71
00 a_ N ~
middotu rr QI 0 u ~ C 0
QI ui C iij 0 QI U - 0
0 EN
d 2
Sll 1lOl
C
u (rr
C 0 u~
0
QI - C middot 0 C
U - O 0 EN
~ 0 2
E
ltD a---==-lr---___--~---6-l_-0_012 ~ Lr- - --1---------J J
S9l ls= apound QI -0 gtcc _gmiddot- 0 1) ui I
Fi g 1 1 2 Piles No 14 and 15 and results f r om stat i c cone penetr ation tests
72
Contact pressure p [ MPa] 2 4 6
01lt---------------~
50
E E
111 100 ~ (qcp=30 MPa for No16
~ iqcp =49 MPa for No14
~ 1so~--~~- _ _ __
I _ _
11 I lf--q = 32 MPa for No15
cp
Fig 1 1 28 Results f r om load tests on piles No 14 15 and 16
73
0300--------------~---~--~--shyE
Driven piles in ~ 0 bull Gravel
amp250 bull Sand L QJ X Silt a 1l o Bored piles in
sand -sect 200 0=-- shyC ~ ~ 10 unless ~~ middot D shown 1
ii O
~ ~ o 3 a 1501-----+-------I- --+---laquo-+-- -+------lt
~ sect 5 - 6 6middot 100t----+----+-----_-1---4--__co_--J~__j
-_
~ 0 t7
C
a 50 2 shyg ~ gt
0 20 30 40 50 60
Standard penetration resistanceN in blows per foot
(N 30
Fig 12 1 Emperical relation between ultimate point resistance of piles and standard penetrashytion test in cohesionless soil (Meyerhof 1976)
14 r-------------------r-------b-----q
References and symbols given in Fig121
121-----+---+----+----+------ll------j
- _sect ~ 10t----+----+-_--1-----+---lt~--~H---- 0 lt-~5- _-)0 I() l- I Q---+-----I[08 ~
H -(l () ltj-~C X bulls pound 061------lt----+-----i~- --+-- shy
- bull
-gt Q1pound--I---L---L---L---L--~ 0 10 20 30 40 50 60
Mean standard penetration resistance N in blows per foot ( N30 l
Fig 122 Empirical relation between ultimate skin friction of piles and standard penetration resistance in cohesionless soil (Meyerhof 1976)
74
a) b)0(1 0lt2
10 10
05 05
1 N30OD-+---------__ OD--t-----r-----r----------------ll--Nbull30~ 10 20 30 10 20 30 40 50
Fig 1 2 3 Reduction coefficient a) for impermeable gravels b) form permeablr gravels (Weltman and Healy 1978)
psf [MPo)
Fig 1 2 4 Relation between ultimate point resistance and SPT in cohesionless soil (Polish specification 1975)
75
30 35 40 45 Loo Med Dense Ver dense
50
40
~ E
l)
g 8 1)
middotu
1 ~
QI- bull Touma ~ bull Koizumi
(183)-depth base middotameter5
20 40 60 00 100 N30
30 35 40 45
OG2(294) bull G1 (183)
300 bull us 59 ( 102) bull 88(180)
bull 075 a GT (467)
150
~ 200-+--------+-- t--- --t-----i 130i 0 094 081
014 _- --- -- shy~ E 066bull bull 063 Note -~ ~m~r~s~ ~ 1001---1-r--t---1point is xh QI Ratio ~ Number in ( ) middotn key is h c Ratio s ~
0 20 40 60 00 100
~ig 1 2 5 Ultimate point and shaft resistance versus N30
(Wr ight and Reese 1979)
-----
76
tu Psa
[kPa] [MPa]
200 tu
------ shy150 Psa
1 1
1100 10 1 1
1 50
0+----------T----~---~-N-3J~shy0 20 40 60 80
Relation between ultimate skin friction and SPT (Decourt 1982)
Fig 1 2 6
Psa
[MPa]
8
0----Meyerhof 1976) 0 7
--- - --~ - copy Polish Specifcoti on 1975)6 ~-
~
reg- middot - Reese (1978) middot 5
f41- -- Decourt (1982) -I bull 4 2
----==---______z__ h25m Dp=12m
3 ---shybull
2 7
--shy ----shy~----shy0-t----i----------r-- ----------------------N3l~shy
0 10 20 30 40 so 60 70
Fig 1 2 7 Relation between ultimate point re~istance of large diameter piles and standard peneshytration test (SPT) in cohesionless soil
------
77
tu [kPa)
200 17 Cast under -J bentonite
~----Meyerhof (1976) ~copy -=middotmiddotmiddotmiddot== middotmiddot150 ~------- Wei tman (1978 ) middot Healy middotmiddot ___ Japanese ) 119810 Society
(0 -middotmiddot- Decourt (1982)middot Wright
100
- -middotmiddot -- 11979]reg Reesemiddot Bored piles
~shy50 1 -- shy
-- shy middotmiddot s-shy - --~ ------reg~~ ---~E_==---- ------- shy
N_ ---shy0-+--C--------------r---- ---------~---~-~shyo 10 20 30 40 50 60 70
Fig 12 8 Relation between ultimate skin friction of piles and standard penetration test (SPT)
78
Pst [MPa]
8
7 ---------ist=7MPa
6
5
4
3
2
I N30o~------------------------------+---------__=-shyo 10 20 30 40 50 60 70
Fig 12 9 Relation between ultimate point resistance of large diamter piles and standard peneshytration test (SPT) in cohesionless soil (proposal)
tu [MPa ]
( excavanted and cast
150 under bentonite ) tu=150 kPa
100 tu=90 kPa
I I
50 I I I I I N30
10 20 30 40 50 60 70
Fig 1 2 10 Relation between ultimate skin friction of large diameter piles and standard penetrashytion test (SPT) in sand (proposal)
79
2 3 4 5 p[MPa] 0 2 3 4 5 p[MPa]0
40 40 Cl
80 c 80
c 120 120
Pile No 1 PileNo216 160
200 2
s s c [mm] (mm]
0 2 3 4 5 p[MPa] 0 2 3 4 5 p [MPa]
40 40
00 80
120 120
16 160 Pile No 3 Pile No 4
200 200
s s [mm] (mm]
0 2 3 4 5 p[MPa] 0 2 3 4 5 p [MAJ]
tgt11 tgt- measured40 40
80 80
120 120
Pile No 5 Pile No 6 160 160
20 200 s s
[mm) [mm)
Fig 1 4 1 Base resistance vs settlement appoximative method piZe No 1- 6
80
0 2 3 6 5 p[MPa) 0 2 3 4 5 p[MPa]
40 40
80 80 6
120 120 6
6160 160
Pi le No 7 Pile No 8 6
200 3J s s
[mm] (mm]
0 2 3 4 5 4 p [ MPo)
6 6 40
6 6
6 80
6 6
6
Pi le No 9 Pile No 10
XJO s s
[mm] [mm]
0 2 3 4 5 p[MPa] 0 2 3 4 5 p [MPa)
6 6
40 40 6 6
6
00 80 6
6
12 1Xl 6
160 Pile No 11 160 Pile No 12
200 200 s s
[mm ] [mm]
Fig 1 4 2 Base resistance vs settlement approximative method pile No - 12
81
0 2 3 4 5 p[MPa] 0 2 3 4 5 p [MPa]
6 6
40 6 40 6
6
80 6 80 6
120 6 120
Pile No 13 Pile No 141fO 160
200 200 s s
[mm] [mm]
0 2 3 4 5 p [MPa) 0 2 3 4 5 p [MPa)
40 40
80 80
120 120
HiO 160
200 200Pile No 15 Pile No 16
s s (mm) [rrrn 1
0 2 3 4 5 p[MPa] 0 2 3 4 5 p[MPa)
40 40 A A A-measured
680 80 t t
120 c 120 c
1fil Pi le No 17 160 Pile No 18
200 200 s s
[mm] [mm]
Fig 1 4 3 Base r esistance vs settlement approximative method pile No 13- 18
82
0 2 3 4 5 p[MPal 0 2 3 4 5 p (MPa]
D D40 40 c c
80 c 80 c
120 120
160 160
Pile No 19 Pile No 20 200 200
~ml (mm]
Fig 1 4 4 Base resistance vs settlement approximative method pile No 19- 20
LlJ QI
0 average lJ = 098 E sd = 029 C
6 SY = 030
4
2
lJ calculated ________________________ _______ measu red
06 08 10 12 14 16
Fig 1 4 5 Calculated pressure divided by the measured pressure at 20 mn settlement for aZZowabZe
q Zoad Pa= ~p approximative method pile
No 1- 20
8 3
Point resistance p [ MPaJ
a)
p(s) = s a +--sshy1 y qcp
1
SQ100p -- --- ---shy
~ s
[mml
I- 01 s rmm]-l p LMPa b)
f~]
c Cll E ~ i s
[mm)
Fig 146 Definition of the point resistance - settlement curve according to the modified hyperbolic method
84
01 ~ 0
20 0 0
0
16 0
medium 0 value a1 = 905-+ 256 Op 0 0
12 (r=039)
0 0
----0 0
8 0
0 0
0 0
4 0
05 06 07 08 09 10 11 12 f3 14 15 16 17 18 19 20 2 1 Op (ml
Fig 1 4 Initial slope of the base resistance curve vs pile diameter
a1 [p] 0
0020
16 assumed a 1= 28 - 4 qcp
12 0
0 Ct) 0 a = 2659 - 369 qcp8 1
0 0 (r = 0188)0
4
2 3 4 5 (MPa]qcp
Fig 1 4 8 Initial slope of the point resistance curve vs ultimate point resistance on the static cone resistance for pile tests No 1 20
85
a [~ 28
24
20
16
12
8
4
0 2 3 4 5 6 Qcp [MPa]
~ Kiosinski (1977) sand and sandy gravel of mediwn density
~ Klosinski (1977) loose sand ID= 0 3 0 4
o US59 ] t HH Touma p and Reese L (1974) fine sand and silty sand OGl (US59 HH BB - very dense Cl - mediwn dense) 1 BB
DIN 4014 Part 2 (1977)
Fig 1 4 9 Initial s lope of the point res istance curve vs ultimate point resis tance
86
assumed [il =30 -10 Op but )1~ 10 )1 [1 I
u 311-10 Op ( r =0 368)4 1 0
3 0 0
02 0
0 0co 0 8 0 0
0
0
05 06 07 08 09 10 11 12 13 14 15 16 17 19 20 21 Dp [ ml
Fig 14 10 Correction factor for hyperbolic base resistance shysettlement relationship
87
a [~] 28
24
20
16
12
8
4
2 3 4 5 qcp [ MPa]
Fig 14 11 Initial slope of the base resistance curve vs ultimate base resistance (proposal)
v [ 1 ]
3
2 -----G- DP J l 1J I Op lm] J
for Dp ~ 2 0 m ~ u = 1 01
0 --------r----r---r----r-----------------r-------------------------r------r-~-~--shy
05 06 07 08 09 10 11 12 13 14 15 16 17 18 19 20 21 Dp[m)
Fig 1 4 12 Correction facto r for hyperbolic base resisshytance - settlement relationship (proposal)
s P ( s)
s +
u qcp
88
a) b)1
bt=o212= 47 MPa a1=1~32 tMWJ s 2 3 4 5 O 1 10 20 30 40 50 60 p [~a]0
0p [ MPa] 40 40
80 80
120 ~
160 b1 = ~ajtg ~= 0 212
~=1132 + 0212middot s
mJ 240 r=0994t t t measured s __ according to Jl s
o o o according to p (bull ll l[mm] [mm]
Pile No 2
slmm) 10 20 30 40 50 60 80 100 125 150 175 2)0 225 Note
p [ MPa] 09 14 17 20 22 24 27 30 32 34 36 38 39
measured
pibull) [ MPa] 074 128 169 202 228 249 282 307 330 347 360 371 380calculated
plbullbull1[MPal 070 125 168 203 233 257 297 327 356 378 396 410 422calculated
1) (bull) ij l099082 091 099 101 104 104 104 102 103 102 100 098 097 sd = 006
ij (HJ1041) (bull10) 078 089 099 102 106 107 110 109 111 111 110 10B 10B sd = 010
plbulll-according to a =1132 [ Jp(s) = s s for pile No21 0 1132 12 39
plbullbulll-according toa =1241 lmiddotGcp=39MPa1 0
~=14 see fig 1411 and fig 14 12 sp(S)=
124+ _ s_ 14middot39
11lbulll11l-J - correlation coefficient calculat~d P5 for
measure p s p(bull) and p(bull) respectively
Fig 1 41 3 Modified hyperboZic point resistance - settZement reZationship for piZe No 2
89
0 2 3 4 5 p(MA1] 0 2 3 4 5 p[MPa)
40 40
80 A 80 A
120 120
160 16 Pile No 1 Pile No 2
20 200 s s
[mm] rnm
0 2 3 4 5 0 2 3 4 5p [MPa] p [MPo]
40 40
80 80
120 1ZJ
lfpound) Pi le No 3 Pile No 4 A
200 A
s s A
[mm) [mm
0 2 3 4 5 p [MPa] 0 2 3 4 5 p [MPa]
40 40 A A A measured ~ calculated
80 80
12
160 160 Pi le No 5 Pile No 6
200 Z)Q
Fig 1 4 14 l3ase resmiddotistance vs settlement pr oposed method pile No 1- 6
90
2 3 4 5 p [MPa] 2 3 4 5 p [ MPa]
40 6
6 40
1 80 80
6
120 120 6
6 160 160
Pile No 7 6
200 200 s
[mm ] s
[mm]
0 2 3 4 5 6 p [MR] 0 2 3 4 5 p [MPa] 0 0
40 40 6
6
80 80
6
120 120
160 160 Pile No9 Pile No 10
200 200
s [mm] [msml I
0 2 3 4 5 6p[MR] 0 2 3 4 5 p [MPa]04--___ ____ ___ ___ ____
0+-=---------------~-~- shy
40 40 c 6 c - measured
0--0-0 shy calculated
80 80
120 120
160 160 Pile No11 Pi le No12
200 200
s [mm]
s [mm]
Fig 1415 Base resistance vs settlement proposed method pile No 7-12
91
0 2 3 4 5 p [MPal 0 2 3 4 5 p [MPa)
40 40
80 80
120
16 Pile No 13 Pile No 14
200 s
tnml [mm]
0 2 3 4 5 p [ MPa] 0 2 3 4 5 p [MPa)
40 40
80 80
120 120
160 1fD
Pi le No 15200 axJ s s
[mm] [mm]
0 2 3 4 5 p[MPa] 0 2 3 4 5 6 plMPa ]
A A A measured40 0---0-0 calculated
80
120 120
160 1ED Pile No 17 Pi le No 18
200 200
s s [mm] [mm]
Fig 1 4 16 Base resistance vs settlement proposed method pile No 13- 18
92
0 2 3 4 5 p [MFb] 0 2 3 4 5 p[MPa]
0 6 o -measured40 40 0 0 o -calculated
80 80
120 120
160 160 Pile No 19 Pile No 20
200 200 s s
[mm] [mnil
Fig 1 4 17 Base resistance vs settlement proposed method pile No 19-20
p(s~Psf
15 20
ean
-C 5 w u L Lower ~ confidence
linea 0
a IJl 10
o---o proposed
method I I I
15
Fig 1 4 17a Design curves for estimating developed base resistance in sand (Wr ight and Reese 1979)
93
n (number)
30
28
26
24
22
20
18
16
14
12
10
8
6
4
2
0 02 04
Fig 1 4 18
I= 126
Between 1] = 0 7 - 1 3--- I= 106 ( 84 frac34)
Average ~ = 098 Standard sd =023 deviation
Standard sv =023 veriation
1] (Coefficient Calculated Measured
06 08 10 12 14 16 18
Calculated pressur e divided by the measured pr essure for all pressure - settlement curves pr oposed method pile No 1- 20
94
a) b) Total load
Total load curve
---- _____-- shy- -- -Base load ~- Base load
-0-0 ~
00 00 J
ldeoli zed shaft load J
Shaft sesistanc1---------- 0=0middot30 a= 0 middot 30
025 Settlement IN 025 Settlement IN
Fig 1 419 Proposed method of synthesizing design loadsettlement curve (a) conservative design prodiction b) design prediction- peak in shaft loadsettlement curve (Burland et al 1966)
Cf
-0 0 0
J
0
~-----~--~-~ amp- 2 3 4 5 6 (cm)
a~middotltii -0 lt) cco2 41 -~ -0 1)
vi ~ llloli=----------- ---c~0 1 2 3 4 5 6 7 ( of diameter)1 1 1 1
05 10 15 20 ( in) for 30 in Pile Movemen~ ( 75cm pile)
Fig 1 4 20 Approximate load settlement curves for 30 in bored piles (AB and C represent failure load at 1 in settlement A B and C represent ultimate failure load) (Touma and Reese 194)
95
Load in MN 0 2 3 4 5
25
50E E C
-C 75
-~ ~
-Z 100 lJ
Shaft resistshy
125 once
15 Fig 1 4 21 Load-settlement relationships for largeshydiameter bored piles in stiff clay (Tomlinson 1977)
SettlementSo
Fig 1 4 22 Diagrams of s1iaft and base resistances versus settleshyment assumed in analysis (Kiosinski 1977)
96
0 0 1 ~ r- 025g ~~ 2
1- -shy3 03Sg 14 5 2
Qls =Qpls+Q5 (sQpls) Qs(s-3E
0
degsis __ -- Qpls) a~ C
4
t Sg l
5 Qu Is)
Q(s)in MN-l T
Ouls Q Is) in MN ---
Fig 1 4 23 Construction of load - settlement curves a) for sand b) for cohesive soil (DIN 4014 Part 2 1977 and Franke 1981)
-
s C 5C
Cl
3 0 00 05 10 15 20 Mean settlement I in)
Fig 1 4 24 Load- settlement curves for test shaft S4 (1 in = 25 4 mm 1 ton= 8 90 kN) (Reese 1978)
97
Relative side resistance
0 05 10 15 20 0E=--t----+---+--~
c QI lt) ~ 2 C
I itaker c
QI amp Cooke3E QI-j
c-en 4
C QI
E us 59o
5 QI gt
SA0 w 0 6
Fig 1425a Relative side resistance for clay vesus relative midlength settlement (Reese 1978)
degs (Osl u l t 0 05 10 15 2 0
Mean
2 Lower ~ C QI u
confidence line
~ 3 a
0
~4 E
()
5
6 __ _ ______ ________ __1
Fig 1 4 25b Design curves for esti mating developed side resistance (~Jy1nht ReertP- 1987 J
98 Load Q
8 - 15 mm
1- 2 of p ile diameter
100-200 10-15 of pile Os Ot diameter Shaft Total
Settlement S Resistshy Resist- Load ance once
Fig 1426 Dependence of total load base resistance and shaft resistance on settlement of lar-ge diameter pile (Tejchman Gwizdala 1979)
6
5 Shaft load
4
3
2
z ~
-0
g Pile EF- 56 J 0
0 0 20 30 Butt settlement (mm)
Fig 1 4 27 Deveiopment of shaft and base resistance with settiement (Promboon Brenner 1981)
99
0 1000 2000 3000 4000 5000 6000 7000 8000 9000 0 r-=-1---J__-----------------------~----_shy
Load [ k N l5
10
20
( I
Skin friction ----1 I I
~ 40 QI E
fQI
50 I
Q) I () ICOntinuos fost deolading
Fig 1428 Load-Settlement-Diagram Testelement III (Diaphragm-Wall 0515 m 244 m deep) Portion of Skin Friction and Base Resistance (Prodinger Veder 1981)
Qs (QJ max
0 05 10
Upper Limit of Data
Farr and Aurora (1981J C
~ 2 - shy -+shy - Mean of Data
I QI
Lower Limit of Data a
0 - 3 E
Vl
4
Smid = Approximate shaft buff movement ignoring the elastic compression of upper halt of the shaft
D = Shaft diameter
Q Mobi Ii zed shaft resistance
Qs1max = Maximum shaft resistance
Fig 1 4 29 Relative shaft resistance vs relative movement (Farr and Aurora 1981)
100 Load Q (s) [ MN]
Su5 s s 20 mm for non- cohesive soil u
s s 10 mm f or cohesive soil u
s s 15 mm for claysand u
Q (s) + Q (s)s p
Qs(s)
-C ltII E s ~- [mm]-ltII IJ)
Fig 1 430 Dependence of total load Q(s) point res i stance Q (s) and shaft resistance Q (s) versus settlement p s
~ 3 Usu Qpu Qu Q(s) [ MN]
Sus= 20
1J
60
80
100
120
degs (s ) 140
5 P=Ol Op
1EO
C -ltII E 180 ~ ] 200
s [mm]
Approximative dependence of total load point resistance and shaft resistance versus settlement fny non-cohesive soil
Fig 1 4 31
101
113 3 ~fic0P Ye hY
1 Ground water
D
I y
yh C
Fig 1 5 1 Determination of 01 and 03 for settlement analysis of lar ge diameter bored piles
102
I
E=Et [MPa]
160 0
140
120 0
100
80
6
40
--- --shy 0
0
8 0
0
0
20
2 3 4
I 0 15
Fig 1 5 2
E = Et [MPa]
120
100
80
60
40
I I 0 35 065 085
0
Et= 17 81 qcp0844
( r = 0 128)
5
100
6 qcplMPo]
Calculated values of Young s modulus for piles No 1shy24 according to equation 1 5 2 and 1 56
0
0 0
E =898qcp127 (r= 0314)
E = 9 middot qcp 13 0
20 shy 0
0 0
0 1 2
loJ
I 0 35
3 I
065
4
I 085
5
100
6 qcp [MPo]
Fig 1 5 3 Calculated valueBof Young s modulus for piles No 1shy24 according to equation 1 5 4 and 1 5 6
I K 10 3
( 1 ] 1832
1400 0
1200 0
0
1000 0
800 0
m=2821 qcp0621
600 0
(r=0057)
400 0 0 0 0 0
200
2 3 4 5 6 qcp (MPa]
I 035
I 065
I 085 100 Io
Fig 15 4 Calculated valuesof the dimensionless compress ion modulus K for piles No 1- 24 according to equation 1 5 2 and 1 56
K ( 1 ]
0
1400
1200 0 0
1000
800
600
0
0 0
0
0 0
0 K= 1422 qcpl05
(r=0181)
0 K= 150 qcp
400 0
3)0 0 0
2 3 4 5 6 qcp(MPa)
I I -J 035 065 085 100 Io
Fig 1 5 5 Calculated values of the dimensionless compression modulus K for pile~ No 1-24 according to equation 1 5 2 and 1 5 6
104
120
100
2 3 4 5
I I I rv 0 15 035 065 085 100 lo
Bergdahl (1982) for shallow foundation
o----o Bozant Masopust (1981) D= 1 0 rn h=10 rn large diameter bored piles in noncohesive so il
0----0 Proposal according to current anal ysis
Klosinski (1977) D=090 to 125 rn large diameter bored piles in sand and sandy grave l
Mitchell Gardner (1976) very dense sand E=(35)q (it depends on sand density and stress history) c
Fig 1 5 6 Composision of Young s moduius
105
TABLES
0 Tab 1 11 Methods for detemination of the bearing capacity of bored piles (Ro llberg 1977)
Cl
Nol -- I Soil Areas of Q) Q) Editor Determination of Coefficients 5 type influenceqP qs p ~ C C 11 12 fP I fs
1 all Lab f Soil Mech (1936) l qp at the elevashy 1 0
2 all Huizinga (1951) ~ t~on of the pile 14 point
3 all Van der Veen (1953) ) 18 1 h+l14 all Van der Veen 1 0 Dpl375 D~ 15-- J qcmiddotdhBoersma (1957)
~ 11 +12 h - 12
5 12 all Menzenbach ( 1961) qc at the elevashy~ tion of pile point
6 18 all Mohan Jain Kuman (1963)1 average of qc over 1 h Q) h ~qcmiddotdhl 10 Dpj 3 75 Dj 15 50_micro
and 1 2C 11
7 I amp all de Beer ( 1964) graphically from 10 Q) qc 0 1 h+l18 u C
sand Soviet norm SNIP II 9ct9cp I4 bull O Dp I10 DP l66-1 083shyu clay B5- 67 Trofimenkov (1969) 2 50 1 251 +l J qc middotdh micro middot h middot-l l 2h-~ _micro
9 _micro u all Paproth (1972) at the elevation 3 5 I shy
) of pile point (Dpgt0 5 m 7 D8DpE
E-lt p 1 h+l1 1 h Dplt 5 m u l+l J qcmiddotdh h f qcmiddotd~ 30 Dpl 50 Dp 2 0 100shy10 sand Norwegian method
0l 2 h-12 200Senneseth (1974)
11 lall Soviet method h+l (20-0lqgl - 101 1 q middotdhTrofimenkov (1974) -- f C UpUsmiddotQct
l1+l2 h - 1212 Qct-Qcp 40 D~ 10 Dp 1 33- 0 67shyUsbullh 4 00 2 50
13 English method 10 DFJ 375Dp 10 I
Rodin Corbett Shershywood Thorburn (1974)
3 7 5 Dcl 8 0 DP 10h+l1 _1_ J qcmiddotdh 1 h
qcmiddotdh 20011 +12 h - 12 hb
1 h qcmiddotdh 150hf
0
Observations
fp I f (qp)fs C
Dp E = 1 cm Qbu = 2 Qpa (approx )
s fs=f (qc)
q=~g Us 0 h
fp=f(q~)
fs=f(qgl
bull fine grained non- cohesive soil loosely packed
bull fine grained non- cohesive soil medium dense comp
fine grained non- cohesive soil
Tab 111 (cont)
h+h bE 14 non-cohe- Meyerhof ( 1956 poundti J N 3o middot dh CtME fN3 o dh 1 0 DP 4 0 DP 10 100 etM= l 2
sive soil 1976) lJ +12 h - li hE o hgp taken into consi der ~ Ul (I)
E-lt
C 0
~E = 1 kgbull 30 cm
(statistical limit depth of the pile) hE - clamping length of
pile micro rrJ l-l micro (I)
15 C (I) p
sand Norwegian method
- irm - - - 10 IT
m = diagram O l-l Senneset (1 974) rrJO C
16 rrJ micro gravel English meth it 3 middot N30 - - - 10 - Jf 3 + diagram U) ~
E-lt p U)
iiouiu Coruett Sherwood Thorshyburn (1974 )
(NJQat the elevashytion of pile point1
0 -i
108
Tab 11 2
Results of calculati o n of p i le point load pile shaft load and total pile load from static con e penetration test (Rol l berg 1977)
~ gt
~ gt Ultima te Ultimate Ult imate
No Method micro micro poi nt skin bearing 080lt17nlt1 50 Q) -l
-l middot-i resistanceuro resistance r esistancE
middot-i p 0
(J n1 n n2 n n3 n n1 n2 n3
1
2
Lab fSoil Mech
Hu izinga (1951)
(1936 ) 430
307 i 3 Van der Veen (1953) 239
49
4
5
Van der VeenBoersma
Menzenbach (1961)
(1957) -l middot-i 0
2 4 7
1 57 1-CJ)
6
7
8
Mohan Jain Kumen
de Beer (1964)
Sovi et Norm (1969)
(1963) CJ) Q)
-l middot-i 0
lJ Q)
Q)
gt- CJ) Q)
c 0
2 44
1 37
183
47
t I
49
487
0 18
47
16
3 02
0 85 1
47
16
137
08
9
10
Paproth ( 1972)
Norw Method (1974)
~ 0
0
u I
C 0 C
1 8 1
180 l 46
1- - -_L~ 46 167 46 1 19
1 1 Soviet Method ( 1974) [1 1 41 46 1 62 13 083 13 1 14 0 8
12 Engl Method (1974) 2 66 35 128 35 2 30 35 1 28
Note
cal Q a) n = --- mean value of the rat i o between calculat ed pile loads and those n Q determined f r om loading test
b) n = number of piles
109
Tab 113
Point resistance of large diameter piles (DIN 4014 Part 2 1977)
Settlement Point pressure 1 Factor -fshy
(cm) (MPa) cf=lOMPa I i=15 MPa C C
Piles without enlarged base
1 05 005 003 2 08 008 005 3 11 0 11 007
15 34 034 023
Piles with enlarged base
1 035 0 04 002 2 065 0 07 004 3 0 90 009 006
15 2 40 0 24 0 16
Note 10 lt qp lt 15 (MPa)C
Tab 114
Skin friction resistance of large diameter piles (DIN 4014 1977)
Strength Static cone pen- Depth below Skin frict ion Factor of sand etration resist surface
(MPa) (m) (MPa) fs
Very small lt 5 - 0
Small 5 to 10 0 to 2 0 2 to 5 003 ln6 to 333
gt 5 005 100 to 200
Medium I I 10 to 15 0 to 2 0 I
I 2 to 7 5
gt 75 I 0045 0075
222 to 133 to
333 200
High I I
i
l
gt 15 0 2
to 2 to 10 gt 10
I I I
I
i
0 006 0 10
gt gt
250 150
Note Skin friction is assumpted as linear until s =2 cm and constant for s gt 2 cm
11 0
Tab 115
Values of the inverse of the point resistance factor (Bustamante 1982) fp
Soil type qPC I 1
Factor - shyfp(MPa)
for piles group
a) Silt and loose sand lt 5 0 40 -b) Moderately compact
5 - 12 040sand and gravel
c) Compact to very gt 12 i 030compact sand and gravel I
Tab 116
Values of the shaft resistance factor fs (Bustamante 1982)
Factor fs
Soil type qs
C Category I(MPa) I A I B I II A III BI
I a) Silt and loose lt 5 60
i 150 I 60 I 120-
sand
b) Moderately corn- I pact sand and 5 - 12 100 200 100 200 gravel i
Icl Compact to very
compact sand gt 12 150 i I 300 150 I 200I
I I and gravel i
I
111
Tab 117
Point resistance factor (proposal)
-
1-fp
qc (MPa)
Gravel
Coarse sand Medium sand
Fine sand Silty sand
25
080
0 70
060
5 0
0 65
055
047
75
054
045
039
10 0
045
036
031
150
035
027
022
200
030
0 23
018
Tab 118
Shaf t r e sistance factor (proposal)
fs
qc (MPa)
Gravel
Coarse sand Medium sand
Fine sand Silty sand
25
80
100
130
10 0
120
150
190
I 200
180
230
300
11 2
Tab 119
Calculated values qcp
for large diameter piles
Pile Literature Length Diameter (m) Measured p Cr1 lcul Settlement Note Authcr(year) No (ml D Dp (MPa)
(s=0 10Dp) (MPa)p ~~JL__
s s ()(mm) Dp
1 Franke (1977) 1 13 11 36 38 117 106 Garbrecht
2
3
2
3
13
14
11
15
1 58 36
37
38
40
215
185
136
123
) qg accord to Franke
4 4 13 15 204 3 2 33 220 108 and Garshy
5 5 6 11 33 35 127 11 5 brecht (1977)
6 6 6 11 153 36 35 146 9 5
7 7 6 1 5 34 35 158 105
8 -shy 8 6 15 2 1 41 3 0 109 52
9 10 9 11 39 52 47
10 11 95 11 43 35 77 70
11 12 9 11 49 66 60
12 13 10 11 15 5 1 4 0 77 5 1
13 14 9 11 1 5 4 8 46 115 77--shy14 Pranke ( 1973) 15 115 18 4 9
) ) average 88
15 13$ 13 5 1 3 19 -2 5 3 2 sd=3 0
16 - - 165 16 5 13 19 30 sv=0 34
17
18
Spang (1972)
llXJ
V90
6 6
6 75
0 7
09
3 2
4 2
32X
42X
x) s =0 10 D p
19 VlaJ 720 1 2 39 3 9X
20 - - VlsJ 6 5 1 5 3 0 3 ox
21 Touma and US59 9 9 o 76 8 0 Reese ( 1977)
22 HH 75 0 61 8 0
23 Gl 180 091 - 2 5
24 BB 137 o 76
sd = standard deviation
sv = standard variation
Tab 1 2 1
Ultimate point resistance coarse and medium sand psf (MPal (Pol ish Specification 1975)
Depth h
Medium sand r = 0 40 N = 200 30 Base diam (Op) and depthbase diam (hDp)
Dense sand r 0 Base diam (Op)
= 0 80 = 50N30 and dpethbase diam (hDp)
(ml Dp = 0 6 m Dp = 1 0 m Dp =12 m Dp = 1 5 m Dp = 0 6 m DP = 10 m DP = 12 m DP = 15 m
Psf hDp Psf hDp Psf hDp Psf hDp Psf hDp Psf hDp Psf hDp Psf hDp
5 10 83 0 85 5 0 075 42 07 33 20 8 3 16 50 14 42 13 3 3
7 14 11 7 1 2 70 11 5 8 10 4 7 2 8 11 7 22 70 2 0 5 8 1 8 47
10 18 16 7 15 10 0 14 8 3 1 3 67 35 167 28 100 2 5 83 2 2 67
15 18 250 18 15 0 16 12 5 15 100 4 2 25 0 3 4 15 0 30 125 27 100
20 2 4 333 2 0 200 185 167 1 7 133 4 7 333 3 8 200 33 167 30 13 3
25 26 41 7 2 2 25 0 20 208 19 167 5 0 41 7 4 0 250 3 5 20 8 3 2 167
w
11 4
Tab 131
Partial safety factors for resistance to axial load for bored piles (Wright Reese 1979)
Partial safety Normal Poor factor for control control
Unit skin resistance 1 70 185
(no load test)
Unit skin resistance 160 1 70
(from load test)
End bearing 165 180
Tab 1 3 2
Probability of failure of bored piles under normal design conditions (Wright Reese 1979)
Probability of Factor of Structure failure safety classification
5 10-3 25 monumental
210shy 22 permanent- 2
5 middot 10 2 0 110shy 1 85
temporary 5 bull 10-l 165
11 5
Tab 133 Results of field tests (Tejchman Gwizdara 1979)
L
II C C C 0 0 0
micro micro
micro micro micro For universal safe~y F2u u CUNo micro C C ~ ~g~ middot- C
~ Permisible micro micro i ~c -i micro
cmiddot-~ micro~ L
micro oo ~ load ~t~ ~~ omicro micro ~ ~ 3Z~ ~ ~ micro
-~~
~ e ~ --middot--
middot- ~ obull 0
~ g ~~ ~~ ~
~ L
o Jl i5 sect~ =gt L Q~ = yen t p Qp Qp
D h Q~ Srrx s tm p s E~ iQ~lQ~cm ~~ KN X ll1l kPa kPa kN kN kN Jl ~e ~ 1 2 3 4 5 6 7 8 9 10 11 12 13 14 15 16 17
1 70 6 60 4081 1550 2531 38 0 1182 10 4040 175 2041 245 1796 632 141 120
2 90 6 75 5082 3041 2041 598 1785 10 4782 107 2541 1079 1462 282 140 42 5
3 120 720 7259 4041 3218 557 1035 10 3576 119 3630 2158 1472 187 2 19 594
4 150 650 8643 4454 4189 51 5 928 20 2521 136 4326 2158 2168 3 10 166 253
5 130190 195 7750 3011 4709 392 805 10 1075 - 3875 981 2894 3 10 166 253
6 130190 165 9516 5101 4415 536 522 20 1800 - 4758 1962 2796 260 158 412
7 130190 135 8044 5199 2845 646 114 4 15 1834 - 4022 2109 1913 2 47 149 524
8 180 115 11380 4415 6965 388 792 15 1735 - 5690 2747 2943 161 2 37 483
9 76 980 6867 4316 2551 628 110 13 9529 109 3534 1128 2306 383 111 32 8
10 61 7 60 7161 2747 44 14 383 67 15 9404 303 3581 392 3188 700 169 109
11 92 180 4807 883 3924 184 20 8 1329 76 2404 196 2207 450 178 82
12 76 24 5 6769 736 6033 109 20 8 1623 103 3385 147 3238 500 186 43
13 76 137 5396 2060 3336 38 2 63 8 4535 102 2698 589 1109 350 t 58 218
14 120 23 5297 1854 3443 35 0 960 10 1640 39 2649 196 2453 945 130 7 4
15 135 16 7 13489 7554 5935 560 181 10 5260 83 6749 2060 4689 367 127 305
16 170 46 0 8829 2943 5886 333 17 10 3466 39 4415 1373 3042 2 14 1 94 31 1
Average Fi 387 166 Standard deviation Sd 2 1 5 034 Standard variation sv= 0 56 0 20
1234 Spang1972 567 8 Franke 1976 9 10 111 2 1 3 Touma Reese 1974
14 Colombo 1971 15 Kerisel Simons 1962 16 Appendino 1973
11 6
Tab 134
Results of model
SafetyScheme factor
medium F ssand
F p
loose F s
samd Fp
F 3 55 sd _P F 1 32 sd
s
tests (Tejchman Gwizdara 1979)
Diameter D (mm)
30 60 90 133
145 129 108 112
280 3 08 307 294
140 154 153 112
594 3 04 324 426
107 sv 030
0 19 sv 0 14
117
Tab 135
Individual safety factors according to literature
Literature proposal ofLiterature individual safety factor
Fs Fb
Polish Specification (1974) 100 250
Tejchman Gwizdala (1979) 150 400
Bustamante Gianeselli 200 300 (1982)
Decourt ( 1982) 130 400
average 145 3 38
TAB 141 0)
Load settlement curves - measured
Pile No
Settlement 1 c 3 4 5 6 7 8 9 10 11 12
s p s p p s
p p s P
p s P
p s p p s
P p s
P p s
p p s p p S
p I i p s
p p s p
mm MPa rrrn lifl5a MPa mm
lifl5a MPa
mm lifl5a MPa mm
RPa mmMPa nwa MPa mm
RPa MPa mm RPa MPa mm
RPa MPa mm RPa MPa mm
RPa MPa mm RPa MPa mm
RPa 10 045 222 09 1 1 05 20 07 143 06 167 08 125 0 5 20 08 125 10 100 08 12 5 15 67 16 63 20 092 21 7 14 43 08 25 10 20 0 1 1 182 12 167 0 9 22 2 12 167 18 111 14 143 24 83 22 9 1 30 125 240 1 7 I 7 6 1 1 273 1 2 250 14 214 15 200 1 2 250 15 200 25 12 0 19 15 8 30 100 26 11 5 40 1ti 250 20 10 0 14 28 6 14 286 1 7 235 18 222 1 4 286 18 22 2 3 2 12 5 23 174 36 111 3 0 133 50 20 250 22 ~27 1 7 294 1 5 333 20 250 2 1 ~38 1 7 294 1 9 263 37 135 27 18 5 4 2 11 9 33 152 60 2 2 273 24 ~5o 20 300 1 7 353 23 61 22 ~73 18 333 21 286 43 140 30 20 0 46 13 0 36 16 7 80 271 295 27 796 24 333 20 400 27 ~96 25 1320 22 364 25 32 0 53 15 1 36 222 41 195
100 322 31 1 30 333 28 357 22 454 31 1323 29 345 26 385 28 357 60 16 7 40 25 0 45 22 2 125 38 329 32 391 32 391 25 500 32 139 1 30 41 7 32 39 1 4 6 272 48 ~6 0 150 14 2 357 34 1441 36 41 7 27 555 36 ~1 7 34 44 1 36 41 7 175 36 486 39 449 30 583 38 ~61 38 461 200 38 526 42 476 32 625 225 39 577 33 682
(mmMPa) ( 1 MPa)
1
1=2074
t 1=O ~01 =0 98S
a1=1132
b1 =0 212 V =0994
a1=2217
b1=O 131
V =Q 978
a1=1860 b1=0233
V =Q966
a1=1562
b1=0174 V =Q983
a1=1382
b1=O195
V =0975
a1 =20 37
b1 =C 174
V =0957
a1=1443
b1=(l 193 v =O 961
a1=965
b1= 0071 V =0 990
a1=1 91
b1 =o 128
V =0 993
a1=5 83
b1=C124
v =O 981
a1=6 1 4
b1=01 64 v =U 985
li(MPa) ~9 4 7 76 43 57 middot5 1 57 5 2 141 78 81 61 cp (MPa) B8 39 40 33 35 35 35 3 0 39 3 5 49 40 __Ef ~-6 1 2 1 9 1 3 16 15 16 1 7 36 22 16 15 qcp
TAB 141 (continue) Load settlement curves - measured
Pi le No 3ettlement 13 14 15 1 17 18 19 20 21 22 23 24
s p s T5
p s T5
p s T5
p s P
p s P
p s P
p s P
p s P
p s T5
p s T5
p s p p s
p mm MPa lll1l
HPa MPa mm HPa MPa mm
fWa MPa mm fWa MPa lll1l
HPa MPa mm HPa MPa mm
MPa MPa lll1l NT5a MPa HPa MPa 111111
HPa MPa 111111
HPa MPa 1)1111
mra 10 1 7 59 075 133 06 167 075 133 ~95 105 09 11 1 07 143 3 76 1 7 59 08 133 10 100 20 2 4 83 130 154 095 21 1 1 15 17 4 1 75 114 16 125 12 167 ~7 74 33 6 2 1 3 15 3 1 9 103 30 29 103 1 7 176 1 2 250 15 200 r55 118 22 136 16 18 8 38 79 46 66 1 7 182 27 110 40 33 12 1 20 200 1 35 29 6 1 75 229 ~O 133 26 154 175 229 49 82 58 6 9 1 9 21 1 35 115 50 36 139 235 21 3 145 34 5 1 95 256 24 208 ~-4 147 28 17 9 20 250 gt8 86 6 9 72 2 2 233 4 2 11 8 60 39 154 265 22 6 1 55 387 2 15 279 28 214 ~6 16 7 30 120 0 2 2 27 3 o 8 89 80 7 5 2 3 262 80 43 186 31 258 1 7 47 1 36 222 14 05 198 33 124 2 25 320 B 1 98 25 327
100 45 222 18 556 39~ 253 ~-5 222 36 1278 27 370 ~8 113 125 47 26 6 20 625 42 29 8 149 255 28 1446 t50 22 682 3 0 500 175 200 225
(mmMPa) a1=479 a1=1206 a1=14 51 a1=1113 a1=1406 ~=836 a1=843 a1=1176 ~=64 a =561 a1=10 0 a1=9 5 (1MPa) b1=0175 b1=0 178 b1=0 382 b=0287 b1=O 119 p 1=0 137 h1 =o 193 b=0258 p1=0 049 b1=0032 b1=0 276 b1 =0 048
hf (MPa)
v =0998 57
v =0-987 5 6
v =0989 26
v =0992 35
v =0933 Iv =0991 84 73
v =0993 5 2
v =0998 tJ
3 9 =0944 v =0998 v =0996 v =0981
qcp (MPa) 46 39 32 30 32 14 2 39 30
lL 12 1 1 08 12 26 1 7 1 3 13 qcp
lD
N 0
TAB 142
Calculated point resistance curves
Setlement (mm) p(s)
1
n p(s)
Calculated value of the p(s) for pile No
2 3 4 5
n p(s) n p(s) n p(s) n p(s) 6
(MPa)
n p(s)
7
n p(s) 8
n p(s) 9
n p(s)
10 20 30 50 80
100
150 200 225
070 128 177 253 335
375 446 493
157 140 141
127
123
1 16 106
070 1 25 168 232
297
327 378 410
422
078 089 099 1 06
1 10
109 1 11 108
108
073 1 30 176 246
315 349
405 441
146 163
160 145
1 32 125
113 105
056 096
1 26
167 205 222
249 265
271
0 80 096
105
1 11 100 101
092 0 83
082
065
118 162 233
308 345
412 456
108 108
1 16 116 114 111
064
1 12 151 2 10 2 69
298
346 3 76
078 P63 093 tt 13 101 tt 53 100 I 13
108 ~75
103 ~04 096 ~ 55
~ 87
1 26 125 127 126
125
1 17 1 04
052 088
1 15 153
188 2 03 227 242
065 0 74
o 77 0 81 0 75
0 73
063
072 122
1 83 262 347 388
463 5 11
073
0 74
073 0 71 0 65 065
064 1 18
162 233 309
3 46
41 3 4 57
Dp (m) 1 1 Qcp (MPa) 38 (mmMPa) h2 8 1 1 9 Qcpbullv1(MPa) 72
158
39
124 14 55
15
40
n20 15 60
204
33 148 10 33
1 1
35
tt 4o 1 9 67
1 53 3 5
tt 4 0 1 5 51
15
13 5
114 0 15 i-gt 3
2 1
30
tt 6 0 10 3 0
1 1
3 9
12 4 1 9 74
1 1
3 5 h40
1 9 67
Note n = condition coefficient calculated p(s) measured p(s)
10
n
081
084 0 85 0 86 0 85
087
TAB 142 (continue)
Calculated point resistance curves
Calculated value of the p(s) for pile No (MPa) Setlement 11 12 13 14 15 16 17 18 19 20
(mm) p(s) ll p(s) n p(s) ll p(s) n p(s) n p(s) n p(s) n p(s) n p(s n p(s) n
10 106 070 0 71 045 091 054 099 1 32 055 092 053 070 060 081 085 0 72 080 055 078
20 1 90 079 130 059 160 067 1 70 1 30 096 101 091 079 1 12 148 085 1 31 082 098 082
30 258 086 1 76 068 2 15 074 222 1 31 1 26 105 120 080 156 205 081 180 082 132 083
50 363 086 246 075 297 082 296 1 26 1 70 117 161 082 228 095 295 087 256 0 91 184 092
80 471 316 o 77 3 77 088 364 1 18 2 1 o 1 24 199 308 085 393 097 336 1 02 237 095
100 522 349 078 415 092 394 228 1 27 2 16 348 088 442 098 375 104 262 097
150 611 405 479 443 258 117 244 423 529 443 304 101
200 669 441 518 473 276 261 474 587 488 331
Dp (MPa) 1 1 1 5 1 5 18 1 9 19 070 090 12 15
qcp (MPa) 49 4 0 46 49 32 30 32 42 39 30 12 a1 mmMPa) 84 h20 96 84 152 160 152 124 160
IV1 1 9 1 5 15 12 11 1 1 23 21 18 15
qcpmiddotv1 (MPa) 93 60 69 59 35 33 74 88 70 45
- 12287 average = ~ = 098
standard deviation sd = 023 standard variation sv = 023
N
122
TAB 143 Ultimate settlement for shaft resistance - summing up
Ultimate settlements (mm)Literature sand cohesive claysand
soil
Burland Butler Dunican (1966) 7
Touma Reese (1974) 10 Tomlinson (1977) 10 Klosinski (1977) 8
Francke Gerbrecht (1977) 20-30 DIN 4014 part 2 (1977) 20 10 Francke (1981) Reese (1978) (1979) 05-2 of 05-2 of Farr Aurora (1981) shaft dia~ shaft diam
5-20 mm 5-20 mm Tejchman Gwizdala (1979) - Spang (1972) 10
10 10 20
- Francke (1976) 10 20 15 15
- Touma Reese (1974) 13 8 15 8
8 - Colombo (1971) 10
- Kerisel Simons (1962) 20 - Appendino (1973) 10 Promboon Brenner (1981) 10 Prodinger Veder (1981) 12 Decourt (1982) 10-15 10-15
-average s = 14 1 10 126
standard deviation sd = 53 2 1 47
standard variation sv = 038 021 037
123
TABLE 14 4 Al l owab l e base resistance versus sett lement
Pile Li terature ength Diameter (m) Calculated qcp=qcp Settl ement Fp-3- sa (mm)No Aut hor No (m) D DP qcp (MPa) for qcp3(MPa)
1 Francke ( 1977) 1 13 11 38 127 25 Garbrecht
II2 2 13 11 158 39 130 19
II3 3 14 15 40 133 33
II4 4 13 15 204 33 110 23
II5 5 6 11 35 117 22
II6 6 6 11 153 35 117 19
II
8
7 7 6 15 35 1 17 25
II 8 6 15 21 30 100 21
II9 10 9 11 39 130 13
II10 11 95 11 35 117 15
II11 12 9 11 39 163 11
II12 13 10 11 15 40 133 7
II13 14 9 11 15 46 153 9
14 Francke ( 1973) 115 11 5 18 30 100 15
II15 135 135 13 19 32 107 29
II16 165 165 13 19 49 163 35
17 Spang (1972) V70 660 070 32 107 28
18 II V90 675 0 90 42 140 16
II19 V120 720 1 20 3 9 130 16
II20 V15C 650 150 30 100 16 average for pi les 198
standard dev sd = 78
standard var sv = 039
)assumed qc = p for s = 010 Op sonding meRsurement were not availab le
IV
TA~LE 15 1
Comparison of the initial sl ope of the pile point resistance - settlement curve
Accardi ng to 1 2 3 4
In i t i ~l 5
slope a1 for the pile No
6 7 8 9
(mmMPa)
10 11 12 13 14 15 Note
a 1 for s=10 mm 222 11 1 a1 for s=20 mm 21 7 14 3 calculated 207 113see Tab 14 1 Bo Berggren (198 )230s=20 mm
Schmertmann s method (see 202B Berggren 1981)s=20 mm
No 1 _ llNo - 6 1 97 098
202 250
22 2
400
30 8
090
14 3
200
186
076
167
182 156
286
18 2
107
125
167 138
091
20 0
222
204
426
263
098
125
167
144
087
100
11 1 9 7
182
23 5
1 03
12 5
14 3
11 9
174
164
105
67 83
58
14 6
125
1 16
63
9 1
61
103
59
8 3 48
123
13 3
15 4 12 1
1 10
167 21 1
aceto hypershy14 5 bola type curve
1 15
No 2 NQj = n1
No 4Noz ~ na No 5Naz= T]g
105 1 27
106
093
1 13
160
1 23
108 1 17
157
100
121 109
1 92
118
1 16 1 14
164
2 12
120
122
1 15
143
1 76
151
149 1 73 1 27 146
TAllLE 151 (continue)
Compa ri son of the initial slope of the pile point resistance - settl ement curve
Initial slope a1 for the pile No (mmMPa)According Note to 16 17 18 19 20 21 22 23 24 -a1 for s=10 mm 133 - 105 11 1 143 76 59 133 100 a1 for s=20 mm 174 - 114 125 167 74 62 153 10 3 calculated see 11 1 146 84 84 118 64 56 100 95Tab 141
Bo Berggren 198 67 78 25 0 114s=20 mm Schmertmann s method (see B 136 67 250 146 Berggren 1981) s = 20 mm
nG = 108 No 1NoJ = n 1 20 125 1 32 121 1 19 105 1 33 105 sd = 0 14
SY= 013 No 2 i) = 1 29ro1 = n1 157 136 149 142 1 16 1 11 1 53 108 sd = 019
SY= 015 No 4 iis = 143 INo2 = ns 091 126 1 63 111 sd = 033
SY= 0 23 No 5 ii9 = 1 37183 108 163 142INoz = n9 sd = 0 37
SY = 027
N Vl
126
TABLE 152
Measured and calculated pile point resistance
Pile Calculated Measured Measured No qcp P for
s=10 mm P for s=20 mm
~ 10 mm ~ 20 mm
- (MPa) (MPa) (MPa) - -
1 38 045 092 84 41 2 39 09 14 43 28
3 40 05 08 80 50 4 33 07 10 47 33 5 35 06 11 58 30 6 35 08 12 44 29 7 35 05 09 70 39 8 30 08 12 38 25 9 39 10 18 39 22
10 35 08 14 44 25 11 49 15 24 33 20 12 40 16 22 25 18 13 46 1 7 2 4 27 19 14 30 075 13 40 23 15 32 06 095 53 34 16 49 075 115 65 43 17 32 - - - -18 42 095 1 75 44 24 19 39 09 160 4 3 23 20 3 0 07 12 43 25
average= 484 291
sd 163 088 sv 034 030
Tab 153 Results of calculation for piles No 1-24
Pile No
Length (m)
Overburden pressure 0 vs
0hs (kPa)
0ve (kPa)
0 nc (kPa)
- -ov=o1 (kPa)
- -OV=03 ( kPa)
00 (kPa)
p(a il ( kPa)
s (a 1) (mm)
A2 ( 1 )
E t
(kPa)
Md ( 1 )
K (1)
E I
t (kPa)
( kPa) 1 2 3 4 5 6 7 8 9 10 11 12 13 14 15 16
l 2 3 4 5 6 7 8 9
10 11 12 13 14 15 16 17 18 19 20 21 22 23 24
13 12 14 13 6 6 6 6 9 95 9
10 95
11 5 135 165 66 675 72 65 99 75
180 137
l 33 133 123 116
70 70 70 70
104 102 95
102 95 94
106 139 95
101 106 97
180 137 221 215
53 53 49 46 28 28 28 28 42 41 38 41 38 38 42 56 38 40 42 39 72 55 88 86
202 202 216 202 1114 104 104 104 146 153 146 160 153 181 209 251 120 128 134 123 238 180 305 277
202 202 216 202 104 104 104 104 146 153 146 160 153 181 209 251 120 128 134 123 238 180 305 277
168 Hi8 170 159 87 87 87 87
125 128 121 131 124 138 158 195 108 115 120 110 209 159 263 246
128 128 133 124 66 66 66 66 94 97 92
101 96
110 126 154 79 84 88 81
155 118 197 182
141 141 145 136
73 73 73 73
104 107 104 111 105 119 137 117 89 94 99 91
173 132 219 203
950 975
1000 825 875 875 875 750 975 875
1225 1000 1150 750 800
1225 800
1050 975 750
2000 2000 625
1500
218 139 255 190 16 1 146 210 12 7 10 1 11 7 84 73 69
104 167 210 124 103 10 1 109 142 120 76
153
0802 0802 0822 0820 0798 0798 0798 0798 0791 0798 0800 0811 0814 0837 0837 0830 0769 0 768 0771 0 775 0 780 0 781 0 788 o 779
35296 81603 43312 65222 44019 67515 4609 91313 78186 60572
118115 15129 5 184075 95577 67017 81607 33252 67554 85294 75994 78816 74857 55101 54862
075 075 0 77 075 084 084 084 081 079 078 084 080 083 076 076 078 0 77 081 079 076 082 087 064 0 74
278 643 337 512 542 832 567
1085 766 572
1216 1417 1832
796 520 709 353 735 878 781 630 726 302 366
26472 61202 33350 48917 36976 56713 38656 73964 61767 47246 99217
121036 152782
72639 51932 63653 25604 54719 67382 57755 64629 65126 35265 40598
a=282l a =l781 y=axs S=0621 B=0 844
V=0 057 V=0 128 _ Iv -J
~
N co
Tab l53 Results of calculation for piles No 7-24
Pile No
17
1 2 3 4 5 6 7 8 9
70 11 72 13 74 75 16 17 78 79 20 27 22 23 24
Ground water
18
-20 m b s
-28 m -335 m -330 m -3 15 m dry dry -53 m -85 m
E t (kPa)
19
33653 64979 35364 45664 47969 54583 37574 63072 74548 57753
71 2618 123531 150297
71239 48619 59204 39744 77208 77863 62049 90407 95844 57762 62937
vxEt=E Md (kPa)
20
25240 48689 27230 34248 35254 45849 31562 51040 58893 45047 94599 98825
724747 54142 36950 46179 30603 57678 61572 47157 47734 83384 36968 46569
a=898 S=l 27 =0314
K (l )
21
265 511 275 358 517 672 463 749 730 546
1160 1157 7496
593 377 514 422 775 802 638 723 929 377 420
a=l422 S=l 05 =0187
E=E = t1 3
g-gcp (kPa)
22
51046 52799 54566 42492 45870 45870 45870 37547 52799 45870 77039 54566 65438 52799 40826 71039 40926 58739 52799 37541 82549 82549 40826 59945
Calculated s
(mm)
23
708 128 72 7 15 3 724 146 144 17 3 71 3 11 5 11 2 732 13 2 707 1 5 1 13 7 93
102 118 137 728 12 l 69
11 9
s__caL n=smeos
() 24
050 092 050 087 0 77 7 00 069 l36 l 12 098 133 l81 l97 103 090 065 0 75 099 117 126 090 101 097 078
ri=l00 sd=035 sv=035
K = l50gcp
25
570 585 600 495 525 525 525 450 585 525 735 600 690 450 480 735 480 630 585 450 825 825 1180 645
E l
(kPa)
26
67684 69465 72250 57726 44856 44856 44856 38448 59659 54306 74956 63214 70704 49089 56783 79502 45283 61081 58207 42927
708572 94785 71033 91898
E = t E middotA2
l
(kPa)
27
54283 5571 l 59389 47336 35795 35795 35795 30682 47790 43336 59964 51266 57553 47088 47024 65987 34823 46970 44877 33269 84639 74027 55974 71589
Calculated s
(mm)
28
l O l 12 l 11 7 737 15 9 18 7 185 21 1 12 6 12 2 133 14 l 150 13 7 13 l 14 7 709 12 7 738 755 12 4 735 50
100
- -
Tab l53 Results of calculation for piles No l-24
Pile
29
l 2 3 4 5 6 7 8 9
10 ll 12 13 14 15 76 17 78 19 20 21 22 23 24
sea l n= middotshy
smeas
28 TT
30
0 46 087 046 0 72 099 l 28 088 l 66 l 25 l 04 l 58 l 93 2 17 l 32 078 0 70 088 l 23 l 37 l42 087 l l 3 066 065
n=l 10 sd=0 44 sv=040
s seal for p n=s=lOrnn ac cording to s = 70mm
(mm)
37 32
5 l 0 51 ll 8 l18 64 064
13 0 l30 85 0 85
13 3 l 33 83 0 83
184 l84 ll6 l l 6 105 l05 137 l 37 21 3 2 12 19 4 l94 107 l06 l l 3 l l 3 84 084
92 092 l 0 9 l09 128 l28 83 083
l 0 3 l03 88 088 79 0 79
n=1 73 sd=025 sv=027
s for p according to s = 20mm
(mm)
33
10 4 184 102 18 6 15 6 200 14 9 276 209 18 4 219 292 274 185 17 9 12 9 -
169 194 219 172 200 143 15 0
seal n=s=20rnn
34
052 092 051 093 078 l00 075 l 38 l 05 092 l l 0 l46 l 37 093 090 065
-085 097 l1 0 086 l00 072 075
n=093 sd=025 sv=0 27
s for p according to s = 30rnn
(mm)
35
142 223 14 l 22 3 198 249 142 34 5 290 249 274 345 33 l 243 22 6 168 -
24 7 26 6 293 24 3 279 187 213
seal n=s=30rnn
36
047 0 74 047 0 74 066 083 047 l 15 0 97 083 091 l 15 l10 0 81 075 056 -
082 089 098 081 093 062 0 71
n=o80 sd=020 _ sv=0 25 N
IO
APPENDIXES
APPENDIX 1 1 1
Pi le No 1 Length 13 m D 10 m
Areas of influence
-
qe
(MPa)
1 fp
___9c_ f
(MPR) zyen
(MPf) qcp (MPa)
Soil type
22 20 18 16 14 1 2
l 2 (m)
10
1 0 08 06
16 15 16
026 027 026
42 41 42 Sand
04 14 U28 39 02 14 028 39 41
02 16 0 26 42 04 16 026 42 06 16 026 42 08 14 028 39 Sand 1 0 13 030 39 12 15 027 4 1 38 14 13 030 39 16 12 032 38 18 12 032 38
40 20 10 036 36 22 10 036 36 24 9 U39 35 2 6 8 043 34 28 10 036 36 30 10 036 36 3 2 10 036 36 34 10 0 36 36 36 11 0 34 37 38 11 034 37
l 1 (m)
40
42 44
11 0 34 37 15 1
46 48 50 52 54 56 58 60 62 64 66 68 70 7 2 74 76 78 8 0
APPENDIX 112
Pile No 2
to little depth of sounding
q~ = middle values for 11 = 2 Op
q~ = 145 MAa (Francke Garbrecht 1977 Tab 2 p 50) (Fi g No 2)
for sand
qcp = 0275middot145 = 40 MPa q~p =V ~~s) middot 40 = 097middot40 = 39 MPa
Pile No 4
q~ = 120 MPa sand (Fig No 4)
q = 0 315middot12 = 3 8 MPa q bull 38 = 086middot38 = 33 MPa=V Jmiddot54
1
cp middot bull cp
Pile No 12
qg = 155 MPa sand (Fig No 13)
qcp = 026middot155 = 4 03 MPa
Pile No 13
q~ = 200 MPa sand (Fig No 14)
q = 0 23middot20 = 46 MPacp
APPENDIX 113
PileNo3 Length 14 m D 15 m
Areas of influence
-
qe
(MPa)
1 Tp
----9cf
(t-1Pf) r~
(MPf) qcp (MPa)
Soil type
22 2D 18 16 17 025 43 14 17 II II
L 2 17 II II
12 (m)
16 10 08 06
17 17 17
o
II
II
II
II
Sand 04 17 II II
02 19 024 46 b9
02 19 024 46 04 17 025 43 06 15 027 41 08 13 030 48 1 0 12 032 38 12 11 033 36 14 13 0 30 39 16 14 028 39 18 12 032 38 40 20 16 026 42 2 2 16 026 42 24 11 033 36 26 11 033 36
60 28 30
10 10
036 036
36 36
Sand
32 10 036 36 34 12 032 3 8 3 6 12 032 38 38 12 032 38
1 1 (m)
40
4 2 4 4
13
14 16
030
028 026
39
39 42
46 13 030 39 48 12 032 38 50 14 028 39 52 10 036 36 54 13 030 39 56 14 028 39 58 15 027 41 60 15 027 ~-1 236 62 64 66 68 70 72 74 76 7 8 80
APPENDIX 114
Pi l e No 5 Length 6 0m D 11 m Dp 11 m
Area s of i nfluence
-
qc
(MPa)
1 Tp
-3Lf
( MPf) l ~
(MP~) qcp (MPa)
Soil type
2 2 2 0 18 1 6 14 1 2 155 U i1 33
l 2 (m)
1 2 10 08 06
15 14 12
022 023 0 27
3 3 32 32
Fine sand
+ silt
04 125 026 33 02 16 0 21 34 39
02 16 021 34 04 13 025 33 06 08 10
15 5 17 20
022 0 20 018
34 34 36
35 Fi ne sand
1 2 20 0 18 36 14 20 018 36 + s ilt 16 20 0 18 36 18 165 020 32 20 165 0 20 32 22 17 0 20 34 24 26 2 8 30 32 3 36 38 4 0
19 21 5 21 5 21 5 20 19 5 19 5 20 215
01 9 ---
018 018 0 18 0 18 -
3 6 40 40 40 36 35 3 5 36 4 0
l 1 (m) 4 2
44 20 19
018 01 9
36 3 6 157
46 48 50 5 2 54 56 58 6 0 62 64 66 68 70 7 2 74 76 7 8 8 0
APPENDIX 1 15
Pi le No 6 Lengt h6 0 m D 11 m
Areas of qc 1 __9_c_ qcp Soil typei nfluence fp f 1 yen (MPa) (MPf ) (MPf) (MPa)
-2 2 20 18 16 t 4---0 14 75 038 29 L2 20 018 36 Fi ne sand
1ti 10 30 40 + s i lt12 08 19 0 19 36(m) 06 17 020 34 04 14 023 32 02 9 034 31 56
02 6 043 26 04 12 026 3 1 06 17 020 34 08 11 028 3 1 1 0 14 023 32 35 1 2 17 020 34 Fi ne sand14 19 019 35 16 20 018 36 + silt18 18 0 19 34 20 14 023 32
46 22 12 026 31 24 12 026 31 26 15 022 33 28 18 019 34 30 20 018 36 3 20 0 18 36 34 20 018 36 3G 20 018 36 38 20 018 36 4 0 20 018 36
l 1 42 22 40
(m) 44 22 40 46 L2 4 0 158 48 50 52 54 56 q =V ~ - 3 b =0 99middot35 = 35 MPp cp 53 58 6 0 62 64 66 68 70 72 74 76 78 80
APPENDIX 116
Pi leNo7 Length 60 m 0 15 m
Areas of influence
-
qe
(MPa)
1 Tp ~
(MPg) r~
(MPf) qcp (MPa)
Soil type
22 20 18 16 9 U33 30 14 10 031 31 12 135 024 32
l 2 (m)
16 10 08 06 04 02
13 12 6
10 175
025 026 043 0 31 020
33 31 26 3 1 35 50
Fine sand
+ silt
02 04 06
17 10 115
0 20 0 31 027
34 31 3 1
08 10
145 185
023 019
33 35 3 5
1 2 14
20 19
018 0 19
36 36 Fine sand
l 1 (m)
60
16 18 20 22 24 26 28 30 3 2 34 36 38 40
42 44 46 48 50 52 54 56 58 6 0
185 125 125 165 17 19 21 215 205 20 21 20 20
24 22 20 215 22 22 21 19 18 22
0 19 026 0 26 020 020 019 --
018 018 -
018 01 8 --
018 ----
0 19 0 19
35 33 33 33 34 36 40 40 37 36 40 36 36
40 40 36 40 40 40 40 36 34 40 219
+ silt
62 64 66 68 70 72 74 76 78 80
APPENDIX 117
Pile No 8 Length60 m D 15 m Dp 2 1 m
Areas of influence
-
qe
(MPa)
1 r +
(MPg) r~
(MPf) qcp (MPa)
Soil type
22 18 019 34 20 16 021 34 18 125 026 3 3 16 115 027 31 14 11 028 3 1 12 11 028 3 1
l 2 (m)
10 08 06
105 11 145
D29 028 023
30 31 33
Fine sand
+ silt
04 18 0 19 34 02 18 019 34 71
02 15 022 33 04 11 0 28 31 06 13 0 25 33 08 20 0 18 36 10 15 022 33 12 13 025 33 14 175 020 35 16 18 20 22
20 21 20 15
018 -
018 0 22
36 40 36 33
35 Fine sand
+ s i lt
24 26 28 30 3 =
13 16 175 19 20 20
025 021 020 0 18 018 018
33 34 3 5 34 36 36
36 38 4 0
20 20 21
018 0 18 -
36 36 40
11 (m)
4 2 4 4 4 6 48 50 5 2 5 4 56 5 8 60 6 2 6 4
20 20 21 22 21 20 19 175 19 20 25 28
018 0 18 ---
01 8 01 9 0 20 0 19 018
36 36 40 40 40 36 36 35 36 36 40 4 0 23 0
6 6 68 70 72 74 76 78
qcp 1f5=v 2T middot35 = b85 middot35 = 30 MPa
80
APPENDIX 118
Pi le No 9 Le ngth 90 m D 11 m m
Areas of 1Qe -9c qcp Soil typeinfluence Tp f ryen (MPa) (MPg) (MPf) (MPa)
-
2 2 2 0 18 16 14 lc 11 034 37
12 10 10 036 36 12 08 9 039 35 Medium(m) 06 10 036 36 sand04 10 036 36
02 11 034 37 43
02 12 032 38 04 12 0 32 38 06 12 0 32 38 08 13 030 39 10 13 030 39 12 13 030 39 14 14 028 39 16 14 028 39
44 18 14 028 39 20 14 028 39 39 Med ium 22 15 027 4 1 sand 24 16 026 4 2 26 17 025 43 28 13 0 30 39 3 0 9 039 35 32 13 030 39 34 16 026 42 36 17 025 43 38 17 025 43 40 19 024 4 6
11 42 17 025 43
(m) 44 15 027 41 17 7 46 48 50 52 54 56 58 60 6 2 64 66 68 7 0 7 2 74 76 78 80
APPENDIX 119
Pi 1 e No 10 Length 95m D 11 m m
Areas of influence
-
qe
(MPa)
1 fp
-9c f
(t-1Pf) [~
(MPf)
qcp
(MPa)
Soil type
22 20 1 8 16 14 L 2 13 Uti 3J
l 2 (m) 12
10 08 06 04
18 18 28 19
0 19 019 0 19 019
34 34 34 34
Fine
sand
02 21 40 42
02 20 4 0 04 17 020 34 06 21 40 0 8 10
23 22
40 40 Fine
1 2 14 16 18
21 20 16 15
0 21 022
4 0 4 0 34 33
sand
44
20 2 2 24 26 28 30 32 34 36 38 40
14 14 13 11 11 14 17 14 12 13 12
023 023 025 0 28 028 023 020 023 027 025 027
32 32 33 31 31 32 34 3 2 32 3 3 32
l 1 (m) 42
44 12 13
0 27 025
32 33 15 2
46 48 50 5 2 5 4 56 5 8 6 0 6 2 6 4 66 6 8 70 72 74 76 78 80
APPENDIX 11 10
Pi 1 e No 11 Lengt h 9 0m D 11 m m
Area s of influence
-
Qe
(MPa)
1 fp
__k_ f
(MP~) ryen
(MPf) qcp (MPa)
Soi l type
22 20 18 16 14 12 lb 55
12 (m)
1 0 08 06 04
23 19 20 21
024 023
55 46 46 55
Medium
sand
02 22 55 62
0 2 04
24 25
55 55
06 08
27 28
55 55
10 12 14
28 28 28
55 55 55 49
16 26 55
44
18 20 22 24 26 28 30 3 34 36 38 40
24 19 18 17 22 21 17 11 13 12 11 9
024 024 025
025 0 34 030 032 034 039
55 46 43 43 55 55 4 3 37 39 38 3 7 35
1 1 (m) 42
Ll Ll
12 16
032 0 26
38 4 2 209
46 48 50 5 2 54 56 58 60 62 64 66 68 70 72 74 76 78 80
APPENDIX 141
0 2 3 4 p [MPa)
PILES WITH 40 ENLARGED BASES
80
120
160 C----0
200 IN4014 s (1977)
[mm]
P s calculateds P p(s)(mm) (MPa)(mmMPa)(MPa) ()
10 035 286 046 20 065 308 080 30 090 333 104
150 24 625 214 200 229
ai = 2605 (mmMPa) b1 = 0243 1MPa V 1000 bi = 1b = 411 MPa
_ 411 MP Vi - 24 a
() assumed
average Dp = 18 m
qcp = 24 MPa ai = 184 (mmMPa) (28-4middot24)
Vi = 1 2 (3-18)
qcpmiddotvi = 29 MPa
40
80
120
160
200 s
[mm]
DIN 4014 Part 2 ( 1977)
0 1 2 3 4 5 p [MPal
PILES WITHOUT ENLARGED BASES
C----0
DIN 4014 ( 1977
s calculated s p -p- p(s)
(mm) (MPa)mmMPa)(MPa) ()
10 05 20 062 20 08 25 113 30 11 27 3 155
150 34 441 385 200 424
ai = 2085 (mmMPa) bi= 0 157 1MPa V = 0970
bi= 1s = 637 MPa
Vi 187=3f =
() assumed
average Dp = 12 m
qcp = 34 MPa a1 = 144 (mmMPa)
Vi = 18
qcpmiddotvi = 61 MPa
Range qc = 10-15 MPa
(28-4bull34)
(3-12)
1 1 q = r -r- = 036 for qc = 10 MPaCp p Ip+= 027 for qc = 15 MPa
qcp = 36-405 MPa P
APPENDIX 142
Touma F and Reese L (1974)
Soil parameters pile parameters and base resistance see fig bullbullbullbull
TAB
Measured load settlement curves
Settlement s
mm
10 20 30 40 50 60 80
100 120
a 1 (mmMPa) bi(MPa) V
N3u
q =04 -N30 (cMPa) ()
1 qCp=--rpbullqC
Pile No 21 (US 59) 22 (HH) 23 (G1) 24 (BB) Notep Sp p S p p S p f Sp MPa mmMPa MPa mmMPa MPa mmMPa Mla mmMPa
131 76 169 59 075 133 100 100 269 74 325 62 131 153 1 94 103 381 79 456 66 165 182 273 11 0 488 82 581 69 1 90 21 1 349 115 581 86 694 72 2 15 233 424 118 675 89 800 75 229 262 813 98 245 327 884 113 925 130
64 56 100 95 U049 0032 0276 0048 0944 0998 0996 0981
80 gt100 30 60 32 gt 40 12 24 ()
Bergdahl (1982)
gt5 5 gt55 32 4 3
(0 18middot32) (018middot40) (0265middot12) (018middot24)
CONTACT PRESSURE p [ MPa]
0 2 4 6 8 100 N-------r---------------(us 59) ( HH) ( BBi
E E SQ-------lt+-----+--------------lt
VI
1shyz UJ
~ 100 1---------i----+----+----+------l------I -J I shyI shyUJ V)
so~----~--~-- ~--~
APPENDIX 143
us 59 fYJo 0 50 00
ff-t r-=-~c~=~-r~c_---_---l-~e-J-C~ 0 ------
CLAY
FINE SANO
J lD- 760 mm
f5m~--~--~
Pile US 59 and results from penetration test
HH IV_l() so 100 r=-=-==-==-r-~--=-=- 0 0 II 15- flf ~ II~ Ibull If t f
CLAY SAND
Sm
)
= -middotl lo - GtOmm
~ JI
SILTY SANO tOm
Pile HH and results from penetration t est
APPENDIX 14 4
61 NJO 50 --------00
11 1 =f J - 1 -- 0
CLAYSILT
E ~ Sm ltrj
SILTY SAND
q I lDmiddot 910 mrn tom
I) t bull
Pile G1 and results from penetration test
88
0 50 too ~1-e I q 111bull - Q
CLAY
SIL TY SAND 5m
]
l lDmiddot760mrn
Om
Pile BB and results from penetration test
APPENDIX 145
Klosinski B (1977)
Loading tests 50 bored piles 09-125 m diameter average Op= 11 m On t he sett l ement of rigid pla te the settlement of t he pi le base is given by
PmiddotOSp = T-K b
where Mb - equivalent deformability modu lus
1) Sand and sandy gravel of medium density
Mb = 25-50 MPa
According to Bergdahl (1979) medium sand is between
q(l) 5 MPa (Io=035)c2)
ql = 10 MPa (Io=065)C
from fig 117 rp1 = 055 for qc = 5 MPa 1Tp = 036 for qc = 10 MPa
q(l)= 0 55middot5 = 2 75 MPacp bull
q(2= 0 36middot10 = 360 MPacp
allowable p~ 1)= ~p = yen = 092 MPa and p~2) = ~ = 120 MPa
settlement of the pi l e base
5(1)= o 92 middot 1bull1 = O 0135 m = 13 5 mm p 325 middot middot
5( 2)= 1bull2bull1middot 1 = O 0088 m = 8 8 m p 350 bull bull
1) _ s _ 135 _ 14 7 (mm) a(2) _ 88 _ a 1 - p - o---92 - bull NPa bull 1 - T-7 - 733 (Wa)
2) Loose sand lo= 030-040
Mb = 12- 25 MPa
q~l) = 44 MPa q~2)= 58 MPa
1Tp = 058 and 052
q(3) = 0 58middot4 4 = 2 55 MPa middot q( 4) = 0 52middot5 8 = 3 02 MPa cp bull middot bull cp bull middot middot
allowable p~ 3)= 4i = 085 MPa p~4)= yenl = 101 MPa
s(3)_ 085-11 = 26 mmmiddot s(4)_ 101middot11 = 148 mm p - 312 p - 3 25
STATENS GEOTEKNISKA INSTITUT Swedish Geotechnical Institute S-581 01 Linkoping Tel 01311 51 00
Serien Rapport ersatter vara tidigare serier Proceedings (27 nr) Sartryck och Preliminara rapporter (60 nr) samt Meddelanden (10 nr)
The series Report supersedes the previous series Proceedings (27 Nos) Reprints and Preliminary Reports (60 Nos) and Meddelanden (10 Nos)
RAPPORT REPORT Pris kr
No Ar (Swcrs)
1 Grundvattensankning till foljd av 1977 50shytunnelsprangning P Ahlberg T Lundgren
2 Pahangskrafter pa langa betongpalar 1977 50shyL Bjerin
3 Methods for reducing undrained 1977 30shyshear strength of soft clay K V Helenelund
4 Basic behaviour of Scandinavian soft 1977 40shyclays R Larsson
5 Snabba odometerforsok 1978 25 shyR Karlsson L Viberg
6 Skredriskbedomningar med hjalp av 1978 40shyelektromagnetisk faltstyrkematning - provning av ny metod J Ingands
7 Forebyggande av sattningar i 1979 40shyledningsgravar - en forstudie U Bergdahl R Fogelstrom K - G Larsson P Liljekvist
8 Grundlaggningskostnadernas fordelning 1979 25 shyB Carlsson
9 Horisontalarmerade fyllningar pa los 1981 50 shyjord J Belfrage
RAPPORTREPORT
No
10 Tuveskredet 1977-11-30 Inlagg om skredets orsaker
11a Tuveskredet geoteknik
l1b Tuveskredet geologi
11 c Tuveskredet hydrogeologi
12 Drained behaviour of Swedish clays
R Larsson
13 Long term consolidation beneath the test fills at Vasby Sweden YCE Chang
14 Bentonittatning mot lakvatten T Lundgren L Karlqvist U Qvarfort
15 Kartering och klassificering av leromradens stabilitetsforutshysattningar L Viberg
16 Geotekniska faltundersokningar Metoder - Erfarenheter - FoU-behov E Ottosson (red)
17 Symposium on Slopes on Soft Clays
18 The Landslide at Tuve November 30 1 977 R Larsson M Jansson
19 Slantstabilitetsberakningar i lera Skall man anvanda total spanningsanalys effektivspanningsanalys eller kombinerad analys R Larsson
20 Portrycksvariationer i leror i Gateshyborgsregionen J Berntson
21 Tekniska egenskaper hos restproshydukter fran kolforbranning shyen laboratoriestudie B Moller G Nilson
Ar
1981
1981
1981
1981
1981
1982
1982
1982
1983
1982
1983
1983
1983
Pris kr (Swcrs)
50shy
50shy
40shy
50shy
100shy
60shy
80shy
60shy
190shy
75shy
60shy
150shy
65shy
RAPPORTREPORT
No Ar Pri s kr (Sw crs)
22 Bestamning av jordegenskaper med sondering - en litteraturstudie U Bergdahl U Eriksson
1983 75 shy
23 Geobildtolkn ing L Vi berg
av grova moraner 1984 70 -
24 Radon i jord -Exhal ation- vatten kvot -Arstidsvariationer - Permeabilitet A Lindmar k B Rosen
1984 75 shy
25 Geoteknisk terrangklassificering for fysisk planering L Viber g
1984 120shy
26 Large diameter bored piles in nonshycohesive soils Determination of the bearing capacity and settlement from results of static penetration tests (CPT) and standard penetration test (SPT) K Gwizdala
1984 85shy

16
Similar results can be observed in Fig 116a and
Fig 116b It was showed by Kerisel (1965) and Franke
(1973) that the harder soil the more loosening at
excavation and thus relatively smaller bearing capacity
Taking into account the Franke diagrams we will have
for D = 125mand settlements= 2 cm p
Cone resistance qc (MPa) 1 5 50 1 0 15 22
qc p for s=2 cm 3 6 8 12 14
(see Fia 1 1 6b )
taking safety factor for pile base F = 3 the point resis~ance
33-10 ~-05
380375 lo 212 bull lo 2114 bull
factors- shy are p
The above anal ysis shows that it is possible to determine
ultimate point and shaft resistance of bored piles from
static cone sounding But it is very important and must
be taken into account type of pile kind of soil and
degree of compaction
Bel ow calculation method for large diameter bored piles
based on the static cone penetrometer resistance (CPT)
is proposed Equation (117) can be used directly for
the base diameter D lt 15 m For larger diameters p shyD gt 15 m the values should be multiplied by the
p ff t ITscoe icen Y~ as pi
( 1 1 5 )
where
qcp = according to equation (117)
D = diameter of the pile base D gt 15 mpi pi
17
This value q~p should be put into equation 116
The value qc s in equation 118 is independent on the
pile diameter
Proposed calculation method
(116)
where)
1 1 40 ~ 11 3 for piles wit h a nd enlarged bases12 10 12 = ~
h+h
q (h) dh (117)qcp l1+l2 f -f- Ch-li p
h 1 f 1
qcs = o -f- qc (h) dh (118)h s
1 -f- = f(q kind of soil ) -+- see Fig 11 7 and Tab 1 1 7
C p
f (q kind of soil ) -+- see Fig 1 1 8 and Tab 1 1 8 fs C
Note
a) the point resistance q for qc gt 20 MPa is assumed cp to be maximum as
- Gravel 70 MPa - Coarse sand medium sand 55 MPa - Fine sand s il ty sand 40 MPa
b ) The shaft resistance qcs for qc gt 20 MPa is assumed to
be maximum as
- Gravel 110 kPa - Coarse sand medium sand 90 kPa - Fine sand s ilty sand 70 kPa
These proposed values are compared with results by
Bustamente (1 982) and the Polish Specification (1978)
Fig 11 9 and F i g 1110 A similar comparison for DIN
4014 1 977 is shown in Fig 1111 and Fig 1112
) In this paper was used the above values 1 1 and l z But it can be used in practice 11 =30 D and h =2Dp respectively The results shall be very simi l ar to the above onPs
18
The proposed method has been examined with field test
results This is shown in Fig 1113 to Fig 1128
and Appendix 1 11 to 1110 and Tab 119
The comparison shows that the value of q in equationcp (117) corresponds to the settlement -10 of the base
diameter (s=010 DP) see Fig 1113 and Tab 119
(average sDp=88 and standard deviation sd=3)
Later in this paper the allowable load and dependence of
the load versus settlement will be determined
12 Determination of bearing capacity of the large
diameter bored piles from results of the Standard
Penetration Tests (SPT)
There are little published on pile tests coupled with
results from Standard Penetration Test (SPT) Among the
authors who have published material in the subject are
- Meyerhof 1956 1976
- Senneset 1974 (Norwegian method)
- Rodin Corbett Sherwood Thorburn 1974 (English method)
- Polish Specification 1975
- Weltman Healy 197 8
- Reese 1978
- Japanese Society 1981
- Decourt 1978 1982
The Norwegian method is valid o nly for concrete andor
wooden piles the English method only for gravel It is
very important to underline that the Norwegian a nd the
English methods use of the SPT resul ts intermediate by
the static cone penetrometer resistance (q ) as well C
Below methods are presented that are using the results of
SPT directly Meyerhof s method in total can also be used
on driven piles in non-cohesive soil Although we could
have found some proposes for bored piles Eqs (121 and
122) see Fig 121 and Fig 1 22 as well
19
Ultimate point resistance (psf)
12 N 3 omiddotH lt 120 N 30
(kPa) (1 2 1)Psf D
where
N30 the average standard penetration resistance
in blows per 03 m
H depth in bearing stratum
Ultimate skin friction tu
for bored piles tu N~ o (kPa) (1 22a)
for driven pil estu 2N30 (kPa) (1 2 2b)
where
N30 the average standard penetration resistance
in blows per 03 m within embedded length
of pile
Weltman and Healy (1978) taking into account Meherhofs
proposition for driven piles have introduced two coefshy
ficents for bored piles in gravels (glacial soil) Equ
123 and Fig 1 23
t = a 2 N30 (kPa ) (1 2 3)U 1
where
ai a 1 for impermeable gravels see Fig 123a
ai a 2 for permeable gravels see Fig 123b
The Polish Specification ( Specification for Design and
Construction of Large Diameter Bored Piles in Bridges
1975 Ministry of Transport) gives the ultimat e point
resistance in dependence of N30 base diameter and depth
see Tab 12 1 The Tab 121 contains values for coarse
and medium sand For other non-cohesive soils the following
coefficients are proposed
p f = S bull p f (medium sand) ( 1 2 4)S 1 S
20
where
S1 1 20 for grave lSi
f 132 080 for fine sand
13 3 070 for silty sand13i
In Fig 124 values of psf are shown for h = 10 m DP
06 m DP= 15 m and h = 20 m DP= 06 m DP 1 5 m
respectively
A few of the instrumented piles were tested and analyzed
by Wright and Reese (1979) The ultimate point and shaft
resistance in the fine and silty sand as a function of
blow count from SPT is shown in Fig 125 Results from
two additional tests reported by Koizumi (1971) are also
introduced in the figure The ultimate point resistance
is assumed to exist at a settlement equal to 5 of the
base diameter
Methods of prediction of the bearing capacity of piles
based exclusively on N30 values were presented by Decourt
1982 Below a proposition for high capacity piles excavated
and cast under bentoni te is presented
The ultimate skin friction is determined by the expression
(see Fig 126)
t = 33 N30 + 1 0 (kPa) ( 1 bull 2 5 ) u
where
N30 average value of N30 along the shaft
- for N30 lt 3 must be taken as = 3N30 - for N3o gt 5 0 must be taken as NJo= 50
The allowable point resistance can be obtained in a n
expedite way as
Psa = 33 N30 (kPa) (1 2 6)
where
N30 = average of Nat point level one metre above
and one metre below
Psa allowable point resistance
21
Decourt proposed a safety factor for the point of F = p
40 Therefore the ultimate point resistance can be
determined by the expression
(kPa) (1 2 7)
In Fig 12 7 and Fig 1 28 the above values for base
and skin friction resistance are compared respectively
Taking into account the type of soil thereis a good
correlation for ultimate point resistance The result for
ultimate skin friction is scattered but only apparently
The values for large diameter bored piles are between
the line 1a and 1b in Fig 128 Large diameter piles
have a high ultimate skin friction in relation to driven
piles (see points for bored piles in Fig 122 and DIN
4014 Part 2 1977 as well) The high values for piles
excavated and cast under bentonite have had a strong base
on the load tests (Decourt 1978 1982 and Wright and
Reese 1979)
Below the proposals are given for determination of the
values of the ultimate point resistance and the ultimate
skin friction Eqs 128 to 1214 and Fig129 1210
The ultimate point resistance
- gravel psf = 140 N30 (kPa) ( 1 bull 2 8)
for N~ 0 gt 50 blows3O cm Psf 7 MPa
- coarse sand and medium sand
(kPa) ( 1 2 9)
for N30 gt 50 blows3O cm Psf 55 MPa
- fine sand and silty sand
psf = 80 Nio (kPa ) (1210)
for N30 gt 50 blows3O cm p f = 40 MPa 5
where N3 o the average of N value near the point level as
22
h+l1
f N3o(h)dh ( 1 2 11 ) h-12
3DP see Fig 1 1 1 D
p
The ultimate skin friction for coarse sand and medium sand
tu = 1 8 N 3 o (kPa) (1212)
t (kPa) (excavated and cast (1213)u under bentonite)
where
N30= the average value of N along the shaft as h
N -
3 o = h1 f N 3 o ( h) dh ( 1 bull 2 bull 1 4 ) 0
The ultimate skin friction for N30 gt 50 blows30 cm is
assumed to be maximum as tu = 90 kPa and t = 150 kPa u
13 Allowable load of large diameter bored piles
The allowable load Qa of large diameter piles has been
expressed as
OuQa ( 1 3 1)Ft
Qa Q(s)=Qb(s) + Os(s) ( 1 3 2)
Opu + Osu (1 3 3)Qa Fp Fs
Qr lt mmiddotQf ( 1 bull 3 4)-
= universal safety factor
individual safety factor for ultimate resistance of the pile point
individual safety factor for ultimate resistance of the pile shaft
= load according to the allowable settlement
calculated load
m coefficient
calculated ultimate bearing load of the pile
23
The equations from (131) to (134) are used as
1) equation (131)
a) DIN 4014 - 1977 Ft= 2 175 15 (depending on the kind of load)
b) Polish Specification 1975 Ft = 18 16 ( -- )
1c) Trofimenkov 1974 Ft = 14307
2) equation (132)
a) DIN 4014-1977 i Q(s) = Qb(s) + Q (s) = A middotp(s) + E tAsmiddott(s)
s p 0
where Qbs) and Qs(s) are described in Fig 1423
3) equation (133)
a) Polish Specification 1974
F 25 22 depending on the kind of load p
F 1 bull 0 s
b) Wright SJ Reese LC 1979
The ultimate capacity or resistance is considered as a
random value and represented by a frequency distribution
The distribution can be described by a mean value and a
variance The distribution of the load applied to the
foundation can be described similarly The coefshy
ficients used to factor resistance and loads are called
partial safety factors Some recommended partial safety
factors for resistance under normal conditions of design
and construction are given in Tab 131 Normal control
is defined as a condition where the coefficient of variation
is less than about 035
Typical values for partial safety factors for loads are
in the range 1 to 2 depending on the type of load and
how it is applied The overall factor of safety Ft can
then be calculated from the equation
Ft = y RbullY S
24
where
YR the par tial sa f ety fac t or for resistance and
Ys the partial safety factor fo r load
The probability of fa i lur e of the foundation can be r eshy
lat ed to the factor of safety for a parti cular degree of
uncert ainty (see Tab 13 2)
c ) Tejchman Gwizdala 1979
The authors discuss adequate safety factors based on fie l d
test s by Spang (1 972) Franke (1976) Touma and Reese (1974)
Colombo (1971) Kerisel and Simons (1962) Appendirno (1973)
see Tab 1 33 Taking into account the universal safety
factor Ft= 2 0 for the tota l load settlement curves it
was estimated
i) F in the range of 111 to 237 with the average value s F = 166 and standard deviation sd = 034 s (see column 16 Tab 133)
ii) Fb in the range of 161 to 945 with the average
value Fb = 387 and standard deviation sd = 2 15
For model core d piles in laboratory conditions values of
Fs = 108 to 154 (average Fs = 132 s~ = 019) and
values of F = 280 to 5 94 (average F = 3 55 sd = 1 07)p p
see Tab 1 3 4
As a conclusion it was assumed that Fb = 40 and F 1 5 s
for l arge diameter bored piles
The investi gation has shown that for the above safety
factors settlements of piles under permissibl e loads are
10 to 20 mm There was assumed a maximum load on large
diameter piles corresponding to a settlement of 010
diameter of the piles
25
d) Bustamente Gianeselli 1 982
e) 0ecourt 1982
The safety factor is given by
F = FgmiddotFfmiddotFamiddotFw where
F 11 - skin friction g F 135 - point bearing capacity
g
Ff safety factor related to the formulation adapted
Ff= 10 for Decourts method
Fd safety factor related to excessive deformation
Fd = 10 for skin friction
As for the point Fa= 2 to 3 depending on the
pile diameter For usual cases 25 is suggested
Fw safety factor related to working load
Decourt recommends 12
Thus we will have
- for skin friction
Fs = 11bull10middot10middot12 132 - 13
- for the point
F = 135bull10bull25middot 1 2 = 405 = 40 p
4) equation (134)
a ) Polish Code 1983
Q lt mbullN r shy
where
total load coefficient (depending on the kind of load For foundation we can assume Yf = 12 )= code load
correction coeffic i ent
09 for pile foundations
m 08 for two piles
m 07 for single pile
26
N ymmiddotQu
ym material (soil) coefficient
ym 08 to 09 (Polish Code 1981)
Thus we will have
QnmiddotYf lt mmiddotym middotQu-
Yf9uFt = On m bull Ym
1 2 max = 2 14Ft 0 7 bull 0 8
1 2min = 1 48Ft 0909
The above analysis has shown different ways to determine
the allowable load The analysis is in direct connection
with mobilization of the load (versus settlement) The
dependence of total load point resistance and shaft reshy
sistance will be discussed in detail in Chapter 14
In the authors opinion taking into account the above
analysis the allowable load should be determined based
on the equation 133 ie based on individual safety
factors for ultimate point and shaft resistance Proposed
values of F and F in literature are shown in Tab 135 s p The average values are Fs = 145 and Fp = 3 38 respectively
Taking into account that the bearing capacity is determined
based on the results from sounding measurements direct from
a place near the piling without a ny indirect correlation
the allowable load of large diameter bored piles is given
by the equation (133a)
( 1 3 3a)
where F = 30 and F 13 are proposedp s
27
14 Determination of settlement of larqe diameter bored
piles based on static cone penetration tests CPT
Determination of ultimate point and skin friction resistance
based on static cone penetration tests has been discussed
in Chapter 11 above Based on the results of this calcushy
lation and on Chapter 13 we can establish an approximate
relation between point resistance shaft resistance and
total load on one hand and settlement on the other However
the approximation gives a wide scatter especially for base
resistance as can be observed in Fig 141 to Fig 144
Only the first part of the point resistance - settlement
curves are in good agreement with measured values It can
be observed in Fig 145 that the average correlation
coefficient n = 098 and standard deviation sd= 029
This way of calculation can be used only for rough calcushy
lation (see Chapter 13)
In Chapter 11 also measured point resistance - settlement
curves were shown The base resistance increases gradually
with increasing pressure and settlement Below the cur7
vature of the point resistance - settl ement curve will be
examined It is assumed that this curve can be described
as a part of the hyperbola curve Thus if the ratio of
the measured settlement (s ) to the point resistance (p)
is plotted against the measured settlement the result
will fall closely to a straight line with the equation
( 1 4 1)
where a 1 and b 1 are constants (see Fig 1 46a and Fig
14 6b)
Then the point resistance - settlement realtionship can be
expressed as a hyperbola
s p = ( 1 bull 4 2)
The constant is the initial s lope of the point resistanceshya 1
settlement curve ie a 1 = t~a The inverse of the constant
28
b 1 is the vertical tangent (asymptote) to the curve 1ie for s = 00
bf= ~ If the ultimate point reshy1
sistance psf is equal to bf (psf=bf) the whole point
resistance settlement curve will be a hyperbola type
Now the Eq 1 4 2 can be written as
s s ( 1 4 3)a) p s or b) p = a+__sect_a1 + 1 Psfbf
If the ultimate point resistance is smaller than bf only
a part of the hyperbola curve ought to be considered
Further the Eq 14 3 will be written as
p ( 1 4 4)
where
poundf_ correction factor for hyperbola point Psf resistance-settlement relationship
Taking into account the discussion in Chapter 11 the
ultimate point resistance psf = qcp based on the CPT measurements
Therefore the relationship between the point resistance
the sett l ement and the CPT result can be expressed as
s p (1 4 5)s
The correction coefficient v 1 will cause a change of the
position of the vertical asymptote bf in r elation to the
ultimate point resistance q bull This means that we take cp into account a different part of the hyperbola curve for
the description of the point resistance-settlement relationshy
ship
Now if we want to use the equation (145) in practice
we must determine the constant and the coefficienta 1 v 1 (assumed that q is determined ear l ier Chapter 11)cp
29
The constant a 1 and t h e coefficient Vi have been detershy
mined based on fi e ld tests according to pi l es No 1 - 20
see Tab 14 1 and Tab 1 1 9 as wel l The values of
a 1 versus the point diameter D and the ul timate pointp
resistance respectively are shown in F i g 147 and Fig
148 Fig 1 47 shows that a 1 is independent of the
point diameter D Based on Fig 148 it can be assumed p
that
28-4bullq (1 4 6)cp
This correlation has been examined with data of the
literature see Fig 1 49 and Appendix 141 to 1 45
(Note there were no static penetration tests and qcp was determined based on a correlation made by Bergdahl
(1982))
A good correlation with equation 146 can be seen taking
into account the safety factor in the DIN 4014 Part 2
(1977) bull
The correction factor v 1 versus the poi nt diameter is shown
in Fig 1410 I t is assumed that the correlation is
V1 = 3 0 - D ( 1 4 7)p
where D is in m p
The above equations ie 146 and 147 were assumed for
a later analyses see Fig 14 11 and Fig 1412 The
piles No 1 to 20 were examined taking into account Eqs
14 5 14 6 and 1 4 7 The result of this cal cul ation is
presented in Fig 1 413 to Fig 1 4 18 and in Tab 1 4 2
respectively In Fig 1413 the calculation way for pile
No 2 is shown as an example
In Fig 1414 to Fig 1 417 measured and calculated
values of the point resistance versus settl ement can be
compared In tota l good correlation exists for all the
30
pressure-settlement curves Values of q from static cp
cone penetration tests and generalized values of anda 1
v 1 were considered Only for piles No 17-20 qcp was
assumed as the point resistance for s = 010 D because p
the static penetration test results were inaccessible
The similar comparison is shown in Fig 1417a for piles
in sand based on experimental results (Tuoma Reese 1972
and Wright Reese 1979) where the ultimate case resistance
was assumed as the resistance at a base settlement of 005
D The relative base resistance is the mobilized base p resistance divided by the ultinate base resistance The
curvature of the proposed point resistance settlement shy
curve to mean value proposed by Wright and Reese is excellent
However the constant a 1 and the coefficient v 1 were
determined for sand only In the future they should be
examined especially for gravel and silty sand based on
field tests Until then in the authors opinion the
values of v 1 can be chosen from Eq 147 for all nonshy
cohesive soils But for a 1 there is proposed
at = gt bulla (1 4 8)1
where
gt- 1 = 080 for gravel
gt 2 120 for silty sand
This proposal is shown in Fig 14 11 as dashed lines
A good correlation can be seen with the investigation by I
Kiosimiddotnski for sandy gravel and on the safety side with
the investigation by Tuoma and Reese for silty sand (see
Fig 149)
In Fig 1418 all calcul ations for pile No 1 to 20 are
summarize d The correlation coefficient n is defined as
the calculated point resistance p(s) divided by measured
point resistance p(s) For totally 126 points from 20
curves an average of n = 098 with standard deviation
31
al= 023 was obtained see Fig 1418 A similar result
can be observed for the range usually assumed of the
allowable settlement for sinqle large diameter bored
piles as
for
- for
- for
s
s
s =
10
20
30
mm a
mm
mm
verage n10 II
II
mm 089
095
099
and sd =
and sd
and sd
031
027
026
It can be questioned whether the sonstant a 1 can be deshy
termined in different ways The constant a 1 is the initial
slope of the point resistance-settlement curve as menshy
tioned above Then we can use all methods for determination
of settlement of a pile point The range of validity of
these methods then must be determined This will be shown
later
In order to be able to design the total load settlement
curve the skin friction resistance-settlement relationshy
ship must be determined The ultimate skin resistance of
large diameter bored piles was determined in Chapter 11
(based on static penetration tests) and in Chapter 12
(based on standard penetration tests)
In the past a lot of field tests have been done on the
mobilization of the shaft resistance versus pile settleshy
ment In this subject there is a rather good agreement
in the whole investigation for cohesive and non-cohesive
soil
Some results and opinions on thispresented in the literashy
ture during the last few years are shown below
Ultimate shaft resistance versus settlement
1) BurlandJB Butler FG Duncan P (1969)
-The shaft l oadsettlement curve is derived using a=0 3
with 90 ultimate load being mobilized at 025 in
settlement(~65 mm)
- soil London clay
- see Fig 1 419
32
2) Touma FT Reese LC (1974)
- The failure of the sides of the shaft takes place
at a downward movement of about 04 in (10 mm)
- soil sand
- see Fig 1420
3) Tomlinson HJ (1977)
- The maximum shaft resistance is mobilized at a
settlement of only 10 mm (or j in)
- soil stiff clay
- see Fig 1421
4) Klosinski B ( 1977)
- It was assumed that skin friction increased proshy
portionally to pile settlement up to the limit value
s bull This value depends on soil conditions and pile0 diameter and is usually from 3 to 8 mm For soft
compressible soil it may be grater than 10 mm
- soil cohesive soils
- see Fig 1422
5) Franke E Garbrecht D (1977)
- At settlement of 2 to 3 cm which are normally
allowed in Germany under working loads for buildings
not very sensitive to differential settlementsthe
skin friction is almost always fully mobilized
- soil sand
6) DIN 4014 part 2 (1977) and Franke E (1981)
- The skin friction Tm is approximated as diameter
independent having failure settlements of smf = 2 cm
in sand and 1 cm in clay
- soil sand and clay
- see Fig 1423
33
7) Reese By L (1978) Reese By L Wright SJ (1979)
(1978) The maximum skin friction being developed at
an average downward movement ranging from about 05shy
2 of the shaft diameter The average of six load tests
reported by Whitaker and Cooke (1966) are a lso plotted
for comparison
- soil stiff clays
- see Fig 1424 and Fig 1425a
(1979) The relative settlement is the average settleshy
ment of the butt and base devided by the shaft diameter
The mean curve maximises at a relative settlement of
about 002 D
- soil sand and clay
- see Fig 1425b
8) Tejchman A Gwizda3a K (1979)
- A clear differentiation of the distribution of shaft
and base resistances is observed for changing settleshy
ment For fairly small settlements the shaft resist shy
ance increases quite fast and the ultimate values
are reached soon while the base resistance increases
gradually with increasing loads and settlements withshy
out clearout ultimate values it can be assumed that
complete mobilization of shaft resistance corresponds
to settlements equal to 001 or 002 diameter of pile
- soil cohesive and non-cohesive soils
- see Tab 131 and Fig 1 426
9) Promboon S Brenner R P (1981)
- Load distribution and load transfer curves disclose
that most of the load is carried by shaft friction
which is developed at small displacements in the order
of 10 mm
- soil Bangkok clay
- see Fig 1427
34
10) Prodinger w Veder Ch (1981)
- The maximum value of skin friction resistance
occurred for a total settlement of 12 mm
- soil silty clay and sand
- see Fig 1428
11) Farr JS Aurora RP (1981)
- Ultimate load transfer was recehed (or nearly reached)
at a relative settlement of about 04 in (10 mm)
- soil gravelly sand
- see Fig 1429
12) Decourt (1982)
The skin friction resistance is totally mobilized
with deformations of about 10 mm or at the most 15
mm regardless of shaft dimensions This observation
of ours seems to clash with the opinions of other
authors who seek to relate the deformation necessary
for full skin friction mobilization with the shaft
diameter
- soil cohesive and non-cohesive soil
In Tab 143 all these results are shown Depending on
the kind of soil the following v a lue s of ultimate settleshy
ment for shaft can be assumed
- averages 142 mm (sd 5 3 mm) for sand
- averages 100 mm (sd = 21 mm) for cohesive soil
averages 726 mm (sd 67 mm) for claysand
It can be observed (see Fig 1419 to 1428) that the
shaft friction resistance increases proportionally to
the pile settlement up to the above limit value and
thereafter becomes constant
35
Taking into account what was mentioned earlier on point
resistance settlement relationship and the above results
a relationship between total load point resistance and
shaft resistance on one hand and settlement on the other
can be made see Fig 1430
It is assumed on the safety side that the following
ultimate settlement (S~) exists for the shaft resistance
of large diameter bored piles
SS1 ) 200 mm for non-cohesive soil u SS2) = 100 mm for cohesive soil u SS3) 15 0 mm for claysandu
In Fig 1 430 the curve Q (s) is calculated based on p
the equation 14 5 or 144
The values of psf in equation 144 can be calculated
based on other methods as well
The total load-settlement relationship is obtained by
summing up point and s haft resistance as
Q (s) = Q (s) + Q (s) (149)s p
for each point
Now the allowable load can be determined from equation
133a and versus the allowabl e settlement as
Q (s) = Q (s) + Q (s) (1410)s p
where s lt Sa
Sa= the allowable settlement of the pile
The analysis allows determination of the approximative
load settlement dependence without calculating the settleshy
ment for non-cohesive soil In Fig 1431 it is shown
36
In Tab 144 the settlement for allowable point reshy
sistance q5P according to equation 133a is shown
as well The average settlements= 198 mm (sd=78 mm)
is obtained This value is similar to the assumed ultimate
settlement of shaft for non-cohesive soil The ultimate
settlement for point resistance is assumed s = 010 Dp as mentioned earlier
37
15 Initial slope of pile point resistance shy
settlement curve
Settlement of piles and pile foundations can be cal culated
based on
- empirical correlations
load-transfer methods using measured relationships
between pile resistance and pile movement at various
points along the pile
- theory of elasticity that employs the equations of
Mindlin for subsurface loading within a semi-infinite
mass
- numerical methods and in particular the finite element
method
- use of in-situ tests (Cone Penetration Test Standard
Penetration Test Pressuremeter Test)
The critical slope of the pile point resistance-settlement
curve is important for calculation in chapter 14 The
constant a1 can be determined from all the above mentioned
methods
Comparison is made to Berggrens and Schmertmanns methods
below (see Berggren 1981 as well)
6sIn Tab 151 (No 1 2 3) the values of a 1 =~p for s =
10 mm and s = 20 mm (measured for large diameter bored
piles No 1 to 24) are compared to the calculated values
according to the modified hyperbola method (see Fig 14 6)
It can be seen that these calculated values are between
s = 1U-2u mm but rather closer the measured values for
the settlements= 10 mm see correlation coefficient n 6
and n 7 in Tab 151 respectively The average correlat i on
coefficent for the settlements= 10 mm is n9 = 108 and
the standard deviation is sct = 014 The comparison to
Berggrens and Schmertmanns methods for s = 20 mm ( see
Berggren 1~81 and Tab 151 as well) shows that the
results based om these methods give too high values of a 1 bull
38
The average values are ne= 143 sd = OJ3 and ng= 137
sd = 037 for Berggrens and Schmertmanns methods
respectively A bit better agreement can be observed
for Schmertmanns method
Taking into account the results in Tab 151 ana Tab
15l it must be assumed that for the determination of
a 1 the pile point contact pressure p(a1) should be
assumed as the ultimate point bearing capacity devided
by about 4
p(ai) - ( 1 bull 5 1 )
Most of the methods for determination of settlement are
based on the theory of elasticity The settlement ot the
pile point can be expressed as the average settlement of
a rigid circular foundation from the equation
11-Dp 1-v 2
s = p -4- -E-bull microd (1 ~ 2 J
where
p pile point contact pressure
E Youngs modulus
D diameter ot pile pointp ) = Poissons ratio
microd = depth factor
The range of validity of the pile point contact pressure
was determined in equation 151 Youngs modulus has an
important meaning lt can be determined from triaxial
tests or oedometer tests The relationship between the
constrained (oedometric) modulus Mo and Young s modulus
Eis dependent on Poissons ratio v as expressed by the
equation
E = l 1 + V ) ( 1 - 2 V ) Mo ( 1 bull 1 bull 1)- 1-v
39
TaKing into account the analyses made ny Chaplin (19b1a
1 961bJ Janbu (1 963 1970 1973J Andreassen (1973)
Duncan and Cheng (1970) Tejchman anct Gwizdala (1979)
Gwizdala (1978) Franke (1981) Berggren (1981) Withiam
and Kulhawy (7981) and the present investigation the
calculation of settlement is proposed to be
s = 24 bull p bull ~ D bull 1-v 2 bull micro d (154)Do o E
where s (r1)
p (kPa)
Dp (m)
E (kPa)
D0 =10 m
micro = 05 + 01 vfrac34E (1 5 5)d vs
but 05 lt microd lt 10-tip= p - (J (ovs see Fig 151)vs
E =Et= Kbullpat (Oo )n [1- Rf(1-sinltj) 101 - 03 ) 12 (1 5 6)2 c cosltP + 2o 3 sinltP 1Pat
in which K n and Rf= hyperbolic stress-strain parameters
Pa= atmosferic pressure ando 1 o 3 and o0 are determined by
averaging the concrete and soil vertical and radial stresses
near the pile point according to Fig 151 Then the
stresses at the pile point level are h
(J vs = L
0 Yi h
l vertical stress in the soil
0 hs Ko h
0 vs radial (horizontal) stress in the soil
0 vc L ye h -l
vertical stress in the concrete 0
0 hc K oc a vc radial (horizontal)
concrete stress in the
40
K at rest soil lateral stress coefficient 0
K c lateral stress coefficient for fluid fresh concrete0
K 1 0 oc
and average values
a 05(a +a)V vc vs
1 1 - shy~ = -(a +a+a I = -3 (av+2ahJ the applied mean normal stress0 j Z X y
Assuming this model calculation results for piles No 1-24
(see Tab 11~ as well) are shown in Tab 153
The piles are embedded mainly in medium sand to fine sand
For this kind of soil it can be assumed (soil parameters
from field or laboratory tests were inaccessible)
~ = 35deg c = 0 R~ = 09 n 05 v = 025 K c 10l 0
K = 04 Pat= 1UO kPa ye 24 kNrn 3 y = 14 kNm 3 bull0 C
Moreover in Tab 153 the following symbols are used
p(a1 ) - pile point contact pressure according to equation
1 bull 5 1
s(a1) - settl ement of pi l e point according to equation
143 and Tab 141
pound TT ( 2E = s bull Dp bull i 1-v ) according to equa~ion 152t
E~ Et bull microltl
EI
K = ro~ - according to equation 1 bull 5 6 p bullO middotA2
a~ o
E = E voD middot D middot ~4 ( 1 - v 2 ) according to equationt S p O 0
1 5 4
Et= E microd
K = according to equation 156 V PatmiddotaomiddotA2
41
The calculation results of Youngs modulus E = Et and
dimensionless canpressionrro1ulus for piles to 1-24 are shown
in Fig 152 to 155 using equation 152 and 15b
or equation 1~4 and 156 respectively lt can be obshy
served that the scatter in Fig 153 and Fig 155
where the influence of tne pile diameter is reduced
compare equation 154 is less than in the other figures
The reduced influence was made after observations from
field and laboratory tests while the equation 152 is
taken direct from theory of elasticity These values of
E and K are in good correlation with published values in
literature The values of Youngs modulus versus the
relative density of soil are compared to literature values
see Fig 15b Based on the analysis in this chapter it
can be assumed that
E = 9-ql 3 ( 1 bull 5 7)cp
where qcp is in accordance with equation 117
The calculation results based on this proposal are incluced
in Tab 1 5 3
The c a lculate d s e ttlements based on e q ua tion 154 and
157 are shown in column 23 and the values of the
correlation coef f icie nt (n= Seal ) in column 24 respectshyimeas
ively
The dimensionless canpression modulus can be d e termined as
K = 15Ubullq (qcp in MPa) (1 5 8)cp
see column 25 Tab 153
The calculation results based on the K compression modulus
according to equation 158 156 and 1 5 4 are shown in
columns 25 26 2 7 28 and 29 in Tab 153
42
For comparison and for determination of the range of
validity of this method the caLculation results of
pile point pressure for settlements s = 10 mm s = 20 mm
s = 30 mm (see Tab 141) according to equation 157
and 154 are shown in columns 30 to 35
The results obtained in Tab 153 confirm the possibility
to use the proposed method to calculate the initial part
of the pile point resistance settlement curve of large
diameter bored piles in non-cohesive soil and the initial
slope of this curve as well
A simple model has been proposed based on the theory of
elasticity ana the tangent modulus defined by Janbu (1963)
and Duncan amp Chang (1970)
A new approach according to the pile diameter depth factor
and principal stress is proposed
The settlement of the pile point can be made up to a point
pressure according to equation 151 on up to a settlement
of about s ~ 20 mm (30 mm)
-- The application of v Op in equation 1 5 4 a llows us ing
Youngs modulus as independent of the pile diameter
opposed to Bazants a nd Mosopusts (1981) proposal where
Youngs modulus wa s determined versus the pile diameter
The equation 1 5 6 takes into account the dependence of
Youngs modulus on depth (or overburden pressure) as
well
In the method field test (Cone Penetration Test) or
laboratory tests (hyperbolic stress-strain parameters
can be used
Comparison of the method to 24 availa ble load test r e sults
or large diameter bored piles in sand shows good a greement
to calculated and measured values
43
REFERE~CES
Adamczyk J (1978) Okreslanie udzwigu pali wierconych
za pomoca sondy statycznej (Bearing capacity of bored
piles based on the static sounding) Inz i Bud No 7
pp 253-257
Andreasson L (1973) The compressibility of cohesionless
soils Thesis Chalmers University of Technology
G6teborg (in Swedish)
Appendino M (1973) Comportamento di un palo di grande
diametro strumentato Rivista Italiano di Geotechnica
No 3 pp 115-118
Butterfield R Banerjee P (1971) A rigid disc embedded
in an elastic half space Geotechnical Engineering
Vol 2 pp 35-49
Bozant z Mosopust J (1981) Drilled pier design based
on load settlement curve X ICSMFE Stockholm Vol 2
pp 615-619
Begemann HK (1982) Cone penetration tests pile bearing
capacity and the thesis of Rollberg Proc of the Second
European Symposium on Penetration Testing Amsterdam
pp 433-438
Berggren B (1981) Bored piles on non-cohesive soils shy
settlement and bearing capacity (in Sweden) Thesis
Department of Geotechnical Engineering Chalmers
University of Technology G6teborg
Bergdahl UB (1979 1982) Sonderingen und in situ Messungen
Wien 18-19 Juni 1979 - Private information 19821983
Bustamante M Giane selli L(1982) Pile bearing capacity
prediction by means of static penetrometer CPT Proc
of the Second Europ Symp on PenTest Amsterdam
Vol 2 pp 493-500
Chaplin TK (1961a) An experimental study of the settleshy
ment of footings in sand PhD Thesis Univ of
Birmingham
44
Chaplin TK (1961b) Compressibility of sands and settleshy
ments of model footings and piles in sand 5th Int
Conf on Soil Mech a Found Engng Vol 2 p 33 Paris
Colombo P (1971) Observazoni sul comportamento ltli pali
a grande diametro Rivista Italiana di Geotechnika
No 3 pp 163-172
Dahlberg R (1975) Settlement characteristics of preconshy
solidated natural sands Swedish Council for Building
Research D11975
De Beer EE (1964) Some considerations concerning the
point bearing capacity of piles Proc Syrop Bearing
Capacity of Piles Boorkee I pp 178-204
Decourt L Quaresma AR (1978) Capacidade de Carga de
Carga de Estacas a partir de Valores de SPT VI Conshy
gresso Brasilerio de Mecanica dos Solos e Engenharia
de Fundacoes - Rio de Janerio - ABNS
Decourt L (1982) Prediction of the bearing capacity of
piles based exclusively on N values of the SPT Proc
of the Second Europ Syrop on Penetration Testing
Amsterdam Vol 1 pp 29-34
Duncan MJ Chang CV (1970) Non-linear analysis of stress
and strain in soils Journal Soil Mech Found Div Vol
96 SM5 pp 1629-1651
Durgunoglu HT (1979) Effect of foundation embedment on
stress and deformation distributions Third Int Conf
on Num Meth in Geomechanics Aachen pp 925-928
Farr JS Aurora RP (1981) Behaviour of an instrumented
pier in gravelly sand Proc of a session Drived Piers
and Caissons sponsored by the Geotech Eng Div of the
ASCE Nat Convention St Louis Missouri pp 53-65
Franke E (1981) Point pressure versus length and diameter
of piles X ICSMFE Stockholm Vol 2 pp 717-722
45
Gregersen os Aas G and Dibiagio E (1973) Load tests
on friction piles in loose sand Proc of the Eigth
International Conference on Soil Mech Moscow USSR
Vol 21 pp 109-117
Gwizda1a K (1978) Behaviour of large diameter bored piles
in non-cohesive soil (in Polish) Archiwum Hydrotechniki
Vol XXV No 2 pp 183-217 (English summary)
Huizinga TK (1951) Application of Results of Deep
Penetration Tests to Foundation Piles Building Research
Congress Vol 1 p 173
Janbu N (1963) Soil compressibility as determined by
oedometer and triaxial tests Proc Europ Conf Soil
Mech and Found Eng Vol 1 p 19 Vol 2 (Discussion)
p 17 Wiesbaden
Janbu N (1970) Grunlung i geoteknikk Tapir Forlag NTH
Trondheim
Janbu N Bjerrum L Kjaernsli B (1973) Soil Mechanics
applied to some engineering problems Norw Inst Publ
No 16 Oslo
Japanese Society SMFE (1981) Present state and future trend
of penetration testing in Japan Separate report at
X ICSMFE Stockholm
Kjekstad O Lunne T (1979) Soil parameters used for design
of gravity platforms in the north sea Second Int Conf
on Behaviour of Off-shore structures London Vol 1
pp 175-192
Klosinski B (1977) Bearing capacity of large diameter bored
piles IX ICSMFE Tokyo Vol 1 pp 609-612
Laboratory for soil mechanics Delft (1936) The predetershy
mination of the required and the prediction of the
resistance of piles Proc 1 Int Conf on Soil Mech
and Found Engng Cambridge (Mass) I p 181
46
Matich M and Stermac A (1971) Settlement performance of
the Burlington Bay Skyway Canadian Geotechnical Journal
Val 8 pp 252-271
Mccammon NR and Golder HQ (1970) Some loading tests
on long pipe piles Geotechnique London England
Val 20 pp 171-184
Meigh AC (1971) Some driving and loading tests on piles
in gravel and chalk Proc of the conference on beshy
haviour of piles London England pp 9-16
Mitchell JK Gardner WS (1976) In situ measurement
of volume change characteristics American Society of
Civil Engineers Specialty Conference on In-situ
Measurements of Soil Properties Raleigh 1975 Proc
Val II pp 279-345
Mezenbach E (1961) The determination of the permissible
pointload of piles by means of static penetration tests
Proc 5 Int Conf on Soil Mech and Found Engng
Paris II pp 99-104
Meyerhof CG (1956) Penetration tests and bearing capacity
of cohesionless soils Proc Amer Society of Civ Engng
SM 1 Pap 866 pp 1-19
Meyherhof GG (1 976) Bearing capacity and settlement of
pile foundations Proc Amer Society of Civ Engng
Journal Geotechnical Engineering Division Val 102
No GT3 pp 197-227
Mohan D Jain GS and Kumar V (196 3 ) Load bearing capacity
of piles Geotechn Val XIII pp 76-86
Nixon I (1982) Standard penetration test State of the
art report Proc of the Second Europ Symp on Pen
Test Amsterdam Val 1 pp 3-20
47
Nunes A Vargas M (1953) Computed bearing capacity of
piles in residual soil compared with laboratory and
load tests Proc of the Third International Conference
on Soil Mechanics Zlirich Switzerland Vol 2 pp 75-79
Nordal S Grande L Janbu N (1982) Prediction of offshy
shore pile behaviour The Norwegian Institute of
Technology Trondheim
Ohde J (1939) Zur Theorie der Druckverteilung im Baugrund
Der Bauingenieur Vol 20 No 3334 p 451
Parroth E (1972) Einfache Formel zur Vorausbestimmung der
Tragfahigkeit von Standpfahlen mit Hilfe der Sande
Bautechn 9 pp 312-314
Poulos HG Davis EH (1980) Pile foundation analysis
and design New York - J Wiley and sons
Prodinger W Veder Ch (1981) Bearing capacity of floating
groups of diaphragm walls Proc X ICSMFE Stockholm
Vol 2 pp 809-814
Promboon S Brenner R (1981) Large diameter bored piles
in Bangkok Clay Proc X ICSMFE Stockholm Vol 2 pp
815-818
Reese L (1978) Design and construction of drilled shafts
ASCE JSMFD Vol 104 No OT1 pp 95-116
Rodin s Corbett BO et al (1974) Penetration testing in
United Kingdom state-of-the-art-report Proc Europ
Symp on Penetration Testing 1 Stockholm pp 139-146
Rollberg D (1976) Bestimmung des verhaltens von Pfahlen
aus sandier und rammengebnissen Heft 4 FBG Technische
Hochschule Aachen
Rollberg D (1977) Determination of the bearing capacity
and pile driving resistance of piles using soundings
Publications of the Institute for Found Eng Soil Mech
Rock Mech and Water Ways Construction Aachen Vol 3
48
Schmertmann J (1970) Static cone to compute static
settlement over sand Journal of the Soil Mech and
Found Division ASCE SM3 pp 1011-1043
Schmertmann J Hartman JP Brown PR (1978) Improved
strain influence factor diagrams Journal of the Soil
Mech and Found Division ASCE GT8 pp 1131-1135
Shibata T Hijikuro K and Fominerga M (1973) Settlement
of a blast furnace foundation Proc of the Eighth Int
Conf on Soil Mech Moscow USSR Vol 13 pp 239-242
Spang J (1972) Die Bestimmung der Tragfahigkeit von Grossshy
borhpfahlen (I) Strassen und Tiefbau No 2 pp 339-355
Senneset K (1974) Penetration testing in Norway State-ofshy
the-art-report Proc Europ Symp on Penetration Testing
Stockholm I pp 85-95
Tejchman A Gwizdala K (1979) Analysis of safety factors
of bearing capacity for large diameter piles Proc VII
ECSMFE Brighton Vol 1 pp 293-296
Thorburn s and Mac Vicar R (1971) Pile load tests to
f a ilure in the clyde alluvium Proc of the conference
on behaviour of pile s London England pp 1-7
Trof imenkov JG (1969) Accuracy of determining the bearing
capacity of piles based on results of static penetration
sounding of soils Osnovaniya Fundamenty i Mekhanika
Gruntov 4 (Translation Soil Mechanics and Foundation
Engineering 4 p 248)
Trofimenkov JG (1974) Penetration testing in USSR Stateshy
of-the-art report Proc Europ Symp on Penetration
Testing Stockholm I pp 147-154
Tuoma F and Reese L (1974) Behaviour of bored piles in
sand JSMFD ASCE Vol 100 No GT 7 Proc Paper 10651
July pp 749-761
49
Van der Veen C (1953) The bearing capacity of a pile
Proc 3 Int Conf on Soil Mech and Found Engng
Zlirich II pp 84-90
Van der Veen C and Boersma L (1957) The bearing capacity
of a pile predetermined by a cone penetration test
Proc 4 Int Conf on Soil Mech and Found Engng
London II pp 72-75
Weltrnan AJ Healy PR (1978) Piling in boulder clay
and other glacial tills Construction Industry Research
and Information Association UK-Report PG 5
Withiam J Kulhawy F (1981) Analysis prodecure for
drilled shaft uplift capacity Proc of a session
Drilled piers and caissons ASCE St Louis Missouri
pp 82-97
Woodward R Lundgren R Boitano J (1961) Pile loading
tests in stiff clays Proc of the Fifth International
Conference on Soil Mechanics Paris France Vol 2
pp 177-184
Wright SJ Reese LC (1979) Design of large diameter
bored piles Ground Engineering Vol 12 No 8 pp
17-22
DIN 4014 Cods Teil 2 (1977) Bohrpfahle Grossbohrpfahle
Herstellung Bemessung und zulassige Belastung
Polish Specification (1975) Specification for design and
construction of large diameter bored piles in bridges
Ministry of Transport Warsaw (in Polish)
Polish Specification (1979) Specification for prevision
bearing capacity of the piles on the presiometer test
and static sounding ENERGOPOL Warsaw (In Polish)
Polish Code (1983) Foundations Bearing capacity of piles
and pile foundations
5 1
FIGURES
bull bull
53
Ou
+ sect raquo iir 1
4 + D
h + +Osu
bull + t2 =n- Dp
LDpl r f 1
Opu
Fig 1 1 1 Bearing pi le in the soil
J_
fp
080
070
060
050
0 40
030
020
010
q~ [MPa ]000 -+--~-~-~-~------------------------=-shy
00 20 4fJ 60 80 10 0 120 14fJ 160 180 200
Fig 1 1 2 The point resistance factor fp
(Trofimenkov 1974)
54
ts
160
140
120
100
080
060
040
020
q~5 [ kPa)
0Q0--1------~-~-~-~-~-~ - - ---=- -- shy000 10 20 30 40 50 60 70 80 90 100
Fig 1 1 3 The shaft resistance factor fs middot (TYofimenkov 1974)
f s
200
180
160
140
120
100 2 3 4 5 6 7 8 9
Fig 1 1 4 Shaft friction factor f depenshys
ding of the soil density (Senneset 1974)
55
Q~ [kN]
1500
1000
500
0-r-----------r----~- Q~ [kN] 0 500 1000 1500
Fig 1 1 5 Comparison of the pile resisshytance determined by the results of static sounding and load tests (TYofimenkov 1974)
D f f
0
Fig 1 16 Equivalent cone resisshytance (Bustamante 1982)
56
E u shy0 ~
QI I ltII ltII
~ a C QI
O C
D
w gt
0
Cone res istance Point resistance
80 160 240 320
05
10
15
e d
20
ver y dense Cone resistance 300 kgcm2
Dpcm
a =45 b = 30 C 60 d = 100 e = 150
Fig 1 16a
Cone resistance _ qc
80 160 80 160 qc [ k g cm2 ]p
05
10 10
15 15 e d a
e d20
Dense Medium2 2200 kgcm 100 kgcm
Cone resistance and point resistance of piles versus overburden pressure (Kerisel 1965)
Point resi stance - p(for s=2cm) of the pi le for
15 sett Iement s = 2 cm
10
5
E u
uJ1 o-~----shya er O 804 2500
32 56
I 1
L oose50 -I =25 Very loose L
----~--shy5000 7500 80 98
~-----lmiddotI1--------2 10000 12500 31400 =Flcn)
112 123 200 =Dplcm)
Fig 1 1 6b Point resistance versus cone resistance and pile diameter (Franke 193)
57
1
fp
080 (D Gravel
0 Coarse sand Medium sand 070
reg Fine sond Silty sand
060
050
040
030
020
010
qc [MPa]000-+----r--~-~-~--------r----r----r-~-~-- -shy
oo 20 40 60 80 100 120 140 160 180 200
Fig 1 1 7 Point resistance factor f (proposal) p
58
300
250
200
150
100
qc [MPa I50-+---------------r---r---r---r----r------------- shy
oo 20 40 60 80 100 120 140 160 180 200
Fig 1 1 8 Shaft resistance factor fs (pr oposal)
59
Bustamante (seetab 115 I
l fp
G)
0 Gravel
Coarse sand Medium sand
cl
b)
t-----l
1----1
080 reg Fine sand Silty sand a) D
070 Polish
060 Specification
( 1979) 050
040
030 CD 020 0
reg 010
qc [MPa]0 00 -+-------------------------------------=--shy
oo 20 4o 5o 80 100 120 14o 15o 180 200
Fig 1 19 Point resistance factor f comparisonp
Bustamente ( see tab 116 I 300
a) ~
250 b)~
cl~
200 Polish Specification ( 1979 l
150
100
q [ MPa]504---~--~--~----- ---___
00 20 40 60 80 100 120 140 150 180 200
Fig 1 1 10 Shaft resistance factor fs comparison
60
1 fp
~
080 CD CD Gravel
070 0 reg Coarse sand Medium sand
060 0 Q) Fine sand Silty sand
05
040 Franke (1973)___
030 DIN 4014
020 Part 2 1977
( see tab113 l 0shy
--shy --a - 010 C---0 Piles without enlarged bases
D---0 Piles with enlarged bases qc [MPa ] 000
00 20 4JJ 60 80 90 100 120 140 160 200
Fig 11 11 Point resistance factor f comparison p
fs
DIN 4014 Part 2 1977 ( see tab 114 l
300
~ 5 lt qc lt 10 MPa 50
~ 10 lt qclt 15 MPa
~qcgt15MPa
200
150
CD
100 0 0
qc [ 1Pa] 50-t-----T-~----T-r-~----------------shy
OO 20 40 6JJ 80 100 120 14JJ 160 180 200
Fig 1 1 12 Shaft resistance factor fs comparison
61
Measured p [ MPa]
( s=010 Dp) 10
9
8
7
6
5 0
4 0 61
3
I 2
Calculated qcp [MPa]
0 0 2 3 4 5 6 7 8 9 10
Fig 1 1 13 Comparison of experimental and aomputed values of the pile point resistanae
62
Contact pressure ( MPa ]
2 I 6
50
100
E E 150 Ill
c QI
E Sett lement for QI
calculated qcpai V) 200
Fig 1114 Results from load tests on piles No 1 and 5
Contact pressure [ MPa I 0 2 I 6
01---------------------1
50
E E 100 Ill
Settlement forc QI calculated qcp E ~ ai
I V) 150
Fig 1 1 15 Results from load test on piles No 7 and 5
63
Contact pressure p [ MPa] 0 2 3 4 6
0-t=-----~-~-----
E E
100 1)
c CU E 2 QI V) 150
Fig 1 1 16 Results from load test on piles No 9 10 and 11
Contact pressured p [MPa] 0 1 2 3 4 5
o~~~=------------___-~-shy
50
100
E E
i 150
CU E CU
-a V) 200 2
Fig 1 1 17 Results from load test on piles No 12 and 13
c
-------------- -
64
Contact pressured
0 1 2 3 4 p [ MPo] ~o __L____1_____J_____L___
50
100
150
E
E
IJ) 200
c a
E a
~ 250
Fig 1 1 18 Results f Pom load tests on piles No 2 4 6 and 8
p [MPa]
60
50
tO
30
~
Pile Pile Pile Pile
Pile No18
------+ Pile No17 + ~_ ---0 Pile No 19
bullbull - --bull Pile No 20
- ~middot -shy-shy -(y I Settlement for
20 tO 60
No17 +-middotmiddot- V 70 No 18 bull--- V 9o No19-middot- V 120 No20bull---- V150
qcp 3
80 100 120 140 160 s (mm)
Bose resistance
Fig 1 1 lBa Point Pesistance vePsus settlement (Spang 1972J
65 Cone resistance qc [ MPa]
0 10 20 30
mud
5 ~ lll
0 c 0
c CD
peat
10 sand
Ill N
10=10
D=lOOOmm
1540=40
20__________________
[ml
Fig 1 119 Pile No 1 and results from static cone penetration test
Cone resistance qc [MPa l 0 10 20 30
7N V degW = 0+--------------------i
mud
5
lll
~ C 0
c peat~
10
sand lll N 1D15
15l lD=1500mm
40=60
20l---------=-------__J
[ml
Fig 1 1 20 Pile No 3 and results from static cone penetration test
66 Cone resistance qc [MPa]
10 20 II 3 igt pound ~
mud+peat
fine sand+ silt
50=11
l lo-11oomm
40= 44
10
15l____________c
[ml
Fig 1 1 21 Pile No 5 and results from static cone penetration test
Section Cone resistance Pile
0 0
5 10 15 20 25 30 qc [MPa] -----~-~shy~
Silt
[7r_ ___~ Medium Sand_~-----l
0 ltD
+shy4
0=11
9=
Fine sand + Silt t
30p=
middotmiddotmiddotmiddotmiddotmiddotmiddotmiddot1~11+-----E-----
[ml
Fig 1 1 22 Pile No 6 and results from static cone penetration test
Cone resistance qcmiddot 1MPuJ
0 10 20 30 67 01-+-------l--------------i
mud+ peat
fine sand
l1)
N
40=60
15L_____________
[ml Fig 1 1 23 PiZe No 7 and resuZts from static
cone penetr ation test
Section Cone resistance Pi le
0 5 10 15 20 25 30 qc [MPa 1 --~----Y-~-----~
Silt
Fine sand
Medium Sand Bentonite2----1~i
t 3
4
0
0=15
Fine iii ~~= 5
sand t ltD
6 +
Silt 7
3Dp=
63 g
10
11
12
13+------=~---l
[ml
Fig 1 1 24 PiZe No 8 and resuZts f rom static cone penetration test
68
I =3
Cone resistance qc [MPa]
0 10 20 30
C 0 C Cl
(I)
Said
Peat
Sand
l 0=110
D = 11
4 D = 44
Fig 1 125 Pile No 9 and results form static cone penetration test
69
Cone resistance qc[MPa)
0 10 20 30 I ~ II JE Ill= II=E IS
Fine sand QI
U) I
[- I C 0 + C Peat QI
CD
Fine sand 0
Ci D = 1 1
L l D= 110
4D= 4 4
Fig 1 1 25 Pile No 10 and results f rom static cone penetr ation test
70
Cone resistance 9c[MPa]
0 10 20 30
Sand
C 0 Mud peat
+shyc 5 ltII
co
Sand Op= 11
u 10 D= 110 4Dp=44
Fig 1 1 26 Pile No 11 and results foIm static cone penetration test
71
00 a_ N ~
middotu rr QI 0 u ~ C 0
QI ui C iij 0 QI U - 0
0 EN
d 2
Sll 1lOl
C
u (rr
C 0 u~
0
QI - C middot 0 C
U - O 0 EN
~ 0 2
E
ltD a---==-lr---___--~---6-l_-0_012 ~ Lr- - --1---------J J
S9l ls= apound QI -0 gtcc _gmiddot- 0 1) ui I
Fi g 1 1 2 Piles No 14 and 15 and results f r om stat i c cone penetr ation tests
72
Contact pressure p [ MPa] 2 4 6
01lt---------------~
50
E E
111 100 ~ (qcp=30 MPa for No16
~ iqcp =49 MPa for No14
~ 1so~--~~- _ _ __
I _ _
11 I lf--q = 32 MPa for No15
cp
Fig 1 1 28 Results f r om load tests on piles No 14 15 and 16
73
0300--------------~---~--~--shyE
Driven piles in ~ 0 bull Gravel
amp250 bull Sand L QJ X Silt a 1l o Bored piles in
sand -sect 200 0=-- shyC ~ ~ 10 unless ~~ middot D shown 1
ii O
~ ~ o 3 a 1501-----+-------I- --+---laquo-+-- -+------lt
~ sect 5 - 6 6middot 100t----+----+-----_-1---4--__co_--J~__j
-_
~ 0 t7
C
a 50 2 shyg ~ gt
0 20 30 40 50 60
Standard penetration resistanceN in blows per foot
(N 30
Fig 12 1 Emperical relation between ultimate point resistance of piles and standard penetrashytion test in cohesionless soil (Meyerhof 1976)
14 r-------------------r-------b-----q
References and symbols given in Fig121
121-----+---+----+----+------ll------j
- _sect ~ 10t----+----+-_--1-----+---lt~--~H---- 0 lt-~5- _-)0 I() l- I Q---+-----I[08 ~
H -(l () ltj-~C X bulls pound 061------lt----+-----i~- --+-- shy
- bull
-gt Q1pound--I---L---L---L---L--~ 0 10 20 30 40 50 60
Mean standard penetration resistance N in blows per foot ( N30 l
Fig 122 Empirical relation between ultimate skin friction of piles and standard penetration resistance in cohesionless soil (Meyerhof 1976)
74
a) b)0(1 0lt2
10 10
05 05
1 N30OD-+---------__ OD--t-----r-----r----------------ll--Nbull30~ 10 20 30 10 20 30 40 50
Fig 1 2 3 Reduction coefficient a) for impermeable gravels b) form permeablr gravels (Weltman and Healy 1978)
psf [MPo)
Fig 1 2 4 Relation between ultimate point resistance and SPT in cohesionless soil (Polish specification 1975)
75
30 35 40 45 Loo Med Dense Ver dense
50
40
~ E
l)
g 8 1)
middotu
1 ~
QI- bull Touma ~ bull Koizumi
(183)-depth base middotameter5
20 40 60 00 100 N30
30 35 40 45
OG2(294) bull G1 (183)
300 bull us 59 ( 102) bull 88(180)
bull 075 a GT (467)
150
~ 200-+--------+-- t--- --t-----i 130i 0 094 081
014 _- --- -- shy~ E 066bull bull 063 Note -~ ~m~r~s~ ~ 1001---1-r--t---1point is xh QI Ratio ~ Number in ( ) middotn key is h c Ratio s ~
0 20 40 60 00 100
~ig 1 2 5 Ultimate point and shaft resistance versus N30
(Wr ight and Reese 1979)
-----
76
tu Psa
[kPa] [MPa]
200 tu
------ shy150 Psa
1 1
1100 10 1 1
1 50
0+----------T----~---~-N-3J~shy0 20 40 60 80
Relation between ultimate skin friction and SPT (Decourt 1982)
Fig 1 2 6
Psa
[MPa]
8
0----Meyerhof 1976) 0 7
--- - --~ - copy Polish Specifcoti on 1975)6 ~-
~
reg- middot - Reese (1978) middot 5
f41- -- Decourt (1982) -I bull 4 2
----==---______z__ h25m Dp=12m
3 ---shybull
2 7
--shy ----shy~----shy0-t----i----------r-- ----------------------N3l~shy
0 10 20 30 40 so 60 70
Fig 1 2 7 Relation between ultimate point re~istance of large diameter piles and standard peneshytration test (SPT) in cohesionless soil
------
77
tu [kPa)
200 17 Cast under -J bentonite
~----Meyerhof (1976) ~copy -=middotmiddotmiddotmiddot== middotmiddot150 ~------- Wei tman (1978 ) middot Healy middotmiddot ___ Japanese ) 119810 Society
(0 -middotmiddot- Decourt (1982)middot Wright
100
- -middotmiddot -- 11979]reg Reesemiddot Bored piles
~shy50 1 -- shy
-- shy middotmiddot s-shy - --~ ------reg~~ ---~E_==---- ------- shy
N_ ---shy0-+--C--------------r---- ---------~---~-~shyo 10 20 30 40 50 60 70
Fig 12 8 Relation between ultimate skin friction of piles and standard penetration test (SPT)
78
Pst [MPa]
8
7 ---------ist=7MPa
6
5
4
3
2
I N30o~------------------------------+---------__=-shyo 10 20 30 40 50 60 70
Fig 12 9 Relation between ultimate point resistance of large diamter piles and standard peneshytration test (SPT) in cohesionless soil (proposal)
tu [MPa ]
( excavanted and cast
150 under bentonite ) tu=150 kPa
100 tu=90 kPa
I I
50 I I I I I N30
10 20 30 40 50 60 70
Fig 1 2 10 Relation between ultimate skin friction of large diameter piles and standard penetrashytion test (SPT) in sand (proposal)
79
2 3 4 5 p[MPa] 0 2 3 4 5 p[MPa]0
40 40 Cl
80 c 80
c 120 120
Pile No 1 PileNo216 160
200 2
s s c [mm] (mm]
0 2 3 4 5 p[MPa] 0 2 3 4 5 p [MPa]
40 40
00 80
120 120
16 160 Pile No 3 Pile No 4
200 200
s s [mm] (mm]
0 2 3 4 5 p[MPa] 0 2 3 4 5 p [MAJ]
tgt11 tgt- measured40 40
80 80
120 120
Pile No 5 Pile No 6 160 160
20 200 s s
[mm) [mm)
Fig 1 4 1 Base resistance vs settlement appoximative method piZe No 1- 6
80
0 2 3 6 5 p[MPa) 0 2 3 4 5 p[MPa]
40 40
80 80 6
120 120 6
6160 160
Pi le No 7 Pile No 8 6
200 3J s s
[mm] (mm]
0 2 3 4 5 4 p [ MPo)
6 6 40
6 6
6 80
6 6
6
Pi le No 9 Pile No 10
XJO s s
[mm] [mm]
0 2 3 4 5 p[MPa] 0 2 3 4 5 p [MPa)
6 6
40 40 6 6
6
00 80 6
6
12 1Xl 6
160 Pile No 11 160 Pile No 12
200 200 s s
[mm ] [mm]
Fig 1 4 2 Base resistance vs settlement approximative method pile No - 12
81
0 2 3 4 5 p[MPa] 0 2 3 4 5 p [MPa]
6 6
40 6 40 6
6
80 6 80 6
120 6 120
Pile No 13 Pile No 141fO 160
200 200 s s
[mm] [mm]
0 2 3 4 5 p [MPa) 0 2 3 4 5 p [MPa)
40 40
80 80
120 120
HiO 160
200 200Pile No 15 Pile No 16
s s (mm) [rrrn 1
0 2 3 4 5 p[MPa] 0 2 3 4 5 p[MPa)
40 40 A A A-measured
680 80 t t
120 c 120 c
1fil Pi le No 17 160 Pile No 18
200 200 s s
[mm] [mm]
Fig 1 4 3 Base r esistance vs settlement approximative method pile No 13- 18
82
0 2 3 4 5 p[MPal 0 2 3 4 5 p (MPa]
D D40 40 c c
80 c 80 c
120 120
160 160
Pile No 19 Pile No 20 200 200
~ml (mm]
Fig 1 4 4 Base resistance vs settlement approximative method pile No 19- 20
LlJ QI
0 average lJ = 098 E sd = 029 C
6 SY = 030
4
2
lJ calculated ________________________ _______ measu red
06 08 10 12 14 16
Fig 1 4 5 Calculated pressure divided by the measured pressure at 20 mn settlement for aZZowabZe
q Zoad Pa= ~p approximative method pile
No 1- 20
8 3
Point resistance p [ MPaJ
a)
p(s) = s a +--sshy1 y qcp
1
SQ100p -- --- ---shy
~ s
[mml
I- 01 s rmm]-l p LMPa b)
f~]
c Cll E ~ i s
[mm)
Fig 146 Definition of the point resistance - settlement curve according to the modified hyperbolic method
84
01 ~ 0
20 0 0
0
16 0
medium 0 value a1 = 905-+ 256 Op 0 0
12 (r=039)
0 0
----0 0
8 0
0 0
0 0
4 0
05 06 07 08 09 10 11 12 f3 14 15 16 17 18 19 20 2 1 Op (ml
Fig 1 4 Initial slope of the base resistance curve vs pile diameter
a1 [p] 0
0020
16 assumed a 1= 28 - 4 qcp
12 0
0 Ct) 0 a = 2659 - 369 qcp8 1
0 0 (r = 0188)0
4
2 3 4 5 (MPa]qcp
Fig 1 4 8 Initial slope of the point resistance curve vs ultimate point resistance on the static cone resistance for pile tests No 1 20
85
a [~ 28
24
20
16
12
8
4
0 2 3 4 5 6 Qcp [MPa]
~ Kiosinski (1977) sand and sandy gravel of mediwn density
~ Klosinski (1977) loose sand ID= 0 3 0 4
o US59 ] t HH Touma p and Reese L (1974) fine sand and silty sand OGl (US59 HH BB - very dense Cl - mediwn dense) 1 BB
DIN 4014 Part 2 (1977)
Fig 1 4 9 Initial s lope of the point res istance curve vs ultimate point resis tance
86
assumed [il =30 -10 Op but )1~ 10 )1 [1 I
u 311-10 Op ( r =0 368)4 1 0
3 0 0
02 0
0 0co 0 8 0 0
0
0
05 06 07 08 09 10 11 12 13 14 15 16 17 19 20 21 Dp [ ml
Fig 14 10 Correction factor for hyperbolic base resistance shysettlement relationship
87
a [~] 28
24
20
16
12
8
4
2 3 4 5 qcp [ MPa]
Fig 14 11 Initial slope of the base resistance curve vs ultimate base resistance (proposal)
v [ 1 ]
3
2 -----G- DP J l 1J I Op lm] J
for Dp ~ 2 0 m ~ u = 1 01
0 --------r----r---r----r-----------------r-------------------------r------r-~-~--shy
05 06 07 08 09 10 11 12 13 14 15 16 17 18 19 20 21 Dp[m)
Fig 1 4 12 Correction facto r for hyperbolic base resisshytance - settlement relationship (proposal)
s P ( s)
s +
u qcp
88
a) b)1
bt=o212= 47 MPa a1=1~32 tMWJ s 2 3 4 5 O 1 10 20 30 40 50 60 p [~a]0
0p [ MPa] 40 40
80 80
120 ~
160 b1 = ~ajtg ~= 0 212
~=1132 + 0212middot s
mJ 240 r=0994t t t measured s __ according to Jl s
o o o according to p (bull ll l[mm] [mm]
Pile No 2
slmm) 10 20 30 40 50 60 80 100 125 150 175 2)0 225 Note
p [ MPa] 09 14 17 20 22 24 27 30 32 34 36 38 39
measured
pibull) [ MPa] 074 128 169 202 228 249 282 307 330 347 360 371 380calculated
plbullbull1[MPal 070 125 168 203 233 257 297 327 356 378 396 410 422calculated
1) (bull) ij l099082 091 099 101 104 104 104 102 103 102 100 098 097 sd = 006
ij (HJ1041) (bull10) 078 089 099 102 106 107 110 109 111 111 110 10B 10B sd = 010
plbulll-according to a =1132 [ Jp(s) = s s for pile No21 0 1132 12 39
plbullbulll-according toa =1241 lmiddotGcp=39MPa1 0
~=14 see fig 1411 and fig 14 12 sp(S)=
124+ _ s_ 14middot39
11lbulll11l-J - correlation coefficient calculat~d P5 for
measure p s p(bull) and p(bull) respectively
Fig 1 41 3 Modified hyperboZic point resistance - settZement reZationship for piZe No 2
89
0 2 3 4 5 p(MA1] 0 2 3 4 5 p[MPa)
40 40
80 A 80 A
120 120
160 16 Pile No 1 Pile No 2
20 200 s s
[mm] rnm
0 2 3 4 5 0 2 3 4 5p [MPa] p [MPo]
40 40
80 80
120 1ZJ
lfpound) Pi le No 3 Pile No 4 A
200 A
s s A
[mm) [mm
0 2 3 4 5 p [MPa] 0 2 3 4 5 p [MPa]
40 40 A A A measured ~ calculated
80 80
12
160 160 Pi le No 5 Pile No 6
200 Z)Q
Fig 1 4 14 l3ase resmiddotistance vs settlement pr oposed method pile No 1- 6
90
2 3 4 5 p [MPa] 2 3 4 5 p [ MPa]
40 6
6 40
1 80 80
6
120 120 6
6 160 160
Pile No 7 6
200 200 s
[mm ] s
[mm]
0 2 3 4 5 6 p [MR] 0 2 3 4 5 p [MPa] 0 0
40 40 6
6
80 80
6
120 120
160 160 Pile No9 Pile No 10
200 200
s [mm] [msml I
0 2 3 4 5 6p[MR] 0 2 3 4 5 p [MPa]04--___ ____ ___ ___ ____
0+-=---------------~-~- shy
40 40 c 6 c - measured
0--0-0 shy calculated
80 80
120 120
160 160 Pile No11 Pi le No12
200 200
s [mm]
s [mm]
Fig 1415 Base resistance vs settlement proposed method pile No 7-12
91
0 2 3 4 5 p [MPal 0 2 3 4 5 p [MPa)
40 40
80 80
120
16 Pile No 13 Pile No 14
200 s
tnml [mm]
0 2 3 4 5 p [ MPa] 0 2 3 4 5 p [MPa)
40 40
80 80
120 120
160 1fD
Pi le No 15200 axJ s s
[mm] [mm]
0 2 3 4 5 p[MPa] 0 2 3 4 5 6 plMPa ]
A A A measured40 0---0-0 calculated
80
120 120
160 1ED Pile No 17 Pi le No 18
200 200
s s [mm] [mm]
Fig 1 4 16 Base resistance vs settlement proposed method pile No 13- 18
92
0 2 3 4 5 p [MFb] 0 2 3 4 5 p[MPa]
0 6 o -measured40 40 0 0 o -calculated
80 80
120 120
160 160 Pile No 19 Pile No 20
200 200 s s
[mm] [mnil
Fig 1 4 17 Base resistance vs settlement proposed method pile No 19-20
p(s~Psf
15 20
ean
-C 5 w u L Lower ~ confidence
linea 0
a IJl 10
o---o proposed
method I I I
15
Fig 1 4 17a Design curves for estimating developed base resistance in sand (Wr ight and Reese 1979)
93
n (number)
30
28
26
24
22
20
18
16
14
12
10
8
6
4
2
0 02 04
Fig 1 4 18
I= 126
Between 1] = 0 7 - 1 3--- I= 106 ( 84 frac34)
Average ~ = 098 Standard sd =023 deviation
Standard sv =023 veriation
1] (Coefficient Calculated Measured
06 08 10 12 14 16 18
Calculated pressur e divided by the measured pr essure for all pressure - settlement curves pr oposed method pile No 1- 20
94
a) b) Total load
Total load curve
---- _____-- shy- -- -Base load ~- Base load
-0-0 ~
00 00 J
ldeoli zed shaft load J
Shaft sesistanc1---------- 0=0middot30 a= 0 middot 30
025 Settlement IN 025 Settlement IN
Fig 1 419 Proposed method of synthesizing design loadsettlement curve (a) conservative design prodiction b) design prediction- peak in shaft loadsettlement curve (Burland et al 1966)
Cf
-0 0 0
J
0
~-----~--~-~ amp- 2 3 4 5 6 (cm)
a~middotltii -0 lt) cco2 41 -~ -0 1)
vi ~ llloli=----------- ---c~0 1 2 3 4 5 6 7 ( of diameter)1 1 1 1
05 10 15 20 ( in) for 30 in Pile Movemen~ ( 75cm pile)
Fig 1 4 20 Approximate load settlement curves for 30 in bored piles (AB and C represent failure load at 1 in settlement A B and C represent ultimate failure load) (Touma and Reese 194)
95
Load in MN 0 2 3 4 5
25
50E E C
-C 75
-~ ~
-Z 100 lJ
Shaft resistshy
125 once
15 Fig 1 4 21 Load-settlement relationships for largeshydiameter bored piles in stiff clay (Tomlinson 1977)
SettlementSo
Fig 1 4 22 Diagrams of s1iaft and base resistances versus settleshyment assumed in analysis (Kiosinski 1977)
96
0 0 1 ~ r- 025g ~~ 2
1- -shy3 03Sg 14 5 2
Qls =Qpls+Q5 (sQpls) Qs(s-3E
0
degsis __ -- Qpls) a~ C
4
t Sg l
5 Qu Is)
Q(s)in MN-l T
Ouls Q Is) in MN ---
Fig 1 4 23 Construction of load - settlement curves a) for sand b) for cohesive soil (DIN 4014 Part 2 1977 and Franke 1981)
-
s C 5C
Cl
3 0 00 05 10 15 20 Mean settlement I in)
Fig 1 4 24 Load- settlement curves for test shaft S4 (1 in = 25 4 mm 1 ton= 8 90 kN) (Reese 1978)
97
Relative side resistance
0 05 10 15 20 0E=--t----+---+--~
c QI lt) ~ 2 C
I itaker c
QI amp Cooke3E QI-j
c-en 4
C QI
E us 59o
5 QI gt
SA0 w 0 6
Fig 1425a Relative side resistance for clay vesus relative midlength settlement (Reese 1978)
degs (Osl u l t 0 05 10 15 2 0
Mean
2 Lower ~ C QI u
confidence line
~ 3 a
0
~4 E
()
5
6 __ _ ______ ________ __1
Fig 1 4 25b Design curves for esti mating developed side resistance (~Jy1nht ReertP- 1987 J
98 Load Q
8 - 15 mm
1- 2 of p ile diameter
100-200 10-15 of pile Os Ot diameter Shaft Total
Settlement S Resistshy Resist- Load ance once
Fig 1426 Dependence of total load base resistance and shaft resistance on settlement of lar-ge diameter pile (Tejchman Gwizdala 1979)
6
5 Shaft load
4
3
2
z ~
-0
g Pile EF- 56 J 0
0 0 20 30 Butt settlement (mm)
Fig 1 4 27 Deveiopment of shaft and base resistance with settiement (Promboon Brenner 1981)
99
0 1000 2000 3000 4000 5000 6000 7000 8000 9000 0 r-=-1---J__-----------------------~----_shy
Load [ k N l5
10
20
( I
Skin friction ----1 I I
~ 40 QI E
fQI
50 I
Q) I () ICOntinuos fost deolading
Fig 1428 Load-Settlement-Diagram Testelement III (Diaphragm-Wall 0515 m 244 m deep) Portion of Skin Friction and Base Resistance (Prodinger Veder 1981)
Qs (QJ max
0 05 10
Upper Limit of Data
Farr and Aurora (1981J C
~ 2 - shy -+shy - Mean of Data
I QI
Lower Limit of Data a
0 - 3 E
Vl
4
Smid = Approximate shaft buff movement ignoring the elastic compression of upper halt of the shaft
D = Shaft diameter
Q Mobi Ii zed shaft resistance
Qs1max = Maximum shaft resistance
Fig 1 4 29 Relative shaft resistance vs relative movement (Farr and Aurora 1981)
100 Load Q (s) [ MN]
Su5 s s 20 mm for non- cohesive soil u
s s 10 mm f or cohesive soil u
s s 15 mm for claysand u
Q (s) + Q (s)s p
Qs(s)
-C ltII E s ~- [mm]-ltII IJ)
Fig 1 430 Dependence of total load Q(s) point res i stance Q (s) and shaft resistance Q (s) versus settlement p s
~ 3 Usu Qpu Qu Q(s) [ MN]
Sus= 20
1J
60
80
100
120
degs (s ) 140
5 P=Ol Op
1EO
C -ltII E 180 ~ ] 200
s [mm]
Approximative dependence of total load point resistance and shaft resistance versus settlement fny non-cohesive soil
Fig 1 4 31
101
113 3 ~fic0P Ye hY
1 Ground water
D
I y
yh C
Fig 1 5 1 Determination of 01 and 03 for settlement analysis of lar ge diameter bored piles
102
I
E=Et [MPa]
160 0
140
120 0
100
80
6
40
--- --shy 0
0
8 0
0
0
20
2 3 4
I 0 15
Fig 1 5 2
E = Et [MPa]
120
100
80
60
40
I I 0 35 065 085
0
Et= 17 81 qcp0844
( r = 0 128)
5
100
6 qcplMPo]
Calculated values of Young s modulus for piles No 1shy24 according to equation 1 5 2 and 1 56
0
0 0
E =898qcp127 (r= 0314)
E = 9 middot qcp 13 0
20 shy 0
0 0
0 1 2
loJ
I 0 35
3 I
065
4
I 085
5
100
6 qcp [MPo]
Fig 1 5 3 Calculated valueBof Young s modulus for piles No 1shy24 according to equation 1 5 4 and 1 5 6
I K 10 3
( 1 ] 1832
1400 0
1200 0
0
1000 0
800 0
m=2821 qcp0621
600 0
(r=0057)
400 0 0 0 0 0
200
2 3 4 5 6 qcp (MPa]
I 035
I 065
I 085 100 Io
Fig 15 4 Calculated valuesof the dimensionless compress ion modulus K for piles No 1- 24 according to equation 1 5 2 and 1 56
K ( 1 ]
0
1400
1200 0 0
1000
800
600
0
0 0
0
0 0
0 K= 1422 qcpl05
(r=0181)
0 K= 150 qcp
400 0
3)0 0 0
2 3 4 5 6 qcp(MPa)
I I -J 035 065 085 100 Io
Fig 1 5 5 Calculated values of the dimensionless compression modulus K for pile~ No 1-24 according to equation 1 5 2 and 1 5 6
104
120
100
2 3 4 5
I I I rv 0 15 035 065 085 100 lo
Bergdahl (1982) for shallow foundation
o----o Bozant Masopust (1981) D= 1 0 rn h=10 rn large diameter bored piles in noncohesive so il
0----0 Proposal according to current anal ysis
Klosinski (1977) D=090 to 125 rn large diameter bored piles in sand and sandy grave l
Mitchell Gardner (1976) very dense sand E=(35)q (it depends on sand density and stress history) c
Fig 1 5 6 Composision of Young s moduius
105
TABLES
0 Tab 1 11 Methods for detemination of the bearing capacity of bored piles (Ro llberg 1977)
Cl
Nol -- I Soil Areas of Q) Q) Editor Determination of Coefficients 5 type influenceqP qs p ~ C C 11 12 fP I fs
1 all Lab f Soil Mech (1936) l qp at the elevashy 1 0
2 all Huizinga (1951) ~ t~on of the pile 14 point
3 all Van der Veen (1953) ) 18 1 h+l14 all Van der Veen 1 0 Dpl375 D~ 15-- J qcmiddotdhBoersma (1957)
~ 11 +12 h - 12
5 12 all Menzenbach ( 1961) qc at the elevashy~ tion of pile point
6 18 all Mohan Jain Kuman (1963)1 average of qc over 1 h Q) h ~qcmiddotdhl 10 Dpj 3 75 Dj 15 50_micro
and 1 2C 11
7 I amp all de Beer ( 1964) graphically from 10 Q) qc 0 1 h+l18 u C
sand Soviet norm SNIP II 9ct9cp I4 bull O Dp I10 DP l66-1 083shyu clay B5- 67 Trofimenkov (1969) 2 50 1 251 +l J qc middotdh micro middot h middot-l l 2h-~ _micro
9 _micro u all Paproth (1972) at the elevation 3 5 I shy
) of pile point (Dpgt0 5 m 7 D8DpE
E-lt p 1 h+l1 1 h Dplt 5 m u l+l J qcmiddotdh h f qcmiddotd~ 30 Dpl 50 Dp 2 0 100shy10 sand Norwegian method
0l 2 h-12 200Senneseth (1974)
11 lall Soviet method h+l (20-0lqgl - 101 1 q middotdhTrofimenkov (1974) -- f C UpUsmiddotQct
l1+l2 h - 1212 Qct-Qcp 40 D~ 10 Dp 1 33- 0 67shyUsbullh 4 00 2 50
13 English method 10 DFJ 375Dp 10 I
Rodin Corbett Shershywood Thorburn (1974)
3 7 5 Dcl 8 0 DP 10h+l1 _1_ J qcmiddotdh 1 h
qcmiddotdh 20011 +12 h - 12 hb
1 h qcmiddotdh 150hf
0
Observations
fp I f (qp)fs C
Dp E = 1 cm Qbu = 2 Qpa (approx )
s fs=f (qc)
q=~g Us 0 h
fp=f(q~)
fs=f(qgl
bull fine grained non- cohesive soil loosely packed
bull fine grained non- cohesive soil medium dense comp
fine grained non- cohesive soil
Tab 111 (cont)
h+h bE 14 non-cohe- Meyerhof ( 1956 poundti J N 3o middot dh CtME fN3 o dh 1 0 DP 4 0 DP 10 100 etM= l 2
sive soil 1976) lJ +12 h - li hE o hgp taken into consi der ~ Ul (I)
E-lt
C 0
~E = 1 kgbull 30 cm
(statistical limit depth of the pile) hE - clamping length of
pile micro rrJ l-l micro (I)
15 C (I) p
sand Norwegian method
- irm - - - 10 IT
m = diagram O l-l Senneset (1 974) rrJO C
16 rrJ micro gravel English meth it 3 middot N30 - - - 10 - Jf 3 + diagram U) ~
E-lt p U)
iiouiu Coruett Sherwood Thorshyburn (1974 )
(NJQat the elevashytion of pile point1
0 -i
108
Tab 11 2
Results of calculati o n of p i le point load pile shaft load and total pile load from static con e penetration test (Rol l berg 1977)
~ gt
~ gt Ultima te Ultimate Ult imate
No Method micro micro poi nt skin bearing 080lt17nlt1 50 Q) -l
-l middot-i resistanceuro resistance r esistancE
middot-i p 0
(J n1 n n2 n n3 n n1 n2 n3
1
2
Lab fSoil Mech
Hu izinga (1951)
(1936 ) 430
307 i 3 Van der Veen (1953) 239
49
4
5
Van der VeenBoersma
Menzenbach (1961)
(1957) -l middot-i 0
2 4 7
1 57 1-CJ)
6
7
8
Mohan Jain Kumen
de Beer (1964)
Sovi et Norm (1969)
(1963) CJ) Q)
-l middot-i 0
lJ Q)
Q)
gt- CJ) Q)
c 0
2 44
1 37
183
47
t I
49
487
0 18
47
16
3 02
0 85 1
47
16
137
08
9
10
Paproth ( 1972)
Norw Method (1974)
~ 0
0
u I
C 0 C
1 8 1
180 l 46
1- - -_L~ 46 167 46 1 19
1 1 Soviet Method ( 1974) [1 1 41 46 1 62 13 083 13 1 14 0 8
12 Engl Method (1974) 2 66 35 128 35 2 30 35 1 28
Note
cal Q a) n = --- mean value of the rat i o between calculat ed pile loads and those n Q determined f r om loading test
b) n = number of piles
109
Tab 113
Point resistance of large diameter piles (DIN 4014 Part 2 1977)
Settlement Point pressure 1 Factor -fshy
(cm) (MPa) cf=lOMPa I i=15 MPa C C
Piles without enlarged base
1 05 005 003 2 08 008 005 3 11 0 11 007
15 34 034 023
Piles with enlarged base
1 035 0 04 002 2 065 0 07 004 3 0 90 009 006
15 2 40 0 24 0 16
Note 10 lt qp lt 15 (MPa)C
Tab 114
Skin friction resistance of large diameter piles (DIN 4014 1977)
Strength Static cone pen- Depth below Skin frict ion Factor of sand etration resist surface
(MPa) (m) (MPa) fs
Very small lt 5 - 0
Small 5 to 10 0 to 2 0 2 to 5 003 ln6 to 333
gt 5 005 100 to 200
Medium I I 10 to 15 0 to 2 0 I
I 2 to 7 5
gt 75 I 0045 0075
222 to 133 to
333 200
High I I
i
l
gt 15 0 2
to 2 to 10 gt 10
I I I
I
i
0 006 0 10
gt gt
250 150
Note Skin friction is assumpted as linear until s =2 cm and constant for s gt 2 cm
11 0
Tab 115
Values of the inverse of the point resistance factor (Bustamante 1982) fp
Soil type qPC I 1
Factor - shyfp(MPa)
for piles group
a) Silt and loose sand lt 5 0 40 -b) Moderately compact
5 - 12 040sand and gravel
c) Compact to very gt 12 i 030compact sand and gravel I
Tab 116
Values of the shaft resistance factor fs (Bustamante 1982)
Factor fs
Soil type qs
C Category I(MPa) I A I B I II A III BI
I a) Silt and loose lt 5 60
i 150 I 60 I 120-
sand
b) Moderately corn- I pact sand and 5 - 12 100 200 100 200 gravel i
Icl Compact to very
compact sand gt 12 150 i I 300 150 I 200I
I I and gravel i
I
111
Tab 117
Point resistance factor (proposal)
-
1-fp
qc (MPa)
Gravel
Coarse sand Medium sand
Fine sand Silty sand
25
080
0 70
060
5 0
0 65
055
047
75
054
045
039
10 0
045
036
031
150
035
027
022
200
030
0 23
018
Tab 118
Shaf t r e sistance factor (proposal)
fs
qc (MPa)
Gravel
Coarse sand Medium sand
Fine sand Silty sand
25
80
100
130
10 0
120
150
190
I 200
180
230
300
11 2
Tab 119
Calculated values qcp
for large diameter piles
Pile Literature Length Diameter (m) Measured p Cr1 lcul Settlement Note Authcr(year) No (ml D Dp (MPa)
(s=0 10Dp) (MPa)p ~~JL__
s s ()(mm) Dp
1 Franke (1977) 1 13 11 36 38 117 106 Garbrecht
2
3
2
3
13
14
11
15
1 58 36
37
38
40
215
185
136
123
) qg accord to Franke
4 4 13 15 204 3 2 33 220 108 and Garshy
5 5 6 11 33 35 127 11 5 brecht (1977)
6 6 6 11 153 36 35 146 9 5
7 7 6 1 5 34 35 158 105
8 -shy 8 6 15 2 1 41 3 0 109 52
9 10 9 11 39 52 47
10 11 95 11 43 35 77 70
11 12 9 11 49 66 60
12 13 10 11 15 5 1 4 0 77 5 1
13 14 9 11 1 5 4 8 46 115 77--shy14 Pranke ( 1973) 15 115 18 4 9
) ) average 88
15 13$ 13 5 1 3 19 -2 5 3 2 sd=3 0
16 - - 165 16 5 13 19 30 sv=0 34
17
18
Spang (1972)
llXJ
V90
6 6
6 75
0 7
09
3 2
4 2
32X
42X
x) s =0 10 D p
19 VlaJ 720 1 2 39 3 9X
20 - - VlsJ 6 5 1 5 3 0 3 ox
21 Touma and US59 9 9 o 76 8 0 Reese ( 1977)
22 HH 75 0 61 8 0
23 Gl 180 091 - 2 5
24 BB 137 o 76
sd = standard deviation
sv = standard variation
Tab 1 2 1
Ultimate point resistance coarse and medium sand psf (MPal (Pol ish Specification 1975)
Depth h
Medium sand r = 0 40 N = 200 30 Base diam (Op) and depthbase diam (hDp)
Dense sand r 0 Base diam (Op)
= 0 80 = 50N30 and dpethbase diam (hDp)
(ml Dp = 0 6 m Dp = 1 0 m Dp =12 m Dp = 1 5 m Dp = 0 6 m DP = 10 m DP = 12 m DP = 15 m
Psf hDp Psf hDp Psf hDp Psf hDp Psf hDp Psf hDp Psf hDp Psf hDp
5 10 83 0 85 5 0 075 42 07 33 20 8 3 16 50 14 42 13 3 3
7 14 11 7 1 2 70 11 5 8 10 4 7 2 8 11 7 22 70 2 0 5 8 1 8 47
10 18 16 7 15 10 0 14 8 3 1 3 67 35 167 28 100 2 5 83 2 2 67
15 18 250 18 15 0 16 12 5 15 100 4 2 25 0 3 4 15 0 30 125 27 100
20 2 4 333 2 0 200 185 167 1 7 133 4 7 333 3 8 200 33 167 30 13 3
25 26 41 7 2 2 25 0 20 208 19 167 5 0 41 7 4 0 250 3 5 20 8 3 2 167
w
11 4
Tab 131
Partial safety factors for resistance to axial load for bored piles (Wright Reese 1979)
Partial safety Normal Poor factor for control control
Unit skin resistance 1 70 185
(no load test)
Unit skin resistance 160 1 70
(from load test)
End bearing 165 180
Tab 1 3 2
Probability of failure of bored piles under normal design conditions (Wright Reese 1979)
Probability of Factor of Structure failure safety classification
5 10-3 25 monumental
210shy 22 permanent- 2
5 middot 10 2 0 110shy 1 85
temporary 5 bull 10-l 165
11 5
Tab 133 Results of field tests (Tejchman Gwizdara 1979)
L
II C C C 0 0 0
micro micro
micro micro micro For universal safe~y F2u u CUNo micro C C ~ ~g~ middot- C
~ Permisible micro micro i ~c -i micro
cmiddot-~ micro~ L
micro oo ~ load ~t~ ~~ omicro micro ~ ~ 3Z~ ~ ~ micro
-~~
~ e ~ --middot--
middot- ~ obull 0
~ g ~~ ~~ ~
~ L
o Jl i5 sect~ =gt L Q~ = yen t p Qp Qp
D h Q~ Srrx s tm p s E~ iQ~lQ~cm ~~ KN X ll1l kPa kPa kN kN kN Jl ~e ~ 1 2 3 4 5 6 7 8 9 10 11 12 13 14 15 16 17
1 70 6 60 4081 1550 2531 38 0 1182 10 4040 175 2041 245 1796 632 141 120
2 90 6 75 5082 3041 2041 598 1785 10 4782 107 2541 1079 1462 282 140 42 5
3 120 720 7259 4041 3218 557 1035 10 3576 119 3630 2158 1472 187 2 19 594
4 150 650 8643 4454 4189 51 5 928 20 2521 136 4326 2158 2168 3 10 166 253
5 130190 195 7750 3011 4709 392 805 10 1075 - 3875 981 2894 3 10 166 253
6 130190 165 9516 5101 4415 536 522 20 1800 - 4758 1962 2796 260 158 412
7 130190 135 8044 5199 2845 646 114 4 15 1834 - 4022 2109 1913 2 47 149 524
8 180 115 11380 4415 6965 388 792 15 1735 - 5690 2747 2943 161 2 37 483
9 76 980 6867 4316 2551 628 110 13 9529 109 3534 1128 2306 383 111 32 8
10 61 7 60 7161 2747 44 14 383 67 15 9404 303 3581 392 3188 700 169 109
11 92 180 4807 883 3924 184 20 8 1329 76 2404 196 2207 450 178 82
12 76 24 5 6769 736 6033 109 20 8 1623 103 3385 147 3238 500 186 43
13 76 137 5396 2060 3336 38 2 63 8 4535 102 2698 589 1109 350 t 58 218
14 120 23 5297 1854 3443 35 0 960 10 1640 39 2649 196 2453 945 130 7 4
15 135 16 7 13489 7554 5935 560 181 10 5260 83 6749 2060 4689 367 127 305
16 170 46 0 8829 2943 5886 333 17 10 3466 39 4415 1373 3042 2 14 1 94 31 1
Average Fi 387 166 Standard deviation Sd 2 1 5 034 Standard variation sv= 0 56 0 20
1234 Spang1972 567 8 Franke 1976 9 10 111 2 1 3 Touma Reese 1974
14 Colombo 1971 15 Kerisel Simons 1962 16 Appendino 1973
11 6
Tab 134
Results of model
SafetyScheme factor
medium F ssand
F p
loose F s
samd Fp
F 3 55 sd _P F 1 32 sd
s
tests (Tejchman Gwizdara 1979)
Diameter D (mm)
30 60 90 133
145 129 108 112
280 3 08 307 294
140 154 153 112
594 3 04 324 426
107 sv 030
0 19 sv 0 14
117
Tab 135
Individual safety factors according to literature
Literature proposal ofLiterature individual safety factor
Fs Fb
Polish Specification (1974) 100 250
Tejchman Gwizdala (1979) 150 400
Bustamante Gianeselli 200 300 (1982)
Decourt ( 1982) 130 400
average 145 3 38
TAB 141 0)
Load settlement curves - measured
Pile No
Settlement 1 c 3 4 5 6 7 8 9 10 11 12
s p s p p s
p p s P
p s P
p s p p s
P p s
P p s
p p s p p S
p I i p s
p p s p
mm MPa rrrn lifl5a MPa mm
lifl5a MPa
mm lifl5a MPa mm
RPa mmMPa nwa MPa mm
RPa MPa mm RPa MPa mm
RPa MPa mm RPa MPa mm
RPa MPa mm RPa MPa mm
RPa 10 045 222 09 1 1 05 20 07 143 06 167 08 125 0 5 20 08 125 10 100 08 12 5 15 67 16 63 20 092 21 7 14 43 08 25 10 20 0 1 1 182 12 167 0 9 22 2 12 167 18 111 14 143 24 83 22 9 1 30 125 240 1 7 I 7 6 1 1 273 1 2 250 14 214 15 200 1 2 250 15 200 25 12 0 19 15 8 30 100 26 11 5 40 1ti 250 20 10 0 14 28 6 14 286 1 7 235 18 222 1 4 286 18 22 2 3 2 12 5 23 174 36 111 3 0 133 50 20 250 22 ~27 1 7 294 1 5 333 20 250 2 1 ~38 1 7 294 1 9 263 37 135 27 18 5 4 2 11 9 33 152 60 2 2 273 24 ~5o 20 300 1 7 353 23 61 22 ~73 18 333 21 286 43 140 30 20 0 46 13 0 36 16 7 80 271 295 27 796 24 333 20 400 27 ~96 25 1320 22 364 25 32 0 53 15 1 36 222 41 195
100 322 31 1 30 333 28 357 22 454 31 1323 29 345 26 385 28 357 60 16 7 40 25 0 45 22 2 125 38 329 32 391 32 391 25 500 32 139 1 30 41 7 32 39 1 4 6 272 48 ~6 0 150 14 2 357 34 1441 36 41 7 27 555 36 ~1 7 34 44 1 36 41 7 175 36 486 39 449 30 583 38 ~61 38 461 200 38 526 42 476 32 625 225 39 577 33 682
(mmMPa) ( 1 MPa)
1
1=2074
t 1=O ~01 =0 98S
a1=1132
b1 =0 212 V =0994
a1=2217
b1=O 131
V =Q 978
a1=1860 b1=0233
V =Q966
a1=1562
b1=0174 V =Q983
a1=1382
b1=O195
V =0975
a1 =20 37
b1 =C 174
V =0957
a1=1443
b1=(l 193 v =O 961
a1=965
b1= 0071 V =0 990
a1=1 91
b1 =o 128
V =0 993
a1=5 83
b1=C124
v =O 981
a1=6 1 4
b1=01 64 v =U 985
li(MPa) ~9 4 7 76 43 57 middot5 1 57 5 2 141 78 81 61 cp (MPa) B8 39 40 33 35 35 35 3 0 39 3 5 49 40 __Ef ~-6 1 2 1 9 1 3 16 15 16 1 7 36 22 16 15 qcp
TAB 141 (continue) Load settlement curves - measured
Pi le No 3ettlement 13 14 15 1 17 18 19 20 21 22 23 24
s p s T5
p s T5
p s T5
p s P
p s P
p s P
p s P
p s P
p s T5
p s T5
p s p p s
p mm MPa lll1l
HPa MPa mm HPa MPa mm
fWa MPa mm fWa MPa lll1l
HPa MPa mm HPa MPa mm
MPa MPa lll1l NT5a MPa HPa MPa 111111
HPa MPa 111111
HPa MPa 1)1111
mra 10 1 7 59 075 133 06 167 075 133 ~95 105 09 11 1 07 143 3 76 1 7 59 08 133 10 100 20 2 4 83 130 154 095 21 1 1 15 17 4 1 75 114 16 125 12 167 ~7 74 33 6 2 1 3 15 3 1 9 103 30 29 103 1 7 176 1 2 250 15 200 r55 118 22 136 16 18 8 38 79 46 66 1 7 182 27 110 40 33 12 1 20 200 1 35 29 6 1 75 229 ~O 133 26 154 175 229 49 82 58 6 9 1 9 21 1 35 115 50 36 139 235 21 3 145 34 5 1 95 256 24 208 ~-4 147 28 17 9 20 250 gt8 86 6 9 72 2 2 233 4 2 11 8 60 39 154 265 22 6 1 55 387 2 15 279 28 214 ~6 16 7 30 120 0 2 2 27 3 o 8 89 80 7 5 2 3 262 80 43 186 31 258 1 7 47 1 36 222 14 05 198 33 124 2 25 320 B 1 98 25 327
100 45 222 18 556 39~ 253 ~-5 222 36 1278 27 370 ~8 113 125 47 26 6 20 625 42 29 8 149 255 28 1446 t50 22 682 3 0 500 175 200 225
(mmMPa) a1=479 a1=1206 a1=14 51 a1=1113 a1=1406 ~=836 a1=843 a1=1176 ~=64 a =561 a1=10 0 a1=9 5 (1MPa) b1=0175 b1=0 178 b1=0 382 b=0287 b1=O 119 p 1=0 137 h1 =o 193 b=0258 p1=0 049 b1=0032 b1=0 276 b1 =0 048
hf (MPa)
v =0998 57
v =0-987 5 6
v =0989 26
v =0992 35
v =0933 Iv =0991 84 73
v =0993 5 2
v =0998 tJ
3 9 =0944 v =0998 v =0996 v =0981
qcp (MPa) 46 39 32 30 32 14 2 39 30
lL 12 1 1 08 12 26 1 7 1 3 13 qcp
lD
N 0
TAB 142
Calculated point resistance curves
Setlement (mm) p(s)
1
n p(s)
Calculated value of the p(s) for pile No
2 3 4 5
n p(s) n p(s) n p(s) n p(s) 6
(MPa)
n p(s)
7
n p(s) 8
n p(s) 9
n p(s)
10 20 30 50 80
100
150 200 225
070 128 177 253 335
375 446 493
157 140 141
127
123
1 16 106
070 1 25 168 232
297
327 378 410
422
078 089 099 1 06
1 10
109 1 11 108
108
073 1 30 176 246
315 349
405 441
146 163
160 145
1 32 125
113 105
056 096
1 26
167 205 222
249 265
271
0 80 096
105
1 11 100 101
092 0 83
082
065
118 162 233
308 345
412 456
108 108
1 16 116 114 111
064
1 12 151 2 10 2 69
298
346 3 76
078 P63 093 tt 13 101 tt 53 100 I 13
108 ~75
103 ~04 096 ~ 55
~ 87
1 26 125 127 126
125
1 17 1 04
052 088
1 15 153
188 2 03 227 242
065 0 74
o 77 0 81 0 75
0 73
063
072 122
1 83 262 347 388
463 5 11
073
0 74
073 0 71 0 65 065
064 1 18
162 233 309
3 46
41 3 4 57
Dp (m) 1 1 Qcp (MPa) 38 (mmMPa) h2 8 1 1 9 Qcpbullv1(MPa) 72
158
39
124 14 55
15
40
n20 15 60
204
33 148 10 33
1 1
35
tt 4o 1 9 67
1 53 3 5
tt 4 0 1 5 51
15
13 5
114 0 15 i-gt 3
2 1
30
tt 6 0 10 3 0
1 1
3 9
12 4 1 9 74
1 1
3 5 h40
1 9 67
Note n = condition coefficient calculated p(s) measured p(s)
10
n
081
084 0 85 0 86 0 85
087
TAB 142 (continue)
Calculated point resistance curves
Calculated value of the p(s) for pile No (MPa) Setlement 11 12 13 14 15 16 17 18 19 20
(mm) p(s) ll p(s) n p(s) ll p(s) n p(s) n p(s) n p(s) n p(s) n p(s n p(s) n
10 106 070 0 71 045 091 054 099 1 32 055 092 053 070 060 081 085 0 72 080 055 078
20 1 90 079 130 059 160 067 1 70 1 30 096 101 091 079 1 12 148 085 1 31 082 098 082
30 258 086 1 76 068 2 15 074 222 1 31 1 26 105 120 080 156 205 081 180 082 132 083
50 363 086 246 075 297 082 296 1 26 1 70 117 161 082 228 095 295 087 256 0 91 184 092
80 471 316 o 77 3 77 088 364 1 18 2 1 o 1 24 199 308 085 393 097 336 1 02 237 095
100 522 349 078 415 092 394 228 1 27 2 16 348 088 442 098 375 104 262 097
150 611 405 479 443 258 117 244 423 529 443 304 101
200 669 441 518 473 276 261 474 587 488 331
Dp (MPa) 1 1 1 5 1 5 18 1 9 19 070 090 12 15
qcp (MPa) 49 4 0 46 49 32 30 32 42 39 30 12 a1 mmMPa) 84 h20 96 84 152 160 152 124 160
IV1 1 9 1 5 15 12 11 1 1 23 21 18 15
qcpmiddotv1 (MPa) 93 60 69 59 35 33 74 88 70 45
- 12287 average = ~ = 098
standard deviation sd = 023 standard variation sv = 023
N
122
TAB 143 Ultimate settlement for shaft resistance - summing up
Ultimate settlements (mm)Literature sand cohesive claysand
soil
Burland Butler Dunican (1966) 7
Touma Reese (1974) 10 Tomlinson (1977) 10 Klosinski (1977) 8
Francke Gerbrecht (1977) 20-30 DIN 4014 part 2 (1977) 20 10 Francke (1981) Reese (1978) (1979) 05-2 of 05-2 of Farr Aurora (1981) shaft dia~ shaft diam
5-20 mm 5-20 mm Tejchman Gwizdala (1979) - Spang (1972) 10
10 10 20
- Francke (1976) 10 20 15 15
- Touma Reese (1974) 13 8 15 8
8 - Colombo (1971) 10
- Kerisel Simons (1962) 20 - Appendino (1973) 10 Promboon Brenner (1981) 10 Prodinger Veder (1981) 12 Decourt (1982) 10-15 10-15
-average s = 14 1 10 126
standard deviation sd = 53 2 1 47
standard variation sv = 038 021 037
123
TABLE 14 4 Al l owab l e base resistance versus sett lement
Pile Li terature ength Diameter (m) Calculated qcp=qcp Settl ement Fp-3- sa (mm)No Aut hor No (m) D DP qcp (MPa) for qcp3(MPa)
1 Francke ( 1977) 1 13 11 38 127 25 Garbrecht
II2 2 13 11 158 39 130 19
II3 3 14 15 40 133 33
II4 4 13 15 204 33 110 23
II5 5 6 11 35 117 22
II6 6 6 11 153 35 117 19
II
8
7 7 6 15 35 1 17 25
II 8 6 15 21 30 100 21
II9 10 9 11 39 130 13
II10 11 95 11 35 117 15
II11 12 9 11 39 163 11
II12 13 10 11 15 40 133 7
II13 14 9 11 15 46 153 9
14 Francke ( 1973) 115 11 5 18 30 100 15
II15 135 135 13 19 32 107 29
II16 165 165 13 19 49 163 35
17 Spang (1972) V70 660 070 32 107 28
18 II V90 675 0 90 42 140 16
II19 V120 720 1 20 3 9 130 16
II20 V15C 650 150 30 100 16 average for pi les 198
standard dev sd = 78
standard var sv = 039
)assumed qc = p for s = 010 Op sonding meRsurement were not availab le
IV
TA~LE 15 1
Comparison of the initial sl ope of the pile point resistance - settlement curve
Accardi ng to 1 2 3 4
In i t i ~l 5
slope a1 for the pile No
6 7 8 9
(mmMPa)
10 11 12 13 14 15 Note
a 1 for s=10 mm 222 11 1 a1 for s=20 mm 21 7 14 3 calculated 207 113see Tab 14 1 Bo Berggren (198 )230s=20 mm
Schmertmann s method (see 202B Berggren 1981)s=20 mm
No 1 _ llNo - 6 1 97 098
202 250
22 2
400
30 8
090
14 3
200
186
076
167
182 156
286
18 2
107
125
167 138
091
20 0
222
204
426
263
098
125
167
144
087
100
11 1 9 7
182
23 5
1 03
12 5
14 3
11 9
174
164
105
67 83
58
14 6
125
1 16
63
9 1
61
103
59
8 3 48
123
13 3
15 4 12 1
1 10
167 21 1
aceto hypershy14 5 bola type curve
1 15
No 2 NQj = n1
No 4Noz ~ na No 5Naz= T]g
105 1 27
106
093
1 13
160
1 23
108 1 17
157
100
121 109
1 92
118
1 16 1 14
164
2 12
120
122
1 15
143
1 76
151
149 1 73 1 27 146
TAllLE 151 (continue)
Compa ri son of the initial slope of the pile point resistance - settl ement curve
Initial slope a1 for the pile No (mmMPa)According Note to 16 17 18 19 20 21 22 23 24 -a1 for s=10 mm 133 - 105 11 1 143 76 59 133 100 a1 for s=20 mm 174 - 114 125 167 74 62 153 10 3 calculated see 11 1 146 84 84 118 64 56 100 95Tab 141
Bo Berggren 198 67 78 25 0 114s=20 mm Schmertmann s method (see B 136 67 250 146 Berggren 1981) s = 20 mm
nG = 108 No 1NoJ = n 1 20 125 1 32 121 1 19 105 1 33 105 sd = 0 14
SY= 013 No 2 i) = 1 29ro1 = n1 157 136 149 142 1 16 1 11 1 53 108 sd = 019
SY= 015 No 4 iis = 143 INo2 = ns 091 126 1 63 111 sd = 033
SY= 0 23 No 5 ii9 = 1 37183 108 163 142INoz = n9 sd = 0 37
SY = 027
N Vl
126
TABLE 152
Measured and calculated pile point resistance
Pile Calculated Measured Measured No qcp P for
s=10 mm P for s=20 mm
~ 10 mm ~ 20 mm
- (MPa) (MPa) (MPa) - -
1 38 045 092 84 41 2 39 09 14 43 28
3 40 05 08 80 50 4 33 07 10 47 33 5 35 06 11 58 30 6 35 08 12 44 29 7 35 05 09 70 39 8 30 08 12 38 25 9 39 10 18 39 22
10 35 08 14 44 25 11 49 15 24 33 20 12 40 16 22 25 18 13 46 1 7 2 4 27 19 14 30 075 13 40 23 15 32 06 095 53 34 16 49 075 115 65 43 17 32 - - - -18 42 095 1 75 44 24 19 39 09 160 4 3 23 20 3 0 07 12 43 25
average= 484 291
sd 163 088 sv 034 030
Tab 153 Results of calculation for piles No 1-24
Pile No
Length (m)
Overburden pressure 0 vs
0hs (kPa)
0ve (kPa)
0 nc (kPa)
- -ov=o1 (kPa)
- -OV=03 ( kPa)
00 (kPa)
p(a il ( kPa)
s (a 1) (mm)
A2 ( 1 )
E t
(kPa)
Md ( 1 )
K (1)
E I
t (kPa)
( kPa) 1 2 3 4 5 6 7 8 9 10 11 12 13 14 15 16
l 2 3 4 5 6 7 8 9
10 11 12 13 14 15 16 17 18 19 20 21 22 23 24
13 12 14 13 6 6 6 6 9 95 9
10 95
11 5 135 165 66 675 72 65 99 75
180 137
l 33 133 123 116
70 70 70 70
104 102 95
102 95 94
106 139 95
101 106 97
180 137 221 215
53 53 49 46 28 28 28 28 42 41 38 41 38 38 42 56 38 40 42 39 72 55 88 86
202 202 216 202 1114 104 104 104 146 153 146 160 153 181 209 251 120 128 134 123 238 180 305 277
202 202 216 202 104 104 104 104 146 153 146 160 153 181 209 251 120 128 134 123 238 180 305 277
168 Hi8 170 159 87 87 87 87
125 128 121 131 124 138 158 195 108 115 120 110 209 159 263 246
128 128 133 124 66 66 66 66 94 97 92
101 96
110 126 154 79 84 88 81
155 118 197 182
141 141 145 136
73 73 73 73
104 107 104 111 105 119 137 117 89 94 99 91
173 132 219 203
950 975
1000 825 875 875 875 750 975 875
1225 1000 1150 750 800
1225 800
1050 975 750
2000 2000 625
1500
218 139 255 190 16 1 146 210 12 7 10 1 11 7 84 73 69
104 167 210 124 103 10 1 109 142 120 76
153
0802 0802 0822 0820 0798 0798 0798 0798 0791 0798 0800 0811 0814 0837 0837 0830 0769 0 768 0771 0 775 0 780 0 781 0 788 o 779
35296 81603 43312 65222 44019 67515 4609 91313 78186 60572
118115 15129 5 184075 95577 67017 81607 33252 67554 85294 75994 78816 74857 55101 54862
075 075 0 77 075 084 084 084 081 079 078 084 080 083 076 076 078 0 77 081 079 076 082 087 064 0 74
278 643 337 512 542 832 567
1085 766 572
1216 1417 1832
796 520 709 353 735 878 781 630 726 302 366
26472 61202 33350 48917 36976 56713 38656 73964 61767 47246 99217
121036 152782
72639 51932 63653 25604 54719 67382 57755 64629 65126 35265 40598
a=282l a =l781 y=axs S=0621 B=0 844
V=0 057 V=0 128 _ Iv -J
~
N co
Tab l53 Results of calculation for piles No 7-24
Pile No
17
1 2 3 4 5 6 7 8 9
70 11 72 13 74 75 16 17 78 79 20 27 22 23 24
Ground water
18
-20 m b s
-28 m -335 m -330 m -3 15 m dry dry -53 m -85 m
E t (kPa)
19
33653 64979 35364 45664 47969 54583 37574 63072 74548 57753
71 2618 123531 150297
71239 48619 59204 39744 77208 77863 62049 90407 95844 57762 62937
vxEt=E Md (kPa)
20
25240 48689 27230 34248 35254 45849 31562 51040 58893 45047 94599 98825
724747 54142 36950 46179 30603 57678 61572 47157 47734 83384 36968 46569
a=898 S=l 27 =0314
K (l )
21
265 511 275 358 517 672 463 749 730 546
1160 1157 7496
593 377 514 422 775 802 638 723 929 377 420
a=l422 S=l 05 =0187
E=E = t1 3
g-gcp (kPa)
22
51046 52799 54566 42492 45870 45870 45870 37547 52799 45870 77039 54566 65438 52799 40826 71039 40926 58739 52799 37541 82549 82549 40826 59945
Calculated s
(mm)
23
708 128 72 7 15 3 724 146 144 17 3 71 3 11 5 11 2 732 13 2 707 1 5 1 13 7 93
102 118 137 728 12 l 69
11 9
s__caL n=smeos
() 24
050 092 050 087 0 77 7 00 069 l36 l 12 098 133 l81 l97 103 090 065 0 75 099 117 126 090 101 097 078
ri=l00 sd=035 sv=035
K = l50gcp
25
570 585 600 495 525 525 525 450 585 525 735 600 690 450 480 735 480 630 585 450 825 825 1180 645
E l
(kPa)
26
67684 69465 72250 57726 44856 44856 44856 38448 59659 54306 74956 63214 70704 49089 56783 79502 45283 61081 58207 42927
708572 94785 71033 91898
E = t E middotA2
l
(kPa)
27
54283 5571 l 59389 47336 35795 35795 35795 30682 47790 43336 59964 51266 57553 47088 47024 65987 34823 46970 44877 33269 84639 74027 55974 71589
Calculated s
(mm)
28
l O l 12 l 11 7 737 15 9 18 7 185 21 1 12 6 12 2 133 14 l 150 13 7 13 l 14 7 709 12 7 738 755 12 4 735 50
100
- -
Tab l53 Results of calculation for piles No l-24
Pile
29
l 2 3 4 5 6 7 8 9
10 ll 12 13 14 15 76 17 78 19 20 21 22 23 24
sea l n= middotshy
smeas
28 TT
30
0 46 087 046 0 72 099 l 28 088 l 66 l 25 l 04 l 58 l 93 2 17 l 32 078 0 70 088 l 23 l 37 l42 087 l l 3 066 065
n=l 10 sd=0 44 sv=040
s seal for p n=s=lOrnn ac cording to s = 70mm
(mm)
37 32
5 l 0 51 ll 8 l18 64 064
13 0 l30 85 0 85
13 3 l 33 83 0 83
184 l84 ll6 l l 6 105 l05 137 l 37 21 3 2 12 19 4 l94 107 l06 l l 3 l l 3 84 084
92 092 l 0 9 l09 128 l28 83 083
l 0 3 l03 88 088 79 0 79
n=1 73 sd=025 sv=027
s for p according to s = 20mm
(mm)
33
10 4 184 102 18 6 15 6 200 14 9 276 209 18 4 219 292 274 185 17 9 12 9 -
169 194 219 172 200 143 15 0
seal n=s=20rnn
34
052 092 051 093 078 l00 075 l 38 l 05 092 l l 0 l46 l 37 093 090 065
-085 097 l1 0 086 l00 072 075
n=093 sd=025 sv=0 27
s for p according to s = 30rnn
(mm)
35
142 223 14 l 22 3 198 249 142 34 5 290 249 274 345 33 l 243 22 6 168 -
24 7 26 6 293 24 3 279 187 213
seal n=s=30rnn
36
047 0 74 047 0 74 066 083 047 l 15 0 97 083 091 l 15 l10 0 81 075 056 -
082 089 098 081 093 062 0 71
n=o80 sd=020 _ sv=0 25 N
IO
APPENDIXES
APPENDIX 1 1 1
Pi le No 1 Length 13 m D 10 m
Areas of influence
-
qe
(MPa)
1 fp
___9c_ f
(MPR) zyen
(MPf) qcp (MPa)
Soil type
22 20 18 16 14 1 2
l 2 (m)
10
1 0 08 06
16 15 16
026 027 026
42 41 42 Sand
04 14 U28 39 02 14 028 39 41
02 16 0 26 42 04 16 026 42 06 16 026 42 08 14 028 39 Sand 1 0 13 030 39 12 15 027 4 1 38 14 13 030 39 16 12 032 38 18 12 032 38
40 20 10 036 36 22 10 036 36 24 9 U39 35 2 6 8 043 34 28 10 036 36 30 10 036 36 3 2 10 036 36 34 10 0 36 36 36 11 0 34 37 38 11 034 37
l 1 (m)
40
42 44
11 0 34 37 15 1
46 48 50 52 54 56 58 60 62 64 66 68 70 7 2 74 76 78 8 0
APPENDIX 112
Pile No 2
to little depth of sounding
q~ = middle values for 11 = 2 Op
q~ = 145 MAa (Francke Garbrecht 1977 Tab 2 p 50) (Fi g No 2)
for sand
qcp = 0275middot145 = 40 MPa q~p =V ~~s) middot 40 = 097middot40 = 39 MPa
Pile No 4
q~ = 120 MPa sand (Fig No 4)
q = 0 315middot12 = 3 8 MPa q bull 38 = 086middot38 = 33 MPa=V Jmiddot54
1
cp middot bull cp
Pile No 12
qg = 155 MPa sand (Fig No 13)
qcp = 026middot155 = 4 03 MPa
Pile No 13
q~ = 200 MPa sand (Fig No 14)
q = 0 23middot20 = 46 MPacp
APPENDIX 113
PileNo3 Length 14 m D 15 m
Areas of influence
-
qe
(MPa)
1 Tp
----9cf
(t-1Pf) r~
(MPf) qcp (MPa)
Soil type
22 2D 18 16 17 025 43 14 17 II II
L 2 17 II II
12 (m)
16 10 08 06
17 17 17
o
II
II
II
II
Sand 04 17 II II
02 19 024 46 b9
02 19 024 46 04 17 025 43 06 15 027 41 08 13 030 48 1 0 12 032 38 12 11 033 36 14 13 0 30 39 16 14 028 39 18 12 032 38 40 20 16 026 42 2 2 16 026 42 24 11 033 36 26 11 033 36
60 28 30
10 10
036 036
36 36
Sand
32 10 036 36 34 12 032 3 8 3 6 12 032 38 38 12 032 38
1 1 (m)
40
4 2 4 4
13
14 16
030
028 026
39
39 42
46 13 030 39 48 12 032 38 50 14 028 39 52 10 036 36 54 13 030 39 56 14 028 39 58 15 027 41 60 15 027 ~-1 236 62 64 66 68 70 72 74 76 7 8 80
APPENDIX 114
Pi l e No 5 Length 6 0m D 11 m Dp 11 m
Area s of i nfluence
-
qc
(MPa)
1 Tp
-3Lf
( MPf) l ~
(MP~) qcp (MPa)
Soil type
2 2 2 0 18 1 6 14 1 2 155 U i1 33
l 2 (m)
1 2 10 08 06
15 14 12
022 023 0 27
3 3 32 32
Fine sand
+ silt
04 125 026 33 02 16 0 21 34 39
02 16 021 34 04 13 025 33 06 08 10
15 5 17 20
022 0 20 018
34 34 36
35 Fi ne sand
1 2 20 0 18 36 14 20 018 36 + s ilt 16 20 0 18 36 18 165 020 32 20 165 0 20 32 22 17 0 20 34 24 26 2 8 30 32 3 36 38 4 0
19 21 5 21 5 21 5 20 19 5 19 5 20 215
01 9 ---
018 018 0 18 0 18 -
3 6 40 40 40 36 35 3 5 36 4 0
l 1 (m) 4 2
44 20 19
018 01 9
36 3 6 157
46 48 50 5 2 54 56 58 6 0 62 64 66 68 70 7 2 74 76 7 8 8 0
APPENDIX 1 15
Pi le No 6 Lengt h6 0 m D 11 m
Areas of qc 1 __9_c_ qcp Soil typei nfluence fp f 1 yen (MPa) (MPf ) (MPf) (MPa)
-2 2 20 18 16 t 4---0 14 75 038 29 L2 20 018 36 Fi ne sand
1ti 10 30 40 + s i lt12 08 19 0 19 36(m) 06 17 020 34 04 14 023 32 02 9 034 31 56
02 6 043 26 04 12 026 3 1 06 17 020 34 08 11 028 3 1 1 0 14 023 32 35 1 2 17 020 34 Fi ne sand14 19 019 35 16 20 018 36 + silt18 18 0 19 34 20 14 023 32
46 22 12 026 31 24 12 026 31 26 15 022 33 28 18 019 34 30 20 018 36 3 20 0 18 36 34 20 018 36 3G 20 018 36 38 20 018 36 4 0 20 018 36
l 1 42 22 40
(m) 44 22 40 46 L2 4 0 158 48 50 52 54 56 q =V ~ - 3 b =0 99middot35 = 35 MPp cp 53 58 6 0 62 64 66 68 70 72 74 76 78 80
APPENDIX 116
Pi leNo7 Length 60 m 0 15 m
Areas of influence
-
qe
(MPa)
1 Tp ~
(MPg) r~
(MPf) qcp (MPa)
Soil type
22 20 18 16 9 U33 30 14 10 031 31 12 135 024 32
l 2 (m)
16 10 08 06 04 02
13 12 6
10 175
025 026 043 0 31 020
33 31 26 3 1 35 50
Fine sand
+ silt
02 04 06
17 10 115
0 20 0 31 027
34 31 3 1
08 10
145 185
023 019
33 35 3 5
1 2 14
20 19
018 0 19
36 36 Fine sand
l 1 (m)
60
16 18 20 22 24 26 28 30 3 2 34 36 38 40
42 44 46 48 50 52 54 56 58 6 0
185 125 125 165 17 19 21 215 205 20 21 20 20
24 22 20 215 22 22 21 19 18 22
0 19 026 0 26 020 020 019 --
018 018 -
018 01 8 --
018 ----
0 19 0 19
35 33 33 33 34 36 40 40 37 36 40 36 36
40 40 36 40 40 40 40 36 34 40 219
+ silt
62 64 66 68 70 72 74 76 78 80
APPENDIX 117
Pile No 8 Length60 m D 15 m Dp 2 1 m
Areas of influence
-
qe
(MPa)
1 r +
(MPg) r~
(MPf) qcp (MPa)
Soil type
22 18 019 34 20 16 021 34 18 125 026 3 3 16 115 027 31 14 11 028 3 1 12 11 028 3 1
l 2 (m)
10 08 06
105 11 145
D29 028 023
30 31 33
Fine sand
+ silt
04 18 0 19 34 02 18 019 34 71
02 15 022 33 04 11 0 28 31 06 13 0 25 33 08 20 0 18 36 10 15 022 33 12 13 025 33 14 175 020 35 16 18 20 22
20 21 20 15
018 -
018 0 22
36 40 36 33
35 Fine sand
+ s i lt
24 26 28 30 3 =
13 16 175 19 20 20
025 021 020 0 18 018 018
33 34 3 5 34 36 36
36 38 4 0
20 20 21
018 0 18 -
36 36 40
11 (m)
4 2 4 4 4 6 48 50 5 2 5 4 56 5 8 60 6 2 6 4
20 20 21 22 21 20 19 175 19 20 25 28
018 0 18 ---
01 8 01 9 0 20 0 19 018
36 36 40 40 40 36 36 35 36 36 40 4 0 23 0
6 6 68 70 72 74 76 78
qcp 1f5=v 2T middot35 = b85 middot35 = 30 MPa
80
APPENDIX 118
Pi le No 9 Le ngth 90 m D 11 m m
Areas of 1Qe -9c qcp Soil typeinfluence Tp f ryen (MPa) (MPg) (MPf) (MPa)
-
2 2 2 0 18 16 14 lc 11 034 37
12 10 10 036 36 12 08 9 039 35 Medium(m) 06 10 036 36 sand04 10 036 36
02 11 034 37 43
02 12 032 38 04 12 0 32 38 06 12 0 32 38 08 13 030 39 10 13 030 39 12 13 030 39 14 14 028 39 16 14 028 39
44 18 14 028 39 20 14 028 39 39 Med ium 22 15 027 4 1 sand 24 16 026 4 2 26 17 025 43 28 13 0 30 39 3 0 9 039 35 32 13 030 39 34 16 026 42 36 17 025 43 38 17 025 43 40 19 024 4 6
11 42 17 025 43
(m) 44 15 027 41 17 7 46 48 50 52 54 56 58 60 6 2 64 66 68 7 0 7 2 74 76 78 80
APPENDIX 119
Pi 1 e No 10 Length 95m D 11 m m
Areas of influence
-
qe
(MPa)
1 fp
-9c f
(t-1Pf) [~
(MPf)
qcp
(MPa)
Soil type
22 20 1 8 16 14 L 2 13 Uti 3J
l 2 (m) 12
10 08 06 04
18 18 28 19
0 19 019 0 19 019
34 34 34 34
Fine
sand
02 21 40 42
02 20 4 0 04 17 020 34 06 21 40 0 8 10
23 22
40 40 Fine
1 2 14 16 18
21 20 16 15
0 21 022
4 0 4 0 34 33
sand
44
20 2 2 24 26 28 30 32 34 36 38 40
14 14 13 11 11 14 17 14 12 13 12
023 023 025 0 28 028 023 020 023 027 025 027
32 32 33 31 31 32 34 3 2 32 3 3 32
l 1 (m) 42
44 12 13
0 27 025
32 33 15 2
46 48 50 5 2 5 4 56 5 8 6 0 6 2 6 4 66 6 8 70 72 74 76 78 80
APPENDIX 11 10
Pi 1 e No 11 Lengt h 9 0m D 11 m m
Area s of influence
-
Qe
(MPa)
1 fp
__k_ f
(MP~) ryen
(MPf) qcp (MPa)
Soi l type
22 20 18 16 14 12 lb 55
12 (m)
1 0 08 06 04
23 19 20 21
024 023
55 46 46 55
Medium
sand
02 22 55 62
0 2 04
24 25
55 55
06 08
27 28
55 55
10 12 14
28 28 28
55 55 55 49
16 26 55
44
18 20 22 24 26 28 30 3 34 36 38 40
24 19 18 17 22 21 17 11 13 12 11 9
024 024 025
025 0 34 030 032 034 039
55 46 43 43 55 55 4 3 37 39 38 3 7 35
1 1 (m) 42
Ll Ll
12 16
032 0 26
38 4 2 209
46 48 50 5 2 54 56 58 60 62 64 66 68 70 72 74 76 78 80
APPENDIX 141
0 2 3 4 p [MPa)
PILES WITH 40 ENLARGED BASES
80
120
160 C----0
200 IN4014 s (1977)
[mm]
P s calculateds P p(s)(mm) (MPa)(mmMPa)(MPa) ()
10 035 286 046 20 065 308 080 30 090 333 104
150 24 625 214 200 229
ai = 2605 (mmMPa) b1 = 0243 1MPa V 1000 bi = 1b = 411 MPa
_ 411 MP Vi - 24 a
() assumed
average Dp = 18 m
qcp = 24 MPa ai = 184 (mmMPa) (28-4middot24)
Vi = 1 2 (3-18)
qcpmiddotvi = 29 MPa
40
80
120
160
200 s
[mm]
DIN 4014 Part 2 ( 1977)
0 1 2 3 4 5 p [MPal
PILES WITHOUT ENLARGED BASES
C----0
DIN 4014 ( 1977
s calculated s p -p- p(s)
(mm) (MPa)mmMPa)(MPa) ()
10 05 20 062 20 08 25 113 30 11 27 3 155
150 34 441 385 200 424
ai = 2085 (mmMPa) bi= 0 157 1MPa V = 0970
bi= 1s = 637 MPa
Vi 187=3f =
() assumed
average Dp = 12 m
qcp = 34 MPa a1 = 144 (mmMPa)
Vi = 18
qcpmiddotvi = 61 MPa
Range qc = 10-15 MPa
(28-4bull34)
(3-12)
1 1 q = r -r- = 036 for qc = 10 MPaCp p Ip+= 027 for qc = 15 MPa
qcp = 36-405 MPa P
APPENDIX 142
Touma F and Reese L (1974)
Soil parameters pile parameters and base resistance see fig bullbullbullbull
TAB
Measured load settlement curves
Settlement s
mm
10 20 30 40 50 60 80
100 120
a 1 (mmMPa) bi(MPa) V
N3u
q =04 -N30 (cMPa) ()
1 qCp=--rpbullqC
Pile No 21 (US 59) 22 (HH) 23 (G1) 24 (BB) Notep Sp p S p p S p f Sp MPa mmMPa MPa mmMPa MPa mmMPa Mla mmMPa
131 76 169 59 075 133 100 100 269 74 325 62 131 153 1 94 103 381 79 456 66 165 182 273 11 0 488 82 581 69 1 90 21 1 349 115 581 86 694 72 2 15 233 424 118 675 89 800 75 229 262 813 98 245 327 884 113 925 130
64 56 100 95 U049 0032 0276 0048 0944 0998 0996 0981
80 gt100 30 60 32 gt 40 12 24 ()
Bergdahl (1982)
gt5 5 gt55 32 4 3
(0 18middot32) (018middot40) (0265middot12) (018middot24)
CONTACT PRESSURE p [ MPa]
0 2 4 6 8 100 N-------r---------------(us 59) ( HH) ( BBi
E E SQ-------lt+-----+--------------lt
VI
1shyz UJ
~ 100 1---------i----+----+----+------l------I -J I shyI shyUJ V)
so~----~--~-- ~--~
APPENDIX 143
us 59 fYJo 0 50 00
ff-t r-=-~c~=~-r~c_---_---l-~e-J-C~ 0 ------
CLAY
FINE SANO
J lD- 760 mm
f5m~--~--~
Pile US 59 and results from penetration test
HH IV_l() so 100 r=-=-==-==-r-~--=-=- 0 0 II 15- flf ~ II~ Ibull If t f
CLAY SAND
Sm
)
= -middotl lo - GtOmm
~ JI
SILTY SANO tOm
Pile HH and results from penetration t est
APPENDIX 14 4
61 NJO 50 --------00
11 1 =f J - 1 -- 0
CLAYSILT
E ~ Sm ltrj
SILTY SAND
q I lDmiddot 910 mrn tom
I) t bull
Pile G1 and results from penetration test
88
0 50 too ~1-e I q 111bull - Q
CLAY
SIL TY SAND 5m
]
l lDmiddot760mrn
Om
Pile BB and results from penetration test
APPENDIX 145
Klosinski B (1977)
Loading tests 50 bored piles 09-125 m diameter average Op= 11 m On t he sett l ement of rigid pla te the settlement of t he pi le base is given by
PmiddotOSp = T-K b
where Mb - equivalent deformability modu lus
1) Sand and sandy gravel of medium density
Mb = 25-50 MPa
According to Bergdahl (1979) medium sand is between
q(l) 5 MPa (Io=035)c2)
ql = 10 MPa (Io=065)C
from fig 117 rp1 = 055 for qc = 5 MPa 1Tp = 036 for qc = 10 MPa
q(l)= 0 55middot5 = 2 75 MPacp bull
q(2= 0 36middot10 = 360 MPacp
allowable p~ 1)= ~p = yen = 092 MPa and p~2) = ~ = 120 MPa
settlement of the pi l e base
5(1)= o 92 middot 1bull1 = O 0135 m = 13 5 mm p 325 middot middot
5( 2)= 1bull2bull1middot 1 = O 0088 m = 8 8 m p 350 bull bull
1) _ s _ 135 _ 14 7 (mm) a(2) _ 88 _ a 1 - p - o---92 - bull NPa bull 1 - T-7 - 733 (Wa)
2) Loose sand lo= 030-040
Mb = 12- 25 MPa
q~l) = 44 MPa q~2)= 58 MPa
1Tp = 058 and 052
q(3) = 0 58middot4 4 = 2 55 MPa middot q( 4) = 0 52middot5 8 = 3 02 MPa cp bull middot bull cp bull middot middot
allowable p~ 3)= 4i = 085 MPa p~4)= yenl = 101 MPa
s(3)_ 085-11 = 26 mmmiddot s(4)_ 101middot11 = 148 mm p - 312 p - 3 25
STATENS GEOTEKNISKA INSTITUT Swedish Geotechnical Institute S-581 01 Linkoping Tel 01311 51 00
Serien Rapport ersatter vara tidigare serier Proceedings (27 nr) Sartryck och Preliminara rapporter (60 nr) samt Meddelanden (10 nr)
The series Report supersedes the previous series Proceedings (27 Nos) Reprints and Preliminary Reports (60 Nos) and Meddelanden (10 Nos)
RAPPORT REPORT Pris kr
No Ar (Swcrs)
1 Grundvattensankning till foljd av 1977 50shytunnelsprangning P Ahlberg T Lundgren
2 Pahangskrafter pa langa betongpalar 1977 50shyL Bjerin
3 Methods for reducing undrained 1977 30shyshear strength of soft clay K V Helenelund
4 Basic behaviour of Scandinavian soft 1977 40shyclays R Larsson
5 Snabba odometerforsok 1978 25 shyR Karlsson L Viberg
6 Skredriskbedomningar med hjalp av 1978 40shyelektromagnetisk faltstyrkematning - provning av ny metod J Ingands
7 Forebyggande av sattningar i 1979 40shyledningsgravar - en forstudie U Bergdahl R Fogelstrom K - G Larsson P Liljekvist
8 Grundlaggningskostnadernas fordelning 1979 25 shyB Carlsson
9 Horisontalarmerade fyllningar pa los 1981 50 shyjord J Belfrage
RAPPORTREPORT
No
10 Tuveskredet 1977-11-30 Inlagg om skredets orsaker
11a Tuveskredet geoteknik
l1b Tuveskredet geologi
11 c Tuveskredet hydrogeologi
12 Drained behaviour of Swedish clays
R Larsson
13 Long term consolidation beneath the test fills at Vasby Sweden YCE Chang
14 Bentonittatning mot lakvatten T Lundgren L Karlqvist U Qvarfort
15 Kartering och klassificering av leromradens stabilitetsforutshysattningar L Viberg
16 Geotekniska faltundersokningar Metoder - Erfarenheter - FoU-behov E Ottosson (red)
17 Symposium on Slopes on Soft Clays
18 The Landslide at Tuve November 30 1 977 R Larsson M Jansson
19 Slantstabilitetsberakningar i lera Skall man anvanda total spanningsanalys effektivspanningsanalys eller kombinerad analys R Larsson
20 Portrycksvariationer i leror i Gateshyborgsregionen J Berntson
21 Tekniska egenskaper hos restproshydukter fran kolforbranning shyen laboratoriestudie B Moller G Nilson
Ar
1981
1981
1981
1981
1981
1982
1982
1982
1983
1982
1983
1983
1983
Pris kr (Swcrs)
50shy
50shy
40shy
50shy
100shy
60shy
80shy
60shy
190shy
75shy
60shy
150shy
65shy
RAPPORTREPORT
No Ar Pri s kr (Sw crs)
22 Bestamning av jordegenskaper med sondering - en litteraturstudie U Bergdahl U Eriksson
1983 75 shy
23 Geobildtolkn ing L Vi berg
av grova moraner 1984 70 -
24 Radon i jord -Exhal ation- vatten kvot -Arstidsvariationer - Permeabilitet A Lindmar k B Rosen
1984 75 shy
25 Geoteknisk terrangklassificering for fysisk planering L Viber g
1984 120shy
26 Large diameter bored piles in nonshycohesive soils Determination of the bearing capacity and settlement from results of static penetration tests (CPT) and standard penetration test (SPT) K Gwizdala
1984 85shy

17
This value q~p should be put into equation 116
The value qc s in equation 118 is independent on the
pile diameter
Proposed calculation method
(116)
where)
1 1 40 ~ 11 3 for piles wit h a nd enlarged bases12 10 12 = ~
h+h
q (h) dh (117)qcp l1+l2 f -f- Ch-li p
h 1 f 1
qcs = o -f- qc (h) dh (118)h s
1 -f- = f(q kind of soil ) -+- see Fig 11 7 and Tab 1 1 7
C p
f (q kind of soil ) -+- see Fig 1 1 8 and Tab 1 1 8 fs C
Note
a) the point resistance q for qc gt 20 MPa is assumed cp to be maximum as
- Gravel 70 MPa - Coarse sand medium sand 55 MPa - Fine sand s il ty sand 40 MPa
b ) The shaft resistance qcs for qc gt 20 MPa is assumed to
be maximum as
- Gravel 110 kPa - Coarse sand medium sand 90 kPa - Fine sand s ilty sand 70 kPa
These proposed values are compared with results by
Bustamente (1 982) and the Polish Specification (1978)
Fig 11 9 and F i g 1110 A similar comparison for DIN
4014 1 977 is shown in Fig 1111 and Fig 1112
) In this paper was used the above values 1 1 and l z But it can be used in practice 11 =30 D and h =2Dp respectively The results shall be very simi l ar to the above onPs
18
The proposed method has been examined with field test
results This is shown in Fig 1113 to Fig 1128
and Appendix 1 11 to 1110 and Tab 119
The comparison shows that the value of q in equationcp (117) corresponds to the settlement -10 of the base
diameter (s=010 DP) see Fig 1113 and Tab 119
(average sDp=88 and standard deviation sd=3)
Later in this paper the allowable load and dependence of
the load versus settlement will be determined
12 Determination of bearing capacity of the large
diameter bored piles from results of the Standard
Penetration Tests (SPT)
There are little published on pile tests coupled with
results from Standard Penetration Test (SPT) Among the
authors who have published material in the subject are
- Meyerhof 1956 1976
- Senneset 1974 (Norwegian method)
- Rodin Corbett Sherwood Thorburn 1974 (English method)
- Polish Specification 1975
- Weltman Healy 197 8
- Reese 1978
- Japanese Society 1981
- Decourt 1978 1982
The Norwegian method is valid o nly for concrete andor
wooden piles the English method only for gravel It is
very important to underline that the Norwegian a nd the
English methods use of the SPT resul ts intermediate by
the static cone penetrometer resistance (q ) as well C
Below methods are presented that are using the results of
SPT directly Meyerhof s method in total can also be used
on driven piles in non-cohesive soil Although we could
have found some proposes for bored piles Eqs (121 and
122) see Fig 121 and Fig 1 22 as well
19
Ultimate point resistance (psf)
12 N 3 omiddotH lt 120 N 30
(kPa) (1 2 1)Psf D
where
N30 the average standard penetration resistance
in blows per 03 m
H depth in bearing stratum
Ultimate skin friction tu
for bored piles tu N~ o (kPa) (1 22a)
for driven pil estu 2N30 (kPa) (1 2 2b)
where
N30 the average standard penetration resistance
in blows per 03 m within embedded length
of pile
Weltman and Healy (1978) taking into account Meherhofs
proposition for driven piles have introduced two coefshy
ficents for bored piles in gravels (glacial soil) Equ
123 and Fig 1 23
t = a 2 N30 (kPa ) (1 2 3)U 1
where
ai a 1 for impermeable gravels see Fig 123a
ai a 2 for permeable gravels see Fig 123b
The Polish Specification ( Specification for Design and
Construction of Large Diameter Bored Piles in Bridges
1975 Ministry of Transport) gives the ultimat e point
resistance in dependence of N30 base diameter and depth
see Tab 12 1 The Tab 121 contains values for coarse
and medium sand For other non-cohesive soils the following
coefficients are proposed
p f = S bull p f (medium sand) ( 1 2 4)S 1 S
20
where
S1 1 20 for grave lSi
f 132 080 for fine sand
13 3 070 for silty sand13i
In Fig 124 values of psf are shown for h = 10 m DP
06 m DP= 15 m and h = 20 m DP= 06 m DP 1 5 m
respectively
A few of the instrumented piles were tested and analyzed
by Wright and Reese (1979) The ultimate point and shaft
resistance in the fine and silty sand as a function of
blow count from SPT is shown in Fig 125 Results from
two additional tests reported by Koizumi (1971) are also
introduced in the figure The ultimate point resistance
is assumed to exist at a settlement equal to 5 of the
base diameter
Methods of prediction of the bearing capacity of piles
based exclusively on N30 values were presented by Decourt
1982 Below a proposition for high capacity piles excavated
and cast under bentoni te is presented
The ultimate skin friction is determined by the expression
(see Fig 126)
t = 33 N30 + 1 0 (kPa) ( 1 bull 2 5 ) u
where
N30 average value of N30 along the shaft
- for N30 lt 3 must be taken as = 3N30 - for N3o gt 5 0 must be taken as NJo= 50
The allowable point resistance can be obtained in a n
expedite way as
Psa = 33 N30 (kPa) (1 2 6)
where
N30 = average of Nat point level one metre above
and one metre below
Psa allowable point resistance
21
Decourt proposed a safety factor for the point of F = p
40 Therefore the ultimate point resistance can be
determined by the expression
(kPa) (1 2 7)
In Fig 12 7 and Fig 1 28 the above values for base
and skin friction resistance are compared respectively
Taking into account the type of soil thereis a good
correlation for ultimate point resistance The result for
ultimate skin friction is scattered but only apparently
The values for large diameter bored piles are between
the line 1a and 1b in Fig 128 Large diameter piles
have a high ultimate skin friction in relation to driven
piles (see points for bored piles in Fig 122 and DIN
4014 Part 2 1977 as well) The high values for piles
excavated and cast under bentonite have had a strong base
on the load tests (Decourt 1978 1982 and Wright and
Reese 1979)
Below the proposals are given for determination of the
values of the ultimate point resistance and the ultimate
skin friction Eqs 128 to 1214 and Fig129 1210
The ultimate point resistance
- gravel psf = 140 N30 (kPa) ( 1 bull 2 8)
for N~ 0 gt 50 blows3O cm Psf 7 MPa
- coarse sand and medium sand
(kPa) ( 1 2 9)
for N30 gt 50 blows3O cm Psf 55 MPa
- fine sand and silty sand
psf = 80 Nio (kPa ) (1210)
for N30 gt 50 blows3O cm p f = 40 MPa 5
where N3 o the average of N value near the point level as
22
h+l1
f N3o(h)dh ( 1 2 11 ) h-12
3DP see Fig 1 1 1 D
p
The ultimate skin friction for coarse sand and medium sand
tu = 1 8 N 3 o (kPa) (1212)
t (kPa) (excavated and cast (1213)u under bentonite)
where
N30= the average value of N along the shaft as h
N -
3 o = h1 f N 3 o ( h) dh ( 1 bull 2 bull 1 4 ) 0
The ultimate skin friction for N30 gt 50 blows30 cm is
assumed to be maximum as tu = 90 kPa and t = 150 kPa u
13 Allowable load of large diameter bored piles
The allowable load Qa of large diameter piles has been
expressed as
OuQa ( 1 3 1)Ft
Qa Q(s)=Qb(s) + Os(s) ( 1 3 2)
Opu + Osu (1 3 3)Qa Fp Fs
Qr lt mmiddotQf ( 1 bull 3 4)-
= universal safety factor
individual safety factor for ultimate resistance of the pile point
individual safety factor for ultimate resistance of the pile shaft
= load according to the allowable settlement
calculated load
m coefficient
calculated ultimate bearing load of the pile
23
The equations from (131) to (134) are used as
1) equation (131)
a) DIN 4014 - 1977 Ft= 2 175 15 (depending on the kind of load)
b) Polish Specification 1975 Ft = 18 16 ( -- )
1c) Trofimenkov 1974 Ft = 14307
2) equation (132)
a) DIN 4014-1977 i Q(s) = Qb(s) + Q (s) = A middotp(s) + E tAsmiddott(s)
s p 0
where Qbs) and Qs(s) are described in Fig 1423
3) equation (133)
a) Polish Specification 1974
F 25 22 depending on the kind of load p
F 1 bull 0 s
b) Wright SJ Reese LC 1979
The ultimate capacity or resistance is considered as a
random value and represented by a frequency distribution
The distribution can be described by a mean value and a
variance The distribution of the load applied to the
foundation can be described similarly The coefshy
ficients used to factor resistance and loads are called
partial safety factors Some recommended partial safety
factors for resistance under normal conditions of design
and construction are given in Tab 131 Normal control
is defined as a condition where the coefficient of variation
is less than about 035
Typical values for partial safety factors for loads are
in the range 1 to 2 depending on the type of load and
how it is applied The overall factor of safety Ft can
then be calculated from the equation
Ft = y RbullY S
24
where
YR the par tial sa f ety fac t or for resistance and
Ys the partial safety factor fo r load
The probability of fa i lur e of the foundation can be r eshy
lat ed to the factor of safety for a parti cular degree of
uncert ainty (see Tab 13 2)
c ) Tejchman Gwizdala 1979
The authors discuss adequate safety factors based on fie l d
test s by Spang (1 972) Franke (1976) Touma and Reese (1974)
Colombo (1971) Kerisel and Simons (1962) Appendirno (1973)
see Tab 1 33 Taking into account the universal safety
factor Ft= 2 0 for the tota l load settlement curves it
was estimated
i) F in the range of 111 to 237 with the average value s F = 166 and standard deviation sd = 034 s (see column 16 Tab 133)
ii) Fb in the range of 161 to 945 with the average
value Fb = 387 and standard deviation sd = 2 15
For model core d piles in laboratory conditions values of
Fs = 108 to 154 (average Fs = 132 s~ = 019) and
values of F = 280 to 5 94 (average F = 3 55 sd = 1 07)p p
see Tab 1 3 4
As a conclusion it was assumed that Fb = 40 and F 1 5 s
for l arge diameter bored piles
The investi gation has shown that for the above safety
factors settlements of piles under permissibl e loads are
10 to 20 mm There was assumed a maximum load on large
diameter piles corresponding to a settlement of 010
diameter of the piles
25
d) Bustamente Gianeselli 1 982
e) 0ecourt 1982
The safety factor is given by
F = FgmiddotFfmiddotFamiddotFw where
F 11 - skin friction g F 135 - point bearing capacity
g
Ff safety factor related to the formulation adapted
Ff= 10 for Decourts method
Fd safety factor related to excessive deformation
Fd = 10 for skin friction
As for the point Fa= 2 to 3 depending on the
pile diameter For usual cases 25 is suggested
Fw safety factor related to working load
Decourt recommends 12
Thus we will have
- for skin friction
Fs = 11bull10middot10middot12 132 - 13
- for the point
F = 135bull10bull25middot 1 2 = 405 = 40 p
4) equation (134)
a ) Polish Code 1983
Q lt mbullN r shy
where
total load coefficient (depending on the kind of load For foundation we can assume Yf = 12 )= code load
correction coeffic i ent
09 for pile foundations
m 08 for two piles
m 07 for single pile
26
N ymmiddotQu
ym material (soil) coefficient
ym 08 to 09 (Polish Code 1981)
Thus we will have
QnmiddotYf lt mmiddotym middotQu-
Yf9uFt = On m bull Ym
1 2 max = 2 14Ft 0 7 bull 0 8
1 2min = 1 48Ft 0909
The above analysis has shown different ways to determine
the allowable load The analysis is in direct connection
with mobilization of the load (versus settlement) The
dependence of total load point resistance and shaft reshy
sistance will be discussed in detail in Chapter 14
In the authors opinion taking into account the above
analysis the allowable load should be determined based
on the equation 133 ie based on individual safety
factors for ultimate point and shaft resistance Proposed
values of F and F in literature are shown in Tab 135 s p The average values are Fs = 145 and Fp = 3 38 respectively
Taking into account that the bearing capacity is determined
based on the results from sounding measurements direct from
a place near the piling without a ny indirect correlation
the allowable load of large diameter bored piles is given
by the equation (133a)
( 1 3 3a)
where F = 30 and F 13 are proposedp s
27
14 Determination of settlement of larqe diameter bored
piles based on static cone penetration tests CPT
Determination of ultimate point and skin friction resistance
based on static cone penetration tests has been discussed
in Chapter 11 above Based on the results of this calcushy
lation and on Chapter 13 we can establish an approximate
relation between point resistance shaft resistance and
total load on one hand and settlement on the other However
the approximation gives a wide scatter especially for base
resistance as can be observed in Fig 141 to Fig 144
Only the first part of the point resistance - settlement
curves are in good agreement with measured values It can
be observed in Fig 145 that the average correlation
coefficient n = 098 and standard deviation sd= 029
This way of calculation can be used only for rough calcushy
lation (see Chapter 13)
In Chapter 11 also measured point resistance - settlement
curves were shown The base resistance increases gradually
with increasing pressure and settlement Below the cur7
vature of the point resistance - settl ement curve will be
examined It is assumed that this curve can be described
as a part of the hyperbola curve Thus if the ratio of
the measured settlement (s ) to the point resistance (p)
is plotted against the measured settlement the result
will fall closely to a straight line with the equation
( 1 4 1)
where a 1 and b 1 are constants (see Fig 1 46a and Fig
14 6b)
Then the point resistance - settlement realtionship can be
expressed as a hyperbola
s p = ( 1 bull 4 2)
The constant is the initial s lope of the point resistanceshya 1
settlement curve ie a 1 = t~a The inverse of the constant
28
b 1 is the vertical tangent (asymptote) to the curve 1ie for s = 00
bf= ~ If the ultimate point reshy1
sistance psf is equal to bf (psf=bf) the whole point
resistance settlement curve will be a hyperbola type
Now the Eq 1 4 2 can be written as
s s ( 1 4 3)a) p s or b) p = a+__sect_a1 + 1 Psfbf
If the ultimate point resistance is smaller than bf only
a part of the hyperbola curve ought to be considered
Further the Eq 14 3 will be written as
p ( 1 4 4)
where
poundf_ correction factor for hyperbola point Psf resistance-settlement relationship
Taking into account the discussion in Chapter 11 the
ultimate point resistance psf = qcp based on the CPT measurements
Therefore the relationship between the point resistance
the sett l ement and the CPT result can be expressed as
s p (1 4 5)s
The correction coefficient v 1 will cause a change of the
position of the vertical asymptote bf in r elation to the
ultimate point resistance q bull This means that we take cp into account a different part of the hyperbola curve for
the description of the point resistance-settlement relationshy
ship
Now if we want to use the equation (145) in practice
we must determine the constant and the coefficienta 1 v 1 (assumed that q is determined ear l ier Chapter 11)cp
29
The constant a 1 and t h e coefficient Vi have been detershy
mined based on fi e ld tests according to pi l es No 1 - 20
see Tab 14 1 and Tab 1 1 9 as wel l The values of
a 1 versus the point diameter D and the ul timate pointp
resistance respectively are shown in F i g 147 and Fig
148 Fig 1 47 shows that a 1 is independent of the
point diameter D Based on Fig 148 it can be assumed p
that
28-4bullq (1 4 6)cp
This correlation has been examined with data of the
literature see Fig 1 49 and Appendix 141 to 1 45
(Note there were no static penetration tests and qcp was determined based on a correlation made by Bergdahl
(1982))
A good correlation with equation 146 can be seen taking
into account the safety factor in the DIN 4014 Part 2
(1977) bull
The correction factor v 1 versus the poi nt diameter is shown
in Fig 1410 I t is assumed that the correlation is
V1 = 3 0 - D ( 1 4 7)p
where D is in m p
The above equations ie 146 and 147 were assumed for
a later analyses see Fig 14 11 and Fig 1412 The
piles No 1 to 20 were examined taking into account Eqs
14 5 14 6 and 1 4 7 The result of this cal cul ation is
presented in Fig 1 413 to Fig 1 4 18 and in Tab 1 4 2
respectively In Fig 1413 the calculation way for pile
No 2 is shown as an example
In Fig 1414 to Fig 1 417 measured and calculated
values of the point resistance versus settl ement can be
compared In tota l good correlation exists for all the
30
pressure-settlement curves Values of q from static cp
cone penetration tests and generalized values of anda 1
v 1 were considered Only for piles No 17-20 qcp was
assumed as the point resistance for s = 010 D because p
the static penetration test results were inaccessible
The similar comparison is shown in Fig 1417a for piles
in sand based on experimental results (Tuoma Reese 1972
and Wright Reese 1979) where the ultimate case resistance
was assumed as the resistance at a base settlement of 005
D The relative base resistance is the mobilized base p resistance divided by the ultinate base resistance The
curvature of the proposed point resistance settlement shy
curve to mean value proposed by Wright and Reese is excellent
However the constant a 1 and the coefficient v 1 were
determined for sand only In the future they should be
examined especially for gravel and silty sand based on
field tests Until then in the authors opinion the
values of v 1 can be chosen from Eq 147 for all nonshy
cohesive soils But for a 1 there is proposed
at = gt bulla (1 4 8)1
where
gt- 1 = 080 for gravel
gt 2 120 for silty sand
This proposal is shown in Fig 14 11 as dashed lines
A good correlation can be seen with the investigation by I
Kiosimiddotnski for sandy gravel and on the safety side with
the investigation by Tuoma and Reese for silty sand (see
Fig 149)
In Fig 1418 all calcul ations for pile No 1 to 20 are
summarize d The correlation coefficient n is defined as
the calculated point resistance p(s) divided by measured
point resistance p(s) For totally 126 points from 20
curves an average of n = 098 with standard deviation
31
al= 023 was obtained see Fig 1418 A similar result
can be observed for the range usually assumed of the
allowable settlement for sinqle large diameter bored
piles as
for
- for
- for
s
s
s =
10
20
30
mm a
mm
mm
verage n10 II
II
mm 089
095
099
and sd =
and sd
and sd
031
027
026
It can be questioned whether the sonstant a 1 can be deshy
termined in different ways The constant a 1 is the initial
slope of the point resistance-settlement curve as menshy
tioned above Then we can use all methods for determination
of settlement of a pile point The range of validity of
these methods then must be determined This will be shown
later
In order to be able to design the total load settlement
curve the skin friction resistance-settlement relationshy
ship must be determined The ultimate skin resistance of
large diameter bored piles was determined in Chapter 11
(based on static penetration tests) and in Chapter 12
(based on standard penetration tests)
In the past a lot of field tests have been done on the
mobilization of the shaft resistance versus pile settleshy
ment In this subject there is a rather good agreement
in the whole investigation for cohesive and non-cohesive
soil
Some results and opinions on thispresented in the literashy
ture during the last few years are shown below
Ultimate shaft resistance versus settlement
1) BurlandJB Butler FG Duncan P (1969)
-The shaft l oadsettlement curve is derived using a=0 3
with 90 ultimate load being mobilized at 025 in
settlement(~65 mm)
- soil London clay
- see Fig 1 419
32
2) Touma FT Reese LC (1974)
- The failure of the sides of the shaft takes place
at a downward movement of about 04 in (10 mm)
- soil sand
- see Fig 1420
3) Tomlinson HJ (1977)
- The maximum shaft resistance is mobilized at a
settlement of only 10 mm (or j in)
- soil stiff clay
- see Fig 1421
4) Klosinski B ( 1977)
- It was assumed that skin friction increased proshy
portionally to pile settlement up to the limit value
s bull This value depends on soil conditions and pile0 diameter and is usually from 3 to 8 mm For soft
compressible soil it may be grater than 10 mm
- soil cohesive soils
- see Fig 1422
5) Franke E Garbrecht D (1977)
- At settlement of 2 to 3 cm which are normally
allowed in Germany under working loads for buildings
not very sensitive to differential settlementsthe
skin friction is almost always fully mobilized
- soil sand
6) DIN 4014 part 2 (1977) and Franke E (1981)
- The skin friction Tm is approximated as diameter
independent having failure settlements of smf = 2 cm
in sand and 1 cm in clay
- soil sand and clay
- see Fig 1423
33
7) Reese By L (1978) Reese By L Wright SJ (1979)
(1978) The maximum skin friction being developed at
an average downward movement ranging from about 05shy
2 of the shaft diameter The average of six load tests
reported by Whitaker and Cooke (1966) are a lso plotted
for comparison
- soil stiff clays
- see Fig 1424 and Fig 1425a
(1979) The relative settlement is the average settleshy
ment of the butt and base devided by the shaft diameter
The mean curve maximises at a relative settlement of
about 002 D
- soil sand and clay
- see Fig 1425b
8) Tejchman A Gwizda3a K (1979)
- A clear differentiation of the distribution of shaft
and base resistances is observed for changing settleshy
ment For fairly small settlements the shaft resist shy
ance increases quite fast and the ultimate values
are reached soon while the base resistance increases
gradually with increasing loads and settlements withshy
out clearout ultimate values it can be assumed that
complete mobilization of shaft resistance corresponds
to settlements equal to 001 or 002 diameter of pile
- soil cohesive and non-cohesive soils
- see Tab 131 and Fig 1 426
9) Promboon S Brenner R P (1981)
- Load distribution and load transfer curves disclose
that most of the load is carried by shaft friction
which is developed at small displacements in the order
of 10 mm
- soil Bangkok clay
- see Fig 1427
34
10) Prodinger w Veder Ch (1981)
- The maximum value of skin friction resistance
occurred for a total settlement of 12 mm
- soil silty clay and sand
- see Fig 1428
11) Farr JS Aurora RP (1981)
- Ultimate load transfer was recehed (or nearly reached)
at a relative settlement of about 04 in (10 mm)
- soil gravelly sand
- see Fig 1429
12) Decourt (1982)
The skin friction resistance is totally mobilized
with deformations of about 10 mm or at the most 15
mm regardless of shaft dimensions This observation
of ours seems to clash with the opinions of other
authors who seek to relate the deformation necessary
for full skin friction mobilization with the shaft
diameter
- soil cohesive and non-cohesive soil
In Tab 143 all these results are shown Depending on
the kind of soil the following v a lue s of ultimate settleshy
ment for shaft can be assumed
- averages 142 mm (sd 5 3 mm) for sand
- averages 100 mm (sd = 21 mm) for cohesive soil
averages 726 mm (sd 67 mm) for claysand
It can be observed (see Fig 1419 to 1428) that the
shaft friction resistance increases proportionally to
the pile settlement up to the above limit value and
thereafter becomes constant
35
Taking into account what was mentioned earlier on point
resistance settlement relationship and the above results
a relationship between total load point resistance and
shaft resistance on one hand and settlement on the other
can be made see Fig 1430
It is assumed on the safety side that the following
ultimate settlement (S~) exists for the shaft resistance
of large diameter bored piles
SS1 ) 200 mm for non-cohesive soil u SS2) = 100 mm for cohesive soil u SS3) 15 0 mm for claysandu
In Fig 1 430 the curve Q (s) is calculated based on p
the equation 14 5 or 144
The values of psf in equation 144 can be calculated
based on other methods as well
The total load-settlement relationship is obtained by
summing up point and s haft resistance as
Q (s) = Q (s) + Q (s) (149)s p
for each point
Now the allowable load can be determined from equation
133a and versus the allowabl e settlement as
Q (s) = Q (s) + Q (s) (1410)s p
where s lt Sa
Sa= the allowable settlement of the pile
The analysis allows determination of the approximative
load settlement dependence without calculating the settleshy
ment for non-cohesive soil In Fig 1431 it is shown
36
In Tab 144 the settlement for allowable point reshy
sistance q5P according to equation 133a is shown
as well The average settlements= 198 mm (sd=78 mm)
is obtained This value is similar to the assumed ultimate
settlement of shaft for non-cohesive soil The ultimate
settlement for point resistance is assumed s = 010 Dp as mentioned earlier
37
15 Initial slope of pile point resistance shy
settlement curve
Settlement of piles and pile foundations can be cal culated
based on
- empirical correlations
load-transfer methods using measured relationships
between pile resistance and pile movement at various
points along the pile
- theory of elasticity that employs the equations of
Mindlin for subsurface loading within a semi-infinite
mass
- numerical methods and in particular the finite element
method
- use of in-situ tests (Cone Penetration Test Standard
Penetration Test Pressuremeter Test)
The critical slope of the pile point resistance-settlement
curve is important for calculation in chapter 14 The
constant a1 can be determined from all the above mentioned
methods
Comparison is made to Berggrens and Schmertmanns methods
below (see Berggren 1981 as well)
6sIn Tab 151 (No 1 2 3) the values of a 1 =~p for s =
10 mm and s = 20 mm (measured for large diameter bored
piles No 1 to 24) are compared to the calculated values
according to the modified hyperbola method (see Fig 14 6)
It can be seen that these calculated values are between
s = 1U-2u mm but rather closer the measured values for
the settlements= 10 mm see correlation coefficient n 6
and n 7 in Tab 151 respectively The average correlat i on
coefficent for the settlements= 10 mm is n9 = 108 and
the standard deviation is sct = 014 The comparison to
Berggrens and Schmertmanns methods for s = 20 mm ( see
Berggren 1~81 and Tab 151 as well) shows that the
results based om these methods give too high values of a 1 bull
38
The average values are ne= 143 sd = OJ3 and ng= 137
sd = 037 for Berggrens and Schmertmanns methods
respectively A bit better agreement can be observed
for Schmertmanns method
Taking into account the results in Tab 151 ana Tab
15l it must be assumed that for the determination of
a 1 the pile point contact pressure p(a1) should be
assumed as the ultimate point bearing capacity devided
by about 4
p(ai) - ( 1 bull 5 1 )
Most of the methods for determination of settlement are
based on the theory of elasticity The settlement ot the
pile point can be expressed as the average settlement of
a rigid circular foundation from the equation
11-Dp 1-v 2
s = p -4- -E-bull microd (1 ~ 2 J
where
p pile point contact pressure
E Youngs modulus
D diameter ot pile pointp ) = Poissons ratio
microd = depth factor
The range of validity of the pile point contact pressure
was determined in equation 151 Youngs modulus has an
important meaning lt can be determined from triaxial
tests or oedometer tests The relationship between the
constrained (oedometric) modulus Mo and Young s modulus
Eis dependent on Poissons ratio v as expressed by the
equation
E = l 1 + V ) ( 1 - 2 V ) Mo ( 1 bull 1 bull 1)- 1-v
39
TaKing into account the analyses made ny Chaplin (19b1a
1 961bJ Janbu (1 963 1970 1973J Andreassen (1973)
Duncan and Cheng (1970) Tejchman anct Gwizdala (1979)
Gwizdala (1978) Franke (1981) Berggren (1981) Withiam
and Kulhawy (7981) and the present investigation the
calculation of settlement is proposed to be
s = 24 bull p bull ~ D bull 1-v 2 bull micro d (154)Do o E
where s (r1)
p (kPa)
Dp (m)
E (kPa)
D0 =10 m
micro = 05 + 01 vfrac34E (1 5 5)d vs
but 05 lt microd lt 10-tip= p - (J (ovs see Fig 151)vs
E =Et= Kbullpat (Oo )n [1- Rf(1-sinltj) 101 - 03 ) 12 (1 5 6)2 c cosltP + 2o 3 sinltP 1Pat
in which K n and Rf= hyperbolic stress-strain parameters
Pa= atmosferic pressure ando 1 o 3 and o0 are determined by
averaging the concrete and soil vertical and radial stresses
near the pile point according to Fig 151 Then the
stresses at the pile point level are h
(J vs = L
0 Yi h
l vertical stress in the soil
0 hs Ko h
0 vs radial (horizontal) stress in the soil
0 vc L ye h -l
vertical stress in the concrete 0
0 hc K oc a vc radial (horizontal)
concrete stress in the
40
K at rest soil lateral stress coefficient 0
K c lateral stress coefficient for fluid fresh concrete0
K 1 0 oc
and average values
a 05(a +a)V vc vs
1 1 - shy~ = -(a +a+a I = -3 (av+2ahJ the applied mean normal stress0 j Z X y
Assuming this model calculation results for piles No 1-24
(see Tab 11~ as well) are shown in Tab 153
The piles are embedded mainly in medium sand to fine sand
For this kind of soil it can be assumed (soil parameters
from field or laboratory tests were inaccessible)
~ = 35deg c = 0 R~ = 09 n 05 v = 025 K c 10l 0
K = 04 Pat= 1UO kPa ye 24 kNrn 3 y = 14 kNm 3 bull0 C
Moreover in Tab 153 the following symbols are used
p(a1 ) - pile point contact pressure according to equation
1 bull 5 1
s(a1) - settl ement of pi l e point according to equation
143 and Tab 141
pound TT ( 2E = s bull Dp bull i 1-v ) according to equa~ion 152t
E~ Et bull microltl
EI
K = ro~ - according to equation 1 bull 5 6 p bullO middotA2
a~ o
E = E voD middot D middot ~4 ( 1 - v 2 ) according to equationt S p O 0
1 5 4
Et= E microd
K = according to equation 156 V PatmiddotaomiddotA2
41
The calculation results of Youngs modulus E = Et and
dimensionless canpressionrro1ulus for piles to 1-24 are shown
in Fig 152 to 155 using equation 152 and 15b
or equation 1~4 and 156 respectively lt can be obshy
served that the scatter in Fig 153 and Fig 155
where the influence of tne pile diameter is reduced
compare equation 154 is less than in the other figures
The reduced influence was made after observations from
field and laboratory tests while the equation 152 is
taken direct from theory of elasticity These values of
E and K are in good correlation with published values in
literature The values of Youngs modulus versus the
relative density of soil are compared to literature values
see Fig 15b Based on the analysis in this chapter it
can be assumed that
E = 9-ql 3 ( 1 bull 5 7)cp
where qcp is in accordance with equation 117
The calculation results based on this proposal are incluced
in Tab 1 5 3
The c a lculate d s e ttlements based on e q ua tion 154 and
157 are shown in column 23 and the values of the
correlation coef f icie nt (n= Seal ) in column 24 respectshyimeas
ively
The dimensionless canpression modulus can be d e termined as
K = 15Ubullq (qcp in MPa) (1 5 8)cp
see column 25 Tab 153
The calculation results based on the K compression modulus
according to equation 158 156 and 1 5 4 are shown in
columns 25 26 2 7 28 and 29 in Tab 153
42
For comparison and for determination of the range of
validity of this method the caLculation results of
pile point pressure for settlements s = 10 mm s = 20 mm
s = 30 mm (see Tab 141) according to equation 157
and 154 are shown in columns 30 to 35
The results obtained in Tab 153 confirm the possibility
to use the proposed method to calculate the initial part
of the pile point resistance settlement curve of large
diameter bored piles in non-cohesive soil and the initial
slope of this curve as well
A simple model has been proposed based on the theory of
elasticity ana the tangent modulus defined by Janbu (1963)
and Duncan amp Chang (1970)
A new approach according to the pile diameter depth factor
and principal stress is proposed
The settlement of the pile point can be made up to a point
pressure according to equation 151 on up to a settlement
of about s ~ 20 mm (30 mm)
-- The application of v Op in equation 1 5 4 a llows us ing
Youngs modulus as independent of the pile diameter
opposed to Bazants a nd Mosopusts (1981) proposal where
Youngs modulus wa s determined versus the pile diameter
The equation 1 5 6 takes into account the dependence of
Youngs modulus on depth (or overburden pressure) as
well
In the method field test (Cone Penetration Test) or
laboratory tests (hyperbolic stress-strain parameters
can be used
Comparison of the method to 24 availa ble load test r e sults
or large diameter bored piles in sand shows good a greement
to calculated and measured values
43
REFERE~CES
Adamczyk J (1978) Okreslanie udzwigu pali wierconych
za pomoca sondy statycznej (Bearing capacity of bored
piles based on the static sounding) Inz i Bud No 7
pp 253-257
Andreasson L (1973) The compressibility of cohesionless
soils Thesis Chalmers University of Technology
G6teborg (in Swedish)
Appendino M (1973) Comportamento di un palo di grande
diametro strumentato Rivista Italiano di Geotechnica
No 3 pp 115-118
Butterfield R Banerjee P (1971) A rigid disc embedded
in an elastic half space Geotechnical Engineering
Vol 2 pp 35-49
Bozant z Mosopust J (1981) Drilled pier design based
on load settlement curve X ICSMFE Stockholm Vol 2
pp 615-619
Begemann HK (1982) Cone penetration tests pile bearing
capacity and the thesis of Rollberg Proc of the Second
European Symposium on Penetration Testing Amsterdam
pp 433-438
Berggren B (1981) Bored piles on non-cohesive soils shy
settlement and bearing capacity (in Sweden) Thesis
Department of Geotechnical Engineering Chalmers
University of Technology G6teborg
Bergdahl UB (1979 1982) Sonderingen und in situ Messungen
Wien 18-19 Juni 1979 - Private information 19821983
Bustamante M Giane selli L(1982) Pile bearing capacity
prediction by means of static penetrometer CPT Proc
of the Second Europ Symp on PenTest Amsterdam
Vol 2 pp 493-500
Chaplin TK (1961a) An experimental study of the settleshy
ment of footings in sand PhD Thesis Univ of
Birmingham
44
Chaplin TK (1961b) Compressibility of sands and settleshy
ments of model footings and piles in sand 5th Int
Conf on Soil Mech a Found Engng Vol 2 p 33 Paris
Colombo P (1971) Observazoni sul comportamento ltli pali
a grande diametro Rivista Italiana di Geotechnika
No 3 pp 163-172
Dahlberg R (1975) Settlement characteristics of preconshy
solidated natural sands Swedish Council for Building
Research D11975
De Beer EE (1964) Some considerations concerning the
point bearing capacity of piles Proc Syrop Bearing
Capacity of Piles Boorkee I pp 178-204
Decourt L Quaresma AR (1978) Capacidade de Carga de
Carga de Estacas a partir de Valores de SPT VI Conshy
gresso Brasilerio de Mecanica dos Solos e Engenharia
de Fundacoes - Rio de Janerio - ABNS
Decourt L (1982) Prediction of the bearing capacity of
piles based exclusively on N values of the SPT Proc
of the Second Europ Syrop on Penetration Testing
Amsterdam Vol 1 pp 29-34
Duncan MJ Chang CV (1970) Non-linear analysis of stress
and strain in soils Journal Soil Mech Found Div Vol
96 SM5 pp 1629-1651
Durgunoglu HT (1979) Effect of foundation embedment on
stress and deformation distributions Third Int Conf
on Num Meth in Geomechanics Aachen pp 925-928
Farr JS Aurora RP (1981) Behaviour of an instrumented
pier in gravelly sand Proc of a session Drived Piers
and Caissons sponsored by the Geotech Eng Div of the
ASCE Nat Convention St Louis Missouri pp 53-65
Franke E (1981) Point pressure versus length and diameter
of piles X ICSMFE Stockholm Vol 2 pp 717-722
45
Gregersen os Aas G and Dibiagio E (1973) Load tests
on friction piles in loose sand Proc of the Eigth
International Conference on Soil Mech Moscow USSR
Vol 21 pp 109-117
Gwizda1a K (1978) Behaviour of large diameter bored piles
in non-cohesive soil (in Polish) Archiwum Hydrotechniki
Vol XXV No 2 pp 183-217 (English summary)
Huizinga TK (1951) Application of Results of Deep
Penetration Tests to Foundation Piles Building Research
Congress Vol 1 p 173
Janbu N (1963) Soil compressibility as determined by
oedometer and triaxial tests Proc Europ Conf Soil
Mech and Found Eng Vol 1 p 19 Vol 2 (Discussion)
p 17 Wiesbaden
Janbu N (1970) Grunlung i geoteknikk Tapir Forlag NTH
Trondheim
Janbu N Bjerrum L Kjaernsli B (1973) Soil Mechanics
applied to some engineering problems Norw Inst Publ
No 16 Oslo
Japanese Society SMFE (1981) Present state and future trend
of penetration testing in Japan Separate report at
X ICSMFE Stockholm
Kjekstad O Lunne T (1979) Soil parameters used for design
of gravity platforms in the north sea Second Int Conf
on Behaviour of Off-shore structures London Vol 1
pp 175-192
Klosinski B (1977) Bearing capacity of large diameter bored
piles IX ICSMFE Tokyo Vol 1 pp 609-612
Laboratory for soil mechanics Delft (1936) The predetershy
mination of the required and the prediction of the
resistance of piles Proc 1 Int Conf on Soil Mech
and Found Engng Cambridge (Mass) I p 181
46
Matich M and Stermac A (1971) Settlement performance of
the Burlington Bay Skyway Canadian Geotechnical Journal
Val 8 pp 252-271
Mccammon NR and Golder HQ (1970) Some loading tests
on long pipe piles Geotechnique London England
Val 20 pp 171-184
Meigh AC (1971) Some driving and loading tests on piles
in gravel and chalk Proc of the conference on beshy
haviour of piles London England pp 9-16
Mitchell JK Gardner WS (1976) In situ measurement
of volume change characteristics American Society of
Civil Engineers Specialty Conference on In-situ
Measurements of Soil Properties Raleigh 1975 Proc
Val II pp 279-345
Mezenbach E (1961) The determination of the permissible
pointload of piles by means of static penetration tests
Proc 5 Int Conf on Soil Mech and Found Engng
Paris II pp 99-104
Meyerhof CG (1956) Penetration tests and bearing capacity
of cohesionless soils Proc Amer Society of Civ Engng
SM 1 Pap 866 pp 1-19
Meyherhof GG (1 976) Bearing capacity and settlement of
pile foundations Proc Amer Society of Civ Engng
Journal Geotechnical Engineering Division Val 102
No GT3 pp 197-227
Mohan D Jain GS and Kumar V (196 3 ) Load bearing capacity
of piles Geotechn Val XIII pp 76-86
Nixon I (1982) Standard penetration test State of the
art report Proc of the Second Europ Symp on Pen
Test Amsterdam Val 1 pp 3-20
47
Nunes A Vargas M (1953) Computed bearing capacity of
piles in residual soil compared with laboratory and
load tests Proc of the Third International Conference
on Soil Mechanics Zlirich Switzerland Vol 2 pp 75-79
Nordal S Grande L Janbu N (1982) Prediction of offshy
shore pile behaviour The Norwegian Institute of
Technology Trondheim
Ohde J (1939) Zur Theorie der Druckverteilung im Baugrund
Der Bauingenieur Vol 20 No 3334 p 451
Parroth E (1972) Einfache Formel zur Vorausbestimmung der
Tragfahigkeit von Standpfahlen mit Hilfe der Sande
Bautechn 9 pp 312-314
Poulos HG Davis EH (1980) Pile foundation analysis
and design New York - J Wiley and sons
Prodinger W Veder Ch (1981) Bearing capacity of floating
groups of diaphragm walls Proc X ICSMFE Stockholm
Vol 2 pp 809-814
Promboon S Brenner R (1981) Large diameter bored piles
in Bangkok Clay Proc X ICSMFE Stockholm Vol 2 pp
815-818
Reese L (1978) Design and construction of drilled shafts
ASCE JSMFD Vol 104 No OT1 pp 95-116
Rodin s Corbett BO et al (1974) Penetration testing in
United Kingdom state-of-the-art-report Proc Europ
Symp on Penetration Testing 1 Stockholm pp 139-146
Rollberg D (1976) Bestimmung des verhaltens von Pfahlen
aus sandier und rammengebnissen Heft 4 FBG Technische
Hochschule Aachen
Rollberg D (1977) Determination of the bearing capacity
and pile driving resistance of piles using soundings
Publications of the Institute for Found Eng Soil Mech
Rock Mech and Water Ways Construction Aachen Vol 3
48
Schmertmann J (1970) Static cone to compute static
settlement over sand Journal of the Soil Mech and
Found Division ASCE SM3 pp 1011-1043
Schmertmann J Hartman JP Brown PR (1978) Improved
strain influence factor diagrams Journal of the Soil
Mech and Found Division ASCE GT8 pp 1131-1135
Shibata T Hijikuro K and Fominerga M (1973) Settlement
of a blast furnace foundation Proc of the Eighth Int
Conf on Soil Mech Moscow USSR Vol 13 pp 239-242
Spang J (1972) Die Bestimmung der Tragfahigkeit von Grossshy
borhpfahlen (I) Strassen und Tiefbau No 2 pp 339-355
Senneset K (1974) Penetration testing in Norway State-ofshy
the-art-report Proc Europ Symp on Penetration Testing
Stockholm I pp 85-95
Tejchman A Gwizdala K (1979) Analysis of safety factors
of bearing capacity for large diameter piles Proc VII
ECSMFE Brighton Vol 1 pp 293-296
Thorburn s and Mac Vicar R (1971) Pile load tests to
f a ilure in the clyde alluvium Proc of the conference
on behaviour of pile s London England pp 1-7
Trof imenkov JG (1969) Accuracy of determining the bearing
capacity of piles based on results of static penetration
sounding of soils Osnovaniya Fundamenty i Mekhanika
Gruntov 4 (Translation Soil Mechanics and Foundation
Engineering 4 p 248)
Trofimenkov JG (1974) Penetration testing in USSR Stateshy
of-the-art report Proc Europ Symp on Penetration
Testing Stockholm I pp 147-154
Tuoma F and Reese L (1974) Behaviour of bored piles in
sand JSMFD ASCE Vol 100 No GT 7 Proc Paper 10651
July pp 749-761
49
Van der Veen C (1953) The bearing capacity of a pile
Proc 3 Int Conf on Soil Mech and Found Engng
Zlirich II pp 84-90
Van der Veen C and Boersma L (1957) The bearing capacity
of a pile predetermined by a cone penetration test
Proc 4 Int Conf on Soil Mech and Found Engng
London II pp 72-75
Weltrnan AJ Healy PR (1978) Piling in boulder clay
and other glacial tills Construction Industry Research
and Information Association UK-Report PG 5
Withiam J Kulhawy F (1981) Analysis prodecure for
drilled shaft uplift capacity Proc of a session
Drilled piers and caissons ASCE St Louis Missouri
pp 82-97
Woodward R Lundgren R Boitano J (1961) Pile loading
tests in stiff clays Proc of the Fifth International
Conference on Soil Mechanics Paris France Vol 2
pp 177-184
Wright SJ Reese LC (1979) Design of large diameter
bored piles Ground Engineering Vol 12 No 8 pp
17-22
DIN 4014 Cods Teil 2 (1977) Bohrpfahle Grossbohrpfahle
Herstellung Bemessung und zulassige Belastung
Polish Specification (1975) Specification for design and
construction of large diameter bored piles in bridges
Ministry of Transport Warsaw (in Polish)
Polish Specification (1979) Specification for prevision
bearing capacity of the piles on the presiometer test
and static sounding ENERGOPOL Warsaw (In Polish)
Polish Code (1983) Foundations Bearing capacity of piles
and pile foundations
5 1
FIGURES
bull bull
53
Ou
+ sect raquo iir 1
4 + D
h + +Osu
bull + t2 =n- Dp
LDpl r f 1
Opu
Fig 1 1 1 Bearing pi le in the soil
J_
fp
080
070
060
050
0 40
030
020
010
q~ [MPa ]000 -+--~-~-~-~------------------------=-shy
00 20 4fJ 60 80 10 0 120 14fJ 160 180 200
Fig 1 1 2 The point resistance factor fp
(Trofimenkov 1974)
54
ts
160
140
120
100
080
060
040
020
q~5 [ kPa)
0Q0--1------~-~-~-~-~-~ - - ---=- -- shy000 10 20 30 40 50 60 70 80 90 100
Fig 1 1 3 The shaft resistance factor fs middot (TYofimenkov 1974)
f s
200
180
160
140
120
100 2 3 4 5 6 7 8 9
Fig 1 1 4 Shaft friction factor f depenshys
ding of the soil density (Senneset 1974)
55
Q~ [kN]
1500
1000
500
0-r-----------r----~- Q~ [kN] 0 500 1000 1500
Fig 1 1 5 Comparison of the pile resisshytance determined by the results of static sounding and load tests (TYofimenkov 1974)
D f f
0
Fig 1 16 Equivalent cone resisshytance (Bustamante 1982)
56
E u shy0 ~
QI I ltII ltII
~ a C QI
O C
D
w gt
0
Cone res istance Point resistance
80 160 240 320
05
10
15
e d
20
ver y dense Cone resistance 300 kgcm2
Dpcm
a =45 b = 30 C 60 d = 100 e = 150
Fig 1 16a
Cone resistance _ qc
80 160 80 160 qc [ k g cm2 ]p
05
10 10
15 15 e d a
e d20
Dense Medium2 2200 kgcm 100 kgcm
Cone resistance and point resistance of piles versus overburden pressure (Kerisel 1965)
Point resi stance - p(for s=2cm) of the pi le for
15 sett Iement s = 2 cm
10
5
E u
uJ1 o-~----shya er O 804 2500
32 56
I 1
L oose50 -I =25 Very loose L
----~--shy5000 7500 80 98
~-----lmiddotI1--------2 10000 12500 31400 =Flcn)
112 123 200 =Dplcm)
Fig 1 1 6b Point resistance versus cone resistance and pile diameter (Franke 193)
57
1
fp
080 (D Gravel
0 Coarse sand Medium sand 070
reg Fine sond Silty sand
060
050
040
030
020
010
qc [MPa]000-+----r--~-~-~--------r----r----r-~-~-- -shy
oo 20 40 60 80 100 120 140 160 180 200
Fig 1 1 7 Point resistance factor f (proposal) p
58
300
250
200
150
100
qc [MPa I50-+---------------r---r---r---r----r------------- shy
oo 20 40 60 80 100 120 140 160 180 200
Fig 1 1 8 Shaft resistance factor fs (pr oposal)
59
Bustamante (seetab 115 I
l fp
G)
0 Gravel
Coarse sand Medium sand
cl
b)
t-----l
1----1
080 reg Fine sand Silty sand a) D
070 Polish
060 Specification
( 1979) 050
040
030 CD 020 0
reg 010
qc [MPa]0 00 -+-------------------------------------=--shy
oo 20 4o 5o 80 100 120 14o 15o 180 200
Fig 1 19 Point resistance factor f comparisonp
Bustamente ( see tab 116 I 300
a) ~
250 b)~
cl~
200 Polish Specification ( 1979 l
150
100
q [ MPa]504---~--~--~----- ---___
00 20 40 60 80 100 120 140 150 180 200
Fig 1 1 10 Shaft resistance factor fs comparison
60
1 fp
~
080 CD CD Gravel
070 0 reg Coarse sand Medium sand
060 0 Q) Fine sand Silty sand
05
040 Franke (1973)___
030 DIN 4014
020 Part 2 1977
( see tab113 l 0shy
--shy --a - 010 C---0 Piles without enlarged bases
D---0 Piles with enlarged bases qc [MPa ] 000
00 20 4JJ 60 80 90 100 120 140 160 200
Fig 11 11 Point resistance factor f comparison p
fs
DIN 4014 Part 2 1977 ( see tab 114 l
300
~ 5 lt qc lt 10 MPa 50
~ 10 lt qclt 15 MPa
~qcgt15MPa
200
150
CD
100 0 0
qc [ 1Pa] 50-t-----T-~----T-r-~----------------shy
OO 20 40 6JJ 80 100 120 14JJ 160 180 200
Fig 1 1 12 Shaft resistance factor fs comparison
61
Measured p [ MPa]
( s=010 Dp) 10
9
8
7
6
5 0
4 0 61
3
I 2
Calculated qcp [MPa]
0 0 2 3 4 5 6 7 8 9 10
Fig 1 1 13 Comparison of experimental and aomputed values of the pile point resistanae
62
Contact pressure ( MPa ]
2 I 6
50
100
E E 150 Ill
c QI
E Sett lement for QI
calculated qcpai V) 200
Fig 1114 Results from load tests on piles No 1 and 5
Contact pressure [ MPa I 0 2 I 6
01---------------------1
50
E E 100 Ill
Settlement forc QI calculated qcp E ~ ai
I V) 150
Fig 1 1 15 Results from load test on piles No 7 and 5
63
Contact pressure p [ MPa] 0 2 3 4 6
0-t=-----~-~-----
E E
100 1)
c CU E 2 QI V) 150
Fig 1 1 16 Results from load test on piles No 9 10 and 11
Contact pressured p [MPa] 0 1 2 3 4 5
o~~~=------------___-~-shy
50
100
E E
i 150
CU E CU
-a V) 200 2
Fig 1 1 17 Results from load test on piles No 12 and 13
c
-------------- -
64
Contact pressured
0 1 2 3 4 p [ MPo] ~o __L____1_____J_____L___
50
100
150
E
E
IJ) 200
c a
E a
~ 250
Fig 1 1 18 Results f Pom load tests on piles No 2 4 6 and 8
p [MPa]
60
50
tO
30
~
Pile Pile Pile Pile
Pile No18
------+ Pile No17 + ~_ ---0 Pile No 19
bullbull - --bull Pile No 20
- ~middot -shy-shy -(y I Settlement for
20 tO 60
No17 +-middotmiddot- V 70 No 18 bull--- V 9o No19-middot- V 120 No20bull---- V150
qcp 3
80 100 120 140 160 s (mm)
Bose resistance
Fig 1 1 lBa Point Pesistance vePsus settlement (Spang 1972J
65 Cone resistance qc [ MPa]
0 10 20 30
mud
5 ~ lll
0 c 0
c CD
peat
10 sand
Ill N
10=10
D=lOOOmm
1540=40
20__________________
[ml
Fig 1 119 Pile No 1 and results from static cone penetration test
Cone resistance qc [MPa l 0 10 20 30
7N V degW = 0+--------------------i
mud
5
lll
~ C 0
c peat~
10
sand lll N 1D15
15l lD=1500mm
40=60
20l---------=-------__J
[ml
Fig 1 1 20 Pile No 3 and results from static cone penetration test
66 Cone resistance qc [MPa]
10 20 II 3 igt pound ~
mud+peat
fine sand+ silt
50=11
l lo-11oomm
40= 44
10
15l____________c
[ml
Fig 1 1 21 Pile No 5 and results from static cone penetration test
Section Cone resistance Pile
0 0
5 10 15 20 25 30 qc [MPa] -----~-~shy~
Silt
[7r_ ___~ Medium Sand_~-----l
0 ltD
+shy4
0=11
9=
Fine sand + Silt t
30p=
middotmiddotmiddotmiddotmiddotmiddotmiddotmiddot1~11+-----E-----
[ml
Fig 1 1 22 Pile No 6 and results from static cone penetration test
Cone resistance qcmiddot 1MPuJ
0 10 20 30 67 01-+-------l--------------i
mud+ peat
fine sand
l1)
N
40=60
15L_____________
[ml Fig 1 1 23 PiZe No 7 and resuZts from static
cone penetr ation test
Section Cone resistance Pi le
0 5 10 15 20 25 30 qc [MPa 1 --~----Y-~-----~
Silt
Fine sand
Medium Sand Bentonite2----1~i
t 3
4
0
0=15
Fine iii ~~= 5
sand t ltD
6 +
Silt 7
3Dp=
63 g
10
11
12
13+------=~---l
[ml
Fig 1 1 24 PiZe No 8 and resuZts f rom static cone penetration test
68
I =3
Cone resistance qc [MPa]
0 10 20 30
C 0 C Cl
(I)
Said
Peat
Sand
l 0=110
D = 11
4 D = 44
Fig 1 125 Pile No 9 and results form static cone penetration test
69
Cone resistance qc[MPa)
0 10 20 30 I ~ II JE Ill= II=E IS
Fine sand QI
U) I
[- I C 0 + C Peat QI
CD
Fine sand 0
Ci D = 1 1
L l D= 110
4D= 4 4
Fig 1 1 25 Pile No 10 and results f rom static cone penetr ation test
70
Cone resistance 9c[MPa]
0 10 20 30
Sand
C 0 Mud peat
+shyc 5 ltII
co
Sand Op= 11
u 10 D= 110 4Dp=44
Fig 1 1 26 Pile No 11 and results foIm static cone penetration test
71
00 a_ N ~
middotu rr QI 0 u ~ C 0
QI ui C iij 0 QI U - 0
0 EN
d 2
Sll 1lOl
C
u (rr
C 0 u~
0
QI - C middot 0 C
U - O 0 EN
~ 0 2
E
ltD a---==-lr---___--~---6-l_-0_012 ~ Lr- - --1---------J J
S9l ls= apound QI -0 gtcc _gmiddot- 0 1) ui I
Fi g 1 1 2 Piles No 14 and 15 and results f r om stat i c cone penetr ation tests
72
Contact pressure p [ MPa] 2 4 6
01lt---------------~
50
E E
111 100 ~ (qcp=30 MPa for No16
~ iqcp =49 MPa for No14
~ 1so~--~~- _ _ __
I _ _
11 I lf--q = 32 MPa for No15
cp
Fig 1 1 28 Results f r om load tests on piles No 14 15 and 16
73
0300--------------~---~--~--shyE
Driven piles in ~ 0 bull Gravel
amp250 bull Sand L QJ X Silt a 1l o Bored piles in
sand -sect 200 0=-- shyC ~ ~ 10 unless ~~ middot D shown 1
ii O
~ ~ o 3 a 1501-----+-------I- --+---laquo-+-- -+------lt
~ sect 5 - 6 6middot 100t----+----+-----_-1---4--__co_--J~__j
-_
~ 0 t7
C
a 50 2 shyg ~ gt
0 20 30 40 50 60
Standard penetration resistanceN in blows per foot
(N 30
Fig 12 1 Emperical relation between ultimate point resistance of piles and standard penetrashytion test in cohesionless soil (Meyerhof 1976)
14 r-------------------r-------b-----q
References and symbols given in Fig121
121-----+---+----+----+------ll------j
- _sect ~ 10t----+----+-_--1-----+---lt~--~H---- 0 lt-~5- _-)0 I() l- I Q---+-----I[08 ~
H -(l () ltj-~C X bulls pound 061------lt----+-----i~- --+-- shy
- bull
-gt Q1pound--I---L---L---L---L--~ 0 10 20 30 40 50 60
Mean standard penetration resistance N in blows per foot ( N30 l
Fig 122 Empirical relation between ultimate skin friction of piles and standard penetration resistance in cohesionless soil (Meyerhof 1976)
74
a) b)0(1 0lt2
10 10
05 05
1 N30OD-+---------__ OD--t-----r-----r----------------ll--Nbull30~ 10 20 30 10 20 30 40 50
Fig 1 2 3 Reduction coefficient a) for impermeable gravels b) form permeablr gravels (Weltman and Healy 1978)
psf [MPo)
Fig 1 2 4 Relation between ultimate point resistance and SPT in cohesionless soil (Polish specification 1975)
75
30 35 40 45 Loo Med Dense Ver dense
50
40
~ E
l)
g 8 1)
middotu
1 ~
QI- bull Touma ~ bull Koizumi
(183)-depth base middotameter5
20 40 60 00 100 N30
30 35 40 45
OG2(294) bull G1 (183)
300 bull us 59 ( 102) bull 88(180)
bull 075 a GT (467)
150
~ 200-+--------+-- t--- --t-----i 130i 0 094 081
014 _- --- -- shy~ E 066bull bull 063 Note -~ ~m~r~s~ ~ 1001---1-r--t---1point is xh QI Ratio ~ Number in ( ) middotn key is h c Ratio s ~
0 20 40 60 00 100
~ig 1 2 5 Ultimate point and shaft resistance versus N30
(Wr ight and Reese 1979)
-----
76
tu Psa
[kPa] [MPa]
200 tu
------ shy150 Psa
1 1
1100 10 1 1
1 50
0+----------T----~---~-N-3J~shy0 20 40 60 80
Relation between ultimate skin friction and SPT (Decourt 1982)
Fig 1 2 6
Psa
[MPa]
8
0----Meyerhof 1976) 0 7
--- - --~ - copy Polish Specifcoti on 1975)6 ~-
~
reg- middot - Reese (1978) middot 5
f41- -- Decourt (1982) -I bull 4 2
----==---______z__ h25m Dp=12m
3 ---shybull
2 7
--shy ----shy~----shy0-t----i----------r-- ----------------------N3l~shy
0 10 20 30 40 so 60 70
Fig 1 2 7 Relation between ultimate point re~istance of large diameter piles and standard peneshytration test (SPT) in cohesionless soil
------
77
tu [kPa)
200 17 Cast under -J bentonite
~----Meyerhof (1976) ~copy -=middotmiddotmiddotmiddot== middotmiddot150 ~------- Wei tman (1978 ) middot Healy middotmiddot ___ Japanese ) 119810 Society
(0 -middotmiddot- Decourt (1982)middot Wright
100
- -middotmiddot -- 11979]reg Reesemiddot Bored piles
~shy50 1 -- shy
-- shy middotmiddot s-shy - --~ ------reg~~ ---~E_==---- ------- shy
N_ ---shy0-+--C--------------r---- ---------~---~-~shyo 10 20 30 40 50 60 70
Fig 12 8 Relation between ultimate skin friction of piles and standard penetration test (SPT)
78
Pst [MPa]
8
7 ---------ist=7MPa
6
5
4
3
2
I N30o~------------------------------+---------__=-shyo 10 20 30 40 50 60 70
Fig 12 9 Relation between ultimate point resistance of large diamter piles and standard peneshytration test (SPT) in cohesionless soil (proposal)
tu [MPa ]
( excavanted and cast
150 under bentonite ) tu=150 kPa
100 tu=90 kPa
I I
50 I I I I I N30
10 20 30 40 50 60 70
Fig 1 2 10 Relation between ultimate skin friction of large diameter piles and standard penetrashytion test (SPT) in sand (proposal)
79
2 3 4 5 p[MPa] 0 2 3 4 5 p[MPa]0
40 40 Cl
80 c 80
c 120 120
Pile No 1 PileNo216 160
200 2
s s c [mm] (mm]
0 2 3 4 5 p[MPa] 0 2 3 4 5 p [MPa]
40 40
00 80
120 120
16 160 Pile No 3 Pile No 4
200 200
s s [mm] (mm]
0 2 3 4 5 p[MPa] 0 2 3 4 5 p [MAJ]
tgt11 tgt- measured40 40
80 80
120 120
Pile No 5 Pile No 6 160 160
20 200 s s
[mm) [mm)
Fig 1 4 1 Base resistance vs settlement appoximative method piZe No 1- 6
80
0 2 3 6 5 p[MPa) 0 2 3 4 5 p[MPa]
40 40
80 80 6
120 120 6
6160 160
Pi le No 7 Pile No 8 6
200 3J s s
[mm] (mm]
0 2 3 4 5 4 p [ MPo)
6 6 40
6 6
6 80
6 6
6
Pi le No 9 Pile No 10
XJO s s
[mm] [mm]
0 2 3 4 5 p[MPa] 0 2 3 4 5 p [MPa)
6 6
40 40 6 6
6
00 80 6
6
12 1Xl 6
160 Pile No 11 160 Pile No 12
200 200 s s
[mm ] [mm]
Fig 1 4 2 Base resistance vs settlement approximative method pile No - 12
81
0 2 3 4 5 p[MPa] 0 2 3 4 5 p [MPa]
6 6
40 6 40 6
6
80 6 80 6
120 6 120
Pile No 13 Pile No 141fO 160
200 200 s s
[mm] [mm]
0 2 3 4 5 p [MPa) 0 2 3 4 5 p [MPa)
40 40
80 80
120 120
HiO 160
200 200Pile No 15 Pile No 16
s s (mm) [rrrn 1
0 2 3 4 5 p[MPa] 0 2 3 4 5 p[MPa)
40 40 A A A-measured
680 80 t t
120 c 120 c
1fil Pi le No 17 160 Pile No 18
200 200 s s
[mm] [mm]
Fig 1 4 3 Base r esistance vs settlement approximative method pile No 13- 18
82
0 2 3 4 5 p[MPal 0 2 3 4 5 p (MPa]
D D40 40 c c
80 c 80 c
120 120
160 160
Pile No 19 Pile No 20 200 200
~ml (mm]
Fig 1 4 4 Base resistance vs settlement approximative method pile No 19- 20
LlJ QI
0 average lJ = 098 E sd = 029 C
6 SY = 030
4
2
lJ calculated ________________________ _______ measu red
06 08 10 12 14 16
Fig 1 4 5 Calculated pressure divided by the measured pressure at 20 mn settlement for aZZowabZe
q Zoad Pa= ~p approximative method pile
No 1- 20
8 3
Point resistance p [ MPaJ
a)
p(s) = s a +--sshy1 y qcp
1
SQ100p -- --- ---shy
~ s
[mml
I- 01 s rmm]-l p LMPa b)
f~]
c Cll E ~ i s
[mm)
Fig 146 Definition of the point resistance - settlement curve according to the modified hyperbolic method
84
01 ~ 0
20 0 0
0
16 0
medium 0 value a1 = 905-+ 256 Op 0 0
12 (r=039)
0 0
----0 0
8 0
0 0
0 0
4 0
05 06 07 08 09 10 11 12 f3 14 15 16 17 18 19 20 2 1 Op (ml
Fig 1 4 Initial slope of the base resistance curve vs pile diameter
a1 [p] 0
0020
16 assumed a 1= 28 - 4 qcp
12 0
0 Ct) 0 a = 2659 - 369 qcp8 1
0 0 (r = 0188)0
4
2 3 4 5 (MPa]qcp
Fig 1 4 8 Initial slope of the point resistance curve vs ultimate point resistance on the static cone resistance for pile tests No 1 20
85
a [~ 28
24
20
16
12
8
4
0 2 3 4 5 6 Qcp [MPa]
~ Kiosinski (1977) sand and sandy gravel of mediwn density
~ Klosinski (1977) loose sand ID= 0 3 0 4
o US59 ] t HH Touma p and Reese L (1974) fine sand and silty sand OGl (US59 HH BB - very dense Cl - mediwn dense) 1 BB
DIN 4014 Part 2 (1977)
Fig 1 4 9 Initial s lope of the point res istance curve vs ultimate point resis tance
86
assumed [il =30 -10 Op but )1~ 10 )1 [1 I
u 311-10 Op ( r =0 368)4 1 0
3 0 0
02 0
0 0co 0 8 0 0
0
0
05 06 07 08 09 10 11 12 13 14 15 16 17 19 20 21 Dp [ ml
Fig 14 10 Correction factor for hyperbolic base resistance shysettlement relationship
87
a [~] 28
24
20
16
12
8
4
2 3 4 5 qcp [ MPa]
Fig 14 11 Initial slope of the base resistance curve vs ultimate base resistance (proposal)
v [ 1 ]
3
2 -----G- DP J l 1J I Op lm] J
for Dp ~ 2 0 m ~ u = 1 01
0 --------r----r---r----r-----------------r-------------------------r------r-~-~--shy
05 06 07 08 09 10 11 12 13 14 15 16 17 18 19 20 21 Dp[m)
Fig 1 4 12 Correction facto r for hyperbolic base resisshytance - settlement relationship (proposal)
s P ( s)
s +
u qcp
88
a) b)1
bt=o212= 47 MPa a1=1~32 tMWJ s 2 3 4 5 O 1 10 20 30 40 50 60 p [~a]0
0p [ MPa] 40 40
80 80
120 ~
160 b1 = ~ajtg ~= 0 212
~=1132 + 0212middot s
mJ 240 r=0994t t t measured s __ according to Jl s
o o o according to p (bull ll l[mm] [mm]
Pile No 2
slmm) 10 20 30 40 50 60 80 100 125 150 175 2)0 225 Note
p [ MPa] 09 14 17 20 22 24 27 30 32 34 36 38 39
measured
pibull) [ MPa] 074 128 169 202 228 249 282 307 330 347 360 371 380calculated
plbullbull1[MPal 070 125 168 203 233 257 297 327 356 378 396 410 422calculated
1) (bull) ij l099082 091 099 101 104 104 104 102 103 102 100 098 097 sd = 006
ij (HJ1041) (bull10) 078 089 099 102 106 107 110 109 111 111 110 10B 10B sd = 010
plbulll-according to a =1132 [ Jp(s) = s s for pile No21 0 1132 12 39
plbullbulll-according toa =1241 lmiddotGcp=39MPa1 0
~=14 see fig 1411 and fig 14 12 sp(S)=
124+ _ s_ 14middot39
11lbulll11l-J - correlation coefficient calculat~d P5 for
measure p s p(bull) and p(bull) respectively
Fig 1 41 3 Modified hyperboZic point resistance - settZement reZationship for piZe No 2
89
0 2 3 4 5 p(MA1] 0 2 3 4 5 p[MPa)
40 40
80 A 80 A
120 120
160 16 Pile No 1 Pile No 2
20 200 s s
[mm] rnm
0 2 3 4 5 0 2 3 4 5p [MPa] p [MPo]
40 40
80 80
120 1ZJ
lfpound) Pi le No 3 Pile No 4 A
200 A
s s A
[mm) [mm
0 2 3 4 5 p [MPa] 0 2 3 4 5 p [MPa]
40 40 A A A measured ~ calculated
80 80
12
160 160 Pi le No 5 Pile No 6
200 Z)Q
Fig 1 4 14 l3ase resmiddotistance vs settlement pr oposed method pile No 1- 6
90
2 3 4 5 p [MPa] 2 3 4 5 p [ MPa]
40 6
6 40
1 80 80
6
120 120 6
6 160 160
Pile No 7 6
200 200 s
[mm ] s
[mm]
0 2 3 4 5 6 p [MR] 0 2 3 4 5 p [MPa] 0 0
40 40 6
6
80 80
6
120 120
160 160 Pile No9 Pile No 10
200 200
s [mm] [msml I
0 2 3 4 5 6p[MR] 0 2 3 4 5 p [MPa]04--___ ____ ___ ___ ____
0+-=---------------~-~- shy
40 40 c 6 c - measured
0--0-0 shy calculated
80 80
120 120
160 160 Pile No11 Pi le No12
200 200
s [mm]
s [mm]
Fig 1415 Base resistance vs settlement proposed method pile No 7-12
91
0 2 3 4 5 p [MPal 0 2 3 4 5 p [MPa)
40 40
80 80
120
16 Pile No 13 Pile No 14
200 s
tnml [mm]
0 2 3 4 5 p [ MPa] 0 2 3 4 5 p [MPa)
40 40
80 80
120 120
160 1fD
Pi le No 15200 axJ s s
[mm] [mm]
0 2 3 4 5 p[MPa] 0 2 3 4 5 6 plMPa ]
A A A measured40 0---0-0 calculated
80
120 120
160 1ED Pile No 17 Pi le No 18
200 200
s s [mm] [mm]
Fig 1 4 16 Base resistance vs settlement proposed method pile No 13- 18
92
0 2 3 4 5 p [MFb] 0 2 3 4 5 p[MPa]
0 6 o -measured40 40 0 0 o -calculated
80 80
120 120
160 160 Pile No 19 Pile No 20
200 200 s s
[mm] [mnil
Fig 1 4 17 Base resistance vs settlement proposed method pile No 19-20
p(s~Psf
15 20
ean
-C 5 w u L Lower ~ confidence
linea 0
a IJl 10
o---o proposed
method I I I
15
Fig 1 4 17a Design curves for estimating developed base resistance in sand (Wr ight and Reese 1979)
93
n (number)
30
28
26
24
22
20
18
16
14
12
10
8
6
4
2
0 02 04
Fig 1 4 18
I= 126
Between 1] = 0 7 - 1 3--- I= 106 ( 84 frac34)
Average ~ = 098 Standard sd =023 deviation
Standard sv =023 veriation
1] (Coefficient Calculated Measured
06 08 10 12 14 16 18
Calculated pressur e divided by the measured pr essure for all pressure - settlement curves pr oposed method pile No 1- 20
94
a) b) Total load
Total load curve
---- _____-- shy- -- -Base load ~- Base load
-0-0 ~
00 00 J
ldeoli zed shaft load J
Shaft sesistanc1---------- 0=0middot30 a= 0 middot 30
025 Settlement IN 025 Settlement IN
Fig 1 419 Proposed method of synthesizing design loadsettlement curve (a) conservative design prodiction b) design prediction- peak in shaft loadsettlement curve (Burland et al 1966)
Cf
-0 0 0
J
0
~-----~--~-~ amp- 2 3 4 5 6 (cm)
a~middotltii -0 lt) cco2 41 -~ -0 1)
vi ~ llloli=----------- ---c~0 1 2 3 4 5 6 7 ( of diameter)1 1 1 1
05 10 15 20 ( in) for 30 in Pile Movemen~ ( 75cm pile)
Fig 1 4 20 Approximate load settlement curves for 30 in bored piles (AB and C represent failure load at 1 in settlement A B and C represent ultimate failure load) (Touma and Reese 194)
95
Load in MN 0 2 3 4 5
25
50E E C
-C 75
-~ ~
-Z 100 lJ
Shaft resistshy
125 once
15 Fig 1 4 21 Load-settlement relationships for largeshydiameter bored piles in stiff clay (Tomlinson 1977)
SettlementSo
Fig 1 4 22 Diagrams of s1iaft and base resistances versus settleshyment assumed in analysis (Kiosinski 1977)
96
0 0 1 ~ r- 025g ~~ 2
1- -shy3 03Sg 14 5 2
Qls =Qpls+Q5 (sQpls) Qs(s-3E
0
degsis __ -- Qpls) a~ C
4
t Sg l
5 Qu Is)
Q(s)in MN-l T
Ouls Q Is) in MN ---
Fig 1 4 23 Construction of load - settlement curves a) for sand b) for cohesive soil (DIN 4014 Part 2 1977 and Franke 1981)
-
s C 5C
Cl
3 0 00 05 10 15 20 Mean settlement I in)
Fig 1 4 24 Load- settlement curves for test shaft S4 (1 in = 25 4 mm 1 ton= 8 90 kN) (Reese 1978)
97
Relative side resistance
0 05 10 15 20 0E=--t----+---+--~
c QI lt) ~ 2 C
I itaker c
QI amp Cooke3E QI-j
c-en 4
C QI
E us 59o
5 QI gt
SA0 w 0 6
Fig 1425a Relative side resistance for clay vesus relative midlength settlement (Reese 1978)
degs (Osl u l t 0 05 10 15 2 0
Mean
2 Lower ~ C QI u
confidence line
~ 3 a
0
~4 E
()
5
6 __ _ ______ ________ __1
Fig 1 4 25b Design curves for esti mating developed side resistance (~Jy1nht ReertP- 1987 J
98 Load Q
8 - 15 mm
1- 2 of p ile diameter
100-200 10-15 of pile Os Ot diameter Shaft Total
Settlement S Resistshy Resist- Load ance once
Fig 1426 Dependence of total load base resistance and shaft resistance on settlement of lar-ge diameter pile (Tejchman Gwizdala 1979)
6
5 Shaft load
4
3
2
z ~
-0
g Pile EF- 56 J 0
0 0 20 30 Butt settlement (mm)
Fig 1 4 27 Deveiopment of shaft and base resistance with settiement (Promboon Brenner 1981)
99
0 1000 2000 3000 4000 5000 6000 7000 8000 9000 0 r-=-1---J__-----------------------~----_shy
Load [ k N l5
10
20
( I
Skin friction ----1 I I
~ 40 QI E
fQI
50 I
Q) I () ICOntinuos fost deolading
Fig 1428 Load-Settlement-Diagram Testelement III (Diaphragm-Wall 0515 m 244 m deep) Portion of Skin Friction and Base Resistance (Prodinger Veder 1981)
Qs (QJ max
0 05 10
Upper Limit of Data
Farr and Aurora (1981J C
~ 2 - shy -+shy - Mean of Data
I QI
Lower Limit of Data a
0 - 3 E
Vl
4
Smid = Approximate shaft buff movement ignoring the elastic compression of upper halt of the shaft
D = Shaft diameter
Q Mobi Ii zed shaft resistance
Qs1max = Maximum shaft resistance
Fig 1 4 29 Relative shaft resistance vs relative movement (Farr and Aurora 1981)
100 Load Q (s) [ MN]
Su5 s s 20 mm for non- cohesive soil u
s s 10 mm f or cohesive soil u
s s 15 mm for claysand u
Q (s) + Q (s)s p
Qs(s)
-C ltII E s ~- [mm]-ltII IJ)
Fig 1 430 Dependence of total load Q(s) point res i stance Q (s) and shaft resistance Q (s) versus settlement p s
~ 3 Usu Qpu Qu Q(s) [ MN]
Sus= 20
1J
60
80
100
120
degs (s ) 140
5 P=Ol Op
1EO
C -ltII E 180 ~ ] 200
s [mm]
Approximative dependence of total load point resistance and shaft resistance versus settlement fny non-cohesive soil
Fig 1 4 31
101
113 3 ~fic0P Ye hY
1 Ground water
D
I y
yh C
Fig 1 5 1 Determination of 01 and 03 for settlement analysis of lar ge diameter bored piles
102
I
E=Et [MPa]
160 0
140
120 0
100
80
6
40
--- --shy 0
0
8 0
0
0
20
2 3 4
I 0 15
Fig 1 5 2
E = Et [MPa]
120
100
80
60
40
I I 0 35 065 085
0
Et= 17 81 qcp0844
( r = 0 128)
5
100
6 qcplMPo]
Calculated values of Young s modulus for piles No 1shy24 according to equation 1 5 2 and 1 56
0
0 0
E =898qcp127 (r= 0314)
E = 9 middot qcp 13 0
20 shy 0
0 0
0 1 2
loJ
I 0 35
3 I
065
4
I 085
5
100
6 qcp [MPo]
Fig 1 5 3 Calculated valueBof Young s modulus for piles No 1shy24 according to equation 1 5 4 and 1 5 6
I K 10 3
( 1 ] 1832
1400 0
1200 0
0
1000 0
800 0
m=2821 qcp0621
600 0
(r=0057)
400 0 0 0 0 0
200
2 3 4 5 6 qcp (MPa]
I 035
I 065
I 085 100 Io
Fig 15 4 Calculated valuesof the dimensionless compress ion modulus K for piles No 1- 24 according to equation 1 5 2 and 1 56
K ( 1 ]
0
1400
1200 0 0
1000
800
600
0
0 0
0
0 0
0 K= 1422 qcpl05
(r=0181)
0 K= 150 qcp
400 0
3)0 0 0
2 3 4 5 6 qcp(MPa)
I I -J 035 065 085 100 Io
Fig 1 5 5 Calculated values of the dimensionless compression modulus K for pile~ No 1-24 according to equation 1 5 2 and 1 5 6
104
120
100
2 3 4 5
I I I rv 0 15 035 065 085 100 lo
Bergdahl (1982) for shallow foundation
o----o Bozant Masopust (1981) D= 1 0 rn h=10 rn large diameter bored piles in noncohesive so il
0----0 Proposal according to current anal ysis
Klosinski (1977) D=090 to 125 rn large diameter bored piles in sand and sandy grave l
Mitchell Gardner (1976) very dense sand E=(35)q (it depends on sand density and stress history) c
Fig 1 5 6 Composision of Young s moduius
105
TABLES
0 Tab 1 11 Methods for detemination of the bearing capacity of bored piles (Ro llberg 1977)
Cl
Nol -- I Soil Areas of Q) Q) Editor Determination of Coefficients 5 type influenceqP qs p ~ C C 11 12 fP I fs
1 all Lab f Soil Mech (1936) l qp at the elevashy 1 0
2 all Huizinga (1951) ~ t~on of the pile 14 point
3 all Van der Veen (1953) ) 18 1 h+l14 all Van der Veen 1 0 Dpl375 D~ 15-- J qcmiddotdhBoersma (1957)
~ 11 +12 h - 12
5 12 all Menzenbach ( 1961) qc at the elevashy~ tion of pile point
6 18 all Mohan Jain Kuman (1963)1 average of qc over 1 h Q) h ~qcmiddotdhl 10 Dpj 3 75 Dj 15 50_micro
and 1 2C 11
7 I amp all de Beer ( 1964) graphically from 10 Q) qc 0 1 h+l18 u C
sand Soviet norm SNIP II 9ct9cp I4 bull O Dp I10 DP l66-1 083shyu clay B5- 67 Trofimenkov (1969) 2 50 1 251 +l J qc middotdh micro middot h middot-l l 2h-~ _micro
9 _micro u all Paproth (1972) at the elevation 3 5 I shy
) of pile point (Dpgt0 5 m 7 D8DpE
E-lt p 1 h+l1 1 h Dplt 5 m u l+l J qcmiddotdh h f qcmiddotd~ 30 Dpl 50 Dp 2 0 100shy10 sand Norwegian method
0l 2 h-12 200Senneseth (1974)
11 lall Soviet method h+l (20-0lqgl - 101 1 q middotdhTrofimenkov (1974) -- f C UpUsmiddotQct
l1+l2 h - 1212 Qct-Qcp 40 D~ 10 Dp 1 33- 0 67shyUsbullh 4 00 2 50
13 English method 10 DFJ 375Dp 10 I
Rodin Corbett Shershywood Thorburn (1974)
3 7 5 Dcl 8 0 DP 10h+l1 _1_ J qcmiddotdh 1 h
qcmiddotdh 20011 +12 h - 12 hb
1 h qcmiddotdh 150hf
0
Observations
fp I f (qp)fs C
Dp E = 1 cm Qbu = 2 Qpa (approx )
s fs=f (qc)
q=~g Us 0 h
fp=f(q~)
fs=f(qgl
bull fine grained non- cohesive soil loosely packed
bull fine grained non- cohesive soil medium dense comp
fine grained non- cohesive soil
Tab 111 (cont)
h+h bE 14 non-cohe- Meyerhof ( 1956 poundti J N 3o middot dh CtME fN3 o dh 1 0 DP 4 0 DP 10 100 etM= l 2
sive soil 1976) lJ +12 h - li hE o hgp taken into consi der ~ Ul (I)
E-lt
C 0
~E = 1 kgbull 30 cm
(statistical limit depth of the pile) hE - clamping length of
pile micro rrJ l-l micro (I)
15 C (I) p
sand Norwegian method
- irm - - - 10 IT
m = diagram O l-l Senneset (1 974) rrJO C
16 rrJ micro gravel English meth it 3 middot N30 - - - 10 - Jf 3 + diagram U) ~
E-lt p U)
iiouiu Coruett Sherwood Thorshyburn (1974 )
(NJQat the elevashytion of pile point1
0 -i
108
Tab 11 2
Results of calculati o n of p i le point load pile shaft load and total pile load from static con e penetration test (Rol l berg 1977)
~ gt
~ gt Ultima te Ultimate Ult imate
No Method micro micro poi nt skin bearing 080lt17nlt1 50 Q) -l
-l middot-i resistanceuro resistance r esistancE
middot-i p 0
(J n1 n n2 n n3 n n1 n2 n3
1
2
Lab fSoil Mech
Hu izinga (1951)
(1936 ) 430
307 i 3 Van der Veen (1953) 239
49
4
5
Van der VeenBoersma
Menzenbach (1961)
(1957) -l middot-i 0
2 4 7
1 57 1-CJ)
6
7
8
Mohan Jain Kumen
de Beer (1964)
Sovi et Norm (1969)
(1963) CJ) Q)
-l middot-i 0
lJ Q)
Q)
gt- CJ) Q)
c 0
2 44
1 37
183
47
t I
49
487
0 18
47
16
3 02
0 85 1
47
16
137
08
9
10
Paproth ( 1972)
Norw Method (1974)
~ 0
0
u I
C 0 C
1 8 1
180 l 46
1- - -_L~ 46 167 46 1 19
1 1 Soviet Method ( 1974) [1 1 41 46 1 62 13 083 13 1 14 0 8
12 Engl Method (1974) 2 66 35 128 35 2 30 35 1 28
Note
cal Q a) n = --- mean value of the rat i o between calculat ed pile loads and those n Q determined f r om loading test
b) n = number of piles
109
Tab 113
Point resistance of large diameter piles (DIN 4014 Part 2 1977)
Settlement Point pressure 1 Factor -fshy
(cm) (MPa) cf=lOMPa I i=15 MPa C C
Piles without enlarged base
1 05 005 003 2 08 008 005 3 11 0 11 007
15 34 034 023
Piles with enlarged base
1 035 0 04 002 2 065 0 07 004 3 0 90 009 006
15 2 40 0 24 0 16
Note 10 lt qp lt 15 (MPa)C
Tab 114
Skin friction resistance of large diameter piles (DIN 4014 1977)
Strength Static cone pen- Depth below Skin frict ion Factor of sand etration resist surface
(MPa) (m) (MPa) fs
Very small lt 5 - 0
Small 5 to 10 0 to 2 0 2 to 5 003 ln6 to 333
gt 5 005 100 to 200
Medium I I 10 to 15 0 to 2 0 I
I 2 to 7 5
gt 75 I 0045 0075
222 to 133 to
333 200
High I I
i
l
gt 15 0 2
to 2 to 10 gt 10
I I I
I
i
0 006 0 10
gt gt
250 150
Note Skin friction is assumpted as linear until s =2 cm and constant for s gt 2 cm
11 0
Tab 115
Values of the inverse of the point resistance factor (Bustamante 1982) fp
Soil type qPC I 1
Factor - shyfp(MPa)
for piles group
a) Silt and loose sand lt 5 0 40 -b) Moderately compact
5 - 12 040sand and gravel
c) Compact to very gt 12 i 030compact sand and gravel I
Tab 116
Values of the shaft resistance factor fs (Bustamante 1982)
Factor fs
Soil type qs
C Category I(MPa) I A I B I II A III BI
I a) Silt and loose lt 5 60
i 150 I 60 I 120-
sand
b) Moderately corn- I pact sand and 5 - 12 100 200 100 200 gravel i
Icl Compact to very
compact sand gt 12 150 i I 300 150 I 200I
I I and gravel i
I
111
Tab 117
Point resistance factor (proposal)
-
1-fp
qc (MPa)
Gravel
Coarse sand Medium sand
Fine sand Silty sand
25
080
0 70
060
5 0
0 65
055
047
75
054
045
039
10 0
045
036
031
150
035
027
022
200
030
0 23
018
Tab 118
Shaf t r e sistance factor (proposal)
fs
qc (MPa)
Gravel
Coarse sand Medium sand
Fine sand Silty sand
25
80
100
130
10 0
120
150
190
I 200
180
230
300
11 2
Tab 119
Calculated values qcp
for large diameter piles
Pile Literature Length Diameter (m) Measured p Cr1 lcul Settlement Note Authcr(year) No (ml D Dp (MPa)
(s=0 10Dp) (MPa)p ~~JL__
s s ()(mm) Dp
1 Franke (1977) 1 13 11 36 38 117 106 Garbrecht
2
3
2
3
13
14
11
15
1 58 36
37
38
40
215
185
136
123
) qg accord to Franke
4 4 13 15 204 3 2 33 220 108 and Garshy
5 5 6 11 33 35 127 11 5 brecht (1977)
6 6 6 11 153 36 35 146 9 5
7 7 6 1 5 34 35 158 105
8 -shy 8 6 15 2 1 41 3 0 109 52
9 10 9 11 39 52 47
10 11 95 11 43 35 77 70
11 12 9 11 49 66 60
12 13 10 11 15 5 1 4 0 77 5 1
13 14 9 11 1 5 4 8 46 115 77--shy14 Pranke ( 1973) 15 115 18 4 9
) ) average 88
15 13$ 13 5 1 3 19 -2 5 3 2 sd=3 0
16 - - 165 16 5 13 19 30 sv=0 34
17
18
Spang (1972)
llXJ
V90
6 6
6 75
0 7
09
3 2
4 2
32X
42X
x) s =0 10 D p
19 VlaJ 720 1 2 39 3 9X
20 - - VlsJ 6 5 1 5 3 0 3 ox
21 Touma and US59 9 9 o 76 8 0 Reese ( 1977)
22 HH 75 0 61 8 0
23 Gl 180 091 - 2 5
24 BB 137 o 76
sd = standard deviation
sv = standard variation
Tab 1 2 1
Ultimate point resistance coarse and medium sand psf (MPal (Pol ish Specification 1975)
Depth h
Medium sand r = 0 40 N = 200 30 Base diam (Op) and depthbase diam (hDp)
Dense sand r 0 Base diam (Op)
= 0 80 = 50N30 and dpethbase diam (hDp)
(ml Dp = 0 6 m Dp = 1 0 m Dp =12 m Dp = 1 5 m Dp = 0 6 m DP = 10 m DP = 12 m DP = 15 m
Psf hDp Psf hDp Psf hDp Psf hDp Psf hDp Psf hDp Psf hDp Psf hDp
5 10 83 0 85 5 0 075 42 07 33 20 8 3 16 50 14 42 13 3 3
7 14 11 7 1 2 70 11 5 8 10 4 7 2 8 11 7 22 70 2 0 5 8 1 8 47
10 18 16 7 15 10 0 14 8 3 1 3 67 35 167 28 100 2 5 83 2 2 67
15 18 250 18 15 0 16 12 5 15 100 4 2 25 0 3 4 15 0 30 125 27 100
20 2 4 333 2 0 200 185 167 1 7 133 4 7 333 3 8 200 33 167 30 13 3
25 26 41 7 2 2 25 0 20 208 19 167 5 0 41 7 4 0 250 3 5 20 8 3 2 167
w
11 4
Tab 131
Partial safety factors for resistance to axial load for bored piles (Wright Reese 1979)
Partial safety Normal Poor factor for control control
Unit skin resistance 1 70 185
(no load test)
Unit skin resistance 160 1 70
(from load test)
End bearing 165 180
Tab 1 3 2
Probability of failure of bored piles under normal design conditions (Wright Reese 1979)
Probability of Factor of Structure failure safety classification
5 10-3 25 monumental
210shy 22 permanent- 2
5 middot 10 2 0 110shy 1 85
temporary 5 bull 10-l 165
11 5
Tab 133 Results of field tests (Tejchman Gwizdara 1979)
L
II C C C 0 0 0
micro micro
micro micro micro For universal safe~y F2u u CUNo micro C C ~ ~g~ middot- C
~ Permisible micro micro i ~c -i micro
cmiddot-~ micro~ L
micro oo ~ load ~t~ ~~ omicro micro ~ ~ 3Z~ ~ ~ micro
-~~
~ e ~ --middot--
middot- ~ obull 0
~ g ~~ ~~ ~
~ L
o Jl i5 sect~ =gt L Q~ = yen t p Qp Qp
D h Q~ Srrx s tm p s E~ iQ~lQ~cm ~~ KN X ll1l kPa kPa kN kN kN Jl ~e ~ 1 2 3 4 5 6 7 8 9 10 11 12 13 14 15 16 17
1 70 6 60 4081 1550 2531 38 0 1182 10 4040 175 2041 245 1796 632 141 120
2 90 6 75 5082 3041 2041 598 1785 10 4782 107 2541 1079 1462 282 140 42 5
3 120 720 7259 4041 3218 557 1035 10 3576 119 3630 2158 1472 187 2 19 594
4 150 650 8643 4454 4189 51 5 928 20 2521 136 4326 2158 2168 3 10 166 253
5 130190 195 7750 3011 4709 392 805 10 1075 - 3875 981 2894 3 10 166 253
6 130190 165 9516 5101 4415 536 522 20 1800 - 4758 1962 2796 260 158 412
7 130190 135 8044 5199 2845 646 114 4 15 1834 - 4022 2109 1913 2 47 149 524
8 180 115 11380 4415 6965 388 792 15 1735 - 5690 2747 2943 161 2 37 483
9 76 980 6867 4316 2551 628 110 13 9529 109 3534 1128 2306 383 111 32 8
10 61 7 60 7161 2747 44 14 383 67 15 9404 303 3581 392 3188 700 169 109
11 92 180 4807 883 3924 184 20 8 1329 76 2404 196 2207 450 178 82
12 76 24 5 6769 736 6033 109 20 8 1623 103 3385 147 3238 500 186 43
13 76 137 5396 2060 3336 38 2 63 8 4535 102 2698 589 1109 350 t 58 218
14 120 23 5297 1854 3443 35 0 960 10 1640 39 2649 196 2453 945 130 7 4
15 135 16 7 13489 7554 5935 560 181 10 5260 83 6749 2060 4689 367 127 305
16 170 46 0 8829 2943 5886 333 17 10 3466 39 4415 1373 3042 2 14 1 94 31 1
Average Fi 387 166 Standard deviation Sd 2 1 5 034 Standard variation sv= 0 56 0 20
1234 Spang1972 567 8 Franke 1976 9 10 111 2 1 3 Touma Reese 1974
14 Colombo 1971 15 Kerisel Simons 1962 16 Appendino 1973
11 6
Tab 134
Results of model
SafetyScheme factor
medium F ssand
F p
loose F s
samd Fp
F 3 55 sd _P F 1 32 sd
s
tests (Tejchman Gwizdara 1979)
Diameter D (mm)
30 60 90 133
145 129 108 112
280 3 08 307 294
140 154 153 112
594 3 04 324 426
107 sv 030
0 19 sv 0 14
117
Tab 135
Individual safety factors according to literature
Literature proposal ofLiterature individual safety factor
Fs Fb
Polish Specification (1974) 100 250
Tejchman Gwizdala (1979) 150 400
Bustamante Gianeselli 200 300 (1982)
Decourt ( 1982) 130 400
average 145 3 38
TAB 141 0)
Load settlement curves - measured
Pile No
Settlement 1 c 3 4 5 6 7 8 9 10 11 12
s p s p p s
p p s P
p s P
p s p p s
P p s
P p s
p p s p p S
p I i p s
p p s p
mm MPa rrrn lifl5a MPa mm
lifl5a MPa
mm lifl5a MPa mm
RPa mmMPa nwa MPa mm
RPa MPa mm RPa MPa mm
RPa MPa mm RPa MPa mm
RPa MPa mm RPa MPa mm
RPa 10 045 222 09 1 1 05 20 07 143 06 167 08 125 0 5 20 08 125 10 100 08 12 5 15 67 16 63 20 092 21 7 14 43 08 25 10 20 0 1 1 182 12 167 0 9 22 2 12 167 18 111 14 143 24 83 22 9 1 30 125 240 1 7 I 7 6 1 1 273 1 2 250 14 214 15 200 1 2 250 15 200 25 12 0 19 15 8 30 100 26 11 5 40 1ti 250 20 10 0 14 28 6 14 286 1 7 235 18 222 1 4 286 18 22 2 3 2 12 5 23 174 36 111 3 0 133 50 20 250 22 ~27 1 7 294 1 5 333 20 250 2 1 ~38 1 7 294 1 9 263 37 135 27 18 5 4 2 11 9 33 152 60 2 2 273 24 ~5o 20 300 1 7 353 23 61 22 ~73 18 333 21 286 43 140 30 20 0 46 13 0 36 16 7 80 271 295 27 796 24 333 20 400 27 ~96 25 1320 22 364 25 32 0 53 15 1 36 222 41 195
100 322 31 1 30 333 28 357 22 454 31 1323 29 345 26 385 28 357 60 16 7 40 25 0 45 22 2 125 38 329 32 391 32 391 25 500 32 139 1 30 41 7 32 39 1 4 6 272 48 ~6 0 150 14 2 357 34 1441 36 41 7 27 555 36 ~1 7 34 44 1 36 41 7 175 36 486 39 449 30 583 38 ~61 38 461 200 38 526 42 476 32 625 225 39 577 33 682
(mmMPa) ( 1 MPa)
1
1=2074
t 1=O ~01 =0 98S
a1=1132
b1 =0 212 V =0994
a1=2217
b1=O 131
V =Q 978
a1=1860 b1=0233
V =Q966
a1=1562
b1=0174 V =Q983
a1=1382
b1=O195
V =0975
a1 =20 37
b1 =C 174
V =0957
a1=1443
b1=(l 193 v =O 961
a1=965
b1= 0071 V =0 990
a1=1 91
b1 =o 128
V =0 993
a1=5 83
b1=C124
v =O 981
a1=6 1 4
b1=01 64 v =U 985
li(MPa) ~9 4 7 76 43 57 middot5 1 57 5 2 141 78 81 61 cp (MPa) B8 39 40 33 35 35 35 3 0 39 3 5 49 40 __Ef ~-6 1 2 1 9 1 3 16 15 16 1 7 36 22 16 15 qcp
TAB 141 (continue) Load settlement curves - measured
Pi le No 3ettlement 13 14 15 1 17 18 19 20 21 22 23 24
s p s T5
p s T5
p s T5
p s P
p s P
p s P
p s P
p s P
p s T5
p s T5
p s p p s
p mm MPa lll1l
HPa MPa mm HPa MPa mm
fWa MPa mm fWa MPa lll1l
HPa MPa mm HPa MPa mm
MPa MPa lll1l NT5a MPa HPa MPa 111111
HPa MPa 111111
HPa MPa 1)1111
mra 10 1 7 59 075 133 06 167 075 133 ~95 105 09 11 1 07 143 3 76 1 7 59 08 133 10 100 20 2 4 83 130 154 095 21 1 1 15 17 4 1 75 114 16 125 12 167 ~7 74 33 6 2 1 3 15 3 1 9 103 30 29 103 1 7 176 1 2 250 15 200 r55 118 22 136 16 18 8 38 79 46 66 1 7 182 27 110 40 33 12 1 20 200 1 35 29 6 1 75 229 ~O 133 26 154 175 229 49 82 58 6 9 1 9 21 1 35 115 50 36 139 235 21 3 145 34 5 1 95 256 24 208 ~-4 147 28 17 9 20 250 gt8 86 6 9 72 2 2 233 4 2 11 8 60 39 154 265 22 6 1 55 387 2 15 279 28 214 ~6 16 7 30 120 0 2 2 27 3 o 8 89 80 7 5 2 3 262 80 43 186 31 258 1 7 47 1 36 222 14 05 198 33 124 2 25 320 B 1 98 25 327
100 45 222 18 556 39~ 253 ~-5 222 36 1278 27 370 ~8 113 125 47 26 6 20 625 42 29 8 149 255 28 1446 t50 22 682 3 0 500 175 200 225
(mmMPa) a1=479 a1=1206 a1=14 51 a1=1113 a1=1406 ~=836 a1=843 a1=1176 ~=64 a =561 a1=10 0 a1=9 5 (1MPa) b1=0175 b1=0 178 b1=0 382 b=0287 b1=O 119 p 1=0 137 h1 =o 193 b=0258 p1=0 049 b1=0032 b1=0 276 b1 =0 048
hf (MPa)
v =0998 57
v =0-987 5 6
v =0989 26
v =0992 35
v =0933 Iv =0991 84 73
v =0993 5 2
v =0998 tJ
3 9 =0944 v =0998 v =0996 v =0981
qcp (MPa) 46 39 32 30 32 14 2 39 30
lL 12 1 1 08 12 26 1 7 1 3 13 qcp
lD
N 0
TAB 142
Calculated point resistance curves
Setlement (mm) p(s)
1
n p(s)
Calculated value of the p(s) for pile No
2 3 4 5
n p(s) n p(s) n p(s) n p(s) 6
(MPa)
n p(s)
7
n p(s) 8
n p(s) 9
n p(s)
10 20 30 50 80
100
150 200 225
070 128 177 253 335
375 446 493
157 140 141
127
123
1 16 106
070 1 25 168 232
297
327 378 410
422
078 089 099 1 06
1 10
109 1 11 108
108
073 1 30 176 246
315 349
405 441
146 163
160 145
1 32 125
113 105
056 096
1 26
167 205 222
249 265
271
0 80 096
105
1 11 100 101
092 0 83
082
065
118 162 233
308 345
412 456
108 108
1 16 116 114 111
064
1 12 151 2 10 2 69
298
346 3 76
078 P63 093 tt 13 101 tt 53 100 I 13
108 ~75
103 ~04 096 ~ 55
~ 87
1 26 125 127 126
125
1 17 1 04
052 088
1 15 153
188 2 03 227 242
065 0 74
o 77 0 81 0 75
0 73
063
072 122
1 83 262 347 388
463 5 11
073
0 74
073 0 71 0 65 065
064 1 18
162 233 309
3 46
41 3 4 57
Dp (m) 1 1 Qcp (MPa) 38 (mmMPa) h2 8 1 1 9 Qcpbullv1(MPa) 72
158
39
124 14 55
15
40
n20 15 60
204
33 148 10 33
1 1
35
tt 4o 1 9 67
1 53 3 5
tt 4 0 1 5 51
15
13 5
114 0 15 i-gt 3
2 1
30
tt 6 0 10 3 0
1 1
3 9
12 4 1 9 74
1 1
3 5 h40
1 9 67
Note n = condition coefficient calculated p(s) measured p(s)
10
n
081
084 0 85 0 86 0 85
087
TAB 142 (continue)
Calculated point resistance curves
Calculated value of the p(s) for pile No (MPa) Setlement 11 12 13 14 15 16 17 18 19 20
(mm) p(s) ll p(s) n p(s) ll p(s) n p(s) n p(s) n p(s) n p(s) n p(s n p(s) n
10 106 070 0 71 045 091 054 099 1 32 055 092 053 070 060 081 085 0 72 080 055 078
20 1 90 079 130 059 160 067 1 70 1 30 096 101 091 079 1 12 148 085 1 31 082 098 082
30 258 086 1 76 068 2 15 074 222 1 31 1 26 105 120 080 156 205 081 180 082 132 083
50 363 086 246 075 297 082 296 1 26 1 70 117 161 082 228 095 295 087 256 0 91 184 092
80 471 316 o 77 3 77 088 364 1 18 2 1 o 1 24 199 308 085 393 097 336 1 02 237 095
100 522 349 078 415 092 394 228 1 27 2 16 348 088 442 098 375 104 262 097
150 611 405 479 443 258 117 244 423 529 443 304 101
200 669 441 518 473 276 261 474 587 488 331
Dp (MPa) 1 1 1 5 1 5 18 1 9 19 070 090 12 15
qcp (MPa) 49 4 0 46 49 32 30 32 42 39 30 12 a1 mmMPa) 84 h20 96 84 152 160 152 124 160
IV1 1 9 1 5 15 12 11 1 1 23 21 18 15
qcpmiddotv1 (MPa) 93 60 69 59 35 33 74 88 70 45
- 12287 average = ~ = 098
standard deviation sd = 023 standard variation sv = 023
N
122
TAB 143 Ultimate settlement for shaft resistance - summing up
Ultimate settlements (mm)Literature sand cohesive claysand
soil
Burland Butler Dunican (1966) 7
Touma Reese (1974) 10 Tomlinson (1977) 10 Klosinski (1977) 8
Francke Gerbrecht (1977) 20-30 DIN 4014 part 2 (1977) 20 10 Francke (1981) Reese (1978) (1979) 05-2 of 05-2 of Farr Aurora (1981) shaft dia~ shaft diam
5-20 mm 5-20 mm Tejchman Gwizdala (1979) - Spang (1972) 10
10 10 20
- Francke (1976) 10 20 15 15
- Touma Reese (1974) 13 8 15 8
8 - Colombo (1971) 10
- Kerisel Simons (1962) 20 - Appendino (1973) 10 Promboon Brenner (1981) 10 Prodinger Veder (1981) 12 Decourt (1982) 10-15 10-15
-average s = 14 1 10 126
standard deviation sd = 53 2 1 47
standard variation sv = 038 021 037
123
TABLE 14 4 Al l owab l e base resistance versus sett lement
Pile Li terature ength Diameter (m) Calculated qcp=qcp Settl ement Fp-3- sa (mm)No Aut hor No (m) D DP qcp (MPa) for qcp3(MPa)
1 Francke ( 1977) 1 13 11 38 127 25 Garbrecht
II2 2 13 11 158 39 130 19
II3 3 14 15 40 133 33
II4 4 13 15 204 33 110 23
II5 5 6 11 35 117 22
II6 6 6 11 153 35 117 19
II
8
7 7 6 15 35 1 17 25
II 8 6 15 21 30 100 21
II9 10 9 11 39 130 13
II10 11 95 11 35 117 15
II11 12 9 11 39 163 11
II12 13 10 11 15 40 133 7
II13 14 9 11 15 46 153 9
14 Francke ( 1973) 115 11 5 18 30 100 15
II15 135 135 13 19 32 107 29
II16 165 165 13 19 49 163 35
17 Spang (1972) V70 660 070 32 107 28
18 II V90 675 0 90 42 140 16
II19 V120 720 1 20 3 9 130 16
II20 V15C 650 150 30 100 16 average for pi les 198
standard dev sd = 78
standard var sv = 039
)assumed qc = p for s = 010 Op sonding meRsurement were not availab le
IV
TA~LE 15 1
Comparison of the initial sl ope of the pile point resistance - settlement curve
Accardi ng to 1 2 3 4
In i t i ~l 5
slope a1 for the pile No
6 7 8 9
(mmMPa)
10 11 12 13 14 15 Note
a 1 for s=10 mm 222 11 1 a1 for s=20 mm 21 7 14 3 calculated 207 113see Tab 14 1 Bo Berggren (198 )230s=20 mm
Schmertmann s method (see 202B Berggren 1981)s=20 mm
No 1 _ llNo - 6 1 97 098
202 250
22 2
400
30 8
090
14 3
200
186
076
167
182 156
286
18 2
107
125
167 138
091
20 0
222
204
426
263
098
125
167
144
087
100
11 1 9 7
182
23 5
1 03
12 5
14 3
11 9
174
164
105
67 83
58
14 6
125
1 16
63
9 1
61
103
59
8 3 48
123
13 3
15 4 12 1
1 10
167 21 1
aceto hypershy14 5 bola type curve
1 15
No 2 NQj = n1
No 4Noz ~ na No 5Naz= T]g
105 1 27
106
093
1 13
160
1 23
108 1 17
157
100
121 109
1 92
118
1 16 1 14
164
2 12
120
122
1 15
143
1 76
151
149 1 73 1 27 146
TAllLE 151 (continue)
Compa ri son of the initial slope of the pile point resistance - settl ement curve
Initial slope a1 for the pile No (mmMPa)According Note to 16 17 18 19 20 21 22 23 24 -a1 for s=10 mm 133 - 105 11 1 143 76 59 133 100 a1 for s=20 mm 174 - 114 125 167 74 62 153 10 3 calculated see 11 1 146 84 84 118 64 56 100 95Tab 141
Bo Berggren 198 67 78 25 0 114s=20 mm Schmertmann s method (see B 136 67 250 146 Berggren 1981) s = 20 mm
nG = 108 No 1NoJ = n 1 20 125 1 32 121 1 19 105 1 33 105 sd = 0 14
SY= 013 No 2 i) = 1 29ro1 = n1 157 136 149 142 1 16 1 11 1 53 108 sd = 019
SY= 015 No 4 iis = 143 INo2 = ns 091 126 1 63 111 sd = 033
SY= 0 23 No 5 ii9 = 1 37183 108 163 142INoz = n9 sd = 0 37
SY = 027
N Vl
126
TABLE 152
Measured and calculated pile point resistance
Pile Calculated Measured Measured No qcp P for
s=10 mm P for s=20 mm
~ 10 mm ~ 20 mm
- (MPa) (MPa) (MPa) - -
1 38 045 092 84 41 2 39 09 14 43 28
3 40 05 08 80 50 4 33 07 10 47 33 5 35 06 11 58 30 6 35 08 12 44 29 7 35 05 09 70 39 8 30 08 12 38 25 9 39 10 18 39 22
10 35 08 14 44 25 11 49 15 24 33 20 12 40 16 22 25 18 13 46 1 7 2 4 27 19 14 30 075 13 40 23 15 32 06 095 53 34 16 49 075 115 65 43 17 32 - - - -18 42 095 1 75 44 24 19 39 09 160 4 3 23 20 3 0 07 12 43 25
average= 484 291
sd 163 088 sv 034 030
Tab 153 Results of calculation for piles No 1-24
Pile No
Length (m)
Overburden pressure 0 vs
0hs (kPa)
0ve (kPa)
0 nc (kPa)
- -ov=o1 (kPa)
- -OV=03 ( kPa)
00 (kPa)
p(a il ( kPa)
s (a 1) (mm)
A2 ( 1 )
E t
(kPa)
Md ( 1 )
K (1)
E I
t (kPa)
( kPa) 1 2 3 4 5 6 7 8 9 10 11 12 13 14 15 16
l 2 3 4 5 6 7 8 9
10 11 12 13 14 15 16 17 18 19 20 21 22 23 24
13 12 14 13 6 6 6 6 9 95 9
10 95
11 5 135 165 66 675 72 65 99 75
180 137
l 33 133 123 116
70 70 70 70
104 102 95
102 95 94
106 139 95
101 106 97
180 137 221 215
53 53 49 46 28 28 28 28 42 41 38 41 38 38 42 56 38 40 42 39 72 55 88 86
202 202 216 202 1114 104 104 104 146 153 146 160 153 181 209 251 120 128 134 123 238 180 305 277
202 202 216 202 104 104 104 104 146 153 146 160 153 181 209 251 120 128 134 123 238 180 305 277
168 Hi8 170 159 87 87 87 87
125 128 121 131 124 138 158 195 108 115 120 110 209 159 263 246
128 128 133 124 66 66 66 66 94 97 92
101 96
110 126 154 79 84 88 81
155 118 197 182
141 141 145 136
73 73 73 73
104 107 104 111 105 119 137 117 89 94 99 91
173 132 219 203
950 975
1000 825 875 875 875 750 975 875
1225 1000 1150 750 800
1225 800
1050 975 750
2000 2000 625
1500
218 139 255 190 16 1 146 210 12 7 10 1 11 7 84 73 69
104 167 210 124 103 10 1 109 142 120 76
153
0802 0802 0822 0820 0798 0798 0798 0798 0791 0798 0800 0811 0814 0837 0837 0830 0769 0 768 0771 0 775 0 780 0 781 0 788 o 779
35296 81603 43312 65222 44019 67515 4609 91313 78186 60572
118115 15129 5 184075 95577 67017 81607 33252 67554 85294 75994 78816 74857 55101 54862
075 075 0 77 075 084 084 084 081 079 078 084 080 083 076 076 078 0 77 081 079 076 082 087 064 0 74
278 643 337 512 542 832 567
1085 766 572
1216 1417 1832
796 520 709 353 735 878 781 630 726 302 366
26472 61202 33350 48917 36976 56713 38656 73964 61767 47246 99217
121036 152782
72639 51932 63653 25604 54719 67382 57755 64629 65126 35265 40598
a=282l a =l781 y=axs S=0621 B=0 844
V=0 057 V=0 128 _ Iv -J
~
N co
Tab l53 Results of calculation for piles No 7-24
Pile No
17
1 2 3 4 5 6 7 8 9
70 11 72 13 74 75 16 17 78 79 20 27 22 23 24
Ground water
18
-20 m b s
-28 m -335 m -330 m -3 15 m dry dry -53 m -85 m
E t (kPa)
19
33653 64979 35364 45664 47969 54583 37574 63072 74548 57753
71 2618 123531 150297
71239 48619 59204 39744 77208 77863 62049 90407 95844 57762 62937
vxEt=E Md (kPa)
20
25240 48689 27230 34248 35254 45849 31562 51040 58893 45047 94599 98825
724747 54142 36950 46179 30603 57678 61572 47157 47734 83384 36968 46569
a=898 S=l 27 =0314
K (l )
21
265 511 275 358 517 672 463 749 730 546
1160 1157 7496
593 377 514 422 775 802 638 723 929 377 420
a=l422 S=l 05 =0187
E=E = t1 3
g-gcp (kPa)
22
51046 52799 54566 42492 45870 45870 45870 37547 52799 45870 77039 54566 65438 52799 40826 71039 40926 58739 52799 37541 82549 82549 40826 59945
Calculated s
(mm)
23
708 128 72 7 15 3 724 146 144 17 3 71 3 11 5 11 2 732 13 2 707 1 5 1 13 7 93
102 118 137 728 12 l 69
11 9
s__caL n=smeos
() 24
050 092 050 087 0 77 7 00 069 l36 l 12 098 133 l81 l97 103 090 065 0 75 099 117 126 090 101 097 078
ri=l00 sd=035 sv=035
K = l50gcp
25
570 585 600 495 525 525 525 450 585 525 735 600 690 450 480 735 480 630 585 450 825 825 1180 645
E l
(kPa)
26
67684 69465 72250 57726 44856 44856 44856 38448 59659 54306 74956 63214 70704 49089 56783 79502 45283 61081 58207 42927
708572 94785 71033 91898
E = t E middotA2
l
(kPa)
27
54283 5571 l 59389 47336 35795 35795 35795 30682 47790 43336 59964 51266 57553 47088 47024 65987 34823 46970 44877 33269 84639 74027 55974 71589
Calculated s
(mm)
28
l O l 12 l 11 7 737 15 9 18 7 185 21 1 12 6 12 2 133 14 l 150 13 7 13 l 14 7 709 12 7 738 755 12 4 735 50
100
- -
Tab l53 Results of calculation for piles No l-24
Pile
29
l 2 3 4 5 6 7 8 9
10 ll 12 13 14 15 76 17 78 19 20 21 22 23 24
sea l n= middotshy
smeas
28 TT
30
0 46 087 046 0 72 099 l 28 088 l 66 l 25 l 04 l 58 l 93 2 17 l 32 078 0 70 088 l 23 l 37 l42 087 l l 3 066 065
n=l 10 sd=0 44 sv=040
s seal for p n=s=lOrnn ac cording to s = 70mm
(mm)
37 32
5 l 0 51 ll 8 l18 64 064
13 0 l30 85 0 85
13 3 l 33 83 0 83
184 l84 ll6 l l 6 105 l05 137 l 37 21 3 2 12 19 4 l94 107 l06 l l 3 l l 3 84 084
92 092 l 0 9 l09 128 l28 83 083
l 0 3 l03 88 088 79 0 79
n=1 73 sd=025 sv=027
s for p according to s = 20mm
(mm)
33
10 4 184 102 18 6 15 6 200 14 9 276 209 18 4 219 292 274 185 17 9 12 9 -
169 194 219 172 200 143 15 0
seal n=s=20rnn
34
052 092 051 093 078 l00 075 l 38 l 05 092 l l 0 l46 l 37 093 090 065
-085 097 l1 0 086 l00 072 075
n=093 sd=025 sv=0 27
s for p according to s = 30rnn
(mm)
35
142 223 14 l 22 3 198 249 142 34 5 290 249 274 345 33 l 243 22 6 168 -
24 7 26 6 293 24 3 279 187 213
seal n=s=30rnn
36
047 0 74 047 0 74 066 083 047 l 15 0 97 083 091 l 15 l10 0 81 075 056 -
082 089 098 081 093 062 0 71
n=o80 sd=020 _ sv=0 25 N
IO
APPENDIXES
APPENDIX 1 1 1
Pi le No 1 Length 13 m D 10 m
Areas of influence
-
qe
(MPa)
1 fp
___9c_ f
(MPR) zyen
(MPf) qcp (MPa)
Soil type
22 20 18 16 14 1 2
l 2 (m)
10
1 0 08 06
16 15 16
026 027 026
42 41 42 Sand
04 14 U28 39 02 14 028 39 41
02 16 0 26 42 04 16 026 42 06 16 026 42 08 14 028 39 Sand 1 0 13 030 39 12 15 027 4 1 38 14 13 030 39 16 12 032 38 18 12 032 38
40 20 10 036 36 22 10 036 36 24 9 U39 35 2 6 8 043 34 28 10 036 36 30 10 036 36 3 2 10 036 36 34 10 0 36 36 36 11 0 34 37 38 11 034 37
l 1 (m)
40
42 44
11 0 34 37 15 1
46 48 50 52 54 56 58 60 62 64 66 68 70 7 2 74 76 78 8 0
APPENDIX 112
Pile No 2
to little depth of sounding
q~ = middle values for 11 = 2 Op
q~ = 145 MAa (Francke Garbrecht 1977 Tab 2 p 50) (Fi g No 2)
for sand
qcp = 0275middot145 = 40 MPa q~p =V ~~s) middot 40 = 097middot40 = 39 MPa
Pile No 4
q~ = 120 MPa sand (Fig No 4)
q = 0 315middot12 = 3 8 MPa q bull 38 = 086middot38 = 33 MPa=V Jmiddot54
1
cp middot bull cp
Pile No 12
qg = 155 MPa sand (Fig No 13)
qcp = 026middot155 = 4 03 MPa
Pile No 13
q~ = 200 MPa sand (Fig No 14)
q = 0 23middot20 = 46 MPacp
APPENDIX 113
PileNo3 Length 14 m D 15 m
Areas of influence
-
qe
(MPa)
1 Tp
----9cf
(t-1Pf) r~
(MPf) qcp (MPa)
Soil type
22 2D 18 16 17 025 43 14 17 II II
L 2 17 II II
12 (m)
16 10 08 06
17 17 17
o
II
II
II
II
Sand 04 17 II II
02 19 024 46 b9
02 19 024 46 04 17 025 43 06 15 027 41 08 13 030 48 1 0 12 032 38 12 11 033 36 14 13 0 30 39 16 14 028 39 18 12 032 38 40 20 16 026 42 2 2 16 026 42 24 11 033 36 26 11 033 36
60 28 30
10 10
036 036
36 36
Sand
32 10 036 36 34 12 032 3 8 3 6 12 032 38 38 12 032 38
1 1 (m)
40
4 2 4 4
13
14 16
030
028 026
39
39 42
46 13 030 39 48 12 032 38 50 14 028 39 52 10 036 36 54 13 030 39 56 14 028 39 58 15 027 41 60 15 027 ~-1 236 62 64 66 68 70 72 74 76 7 8 80
APPENDIX 114
Pi l e No 5 Length 6 0m D 11 m Dp 11 m
Area s of i nfluence
-
qc
(MPa)
1 Tp
-3Lf
( MPf) l ~
(MP~) qcp (MPa)
Soil type
2 2 2 0 18 1 6 14 1 2 155 U i1 33
l 2 (m)
1 2 10 08 06
15 14 12
022 023 0 27
3 3 32 32
Fine sand
+ silt
04 125 026 33 02 16 0 21 34 39
02 16 021 34 04 13 025 33 06 08 10
15 5 17 20
022 0 20 018
34 34 36
35 Fi ne sand
1 2 20 0 18 36 14 20 018 36 + s ilt 16 20 0 18 36 18 165 020 32 20 165 0 20 32 22 17 0 20 34 24 26 2 8 30 32 3 36 38 4 0
19 21 5 21 5 21 5 20 19 5 19 5 20 215
01 9 ---
018 018 0 18 0 18 -
3 6 40 40 40 36 35 3 5 36 4 0
l 1 (m) 4 2
44 20 19
018 01 9
36 3 6 157
46 48 50 5 2 54 56 58 6 0 62 64 66 68 70 7 2 74 76 7 8 8 0
APPENDIX 1 15
Pi le No 6 Lengt h6 0 m D 11 m
Areas of qc 1 __9_c_ qcp Soil typei nfluence fp f 1 yen (MPa) (MPf ) (MPf) (MPa)
-2 2 20 18 16 t 4---0 14 75 038 29 L2 20 018 36 Fi ne sand
1ti 10 30 40 + s i lt12 08 19 0 19 36(m) 06 17 020 34 04 14 023 32 02 9 034 31 56
02 6 043 26 04 12 026 3 1 06 17 020 34 08 11 028 3 1 1 0 14 023 32 35 1 2 17 020 34 Fi ne sand14 19 019 35 16 20 018 36 + silt18 18 0 19 34 20 14 023 32
46 22 12 026 31 24 12 026 31 26 15 022 33 28 18 019 34 30 20 018 36 3 20 0 18 36 34 20 018 36 3G 20 018 36 38 20 018 36 4 0 20 018 36
l 1 42 22 40
(m) 44 22 40 46 L2 4 0 158 48 50 52 54 56 q =V ~ - 3 b =0 99middot35 = 35 MPp cp 53 58 6 0 62 64 66 68 70 72 74 76 78 80
APPENDIX 116
Pi leNo7 Length 60 m 0 15 m
Areas of influence
-
qe
(MPa)
1 Tp ~
(MPg) r~
(MPf) qcp (MPa)
Soil type
22 20 18 16 9 U33 30 14 10 031 31 12 135 024 32
l 2 (m)
16 10 08 06 04 02
13 12 6
10 175
025 026 043 0 31 020
33 31 26 3 1 35 50
Fine sand
+ silt
02 04 06
17 10 115
0 20 0 31 027
34 31 3 1
08 10
145 185
023 019
33 35 3 5
1 2 14
20 19
018 0 19
36 36 Fine sand
l 1 (m)
60
16 18 20 22 24 26 28 30 3 2 34 36 38 40
42 44 46 48 50 52 54 56 58 6 0
185 125 125 165 17 19 21 215 205 20 21 20 20
24 22 20 215 22 22 21 19 18 22
0 19 026 0 26 020 020 019 --
018 018 -
018 01 8 --
018 ----
0 19 0 19
35 33 33 33 34 36 40 40 37 36 40 36 36
40 40 36 40 40 40 40 36 34 40 219
+ silt
62 64 66 68 70 72 74 76 78 80
APPENDIX 117
Pile No 8 Length60 m D 15 m Dp 2 1 m
Areas of influence
-
qe
(MPa)
1 r +
(MPg) r~
(MPf) qcp (MPa)
Soil type
22 18 019 34 20 16 021 34 18 125 026 3 3 16 115 027 31 14 11 028 3 1 12 11 028 3 1
l 2 (m)
10 08 06
105 11 145
D29 028 023
30 31 33
Fine sand
+ silt
04 18 0 19 34 02 18 019 34 71
02 15 022 33 04 11 0 28 31 06 13 0 25 33 08 20 0 18 36 10 15 022 33 12 13 025 33 14 175 020 35 16 18 20 22
20 21 20 15
018 -
018 0 22
36 40 36 33
35 Fine sand
+ s i lt
24 26 28 30 3 =
13 16 175 19 20 20
025 021 020 0 18 018 018
33 34 3 5 34 36 36
36 38 4 0
20 20 21
018 0 18 -
36 36 40
11 (m)
4 2 4 4 4 6 48 50 5 2 5 4 56 5 8 60 6 2 6 4
20 20 21 22 21 20 19 175 19 20 25 28
018 0 18 ---
01 8 01 9 0 20 0 19 018
36 36 40 40 40 36 36 35 36 36 40 4 0 23 0
6 6 68 70 72 74 76 78
qcp 1f5=v 2T middot35 = b85 middot35 = 30 MPa
80
APPENDIX 118
Pi le No 9 Le ngth 90 m D 11 m m
Areas of 1Qe -9c qcp Soil typeinfluence Tp f ryen (MPa) (MPg) (MPf) (MPa)
-
2 2 2 0 18 16 14 lc 11 034 37
12 10 10 036 36 12 08 9 039 35 Medium(m) 06 10 036 36 sand04 10 036 36
02 11 034 37 43
02 12 032 38 04 12 0 32 38 06 12 0 32 38 08 13 030 39 10 13 030 39 12 13 030 39 14 14 028 39 16 14 028 39
44 18 14 028 39 20 14 028 39 39 Med ium 22 15 027 4 1 sand 24 16 026 4 2 26 17 025 43 28 13 0 30 39 3 0 9 039 35 32 13 030 39 34 16 026 42 36 17 025 43 38 17 025 43 40 19 024 4 6
11 42 17 025 43
(m) 44 15 027 41 17 7 46 48 50 52 54 56 58 60 6 2 64 66 68 7 0 7 2 74 76 78 80
APPENDIX 119
Pi 1 e No 10 Length 95m D 11 m m
Areas of influence
-
qe
(MPa)
1 fp
-9c f
(t-1Pf) [~
(MPf)
qcp
(MPa)
Soil type
22 20 1 8 16 14 L 2 13 Uti 3J
l 2 (m) 12
10 08 06 04
18 18 28 19
0 19 019 0 19 019
34 34 34 34
Fine
sand
02 21 40 42
02 20 4 0 04 17 020 34 06 21 40 0 8 10
23 22
40 40 Fine
1 2 14 16 18
21 20 16 15
0 21 022
4 0 4 0 34 33
sand
44
20 2 2 24 26 28 30 32 34 36 38 40
14 14 13 11 11 14 17 14 12 13 12
023 023 025 0 28 028 023 020 023 027 025 027
32 32 33 31 31 32 34 3 2 32 3 3 32
l 1 (m) 42
44 12 13
0 27 025
32 33 15 2
46 48 50 5 2 5 4 56 5 8 6 0 6 2 6 4 66 6 8 70 72 74 76 78 80
APPENDIX 11 10
Pi 1 e No 11 Lengt h 9 0m D 11 m m
Area s of influence
-
Qe
(MPa)
1 fp
__k_ f
(MP~) ryen
(MPf) qcp (MPa)
Soi l type
22 20 18 16 14 12 lb 55
12 (m)
1 0 08 06 04
23 19 20 21
024 023
55 46 46 55
Medium
sand
02 22 55 62
0 2 04
24 25
55 55
06 08
27 28
55 55
10 12 14
28 28 28
55 55 55 49
16 26 55
44
18 20 22 24 26 28 30 3 34 36 38 40
24 19 18 17 22 21 17 11 13 12 11 9
024 024 025
025 0 34 030 032 034 039
55 46 43 43 55 55 4 3 37 39 38 3 7 35
1 1 (m) 42
Ll Ll
12 16
032 0 26
38 4 2 209
46 48 50 5 2 54 56 58 60 62 64 66 68 70 72 74 76 78 80
APPENDIX 141
0 2 3 4 p [MPa)
PILES WITH 40 ENLARGED BASES
80
120
160 C----0
200 IN4014 s (1977)
[mm]
P s calculateds P p(s)(mm) (MPa)(mmMPa)(MPa) ()
10 035 286 046 20 065 308 080 30 090 333 104
150 24 625 214 200 229
ai = 2605 (mmMPa) b1 = 0243 1MPa V 1000 bi = 1b = 411 MPa
_ 411 MP Vi - 24 a
() assumed
average Dp = 18 m
qcp = 24 MPa ai = 184 (mmMPa) (28-4middot24)
Vi = 1 2 (3-18)
qcpmiddotvi = 29 MPa
40
80
120
160
200 s
[mm]
DIN 4014 Part 2 ( 1977)
0 1 2 3 4 5 p [MPal
PILES WITHOUT ENLARGED BASES
C----0
DIN 4014 ( 1977
s calculated s p -p- p(s)
(mm) (MPa)mmMPa)(MPa) ()
10 05 20 062 20 08 25 113 30 11 27 3 155
150 34 441 385 200 424
ai = 2085 (mmMPa) bi= 0 157 1MPa V = 0970
bi= 1s = 637 MPa
Vi 187=3f =
() assumed
average Dp = 12 m
qcp = 34 MPa a1 = 144 (mmMPa)
Vi = 18
qcpmiddotvi = 61 MPa
Range qc = 10-15 MPa
(28-4bull34)
(3-12)
1 1 q = r -r- = 036 for qc = 10 MPaCp p Ip+= 027 for qc = 15 MPa
qcp = 36-405 MPa P
APPENDIX 142
Touma F and Reese L (1974)
Soil parameters pile parameters and base resistance see fig bullbullbullbull
TAB
Measured load settlement curves
Settlement s
mm
10 20 30 40 50 60 80
100 120
a 1 (mmMPa) bi(MPa) V
N3u
q =04 -N30 (cMPa) ()
1 qCp=--rpbullqC
Pile No 21 (US 59) 22 (HH) 23 (G1) 24 (BB) Notep Sp p S p p S p f Sp MPa mmMPa MPa mmMPa MPa mmMPa Mla mmMPa
131 76 169 59 075 133 100 100 269 74 325 62 131 153 1 94 103 381 79 456 66 165 182 273 11 0 488 82 581 69 1 90 21 1 349 115 581 86 694 72 2 15 233 424 118 675 89 800 75 229 262 813 98 245 327 884 113 925 130
64 56 100 95 U049 0032 0276 0048 0944 0998 0996 0981
80 gt100 30 60 32 gt 40 12 24 ()
Bergdahl (1982)
gt5 5 gt55 32 4 3
(0 18middot32) (018middot40) (0265middot12) (018middot24)
CONTACT PRESSURE p [ MPa]
0 2 4 6 8 100 N-------r---------------(us 59) ( HH) ( BBi
E E SQ-------lt+-----+--------------lt
VI
1shyz UJ
~ 100 1---------i----+----+----+------l------I -J I shyI shyUJ V)
so~----~--~-- ~--~
APPENDIX 143
us 59 fYJo 0 50 00
ff-t r-=-~c~=~-r~c_---_---l-~e-J-C~ 0 ------
CLAY
FINE SANO
J lD- 760 mm
f5m~--~--~
Pile US 59 and results from penetration test
HH IV_l() so 100 r=-=-==-==-r-~--=-=- 0 0 II 15- flf ~ II~ Ibull If t f
CLAY SAND
Sm
)
= -middotl lo - GtOmm
~ JI
SILTY SANO tOm
Pile HH and results from penetration t est
APPENDIX 14 4
61 NJO 50 --------00
11 1 =f J - 1 -- 0
CLAYSILT
E ~ Sm ltrj
SILTY SAND
q I lDmiddot 910 mrn tom
I) t bull
Pile G1 and results from penetration test
88
0 50 too ~1-e I q 111bull - Q
CLAY
SIL TY SAND 5m
]
l lDmiddot760mrn
Om
Pile BB and results from penetration test
APPENDIX 145
Klosinski B (1977)
Loading tests 50 bored piles 09-125 m diameter average Op= 11 m On t he sett l ement of rigid pla te the settlement of t he pi le base is given by
PmiddotOSp = T-K b
where Mb - equivalent deformability modu lus
1) Sand and sandy gravel of medium density
Mb = 25-50 MPa
According to Bergdahl (1979) medium sand is between
q(l) 5 MPa (Io=035)c2)
ql = 10 MPa (Io=065)C
from fig 117 rp1 = 055 for qc = 5 MPa 1Tp = 036 for qc = 10 MPa
q(l)= 0 55middot5 = 2 75 MPacp bull
q(2= 0 36middot10 = 360 MPacp
allowable p~ 1)= ~p = yen = 092 MPa and p~2) = ~ = 120 MPa
settlement of the pi l e base
5(1)= o 92 middot 1bull1 = O 0135 m = 13 5 mm p 325 middot middot
5( 2)= 1bull2bull1middot 1 = O 0088 m = 8 8 m p 350 bull bull
1) _ s _ 135 _ 14 7 (mm) a(2) _ 88 _ a 1 - p - o---92 - bull NPa bull 1 - T-7 - 733 (Wa)
2) Loose sand lo= 030-040
Mb = 12- 25 MPa
q~l) = 44 MPa q~2)= 58 MPa
1Tp = 058 and 052
q(3) = 0 58middot4 4 = 2 55 MPa middot q( 4) = 0 52middot5 8 = 3 02 MPa cp bull middot bull cp bull middot middot
allowable p~ 3)= 4i = 085 MPa p~4)= yenl = 101 MPa
s(3)_ 085-11 = 26 mmmiddot s(4)_ 101middot11 = 148 mm p - 312 p - 3 25
STATENS GEOTEKNISKA INSTITUT Swedish Geotechnical Institute S-581 01 Linkoping Tel 01311 51 00
Serien Rapport ersatter vara tidigare serier Proceedings (27 nr) Sartryck och Preliminara rapporter (60 nr) samt Meddelanden (10 nr)
The series Report supersedes the previous series Proceedings (27 Nos) Reprints and Preliminary Reports (60 Nos) and Meddelanden (10 Nos)
RAPPORT REPORT Pris kr
No Ar (Swcrs)
1 Grundvattensankning till foljd av 1977 50shytunnelsprangning P Ahlberg T Lundgren
2 Pahangskrafter pa langa betongpalar 1977 50shyL Bjerin
3 Methods for reducing undrained 1977 30shyshear strength of soft clay K V Helenelund
4 Basic behaviour of Scandinavian soft 1977 40shyclays R Larsson
5 Snabba odometerforsok 1978 25 shyR Karlsson L Viberg
6 Skredriskbedomningar med hjalp av 1978 40shyelektromagnetisk faltstyrkematning - provning av ny metod J Ingands
7 Forebyggande av sattningar i 1979 40shyledningsgravar - en forstudie U Bergdahl R Fogelstrom K - G Larsson P Liljekvist
8 Grundlaggningskostnadernas fordelning 1979 25 shyB Carlsson
9 Horisontalarmerade fyllningar pa los 1981 50 shyjord J Belfrage
RAPPORTREPORT
No
10 Tuveskredet 1977-11-30 Inlagg om skredets orsaker
11a Tuveskredet geoteknik
l1b Tuveskredet geologi
11 c Tuveskredet hydrogeologi
12 Drained behaviour of Swedish clays
R Larsson
13 Long term consolidation beneath the test fills at Vasby Sweden YCE Chang
14 Bentonittatning mot lakvatten T Lundgren L Karlqvist U Qvarfort
15 Kartering och klassificering av leromradens stabilitetsforutshysattningar L Viberg
16 Geotekniska faltundersokningar Metoder - Erfarenheter - FoU-behov E Ottosson (red)
17 Symposium on Slopes on Soft Clays
18 The Landslide at Tuve November 30 1 977 R Larsson M Jansson
19 Slantstabilitetsberakningar i lera Skall man anvanda total spanningsanalys effektivspanningsanalys eller kombinerad analys R Larsson
20 Portrycksvariationer i leror i Gateshyborgsregionen J Berntson
21 Tekniska egenskaper hos restproshydukter fran kolforbranning shyen laboratoriestudie B Moller G Nilson
Ar
1981
1981
1981
1981
1981
1982
1982
1982
1983
1982
1983
1983
1983
Pris kr (Swcrs)
50shy
50shy
40shy
50shy
100shy
60shy
80shy
60shy
190shy
75shy
60shy
150shy
65shy
RAPPORTREPORT
No Ar Pri s kr (Sw crs)
22 Bestamning av jordegenskaper med sondering - en litteraturstudie U Bergdahl U Eriksson
1983 75 shy
23 Geobildtolkn ing L Vi berg
av grova moraner 1984 70 -
24 Radon i jord -Exhal ation- vatten kvot -Arstidsvariationer - Permeabilitet A Lindmar k B Rosen
1984 75 shy
25 Geoteknisk terrangklassificering for fysisk planering L Viber g
1984 120shy
26 Large diameter bored piles in nonshycohesive soils Determination of the bearing capacity and settlement from results of static penetration tests (CPT) and standard penetration test (SPT) K Gwizdala
1984 85shy