Embed Size (px)
Citation preview

REPORT OF HYDROGEOLOGICAL
EXPLORATION AND REVIEW
Municipal Wastewater Treatment Plant 1000 Ferry Street
Eau Claire, Wisconsin
AET Report No. 31-00455.02
Date:
October 15, 2012
Prepared for:
Donohue & Associates
3311 Weeden Creek Road
Sheboygan, Wisconsin 53081

October 15, 2012
Mr. Phil Englebert, P.E., S.E.
Donohue & Associates, Inc.
3311 Weeden Creek Road
Sheboygan, WI 53081
RE: Report of Hydrogeological Exploration and Review
Municipal Wastewater Treatment Plant
1000 Ferry Street
Eau Claire, Wisconsin
AET Report No. 31-00455.02
Dear Mr. Englebert:
American Engineering Testing, Inc. has prepared this report for the above-referenced project in Eau
Claire, Wisconsin. This report presents the subsurface hydrogeologic conditions that we observed at
22 soil borings, 8 new piezometers and 7 existing dewatering wells on this site. The purpose of this
exploration was to assess aquifer characteristics for future dewatering efforts to maintain the
groundwater level below the digester complex during the 100-year flood conditions of the adjacent
Chippewa River.
Our preliminary findings and recommendations were presented to you on June 15, 2012. In lieu of
additional testing of the existing well(s), and based on the current pumping estimates and facility’s
volumetric discharge constraints, the City of Eau Claire has chosen to modify the basement floor of
the digester complex. Instead of dewatering, the floor slab will be reconstructed to structurally resist
the uplift forces from a rising water table.
We appreciate the opportunity to serve you on this project. If you have questions regarding the
information in this report, please call us.
Sincerely,
American Engineering Testing, Inc.
Richard W. Pennings, P.E.
Senior Environmental Engineer
Phone: (651) 789-4649
Email: [email protected]
1837 County Highway OO Chippewa Falls, WI 54727
Phone 715-861-5045 Toll Free 800-972-6364 Fax 715-861-5048 www.amengtest.com AA/EEO This document shall not be reproduced, except in full, without written approval from American Engineering Testing, Inc.
CONSULTANTS
ENVIRONMENTAL
GEOTECHNICAL
MATERIALS
FORENSICS


Report of Hydrogeological Exploration and Review
Municipal Wastewater Treatment Plant, Eau Claire, Wisconsin October 15, 2012
AET Report No. 31-00455.02 Page iv
TABLE OF CONTENTS
CERTIFICATION .......................................................................................................................... iii
TABLE OF CONTENTS ............................................................................................................... iv
ACRONYMS AND ABBREVIATIONS ...................................................................................... vi
EXECUTIVE SUMMARY........................................................................................................... vii
1.0 INTRODUCTION..................................................................................................................... 1
2.0 PROJECT DESCRIPTION ....................................................................................................... 1
3.0 SCOPE OF SERVICES ............................................................................................................ 3
4.0 REGIONAL SETTING ............................................................................................................. 5
4.1 Geology .............................................................................................................................. 5
4.2 Hydrogeology ..................................................................................................................... 6
5.0 SUBSURFACE EXPLORATION ............................................................................................ 7
5.1 Field Exploration Program ................................................................................................ 7
5.1.1 Boring Layout and Elevations ............................................................................... 7
5.1.2 Drilling Methods ................................................................................................... 8
5.1.3 Sampling Methods and Limitations ....................................................................... 8
5.1.4 Borehole Water Level Measurements ................................................................... 9
5.1.5 Piezometer Construction and Development .......................................................... 9
5.2 Laboratory Testing ........................................................................................................... 10
5.2.1 Classification Methods ........................................................................................ 10
5.2.2 Sample Storage.................................................................................................... 11
5.3 Field Testing .................................................................................................................... 11
5.3.1 Groundwater Level Measurements ..................................................................... 11
5.3.2 SeeSnake Video Survey........................................................................................ 11
5.3.3 Single Well Response (Slug) Tests ...................................................................... 11
6.0 FINDINGS .............................................................................................................................. 12
6.1 Surface Observations ....................................................................................................... 12
6.2 Soil ................................................................................................................................... 12
6.2.1 Texture and Stratigraphy .................................................................................... 12
6.2.2 Particle Size Distribution Results ....................................................................... 13
6.3 Ground Water .................................................................................................................. 13

Report of Hydrogeological Exploration and Review
Municipal Wastewater Treatment Plant, Eau Claire, Wisconsin October 15, 2012
AET Report No. 31-00455.02 Page v
6.4 Aquifer Characteristics .................................................................................................... 14
6.4.1 Saturated Thickness and Porosity ....................................................................... 14
6.4.2 Hydraulic Conductivities .................................................................................... 15
6.4.3 Boundary Conditions at the River ....................................................................... 17
6.4.4 Uniform Flow ...................................................................................................... 17
6.5 Computer Model Simulations .......................................................................................... 17
6.5.1 Existing and Flood Conditions ........................................................................... 18
6.5.2 Dewatering Scenarios ......................................................................................... 18
6.5.3 Solution Sensitivity .............................................................................................. 19
6.6 Dewatering Well Conditions ........................................................................................... 20
6.6.1 Video Surveys ...................................................................................................... 21
6.6.2 Well Efficiency..................................................................................................... 22
7.0 CONCLUSIONS ..................................................................................................................... 23
8.0 RECOMMENDATIONS ........................................................................................................ 24
9.0 STANDARD OF CARE ......................................................................................................... 25
TABLES
1. Boring/Piezometer Completion Information
2. Summary of Gradation Results and Kozeny-Carman Calculations
3. Summary of Single Well Response (Slug) Test Results
FIGURES
1. Site Location Map
2. Site Map
3. Well and Piezometer Hydrographs
4. Groundwater Contours (5/18/2012)
5. Simulated Existing Conditions
6. Simulated Flood – Seven Head-Specified Wells
7. Simulated Flood – Seven Discharge-Specified Wells
8. Simulated Flood – Three Discharge Specified Wells
9. Simulated Flood – Anecdotal Evidence
APPENDICES
A. Soil Boring Logs and Classification/Exploration/Log Notes
B. WDNR Monitoring Well Construction and Development Forms
C. Gradation Curves
D. Kozeny-Carman Calculation Estimates
E. Slug Test Results
F. Discharge Potentials for Rectilinear Flow Scenarios

Report of Hydrogeological Exploration and Review
Municipal Wastewater Treatment Plant, Eau Claire, Wisconsin October 15, 2012
AET Report No. 31-00455.02 Page vi
ACRONYMS AND ABBREVIATIONS
AET American Engineering Testing, Inc.
ASTM ASTM International (formerly American Society for Testing and Materials)
bgs below ground surface
bpf blows per foot
Donohue Donohue & Associates, Inc.
GPM gallons per minute
HSA hollow stem auger
NAVD88 North American Vertical Datum of 1988
PVC Polyvinyl Chloride
SCH 40 Schedule 40
SPT Standard Penetration Test
USCS Unified Soil Classification System
WWTP Wastewater Treatment Plant
WDNR Wisconsin Department of Natural Resources
WisDOT Wisconsin Department of Transportation

Report of Hydrogeological Exploration and Review
Municipal Wastewater Treatment Plant, Eau Claire, Wisconsin October 15, 2012
AET Report No. 31-00455.02 Page vii
EXECUTIVE SUMMARY
The City of Eau Claire plans to upgrade its existing wastewater treatment plant (WWTP) facilities;
Donohue & Associates, Inc. (Donohue) is providing engineering services for design and construction. To
assist Donohue with its design, American Engineering Testing, Inc. (AET) has conducted geotechnical and
hydrogeological assessments. This report provides the hydrogeological assessment with a focus on
dewatering at the digester complex during Chippewa River flood conditions; the geotechnical report was
submitted separately. The hydrogeological assessment was based on subsurface explorations that included 5
existing dewatering wells, 22 soil borings, 8 new piezometers, 12 gradation tests and 24 sets of slug tests.
The shallow unconfined aquifer below the WWTP is sand and gravel of high hydraulic conductivity.
Under idealized aquifer and pumping conceptualizations for the 100-year Chippewa River flood
condition, we estimated that an aggregate pumping volume (discharge) around 7,500 GPM under steady-
state flood conditions would be required to maintain the groundwater level below the basement slab at the
digester complex. On June 15, 2012, we presented our modeling results and recommendations to
Donohue. Our recommendations had included cleaning one of the dewatering wells on the north side of
the complex and running a full-scale pumping test in this well, to verify the hydraulic conductivity
estimate and to determine the well’s efficiency.
Donohue subsequently requested additional modeling analysis on anecdotal evidence and requested
AET solicit bids for the full-scale pumping test. Based on the results of these services and on
physical volumetric pumping constraints at the WWTP, Donohue presented the City with an
alternative to modify the digester basement floor slab to resist buoyant forces from a rising water
table. The City has chosen the structural slab modification instead of a new dewatering system.

REPORT OF HYDROGEOLOGICAL EXPLORATION AND REVIEW
for
MUNICIPAL WASTEWATER TREATMENT PLANT
EAU CLAIRE, WISCONSIN
AET REPORT NO. 31-00455.02
October 15, 2012
1.0 INTRODUCTION
The City of Eau Claire plans to upgrade its wastewater treatment plant facilities. Donohue &
Associates, Inc. (Donohue) is providing engineering services for design and construction of multiple
structural improvements. Donohue contracted with American Engineering Testing, Inc. (AET) to
assess the subsurface characteristics for both geotechnical and hydrogeological purposes.
Numerous structural improvements are planned for the WWTP facility. The proposed improvements
are described in AET’s Report of Geotechnical Exploration and Review dated May 22, 2012 (AET
Report No. 31-00455). In that report, AET presented recommendations for feasible methods of
earthwork and foundation design and construction.
This complementary report is intended to summarize the hydrogeological characteristics at the site and
to present our recommendations for a dewatering system surrounding the digester complex for the 100-
year flood scenario. In this report, we present a description of the site and regional setting, the scope of
services we provided, the results of our exploration and testing, and our recommendations and opinions
based on our findings with regard to a new dewatering system.
2.0 PROJECT DESCRIPTION
The City of Eau Claire municipal wastewater treatment plant (WWTP) is located at 1000 Ferry
Street, just east of the I-94 crossing of the Chippewa River (Figure 1). The WWTP is bordered by

Report of Hydrogeological Exploration and Review
Municipal Wastewater Treatment Plant, Eau Claire, Wisconsin October 15, 2012
AET Report No. 31-00455.02 Page 2 of 25
the Chippewa River on the west, south and east; a levee was built around the facility for flood
protection. Grade elevations at the plant are near elevation 770 feet North American Vertical Datum
of 1988 (NAVD88), rising to 775 feet in the north part of the plant. The normal water level of the
Chippewa River is about elevation 755 feet near the site, whereas the 100-year flood stage at the
plant is reportedly at elevation 773.2 feet.
The buildings at the WWTP were constructed in two major phases, approximately 75 and 30 years
ago. Ferry Street enters the plant from the north on the east side of the property, and turns into the
parking lot south of the Administration building. The digester complex lies directly west of the
Administration building (Figure 2), and is surrounded by seven 18-inch diameter dewatering wells
that were installed about 60 feet deep (dewatering wells W-1 through W-7 on Figure 2). The
basement floor in the digester complex is at elevation 760 feet; the basement slab is reported to be 8
inches thick for a slab bottom at elevation 759.33 feet.
During periods of past high groundwater levels, uplift pressures were exerted on the bottom of the
digester complex basement slab and water has also leaked into the basement on some of these
occasions. Two pumps have been fitted in two of the dewatering wells at the site (wells W-1 and W-
7) in an attempt to control rising groundwater levels. The wells are reportedly set to start pumping
when groundwater reaches elevation 759 feet. Based on anecdotal evidence provided by the City,
these two wells maintain dewatered conditions below the floor slab when flood levels reach 768 feet
in the Chippewa River; discharge rates for this case are not known. However, these wells have not
performed as intended for higher river levels: groundwater breached the basement during the
September 2010 flood.
AET was provided two pump detail sheets, both indicating shallow vertical turbine pump heads rated
for 1,250 gallons per minute (GPM) and 24 feet of total dynamic head (TDH). One pump is listed as
an Aurora Series 1110 10FHM (Well Details sheet by Ayres Associates, no date), and the other is a
Layne Type RF816 (Layne Installation Plan dated March 23, 1988). According to these sheets, the

Report of Hydrogeological Exploration and Review
Municipal Wastewater Treatment Plant, Eau Claire, Wisconsin October 15, 2012
AET Report No. 31-00455.02 Page 3 of 25
intake depths below the discharge inverts for these pumps are about 24 feet for the Aurora and about
28 feet for the Layne: AET observed pump heads at these two wells, but could not confirm the well
types, installations or depths.
The purpose of this study is to assess the soil and groundwater characteristics in the vicinity of the
digester complex. The geotechnical exploration program was utilized and augmented to provide
additional groundwater monitoring and testing capabilities. The intent is to provide Donohue a
review of the existing well system and its dewatering capacity, and provide recommendations for
modifications or improvements to this dewatering system.
3.0 SCOPE OF SERVICES
AET provided Donohue a proposal dated February 6, 2012 that described our geotechnical and
hydrogeological services for this project. Donohue authorized this proposal in writing on March 20,
2012. The scope of services germane to the hydrogeological exploration (including some overlap
with the geotechnical exploration) that were authorized and completed consisted of the following
elements:
1. Soil Borings
a. Cleared utilities via Digger’s Hotline and plant personnel
b. Drilled 22 soil borings using hollow stem augers and mud rotary techniques
c. Sampled soils by the split barrel method (ASTM D 1586) to depths ranging from
16.5 to 76.5 feet below ground surface (bgs)
d. Performed 12 particle size distribution (gradation) tests
e. Surveyed ground elevations at the boring locations
2. Piezometers
a. Drilled eight hollow stem auger borings next to soil borings B-3, B-4, B-5, B-6, B-7,
B-17, B-19 and B-20 with no soil sampling
Report of Hydrogeological Exploration and Review
Municipal Wastewater Treatment Plant, Eau Claire, Wisconsin October 15, 2012
AET Report No. 31-00455.02 Page 4 of 25
b. Installed eight 2-inch diameter by 5-foot long schedule 40 polyvinyl chloride (SCH
40 PVC) screens in each boring, extended to the surface using flush-thread connected
SCH 40 PVC riser pipes – the piezometer depths range from 35.5 to 50.5 feet bgs
c. Surveyed ground and top-of-riser elevations at the piezometer locations
d. Developed the piezometers using 12-volt battery powered submersible pumps and
Teflon tubing
e. Conducted a minimum of three sets of single well response (slug) tests in each of the
piezometers; one set consisted of one falling-head (slug-in) test and one rising-head
(slug-out) test
f. Collected three sets of water level measurements in the piezometers
3. Dewatering Wells (without pumps)
a. Surveyed the top-of-casing and ground surface at each well location
b. Collected four sets of water level measurements in the wells
c. Observed well conditions using a SeeSnake video cable system
4. Hydrogeologic Assessment and Report
a. Described the subsurface conditions
b. Estimated the hydraulic conductivities using gradation results and the slug test data
c. Analyzed pumping scenarios using the existing well array and a computer
groundwater model
d. Prepared a hydrogeological report of findings and recommendations
We have prepared this report to describe the soil and groundwater conditions encountered in our
subsurface exploration; to review and evaluate these conditions with respect to the proposed project;
and to present recommendations for dewatering system adjustments and further testing or
assessments (e.g., a pumping test). This scope of services specifically excludes any environmental
testing of the air, soil or groundwater with respect to chemical composition or contamination.

Report of Hydrogeological Exploration and Review
Municipal Wastewater Treatment Plant, Eau Claire, Wisconsin October 15, 2012
AET Report No. 31-00455.02 Page 5 of 25
Based on preliminary findings and recommendations, Donohue subsequently requested that AET
solicit quotes for well cleaning and testing and that AET perform an additional modeling analysis of
the City’s anecdotal evidence of dewatered conditions with the flood level at 768 feet in the
Chippewa River. The quote for well cleaning and testing was provided separately by others under
separate cover. The results of the additional modeling analysis are included in this report.
4.0 REGIONAL SETTING
4.1 Geology
According to Sheet 1 of the Water Resources of Wisconsin Chippewa River Basin (Young, H. L. and
S. M. Hindall, Hydrologic Investigations Atlas HA-386, United States Geological Survey, 1972), the
surficial soils below the site are sand and gravel, which is geologically classified as “unpitted
outwash,” indicating underlying topographical pits were not formed in the area by a rapid glacial
retreat (Wisconsinan Epoch). This sheet indicates that the underlying bedrock is sandstone from the
Cambrian period. The map does not differentiate the bedrock type, and it includes Jordan Sandstone,
St. Lawrence Formation, Franconia Sandstone, Galesville Sandstone, Eau Claire Sandstone and
Mount Simon Sandstone. It is likely that the overlying unconsolidated sand and gravel at this site is
more permeable than the underlying sandstone. For
this reason and the purposes of this study, the depth
to bedrock is likely more relevant than the type of
sandstone bedrock at this site.
The Depth to Bedrock Map of Eau Claire County,
Wisconsin (Johnson, D.M., Miscellaneous Map 37,
University of Wisconsin – Extension, Wisconsin
Geological and Natural History Survey, 1993)
indicates depths to bedrock in excess of 100 feet Misc Map 37 Excerpt: Depth to Bedrock
Site

Report of Hydrogeological Exploration and Review
Municipal Wastewater Treatment Plant, Eau Claire, Wisconsin October 15, 2012
AET Report No. 31-00455.02 Page 6 of 25
along most of the Chippewa River and several of its tributaries. These areas are indicated by the
dark purple in the inset above. The majority of the boreholes used to compile this map were not
drilled to bedrock near the site; these boreholes are indicated by open circles in the inset.
Based on these regional geological descriptions, the sand and gravel deposits within the Chippewa
River channel area appear to be deep and highly permeable. The results of our subsurface
exploration generally agree with these interpretations and are described later in this report.
4.2 Hydrogeology
The closest surface water feature that has the most potential to influence groundwater levels at the
site is the Chippewa River. The closest reach of the Chippewa River at normal water level is about
1,000 feet to the southwest of the digester complex. The topographic map on Figure 1 brackets the
normal water elevation of this reach of the Chippewa River between elevations 750 and 760 feet. As
referenced in our geotechnical report, the normal river elevation near the WWTP is around 755 feet.
The Chippewa River generally flows from the east-northeast to the west-southwest past the site, so
some drop in river elevation is anticipated between the east and west reaches that bracket the site.
The Generalized Water-Table Elevation Map of Eau
Claire County, Wisconsin (Muldoon, M.A.,
Miscellaneous Map 35, University of Wisconsin –
Extension, Wisconsin Geological and Natural History
Survey, 1992) confirms the local control that the
Chippewa River exerts on groundwater flow. The
inset to the right indicates groundwater flow toward
the Chippewa River on both sides of the river. Higher
flow gradients appear to the northeast of the site, but
the flow gradient flattens as it approaches the river.
Misc Map 35 Excerpt: Groundwater flow
Site

Report of Hydrogeological Exploration and Review
Municipal Wastewater Treatment Plant, Eau Claire, Wisconsin October 15, 2012
AET Report No. 31-00455.02 Page 7 of 25
The regional groundwater descriptions generally reflect the measurements that we have collected at
the site, which are discussed in detail later in this report.
5.0 SUBSURFACE EXPLORATION
5.1 Field Exploration Program
The subsurface exploration program conducted for this phase of the project consisted of 22 standard
penetration test (SPT) borings (borings B-1 through B-22), 8 piezometers (P-3 through P-7, P-17, P-
19 and P-20), and 5 dewatering wells (W-2 through W-6). The piezometers were not installed in the
same boring from which the soils were sampled; rather, the piezometer borings were offset about 5
feet from the boring locations, were not sampled for soils, and were not drilled with bentonite
drilling fluid.
The boring, piezometer and dewatering well locations are shown on Figure 2. Location designated
“W-8 (?)” was not known to exist until later in our exploration; its depth and dimensions are
consistent with the other dewatering wells, but we did not conduct a video survey of this casing to
verify that it is screened. The logs of the borings, along with further details of the test methods we
used, are included in Appendix A. The logs of the piezometers, along with details on development,
are in Appendix B.
5.1.1 Boring Layout and Elevations
The locations and depths of the borings were chosen jointly by Donohue and AET. AET located the
borings in the field by taping from existing site features (e.g., building corners). AET referenced the
boring location ground elevations and piezometer top-of-riser elevations using an engineer’s level
and surveyor’s rod. AET used the Wisconsin Department of Transportation (WisDOT) survey
marker located just beyond the southwest corner of the Administration building parking lot. The
Wisconsin State Cartographer’s Office website shows this benchmark at elevation 768.24 feet
NAVD88.

Report of Hydrogeological Exploration and Review
Municipal Wastewater Treatment Plant, Eau Claire, Wisconsin October 15, 2012
AET Report No. 31-00455.02 Page 8 of 25
Elevation information for the borings and piezometers is summarized in Table 1. The depths to
groundwater from the tops of risers that AET measured and the groundwater levels on dates
measured are also included in Table 1.
5.1.2 Drilling Methods
The soil borings that were sampled were drilled using 3-1/4-inch inner diameter HSA and the mud-
rotary method. The soil borings in which the piezometers were installed were drilled using 4-1/4-
inch inner diameter hollow-stem augers (HSA) and no drilling mud. All of the borings were
backfilled in compliance with the Wisconsin Administrative Code NR141. Wisconsin Department
of Natural Resources (WDNR) piezometer installation and development forms are included in
Appendix B.
5.1.3 Sampling Methods and Limitations
Split-barrel samples were collected by the SPT method in general accordance with ASTM: D 1586.
The sampler was driven at least 18 inches into the soil and the number of blows to drive the sampler
the 6 to 18 inches is referred to as the standard penetration resistance or N-value. Representative
portions of the recovered soil samples were sealed in jars to reduce moisture loss and were submitted
to our laboratory for examination, testing and final classification by a geotechnical engineer.
Unless actually observed in a sample, the contacts between soil layers are estimated based on the
vertical spacing of samples and the action of the drilling tools. Cobbles, boulders, and other large
objects cannot be recovered intact from test borings. They may be present in the ground even if they
are not noted on the boring logs.
Sample recovery can be limited if the sampler “pushes” coarse gravel or is obstructed on a hard
surface. Sample recovery lengths less than sampled intervals indicate that some soils in the sampled
profile were not recovered. In these cases, lenses or layers of differing soil types may exist in
subsurface profile that are not described on our boring logs.

Report of Hydrogeological Exploration and Review
Municipal Wastewater Treatment Plant, Eau Claire, Wisconsin October 15, 2012
AET Report No. 31-00455.02 Page 9 of 25
5.1.4 Borehole Water Level Measurements
The boreholes were probed for the presence of ground water during and after drilling, and water level
measurements were taken. Groundwater measurements are shown at the bottom of the respective
boring logs. The following information appears under “Water Level Measurements” on the logs:
▪ Date and Time of measurement;
▪ Sampled Depth: lowest depth of soil sampling at the time of measurement;
▪ Casing Depth: depth to bottom of casing or hollow-stem auger at time of
measurement;
▪ Cave-in Depth: depth at which measuring tape stops in the borehole;
▪ Water Level: depth in the borehole where free water is encountered; and
▪ Drilling Fluid Level: same as Water Level, except that the liquid in the borehole is
drilling fluid.
The true depth of the water table at the boring locations may be different than the water levels we
measured in the boreholes. This is possible because there are several factors that can affect water
level measurements in a borehole. These factors include the permeability of each soil layer in
profile, the presence of perched water layers, the amount of time between water level readings, the
presence of drilling fluid, weather conditions, the use of borehole casing, and the use of drilling mud.
5.1.5 Piezometer Construction and Development
We installed 2-inch diameter SCH 40 PVC riser and screen for piezometers next to borings B-3, B-4,
B-5, B-6, B-7, B-17, B-19 and B-20. The purposes of these piezometers were to allow groundwater
to stabilize for obtaining more representative measurements of static groundwater levels, and to
facilitate aquifer testing. The piezometer construction details are summarized in Table 1. The
piezometer construction logs are in Appendix B.

Report of Hydrogeological Exploration and Review
Municipal Wastewater Treatment Plant, Eau Claire, Wisconsin October 15, 2012
AET Report No. 31-00455.02 Page 10 of 25
On May 16 and 17, 2012, we developed the piezometers using submersible pumps powered by 12-
volt batteries. The pumps were lowered and raised in the well screen while discharging, to remove
silt and clay, until the discharge water appeared relatively clear. A minimum of five well volumes
(accounting for both the casing and filter pack) were removed from the piezometers for development.
Purge volumes ranged from 45 to 85 gallons and purge rates ranged between 0.5 and 1.5 GPM. The
piezometer development details are summarized in Table 1. The piezometer development forms are
in Appendix B.
5.2 Laboratory Testing
The laboratory program consisted of the 12 grain-size distribution (gradation) tests down to the No.
200 screen size (ASTM: D 422). The gradation curves from these tests are on separate data sheets in
Appendix C.
5.2.1 Classification Methods
The soil classifications shown on the boring logs are based on the Unified Soil Classification System
(USCS), described in ASTM: D 2487 and D 2488. Where laboratory tests, such as gradation and/or
Atterberg limits, have been performed, classifications per ASTM: D 2487 are possible. Otherwise,
soil classifications shown on the boring logs are visual-manual judgments. We have attached charts
(Appendix A) illustrating the USCS, the descriptive terminology, and the symbols used on the boring
logs.
The boring logs include our interpretation of the geologic depositional environment. This
interpretation is based on our observation of the recovered soil samples and our knowledge of the
geologic history of the area. Observations of the surrounding topography, vegetation, and
development can aid this interpretation.

Report of Hydrogeological Exploration and Review
Municipal Wastewater Treatment Plant, Eau Claire, Wisconsin October 15, 2012
AET Report No. 31-00455.02 Page 11 of 25
5.2.2 Sample Storage
We will retain representative samples of the soils recovered from the borings for a period of 180 days
from the date of the geotechnical report of May 22, 2012. The samples will then be discarded unless
you notify us otherwise.
5.3 Field Testing
The field testing program consisted of a minimum of three sets of groundwater level measurements
and three sets of single-well response (slug) tests in the piezometers.
5.3.1 Groundwater Level Measurements
AET collected manual water level measurements from the accessible dewatering wells (W-2 through
W-6) and the piezometers using an electronic water level indicator with a tape graduated in
hundredths of a foot. The water levels were referenced to the top of casing. The dates of
measurement and results are listed in Table 1 and on Figure 3.
5.3.2 SeeSnake Video Survey
AET conducted a video survey of dewatering wells W-2 through W-6 on March 29, 2012. The video
survey was conducted using a RIDGID SeeSnake fiber optic camera. The camera on the cable is
unidirectional, but was articulated using a cloth measuring tape to direct the camera toward the
casing sidewalls. Recording to DVD was done for dewatering well W-5.
5.3.3 Single Well Response (Slug) Tests
AET conducted single well response (slug) tests in the piezometers on March 17 and 18, 2012. The
slug tests were conducted by measuring temporal changes in water levels in each of the piezometers
upon the introduction and removal of a solid cylinder (i.e., slug) in the water column; these tests are
referred to as “slug-in” and “slug-out” tests, respectively. A minimum of three sets of “slug-in” and
“slug-out” data were collected from each piezometer. Two slug sizes were used during testing, the
smaller of which was used on the second set of measurements.

Report of Hydrogeological Exploration and Review
Municipal Wastewater Treatment Plant, Eau Claire, Wisconsin October 15, 2012
AET Report No. 31-00455.02 Page 12 of 25
The temporal changes in water level and temperature were measured down-hole with a pressure
transducer set about 6 to 8 feet below the water surface in the piezometer. The data was captured
following a logarithmically decaying schedule set to record in seconds, with several measurements
taken at the start of each test (approximately three readings per second). The elapsed time between
readings was set to increase as the test progressed, but responses were very rapid at this site.
6.0 FINDINGS
6.1 Surface Observations
South of the levee, the surface elevations at the plant are relatively flat, with higher grades on the
north side of the plant. The grades at the borings discussed in this report ranged from 768 to 772
feet. The piezometers were constructed in mostly green areas, to avoid traffic and plant operations.
6.2 Soil
The soil conditions we encountered are detailed in the logs of borings attached in Appendix A. The
logs contain information concerning soil layering, soil classification, geologic description, and
moisture. Relative density or consistency is also noted, based on the standard penetration resistance
(N-value) reported in blows per foot (bpf). The boring logs only indicate the subsurface conditions
at the sampled locations, and variations can occur between and beyond borings.
6.2.1 Texture and Stratigraphy
A detailed description of the soils profile at this site is presented in AET’s geotechnical report
(Report No. 31-00455), which was submitted under separate cover. Below about 1 to 6 feet of fill,
the majority of soil at this site is naturally-occurring sand to sand with gravel. Samples of clay and
silt were recovered at depth in two of the borings, below 55 feet, but these appear isolated and likely
have little to no bearing on flow conditions within the aquifer. In general, the soil types that we
observed in the 22 soil borings agree with the regional geologic description presented in section 4.1.

Report of Hydrogeological Exploration and Review
Municipal Wastewater Treatment Plant, Eau Claire, Wisconsin October 15, 2012
AET Report No. 31-00455.02 Page 13 of 25
6.2.2 Particle Size Distribution Results
Twelve soil samples were tested for particle size distribution. The samples were chosen from the
screened intervals at six of the eight piezometer locations. The gradation results are summarized in
Table 2 and the gradation curves are presented in Appendix C.
All of the samples tested had 3.5% or less silt and clay content, and were classified as poorly graded
sands. The particle size diameters of the 10th
percentiles ranged from 0.19 to 0.35 millimeters, such
that hydraulic conductivity estimates could be calculated for all of these samples by both the Hazen
formula and the Kozeny-Carman approximation; the calculation sheets for these estimates are in
Appendix D and are also summarized in Table 2.
6.3 Ground Water
Ground water was present in the borings at depths between 11.7 and 17.8 feet bgs during drilling,
with a corresponding elevation range of 754.2 to 756.6 feet. The measurements span a few weeks
over the course of drilling and were made with a weighted fiberglass tape. After the soil borings
were drilled, eight piezometers were installed to more accurately measure water levels and to
facilitate aquifer testing. AET collected four sets of groundwater level measurements after
installation: one before piezometer development, one on the last day of slug testing, and two more in
the month that followed, each separated by about two weeks. The groundwater measurements in the
piezometers were taken with an electronic water level indicator. The results are summarized in
Table 1; the hydrographs are plotted on Figure 3.
The groundwater levels measured in the piezometers and dewatering wells on the first three
occasions varied less than 0.8 foot with respect to each other’s values, with the exception of one
outlier (P-17) that was measured prior to development. From the evening of May 16 to the morning
of May 18, the water table beneath the site dropped about 0.6 foot. The groundwater elevations
calculated from the May 18, 2012 measurements are plotted on Figure 4, with contouring output
from the computer program Surfer (version 7) as interpolated using kriging. These data indicate

Report of Hydrogeological Exploration and Review
Municipal Wastewater Treatment Plant, Eau Claire, Wisconsin October 15, 2012
AET Report No. 31-00455.02 Page 14 of 25
flow toward the Chippewa River under a general gradient of out 0.0011 foot per foot (approximately
0.1 foot vertical per 90 feet horizontal).
The groundwater level measurements on June 15, 2012 were about 2 feet lower than the previous
measurements on May 31, 2012. According to the National Weather Service river stage reports for
the Chippewa River at Eau Claire, the surface elevation was about 1.5 feet lower on for these dates
as well (http://water.weather.gov/ahps2/hydrograph.php?wfo=mpx&gage=eclw3).
Groundwater levels usually fluctuate due to varying seasonal and yearly rainfall and snow melt,
infiltration, nearby pumping, river and lake levels, and barometric pressure. Water levels measured
in the winter are typically lower and rise during the spring months. Based on the “clean” sand and
gravel and the apparent hydraulic connection with the Chippewa River, the river elevations probably
directly influence the groundwater levels below this site. Rises or drops in the river elevation likely
propagate quickly (i.e., with days or hours, or less) to the groundwater below the plant.
6.4 Aquifer Characteristics
The transmissivity of a homogeneous, isotropic sand and gravel aquifer is defined as the product of
the hydraulic conductivity and saturated thickness. Local estimates of hydraulic conductivities were
obtained from gradations and slug tests. The resultant hydraulic conductivity was used in
conjunction with a simplified, idealized conceptualization of the aquifer and boundary conditions of
flow to mimic the groundwater flow regime and predict groundwater table responses to selected
pumping scenarios.
6.4.1 Saturated Thickness and Porosity
The majority of the 22 soil borings terminated in sand and gravel, such that the shallow aquifer base
elevation was not determined. Based on the regional estimates of depth to bedrock, an aquifer base
elevation was set at 670 feet (i.e., 100 feet bgs) and its sensitivity to the computer simulations was
evaluated.

Report of Hydrogeological Exploration and Review
Municipal Wastewater Treatment Plant, Eau Claire, Wisconsin October 15, 2012
AET Report No. 31-00455.02 Page 15 of 25
Porosity is the fractional relation of the volume of pore space to the bulk volume of solids. The
porosity of a disturbed soil sample is difficult to obtain, and is often estimated based on the soil type
and published values. The published range of porosities for a sand and gravel mix is 10% to 35% in
Groundwater and Wells (Driscoll, F. G., Second Edition, Johnson Division, St. Paul, Minnesota,
1986). A value of 30% was used in our evaluation for the entire site.
6.4.2 Hydraulic Conductivities
Based on typical parameter values for certain constants (e.g., porosity and shape factor), the
hydraulic conductivities estimated from the gradation tests ranged from about 100 to 350 feet/day
based on the Hazen formula and 70 to 250 feet/day based on the Kozeny-Carman equation. The
latter approach is highly dependent on the porosity of the soil, with a more rapid non-linear increase
in hydraulic conductivity with respect to an increasing porosity value. Conductivity estimates can
more than double with porosity increasing from 25% to 35%. The calculation sheets for these
equations are in Appendix D.
To better quantify localized hydraulic conductivities at the piezometer locations, we analyzed the
slug test data using the computer program Aqtesolv® Pro v. 4.50 and the Springer-Gelhar
(oscillatory) and Bouwer-Rice (straight line) methods of analysis. The changes in water level were
related to the water level surface and were normalized in the analyses. The translation method was
used to remove early “noise” in the data due to the non-instantaneous introduction of the slug as is
conventionally done, but care was taken to shift to a peak or trough for those tests that had oscillatory
behaviors to maintain the zero velocity boundary condition at the start of the test as required in the
solution.
The saturated thickness for the analyses was calculated separately for each piezometer location using
the aquifer base elevation estimate of 670 feet. Increasing the saturated thickness (i.e., varying the

Report of Hydrogeological Exploration and Review
Municipal Wastewater Treatment Plant, Eau Claire, Wisconsin October 15, 2012
AET Report No. 31-00455.02 Page 16 of 25
base elevation) had little to no effect on the resultant hydraulic conductivity estimates, indicating
sensitivity to deeper saturated thicknesses is relatively low for this application.
The calculation sheets for the “slug in” and “slug out” tests that were analyzed are in Appendix E;
the results are summarized in Table 3. The results for the individual tests ranged from 82 to 569
feet/day. The majority of the slug data (all but one well) exhibited an oscillatory response, in which
the return to static conditions follows a diminishing wave form as
seen in the example to the right. This response is common “in
formations of very high hydraulic conductivity or wells with very
long columns of water above the top of the screen in formations
of moderate or higher conductivity” (Butler, J.J., The Design,
Performance and Analysis of Slug Tests, Lewis Publishers,
1998). Borrowed from terminology for a damped spring, these
responses are referred to as “underdamped.”
All of the piezometer slug data at this site exhibited underdamped responses except for piezometer
P-17. The data from this piezometer appeared to be “overdamped” for the slug-in tests and
“critically damped” for the slug-out tests. Normalized comparisons of these response curves indicate
that development of this well is suspect and that fines in the screened interval may be interfering
with its response. The slug-in values for P-17 corresponded to the lowest hydraulic conductivity
estimates.
The average hydraulic conductivity for all of the tests that were analyzed was approximately 325
feet/day. The average increases to 333 feet/day if the highest (P-3) and lowest (P-17) values are
removed. To arrive at a single, representative hydraulic conductivity for this site to use in the
computer simulations, the slug test data was averaged from the four deeper piezometers (P-3, P-4, P-
19 and P-20). The data from these four piezometers appear to visually fit the solution curves better
than the data from the shallower piezometers did; the longer water column may have been a factor in
Actual Site Data: P-3 Slug In 01

Report of Hydrogeological Exploration and Review
Municipal Wastewater Treatment Plant, Eau Claire, Wisconsin October 15, 2012
AET Report No. 31-00455.02 Page 17 of 25
accentuating the underdamped responses. Based on the results of these four piezometers, we used a
hydraulic conductivity value of 367 feet/day to estimate dewatering discharges and drawdowns for
the computer simulations.
6.4.3 Boundary Conditions at the River
Assuming a good hydraulic connection exists between the aquifer and the Chippewa River, the river
can be interpreted as a surface expression of the groundwater table and a control on the head along
its boundary. Therefore, the groundwater head was fixed along the river for the computer
simulations. Values were adjusted from higher head upstream to lower head downstream. The head
near the site was set within a few tenths of elevation 755 for existing conditions and 773 for flood
conditions. Discharges to or from the river will adjust accordingly to maintain these heads in the
computer simulations.
6.4.4 Uniform Flow
Other elements far away from the site that effect groundwater flow to the site (e.g., lakes, rivers and
rainfall) can be approximated as uniform flow. The uniform flow discharge is distributed equally
along the vertical profile. Uniform flow can be calculated using a simple relation and three observed
groundwater levels from triangulated wells or piezometers. The groundwater levels measured from
the heads at P-4, P-17 and P-20 were used to calculate this discharge value; the suspected insufficient
development at piezometer P-17 is not a concern for post-development water table measurements at
this location. The calculation sheets for the uniform flow values used in the computer simulations
are included in Appendix F.
6.5 Computer Model Simulations
We used the Multi-Layer Analytic Element Model (MLAEM v. 5.1.08 Dev) to implement the
analytic solution and analyze selected dewatering scenarios; our models only used one layer (aquifer)
for the saturated coarse alluvium at the site. The model is intended as a simple engineering tool to
predict hydraulic conditions and estimate likely groundwater discharge volumes based on our
Report of Hydrogeological Exploration and Review
Municipal Wastewater Treatment Plant, Eau Claire, Wisconsin October 15, 2012
AET Report No. 31-00455.02 Page 18 of 25
geotechnical report and the slug test results; it is based on a fixed geometric representation of river
near the plant and limited head-specified (e.g. the river and wells) and discharge-specified (e.g.
uniform flow and wells) elements. The pumping solutions are derived as “steady-state,” meaning
that the results represent conditions after continuous pumping for a long period of time; this solution
does not account for the volume of water that will be pumped from storage (i.e., residual water that
drains vertically from the soil pores as the water table is lowered) during the initial stages of
dewatering.
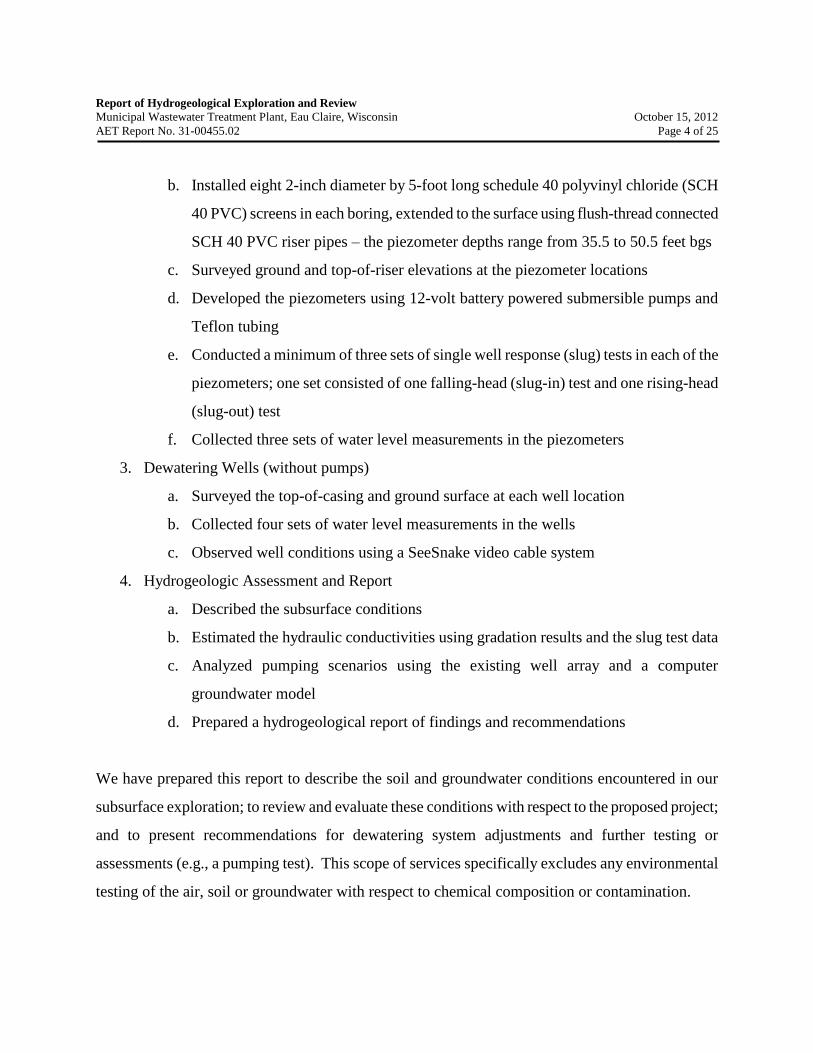
6.5.1 Existing and 100-year Flood Conditions
The above parameters for hydraulic conductivity (367 feet/day), aquifer base elevation (670 feet),
head at river (~755 feet) and uniform flow (~67 cubic feet of water per day per foot width of aquifer
angled at 49 degrees south of east) yield the modeled groundwater contours shown on Figure 5; to
complete the solution, head was fixed at one point on the south side of the river (i.e., the reference
point). The observed heads at the observation points on May 18, 2012 were subtracted from the
computed heads using the model, resulting in absolute differences of less than 0.2 foot and a root
mean square error of less than 0.06 foot. The hydraulic gradients compare well on the northern half
of the site, but are off by about a factor of two on the southern half. The southernmost piezometer
(P-20) corresponds to the highest (0.2 foot) error in head as well.
To model flooded conditions, the head at the river was increased 18 feet. The uniform flow was
recalculated using head values also elevated by 18 feet. The resultant contours mimicked those for
the existing conditions, but were 18 feet higher. This conceptualization was used to analyze selected
pumping scenarios.
6.5.2 Dewatering Scenarios
The general dewatering target is to maintain the groundwater elevation at 759 feet or lower between
the dewatering wells. The first scenario in Figure 6 shows the resultant contours and pumping rates
for the case that the head at all seven dewatering wells are maintained at 755 feet. The pumping

Report of Hydrogeological Exploration and Review
Municipal Wastewater Treatment Plant, Eau Claire, Wisconsin October 15, 2012
AET Report No. 31-00455.02 Page 19 of 25
rates varied between 931 and 1,227 GPM, with a total discharge of 7,561 GPM. The groundwater
contours appear to lie between elevations 759 and 760 feet under the majority of the digester
complex. Therefore, the discharges of the southern wells would have to be increased, or a new well
should be installed farther to the south, to maintain the water level below elevation 759 feet below
the digester complex.
The second scenario in Figure 7 shows the resultant contours and pumping rates for the case that the
discharge at all seven dewatering wells are maintained at 1,000 GPM. The heads at the wells ranged
from 755.7 to 757.3 feet. The total discharge of this scenario is 7,000 GPM, which is less than the
above scenario. In this case the modeled groundwater contour at elevation 760 feet also encroaches
on the digester complex basement floor. Discharges on the southern two wells would need to be
increased, to about 1,250 GPM, which is the rated capacity of the two pumps that are currently
installed.
The third scenario in Figure 8 shows the resultant contours and pumping rates for the case that the
discharge at all three dewatering wells (W-1, W-4 and W-7) are maintained at 2,500 GPM. The
heads at the wells ranged from 747.5 to 748.3 feet. The total discharge of this scenario is 7,500
GPM, close to the first scenario, resulting in a similar dewatered drawdown pattern. To achieve this
condition, pump intakes would have to be installed deeper in the wells and the well screens would
have to be able to transmit water equal to or greater than this rate into the wells, without pulling sand
into the casing.
6.5.3 Solution Sensitivity
This solution is sensitive to the hydraulic conductivity of the aquifer to a large extent and to the
aquifer thickness to a much lesser extent. The water table drawdown is directly proportional to the
ratio of discharge volume to hydraulic conductivity. Hence, if the hydraulic conductivity is doubled,
the discharge volumes need to be doubled to result in the same drawdown patterns and elevations
Report of Hydrogeological Exploration and Review
Municipal Wastewater Treatment Plant, Eau Claire, Wisconsin October 15, 2012
AET Report No. 31-00455.02 Page 20 of 25
depicted in the scenarios above. Similarly if the hydraulic conductivity is halved, so are the
discharges.
The aquifer thickness is also proportional with pumping, but not to the degree of hydraulic
conductivity. If the saturated thickness were more than doubled (e.g., lowered to elevation 570 feet),
an approximate, additional 2.7 feet of dewatering would be required at the wells.
6.5.4 Anecdotal Flood Simulation
Following discussions of the above modeling results, Donohue requested that additional simulations
be run based on anecdotal evidence provided by the City. The City reports that wells 1 and 7 are
able to maintain groundwater levels below the digester basement slab when flood levels are at
elevation 768 feet in the Chippewa River. In the model, the river elevation and uniform flow
discharge were adjusted accordingly and multiple simulations were run with various hydraulic
conductivity values; the actual discharges of the wells were not measured by the City, so these values
were fixed at the reported maximum discharge rates of 1,250 GPM for all scenarios.
The 760-foot groundwater contour for hydraulic conductivity values of 100, 150, 200, 250 and 300
feet/day are plotted on Figure 9. Based on this representation, the simulations using hydraulic
conductivity values at 200 feet/day or less achieved the reported result of groundwater being
maintained below the digester basement floor.
6.6 Dewatering Well Conditions
The modeled heads in the above scenarios are idealized values assuming full aquifer penetration and
100% efficiency at the pump. The dewatering wells at this site are partially penetrating and the
actual drawdown in the well casing will be lower than outside the well skin due to head losses at the
well itself.

Report of Hydrogeological Exploration and Review
Municipal Wastewater Treatment Plant, Eau Claire, Wisconsin October 15, 2012
AET Report No. 31-00455.02 Page 21 of 25
6.6.1 Video Surveys
The construction and development details of the existing dewatering wells are not known, except for
depth and screen length. The video survey conducted by AET indicated that fouling is present on the
well casings and screens. The screens themselves were hard to discern, and were generally
interpreted to begin where the fouling switched from a uniform to an irregular appearance. The
screen slots may be vertical, but this could not be
definitively seen in this video assessment. The picture
to the right is a close up of the side wall of well W-5
at 44 feet below the top of the casing; the depth
stamped in the photograph includes slack in the
camera cable. The red arrow indicates the downward
direction. Floating debris that was scraped from the
sidewall during the camera’s decent can be seen in the
lower left corner.
Following AET’s video survey, the City provided a video tape of a previous survey of dewatering
wells W-1 and W-7 that was completed in 2001. The videos were taken before and after these wells
were jetted and cleaned. AET transferred this video to DVD and provided two copies to Donohue
and returned the original VHS tape to the City. As seen in the photograph below, the fouling was
removed and the well screen was easily observed; the red arrow indicates the downward direction.
The slots appeared rectangular with an approximate 4 to 1 aspect ratio, with the long axis oriented in
the vertical direction. However, post-jetting pumping information (e.g., discharge and drawdown)
was not provided by the City.
Well W-5 @ 44 feet deep (3/29/2012)

Report of Hydrogeological Exploration and Review
Municipal Wastewater Treatment Plant, Eau Claire, Wisconsin October 15, 2012
AET Report No. 31-00455.02 Page 22 of 25
6.6.2 Well Efficiency
Well efficiency is defined as the fractional relation of drawdown outside the well divided by the
pumping level inside the casing. For wells, “an efficiency of 70 to 80 percent is usually
obtainable if good design, construction and development practices are followed” (Driscoll, 1986).
Insufficient slot openings can increase head losses due to increased entrance velocities. The
fouling further reduces the slot openings and can reduce well efficiencies over time. Well
efficiencies will have to be determined via full-scale pumping tests to ensure that the vertical
turbine pumps that are currently installed can sustain pumping without drawing the water level
within the casing below the top of the pump intakes.
East Well (W-7) after jetting (2/26/2001)

Report of Hydrogeological Exploration and Review
Municipal Wastewater Treatment Plant, Eau Claire, Wisconsin October 15, 2012
AET Report No. 31-00455.02 Page 23 of 25
7.0 CONCLUSIONS
Based on our 22 borings, the soil at the WWTP appears to be relatively homogeneous sand and
gravel of high hydraulic conductivity. Eight piezometers were installed and subsequent slug testing
of the four deeper ones yielded an average hydraulic conductivity estimate of 367 feet/day. This
estimate was used to approximate discharge and drawdown for proposed pumping scenarios around
the digester complex. Based on an idealized aquifer and pumping conceptualizations for flood
conditions, we estimate an aggregate discharge around 7,500 GPM under steady-state flood
conditions will be needed to keep the water table below the basement slab during the 100-year flood
scenario.
The existing dewatering wells surrounding the digester complex have suffered from fouling and will
require jetting and cleaning if they are to be brought into service. The well survey video provided by
the City indicates that the interiors of the remaining wells likely can be rehabilitated to similar
conditions as the two pumping wells were back in 2001. Additional shallow vertical turbine pumps
similar to those installed in dewatering well W-1 and W-7 would be needed in all seven wells if
sustained flows are experienced during a 100-year flood event. This will require well efficiencies
that can sustain discharges into the casings so that the intakes do not draw air. Fewer wells would be
needed if deeper submersible pumps are used, and the intakes are lowered into the screened intervals
of the dewatering wells.
Simulations of the anecdotal report for flood levels at 768 feet indicate that dry conditions at the
floor slab are achieved for wells 1 and 7 both pumping 1,250 GPM in an aquifer with a hydraulic
conductivity at 200 feet/day or less. Therefore, the models based on the hydraulic conductivity of
367 feet/day may overestimate the required discharge volume and/or the digester walls extending
below the groundwater table may have a significant effect on the solution.

Report of Hydrogeological Exploration and Review
Municipal Wastewater Treatment Plant, Eau Claire, Wisconsin October 15, 2012
AET Report No. 31-00455.02 Page 24 of 25
8.0 RECOMMENDATIONS
Based on the findings and conclusions presented above, we recommended the following actions be
considered for long-term groundwater level control efforts at the WWTP digester complex.
1. Continue to monitor water levels in the newly-installed piezometers on a quarterly (once
every three months) basis, increasing to daily measurements when the Chippewa River is at
or above elevation 759 feet near the plant. One or more of the piezometer could be equipped
with an automated data logger set to record at a specific time intervals.
2. Contract a water well driller to jet and clean dewatering well W-4. Have the driller pump the
well using a high capacity pump capable of discharging at least 2,500 GPM. Monitor water
levels in the pumped well and surrounding piezometers and wells using automated data
loggers. Utilize this data to determine well efficiencies and pumping capacities. If the pump
intake is set within the screened interval, the casing should be monitored for sand intrusion
during pumping.
3. Conduct a cost-benefit analysis on additional submersible and vertical turbine pumps, or
combinations thereof, to meet the aggregate pumping volume of 7,500 GPM. Adjust the
pumping scenarios and aggregate pumping volume based on the pumping test results at well
W-4, if needed.
4. Pull at least one existing pump from either well W-1 or W-7 to redo the video survey
completed in 2001 and observe the amount of fouling that has returned. Because these wells
are pumped on an infrequent basis, maintenance and cleaning should be done on a regularly-
scheduled basis. The pump manufacturers should be consulted regarding routine operation
even during low groundwater conditions to keep the pumps in working order and to ensure
operating conditions are maintained.
Higher flow rates should be expected initially as the soils drain due to gravity after the water table is
lowered; this volume of water is defined as storativity or the specific yield (drainable porosity) for an

Report of Hydrogeological Exploration and Review
Municipal Wastewater Treatment Plant, Eau Claire, Wisconsin October 15, 2012
AET Report No. 31-00455.02 Page 25 of 25
unconfined aquifer. Lowering of the groundwater table below normal levels can induce settlement.
Estimation or analysis of settlement due to dewatering was not part of our scope of services. A
qualified dewatering engineer should be consulted to determine whether the theoretical and actual
drawdowns could affect nearby buildings and utilities.
Donohue and the City weighed the implications of implementing these recommendations versus an
alternative to structurally modify the digester basement floor slab to resist uplift pressures. On
September 21, 2012, Donohue informed AET that the alternative approach for a structural slab was
chosen instead of a new permanent dewatering system.
9.0 STANDARD OF CARE
The data derived through this exploration program have been used to develop our opinions about the
subsurface conditions at this site. However, because no exploration program can reveal totally what
is in the subsurface, conditions between borings and between samples, and at other times, may differ
from conditions described in this report. The exploration we conducted identified subsurface
conditions only at those points where we took samples or observed ground water conditions.
Depending on the sampling methods and sampling frequency, every soil layer may not be observed,
and some materials or layers which are present in the ground may not be noted on the boring logs.
Within the limitations of scope, budget, and schedule, we have endeavored to provide our services
according to generally accepted engineering practices at this time and location. No warranty, express
or implied, is made.
If soil and groundwater conditions differing from our exploration and test results are identified, AET
should be immediately contacted to review these conditions to determine whether there are impacts
on our conclusions and recommendations. This report was prepared based on our current
understanding of the project and conditions at the site.

Tables
1. Boring/Piezometer Completion Information
2. Summary of Gradation Results and Kozeny-
Carman Calculations
3. Summary of Single Well Response (Slug) Test
Results

B-1 B-2 B-3
(P-3)
B-4
(P-4)
B-5
(P-5)
B-6
(P-6)
B-7
(P-7)
B-8 B-9 B-10 B-11
3/26/2012 3/27/2012 4/12/2012 4/11/2012 4/11/2012 4/2/2012 4/2/2012 4/9/2012 4/5/2012 4/4/2012 4/3/2012
NA NA 5/10/2012 5/10/2012 5/9/2012 5/9/2012 5/9/2012 NA NA NA NA
Easting (feet) 328120 328189 328478 328274 328476 328614 328788 328708 328848 328777 328714
Northing (feet) 269154 269206 269203 269429 269505 269568 269634 269569 269568 269517 269412
Boring Terminus 76 51 61.5 61.5 61 36.5 36.5 51 71.5 76 76.5
Piezometer Terminus NA NA 50.5 50.5 35.5 36 35.5 NA NA NA NA
Groundwater when Drilled 11.7 11.6 16.5 17.8 15.5 13.5 13.5 14.2 14.7 14.6 14.9
Groundwater when Installed NA NA 13.8 14.9 13.5 11.9 12.2 NA NA NA NA
Riser (stick up) NA NA -3.1 -3.1 -3.0 -3.0 -2.9 NA NA NA NA
Top of Screen NA NA 45.0 44.9 30.1 29.1 30.0 NA NA NA NA
Bottom of Screen NA NA 50.0 49.9 35.1 34.1 35.0 NA NA NA NA
Date Developed NA NA 5/17/2012 5/17/2012 5/17/2012 5/17/2012 5/17/2012 NA NA NA NA
Initial Water Level (feet bgs) NA NA 18.54 19.51 17.41 16.77 16.44 NA NA NA NA
Final Water Level (feet bgs) NA NA 18.56 19.52 17.43 16.80 16.46 NA NA NA NA
Purge Rate (gpm) NA NA 1.1 1.1 1.0 0.5 0.6 NA NA NA NA
Total Purge Volume (gallons) NA NA 75 75 55 45 55 NA NA NA NA
Groundwater on 5/16/2012 NM NM 18.37 19.33 17.22 16.60 16.26 NM NM NM NM
Groundwater on 5/18/2012 NM NM 18.82 19.76 17.66 17.03 16.74 NM NM NM NM
Groundwater on 5/31/2012 NM NM 18.55 19.60 17.55 16.95 16.55 NM NM NM NM
Groundwater on 6/15/2012 NM NM 20.65 21.58 19.53 18.94 18.52 NM NM NM NM
Ground Surface (P) 767.9 768.2 771.0 772.0 770.2 769.5 769.4 770.2 770.1 770.1 770.1
Top of Riser NA NA 774.11 775.12 773.10 772.57 772.25 NA NA NA NA
Top of Screen NA NA 726.0 727.1 740.1 740.4 739.4 NA NA NA NA
Bottom of Screen NA NA 721.0 722.1 735.1 735.4 734.4 NA NA NA NA
Groundwater on Date Drilled 756.2 756.6 754.5 754.2 754.7 756.0 755.9 756.0 755.4 755.5 755.2
Groundwater on 5/16/2012 NM NM 755.74 755.79 755.88 755.97 755.99 NM NM NM NM
Groundwater on 5/18/2012 NM NM 755.29 755.36 755.44 755.54 755.51 NM NM NM NM
Groundwater on 5/31/2012 NM NM 755.56 755.52 755.55 755.62 755.70 NM NM NM NM
Groundwater on 6/15/2012 NM NM 753.46 753.54 753.57 753.63 753.73 NM NM NM NM
ECCC, NAD 83 = Eau Claire County Coordinates, North American Datum of 1983; approximate
bgs = below ground surface
btor = below top of riser
NAVD 88 = North American Vertical Datum of 1988
NA = Not Applicable
NM = Not Measured
Table 1
Boring/Piezometer Completion Information
Eau Claire, Wisconsin
AET Project No. 31-00455
Municipal Wastewater Treatment Plant
Coordinates
(ECCC,
NAD 83)
Elevations
(feet NAVD88)
Boring (Piezometer=P)
Date Installed (P)
Depths
(feet bgs)
Depths
(feet btor)
Date Drilled
Piezometer
Development
Table 1
Page 1 of 2

B-12 B-13 B-14 B-15 B-16 B-17
(P-17)
B-18 B-19
(P-19)
B-20
(P-20)
B-21 B-22
4/9/2012 3/28/2012 3/28/2012 3/28/2012 3/28/2012 4/2/2012 3/27/2012 3/27/2012 3/27/2012 4/12/2012 4/12/2012
NA NA NA NA NA 5/14/2012 NA 5/11/2012 5/11/2012 NA NA
Easting (feet) 328838 328925 328888 328923 328946 328979 329051 328620 328230 329001 328949
Northing (feet) 269414 269512 269463 269416 269269 269034 268818 268758 268828 269883 269903
Boring Terminus 51 21.5 21.5 21.5 36.5 36.5 16.5 16.5 14.0 26.5 26.5
Piezometer Terminus NA NA NA NA NA 35.5 NA 50.5 49.9 NA NA
Groundwater when Drilled 15.3 12.4 12.9 13.4 15.7 16.1 14.0 12.8 14.0 17.0 16.0
Groundwater when Installed NA NA NA NA NA 14.5 NA 11.9 13.0 NA NA
Riser (stick up) NA NA NA NA NA -3.1 NA -3.1 -3.1 NA NA
Top of Screen NA NA NA NA NA 30.1 NA 45.0 44.9 NA NA
Bottom of Screen NA NA NA NA NA 35.1 NA 50.0 49.9 NA NA
Date Developed NA NA NA NA NA 5/16/2012 NA 5/16/2012 5/17/2012 NA NA
Initial Water Level (feet bgs) NA NA NA NA NA 18.07 NA 16.53 17.79 NA NA
Final Water Level (feet bgs) NA NA NA NA NA 18.99 NA 16.59 17.80 NA NA
Purge Rate (gpm) NA NA NA NA NA 1.5 NA 0.6 1.3 NA NA
Total Purge Volume (gallons) NA NA NA NA NA 80 NA 85 60 NA NA
Groundwater on 5/16/2012 NM NM NM NM NM 18.07 NM 16.53 17.58 NM NM
Groundwater on 5/18/2012 NM NM NM NM NM 19.42 NM 17.05 18.10 NM NM
Groundwater on 5/31/2012 NM NM NM NM NM 18.95 NM 16.50 17.60 NM NM
Groundwater on 6/15/2012 NM NM NM NM NM 21.18 NM 18.75 19.63 NM NM
Ground Surface 770.2 768.7 769.3 769.6 772.2 771.4 770.5 768.9 769.9 770.6 770.3
Top of Riser NA NA NA NA NA 774.53 NA 772.01 772.93 NA NA
Top of Screen NA NA NA NA NA 741.3 NA 723.9 725.0 NA NA
Bottom of Screen NA NA NA NA NA 736.3 NA 718.9 720.0 NA NA
Groundwater on Date Drilled 754.9 756.3 756.4 756.2 756.5 755.3 756.5 756.1 755.9 753.6 754.3
Groundwater on 5/16/2012 NM NM NM NM NM 756.46 NM 755.48 755.35 NM NM
Groundwater on 5/18/2012 NM NM NM NM NM 755.11 NM 754.96 754.83 NM NM
Groundwater on 5/31/2012 NM NM NM NM NM 755.58 NM 755.51 755.33 NM NM
Groundwater on 6/15/2012 NM NM NM NM NM 753.35 NM 753.26 753.30 NM NM
ECCC, NAD 83 = Eau Claire County Coordinates, North American Datum of 1983; approximate
bgs = below ground surface
btor = below top of riser
NAVD 88 = North American Vertical Datum of 1988
NA = Not Applicable
NM = Not Measured
Piezometer
Development
Depths
(feet btor)
Elevations
(feet NAVD88)
Boring (Piezometer=P)
Date Installed (P)
Coordinates
(ECCC,
NAD 83)
Depths
(feet bgs)
Date Drilled
Table 1 (continued)
Boring/Piezometer Completion Information
Municipal Wastewater Treatment Plant
Eau Claire, Wisconsin
AET Project No. 31-00455
Table 1
Page 2 of 2

ft/d cm/s ft/d cm/s
B-3 13 44.5 to 46.5 Sand (SP) 1.5 0.23 0.30 142.9 5.0 x 10⁻² 148.7 5.2 x 10
-2
B-3 14 49.5 to 51.5 Sand (SP) 0.9 0.19 0.30 71.1 2.5 x 10⁻² 101.1 3.6 x 10
-2
B-4 13 44.5 to 46.5 Sand (SP) 2.7 0.25 0.30 134.5 4.7 x 10⁻² 178.6 6.3 x 10
-2
B-4 14 49.5 to 51.5 Sand (SP) 1.8 0.27 0.30 122.6 4.3 x 10⁻² 205.4 7.3 x 10
-2
B-5 10 29 to 31 Sand (SP) 3.5 0.35 0.30 235.2 8.3 x 10⁻² 347.8 1.2 x 10
-1
B-5 11 34 to 36 Sand (SP) 2.4 0.35 0.30 248.9 8.8 x 10⁻² 340.7 1.2 x 10
-1
B-6 10 29.5 to 31.5 Sand (SP) 3.3 0.28 0.30 165.8 5.9 x 10⁻² 217.8 7.7 x 10
-2
B-6 11 34.5 to 36.5 Sand (SP) 1.7 0.34 0.30 244.5 8.6 x 10⁻² 325.0 1.2 x 10
-1
B-7 10 29.5 to 31.5 Sand (SP) 2.4 0.33 0.30 240.4 8.5 x 10⁻² 303.8 1.1 x 10
-1
B-7 11 34.5 to 36.5 Sand (SP) 1.5 0.20 0.30 144.5 5.1 x 10⁻² 110.8 3.9 x 10
-2
B-17 10 29.5 to 31.5 Sand (SP) 1.4 0.21 0.30 84.3 3.0 x 10⁻² 128.2 4.5 x 10
-2
B-17 11 34.5 to 36.5 Sand (SP) 2.6 0.31 0.30 192.0 6.8 x 10⁻² 273.8 9.7 x 10
-2
* A nominal value of 30% was used, which is in the published range of 25% to 50% for unconsolidated sand (Freeze and Cherry, Groundwater, 1979)
Table 2
Summary of Gradation Results and Kozeny-Carman Calculations
AET Project No. 31-00455
Kozeny-Carman
Municipal Wastewater Treatment Plant
Eau Claire, Wisconsin
Boring No. Sample
ID
Depth
(feet)
Estimated Hydraulic Conductivity
HazenUSCSP-200
(%)D10 (mm)
Estimated
Porosity*
(%)

ft/d cm/s ft/d cm/s ft/d cm/s
S-G Slug In #1 569.0 2.0 x 10⁻¹
S-G Slug In #2 541.4 1.9 x 10⁻¹
S-G Slug In #3 574.3 2.0 x 10⁻¹
S-G Slug Out #1 447.2 1.6 x 10⁻¹
S-G Slug Out #2 327.2 1.2 x 10⁻¹
S-G Slug Out #3 455.5 1.6 x 10⁻¹
S-G Slug In #1 322.3 1.1 x 10⁻¹
S-G Slug In #2 366.9 1.3 x 10⁻¹
S-G Slug In #3 325.0 1.1 x 10⁻¹
S-G Slug Out #1 346.8 1.2 x 10⁻¹
S-G Slug Out #2 321.8 1.1 x 10⁻¹
S-G Slug Out #3 318.8 1.1 x 10⁻¹
S-G Slug In #1 198.5 7.0 x 10⁻²
S-G Slug In #2 227.6 8.0 x 10⁻²
S-G Slug In #3 195.2 6.9 x 10⁻²
S-G Slug Out #1 430.8 1.5 x 10⁻¹
S-G Slug Out #2 382.9 1.4 x 10⁻¹
S-G Slug Out #3 411.1 1.5 x 10⁻¹
S-G Slug In #1 445.0 1.6 x 10⁻¹
S-G Slug In #2 548.5 1.9 x 10⁻¹
S-G Slug In #3 518.2 1.8 x 10⁻¹
S-G Slug Out #1 249.0 8.8 x 10⁻²
S-G Slug Out #2 195.5 6.9 x 10⁻²
S-G Slug Out #3 259.3 9.1 x 10⁻²
S-G = Springer-Gelhar
B-R = Bouwer-Rice
Table 3
Summary of Single Well Response (Slug) Test Results
Municipal Wastewater Treatment Plan
Eau Claire, Wisconsin
AET Project No. 31-00455
Average Location Results
P-3
561.6 2.0 x 10⁻¹
485.8 1.7 x 10⁻¹
410.0
Piezometer Test
Estimated Hydraulic Conductivity
Individual Test Results
1.4 x 10⁻¹
P-4
338.1 1.2 x 10⁻¹
Average Group Results
207.1 7.3 x 10⁻²
Solution
Method
P-5 307.7
333.6 1.2 x 10⁻¹
329.1 1.2 x 10⁻¹
1.1 x 10⁻¹
408.3 1.4 x 10⁻¹
1.3 x 10⁻¹
234.6 8.3 x 10⁻²
P-6
503.9 1.8 x 10⁻¹
369.3
Table 3
Page 1 of 2

ft/d cm/s ft/d cm/s ft/d cm/s
S-G Slug In #1 356.8 1.3 x 10⁻¹
S-G Slug In #2 511.2 1.8 x 10⁻¹
S-G Slug In #3 408.7 1.4 x 10⁻¹
S-G Slug Out #1 298.4 1.1 x 10⁻¹
S-G Slug Out #2 253.8 9.0 x 10⁻²
S-G Slug Out #3 234.0 8.3 x 10⁻²
B-R Slug In #1 82.0 2.9 x 10⁻²
B-R Slug In #2 95.0 3.4 x 10⁻²
B-R Slug In #3 65.6 2.3 x 10⁻²
B-R Slug Out #1 101.9 3.6 x 10⁻²
B-R Slug Out #2 107.4 3.8 x 10⁻²
B-R Slug Out #3 113.9 4.0 x 10⁻²
S-G Slug In #1 286.4 1.0 x 10⁻¹
S-G Slug In #2 312.7 1.1 x 10⁻¹
S-G Slug In #3 317.9 1.1 x 10⁻¹
S-G Slug Out #1 275.9 9.7 x 10⁻²
S-G Slug Out #2 225.4 8.0 x 10⁻²
S-G Slug Out #3 226.8 8.0 x 10⁻²
S-G Slug In #1 314.9 1.1 x 10⁻¹
S-G Slug In #2 382.5 1.3 x 10⁻¹
S-G Slug In #3 499.8 1.8 x 10⁻¹
S-G Slug Out #1 379.2 1.3 x 10⁻¹
S-G Slug Out #2 306.5 1.1 x 10⁻¹
S-G Slug Out #3 350.7 1.2 x 10⁻¹
S-G = Springer-Gelhar
B-R = Bouwer-Rice
Table 3
Summary of Single Well Response (Slug) Test Results
Municipal Wastewater Treatment Plan
Eau Claire, Wisconsin
AET Project No. 31-00455
PiezometerSolution
MethodTest
Estimated Hydraulic Conductivity
Individual Test Results Average Group Results Average Location Results
P-7
425.6 1.5 x 10⁻¹
343.8 1.2 x 10⁻¹
262.1 9.2 x 10⁻²
P-17
80.9 2.9 x 10⁻²
94.3 3.3 x 10⁻²
107.7 3.8 x 10⁻²
P-19
305.7 1.1 x 10⁻¹
274.2 9.7 x 10⁻²
242.7 8.6 x 10⁻²
P-20
399.1 1.4 x 10⁻¹
372.3 1.3 x 10⁻¹
345.5 1.2 x 10⁻¹
Table 3
Page 2 of 2

Figures 1. Site Location Map
2. Site Map
3. Well and Piezometer Hydrographs
4. Groundwater Contours (5/18/2012)
5. Simulated Existing Conditions
6. Simulated Flood – Seven Head-Specified Wells
7. Simulated Flood – Seven Discharge-Specified
Wells
8. Simulated Flood – Three Discharge Specified
Wells
9. Simulated Flood – Anecdotal Evidence

_̂
0 2,0001,000
Feet
±Map Reference: ArcGIS USA Topo Maps
File: Figure01-SLM.mxd Date: 05/31/2012
AMERICANENGINEERINGTESTING, INC
Site Location Map
AET Project No. 31-00455
Municipal Wastewater Treatment Plant1000 Ferry Street
Eau Claire, Wisconsin
Figure 1
Date: 05/31/2012
Hydrogeological Exploration and Review1:24,000
Legend
_̂ Site

&<
&< &<
&<
&<
&<
&<
&< &<
&<
&< &<
&<
&<
&<
&<
&<
&<
&<
&<
&<&<
@A
@A
@A
@A
@A
@A
@A
@A
!.
!.
!.!.
!.
!.
!.
!.
&<
&<
B-9B-8
B-7
B-6B-5
B-4
B-3B-2B-1
B-22B-21
B-20B-19
B-18
B-17
B-16
B-15B-14
B-13
B-12B-11
B-10
P-7
P-6P-5
P-4
P-3
P-20P-19
P-17
W-7
W-6
W-5W-4
W-3
W-2
W-1
W-8 (?)
21
0 200100
Feet
±Map Reference: ArcGIS World Imagery
File: Figure02-SM.mxd Date: 06/11/2012
AMERICANENGINEERINGTESTING, INC
Site Map
AET Project No.31-00455
Municipal Wastewater Treatment Plant1000 Ferry Street
Eau Claire, Wisconsin
Figure 2
Date: 06/11/2012
Hydrogeological Exploration and Review1:2,400
Legend!. Dewatering Well 18"x60' nominal&< AET Boring 2012
@A AET Boring/Piezometer 2012
&< Tetra Tech Boring 2007
Image: 2009
AdministrationBuilding
DigesterComplex

Date: 06/15/12 31-00455
Figure No. 3
Well and Piezometer Hydrographs
Hydrogeological Exploration and Review
Municipal Wastewater Treatment Plant
1000 Ferry Street
Eau Claire, WisconsinAET Project No.
3/29/12 5/16/12 5/18/12 5/31/12 6/15/12
W-2 755.72 755.65 755.18 755.55 753.43
W-3 755.88 755.78 755.31 755.60 753.49
W-4 755.84 755.76 755.30 755.64 753.46
W-5 755.85 755.75 755.28 753.42
W-6 755.77 755.69 755.21 755.57 753.44
P-3 755.74 755.29 755.56 753.46
P-4 755.79 755.36 755.52 753.54
P-5 755.88 755.44 755.55 753.57
P-6 755.97 755.54 755.62 753.63
P-7 755.99 755.51 755.70 753.73
P-17 756.46 755.11 755.58 753.35
P-19 755.48 754.96 755.51 753.26
P-20 755.35 754.83 755.33 753.30
753.0
753.5
754.0
754.5
755.0
755.5
756.0
756.5
757.0
Gro
undw
ate
r E
levatio
n (
feet N
AV
D88)
Hydrographs
AMERICAN
ENGINEERING
TESTING, INC.754.8
756.8
3/29/125/16/125/18/125/31/12
Gro
un
dw
ate
r E
levati
o…
Hydrographs W-2 W-3 W-4 W-5 W-6
P-3 P-4 P-5 P-6 P-7
P-17 P-19 P-20
Not Measured
Not Installed

@A
@A
@A
@A
@A
@A
@A
@A
!.
!.
!.!.
!.
!.
!.
!.
F755.2
755.3
755.1
755.4
755.0
755.5
754.9
P-7
P-6
P-5
P-4
P-3
P-20
P-19
P-17
W-7
W-6
W-5W-4
W-3
W-2
W-1
W-8 (?)
0 15075
Feet
±Map Reference: ArcGIS World Imagery
File: Figure04-GWTC-2012-05-18.mxd Date: 06/06/2012
AMERICANENGINEERINGTESTING, INC
Groundwater Contours (5/18/2018)
AET Project No.31-00455
Municipal Wastewater Treatment Plant1000 Ferry Street
Eau Claire, Wisconsin
Figure 4
Date: 06/06/2012
Hydrogeological Exploration and Review1:1,800
Legend!. Dewatering Well 18"x60' nominal
@A Piezometer 2012Groundwater Contour 5-18-2012F
General Flow Direction
Image: 2009
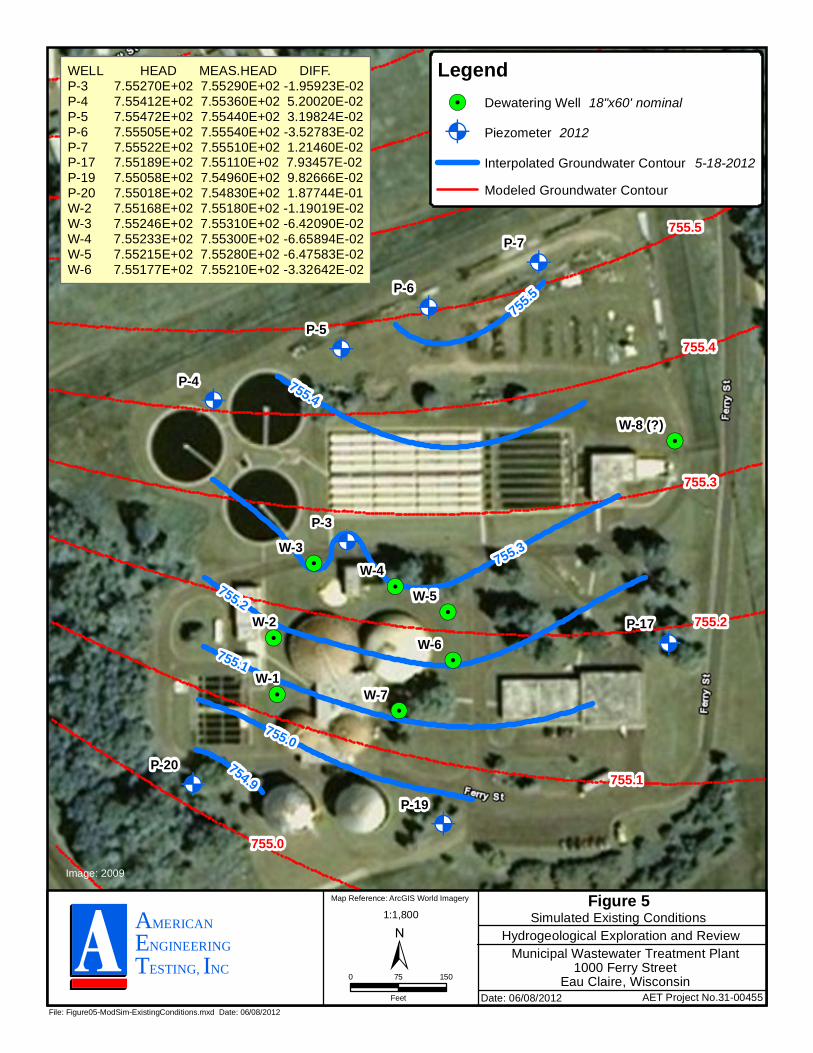
@A
@A
@A
@A
@A
@A
@A
@A
!.
!.
!.!.
!.
!.
!.
!.
755.2
755.3
755.1
755.4
755.0
755.5
754.9
P-7
P-6
P-5
P-4
P-3
P-20
P-19
P-17
W-7
W-6
W-5W-4
W-3
W-2
W-1
W-8 (?)
0 15075
Feet
±Map Reference: ArcGIS World Imagery
File: Figure05-ModSim-ExistingConditions.mxd Date: 06/08/2012
AMERICANENGINEERINGTESTING, INC
Simulated Existing Conditions
AET Project No.31-00455
Municipal Wastewater Treatment Plant1000 Ferry Street
Eau Claire, Wisconsin
Figure 5
Date: 06/08/2012
Hydrogeological Exploration and Review1:1,800
Legend!. Dewatering Well 18"x60' nominal
@A Piezometer 2012Interpolated Groundwater Contour 5-18-2012Modeled Groundwater Contour
Image: 2009
755.0
755.5
755.4
755.3
755.2
755.1
WELL HEAD MEAS.HEAD DIFF.P-3 7.55270E+02 7.55290E+02 -1.95923E-02P-4 7.55412E+02 7.55360E+02 5.20020E-02P-5 7.55472E+02 7.55440E+02 3.19824E-02P-6 7.55505E+02 7.55540E+02 -3.52783E-02P-7 7.55522E+02 7.55510E+02 1.21460E-02P-17 7.55189E+02 7.55110E+02 7.93457E-02P-19 7.55058E+02 7.54960E+02 9.82666E-02P-20 7.55018E+02 7.54830E+02 1.87744E-01W-2 7.55168E+02 7.55180E+02 -1.19019E-02W-3 7.55246E+02 7.55310E+02 -6.42090E-02W-4 7.55233E+02 7.55300E+02 -6.65894E-02W-5 7.55215E+02 7.55280E+02 -6.47583E-02W-6 7.55177E+02 7.55210E+02 -3.32642E-02
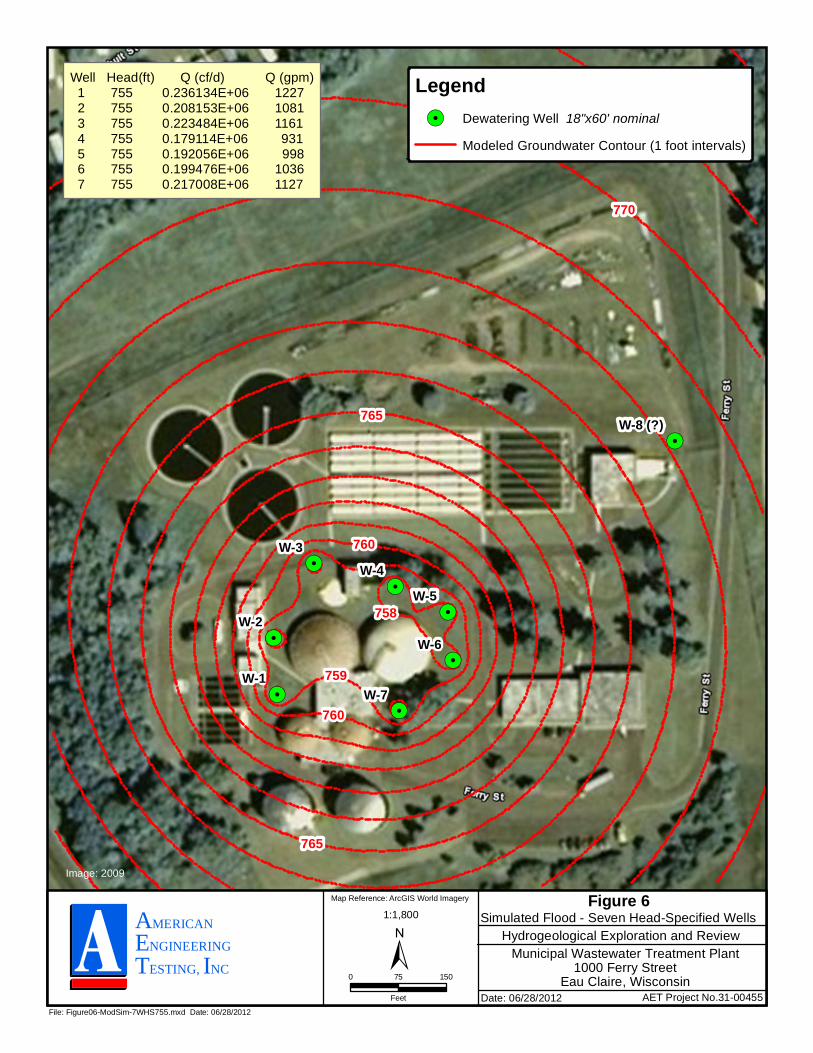
!.
!.
!.!.
!.
!.
!.
!.
W-7
W-6
W-5W-4
W-3
W-2
W-1
W-8 (?)
0 15075
Feet
±Map Reference: ArcGIS World Imagery
File: Figure06-ModSim-7WHS755.mxd Date: 06/28/2012
AMERICANENGINEERINGTESTING, INC
Simulated Flood - Seven Head-Specified Wells
AET Project No.31-00455
Municipal Wastewater Treatment Plant1000 Ferry Street
Eau Claire, Wisconsin
Figure 6
Date: 06/28/2012
Hydrogeological Exploration and Review1:1,800
Legend!. Dewatering Well 18"x60' nominal
Modeled Groundwater Contour (1 foot intervals)
Image: 2009
765
759
760
758
760
765
Well Head(ft) Q (cf/d) Q (gpm) 1 755 0.236134E+06 1227 2 755 0.208153E+06 1081 3 755 0.223484E+06 1161 4 755 0.179114E+06 931 5 755 0.192056E+06 998 6 755 0.199476E+06 1036 7 755 0.217008E+06 1127
770
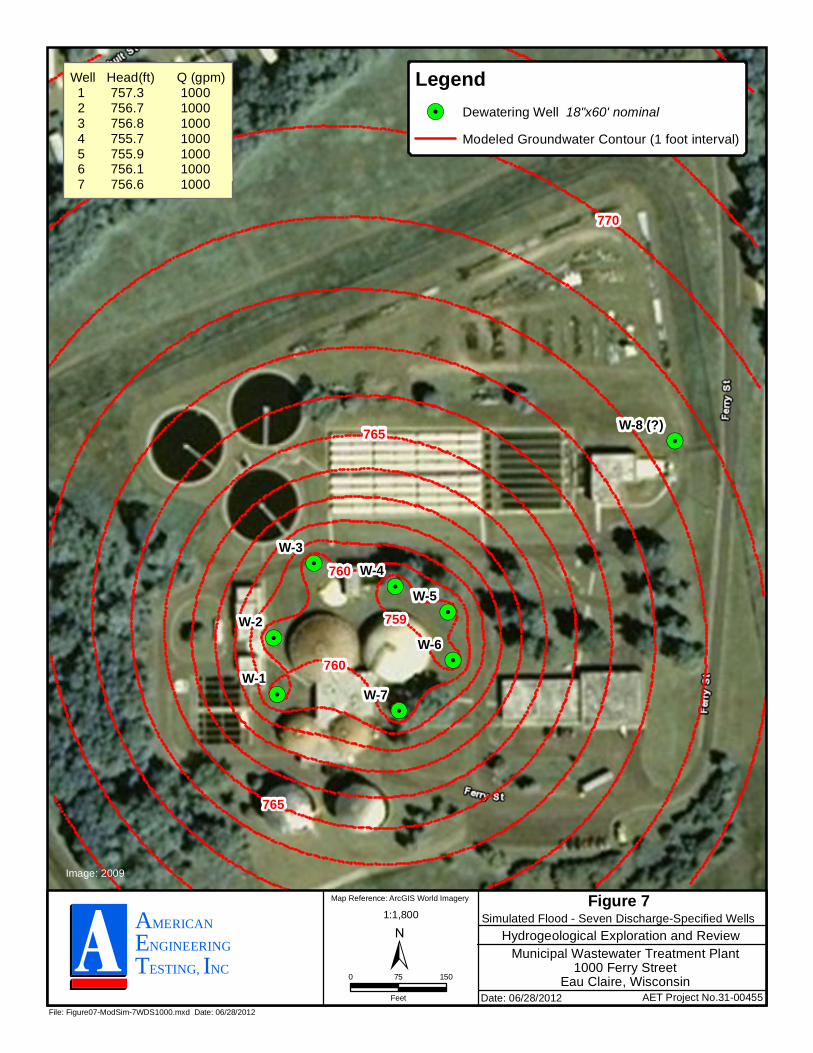
!.
!.
!.!.
!.
!.
!.
!.
W-7
W-6
W-5W-4
W-3
W-2
W-1
W-8 (?)
0 15075
Feet
±Map Reference: ArcGIS World Imagery
File: Figure07-ModSim-7WDS1000.mxd Date: 06/28/2012
AMERICANENGINEERINGTESTING, INC
Simulated Flood - Seven Discharge-Specified Wells
AET Project No.31-00455
Municipal Wastewater Treatment Plant1000 Ferry Street
Eau Claire, Wisconsin
Figure 7
Date: 06/28/2012
Hydrogeological Exploration and Review1:1,800
Legend!. Dewatering Well 18"x60' nominal
Modeled Groundwater Contour (1 foot interval)
Image: 2009
765
760
759
760
765
Well Head(ft) Q (gpm) 1 757.3 1000 2 756.7 1000 3 756.8 1000 4 755.7 1000 5 755.9 1000 6 756.1 1000 7 756.6 1000
770

!.
!.
!.!.
!.
!.
!.
!.
W-7
W-6
W-5W-4
W-3
W-2
W-1
W-8 (?)
0 15075
Feet
±Map Reference: ArcGIS World Imagery
File: Figure08-ModSim-3WDS2500.mxd Date: 06/09/2012
AMERICANENGINEERINGTESTING, INC
Simulated Flood - Three Discharge-Specified Wells
AET Project No.31-00455
Municipal Wastewater Treatment Plant1000 Ferry Street
Eau Claire, Wisconsin
Figure 8
Date: 06/09/2012
Hydrogeological Exploration and Review1:1,800
Legend!. Dewatering Well 18"x60' nominal
Modeled Groundwater Contour (1 foot interval)
Image: 2009
765
758759
760
765
Well Head(ft) Q (gpm) 1 748.3 2500 2 760.0 0 3 761.2 0 4 748.0 2500 5 760.1 0 6 760.1 0 7 747.5 2500
770
760
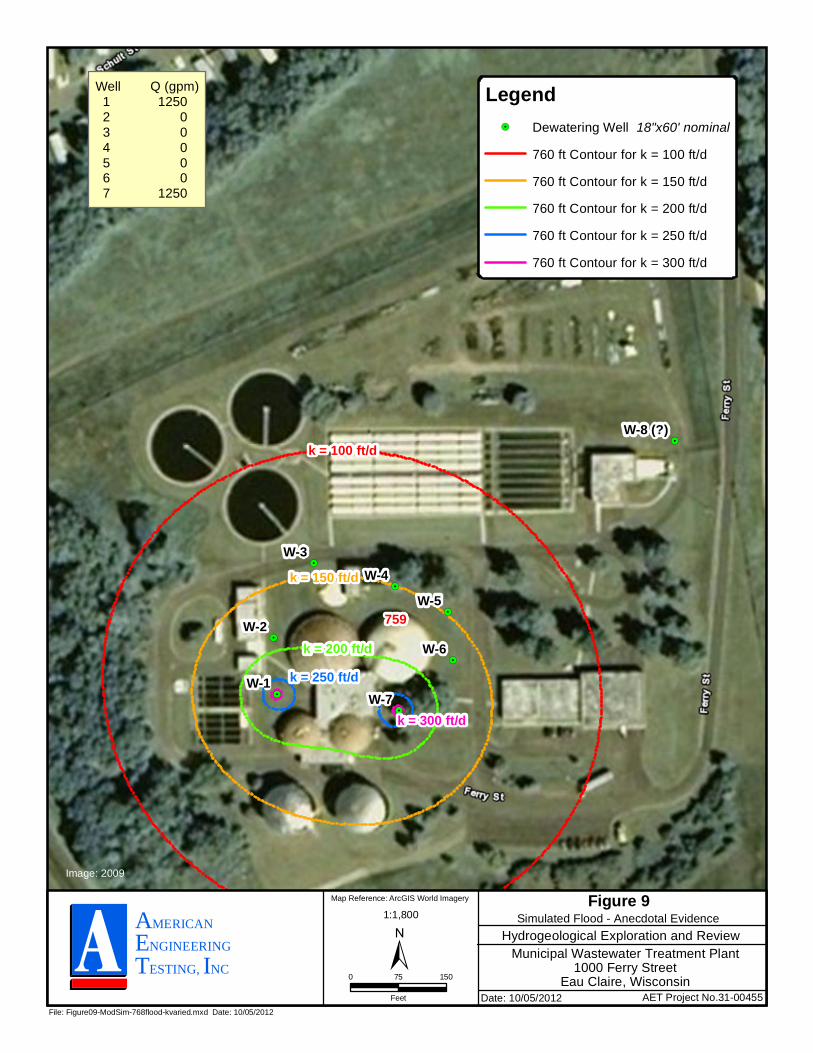
!.
!.
!.
!.
!.
!.
!.
!.
W-7
W-6
W-5W-4
W-3
W-2
W-1
W-8 (?)
0 15075
Feet
±Map Reference: ArcGIS World Imagery
File: Figure09-ModSim-768flood-kvaried.mxd Date: 10/05/2012
AMERICANENGINEERINGTESTING, INC
Simulated Flood - Anecdotal Evidence
AET Project No.31-00455
Municipal Wastewater Treatment Plant1000 Ferry Street
Eau Claire, Wisconsin
Figure 9
Date: 10/05/2012
Hydrogeological Exploration and Review1:1,800
Legend!. Dewatering Well 18"x60' nominal
760 ft Contour for k = 100 ft/d760 ft Contour for k = 150 ft/d760 ft Contour for k = 200 ft/d760 ft Contour for k = 250 ft/d760 ft Contour for k = 300 ft/d
Image: 2009
k = 250 ft/dk = 200 ft/d
759
k = 150 ft/d
k = 100 ft/d
Well Q (gpm) 1 1250 2 0 3 0 4 0 5 0 6 0 7 1250
k = 300 ft/d

Appendix A
Soil Boring Logs and
Classification/Exploration/Log Notes

FILL
FINEALLUVIUM
COARSEALLUVIUM
FILL, silty sand with organics, dark brownFILL, sand, a little gravel, brown
SILT WITH SAND, trace roots, brown, moist,very loose (ML)
SAND, a little gravel, fine to medium grained,brown, moist to waterbearing, loose (SP)
SANDY GRAVEL, brown, waterbearing,medium dense (GP)
M
M
M
M
M
W
W
W
W
W
SS
SS
SS
SS
SS
SS
SS
SS
SS
SS
7
9
4
8
8
7
9
13
10
24
18
18
20
20
20
12
14
4
6
6
767.9
GM LG:
SAMPLEDDEPTH
11.7
DR:
BORINGCOMPLETED: 3/26/12
CAVE-INDEPTH
DRILLING METHOD NOTE: REFER TO
THE ATTACHED
SHEETS FOR AN
EXPLANATION OF
TERMINOLOGY ON
THIS LOG
TIME
3/26/12 12.0
SURFACE ELEVATION:
CASINGDEPTH0' to 14.5'
14.5' to 76' 14.0
DEPTH:
DRILLINGFLUID LEVELDATE
30MH
3.25" HSARD w/DM
WATER LEVEL MEASUREMENTS
11.9
WATERLEVEL
9:15
Rig:
RECIN.
AET JOB NO:
PROJECT:
B-1 (p. 1 of 3)LOG OF BORING NO.
FIELD & LABORATORY TESTS
1
2
3
4
5
6
7
8
9
10
11
12
13
14
15
16
17
18
19
20
21
22
23
24
25
26
27
28
29
30
31
31-00455
06/04
DENWC LLMC
AMERICANENGINEERINGTESTING, INC.
DEPTHIN
FEETN SAMPLE
TYPEGEOLOGY
MATERIAL DESCRIPTION %-#200PL
SUBSURFACE BORING LOG
Eau Claire Wastewater Treatment Plant, 1000 Ferry Street; Eau Claire, Wisconsin

FINEALLUVIUM
COARSEALLUVIUM
SANDY GRAVEL, brown, waterbearing,medium dense (GP) (continued)
SAND WITH GRAVEL, fine to mediumgrained, grayish brown, waterbearing, mediumdense, laminations of lean clay (SP)
SANDY LEAN CLAY, a little gravel, gray,waterbearing, firm (CL)
SAND WITH GRAVEL, fine to coarse grained,grayish brown, waterbearing, medium dense tovery dense (SP)
M
M
M
M
M
M
M
SS
SS
SS
SS
SS
SS
SS
23
20
27
18
23
8
18
6
2
2
14
8
1
14
RECIN.
AET JOB NO:
PROJECT:
B-1 (p. 2 of 3)LOG OF BORING NO.
FIELD & LABORATORY TESTS
33
34
35
36
37
38
39
40
41
42
43
44
45
46
47
48
49
50
51
52
53
54
55
56
57
58
59
60
61
62
63
64
65
66
67
68
69
31-00455
06/04
DENWC LLMC
AMERICANENGINEERINGTESTING, INC.
DEPTHIN
FEETN SAMPLE
TYPEGEOLOGY
MATERIAL DESCRIPTION %-#200PL
SUBSURFACE BORING LOG
Eau Claire Wastewater Treatment Plant, 1000 Ferry Street; Eau Claire, Wisconsin

COARSEALLUVIUM(continued)
SAND WITH GRAVEL, fine to coarse grained,grayish brown, waterbearing, medium dense tovery dense (SP) (continued)
End of boring at 76.0 feet.
M
M
SS
SS
78
77
12
12
RECIN.
AET JOB NO:
PROJECT:
B-1 (p. 3 of 3)LOG OF BORING NO.
FIELD & LABORATORY TESTS
71
72
73
74
75
76
31-00455
06/04
DENWC LLMC
AMERICANENGINEERINGTESTING, INC.
DEPTHIN
FEETN SAMPLE
TYPEGEOLOGY
MATERIAL DESCRIPTION %-#200PL
SUBSURFACE BORING LOG
Eau Claire Wastewater Treatment Plant, 1000 Ferry Street; Eau Claire, Wisconsin

FILL
BURIEDTOPSOILCOARSEALLUVIUM
FILL, silty sand with organics, dark brownFILL, silty sand, brown
FILL, sand, a little gravel, light brown
FILL, sand with silt, brown
SANDY SILT WITH ROOTS, dark brown,moist, loose (ML)SAND, a little gravel, fine to medium grained,light brown, moist, loose (SP)
SAND, a little gravel, fine to medium grained,grayish brown, waterbearing, loose (SP)
GRAVELLY SAND, fine to coarse grained,brown, waterbearing, loose to dense (SP)
M
M
M
M
M
W
W
W
W
W
SS
SS
SS
SS
SS
SS
SS
SS
SS
SS
10
8
5
8
6
7
7
34
13
18
18
18
18
20
20
12
12
12
0
12
768.2
GM LG:
SAMPLEDDEPTH
11.6
DR:
BORINGCOMPLETED: 3/27/12
CAVE-INDEPTH
DRILLING METHOD NOTE: REFER TO
THE ATTACHED
SHEETS FOR AN
EXPLANATION OF
TERMINOLOGY ON
THIS LOG
TIME
3/27/12 12.0
SURFACE ELEVATION:
CASINGDEPTH0' to 14.5'
14.5' to 51' 14.0
DEPTH:
DRILLINGFLUID LEVELDATE
30MH
3.25" HSARD w/DM
WATER LEVEL MEASUREMENTS
12.0
WATERLEVEL
8:10
Rig:
RECIN.
AET JOB NO:
PROJECT:
B-2 (p. 1 of 2)LOG OF BORING NO.
FIELD & LABORATORY TESTS
1
2
3
4
5
6
7
8
9
10
11
12
13
14
15
16
17
18
19
20
21
22
23
24
25
26
27
28
29
30
31
31-00455
06/04
DENWC LLMC
AMERICANENGINEERINGTESTING, INC.
DEPTHIN
FEETN SAMPLE
TYPEGEOLOGY
MATERIAL DESCRIPTION %-#200PL
SUBSURFACE BORING LOG
Eau Claire Wastewater Treatment Plant, 1000 Ferry Street; Eau Claire, Wisconsin

GRAVELLY SAND, fine to coarse grained,brown, waterbearing, loose to dense (SP)(continued)
End of boring at 51.0 feet.
W
W
W
W
SS
SS
SS
SS
16
17
20
19
8
14
14
16
RECIN.
AET JOB NO:
PROJECT:
B-2 (p. 2 of 2)LOG OF BORING NO.
FIELD & LABORATORY TESTS
33
34
35
36
37
38
39
40
41
42
43
44
45
46
47
48
49
50
51
31-00455
06/04
DENWC LLMC
AMERICANENGINEERINGTESTING, INC.
DEPTHIN
FEETN SAMPLE
TYPEGEOLOGY
MATERIAL DESCRIPTION %-#200PL
SUBSURFACE BORING LOG
Eau Claire Wastewater Treatment Plant, 1000 Ferry Street; Eau Claire, Wisconsin

TOPSOIL
COARSEALLUVIUM
SAPRIC PEAT, black, most, medium dense(PT)SILTY SAND, trace roots, fine to mediumgrained, black, moist, medium dense (SM)SAND WITH SILT, a little gravel, fine tomedium grained, brown, moist, medium dense(SP-SM)SILTY SAND, fine to medium grained, brown,moist, medium dense (SM)SAND, a little gravel, fine to medium grained,light brown, moist to waterbearing, very loose tomedium dense (SP)
GRAVELLY SAND, fine to coarse grained,brown, waterbearing, medium dense (SP)
M
M
M
M
M
M
M
W
W
W
SS
SS
SS
SS
SS
SS
SS
SS
SS
SS
13
18
13
7
3
4
5
11
10
15
12
20
12
20
18
20
20
16
14
6
771.3
GH LG:
SAMPLEDDEPTH
16.5
DR:
BORINGCOMPLETED: 4/12/12
CAVE-INDEPTH
DRILLING METHOD NOTE: REFER TO
THE ATTACHED
SHEETS FOR AN
EXPLANATION OF
TERMINOLOGY ON
THIS LOG
TIME
4/12/12 19.5
SURFACE ELEVATION:
CASINGDEPTH0' to 19.5'
19.5' to 61.5' 21.5
DEPTH:
DRILLINGFLUID LEVELDATE
67MH
3.25" HSARD w/DM
WATER LEVEL MEASUREMENTS
19.5
WATERLEVEL
8:20
Rig:
RECIN.
AET JOB NO:
PROJECT:
B-3 (p. 1 of 2)LOG OF BORING NO.
FIELD & LABORATORY TESTS
1
2
3
4
5
6
7
8
9
10
11
12
13
14
15
16
17
18
19
20
21
22
23
24
25
26
27
28
29
30
31
31-00455
06/04
DENWC LLMC
AMERICANENGINEERINGTESTING, INC.
DEPTHIN
FEETN SAMPLE
TYPEGEOLOGY
MATERIAL DESCRIPTION %-#200PL
SUBSURFACE BORING LOG
Eau Claire Wastewater Treatment Plant, 1000 Ferry Street; Eau Claire, Wisconsin
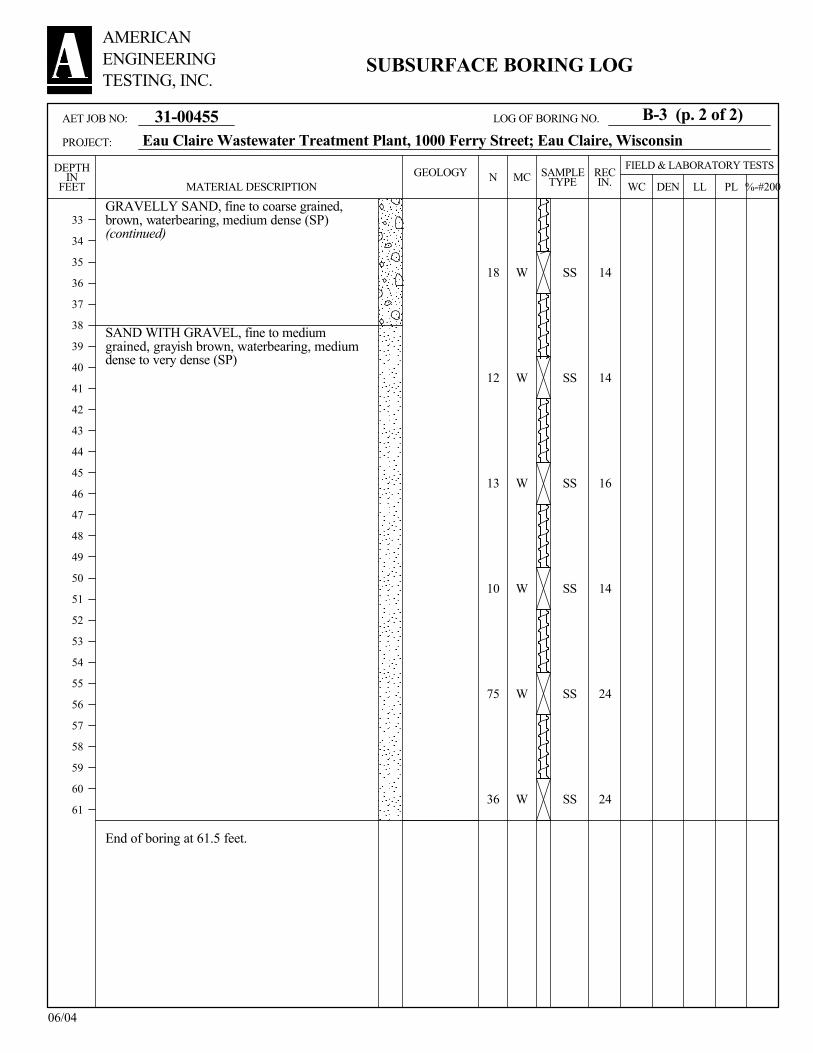
GRAVELLY SAND, fine to coarse grained,brown, waterbearing, medium dense (SP)(continued)
SAND WITH GRAVEL, fine to mediumgrained, grayish brown, waterbearing, mediumdense to very dense (SP)
End of boring at 61.5 feet.
W
W
W
W
W
W
SS
SS
SS
SS
SS
SS
18
12
13
10
75
36
14
14
16
14
24
24
RECIN.
AET JOB NO:
PROJECT:
B-3 (p. 2 of 2)LOG OF BORING NO.
FIELD & LABORATORY TESTS
33
34
35
36
37
38
39
40
41
42
43
44
45
46
47
48
49
50
51
52
53
54
55
56
57
58
59
60
61
31-00455
06/04
DENWC LLMC
AMERICANENGINEERINGTESTING, INC.
DEPTHIN
FEETN SAMPLE
TYPEGEOLOGY
MATERIAL DESCRIPTION %-#200PL
SUBSURFACE BORING LOG
Eau Claire Wastewater Treatment Plant, 1000 Ferry Street; Eau Claire, Wisconsin

TOPSOILCOARSEALLUVIUM
SILTY SAND WITH ROOTS, fine to mediumgrained, black, moist, medium dense (SM)SAND WITH SILT, a little gravel, fine tomedium grained, brown, moist, medium denseto very loose (SP-SM)
GRAVELLY SAND, fine to medium grained,brown, waterbearing, medium dense (SP)
M
M
M
M
M
M
M
W
W
W
SS
SS
SS
SS
SS
SS
SS
SS
SS
SS
12
17
12
5
4
4
8
22
25
20
6
18
18
16
6
19
18
18
3
16
772.1
GH LG:
SAMPLEDDEPTH
17.8
DR:
BORINGCOMPLETED: 4/11/12
CAVE-INDEPTH
DRILLING METHOD NOTE: REFER TO
THE ATTACHED
SHEETS FOR AN
EXPLANATION OF
TERMINOLOGY ON
THIS LOG
TIME
4/11/12 19.5
SURFACE ELEVATION:
CASINGDEPTH0' to 19.5'
19.5' to 61.5' 21.5
DEPTH:
DRILLINGFLUID LEVELDATE
67MH
3.25" HSARD w/DM
WATER LEVEL MEASUREMENTS
20.0
WATERLEVEL
13:50
Rig:
RECIN.
AET JOB NO:
PROJECT:
B-4 (p. 1 of 2)LOG OF BORING NO.
FIELD & LABORATORY TESTS
1
2
3
4
5
6
7
8
9
10
11
12
13
14
15
16
17
18
19
20
21
22
23
24
25
26
27
28
29
30
31
31-00455
06/04
DENWC LLMC
AMERICANENGINEERINGTESTING, INC.
DEPTHIN
FEETN SAMPLE
TYPEGEOLOGY
MATERIAL DESCRIPTION %-#200PL
SUBSURFACE BORING LOG
Eau Claire Wastewater Treatment Plant, 1000 Ferry Street; Eau Claire, Wisconsin

SAND WITH GRAVEL, fine to coarse grained,brown, waterbearing, medium dense to dense(SP)
SAND WITH GRAVEL, fine to mediumgrained, grayish brown, waterbearing, mediumdense (SP)
End of boring at 61.5 feet.
W
W
W
W
W
W
SS
SS
SS
SS
SS
SS
22
34
16
18
23
19
14
16
16
14
18
18
RECIN.
AET JOB NO:
PROJECT:
B-4 (p. 2 of 2)LOG OF BORING NO.
FIELD & LABORATORY TESTS
33
34
35
36
37
38
39
40
41
42
43
44
45
46
47
48
49
50
51
52
53
54
55
56
57
58
59
60
61
31-00455
06/04
DENWC LLMC
AMERICANENGINEERINGTESTING, INC.
DEPTHIN
FEETN SAMPLE
TYPEGEOLOGY
MATERIAL DESCRIPTION %-#200PL
SUBSURFACE BORING LOG
Eau Claire Wastewater Treatment Plant, 1000 Ferry Street; Eau Claire, Wisconsin

TOPSOILCOARSEALLUVIUM
SILTY SAND WITH ROOTS, fine to mediumgrained, black, moist, loose (SM)SILTY SAND, a little gravel, fine to mediumgrained, brown, moist, loose (SM)SAND, a little gravel, fine to medium grained,brown, moist, medium dense (SP)SILTY SAND, mostly fine grained, brown,moist, very loose (ML)
SAND WITH GRAVEL, fine to mediumgrained, light brown, moist, loose to mediumdense (SP)
GRAVELLY SAND, fine to medium grained,brown, moist to waterbearing, medium dense(SP)
GRAVELLY SAND, fine to coarse grained,brown, waterbearing, medium dense (SP)
M
M
M
M
M
M
W
W
W
W
SS
SS
SS
SS
SS
SS
SS
SS
SS
SS
9
11
3
5
8
15
25
12
27
16
22
16
21
17
19
17
15
7
8
12
770.2
GH LG:
SAMPLEDDEPTH
15.5
DR:
BORINGCOMPLETED: 4/11/12
CAVE-INDEPTH
DRILLING METHOD NOTE: REFER TO
THE ATTACHED
SHEETS FOR AN
EXPLANATION OF
TERMINOLOGY ON
THIS LOG
TIME
4/10/12 14.5
SURFACE ELEVATION:
CASINGDEPTH0' to 14.5'
14.5' to 61' 16.5
DEPTH:
DRILLINGFLUID LEVELDATE
67MH
3.25" HSARD w/DM
WATER LEVEL MEASUREMENTS
15.5
WATERLEVEL
16:30
Rig:
RECIN.
AET JOB NO:
PROJECT:
B-5 (p. 1 of 2)LOG OF BORING NO.
FIELD & LABORATORY TESTS
1
2
3
4
5
6
7
8
9
10
11
12
13
14
15
16
17
18
19
20
21
22
23
24
25
26
27
28
29
30
31
31-00455
06/04
DENWC LLMC
AMERICANENGINEERINGTESTING, INC.
DEPTHIN
FEETN SAMPLE
TYPEGEOLOGY
MATERIAL DESCRIPTION %-#200PL
SUBSURFACE BORING LOG
Eau Claire Wastewater Treatment Plant, 1000 Ferry Street; Eau Claire, Wisconsin

GRAVELLY SAND, fine to coarse grained,brown, waterbearing, medium dense (SP)(continued)
SAND WITH GRAVEL, fine to coarse grained,grayish brown, waterbearing, medium dense(SP)
End of boring at 61.0 feet.
W
W
W
W
W
W
SS
SS
SS
SS
SS
SS
16
16
16
22
17
15
10
14
16
20
16
20
RECIN.
AET JOB NO:
PROJECT:
B-5 (p. 2 of 2)LOG OF BORING NO.
FIELD & LABORATORY TESTS
33
34
35
36
37
38
39
40
41
42
43
44
45
46
47
48
49
50
51
52
53
54
55
56
57
58
59
60
61
31-00455
06/04
DENWC LLMC
AMERICANENGINEERINGTESTING, INC.
DEPTHIN
FEETN SAMPLE
TYPEGEOLOGY
MATERIAL DESCRIPTION %-#200PL
SUBSURFACE BORING LOG
Eau Claire Wastewater Treatment Plant, 1000 Ferry Street; Eau Claire, Wisconsin

TOPSOIL
COARSEALLUVIUM
SAPRIC PEAT, black, moist, loose (PT)SILTY SAND, fine to medium grained, darkbrown, moist, loose (SM)
SAND, fine to medium grained, brown, moist,loose (SP)SILTY SAND, fine to medium grained, brown,moist, very loose (SM)
SAND, fine to medium grained, brown, moist towaterbearing, loose (SP)
SAND WITH GRAVEL, fine to coarse grained,brown, waterbearing, medium dense (SP)
M
M
M
M
M
W
W
W
W
W
SS
SS
SS
SS
SS
SS
SS
SS
SS
SS
6
7
4
4
9
7
15
21
14
22
10
19
20
20
18
18
12
6
8
12
769.7
GM LG:
SAMPLEDDEPTH
13.5
DR:
BORINGCOMPLETED: 4/2/12
CAVE-INDEPTH
DRILLING METHOD NOTE: REFER TO
THE ATTACHED
SHEETS FOR AN
EXPLANATION OF
TERMINOLOGY ON
THIS LOG
TIME
4/2/12 12.0
SURFACE ELEVATION:
CASINGDEPTH0' to 14.5'
14.5' to 36.5' 14.0
DEPTH:
DRILLINGFLUID LEVELDATE
30MH
3.25" HSARD w/DM
WATER LEVEL MEASUREMENTS
13.5
WATERLEVEL
13:15
Rig:
RECIN.
AET JOB NO:
PROJECT:
B-6 (p. 1 of 2)LOG OF BORING NO.
FIELD & LABORATORY TESTS
1
2
3
4
5
6
7
8
9
10
11
12
13
14
15
16
17
18
19
20
21
22
23
24
25
26
27
28
29
30
31
31-00455
06/04
DENWC LLMC
AMERICANENGINEERINGTESTING, INC.
DEPTHIN
FEETN SAMPLE
TYPEGEOLOGY
MATERIAL DESCRIPTION %-#200PL
SUBSURFACE BORING LOG
Eau Claire Wastewater Treatment Plant, 1000 Ferry Street; Eau Claire, Wisconsin

SAND WITH GRAVEL, fine to coarse grained,brown, waterbearing, medium dense (SP)(continued)
End of boring at 36.5 feet.
W SS12 14
RECIN.
AET JOB NO:
PROJECT:
B-6 (p. 2 of 2)LOG OF BORING NO.
FIELD & LABORATORY TESTS
33
34
35
36
31-00455
06/04
DENWC LLMC
AMERICANENGINEERINGTESTING, INC.
DEPTHIN
FEETN SAMPLE
TYPEGEOLOGY
MATERIAL DESCRIPTION %-#200PL
SUBSURFACE BORING LOG
Eau Claire Wastewater Treatment Plant, 1000 Ferry Street; Eau Claire, Wisconsin

FILL
COARSEALLUVIUM
FILL, silty sand with organics, dark brownFILL, sand, brown
SILTY SAND, fine to medium grained, darkbrown, moist, loose (SM)
SAND, fine to coarse grained, light brown,moist, loose (SP)
SAND, a little gravel, fine to coarse grained,brown, moist to waterbearing, medium dense(SP)
SAND WITH GRAVEL, fine to coarse grained,brown, waterbearing, medium dense (SP)
M
M
M
M
M
W
W
W
W
W
SS
SS
SS
SS
SS
SS
SS
SS
SS
SS
7
7
6
6
6
9
14
12
13
19
14
18
20
18
20
18
8
3
6
12
769.5
GM LG:
SAMPLEDDEPTH
13.5
DR:
BORINGCOMPLETED: 4/2/12
CAVE-INDEPTH
DRILLING METHOD NOTE: REFER TO
THE ATTACHED
SHEETS FOR AN
EXPLANATION OF
TERMINOLOGY ON
THIS LOG
TIME
4/2/12 12.0
SURFACE ELEVATION:
CASINGDEPTH0' to 14.5'
14.5' to 36.5' 14.0
DEPTH:
DRILLINGFLUID LEVELDATE
30MH
3.25" HSARD w/DM
WATER LEVEL MEASUREMENTS
13.6
WATERLEVEL
11:30
Rig:
RECIN.
AET JOB NO:
PROJECT:
B-7 (p. 1 of 2)LOG OF BORING NO.
FIELD & LABORATORY TESTS
1
2
3
4
5
6
7
8
9
10
11
12
13
14
15
16
17
18
19
20
21
22
23
24
25
26
27
28
29
30
31
31-00455
06/04
DENWC LLMC
AMERICANENGINEERINGTESTING, INC.
DEPTHIN
FEETN SAMPLE
TYPEGEOLOGY
MATERIAL DESCRIPTION %-#200PL
SUBSURFACE BORING LOG
Eau Claire Wastewater Treatment Plant, 1000 Ferry Street; Eau Claire, Wisconsin

SAND WITH GRAVEL, fine to coarse grained,brown, waterbearing, medium dense (SP)(continued)
End of boring at 36.5 feet.
W SS12 14
RECIN.
AET JOB NO:
PROJECT:
B-7 (p. 2 of 2)LOG OF BORING NO.
FIELD & LABORATORY TESTS
33
34
35
36
31-00455
06/04
DENWC LLMC
AMERICANENGINEERINGTESTING, INC.
DEPTHIN
FEETN SAMPLE
TYPEGEOLOGY
MATERIAL DESCRIPTION %-#200PL
SUBSURFACE BORING LOG
Eau Claire Wastewater Treatment Plant, 1000 Ferry Street; Eau Claire, Wisconsin

FILL
COARSEALLUVIUM
FILL, sandy silt with roots and sandy gravel,black and light brownSILTY SAND, a little gravel, fine to mediumgrained, brown, moist, very loose (SM)SAND WITH GRAVEL, fine to mediumgrained, light brown, moist, medium dense (SP)SILTY SAND, mostly fine grained, brown,moist, very loose (SM)
SAND, a little gravel, fine to medium grained,light brown, moist to waterbearing, loose (SP)
GRAVELLY SAND, fine to coarse grained,brown, waterbearing, medium dense to loose(SP)
SAND WITH GRAVEL, fine to mediumgrained, grayish brown, waterbearing, mediumdense (SP)
M
M
M
M
M
M
W
W
W
W
SS
SS
SS
SS
SS
SS
SS
SS
SS
SS
4
11
4
3
8
7
5
17
6
20
6
8
15
19
21
17
19
2
6
6
770.2
MH LG:
SAMPLEDDEPTH
14.2
DR:
BORINGCOMPLETED: 4/9/12
CAVE-INDEPTH
DRILLING METHOD NOTE: REFER TO
THE ATTACHED
SHEETS FOR AN
EXPLANATION OF
TERMINOLOGY ON
THIS LOG
TIME
4/9/12 14.5
SURFACE ELEVATION:
CASINGDEPTH0' to 14.5'
14.5' to 51' 16.5
DEPTH:
DRILLINGFLUID LEVELDATE
67GM
3.25" HSARD w/DM
WATER LEVEL MEASUREMENTS
14.2
WATERLEVEL
17:40
Rig:
RECIN.
AET JOB NO:
PROJECT:
B-8 (p. 1 of 2)LOG OF BORING NO.
FIELD & LABORATORY TESTS
1
2
3
4
5
6
7
8
9
10
11
12
13
14
15
16
17
18
19
20
21
22
23
24
25
26
27
28
29
30
31
31-00455
06/04
DENWC LLMC
AMERICANENGINEERINGTESTING, INC.
DEPTHIN
FEETN SAMPLE
TYPEGEOLOGY
MATERIAL DESCRIPTION %-#200PL
SUBSURFACE BORING LOG
Eau Claire Wastewater Treatment Plant, 1000 Ferry Street; Eau Claire, Wisconsin

SAND WITH GRAVEL, fine to mediumgrained, grayish brown, waterbearing, mediumdense (SP) (continued)
End of boring at 51.0 feet.
W
W
W
W
SS
SS
SS
SS
12
20
16
24
15
14
13
16
RECIN.
AET JOB NO:
PROJECT:
B-8 (p. 2 of 2)LOG OF BORING NO.
FIELD & LABORATORY TESTS
33
34
35
36
37
38
39
40
41
42
43
44
45
46
47
48
49
50
51
31-00455
06/04
DENWC LLMC
AMERICANENGINEERINGTESTING, INC.
DEPTHIN
FEETN SAMPLE
TYPEGEOLOGY
MATERIAL DESCRIPTION %-#200PL
SUBSURFACE BORING LOG
Eau Claire Wastewater Treatment Plant, 1000 Ferry Street; Eau Claire, Wisconsin

TOPSOILCOARSEALLUVIUM
SILTY SAND, trace roots, black, moist, loose(SM)SILTY SAND, a little gravel, fine to mediumgrained, brown, moist, loose (SM)
SAND, mostly fine grained, light brown, moist,loose (SP)
SAND WITH GRAVEL, fine to coarse grained,brown, moist to waterbearing, loose to mediumdense (SP)
GRAVELLY SAND, fine to coarse grained,grayish brown, waterbearing, loose to mediumdense (SP)
M
M
M
M
M
M
W
W
W
W
SS
SS
SS
SS
SS
SS
SS
SS
SS
SS
7
4
5
4
9
11
6
20
5
13
18
14
16
16
18
16
14
8
6
5
770.1
GM LG:
SAMPLEDDEPTH
14.714.7
DR:
BORINGCOMPLETED: 4/5/12
CAVE-INDEPTH
DRILLING METHOD NOTE: REFER TO
THE ATTACHED
SHEETS FOR AN
EXPLANATION OF
TERMINOLOGY ON
THIS LOG
TIME
4/4/124/5/12
14.514.5
SURFACE ELEVATION:
CASINGDEPTH0' to 14.5'
14.5' to 71.5' 16.516.5
DEPTH:
DRILLINGFLUID LEVELDATE
30MH
3.25" HSARD w/DM
WATER LEVEL MEASUREMENTS
14.814.8
WATERLEVEL
17:557:15
Rig:
RECIN.
AET JOB NO:
PROJECT:
B-9 (p. 1 of 3)LOG OF BORING NO.
FIELD & LABORATORY TESTS
1
2
3
4
5
6
7
8
9
10
11
12
13
14
15
16
17
18
19
20
21
22
23
24
25
26
27
28
29
30
31
31-00455
06/04
DENWC LLMC
AMERICANENGINEERINGTESTING, INC.
DEPTHIN
FEETN SAMPLE
TYPEGEOLOGY
MATERIAL DESCRIPTION %-#200PL
SUBSURFACE BORING LOG
Eau Claire Wastewater Treatment Plant, 1000 Ferry Street; Eau Claire, Wisconsin

FINEALLUVIUM
SAND, a little gravel, fine to medium grained,grayish brown, waterbearing, medium dense(SP)
SANDY SILT, grayish brown, waterbearing,medium dense (ML)
W
W
W
W
W
M
M
SS
SS
SS
SS
SS
SS
SS
14
17
17
18
22
21
23
12
14
12
16
14
16
14
RECIN.
AET JOB NO:
PROJECT:
B-9 (p. 2 of 3)LOG OF BORING NO.
FIELD & LABORATORY TESTS
33
34
35
36
37
38
39
40
41
42
43
44
45
46
47
48
49
50
51
52
53
54
55
56
57
58
59
60
61
62
63
64
65
66
67
68
69
31-00455
06/04
DENWC LLMC
AMERICANENGINEERINGTESTING, INC.
DEPTHIN
FEETN SAMPLE
TYPEGEOLOGY
MATERIAL DESCRIPTION %-#200PL
SUBSURFACE BORING LOG
Eau Claire Wastewater Treatment Plant, 1000 Ferry Street; Eau Claire, Wisconsin

FINEALLUVIUM(continued)
SANDY SILT, grayish brown, waterbearing,medium dense (ML) (continued)
End of boring at 71.5 feet.
M SS14 20
RECIN.
AET JOB NO:
PROJECT:
B-9 (p. 3 of 3)LOG OF BORING NO.
FIELD & LABORATORY TESTS
71
31-00455
06/04
DENWC LLMC
AMERICANENGINEERINGTESTING, INC.
DEPTHIN
FEETN SAMPLE
TYPEGEOLOGY
MATERIAL DESCRIPTION %-#200PL
SUBSURFACE BORING LOG
Eau Claire Wastewater Treatment Plant, 1000 Ferry Street; Eau Claire, Wisconsin

TOPSOILCOARSEALLUVIUM
SILTY SAND, trace roots, fine to mediumgrained, dark brown, moist, loose (SM)SILTY SAND, fine to medium grained, brown,moist, loose (SM)SAND, a little gravel, fine to medium grained,brown, moist, loose (SP)SILTY SAND, fine to medium grained, brown,moist, very loose (SM)
SAND, a little gravel, fine to medium grained,light brown, moist to waterbearing, loose to veryloose (SP)
GRAVELLY SAND, fine to coarse grained,brown, waterbearing, medium dense to loose(SP)
M
M
M
M
M
M
W
W
W
W
SS
SS
SS
SS
SS
SS
SS
SS
SS
SS
9
10
3
3
9
7
3
16
9
18
6
20
20
18
18
20
18
10
6
10
770.1
GM LG:
SAMPLEDDEPTH
14.6
DR:
BORINGCOMPLETED: 4/4/12
CAVE-INDEPTH
DRILLING METHOD NOTE: REFER TO
THE ATTACHED
SHEETS FOR AN
EXPLANATION OF
TERMINOLOGY ON
THIS LOG
TIME
4/4/12 14.5
SURFACE ELEVATION:
CASINGDEPTH0' to 14.5'
14.5' to 76.0' 16.5
DEPTH:
DRILLINGFLUID LEVELDATE
30MH
3.25" HSARD w/DM
WATER LEVEL MEASUREMENTS
14.6
WATERLEVEL
10:45
Rig:
RECIN.
AET JOB NO:
PROJECT:
B-10 (p. 1 of 3)LOG OF BORING NO.
FIELD & LABORATORY TESTS
1
2
3
4
5
6
7
8
9
10
11
12
13
14
15
16
17
18
19
20
21
22
23
24
25
26
27
28
29
30
31
31-00455
06/04
DENWC LLMC
AMERICANENGINEERINGTESTING, INC.
DEPTHIN
FEETN SAMPLE
TYPEGEOLOGY
MATERIAL DESCRIPTION %-#200PL
SUBSURFACE BORING LOG
Eau Claire Wastewater Treatment Plant, 1000 Ferry Street; Eau Claire, Wisconsin

GRAVELLY SAND, fine to coarse grained,brown, waterbearing, medium dense to loose(SP) (continued)
SAND, a little gravel, fine to coarse grained,grayish brown, waterbearing, medium dense(SP)
W
W
W
W
W
W
W
SS
SS
SS
SS
SS
SS
SS
23
16
19
28
20
16
23
6
12
18
16
22
18
20
RECIN.
AET JOB NO:
PROJECT:
B-10 (p. 2 of 3)LOG OF BORING NO.
FIELD & LABORATORY TESTS
33
34
35
36
37
38
39
40
41
42
43
44
45
46
47
48
49
50
51
52
53
54
55
56
57
58
59
60
61
62
63
64
65
66
67
68
69
31-00455
06/04
DENWC LLMC
AMERICANENGINEERINGTESTING, INC.
DEPTHIN
FEETN SAMPLE
TYPEGEOLOGY
MATERIAL DESCRIPTION %-#200PL
SUBSURFACE BORING LOG
Eau Claire Wastewater Treatment Plant, 1000 Ferry Street; Eau Claire, Wisconsin

SAND, a little gravel, fine to coarse grained,grayish brown, waterbearing, medium dense(SP) (continued)
GRAVELLY SAND, fine to coarse grained,grayish brown, waterbearing, very dense (SP)
End of boring at 76.0 feet.
W
W
SS
SS
17
94
22
14
RECIN.
AET JOB NO:
PROJECT:
B-10 (p. 3 of 3)LOG OF BORING NO.
FIELD & LABORATORY TESTS
71
72
73
74
75
76
31-00455
06/04
DENWC LLMC
AMERICANENGINEERINGTESTING, INC.
DEPTHIN
FEETN SAMPLE
TYPEGEOLOGY
MATERIAL DESCRIPTION %-#200PL
SUBSURFACE BORING LOG
Eau Claire Wastewater Treatment Plant, 1000 Ferry Street; Eau Claire, Wisconsin

TOPSOILCOARSEALLUVIUMFINEALLUVIUM
COARSEALLUVIUM
SAPRIC PEAT, black, moist, loose (PT)SILTY SAND, fine to medium grained, brown,moist, loose (SM)SILT, brown, moist, medium dense (ML)
SAND, fine to medium grained, brown to lightbrown, moist, loose (SP)
SAND, a little gravel, fine to coarse grained,brown, moist to waterbearing, medium dense(SP)
SAND WITH GRAVEL, fine to coarse grained,brown, waterbearing, medium dense (SP)
SAND WITH GRAVEL, fine to coarse grained,grayish brown, waterbearing, medium dense(SP)
M
M
M
M
M
M
W
W
W
W
SS
SS
SS
SS
SS
SS
SS
SS
SS
SS
6
12
9
7
9
18
21
36
18
18
14
20
18
18
20
18
8
10
5
8
770.1
GM LG:
SAMPLEDDEPTH
14.9
DR:
BORINGCOMPLETED: 4/3/12
CAVE-INDEPTH
DRILLING METHOD NOTE: REFER TO
THE ATTACHED
SHEETS FOR AN
EXPLANATION OF
TERMINOLOGY ON
THIS LOG
TIME
4/3/12 14.5
SURFACE ELEVATION:
CASINGDEPTH0' to 14.5'
14.5' to 76.5' 16.5
DEPTH:
DRILLINGFLUID LEVELDATE
30MH
3.25" HSARD w/DM
WATER LEVEL MEASUREMENTS
14.9
WATERLEVEL
9:50
Rig:
RECIN.
AET JOB NO:
PROJECT:
B-11 (p. 1 of 3)LOG OF BORING NO.
FIELD & LABORATORY TESTS
1
2
3
4
5
6
7
8
9
10
11
12
13
14
15
16
17
18
19
20
21
22
23
24
25
26
27
28
29
30
31
31-00455
06/04
DENWC LLMC
AMERICANENGINEERINGTESTING, INC.
DEPTHIN
FEETN SAMPLE
TYPEGEOLOGY
MATERIAL DESCRIPTION %-#200PL
SUBSURFACE BORING LOG
Eau Claire Wastewater Treatment Plant, 1000 Ferry Street; Eau Claire, Wisconsin

SAND WITH GRAVEL, fine to coarse grained,grayish brown, waterbearing, medium dense(SP) (continued)
W
W
W
W
W
W
W
SS
SS
SS
SS
SS
SS
SS
22
16
27
30
26
14
32
10
14
12
14
14
16
16
RECIN.
AET JOB NO:
PROJECT:
B-11 (p. 2 of 3)LOG OF BORING NO.
FIELD & LABORATORY TESTS
33
34
35
36
37
38
39
40
41
42
43
44
45
46
47
48
49
50
51
52
53
54
55
56
57
58
59
60
61
62
63
64
65
66
67
68
69
31-00455
06/04
DENWC LLMC
AMERICANENGINEERINGTESTING, INC.
DEPTHIN
FEETN SAMPLE
TYPEGEOLOGY
MATERIAL DESCRIPTION %-#200PL
SUBSURFACE BORING LOG
Eau Claire Wastewater Treatment Plant, 1000 Ferry Street; Eau Claire, Wisconsin

SAND WITH GRAVEL, fine to coarse grained,grayish brown, waterbearing, dense, lenses ofsilty sand (SP) (continued)
End of boring at 76.5 feet.
W
W
SS
SS
39
45
18
14
RECIN.
AET JOB NO:
PROJECT:
B-11 (p. 3 of 3)LOG OF BORING NO.
FIELD & LABORATORY TESTS
71
72
73
74
75
76
31-00455
06/04
DENWC LLMC
AMERICANENGINEERINGTESTING, INC.
DEPTHIN
FEETN SAMPLE
TYPEGEOLOGY
MATERIAL DESCRIPTION %-#200PL
SUBSURFACE BORING LOG
Eau Claire Wastewater Treatment Plant, 1000 Ferry Street; Eau Claire, Wisconsin

TOPSOIL
COARSEALLUVIUM
SILTY SAND, trace roots, black, moist, loose(SM)SAND WITH SILT, a little gravel, fine tomedium grained, brown, moist, loose to mediumdense (SP-SM)
SILTY SAND, fine to medium grained, brown,moist, loose (SM)
SAND, a little gravel, fine to medium grained,light brown, moist, loose (SP)
SAND WITH GRAVEL, fine to mediumgrained, light brown, moist, medium dense (SP)
GRAVELLY SAND, fine to coarse grained,brown, waterbearing, loose to dense (SP)
M
M
M
M
M
M
W
W
W
W
SS
SS
SS
SS
SS
SS
SS
SS
SS
SS
6
24
9
8
6
10
17
13
9
37
18
20
21
19
17
16
6
2
7
8
770.2
GM LG:
SAMPLEDDEPTH
15.3
DR:
BORINGCOMPLETED: 4/9/12
CAVE-INDEPTH
DRILLING METHOD NOTE: REFER TO
THE ATTACHED
SHEETS FOR AN
EXPLANATION OF
TERMINOLOGY ON
THIS LOG
TIME
4/9/12 14.5
SURFACE ELEVATION:
CASINGDEPTH0' to 14.5'
14.5' to 51' 16.5
DEPTH:
DRILLINGFLUID LEVELDATE
67MH
3.25" HSARD w/DM
WATER LEVEL MEASUREMENTS
15.5
WATERLEVEL
11:45
Rig:
RECIN.
AET JOB NO:
PROJECT:
B-12 (p. 1 of 2)LOG OF BORING NO.
FIELD & LABORATORY TESTS
1
2
3
4
5
6
7
8
9
10
11
12
13
14
15
16
17
18
19
20
21
22
23
24
25
26
27
28
29
30
31
31-00455
06/04
DENWC LLMC
AMERICANENGINEERINGTESTING, INC.
DEPTHIN
FEETN SAMPLE
TYPEGEOLOGY
MATERIAL DESCRIPTION %-#200PL
SUBSURFACE BORING LOG
Eau Claire Wastewater Treatment Plant, 1000 Ferry Street; Eau Claire, Wisconsin

SAND WITH GRAVEL, fine to mediumgrained, grayish brown, waterbearing, mediumdense (SP)
End of boring at 51.0 feet.
W
W
W
W
SS
SS
SS
SS
14
22
13
25
13
10
15
15
RECIN.
AET JOB NO:
PROJECT:
B-12 (p. 2 of 2)LOG OF BORING NO.
FIELD & LABORATORY TESTS
33
34
35
36
37
38
39
40
41
42
43
44
45
46
47
48
49
50
51
31-00455
06/04
DENWC LLMC
AMERICANENGINEERINGTESTING, INC.
DEPTHIN
FEETN SAMPLE
TYPEGEOLOGY
MATERIAL DESCRIPTION %-#200PL
SUBSURFACE BORING LOG
Eau Claire Wastewater Treatment Plant, 1000 Ferry Street; Eau Claire, Wisconsin

TOPSOILCOARSEALLUVIUM
SAPRIC PEAT, black, moist, loose (PT)SILTY SAND, a little gravel, fine to mediumgrained, brown, moist, loose (SM)
SAND, fine to medium grained, brown, moist,loose (SP)
SAND WITH GRAVEL, fine to mediumgrained, brown, moist to waterbearing, loose tovery loose (SP)
SANDY GRAVEL, brown, waterbearing,medium dense (GP)
End of boring at 21.5 feet.
M
M
M
M
M
W
W
W
SS
SS
SS
SS
SS
SS
SS
SS
8
6
5
6
6
3
7
17
12
22
20
20
18
20
12
5
768.7
GM LG:
SAMPLEDDEPTH
12.4
DR:
BORINGCOMPLETED: 3/28/12
CAVE-INDEPTH
DRILLING METHOD NOTE: REFER TO
THE ATTACHED
SHEETS FOR AN
EXPLANATION OF
TERMINOLOGY ON
THIS LOG
TIME
3/28/12 12.0
SURFACE ELEVATION:
CASINGDEPTH0' to 12'
12' to 21.5' 14.0
DEPTH:
DRILLINGFLUID LEVELDATE
30MH
3.25" HSARD w/DM
WATER LEVEL MEASUREMENTS
12.6
WATERLEVEL
12:55
Rig:
RECIN.
AET JOB NO:
PROJECT:
B-13 (p. 1 of 1)LOG OF BORING NO.
FIELD & LABORATORY TESTS
1
2
3
4
5
6
7
8
9
10
11
12
13
14
15
16
17
18
19
20
21
31-00455
06/04
DENWC LLMC
AMERICANENGINEERINGTESTING, INC.
DEPTHIN
FEETN SAMPLE
TYPEGEOLOGY
MATERIAL DESCRIPTION %-#200PL
SUBSURFACE BORING LOG
Eau Claire Wastewater Treatment Plant, 1000 Ferry Street; Eau Claire, Wisconsin

TOPSOIL
COARSEALLUVIUM
SAPRIC PEAT, black, moist, loose (PT)SAND WITH SILT, fine to medium grained,brown, moist, medium dense (SP-SM)
SILTY SAND, fine to medium grained, brown,moist, loose (SM)
SAND, fine to medium grained, light brown,moist, loose (SP)
SAND WITH GRAVEL, fine to mediumgrained, brown, waterbearing, medium dense(SP)
GRAVELLY SAND, fine to coarse grained,brown, waterbearing, medium dense (SP)
End of boring at 21.5 feet.
M
M
M
M
M
W
W
W
SS
SS
SS
SS
SS
SS
SS
SS
10
16
7
6
7
12
19
15
18
20
20
20
18
14
8
12
769.3
GM LG:
SAMPLEDDEPTH
12.9
DR:
BORINGCOMPLETED: 3/28/12
CAVE-INDEPTH
DRILLING METHOD NOTE: REFER TO
THE ATTACHED
SHEETS FOR AN
EXPLANATION OF
TERMINOLOGY ON
THIS LOG
TIME
3/28/12 12.0
SURFACE ELEVATION:
CASINGDEPTH0' to 12'
12' to 21.5' 14.0
DEPTH:
DRILLINGFLUID LEVELDATE
30MH
3.25" HSARD w/DM
WATER LEVEL MEASUREMENTS
13.2
WATERLEVEL
12:05
Rig:
RECIN.
AET JOB NO:
PROJECT:
B-14 (p. 1 of 1)LOG OF BORING NO.
FIELD & LABORATORY TESTS
1
2
3
4
5
6
7
8
9
10
11
12
13
14
15
16
17
18
19
20
21
31-00455
06/04
DENWC LLMC
AMERICANENGINEERINGTESTING, INC.
DEPTHIN
FEETN SAMPLE
TYPEGEOLOGY
MATERIAL DESCRIPTION %-#200PL
SUBSURFACE BORING LOG
Eau Claire Wastewater Treatment Plant, 1000 Ferry Street; Eau Claire, Wisconsin

TOPSOILCOARSEALLUVIUM
SAPRIC PEAT, black, moist, loose (PT)SILTY SAND, fine to medium grained, brown,moist, loose (SM)
SAND, a little gravel, fine to medium grained,light brown, moist, loose to medium dense (SP)
GRAVELLY SAND, fine to coarse grained,brown, waterbearing, medium dense (SP)
End of boring at 21.5 feet.
M
M
M
M
M
M
W
W
SS
SS
SS
SS
SS
SS
SS
SS
7
5
5
6
12
26
14
24
18
20
18
20
18
18
12
6
769.6
GM LG:
SAMPLEDDEPTH
13.4
DR:
BORINGCOMPLETED: 3/28/12
CAVE-INDEPTH
DRILLING METHOD NOTE: REFER TO
THE ATTACHED
SHEETS FOR AN
EXPLANATION OF
TERMINOLOGY ON
THIS LOG
TIME
3/28/12 14.5
SURFACE ELEVATION:
CASINGDEPTH0' to 14.5'
14.5' to 21.5' 16.5
DEPTH:
DRILLINGFLUID LEVELDATE
30MH
3.25" HSARD w/DM
WATER LEVEL MEASUREMENTS
14.5
WATERLEVEL
11:20
Rig:
RECIN.
AET JOB NO:
PROJECT:
B-15 (p. 1 of 1)LOG OF BORING NO.
FIELD & LABORATORY TESTS
1
2
3
4
5
6
7
8
9
10
11
12
13
14
15
16
17
18
19
20
21
31-00455
06/04
DENWC LLMC
AMERICANENGINEERINGTESTING, INC.
DEPTHIN
FEETN SAMPLE
TYPEGEOLOGY
MATERIAL DESCRIPTION %-#200PL
SUBSURFACE BORING LOG
Eau Claire Wastewater Treatment Plant, 1000 Ferry Street; Eau Claire, Wisconsin

TOPSOIL
COARSEALLUVIUM
SILTY SAND, trace roots, black, moist, loose(SM)SAND WITH SILT, a little gravel, fine tomedium grained, brown, moist, loose to mediumdense (SP-SM)
SAND, a little gravel, fine to medium grained,light brown, moist, medium dense (SP)
SAND WITH GRAVEL, fine to mediumgrained, light brown, moist, medium dense (SP)
GRAVELLY SAND, fine to coarse grained,grayish brown, waterbearing, medium dense(SP)
M
M
M
M
M
M
W
W
W
W
SS
SS
SS
SS
SS
SS
SS
SS
SS
SS
7
26
11
9
14
18
21
16
15
13
12
18
18
8
20
18
3
10
6
14
772.2
GM LG:
SAMPLEDDEPTH
15.7
DR:
BORINGCOMPLETED: 3/28/12
CAVE-INDEPTH
DRILLING METHOD NOTE: REFER TO
THE ATTACHED
SHEETS FOR AN
EXPLANATION OF
TERMINOLOGY ON
THIS LOG
TIME
3/28/12 14.5
SURFACE ELEVATION:
CASINGDEPTH0' to 14.5'
14.5' to 31.5' 16.5
DEPTH:
DRILLINGFLUID LEVELDATE
30MH
3.25" HSARD w/DM
WATER LEVEL MEASUREMENTS
15.9
WATERLEVEL
8:30
Rig:
RECIN.
AET JOB NO:
PROJECT:
B-16 (p. 1 of 2)LOG OF BORING NO.
FIELD & LABORATORY TESTS
1
2
3
4
5
6
7
8
9
10
11
12
13
14
15
16
17
18
19
20
21
22
23
24
25
26
27
28
29
30
31
31-00455
06/04
DENWC LLMC
AMERICANENGINEERINGTESTING, INC.
DEPTHIN
FEETN SAMPLE
TYPEGEOLOGY
MATERIAL DESCRIPTION %-#200PL
SUBSURFACE BORING LOG
Eau Claire Wastewater Treatment Plant, 1000 Ferry Street; Eau Claire, Wisconsin

SAND, a little gravel, fine to medium grained,grayish brown, waterbearing, medium dense(SP)
End of boring at 36.5 feet.
W SS12 10
RECIN.
AET JOB NO:
PROJECT:
B-16 (p. 2 of 2)LOG OF BORING NO.
FIELD & LABORATORY TESTS
33
34
35
36
31-00455
06/04
DENWC LLMC
AMERICANENGINEERINGTESTING, INC.
DEPTHIN
FEETN SAMPLE
TYPEGEOLOGY
MATERIAL DESCRIPTION %-#200PL
SUBSURFACE BORING LOG
Eau Claire Wastewater Treatment Plant, 1000 Ferry Street; Eau Claire, Wisconsin

TOPSOILCOARSEALLUVIUM
SAPRIC PEAT, black, moist, loose (PT)SILTY SAND, a little gravel, fine to mediumgrained, brown, moist, medium dense (SM)
SAND WITH GRAVEL, fine to mediumgrained, brown, moist, medium dense (SP)
GRAVELLY SAND, fine to coarse grained,grayish brown, waterbearing, medium dense(SP)
M
M
M
M
M
M
W
W
W
W
SS
SS
SS
SS
SS
SS
SS
SS
SS
SS
8
11
13
16
26
14
17
17
15
12
14
18
18
18
16
16
6
12
8
12
771.5
GM LG:
SAMPLEDDEPTH
16.1
DR:
BORINGCOMPLETED: 4/2/12
CAVE-INDEPTH
DRILLING METHOD NOTE: REFER TO
THE ATTACHED
SHEETS FOR AN
EXPLANATION OF
TERMINOLOGY ON
THIS LOG
TIME
4/2/12 14.5
SURFACE ELEVATION:
CASINGDEPTH0' to 14.5'
14.5' to 36.5' 16.5
DEPTH:
DRILLINGFLUID LEVELDATE
30MH
3.25" HSARD w/DM
WATER LEVEL MEASUREMENTS
16.1
WATERLEVEL
8:20
Rig:
RECIN.
AET JOB NO:
PROJECT:
B-17 (p. 1 of 2)LOG OF BORING NO.
FIELD & LABORATORY TESTS
1
2
3
4
5
6
7
8
9
10
11
12
13
14
15
16
17
18
19
20
21
22
23
24
25
26
27
28
29
30
31
31-00455
06/04
DENWC LLMC
AMERICANENGINEERINGTESTING, INC.
DEPTHIN
FEETN SAMPLE
TYPEGEOLOGY
MATERIAL DESCRIPTION %-#200PL
SUBSURFACE BORING LOG
Eau Claire Wastewater Treatment Plant, 1000 Ferry Street; Eau Claire, Wisconsin
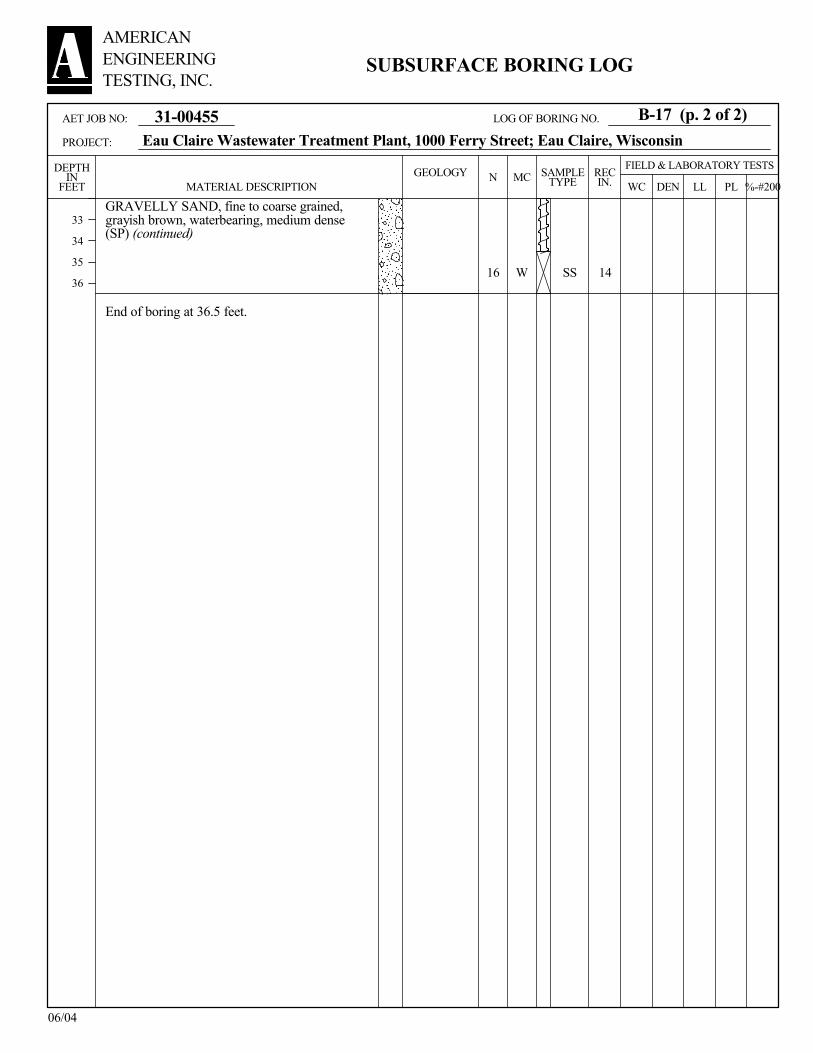
GRAVELLY SAND, fine to coarse grained,grayish brown, waterbearing, medium dense(SP) (continued)
End of boring at 36.5 feet.
W SS16 14
RECIN.
AET JOB NO:
PROJECT:
B-17 (p. 2 of 2)LOG OF BORING NO.
FIELD & LABORATORY TESTS
33
34
35
36
31-00455
06/04
DENWC LLMC
AMERICANENGINEERINGTESTING, INC.
DEPTHIN
FEETN SAMPLE
TYPEGEOLOGY
MATERIAL DESCRIPTION %-#200PL
SUBSURFACE BORING LOG
Eau Claire Wastewater Treatment Plant, 1000 Ferry Street; Eau Claire, Wisconsin

TOPSOILCOARSEALLUVIUM
SAPRIC PEAT, black, moist, loose (PT)SILTY SAND, a little gravel, fine to mediumgrained, brown, moist, medium dense (SM)
SAND WITH GRAVEL, fine to mediumgrained, light brown, moist to waterbearing,medium dense (SP)
End of boring at 16.5 feet.
M
M
M
M
M
M
W
SS
SS
SS
SS
SS
SS
SS
15
17
21
19
18
18
18
20
14
22
16
14
4
12
770.5
GM LG:
SAMPLEDDEPTH
14.0
DR:
BORINGCOMPLETED: 3/27/12
CAVE-INDEPTH
DRILLING METHOD NOTE: REFER TO
THE ATTACHED
SHEETS FOR AN
EXPLANATION OF
TERMINOLOGY ON
THIS LOG
TIME
3/27/12 14.5
SURFACE ELEVATION:
CASINGDEPTH0' to 16.5'
16.5
DEPTH:
DRILLINGFLUID LEVELDATE
30MH
3.25" HSA
WATER LEVEL MEASUREMENTS
14.4
WATERLEVEL
15:50
Rig:
RECIN.
AET JOB NO:
PROJECT:
B-18 (p. 1 of 1)LOG OF BORING NO.
FIELD & LABORATORY TESTS
1
2
3
4
5
6
7
8
9
10
11
12
13
14
15
16
31-00455
06/04
DENWC LLMC
AMERICANENGINEERINGTESTING, INC.
DEPTHIN
FEETN SAMPLE
TYPEGEOLOGY
MATERIAL DESCRIPTION %-#200PL
SUBSURFACE BORING LOG
Eau Claire Wastewater Treatment Plant, 1000 Ferry Street; Eau Claire, Wisconsin

TOPSOILCOARSEALLUVIUM
SAPRIC PEAT, black, moist, loose (PT)SILTY SAND, fine to medium grained, brown,moist, loose (SM)SAND WITH SILT, fine to medium grained,brown, moist, loose (SP-SM)
SAND WITH GRAVEL, fine to mediumgrained, brown, moist to waterbearing, loose tomedium dense (SP)
GRAVELLY SAND, fine to coarse grained,brown, waterbearing, medium dense (SP)
End of boring at 16.5 feet.
M
M
M
M
M
W
W
SS
SS
SS
SS
SS
SS
SS
6
6
9
10
7
11
15
16
18
18
18
3
18
12
769.0
GM LG:
SAMPLEDDEPTH
12.8
DR:
BORINGCOMPLETED: 3/27/12
CAVE-INDEPTH
DRILLING METHOD NOTE: REFER TO
THE ATTACHED
SHEETS FOR AN
EXPLANATION OF
TERMINOLOGY ON
THIS LOG
TIME
3/27/12 12.0
SURFACE ELEVATION:
CASINGDEPTH0' to 12'
12' to 16.5' 14.0
DEPTH:
DRILLINGFLUID LEVELDATE
30MH
3.25" HSARD w/DM
WATER LEVEL MEASUREMENTS
12.9
WATERLEVEL
14:55
Rig:
RECIN.
AET JOB NO:
PROJECT:
B-19 (p. 1 of 1)LOG OF BORING NO.
FIELD & LABORATORY TESTS
1
2
3
4
5
6
7
8
9
10
11
12
13
14
15
16
31-00455
06/04
DENWC LLMC
AMERICANENGINEERINGTESTING, INC.
DEPTHIN
FEETN SAMPLE
TYPEGEOLOGY
MATERIAL DESCRIPTION %-#200PL
SUBSURFACE BORING LOG
Eau Claire Wastewater Treatment Plant, 1000 Ferry Street; Eau Claire, Wisconsin

TOPSOILCOARSEALLUVIUM
SAPRIC PEAT, black, moist, loose (PT)SILTY SAND, fine to medium grained, brown,moist, loose (SM)
SAND, fine to medium grained, brown, moist towaterbearing, loose (SP)
GRAVELLY SAND, fine to coarse grained,brown, waterbearing, dense (SP)
End of boring at 16.5 feet.
M
M
M
M
M
W
W
SS
SS
SS
SS
SS
SS
SS
7
6
6
8
8
8
35
12
20
18
18
20
16
12
770.0
GM LG:
SAMPLEDDEPTH
14.0
DR:
BORINGCOMPLETED: 3/27/12
CAVE-INDEPTH
DRILLING METHOD NOTE: REFER TO
THE ATTACHED
SHEETS FOR AN
EXPLANATION OF
TERMINOLOGY ON
THIS LOG
TIME
3/27/12 12.0
SURFACE ELEVATION:
CASINGDEPTH0' to 12'
12' to 16.5' 14.0
DEPTH:
DRILLINGFLUID LEVELDATE
30MH
3.25" HSARD w/DM
WATER LEVEL MEASUREMENTS
14.0
WATERLEVEL
14:00
Rig:
RECIN.
AET JOB NO:
PROJECT:
B-20 (p. 1 of 1)LOG OF BORING NO.
FIELD & LABORATORY TESTS
1
2
3
4
5
6
7
8
9
10
11
12
13
14
15
16
31-00455
06/04
DENWC LLMC
AMERICANENGINEERINGTESTING, INC.
DEPTHIN
FEETN SAMPLE
TYPEGEOLOGY
MATERIAL DESCRIPTION %-#200PL
SUBSURFACE BORING LOG
Eau Claire Wastewater Treatment Plant, 1000 Ferry Street; Eau Claire, Wisconsin

FILL
COARSEALLUVIUM
FILL, silty sand with gravel, trace roots, brownand black
FILL, silty sand with gravel and woodfragments, brown and black
FILL, sand, a little gravel, light brown
FILL, silty sand with wood fragments, brownand dark brown
GRAVELLY SAND, fine to coarse grained,brown, waterbearing, medium dense to loose(SP)
End of boring at 26.5 feet.
M
M
M
M
M
M
W
W
W
SS
SS
SS
SS
SS
SS
SS
SS
SS
10
1
13
2
8
24
28
6
13
10
4
4
6
10
3
6
6
16
770.6
GH LG:
SAMPLEDDEPTH
17.0
DR:
BORINGCOMPLETED: 4/12/12
CAVE-INDEPTH
DRILLING METHOD NOTE: REFER TO
THE ATTACHED
SHEETS FOR AN
EXPLANATION OF
TERMINOLOGY ON
THIS LOG
TIME
4/12/12 19.5
SURFACE ELEVATION:
CASINGDEPTH0' to 19.5'
19.5' to 26.5' 19.5
DEPTH:
DRILLINGFLUID LEVELDATE
67MH
3.25" HSARD w/DM
WATER LEVEL MEASUREMENTS
19.5
WATERLEVEL
12:35
Rig:
RECIN.
AET JOB NO:
PROJECT:
B-21 (p. 1 of 1)LOG OF BORING NO.
FIELD & LABORATORY TESTS
1
2
3
4
5
6
7
8
9
10
11
12
13
14
15
16
17
18
19
20
21
22
23
24
25
26
31-00455
06/04
DENWC LLMC
AMERICANENGINEERINGTESTING, INC.
DEPTHIN
FEETN SAMPLE
TYPEGEOLOGY
MATERIAL DESCRIPTION %-#200PL
SUBSURFACE BORING LOG
Eau Claire Wastewater Treatment Plant, 1000 Ferry Street; Eau Claire, Wisconsin

FILL
COARSEALLUVIUM
FILL, sapric peat, black
FILL, silty sand, a little gravel, trace roots,brown, a little black
SAND, a little gravel, fine to medium grained,light brown, moist, loose to medium dense (SP)
GRAVELLY SAND, fine to coarse grained,brown, waterbearing, medium dense to loose(SP)
End of boring at 26.5 feet.
M
M
M
M
M
M
M
M
M
SS
SS
SS
SS
SS
SS
SS
SS
SS
4
4
3
5
8
14
29
10
9
6
10
5
14
18
16
10
12
10
770.3
GH LG:
SAMPLEDDEPTH
16.0
DR:
BORINGCOMPLETED: 4/12/12
CAVE-INDEPTH
DRILLING METHOD NOTE: REFER TO
THE ATTACHED
SHEETS FOR AN
EXPLANATION OF
TERMINOLOGY ON
THIS LOG
TIME
4/12/12 14.5
SURFACE ELEVATION:
CASINGDEPTH0' to 14.5'
14.5' to 26.5' 16.5
DEPTH:
DRILLINGFLUID LEVELDATE
67MH
3.25" HSARD w/DM
WATER LEVEL MEASUREMENTS
16.5
WATERLEVEL
13:35
Rig:
RECIN.
AET JOB NO:
PROJECT:
B-22 (p. 1 of 1)LOG OF BORING NO.
FIELD & LABORATORY TESTS
1
2
3
4
5
6
7
8
9
10
11
12
13
14
15
16
17
18
19
20
21
22
23
24
25
26
31-00455
06/04
DENWC LLMC
AMERICANENGINEERINGTESTING, INC.
DEPTHIN
FEETN SAMPLE
TYPEGEOLOGY
MATERIAL DESCRIPTION %-#200PL
SUBSURFACE BORING LOG
Eau Claire Wastewater Treatment Plant, 1000 Ferry Street; Eau Claire, Wisconsin


01REP051 (12/08) AMERICAN ENGINEERING TESTING, INC.
EXPLORATION/CLASSIFICATION METHODS SAMPLING METHODS
Split-Spoon Samples (SS) Standard penetration (split-spoon) samples were collected in general accordance with ASTM:D1586. This method consists of driving a 2" O.D. split barrel sampler into the in-situ soil with a 140-pound hammer dropped from a height of 30". The sampler is driven a total of 18" into the soil. After an initial set of 6", the number of hammer blows to drive the sampler the final 12" is known as the standard penetration resistance or N-value.
Disturbed Samples (DS)/Spin-up Samples (SU) Sample types described as “DS” or “SU” on the boring logs are disturbed samples, which are taken from the flights of the auger. Because the auger disturbs the samples, possible soil layering and contact depths should be considered approximate.
Sampling Limitations Unless actually observed in a sample, contacts between soil layers are estimated based on the spacing of samples and the action of drilling tools. Cobbles, boulders, and other large objects generally cannot be recovered from test borings, and they may be present in the ground even if they are not noted on the boring logs. CLASSIFICATION METHODS Soil classifications shown on the boring logs are based on the Unified Soil Classification (USC) system. The USC system is described in ASTM:D2487 and D2488. Where laboratory classification tests (sieve analysis or Atterberg Limits) have been performed, accurate classifications per ASTM: D2487 are possible. Otherwise, soil classifications shown on the boring logs are visual-manual judgments. Charts are attached which provide information on the USC system, the descriptive terminology, and the symbols used on the boring logs. The boring logs include descriptions of apparent geology. The geologic depositional origin of each soil layer is interpreted primarily by observation of the soil samples, which can be limited. Observations of the surrounding topography, vegetation, and development can sometimes aid this judgment. WATER LEVEL MEASUREMENTS The ground water level measurements are shown at the bottom of the boring logs. The following information appears under “Water Level Measurements” on the logs:
• Date and Time of measurement • Sampled Depth: lowest depth of soil sampling at the time of measurement • Casing Depth: depth to bottom of casing or hollow-stem auger at time of measurement • Cave-in Depth: depth at which measuring tape stops in the borehole • Water Level: depth in the borehole where free water is encountered • Drilling Fluid Level: same as Water Level, except that the liquid in the borehole is drilling fluid
The true location of the water table at the boring locations may be different than the water levels measured in the boreholes. This is possible because there are several factors that can affect the water level measurements in the borehole. Some of these factors include: permeability of each soil layer in profile, presence of perched water, amount of time between water level readings, presence of drilling fluid, weather conditions, and use of borehole casing. SAMPLE STORAGE Unless notified to do otherwise, we routinely retain representative samples of the soils recovered from the borings for a period of 30 days.

01REP052 (12/08) AMERICAN ENGINEERING TESTING, INC.
BORING LOG NOTES DRILLING AND SAMPLING SYMBOLS TEST SYMBOLS Symbol Definition Symbol Definition B, H, N: Size of flush-joint casing CA: Crew Assistant (initials) CAS: Pipe casing, number indicates nominal diameter in
inches CC: Crew Chief (initials) COT: Clean-out tube DC: Drive casing; number indicates diameter in inches DM: Drilling mud or bentonite slurry DR: Driller (initials) DS: Disturbed sample from auger flights FA: Flight auger; number indicates outside diameter in
inches HA: Hand auger; number indicates outside diameter HSA: Hollow stem auger; number indicates inside diameter
in inches LG: Field logger (initials) MC: Column used to describe moisture condition of
samples and for the ground water level symbols N (BPF): Standard penetration resistance (N-value) in blows per foot (see notes) NQ: NQ wireline core barrel PQ: PQ wireline core barrel RD: Rotary drilling with fluid and roller or drag bit REC: In split-spoon (see notes) and thin-walled tube
sampling, the recovered length (in inches) of sample. In rock coring, the length of core recovered (expressed as percent of the total core run). Zero indicates no sample recovered.
REV: Revert drilling fluid SS: Standard split-spoon sampler (steel; 1⅜" is inside
diameter; 2" outside diameter); unless indicated otherwise
SU Spin-up sample from hollow stem auger TW: Thin-walled tube; number indicates inside diameter in
inches WASH: Sample of material obtained by screening returning
rotary drilling fluid or by which has collected inside the borehole after “falling” through drilling fluid
WH: Sampler advanced by static weight of drill rod and 140-pound hammer
WR: Sampler advanced by static weight of drill rod 94mm: 94 millimeter wireline core barrel ▼: Water level directly measured in boring
: Estimated water level based solely on sample appearance
CONS: One-dimensional consolidation test DEN: Dry density, pcf DST: Direct shear test E: Pressuremeter Modulus, tsf HYD: Hydrometer analysis LL: Liquid Limit, % LP: Pressuremeter Limit Pressure, tsf OC: Organic Content, % PERM: Coefficient of permeability (K) test; F - Field;
L - Laboratory PL: Plastic Limit, % qp: Pocket Penetrometer strength, tsf (approximate) qc: Static cone bearing pressure, tsf qu: Unconfined compressive strength, psf R: Electrical Resistivity, ohm-cms RQD: Rock Quality Designation of Rock Core, in percent
(aggregate length of core pieces 4" or more in length as a percent of total core run)
SA: Sieve analysis TRX: Triaxial compression test VSR: Vane shear strength, remolded (field), psf VSU: Vane shear strength, undisturbed (field), psf WC: Water content, as percent of dry weight %-200: Percent of material finer than #200 sieve STANDARD PENETRATION TEST NOTES The standard penetration test consists of driving the sampler with a 140 pound hammer and counting the number of blows applied in each of three 6" increments of penetration. If the sampler is driven less than 18" (usually in highly resistant material), permitted in ASTM: D1586, the blows for each complete 6" increment and for each partial increment is on the boring log. For partial increments, the number of blows is shown to the nearest 0.1' below the slash. The length of sample recovered, as shown on the “REC” column, may be greater than the distance indicated in the N column. The disparity is because the N-value is recorded below the initial 6" set (unless partial penetration defined in ASTM: D1586 is encountered) whereas the length of sample recovered is for the entire sampler drive (which may even extend more than 18").

Appendix B
WDNR Monitoring Well Construction and
Development Forms
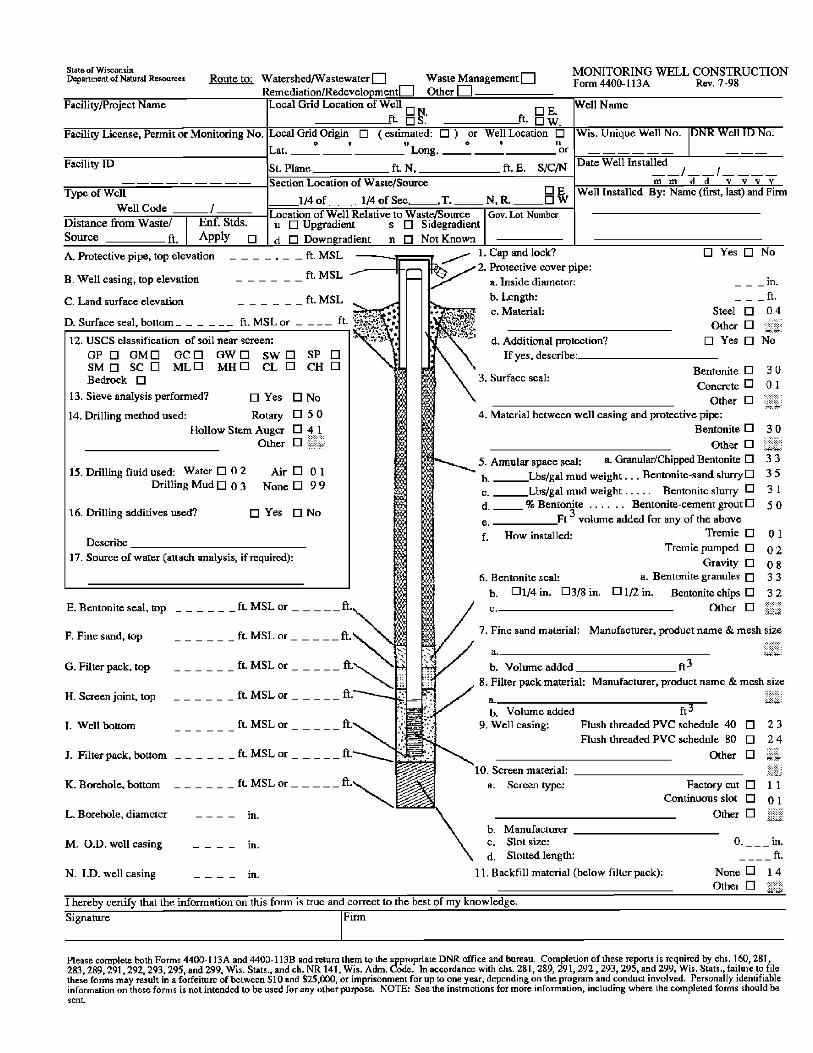


Appendix C
Gradation Curves


Appendix D
Kozeny-Carman Calculation Estimates

American Engineering Testing, Inc. AET Project No.550 Cleveland Avenue North Boring No.
St. Paul, Minnesota 55114 Sample No.
Phone: (651) 659-9001 Depth (feet)
Fax: (651) 659-1379 Cu
CcD10 [mm]
P-200 [%]
Fines
USCS
Sieve Sieve Size (mm) Percent FinerSieve Size
(cm)i Dsi (cm) Dli (cm) fi
Di ave =
Dli^0.404 x
Dsi^0.595
fi / Di ave
2 inches 50 100 5 12 NA NA NA NA NA
1.5 inches 37.5 100 3.75 11 3.7500 5.0000 0 4.207 0.0
1 inch 25 100 2.5 10 2.5000 3.7500 0 2.942 0.0
3/4 inch 19 100 1.9 9 1.9000 2.5000 0 2.121 0.0
5/8 inch 16 89 1.6 8 1.6000 1.9000 11 1.714 6.4
1/2 inch 12.7 89 1.27 7 1.2700 1.6000 0 1.394 0.0
No. 4 4.75 83 0.475 6 0.4750 1.2700 6 0.707 8.5
No. 10 2 76 0.2 5 0.2000 0.4750 7 0.284 24.6
No. 20 0.85 55 0.085 4 0.0850 0.2000 21 0.120 174.4
No. 40 0.425 29 0.0425 3 0.0425 0.0850 26 0.056 460.9
No. 100 0.15 3 0.015 2 0.0150 0.0425 26 0.023 1133.3
No. 200 0.075 1.5 0.0075 1 0.0075 0.0150 1.5 0.010 150.4
0 0.00433 0.00750 1.5 0.005 276.0
Equivalent Minimum Particle Size2: or 0.001 mm, whichever is greater Sum = 2234.5
0.30 Estimated
0.43 = n/(1-n)
6.6 Rounded, Loudon (1952)
valid for: < 5% passing No. 200 sieve and 0.1 ≤ D10 ≤ 3 mm
Hazen k = 5.24E-02 cm/s
or 148.7 ft/d
References:
feet/dayor 142.9
Porosity (n) =
Shape Factor (SF) =
Kozeny-Carman k = 5.04E-02
0.23
1.5
Mostly Non-plastic
Sand (SP)
Kozeny-Carman Equation1
cm/s
2Chapuis R. P. and M. Aubertin, "Discussion on the use of the Kozeny-Carman equation to predict the hydraulic conductivity of soils," Canadian Geotechnical Journal , Vol. 40: 616-628, 2003
1Carrier, D. W., III, "Goodbye, Hazen; Hello, Kozeny-Carman," Technical Note, Journal of Geotechnical and Geoenvironmental Engineering , ASCE, Vol. 129, No. 11, November 2003
31-004553
13
44.5 to 46.5
4.34
0.86
Hazen Equation
Voids ratio (e) =
e
e
SF
DD
fxk
sili
i1
1%1001099.1
3
2
2
595.0404.0
4
mmDandscmk
DCDk
10
2
10
2
10
32
00 ls DD

American Engineering Testing, Inc. AET Project No.550 Cleveland Avenue North Boring No.
St. Paul, Minnesota 55114 Sample No.
Phone: (651) 659-9001 Depth (feet)
Fax: (651) 659-1379 Cu
CcD10 [mm]
P-200 [%]
Fines
USCS
Sieve Sieve Size (mm) Percent FinerSieve Size
(cm)i Dsi (cm) Dli (cm) fi
Di ave =
Dli^0.404 x
Dsi^0.595
fi / Di ave
2 inches 50 100 5 12 NA NA NA NA NA
1.5 inches 37.5 100 3.75 11 3.7500 5.0000 0 4.207 0.0
1 inch 25 100 2.5 10 2.5000 3.7500 0 2.942 0.0
3/4 inch 19 100 1.9 9 1.9000 2.5000 0 2.121 0.0
5/8 inch 16 100 1.6 8 1.6000 1.9000 0 1.714 0.0
1/2 inch 12.7 98 1.27 7 1.2700 1.6000 2 1.394 1.4
No. 4 4.75 96 0.475 6 0.4750 1.2700 2 0.707 2.8
No. 10 2 93 0.2 5 0.2000 0.4750 3 0.284 10.6
No. 20 0.85 84 0.085 4 0.0850 0.2000 9 0.120 74.8
No. 40 0.425 52 0.0425 3 0.0425 0.0850 32 0.056 567.2
No. 100 0.15 3 0.015 2 0.0150 0.0425 49 0.023 2135.8
No. 200 0.075 0.9 0.0075 1 0.0075 0.0150 2.1 0.010 210.6
0 0.00433 0.00750 0.9 0.005 165.6
Equivalent Minimum Particle Size2: or 0.001 mm, whichever is greater Sum = 3168.7
0.30 Estimated
0.43 = n/(1-n)
6.6 Rounded, Loudon (1952)
valid for: < 5% passing No. 200 sieve and 0.1 ≤ D10 ≤ 3 mm
Hazen k = 3.57E-02 cm/s
or 101.1 ft/d
References:
31-004553
14
49.5 to 51.5
2.61
0.9
0.19
0.9
Mostly Non-plastic
Sand (SP)
2Chapuis R. P. and M. Aubertin, "Discussion on the use of the Kozeny-Carman equation to predict the hydraulic conductivity of soils," Canadian Geotechnical Journal , Vol. 40: 616-628, 2003
1Carrier, D. W., III, "Goodbye, Hazen; Hello, Kozeny-Carman," Technical Note, Journal of Geotechnical and Geoenvironmental Engineering , ASCE, Vol. 129, No. 11, November 2003
Hazen Equation
Voids ratio (e) =
Kozeny-Carman Equation1
cm/s
or 71.1
Porosity (n) =
Shape Factor (SF) =
Kozeny-Carman k = 2.51E-02
feet/day
e
e
SF
DD
fxk
sili
i1
1%1001099.1
3
2
2
595.0404.0
4
mmDandscmk
DCDk
10
2
10
2
10
32
00 ls DD

American Engineering Testing, Inc. AET Project No.550 Cleveland Avenue North Boring No.
St. Paul, Minnesota 55114 Sample No.
Phone: (651) 659-9001 Depth (feet)
Fax: (651) 659-1379 Cu
CcD10 [mm]
P-200 [%]
Fines
USCS
Sieve Sieve Size (mm) Percent FinerSieve Size
(cm)i Dsi (cm) Dli (cm) fi
Di ave =
Dli^0.404 x
Dsi^0.595
fi / Di ave
2 inches 50 100 5 12 NA NA NA NA NA
1.5 inches 37.5 100 3.75 11 3.7500 5.0000 0 4.207 0.0
1 inch 25 100 2.5 10 2.5000 3.7500 0 2.942 0.0
3/4 inch 19 100 1.9 9 1.9000 2.5000 0 2.121 0.0
5/8 inch 16 100 1.6 8 1.6000 1.9000 0 1.714 0.0
1/2 inch 12.7 100 1.27 7 1.2700 1.6000 0 1.394 0.0
No. 4 4.75 91 0.475 6 0.4750 1.2700 9 0.707 12.7
No. 10 2 85 0.2 5 0.2000 0.4750 6 0.284 21.1
No. 20 0.85 63 0.085 4 0.0850 0.2000 22 0.120 182.7
No. 40 0.425 20 0.0425 3 0.0425 0.0850 43 0.056 762.2
No. 100 0.15 4 0.015 2 0.0150 0.0425 16 0.023 697.4
No. 200 0.075 2.7 0.0075 1 0.0075 0.0150 1.3 0.010 130.4
0 0.00433 0.00750 2.7 0.005 496.7
Equivalent Minimum Particle Size2: or 0.001 mm, whichever is greater Sum = 2303.3
0.30 Estimated
0.43 = n/(1-n)
6.6 Rounded, Loudon (1952)
valid for: < 5% passing No. 200 sieve and 0.1 ≤ D10 ≤ 3 mm
Hazen k = 6.30E-02 cm/s
or 178.6 ft/d
References:
feet/dayor 134.5
Porosity (n) =
Shape Factor (SF) =
Kozeny-Carman k = 4.74E-02
0.25
2.7
Mostly Non-plastic
Sand (SP)
Kozeny-Carman Equation1
cm/s
2Chapuis R. P. and M. Aubertin, "Discussion on the use of the Kozeny-Carman equation to predict the hydraulic conductivity of soils," Canadian Geotechnical Journal , Vol. 40: 616-628, 2003
1Carrier, D. W., III, "Goodbye, Hazen; Hello, Kozeny-Carman," Technical Note, Journal of Geotechnical and Geoenvironmental Engineering , ASCE, Vol. 129, No. 11, November 2003
31-004554
13
44.5 to 46.5
3.19
1.28
Hazen Equation
Voids ratio (e) =
e
e
SF
DD
fxk
sili
i1
1%1001099.1
3
2
2
595.0404.0
4
mmDandscmk
DCDk
10
2
10
2
10
32
00 ls DD

American Engineering Testing, Inc. AET Project No.550 Cleveland Avenue North Boring No.
St. Paul, Minnesota 55114 Sample No.
Phone: (651) 659-9001 Depth (feet)
Fax: (651) 659-1379 Cu
CcD10 [mm]
P-200 [%]
Fines
USCS
Sieve Sieve Size (mm) Percent FinerSieve Size
(cm)i Dsi (cm) Dli (cm) fi
Di ave =
Dli^0.404 x
Dsi^0.595
fi / Di ave
2 inches 50 100 5 12 NA NA NA NA NA
1.5 inches 37.5 100 3.75 11 3.7500 5.0000 0 4.207 0.0
1 inch 25 100 2.5 10 2.5000 3.7500 0 2.942 0.0
3/4 inch 19 100 1.9 9 1.9000 2.5000 0 2.121 0.0
5/8 inch 16 100 1.6 8 1.6000 1.9000 0 1.714 0.0
1/2 inch 12.7 100 1.27 7 1.2700 1.6000 0 1.394 0.0
No. 4 4.75 99 0.475 6 0.4750 1.2700 1 0.707 1.4
No. 10 2 96 0.2 5 0.2000 0.4750 3 0.284 10.6
No. 20 0.85 84 0.085 4 0.0850 0.2000 12 0.120 99.7
No. 40 0.425 19 0.0425 3 0.0425 0.0850 65 0.056 1152.2
No. 100 0.15 3 0.015 2 0.0150 0.0425 16 0.023 697.4
No. 200 0.075 1.8 0.0075 1 0.0075 0.0150 1.2 0.010 120.3
0 0.00433 0.00750 1.8 0.005 331.2
Equivalent Minimum Particle Size2: or 0.001 mm, whichever is greater Sum = 2412.7
0.30 Estimated
0.43 = n/(1-n)
6.6 Rounded, Loudon (1952)
valid for: < 5% passing No. 200 sieve and 0.1 ≤ D10 ≤ 3 mm
Hazen k = 7.25E-02 cm/s
or 205.4 ft/d
References:
31-004554
14
49.5 to 51.5
2.41
1.34
0.27
1.8
Mostly Non-plastic
Sand (SP)
2Chapuis R. P. and M. Aubertin, "Discussion on the use of the Kozeny-Carman equation to predict the hydraulic conductivity of soils," Canadian Geotechnical Journal , Vol. 40: 616-628, 2003
1Carrier, D. W., III, "Goodbye, Hazen; Hello, Kozeny-Carman," Technical Note, Journal of Geotechnical and Geoenvironmental Engineering , ASCE, Vol. 129, No. 11, November 2003
Hazen Equation
Voids ratio (e) =
Kozeny-Carman Equation1
cm/s
or 122.6
Porosity (n) =
Shape Factor (SF) =
Kozeny-Carman k = 4.32E-02
feet/day
e
e
SF
DD
fxk
sili
i1
1%1001099.1
3
2
2
595.0404.0
4
mmDandscmk
DCDk
10
2
10
2
10
32
00 ls DD

American Engineering Testing, Inc. AET Project No.550 Cleveland Avenue North Boring No.
St. Paul, Minnesota 55114 Sample No.
Phone: (651) 659-9001 Depth (feet)
Fax: (651) 659-1379 Cu
CcD10 [mm]
P-200 [%]
Fines
USCS
Sieve Sieve Size (mm) Percent FinerSieve Size
(cm)i Dsi (cm) Dli (cm) fi
Di ave =
Dli^0.404 x
Dsi^0.595
fi / Di ave
2 inches 50 100 5 12 NA NA NA NA NA
1.5 inches 37.5 100 3.75 11 3.7500 5.0000 0 4.207 0.0
1 inch 25 100 2.5 10 2.5000 3.7500 0 2.942 0.0
3/4 inch 19 100 1.9 9 1.9000 2.5000 0 2.121 0.0
5/8 inch 16 91 1.6 8 1.6000 1.9000 9 1.714 5.3
1/2 inch 12.7 88 1.27 7 1.2700 1.6000 3 1.394 2.2
No. 4 4.75 72 0.475 6 0.4750 1.2700 16 0.707 22.6
No. 10 2 55 0.2 5 0.2000 0.4750 17 0.284 59.8
No. 20 0.85 30 0.085 4 0.0850 0.2000 25 0.120 207.6
No. 40 0.425 13 0.0425 3 0.0425 0.0850 17 0.056 301.4
No. 100 0.15 5 0.015 2 0.0150 0.0425 8 0.023 348.7
No. 200 0.075 3.5 0.0075 1 0.0075 0.0150 1.5 0.010 150.4
0 0.00433 0.00750 3.5 0.005 643.9
Equivalent Minimum Particle Size2: or 0.001 mm, whichever is greater Sum = 1741.9
0.30 Estimated
0.43 = n/(1-n)
6.6 Rounded, Loudon (1952)
valid for: < 5% passing No. 200 sieve and 0.1 ≤ D10 ≤ 3 mm
Hazen k = 1.23E-01 cm/s
or 347.8 ft/d
References:
feet/dayor 235.2
Porosity (n) =
Shape Factor (SF) =
Kozeny-Carman k = 8.30E-02
0.35
3.5
Mostly Non-plastic
Sand (SP)
Kozeny-Carman Equation1
cm/s
2Chapuis R. P. and M. Aubertin, "Discussion on the use of the Kozeny-Carman equation to predict the hydraulic conductivity of soils," Canadian Geotechnical Journal , Vol. 40: 616-628, 2003
1Carrier, D. W., III, "Goodbye, Hazen; Hello, Kozeny-Carman," Technical Note, Journal of Geotechnical and Geoenvironmental Engineering , ASCE, Vol. 129, No. 11, November 2003
31-004555
10
29 to 31
7.03
0.82
Hazen Equation
Voids ratio (e) =
e
e
SF
DD
fxk
sili
i1
1%1001099.1
3
2
2
595.0404.0
4
mmDandscmk
DCDk
10
2
10
2
10
32
00 ls DD

American Engineering Testing, Inc. AET Project No.550 Cleveland Avenue North Boring No.
St. Paul, Minnesota 55114 Sample No.
Phone: (651) 659-9001 Depth (feet)
Fax: (651) 659-1379 Cu
CcD10 [mm]
P-200 [%]
Fines
USCS
Sieve Sieve Size (mm) Percent FinerSieve Size
(cm)i Dsi (cm) Dli (cm) fi
Di ave =
Dli^0.404 x
Dsi^0.595
fi / Di ave
2 inches 50 100 5 12 NA NA NA NA NA
1.5 inches 37.5 100 3.75 11 3.7500 5.0000 0 4.207 0.0
1 inch 25 100 2.5 10 2.5000 3.7500 0 2.942 0.0
3/4 inch 19 100 1.9 9 1.9000 2.5000 0 2.121 0.0
5/8 inch 16 91 1.6 8 1.6000 1.9000 9 1.714 5.3
1/2 inch 12.7 89 1.27 7 1.2700 1.6000 2 1.394 1.4
No. 4 4.75 71 0.475 6 0.4750 1.2700 18 0.707 25.5
No. 10 2 57 0.2 5 0.2000 0.4750 14 0.284 49.3
No. 20 0.85 37 0.085 4 0.0850 0.2000 20 0.120 166.1
No. 40 0.425 14 0.0425 3 0.0425 0.0850 23 0.056 407.7
No. 100 0.15 4 0.015 2 0.0150 0.0425 10 0.023 435.9
No. 200 0.075 2.4 0.0075 1 0.0075 0.0150 1.6 0.010 160.4
0 0.00433 0.00750 2.4 0.005 441.5
Equivalent Minimum Particle Size2: or 0.001 mm, whichever is greater Sum = 1693.1
0.30 Estimated
0.43 = n/(1-n)
6.6 Rounded, Loudon (1952)
valid for: < 5% passing No. 200 sieve and 0.1 ≤ D10 ≤ 3 mm
Hazen k = 1.20E-01 cm/s
or 340.7 ft/d
References:
31-004555
11
34 to 36
7.07
0.57
0.35
2.4
Mostly Non-plastic
Sand (SP)
2Chapuis R. P. and M. Aubertin, "Discussion on the use of the Kozeny-Carman equation to predict the hydraulic conductivity of soils," Canadian Geotechnical Journal , Vol. 40: 616-628, 2003
1Carrier, D. W., III, "Goodbye, Hazen; Hello, Kozeny-Carman," Technical Note, Journal of Geotechnical and Geoenvironmental Engineering , ASCE, Vol. 129, No. 11, November 2003
Hazen Equation
Voids ratio (e) =
Kozeny-Carman Equation1
cm/s
or 248.9
Porosity (n) =
Shape Factor (SF) =
Kozeny-Carman k = 8.78E-02
feet/day
e
e
SF
DD
fxk
sili
i1
1%1001099.1
3
2
2
595.0404.0
4
mmDandscmk
DCDk
10
2
10
2
10
32
00 ls DD

American Engineering Testing, Inc. AET Project No.550 Cleveland Avenue North Boring No.
St. Paul, Minnesota 55114 Sample No.
Phone: (651) 659-9001 Depth (feet)
Fax: (651) 659-1379 Cu
CcD10 [mm]
P-200 [%]
Fines
USCS
Sieve Sieve Size (mm) Percent FinerSieve Size
(cm)i Dsi (cm) Dli (cm) fi
Di ave =
Dli^0.404 x
Dsi^0.595
fi / Di ave
2 inches 50 100 5 12 NA NA NA NA NA
1.5 inches 37.5 100 3.75 11 3.7500 5.0000 0 4.207 0.0
1 inch 25 100 2.5 10 2.5000 3.7500 0 2.942 0.0
3/4 inch 19 100 1.9 9 1.9000 2.5000 0 2.121 0.0
5/8 inch 16 95 1.6 8 1.6000 1.9000 5 1.714 2.9
1/2 inch 12.7 91 1.27 7 1.2700 1.6000 4 1.394 2.9
No. 4 4.75 83 0.475 6 0.4750 1.2700 8 0.707 11.3
No. 10 2 70 0.2 5 0.2000 0.4750 13 0.284 45.8
No. 20 0.85 43 0.085 4 0.0850 0.2000 27 0.120 224.3
No. 40 0.425 18 0.0425 3 0.0425 0.0850 25 0.056 443.2
No. 100 0.15 5 0.015 2 0.0150 0.0425 13 0.023 566.6
No. 200 0.075 3.3 0.0075 1 0.0075 0.0150 1.7 0.010 170.5
0 0.00433 0.00750 3.3 0.005 607.1
Equivalent Minimum Particle Size2: or 0.001 mm, whichever is greater Sum = 2074.5
0.30 Estimated
0.43 = n/(1-n)
6.6 Rounded, Loudon (1952)
valid for: < 5% passing No. 200 sieve and 0.1 ≤ D10 ≤ 3 mm
Hazen k = 7.68E-02 cm/s
or 217.8 ft/d
References:
feet/dayor 165.8
Porosity (n) =
Shape Factor (SF) =
Kozeny-Carman k = 5.85E-02
0.28
3.3
Mostly Non-plastic
Sand (SP)
Kozeny-Carman Equation1
cm/s
2Chapuis R. P. and M. Aubertin, "Discussion on the use of the Kozeny-Carman equation to predict the hydraulic conductivity of soils," Canadian Geotechnical Journal , Vol. 40: 616-628, 2003
1Carrier, D. W., III, "Goodbye, Hazen; Hello, Kozeny-Carman," Technical Note, Journal of Geotechnical and Geoenvironmental Engineering , ASCE, Vol. 129, No. 11, November 2003
31-004556
10
29.5 to 31.5
5
0.96
Hazen Equation
Voids ratio (e) =
e
e
SF
DD
fxk
sili
i1
1%1001099.1
3
2
2
595.0404.0
4
mmDandscmk
DCDk
10
2
10
2
10
32
00 ls DD

American Engineering Testing, Inc. AET Project No.550 Cleveland Avenue North Boring No.
St. Paul, Minnesota 55114 Sample No.
Phone: (651) 659-9001 Depth (feet)
Fax: (651) 659-1379 Cu
CcD10 [mm]
P-200 [%]
Fines
USCS
Sieve Sieve Size (mm) Percent FinerSieve Size
(cm)i Dsi (cm) Dli (cm) fi
Di ave =
Dli^0.404 x
Dsi^0.595
fi / Di ave
2 inches 50 100 5 12 NA NA NA NA NA
1.5 inches 37.5 100 3.75 11 3.7500 5.0000 0 4.207 0.0
1 inch 25 100 2.5 10 2.5000 3.7500 0 2.942 0.0
3/4 inch 19 100 1.9 9 1.9000 2.5000 0 2.121 0.0
5/8 inch 16 96 1.6 8 1.6000 1.9000 4 1.714 2.3
1/2 inch 12.7 91 1.27 7 1.2700 1.6000 5 1.394 3.6
No. 4 4.75 76 0.475 6 0.4750 1.2700 15 0.707 21.2
No. 10 2 63 0.2 5 0.2000 0.4750 13 0.284 45.8
No. 20 0.85 41 0.085 4 0.0850 0.2000 22 0.120 182.7
No. 40 0.425 16 0.0425 3 0.0425 0.0850 25 0.056 443.2
No. 100 0.15 3 0.015 2 0.0150 0.0425 13 0.023 566.6
No. 200 0.075 1.7 0.0075 1 0.0075 0.0150 1.3 0.010 130.4
0 0.00433 0.00750 1.7 0.005 312.8
Equivalent Minimum Particle Size2: or 0.001 mm, whichever is greater Sum = 1708.5
0.30 Estimated
0.43 = n/(1-n)
6.6 Rounded, Loudon (1952)
valid for: < 5% passing No. 200 sieve and 0.1 ≤ D10 ≤ 3 mm
Hazen k = 1.15E-01 cm/s
or 325.0 ft/d
References:
31-004556
11
34.5 to 36.5
5.15
0.69
0.34
1.7
Mostly Non-plastic
Sand (SP)
2Chapuis R. P. and M. Aubertin, "Discussion on the use of the Kozeny-Carman equation to predict the hydraulic conductivity of soils," Canadian Geotechnical Journal , Vol. 40: 616-628, 2003
1Carrier, D. W., III, "Goodbye, Hazen; Hello, Kozeny-Carman," Technical Note, Journal of Geotechnical and Geoenvironmental Engineering , ASCE, Vol. 129, No. 11, November 2003
Hazen Equation
Voids ratio (e) =
Kozeny-Carman Equation1
cm/s
or 244.5
Porosity (n) =
Shape Factor (SF) =
Kozeny-Carman k = 8.62E-02
feet/day
e
e
SF
DD
fxk
sili
i1
1%1001099.1
3
2
2
595.0404.0
4
mmDandscmk
DCDk
10
2
10
2
10
32
00 ls DD

American Engineering Testing, Inc. AET Project No.550 Cleveland Avenue North Boring No.
St. Paul, Minnesota 55114 Sample No.
Phone: (651) 659-9001 Depth (feet)
Fax: (651) 659-1379 Cu
CcD10 [mm]
P-200 [%]
Fines
USCS
Sieve Sieve Size (mm) Percent FinerSieve Size
(cm)i Dsi (cm) Dli (cm) fi
Di ave =
Dli^0.404 x
Dsi^0.595
fi / Di ave
2 inches 50 100 5 12 NA NA NA NA NA
1.5 inches 37.5 100 3.75 11 3.7500 5.0000 0 4.207 0.0
1 inch 25 100 2.5 10 2.5000 3.7500 0 2.942 0.0
3/4 inch 19 100 1.9 9 1.9000 2.5000 0 2.121 0.0
5/8 inch 16 87 1.6 8 1.6000 1.9000 13 1.714 7.6
1/2 inch 12.7 85 1.27 7 1.2700 1.6000 2 1.394 1.4
No. 4 4.75 72 0.475 6 0.4750 1.2700 13 0.707 18.4
No. 10 2 61 0.2 5 0.2000 0.4750 11 0.284 38.7
No. 20 0.85 41 0.085 4 0.0850 0.2000 20 0.120 166.1
No. 40 0.425 13 0.0425 3 0.0425 0.0850 28 0.056 496.3
No. 100 0.15 4 0.015 2 0.0150 0.0425 9 0.023 392.3
No. 200 0.075 2.4 0.0075 1 0.0075 0.0150 1.6 0.010 160.4
0 0.00433 0.00750 2.4 0.005 441.5
Equivalent Minimum Particle Size2: or 0.001 mm, whichever is greater Sum = 1722.8
0.30 Estimated
0.43 = n/(1-n)
6.6 Rounded, Loudon (1952)
valid for: < 5% passing No. 200 sieve and 0.1 ≤ D10 ≤ 3 mm
Hazen k = 1.07E-01 cm/s
or 303.8 ft/d
References:
31-004557
Kozeny-Carman Equation1
10
29.5 to 31.5
5.78
0.7
0.33
2.4
Mostly Non-plastic
Sand (SP)
Porosity (n) = Hazen Equation
1Carrier, D. W., III, "Goodbye, Hazen; Hello, Kozeny-Carman," Technical Note, Journal of Geotechnical and Geoenvironmental Engineering , ASCE, Vol. 129, No. 11, November 2003
2Chapuis R. P. and M. Aubertin, "Discussion on the use of the Kozeny-Carman equation to predict the hydraulic conductivity of soils," Canadian Geotechnical Journal , Vol. 40: 616-628, 2003
Voids ratio (e) =
Shape Factor (SF) =
Kozeny-Carman k = 8.48E-02 cm/s
or 240.4 feet/day
e
e
SF
DD
fxk
sili
i1
1%1001099.1
3
2
2
595.0404.0
4
mmDandscmk
DCDk
10
2
10
2
10
32
00 ls DD

American Engineering Testing, Inc. AET Project No.550 Cleveland Avenue North Boring No.
St. Paul, Minnesota 55114 Sample No.
Phone: (651) 659-9001 Depth (feet)
Fax: (651) 659-1379 Cu
CcD10 [mm]
P-200 [%]
Fines
USCS
Sieve Sieve Size (mm) Percent FinerSieve Size
(cm)i Dsi (cm) Dli (cm) fi
Di ave =
Dli^0.404 x
Dsi^0.595
fi / Di ave
2 inches 50 100 5 12 NA NA NA NA NA
1.5 inches 37.5 100 3.75 11 3.7500 5.0000 0 4.207 0.0
1 inch 25 100 2.5 10 2.5000 3.7500 0 2.942 0.0
3/4 inch 19 100 1.9 9 1.9000 2.5000 0 2.121 0.0
5/8 inch 16 84 1.6 8 1.6000 1.9000 16 1.714 9.3
1/2 inch 12.7 77 1.27 7 1.2700 1.6000 7 1.394 5.0
No. 4 4.75 64 0.475 6 0.4750 1.2700 13 0.707 18.4
No. 10 2 59 0.2 5 0.2000 0.4750 5 0.284 17.6
No. 20 0.85 50 0.085 4 0.0850 0.2000 9 0.120 74.8
No. 40 0.425 31 0.0425 3 0.0425 0.0850 19 0.056 336.8
No. 100 0.15 5 0.015 2 0.0150 0.0425 26 0.023 1133.3
No. 200 0.075 1.5 0.0075 1 0.0075 0.0150 3.5 0.010 351.0
0 0.00433 0.00750 1.5 0.005 276.0
Equivalent Minimum Particle Size2: or 0.001 mm, whichever is greater Sum = 2222.1
0.30 Estimated
0.43 = n/(1-n)
6.6 Rounded, Loudon (1952)
valid for: < 5% passing No. 200 sieve and 0.1 ≤ D10 ≤ 3 mm
Hazen k = 3.91E-02 cm/s
or 110.8 ft/d
References:
31-004557
Kozeny-Carman Equation1
11
34.5 to 36.5
12.38
0.36
0.20
1.5
Mostly Non-plastic
Sand (SP)
Porosity (n) = Hazen Equation
1Carrier, D. W., III, "Goodbye, Hazen; Hello, Kozeny-Carman," Technical Note, Journal of Geotechnical and Geoenvironmental Engineering , ASCE, Vol. 129, No. 11, November 2003
2Chapuis R. P. and M. Aubertin, "Discussion on the use of the Kozeny-Carman equation to predict the hydraulic conductivity of soils," Canadian Geotechnical Journal , Vol. 40: 616-628, 2003
Voids ratio (e) =
Shape Factor (SF) =
Kozeny-Carman k = 5.10E-02 cm/s
or 144.5 feet/day
e
e
SF
DD
fxk
sili
i1
1%1001099.1
3
2
2
595.0404.0
4
mmDandscmk
DCDk
10
2
10
2
10
32
00 ls DD
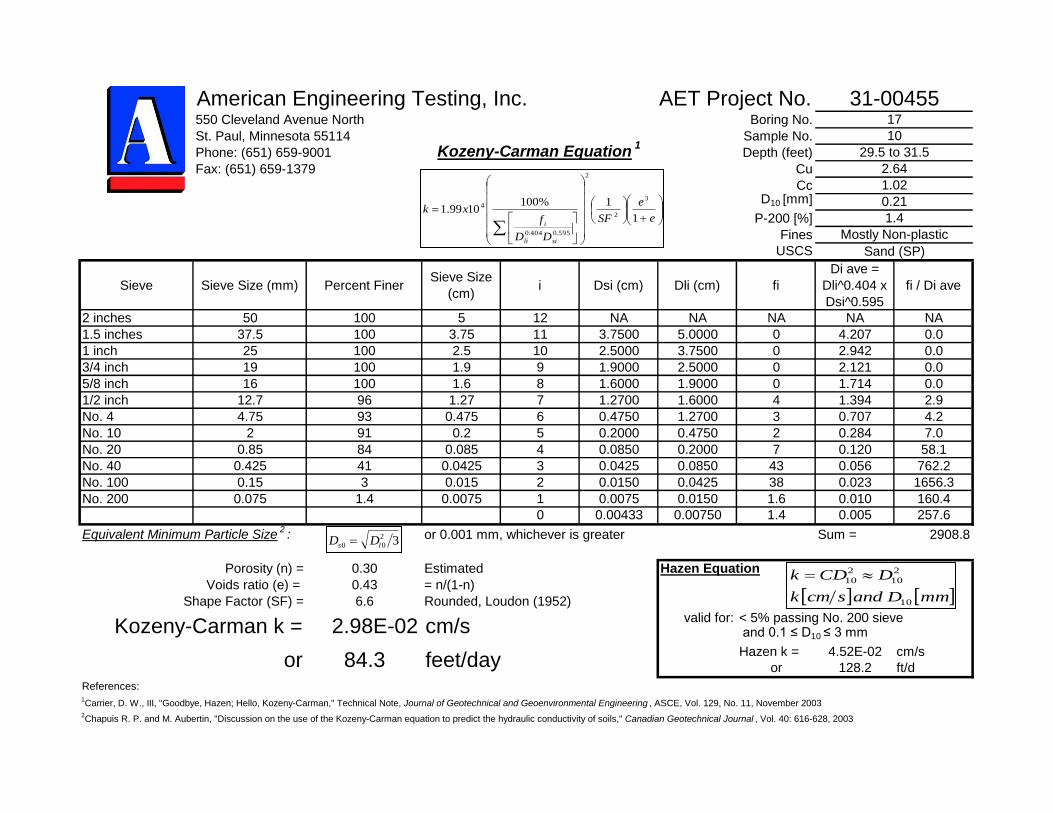
American Engineering Testing, Inc. AET Project No.550 Cleveland Avenue North Boring No.
St. Paul, Minnesota 55114 Sample No.
Phone: (651) 659-9001 Depth (feet)
Fax: (651) 659-1379 Cu
CcD10 [mm]
P-200 [%]
Fines
USCS
Sieve Sieve Size (mm) Percent FinerSieve Size
(cm)i Dsi (cm) Dli (cm) fi
Di ave =
Dli^0.404 x
Dsi^0.595
fi / Di ave
2 inches 50 100 5 12 NA NA NA NA NA
1.5 inches 37.5 100 3.75 11 3.7500 5.0000 0 4.207 0.0
1 inch 25 100 2.5 10 2.5000 3.7500 0 2.942 0.0
3/4 inch 19 100 1.9 9 1.9000 2.5000 0 2.121 0.0
5/8 inch 16 100 1.6 8 1.6000 1.9000 0 1.714 0.0
1/2 inch 12.7 96 1.27 7 1.2700 1.6000 4 1.394 2.9
No. 4 4.75 93 0.475 6 0.4750 1.2700 3 0.707 4.2
No. 10 2 91 0.2 5 0.2000 0.4750 2 0.284 7.0
No. 20 0.85 84 0.085 4 0.0850 0.2000 7 0.120 58.1
No. 40 0.425 41 0.0425 3 0.0425 0.0850 43 0.056 762.2
No. 100 0.15 3 0.015 2 0.0150 0.0425 38 0.023 1656.3
No. 200 0.075 1.4 0.0075 1 0.0075 0.0150 1.6 0.010 160.4
0 0.00433 0.00750 1.4 0.005 257.6
Equivalent Minimum Particle Size2: or 0.001 mm, whichever is greater Sum = 2908.8
0.30 Estimated
0.43 = n/(1-n)
6.6 Rounded, Loudon (1952)
valid for: < 5% passing No. 200 sieve and 0.1 ≤ D10 ≤ 3 mm
Hazen k = 4.52E-02 cm/s
or 128.2 ft/d
References:
31-0045517
Kozeny-Carman Equation1
10
29.5 to 31.5
2.64
1.02
0.21
1.4
Mostly Non-plastic
Sand (SP)
Porosity (n) = Hazen Equation
1Carrier, D. W., III, "Goodbye, Hazen; Hello, Kozeny-Carman," Technical Note, Journal of Geotechnical and Geoenvironmental Engineering , ASCE, Vol. 129, No. 11, November 2003
2Chapuis R. P. and M. Aubertin, "Discussion on the use of the Kozeny-Carman equation to predict the hydraulic conductivity of soils," Canadian Geotechnical Journal , Vol. 40: 616-628, 2003
Voids ratio (e) =
Shape Factor (SF) =
Kozeny-Carman k = 2.98E-02 cm/s
or 84.3 feet/day
e
e
SF
DD
fxk
sili
i1
1%1001099.1
3
2
2
595.0404.0
4
mmDandscmk
DCDk
10
2
10
2
10
32
00 ls DD

American Engineering Testing, Inc. AET Project No.550 Cleveland Avenue North Boring No.
St. Paul, Minnesota 55114 Sample No.
Phone: (651) 659-9001 Depth (feet)
Fax: (651) 659-1379 Cu
CcD10 [mm]
P-200 [%]
Fines
USCS
Sieve Sieve Size (mm) Percent FinerSieve Size
(cm)i Dsi (cm) Dli (cm) fi
Di ave =
Dli^0.404 x
Dsi^0.595
fi / Di ave
2 inches 50 100 5 12 NA NA NA NA NA
1.5 inches 37.5 100 3.75 11 3.7500 5.0000 0 4.207 0.0
1 inch 25 100 2.5 10 2.5000 3.7500 0 2.942 0.0
3/4 inch 19 100 1.9 9 1.9000 2.5000 0 2.121 0.0
5/8 inch 16 94 1.6 8 1.6000 1.9000 6 1.714 3.5
1/2 inch 12.7 89 1.27 7 1.2700 1.6000 5 1.394 3.6
No. 4 4.75 78 0.475 6 0.4750 1.2700 11 0.707 15.6
No. 10 2 64 0.2 5 0.2000 0.4750 14 0.284 49.3
No. 20 0.85 44 0.085 4 0.0850 0.2000 20 0.120 166.1
No. 40 0.425 18 0.0425 3 0.0425 0.0850 26 0.056 460.9
No. 100 0.15 4 0.015 2 0.0150 0.0425 14 0.023 610.2
No. 200 0.075 2.6 0.0075 1 0.0075 0.0150 1.4 0.010 140.4
0 0.00433 0.00750 2.6 0.005 478.3
Equivalent Minimum Particle Size2: or 0.001 mm, whichever is greater Sum = 1927.9
0.30 Estimated
0.43 = n/(1-n)
6.6 Rounded, Loudon (1952)
valid for: < 5% passing No. 200 sieve and 0.1 ≤ D10 ≤ 3 mm
Hazen k = 9.66E-02 cm/s
or 273.8 ft/d
References:
31-0045517
Kozeny-Carman Equation1
11
34.5 to 36.5
5.12
0.71
0.31
2.6
Mostly Non-plastic
Sand (SP)
Porosity (n) = Hazen Equation
1Carrier, D. W., III, "Goodbye, Hazen; Hello, Kozeny-Carman," Technical Note, Journal of Geotechnical and Geoenvironmental Engineering , ASCE, Vol. 129, No. 11, November 2003
2Chapuis R. P. and M. Aubertin, "Discussion on the use of the Kozeny-Carman equation to predict the hydraulic conductivity of soils," Canadian Geotechnical Journal , Vol. 40: 616-628, 2003
Voids ratio (e) =
Shape Factor (SF) =
Kozeny-Carman k = 6.77E-02 cm/s
or 192.0 feet/day
e
e
SF
DD
fxk
sili
i1
1%1001099.1
3
2
2
595.0404.0
4
mmDandscmk
DCDk
10
2
10
2
10
32
00 ls DD

Appendix E
Slug Test Results

0.01 0.1 1. 10.-1.
-0.6
-0.2
0.2
0.6
1.
Time (min)
Norm
alize
d Hea
d (ft/f
t)
SLUG IN 01Data Set: X:\...\P3in01.aqtDate: 06/02/12 Time: 17:27:01
PROJECT INFORMATIONCompany: American Engineering TestingClient: Donohue & AssociatesProject: 31-00455Location: Eau Claire, WITest Well: P-3Test Date: 5/18/2012
AQUIFER DATASaturated Thickness: 86.6 ft Anisotropy Ratio (Kz/Kr): 1.
WELL DATA (P-3)Initial Displacement: -0.735 ft Static Water Column Height: 35.45 ftTotal Well Penetration Depth: 35.45 ft Screen Length: 5. ftCasing Radius: 0.083 ft Well Radius: 0.083 ft
SOLUTIONAquifer Model: Unconfined Solution Method: Springer-GelharK = 569. ft/day Le = 18.54 ft

0. 0.12 0.24 0.36 0.48 0.6-1.
-0.6
-0.2
0.2
0.6
1.
Time (min)
Norm
alize
d Hea
d (ft/f
t)
SLUG IN 02Data Set: X:\...\P3in02.aqtDate: 06/02/12 Time: 17:32:33
PROJECT INFORMATIONCompany: American Engineering TestingClient: Donohue & AssociatesProject: 31-00455Location: Eau Claire, WITest Well: P-3Test Date: 5/18/2012
AQUIFER DATASaturated Thickness: 86.6 ft Anisotropy Ratio (Kz/Kr): 1.
WELL DATA (P-3)Initial Displacement: -0.261 ft Static Water Column Height: 35.45 ftTotal Well Penetration Depth: 35.45 ft Screen Length: 5. ftCasing Radius: 0.083 ft Well Radius: 0.083 ft
SOLUTIONAquifer Model: Unconfined Solution Method: Springer-GelharK = 541.4 ft/day Le = 23.01 ft
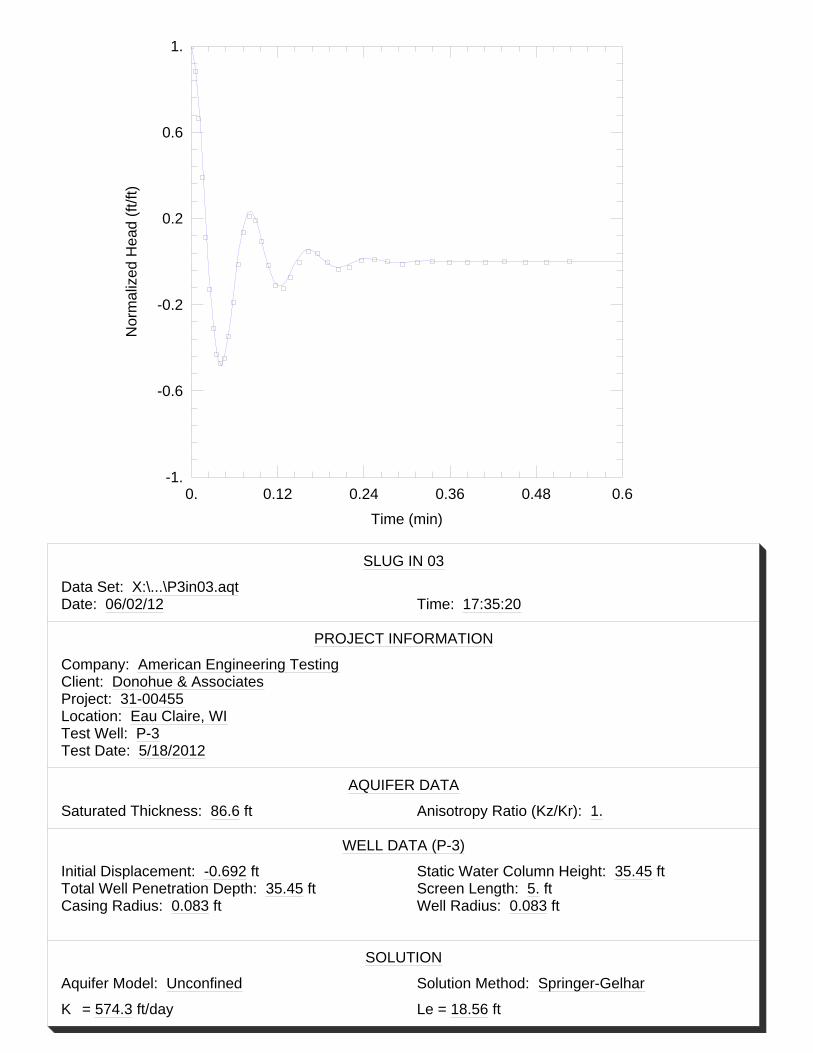
0. 0.12 0.24 0.36 0.48 0.6-1.
-0.6
-0.2
0.2
0.6
1.
Time (min)
Norm
alize
d Hea
d (ft/f
t)
SLUG IN 03Data Set: X:\...\P3in03.aqtDate: 06/02/12 Time: 17:35:20
PROJECT INFORMATIONCompany: American Engineering TestingClient: Donohue & AssociatesProject: 31-00455Location: Eau Claire, WITest Well: P-3Test Date: 5/18/2012
AQUIFER DATASaturated Thickness: 86.6 ft Anisotropy Ratio (Kz/Kr): 1.
WELL DATA (P-3)Initial Displacement: -0.692 ft Static Water Column Height: 35.45 ftTotal Well Penetration Depth: 35.45 ft Screen Length: 5. ftCasing Radius: 0.083 ft Well Radius: 0.083 ft
SOLUTIONAquifer Model: Unconfined Solution Method: Springer-GelharK = 574.3 ft/day Le = 18.56 ft

0. 0.12 0.24 0.36 0.48 0.6-1.
-0.6
-0.2
0.2
0.6
1.
Time (min)
Norm
alize
d Hea
d (ft/f
t)
SLUG OUT 01Data Set: X:\...\P3out01.aqtDate: 06/02/12 Time: 17:37:43
PROJECT INFORMATIONCompany: American Engineering TestingClient: Donohue & AssociatesProject: 31-00455Location: Eau Claire, WITest Well: P-3Test Date: 5/18/2012
AQUIFER DATASaturated Thickness: 86.6 ft Anisotropy Ratio (Kz/Kr): 1.
WELL DATA (P-3)Initial Displacement: 1.341 ft Static Water Column Height: 35.45 ftTotal Well Penetration Depth: 35.45 ft Screen Length: 5. ftCasing Radius: 0.083 ft Well Radius: 0.083 ft
SOLUTIONAquifer Model: Unconfined Solution Method: Springer-GelharK = 447.2 ft/day Le = 23.55 ft

0. 0.12 0.24 0.36 0.48 0.6-1.
-0.6
-0.2
0.2
0.6
1.
Time (min)
Norm
alize
d Hea
d (ft/f
t)
SLUG OUT 02Data Set: X:\...\P3out02.aqtDate: 06/02/12 Time: 17:39:53
PROJECT INFORMATIONCompany: American Engineering TestingClient: Donohue & AssociatesProject: 31-00455Location: Eau Claire, WITest Well: P-3Test Date: 5/18/2012
AQUIFER DATASaturated Thickness: 86.6 ft Anisotropy Ratio (Kz/Kr): 1.
WELL DATA (P-3)Initial Displacement: -0.254 ft Static Water Column Height: 35.45 ftTotal Well Penetration Depth: 35.45 ft Screen Length: 5. ftCasing Radius: 0.083 ft Well Radius: 0.083 ft
SOLUTIONAquifer Model: Unconfined Solution Method: Springer-GelharK = 327.2 ft/day Le = 29.96 ft

0. 0.12 0.24 0.36 0.48 0.6-1.
-0.6
-0.2
0.2
0.6
1.
Time (min)
Norm
alize
d Hea
d (ft/f
t)
SLUG OUT 03Data Set: X:\...\P3out03.aqtDate: 06/02/12 Time: 17:41:30
PROJECT INFORMATIONCompany: American Engineering TestingClient: Donohue & AssociatesProject: 31-00455Location: Eau Claire, WITest Well: P-3Test Date: 5/18/2012
AQUIFER DATASaturated Thickness: 86.6 ft Anisotropy Ratio (Kz/Kr): 1.
WELL DATA (P-3)Initial Displacement: -0.537 ft Static Water Column Height: 35.45 ftTotal Well Penetration Depth: 35.45 ft Screen Length: 5. ftCasing Radius: 0.083 ft Well Radius: 0.083 ft
SOLUTIONAquifer Model: Unconfined Solution Method: Springer-GelharK = 455.5 ft/day Le = 24.04 ft

0.01 0.1 1.-1.
-0.6
-0.2
0.2
0.6
1.
Time (min)
Norm
alize
d Hea
d (ft/f
t)
SLUG IN 01Data Set: X:\...\P4in01.aqtDate: 06/02/12 Time: 17:47:20
PROJECT INFORMATIONCompany: American Engineering TestingClient: Donohue & AssociatesProject: 31-00455Location: Eau Claire, WITest Well: P-4Test Date: 5/17/2012
AQUIFER DATASaturated Thickness: 85.4 ft Anisotropy Ratio (Kz/Kr): 1.
WELL DATA (P-4)Initial Displacement: -0.38 ft Static Water Column Height: 32.55 ftTotal Well Penetration Depth: 32.55 ft Screen Length: 5. ftCasing Radius: 0.083 ft Well Radius: 0.083 ft
SOLUTIONAquifer Model: Unconfined Solution Method: Springer-GelharK = 322.3 ft/day Le = 31.13 ft

0.01 0.1 1.-1.
-0.6
-0.2
0.2
0.6
1.
Time (min)
Norm
alize
d Hea
d (ft/f
t)
SLUG IN 02Data Set: X:\...\P4in02.aqtDate: 06/02/12 Time: 17:49:21
PROJECT INFORMATIONCompany: American Engineering TestingClient: Donohue & AssociatesProject: 31-00455Location: Eau Claire, WITest Well: P-4Test Date: 5/17/2012
AQUIFER DATASaturated Thickness: 85.4 ft Anisotropy Ratio (Kz/Kr): 1.
WELL DATA (P-4)Initial Displacement: -0.217 ft Static Water Column Height: 32.55 ftTotal Well Penetration Depth: 32.55 ft Screen Length: 5. ftCasing Radius: 0.083 ft Well Radius: 0.083 ft
SOLUTIONAquifer Model: Unconfined Solution Method: Springer-GelharK = 366.9 ft/day Le = 30.72 ft

0.01 0.1 1.-1.
-0.6
-0.2
0.2
0.6
1.
Time (min)
Norm
alize
d Hea
d (ft/f
t)
SLUG IN 03Data Set: X:\...\P4in03.aqtDate: 06/03/12 Time: 15:26:48
PROJECT INFORMATIONCompany: American Engineering TestingClient: Donohue & AssociatesProject: 31-00455Location: Eau Claire, WITest Well: P-4Test Date: 5/17/2012
AQUIFER DATASaturated Thickness: 85.4 ft Anisotropy Ratio (Kz/Kr): 1.
WELL DATA (P-4)Initial Displacement: -0.369 ft Static Water Column Height: 32.55 ftTotal Well Penetration Depth: 32.55 ft Screen Length: 5. ftCasing Radius: 0.083 ft Well Radius: 0.083 ft
SOLUTIONAquifer Model: Unconfined Solution Method: Springer-GelharK = 325. ft/day Le = 32.39 ft
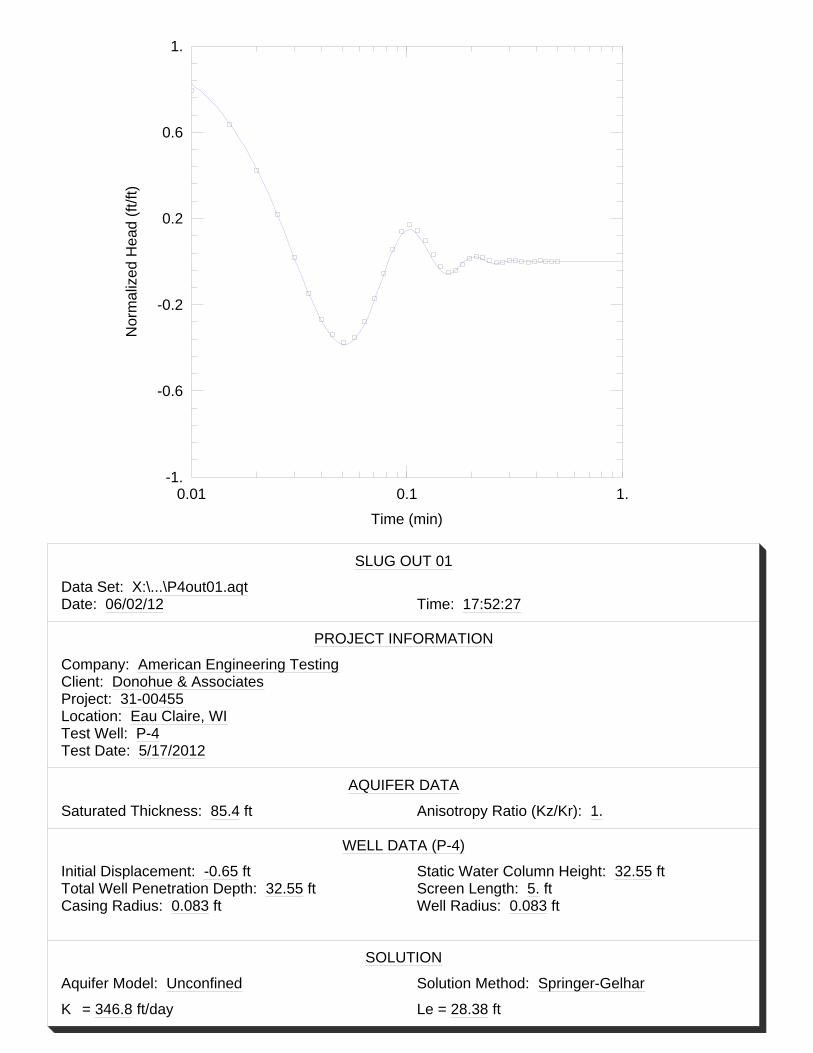
0.01 0.1 1.-1.
-0.6
-0.2
0.2
0.6
1.
Time (min)
Norm
alize
d Hea
d (ft/f
t)
SLUG OUT 01Data Set: X:\...\P4out01.aqtDate: 06/02/12 Time: 17:52:27
PROJECT INFORMATIONCompany: American Engineering TestingClient: Donohue & AssociatesProject: 31-00455Location: Eau Claire, WITest Well: P-4Test Date: 5/17/2012
AQUIFER DATASaturated Thickness: 85.4 ft Anisotropy Ratio (Kz/Kr): 1.
WELL DATA (P-4)Initial Displacement: -0.65 ft Static Water Column Height: 32.55 ftTotal Well Penetration Depth: 32.55 ft Screen Length: 5. ftCasing Radius: 0.083 ft Well Radius: 0.083 ft
SOLUTIONAquifer Model: Unconfined Solution Method: Springer-GelharK = 346.8 ft/day Le = 28.38 ft

0.01 0.1 1.-1.
-0.6
-0.2
0.2
0.6
1.
Time (min)
Norm
alize
d Hea
d (ft/f
t)
SLUG OUT 02Data Set: X:\...\P4out02.aqtDate: 06/02/12 Time: 17:53:55
PROJECT INFORMATIONCompany: American Engineering TestingClient: Donohue & AssociatesProject: 31-00455Location: Eau Claire, WITest Well: P-4Test Date: 5/17/2012
AQUIFER DATASaturated Thickness: 85.4 ft Anisotropy Ratio (Kz/Kr): 1.
WELL DATA (P-4)Initial Displacement: -0.311 ft Static Water Column Height: 32.55 ftTotal Well Penetration Depth: 32.55 ft Screen Length: 5. ftCasing Radius: 0.083 ft Well Radius: 0.083 ft
SOLUTIONAquifer Model: Unconfined Solution Method: Springer-GelharK = 321.8 ft/day Le = 29.01 ft

0.01 0.1 1.-1.
-0.6
-0.2
0.2
0.6
1.
Time (min)
Norm
alize
d Hea
d (ft/f
t)
SLUG OUT 03Data Set: X:\...\P4out03.aqtDate: 06/02/12 Time: 17:55:23
PROJECT INFORMATIONCompany: American Engineering TestingClient: Donohue & AssociatesProject: 31-00455Location: Eau Claire, WITest Well: P-4Test Date: 5/17/2012
AQUIFER DATASaturated Thickness: 85.4 ft Anisotropy Ratio (Kz/Kr): 1.
WELL DATA (P-4)Initial Displacement: -0.692 ft Static Water Column Height: 32.55 ftTotal Well Penetration Depth: 32.55 ft Screen Length: 5. ftCasing Radius: 0.083 ft Well Radius: 0.083 ft
SOLUTIONAquifer Model: Unconfined Solution Method: Springer-GelharK = 318.8 ft/day Le = 30.3 ft

0. 0.12 0.24 0.36 0.48 0.6-1.
-0.6
-0.2
0.2
0.6
1.
Time (min)
Norm
alize
d Hea
d (ft/f
t)
SLUG IN 01Data Set: X:\...\P5in01.aqtDate: 06/02/12 Time: 18:01:58
PROJECT INFORMATIONCompany: American Engineering TestingClient: Donohue & AssociatesProject: 31-00455Location: Eau Claire, WITest Well: P-5Test Date: 5/18/2012
AQUIFER DATASaturated Thickness: 85.5 ft Anisotropy Ratio (Kz/Kr): 1.
WELL DATA (P-5)Initial Displacement: 0.077 ft Static Water Column Height: 20.28 ftTotal Well Penetration Depth: 20.28 ft Screen Length: 5. ftCasing Radius: 0.083 ft Well Radius: 0.083 ft
SOLUTIONAquifer Model: Unconfined Solution Method: Springer-GelharK = 198.5 ft/day Le = 13.73 ft

0. 0.06 0.12 0.18 0.24 0.3-1.
-0.6
-0.2
0.2
0.6
1.
Time (min)
Norm
alize
d Hea
d (ft/f
t)
SLUG IN 02Data Set: X:\...\P5in02.aqtDate: 06/02/12 Time: 18:04:15
PROJECT INFORMATIONCompany: American Engineering TestingClient: Donohue & AssociatesProject: 31-00455Location: Eau Claire, WITest Well: P-5Test Date: 5/18/2012
AQUIFER DATASaturated Thickness: 85.5 ft Anisotropy Ratio (Kz/Kr): 1.
WELL DATA (P-5)Initial Displacement: 0.086 ft Static Water Column Height: 20.28 ftTotal Well Penetration Depth: 20.28 ft Screen Length: 5. ftCasing Radius: 0.083 ft Well Radius: 0.083 ft
SOLUTIONAquifer Model: Unconfined Solution Method: Springer-GelharK = 227.6 ft/day Le = 11.6 ft

0. 0.06 0.12 0.18 0.24 0.3-1.
-0.6
-0.2
0.2
0.6
1.
Time (min)
Norm
alize
d Hea
d (ft/f
t)
SLUG IN 03Data Set: X:\...\P5in03.aqtDate: 06/02/12 Time: 18:05:35
PROJECT INFORMATIONCompany: American Engineering TestingClient: Donohue & AssociatesProject: 31-00455Location: Eau Claire, WITest Well: P-5Test Date: 5/18/2012
AQUIFER DATASaturated Thickness: 85.5 ft Anisotropy Ratio (Kz/Kr): 1.
WELL DATA (P-5)Initial Displacement: 0.083 ft Static Water Column Height: 20.28 ftTotal Well Penetration Depth: 20.28 ft Screen Length: 5. ftCasing Radius: 0.083 ft Well Radius: 0.083 ft
SOLUTIONAquifer Model: Unconfined Solution Method: Springer-GelharK = 195.2 ft/day Le = 18.78 ft

0. 0.06 0.12 0.18 0.24 0.3-1.
-0.6
-0.2
0.2
0.6
1.
Time (min)
Norm
alize
d Hea
d (ft/f
t)
SLUG OUT 01Data Set: X:\...\P5out01.aqtDate: 06/02/12 Time: 18:08:06
PROJECT INFORMATIONCompany: American Engineering TestingClient: Donohue & AssociatesProject: 31-00455Location: Eau Claire, WITest Well: P-5Test Date: 5/18/2012
AQUIFER DATASaturated Thickness: 85.5 ft Anisotropy Ratio (Kz/Kr): 1.
WELL DATA (P-5)Initial Displacement: -0.42 ft Static Water Column Height: 20.28 ftTotal Well Penetration Depth: 20.28 ft Screen Length: 5. ftCasing Radius: 0.083 ft Well Radius: 0.083 ft
SOLUTIONAquifer Model: Unconfined Solution Method: Springer-GelharK = 430.8 ft/day Le = 15.79 ft

0. 0.08 0.16 0.24 0.32 0.4-1.
-0.6
-0.2
0.2
0.6
1.
Time (min)
Norm
alize
d Hea
d (ft/f
t)
SLUG OUT 02Data Set: X:\...\P5out02.aqtDate: 06/02/12 Time: 18:09:44
PROJECT INFORMATIONCompany: American Engineering TestingClient: Donohue & AssociatesProject: 31-00455Location: Eau Claire, WITest Well: P-5Test Date: 5/18/2012
AQUIFER DATASaturated Thickness: 85.5 ft Anisotropy Ratio (Kz/Kr): 1.
WELL DATA (P-5)Initial Displacement: -0.232 ft Static Water Column Height: 20.28 ftTotal Well Penetration Depth: 20.28 ft Screen Length: 5. ftCasing Radius: 0.083 ft Well Radius: 0.083 ft
SOLUTIONAquifer Model: Unconfined Solution Method: Springer-GelharK = 382.9 ft/day Le = 16.51 ft

0. 0.08 0.16 0.24 0.32 0.4-1.
-0.6
-0.2
0.2
0.6
1.
Time (min)
Norm
alize
d Hea
d (ft/f
t)
SLUG OUT 03Data Set: X:\...\P5out03.aqtDate: 06/02/12 Time: 18:10:55
PROJECT INFORMATIONCompany: American Engineering TestingClient: Donohue & AssociatesProject: 31-00455Location: Eau Claire, WITest Well: P-5Test Date: 5/18/2012
AQUIFER DATASaturated Thickness: 85.5 ft Anisotropy Ratio (Kz/Kr): 1.
WELL DATA (P-5)Initial Displacement: -0.447 ft Static Water Column Height: 20.28 ftTotal Well Penetration Depth: 20.28 ft Screen Length: 5. ftCasing Radius: 0.083 ft Well Radius: 0.083 ft
SOLUTIONAquifer Model: Unconfined Solution Method: Springer-GelharK = 411.1 ft/day Le = 16.46 ft

0. 0.08 0.16 0.24 0.32 0.4-1.
-0.6
-0.2
0.2
0.6
1.
Time (min)
Norm
alize
d Hea
d (ft/f
t)
SLUG IN 01Data Set: X:\...\P6in01.aqtDate: 06/02/12 Time: 18:16:25
PROJECT INFORMATIONCompany: American Engineering TestingClient: Donohue & AssociatesProject: 31-00455Location: Eau Claire, WITest Well: P-6Test Date: 5/18/2012
AQUIFER DATASaturated Thickness: 85.6 ft Anisotropy Ratio (Kz/Kr): 1.
WELL DATA (P-6)Initial Displacement: -0.073 ft Static Water Column Height: 20.29 ftTotal Well Penetration Depth: 20.29 ft Screen Length: 5. ftCasing Radius: 0.083 ft Well Radius: 0.083 ft
SOLUTIONAquifer Model: Unconfined Solution Method: Springer-GelharK = 445. ft/day Le = 18.87 ft

0. 0.08 0.16 0.24 0.32 0.4-1.
-0.6
-0.2
0.2
0.6
1.
Time (min)
Norm
alize
d Hea
d (ft/f
t)
SLUG IN 02Data Set: X:\...\P6in02.aqtDate: 06/02/12 Time: 18:17:54
PROJECT INFORMATIONCompany: American Engineering TestingClient: Donohue & AssociatesProject: 31-00455Location: Eau Claire, WITest Well: P-6Test Date: 5/18/2012
AQUIFER DATASaturated Thickness: 85.6 ft Anisotropy Ratio (Kz/Kr): 1.
WELL DATA (P-6)Initial Displacement: -0.069 ft Static Water Column Height: 20.29 ftTotal Well Penetration Depth: 20.29 ft Screen Length: 5. ftCasing Radius: 0.083 ft Well Radius: 0.083 ft
SOLUTIONAquifer Model: Unconfined Solution Method: Springer-GelharK = 548.5 ft/day Le = 20.34 ft

0. 0.08 0.16 0.24 0.32 0.4-1.
-0.6
-0.2
0.2
0.6
1.
Time (min)
Norm
alize
d Hea
d (ft/f
t)
SLUG IN 03Data Set: X:\...\P6in03.aqtDate: 06/02/12 Time: 18:19:13
PROJECT INFORMATIONCompany: American Engineering TestingClient: Donohue & AssociatesProject: 31-00455Location: Eau Claire, WITest Well: P-6Test Date: 5/18/2012
AQUIFER DATASaturated Thickness: 85.6 ft Anisotropy Ratio (Kz/Kr): 1.
WELL DATA (P-6)Initial Displacement: -0.063 ft Static Water Column Height: 20.29 ftTotal Well Penetration Depth: 20.29 ft Screen Length: 5. ftCasing Radius: 0.083 ft Well Radius: 0.083 ft
SOLUTIONAquifer Model: Unconfined Solution Method: Springer-GelharK = 518.2 ft/day Le = 17.63 ft

0. 0.08 0.16 0.24 0.32 0.4-1.
-0.6
-0.2
0.2
0.6
1.
Time (min)
Norm
alize
d Hea
d (ft/f
t)
SLUG OUT 01Data Set: X:\...\P6out01.aqtDate: 06/02/12 Time: 19:24:57
PROJECT INFORMATIONCompany: American Engineering TestingClient: Donohue & AssociatesProject: 31-00455Location: Eau Claire, WITest Well: P-6Test Date: 5/18/2012
AQUIFER DATASaturated Thickness: 85.6 ft Anisotropy Ratio (Kz/Kr): 1.
WELL DATA (P-6)Initial Displacement: -0.275 ft Static Water Column Height: 20.29 ftTotal Well Penetration Depth: 20.29 ft Screen Length: 5. ftCasing Radius: 0.083 ft Well Radius: 0.083 ft
SOLUTIONAquifer Model: Unconfined Solution Method: Springer-GelharK = 249. ft/day Le = 14.98 ft

0. 0.08 0.16 0.24 0.32 0.4-1.
-0.6
-0.2
0.2
0.6
1.
Time (min)
Norm
alize
d Hea
d (ft/f
t)
SLUG OUT 02Data Set: X:\...\P6out02.aqtDate: 06/02/12 Time: 19:25:09
PROJECT INFORMATIONCompany: American Engineering TestingClient: Donohue & AssociatesProject: 31-00455Location: Eau Claire, WITest Well: P-6Test Date: 5/18/2012
AQUIFER DATASaturated Thickness: 85.6 ft Anisotropy Ratio (Kz/Kr): 1.
WELL DATA (P-6)Initial Displacement: -0.139 ft Static Water Column Height: 20.29 ftTotal Well Penetration Depth: 20.29 ft Screen Length: 5. ftCasing Radius: 0.083 ft Well Radius: 0.083 ft
SOLUTIONAquifer Model: Unconfined Solution Method: Springer-GelharK = 195.5 ft/day Le = 16.33 ft

0. 0.08 0.16 0.24 0.32 0.4-1.
-0.6
-0.2
0.2
0.6
1.
Time (min)
Norm
alize
d Hea
d (ft/f
t)
SLUG OUT 03Data Set: X:\...\P6out03.aqtDate: 06/02/12 Time: 19:25:30
PROJECT INFORMATIONCompany: American Engineering TestingClient: Donohue & AssociatesProject: 31-00455Location: Eau Claire, WITest Well: P-6Test Date: 5/18/2012
AQUIFER DATASaturated Thickness: 85.6 ft Anisotropy Ratio (Kz/Kr): 1.
WELL DATA (P-6)Initial Displacement: -0.269 ft Static Water Column Height: 20.29 ftTotal Well Penetration Depth: 20.29 ft Screen Length: 5. ftCasing Radius: 0.083 ft Well Radius: 0.083 ft
SOLUTIONAquifer Model: Unconfined Solution Method: Springer-GelharK = 259.3 ft/day Le = 14.01 ft

0. 0.12 0.24 0.36 0.48 0.6-1.
-0.6
-0.2
0.2
0.6
1.
Time (min)
Norm
alize
d Hea
d (ft/f
t)
SLUG IN 01Data Set: X:\...\P7in01.aqtDate: 06/02/12 Time: 18:28:12
PROJECT INFORMATIONCompany: American Engineering TestingClient: Donohue & AssociatesProject: 31-00455Location: Eau Claire, WITest Well: P-7Test Date: 5/18/2012
AQUIFER DATASaturated Thickness: 85.6 ft Anisotropy Ratio (Kz/Kr): 1.
WELL DATA (P-7)Initial Displacement: -0.125 ft Static Water Column Height: 21.06 ftTotal Well Penetration Depth: 21.06 ft Screen Length: 5. ftCasing Radius: 0.083 ft Well Radius: 0.083 ft
SOLUTIONAquifer Model: Unconfined Solution Method: Springer-GelharK = 356.8 ft/day Le = 21.27 ft

0. 0.12 0.24 0.36 0.48 0.6-1.
-0.6
-0.2
0.2
0.6
1.
Time (min)
Norm
alize
d Hea
d (ft/f
t)
SLUG IN 02Data Set: X:\...\P7in02.aqtDate: 06/02/12 Time: 18:29:43
PROJECT INFORMATIONCompany: American Engineering TestingClient: Donohue & AssociatesProject: 31-00455Location: Eau Claire, WITest Well: P-7Test Date: 5/18/2012
AQUIFER DATASaturated Thickness: 85.6 ft Anisotropy Ratio (Kz/Kr): 1.
WELL DATA (P-7)Initial Displacement: -0.078 ft Static Water Column Height: 21.06 ftTotal Well Penetration Depth: 21.06 ft Screen Length: 5. ftCasing Radius: 0.083 ft Well Radius: 0.083 ft
SOLUTIONAquifer Model: Unconfined Solution Method: Springer-GelharK = 511.2 ft/day Le = 21.07 ft

0. 0.12 0.24 0.36 0.48 0.6-1.
-0.6
-0.2
0.2
0.6
1.
Time (min)
Norm
alize
d Hea
d (ft/f
t)
SLUG IN 03Data Set: X:\...\P7in03.aqtDate: 06/02/12 Time: 18:31:25
PROJECT INFORMATIONCompany: American Engineering TestingClient: Donohue & AssociatesProject: 31-00455Location: Eau Claire, WITest Well: P-7Test Date: 5/18/2012
AQUIFER DATASaturated Thickness: 85.6 ft Anisotropy Ratio (Kz/Kr): 1.
WELL DATA (P-7)Initial Displacement: -0.125 ft Static Water Column Height: 21.06 ftTotal Well Penetration Depth: 21.06 ft Screen Length: 5. ftCasing Radius: 0.083 ft Well Radius: 0.083 ft
SOLUTIONAquifer Model: Unconfined Solution Method: Springer-GelharK = 408.7 ft/day Le = 16.53 ft

0. 0.08 0.16 0.24 0.32 0.4-1.
-0.6
-0.2
0.2
0.6
1.
Time (min)
Norm
alize
d Hea
d (ft/f
t)
SLUG OUT 01Data Set: X:\...\P7out01.aqtDate: 06/02/12 Time: 18:33:14
PROJECT INFORMATIONCompany: American Engineering TestingClient: Donohue & AssociatesProject: 31-00455Location: Eau Claire, WITest Well: P-7Test Date: 5/18/2012
AQUIFER DATASaturated Thickness: 85.6 ft Anisotropy Ratio (Kz/Kr): 1.
WELL DATA (P-7)Initial Displacement: -0.265 ft Static Water Column Height: 21.06 ftTotal Well Penetration Depth: 21.06 ft Screen Length: 5. ftCasing Radius: 0.083 ft Well Radius: 0.083 ft
SOLUTIONAquifer Model: Unconfined Solution Method: Springer-GelharK = 298.4 ft/day Le = 14.14 ft

0. 0.08 0.16 0.24 0.32 0.4-1.
-0.6
-0.2
0.2
0.6
1.
Time (min)
Norm
alize
d Hea
d (ft/f
t)
SLUG OUT 02Data Set: X:\...\P7out02.aqtDate: 06/02/12 Time: 18:34:22
PROJECT INFORMATIONCompany: American Engineering TestingClient: Donohue & AssociatesProject: 31-00455Location: Eau Claire, WITest Well: P-7Test Date: 5/18/2012
AQUIFER DATASaturated Thickness: 85.6 ft Anisotropy Ratio (Kz/Kr): 1.
WELL DATA (P-7)Initial Displacement: -0.149 ft Static Water Column Height: 21.06 ftTotal Well Penetration Depth: 21.06 ft Screen Length: 5. ftCasing Radius: 0.083 ft Well Radius: 0.083 ft
SOLUTIONAquifer Model: Unconfined Solution Method: Springer-GelharK = 253.8 ft/day Le = 12.69 ft

0. 0.08 0.16 0.24 0.32 0.4-1.
-0.6
-0.2
0.2
0.6
1.
Time (min)
Norm
alize
d Hea
d (ft/f
t)
SLUG OUT 03Data Set: X:\...\P7out03.aqtDate: 06/02/12 Time: 18:35:28
PROJECT INFORMATIONCompany: American Engineering TestingClient: Donohue & AssociatesProject: 31-00455Location: Eau Claire, WITest Well: P-7Test Date: 5/18/2012
AQUIFER DATASaturated Thickness: 85.6 ft Anisotropy Ratio (Kz/Kr): 1.
WELL DATA (P-7)Initial Displacement: -0.281 ft Static Water Column Height: 21.06 ftTotal Well Penetration Depth: 21.06 ft Screen Length: 5. ftCasing Radius: 0.083 ft Well Radius: 0.083 ft
SOLUTIONAquifer Model: Unconfined Solution Method: Springer-GelharK = 234. ft/day Le = 19.58 ft

0. 0.06 0.12 0.18 0.24 0.30.001
0.01
0.1
1.
Time (min)
Norm
alize
d Hea
d (ft/f
t)
SLUG IN 01Data Set: X:\...\P17in01.aqtDate: 06/02/12 Time: 19:03:57
PROJECT INFORMATIONCompany: American Engineering TestingClient: Donohue & AssociatesProject: 31-00455Location: Eau Claire, WITest Well: P-17Test Date: 5/17/2012
AQUIFER DATASaturated Thickness: 85.4 ft Anisotropy Ratio (Kz/Kr): 1.
WELL DATA (P-17)Initial Displacement: 2.471 ft Static Water Column Height: 18.89 ftTotal Well Penetration Depth: 18.89 ft Screen Length: 5. ftCasing Radius: 0.083 ft Well Radius: 0.083 ft
SOLUTIONAquifer Model: Unconfined Solution Method: Bouwer-RiceK = 81.99 ft/day y0 = 1.896 ft

0. 0.06 0.12 0.18 0.24 0.30.01
0.1
1.
Time (min)
Norm
alize
d Hea
d (ft/f
t)
SLUG IN 02Data Set: X:\...\P17in02.aqtDate: 06/02/12 Time: 19:12:16
PROJECT INFORMATIONCompany: American Engineering TestingClient: Donohue & AssociatesProject: 31-00455Location: Eau Claire, WITest Well: P-17Test Date: 5/17/2012
AQUIFER DATASaturated Thickness: 85.4 ft Anisotropy Ratio (Kz/Kr): 1.
WELL DATA (P-17)Initial Displacement: 0.742 ft Static Water Column Height: 18.89 ftTotal Well Penetration Depth: 18.89 ft Screen Length: 5. ftCasing Radius: 0.083 ft Well Radius: 0.083 ft
SOLUTIONAquifer Model: Unconfined Solution Method: Bouwer-RiceK = 95. ft/day y0 = 0.5325 ft

0. 0.06 0.12 0.18 0.24 0.30.01
0.1
1.
Time (min)
Norm
alize
d Hea
d (ft/f
t)
SLUG IN 03Data Set: X:\...\P17in03.aqtDate: 06/02/12 Time: 19:14:52
PROJECT INFORMATIONCompany: American Engineering TestingClient: Donohue & AssociatesProject: 31-00455Location: Eau Claire, WITest Well: P-17Test Date: 5/17/2012
AQUIFER DATASaturated Thickness: 85.4 ft Anisotropy Ratio (Kz/Kr): 1.
WELL DATA (P-17)Initial Displacement: 0.881 ft Static Water Column Height: 18.89 ftTotal Well Penetration Depth: 18.89 ft Screen Length: 5. ftCasing Radius: 0.083 ft Well Radius: 0.083 ft
SOLUTIONAquifer Model: Unconfined Solution Method: Bouwer-RiceK = 65.58 ft/day y0 = 0.6687 ft

0. 0.04 0.08 0.12 0.16 0.20.001
0.01
0.1
1.
Time (min)
Norm
alize
d Hea
d (ft/f
t)
SLUG OUT 01Data Set: X:\...\P17out01.aqtDate: 06/02/12 Time: 19:17:33
PROJECT INFORMATIONCompany: American Engineering TestingClient: Donohue & AssociatesProject: 31-00455Location: Eau Claire, WITest Well: P-17Test Date: 5/17/2012
AQUIFER DATASaturated Thickness: 85.4 ft Anisotropy Ratio (Kz/Kr): 1.
WELL DATA (P-17)Initial Displacement: 1.538 ft Static Water Column Height: 18.89 ftTotal Well Penetration Depth: 18.89 ft Screen Length: 5. ftCasing Radius: 0.083 ft Well Radius: 0.083 ft
SOLUTIONAquifer Model: Unconfined Solution Method: Bouwer-RiceK = 101.9 ft/day y0 = 1.226 ft

0. 0.04 0.08 0.12 0.16 0.20.001
0.01
0.1
1.
Time (min)
Norm
alize
d Hea
d (ft/f
t)
SLUG OUT 02Data Set: X:\...\P17out02.aqtDate: 06/02/12 Time: 19:18:49
PROJECT INFORMATIONCompany: American Engineering TestingClient: Donohue & AssociatesProject: 31-00455Location: Eau Claire, WITest Well: P-17Test Date: 5/17/2012
AQUIFER DATASaturated Thickness: 85.4 ft Anisotropy Ratio (Kz/Kr): 1.
WELL DATA (P-17)Initial Displacement: 0.756 ft Static Water Column Height: 18.89 ftTotal Well Penetration Depth: 18.89 ft Screen Length: 5. ftCasing Radius: 0.083 ft Well Radius: 0.083 ft
SOLUTIONAquifer Model: Unconfined Solution Method: Bouwer-RiceK = 107.4 ft/day y0 = 0.8733 ft

0. 0.04 0.08 0.12 0.16 0.20.001
0.01
0.1
1.
Time (min)
Norm
alize
d Hea
d (ft/f
t)
SLUG OUT 03Data Set: X:\...\P17out03.aqtDate: 06/02/12 Time: 19:21:17
PROJECT INFORMATIONCompany: American Engineering TestingClient: Donohue & AssociatesProject: 31-00455Location: Eau Claire, WITest Well: P-17Test Date: 5/17/2012
AQUIFER DATASaturated Thickness: 85.4 ft Anisotropy Ratio (Kz/Kr): 1.
WELL DATA (P-17)Initial Displacement: 1.173 ft Static Water Column Height: 18.89 ftTotal Well Penetration Depth: 18.89 ft Screen Length: 5. ftCasing Radius: 0.083 ft Well Radius: 0.083 ft
SOLUTIONAquifer Model: Unconfined Solution Method: Bouwer-RiceK = 113.9 ft/day y0 = 1.395 ft

0.01 0.1 1.-1.
-0.6
-0.2
0.2
0.6
1.
Time (min)
Norm
alize
d Hea
d (ft/f
t)
SLUG IN 01Data Set: X:\...\P19in01.aqtDate: 06/02/12 Time: 18:46:27
PROJECT INFORMATIONCompany: American Engineering TestingClient: Donohue & AssociatesProject: 31-00455Location: Eau Claire, WITest Well: P-19Test Date: 5/17/2012
AQUIFER DATASaturated Thickness: 85.3 ft Anisotropy Ratio (Kz/Kr): 1.
WELL DATA (P-19)Initial Displacement: -0.429 ft Static Water Column Height: 36.21 ftTotal Well Penetration Depth: 36.21 ft Screen Length: 5. ftCasing Radius: 0.083 ft Well Radius: 0.083 ft
SOLUTIONAquifer Model: Unconfined Solution Method: Springer-GelharK = 286.4 ft/day Le = 27.55 ft

0.01 0.1 1.-1.
-0.6
-0.2
0.2
0.6
1.
Time (min)
Norm
alize
d Hea
d (ft/f
t)
SLUG IN 02Data Set: X:\...\P19in02.aqtDate: 06/02/12 Time: 18:46:59
PROJECT INFORMATIONCompany: American Engineering TestingClient: Donohue & AssociatesProject: 31-00455Location: Eau Claire, WITest Well: P-19Test Date: 5/17/2012
AQUIFER DATASaturated Thickness: 85.3 ft Anisotropy Ratio (Kz/Kr): 1.
WELL DATA (P-19)Initial Displacement: -0.201 ft Static Water Column Height: 36.21 ftTotal Well Penetration Depth: 36.21 ft Screen Length: 5. ftCasing Radius: 0.083 ft Well Radius: 0.083 ft
SOLUTIONAquifer Model: Unconfined Solution Method: Springer-GelharK = 312.7 ft/day Le = 32.54 ft

0.01 0.1 1.-1.
-0.6
-0.2
0.2
0.6
1.
Time (min)
Norm
alize
d Hea
d (ft/f
t)
SLUG IN 03Data Set: X:\...\P19in03.aqtDate: 06/02/12 Time: 18:42:12
PROJECT INFORMATIONCompany: American Engineering TestingClient: Donohue & AssociatesProject: 31-00455Location: Eau Claire, WITest Well: P-19Test Date: 5/17/2012
AQUIFER DATASaturated Thickness: 85.3 ft Anisotropy Ratio (Kz/Kr): 1.
WELL DATA (P-19)Initial Displacement: -0.467 ft Static Water Column Height: 36.21 ftTotal Well Penetration Depth: 36.21 ft Screen Length: 5. ftCasing Radius: 0.083 ft Well Radius: 0.083 ft
SOLUTIONAquifer Model: Unconfined Solution Method: Springer-GelharK = 317.9 ft/day Le = 22.47 ft

0.01 0.1 1.-1.
-0.6
-0.2
0.2
0.6
1.
Time (min)
Norm
alize
d Hea
d (ft/f
t)
SLUG OUT 01Data Set: X:\...\P19out01.aqtDate: 06/02/12 Time: 18:43:21
PROJECT INFORMATIONCompany: American Engineering TestingClient: Donohue & AssociatesProject: 31-00455Location: Eau Claire, WITest Well: P-19Test Date: 5/17/2012
AQUIFER DATASaturated Thickness: 85.3 ft Anisotropy Ratio (Kz/Kr): 1.
WELL DATA (P-19)Initial Displacement: -0.524 ft Static Water Column Height: 36.21 ftTotal Well Penetration Depth: 36.21 ft Screen Length: 5. ftCasing Radius: 0.083 ft Well Radius: 0.083 ft
SOLUTIONAquifer Model: Unconfined Solution Method: Springer-GelharK = 275.9 ft/day Le = 30.06 ft

0.01 0.1 1.-1.
-0.6
-0.2
0.2
0.6
1.
Time (min)
Norm
alize
d Hea
d (ft/f
t)
SLUG OUT 02Data Set: X:\...\P19out02.aqtDate: 06/02/12 Time: 18:44:32
PROJECT INFORMATIONCompany: American Engineering TestingClient: Donohue & AssociatesProject: 31-00455Location: Eau Claire, WITest Well: P-19Test Date: 5/17/2012
AQUIFER DATASaturated Thickness: 85.3 ft Anisotropy Ratio (Kz/Kr): 1.
WELL DATA (P-19)Initial Displacement: -0.273 ft Static Water Column Height: 36.21 ftTotal Well Penetration Depth: 36.21 ft Screen Length: 5. ftCasing Radius: 0.083 ft Well Radius: 0.083 ft
SOLUTIONAquifer Model: Unconfined Solution Method: Springer-GelharK = 225.4 ft/day Le = 29.26 ft

0.01 0.1 1.-1.
-0.6
-0.2
0.2
0.6
1.
Time (min)
Norm
alize
d Hea
d (ft/f
t)
SLUG OUT 02Data Set: X:\...\P19out03.aqtDate: 06/02/12 Time: 18:45:53
PROJECT INFORMATIONCompany: American Engineering TestingClient: Donohue & AssociatesProject: 31-00455Location: Eau Claire, WITest Well: P-19Test Date: 5/17/2012
AQUIFER DATASaturated Thickness: 85.3 ft Anisotropy Ratio (Kz/Kr): 1.
WELL DATA (P-19)Initial Displacement: -0.501 ft Static Water Column Height: 36.21 ftTotal Well Penetration Depth: 36.21 ft Screen Length: 5. ftCasing Radius: 0.083 ft Well Radius: 0.083 ft
SOLUTIONAquifer Model: Unconfined Solution Method: Springer-GelharK = 226.8 ft/day Le = 36.55 ft

0.01 0.1 1.-1.
-0.6
-0.2
0.2
0.6
1.
Time (min)
Norm
alize
d Hea
d (ft/f
t)
SLUG IN 01Data Set: X:\...\P20in01.aqtDate: 06/02/12 Time: 18:51:31
PROJECT INFORMATIONCompany: American Engineering TestingClient: Donohue & AssociatesProject: 31-00455Location: Eau Claire, WITest Well: P-20Test Date: 5/18/2012
AQUIFER DATASaturated Thickness: 84.9 ft Anisotropy Ratio (Kz/Kr): 1.
WELL DATA (P-20)Initial Displacement: -0.438 ft Static Water Column Height: 34.44 ftTotal Well Penetration Depth: 34.44 ft Screen Length: 5. ftCasing Radius: 0.083 ft Well Radius: 0.083 ft
SOLUTIONAquifer Model: Unconfined Solution Method: Springer-GelharK = 314.9 ft/day Le = 36.95 ft

0.01 0.1 1.-1.
-0.6
-0.2
0.2
0.6
1.
Time (min)
Norm
alize
d Hea
d (ft/f
t)
SLUG IN 02Data Set: X:\...\P20in02.aqtDate: 06/02/12 Time: 18:52:48
PROJECT INFORMATIONCompany: American Engineering TestingClient: Donohue & AssociatesProject: 31-00455Location: Eau Claire, WITest Well: P-20Test Date: 5/18/2012
AQUIFER DATASaturated Thickness: 84.9 ft Anisotropy Ratio (Kz/Kr): 1.
WELL DATA (P-20)Initial Displacement: -0.252 ft Static Water Column Height: 34.44 ftTotal Well Penetration Depth: 34.44 ft Screen Length: 5. ftCasing Radius: 0.083 ft Well Radius: 0.083 ft
SOLUTIONAquifer Model: Unconfined Solution Method: Springer-GelharK = 382.5 ft/day Le = 34.67 ft

0.01 0.1 1.-1.
-0.6
-0.2
0.2
0.6
1.
Time (min)
Norm
alize
d Hea
d (ft/f
t)
SLUG IN 03Data Set: X:\...\P20in03.aqtDate: 06/02/12 Time: 18:54:07
PROJECT INFORMATIONCompany: American Engineering TestingClient: Donohue & AssociatesProject: 31-00455Location: Eau Claire, WITest Well: P-20Test Date: 5/18/2012
AQUIFER DATASaturated Thickness: 84.9 ft Anisotropy Ratio (Kz/Kr): 1.
WELL DATA (P-20)Initial Displacement: -0.252 ft Static Water Column Height: 34.44 ftTotal Well Penetration Depth: 34.44 ft Screen Length: 5. ftCasing Radius: 0.083 ft Well Radius: 0.083 ft
SOLUTIONAquifer Model: Unconfined Solution Method: Springer-GelharK = 499.8 ft/day Le = 43.49 ft

0.01 0.1 1.-1.
-0.6
-0.2
0.2
0.6
1.
Time (min)
Norm
alize
d Hea
d (ft/f
t)
SLUG OUT 01Data Set: X:\...\P20out01.aqtDate: 06/02/12 Time: 18:56:13
PROJECT INFORMATIONCompany: American Engineering TestingClient: Donohue & AssociatesProject: 31-00455Location: Eau Claire, WITest Well: P-20Test Date: 5/18/2012
AQUIFER DATASaturated Thickness: 84.9 ft Anisotropy Ratio (Kz/Kr): 1.
WELL DATA (P-20)Initial Displacement: -0.718 ft Static Water Column Height: 34.44 ftTotal Well Penetration Depth: 34.44 ft Screen Length: 5. ftCasing Radius: 0.083 ft Well Radius: 0.083 ft
SOLUTIONAquifer Model: Unconfined Solution Method: Springer-GelharK = 379.2 ft/day Le = 30.34 ft

0.01 0.1 1.-1.
-0.6
-0.2
0.2
0.6
1.
Time (min)
Norm
alize
d Hea
d (ft/f
t)
SLUG OUT 02Data Set: X:\...\P20out02.aqtDate: 06/02/12 Time: 18:57:30
PROJECT INFORMATIONCompany: American Engineering TestingClient: Donohue & AssociatesProject: 31-00455Location: Eau Claire, WITest Well: P-20Test Date: 5/18/2012
AQUIFER DATASaturated Thickness: 84.9 ft Anisotropy Ratio (Kz/Kr): 1.
WELL DATA (P-20)Initial Displacement: -0.344 ft Static Water Column Height: 34.44 ftTotal Well Penetration Depth: 34.44 ft Screen Length: 5. ftCasing Radius: 0.083 ft Well Radius: 0.083 ft
SOLUTIONAquifer Model: Unconfined Solution Method: Springer-GelharK = 306.5 ft/day Le = 35.37 ft

0.01 0.1 1.-1.
-0.6
-0.2
0.2
0.6
1.
Time (min)
Norm
alize
d Hea
d (ft/f
t)
SLUG OUT 03Data Set: X:\...\P20out03.aqtDate: 06/02/12 Time: 18:58:32
PROJECT INFORMATIONCompany: American Engineering TestingClient: Donohue & AssociatesProject: 31-00455Location: Eau Claire, WITest Well: P-20Test Date: 5/18/2012
AQUIFER DATASaturated Thickness: 84.9 ft Anisotropy Ratio (Kz/Kr): 1.
WELL DATA (P-20)Initial Displacement: -0.699 ft Static Water Column Height: 34.44 ftTotal Well Penetration Depth: 34.44 ft Screen Length: 5. ftCasing Radius: 0.083 ft Well Radius: 0.083 ft
SOLUTIONAquifer Model: Unconfined Solution Method: Springer-GelharK = 350.7 ft/day Le = 34.24 ft

Appendix F
Discharge Potentials for Rectilinear Flow Scenarios

American Engineering Testing, Inc. AET Project No.550 Cleveland Avenue North
St. Paul, Minnesota 55114
Phone: (651) 659-9001
Fax: (651) 659-1379
Discharge Potential for Rectilinear Flow1
Confined Flow2
Unconfined Flow2
Qx0 [ft2/d] = component of the discharge vector for flow in the x direction f [ft] = piezometric head above the aquifer base
Qy0 [ft2/d] = component of the discharge vector for flow in the y direction k [ft/d] = hydraulic conductivity of the homogeneous aquifer
x,y [ft] = cartesian coordinates in the horizontal plane H [ft] = thickness of the aquifer
F0 [ft3/d] = constant f > H = confined; f < H = unconfined
Well i fi xi yi
P-4 1 85.36 468035 164699
P-17 2 85.11 468462 164887P-20 3 84.83 468365 164599
Qa = ft3/d per ft of aquifer perpendicular to the direction of flow
= gallons per minute per ft of aquifer perpendicular to the direction of flow
a = radians
= degrees
References:
2Ibid., p. 49
1320490
56.76
0.2949
-0.86
-49.0
1Strack, O.D.L., Groundwater Mechanics , Prentice Hall, Englewood Cliffs, New Jersey, 1989, p. 225
Unconfined 1337041
37.25 -42.83755.11 Unconfined 1329221754.83 Unconfined
Flow Regime Fi Qx0 Qy0
367 670 770 100
755.36
Yields:
Aquifer
Hydraulic
Conductivity
(k)
Aquifer
Base
Elevation
(feet)
Aquifer
Top
Elevation
(feet)
Aquifer
Thickness
(H)
Ground-
water
Elevation
(feet)
31-00455Municipal Wastewater Treatment Plant
Eau Claire, Wisconsin
Given:
000 FF yQxQ yx2
2
1kHkH F f 2
2
1fkF
3,2,1000 FF iforyQxQ iyixi
12131312
1221331132233210
12131312
121313120
12131312
131212130 ,,
yyxxyyxx
yxyxyxyxyxyx
yyxxyyxx
xxxxQ
yyxxyyxx
yyyyQ yx
FFFF
FFFF
FFFF
)(tan 00
12
0
2
0 xyyx QQandQQQ aa

American Engineering Testing, Inc. AET Project No.550 Cleveland Avenue North
St. Paul, Minnesota 55114
Phone: (651) 659-9001
Fax: (651) 659-1379
Discharge Potential for Rectilinear Flow1
Confined Flow2
Unconfined Flow2
Qx0 [ft2/d] = component of the discharge vector for flow in the x direction f [ft] = piezometric head above the aquifer base
Qy0 [ft2/d] = component of the discharge vector for flow in the y direction k [ft/d] = hydraulic conductivity of the homogeneous aquifer
x,y [ft] = cartesian coordinates in the horizontal plane H [ft] = thickness of the aquifer
F0 [ft3/d] = constant f > H = confined; f < H = unconfined
Well i fi xi yi
P-4 1 103.36 468035 164699
P-17 2 103.11 468462 164887P-20 3 102.83 468365 164599
Qa = ft3/d per ft of aquifer perpendicular to the direction of flow
= gallons per minute per ft of aquifer perpendicular to the direction of flow
a = radians
= degrees
References:
2Ibid., p. 49
1938861
66.73
0.3466
-0.86
-49.0
1Strack, O.D.L., Groundwater Mechanics , Prentice Hall, Englewood Cliffs, New Jersey, 1989, p. 225
Confined 1958312
43.76 -50.38773.11 Confined 1949137772.83 Confined
Flow Regime Fi Qx0 Qy0
367 670 770 100
773.36
Yields:
Aquifer
Hydraulic
Conductivity
(k)
Aquifer
Base
Elevation
(feet)
Aquifer
Top
Elevation
(feet)
Aquifer
Thickness
(H)
Ground-
water
Elevation
(feet)
31-00455Municipal Wastewater Treatment Plant
Eau Claire, Wisconsin
Given:
000 FF yQxQ yx2
2
1kHkH F f 2
2
1fkF
3,2,1000 FF iforyQxQ iyixi
12131312
1221331132233210
12131312
121313120
12131312
131212130 ,,
yyxxyyxx
yxyxyxyxyxyx
yyxxyyxx
xxxxQ
yyxxyyxx
yyyyQ yx
FFFF
FFFF
FFFF
)(tan 00
12
0
2
0 xyyx QQandQQQ aa
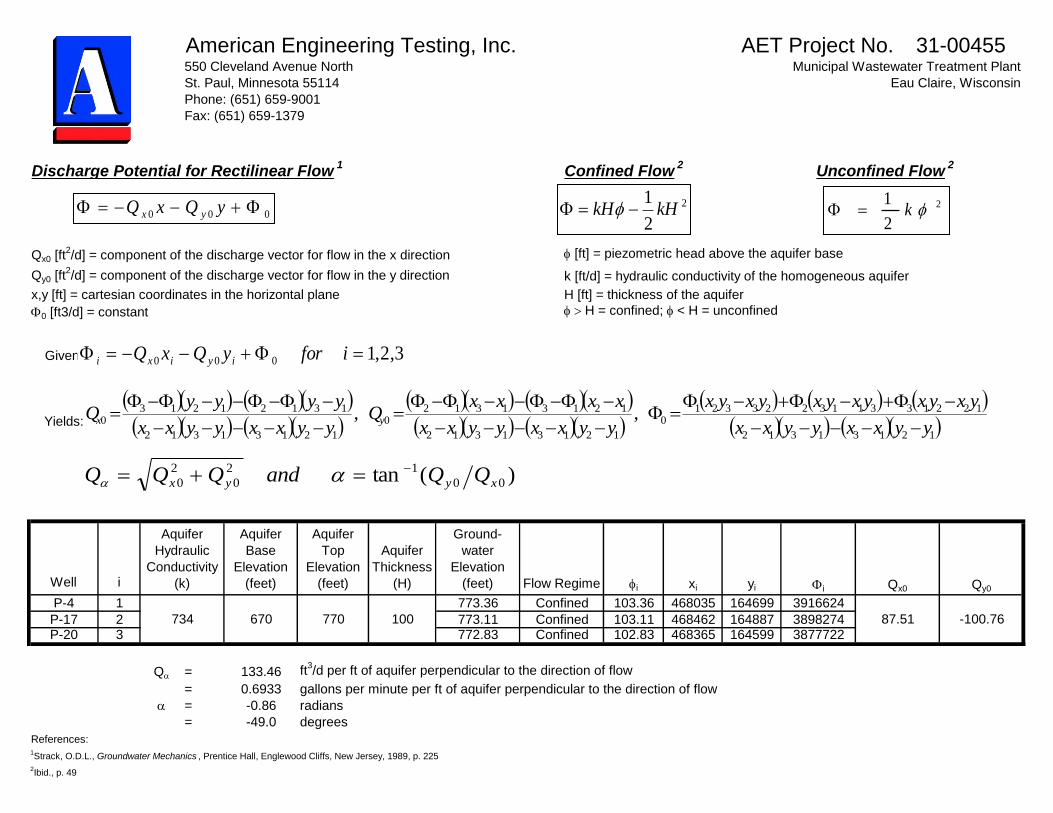
American Engineering Testing, Inc. AET Project No.550 Cleveland Avenue North
St. Paul, Minnesota 55114
Phone: (651) 659-9001
Fax: (651) 659-1379
Discharge Potential for Rectilinear Flow1
Confined Flow2
Unconfined Flow2
Qx0 [ft2/d] = component of the discharge vector for flow in the x direction f [ft] = piezometric head above the aquifer base
Qy0 [ft2/d] = component of the discharge vector for flow in the y direction k [ft/d] = hydraulic conductivity of the homogeneous aquifer
x,y [ft] = cartesian coordinates in the horizontal plane H [ft] = thickness of the aquifer
F0 [ft3/d] = constant f > H = confined; f < H = unconfined
Well i fi xi yi
P-4 1 103.36 468035 164699
P-17 2 103.11 468462 164887P-20 3 102.83 468365 164599
Qa = ft3/d per ft of aquifer perpendicular to the direction of flow
= gallons per minute per ft of aquifer perpendicular to the direction of flow
a = radians
= degrees
References:
31-00455Municipal Wastewater Treatment Plant
Eau Claire, Wisconsin
Given:
Yields:
Aquifer
Hydraulic
Conductivity
(k)
Aquifer
Base
Elevation
(feet)
Aquifer
Top
Elevation
(feet)
Aquifer
Thickness
(H)
Ground-
water
Elevation
(feet) Flow Regime Fi Qx0 Qy0
734 670 770 100
773.36 Confined 3916624
87.51 -100.76773.11 Confined 3898274772.83 Confined
2Ibid., p. 49
3877722
133.46
0.6933
-0.86
-49.0
1Strack, O.D.L., Groundwater Mechanics , Prentice Hall, Englewood Cliffs, New Jersey, 1989, p. 225
000 FF yQxQ yx2
2
1kHkH F f 2
2
1fkF
3,2,1000 FF iforyQxQ iyixi
12131312
1221331132233210
12131312
121313120
12131312
131212130 ,,
yyxxyyxx
yxyxyxyxyxyx
yyxxyyxx
xxxxQ
yyxxyyxx
yyyyQ yx
FFFF
FFFF
FFFF
)(tan 00
12
0
2
0 xyyx QQandQQQ aa

American Engineering Testing, Inc. AET Project No.550 Cleveland Avenue North
St. Paul, Minnesota 55114
Phone: (651) 659-9001
Fax: (651) 659-1379
Discharge Potential for Rectilinear Flow1
Confined Flow2
Unconfined Flow2
Qx0 [ft2/d] = component of the discharge vector for flow in the x direction f [ft] = piezometric head above the aquifer base
Qy0 [ft2/d] = component of the discharge vector for flow in the y direction k [ft/d] = hydraulic conductivity of the homogeneous aquifer
x,y [ft] = cartesian coordinates in the horizontal plane H [ft] = thickness of the aquifer
F0 [ft3/d] = constant f > H = confined; f < H = unconfined
Well i fi xi yi
P-4 1 103.36 468035 164699
P-17 2 103.11 468462 164887P-20 3 102.83 468365 164599
Qa = ft3/d per ft of aquifer perpendicular to the direction of flow
= gallons per minute per ft of aquifer perpendicular to the direction of flow
a = radians
= degrees
References:
31-00455Municipal Wastewater Treatment Plant
Eau Claire, Wisconsin
Given:
Yields:
Aquifer
Hydraulic
Conductivity
(k)
Aquifer
Base
Elevation
(feet)
Aquifer
Top
Elevation
(feet)
Aquifer
Thickness
(H)
Ground-
water
Elevation
(feet) Flow Regime Fi Qx0 Qy0
183.5 670 770 100
773.36 Confined 979156
21.88 -25.19773.11 Confined 974569772.83 Confined
2Ibid., p. 49
969431
33.36
0.1733
-0.86
-49.0
1Strack, O.D.L., Groundwater Mechanics , Prentice Hall, Englewood Cliffs, New Jersey, 1989, p. 225
000 FF yQxQ yx2
2
1kHkH F f 2
2
1fkF
3,2,1000 FF iforyQxQ iyixi
12131312
1221331132233210
12131312
121313120
12131312
131212130 ,,
yyxxyyxx
yxyxyxyxyxyx
yyxxyyxx
xxxxQ
yyxxyyxx
yyyyQ yx
FFFF
FFFF
FFFF
)(tan 00
12
0
2
0 xyyx QQandQQQ aa

American Engineering Testing, Inc. AET Project No.550 Cleveland Avenue North
St. Paul, Minnesota 55114
Phone: (651) 659-9001
Fax: (651) 659-1379
Discharge Potential for Rectilinear Flow1
Confined Flow2
Unconfined Flow2
Qx0 [ft2/d] = component of the discharge vector for flow in the x direction f [ft] = piezometric head above the aquifer base
Qy0 [ft2/d] = component of the discharge vector for flow in the y direction k [ft/d] = hydraulic conductivity of the homogeneous aquifer
x,y [ft] = cartesian coordinates in the horizontal plane H [ft] = thickness of the aquifer
F0 [ft3/d] = constant f > H = confined; f < H = unconfined
Well i fi xi yi
P-4 1 83.36 468035 164699
P-17 2 83.11 468462 164887P-20 3 82.83 468365 164599
Qa = ft3/d per ft of aquifer perpendicular to the direction of flow
= gallons per minute per ft of aquifer perpendicular to the direction of flow
a = radians
= degrees
References:
31-00455Municipal Wastewater Treatment Plant
Eau Claire, Wisconsin
Given:
Yields:
Aquifer
Hydraulic
Conductivity
(k)
Aquifer
Base
Elevation
(feet)
Aquifer
Top
Elevation
(feet)
Aquifer
Thickness
(H)
Ground-
water
Elevation
(feet) Flow Regime Fi Qx0 Qy0
367 690 770 80
773.36 Confined 1273050
35.00 -40.30773.11 Confined 1265710772.83 Confined
2Ibid., p. 49
1257489
53.38
0.2773
-0.86
-49.0
1Strack, O.D.L., Groundwater Mechanics , Prentice Hall, Englewood Cliffs, New Jersey, 1989, p. 225
000 FF yQxQ yx2
2
1kHkH F f 2
2
1fkF
3,2,1000 FF iforyQxQ iyixi
12131312
1221331132233210
12131312
121313120
12131312
131212130 ,,
yyxxyyxx
yxyxyxyxyxyx
yyxxyyxx
xxxxQ
yyxxyyxx
yyyyQ yx
FFFF
FFFF
FFFF
)(tan 00
12
0
2
0 xyyx QQandQQQ aa

American Engineering Testing, Inc. AET Project No.550 Cleveland Avenue North
St. Paul, Minnesota 55114
Phone: (651) 659-9001
Fax: (651) 659-1379
Discharge Potential for Rectilinear Flow1
Confined Flow2
Unconfined Flow2
Qx0 [ft2/d] = component of the discharge vector for flow in the x direction f [ft] = piezometric head above the aquifer base
Qy0 [ft2/d] = component of the discharge vector for flow in the y direction k [ft/d] = hydraulic conductivity of the homogeneous aquifer
x,y [ft] = cartesian coordinates in the horizontal plane H [ft] = thickness of the aquifer
F0 [ft3/d] = constant f > H = confined; f < H = unconfined
Well i fi xi yi
P-4 1 93.36 468035 164699
P-17 2 93.11 468462 164887P-20 3 92.83 468365 164599
Qa = ft3/d per ft of aquifer perpendicular to the direction of flow
= gallons per minute per ft of aquifer perpendicular to the direction of flow
a = radians
= degrees
References:
31-00455Municipal Wastewater Treatment Plant
Eau Claire, Wisconsin
Given:
Yields:
Aquifer
Hydraulic
Conductivity
(k)
Aquifer
Base
Elevation
(feet)
Aquifer
Top
Elevation
(feet)
Aquifer
Thickness
(H)
Ground-
water
Elevation
(feet) Flow Regime Fi Qx0 Qy0
367 680 770 90
773.36 Confined 1597331
39.38 -45.34773.11 Confined 1589073772.83 Confined
2Ibid., p. 49
1579825
60.06
0.3120
-0.86
-49.0
1Strack, O.D.L., Groundwater Mechanics , Prentice Hall, Englewood Cliffs, New Jersey, 1989, p. 225
000 FF yQxQ yx2
2
1kHkH F f 2
2
1fkF
3,2,1000 FF iforyQxQ iyixi
12131312
1221331132233210
12131312
121313120
12131312
131212130 ,,
yyxxyyxx
yxyxyxyxyxyx
yyxxyyxx
xxxxQ
yyxxyyxx
yyyyQ yx
FFFF
FFFF
FFFF
)(tan 00
12
0
2
0 xyyx QQandQQQ aa

American Engineering Testing, Inc. AET Project No.550 Cleveland Avenue North
St. Paul, Minnesota 55114
Phone: (651) 659-9001
Fax: (651) 659-1379
Discharge Potential for Rectilinear Flow1
Confined Flow2
Unconfined Flow2
Qx0 [ft2/d] = component of the discharge vector for flow in the x direction f [ft] = piezometric head above the aquifer base
Qy0 [ft2/d] = component of the discharge vector for flow in the y direction k [ft/d] = hydraulic conductivity of the homogeneous aquifer
x,y [ft] = cartesian coordinates in the horizontal plane H [ft] = thickness of the aquifer
F0 [ft3/d] = constant f > H = confined; f < H = unconfined
Well i fi xi yi
P-4 1 113.36 468035 164699
P-17 2 113.11 468462 164887P-20 3 112.83 468365 164599
Qa = ft3/d per ft of aquifer perpendicular to the direction of flow
= gallons per minute per ft of aquifer perpendicular to the direction of flow
a = radians
= degrees
References:
31-00455Municipal Wastewater Treatment Plant
Eau Claire, Wisconsin
Given:
Yields:
Aquifer
Hydraulic
Conductivity
(k)
Aquifer
Base
Elevation
(feet)
Aquifer
Top
Elevation
(feet)
Aquifer
Thickness
(H)
Ground-
water
Elevation
(feet) Flow Regime Fi Qx0 Qy0
367 660 770 110
773.36 Confined 2355993
48.13 -55.42773.11 Confined 2345901772.83 Confined
2Ibid., p. 49
2334597
73.40
0.3813
-0.86
-49.0
1Strack, O.D.L., Groundwater Mechanics , Prentice Hall, Englewood Cliffs, New Jersey, 1989, p. 225
000 FF yQxQ yx2
2
1kHkH F f 2
2
1fkF
3,2,1000 FF iforyQxQ iyixi
12131312
1221331132233210
12131312
121313120
12131312
131212130 ,,
yyxxyyxx
yxyxyxyxyxyx
yyxxyyxx
xxxxQ
yyxxyyxx
yyyyQ yx
FFFF
FFFF
FFFF
)(tan 00
12
0
2
0 xyyx QQandQQQ aa

American Engineering Testing, Inc. AET Project No.550 Cleveland Avenue North
St. Paul, Minnesota 55114
Phone: (651) 659-9001
Fax: (651) 659-1379
Discharge Potential for Rectilinear Flow1
Confined Flow2
Unconfined Flow2
Qx0 [ft2/d] = component of the discharge vector for flow in the x direction f [ft] = piezometric head above the aquifer base
Qy0 [ft2/d] = component of the discharge vector for flow in the y direction k [ft/d] = hydraulic conductivity of the homogeneous aquifer
x,y [ft] = cartesian coordinates in the horizontal plane H [ft] = thickness of the aquifer
F0 [ft3/d] = constant f > H = confined; f < H = unconfined
Well i fi xi yi
P-4 1 123.36 468035 164699
P-17 2 123.11 468462 164887P-20 3 122.83 468365 164599
Qa = ft3/d per ft of aquifer perpendicular to the direction of flow
= gallons per minute per ft of aquifer perpendicular to the direction of flow
a = radians
= degrees
References:
31-00455Municipal Wastewater Treatment Plant
Eau Claire, Wisconsin
Given:
Yields:
Aquifer
Hydraulic
Conductivity
(k)
Aquifer
Base
Elevation
(feet)
Aquifer
Top
Elevation
(feet)
Aquifer
Thickness
(H)
Ground-
water
Elevation
(feet) Flow Regime Fi Qx0 Qy0
367 650 770 120
773.36 Confined 2790374
52.51 -60.46773.11 Confined 2779364772.83 Confined
2Ibid., p. 49
2767033
80.07
0.4160
-0.86
-49.0
1Strack, O.D.L., Groundwater Mechanics , Prentice Hall, Englewood Cliffs, New Jersey, 1989, p. 225
000 FF yQxQ yx2
2
1kHkH F f 2
2
1fkF
3,2,1000 FF iforyQxQ iyixi
12131312
1221331132233210
12131312
121313120
12131312
131212130 ,,
yyxxyyxx
yxyxyxyxyxyx
yyxxyyxx
xxxxQ
yyxxyyxx
yyyyQ yx
FFFF
FFFF
FFFF
)(tan 00
12
0
2
0 xyyx QQandQQQ aa

American Engineering Testing, Inc. AET Project No.550 Cleveland Avenue North
St. Paul, Minnesota 55114
Phone: (651) 659-9001
Fax: (651) 659-1379
Discharge Potential for Rectilinear Flow1
Confined Flow2
Unconfined Flow2
Qx0 [ft2/d] = component of the discharge vector for flow in the x direction f [ft] = piezometric head above the aquifer base
Qy0 [ft2/d] = component of the discharge vector for flow in the y direction k [ft/d] = hydraulic conductivity of the homogeneous aquifer
x,y [ft] = cartesian coordinates in the horizontal plane H [ft] = thickness of the aquifer
F0 [ft3/d] = constant f > H = confined; f < H = unconfined
Well i fi xi yi
P-4 1 153.36 468035 164699
P-17 2 153.11 468462 164887P-20 3 152.83 468365 164599
Qa = ft3/d per ft of aquifer perpendicular to the direction of flow
= gallons per minute per ft of aquifer perpendicular to the direction of flow
a = radians
= degrees
References:
31-00455Municipal Wastewater Treatment Plant
Eau Claire, Wisconsin
Given:
Yields:
Aquifer
Hydraulic
Conductivity
(k)
Aquifer
Base
Elevation
(feet)
Aquifer
Top
Elevation
(feet)
Aquifer
Thickness
(H)
Ground-
water
Elevation
(feet) Flow Regime Fi Qx0 Qy0
367 620 770 150
773.36 Confined 4313718
65.63 -75.57773.11 Confined 4299956772.83 Confined
2Ibid., p. 49
4284542
100.09
0.5200
-0.86
-49.0
1Strack, O.D.L., Groundwater Mechanics , Prentice Hall, Englewood Cliffs, New Jersey, 1989, p. 225
000 FF yQxQ yx2
2
1kHkH F f 2
2
1fkF
3,2,1000 FF iforyQxQ iyixi
12131312
1221331132233210
12131312
121313120
12131312
131212130 ,,
yyxxyyxx
yxyxyxyxyxyx
yyxxyyxx
xxxxQ
yyxxyyxx
yyyyQ yx
FFFF
FFFF
FFFF
)(tan 00
12
0
2
0 xyyx QQandQQQ aa

American Engineering Testing, Inc. AET Project No.550 Cleveland Avenue North
St. Paul, Minnesota 55114
Phone: (651) 659-9001
Fax: (651) 659-1379
Discharge Potential for Rectilinear Flow1
Confined Flow2
Unconfined Flow2
Qx0 [ft2/d] = component of the discharge vector for flow in the x direction f [ft] = piezometric head above the aquifer base
Qy0 [ft2/d] = component of the discharge vector for flow in the y direction k [ft/d] = hydraulic conductivity of the homogeneous aquifer
x,y [ft] = cartesian coordinates in the horizontal plane H [ft] = thickness of the aquifer
F0 [ft3/d] = constant f > H = confined; f < H = unconfined
Well i fi xi yi
P-4 1 203.36 468035 164699
P-17 2 203.11 468462 164887P-20 3 202.83 468365 164599
Qa = ft3/d per ft of aquifer perpendicular to the direction of flow
= gallons per minute per ft of aquifer perpendicular to the direction of flow
a = radians
= degrees
References:
31-00455Municipal Wastewater Treatment Plant
Eau Claire, Wisconsin
Given:
Yields:
Aquifer
Hydraulic
Conductivity
(k)
Aquifer
Base
Elevation
(feet)
Aquifer
Top
Elevation
(feet)
Aquifer
Thickness
(H)
Ground-
water
Elevation
(feet) Flow Regime Fi Qx0 Qy0
367 570 770 200
773.36 Confined 7586624
87.51 -100.76773.11 Confined 7568274772.83 Confined
2Ibid., p. 49
7547722
133.46
0.6933
-0.86
-49.0
1Strack, O.D.L., Groundwater Mechanics , Prentice Hall, Englewood Cliffs, New Jersey, 1989, p. 225
000 FF yQxQ yx2
2
1kHkH F f 2
2
1fkF
3,2,1000 FF iforyQxQ iyixi
12131312
1221331132233210
12131312
121313120
12131312
131212130 ,,
yyxxyyxx
yxyxyxyxyxyx
yyxxyyxx
xxxxQ
yyxxyyxx
yyyyQ yx
FFFF
FFFF
FFFF
)(tan 00
12
0
2
0 xyyx QQandQQQ aa