Embed Size (px)
Citation preview


~2~
REPORT OF INDEPENDENT ACCOUNTANTS
To the Board of Directors and Shareholders of Delta Electronics, Inc.
Opinion
We have audited the accompanying consolidated balance sheets of Delta Electronics, Inc. and
its subsidiaries (the “Group”) as at December 31, 2019 and 2018, and the related consolidated
statements of comprehensive income, of changes in equity and of cash flows for the years then
ended, and notes to the consolidated financial statements, including a summary of significant
accounting policies.
In our opinion, based on our audits and the audit reports of the other independent accountants
as described in the Other Matter - Scope of the Audit section of our report, the accompanying
consolidated financial statements present fairly, in all material respects, the consolidated financial
position of the Group as at December 31, 2019 and 2018, and its consolidated financial
performance and its consolidated cash flows for the years then ended in accordance with the
“Regulations Governing the Preparation of Financial Reports by Securities Issuers” and the
International Financial Reporting Standards, International Accounting Standards, IFRIC
Interpretations, and SIC Interpretations as endorsed by the Financial Supervisory Commission.
Basis for opinion
We conducted our audits in accordance with the “Regulations Governing Auditing and
Attestation of Financial Statements by Certified Public Accountants” and Generally Accepted
Auditing Standards in the Republic of China (ROC GAAS). Our responsibilities under those
standards are further described in the Auditor’s Responsibilities for the Audit of the Consolidated
Financial Statements section of our report. We are independent of the Group in accordance with
the Code of Professional Ethics for Certified Public Accountants in the Republic of China (the
“Code”), and we have fulfilled our other ethical responsibilities in accordance with the Code. Based
on our audits and the audit reports of other independent accountants, we believe that the audit
evidence we have obtained is sufficient and appropriate to provide a basis for our opinion.

~3~
Key audit matters
Key audit matters are those matters that, in our professional judgment, were of most
significance in our audit of the consolidated financial statements of the current period. These matters
were addressed in the context of our audit of the consolidated financial statements as a whole and,
in forming our opinion thereon, we do not provide a separate opinion on these matters.
Key audit matters for the Group’s consolidated financial statements of the current period are
stated as follows:
Assessment of the reasonableness of the purchase price allocation for business combination
Description
In April 2019, the Group publicly acquired 42.85% of Delta Electronics (Thailand) Public
Company Limited through a tender offer and obtained control over the Company. The value of
intangible assets, inclusive of goodwill and identifiable intangible assets-premium on customer
relationship, etc., acquired from the merger is significant. The merger was accounted for in
accordance with IFRS 3, “Business Combination”. For details of purchase price allocation, refer to
Note 6(30).
As the allocation of goodwill and the net fair value of identifiable assets and liabilities are
based on management’s estimation and involve accounting estimations and assumptions, we
consider the above equity price allocation transaction a key audit matter.
How our audit addressed the matter
We obtained an understanding of the basis and process of purchase price allocation which was
estimated by management. We reviewed the reasonableness of the fair value assessment for assets
acquired and liabilities assumed, projected cash flow, and the fair value calculation model as
indicated in the purchase price allocation reports prepared by the appraisers appointed by the Group.
Our procedures also included the following:
A. Assessing the setting of parameters of valuation models and calculation formulas;
B. Comparing expected growth rates and gross margin with historical data, economic and industry
forecasts; and

~4~
C. Comparing the discount rate with the cost of capital assumptions of cash generating units and
rate of returns of similar assets.
Impairment assessment of goodwill
Description
As at December 31, 2019, the recognised goodwill as a result of acquisitions of Delta
Electronics (Thailand) Public Company Limited, Eltek AS, Cyntec Co., Ltd., Delta Controls Inc.,
Delta Greentech (China) Co., Ltd. and Loy Tec electronics GmbH amounted to NT$51,555,322
thousand, constituting 16.58% of consolidated total assets. Refer to Notes 5(2) and 6(12) for details.
As the balance of goodwill acquired from the merger is material, the valuation model adopted
in the impairment assessment has an impact in determining the recoverable amount which involves
the significant accounting estimates and prediction of future cash flows. Thus, we consider the
impairment assessment of goodwill a key audit matter.
How our audit addressed the matter
We obtained management’s impairment assessment of goodwill, obtained an understanding
of the process in determining the expected future cash flows based on each cash generating unit,
and performed the following audit procedures:
A. Assessing whether the valuation models adopted by the Group are reasonable for the industry,
environment and the valued assets of the Group;
B. Confirming whether the expected future cash flows adopted in the valuation model are in
agreement with the budget provided by the business units; and
C. Assessing the reasonableness of material assumptions, such as expected growth rates, operating
margin and discount rates, by:
(a) Checking the setting of parameters of valuation models and calculation formulas;
(b) Comparing the expected growth rate and operating margin with historical data, economic
and industrial forecast documents; and
(c) Comparing the discount rate with cost of capital assumptions of cash generating units and
rate of returns of similar assets.
~5~
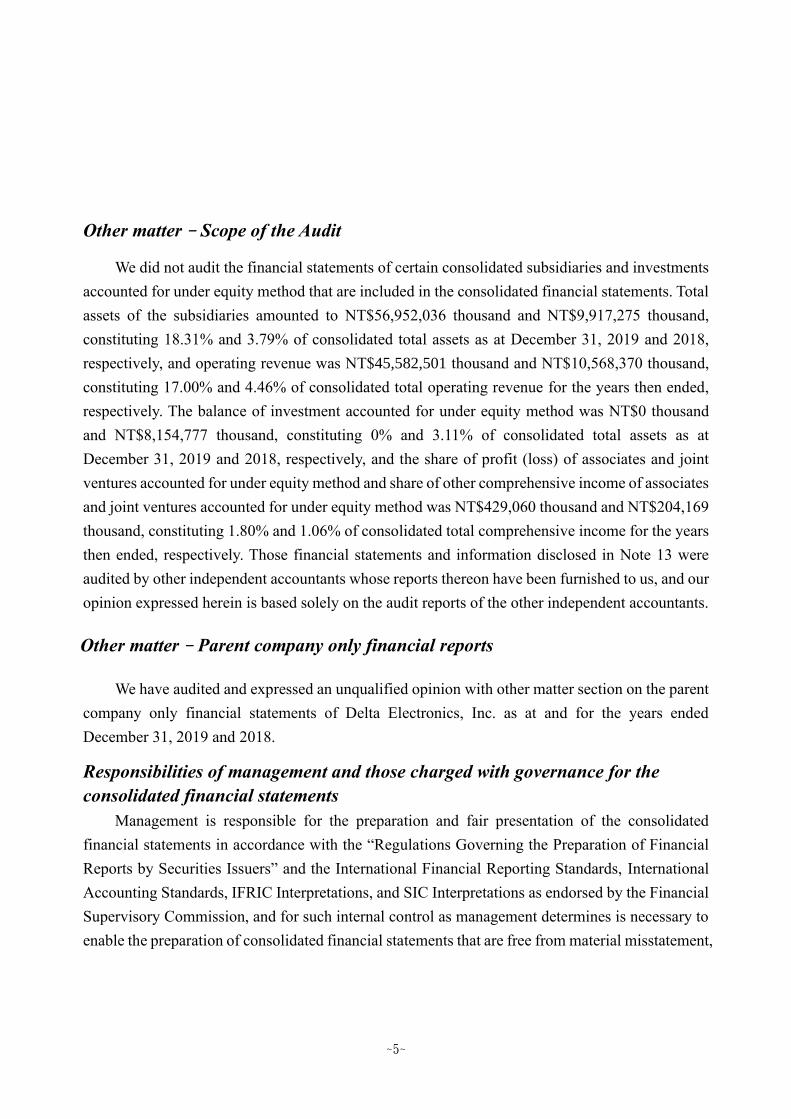
Other matter–Scope of the Audit
We did not audit the financial statements of certain consolidated subsidiaries and investments
accounted for under equity method that are included in the consolidated financial statements. Total
assets of the subsidiaries amounted to NT$56,952,036 thousand and NT$9,917,275 thousand,
constituting 18.31% and 3.79% of consolidated total assets as at December 31, 2019 and 2018,
respectively, and operating revenue was NT$45,582,501 thousand and NT$10,568,370 thousand,
constituting 17.00% and 4.46% of consolidated total operating revenue for the years then ended,
respectively. The balance of investment accounted for under equity method was NT$0 thousand
and NT$8,154,777 thousand, constituting 0% and 3.11% of consolidated total assets as at
December 31, 2019 and 2018, respectively, and the share of profit (loss) of associates and joint
ventures accounted for under equity method and share of other comprehensive income of associates
and joint ventures accounted for under equity method was NT$429,060 thousand and NT$204,169
thousand, constituting 1.80% and 1.06% of consolidated total comprehensive income for the years
then ended, respectively. Those financial statements and information disclosed in Note 13 were
audited by other independent accountants whose reports thereon have been furnished to us, and our
opinion expressed herein is based solely on the audit reports of the other independent accountants.
Other matter–Parent company only financial reports
We have audited and expressed an unqualified opinion with other matter section on the parent
company only financial statements of Delta Electronics, Inc. as at and for the years ended
December 31, 2019 and 2018.
Responsibilities of management and those charged with governance for the
consolidated financial statements
Management is responsible for the preparation and fair presentation of the consolidated
financial statements in accordance with the “Regulations Governing the Preparation of Financial
Reports by Securities Issuers” and the International Financial Reporting Standards, International
Accounting Standards, IFRIC Interpretations, and SIC Interpretations as endorsed by the Financial
Supervisory Commission, and for such internal control as management determines is necessary to
enable the preparation of consolidated financial statements that are free from material misstatement,

~6~
whether due to fraud or error.
In preparing the consolidated financial statements, management is responsible for assessing
the Group’s ability to continue as a going concern, disclosing, as applicable, matters related to
going concern and using the going concern basis of accounting unless management either intends
to liquidate the Group or to cease operations, or has no realistic alternative but to do so.
Those charged with governance, including audit committee, are responsible for overseeing the
Group’s financial reporting process.
Auditor’s responsibilities for the audit of the consolidated financial statements
Our objectives are to obtain reasonable assurance about whether the consolidated financial
statements as a whole are free from material misstatement, whether due to fraud or error, and to
issue an auditor’s report that includes our opinion. Reasonable assurance is a high level of assurance,
but is not a guarantee that an audit conducted in accordance with ROC GAAS will always detect a
material misstatement when it exists. Misstatements can arise from fraud or error and are
considered material if, individually or in the aggregate, they could reasonably be expected to
influence the economic decisions of users taken on the basis of these consolidated financial
statements.
As part of an audit in accordance with ROC GAAS, we exercise professional judgment and
maintain professional skepticism throughout the audit. We also:
A. Identify and assess the risks of material misstatement of the consolidated financial statements,
whether due to fraud or error, design and perform audit procedures responsive to those risks,
and obtain audit evidence that is sufficient and appropriate to provide a basis for our opinion.
The risk of not detecting a material misstatement resulting from fraud is higher than for one
resulting from error, as fraud may involve collusion, forgery, intentional omissions,
misrepresentations, or the override of internal control;
B. Obtain an understanding of internal control relevant to the audit in order to design audit
procedures that are appropriate in the circumstances, but not for the purpose of expressing an
opinion on the effectiveness of the Group’s internal control;
C. Evaluate the appropriateness of accounting policies used and the reasonableness of accounting
estimates and related disclosures made by management;
D. Conclude on the appropriateness of management’s use of the going concern basis of

~7~
accounting and, based on the audit evidence obtained, whether a material uncertainty exists
related to events or conditions that may cast significant doubt on the Group’s ability to
continue as a going concern. If we conclude that a material uncertainty exists, we are required
to draw attention in our auditor’s report to the related disclosures in the consolidated financial
statements or, if such disclosures are inadequate, to modify our opinion. Our conclusions are
based on the audit evidence obtained up to the date of our auditor’s report. However, future
events or conditions may cause the Group to cease to continue as a going concern;
E. Evaluate the overall presentation, structure and content of the consolidated financial
statements, including the disclosures, and whether the consolidated financial statements
represent the underlying transactions and events in a manner that achieves fair presentation;
and
F. Obtain sufficient appropriate audit evidence regarding the financial information of the entities
or business activities within the Group to express an opinion on the consolidated financial
statements. We are responsible for the direction, supervision and performance of the group
audit. We remain solely responsible for our audit opinion.
We communicate with those charged with governance regarding, among other matters, the
planned scope and timing of the audit and significant audit findings, including any significant
deficiencies in internal control that we identify during our audit.
We also provide those charged with governance with a statement that we have complied with
relevant ethical requirements regarding independence, and to communicate with them all
relationships and other matters that may reasonably be thought to bear on our independence, and
where applicable, related safeguards.
From the matters communicated with those charged with governance, we determine those
matters that were of most significance in the audit of the consolidated financial statements of the
current year and are therefore the key audit matters. We describe these matters in our auditor’s
report unless law or regulation precludes public disclosure about the matter or when, in extremely
rare circumstances, we determine that a matter should not be communicated in our report because
the adverse consequences of doing so would reasonably be expected to outweigh the public interest
benefits of such communication.

~8~
The consolidated financial statements of Delta Electronics, Inc. and subsidiaries as at and for
the year ended December 31, 2019 expressed in US dollars are presented solely for the convenience
of the reader and were translated from the financial statements expressed in New Taiwan dollars
using the exchange rate of $29.98 to US$1.00 at December 31, 2019. This basis of translation is
not in accordance with International Financial Reporting Standards, International Accounting
Standards, and relevant interpretations and interpretative bulletins that are ratified by the Financial
Supervisory Commission.
Lin, Yu-Kuan Chou, Chien-Hung
for and on behalf of PricewaterhouseCoopers, Taiwan
March 10, 2020
----------------------------------------------------------------------------------------------------------------------------
The accompanying consolidated financial statements are not intended to present the financial position and results of
operations and cash flows in accordance with accounting principles generally accepted in countries and jurisdictions
other than the Republic of China. The standards, procedures and practices in the Republic of China governing the
audit of such financial statements may differ from those generally accepted in countries and jurisdictions other than
the Republic of China. Accordingly, the accompanying consolidated financial statements and report of independent
accountants are not intended for use by those who are not informed about the accounting principles or auditing
standards generally accepted in the Republic of China, and their applications in practice.
As the financial statements are the responsibility of the management, PricewaterhouseCoopers, Taiwan cannot accept
any liability for the use of, or reliance on, the English translation or for any errors or misunderstandings that may
derive from the translation.
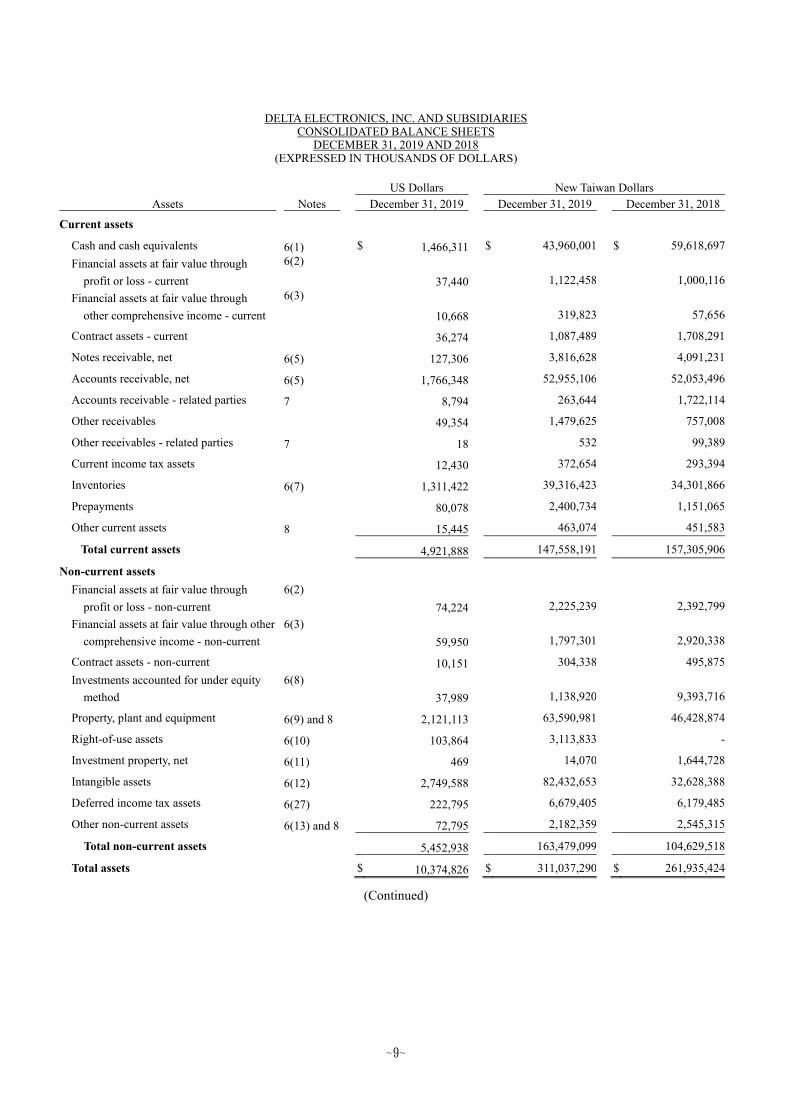
DELTA ELECTRONICS, INC. AND SUBSIDIARIES CONSOLIDATED BALANCE SHEETS
DECEMBER 31, 2019 AND 2018 (EXPRESSED IN THOUSANDS OF DOLLARS)
~9~
US Dollars New Taiwan Dollars Assets Notes December 31, 2019 December 31, 2019 December 31, 2018
Current assets
Cash and cash equivalents 6(1) $ 1,466,311 $ 43,960,001 $ 59,618,697
Financial assets at fair value through
profit or loss - current
6(2) 37,440
1,122,458 1,000,116
Financial assets at fair value through
other comprehensive income - current
6(3) 10,668
319,823 57,656
Contract assets - current 36,274 1,087,489 1,708,291
Notes receivable, net 6(5) 127,306 3,816,628 4,091,231
Accounts receivable, net 6(5) 1,766,348 52,955,106 52,053,496
Accounts receivable - related parties 7 8,794 263,644 1,722,114
Other receivables 49,354 1,479,625 757,008
Other receivables - related parties 7 18 532 99,389
Current income tax assets 12,430 372,654 293,394
Inventories 6(7) 1,311,422 39,316,423 34,301,866
Prepayments 80,078 2,400,734 1,151,065
Other current assets 8 15,445 463,074 451,583
Total current assets 4,921,888 147,558,191 157,305,906
Non-current assets Financial assets at fair value through
profit or loss - non-current 6(2)
74,224
2,225,239 2,392,799 Financial assets at fair value through other
comprehensive income - non-current
6(3) 59,950
1,797,301 2,920,338
Contract assets - non-current 10,151 304,338 495,875 Investments accounted for under equity
method
6(8) 37,989
1,138,920 9,393,716
Property, plant and equipment 6(9) and 8 2,121,113 63,590,981 46,428,874
Right-of-use assets 6(10) 103,864 3,113,833 -
Investment property, net 6(11) 469 14,070 1,644,728
Intangible assets 6(12) 2,749,588 82,432,653 32,628,388
Deferred income tax assets 6(27) 222,795 6,679,405 6,179,485
Other non-current assets 6(13) and 8 72,795 2,182,359 2,545,315
Total non-current assets 5,452,938 163,479,099 104,629,518
Total assets $ 10,374,826 $ 311,037,290 $ 261,935,424
(Continued)

DELTA ELECTRONICS, INC. AND SUBSIDIARIES CONSOLIDATED BALANCE SHEETS
DECEMBER 31, 2019 AND 2018 (EXPRESSED IN THOUSANDS OF DOLLARS)
The accompanying notes are an integral part of these consolidated financial statements.
~10~
US Dollars New Taiwan Dollars Liabilities and Equity Notes December 31, 2019 December 31, 2019 December 31, 2018
Current liabilities
Short-term borrowings 6(14) $ 252,700 $ 7,575,932 $ 6,259,062 Financial liabilities at fair value through
profit or loss - current 6(2)
531 15,929 8,544
Contract liabilities - current 6(21) 111,815 3,352,208 2,643,318
Notes payable 723 21,669 7,955
Accounts payable 1,316,827 39,478,462 39,016,773
Accounts payable - related parties 7 1,074 32,197 1,484,335
Other payables 961,620 28,829,379 24,786,588
Current income tax liabilities 72,951 2,187,076 2,712,106
Other current liabilities 6(15) 141,204 4,233,308 3,710,299
Total current liabilities 2,859,445 85,726,160 80,628,980
Non-current liabilities
Long-term borrowings 6(15) 925,578 27,748,839 25,232,787
Deferred income tax liabilities 6(27) 467,274 14,008,861 11,569,432
Lease liabilities - non-current 47,407 1,421,265 -
Other non-current liabilities 6(16) 259,430 7,777,723 5,043,317
Total non-current liabilities 1,699,689 50,956,688 41,845,536
Total liabilities 4,559,134 136,682,848 122,474,516
Equity
Share capital
Share capital - common stock 6(17) 866,425 25,975,433 25,975,433
Capital surplus 6(18)
Capital surplus 1,637,870 49,103,331 48,397,067
Retained earnings 6(19)
Legal reserve 834,915 25,030,754 23,211,444
Special reserve 252,203 7,561,032 7,088,143
Unappropriated retained earnings 1,337,837 40,108,361 33,160,104
Other equity interest
Other equity interest ( 254,237 ) ( 7,622,034 ) ( 7,561,032 ) Equity attributable to owners of the
parent 4,675,013 140,156,877 130,271,159
Non-controlling interest 4(3) and
6(20) 1,140,679 34,197,565 9,189,749
Total equity 5,815,692 174,354,442 139,460,908 Significant contingent liabilities and
unrecorded contract commitments
9
Significant subsequent events 11
Total liabilities and equity $ 10,374,826 $ 311,037,290 $ 261,935,424

DELTA ELECTRONICS, INC. AND SUBSIDIARIES CONSOLIDATED STATEMENTS OF COMPREHENSIVE INCOME
YEARS ENDED DECEMBER 31, 2019 AND 2018 (EXPRESSED IN THOUSANDS OF DOLLARS, EXCEPT EARNINGS PER SHARE DATA)
~11~
US Dollars New Taiwan Dollars
Items Notes 2019 2019 2018
Sales revenue 6(21) and 7 $ 8,943,676 $ 268,131,397 $ 237,017,809
Operating costs 6(7)(25)
(26) and 7
( 6,458,815 ) ( 193,635,252 ) ( 173,463,422 )
Gross profit 2,484,861 74,496,145 63,554,387
Operating expenses 6(25)(26)
Selling expenses ( 661,682 ) ( 19,837,224 ) ( 16,553,772 )
General and administrative expenses ( 380,864 ) ( 11,418,313 ) ( 9,714,466 )
Research and development expenses ( 796,794 ) ( 23,887,886 ) ( 19,257,915 )
Expected credit impairment gain 12(2) 1,870 56,068 138,489
Total operating expenses ( 1,837,470 ) ( 55,087,355 ) ( 45,387,664 )
Operating profit 647,391 19,408,790 18,166,723
Non-operating income and expenses
Other income 6(22)
134,662 4,037,166 4,373,591
Other gains and losses 6(23)
210,288 6,304,445 ( 134,572 )
Finance costs 6(24)
( 24,611 ) ( 737,869 ) ( 548,704 )
Share of profit of associates and
joint ventures accounted for
under equity method
6(8)
4,732 141,877 943,990
Total non-operating income and
expenses
325,071 9,745,619 4,634,305
Profit before income tax 972,462 29,154,409 22,801,028
Income tax expense 6(27) ( 174,338 ) ( 5,226,653 ) ( 4,152,444 )
Profit for the year $ 798,124 $ 23,927,756 $ 18,648,584
(Continued)
DELTA ELECTRONICS, INC. AND SUBSIDIARIES CONSOLIDATED STATEMENTS OF COMPREHENSIVE INCOME
YEARS ENDED DECEMBER 31, 2019 AND 2018 (EXPRESSED IN THOUSANDS OF DOLLARS, EXCEPT EARNINGS PER SHARE DATA)
The accompanying notes are an integral part of these consolidated financial statements.
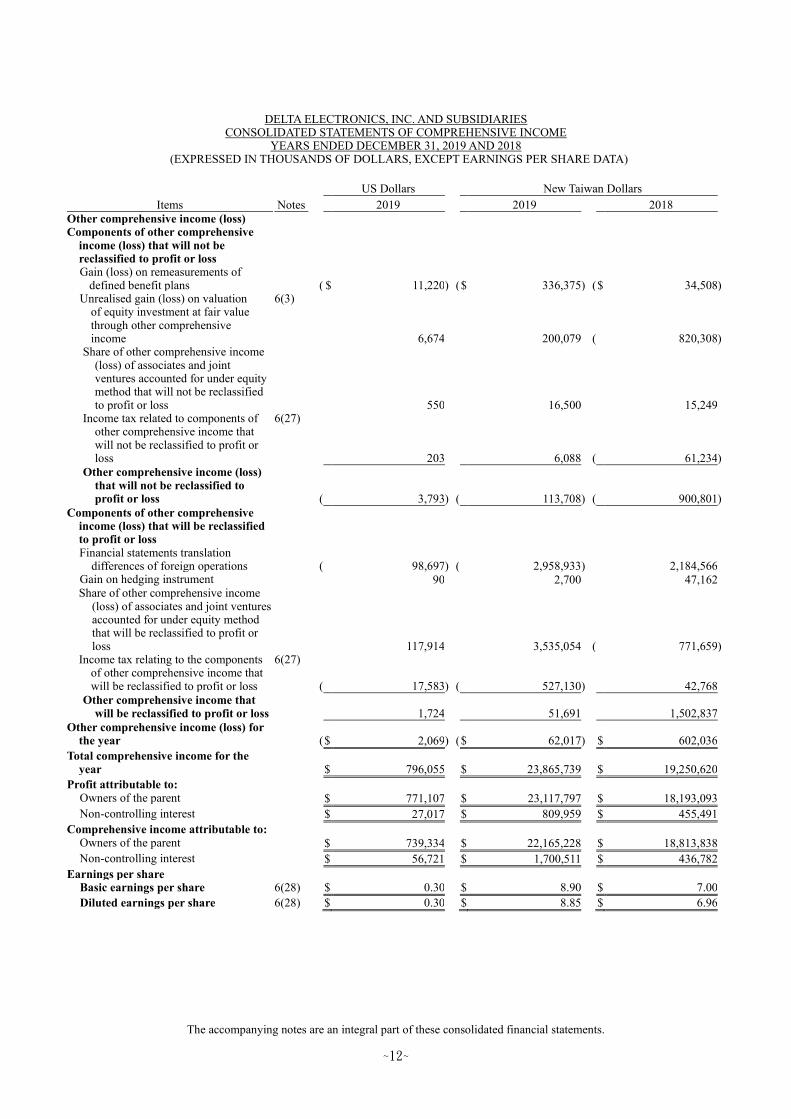
~12~
US Dollars New Taiwan Dollars
Items Notes 2019 2019 2018
Other comprehensive income (loss) Components of other comprehensive
income (loss) that will not be reclassified to profit or loss
Gain (loss) on remeasurements of defined benefit plans
( $ 11,220 ) ( $ 336,375 ) ( $ 34,508 )
Unrealised gain (loss) on valuation of equity investment at fair value through other comprehensive income
6(3)
6,674 200,079 ( 820,308 ) Share of other comprehensive income
(loss) of associates and joint ventures accounted for under equity method that will not be reclassified to profit or loss
550 16,500 15,249 Income tax related to components of
other comprehensive income that will not be reclassified to profit or loss
6(27)
203 6,088 ( 61,234 )
Other comprehensive income (loss)
that will not be reclassified to profit or loss
( 3,793 ) ( 113,708 ) ( 900,801 )
Components of other comprehensive income (loss) that will be reclassified to profit or loss
Financial statements translation
differences of foreign operations
( 98,697 ) ( 2,958,933 ) 2,184,566
Gain on hedging instrument 90 2,700 47,162 Share of other comprehensive income
(loss) of associates and joint ventures accounted for under equity method that will be reclassified to profit or loss
117,914 3,535,054 ( 771,659 ) Income tax relating to the components
of other comprehensive income that will be reclassified to profit or loss
6(27)
( 17,583 ) ( 527,130 ) 42,768
Other comprehensive income that
will be reclassified to profit or loss
1,724 51,691 1,502,837
Other comprehensive income (loss) for the year
( $ 2,069 ) ( $ 62,017 ) $ 602,036
Total comprehensive income for the
year
$ 796,055 $ 23,865,739 $ 19,250,620
Profit attributable to: Owners of the parent $ 771,107 $ 23,117,797 $ 18,193,093
Non-controlling interest $ 27,017 $ 809,959 $ 455,491
Comprehensive income attributable to: Owners of the parent $ 739,334 $ 22,165,228 $ 18,813,838
Non-controlling interest $ 56,721 $ 1,700,511 $ 436,782
Earnings per share Basic earnings per share 6(28) $ 0.30 $ 8.90 $ 7.00
Diluted earnings per share 6(28) $ 0.30 $ 8.85 $ 6.96

DELTA ELECTRONICS, INC. AND SUBSIDIARIES
CONSOLIDATED STATEMENTS OF CHANGES IN EQUITY
YEARS ENDED DECEMBER 31, 2019 AND 2018
(EXPRESSED IN THOUSANDS OF DOLLARS)
~13~
Equity attributable to owners of the parent Retained earnings Other equity interest
Items
Notes
Share capital - common
stock Capital
surplus Legal reserve Special reserve
Unappropriated retained earnings
Financial statements translation
differences of foreign
operations
Unrealised gain (loss) on
financial assets measured at fair value through
other comprehensive
income
Unrealised gain (loss)
on available-for-sale financial
assets
Hedging instrument gain (loss)
on effective hedge of cash flow
hedges
Gain (loss) on hedging instruments Total
Non-controlling
interest Total equity 2018 New Taiwan Dollars Balance at January 1, 2018 $ 25,975,433 $ 48,446,318 $ 21,373,388 $ 2,767,749 $ 33,082,224 ( $ 5,911,839 ) $ - ( $ 1,256,841 ) $ 80,537 $ - $ 124,556,969 $ 9,216,505 $ 133,773,474 Effects of retrospective application and retrospective restatement - - - - 1,118,916 - ( 2,375,757 ) 1,256,841 ( 80,537 ) 80,537 - - - Balance after retrospective restatement at January 1, 2018 25,975,433 48,446,318 21,373,388 2,767,749 34,201,140 ( 5,911,839 ) ( 2,375,757 ) - - 80,537 124,556,969 9,216,505 133,773,474 Profit for the year - - - - 18,193,093 - - - - - 18,193,093 455,491 18,648,584 Other comprehensive income (loss) for the year - - - - ( 15,946 ) 1,489,814 ( 903,738 ) - - 50,615 620,745 ( 18,709 ) 602,036 Comprehensive income (loss) for the year - - - - 18,177,147 1,489,814 ( 903,738 ) - - 50,615 18,813,838 436,782 19,250,620 Distribution of 2017 earnings 6(19) Legal reserve - - 1,838,056 - ( 1,838,056 ) - - - - - - - - Special reserve - - - 4,320,394 ( 4,320,394 ) - - - - - - - - Cash dividends - - - - ( 12,987,717 ) - - - - - ( 12,987,717 ) - ( 12,987,717 ) Changes in ownership interests in subsidiaries - ( 49,251 ) - - ( 62,680 ) - - - - - ( 111,931 ) - ( 111,931 ) Changes in non-controlling interests 6(20) - - - - - - - - - - - ( 463,538 ) ( 463,538 ) Disposal of equity investments at fair value through other comprehensive
income 6(3)
- - - - ( 9,336 ) - 9,336 - - - - - - Balance at December 31, 2018 $ 25,975,433 $ 48,397,067 $ 23,211,444 $ 7,088,143 $ 33,160,104 ( $ 4,422,025 ) ( $ 3,270,159 ) $ - $ - $ 131,152 $ 130,271,159 $ 9,189,749 $ 139,460,908 2019 New Taiwan Dollars Balance at January 1, 2019 $ 25,975,433 $ 48,397,067 $ 23,211,444 $ 7,088,143 $ 33,160,104 ( $ 4,422,025 ) ( $ 3,270,159 ) $ - $ - $ 131,152 $ 130,271,159 $ 9,189,749 $ 139,460,908 Effects of retrospective application and retrospective restatement 3(1) - - - - 1,943 - - - - - 1,943 - 1,943 Balance after retrospective restatement at January 1, 2019 25,975,433 48,397,067 23,211,444 7,088,143 33,162,047 ( 4,422,025 ) ( 3,270,159 ) - - 131,152 130,273,102 9,189,749 139,462,851 Profit for the year - - - - 23,117,797 - - - - - 23,117,797 809,959 23,927,756 Other comprehensive income (loss) for the year - - - - ( 255,785 ) ( 912,967 ) 200,079 - - 16,104 ( 952,569 ) 890,552 ( 62,017 ) Comprehensive income (loss) for the year - - - - 22,862,012 ( 912,967 ) 200,079 - - 16,104 22,165,228 1,700,511 23,865,739 Distribution of 2018 earnings 6(19) Legal reserve - - 1,819,310 - ( 1,819,310 ) - - - - - - - - Special reserve - - - 472,889 ( 472,889 ) - - - - - - - - Cash dividends - - - - ( 12,987,717 ) - - - - - ( 12,987,717 ) - ( 12,987,717 ) Changes in ownership interests in subsidiaries - 34,941 - - - - - - - - 34,941 - 34,941 Difference between consideration and carrying amount of subsidiaries
acquired or disposed 6(31)
- 671,323 - - - - - - - - 671,323 ( 4,947,661 ) ( 4,276,338 ) Changes in non-controlling interests 6(20) - - - - - - - - - - - 28,254,966 28,254,966 Disposal of equity investments at fair value through other comprehensive
income 6(3)
- - - - ( 635,782 ) - 635,782 - - - - - - Balance at December 31, 2019 $ 25,975,433 $ 49,103,331 $ 25,030,754 $ 7,561,032 $ 40,108,361 ( $ 5,334,992 ) ( $ 2,434,298 ) $ - $ - $ 147,256 $ 140,156,877 $ 34,197,565 $ 174,354,442
(Continued)
DELTA ELECTRONICS, INC. AND SUBSIDIARIES
CONSOLIDATED STATEMENTS OF CHANGES IN EQUITY
YEARS ENDED DECEMBER 31, 2019 AND 2018
(EXPRESSED IN THOUSANDS OF DOLLARS)
The accompanying notes are an integral part of these consolidated financial statements.
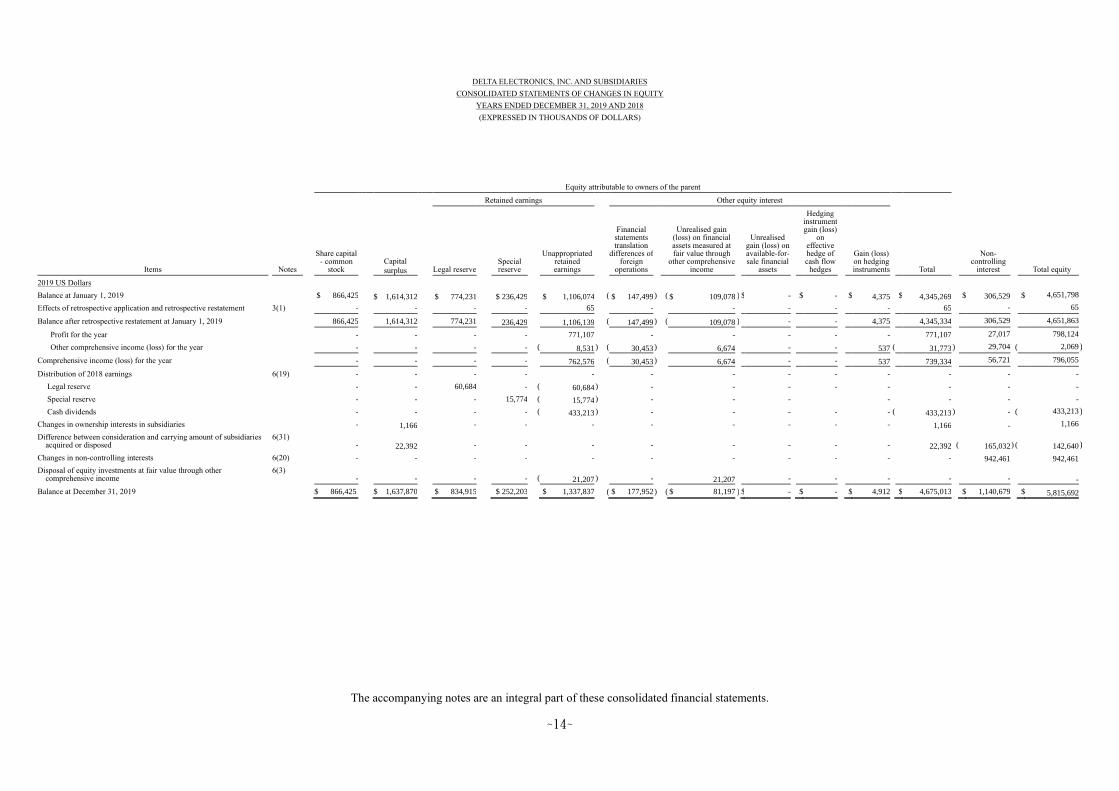
~14~
Equity attributable to owners of the parent Retained earnings Other equity interest
Items Notes
Share capital - common
stock Capital
surplus Legal reserve Special reserve
Unappropriated retained earnings
Financial statements translation
differences of foreign
operations
Unrealised gain (loss) on financial assets measured at fair value through
other comprehensive income
Unrealised gain (loss) on available-for-sale financial
assets
Hedging instrument gain (loss)
on effective hedge of cash flow
hedges
Gain (loss) on hedging instruments Total
Non-controlling
interest Total equity 2019 US Dollars Balance at January 1, 2019 $ 866,425 $ 1,614,312 $ 774,231 $ 236,429 $ 1,106,074 ( $ 147,499 ) ( $ 109,078 ) $ - $ - $ 4,375 $ 4,345,269 $ 306,529 $ 4,651,798 Effects of retrospective application and retrospective restatement 3(1) - - - - 65 - - - - - 65 - 65 Balance after retrospective restatement at January 1, 2019 866,425 1,614,312 774,231 236,429 1,106,139 ( 147,499 ) ( 109,078 ) - - 4,375 4,345,334 306,529 4,651,863 Profit for the year - - - - 771,107 - - - - - 771,107 27,017 798,124 Other comprehensive income (loss) for the year - - - - ( 8,531 ) ( 30,453 ) 6,674 - - 537 ( 31,773 ) 29,704 ( 2,069 )
Comprehensive income (loss) for the year - - - - 762,576 ( 30,453 ) 6,674 - - 537 739,334 56,721 796,055
Distribution of 2018 earnings 6(19) - - - - - - - - - - - - - Legal reserve - - 60,684 - ( 60,684 ) - - - - - - - - Special reserve - - - 15,774 ( 15,774 ) - - - - - - - Cash dividends - - - - ( 433,213 ) - - - - - ( 433,213 ) - ( 433,213 )
Changes in ownership interests in subsidiaries - 1,166 - - - - - - - - 1,166 - 1,166
Difference between consideration and carrying amount of subsidiaries acquired or disposed
6(31) - 22,392 - - - - - - - - 22,392 ( 165,032 ) ( 142,640 )
Changes in non-controlling interests 6(20) - - - - - - - - - - - 942,461 942,461 Disposal of equity investments at fair value through other
comprehensive income 6(3)
- - - - ( 21,207 ) - 21,207 - - - - - - Balance at December 31, 2019 $ 866,425 $ 1,637,870 $ 834,915 $ 252,203 $ 1,337,837 ( $ 177,952 ) ( $ 81,197 ) $ - $ - $ 4,912 $ 4,675,013 $ 1,140,679 $ 5,815,692

DELTA ELECTRONICS, INC. AND SUBSIDIARIES
CONSOLIDATED STATEMENTS OF CASH FLOWS YEARS ENDED DECEMBER 31, 2019 AND 2018 (EXPRESSED IN THOUSANDS OF DOLLARS)
~15~
US Dollars New Taiwan Dollars
Notes 2019 2019 2018 CASH FLOWS FROM OPERATING ACTIVITIES Consolidated profit before tax for the year $ 972,462 $ 29,154,409 $ 22,801,028 Adjustments to reconcile net income to net cash
generated from operating activities
Income and expenses having no effect on cash flows Depreciation 6(9)(10)(11)
(25)
363,996
10,912,594
8,939,275
Amortization 6(12)(25) 102,497 3,072,851 2,203,617 Expected credit impairment gain 12(2) ( 1,870 ) ( 56,068 ) ( 138,489 ) Net (gain) loss on financial assets or liabilities at
fair value through profit or loss 6(23)
( 12,207 ) ( 365,965 )
202,545 Interest expense 6(24) 24,408 731,745 545,804 Interest income 6(22) ( 29,571 ) ( 886,537 ) ( 851,185 ) Dividend income 6(22) ( 9,416 ) ( 282,302 ) ( 181,942 ) Share-based payments 6(29) 1,373 41,176 ( 5,282 ) Share of profit of associates accounted for under
equity method 6(8)
( 4,732 ) ( 141,877 ) ( 943,990 )
Loss (gain) on disposal of property, plant and equipment
6(23) 1,883 56,441
( 274,921 )
Gain on disposal of investments 6(23) ( 200,197 ) ( 6,001,894 ) - Reversal of impairment loss on non-financial assets 6(23) ( 3,009 ) ( 90,215 ) - Changes in assets/liabilities relating to operating
activities
Net changes in assets relating to operating activities Financial assets mandatorily measured at fair
value through profit or loss
9,470 283,898
240,966 Contract assets 27,096 812,339 ( 533,977 ) Notes receivable 9,160 274,603 ( 80,786 ) Accounts receivable 277,066 8,306,424 ( 3,501,951 ) Accounts receivable - related parties 94,511 2,833,432 ( 402,645 ) Other receivables ( 3,890 ) ( 116,634 ) ( 42,452 ) Other receivables - related parties 3,632 108,894 ( 29,208 ) Inventories 188,188 5,641,877 ( 3,476,464 ) Prepayments ( 10,740 ) ( 321,976 ) 580,341 Other current assets ( 11 ) ( 328 ) 240,631 Other non-current assets 4,348 130,389 50,370 Net changes in operating liabilities relating to
operating activities
Contract liabilities 23,645 708,890 949,545 Notes payable 457 13,714 ( 1,837 ) Accounts payable ( 224,254 ) ( 6,723,132 ) 2,307,949 Accounts payable - related parties ( 79,424 ) ( 2,381,143 ) 278,138 Other payables ( 4,269 ) ( 127,974 ) ( 422,895 ) Other current liabilities ( 22,669 ) ( 679,602 ) ( 1,828,485 ) Other non-current liabilities 22,765 682,490 821,714 Cash inflow generated from operations 1,520,698 45,590,519 27,445,414 Interest received 31,427 942,187 781,652 Dividends received 9,416 282,302 714,031 Interest paid ( 24,323 ) ( 729,218 ) ( 536,989 ) Income taxes paid ( 139,260 ) ( 4,175,022 ) ( 4,732,398 )
Net cash flows from operating activities 1,397,958 41,910,768 23,671,710
(Continued)

DELTA ELECTRONICS, INC. AND SUBSIDIARIES
CONSOLIDATED STATEMENTS OF CASH FLOWS YEARS ENDED DECEMBER 31, 2019 AND 2018 (EXPRESSED IN THOUSANDS OF DOLLARS)
The accompanying notes are an integral part of these consolidated financial statements.
~16~
US Dollars New Taiwan Dollars Notes 2019 2019 2018
CASH FLOWS FROM INVESTING ACTIVITIES
Acquisition of financial assets at fair value through other
comprehensive income
( $ 373 )
( $ 11,190 ) ( $ 439,188 )
Disposal of financial assets at fair value through other
comprehensive income
6(3)
37,187
1,114,871 733
Acquisition of investments accounted for under equity
method
( 405 )
( 12,154 ) ( 210,950 )
Net cash flow from acquisition of subsidiaries (net of cash
acquired)
6(30)
( 801,135 )
( 24,018,015 ) -
Acquisition of property, plant and equipment 6(9) ( 562,581 ) ( 16,866,186 ) ( 11,340,871 )
Proceeds from disposal of property, plant and equipment 15,763 472,561 676,924
Acquisition of investment properties -
- ( 15,448 )
Disposal of investment properties -
- 38
Acquisition of intangible assets 6(12) ( 22,247 ) ( 666,967 ) ( 503,457 )
(Increase) decrease in other financial assets ( 1,714 ) ( 51,359 ) 4,820
(Increase) decrease in other non-current assets ( 16,327 ) ( 489,479 ) 151,465
Net cash flows used in investing activities ( 1,351,832 ) ( 40,527,918 ) ( 11,675,934 )
CASH FLOWS FROM FINANCING ACTIVITIES
Increase (decrease) in short-term borrowings 6(32) 43,925 1,316,870 ( 11,204,447 )
Proceeds from long-term debt 6(32) 80,316 2,407,888 14,138,799
Lease principal repayment ( 19,555 ) ( 586,249 ) -
Cash dividends paid 6(19) ( 433,213 ) ( 12,987,717 ) ( 12,987,717 )
Cash dividends paid to minority share interests 6(20) ( 77,391 ) ( 2,320,171 ) ( 369,183 )
Acquisition of ownership interests in subsidiaries 6(20)(31) ( 142,638 ) ( 4,276,338 ) ( 94,355 )
Net cash flows used in financing activities ( 548,556 ) ( 16,445,717 ) ( 10,516,903 )
Effects due to changes in exchange rate ( 19,875 ) ( 595,829 ) 773,207
Net (decrease) increase in cash and cash equivalents ( 522,305 ) ( 15,658,696 ) 2,252,080
Cash and cash equivalents at beginning of year 1,988,616 59,618,697 57,366,617
Cash and cash equivalents at end of year $ 1,466,311 $ 43,960,001 $ 59,618,697
~17~
DELTA ELECTRONICS, INC. AND SUBSIDIARIES
NOTES TO THE CONSOLIDATED FINANCIAL STATEMENTS
YEARS ENDED DECEMBER 31, 2019 AND 2018
(EXPRESSED IN THOUSANDS OF NEW TAIWAN DOLLARS,
EXCEPT AS OTHERWISE INDICATED)
1. HISTORY AND ORGANISATION
Delta Electronics, Inc. (the Company) was incorporated as a company limited by shares under the
provisions of the Company Law of the Republic of China (R.O.C.). The Company and its subsidiaries
(collectively referred herein as the Group) are global leaders in power and thermal management solutions
and are primarily engaged in the research and development, design, manufacturing and sale of electronic
control systems, DC brushless fans, thermal system, and miniaturization key component, industrial
automation products, digital display products, communication products, consumer electronics products,
energy-saving lighting application, renewable energy applications, EV charging, energy technology
services and consulting services of building management and control solutions, etc. The Group’s mission
statement, to provide innovative, clean and energy-efficient solutions for a better tomorrow, focuses on
addressing key environmental issues such as global climate change. With the concern for the environment,
the Group continues to develop innovative energy-efficient products and solutions. In recent years, the
Group has transformed from a product provider towards a solution provider and the Group’s business is
segregated into power electronics business, automation business, and infrastructure business.
2. THE DATE OF AUTHORISATION FOR ISSUANCE OF THE CONSOLIDATED FINANCIAL
STATEMENTS AND PROCEDURES FOR AUTHORISATION
These consolidated financial statements were authorised for issuance by the Board of Directors on March
10, 2020.
3. APPLICATION OF NEW STANDARDS, AMENDMENTS AND INTERPRETATIONS
(1) Effect of the adoption of new issuances of or amendments to International Financial Reporting
Standards (“IFRS”) as endorsed by the Financial Supervisory Commission (“FSC”)
New standards, interpretations and amendments endorsed by the FSC effective from 2019 are as
follows:
Except for the following, the above standards and interpretations have no significant impact to the
New Standards, Interpretations and Amendments
Effective date by
International Accounting
Standards Board
Amendments to IFRS 9, ‘Prepayment features with negative
compensation’
January 1, 2019
IFRS 16, ‘Leases’ January 1, 2019
Amendments to IAS 19, ‘Plan amendment, curtailment or settlement’ January 1, 2019
Amendments to IAS 28, ‘Long-term interests in associates and joint
ventures’
January 1, 2019
IFRIC 23, ‘Uncertainty over income tax treatments’ January 1, 2019
Annual improvements to IFRSs 2015-2017 cycle January 1, 2019
~18~
Group’s financial condition and financial performance based on the Group’s assessment.
IFRS 16, ‘Leases’
A. IFRS 16, ‘Leases’, replaces IAS 17, ‘Leases’ and related interpretations and SICs. The standard
requires lessees to recognise a ‘right-of-use asset’ and a ‘lease liability’ (except for those leases
with terms of 12 months or less and leases of low-value assets). The accounting stays the same for
lessors, which is to classify their leases as either finance leases or operating leases and account for
those two types of leases differently. IFRS 16 only requires enhanced disclosures to be provided
by lessors.
B. The Group has elected to apply IFRS 16 by not restating the comparative information (referred
herein as the ‘modified retrospective approach’) when applying “IFRSs” effective in 2019 as
endorsed by the FSC. Accordingly, the Group increased ‘right-of-use asset’, ‘lease liability’ and
‘retained earnings’ by $2,749,997, $1,695,257 and $1,943, respectively, and decreased other non-
current assets by $1,052,797 with respect to the lease contracts of lessees on January 1, 2019.
C. The Group has used the following practical expedients permitted by the standard at the date of
initial application of IFRS 16:
(a) Reassessment as to whether a contract is, or contains, a lease is not required, instead, the
application of IFRS 16 depends on whether or not the contracts were previously identified as
leases applying IAS 17 and IFRIC 4.
(b) The use of a single discount rate to a portfolio of leases with reasonably similar characteristics.
(c) The use of hindsight in determining the lease term where the contract contains options to
extend the lease.
D. The Group calculated the present value of lease liabilities by using the weighted average
incremental borrowing interest rate of 1.19%.
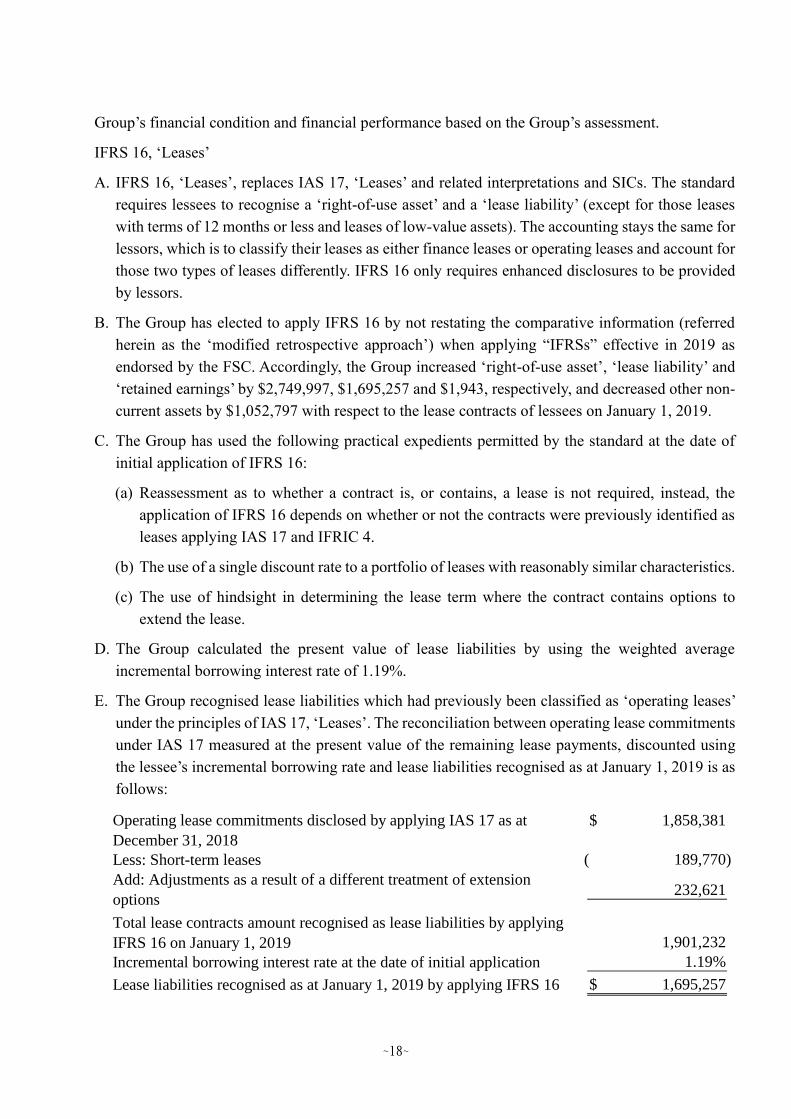
E. The Group recognised lease liabilities which had previously been classified as ‘operating leases’
under the principles of IAS 17, ‘Leases’. The reconciliation between operating lease commitments
under IAS 17 measured at the present value of the remaining lease payments, discounted using
the lessee’s incremental borrowing rate and lease liabilities recognised as at January 1, 2019 is as
follows:
Operating lease commitments disclosed by applying IAS 17 as at
December 31, 2018
1,858,381$
Less: Short-term leases 189,770)(
Add: Adjustments as a result of a different treatment of extension
options232,621
Total lease contracts amount recognised as lease liabilities by applying
IFRS 16 on January 1, 2019 1,901,232
Incremental borrowing interest rate at the date of initial application 1.19%
Lease liabilities recognised as at January 1, 2019 by applying IFRS 16 1,695,257$

~19~
(2) Effect of new issuances of or amendments to IFRSs as endorsed by the FSC but not yet adopted by
the Group
New standards, interpretations and amendments endorsed by the FSC effective from 2020 are as
follows:
The above standards and interpretations have no significant impact to the Group’s financial condition
and financial performance based on the Group’s assessment.
(3) Effect of IFRSs issued by IASB but not yet endorsed by the FSC
New standards, interpretations and amendments issued by IASB but not yet included in the IFRSs as
endorsed by the FSC are as follows:
The above standards and interpretations have no significant impact to the Group’s financial condition
and financial performance based on the Group’s assessment.
4. SUMMARY OF SIGNIFICANT ACCOUNTING POLICIES
The principal accounting policies applied in the preparation of these consolidated financial statements
are set out below. These policies have been consistently applied to all the periods presented, unless
otherwise stated.
(1) Compliance statement
The consolidated financial statements of the Group have been prepared in accordance with the
“Regulations Governing the Preparation of Financial Reports by Securities Issuers”, International
Financial Reporting Standards, International Accounting Standards, IFRIC Interpretations, and SIC
Interpretations as endorsed by the FSC (collectively referred herein as the “IFRSs”).
New Standards, Interpretations and Amendments
Effective date by
International Accounting
Standards Board
Amendments to IAS 1 and IAS 8, ‘Disclosure Initiative-Definition of
Material’
January 1, 2020
Amendments to IFRS 3, ‘Definition of a business’ January 1, 2020
Amendments to IFRS 9, IAS 39 and IFRS 7, ‘Interest rate benchmark
reform’
January 1, 2020
New Standards, Interpretations and Amendments
Effective date by
International Accounting
Standards Board
Amendments to IFRS 10 and IAS 28, ‘Sale or contribution of assets
between an investor and its associate or joint venture’
To be determined by
International Accounting
Standards Board
IFRS 17, ‘Insurance contracts’ January 1, 2021
Amendments to IAS 1, ‘Classification of liabilities as current or
noncurrent’
January 1, 2022

~20~
(2) Basis of preparation
A. Except for the following items, the consolidated financial statements have been prepared under
the historical cost convention:
(a) Financial assets and financial liabilities (including derivative instruments) at fair value through
profit or loss.
(b) Financial assets at fair value through other comprehensive income.
(c) Defined benefit liabilities recognised based on the net amount of pension fund assets less
present value of defined benefit obligation.
B. The preparation of financial statements in conformity with IFRSs requires the use of certain
critical accounting estimates. It also requires management to exercise its judgment in the process
of applying the Group’s accounting policies. The areas involving a higher degree of judgment or
complexity, or areas where assumptions and estimates are significant to the consolidated financial
statements are disclosed in Note 5.
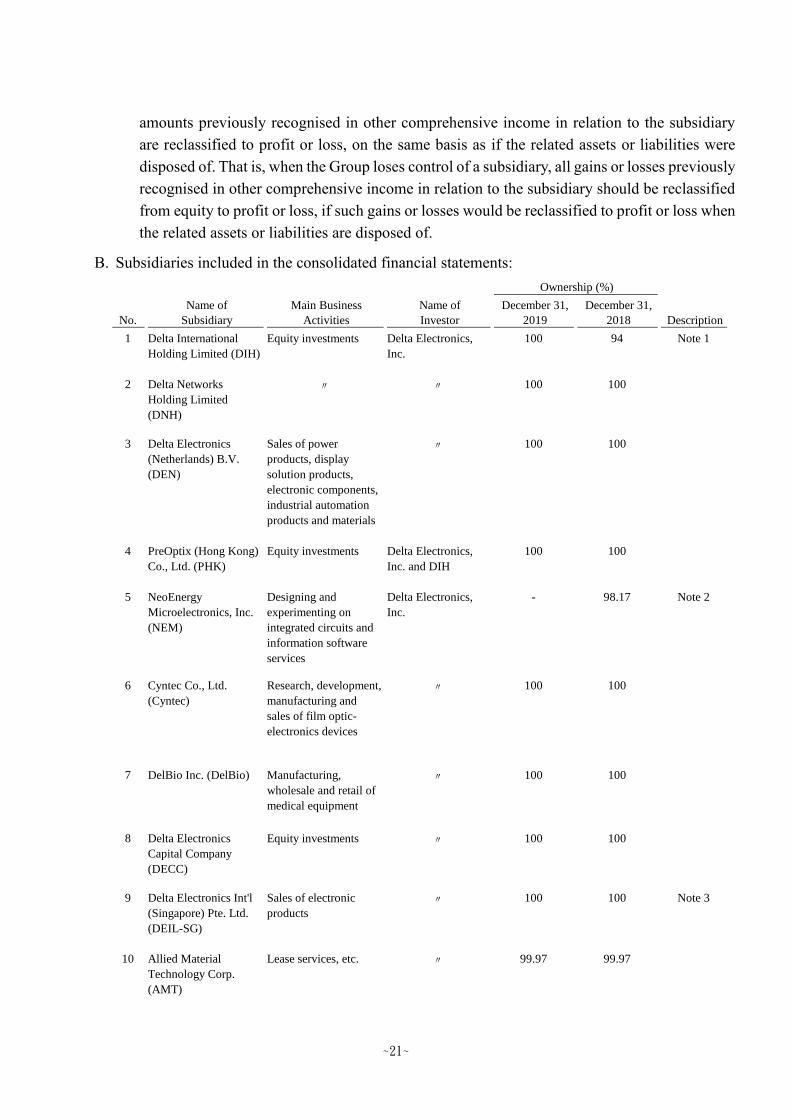
(3) Basis of consolidation
A. Basis for preparation of consolidated financial statements:
(a) All subsidiaries are included in the Group’s consolidated financial statements. Subsidiaries are
all entities (including structured entities) controlled by the Group. The Group controls an entity
when the Group is exposed, or has rights, to variable returns from its involvement with the
entity and has the ability to affect those returns through its power over the entity. Consolidation
of subsidiaries begins from the date the Group obtains control of the subsidiaries and ceases
when the Group loses control of the subsidiaries.
(b) Inter-company transactions, balances and unrealised gains or losses on transactions between
companies within the Group are eliminated. Accounting policies of subsidiaries are consistent
with the policies adopted by the Group.
(c) Profit or loss and each component of other comprehensive income are attributed to the owners
of the parent and to the non-controlling interests. Total comprehensive income is attributed to
the owners of the parent and to the non-controlling interests even if this results in the non-
controlling interests having a deficit balance.
(d) Changes in a parent’s ownership interest in a subsidiary that do not result in the parent losing
control of the subsidiary (transactions with non-controlling interests) are accounted for as
equity transactions, i.e. transactions with owners in their capacity as owners. Any difference
between the amount by which the non-controlling interests are adjusted and the fair value of
the consideration paid or received is recognised directly in equity.
(e) When the Group loses control of a subsidiary, the Group remeasures any investment retained
in the former subsidiary at its fair value. That fair value is regarded as the fair value on initial
recognition of a financial asset or the cost on initial recognition of the associate or joint venture.
Any difference between fair value and carrying amount is recognised in profit or loss. All
~21~
amounts previously recognised in other comprehensive income in relation to the subsidiary
are reclassified to profit or loss, on the same basis as if the related assets or liabilities were
disposed of. That is, when the Group loses control of a subsidiary, all gains or losses previously
recognised in other comprehensive income in relation to the subsidiary should be reclassified
from equity to profit or loss, if such gains or losses would be reclassified to profit or loss when
the related assets or liabilities are disposed of.
B. Subsidiaries included in the consolidated financial statements:
Name of Main Business Name of December 31, December 31,
No. Subsidiary Activities Investor 2019 2018 Description
1 Delta International
Holding Limited (DIH)
Equity investments Delta Electronics,
Inc.
100 94 Note 1
2 Delta Networks
Holding Limited
(DNH)
〃 〃 100 100
3 Delta Electronics
(Netherlands) B.V.
(DEN)
Sales of power
products, display
solution products,
electronic components,
industrial automation
products and materials
〃 100 100
4 PreOptix (Hong Kong)
Co., Ltd. (PHK)
Equity investments Delta Electronics,
Inc. and DIH
100 100
5 NeoEnergy
Microelectronics, Inc.
(NEM)
Designing and
experimenting on
integrated circuits and
information software
services
Delta Electronics,
Inc.
- 98.17 Note 2
6 Cyntec Co., Ltd.
(Cyntec)
Research, development,
manufacturing and
sales of film optic-
electronics devices
〃 100 100
7 DelBio Inc. (DelBio) Manufacturing,
wholesale and retail of
medical equipment
〃 100 100
8 Delta Electronics
Capital Company
(DECC)
Equity investments 〃 100 100
9 Delta Electronics Int'l
(Singapore) Pte. Ltd.
(DEIL-SG)
Sales of electronic
products
〃 100 100 Note 3
10 Allied Material
Technology Corp.
(AMT)
Lease services, etc. 〃 99.97 99.97
Ownership (%)

~22~
Name of Main Business Name of December 31, December 31,
No. Subsidiary Activities Investor 2019 2018 Description
11 Delta America Ltd.
(DAL)
Equity investments Delta Electronics,
Inc., DEN, Castle
Horizon Limited and
Energy Dragon
Global Limited
100 100
12 Delta Electronics
(H.K.) Ltd. (DHK)
Equity investments,
operations management
and engineering
services
DEN/DIH 100 100 Note 4
13 DEI Logistics (USA)
Corp. (ALI)
Warehousing and
logistics services
DIH 100 100
14 Delta Electronics
(Japan), Inc. (DEJ)
Sales of power
products, display
solution products,
electronic components,
industrial automation
products and materials
〃 100 100
15 DAC Holding
(Cayman) Limited
(DAC)
Equity investments 〃 - 100 Note 5
16 Ace Pillar
Holding Co., Ltd.
(Ace)
〃 〃 - 100 Note 2
17 Drake Investment (HK)
Limited (Drake-HK)
〃 DEN/DIH 100 100 Note 4
18 Delta Greentech
(China) Co., Ltd.
(DGC)
Sales of uninterruptible
power systems
DGSG、Drake-
HK、Boom/ DIH、
Ace、Drake-HK、
DGSG、Boom
95.91 95.91 Note 6
19 Vivitek Corporation
(Vivitek)
Sales of projector
products and their
materials
DIH 100 100
20 Delta Greentech SGP
Pte. Ltd. (DGSG)
Equity investments DEN/DIH 100 100 Note 4
21 Delta Electronics
Europe Limited (DEU)
Repair centre and
providing support
services
DIH 100 100
22 Boom Treasure Limited
(Boom)
Equity investments DEN/DIH 100 100 Note 4
23 Apex Investment (HK)
Limited (Apex-HK)
〃 DIH 100 100 Note 26
Ownership (%)

~23~
Name of Main Business Name of December 31, December 31,
No. Subsidiary Activities Investor 2019 2018 Description
24 Galaxy Star Investment
(HK) Limited
(Galaxy Star-HK)
Equity investments DIH 100 100 Note 26
25 Jade Investment (HK)
Limited
(Jade-HK)
〃 〃 100 100 Note 26
26 Delta Electronics
(Dongguan) Co., Ltd.
(DDG)
Manufacturing and
sales of transformer and
thermal products
DHK 100 100
27 Delta Electronics
Power (Dongguan) Co.,
Ltd. (DEP)
Manufacturing and
sales of power supplies
〃 100 100
28 Delta Electronics
(Shanghai) Co., Ltd.
(DPEC)
Product design,
management consulting
service and distribution
of electronic products
〃 100 100
29 Delta Electronics
(Jiangsu) Ltd. (DWJ)
Manufacturing and
sales of power supplies
and transformers
DHK/DHK, Apex-
HK, Galaxy Star-HK
and Jade-HK
100 100 Note 7
30 Delta Electronics
Components (Wujiang)
Ltd. (DWC)
Manufacturing and
sales of new-type
electronic components,
variable-frequency
drive and others
〃 100 100 Note 7
31 Delta Video Display
System (Wujiang) Ltd.
(DWV)
Manufacturing and
sales of various
projectors
〃 100 100 Note 7
32 Delta Electronics
(Wuhu) Co., Ltd.
(DWH)
Manufacturing and
sales of LED light
source, power supplies
and others
DHK 100 100
33 Delta Electronics
(Chenzhou) Co., Ltd.
(DCZ)
Manufacturing and
sales of transformers
〃 100 100
34 Delta Electronics
International Mexico
S.A. DE C.V. (DEIL-
MX)
Sales of power
management system of
industrial automation
product and
telecommunications
equipment
〃 100 100
35 Delta Electronics
(Wujiang) Trading Co.,
Ltd. (DWT)
Installation, consulting
and trading of
electronic products
〃 - 100 Note 8
Ownership (%)
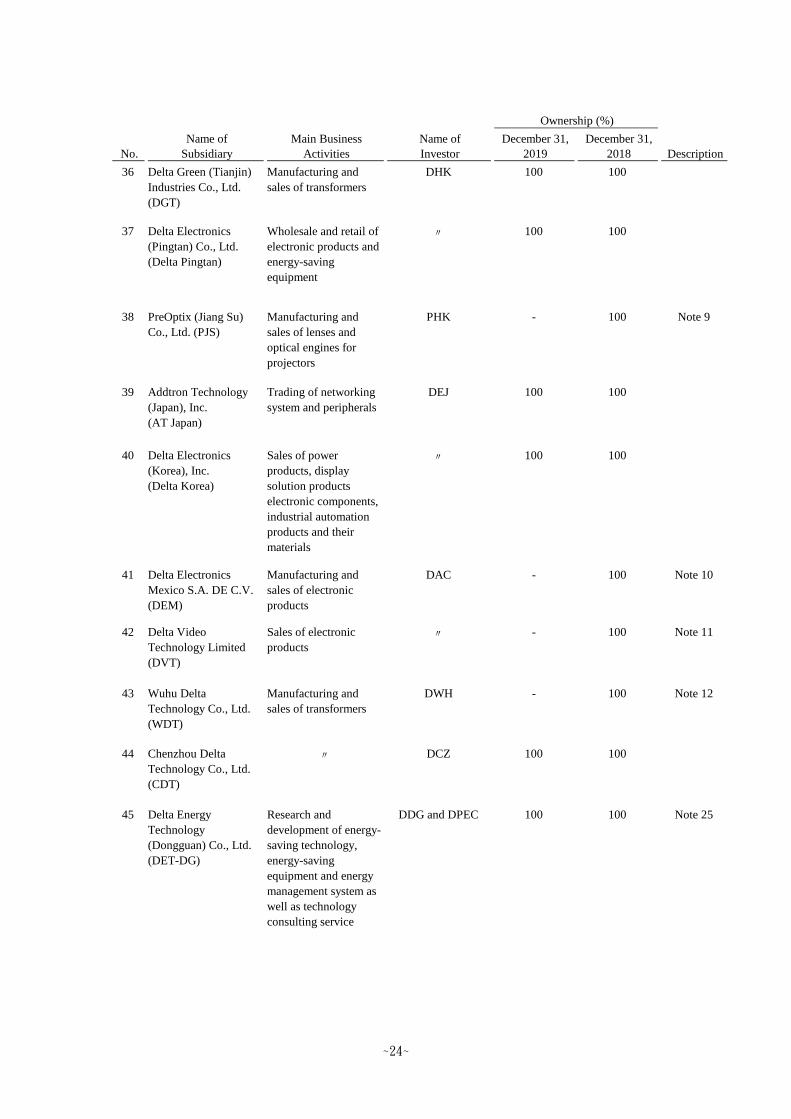
~24~
Name of Main Business Name of December 31, December 31,
No. Subsidiary Activities Investor 2019 2018 Description
36 Delta Green (Tianjin)
Industries Co., Ltd.
(DGT)
Manufacturing and
sales of transformers
DHK 100 100
37 Delta Electronics
(Pingtan) Co., Ltd.
(Delta Pingtan)
Wholesale and retail of
electronic products and
energy-saving
equipment
〃 100 100
38 PreOptix (Jiang Su)
Co., Ltd. (PJS)
Manufacturing and
sales of lenses and
optical engines for
projectors
PHK - 100 Note 9
39 Addtron Technology
(Japan), Inc.
(AT Japan)
Trading of networking
system and peripherals
DEJ 100 100
40 Delta Electronics
(Korea), Inc.
(Delta Korea)
Sales of power
products, display
solution products
electronic components,
industrial automation
products and their
materials
〃 100 100
41 Delta Electronics
Mexico S.A. DE C.V.
(DEM)
Manufacturing and
sales of electronic
products
DAC - 100 Note 10
42 Delta Video
Technology Limited
(DVT)
Sales of electronic
products
〃 - 100 Note 11
43 Wuhu Delta
Technology Co., Ltd.
(WDT)
Manufacturing and
sales of transformers
DWH - 100 Note 12
44 Chenzhou Delta
Technology Co., Ltd.
(CDT)
〃 DCZ 100 100
45 Delta Energy
Technology
(Dongguan) Co., Ltd.
(DET-DG)
Research and
development of energy-
saving technology,
energy-saving
equipment and energy
management system as
well as technology
consulting service
DDG and DPEC 100 100 Note 25
Ownership (%)

~25~
Name of Main Business Name of December 31, December 31,
No. Subsidiary Activities Investor 2019 2018 Description
46 Delta Energy
Technology (Shanghai)
Co., Ltd. (DET-SH)
Energy performance
contracting,
development of energy-
saving technology,
energy-saving
equipment and energy
management system as
well as consulting
service, installation,
sales, etc.
DPEC and DGC 100 100
47 Delta Networks, Inc.
(DNI Cayman)
Equity investments DNH 100 100
48 Delta Networks, Inc.
(Taiwan) (DNIT)
Research, development,
design, manufacturing
and sales of networking
system and peripherals
Delta Electronics,
Inc.
- 99.98 Note 13
49 DNI Logistics (USA)
Corporation (ALN)
Trading of networking
system and peripherals
DNI Cayman - 100 Note 14
50 Delta Networks (H.K.)
Limited (DNHK)
Equity investments 〃 100 100
51 Delta Networks
(Dongguan) Ltd. (DII)
Manufacturing and
sales of other radio-
broadcast receivers and
the equipment in
relation to broadband
access networking
system
DNHK 100 100
52 Fairview Assets Ltd.
(Fairview)
Equity investments Cyntec 100 100
53 Grandview Holding
Ltd. (Grandview)
〃 Fairview 100 100
54 Cyntec Holding (H.K.)
Ltd. (CHK)
〃 Grandview 100 100
55 Cyntec International
Ltd. -Labuan
(CIL-Labuan)
Trading 〃 100 100
56 Cyntec Electronics
(Suzhou) Co., Ltd.
(CES)
Research, development,
manufacturing and
sales of new-type
electronic components
(chip components,
sensing elements,
hybrid integrated
circuits) and wholesale
of similar products
CHK 100 100
Ownership (%)

~26~
Name of Main Business Name of December 31, December 31,
No. Subsidiary Activities Investor 2019 2018 Description
57 DelBio (Wujiang) Co.,
Ltd.
Manufacturing,
wholesale and retail of
medical equipment
DelBio 100 100
58 ELTEK AS Research, development
and sales of power
supplies and others
DIH/DEN 100 100 Note 4
59 Castle Horizon Limited Equity investments DEN 100 100
60 Energy Dragon Global
Limited
〃 〃 100 100
61 Delta Controls Inc.
(DCI)
Provide resolution of
building management
and control
DIH/DEN 100 100 Note 4
62 DELTA
ELECTRONICS
HOLDING (USA)
INC.
Equity investments 〃 100 100 Note 4
63 ELTEK PAKISTAN
(PRIVATE) LIMITED
Sales of power supplies
and others
ELTEK AS 100 100
64 Eltek Deutschland
GmbH
Sales of power supplies
and others and system
installation
〃 100 100
65 ELTEK AUSTRALIA
PTY LIMITED
〃 〃 100 100
66 Eltek Egypt for Power
Supply S.A.E.
Sales of power supplies
and others
〃 95 95
67 Eltek SGS Pvt Ltd. Sales of power supplies
and others and system
installation
〃 100 100
68 Eltek SGS Mechanics
Pvt Ltd.
Sales of power supplies
and others
ELTEK AS and
Eltek SGS Pvt Ltd.
51 51
69 ELTEK POWER PTE.
LTD.
Sales of power supplies
and others and system
installation
DELI-SG/ELTEK-
AS
- 100 Note 3
70 Eltek Polska Sp.
z o. o.
〃 ELTEK AS 51.04 51.04
Ownership (%)

~27~
Name of Main Business Name of December 31, December 31,
No. Subsidiary Activities Investor 2019 2018 Description
71 ELTEK POWER
FRANCE SAS
Sales of power supplies
and others and system
installation
ELTEK AS 100 100
72 ELTEK LIMITED Equity investments and
trading
〃 100 100
73 ELTEK MEA DMCC Sales of power supplies
and others
〃 100 100
74 ELTEK KENYA
LIMITED
Sales of power supplies ELTEK MEA
DMCC and ELTEK
AS
100 100
75 ELTEK WEST
AFRICA LIMITED
〃 〃 100 100
76 Eltek Italia S.r.l. Sales of power supplies
and others
ELTEK AS 100 100
77 Eltek Power Sweden
AB
Sales of power supplies
and equity investments
〃 100 100
78 Eltek Power (UK) Ltd. Sales of power supplies 〃 100 100
79 Eltek Power Oy Sales of power supplies
and others
〃 100 100
80 OOO Eltek Sales of power supplies
and others and system
installation
〃 100 100
81 ELTEK ENERJI
SISTEMLERI
LIMITED SIRKETI
Sales of power supplies
and others
〃 100 100
82 Eltek Montage GmbH Installation and
maintenance of power
supplies
Eltek Deutschland
GmbH
100 100
83 E.V.I Electronics Sp. z
o. o.
Trading and
construction of power
supply model
〃 - 100 Note 15
84 ELTEK POWER
INCORPORATED
Sales of power supplies
and others
DEIL-SG/ELTEK
POWER PTE. LTD.
100 100 Note 16
85 ELTEK POWER CO.,
LTD.
〃 〃 100 100 Note 16
Note 17
86 ELTEK POWER
(CAMBODIA) LTD.
〃 〃 100 100 Note 16
Ownership (%)

~28~
Name of Main Business Name of December 31, December 31,
No. Subsidiary Activities Investor 2019 2018 Description
87 ELTEK POWER
(MALAYSIA) SDN.
BHD.
Sales of power supplies
and others
DEIL-SG/ELTEK
POWER PTE. LTD.
100 100 Note 16
Note 18
88 ELTEK CVI LIMITED Equity investments ELTEK LIMITED 100 100
89 Eltek Energy
Technology
(Dongguan)
Ltd.
Development,
manufacturing and
sales of intelligent
power equipment and
system for supporting
access networking
system, and
manufacturing and
sales of intelligent
power equipment for
supporting renewable
energy
DHK/ELTEK CVI
LIMITED
100 100 Note 19
90 DELTA
ELECTRONICS
(USA) INC.
Manufacturing and
sales of power supplies
DELTA
ELECTRONICS
HOLDING (USA)
INC.
100 100
91 DELTA
ELECTRONICS
(ARGENTINA) S.R.L.
Sales of power supplies
and others
DELTA
ELECTRONICS
(USA) INC.
100 100
92 Eltek Sistemas de
Energia Industria e
Commercio S.A.
Manufacturing and
sales of power supplies
〃 100 100
93 DELTA
ELECTRONICS
(PERU) INC. S.R.L.
Sales of power supplies
and others
〃 100 100
94 DELTA
ELECTRONICS
(COLOMBIA) S.A.S.
〃 〃 100 100
95 Eltekenergy Services,
S.A. de C.V.
〃 DELTA
ELECTRONICS
(USA) INC. and
DELTA
ELECTRONICS
HOLDING (USA)
INC.
100 100
96 Eltekenergy
International de
México, S. de R.L.
de C.V.
〃 〃 100 100
Ownership (%)

~29~
Name of Main Business Name of December 31, December 31,
No. Subsidiary Activities Investor 2019 2018 Description
97 Delta Electronics
(Americas) Ltd.
Sales of electronic
components
DAL 100 100
98 Delta Solar Solutions
LLC
Equity investments 〃 100 100
99 2009 PPA LLC Sales of power supplies Delta Electronics
(Americas) Ltd.
100 100
100 DSS-CI LLC Rental of solar power
systems
Delta Solar Solution
LLC
100 100
101 DSS-USF LLC 〃 〃 100 100
102 Power Forest
Technology
Corporation
IC design of power
management
Cyntec 59.03 59.03
103 Delta Energy
Technology Puhuan
(Shanghai) Co., Ltd.
Energy technology,
development and
consulting of
environmental technical
skills,
and design and sales of
energy saving
equipment
DET-SH 100 100
104 Loy Tec electronics
GmbH (Loy Tec)
Consulting service of
building management
and control solutions
DEIL-SG 100 85 Note 20
105 LOYTEC Americas,
Inc.
〃 Loy Tec 100 100
106 Delta Electronics
(Beijing) Co., Ltd.
Installation of
mechanic, electronic,
telecommunication and
circuit equipment
DHK 100 100
107 Delta Electronics
(Xi'an) Co., Ltd.
Sales of computer,
peripheral and software
〃 100 100
108 Beijing Industrial
Foresight Technology
Co., Ltd.
Computer system
services and data
process
Delta Electronics
(Beijing) Co., Ltd.
- 80 Note 21
109 UNICOM SYSTEM
ENG. CORP.
(UNICOM)
Design and sales of
computer, peripheral
and information system
(software and
hardware)
Delta Electronics,
Inc.
100 100
110 Unicom (Nanjing)
System Eng. Corp
〃 UNICOM 100 100
Ownership (%)

~30~
Name of Main Business Name of December 31, December 31,
No. Subsidiary Activities Investor 2019 2018 Description
111 Delta Electronics
(Switzerland) AG
(DES)
Equity investments,
research, development
and sales of electronic
products
Delta Greentech
(Netherlands) B.V.
and DIH/DEN and
Delta Greentech
(Netherlands) B.V.
100 51 Note 4
Note 22
112 Delta Greentech
Electronics Industry
LLC
Marketing and sales of
electronic products
DEN、Delta
Greentech
(Netherlands) B.V.
100 51 Note 22
113 Delta Greentech
(Brasil) S.A. (DGB)
Manufacturing and
sales of electronic
products
DEN 100 100
114 Delta Electronics
(Czech Republic), spol.
s.r.o.
Sales of electronic
products
DES 100 100
115 Delta Electronics
(Italy) S.r.l.
″ ″ 100 100
116 Delta Electronics
(Poland) Sp. z o. o.
″ ″ 100 100
117 Delta Solutions
(Finland) Oy
″ ″ 100 100
118 Delta Electronics
Solutions (Spain) SL
″ ″ 100 100
119 Delta Electronics
(France) SA
″ ″ 100 100
120 Delta Energy Systems
(Sweden) AB
″ ″ 100 100
121 Vivotek Inc.
(Vivotek)
Manufacturing and
sales of video
compression software
and encoding, network
video server, webcam
and its related
components
Delta Electronics,
Inc.
49.87 50.13 Note 23
122 Vatics Inc. Designing and sales of
multimedia integrated
circuits
Vivotek and
Realwin
54.41 54.41
123 Vivotek Holdings, Inc. Holding company Vivotek 100 100
124 Realwin Investment
Inc.
(Realwin)
Investment in the
network
communications
industry
″ 100 100
Ownership (%)

~31~
Name of Main Business Name of December 31, December 31,
No. Subsidiary Activities Investor 2019 2018 Description
125 Vivotek Netherlands
B.V.
Sales service Vivotek 100 100
126 Vivotek (Japan)
Inc.
〃 〃 100 100
127 Vivotek USA, Inc. Sales of webcams and
related components
Vivotek Holdings,
Inc.
100 100
128 Wellstates Investment,
LLC
Investment and
commercial lease of real
estate
Realwin 100 100
129 Otus Imaging, Inc. Sales of webcams and
related components
Vivotek 100 100
130 Aetek Inc. 〃 Realwin 56.21 56.21
131 Vivotek Middle East
FZCO
〃 〃 89.99 89.99
132 Lidlight Inc. Sales of lighting
equipment
〃 51 51
133 DELTA
ELECTRONICS
BRASIL LTDA.
Manufacturing and sales
of electronic products
DEN 100 100
134 Delta Electronics
(Thailand) Public
Company Limited
(DET)
Manufacturing and
exporting power
supplies, other
electronic parts and
components
Delta Electronics,
Inc., DEIL-SG and
DIH
63.78 - Note 24
135 DET International
Holding Limited
Equity investments DET 100 - Note 24
136 Delta Energy Systems
(Singapore) PTE. LTD.
Equity investments,
trading, management
and consultancy
〃 100 - Note 24
137 Delta Green Industrial
(Thailand) Co., Ltd.
Integration, sales,
trading, installation and
providing services of
uninterruptible power
supply, photovoltaic
inverter, electric cars
changer and data center
〃 100 - Note 24
138 DET Logistics (USA)
Corporation
Providing logistics
services in USA
DET International
Holding Limited
100 - Note 24
139 Delta Energy Systems
(Germany) GmbH
Development, marketing
and sales of electronic
products
〃 100 - Note 24
Ownership (%)

~32~
Name of Main Business Name of December 31, December 31,
No. Subsidiary Activities Investor 2019 2018 Description
140 Delta Energy Systems
(India) Private Ltd.
Marketing and sales of
electronic products
DET International
Holding Limited
100 - Note 24
141 Delta Electronics
(Slovakia) s.r.o.
Manufacturing and
sales of power supplies,
power system and OEM
power system
DET International
Holding Limited
and Delta
Energy Systems
(Singapore) PTE.
LTD.
100 - Note 24
142 Delta Energy Systems
(Romania) S.R.L.
Research and
development
DET International
Holding Limited
100 - Note 24
143 Delta Energy Systems
Property (Germany)
GmbH
Property rights
business
Delta Energy
Systems (Germany)
GmbH
100 - Note 24
144 Delta Electronics
(Australia) Pty. Ltd.
Marketing and sales of
renewable energy
products
Delta Energy
Systems (Singapore)
PTE. LTD.
100 - Note 24
145 Delta Electronics India
Pvt. Ltd.
Manufacturing and
marketing of non-
telecom power system
and uninterruptible
power supply, and sales
of uninterruptible
power supply
〃 100 - Note 24
146 Delta Electronics
(Myanmar) Co., Ltd.
Manufacturing of
electronic products
used in CMP
manufacturing process
and machinery
〃 100 - Note 24
147 Delta Energy Systems
(UK) Ltd.
Research and
development of
electronic products
〃 100 - Note 24
148 Delta PBA Engineering
Solutions Co., Ltd.
Providing solution for
industrial automation
〃 51 - Note 24
149 Delta Greentech
(Netherlands)
Cooperatie U.A.
Equity investments 〃 100 - Note 24
150 Delta Greentech
(Netherlands) B.V.
〃 Delta Greentech
(Netherlands)
Cooperatie U.A.
100 - Note 24
151 Delta Energy Systems
LLC
Marketing and sales of
power systems
Delta Greentech
(Netherlands) B.V.
100 - Note 24
152 Eltek s.r.o. Manufacturing of
telecom power system
〃 100 - Note 24
Ownership (%)

~33~
Note 1: In December 2019, DIH repurchased and cancelled 6% of its own equity interest from
non-controlling interest, and the Company held 100% equity interest of DIH after the
cancellation.
Note 2: This company had been liquidated in October 2019.
Note 3: In March 2019, ELTEK AS sold ELTEK POWER PTE. LTD. to DEIL-SG, and ELTEK
POWER PTE. LTD. merged into DEIL-SG in May 2019. Under the merger, DEIL-SG
was the surviving company while ELTEK POWER PTE. LTD. was the dissolved
company.
Note 4: In November 2019, due to the reorganisation of the Group, DEN exchanged 100%
equity interests of its subsidiaries, ELTEK AS, DCI, and DELTA ELECTRONICS
HOLDING (USA) INC. and a 51% equity interest of its subsidiary, DES, for 100%
equity interests of the DIH’ subsidiaries, DHK, Drake-HK, DGSG and BOOM.
Note 5: This company had been liquidated in November 2019.
Note 6: In July 2019, Drake-HK acquired 10.38% and 3.81% equity interest of DGC held by
DIH and Ace, respectively.
Note 7: In July 2019, DHK acquired 15% equity interest of DWV, DWC and DWJ held by Apex-
HK, Galaxy Star-HK and Jade-HK, respectively.
Note 8: This company had been liquidated in April 2019.
Note 9: In October 2019, PHK sold a 100% equity interest of its subsidiary, PJS.
Note 10: This company had been liquidated in March 2019.
Note 11: This company had been liquidated in August 2019.
Name of Main Business Name of December 31, December 31,
No. Subsidiary Activities Investor 2019 2018 Description
153 Delta Electronics
(Automotive) Americas
Inc.
Research and
development of
automotive power and
traction inverter
Delta Greentech
(Netherlands) B.V.
100 - Note 24
154 Amerlux, LLC Design and producing
of dedicated lighting
system and facilities
DEN 100 - Note 24
155 Amerlux Lighting Asia,
LLC
Equity investments Amerlux, LLC 100 - Note 24
156 Amerlux Lighting
Hong Kong Limited
〃 Amerlux Lighting
Asia, LLC
100 - Note 24
157 Guangzhou Amerlux
Lighting Co., Ltd.
Wholesale of lighting
fixture and decorative
objects
Amerlux Lighting
Hong Kong Limited
100 - Note 24
Ownership (%)

~34~
Note 12: This company had been liquidated in December 2019.
Note 13: Merged with the Company on April 1, 2019.
Note 14: In August 2019, DNI Cayman sold this company to DIH, and this company merged into
its subsidiary-ALI. Under the merger, ALI was the surviving company while ALN was
the dissolved company.
Note 15: This company had been liquidated in September 2019.
Note 16: Relative to the merger described in Note 3, the investee was changed from ELTEK
POWER PTE. LTD. to DEIL-SG.
Note 17: 55% of shares are held through others due to local regulations.
Note 18: 71% of shares are held through others due to local regulations.
Note 19: In July 2019, this company was sold to DHK by ELTEK CVI LIMITED.
Note 20: In May 2019, DEIL-SG acquired a 15% equity interest in Loy Tec electronics GmbH,
and the total shareholding ratio is 100%.
Note 21: This company had been liquidated in July 2019.
Note 22: The Group obtained control over Delta Electronics (Thailand) Public Company Limited
through merger. The Group holds a 100% equity interest in Delta Electronics
(Switzerland) AG and Delta Greentech Electronics Industry LLC through the Delta
Electronics (Thailand) Public Company Limited 100% held subsidiary, Delta Greentech
(Netherlands) B.V.
Note 23: Because most of the shares were held by the company and other shareholdings are
disaggregated, it was included in the consolidated financial statements.
Note 24: Companies were established or acquired through merger during 2019.
Note 25: In September 2019, the company began liquidation process and was dissolved, but has
not yet been completed as at December 31, 2019.
Note 26: In December 2019, the company began liquidation process and was dissolved, but has
not yet been completed as at December 31, 2019.
C. Subsidiaries not included in the consolidated financial statements: None.
D. Adjustments for subsidiaries with different balance sheet dates: None.
E. Significant restrictions: None.
F. Subsidiaries that have non-controlling interests that are material to the Group:
As at December 31, 2019 and 2018, the non-controlling interest amounted to $34,197,565,
$9,189,749, respectively. The information on non-controlling interest and respective subsidiary is
as follows:

~35~
Summarised financial information of the subsidiary:
Balance sheet
Principal place Ownership Ownership
Name of subsidiary of business Amount (%) Amount (%)
Delta International
Holding Ltd. (DIH)
Cayman Islands $ - - $ 4,216,092 6.00%
Vivotek Inc.
(Vivotek)
Taiwan 3,932,420 50.13% 3,975,977 49.87%
Delta Electronics
(Thailand) Public
Company limited
(DET)
Thailand 29,761,580 36.22% - -
Non-controlling interest
December 31, 2019 December 31, 2018
DET DIH
December 31, 2019 December 31, 2018
Current assets 32,696,207$ 87,627,784$
Non-current assets 62,551,578 34,384,761
Current liabilities 10,944,593)( 46,922,159)(
Non-current liabilities 2,134,279)( 2,693,084)(
Total net assets 82,168,913$ 72,397,302$
December 31, 2019 December 31, 2018
Current assets 3,106,290$ 3,003,380$
Non-current assets 6,452,452 6,575,800
Current liabilities 1,307,013)( 1,207,012)(
Non-current liabilities 407,284)( 399,485)(
Total net assets 7,844,445$ 7,972,683$
Vivotek

~36~
Statement of comprehensive income
Statements of cash flows
DET DIH
2019 2018
Revenue 50,644,767$ 162,343,089$
Profit before income tax 1,754,400 12,993,455
Income tax expense 18,582)( 2,661,380)(
Profit for the year from continuing operations 1,735,818 10,332,075
Other comprehensive (loss) income, net of tax 1,006,786)( 8,732,215
Total comprehensive income for the year 729,032$ 19,064,290$
Comprehensive (loss) income attributable to
non-controlling interest 153,674)($ 523,933$
Dividends paid to non-controlling interest 2,184,585$ 203,351$
Years ended December 31,
2019 2018
Revenue 6,573,617$ 5,235,966$
Profit before income tax 118,133 133,780
Income tax expense 66,991)( 52,832)(
Profit for the year from continuing operations 51,142 80,948
Other comprehensive (loss) income, net of tax 9,853)( 10,647
Total comprehensive income for the year 41,289$ 91,595$
Comprehensive income attributable to
non-controlling interest 1,442$ 19,508$
Dividends paid to non-controlling interest 104,890$ 165,720$
Years ended December 31,
Vivotek
DET DIH
2019 2018
Net cash provided by operating activities 5,112,438$ 14,952,859$
Net cash used in investing activities 4,915,661)( 4,113,982)(
Net cash used in financing activities 2,839,443)( 3,779,613)(
Effect of exchange rates on cash and cash
equivalents 280,456 5,125,165)(
(Decrease) increase in cash and cash
equivalents 2,362,210)( 1,934,099
Cash and cash equivalents, beginning of year 14,877,311 31,677,068
Cash and cash equivalents, end of year 12,515,101$ 33,611,167$
Years ended December 31,

~37~
(4) Foreign currency translation
Items included in the financial statements of each of the Group’s entities are measured using the
currency of the primary economic environment in which the entity operates (the “functional
currency”). The consolidated financial statements are presented in New Taiwan dollars, which is the
Company’s functional and the Group’s presentation currency.
A. Foreign currency transactions and balances
(a) Foreign currency transactions are translated into the functional currency using the exchange
rates prevailing at the dates of the transactions or valuation where items are remeasured.
Foreign exchange gains and losses resulting from the settlement of such transactions are
recognised in profit or loss in the period in which they arise, except when deferred in other
comprehensive income as qualifying cash flow hedges.
(b) Monetary assets and liabilities denominated in foreign currencies at the period end are re-
translated at the exchange rates prevailing at the balance sheet date. Exchange differences
arising upon re-translation at the balance sheet date are recognised in profit or loss.
(c) Non-monetary assets and liabilities denominated in foreign currencies held at fair value
through profit or loss are re-translated at the exchange rates prevailing at the balance sheet
date; their translation differences are recognised in profit or loss as part of the fair value gain
or loss. Non-monetary assets and liabilities denominated in foreign currencies held at fair
value through other comprehensive income are re-translated at the exchange rates prevailing
at the balance sheet date; their translation differences are recognised in other comprehensive
income. However, non-monetary assets and liabilities denominated in foreign currencies that
are not measured at fair value are translated using the historical exchange rates at the dates of
the initial transactions.
(d) All other foreign exchange gains and losses are presented in the statement of comprehensive
income within other gains and losses.
2019 2018
Net cash provided by operating activities 810,131$ 73,673$
Net cash used in investing activities 220,047)( 422,373)(
Net cash used in financing activities 365,874)( 37,419)(
Effect of exchange rates on cash and cash
equivalents 8,709)( 8,289
Increase (decrease) in cash and cash
equivalents 215,501 377,830)(
Cash and cash equivalents, beginning of year 807,712 1,185,542
Cash and cash equivalents, end of year 1,023,213$ 807,712$
Vivotek
Years ended December 31,

~38~
B. Translation of foreign operations
(a) The operating results and financial position of all the group entities, associates and joint
arrangements that have a functional currency different from the presentation currency are
translated into the presentation currency as follows:
i. Assets and liabilities for each balance sheet presented are translated at the closing exchange
rate at the date of that balance sheet;
ii. Income and expenses for each statement of comprehensive income are translated at average
exchange rates of that period; and
iii. All resulting exchange differences are recognised in other comprehensive income.
(b) When the foreign operation partially disposed of or sold is an associate or joint arrangements,
exchange differences that were recorded in other comprehensive income are proportionately
reclassified to profit or loss as part of the gain or loss on sale. In addition, even the Group still
retains partial interest in the former foreign associate or joint arrangements after losing
significant influence over the former foreign associate, or losing joint control of the former
joint arrangements, such transactions should be accounted for as disposal of all interest in these
foreign operations.
(c) When the foreign operation partially disposed of or sold is a subsidiary, cumulative exchange
differences that were recorded in other comprehensive income are proportionately transferred
to the non-controlling interest in this foreign operation. In addition, even the Group still retains
partial interest in the former foreign subsidiary after losing control of the former foreign
subsidiary, such transactions should be accounted for as disposal of all interest in the foreign
operation.
(d) Goodwill and fair value adjustments arising on the acquisition of a foreign entity are treated
as assets and liabilities of the foreign entity and translated at the closing exchange rates at the
balance sheet date.
(5) Classification of current and non-current items
A. Assets that meet one of the following criteria are classified as current assets; otherwise they are
classified as non-current assets:
(a) Assets arising from operating activities that are expected to be realised, or are intended to be
sold or consumed within the normal operating cycle;
(b) Assets held mainly for trading purposes;
(c) Assets that are expected to be realised within twelve months from the balance sheet date;
(d) Cash and cash equivalents, excluding restricted cash and cash equivalents and those that are
to be exchanged or used to pay off liabilities more than twelve months after the balance sheet
date.

~39~
B. Liabilities that meet one of the following criteria are classified as current liabilities; otherwise they
are classified as non-current liabilities:
(a) Liabilities that are expected to be paid off within the normal operating cycle;
(b) Liabilities arising mainly from trading activities;
(c) Liabilities that are to be paid off within twelve months from the balance sheet date;
(d) Liabilities for which the repayment date cannot be extended unconditionally to more than
twelve months after the balance sheet date. Terms of a liability that could, at the option of the
counterparty, result in its settlement by the issue of equity instruments do not affect its
classification.
(6) Cash equivalents
Cash equivalents refer to short-term, highly liquid investments that are readily convertible to known
amounts of cash and which are subject to an insignificant risk of changes in value. Time deposits that
meet the definition above and are held for the purpose of meeting short-term cash commitments in
operations are classified as cash equivalents.
(7) Financial assets at fair value through profit or loss
A. Financial assets at fair value through profit or loss are financial assets that are not measured at
amortised cost or fair value through other comprehensive income.
B. On a regular way purchase or sale basis, financial assets at fair value through profit or loss are
recognised and derecognised using trade date accounting.
C. At initial recognition, the Group measures the financial assets at fair value and recognises the
transaction costs in profit or loss. The Group subsequently measures the financial assets at fair
value, and recognises the gain or loss in profit or loss.
D. The Group recognises the dividend income when the right to receive payment is established, future
economic benefits associated with the dividend will flow to the Group and the amount of the
dividend can be measured reliably.
(8) Financial assets at fair value through other comprehensive income
A. Financial assets at fair value through other comprehensive income comprise equity securities
which are not held for trading, and for which the Group has made an irrevocable election at initial
recognition to recognise changes in fair value in other comprehensive income.
B. On a regular way purchase or sale basis, financial assets at fair value through other comprehensive
income are recognised and derecognised using trade date accounting.
C. They are initially recognised at fair value plus transaction costs. These financial assets are
subsequently remeasured and stated at fair value. The changes in fair value of equity investments
that were recognised in other comprehensive income are reclassified to retained earnings and are
not reclassified to profit or loss following the derecognition of the investment. Dividends are
recognised as revenue when the right to receive payment is established, future economic benefits

~40~
associated with the dividend will flow to the Group and the amount of the dividend can be
measured reliably.
(9) Accounts and notes receivable
A. Accounts and notes receivable entitle the Group a legal right to receive consideration in exchange
for transferred goods or rendered services.
B. The short-term accounts and notes receivable without bearing interest are subsequently measured
at initial invoice amount as the effect of discounting is immaterial.
C. The Group’s operating pattern of accounts receivable that are expected to be factored is for the
purpose of selling, and the accounts receivable are subsequently measured at fair value, with any
changes in fair value recognised in profit or loss.
(10) Impairment of financial assets
For debt instruments measured at fair value through other comprehensive income including accounts
receivable or contract assets that have a significant financing component, at each reporting date, the
Group recognises the impairment provision for 12 months expected credit losses if there has not
been a significant increase in credit risk since initial recognition or recognises the impairment
provision for the lifetime expected credit losses (ECLs) if such credit risk has increased since initial
recognition after taking into consideration all reasonable and verifiable information that includes
forecasts. On the other hand, for accounts receivable or contract assets that do not contain a
significant financing component, the Group recognises the impairment provision for lifetime ECLs.
(11) Derecognition of financial assets
The Group derecognises a financial asset when one of the following conditions is met:
A. The contractual rights to receive the cash flows from the financial asset expire.
B. The contractual rights to receive cash flows of the financial asset have been transferred and the
Group has transferred substantially all risks and rewards of ownership of the financial asset.
C. The contractual rights to receive cash flows of the financial asset have been transferred and, the
Group has not retained control of the financial asset.
(12) Inventories
Inventories are stated at the lower of cost and net realisable value. Inventories are recorded at
standard cost. The cost of finished goods and work in process comprises raw materials, direct labour,
other director costs and related production overheads (allocated based on normal operating capacity).
It excludes borrowing costs. The item by item approach is used in applying the lower of cost and
net realisable value. Net realisable value is the estimated selling price in the ordinary course of
business, less the estimated cost of completion and applicable variable selling expenses.
(13) Investments accounted for under equity method
A. Associates are all entities over which the Group has significant influence but not control. In
general, it is presumed that the investor has significant influence, if an investor holds, directly or

~41~
indirectly 20 per cent or more of the voting power of the investee. Investments in associates are
accounted for using the equity method and are initially recognised at cost.
B. The Group’s share of its associates’ post-acquisition profits or losses is recognised in profit or
loss, and its share of post-acquisition movements in other comprehensive income is recognised
in other comprehensive income. When the Group’s share of loss in an associate equals or exceeds
its interest in the associate, including any other unsecured receivables, the Group does not
recognise further losses, unless it has incurred legal or constructive obligations or made payments
on behalf of the associate.
C. When changes in associates’ equity do not arise from profit or loss or other comprehensive
income of the associate and such changes do not affect the Group’s ownership percentage of the
associate, the Group recognises change in ownership interests in the associate in ‘capital surplus’
in proportion to its ownership.
D. Unrealised gains on transactions between the Group and its associates are eliminated to the extent
of the Group’s interest in the associates. Unrealised losses are also eliminated unless the
transaction provides evidence of an impairment of the asset transferred. Accounting policies of
associates are consistent with the policies adopted by the Group.
E. In the case that an associate issues new shares and the Group does not subscribe or acquire new
shares proportionately, which results in a change in the Group’s ownership percentage of the
associate but maintains significant influence on the associate, then ‘capital surplus’ and
‘investments accounted for under the equity method’ shall be adjusted for the increase or
decrease of its share of equity interest. If the above condition causes a decrease in the Group’s
ownership percentage of the associate, in addition to the above adjustment, the amounts
previously recognised in other comprehensive income in relation to the associate are reclassified
to profit or loss proportionately on the same basis as would be required if the relevant assets or
liabilities were disposed of.
F. Upon loss of significant influence over an associate, the Group remeasures any investment
retained in the former associate at its fair value. Any difference between fair value and carrying
amount is recognised in profit or loss.
G. When the Group disposes its investment in an associate and loses significant influence over this
associate, the amounts previously recognised in other comprehensive income in relation to the
associate are reclassified to profit or loss, on the same basis as would be required if the relevant
assets or liabilities were disposed of. If it retains significant influence over this associate, the
amounts previously recognised in other comprehensive income in relation to the associate are
reclassified to profit or loss proportionately in accordance with the aforementioned approach.
(14) Cash surrender value of life insurance
Premium paid for life insurance with saving nature belonging to cash surrender value is recognised
as a deduction to insurance premium expense in current period and is added to the carrying amount
of cash surrender value.

~42~
(15) Property, plant and equipment
A. Property, plant and equipment are initially recorded at cost. Borrowing costs incurred during the
construction period are capitalised.
B. Subsequent costs are included in the asset’s carrying amount or recognised as a separate asset,
as appropriate, only when it is probable that future economic benefits associated with the item
will flow to the Group and the cost of the item can be measured reliably. The carrying amount of
the replaced part is derecognised. All other repairs and maintenance are charged to profit or loss
during the financial period in which they are incurred.
C. Land is not depreciated. Other property, plant and equipment apply cost model and are
depreciated using the straight-line method to allocate their cost over their estimated useful lives.
Each part of an item of property, plant, and equipment with a cost that is significant in relation
to the total cost of the item must be depreciated separately.
D. The assets’ residual values, useful lives and depreciation methods are reviewed, and adjusted if
appropriate, at each financial year-end. If expectations for the assets’ residual values and useful
lives differ from previous estimates or the patterns of consumption of the assets’ future economic
benefits embodied in the assets have changed significantly, any change is accounted for as a
change in estimate under IAS 8, ‘Accounting Policies, Changes in Accounting Estimates and
Errors’, from the date of the change. The estimated useful lives of property, plant and equipment
are 2~15 years except for buildings, the estimated life of which is 5~55 years.
(16) Leasing arrangements (lessee)-right-of-use assets/ lease liabilities
Effective 2019
A. Leases are recognised as a right-of-use asset and a corresponding lease liability at the date at
which the leased asset is available for use by the Group. For short-term leases or leases of low-
value assets, lease payments are recognised as an expense on a straight-line basis over the lease
term.
B. Lease liabilities include the net present value of the remaining lease payments at the
commencement date, discounted using the incremental borrowing interest rate. Lease payments
are fixed payments, less any lease incentives receivable. The Group subsequently measures the
lease liability at amortised cost using the interest method and recognises interest expense over
the lease term. The lease liability is remeasured and the amount of remeasurement is recognised
as an adjustment to the right-of-use asset when there are changes in the lease term or lease
payments and such changes do not arise from contract modifications.
C. At the commencement date, the right-of-use asset is stated at cost comprising the following:
(a) The amount of the initial measurement of lease liability; and
(b) Any lease payments made at or before the commencement date.
The right-of-use asset is measured subsequently using the cost model and is depreciated from
the commencement date to the earlier of the end of the asset’s useful life or the end of the
lease term. When the lease liability is remeasured, the amount of remeasurement is

~43~
recognised as an adjustment to the right-of-use asset.
(17) Leased assets/ operating leases (lessee)
Prior to 2019
Payments made under an operating lease (net of any incentives received from the lessor) are
recognised in profit or loss on a straight-line basis over the lease term.
(18) Investment property
An investment property is stated initially at its cost and measured subsequently using the cost model.
Except for land, investment property is depreciated on a straight-line basis over its estimated useful
life of 7~50 years.
(19) Intangible assets
A. Goodwill
Goodwill arises in a business combination accounted for by applying the acquisition method.
Acquisition prices in the business combination are calculated by the price of acquisition plus
related direct costs. Goodwill is recognised at the difference of the acquisition prices less net fair
value of identifiable assets acquired. The amortisation duration of acquisition prices may not
exceed one year after the acquisition.
B. Trademarks
(a) Separately acquired trademarks with finite useful lives are stated at acquisition cost and are
amortised on a straight-line basis over their estimated useful lives.
(b) Certain trademarks which are assessed to generate net cash inflows and have indefinite useful
lives are recorded at actual cost. These are not amortised and instead, are tested for
impairment annually.
C. Intangible assets other than goodwill and trademarks, mainly computer software, patents,
customer relationship and technology authorisation fees, are amortised on a straight-line basis
over their estimated useful lives of 2~22 years.
(20) Impairment of non-financial assets
A. The Group assesses at each balance sheet date the recoverable amounts of those assets where
there is an indication that they are impaired. An impairment loss is recognised for the amount by
which the asset’s carrying amount exceeds its recoverable amount. The recoverable amount is
the higher of an asset’s fair value less costs to sell or value in use. When the circumstances or
reasons for recognising impairment loss for an asset in prior years no longer exist or diminish,
the impairment loss is reversed. The increased carrying amount due to reversal should not be
more than what the depreciated or amortised historical cost would have been if the impairment
had not been recognised.
B. The recoverable amounts of goodwill, intangible assets with an indefinite useful life and
intangible assets that have not yet been available for use are evaluated periodically. An

~44~
impairment loss is recognised for the amount by which the asset’s carrying amount exceeds its
recoverable amount. Impairment loss of goodwill previously recognised in profit or loss shall
not be reversed in the following years.
C. For the purpose of impairment testing, goodwill acquired in a business combination is allocated
to each of the cash-generating units, or groups of cash-generating units, that is/are expected to
benefit from the synergies of the business combination. Each unit or group of units to which the
goodwill is allocated represents the lowest level within the entity at which the goodwill is
monitored for internal management purposes. Goodwill is monitored at the operating segment
level.
(21) Borrowings
Borrowings are recognised initially at fair value, net of transaction costs incurred. Borrowings are
subsequently stated at amortised cost; any difference between the proceeds (transaction costs) and
the redemption value is recognised in profit or loss over the period of the borrowings using the
effective interest method.
(22) Notes and accounts payable
Notes and accounts payable are obligations to pay for goods or services that have been acquired in
the ordinary course of business from suppliers. They are recognised initially at fair value and
subsequently measured at amortised cost using the effective interest method. However, for short-
term accounts payable without bearing interest, as the effect of discounting is insignificant, they are
measured subsequently at original invoice amount.
(23) Financial liabilities at fair value through profit or loss
A. Derivatives are categorised as financial liabilities held for trading unless they are designated as
hedges.
B. At initial recognition, the Group measures the financial liabilities at fair value. All related
transaction costs are recognised in profit or loss. The Group subsequently measures these
financial liabilities at fair value with any gain or loss recognised in profit or loss.
(24) Derecognition of financial liabilities
A financial liability is derecognised when the obligation under the liability specified in the contract
is discharged or cancelled or expires.
(25) Offsetting financial instruments
Financial assets and liabilities are offset and reported in the net amount in the balance sheet when
there is a legally enforceable right to offset the recognised amounts and there is an intention to settle
on a net basis or realise the asset and settle the liability simultaneously.
(26) Non-hedging and embedded derivatives
A. Non-hedging derivatives are initially recognised at fair value on the date a derivative contract is
entered into and recorded as financial assets or financial liabilities at fair value through profit or
loss. They are subsequently remeasured at fair value and the gains or losses are recognised in

~45~
profit or loss.
B. Under the financial assets, the hybrid contracts embedded with derivatives are initially
recognised as financial assets at fair value through profit or loss, financial assets at fair value
through other comprehensive income and financial assets at amortised cost based on the contract
terms.
C. Under the non-financial assets, whether the hybrid contracts embedded with derivatives are
accounted for separately at initial recognition is based on whether the economic characteristics
and risks of an embedded derivative are closely related in the host contract. When they are closely
related, the entire hybrid instrument is accounted for by its nature in accordance with the
applicable standard. When they are not closely related, the derivative is accounted for differently
from the host contract as derivative while the host contract is accounted for by its nature in
accordance with the applicable standard. Alternatively, the entire hybrid instrument is designated
as financial liabilities at fair value through profit or loss upon initial recognition.
(27) Hedge accounting
A. At the inception of the hedging relationship, there is formal designation and documentation of
the hedging relationship and the Group’s risk management objective and strategy for undertaking
the hedge. That documentation shall include identification of the hedging instrument, the hedged
item, the nature of the risk being hedged and how the Group will assess whether the hedging
relationship meets the hedge effectiveness requirements.
B. The Group designates the hedging relationship as follows:
(a) Cash flow hedge: a hedge of the exposure to variability in cash flows that is attributable to a
particular risk associated with a recognised asset or liability or a highly probable forecast
transaction.
(b) Hedge of a net investment in a foreign operation.
C. Cash flow hedges
(a) The cash flow hedge reserve associated with the hedged item is adjusted to the lower of the
following (in absolute amounts):
i. The cumulative gain or loss on the hedging instrument from inception of the hedge; and
ii. The cumulative change in fair value of the hedged item from inception of the hedge.
(b) The effective portion of the gain or loss on the hedging instrument is recognised in other
comprehensive income. The gain or loss on the hedging instrument relating to the ineffective
portion is recognised in profit or loss.
(c) The amount that has been accumulated in the cash flow hedge reserve in accordance with (a)
is accounted for as follows:
i. If a hedged forecast transaction subsequently results in the recognition of a non-financial
asset or non-financial liability, or a hedged forecast transaction for a non-financial asset or
non-financial liability becomes a firm commitment for which fair value hedge accounting
~46~
is applied, the Group shall remove that amount from the cash flow hedge reserve and
include it directly in the initial cost or other carrying amount of the asset or liability.
ii. For cash flow hedges other than those covered by i. above, that amount shall be reclassified
from the cash flow hedge reserve to profit or loss as a reclassification adjustment in the
same period or periods during which the hedged expected future cash flows affect profit or
loss.
iii. If that amount is a loss and the Group expects that all or a portion of that loss will not be
recovered in one or more future periods, it shall immediately reclassify the amount that is
not expected to be recovered into profit or loss as a reclassification adjustment.
(d) When the hedging instrument expires, or is sold, terminated, exercised or when the hedging
relationship ceases to meet the qualifying criteria, if the forecast transaction is still expected
to occur, the amount that has been accumulated in the cash flow hedge reserve shall remain in
the cash flow hedge reserve until the forecast transaction occurs; if the forecast transaction is
no longer expected to occur, the amount shall be immediately reclassified from the cash flow
hedge reserve to profit or loss as a reclassification adjustment.
D. Hedges of a net investment in a foreign operation
(a) It is accounted for similarly to cash flow hedges.
(b) The portion of the gain or loss on the hedging instrument that is determined to be an effective
hedge is recognised in other comprehensive income. The ineffective portion is recognised in
profit or loss.
(c) The cumulative gain or loss on the hedging instrument relating to the effective portion of the
hedge that has been accumulated in the foreign currency translation reserve shall be
reclassified from equity to profit or loss as a reclassification adjustment.
(28) Employee benefits
A. Pensions
(a) Defined contribution plans
Under the defined contribution plans, the contributions are recognised as pension expenses
when they are due on an accrual basis. Prepaid contributions are recognised as an asset to the
extent of a cash refund or a reduction in the future payments.
(b) Defined benefit plans
i. Net obligation under a defined benefit plan is defined as the present value of an amount
of pension benefits that employees will receive on retirement for their services with the
Group in current period or prior periods. The liability recognised in the balance sheet in
respect of defined benefit pension plans is the present value of the defined benefit
obligation at the balance sheet date less the fair value of plan assets. The net defined
benefit obligation is calculated annually by independent actuaries using the projected unit

~47~
credit method. The rate used to discount is determined by using interest rates of
government bonds (at the balance sheet date) of a currency and term consistent with the
currency and term of the employment benefit obligations.
ii. Remeasurements arising on defined benefit plans are recognised in other comprehensive
income in the period in which they arise and are recorded as retained earnings.
iii. Past service costs are recognised immediately in profit or loss.
B. Employees’, directors’ and supervisors’ remuneration
Employees’ remuneration and directors’ and supervisors’ remuneration are recognised as
expenses and liabilities, provided that such recognition is required under legal or constructive
obligation and those amounts can be reliably estimated. Any difference between the resolved
amounts and the subsequently actual distributed amounts is accounted for as changes in estimates.
If employees’ compensation is distributed by shares, the Group calculates the number of shares
based on the closing price at the previous day of the board meeting resolution.
(29) Employee share-based payment
A. For the equity-settled share-based payment arrangements, the employee services received are
measured at the fair value of the equity instruments granted at the grant date, and are recognised
as compensation cost over the vesting period, with a corresponding adjustment to equity. The
fair value of the equity instruments granted shall reflect the impact of market vesting conditions
and non-market vesting conditions. Compensation cost is subject to adjustment based on the
service conditions that are expected to be satisfied and the estimates of the number of equity
instruments that are expected to vest under the non-market vesting conditions at each balance
sheet date. Ultimately, the amount of compensation cost recognised is based on the number of
equity instruments that eventually vest.
B. Restricted stocks:
(a) Restricted stocks issued to employees are measured at the fair value of the equity instruments
granted at the grant date, and are recognised as compensation cost over the vesting period.
(b) For restricted stocks where employees do not need to pay to acquire those stocks, if
employees resign during the vesting period, the Group has the right to repurchase the stocks
for a fee and cancel these stocks. No distribution rights for dividends and capital reserves
before the vesting conditions are met.
(30) Income tax
A. The tax expense for the period comprises current and deferred tax. Tax is recognised in profit or
loss, except to the extent that it relates to items recognised in other comprehensive income or
items recognised directly in equity, in which cases the tax is recognised in other comprehensive
income or equity.
B. The current income tax charge is calculated on the basis of the tax laws enacted or substantively
enacted at the balance sheet date in the countries where the Company and its subsidiaries operate

~48~
and generate taxable income. Management periodically evaluates positions taken in tax returns
with respect to situations in accordance with applicable tax regulations. It establishes provisions
where appropriate based on the amounts expected to be paid to the tax authorities. An additional
tax is levied on the unappropriated retained earnings and is recorded as income tax expense in
the year the stockholders resolve to retain the earnings.
C. Deferred tax is recognised, using the balance sheet liability method, on temporary differences
arising between the tax bases of assets and liabilities and their carrying amounts in the
consolidated financial statements. However, the deferred tax is not accounted for if it arises from
initial recognition of goodwill or of an asset or liability in a transaction other than a business
combination that at the time of the transaction affects neither accounting nor taxable profit or
loss. Deferred tax is provided on temporary differences arising on investments in subsidiaries,
except where the timing of the reversal of the temporary difference is controlled by the Group
and it is probable that the temporary difference will not reverse in the foreseeable future. Deferred
tax is determined using tax rates (and laws) that have been enacted or substantially enacted by
the balance sheet date and are expected to apply when the related deferred tax asset is realised or
the deferred tax liability is settled.
D. Deferred tax assets are recognised only to the extent that it is probable that future taxable profit
will be available against which the temporary differences can be utilised. At each balance sheet
date, unrecognised and recognised deferred tax assets are reassessed.
E. Current income tax assets and liabilities are offset and the net amount is reported in the balance
sheet when there is a legally enforceable right to offset the recognised amounts and there is an
intention to settle on a net basis or realise the asset and settle the liability simultaneously.
Deferred tax assets and liabilities are offset on the balance sheet when the entity has the legally
enforceable right to offset current tax assets against current tax liabilities and they are levied by
the same taxation authority on either the same entity or different entities that intend to settle on
a net basis or realise the asset and settle the liability simultaneously.
(31) Share capital
Ordinary shares are classified as equity. Incremental costs directly attributable to the issue of new
shares or stock options are shown in equity as a deduction, net of tax, from the proceeds.
(32) Dividends
Dividends are recorded in the Company’s financial statements in the period in which they are
approved by the Company’s shareholders. Cash dividends are recorded as liabilities.
(33) Revenue recognition
A. Sales of goods
(a) The Group manufactures and sells computers, information technology, electrical machines,
power supply, automation equipment and related components products. Sales are recognised
when control of the products has transferred, being when the products are delivered to the

~49~
customer, the customer has full discretion over the channel and price to sell the products, and
there is no unfulfilled obligation that could affect the customer’s acceptance of the products.
Delivery occurs when the products have been shipped to the specific location, the risks of
obsolescence and loss have been transferred to the customer, and either the customer has
accepted the products in accordance with the sales contract, or the Group has objective
evidence that all criteria for acceptance have been satisfied.
(b) Sales revenue is recognised based on the price specified in the contract, net of the estimated
discounts and allowances. Accumulated experience is used to estimate and provide for the
sales discounts and allowances, using the expected value method, and revenue is only
recognised to the extent that it is highly probable that a significant reversal will not occur.
The estimation is subject to an assessment at each reporting date. A refund liability is
recognised for expected sales discounts and allowances payable to customers in relation to
sales made until the end of the reporting period. Sales are usually made with a credit term of
30 to 90 days after acceptance. As the time interval between the transfer of committed goods
or service and the payment of customer does not exceed one year, the Group does not adjust
the transaction price to reflect the time value of money.
(c) The Group’s obligation to provide a refund for faulty products under the standard warranty
terms is recognised as a provision.
(d) A receivable is recognised when the control of goods are transferred as this is the point in
time that the consideration is unconditional because only the passage of time is required
before the payment is due.
B. Installation of software and module services
(a) The Group provides installation of some software and module services. Revenue from
providing services is recognised in the accounting period in which the services are rendered.
For fixed-price contracts, revenue is recognised based on the actual service provided to the
end of the reporting period as a proportion of the total services to be provided. This is
determined based on the actual cost spent relative to the total expected cost. The customer
pays at the time specified in the payment schedule. If the services rendered exceed the
payment, a contract asset is recognised. If the payments exceed the services rendered, a
contract liability is recognised.
(b) Some contracts include sales and installation services of equipment. The equipment and the
installation services provided by the Group are not distinct and are identified to be one
performance obligation satisfied over time since the installation services involve significant
customisation and modification.
(c) The Group’s estimate about revenue, costs and progress towards complete satisfaction of a
performance obligation is subject to a revision whenever there is a change in circumstances.
Any increase or decrease in revenue or costs due to an estimate revision is reflected in profit
or loss during the period when the management becomes aware of the changes in

~50~
circumstances.
C. Revenue from licencing intellectual property
The Group is entitled to collect usage-based royalty in return for licencing patented technologies
and intellectual property lights to subsidiaries and associates under agreements. The Group
recognises revenue when the performance obligation has been satisfied and the subsequent usage
occurs.
D. Incremental costs of obtaining a contract
Given that the contractual period lasts less than one year, the Group recognises the incremental
costs of obtaining a contract as an expense when incurred although the Group expects to recover
those costs.
(34) Government grants
Government grants are recognised at their fair value only when there is reasonable assurance that
the Group will comply with any conditions attached to the grants and the grants will be received.
Government grants are recognised in profit or loss on a systematic basis over the periods in which
the Group recognises expenses for the related costs for which the grants are intended to compensate.
Government grants related to property, plant and equipment are presented by deducting the grants
from the asset’s carrying amount and are amortised to profit or loss over the estimated useful lives
of the related assets as reduced depreciation expenses.
(35) Business combinations
A. The Group uses the acquisition method to account for business combinations. The consideration
transferred for an acquisition is measured as the fair value of the assets transferred, liabilities
incurred or assumed and equity instruments issued at the acquisition date, plus the fair value of
any assets and liabilities resulting from a contingent consideration arrangement. All acquisition-
related costs are expensed as incurred. Identifiable assets acquired and liabilities and contingent
liabilities assumed in a business combination are measured initially at their fair values at the
acquisition date. For each business combination, the Group measures at the acquisition date
components of non-controlling interests in the acquiree that are present ownership interests and
entitle their holders to the proportionate share of the entity’s net assets in the event of liquidation
at either fair value or the present ownership instruments’ proportionate share in the recognised
amounts of the acquiree’s identifiable net assets. All other non-controlling interests should be
measured at the acquisition-date fair value.
B. The excess of the consideration transferred, the amount of any non-controlling interest in the
acquiree and the fair value of any previous equity interest in the acquiree over the fair value of
the identifiable assets acquired and the liabilities assumed is recorded as goodwill at the
acquisition date. If the total of consideration transferred, non-controlling interest in the acquiree
recognised and the fair value of previously held equity interest in the acquiree is less than the
fair value of the identifiable assets acquired and the liabilities assumed, the difference is
recognised directly in profit or loss on the acquisition date.

~51~
(36) Operating segments
Operating segments are reported in a manner consistent with the internal reporting provided to the
chief operating decision-maker. The Group’s chief operating decision-maker is responsible for
allocating resources and assessing performance of the operating segments.
5. CRITICAL ACCOUNTING JUDGMENTS, ESTIMATES AND KEY SOURCES OF ASSUMPTION
UNCERTAINTY
The preparation of these consolidated financial statements requires management to make critical
judgments in applying the Group’s accounting policies and make critical assumptions and estimates
concerning future events. Assumptions and estimates may differ from the actual results and are
continually evaluated and adjusted based on historical experience and other factors. Such assumptions
and estimates have a significant risk of causing a material adjustment to the carrying amounts of assets
and liabilities within the next financial year; and the related information is addressed below:
(1) Critical judgments in applying the Group’s accounting policies
Investment property
The Group uses part of the property for its own use and part to earn rentals or for capital appreciation.
When the portions cannot be sold separately and cannot be leased out separately under a finance lease,
the property is classified as investment property only if the own-use portion accounts for less than
20% of the property.
(2) Critical accounting estimates and assumptions
Impairment assessment of goodwill
The impairment assessment of goodwill relies on the Group’s subjective judgment, including
identifying cash-generating units, allocating assets and liabilities as well as goodwill to related cash-
generating units, and determining the recoverable amounts of related cash-generating units. Please
refer to Note 6(12) for the information on goodwill impairment.
6. DETAILS OF SIGNIFICANT ACCOUNTS
(1) Cash and cash equivalents
A. The Group associates with a variety of financial institutions all with high credit quality to disperse
credit risk, so it expects that the probability of counterparty default is remote.
B. Details of the Group’s cash and cash equivalents pledged to others as collateral are provided in
Note 8.
December 31, 2019 December 31, 2018
Cash on hand 6,941$ 5,635$
Checking accounts and demand deposits 30,808,159 37,506,087
Time deposits 13,144,901 22,106,975
43,960,001$ 59,618,697$

~52~
(2) Financial assets/liabilities at fair value through profit or loss
A. The Group has recognised financial assets and liabilities at fair value through profit or loss of
$365,965 and ($202,545) for the years ended December 31, 2019 and 2018, respectively.
Asset Items December 31, 2019 December 31, 2018
Current items:
Financial assets mandatorily measured at fair
value through profit or loss
Listed stocks 541,143$ 561,989$
Emerging stocks - 56,102
Derivatives 142,668 37,047
Hybrid instrument 87,578 119,074
771,389 774,212
Valuation adjustment 351,069 225,904
1,122,458$ 1,000,116$
Non-current items:
Financial assets mandatorily measured at fair
value through profit or loss
Listed stocks 499,290$ 501,639$
Emerging stocks 81,000 107,037
Unlisted stocks 2,247,846 2,371,304
2,828,136 2,979,980
Valuation adjustment 602,897)( 587,181)(
2,225,239$ 2,392,799$
Liability Items December 31, 2019 December 31, 2018
Current items:
Valuation adjustment of derivatives 15,929$ 8,544$

~53~
B. Explanations of the transactions and contract information in respect of derivative financial assets
and liabilities that the Group does not adopt hedge accounting are as follows:
Contract period
- Sell AUD / Buy NOK AUD 600 2019.12.04~2020.01.07
- Sell AUD / Buy USD AUD 1,500 2019.09.12~2020.04.28
- Sell BRL / Buy USD BRL 32,622 2019.11.06~2020.02.07
- Sell EUR / Buy GBP EUR 1,000 2019.12.05~2020.02.07
- Sell EUR / Buy NOK EUR 8,000 2019.10.07~2020.07.03
- Sell EUR / Buy USD EUR 28,500 2019.09.18~2020.04.03
- Sell GBP / Buy NOK GBP 2,600 2019.10.07~2020.02.07
- Sell HKD / Buy USD HKD 151,000 2019.09.05~2020.03.03
- Sell INR / Buy USD INR 1,266,206 2019.11.11~2020.01.21
- Sell JPY / Buy USD JPY 889,565 2019.09.25~2020.03.19
- Sell SGD / Buy USD SGD 7,000 2019.12.25~2020.02.04
- Sell THB / Buy USD THB 9,060 2019.12.24~2020.01.23
- Sell USD / Buy CZK USD 300 2019.12.24~2020.01.21
- Sell USD / Buy HKD USD 770 2019.12.26~2020.03.03
- Sell USD / Buy JPY USD 3,100 2019.11.08~2020.02.25
- Sell USD / Buy NOK USD 6,000 2019.10.07~2020.04.03
- Sell USD / Buy RMB USD 217,181 2019.09.27~2020.03.23
Sell USD / Buy SGD USD 14,092 2019.09.25~2020.04.03
Sell USD / Buy THB USD 121,700 2019.09.26~2020.04.03
- Sell EUR / Buy NOK EUR 13,000 2019.09.04~2020.06.05
- Sell EUR / Buy RUB EUR 500 2019.12.05~2020.02.07
- Sell GBP / Buy NOK GBP 500 2019.10.07~2020.01.07
Sell USD / Buy EUR USD 1,113 2019.11.06~2020.01.07
Sell USD / Buy NOK USD 5,000 2019.11.06~2020.03.05
Cross currency swap:
December 31, 2019
Contract amount (nominal
Financial instruments principal) (in thousands)
Forward exchange contracts:

~54~
The Group entered into forward exchange contracts and cross currency swap to manage exposures
to foreign exchange rate fluctuations of import or export sales and dividend distribution between
subsidiary and second-tier subsidiary. However, the forward exchange transactions did not meet
the criteria for hedge accounting. Therefore, the Group did not apply hedge accounting.
C. The Group has no financial assets at fair value through profit or loss pledged to others.
D. Information relating to credit risk is provided in Note 12(2).
Contract period
- Sell USD / Buy RMB USD 123,654 2018.12.19~2019.01.22
- Sell USD / Buy NTD USD 2,000 2018.12.10~2019.01.04
- Sell USD / Buy JPY USD 4,200 2018.11.09~2019.02.25
- Sell USD / Buy CZK USD 470 2018.12.17~2019.01.18
- Sell JPY / Buy USD JPY 622,097 2018.11.05~2019.04.18
- Sell USD / Buy SGD USD 11,750 2018.04.03~2019.03.04
- Sell AUD / Buy USD AUD 18,430 2018.08.24~2019.03.26
- Sell EUR / Buy USD EUR 23,800 2018.09.14~2019.04.25
- Sell EUR / Buy NOK EUR 5,000 2018.10.08~2019.02.07
- Sell GBP / Buy NOK GBP 1,500 2018.12.21~2019.02.07
- Sell SGD / Buy USD SGD 2,050 2018.12.28~2019.01.29
- Sell THB / Buy USD THB 91,276 2018.12.21~2019.02.26
- Sell THB / Buy SGD THB 67,556 2018.12.21~2019.02.26
- Sell USD / Buy RUB USD 500 2018.11.08~2019.01.09
- Sell USD / Buy EUR USD 1,940 2018.11.09~2019.01.07
- Sell USD / Buy AUD USD 800 2018.12.12~2019.02.05
- Sell BRL / Buy USD BRL 41,666 2018.11.05~2019.02.07
- Sell INR / Buy USD INR 71,220 2018.12.05~2019.02.07
- Sell EUR / Buy NOK EUR 6,000 2018.09.04~2019.01.07
- Sell EUR / Buy SEK EUR 500 2018.12.10~2019.02.07
- Sell EUR / Buy SGD EUR 11,653 2018.11.13~2019.01.07
- Sell GBP / Buy NOK GBP 1,000 2018.12.06~2019.01.07
- Sell SGD / Buy EUR SGD 6,000 2018.11.05~2019.01.07
- Sell RUB / Buy USD RUB 166,900 2018.11.05~2019.01.09
- Sell USD / Buy NOK USD 2,000 2018.11.09~2019.01.07
- Sell USD / Buy SGD USD 5,000 2018.12.06~2019.01.07
Forward exchange contracts:
Cross currency swap:
December 31, 2018
Contract amount (nominal
Financial instruments principal) (in thousands)

~55~
(3) Financial assets at fair value through other comprehensive income
A. The Group has elected to classify investments that are considered to be strategic investments as
financial assets at fair value through other comprehensive income. The fair value of such
investments amounted to $2,117,124 and $2,977,994 as at December 31, 2019 and 2018,
respectively.
B. For the years ended December 31, 2019 and 2018, the Group sold listed stocks whose fair value
were $1,114,871 and $733, respectively, to adjust the stock position, resulting to an accumulated
loss on disposal of $635,782 and $9,336, respectively.
C. Amounts recognised in profit or loss and other comprehensive income in relation to the financial
assets at fair value through other comprehensive income are listed below:
D. As at December 31, 2019 and 2018, without taking into account any collateral held or other credit
enhancements, the maximum exposure to credit risk in respect of the amount that best represents
the financial assets at fair value through other comprehensive income held by the Group was
$2,117,124 and $2,977,994, respectively.
E. The Group has no financial assets at fair value through other comprehensive income pledged to
others as collateral.
F. Information relating to credit risk is provided in Note 12(2).
Items December 31, 2019 December 31, 2018
Current items:
Equity instruments
Listed stocks 1,559,472$ 871,492$
Valuation adjustment 1,239,649)( 813,836)(
319,823$ 57,656$
Non-current items:
Equity instruments
Listed stocks 2,301,004$ 4,301,090$
Unlisted stocks 690,945 1,008,088
2,991,949 5,309,178
Valuation adjustment 1,194,648)( 2,388,840)(
1,797,301$ 2,920,338$
2019 2018
Equity instruments at fair value through other
comprehensive income
Fair value change recognised in other
comprehensive income (loss) 200,079$ 844,089)($
Cumulative gain (loss) reclassified to retained
earnings due to derecognition 635,782)($ 9,336)($
Years ended December 31,

~56~
(4) Hedging financial assets and liabilities
A. As at December 31, 2019 and 2018, the balances of financial assets and liabilities used for hedging
were all $0.
B. Information on cash flow hedges and hedges of net investments in foreign operations recognised
as profit or loss and other comprehensive income:
(a) The purpose of hedge accounting is that the hedged highly probable forecast transactions
denominated in foreign currency are expected to occur during the next 12 months. Amounts
accumulated in other comprehensive income as at December 31, 2019 and 2018 are recycled
into profit or loss in the period or periods when the hedged item affects profit or loss.
(b) Hedges of net investments in foreign operations
In the first quarter of 2018, due to the reorganisation of the Group, the risk of USD exchange
rate fluctuating by fair value initially designated as hedged items of hedges of net investments
in foreign operations was no longer material. Consequently, the hedge relationship did not
meet the conditions of hedge accounting. The effective portion of hedges of net investments
in foreign operations was accumulated in other equity previously. Since the foreign operations
was not disposed, it was not reclassified from equity to profit or loss.
Hedges of net
investments in
Cash flow hedges foreign operations
Other equity
At January 1, 2019 -$ 131,152$
Add: (Loss) gain on hedge effectiveness-
amount recognised in other
comprehensive income 6,124)( 16,104
Less: Reclassified to profit or loss as the
hedged item has affected profit or loss 6,124 -
At December 31, 2019 -$ 147,256$
Hedges of net
investments in
Cash flow hedges foreign operations
Other equity
At January 1, 2018 7,061$ 73,476$
Add: (Loss) gain on hedge effectiveness-
amount recognised in other
comprehensive income 4,161)( 57,676
Less: Reclassified to profit or loss as the
hedged item has affected profit or loss 2,900)( -
At December 31, 2018 -$ 131,152$
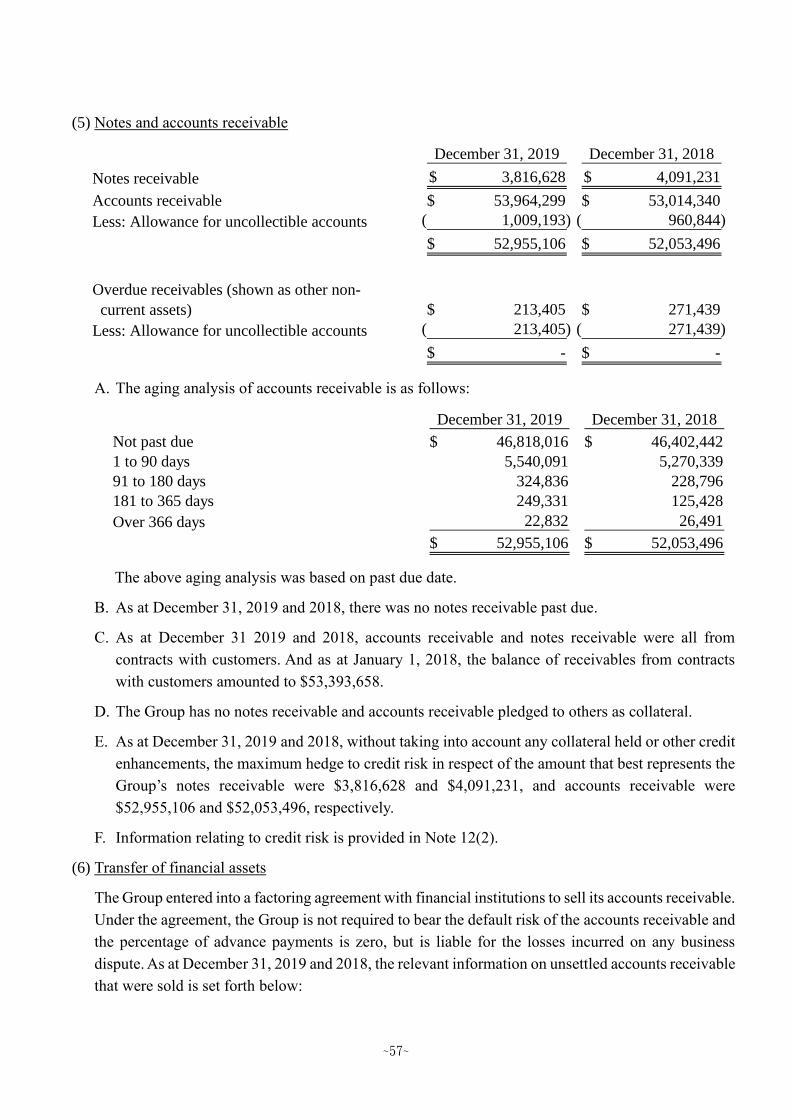
~57~
(5) Notes and accounts receivable
A. The aging analysis of accounts receivable is as follows:
The above aging analysis was based on past due date.
B. As at December 31, 2019 and 2018, there was no notes receivable past due.
C. As at December 31 2019 and 2018, accounts receivable and notes receivable were all from
contracts with customers. And as at January 1, 2018, the balance of receivables from contracts
with customers amounted to $53,393,658.
D. The Group has no notes receivable and accounts receivable pledged to others as collateral.
E. As at December 31, 2019 and 2018, without taking into account any collateral held or other credit
enhancements, the maximum hedge to credit risk in respect of the amount that best represents the
Group’s notes receivable were $3,816,628 and $4,091,231, and accounts receivable were
$52,955,106 and $52,053,496, respectively.
F. Information relating to credit risk is provided in Note 12(2).
(6) Transfer of financial assets
The Group entered into a factoring agreement with financial institutions to sell its accounts receivable.
Under the agreement, the Group is not required to bear the default risk of the accounts receivable and
the percentage of advance payments is zero, but is liable for the losses incurred on any business
dispute. As at December 31, 2019 and 2018, the relevant information on unsettled accounts receivable
that were sold is set forth below:
December 31, 2019 December 31, 2018
Notes receivable 3,816,628$ 4,091,231$
Accounts receivable 53,964,299$ 53,014,340$
Less: Allowance for uncollectible accounts 1,009,193)( 960,844)(
52,955,106$ 52,053,496$
Overdue receivables (shown as other non-
current assets) 213,405$ 271,439$
Less: Allowance for uncollectible accounts 213,405)( 271,439)(
-$ -$
December 31, 2019 December 31, 2018
Not past due 46,818,016$ 46,402,442$
1 to 90 days 5,540,091 5,270,339
91 to 180 days 324,836 228,796
181 to 365 days 249,331 125,428
Over 366 days 22,832 26,491
52,955,106$ 52,053,496$

~58~
(7) Inventories
Purchaser of Accounts Amount Interest rate
accounts receivable Amount Amount available for of amount
receivable transferred derecognised Facilities advanced advance advanced
Taishin
International Bank
57,743$ -$ 299,800$ -$ -$ -$
Purchaser of Accounts Amount Interest rate
accounts receivable Amount Amount available for of amount
receivable transferred derecognised Facilities advanced advance advanced
Taishin
International Bank
70,948$ -$ 307,150$ -$ -$ -$
December 31, 2019
December 31, 2018
Allowance for
Cost valuation loss Book value
Raw materials 13,734,404$ 2,978,189)($ 10,756,215$
Work in process 4,205,155 11,299)( 4,193,856
Finished goods 27,482,584 3,634,975)( 23,847,609
Inventory in transit 518,743 - 518,743
45,940,886$ 6,624,463)($ 39,316,423$
Allowance for
Cost valuation loss Book value
Raw materials 12,622,276$ 1,701,414)($ 10,920,862$
Work in process 3,065,158 13,027)( 3,052,131
Finished goods 22,686,380 2,510,049)( 20,176,331
Inventory in transit 152,542 - 152,542
38,526,356$ 4,224,490)($ 34,301,866$
December 31, 2019
December 31, 2018

~59~
The Group recognised as expense or loss:
(8) Investments accounted for under equity method
A. Details of investments accounted for under the equity method are set forth below:
Note 1: The shareholding ratio in associates represent the ratio of common shares held by the
Group.
Note 2: On April 2, 2019, the subsidiary, DEIL-SG acquired 42.85% equity interests in DET, and
the total equity interest of DET held by the Group is 63.78%. Therefore, the Group has
control over DET, and DET is included in the consolidated financial statements.
B. For the years ended December 31, 2019 and 2018, the share of profit (loss) of associates were
$141,877 and $943,990, respectively.
C. The financial statements of investments under equity method were audited by other independent
accountants. The share of profit (loss) and other comprehensive income (loss) of associates was
$429,060 and $204,169 for the years ended December 31, 2019 and 2018, respectively, and the
balance of investments accounted for under equity method was $0 and $8,154,777 as at December
31, 2019 and 2018, respectively.
2019 2018
Cost of goods sold 187,469,554$ 169,043,616$
Loss on market value decline and obsolete and
slow-moving inventories 1,794,257 556,111
Others 647,439)( 129,078)(
188,616,372$ 169,470,649$
Years ended December 31,
Ownership % Ownership %
Name of associates (Note 1) Book value (Note 1) Book value
Optovue, Inc. 29.50 842,043$ 29.50 959,816$
Digital Projection International
Ltd. (DPI) 41.00 240,059 41.00 241,333
Delta Electronics (Thailand)
Public Company Limited
(DET) (Note 2) (Note 2) 20.93 8,154,777
Others 56,818 37,790
1,138,920$ 9,393,716$
December 31, 2019 December 31, 2018
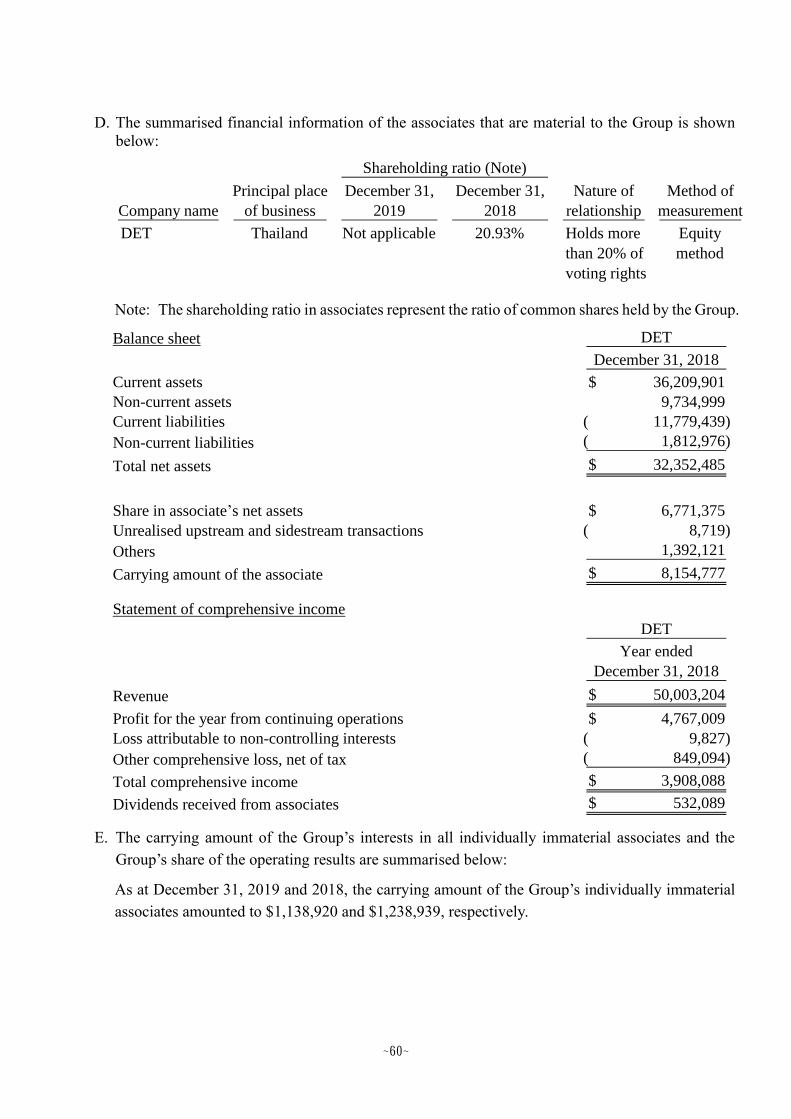
~60~
D. The summarised financial information of the associates that are material to the Group is shown
below:
Note: The shareholding ratio in associates represent the ratio of common shares held by the Group.
E. The carrying amount of the Group’s interests in all individually immaterial associates and the
Group’s share of the operating results are summarised below:
As at December 31, 2019 and 2018, the carrying amount of the Group’s individually immaterial
associates amounted to $1,138,920 and $1,238,939, respectively.
Principal place December 31, December 31, Nature of Method of
Company name of business 2019 2018 relationship measurement
DET Thailand Not applicable 20.93% Holds more
than 20% of
voting rights
Equity
method
Shareholding ratio (Note)
Balance sheet DET
December 31, 2018
Current assets 36,209,901$
Non-current assets 9,734,999
Current liabilities 11,779,439)(
Non-current liabilities 1,812,976)(
Total net assets 32,352,485$
Share in associate’s net assets 6,771,375$
Unrealised upstream and sidestream transactions 8,719)(
Others 1,392,121
Carrying amount of the associate 8,154,777$
Statement of comprehensive income
DET
Year ended
December 31, 2018
Revenue 50,003,204$
Profit for the year from continuing operations 4,767,009$
Loss attributable to non-controlling interests 9,827)(
Other comprehensive loss, net of tax 849,094)(
Total comprehensive income 3,908,088$
Dividends received from associates 532,089$

~61~
F. The Group’s investment in DET has quoted market price. The fair value of DET as at December
31, 2018 was $17,298,030.
2019 2018
Loss for the year from continuing operations 100,862)($ 41,160)($
Other comprehensive income, net of tax 17,156 14,515
Total comprehensive loss 83,706)($ 26,645)($
Years ended December 31,

~62~
(9) Property, plant and equipment
(Note 1) The investment property was reclassified to property, plant and equipment as the percentage of a portion of the investment property for its own use exceeded 20% from the
first quarter of 2019.
(Note 2) For the year ended December 31, 2019, the Group recognised a reversal of impairment loss of $90,215 for certain buildings and structures machinery and equipment and
other equipment that were assessed for reuse in the future. Such reversal of impairment loss was recognised in other operating income and expenses.
Unfinished
construction
Buildings and Machinery and Testing and equipment
At January 1, 2019 Land structures equipment equipment Others under acceptance Total
Cost 9,387,791$ 35,410,148$ 34,306,477$ 15,133,753$ 13,323,988$ 1,426,294$ 108,988,451$
Accumulated depreciation and
impairment 12,228)( 14,756,380)( 24,800,888)( 12,254,047)( 10,736,034)( - 62,559,577)(
9,375,563$ 20,653,768$ 9,505,589$ 2,879,706$ 2,587,954$ 1,426,294$ 46,428,874$
2019
Opening net book amount 9,375,563$ 20,653,768$ 9,505,589$ 2,879,706$ 2,587,954$ 1,426,294$ 46,428,874$
Additions 2,642,719 1,013,780 4,303,311 2,225,498 2,523,680 4,157,198 16,866,186
Acquired through business combinations 1,937,962 2,891,051 2,408,419 372,027 1,190,607 1,184,235 9,984,301
Disposal 347)( 41,898)( 280,720)( 51,258)( 154,652)( 127)( 529,002)(
Transfer - 82,483 906,706 166,922 198,636 1,354,747)( -
Reclassifications (Note 1) 465,686 1,164,972 - - - - 1,630,658
Depreciation charge - 1,874,482)( 4,218,490)( 1,993,308)( 2,200,977)( - 10,287,257)(
Reversal of impairrment loss (Note 2) - 86,246 2,925 - 1,044 - 90,215
Net exchange differences 67,727)( 776,702)( 161,154)( 80,016)( 165,015 327,590 592,994)(
Closing net book amount 14,353,856$ 23,199,218$ 12,466,586$ 3,519,571$ 4,311,307$ 5,740,443$ 63,590,981$
At December 31, 2019
Cost 14,365,775$ 43,455,591$ 43,103,641$ 17,246,547$ 19,083,533$ 5,740,443$ 142,995,530$
Accumulated depreciation and
impairment 11,919)( 20,256,373)( 30,637,055)( 13,726,976)( 14,772,226)( - 79,404,549)(
14,353,856$ 23,199,218$ 12,466,586$ 3,519,571$ 4,311,307$ 5,740,443$ 63,590,981$

~63~
(Note) The reclassifications resulted from the reallocation of the purchase price relative to the acquisition of Vivotek Inc.
A. The Group’s property, plant and equipment are mainly owner-occupied.
B. No interest expense was capitalised on property, plant and equipment.
C. Information about the property, plant and equipment that were pledged to others as collateral is provided in Note 8.
Unfinished
construction
Buildings and Machinery and Testing and equipment
At January 1, 2018 Land structures equipment equipment Others under acceptance Total
Cost 6,200,330$ 34,716,148$ 32,147,803$ 14,124,840$ 12,529,075$ 1,266,620$ 100,984,816$
Accumulated depreciation and
impairment 11,617)( 13,243,559)( 22,629,430)( 11,118,300)( 9,643,282)( - 56,646,188)(
6,188,713$ 21,472,589$ 9,518,373$ 3,006,540$ 2,885,793$ 1,266,620$ 44,338,628$
2018
Opening net book amount 6,188,713$ 21,472,589$ 9,518,373$ 3,006,540$ 2,885,793$ 1,266,620$ 44,338,628$
Additions 3,301,909 587,685 2,528,091 1,533,392 1,153,924 2,235,870 11,340,871
Disposals 136,450)( 77,982)( 113,358)( 26,971)( 47,242)( - 402,003)(
Transfer - 385,297 810,492 192,354 321,697 1,709,840)( -
Reclassifications (Note) 6,159 105,843 3,274 11,757 15,708 - 142,741
Depreciation charge - 1,748,510)( 3,457,862)( 1,860,959)( 1,724,851)( - 8,792,182)(
Net exchange differences 15,232 71,154)( 216,580 23,593 17,076)( 366,356)( 199,181)(
Closing net book amount 9,375,563$ 20,653,768$ 9,505,590$ 2,879,706$ 2,587,953$ 1,426,294$ 46,428,874$
At December 31, 2018
Cost 9,387,791$ 35,410,148$ 34,306,477$ 15,133,753$ 13,323,988$ 1,426,294$ 108,988,451$
Accumulated depreciation and
impairment 12,228)( 14,756,380)( 24,800,888)( 12,254,047)( 10,736,034)( - 62,559,577)(
9,375,563$ 20,653,768$ 9,505,589$ 2,879,706$ 2,587,954$ 1,426,294$ 46,428,874$

~64~
(10) Leasing arrangements - lessee
Effective 2019
A. The Group leases various assets including land, buildings and transportation equipment. Rental
contracts are typically made for periods of 1 to 21 years. Lease terms are negotiated on an
individual basis and contain a wide range of different terms and conditions. The lease agreements
do not impose covenants, but leased assets may not be used as security for borrowing purposes.
B. The carrying amount of right-of-use assets and the depreciation charge are as follows:
C. For the year ended December 31, 2019, the additions to right-of-use assets was $335,118.
D. Information on profit or loss in relation to lease contracts is as follows:
E. For the year ended December 31, 2019, the Group’s total cash outflow for leases was $1,007,692.
F. Extension options
(a) Extension options are included in the Group’s lease contracts pertaining to certain land. These
terms and conditions are the lessor’s general practice and for the Group to effectively utilise
the assets.
(b) In determining the lease term, the Group takes into consideration all facts and circumstances
that create an economic incentive to exercise an extension option. The assessment of lease
period is reviewed if a significant event occurs which affects the assessment.
Year ended
December 31, 2019 December 31, 2019
Book value Depreciation charge
Land 1,683,784$ 49,250$
Buildings and structures 1,321,468 476,602
Transportation equipment 86,200 90,444
Other equipment 22,381 9,041
3,113,833$ 625,337$
Year ended
December 31, 2019
Items affecting profit or loss
Interest expense on lease liabilities 23,962$
Expense on short-term lease contracts 397,481$

~65~
(11) Investment property
(Note) The investment property was reclassified to property, plant and equipment as the percentage
of a portion of the investment property for its own use exceeded 20% from the first quarter
of 2019.
Buildings and
Land structures Total
At January 1, 2019
Cost 479,756$ 4,299,554$ 4,779,310$
Accumulated depreciation
and impairment - 3,134,582)( 3,134,582)(
479,756$ 1,164,972$ 1,644,728$
2019
Opening net book amount 479,756$ 1,164,972$ 1,644,728$
Reclassifications (Note) 465,686)( 1,164,972)( 1,630,658)(
Closing net book amount 14,070$ -$ 14,070$
At December 31, 2019
Cost 14,070$ -$ 14,070$
Accumulated depreciation
and impairment - - -
14,070$ -$ 14,070$
Buildings and
Land structures Total
At January 1, 2018
Cost 465,724$ 4,298,176$ 4,763,900$
Accumulated depreciation
and impairment - 2,987,489)( 2,987,489)(
465,724$ 1,310,687$ 1,776,411$
2018
Opening net book amount 465,724$ 1,310,687$ 1,776,411$
Additions 14,070 1,378 15,448
Disposal 38)( - 38)(
Depreciation charge - 147,093)( 147,093)(
Closing net book amount 479,756$ 1,164,972$ 1,644,728$
At December 31, 2018
Cost 479,756$ 4,299,554$ 4,779,310$
Accumulated depreciation
and impairment - 3,134,582)( 3,134,582)(
479,756$ 1,164,972$ 1,644,728$

~66~
A. Rental income from the lease of the investment property and direct operating expenses arising
from the investment property are shown below:
B. The fair value of the investment property held by the Group as at December 31, 2019 and 2018
was $14,070 and $3,106,112, respectively, which was revalued by the Group.
2019 2018
Rental revenue from the lease of the investment
property 6,747$ 52,162$
Direct operating expenses of investment
property that generated rental revenue during
the year -$ 68,280$
Direct operating expenses of investment
property that did not generate rental revenue
during the year -$ 105,587$
Years ended December 31,
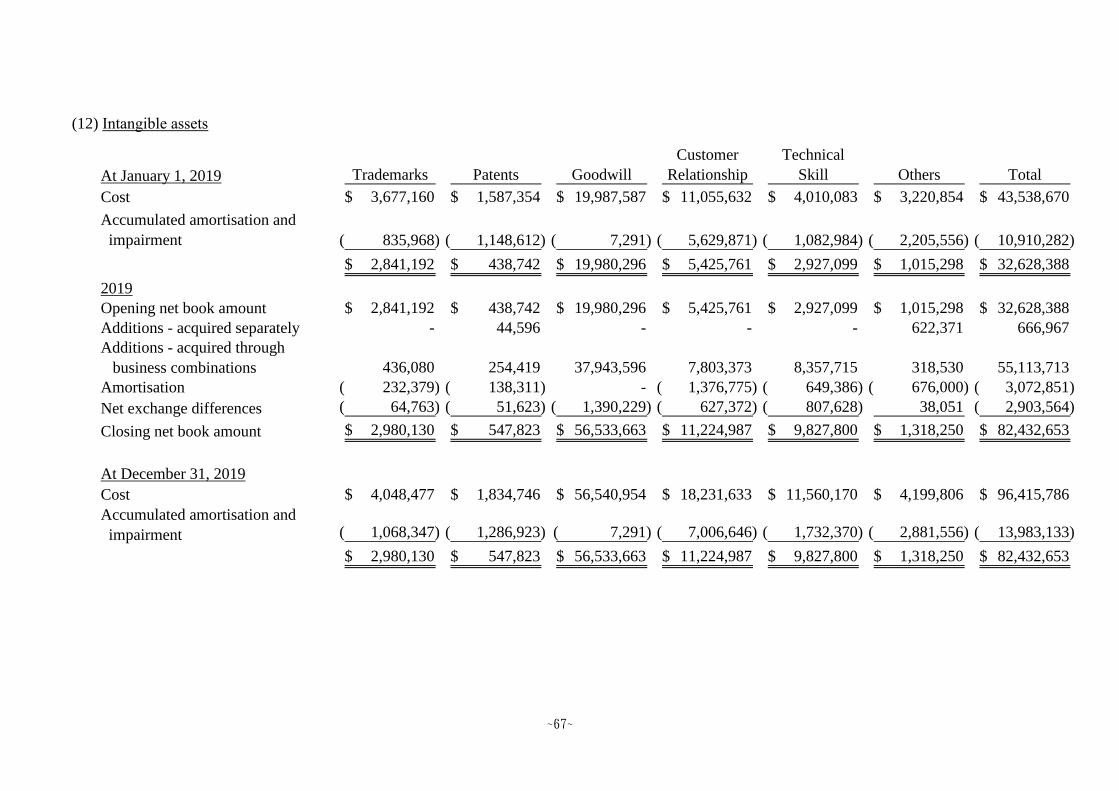
~67~
(12) Intangible assets
Customer Technical
At January 1, 2019 Trademarks Patents Goodwill Relationship Skill Others Total
Cost 3,677,160$ 1,587,354$ 19,987,587$ 11,055,632$ 4,010,083$ 3,220,854$ 43,538,670$
Accumulated amortisation and
impairment 835,968)( 1,148,612)( 7,291)( 5,629,871)( 1,082,984)( 2,205,556)( 10,910,282)(
2,841,192$ 438,742$ 19,980,296$ 5,425,761$ 2,927,099$ 1,015,298$ 32,628,388$
2019
Opening net book amount 2,841,192$ 438,742$ 19,980,296$ 5,425,761$ 2,927,099$ 1,015,298$ 32,628,388$
Additions - acquired separately - 44,596 - - - 622,371 666,967
Additions - acquired through
business combinations 436,080 254,419 37,943,596 7,803,373 8,357,715 318,530 55,113,713
Amortisation 232,379)( 138,311)( - 1,376,775)( 649,386)( 676,000)( 3,072,851)(
Net exchange differences 64,763)( 51,623)( 1,390,229)( 627,372)( 807,628)( 38,051 2,903,564)(
Closing net book amount 2,980,130$ 547,823$ 56,533,663$ 11,224,987$ 9,827,800$ 1,318,250$ 82,432,653$
At December 31, 2019
Cost 4,048,477$ 1,834,746$ 56,540,954$ 18,231,633$ 11,560,170$ 4,199,806$ 96,415,786$
Accumulated amortisation and
impairment 1,068,347)( 1,286,923)( 7,291)( 7,006,646)( 1,732,370)( 2,881,556)( 13,983,133)(
2,980,130$ 547,823$ 56,533,663$ 11,224,987$ 9,827,800$ 1,318,250$ 82,432,653$

~68~
(Note) The reclassifications resulted from the reallocation of the purchase price relative to the acquisition of Vivotek Inc.
Customer Technical
At January 1, 2018 Trademarks Patents Goodwill Relationship Skill Others Total
Cost 2,928,120$ 1,138,472$ 19,684,246$ 9,770,892$ 3,713,854$ 5,304,729$ 42,540,313$
Accumulated amortisation and
impairment 622,233)( 1,037,322)( 7,291)( 4,548,881)( 776,556)( 1,714,382)( 8,706,665)(
2,305,887$ 101,150$ 19,676,955$ 5,222,011$ 2,937,298$ 3,590,347$ 33,833,648$
2018
Opening net book amount 2,305,887$ 101,150$ 19,676,955$ 5,222,011$ 2,937,298$ 3,590,347$ 33,833,648$
Additions - acquired separately - 12,127 - - 207,851 283,479 503,457
Reclassifications (Note) 691,811 379,787 25,421)( 912,736 - 2,100,982)( 142,069)(
Amortisation 213,735)( 111,290)( - 1,080,990)( 306,428)( 491,174)( 2,203,617)(
Net exchange differences 57,229 56,968 328,762 372,004 88,378 266,372)( 636,969
Closing net book amount 2,841,192$ 438,742$ 19,980,296$ 5,425,761$ 2,927,099$ 1,015,298$ 32,628,388$
At December 31, 2018
Cost 3,677,160$ 1,587,354$ 19,987,587$ 11,055,632$ 4,010,083$ 3,220,854$ 43,538,670$
Accumulated amortisation and
impairment 835,968)( 1,148,612)( 7,291)( 5,629,871)( 1,082,984)( 2,205,556)( 10,910,282)(
2,841,192$ 438,742$ 19,980,296$ 5,425,761$ 2,927,099$ 1,015,298$ 32,628,388$

~69~
A. Details of amortisation on intangible assets are as follows:
B. The Group acquired registered or under-application trademark rights such as
, , VIVITEK, 麗訊, , and .
Trademarks are assessed to have finite useful lives. The remaining trademarks which have indefinite
useful lives shall not be amortised but are tested for impairment annually.
C. Goodwill and trademarks with indefinite useful lives are allocated as follows to the Group’s cash-
generating units identified according to operating segment:
Acquisition prices in business combination are calculated based on the price of acquisition and direct
costs for related acquisition. The amount of goodwill recognised is the difference of the acquisition
price less net fair value of identifiable assets acquired. The amortisation duration of acquisition price
may not exceed one year after the acquisition.
2019 2018
Operating costs 54,977$ 12,506$
Selling expenses 1,619,163 1,301,728
Administrative expenses 227,735 206,226
Research and development expenses 1,170,976 683,157
3,072,851$ 2,203,617$
Years ended December 31,
December 31, 2019 December 31, 2018
Goodwill:
DET 35,646,502$ -$
Eltek 5,165,460 5,292,098
Cyntec 5,146,053 5,146,053
Vivotek Inc. 3,232,954 3,232,954
DCI 2,487,284 2,548,263
DGC 1,723,340 1,780,775
Loy Tec 1,386,683 1,420,680
Amerlux 1,189,170 -
Others 556,217 559,473
56,533,663$ 19,980,296$
Trademarks:
Automation business 691,811$ 691,811$
Power electronics business 386,823 386,823
1,078,634$ 1,078,634$

~70~
D. As at December 31, 2019, the Group’s goodwill arose from business combinations amounting to
$56,533,663 in order to improve benefit comprising of potential customer relations and operating
revenue in the location of acquired companies. Based on IAS 36, goodwill acquired in a business
combination should be tested at least annually for impairment. For the impairment testing of
goodwill, goodwill acquired in a business combination is allocated to each of the cash-generating
units that are expected to benefit from the synergies of the business combination. Each company
may be a cash-generating unit which can generate independent cash flows and the impairment of
goodwill is calculated based on value in use and carrying amount of net assets of each company.
The recoverable amount of all cash-generating units calculated using the value-in-use exceeded their
carrying amount, so goodwill was not impaired. The key assumptions used for value-in-use
calculations are operating profit margin growth rate and discount rate.
Management determined budgeted operating profit margin based on past performance and its
expectations of market development. The weighted average growth rates used are consistent with
the forecasts included in industry reports. The discount rates used are pre-tax and reflect specific
risks relating to the relevant operating segments.
(13) Other non-current assets
(14) Short-term borrowings
December 31, 2019 December 31, 2018
Prepayments for business facilities 1,101,540$ 605,154$
Guarantee deposits paid 333,011 314,517
Prepayments for long-term investments 72,259 90,833
Cash surrender value of life insurance 53,953 60,780
Long-term prepaid rent - 1,052,797
Others 621,596 421,234
2,182,359$ 2,545,315$
December 31, 2019 December 31, 2018
Unsecured bank loans 7,575,932$ 6,259,062$
Credit lines 73,937,712$ 78,523,480$
Interest rate range 0.40%~9.15% 0.40%~7.13%
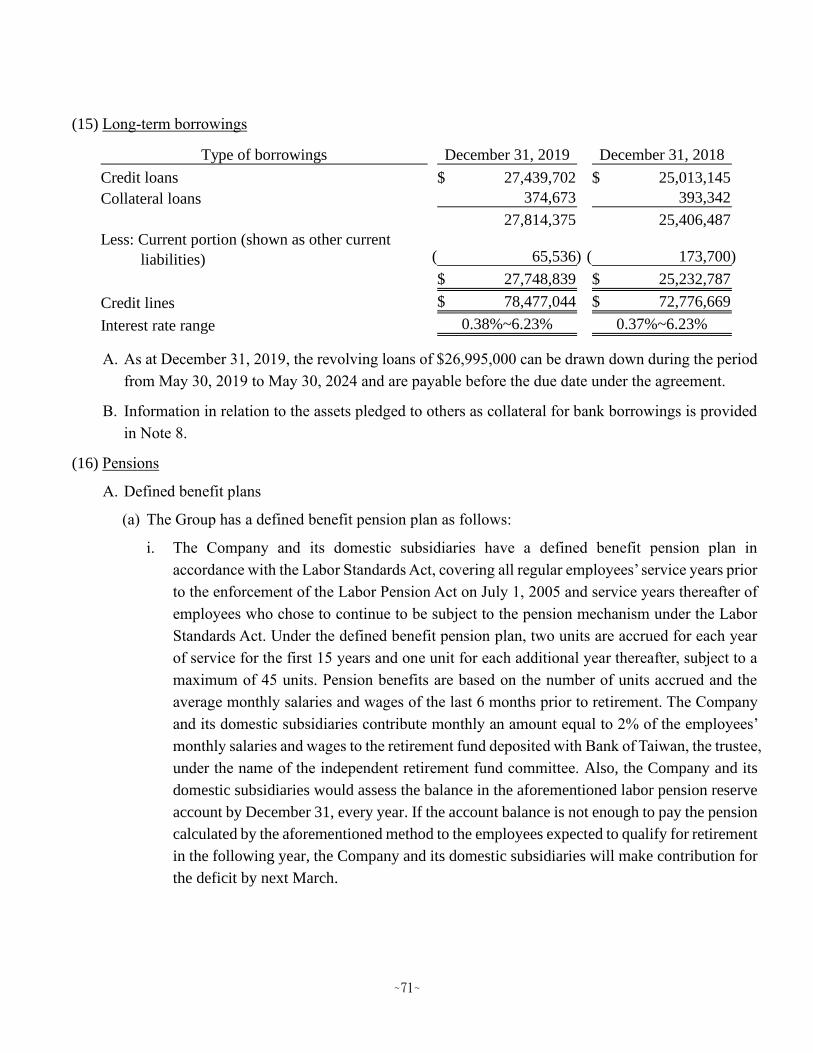
~71~
(15) Long-term borrowings
A. As at December 31, 2019, the revolving loans of $26,995,000 can be drawn down during the period
from May 30, 2019 to May 30, 2024 and are payable before the due date under the agreement.
B. Information in relation to the assets pledged to others as collateral for bank borrowings is provided
in Note 8.
(16) Pensions
A. Defined benefit plans
(a) The Group has a defined benefit pension plan as follows:
i. The Company and its domestic subsidiaries have a defined benefit pension plan in
accordance with the Labor Standards Act, covering all regular employees’ service years prior
to the enforcement of the Labor Pension Act on July 1, 2005 and service years thereafter of
employees who chose to continue to be subject to the pension mechanism under the Labor
Standards Act. Under the defined benefit pension plan, two units are accrued for each year
of service for the first 15 years and one unit for each additional year thereafter, subject to a
maximum of 45 units. Pension benefits are based on the number of units accrued and the
average monthly salaries and wages of the last 6 months prior to retirement. The Company
and its domestic subsidiaries contribute monthly an amount equal to 2% of the employees’
monthly salaries and wages to the retirement fund deposited with Bank of Taiwan, the trustee,
under the name of the independent retirement fund committee. Also, the Company and its
domestic subsidiaries would assess the balance in the aforementioned labor pension reserve
account by December 31, every year. If the account balance is not enough to pay the pension
calculated by the aforementioned method to the employees expected to qualify for retirement
in the following year, the Company and its domestic subsidiaries will make contribution for
the deficit by next March.
Type of borrowings December 31, 2019 December 31, 2018
Credit loans 27,439,702$ 25,013,145$
Collateral loans 374,673 393,342
27,814,375 25,406,487
Less: Current portion (shown as other current
liabilities) 65,536)( 173,700)(
27,748,839$ 25,232,787$
Credit lines 78,477,044$ 72,776,669$
Interest rate range 0.38%~6.23% 0.37%~6.23%

~72~
ii. Certain subsidiaries located in Mainland China maintain defined benefit retirement
(resignation) plans with relative contribution scheme. The employees and the subsidiaries
contribute an amount relatively based on a certain percentage of the monthly basic salary
depending on the employee’s position. When an employee retires or resigns, the total
contribution from the employee is reimbursed based on the accumulated contribution
(without interest) less withdrawals made by the employee in advance during the service
period. The employee is also entitled to receive benefits calculated based on the accumulated
contribution (without interest) from the related subsidiary multiplied by the approved benefit
percentage for the employee’s service years less withdrawals made by the employee in
advance during the service period. The scheme mentioned above ceased on August 1, 2004.
The amount contributed before was archived, and the payment scheme was not changed.
iii. The subsidiaries in Thailand has an obligation to pay certain retirement benefits when
employees retire based on labor regulations.
(b) The amounts recognised in the balance sheet are as follows:
December 31, 2019 December 31, 2018
Present value of defined benefit obligations 5,702,536)($ 4,176,649)($
Fair value of plan assets 1,910,802 1,603,757
Net defined benefit liability 3,791,734)($ 2,572,892)($

~73~
(c) Movements in net defined benefit liabilities are as follows:
Present value of
defined benefit Fair value of Net defined
obligations plan assets benefit liability
Year ended December 31, 2019
Balance at January 1 4,176,649)($ 1,603,757$ 2,572,892)($
Current service cost 83,801)( - 83,801)(
Interest (expense) revenue 74,784)( 18,728 56,056)(
Past service cost 107,552)( - 107,552)(
4,442,786)( 1,622,485 2,820,301)(
Remeasurements:
Return on plan assets
(excluding amounts included in
interest income or expense)
Change in demographic
assumptions 144,134)( - 144,134)(
Change in financial assumptions 110,010)( - 110,010)(
Experience adjustments 7,694 - 7,694
246,450)( 45,397 201,053)(
Pension fund contribution - 300,457 300,457
Paid pension 165,491 94,164)( 71,327
Exchange difference 27,798 493)( 27,305
Effect of business combination 1,206,589)( 37,120 1,169,469)(
Balance at December 31 5,702,536)($ 1,910,802$ 3,791,734)($
- 45,397 45,397

~74~
(d) On April 5, 2019, the Labor Protection Act (No. 7) B.E. 2562 was announced in the Royal Gazette
which will take effect on May 5, 2019. This stipulates additional legal severance pay rates for
employees who have worked for an uninterrupted period of twenty years or more, with such
employees entitled to receive not less than 400 days’ compensation based on the latest wage rate.
This change is considered a post-employment benefits plan amendment. The Group reflected the
effect of the change by recognising past service costs as expense in the income statement of the
current year.
(e) The Bank of Taiwan was commissioned to manage the Fund of the Company’s and domestic
subsidiaries’ defined benefit pension plan in accordance with the Fund’s annual investment and
utilisation plan and the “Regulations for Revenues, Expenditures, Safeguard and Utilisation of
the Labor Retirement Fund” (Article 6: The scope of utilisation for the Fund includes deposit in
domestic or foreign financial institutions, investment in domestic or foreign listed, over-the-
counter, or private placement equity securities, investment in domestic or foreign real estate
securitization products, etc.). With regard to the utilisation of the Fund, its minimum earnings in
the annual distributions on the final financial statements shall be no less than the earnings
attainable from the amounts accrued from two-year time deposits with the interest rates offered
Present value of
defined benefit Fair value of Net defined
obligations plan assets benefit liability
Year ended December 31, 2018
Balance at January 1 4,213,525)($ 1,360,130$ 2,853,395)($
Current service cost 36,684)( - 36,684)(
Interest (expense) revenue 58,972)( 16,740 42,232)(
Effect of plan amendment 6,557)( - 6,557)(
Effect of plan curtailment 4,854 - 4,854
4,310,884)( 1,376,870 2,934,014)(
Remeasurements:
Return on plan assets
(excluding amounts included in
interest income or expense) - 39,382 39,382
Change in demographic
assumptions 5,541)( - 5,541)(
Change in financial assumptions 121,114)( - 121,114)(
Experience adjustments 1,986 - 1,986
124,669)( 39,382 85,287)(
Pension fund contribution - 384,691 384,691
Paid pension 253,601 197,186)( 56,415
Exchange difference 5,303 - 5,303
Balance at December 31 4,176,649)($ 1,603,757$ 2,572,892)($

~75~
by local banks. If the earnings is less than aforementioned rates, government shall make payment
for the deficit after being authorized by the Regulator. The Company and its domestic
subsidiaries have no right to participate in managing and operating that fund and hence the
Company and its domestic subsidiaries are unable to disclose the classification of plan asset fair
value in accordance with IAS 19 paragraph 142. The composition of fair value of plan assets as
at December 31, 2019 and 2018 is given in the Annual Labor Retirement Fund Utilisation Report
announced by the government.
(f) The principal actuarial assumptions used were as follows:
Assumptions regarding future mortality experience are set based on actuarial advice in
accordance with published statistics and experience in each territory.
Because the main actuarial assumption changed, the present value of defined benefit obligation
is affected. The analysis is as follows:
The sensitivity analysis above was arrived at based on one assumption which changed while the
other conditions remain unchanged. In practice, more than one assumption may change all at
once. The method of analysing sensitivity and the method of calculating net pension liability in
the balance sheet are the same.
(g) Expected contributions to the defined benefit pension plans of the Group for the year ending
December 31, 2020 amount to $136,361.
2019 2018
Discount rate 0.75%~7.7% 1%~3.5%
Future salary increases 2.3%~9.0% 3%~3.5%
Years ended December 31,
Increase Decrease Increase Decrease
0.25%-1% 0.25%-1% 0.25%-1% 0.25%-1%
December 31,2019
Effect on present value
of defined benefit
obligation 210,467)($ 270,232$ 184,828$ 132,454)($
Increase Decrease Increase Decrease
December 31,2018 0.25% 0.25% 0.25% 0.25%
Effect on present value
of defined benefit
obligation 119,638)($ 124,611$ 115,753$ 111,798)($
Discount rate Future salary increases
Discount rate Future salary increases

~76~
(h) As at December 31, 2019, the weighted average duration of that retirement plan is 9~22 years.
B. Defined contribution plans
(a) Effective July 1, 2005, the Company and its domestic subsidiaries have established a
defined contribution pension plan (the “New Plan”) under the Labor Pension Act, covering all
regular employees with R.O.C. nationality. Under the New Plan, the Company and its domestic
subsidiaries contribute monthly an amount based on 6% of the employees’ monthly salaries and
wages to the employees’ individual pension accounts at the Bureau of Labor Insurance. The
benefits accrued are paid monthly or in lump sum upon termination of employment. The pension
costs under the defined contribution pension plans of the Company and its domestic subsidiaries
for the years ended December 31, 2019 and 2018 were $465,201 and $416,363, respectively.
(b) Other overseas companies have defined contribution plans in accordance with the local
regulations. Other than the periodic contribution, the overseas companies have no further
obligations.
(17) Share capital
A. In accordance with the Company’s Articles of Incorporation, the total authorised common stock is 4
billion shares (including 100 million shares for stock warrants conversion). As at December 31, 2019,
the total issued and outstanding common stock was 2,597,543 thousand shares with par value of $10
(in dollars) per share.
B. On December 20, 2004, the Board of Directors of the Company adopted a resolution that allowed
certain stockholders to issue 16 million units of global depository receipts (GDRs), represented by
80 million shares of common stock (Deposited Shares), with one unit of GDR representing 5 shares
of common stock. After obtaining approval from SFB, these GDRs were listed on the Securities
Exchange of Luxembourg on March 29, 2005, with total proceeds of US$134,666 thousand. The
issuance of GDRs was represented by outstanding shares, therefore, there is no dilutive effect on the
common shares’ equity. The main terms and conditions of the GDRs are as follows:
(a) Voting rights
GDR holders may, pursuant to the Depositary Agreement and the relevant laws and regulations
of the R.O.C., exercise the voting rights pertaining to the underlying common shares represented
by the GDRs.
(b) Redemption of GDRs
For sales and redemption of the underlying common shares represented by the GDRs when the
holders of the GDRs request the Depositary to redeem the GDRs in accordance with the relevant
R.O.C. regulations and the provisions in the Depositary Agreement, the Depositary may (i)
deliver the underlying common shares represented by the GDRs to the GDR holders, or (ii) sell
~77~
the underlying common shares represented by the GDRs in the R.O.C. stock market on behalf
of the GDR holder. The payment of proceeds from such sale shall be made subject to the relevant
R.O.C. laws and regulations and the provisions in the Depositary Agreement.
(c) Distribution of dividends, preemptive rights and other rights
Distribution of dividends, preemptive rights and other rights and interests of GDR units bear the
same rights as common shares.
(d) After considering the stock dividend distribution year by year, as at December 31, 2019, there
were 603 thousand units outstanding, representing 3,015 thousand common shares of the
Company’s common stock.
(18) Capital surplus
Pursuant to the R.O.C. Company Law, capital surplus arising from paid-in capital in excess of par value
on issuance of common stocks and donations can be used to cover accumulated deficit or to issue new
stocks or cash to shareholders in proportion to their share ownership, provided that the Company has
no accumulated deficit. Further, the R.O.C. Securities and Exchange Law requires that the amount of
capital surplus to be capitalised mentioned above should not exceed 10% of the paid-in capital each
year. Capital surplus should not be used to cover accumulated deficit unless the legal reserve is
insufficient.
(19) Retained earnings
A. Under the Company’s Articles of Incorporation approved by the shareholders on June 8, 2016, the
current year’s earnings, if any, shall be distributed in the following order:
(a) Payment of all taxes and dues.
(b) Offset against prior years’ operating losses, if any.
(c) Set aside 10% of the remaining amount as legal reserve, unless the accumulated amount of the
legal reserve has reached the total authorised capital of the Company.
(d) Setting aside or reversing a special reserve according to relevant regulations when necessary.
(e) The remainder along with beginning unappropriated earnings shall be stockholders’ bonus. The
appropriation of earnings shall be proposed by the Board of Directors and resolved by the
shareholders. As the Company is in the growth stage, and taking into consideration the
shareholders’ benefits, financial health and business development, the amount of bonus
distributed to shareholders shall be no less than 60% of the distributable earnings for the current
period. Cash dividends shall be at least 15% of the bonus distributed to shareholders.
B. Except for covering accumulated deficit or issuing new stocks or cash to shareholders in proportion
to their share ownership, the legal reserve shall not be used for any other purpose. The use of legal

~78~
reserve for the issuance of stocks or cash to shareholders in proportion to their share ownership is
permitted, provided that the distribution of the reserve is limited to the portion in excess of 25% of
the Company’s paid-in capital.
C. (a) In accordance with the regulations, the Company shall set aside special reserve from the debit
balance on other equity items at the balance sheet date before distributing earnings. When debit
balance on other equity items is reversed subsequently, the reversed amount could be included in
the distributable earnings.
(b) The amounts previously set aside by the Company as special reserve on initial application of IFRSs
in accordance with Jin-Guan-Zheng-Fa-Zi Letter No. 1010012865, dated April 6, 2012, shall be
reversed proportionately when the relevant assets are used, disposed of or reclassified
subsequently. Such amounts are reversed upon disposal or reclassified if the assets are investment
property of land, and reversed over the use period if the assets are investment property other than
land.
D. The appropriations of 2018 and 2017 earnings had been approved by the shareholders during their
meeting on June 10, 2019 and June 11, 2018, respectively. Details are summarised below:
Information about the appropriation of earnings will be posted in the “Market Observation Post
System” at the website of the Taiwan Stock Exchange.
E. The appropriations of 2019 earnings had been proposed by the Board of Directors on March 10,
2020. Details are summarised below:
As at March 10, 2020, the abovementioned 2019 earnings appropriation has not yet been approved
by the stockholders.
Dividends Dividends
per share per share
Amount (in dollars) Amount (in dollars)
Legal reserve appropriated 1,819,310$ 1,838,056$
Special reserve appropriated 472,889 4,320,394
Cash dividends 12,987,717 5.0$ 12,987,717 5.0$
Years ended December 31,
2018 2017
Dividends per share
Amount (in dollars)
Legal reserve appropriated 2,311,780$
Special reserve appropriated 61,002
Cash dividends 12,987,717 5.0$
Year ended December 31, 2019

~79~
F. For the information relating to employees’ compensation and directors’ remuneration, please refer
to Note 6(26).
(20) Non-controlling interest
(Note 1) The increase in non-controlling interest is mainly due to the acquisition of share capital of
DET in 2019.
(Note 2) The decrease in non-controlling interest is mainly due to the acquisition of additional equity
interest in Loy Tec, DIH and Vivotek Inc. during the years ended December 31, 2019 and
2018, respectively. Details are provided in Note 6(31).
(21) Operating revenue
A. Disaggregation of revenue from contracts with customers
The Group derives revenue from the transfer of goods and services over time and at a point in time
in the following major business:
2019 2018
At January 1 9,189,749$ 9,216,505$
Share attributable to non-controlling interest:
Profit for the year 809,959 455,491
Currency translation differences 890,552 18,709)(
Dividends paid to minority interest 2,320,171)( 369,183)(
Increase in non-controlling interest (Note 1) 30,575,137 -
Decrease in non-controlling interest (Note 2) 4,947,661)( 94,355)(
At December 31 34,197,565$ 9,189,749$
Years ended December 31,
2019 2018
Revenue from contracts with customers 268,131,397$ 237,017,809$
Years ended December 31,
Power electronics Automation Infrastructure Others Total
Revenue from external
customer contracts 133,069,546$ 37,605,027$ 96,724,182$ 732,642$ 268,131,397$
Timing of revenue
recognition
At a point in time 132,559,649 33,397,404 91,506,014 693,223 258,156,290
Over time 509,897 4,207,623 5,218,168 39,419 9,975,107
133,069,546$ 37,605,027$ 96,724,182$ 732,642$ 268,131,397$
Year ended December 31, 2019

~80~
B. Contract assets and liabilities
The Group has recognised the revenue-related contract assets primarily from automation equipment
contracts and resolution of communication equipment power resource system; contract liabilities
primarily pertain to advance sales receipts, advance receipts for automation equipment contract and
resolution of communication equipment power resource system, etc.
Revenue recognised that was included in the contract liability balance at the beginning of the period
is as follows:
(22) Other income
Power electronics Automation Infrastructure Others Total
Revenue from external
customer contracts 107,376,799$ 35,177,393$ 92,956,980$ 1,506,637$ 237,017,809$
Timing of revenue
recognition
At a point in time 106,523,370 30,039,610 86,866,945 1,456,724 224,886,649
Over time 853,429 5,137,783 6,090,035 49,913 12,131,160
107,376,799$ 35,177,393$ 92,956,980$ 1,506,637$ 237,017,809$
Year ended December 31, 2018
2019 2018
Revenue recognised that was included in the contract
liability balance at the beginning of the year
Advance sales receipts, advance receipts for automation
equipment contract and resolution of communication
equipment power resource system, etc. 2,643,318$ 1,693,773$
Years ended December 31,
2019 2018
Interest income:
Interest income from bank deposits 886,537$ 851,185$
Rental income 132,678 114,844
Dividend income 282,302 181,942
Others 2,735,649 3,225,620
4,037,166$ 4,373,591$
Years ended December 31,

~81~
(23) Other gains and losses
(Note) The Group recognised a gain as a result of measuring at fair value its 20.93% equity interest in
DET held before the business combination. Please refer to Note 6(30) for more information.
(24) Finance costs
(25) Expenses by nature
2019 2018
(Loss) gain on disposal of property, plant and
equipment 56,441)($ 274,921$
Gain on disposal of investments (Note) 6,001,894 -
Net currency exchange gain 454,685 534,511
Gain (loss) on financial assets/liabilities at fair
value through profit or loss 365,965 202,545)(
Reversal of impairment loss:
Reversal of impairment loss on property, plant
and equipment 90,215 -
Miscellaneous disbursements 551,873)( 741,459)(
6,304,445$ 134,572)($
Years ended December 31,
2019 2018
Interest expense 731,745$ 545,804$
Loss on hedging instruments 6,124 2,900
$ 737,869 $ 548,704
Years ended December 31,
2019 2018
Employee benefit expense 55,884,650$ 47,419,926$
Depreciation charges on property, plant and
equipment 10,287,257 8,792,182
Depreciation charges on right-of-use assets 625,337 -
Amortisation charges on intangible assets 3,072,851 2,203,617
69,870,095$ 58,415,725$
Years ended December 31,
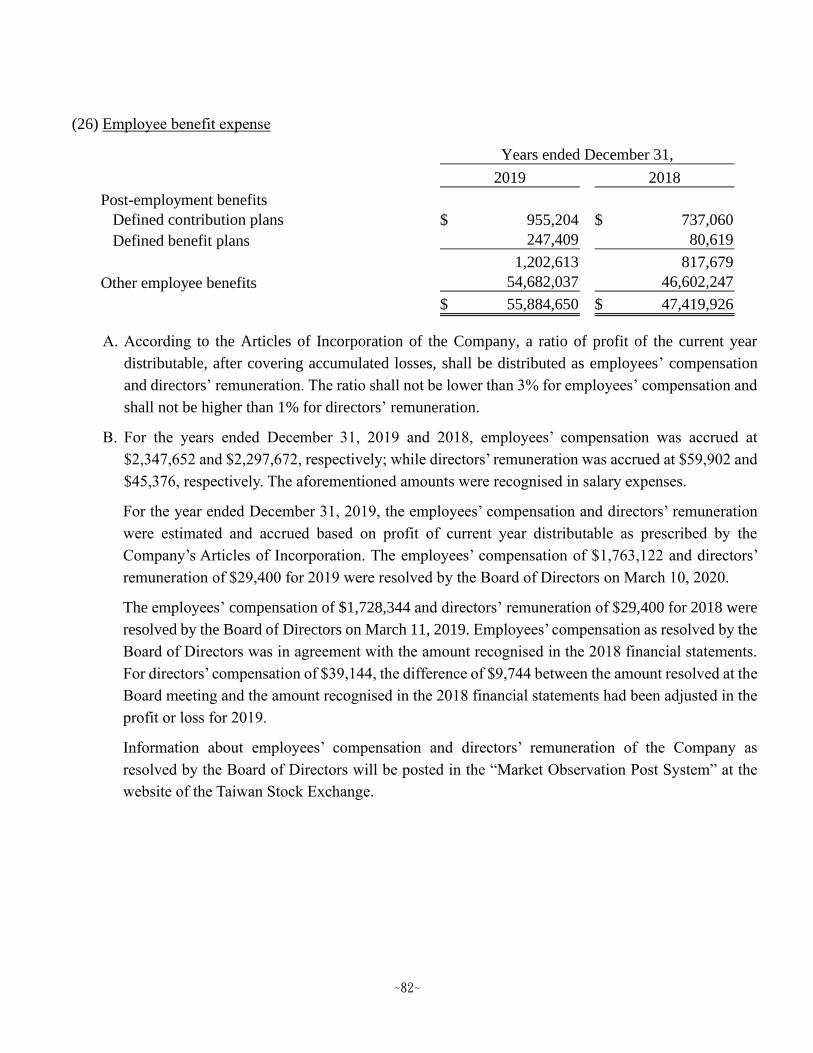
~82~
(26) Employee benefit expense
A. According to the Articles of Incorporation of the Company, a ratio of profit of the current year
distributable, after covering accumulated losses, shall be distributed as employees’ compensation
and directors’ remuneration. The ratio shall not be lower than 3% for employees’ compensation and
shall not be higher than 1% for directors’ remuneration.
B. For the years ended December 31, 2019 and 2018, employees’ compensation was accrued at
$2,347,652 and $2,297,672, respectively; while directors’ remuneration was accrued at $59,902 and
$45,376, respectively. The aforementioned amounts were recognised in salary expenses.
For the year ended December 31, 2019, the employees’ compensation and directors’ remuneration
were estimated and accrued based on profit of current year distributable as prescribed by the
Company’s Articles of Incorporation. The employees’ compensation of $1,763,122 and directors’
remuneration of $29,400 for 2019 were resolved by the Board of Directors on March 10, 2020.
The employees’ compensation of $1,728,344 and directors’ remuneration of $29,400 for 2018 were
resolved by the Board of Directors on March 11, 2019. Employees’ compensation as resolved by the
Board of Directors was in agreement with the amount recognised in the 2018 financial statements.
For directors’ compensation of $39,144, the difference of $9,744 between the amount resolved at the
Board meeting and the amount recognised in the 2018 financial statements had been adjusted in the
profit or loss for 2019.
Information about employees’ compensation and directors’ remuneration of the Company as
resolved by the Board of Directors will be posted in the “Market Observation Post System” at the
website of the Taiwan Stock Exchange.
2019 2018
Post-employment benefits
Defined contribution plans 955,204$ 737,060$
Defined benefit plans 247,409 80,619
1,202,613 817,679
Other employee benefits 54,682,037 46,602,247
55,884,650$ 47,419,926$
Years ended December 31,

~83~
(27) Income tax
A. Income tax expense
(a) Components of income tax expense:
(b) The income tax (charge)/credit relating to components of other comprehensive income is as
follows:
2019 2018
Current tax:
Current tax on profits for the year 4,263,471$ 4,663,669$
Effect from Alternative Minimun Tax 9,188 612
Prior year income tax (overestimation)
underestimation 794,471)( 448,246
Tax on undistributed surplus earnings 204,850 3,349
Total current tax 3,683,038 5,115,876
Deferred tax:
Origination and reversal of temporary
differences 1,543,615 1,579,877)(
Impact of change in tax rate - 616,445
Total deferred tax 1,543,615 963,432)(
5,226,653$ 4,152,444$
Years ended December 31,
2019 2018
Currency translation differences 540,534$ 186,751$
Gain or loss on hedging instruments 13,404)( 10,625)(
Remeasurement of defined benefit
obligations 6,088)( 17,833)(
Unrealised gain or loss on financial assets
measured at fair value through other
comprehensive income - 86,244
Impact of change in tax rate - 226,071)(
521,042$ 18,466$
Years ended December 31,

~84~
B. Reconciliation between income tax expense and accounting profit:
2019 2018
Tax calculated based on profit before tax and
statutory tax rate
8,895,739$ 6,392,592$
Effect from items disallowed by tax regulation 2,330,177)( 2,861,011)(
Effect from investment tax credits 467,938)( 449,194)(
Effect from taxable loss 290,538)( 41,921)(
Prior year income tax (overestimation)
underestimation 794,471)( 448,246
Change in assessment of realisation of
deferred tax assets - 43,326
Effect from Alternative Minimum Tax 9,188 612
Tax on undistributed surplus earnings 204,850 3,349
Impact of change in tax rate - 616,445
Tax expenses 5,226,653$ 4,152,444$
Years ended December 31,

~85~
C. Amounts of deferred tax assets or liabilities as a result of temporary differences and tax losses are as follows:
Recognised
in other
Acquired
through
Recognised in comprehensive Recognised business
January 1 profit or loss income in equity combination December 31
Deferred tax assets:
-Temporary differences:
Allowance for inventory obsolescence 571,917$ 212,398$ -$ -$ -$ 784,315$
Pension liability 445,400 46,834 6,088 - - 498,322
Assets impairment 200,743 16,786)( - - - 183,957
Depreciation difference between tax and
financial basis
1,391,168 140,398)( - - - 1,250,770
Others 3,264,169 49,482)( - - 244,895 3,459,582
Tax losses 306,088 196,371 - - - 502,459
6,179,485 248,937 6,088 - 244,895 6,679,405
Deferred tax liabilities:
-Temporary differences:
Long-term equity investments 9,280,608)( 1,451,256)( 540,534)( 123 - 11,272,275)(
Land value increment tax 119,862)( - - - - 119,862)(
Others 2,168,962)( 341,296)( 13,404 - 119,870)( 2,616,724)(
11,569,432)( 1,792,552)( 527,130)( 123 119,870)( 14,008,861)(
5,389,947)($ 1,543,615)($ 521,042)($ 123$ 125,025$ 7,329,456)($
2019

~86~
Recognised
in other
Recognised in comprehensive Recognised
January 1 profit or loss income in equity December 31
Deferred tax assets:
-Temporary differences:
Allowance for inventory obsolescence 559,686$ 12,231$ -$ -$ 571,917$
Pension liability 414,995 8,209 22,196 - 445,400
Assets impairment 307,330 106,587)( - - 200,743
Depreciation difference between tax and
financial basis
1,648,197 257,029)( - - 1,391,168
Others 2,420,107 844,062 - - 3,264,169
Tax losses 486,280 180,192)( - - 306,088
5,836,595 320,694 22,196 - 6,179,485
Deferred tax liabilities:
-Temporary differences:
Long-term equity investments 10,010,951)( 759,137 39,315 68,109)( 9,280,608)(
Land revaluation increment tax 119,862)( - - - 119,862)(
Others 1,972,586)( 116,399)( 79,977)( - 2,168,962)(
12,103,399)( 642,738 40,662)( 68,109)( 11,569,432)(
6,266,804)($ 963,432$ 18,466)($ 68,109)($ 5,389,947)($
2018

~87~
D. Expiration dates of unused net operating loss carryforward and amounts of unrecognised deferred
tax assets are as follows:
E. The amounts of deductible temporary differences that were not recognised as deferred tax assets
are as follows:
F. The Group has not recognised taxable temporary differences associated with investment in
subsidiaries as deferred tax liabilities. As at December 31, 2019 and 2018, the amounts of
temporary differences unrecognised as deferred tax liabilities were $9,690,116 and $8,752,128,
respectively.
G. The status of the Company and its domestic subsidiaries’ assessed and approved income tax
returns are as follows:
H. Under the amendments to the Income Tax Act which was promulgated by the President of the
Republic of China on February 7, 2018, the Company’s applicable income tax rate was raised
from 17% to 20% effective from January 1, 2018. The Group has assessed the impact of the
change in income tax rate.
Unrecognised
Amount filed / deferred Usable until
Year incurred assessed Unused amount tax assets year
2004-2019 6,015,563$ 5,993,504$ 5,605,653$ 2035
2010-2016 3,087,022$ 3,087,022$ 1,579,274$ indefinitely usable
Unrecognised
Amount filed / deferred Usable until
Year incurred assessed Unused amount tax assets year
2003-2018 6,450,211$ 6,146,359$ 3,836,320$ 2028
2006-2014 580,924$ 580,924$ 87,996$ indefinitely usable
December 31, 2019
December 31, 2018
December 31, 2019 December 31, 2018
Deductible temporary differences 4,039,284$ 180,764$
Latest year
assessed by
Tax Authority
The Company, DNIT, DECC, Vivotek, Lidlight Inc., AMT,
DelBio, Cyntec, UNICOM SYSTEM ENG. CORP.,
Power Forest Technology Corporation, Vatics Inc.,
Realwin Investment Inc., Otus Imaging, Inc. and Aetek Inc.
2017

~88~
(28) Earnings per share
Weighted average
number of
ordinary shares Earnings
Amount outstanding per share
after tax (shares in thousands) (in dollars)
Basic earnings per share
Profit attributable to ordinary
shareholders of the parent 23,117,797$ 2,597,543 8.90$
Diluted earnings per share
Profit attributable to ordinary
shareholders of the parent 23,117,797$ 2,597,543
Assumed conversion of all
dilutive potential ordinary
shares:
Employees’ compensation - 13,840
Profit attributable to ordinary
shareholders of the parent
plus assumed conversion of
all dilutive potential ordinary
shares 23,117,797$ 2,611,383 8.85$
Weighted average
number of
ordinary shares Earnings
Amount outstanding per share
after tax (shares in thousands) (in dollars)
Basic earnings per share
Profit attributable to ordinary
shareholders of the parent 18,193,093$ 2,597,543 7.00$
Diluted earnings per share
Profit attributable to ordinary
shareholders of the parent 18,193,093$ 2,597,543
Assumed conversion of all
dilutive potential ordinary
shares:
Employees’ compensation - 15,964
Profit attributable to ordinary
shareholders of the parent
plus assumed conversion of
all dilutive potential ordinary
shares 18,193,093$ 2,613,507 6.96$
Year ended December 31, 2019
Year ended December 31, 2018

~89~
(29) Share-based payment
A. For the years ended December 31, 2019 and 2018, the Group’s share-based payment
arrangements were as follows:
B. Details of the share-based payment arrangements are as follows:
(a) Employee share options
Quantity Contract
Type of arrangement Grant date granted period Vesting conditions
1,000,000 1 year’s service: 40% vested
2 years’ service: 70% vested
3 years’ service: 100% vested
500,000 1 year’s service: 40% vested
2 years’ service: 70% vested
3 years’ service: 100% vested
Vatics Inc. - Employee stock
options
2016.11.8 2,116,000 3 years 1~3 years’ service
Vivotek Inc. - Plan of
restricted stocks to
employees
2017.11.20 700,000 2 years 1~2 years’ performance
〃 2019.8.19 800,000 2 years 1~2 years’ performance
Power Forest - Employee
stock options
2017.3.3 6 years
〃 2018.3.30 6 years
Weighted-average Weighted-average
exercise price exercise price
options (in dollars) options (in dollars)
Options outstanding
opening balance at
January 1 1,960,000 15.72$ 2,742,000 15.95$
Options granted - - 500,000 15.00
Options forfeited 227,000)( 15.00 241,000)( 15.00
Options exercised - - 242,000)( 15.00
Options expired 61,000)( 16.50 799,000)( 16.50
Options outstanding
at December 31 1,672,000 15.79$ 1,960,000 15.72$
Options exercisable at
December 31 1,267,000 16.04$ 807,250 16.31$
Years ended December 31,
2019 2018
No. of No. of
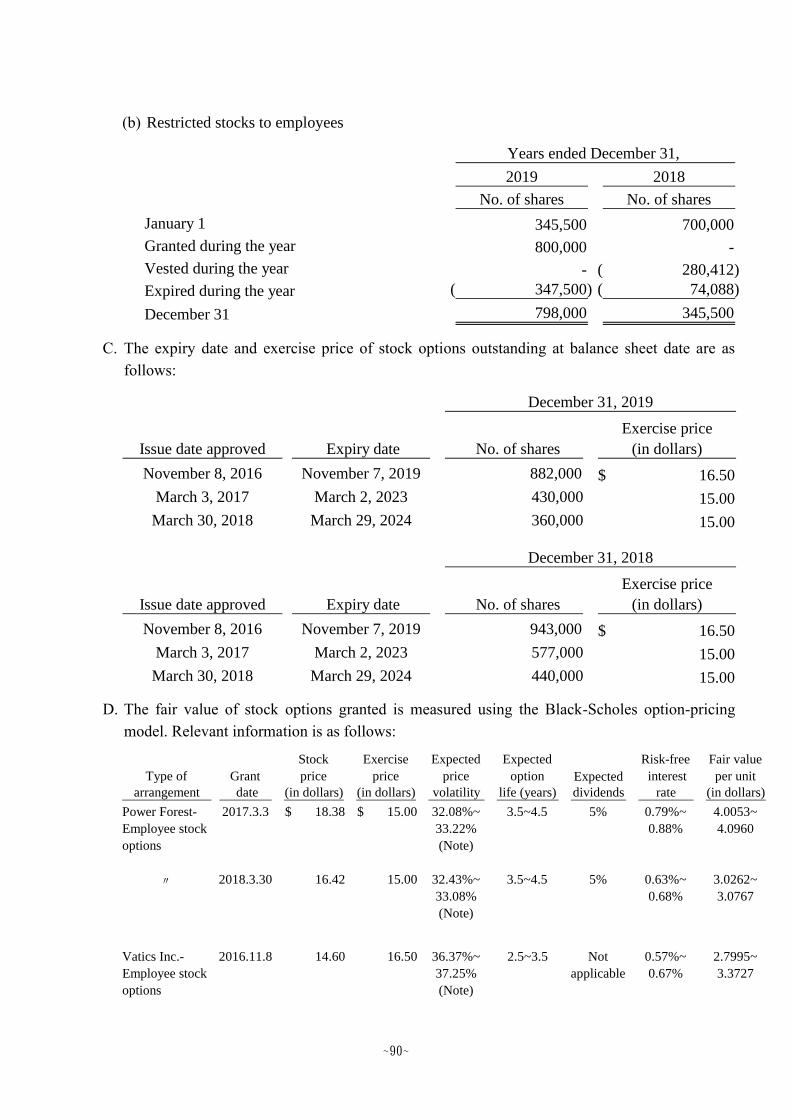
~90~
(b) Restricted stocks to employees
C. The expiry date and exercise price of stock options outstanding at balance sheet date are as
follows:
D. The fair value of stock options granted is measured using the Black-Scholes option-pricing
model. Relevant information is as follows:
2019 2018
No. of shares No. of shares
January 1 345,500 700,000
Granted during the year 800,000 -
Vested during the year - 280,412)(
Expired during the year 347,500)( 74,088)(
December 31 798,000 345,500
Years ended December 31,
Exercise price
Issue date approved Expiry date No. of shares (in dollars)
November 8, 2016 November 7, 2019 882,000 16.50$
March 3, 2017 March 2, 2023 430,000 15.00
March 30, 2018 March 29, 2024 360,000 15.00
Exercise price
Issue date approved Expiry date No. of shares (in dollars)
November 8, 2016 November 7, 2019 943,000 16.50$
March 3, 2017 March 2, 2023 577,000 15.00
March 30, 2018 March 29, 2024 440,000 15.00
December 31, 2019
December 31, 2018
Type of Grant
Stock
price
Exercise
price
Expected
price
Expected
option Expected
Risk-free
interest
Fair value
per unit
arrangement date (in dollars) (in dollars) volatility life (years) dividends rate (in dollars)
Power Forest-
Employee stock
options
2017.3.3 $ 18.38 $ 15.00 32.08%~
33.22%
(Note)
3.5~4.5 5% 0.79%~
0.88%
4.0053~
4.0960
〃 2018.3.30 16.42 15.00 32.43%~
33.08%
(Note)
3.5~4.5 5% 0.63%~
0.68%
3.0262~
3.0767
Vatics Inc.-
Employee stock
options
2016.11.8 14.60 16.50 36.37%~
37.25%
(Note)
2.5~3.5 Not
applicable
0.57%~
0.67%
2.7995~
3.3727

~91~
Note: Expected price volatility rate was estimated by using the stock prices of the most recent
period with length of this period approximate to the length of the stock options’ expected
life, and the standard deviation of return on the stock during this period.
E. Expenses incurred on share-based payment transactions are shown below:
(30) Business combinations
A. On April 2, 2019, the Group acquired 42.85% of the share capital of the Group’s associate, DET,
for $36,874,645 and obtained control over DET. As a result of the acquisition, the Group is
expected to decrease its risk on global trade and extend global business. On June 1, 2019, the
Group acquired 100% of the share capital of Amerlux for $2,844,498 and obtained control over
Amerlux. As a result of the acquisition, the Group is expected to improve the product mix of
lighting fixture and provide completed solutions to customers. The amortisation duration of
acquisition price for Amerlux will complete in one year after the acquisition.
B. The following table summarises the consideration paid for DET and Amerlux and the fair values
of the assets acquired and liabilities assumed at the acquisition date, as well as the fair value of
the non-controlling interest at the acquisition date:
Type of Grant
Stock
price
Exercise
price
Expected
price
Expected
option Expected
Risk-free
interest
Fair value
per unit
arrangement date (in dollars) (in dollars) volatility life (years) dividends rate (in dollars)
Vivotek Inc.-
Plan of
restricted stocks
to employees
2017.11.20 97.20 - Not
applicable
1~2 Not
applicable
Not
applicable
97.2000
〃 2019.8.19 102.50 - Not
applicable
1~2 Not
applicable
Not
applicable
102.5000
2019 2018
Equity-settled $ 41,176 ($ 5,282)
Years ended December 31,

~92~
C. The fair value of Amerlux of the acquired identifiable intangible assets and goodwill of $979,600
and $1,253,428 is provisional pending receipt of the final valuations for those assets.
D. The Group originally held 20.93% of share ownership in DET before the business combination.
Gain on remeasurement of fair value amounted to $5,925,521.
E. The operating revenue included in the consolidated statement of comprehensive income since
April 2, 2019 and June 1, 2019 contributed by DET and Amerlux were $29,052,688 and
$1,658,205, respectively. DET and Amerlux also contributed profit before income tax amounting
to $290,505 and $116,978 over the same period, respectively. Had the companies been
consolidated from January 1, 2019, the consolidated statement of comprehensive income would
show operating revenue of $278,665,788 and profit before income tax of $29,561,067.
(31) Transactions with non-controlling interest - Acquisition of additional equity interest in a subsidiary
In March and December 2019, the Group acquired an additional 15% and 6% of shares of Loy Tec
and DIH for a total cash consideration of $372,338 and $3,904,000, respectively. The effect of
changes in interests attributable to owners of the parent for the year ended December 31, 2019 is
shown below:
December 31, 2019
Purchase consideration
Cash 39,719,143$
Contingent consideration 271,048
39,990,191
Fair value of equity interest in DET Company held before the
business combination 18,057,035
Fair value of the non-controlling interest 30,575,137
88,622,363
Fair value of the identifiable assets acquired and liabilities assumed
Cash and cash equivalents 15,701,128
Other current assets 22,719,840
Property, plant and equipment 9,984,301
Intangible assets 17,170,117
Deferred tax assets 244,895
Other non-current assets 281,247
Other current liabilities 13,250,975)(
Deferred tax liabilities 119,870)(
Other non-current liabilities 2,051,916)(
Total identifiable net assets 50,678,767
Goodwill 37,943,596$

~93~
(32) Changes in liabilities from financing activities
7. RELATED PARTY TRANSACTIONS
(1) Names and relationship of related parties
Loy Tec DIH Total
Carrying amount of non-
controlling interest acquired
369,887$ 4,577,774$ 4,947,661$
Consideration paid to non-
controlling interest 372,338)( 3,904,000)( 4,276,338)(
Capital surplus - difference
between proceeds on actual
acquisition of or disposal of
equity interest in a subsidiary
and its carrying amount 2,451)($ 673,774$ 671,323$
Year ended December 31, 2019
Long-term
borrowings Liabilities from
Short-term (including current financing
borrowings portion) activities-gross
At January 1, 2019 6,259,062$ 25,406,487$ 31,665,549$
Changes in cash flow from
financing activities 1,316,870 2,407,888 3,724,758
At December 31, 2019 7,575,932$ 27,814,375$ 35,390,307$
Long-term
borrowings Liabilities from
Short-term (including current financing
borrowings portion) activities-gross
At January 1, 2018 17,463,509$ 11,267,688$ 28,731,197$
Changes in cash flow from
financing activities 11,204,447)( 14,138,799 2,934,352
At December 31, 2018 6,259,062$ 25,406,487$ 31,665,549$
Names and relationship of related parties Relationship with the Group
Delta Electronics (Thailand) Public Company Limited It is an associate before April 2, 2019, and
has been a subsidiary since April 2, 2019
Delta Electronics (Slovakia) s.r.o. "
Delta Electronics India Pvt. Ltd. "
Delta Energy Systems (Singapore) PTE. LTD. "
Delta Energy Systems (Australia) Pty. Ltd. "
Eltek s.r.o. "

~94~
(2) Significant transactions and balances with related parties
A. Operating revenue
The sales terms, including prices and collections, were negotiated based on cost, market,
competitors and other factors. Sales of services are negotiated with related parties on a cost-plus
basis.
B. Purchases of goods
The purchase terms, including prices and payments, were negotiated based on cost, market,
competitors and other factors.
C. Period-end balances arising from sales of goods
The receivables from related parties arise mainly from sales transactions. The receivables are due
75 days after the date of sale. The receivables are unsecured in nature and bear no interest.
D. Period-end balances arising from purchases of goods
The payables to related parties arise mainly from purchase transactions and are due 70 days after
Names and relationship of related parties Relationship with the Group
Delta Power Solutions (India) Pvt. Ltd. Merged with Delta Electronics India Pvt.
Ltd. in February 2019
Digital Projection Ltd. Associate
Digital Projection Inc. "
2019 2018
Sales of goods:
Associates 1,973,449$ 4,631,945$
Sales of services:
Associates 426,003 1,672,968
2,399,452$ 6,304,913$
Years ended December 31,
2019 2018
Purchases of goods:
Associates 1,515,592$ 7,004,953$
Years ended December 31,
December 31, 2019 December 31, 2018
Receivables from related parties:
Associates 263,644$ 1,722,114$
December 31, 2019 December 31, 2018
Payables to related parties:
Associates 32,197$ 1,484,335$

~95~
the date of purchase. The payables bear no interest.
E. Period-end balances arising from other transactions
The above pertain mainly to payments on behalf of others.
F. Disposal of other assets
For the year ended December 31, 2019, the Group has not disposed equipment to related parties.
(3) Key management compensation
8. PLEDGED ASSETS
The Group’s assets pledged as collateral are as follows:
9. SIGNIFICANT CONTINGENT LIABILITIES AND UNRECOGNISED CONTRACT
COMMITMENTS
(1) Contingencies
None.
December 31, 2019 December 31, 2018
Other receivables-related parties
Associates 532$ 99,389$
Items Proceeds Gain
Associates Other equipment 53,048$ 17,465$
Year ended December 31, 2018
2019 2018
Short-term employee benefits 278,719$ 450,556$
Post-employment benefits 920 3,204
279,639$ 453,760$
Years ended December 31,
December 31, December 31,
Pledged assets 2019 2018 Pledge purpose
Demand deposits (shown as
other current assets)
44,856$ 127,251$ Performance bonds
Time deposits (shown as
other current assets)
232,150 147,901 Perfermance bonds,
customs deposits and
other guarantee deposits
Time deposits (shown as
other non-current assets)
49,505 - Customs deposits
Property, plant and
equipment 578,606 588,052
Long-term borrowings and
credit line
905,117$ 863,204$
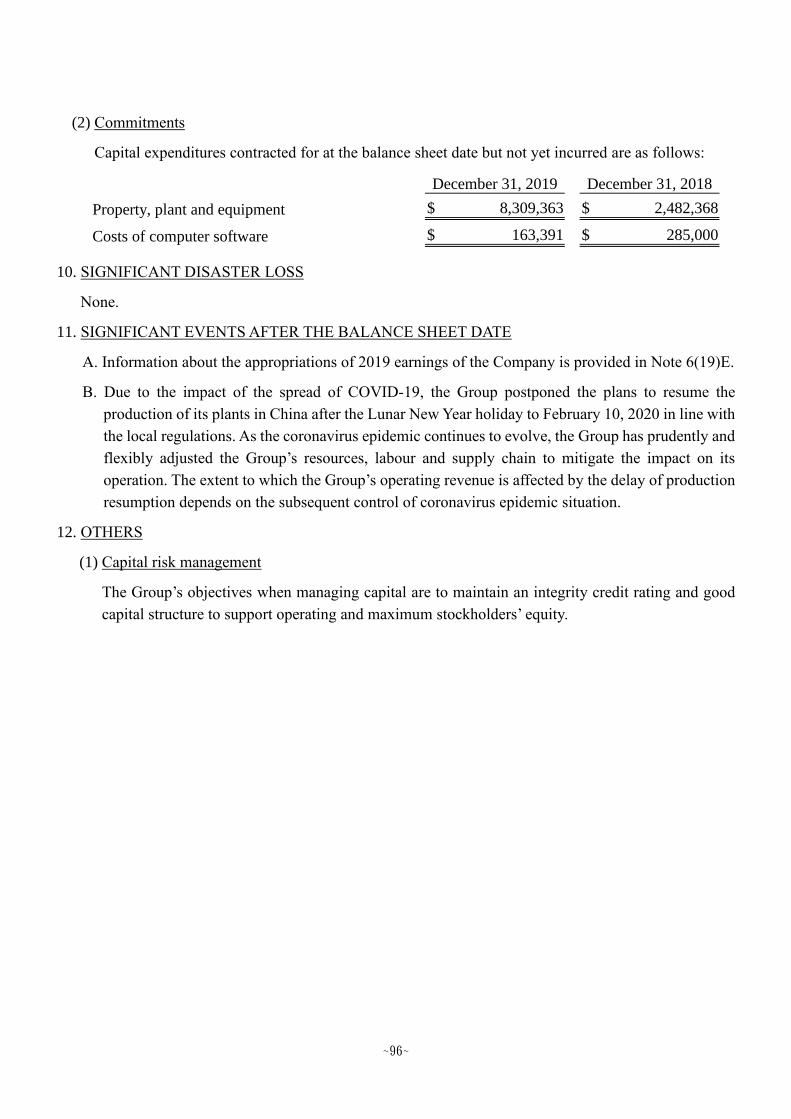
~96~
(2) Commitments
Capital expenditures contracted for at the balance sheet date but not yet incurred are as follows:
10. SIGNIFICANT DISASTER LOSS
None.
11. SIGNIFICANT EVENTS AFTER THE BALANCE SHEET DATE
A. Information about the appropriations of 2019 earnings of the Company is provided in Note 6(19)E.
B. Due to the impact of the spread of COVID-19, the Group postponed the plans to resume the
production of its plants in China after the Lunar New Year holiday to February 10, 2020 in line with
the local regulations. As the coronavirus epidemic continues to evolve, the Group has prudently and
flexibly adjusted the Group’s resources, labour and supply chain to mitigate the impact on its
operation. The extent to which the Group’s operating revenue is affected by the delay of production
resumption depends on the subsequent control of coronavirus epidemic situation.
12. OTHERS
(1) Capital risk management
The Group’s objectives when managing capital are to maintain an integrity credit rating and good
capital structure to support operating and maximum stockholders’ equity.
December 31, 2019 December 31, 2018
Property, plant and equipment 8,309,363$ 2,482,368$
Costs of computer software 163,391$ 285,000$

~97~
(2) Financial instruments
A. Financial instruments by category
B. Financial risk management policies
The Group’s activities expose it to a variety of financial risks: market risk (including foreign
exchange risk, interest rate risk and price risk), credit risk and liquidity risk. The Group’s overall
risk management programme focuses on the unpredictability of financial markets and seeks to
minimise potential adverse effects on the Group’s financial position and financial performance.
The Group uses derivative financial instruments to hedge certain risk exposures (see Note 6(2)).
December 31, 2019 December 31, 2018
Financial assets
Financial assets at fair value through
profit or loss
Financial assets mandatorily measured
at fair value through profit or loss 3,347,697$ 3,392,915$
Financial assets at fair value through
other comprehensive income
Selected designated investments in
equity instruments 2,117,124$ 2,977,994$
Financial assets at amortised cost
Cash and cash equivalents 43,960,001$ 59,618,697$
Notes receivable 3,816,628 4,091,231
Accounts receivable 53,218,750 53,775,610
Other receivables 1,480,157 856,397
Guarantee deposits paid 333,011 314,517
Other financial assets 326,511 275,152
103,135,058$ 118,931,604$
Financial liabilities
Financial liabilities at fair value through
profit or loss
Financial liabilities designated as at fair
value through profit or loss 15,929$ 8,544$
Financial liabilities at amortised cost
Short-term borrowings 7,575,932$ 6,259,062$
Notes payable 21,669 7,955
Accounts payable 39,510,659 40,501,108
Other accounts payable 28,829,379 24,786,588
Lease liability (including current portion) 1,946,635 -
Long-term borrowings
(including current portion) 27,814,375 25,406,487
Guarantee deposits received 387,488 87,287
106,086,137$ 97,048,487$

~98~
C. Significant financial risks and degrees of financial risks
(a) Market risk
Foreign exchange risk
i. The Group operates internationally and is exposed to foreign exchange risk arising from
various currency exposures, primarily with respect to the USD, RMB and EUR. Foreign
exchange risk arises from future commercial transactions, recognised assets and liabilities
and net investments in foreign operations.
ii. Management has set up a policy to require group companies to manage their foreign
exchange risk against their functional currency. To manage their foreign exchange risk
arising from future commercial transactions and recognised assets and liabilities, entities
in the Group use forward foreign exchange contracts, foreign exchange swap contracts
and options, transacted with Group treasury.
iii. The Group adopts the derivative financial instruments like forward exchange contracts /
forward exchange transactions, etc. to hedge the fair value risk and cash flow risk due to
foreign exchange rate fluctuations. The Group monitors at any time and pre-sets a “stop
loss” amount to limit its foreign exchange risk.
iv. The Group’s businesses involve some non-functional currency operations (the Company’s
and certain subsidiaries’ functional currency: NTD; other certain subsidiaries’ functional
currency: USD and RMB). The information on assets and liabilities denominated in
foreign currencies whose values would be materially affected by the exchange rate
fluctuations is as follows:
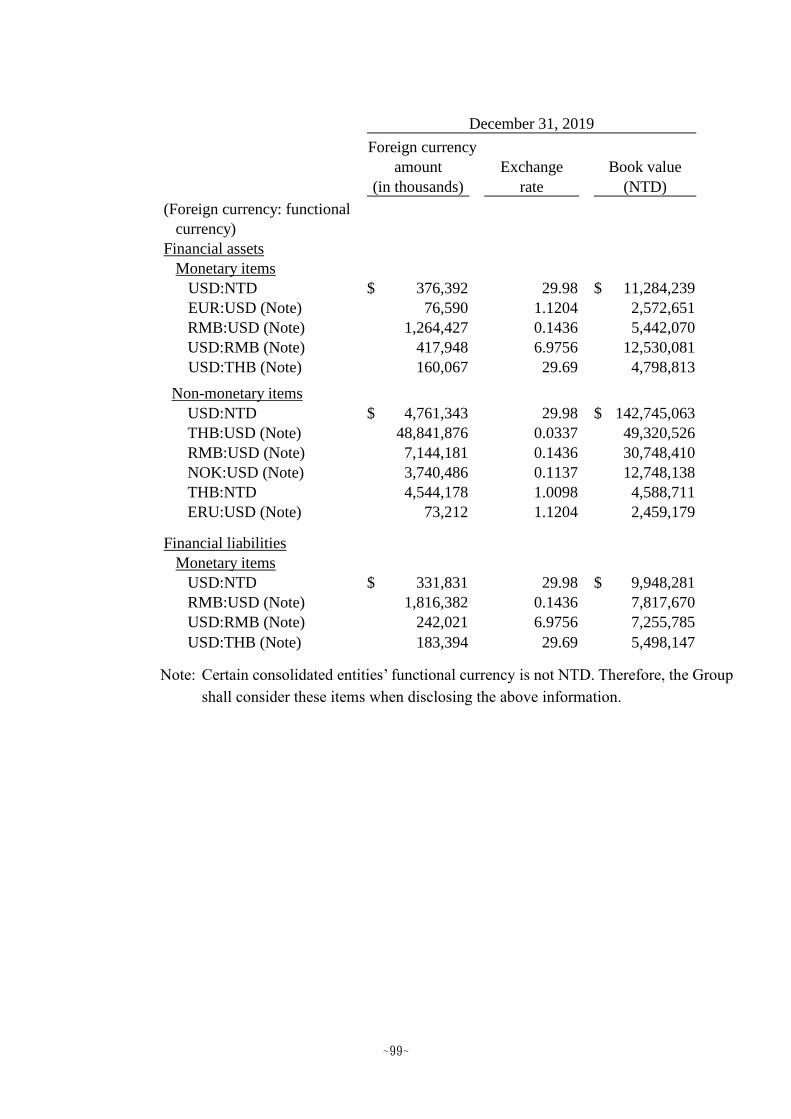
~99~
Note: Certain consolidated entities’ functional currency is not NTD. Therefore, the Group
shall consider these items when disclosing the above information.
Foreign currency
amount Exchange Book value
(in thousands) rate (NTD)
(Foreign currency: functional
currency)
Financial assets
Monetary items
USD:NTD 376,392$ 29.98 11,284,239$
EUR:USD (Note) 76,590 1.1204 2,572,651
RMB:USD (Note) 1,264,427 0.1436 5,442,070
USD:RMB (Note) 417,948 6.9756 12,530,081
USD:THB (Note) 160,067 29.69 4,798,813
Non-monetary items
USD:NTD 4,761,343$ 29.98 142,745,063$
THB:USD (Note) 48,841,876 0.0337 49,320,526
RMB:USD (Note) 7,144,181 0.1436 30,748,410
NOK:USD (Note) 3,740,486 0.1137 12,748,138
THB:NTD 4,544,178 1.0098 4,588,711
ERU:USD (Note) 73,212 1.1204 2,459,179
Financial liabilities
Monetary items
USD:NTD 331,831$ 29.98 9,948,281$
RMB:USD (Note) 1,816,382 0.1436 7,817,670
USD:RMB (Note) 242,021 6.9756 7,255,785
USD:THB (Note) 183,394 29.69 5,498,147
December 31, 2019

~100~
Note: Certain consolidated entities’ functional currency is not NTD. Therefore, the Group
shall consider these items when disclosing the above information.
v. Total exchange gain, including realised and unrealised arising from significant foreign
exchange variation on the monetary items held by the Group for the years ended December
31, 2019 and 2018 amounted to $454,685 and $534,511, respectively.
Foreign currency
amount Exchange Book value
(in thousands) rate (NTD)
(Foreign currency: functional
currency)
Financial assets
Monetary items
USD:NTD 97,782$ 30.7150 3,003,374$
RMB:USD (Note) 1,392,537 0.1456 6,228,957
USD:RMB (Note) 340,946 6.8666 10,472,156
EUR:NOK (Note) 42,704 10.0329 1,503,181
EUR:USD (Note) 62,091 1.1460 2,185,603
Non-monetary items
USD:NTD 4,178,234$ 30.7150 128,334,451$
RMB:USD (Note) 6,716,680 0.1456 30,044,381
NOK:USD (Note) 3,479,516 0.1142 12,207,741
THB:USD (Note) 6,908,111 0.0310 6,584,811
EUR:USD (Note) 61,261 1.1460 2,156,379
THB:NTD 1,647,048 0.9532 1,569,966
Financial liabilities
Monetary items
USD:NTD 1,170,089$ 30.7150 35,939,284$
EUR:NTD 30,378 35.2000 1,069,306
RMB:USD (Note) 1,938,334 0.1456 8,670,362
USD:RMB (Note) 273,578 6.8666 8,402,948
EUR:NOK (Note) 48,333 10.0329 1,701,322
EUR:USD (Note) 38,062 1.1460 1,339,782
December 31, 2018

~101~
Note: Certain consolidated entities’ functional currency is not NTD. Therefore, the Group
shall consider these items when disclosing the above information.
Note: Certain consolidated entities’ functional currency is not NTD. Therefore, the Group
(Foreign currency: Degree of Effect on Effect on
functional currency) variation profit or loss comprehensive income
Financial assets
Monetary items
USD : NTD 1% 112,842$ -$
EUR : USD (Note) 1% 25,727 -
RMB : USD (Note) 1% 54,421 -
USD : RMB (Note) 1% 125,301 -
USD : THB (Note) 1% 47,988 -
Financial liabilities
Monetary items
USD : NTD 1% 99,483$ -$
RMB : USD (Note) 1% 78,177 -
USD : RMB (Note) 1% 72,558 -
USD : THB (Note) 1% 54,981 -
Year ended December 31, 2019
Sensitivity analysis
(Foreign currency: Degree of Effect on Effect on
functional currency) variation profit or loss comprehensive income
Financial assets
Monetary items
USD : NTD 1% 30,034$ -$
RMB : USD (Note) 1% 62,290 -
USD : RMB (Note) 1% 104,722 -
EUR : NOK (Note) 1% 15,032 -
EUR : USD (Note) 1% 21,856 -
Financial liabilities
Monetary items
USD : NTD 1% 359,393$ -$
EUR : NTD 1% 10,693 -
RMB : USD (Note) 1% 86,704 -
USD : RMB (Note) 1% 84,029 -
EUR : NOK (Note) 1% 17,013 -
EUR : USD (Note) 1% 13,398 -
Year ended December 31, 2018
Sensitivity analysis

~102~
shall consider these items when disclosing the above information.
Price risk
i. The Group’s equity securities, which are exposed to price risk, are the held financial assets
at fair value through profit or loss and financial assets at fair value through other
comprehensive income. To manage its price risk arising from investments in equity
securities, the Group diversifies its portfolio.
ii The Group’s investments in equity securities comprise shares issued by the domestic and
foreign companies. The prices of equity securities would change due to the change of the
future value of investee companies. If the prices of these equity securities had
increased/decreased by 1% with all other variables held constant, post-tax profit for the
years ended December 31, 2019 and 2018 would have increased/decreased by $15,240 and
$13,901, respectively, as a result of gain/loss on equity securities classified as at fair value
through profit or loss. Other components of equity would have increased/decreased by
$21,171 and $16,325, respectively, as a result of other comprehensive income classified
equity investment at fair value through other comprehensive income.
Cash flow and fair value interest rate risk
i. The Group’s main interest rate risk arises from long-term borrowings. Borrowings issued
at variable rates expose the Group to cash flow interest rate risk which is partially offset by
cash and cash equivalents held at variable rates. Borrowings issued at fixed rates expose
the Group to fair value interest rate risk. The Group’s borrowings mainly bear fixed and
variable interest rate. During the years ended December 31, 2019 and 2018, the Group’s
borrowings at variable rate were denominated in NTD, USD and JPY.
ii. On December 31, 2019 and 2018, if the interest rate increases by 0.25%, with all other
variables held constant, profit, net of tax for the years ended December 31, 2019 and 2018
would have decreased by $55,629 and $50,811, respectively. The main factor is that
changes in interest expense result from floating rate borrowings.
(b) Credit risk
i. Credit risk refers to the risk of financial loss to the Group arising from default by the clients
or counterparties of financial instruments on the contract obligations. The main factor is
that counterparties could not repay in full the accounts receivable based on the agreed terms,
and the contract cash flows of financial instruments which were settled in accordance with
trading conditions.
ii. According to the Group’s credit policy, each local entity in the Group is responsible for
managing and analysing the credit risk for each of their new clients before standard
payment and delivery terms and conditions are offered. Internal risk control assesses the
credit quality of the customers, taking into account their financial position, past experience
and other factors.

~103~
iii. Individual risk limits are set based on internal or external ratings in accordance with limits
set by the credit controller. The utilisation of credit limits is regularly monitored.
iv. For banks and financial institutions, only well rated parties are accepted.
v. The Group adopts the assumption under IFRS 9, that is, if the contract payments are past
due over 180 days based on the terms, there has been a significant increase in credit risk on
that instrument since initial recognition.
vi. The Group adopts the assumption under IFRS 9, that is, the default occurs when the contract
payments are not expected to be recovered and are transferred to overdue receivables.
vii. The Group classifies customer’s accounts receivable and contract assets in accordance with
customer types. The Group applies the simplified approach using provision matrix, loss rate
methodology to estimate expected credit loss under the provision matrix basis.
viii. The Group uses the forecastability to adjust historical and timely information to assess the
default possibility of accounts receivable. On December 31, 2019 and 2018, the provision
matrix is as follows:
ix. Movements in relation to the Group applying the simplified approach to provide loss
allowance for notes receivable, accounts receivable, contract assets and overdue
Not past due 1-90 days past due 91-180 days past due
At December 31, 2019
Expected loss rate 0.02% 1.05% 22.00%
Total book value 46,827,565$ 5,598,752$ 416,452$
Loss allowance 9,549$ 58,661$ 91,616$
181-365 days Over 366 days
past due past due Total
Expected loss rate 45.50% 96.56%
Total book value 457,455$ 664,075$ 53,964,299$
Loss allowance 208,124$ 641,243$ 1,009,193$
Not past due 1-90 days past due 91-180 days past due
At December 31, 2018
Expected loss rate 0.00% 1.15% 23.39%
Total book value 46,402,866$ 5,331,599$ 298,633$
Loss allowance 424$ 61,260$ 69,837$
181-365 days Over
past due 366 days past due Total
Expected loss rate 49.81% 96.38%
Total book value 249,925$ 731,317$ 53,014,340$
Loss allowance 124,497$ 704,826$ 960,844$
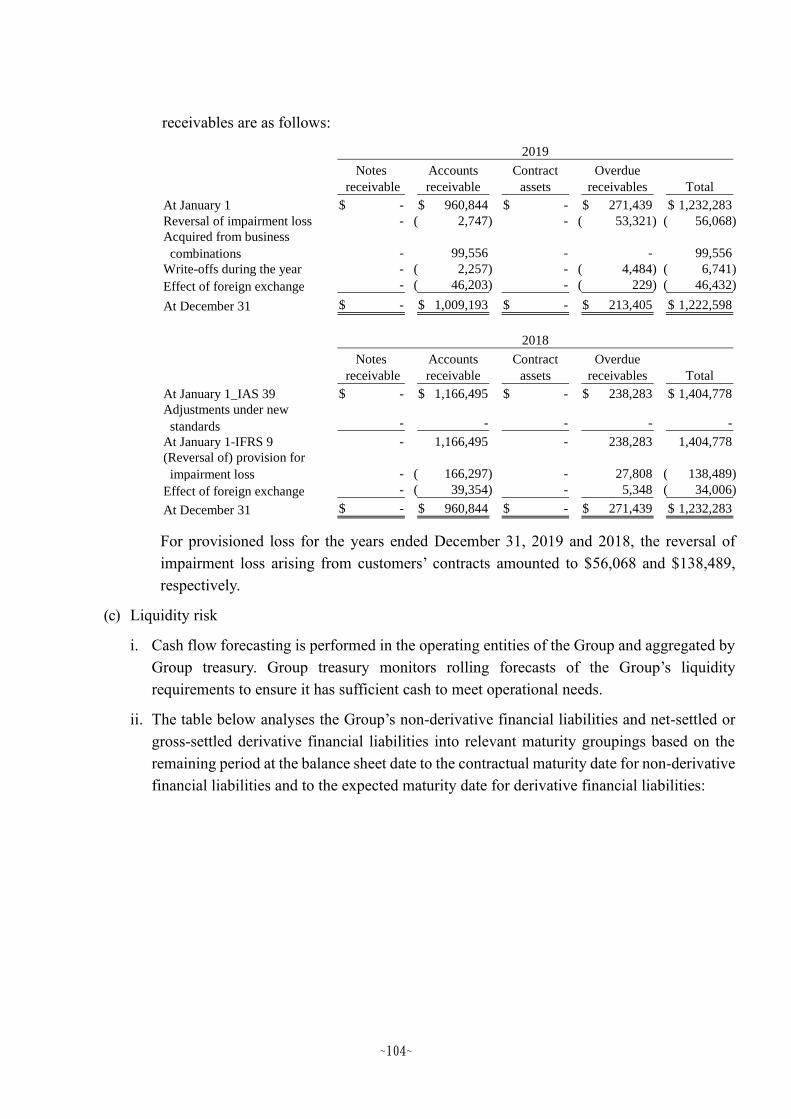
~104~
receivables are as follows:
For provisioned loss for the years ended December 31, 2019 and 2018, the reversal of
impairment loss arising from customers’ contracts amounted to $56,068 and $138,489,
respectively.
(c) Liquidity risk
i. Cash flow forecasting is performed in the operating entities of the Group and aggregated by
Group treasury. Group treasury monitors rolling forecasts of the Group’s liquidity
requirements to ensure it has sufficient cash to meet operational needs.
ii. The table below analyses the Group’s non-derivative financial liabilities and net-settled or
gross-settled derivative financial liabilities into relevant maturity groupings based on the
remaining period at the balance sheet date to the contractual maturity date for non-derivative
financial liabilities and to the expected maturity date for derivative financial liabilities:
Notes Accounts Contract Overdue
receivable receivable assets receivables Total
At January 1 -$ 960,844$ -$ 271,439$ 1,232,283$
Reversal of impairment loss - 2,747)( - 53,321)( 56,068)(
Acquired from business
combinations - 99,556 - - 99,556
Write-offs during the year - 2,257)( - 4,484)( 6,741)(
Effect of foreign exchange - 46,203)( - 229)( 46,432)(
At December 31 -$ 1,009,193$ -$ 213,405$ 1,222,598$
Notes Accounts Contract Overdue
receivable receivable assets receivables Total
At January 1_IAS 39 -$ 1,166,495$ -$ 238,283$ 1,404,778$
Adjustments under new
standards - - - - -
At January 1-IFRS 9 - 1,166,495 - 238,283 1,404,778
(Reversal of) provision for
impairment loss - 166,297)( - 27,808 138,489)(
Effect of foreign exchange - 39,354)( - 5,348 34,006)(
At December 31 -$ 960,844$ -$ 271,439$ 1,232,283$
2019
2018

~105~
Derivative financial liabilities:
As at December 31, 2019 and 2018, the Group’s derivative financial liabilities are due within
1 year.
iii. The Group does not expect the timing of occurrence of the cash flows estimated through the
maturity date analysis to be significantly earlier, nor expect the actual cash flow amount to
be significantly different.
(3) Fair value information
A. The different levels that the inputs to valuation techniques are used to measure fair value of
financial and non-financial instruments have been defined as follows:
Level 1: Quoted prices (unadjusted) in active markets for identical assets or liabilities that the
entity can access at the measurement date. A market is regarded as active where a
market in which transactions for the asset or liability take place with sufficient
frequency and volume to provide pricing information on an ongoing basis.
Level 2: Inputs other than quoted prices included within Level 1 that are observable for the
asset or liability, either directly or indirectly.
Level 3: Unobservable inputs for the asset or liability.
B. The carrying amounts of financial instruments not measured at fair value including cash and
cash equivalents, notes receivable, accounts receivable, other receivables, short-term borrowings,
Less than Between 1 Between 2 Over
December 31, 2019 1 year and 2 years and 5 years 5 years
Short-term borrowings 7,575,932$ -$ -$ -$
Notes and accounts payable
(including related parties) 39,532,328 - - -
Other payables 28,829,379 - - -
Lease liabilities
(including current portion) 525,370 372,557 506,528 542,180
Long-term borrowings
(including current portion) 65,536 25,045,203 2,225,817 477,819
Less than Between 1 Between 2 Over
December 31, 2018 1 year and 2 years and 5 years 5 years
Short-term borrowings 6,259,062$ -$ -$ -$
Notes and accounts payable
(including related parties) 40,509,063 - - -
Other payables 24,786,588 - - -
Long-term borrowings
(including current portion) 173,700 24,585,550 116,969 530,268
Non-derivative financial liabilities:
Non-derivative financial liabilities:

~106~
notes payable, accounts payable, other payables and long-term borrowings (including current
portion) are approximate to their fair values.
C. The related information of financial and non-financial instruments measured at fair value by
level on the basis of the nature, characteristics and risks of the assets and liabilities is as follows:
D. The methods and assumptions that the Group used to measure fair value are as follows:
(a) The instruments that the Group used market quoted prices as their fair values (that is, Level
1) are listed below by characteristics:
December 31, 2019 Level 1 Level 2 Level 3 Total
Assets
Recurring fair value measurements
Financial assets at fair value through
profit or loss
Equity instruments 1,523,977$ -$ 1,581,800$ 3,105,777$
Hybrid instruments 99,252 - - 99,252
Derivative instruments - 142,668 - 142,668
Financial assets at fair value through
other comprehensive income
Equity instruments 1,426,179 - 690,945 2,117,124
3,049,408$ 142,668$ 2,272,745$ 5,464,821$
Liabilities
Recurring fair value measurements
Financial liabilities at fair
value through profit or loss
Derivative instruments -$ 15,929$ -$ 15,929$
December 31, 2018 Level 1 Level 2 Level 3 Total
Assets
Recurring fair value measurements
Financial assets at fair value through
profit or loss
Equity instruments 1,390,101$ -$ 1,842,693$ 3,232,794$
Hybrid instruments 54,000 - 69,074 123,074
Derivative instruments - 37,047 - 37,047
Financial assets at fair value through
other comprehensive income
Equity instruments 1,632,492 - 1,345,502 2,977,994
3,076,593$ 37,047$ 3,257,269$ 6,370,909$
Liabilities
Recurring fair value measurements
Financial liabilities at fair
value through profit or loss
Derivative instruments -$ 8,544$ -$ 8,544$

~107~
(b) Except for financial instruments with active markets, the fair value of other financial
instruments is measured by using valuation techniques that are approved for financial
management.
(c) When assessing non-standard and low-complexity financial instruments, the Group adopts
valuation technique that is widely used by market participants. The inputs used in the
valuation method to measure these financial instruments are normally observable in the
market.
(d) The valuation of derivative financial instruments is based on valuation model widely
accepted by market participants, such as present value techniques and option pricing models.
Forward exchange contracts are usually valued based on the current forward exchange rate.
(e) The output of valuation model is an estimated value and the valuation technique may not be
able to capture all relevant factors of the Group’s financial and non-financial instruments.
Therefore, the estimated value derived using the valuation model is adjusted accordingly with
additional inputs. In accordance with the Group’s management policies and relevant control
procedures relating to the valuation models used for fair value measurement, management
believes adjustment to valuation is necessary in order to reasonably represent the fair value
of financial and non-financial instruments at the consolidated balance sheet. The inputs and
pricing information used during valuation are carefully assessed and adjusted based on
current market conditions.
(f) The Group takes into account adjustments for credit risks to measure the fair value of
financial and non-financial instruments to reflect credit risk of the counterparty.
E. For the years ended December 31, 2019 and 2018, there was no transfer between Level 1 and
Level 2.
F. The following chart is the movement of Level 3 for the years ended December 31, 2019 and
2018:
Listed shares Convertible (exchangeable)
Market quoted price Closing price Closing price
Hybrid instruments Equity instruments Total
At January 1 69,074$ 3,188,195$ 3,257,269$
Loss recognised in profit or
loss - 147,181)( 147,181)(
Acquired during the year - 463,571 463,571
Transferred from convertible
bonds 69,074)( 69,074 -
Disposals during the year - 1,289,621)( 1,289,621)(
Net exchange differences - 11,293)( 11,293)(
At December 31 -$ 2,272,745$ 2,272,745$
2019

~108~
G. Investment department is in charge of valuation procedures for fair value measurements being
categorised within Level 3, which is to verify independent fair value of financial instruments.
Such assessment is to ensure the valuation results are reasonable by applying independent
information to make results close to current market conditions and periodical review.
Investment property is evaluated regularly by the Group’s financial treasury based on the
valuation methods and assumptions announced by the Financial Supervisory Commission,
Securities and Futures Bureau.
The capital department establishes valuation policies, valuation processes and ensures
compliance with the related requirements in IFRS. The related valuation results are reported to
the management monthly. The management is responsible for managing and reviewing valuation
processes.
H. The following is the qualitative information of significant unobservable inputs and sensitivity
analysis of changes in significant unobservable inputs to valuation model used in Level 3 fair
value measurement:
Hybrid instruments Equity instruments Total
At January 1 -$ 1,580,428$ 1,580,428$
Transfers from prepayments
for investment - 58,869 58,869
Effect of IFRS 9 adjustment - 1,147,672 1,147,672
Loss recognised in profit or
loss - 14,215)( 14,215)(
Gains and losses recognised
in other comprehensive
income - 337,414 337,414
Acquired during the year 69,074 419,585 488,659
Proceeds from capital
reduction - 12,930)( 12,930)(
Disposals during the year - 353,201)( 353,201)(
Net exchange differences - 24,573 24,573
At December 31 69,074$ 3,188,195$ 3,257,269$
2018

~109~
Non-derivative equity
instruments:
Unlisted shares $ 2,007,345 Most recent
non-active
market price
Not applicable - Not applicable
〃 265,400 Market
comparable
companies
Price to book
ratio multiple1.96~19.97
The higher the
multiple, the
higher the fair
value
Discount for
lack of
marketability
20% The higher the
discount for lack
of marketability,
the lower the fair
value
Non-derivative equity
instruments:
Unlisted shares $ 2,994,240 Most recent
non-active
market price
Not applicable - Not applicable
〃 193,955 Market
comparable
companies
Price to book
ratio multiple0.97~3.8
The higher the
multiple, the
higher the fair
value
Discount for
lack of
marketability
20% The higher the
discount for lack
of marketability,
the lower the fair
value
Hybrid instruments:
Convertible bonds $ 69,074 Market
comparable
companies
Enterprise
value to
EBITDA
9.02 The higher the
multiple, the
higher the fair
value
Discount for
lack of
marketability
30% The higher the
discount for lack
of marketability,
the lower the fair
value
Relationship of
inputs to fair value
Fair value at
December 31, 2019
Valuation
technique
Significant
unobservable
input
Range
(weighted
average)
Relationship of
inputs to fair value
Fair value at
December 31, 2018
Valuation
technique
Significant
unobservable
input
Range
(weighted
average)

~110~
I. The Group’s valuation techniques are based on the most recent non-active market price after
carefully assessing the valuation models and assumptions used to measure fair value. However,
use of different valuation models or assumptions may result in different measurement. However,
use of different valuation models or assumptions may result in different measurement. The
following is the effect of profit or loss or of other comprehensive income from financial assets
and liabilities categorised within Level 3 if the inputs used to valuation models have changed:
13. SUPPLEMENTARY DISCLOSURES
(1) Significant transactions information
A. Loans to others: Please refer to table 1.
B. Provision of endorsements and guarantees to others: Please refer to table 2.
C. Holding of marketable securities at the end of the period (not including subsidiaries, associates
and joint ventures): Please refer to table 3.
D. Acquisition or sale of the same security with the accumulated cost exceeding $300 million or
20% of the Company’s paid-in capital: Please refer to table 4.
E. Acquisition of real estate reaching $300 million or 20% of paid-in capital or more: Please refer
to table 5.
F. Disposal of real estate reaching $300 million or 20% of paid-in capital or more: None.
G. Purchases or sales of goods from or to related parties reaching $100 million or 20% of paid-in
Favorable Unfavorable Favorable Unfavorable
change change change change
Financial assets
Equity instruments Discount for
lack of
marketability
± 1% -$ -$ 3,275$ 3,275)($
Favorable Unfavorable Favorable Unfavorable
change change change change
Financial assets
Equity instruments Discount for
lack of
marketability
± 1% -$ -$ 2,411$ 2,411)($
Hybrid instruments Discount for
lack of
marketability
± 1% 1,040$ 1,040)($ -$ -$
December 31, 2019
Recognised in Recognised in other
profit or loss comprehensive income (loss)
December 31, 2018
Recognised in Recognised in other
profit or loss comprehensive income (loss)
Input Change
Input Change
~111~
capital or more: Please refer to table 6.
H. Receivables from related parties reaching $100 million or 20% of paid-in capital or more: Please
refer to table 7.
I. Trading in derivative instruments undertaken during the reporting periods: Please refer to Notes
6(2), 6(4) and 12(2).
J. Significant inter-company transactions during the reporting periods: Please refer to table 8.
(2) Information on investees
Names, locations and other information of investee companies (not including investees in Mainland
China):Please refer to table 9.
(3) Information on investments in Mainland China
A. Basic information: Please refer to table 10.
B. Significant transactions, either directly or indirectly through a third area, with investee companies
in the Mainland China: Please refer to table 6, 7 and 8 for significant transactions of purchases,
sales, receivables and payables of investee companies in the Mainland China, and transactions
between the Company indirectly through investees in a third area, Delta Electronics Int'l
(Singapore) Pte. Ltd. (DEIL-SG) and Cyntec International Ltd. (CIL-Labuan), with investee
companies in the Mainland China, for the year ended December 31, 2019.
14. OPERATING SEGMENT INFORMATION
(1) General information
The Group’s management has determined the reportable segments based on the reports reviewed by
the Board of Directors that are used to make strategic decisions. The Group considers the business
from a product perspective. The Group’s business is segregated into power electronics business,
automation business and infrastructure business. Breakdown of the revenue from all sources is as
follows:
A. Power electronics: Component, Embedded Power, Fans and Thermal Management, Automotive
Electronics, Merchant & Mobile Power and Vivitek Projectors.
B. Automation: Industrial Automation and Building Automation.
C. Infrastructure: ICT Infrastructure and Energy Infrastructure.
Because of the change of product classification, the Group’s internal business segment
restructured accordingly. The prior period information was restated for comparison.
(2) Measurement of segment information
The Group’s segment profit (loss) is measured with the operating profit (loss) before tax, which is
used as a basis for the Group in assessing the performance of the operating segments. The accounting
policies of the operating segments are in agreement with the significant accounting policies
summarized in Note 4.
(3) Segment information
The segment information provided to the chief operating decision-maker for the reportable segments

~112~
is as follows:
Note: Segment income represents income after eliminating inter-segment transactions.
(4) Reconciliation information for segment income (loss)
A. The revenue from external customers reported to the chief operating decision-maker is measured
in a manner consistent with that of the statement of comprehensive income.
B. A reconciliation of reportable segments income or loss to income (loss) before tax from
continuing operations for the years ended December 31, 2019 and 2018 is provided as follows:
(5) Information on products and services
As the Group considered the business from a product perspective, the reportable segments were
based on different products and services. Revenues from external customers are the same as in Note
14(3).
(6) Geographical information
Information about geographic areas for the years ended December 31, 2019 and 2018 were as
follows:
Power
electronics Automation Infrastructure
business business business Total
Revenue from external
customers 133,069,546$ 37,605,027$ 96,724,182$ 267,398,755$
Segment income (Note) 15,511,770$ 3,283,965$ 6,411,617$ 25,207,352$
Year ended December 31, 2019
Power
electronics Automation Infrastructure
business business business Total
Revenue from external
customers 107,376,799$ 35,177,393$ 92,956,980$ 235,511,172$
Segment income (Note) 11,563,105$ 4,304,910$ 6,876,648$ 22,744,663$
Year ended December 31, 2018
2019 2018
Reportable segments income 25,207,352$ 22,744,663$
Other segments’ loss 5,798,562)( 4,577,940)(
Non-operating income and expenses 9,745,619 4,634,305
Income before tax from continuing operations 29,154,409$ 22,801,028$
Years ended December 31,

~113~
(7) Major customer information
There are no customers accounting for more than 10% of the Group’s operating revenues for the
years ended December 31, 2019 and 2018.
Non-current Non-current
Revenue assets Revenue assets
Mainland China 106,559,016$ 26,739,482$ 129,527,991$ 27,608,438$
U.S.A. 69,568,497 4,764,583 31,582,755 2,879,059
Taiwan 8,387,683 26,387,992 7,387,094 31,566,486
Tailand 1,733,577 41,987,260 1,901,354 -
Others 81,882,624 51,454,579 66,618,615 21,193,322
268,131,397$ 151,333,896$ 237,017,809$ 83,247,305$
Years ended December 31,
2019 2018

Item Value
1 Fairview Assets Ltd. Delta Electronics
(Netherlands) B.V.
Other receivables -
related parties
Yes 10,193,200$ 10,193,200$ 10,193,200$ 0.50% 2 -$ Additional
operating capital
-$ None -$ 29,928,831$ 29,928,831$ Note 5
1 Fairview Assets Ltd. Delta Controls Inc. Other receivables –
related parties
Yes 3,237,840 2,998,000 2,008,660 0.50% 2 - Additional
operating capital
- None - 29,928,831 29,928,831 Note 5
1 Fairview Assets Ltd. Delta Electronics Int’l
(Singapore) Pte. Ltd.
Other receivables -
related parties
Yes 8,994,000 8,139,570 8,139,570 0.50% 2 - Additional
operating capital
- None - 29,928,831 29,928,831 Note 5
2 Delta Networks Holding
Limited
Delta Electronics
(Netherlands) B.V.
Other receivables -
related parties
Yes 6,595,600 2,398,400 2,398,400 0.50% 2 - Additional
operating capital
- None - 5,522,502 5,522,502 Note 5
2 Delta Networks Holding
Limited
Delta Electronics Int’l
(Singapore) Pte. Ltd.
Other receivables -
related parties
Yes 869,420 869,420 869,420 0.50% 2 - Additional
operating capital
- None - 5,522,502 5,522,502 Note 5
3 Delta Electronics (H.K.) Ltd. Delta Electronics
(Netherlands) B.V.
Other receivables -
related parties
Yes 839,440 - - 0.50% 2 - Additional
operating capital
- None - 17,387,743 17,387,743 Note 5
3 Delta Electronics (H.K.) Ltd. Delta Electronics Int’l
(Singapore) Pte. Ltd.
Other receivables -
related parties
Yes 5,996,000 - - 0.50% 2 - Additional
operating capital
- None - 17,387,743 17,387,743 Note 5
4 Delta International Holding
Limited
Delta Electronics
(Netherlands) B.V.
Other receivables -
related parties
Yes 8,904,060 8,004,660 8,004,660 0.50% 2 - Additional
operating capital
- None - 71,442,255 71,442,255 Note 5
4 Delta International Holding
Limited
Delta Electronics Int’l
(Singapore) Pte. Ltd.
Other receivables -
related parties
Yes 18,347,760 14,750,160 14,750,160 0.50% 2 - Additional
operating capital
- None - 71,442,255 71,442,255 Note 5
4 Delta International Holding
Limited
Drake Investment (HK)
Limited
Other receivables -
related parties
Yes 1,109,260 989,340 989,340 0.50% 2 - Additional
operating capital
- None - 71,442,255 71,442,255 Note 5
4 Delta International Holding
Limited
Delta Electronics (H.K.) Ltd. Other receivables -
related parties
Yes 3,897,400 1,388,074 938,374 0.50% 2 - Additional
operating capital
- None - 71,442,255 71,442,255 Note 5
5 ELTEK AS Eltek Italia S.r.l. Other receivables -
related parties
Yes 26,872 26,872 26,773 1.90% 2 - Additional
operating capital
- None - 2,233,058 2,233,058 Note 5
6 Delta Electronics (Wuhu) Co.,
Ltd.
Cyntec Electronics (Suzhou)
Co., Ltd.
Other receivables -
related parties
Yes 172,159 - - 4.35% 2 - Additional
operating capital
- None - 4,414,992 4,414,992 Note 5
6 Delta Electronics (Wuhu) Co.,
Ltd.
Delta Electronics (Jiangsu)
Ltd.
Other receivables -
related parties
Yes 1,291,194 1,291,194 1,075,995 4.35% 2 - Additional
operating capital
- None - 4,414,992 4,414,992 Note 5
7 Vivotek Inc. Vatics Inc. Other receivables -
related parties
Yes 200,000 200,000 163,565 1.34% 2 - Additional
operating capital
- None - 288,353 576,705 Note 6
7 Vivotek Inc. Lidlight Inc. Other receivables -
related parties
Yes 10,000 10,000 - 1.34% 2 - Additional
operating capital
- None - 20,000 576,705 Note 6
7 Vivotek Inc. Otus Imaging, Inc. Other receivables -
related parties
Yes 15,000 15,000 - 1.34% 2 - Additional
operating capital
- None - 60,000 576,705 Note 6
8 Grandview Holding Ltd. Cyntec Holding (H.K.) Ltd. Other receivables -
related parties
Yes 2,998 2,998 2,998 0.50% 2 - Additional
operating capital
- None - 9,240,613 9,240,613 Note 5
9 Delta Energy Systems
(Germany) GmbH
Delta Energy Systems Property
(Germany) GmbH
Other receivables -
related parties
Yes 386,285 386,285 366,131 0.40% 2 - Additional
operating capital
- None - 504,311 504,311 Note 5
Maximum outstanding
balance during the year
ended December 31,
2019 (Note 2)
Balance at
December 31,
2019
Actual amount
drawn down
No.
(Note 1) Creditor Borrower
General ledger
account
Is a
related
party
Delta Electronics, Inc. and Subsidiaries
Loans to others
Year ended December 31, 2019
Table 1 Expressed in thousands of New Taiwan dollars, except as otherwise indicated
Collateral
Limit on loans
granted to a
single party
Ceiling on total
loans granted Footnote
Interest
rate
Nature of
loan
(Note 7)
Amount of
transactions
with the
borrower
Reason for short-
term financing
Allowance
for
doubtful
accounts
Table 1一1

Item Value
9 Delta Energy Systems
(Germany) GmbH
Eltek s.r.o. Other receivables -
related parties
Yes 50,385$ -$ -$ 0.40% 2 -$ Additional
operating capital
-$ None -$ 504,311$ 504,311$ Note 5
Note 1: The numbers filled in for the loans provided by the Company or subsidiaries are as follows:
(1) The Company is ‘0’.
(2) The subsidiaries are numbered in order starting from ‘1’.
Note 2: Maximum outstanding balance during the current period was translated into New Taiwan dollars using the exchange rate at December 31, 2019, which the Company reported to the Securities and Futures Bureau.
Note 3: Limit on loans granted by the Company to a single party is 20% of the Company’s net assets based on the latest audited or reviewed financial statements, and limit on total loans is 40% of the Company’s net assets based on the latest audited or reviewed financial statements.
Note 4: Limit on loans granted by subsidiaries to a single party is 40% of the subsidiaries’ net assets based on the latest audited or reviewed financial statements, and limit on total loans is 40% of the subsidiaries’ net assets based on the latest audited or reviewed financial statements.
Note 5: Limit on loans for financing granted by and to subsidiaries of which the ultimate parent directly or indirectly holds 100% of its voting shares is the lender’s net assets based on the latest audited or reviewed financial statements, and limit on total loans is the lender’s net assets based on
the latest audited or reviewed financial statements.
Note 6: The calculation and amount on ceiling of loans of Vivotek Inc. are as follows:
(1) The ceiling on total amount of loans to others shall not exceed 20% of the subsidiary’s net assets value in the lastest financial statement which was audited or reviewed by independent accountant.
(2) For the short-term financing, the limit on loans granted to a single party shall not exceed the subsidiary’s paid-in capital and 10% of the subsidiary’s net assets value in the lastest financial statement which was audited or reviewed by independent accountant.
Note 7: Nature of loans:
(1) Business transaction: 1.
(2) Short-term financing: 2.
Ceiling on total
loans granted Footnote
Amount of
transactions
with the
borrower
Reason for short-
term financing
Allowance
for
doubtful
accounts
Collateral
Limit on loans
granted to a
single party
Maximum outstanding
balance during the year
ended December 31,
2019 (Note 2)
Balance at
December 31,
2019
Actual amount
drawn down
Interest
rate
Nature of
loan
(Note 7)
No.
(Note 1) Creditor Borrower
General ledger
account
Is a
related
party
Table 1一2

Company name
Relationship with the
endorser / guarantor
(Note 6)
1 ELTEK AS Eltek Power Sweden AB 2 2,803,138$ 16,050$ -$ -$ -$ 0.00% 7,007,844$ Y N N Note 3
1 ELTEK AS ELTEK MEA DMCC 2 2,803,138 69,937 - - - 0.00% 7,007,844 Y N N Note 3
1 ELTEK AS ELTEK AUSTRALIA
PTY LIMITED
2 2,803,138 134,910 134,910 134,910 - 0.10% 7,007,844 Y N N Note 3
2 Vivotek Inc. Vatics Inc. 2 576,705 120,000 - - - 4.16% 1,153,410 Y N N Note 5
Note 1: The numbers filled in for the endorsements/guarantees provided by the Company or subsidiaries are as follows:
(1) The Company is ‘0’.
(2) The subsidiaries are numbered in order starting from ‘1’.
Note 2: In accordance with the Company’s“Procedures for Provision of Endorsements and Guarantees,” limit on total endorsements is 40% of the Company’s net assets based on the latest audited or reviewed financial statements, limit on endorsements to a single
company is 20% of the Company’s net assets based on the latest audited or reviewed financial statements. Limit on total endorsements granted by the Company and subsidiaries is 50% of the Company’s net assets based on the latest audited or reviewed financial
statements, limit on total endorsements to a single party is 30% of the Company’s net assets based on the latest audited or reviewed financial statements.
Note 3: In accordance with Eltek’s “Procedures for Provision of Endorsements and Guarantees,” limit on total endorsements is 5% of the Company’s net assets based on the latest audited or reviewed financial statements, and limit on endorsements to a single party is 2%
of the Company’s net assets based on the latest audited or reviewed financial statements.
Note 4: The Company’s net assets based on the latest audited or reviewed financial statements were $140,156,877 thousand (2019/12/31).
Note 5: The limit on total endorsements/guarantees of Vivotek Inc. shall not exceed 40% of the company’s net assets value in the lastest financial statement which was reviewed or audited by independent accountant, and limit on endorsements to a single party is 20%
of Vivotek Inc.’s net assets based on the latest audited or reviewed financial statements.
Note 6: Relationship between the endorser/guarantor and the party being endorsed/guaranteed is classified into the following seven categories:
(1) Having business relationship.
(2) The endorser/guarantor parent company owns directly and indirectly more than 50% voting shares of the endorsed/guaranteed subsidiary.
(3) The endorsed/guaranteed company owns directly and indirectly more than 50% voting shares of the endorser/guarantor parent company.
(4) The endorser/guarantor parent company owns directly and indirectly more than 90% voting shares of the endorsed/guaranteed company.
(5) Mutual guarantee of the trade made by the endorsed/guaranteed company or joint contractor as required under the construction contract.
(6) Due to joint venture, all shareholders provide endorsements/guarantees to the endorsed/guaranteed company in proportion to its ownership.
(7) Joint guarantee of the performance guarantee for pre-sold home sales contract as required under the Consumer Protection Act.
Outstanding
endorsement /
guarantee amount at
December 31, 2019
Actual
amount
drawn down
Number
(Note 1) Endorser / guarantor
Party being endorsed/guaranteed
Limit on endorsements /
guarantees provided for
a single party
Maximum outstanding
endorsement /
guarantee amount as
at December 31, 2019
Delta Electronics, Inc. and Subsidiaries
Provision of endorsements and guarantees to others
Year ended December 31, 2019
Table 2 Expressed in thousands of New Taiwan dollars, except as otherwise indicated
Provision of
endorsements /
guarantees to the
party in
Mainland China Footnote
Amount of
endorsements /
guarantees secured
with collateral
Ratio of accumulated
endorsement / guarantee
amount to net asset value of
the endorser / guarantor
company
Ceiling on total
amount of
endorsements /
guarantees
provided
Provision of
endorsements /
guarantees by parent
company to
subsidiary
Provision of
endorsements /
guarantees by
subsidiary to
parent company
Table 2-1

Expressed in thousands of New Taiwan dollars, except as otherwise indicated
Number of shares Book value Ownership (%) Fair value
Delta Electronics, Inc. United Renewable Energy Co., Ltd.
common stock
None Financial assets at fair value through
other comprehensive income
122,980,851 942,033$ 4.89 942,033$
Delta Electronics, Inc. Lanner Electronics Inc. common stock None Financial assets at fair value through
other comprehensive income - non-
current
6,763,845 463,323 5.73 463,323
Delta Electronics, Inc. WK Technology Fund. common stock, etc. None Financial assets at fair value through
profit or loss and financial assets at fair
value through other comprehensive
income
- 217,631 - 217,631
Delta Electronics Capital Company Fusheng Precision Co., Ltd. common stock None Financial assets at fair value through
profit or loss
1,683,000 302,099 1.28 302,099
Delta Electronics Capital Company Tong Hsing Electronic Industries, Ltd.
common stock
None Financial assets at fair value through
profit or loss
2,472,000 386,868 1.49 386,868
Delta Electronics Capital Company Nien Made Enterprise Co., Ltd. common
stock
None Financial assets at fair value through
profit or loss - current
652,043 180,616 0.22 180,616
Delta Electronics Capital Company Cystalvue Medical Corporation. common
stock
None Financial assets at fair value through
profit or loss - current
1,498,000 117,593 6.17 117,593
Delta Electronics Capital Company TaskEasy, Inc. common stock None Financial assets at fair value through
profit or loss - non-current
2,633,872 141,008 7.72 141,008
Delta Electronics Capital Company Allied Supreme Corp. common stock None Financial assets at fair value through
profit or loss - non-current
1,000,000 115,000 1.45 115,000
Delta Electronics Capital Company FineTek Co., Ltd. common stock, etc. None Financial assets at fair value through
profit or loss
- 1,705,515 - 1,705,515
Cyntec Co., Ltd. SUSUMU Co., Ltd. common stock None Financial assets at fair value through
other comprehensive income - non-
current
200,000 104,081 11.53 104,081
Cyntec Co., Ltd. GaN Systems Inc. preferred stock, etc. None Financial assets at fair value through
other comprehensive income
- 161,319 - 161,319
Delta International Holding Limited Mentis Technology, Inc., etc None Financial assets at fair value through
profit or loss - non-current
- 89,940 - 89,940
Delta Electronics (Japan), Inc. Macy Inc. common stock None Financial assets at fair value through
other comprehensive income - non-
current
74,000,000 34,274 19.79 34,274
FootnoteSecurities held by Marketable securities
Relationship with the
securities issuer General ledger account
As at December 31, 2019
Delta Electronics, Inc. and Subsidiaries
Holding of marketable securities at the end of the period (not including subsidiaries, associates and joint ventures)
December 31, 2019
Table 3
Table 3-1
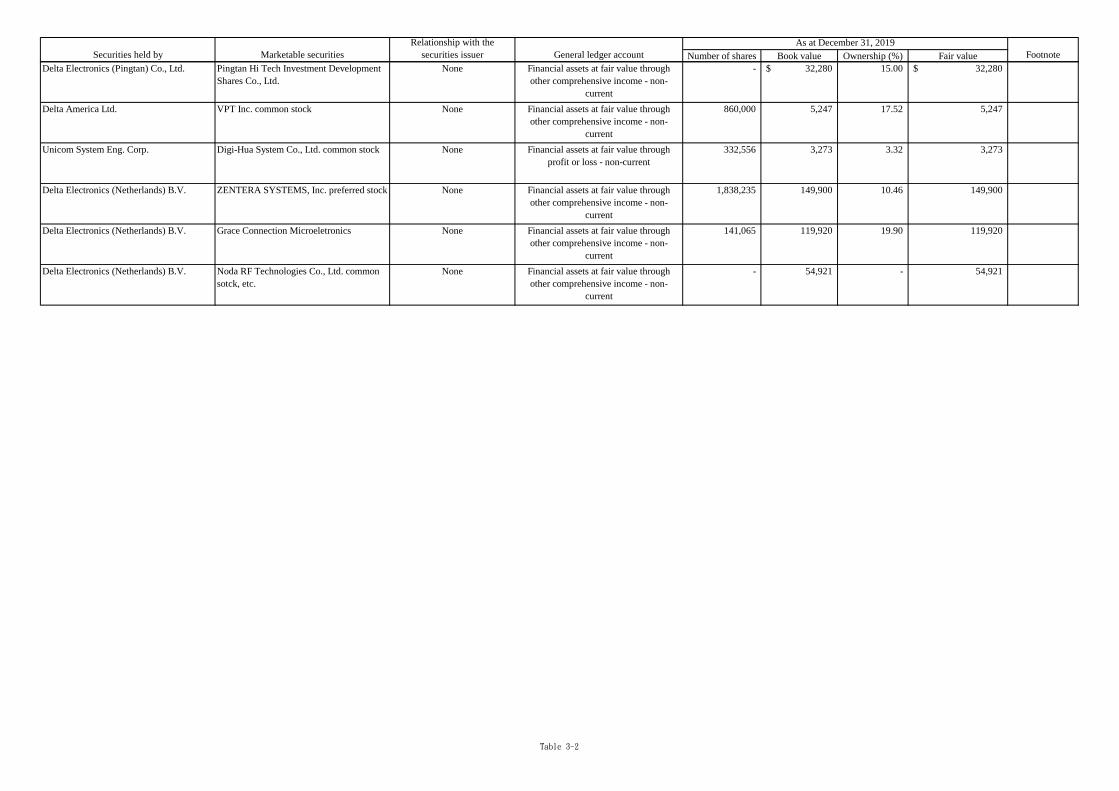
Number of shares Book value Ownership (%) Fair value FootnoteSecurities held by Marketable securities
Relationship with the
securities issuer General ledger account
As at December 31, 2019
Delta Electronics (Pingtan) Co., Ltd. Pingtan Hi Tech Investment Development
Shares Co., Ltd.
None Financial assets at fair value through
other comprehensive income - non-
current
- 32,280$ 15.00 32,280$
Delta America Ltd. VPT Inc. common stock None Financial assets at fair value through
other comprehensive income - non-
current
860,000 5,247 17.52 5,247
Unicom System Eng. Corp. Digi-Hua System Co., Ltd. common stock None Financial assets at fair value through
profit or loss - non-current
332,556 3,273 3.32 3,273
Delta Electronics (Netherlands) B.V. ZENTERA SYSTEMS, Inc. preferred stock None Financial assets at fair value through
other comprehensive income - non-
current
1,838,235 149,900 10.46 149,900
Delta Electronics (Netherlands) B.V. Grace Connection Microeletronics None Financial assets at fair value through
other comprehensive income - non-
current
141,065 119,920 19.90 119,920
Delta Electronics (Netherlands) B.V. Noda RF Technologies Co., Ltd. common
sotck, etc.
None Financial assets at fair value through
other comprehensive income - non-
current
- 54,921 - 54,921
Table 3-2

Table 4
Number of
sharesAmount
Number of
sharesAmount
Number of
sharesSelling price Book value
Gain (loss)
on
disposal
Number of
sharesAmount
Delta Electronics, Inc. United Renewable
Energy Co., Ltd.
common stock
Financial assets
at fair value
through other
comprehensive
income
Centralized securities
exchange market
None 167,145,851 1,308,752$ - -$ 44,165,000 390,802$ 1,067,657$ ($ 676,855)
(Note 4)
122,980,851 942,033$
Cyntec Co., Ltd. LUXTERA. INC.
preferred stock
Financial assets
at fair value
through other
comprehensive
income
Cisco Systems, Inc. None 55,029,284 673,609 - - 55,029,284 656,798 336,195 256,482
(Note 4)
- -
Delta Electronics Int’l (Singapore) Pte. Ltd. Delta Electronics
(Thailand) Public
Co., Ltd. common
stock
Investments
accounted for
under equity
method
Natural person None - - 534,479,306 36,571,874
(Note 6)
- - - - 534,479,306 36,571,874
Delta Electronics Int’l (Singapore) Pte. Ltd. Loy Tec
electronics GmbH
common stock
Investments
accounted for
under equity
method
Natural person None - 2,156,379 - 302,800
(Note 2)
(Note 5)
- - - - - 2,459,179
ELTEK AS ELTEK POWER
PTE. LTD.
common stock
Investments
accounted for
under equity
method
Delta Electronics Int’l
(Singapore) Pte. Ltd.
Affiliated
enterprise
2,000,000 1,078,841 - 14,229
(Note 2)
2,000,000 1,292,340 1,093,070 (Note 1) - - (Note 3)
Delta Electronics (Netherlands) B.V. Amerlux, LLC
common stock
Investments
accounted for
under equity
method
The Unicorn Group,
Inc.
None - - - 3,027,510
(Note7)
- - - - - 3,027,510
Delta International Holding Limited Delta Greentech
(China) Co., Ltd.
common stock
Investments
accounted for
under equity
method
Drake Investment
(HK) Limited
Affiliated
enterprise
58,940,390 512,035 - ( 7,142)
(Note 2)
58,940,390 825,907 504,893 (Note 1) - -
Ace Pillar Holding Co., Ltd. Delta Greentech
(China) Co., Ltd.
commom stock
Investments
accounted for
under equity
method
Drake Investment
(HK) Limited
Affiliated
enterprise
21,646,341 219,339 - ( 2,270)
(Note 2)
21,646,341 303,073 217,069 (Note 1) - -
Expressed in thousands of New Taiwan dollars, except as otherwise indicated
Delta Electronics, Inc. and Subsidiaries
Acquisition or sale of the same security with the accumulated cost exceeding $300 million or 20% of the Company's paid-in capital
Year ended December 31, 2019
Investor
Marketable
securities
General
ledger
account Counterparty
Relationship
with
the investee
Balance as at
January 1, 2019 Addition Disposal
Balance as at
December 31, 2019
Footnote
Table 4-1

Number of
sharesAmount
Number of
sharesAmount
Number of
sharesSelling price Book value
Gain (loss)
on
disposal
Number of
sharesAmount
Apex Investment (HK) Limited, Galaxy
Star Investment (HK) Limited and Jade
Investment (HK) Limited
Delta Electronics
(Jiangsu) Ltd.
share certificate
Investments
accounted for
under equity
method
Delta Electronics
(H.K.) Ltd.
Affiliated
enterprise
- 1,257,702$ - ($ 251,145)
(Note 2)
- 2,450,404$ 1,006,557$ (Note 1) - -$
Apex Investment (HK) Limited, Galaxy
Star Investment (HK) Limited and Jade
Investment (HK) Limited
Delta Electronics
Components
(Wujiang) Ltd.
share certificate
Investments
accounted for
under equity
method
Delta Electronics
(H.K.) Ltd.
Affiliated
enterprise
- 3,353,616 - ( 292,549)
(Note 2)
- 7,445,415 3,061,067 (Note 1) - -
Apex Investment (HK) Limited, Galaxy
Star Investment (HK) Limited and Jade
Investment (HK) Limited
Delta Video
Display System
(Wujiang) Ltd.
share certificate
Investments
accounted for
under equity
method
Delta Electronics
(H.K.) Ltd.
Affiliated
enterprise
- 614,384 - ( 61,458)
(Note 2)
- 1,318,844 552,926 (Note 1) - -
PreOptix (Hong Kong) Co., Ltd. PreOptix (Jiang
Su) Co., Ltd. share
certificate
Investments
accounted for
under equity
method
SMARTWIN
ELECTRONICS
TECHNOLOGY (HK)
LIMITED
None - 264,796 - - - 479,082 270,315 208,767 - -
Note 6: In April 2019, Delta Electronics Int’l (Singapore) Pte. Ltd. increased its investment in Delta Electronics (Thailand) Public Company Limited amounting to $36,874,645, including investment income (loss) recognised during the period
and the movement in the adjustments in the carrying amount.
Note 7: In June 2019, Delta Electronics (Netherlands) B.V. increased its investment in Amerlux, LLC amounting to $2,844,498, which was including investment income (loss) recognised during the period and the movement in the adjustments
in the carrying amount.
Balance as at
January 1, 2019 Addition Disposal
Balance as at
December 31, 2019
Footnote
Note 1: The transaction resulted from the Group’s adjustment in investment structure. There was no gain or loss on disposal pursuant to related ordinances.
Marketable
securities
General
ledger
account Counterparty
Relationship
with
the investee
Note 2: It reflected the movement in the adjustments in the profit (loss), dividends and net value of investments recognised in this period.
Note 3: Only sales transactions are disclosed.
Note 4: It was retained earnings transferred from other equity.
Note 5: In April 2019, Delta Electronics Int’l (Singapore) Pte. Ltd. increased its investment in Loy Tec electronics GmbH amounting to $372,338, including investment income (loss) recognised during the period and the movement
in the adjustments in the carrying amount.
Investor
Table 4-2

Real estate acquired
by Real estate acquired Date of the event Transaction amount
Status of
payment Counterparty
Relationship with
the counterparty
Original owner
who sold the
real estate to
the
counterparty
Relationship
between the
original owner
and the acquirer
Date of the
original
transaction Amount
Basis or reference used
in setting the price
Reason for
acquisition of real
estate and status
of the real estate
Other
commitments
Delta Electronics,
Inc.
Land and buildings
in Zhongli and Neili
April 17, 2019 2,561,996$ Acquired by
cash
Kenmec
Mechanical
Engineering
Co., Ltd.
None - - - -$ Appraisal report For future business
development
None
If the counterparty is a related party, information as to the last
transaction of the real estate is disclosed below:
Delta Electronics, Inc. and Subsidiaries
Acquisition of real estate reaching NT$300 million or 20% of paid-in capital or more
Year ended December 31, 2019
Table 5
Expressed in thousands of New Taiwan dollars, except as otherwise indicated
Table 5-1

Table 6
Purchases
(sales) Amount
Percentage of
total purchases
(sales) Credit term Unit price Credit term Balance
Percentage of total
notes/accounts
receivable
Delta Electronics Inc. Delta Greentech (China) Co., Ltd. Subsidiary Sales and
other
operating
revenue
147,910$ 0.31 70 days 68,769$ 0.72
Delta Electronics Inc. Cyntec Co., Ltd. Subsidiary Sales and
other
operating
revenue
122,798 0.24 70 days 13,420 0.14
Delta Electronics Inc. Cyntec Electronics (Suzhou) Co., Ltd. Subsidiary Sales and
other
operating
revenue
326,396 0.68 70 days 133,400 1.41
Delta Electronics Inc. Delta Electronics India Pvt. Ltd. Subsidiary Sales and
other
operating
revenue
122,431 0.24 70 days 12,890 0.14 Note 5
Delta Electronics Inc. Delta Electronics (Japan), Inc. Subsidiary Sales and
other
operating
revenue
221,881 0.45 70 days 45,591 0.48
Delta Electronics Inc. Delta Electronics (Netherlands) B.V. Subsidiary Sales and
other
operating
revenue
226,477 0.47 70 days 57,560 0.61
Delta Electronics Inc. Delta Electronics Int’l (Singapore) Pte. Ltd. Subsidiary Sales and
other
operating
revenue
13,226,927 27.45 70 days 1,721,805 18.06
Delta Electronics Inc. Delta Energy Systems (Singapore) PTE. LTD. Subsidiary Sales and
other
operating
revenue
256,919 0.51 70 days 68,885 0.73 Note 5
Delta Electronics Inc. Delta Electronics (Thailand) Public Company
Limited
Subsidiary Sales and
other
operating
revenue
1,252,916 2.59 70 days 207,670 2.18 Note 5
Delta Electronics Inc. DEI Logistics (USA) Corp. Subsidiary Sales and
other
operating
revenue
7,150,125 14.79 70 days 2,403,743 25.20
FootnotePurchaser/seller Counterparty
Relationship
with the
counterparty
Transaction
Differences in transaction
term compared to third party
transactions Notes/accounts receivable (payable)
Delta Electronics, Inc. and Subsidiaries
Purchases or sales of goods from or to related parties reaching $100 million or 20% of paid-in capital or more
Year ended December 31, 2019
Expressed in thousands of New Taiwan dollars, except as otherwise indicated
Table 6-1

Purchases
(sales) Amount
Percentage of
total purchases
(sales) Credit term Unit price Credit term Balance
Percentage of total
notes/accounts
receivable FootnotePurchaser/seller Counterparty
Relationship
with the
counterparty
Transaction
Differences in transaction
term compared to third party
transactions Notes/accounts receivable (payable)
Delta Electronics Inc. Delta Electronics (Americas) Ltd. Subsidiary Sales and
other
operating
revenue
571,906$ 1.20 70 days 108,971$ 1.14
Delta Electronics Inc. Vivitek Corporation Subsidiary Sales and
other
operating
revenue
111,506 0.22 70 days 10,751 0.11
Delta Electronics Inc. DELTA ELECTRONICS (USA) INC. Subsidiary Sales 689,105 1.45 70 days 62,569 0.66
Delta Electronics Int’l (Singapore) Pte. Ltd. Delta Electronics (Australia) Pty. Ltd. Affiliated
enterprise
Sales and
other
operating
revenue
148,112 0.07 70 days 32,499 0.18 Note 5
Delta Electronics Int’l (Singapore) Pte. Ltd. ELTEK AUSTRALIA PTY LIMITED Affiliated
enterprise
Sales 178,661 0.08 70 days 21,860 0.11
Delta Electronics Int’l (Singapore) Pte. Ltd. Delta Greentech (Brasil) S.A. Affiliated
enterprise
Sales 223,823 0.11 70 days 182,237 0.51
Delta Electronics Int’l (Singapore) Pte. Ltd. Delta Electronics ( Switzerland ) AG Affiliated
enterprise
Sales 1,259,354 0.53 70 days 378,561 58.58
Delta Electronics Int’l (Singapore) Pte. Ltd. Delta Electronics (Dongguan) Co., Ltd. Affiliated
enterprise
Sales and
other
operating
revenue
5,954,782 2.75 70 days 1,007,970 5.90
Delta Electronics Int’l (Singapore) Pte. Ltd. Delta Electronics Power (Dongguan) Co., Ltd. Affiliated
enterprise
Sales and
other
operating
revenue
11,552,172 5.30 70 days 1,829,242 10.65
Delta Electronics Int’l (Singapore) Pte. Ltd. Delta Electronics (Jiangsu) Ltd. Affiliated
enterprise
Sales and
other
operating
revenue
16,805,200 7.70 70 days 1,443,569 7.85
Delta Electronics Int’l (Singapore) Pte. Ltd. Delta Electronics Components (Wujiang) Ltd. Affiliated
enterprise
Sales and
other
operating
revenue
11,603,582 5.34 70 days 1,247,026 7.58
Delta Electronics Int’l (Singapore) Pte. Ltd. Delta Video Display System (Wujiang) Ltd. Affiliated
enterprise
Sales and
other
operating
revenue
2,813,726 1.26 70 days 242,711 1.22
Table 6-2

Purchases
(sales) Amount
Percentage of
total purchases
(sales) Credit term Unit price Credit term Balance
Percentage of total
notes/accounts
receivable FootnotePurchaser/seller Counterparty
Relationship
with the
counterparty
Transaction
Differences in transaction
term compared to third party
transactions Notes/accounts receivable (payable)
Delta Electronics Int’l (Singapore) Pte. Ltd. Delta Networks (Dongguan) Ltd. Affiliated
enterprise
Sales and
other
operating
revenue
10,766,626$ 4.94 70 days 1,312,357$ 7.64
Delta Electronics Int’l (Singapore) Pte. Ltd. Delta Electronics (Wuhu) Co., Ltd. Affiliated
enterprise
Sales and
other
operating
revenue
6,078,444 2.77 70 days 1,194,038 33.42
Delta Electronics Int’l (Singapore) Pte. Ltd. Delta Electronics (Chenzhou) Co., Ltd. Affiliated
enterprise
Sales and
other
operating
revenue
2,510,641 1.11 70 days 687,149 39.68
Delta Electronics Int’l (Singapore) Pte. Ltd. Chenzhou Delta Technology Co., Ltd. Affiliated
enterprise
Sales 209,854 0.12 70 days 48,689 2.83
Delta Electronics Int’l (Singapore) Pte. Ltd. Cyntec Co., Ltd. Affiliated
enterprise
Sales 720,535 0.33 70 days 263,106 4.96
Delta Electronics Int’l (Singapore) Pte. Ltd. Cyntec International Ltd. Affiliated
enterprise
Sales 2,160,719 0.99 70 days 1,050,790 19.85
Delta Electronics Int’l (Singapore) Pte. Ltd. Cyntec Electronics (Suzhou) Co., Ltd. Affiliated
enterprise
Sales 245,037 0.07 70 days 95,263 1.75
Delta Electronics Int’l (Singapore) Pte. Ltd. Delta Electronics Solutions (Spain) SL Affiliated
enterprise
Sales 172,250 0.04 70 days 86,300 17.17
Delta Electronics Int’l (Singapore) Pte. Ltd. Digital Projection Ltd. Associate Sales and
other
operating
revenue
408,251 0.18 70 days 83,269 0.45
Delta Electronics Int’l (Singapore) Pte. Ltd. Delta Electronics India Pvt. Ltd. Affiliated
enterprise
Sales and
other
operating
revenue
1,484,615 0.69 70 days 362,480 0.97
Delta Electronics Int’l (Singapore) Pte. Ltd. Delta Electronics (Japan), Inc. Affiliated
enterprise
Sales and
other
operating
revenue
2,948,357 1.35 70 days 586,949 1.46
Delta Electronics Int’l (Singapore) Pte. Ltd. Delta Electronics (Korea), Inc. Affiliated
enterprise
Sales and
other
operating
revenue
245,886 0.11 70 days 65,280 0.17
Table 6-3

Purchases
(sales) Amount
Percentage of
total purchases
(sales) Credit term Unit price Credit term Balance
Percentage of total
notes/accounts
receivable FootnotePurchaser/seller Counterparty
Relationship
with the
counterparty
Transaction
Differences in transaction
term compared to third party
transactions Notes/accounts receivable (payable)
Delta Electronics Int’l (Singapore) Pte. Ltd. Delta Electronics International Mexico S.A. DE
C.V.
Affiliated
enterprise
Sales 132,610$ 0.05 70 days 70,368$ 0.38
Delta Electronics Int’l (Singapore) Pte. Ltd. Delta Electronics (Netherlands) B.V. Affiliated
enterprise
Sales and
other
operating
revenue
2,767,840 1.23 70 days 623,019 13.32
Delta Electronics Int’l (Singapore) Pte. Ltd. ELTEK AS Affiliated
enterprise
Sales 1,280,882 0.59 70 days 181,890 1.03
Delta Electronics Int’l (Singapore) Pte. Ltd. ELTEK POWER PTE. LTD. Affiliated
enterprise
Sales 150,010 0.06 70 days 37 -
Delta Electronics Int’l (Singapore) Pte. Ltd. Delta Electronics (Slovakia) s.r.o. Affiliated
enterprise
Sales and
other
operating
revenue
457,211 0.20 70 days 70,393 0.19 Note 5
Delta Electronics Int’l (Singapore) Pte. Ltd. Delta Electronics (Thailand) Public Company
Limited
Affiliated
enterprise
Sales and
other
operating
revenue
682,877 0.31 70 days 194,886 0.55 Note 5
Delta Electronics Int’l (Singapore) Pte. Ltd. Delta Green Industrial (Thailand) Co., Ltd. Affiliated
enterprise
Sales and
other
operating
revenue
175,397 0.05 70 days 22,866 0.06 Note 5
Delta Electronics Int’l (Singapore) Pte. Ltd. Delta Electronics Inc. Ultimate
parent
company
Sales and
other
operating
revenue
16,664,508 7.66 70 days 7,284,145 17.83
Delta Electronics Int’l (Singapore) Pte. Ltd. Delta Networks, Inc. (Taiwan) Affiliated
enterprise
Sales 553,977 0.26 70 days - -
Delta Electronics Int’l (Singapore) Pte. Ltd. DEI Logistics (USA) Corp. Affiliated
enterprise
Sales 24,064,206 11.06 70 days 6,383,361 15.72
Delta Electronics Int’l (Singapore) Pte. Ltd. Delta Electronics (Americas) Ltd. Affiliated
enterprise
Sales 2,732,567 1.26 70 days 687,908 21.13
Delta Electronics Int’l (Singapore) Pte. Ltd. Vivitek Corporation Affiliated
enterprise
Sales and
other
operating
revenue
253,690 0.13 70 days 41,169 0.12
Table 6-4

Purchases
(sales) Amount
Percentage of
total purchases
(sales) Credit term Unit price Credit term Balance
Percentage of total
notes/accounts
receivable FootnotePurchaser/seller Counterparty
Relationship
with the
counterparty
Transaction
Differences in transaction
term compared to third party
transactions Notes/accounts receivable (payable)
Delta Electronics Int’l (Singapore) Pte. Ltd. Digital Projection Inc. Associate Sales and
other
operating
revenue
437,550$ 0.20 70 days 134,471$ 0.72
Delta Electronics Int’l (Singapore) Pte. Ltd. DELTA ELECTRONICS (USA) INC. Affiliated
enterprise
Sales and
other
operating
revenue
2,599,471 1.18 70 days 437,074 1.23
Delta Networks, Inc. (Taiwan) Delta Electronics Int’l (Singapore) Pte. Ltd. Affiliated
enterprise
Sales 314,341 17.76 70 days - -
Delta Networks, Inc. (Taiwan) Delta Electronics Inc. Ultimate
parent
company
Sales and
other
operating
revenue
285,829 16.15 70 days - -
Delta Networks, Inc. (Taiwan) DEI Logistics (USA) Corp. Affiliated
enterprise
Sales 1,032,121 58.32 70 days - -
Delta Networks (Dongguan) Ltd. Delta Electronics Int’l (Singapore) Pte. Ltd. Affiliated
enterprise
Sales and
other
operating
revenue
14,654,249 98.06 70 days 2,068,258 92.12
Delta Electronics (Dongguan) Co., Ltd. Delta Electronics (Shanghai) Co., Ltd. Affiliated
enterprise
Sales 850,625 8.05 70 days 303,473 12.87
Delta Electronics (Dongguan) Co., Ltd. Delta Electronics Int’l (Singapore) Pte. Ltd. Affiliated
enterprise
Sales 8,241,746 77.71 70 days 1,583,437 67.15
Delta Electronics Power (Dongguan) Co., Ltd. Delta Electronics (Dongguan) Co., Ltd. Affiliated
enterprise
Sales and
other
operating
revenue
102,334 0.47 70 days 18,099 0.53
Delta Electronics Power (Dongguan) Co., Ltd. Delta Electronics (Shanghai) Co., Ltd. Affiliated
enterprise
Sales 1,839,580 9.10 70 days 572,370 16.77
Delta Electronics Power (Dongguan) Co., Ltd. Delta Electronics Int’l (Singapore) Pte. Ltd. Affiliated
enterprise
Sales and
other
operating
revenue
17,812,635 88.26 70 days 2,682,974 78.62
Delta Electronics (Jiangsu) Ltd. Delta Electronics Components (Wujiang) Ltd. Affiliated
enterprise
Sales 232,333 0.54 70 days 63,711 1.25
Table 6-5
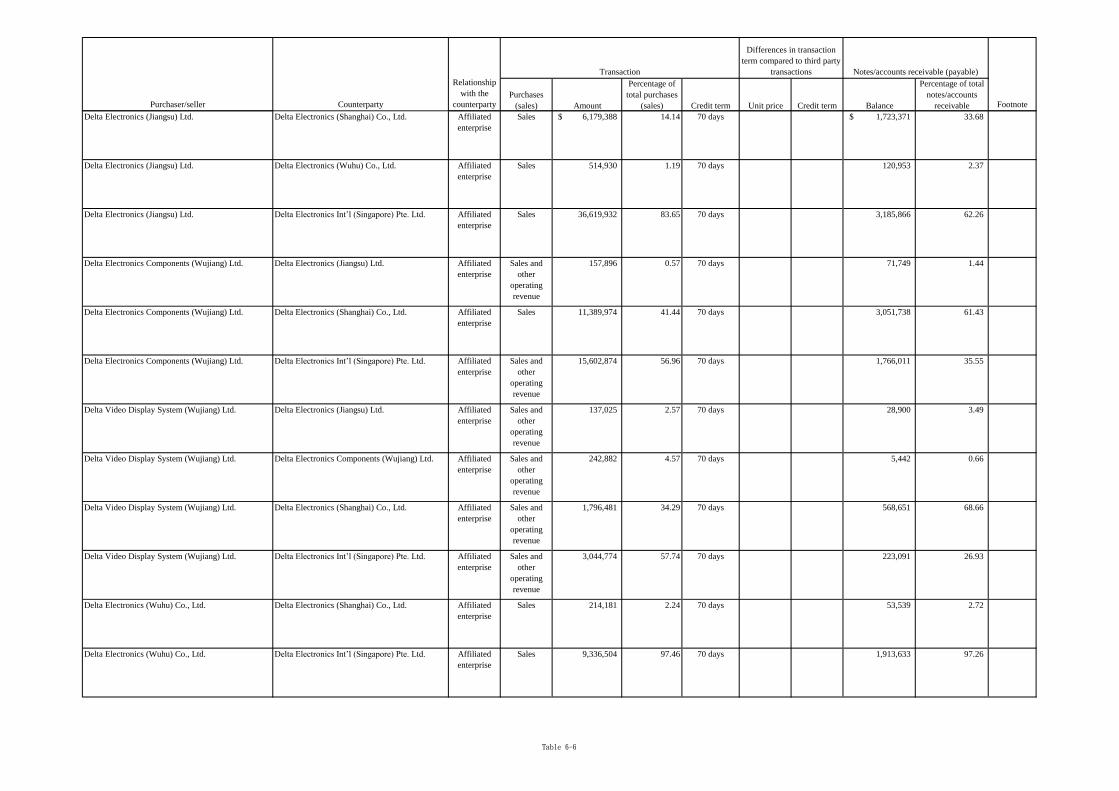
Purchases
(sales) Amount
Percentage of
total purchases
(sales) Credit term Unit price Credit term Balance
Percentage of total
notes/accounts
receivable FootnotePurchaser/seller Counterparty
Relationship
with the
counterparty
Transaction
Differences in transaction
term compared to third party
transactions Notes/accounts receivable (payable)
Delta Electronics (Jiangsu) Ltd. Delta Electronics (Shanghai) Co., Ltd. Affiliated
enterprise
Sales 6,179,388$ 14.14 70 days 1,723,371$ 33.68
Delta Electronics (Jiangsu) Ltd. Delta Electronics (Wuhu) Co., Ltd. Affiliated
enterprise
Sales 514,930 1.19 70 days 120,953 2.37
Delta Electronics (Jiangsu) Ltd. Delta Electronics Int’l (Singapore) Pte. Ltd. Affiliated
enterprise
Sales 36,619,932 83.65 70 days 3,185,866 62.26
Delta Electronics Components (Wujiang) Ltd. Delta Electronics (Jiangsu) Ltd. Affiliated
enterprise
Sales and
other
operating
revenue
157,896 0.57 70 days 71,749 1.44
Delta Electronics Components (Wujiang) Ltd. Delta Electronics (Shanghai) Co., Ltd. Affiliated
enterprise
Sales 11,389,974 41.44 70 days 3,051,738 61.43
Delta Electronics Components (Wujiang) Ltd. Delta Electronics Int’l (Singapore) Pte. Ltd. Affiliated
enterprise
Sales and
other
operating
revenue
15,602,874 56.96 70 days 1,766,011 35.55
Delta Video Display System (Wujiang) Ltd. Delta Electronics (Jiangsu) Ltd. Affiliated
enterprise
Sales and
other
operating
revenue
137,025 2.57 70 days 28,900 3.49
Delta Video Display System (Wujiang) Ltd. Delta Electronics Components (Wujiang) Ltd. Affiliated
enterprise
Sales and
other
operating
revenue
242,882 4.57 70 days 5,442 0.66
Delta Video Display System (Wujiang) Ltd. Delta Electronics (Shanghai) Co., Ltd. Affiliated
enterprise
Sales and
other
operating
revenue
1,796,481 34.29 70 days 568,651 68.66
Delta Video Display System (Wujiang) Ltd. Delta Electronics Int’l (Singapore) Pte. Ltd. Affiliated
enterprise
Sales and
other
operating
revenue
3,044,774 57.74 70 days 223,091 26.93
Delta Electronics (Wuhu) Co., Ltd. Delta Electronics (Shanghai) Co., Ltd. Affiliated
enterprise
Sales 214,181 2.24 70 days 53,539 2.72
Delta Electronics (Wuhu) Co., Ltd. Delta Electronics Int’l (Singapore) Pte. Ltd. Affiliated
enterprise
Sales 9,336,504 97.46 70 days 1,913,633 97.26
Table 6-6

Purchases
(sales) Amount
Percentage of
total purchases
(sales) Credit term Unit price Credit term Balance
Percentage of total
notes/accounts
receivable FootnotePurchaser/seller Counterparty
Relationship
with the
counterparty
Transaction
Differences in transaction
term compared to third party
transactions Notes/accounts receivable (payable)
Delta Electronics (Chenzhou) Co., Ltd. Delta Electronics (Shanghai) Co., Ltd. Affiliated
enterprise
Sales 548,833$ 12.64 70 days 163,519$ 17.55
Delta Electronics (Chenzhou) Co., Ltd. Delta Electronics Int’l (Singapore) Pte. Ltd. Affiliated
enterprise
Sales 3,788,305 87.03 70 days 768,153 82.44
Chenzhou Delta Technology Co., Ltd. Delta Electronics Power (Dongguan) Co., Ltd. Affiliated
enterprise
Sales 1,646,489 70.10 70 days 362,016 67.69
Chenzhou Delta Technology Co., Ltd. Delta Electronics (Chenzhou) Co., Ltd. Affiliated
enterprise
Sales 229,577 9.79 70 days 77,565 14.50
Chenzhou Delta Technology Co., Ltd. Delta Electronics Int’l (Singapore) Pte. Ltd. Affiliated
enterprise
Sales 440,193 18.77 70 days 93,948 17.56
Delta Electronics (Shanghai) Co., Ltd. Delta Electronics (Jiangsu) Ltd. Affiliated
enterprise
Sales and
other
operating
revenue
115,731 0.40 70 days 48,602 0.51
Delta Electronics (Shanghai) Co., Ltd. Delta Greentech (China) Co., Ltd. Affiliated
enterprise
Sales and
other
operating
revenue
13,918,526 48.87 70 days 4,020,275 42.00
Delta Electronics (Shanghai) Co., Ltd. Delta Electronics (Pingtan) Co., Ltd. Affiliated
enterprise
Sales 1,655,401 5.80 70 days 557,637 2.91
Delta Electronics (Shanghai) Co., Ltd. Eltek Energy Technology(Dongguan) Ltd. Affiliated
enterprise
Sales 121,971 0.41 70 days 38,956 0.41
Delta Electronics (Shanghai) Co., Ltd. Delta Electronics Int’l (Singapore) Pte. Ltd. Affiliated
enterprise
Sales and
other
operating
revenue
863,675 3.04 70 days 299,002 3.12
Cyntec Co., Ltd. Cyntec International Ltd. Affiliated
enterprise
Sales and
other
operating
revenue
527,576 10.16 Note 1 Note 1 Note 1 11,956 1.24
Cyntec Co., Ltd. Delta Electronics Inc. Ultimate
parent
company
Sales and
other
operating
revenue
1,269,971 24.50 Note 2 Note 2 Note 2 432,289 44.83
Table 6-7

Purchases
(sales) Amount
Percentage of
total purchases
(sales) Credit term Unit price Credit term Balance
Percentage of total
notes/accounts
receivable FootnotePurchaser/seller Counterparty
Relationship
with the
counterparty
Transaction
Differences in transaction
term compared to third party
transactions Notes/accounts receivable (payable)
Cyntec Co., Ltd. DEI Logistics (USA) Corp. Affiliated
enterprise
Sales 214,204$ 4.17 Note 2 Note 2 Note 2 27,789$ 2.88
Cyntec Electronics (Suzhou) Co., Ltd. Cyntec International Ltd. Affiliated
enterprise
Sales 2,140,364 16.88 Note 3 Note 3 Note 3 5,580 0.18
Cyntec Electronics (Suzhou) Co., Ltd. Delta Electronics Int’l (Singapore) Pte. Ltd. Affiliated
enterprise
Sales 10,263,850 83.01 Note 4 Note 4 Note 4 3,147,932 99.85
Cyntec International Ltd. Cyntec Co., Ltd. Affiliated
enterprise
Sales 519,847 10.03 Note 1 Note 1 Note 1 26 -
ELTEK AS ELTEK MEA DMCC Affiliated
enterprise
Sales and
other
operating
revenue
294,101 4.35 70 days 70,509 4.34
ELTEK AS Eltek Sistemas de Energia Industria e Commercio
S.A.
Affiliated
enterprise
Sales and
other
operating
revenue
136,498 2.02 70 days 23,918 1.48
ELTEK AS Eltek Deutschland GmbH Affiliated
enterprise
Sales and
other
operating
revenue
325,085 4.88 70 days 87,292 5.38
ELTEK AS Eltek Egypt for Power Supply S.A.E. Affiliated
enterprise
Sales and
other
operating
revenue
264,675 3.95 70 days 193,938 11.94
ELTEK AS ELTEK POWER FRANCE SAS Affiliated
enterprise
Sales and
other
operating
revenue
713,458 10.67 70 days 191,821 11.81
ELTEK AS Eltek Power (UK) Ltd. Affiliated
enterprise
Sales and
other
operating
revenue
781,307 11.76 70 days 147,327 9.07
ELTEK AS Eltek SGS Pvt Ltd. Affiliated
enterprise
Sales 129,889 1.94 70 days 50,201 3.09
ELTEK AS OOO Eltek Affiliated
enterprise
Sales and
other
operating
revenue
203,795 3.06 70 days 5,472 0.33
Table 6-8

Purchases
(sales) Amount
Percentage of
total purchases
(sales) Credit term Unit price Credit term Balance
Percentage of total
notes/accounts
receivable FootnotePurchaser/seller Counterparty
Relationship
with the
counterparty
Transaction
Differences in transaction
term compared to third party
transactions Notes/accounts receivable (payable)
ELTEK AS Eltek Power Sweden AB Affiliated
enterprise
Sales and
other
operating
revenue
104,264$ 1.54 70 days 4,755$ 0.29
ELTEK AS Delta Electronics Int’l (Singapore) Pte. Ltd. Affiliated
enterprise
Sales and
other
operating
revenue
132,272 2.04 70 days 16,203 1.00
ELTEK AS Eltek s.r.o. Affiliated
enterprise
Sales and
other
operating
revenue
485,704 7.27 70 days 84,389 5.20 Note 5
ELTEK AS DELTA ELECTRONICS (USA) INC. Affiliated
enterprise
Sales and
other
operating
revenue
1,196,560 17.98 70 days 342,774 21.11
Delta Electronics (Netherlands) B.V. Delta Electronics (Italy) S.r.l. Affiliated
enterprise
Sales and
other
operating
revenue
174,082 2.84 70 days 29,436 2.71
Delta Electronics (Netherlands) B.V. Delta Electronics Int’l (Singapore) Pte. Ltd. Affiliated
enterprise
Sales and
other
operating
revenue
593,391 9.76 70 days 87,575 8.07
Delta Electronics (Netherlands) B.V. Delta Greentech Electronics Industry LLC Affiliated
enterprise
Sales and
other
operating
revenue
415,034 6.89 70 days 238,247 21.94
Delta Electronics (Japan), Inc. Delta Electronics Int’l (Singapore) Pte. Ltd. Affiliated
enterprise
Sales and
other
operating
revenue
933,639 17.11 70 days 170,126 17.33
Delta Electronics (Japan), Inc. Delta Electronics Inc. Ultimate
parent
company
Sales and
other
operating
revenue
231,255 4.25 70 days 36,397 3.71
Delta Electronics (Americas) Ltd. Delta Electronics Int’l (Singapore) Pte. Ltd. Affiliated
enterprise
Sales and
other
operating
revenue
1,409,217 18.56 70 days 10,052 1.05
Delta Electronics (Americas) Ltd. Delta Electronics (Thailand) Public Company
Limited
Affiliated
enterprise
Sales and
other
operating
revenue
454,504 6.02 70 days 67,342 7.04
Delta Electronics (Americas) Ltd. Delta Electronics Inc. Ultimate
parent
company
Sales and
other
operating
revenue
138,250 1.86 70 days 19,169 2.00
Table 6-9

Purchases
(sales) Amount
Percentage of
total purchases
(sales) Credit term Unit price Credit term Balance
Percentage of total
notes/accounts
receivable FootnotePurchaser/seller Counterparty
Relationship
with the
counterparty
Transaction
Differences in transaction
term compared to third party
transactions Notes/accounts receivable (payable)
Vivotek Inc. Vivotek USA, Inc. Affiliated
enterprise
Sales 525,772$ 8.77 90 days 152,659$ 20.21
Vivotek Inc. Vatics Inc. Affiliated
enterprise
Purchase 117,769 2.93 30 days 17,395)( 2.57
Delta Energy Systems (Germany) GmbH Delta Electronics (Thailand) Public Company
Limited
Affiliated
enterprise
Sales and
other
operating
revenue
2,117,776 89.67 70 days 14,540 17.16
Delta Electronics India Pvt. Ltd. Delta Electronics Int’l (Singapore) Pte. Ltd. Affiliated
enterprise
Sales and
other
operating
revenue
199,511 4.11 70 days 77,945 2.89
Delta Electronics (Myanmar) Co., Ltd. Delta Electronics (Thailand) Public Company
Limited
Affiliated
enterprise
Sales and
other
operating
revenue
104,263 100.01 70 days 7,865 100.00
Delta Electronics (Slovakia) s.r.o. Delta Greentech (Netherlands) B.V. Affiliated
enterprise
Sales and
other
operating
revenue
390,839 12.09 70 days 17,634 1.83
Delta Electronics (Slovakia) s.r.o. Delta Electronics (Netherlands) B.V. Affiliated
enterprise
Sales and
other
operating
revenue
541,177 17.11 70 days 144,954 15.05
Delta Electronics (Slovakia) s.r.o. Delta Electronics Int’l (Singapore) Pte. Ltd. Affiliated
enterprise
Sales and
other
operating
revenue
1,464,384 46.32 70 days 434,996 22.58
Delta Electronics (Slovakia) s.r.o. Delta Electronics (Thailand) Public Company
Limited
Affiliated
enterprise
Sales and
other
operating
revenue
614,666 19.81 70 days 352,467 36.60
Eltek s.r.o. ELTEK AS Affiliated
enterprise
Sales and
other
operating
revenue
1,954,077 98.79 70 days 104,395 80.58
Delta Electronics (Thailand) Public Company
Limited
Delta Electronics (Shanghai) Co., Ltd. Affiliated
enterprise
Sales 135,728 0.34 70 days 6,599 0.07
Delta Electronics (Thailand) Public Company
Limited
Delta Energy Systems (Germany) GmbH Affiliated
enterprise
Sales 109,164 0.25 70 days 2,176 0.02
Table 6-10

Purchases
(sales) Amount
Percentage of
total purchases
(sales) Credit term Unit price Credit term Balance
Percentage of total
notes/accounts
receivable FootnotePurchaser/seller Counterparty
Relationship
with the
counterparty
Transaction
Differences in transaction
term compared to third party
transactions Notes/accounts receivable (payable)
Delta Electronics (Thailand) Public Company
Limited
Delta Power Solutions (India) Pvt. Ltd. Affiliated
enterprise
Sales 111,360$ 0.28 70 days -$ -
Delta Electronics (Thailand) Public Company
Limited
Delta Electronics India Pvt. Ltd. Affiliated
enterprise
Sales and
other
operating
revenue
438,732 1.11 70 days 122,210 1.33
Delta Electronics (Thailand) Public Company
Limited
Delta Electronics (Japan), Inc. Affiliated
enterprise
Sales 240,717 0.61 70 days 60,483 0.66
Delta Electronics (Thailand) Public Company
Limited
Delta Electronics Int’l (Singapore) Pte. Ltd. Affiliated
enterprise
Sales 367,752 0.94 70 days 52,527 0.57
Delta Electronics (Thailand) Public Company
Limited
Delta Electronics (Slovakia) s.r.o. Affiliated
enterprise
Sales and
other
operating
revenue
229,529 0.54 70 days 25,013 0.27
Delta Electronics (Thailand) Public Company
Limited
Delta Electronics Inc. Ultimate
parent
company
Sales 110,979 0.29 70 days 31,674 0.34
Delta Electronics (Thailand) Public Company
Limited
DET Logistics (USA) Corporation Affiliated
enterprise
Sales and
other
operating
revenue
14,639,861 36.82 70 days 4,725,070 51.26
Delta Electronics (Thailand) Public Company
Limited
Delta Electronics (Americas) Ltd. Affiliated
enterprise
Sales 714,683 1.79 70 days 184,399 2.00
Delta Electronics (Thailand) Public Company
Limited
DELTA ELECTRONICS (USA) INC. Affiliated
enterprise
Sales 177,251 0.42 70 days 89,169 0.97
Note 1: Selling price was the same with the third parties. The credit term to related parties is 60~90 days after monthly billings, while 30~120 days after monthly billings for the third parties.
Note 2: Sales price was available to third party, the collection term for related parties is 75 days from next month, the credit terms to the third parties is 30~120 days after monthly billings.
Note 4: Sales revenue is cost plus necessary profit, the collection term for related parties is 75 days from next month.
Note 5: It initially was the Group’s associate, and became the Group’s subsidiary since April 2019.
Note 3: For the sales transactions, the amount is calculated by adding costs, fees and all necessary processing costs. The credit term to related parties is 60~90 days after monthly billings, while 30~120 days after monthly billings for the third parties.
Table 6-11

Table 7
Amount Action taken
Delta Electronics, Inc. Cyntec Electronics (Suzhou) Co., Ltd. Subsidiary 133,400$ 3.25 1,009$ 33,681$ -$
Delta Electronics, Inc. Delta Electronics Int'l (Singapore) Pte. Ltd. Subsidiary 2,050,668 8.44 40,430 2,050,668 -
Delta Electronics, Inc. Delta Electronics (Thailand) Public Company
Limited
Subsidiary 207,670 14.55 52,583 182,443 -
Delta Electronics, Inc. DEI Logistics (USA) Corp. Subsidiary 2,403,743 5.07 6,583 1,554,150 -
Delta Electronics, Inc. Delta Electronics (Americas) Ltd. Subsidiary 108,971 7.14 - 108,971 -
Delta Electronics Int'l (Singapore) Pte. Ltd. Delta Greentech (Brasil) S.A. Affiliated
enterprise
182,237 2.38 76,965 56,979 -
Delta Electronics Int’l (Singapore) Pte. Ltd. Delta Electronics ( Switzerland ) AG Affiliated
enterprise
378,561 5.08 - 307,867 -
Delta Electronics Int'l (Singapore) Pte. Ltd. Delta Electronics (Dongguan) Co., Ltd. Affiliated
enterprise
1,007,970 12.38 37,881 929,380 -
Delta Electronics Int'l (Singapore) Pte. Ltd. Delta Electronics Power (Dongguan) Co., Ltd. Affiliated
enterprise
1,829,242 13.36 463,158 1,829,242 -
Delta Electronics Int'l (Singapore) Pte. Ltd. Delta Electronics (Jiangsu) Ltd. Affiliated
enterprise
1,443,569 22.35 - 1,443,569 -
Delta Electronics Int'l (Singapore) Pte. Ltd. Delta Electronics Components (Wujiang) Ltd. Affiliated
enterprise
1,247,026 16.24 - 1,247,026 -
Delta Electronics Int'l (Singapore) Pte. Ltd. Delta Video Display System (Wujiang) Ltd. Affiliated
enterprise
242,711 17.61 - 242,711 -
Delta Electronics Int'l (Singapore) Pte. Ltd. Delta Networks (Dongguan) Ltd. Affiliated
enterprise
1,312,357 25.61 15 1,312,357 -
Delta Electronics Int'l (Singapore) Pte. Ltd. Delta Electronics (Wuhu) Co., Ltd. Affiliated
enterprise
1,194,038 8.47 - 1,194,038 -
Delta Electronics Int'l (Singapore) Pte. Ltd. Delta Electronics (Chenzhou) Co., Ltd. Affiliated
enterprise
687,149 10.47 302,430 428,714 -
Delta Electronics Int’l (Singapore) Pte. Ltd. Cyntec Co., Ltd. Affiliated
enterprise
263,106 5.31 - 177,346 -
Delta Electronics Int’l (Singapore) Pte. Ltd. Cyntec International Ltd. Affiliated
enterprise
1,050,790 3.99 - 637,883 -
Delta Electronics Int'l (Singapore) Pte. Ltd. Delta Electronics India Pvt. Ltd. Affiliated
enterprise
362,480 7.95 20,521 239,992 -
Delta Electronics Int'l (Singapore) Pte. Ltd. Delta Electronics (Japan), Inc. Affiliated
enterprise
586,949 9.54 - 405,332 -
Delta Electronics Int’l (Singapore) Pte. Ltd. ELTEK POWER (MALAYSIA) SDN. BHD. Affiliated
enterprise
121,700 0.40 112,793 2,206 -
Expressed in thousands of New Taiwan dollars, except as otherwise indicated
Amount collected
subsequent to the
balance date
(Note 2)
Allowance for
doubtful accountsCreditor Counterparty
Relationship
with the
counterparty
Balance as at
December 31, 2019
(Note 1) Turnover rate
Overdue receivables
Delta Electronics, Inc. and Subsidiaries
Receivables from related parties reaching $100 million or 20% of paid-in capital or more
December 31, 2019
Table 7-1

Amount Action taken
Amount collected
subsequent to the
balance date
(Note 2)
Allowance for
doubtful accountsCreditor Counterparty
Relationship
with the
counterparty
Balance as at
December 31, 2019
(Note 1) Turnover rate
Overdue receivables
Delta Electronics Int'l (Singapore) Pte. Ltd. Delta Electronics (Netherlands) B.V. Affiliated
enterprise
623,019$ 8.64 -$ 623,019$ -$
Delta Electronics Int'l (Singapore) Pte. Ltd. ELTEK AS Affiliated
enterprise
181,890 13.63 - 103,198 -
Delta Electronics Int'l (Singapore) Pte. Ltd. Delta Electronics (Thailand) Public Company
Limited
Affiliated
enterprise
194,886 6.81 7,474 114,826 -
Delta Electronics Int'l (Singapore) Pte. Ltd. Delta Electronics, Inc. Ultimate parent
company
7,432,332 2.95 - 2,056,319 -
Delta Electronics Int'l (Singapore) Pte. Ltd. DEI Logistics (USA) Corp. Affiliated
enterprise
6,383,361 7.30 573,449 3,936,460 -
Delta Electronics Int'l (Singapore) Pte. Ltd. Delta Electronics (Americas) Ltd. Affiliated
enterprise
687,908 7.71 2,896 428,175 -
Delta Electronics Int'l (Singapore) Pte. Ltd. Digital Projection Inc. Associate 134,471 6.29 70,220 70,220 -
Delta Electronics Int’l (Singapore) Pte. Ltd. DELTA ELECTRONICS (USA) INC. Affiliated
enterprise
437,074 10.28 216,636 136,311 -
Delta Networks (Dongguan) Ltd. Delta Electronics Int’l (Singapore) Pte. Ltd. Affiliated
enterprise
2,068,258 13.74 - 1,753,830 -
Delta Electronics (Chenzhou) Co., Ltd. Delta Electronics (Shanghai) Co., Ltd. Affiliated
enterprise
163,519 6.48 - 105,708 -
Delta Electronics (Chenzhou) Co., Ltd. Delta Electronics Int’l (Singapore) Pte. Ltd. Affiliated
enterprise
768,153 9.52 - 704,529 -
Chenzhou Delta Technology Co., Ltd. Delta Electronics Power (Dongguan) Co., Ltd. Affiliated
enterprise
362,016 8.75 - 314,058 -
Cyntec Co., Ltd. Delta Electronics Int’l (Singapore) Pte. Ltd. Affiliated
enterprise
113,063 14.61 - 133,063 -
Cyntec Co., Ltd. Delta Electronics Inc. Ultimate parent
company
432,289 3.49 - 294,345 -
Cyntec Electronics (Suzhou) Co., Ltd. Delta Electronics Int’l (Singapore) Pte. Ltd. Affiliated
enterprise
3,147,932 4.63 20,286 2,850,236 -
Delta Electronics (Dongguan) Co., Ltd. Delta Electronics (Shanghai) Co., Ltd. Affiliated
enterprise
303,473 5.43 - 177,460 -
Delta Electronics (Dongguan) Co., Ltd. Delta Electronics Int’l (Singapore) Pte. Ltd. Affiliated
enterprise
1,583,437 10.09 - 1,558,959 -
Delta Electronics Power (Dongguan) Co., Ltd. Delta Electronics (Shanghai) Co., Ltd. Affiliated
enterprise
572,370 6.22 - 368,891 -
Delta Electronics Power (Dongguan) Co., Ltd. Delta Electronics Int’l (Singapore) Pte. Ltd. Affiliated
enterprise
2,682,974 12.88 - 2,682,974 -
Delta Electronics (Shanghai) Co., Ltd. Delta Greentech (China) Co., Ltd. Affiliated
enterprise
4,020,275 6.66 - 2,499,779 -
Delta Electronics (Shanghai) Co., Ltd. Delta Electronics (Pingtan) Co., Ltd. Affiliated
enterprise
557,637 5.73 - 332,362 -
Delta Electronics (Shanghai) Co., Ltd. Delta Electronics Int’l (Singapore) Pte. Ltd. Affiliated
enterprise
299,002 5.59 - 130,367 -
Delta Electronics (Wuhu) Co., Ltd. Delta Electronics Int’l (Singapore) Pte. Ltd. Affiliated
enterprise
1,913,633 9.41 31 1,772,897 -
Table 7-2

Amount Action taken
Amount collected
subsequent to the
balance date
(Note 2)
Allowance for
doubtful accountsCreditor Counterparty
Relationship
with the
counterparty
Balance as at
December 31, 2019
(Note 1) Turnover rate
Overdue receivables
ELTEK AS Eltek Egypt for Power Supply S.A.E. Affiliated
enterprise
193,938$ 2.56 154,804$ 75,717$ -$
ELTEK AS ELTEK POWER FRANCE SAS Affiliated
enterprise
191,821 6.92 - 154,872 -
ELTEK AS Eltek Power (UK) Ltd. Affiliated
enterprise
147,327 10.23 277 147,327 -
ELTEK AS DELTA ELECTRONICS (USA) INC. Affiliated
enterprise
342,774 6.72 70 51,259 -
Delta Electronics (Jiangsu) Ltd. Delta Electronics (Shanghai) Co., Ltd. Affiliated
enterprise
1,723,371 6.90 - 1,060,982 -
Delta Electronics (Jiangsu) Ltd. Delta Electronics (Wuhu) Co., Ltd. Affiliated
enterprise
120,953 8.22 - 73,477 -
Delta Electronics (Jiangsu) Ltd. Delta Electronics Int’l (Singapore) Pte. Ltd. Affiliated
enterprise
3,185,866 22.12 - 3,185,866 -
Delta Electronics Components (Wujiang) Ltd. Delta Electronics (Shanghai) Co., Ltd. Affiliated
enterprise
3,051,738 7.17 - 1,945,745 -
Delta Electronics Components (Wujiang) Ltd. Delta Electronics Int’l (Singapore) Pte. Ltd. Affiliated
enterprise
1,766,011 17.02 - 1,766,011 -
Delta Video Display System (Wujiang) Ltd. Delta Electronics (Shanghai) Co., Ltd. Affiliated
enterprise
568,651 6.10 - 373,195 -
Delta Video Display System (Wujiang) Ltd. Delta Electronics Int’l (Singapore) Pte. Ltd. Affiliated
enterprise
223,091 26.17 - 223,091 -
Delta Electronics (Netherlands) B.V. Delta Greentech Electronics Industry LLC Affiliated
enterprise
238,247 1.95 40,716 60,292 -
Delta Electronics (Thailand) Public Company Limited Delta Electronics India Pvt. Ltd. Affiliated
enterprise
122,210 6.57 24,980 103,539 -
Delta Electronics (Thailand) Public Company Limited DET Logistics (USA) Corporation Affiliated
enterprise
4,725,070 3.24 1,095,477 3,069,585 -
Delta Electronics (Thailand) Public Company Limited Delta Electronics (Americas) Ltd. Affiliated
enterprise
184,399 7.21 - 99,637 -
Delta Electronics (Slovakia) s.r.o. Delta Electronics (Netherlands) B.V. Affiliated
enterprise
144,954 5.65 - 84,542 -
Delta Electronics (Slovakia) s.r.o. Delta Electronics Int’l (Singapore) Pte. Ltd. Affiliated
enterprise
434,996 4.93 - 316,715 -
Delta Electronics (Slovakia) s.r.o. Delta Electronics (Thailand) Public Company
Limited
Affiliated
enterprise
352,467 3.06 - 260,023 -
Eltek s.r.o. ELTEK AS Affiliated
enterprise
104,395 26.15 989 104,395 -
Delta Electronics (Japan), Inc. Delta Electronics Int’l (Singapore) Pte. Ltd. Affiliated
enterprise
170,126 4.81 - 6,695 -
Vivotek Inc. Vivotek USA, Inc. Affiliated
enterprise
152,659 3.60 - - -
Delta Energy Systems (Germany) GmbH Delta Electronics (Thailand) Public Company
Limited
Affiliated
enterprise
247,324 - 46 - -
Delta International Holding Limited Delta Electronics (H.K.) Ltd. Affiliated
enterprise
14,874,153 - - - -
Table 7-3

Amount Action taken
Amount collected
subsequent to the
balance date
(Note 2)
Allowance for
doubtful accountsCreditor Counterparty
Relationship
with the
counterparty
Balance as at
December 31, 2019
(Note 1) Turnover rate
Overdue receivables
Fairview Assets Ltd. Delta Electronics (Netherlands) B.V. Affiliated
enterprise
10,193,200$ - -$ -$ -$
Fairview Assets Ltd. Delta Controls Inc. Affiliated
enterprise
2,008,660 - - - -
Fairview Assets Ltd. Delta Electronics Int’l (Singapore) Pte. Ltd. Affiliated
enterprise
8,139,570 - - - -
Delta Networks Holding Limited Delta Electronics (Netherlands) B.V. Affiliated
enterprise
2,401,405 - - - -
Delta Networks Holding Limited Delta Electronics Int’l (Singapore) Pte. Ltd. Affiliated
enterprise
870,024 - - - -
Delta International Holding Limited Delta Electronics (Netherlands) B.V. Affiliated
enterprise
8,014,451 - - - -
Delta International Holding Limited Delta Electronics Int’l (Singapore) Pte. Ltd. Affiliated
enterprise
14,769,307 - - - -
Delta International Holding Limited Drake Investment (HK) Limited Affiliated
enterprise
990,604 - - - -
Delta Electronics (Wuhu) Co., Ltd. Delta Electronics (Jiangsu) Ltd. Affiliated
enterprise
1,102,648 - - - -
Vivotek Inc. Vatics Inc. Affiliated
enterprise
163,565 - - - -
Delta Energy Systems (Germany) GmbH Delta Energy Systems Property (Germany)
GmbH
Affiliated
enterprise
366,131 - - - -
Note 1: Including other receivables in excess of $100,000.
Note 2: The amount represents collections subsequent to December 31, 2019 up to March 10, 2020.
Table 7-4

Table 8
General ledger account Amount (Note 7) Transaction terms
Percentage of
consolidated total
operating revenues or
total assets
(Note 3)
0 Delta Electronics, Inc. Delta Electronics Int'l (Singapore) Pte. Ltd. Subsidiary Sales and other
operating revenue
13,226,927$ (Note 4) 4.93
0 Delta Electronics, Inc. DEI Logistics (USA) Corp. Subsidiary Sales and other
operating revenue
7,150,125 (Note 4) 2.67
1 Delta Electronics Int'l (Singapore) Pte. Ltd. Delta Electronics (Dongguan) Co., Ltd. Affiliated enterprise Sales and other
operating revenue
5,954,782 (Note 4) 2.22
1 Delta Electronics Int'l (Singapore) Pte. Ltd. Delta Electronics Power (Dongguan) Co., Ltd. Affiliated enterprise Sales and other
operating revenue
11,552,172 (Note 4) 4.31
1 Delta Electronics Int'l (Singapore) Pte. Ltd. Delta Electronics (Jiangsu) Ltd. Affiliated enterprise Sales and other
operating revenue
16,805,200 (Note 4) 6.27
1 Delta Electronics Int'l (Singapore) Pte. Ltd. Delta Electronics Components (Wujiang) Ltd. Affiliated enterprise Sales and other
operating revenue
11,603,582 (Note 4) 4.33
1 Delta Electronics Int'l (Singapore) Pte. Ltd. Delta Video Display System (Wujiang) Ltd. Affiliated enterprise Sales and other
operating revenue
2,813,726 (Note 4) 1.05
1 Delta Electronics Int'l (Singapore) Pte. Ltd. Delta Networks (Dongguan) Ltd. Affiliated enterprise Sales and other
operating revenue
10,766,626 (Note 4) 4.02
1 Delta Electronics Int'l (Singapore) Pte. Ltd. Delta Electronics (Wuhu) Co., Ltd. Affiliated enterprise Sales and other
operating revenue
6,078,444 (Note 4) 2.27
1 Delta Electronics Int'l (Singapore) Pte. Ltd. Delta Electronics (Japan), Inc. Affiliated enterprise Sales and other
operating revenue
2,948,357 (Note 4) 1.10
1 Delta Electronics Int'l (Singapore) Pte. Ltd. Delta Electronics (Netherlands) B.V. Affiliated enterprise Sales and other
operating revenue
2,767,840 (Note 4) 1.03
1 Delta Electronics Int'l (Singapore) Pte. Ltd. Delta Electronics Inc. Ultimate parent
company
Sales and other
operating revenue
16,664,508 (Note 4) 6.22
1 Delta Electronics Int'l (Singapore) Pte. Ltd. DEI Logistics (USA) Corp. Affiliated enterprise Sales 24,064,206 (Note 4) 8.97
1 Delta Electronics Int’l (Singapore) Pte. Ltd. Delta Electronics (Americas) Ltd. Affiliated enterprise Sales 2,732,567 (Note 4) 1.02
2 Delta Networks (Dongguan) Ltd. Delta Electronics Int'l (Singapore) Pte. Ltd. Affiliated enterprise Sales and other
operating revenue
14,654,249 (Note 4) 5.47
Number
(Note 1) Company name Counterparty
Relationship
(Note 2)
Expressed in thousands of New Taiwan dollars, except as otherwise indicated
Transaction
Delta Electronics, Inc. and Subsidiaries
Significant inter-company transactions during the reporting period
Year ended December 31, 2019
Table 8-1

General ledger account Amount (Note 7) Transaction terms
Percentage of
consolidated total
operating revenues or
total assets
(Note 3)
Number
(Note 1) Company name Counterparty
Relationship
(Note 2)
Transaction
3 Delta Electronics (Dongguan) Co., Ltd. Delta Electronics Int’l (Singapore) Pte. Ltd. Affiliated enterprise Sales 8,241,746$ (Note 4) 3.07
4 Delta Electronics Power (Dongguan) Co., Ltd. Delta Electronics Int’l (Singapore) Pte. Ltd. Affiliated enterprise Sales and other
operating revenue
17,812,635 (Note 4) 6.64
5 Delta Electronics (Jiangsu) Ltd. Delta Electronics (Shanghai) Co., Ltd. Affiliated enterprise Sales 6,179,388 (Note 4) 2.30
5 Delta Electronics (Jiangsu) Ltd. Delta Electronics Int’l (Singapore) Pte. Ltd. Affiliated enterprise Sales 36,619,932 (Note 4) 13.66
6 Delta Electronics Components (Wujiang) Ltd. Delta Electronics (Shanghai) Co., Ltd. Affiliated enterprise Sales 11,389,974 (Note 4) 4.25
6 Delta Electronics Components (Wujiang) Ltd. Delta Electronics Int’l (Singapore) Pte. Ltd. Affiliated enterprise Sales and other
operating revenue
15,602,874 (Note 4) 5.82
7 Delta Video Display System (Wujiang) Ltd. Delta Electronics Int’l (Singapore) Pte. Ltd. Affiliated enterprise Sales and other
operating revenue
3,044,774 (Note 4) 1.14
8 Delta Electronics (Wuhu) Co., Ltd. Delta Electronics Int’l (Singapore) Pte. Ltd. Affiliated enterprise Sales 9,336,504 (Note 4) 3.48
9 Delta Electronics (Chenzhou) Co., Ltd. Delta Electronics Int’l (Singapore) Pte. Ltd. Affiliated enterprise Sales 3,788,305 (Note 4) 1.41
10 Delta Electronics (Shanghai) Co., Ltd. Delta Greentech (China) Co., Ltd. Affiliated enterprise Sales and other
operating revenue
13,918,526 (Note 4) 5.19
11 Cyntec Electronics (Suzhou) Co., Ltd. Delta Electronics Int’l (Singapore) Pte. Ltd. Affiliated enterprise Sales 10,263,850 (Note 6) 3.83
12 Delta Electronics (Thailand) Public Company
Limited
DET Logistics (USA) Corporation Affiliated enterprise Sales and other
operating revenue
14,639,861 (Note 4) 5.46
1 Delta Electronics Int’l (Singapore) Pte. Ltd. Delta Electronics Inc. Ultimate parent
company
Accounts receivable and
other receivables
7,432,332 (Note 4) 2.39
1 Delta Electronics Int’l (Singapore) Pte. Ltd. DEI Logistics (USA) Corp. Affiliated enterprise Accounts receivable 6,383,361 (Note 4) 2.05
11 Cyntec Electronics (Suzhou) Co., Ltd. Delta Electronics Int’l (Singapore) Pte. Ltd. Affiliated enterprise Accounts receivable 3,147,932 (Note 4) 1.01
10 Delta Electronics (Shanghai) Co., Ltd. Delta Greentech (China) Co., Ltd. Affiliated enterprise Accounts receivable 4,020,275 (Note 4) 1.29
5 Delta Electronics (Jiangsu) Ltd. Delta Electronics Int’l (Singapore) Pte. Ltd. Affiliated enterprise Accounts receivable 3,185,866 (Note 4) 1.02
Table 8-2

General ledger account Amount (Note 7) Transaction terms
Percentage of
consolidated total
operating revenues or
total assets
(Note 3)
Number
(Note 1) Company name Counterparty
Relationship
(Note 2)
Transaction
12 Delta Electronics (Thailand) Public Company
Limited
DET Logistics (USA) Corporation Affiliated enterprise Accounts receivable 4,725,070$ (Note 4) 1.52
13 Delta International Holding Limited Delta Electronics (H.K.) Ltd. Affiliated enterprise Other receivables 14,874,153 (Note 5) 4.78
14 Fairview Assets Ltd. Delta Electronics (Netherlands) B.V. Affiliated enterprise Other receivables 10,193,200 (Note 5) 3.28
14 Fairview Assets Ltd. Delta Electronics Int’l (Singapore) Pte. Ltd. Affiliated enterprise Other receivables 8,139,570 (Note 5) 2.62
13 Delta International Holding Limited Delta Electronics (Netherlands) B.V. Affiliated enterprise Other receivables 8,014,451 (Note 5) 2.58
13 Delta International Holding Limited Delta Electronics Int’l (Singapore) Pte. Ltd. Affiliated enterprise Other receivables 14,769,307 (Note 5) 4.75
Note 1: The numbers filled in for the transaction company in respect of inter-company transactions are as follows:
(1) Parent company is ‘0’.
(2) The subsidiaries are numbered in order starting from ‘1’.
(1) Parent company to subsidiary.
(2) Subsidiary to parent company.
(3) Subsidiary to subsidiary.
Note 3: Regarding percentage of transaction amount to consolidated total operating revenues or total assets, it is computed based on period-end balance of transaction to consolidated total assets for balance sheet accounts and based on
accumulated transaction amount for the period to consolidated total operating revenues for income statement accounts.
Note 4: There is no similar transaction to compare with. It will follow the agreed price and transaction terms and all the credit terms are 70 days.
Note 5: Lending of capital
Note 6: Sales revenue is cost plus necessary profit, the collection term for related parties is 75 days from next month.
Note 7: The disclosure requirement for the above disclosed amounts is 1% of the consolidated total assets for balance sheet accounts and 1% of the consolidated total revenue for income statement accounts.
Note 2: Relationship between transaction company and counterparty is classified into the following three categories:
Table 8-3

Balance as at
December 31,
2019
Balance as at
December 31,
2018 Number of shares Ownership (%) Book value
Delta Electronics, Inc. Delta International Holding Limited Cayman
Islands
Equity investments 8,922,118$ 8,922,118$ 67,680,000 100.00 71,598,502$ 8,372,730$ 8,900,336$ (Note 6)
Delta Electronics, Inc. Delta Networks Holding Limited Cayman
Islands
Equity investments 29,581 29,581 83,800,000 100.00 5,547,216 247,367 180,995 (Note 6)
Delta Electronics, Inc. PreOptix (Hong Kong) Co., Ltd. Hong Kong Equity investments 162,376 162,376 5,250,000 39.62 243,787 199,548 79,061
Delta Electronics, Inc. Cyntec Co., Ltd. Taiwan Research, development,
manufacturing and sales of film
optic-electronic devices
12,067,931 12,067,931 2,341,204,333 100.00 33,929,506 1,140,122 910,629 (Note 6)
Delta Electronics, Inc. Delta Electronics Capital Company Taiwan Equity investments 3,253,241 3,253,241 350,000,000 100.00 3,835,853 308,435 308,435
Delta Electronics, Inc. Delta Electronics Int'l (Singapore) Pte.
Ltd.
Singapore Sales of electronic products 34,498 7,270 1,500,000 100.00 24,194,633 9,621,278 9,347,995 (Note 6)
Delta Electronics, Inc. DelBio Inc. Taiwan Manufacturing, wholesale and
retail of medical equipment
900,000 900,000 21,761,836 100.00 218,817 18,955 18,061 (Note 6)
Delta Electronics, Inc. Allied Material Technology Corp. Taiwan Lease services, etc. 2,113,978 2,113,978 211,400,909 99.97 1,769,895 99,951)( 99,921)(
Delta Electronics, Inc. UNICOM SYSTEM ENG. CORP. Taiwan Design and sales of computer,
peripheral and information
system (software and hardware)
341,695 341,695 570,000 100.00 453,222 21,383 19,350 (Note 6)
Delta Electronics, Inc. NeoEnergy Microelectronics, Inc. Taiwan Designing and experimenting on
integrated circuits and
information software services
- 462,442 - - - 702 689 (Note 16)
Delta Electronics, Inc. Delta Electronics (Thailand) Public
Company Limited
Thailand Manufacturing and exporting
power supplies,other electronic
parts and components
4,780,487 114,615 69,128,140 5.54 4,588,711 2,912,485 56,013 (Notes 6
and 13)
Delta Electronics, Inc. Delta Electronics (Netherlands) B.V. Netherlands Sales of power products, display
solution products, electronic
components, industrial
automation products and
materials
4,529,355 4,247,073 128,492,272 100.00 10,740,522 2,289,934 925,303 (Note 6)
Information on investees
Year ended December 31, 2019
Table 9
Delta Electronics, Inc. and Subsidiaries
Expressed in thousands of New Taiwan dollars, except as otherwise indicated
Net profit (loss)
of the investee
for the year
ended December
31, 2019
Investment income
(loss) recognised by
the Company for
the year ended
December 31, 2019 Footnote
Shares held as at December 31, 2019
Investor Investee Location Main business activities
Initial investment amount
Table 9-1

Balance as at
December 31,
2019
Balance as at
December 31,
2018 Number of shares Ownership (%) Book value
Net profit (loss)
of the investee
for the year
ended December
31, 2019
Investment income
(loss) recognised by
the Company for
the year ended
December 31, 2019 Footnote
Shares held as at December 31, 2019
Investor Investee Location Main business activities
Initial investment amount
Delta Electronics, Inc. Delta Networks, Inc. (Taiwan) Taiwan Research, development, design,
manufacturing and sales of
networking system and
peripherals
-$ 2,490,390$ - - -$ 32,827$ 44,610$ (Notes 6
and 14)
Delta Electronics, Inc. Delta America Ltd. U.S.A. Equity investments 103,065 103,065 2,100,000 10.26 246,704 276,273 20,056 (Notes 6
and 9)
Delta Electronics, Inc. Vivotek Inc. Taiwan Manufacturing and sales of
video compression software and
encoding, network video server,
webcam and its related
components
4,039,937 4,039,937 43,404,058 49.87 3,908,920 274,905 43,928 (Note 6)
Delta International Holding
Limited
Delta Electronics (H.K.) Ltd. Hong Kong Equity investments, operations
management and engineering
services
- 9,845,345 - - - 4,676,058 3,271,265 (Notes
1and 17)
Delta International Holding
Limited
DAC Holding (Cayman) Limited Cayman
Islands
Equity investments - 483,885 - - - 109,484)( 109,484)( (Notes
1and 18)
Delta International Holding
Limited
Delta Electronics (Japan), Inc. Japan Sales of power products, display
solution products, electronic
components, industrial
automation products and
materials
85,712 85,712 5,600 100.00 578,816 78,893 78,893 (Note 1)
Delta International Holding
Limited
Digital Projection International Ltd. Britain Equity investments 342,982 342,982 19,249,667 41.00 240,059 26,332 12,973)( (Note 1)
Delta International Holding
Limited
PreOptix (Hong Kong) Co., Ltd. Hong Kong Equity investments 239,840 239,840 8,000,000 60.38 354,973 199,548 120,487 (Note 1)
Delta International Holding
Limited
DEI Logistics (USA) Corp. U.S.A. Warehousing and logistics
services
86,072 14,990 1,000,000 100.00 229,496 6,860 5,219 (Note 1)
Delta International Holding
Limited
Ace Pillar Holding Co., Ltd. Samoa Equity investments - 409,391 - - - 6,563)( 13,127)( (Notes
1and 16)
Delta International Holding
Limited
Drake Investment (HK) Limited Hong Kong Equity investments - 5,160,048 - - - 382,289 191,545 (Notes
1and 17)
Delta International Holding
Limited
Vivitek Corporation U.S.A. Sales of projector products and
their materials
44,970 44,970 9,000,000 100.00 113,956 16,320 16,320 (Note 1)
Delta International Holding
Limited
Delta Greentech SGP Pte. Ltd. Singapore Equity investments - 837,361 - - - 56,507 18,030 (Notes
1and 17)
Delta International Holding
Limited
Delta Electronics Europe Limited Britain Repair centre and providing
support services
109,727 109,727 500,000 100.00 58,060 4,429 4,429 (Note 1)
Delta International Holding
Limited
Boom Treasure Limited Hong Kong Equity investments - 2,614,486 - - - 172,212 45,831 (Notes
1and 17)
Delta International Holding
Limited
Apex Investment (HK) Limited Hong Kong Equity investments - 3,787,800 - - - 268,214 130,956 (Notes
1and 19)
Table 9-2

Balance as at
December 31,
2019
Balance as at
December 31,
2018 Number of shares Ownership (%) Book value
Net profit (loss)
of the investee
for the year
ended December
31, 2019
Investment income
(loss) recognised by
the Company for
the year ended
December 31, 2019 Footnote
Shares held as at December 31, 2019
Investor Investee Location Main business activities
Initial investment amount
Delta International Holding
Limited
Galaxy Star Investment (HK) Limited Hong Kong Equity investments -$ 3,787,800$ - - -$ 268,214$ 130,956$ (Notes
1and 19)
Delta International Holding
Limited
Jade Investment (HK) Limited Hong Kong Equity investments - 3,787,800 - - - 268,214 130,956 (Notes
1and 19)
Delta International Holding
Limited
Delta Electronics (Thailand) Public
Company Limited
Thailand Manufacturing and exporting
power supplies, other electronic
parts and components
12,914,701 4,291,709 191,984,450 15.39 12,748,652 2,912,485 104,475 (Note 13)
Delta International Holding
Limited
ELTEK AS Norway Research, development and
sales of power supplies and
others
14,905,081 - 93,531,101 100.00 12,748,652 1,185,420 76,666 (Note 17)
Delta International Holding
Limited
DELTA ELECTRONICS HOLDING
(USA) INC.
U.S.A. Equity investments 2,047,331 - 1,060,624 100.00 1,973,672 226,967 10,001)( (Note 17)
Delta International Holding
Limited
Delta Controls Inc. Canada Provide resolution of building
management and control
2,248,500 - 75,000,000 100.00 2,660,140 107,725 3,225 (Note 17)
Delta International Holding
Limited
Delta Electronics (Switzerland) AG Switzerland Equity investments, research,
development and sales of
electronic products
230,375 - 5,100 51.00 357,066 89,899 5,492)( (Note 17)
Delta Electronics (H.K.) Ltd. Delta Electronics International Mexico
S.A. DE C.V.
Mexico Sales of power management
system of industrial automation
product and telecommunications
equipment
181,379 181,379 252,002 100.00 140,715 8,120)( 8,120)( (Note 2)
Delta Electronics
(Netherlands) B.V.
ELTEK AS Norway Research, development and
sales of power supplies and
others
- 14,905,081 - - - 1,185,420 323,381 (Note 17)
Delta Electronics
(Netherlands) B.V.
DELTA ELECTRONICS HOLDING
(USA) INC.
U.S.A. Equity investments - 2,047,331 - - - 226,967 234,615 (Note 17)
Delta Electronics
(Netherlands) B.V.
Delta America Ltd. U.S.A. Equity investments 689,045 689,045 8,179,182 39.95 990,401 276,273 109,466 (Notes 8
and 9)
Delta Electronics
(Netherlands) B.V.
Optovue, Inc. U.S.A. Research, development, design,
manufacturing and sales of
medical equipment
1,109,260 1,109,260 5,190,330 29.50 842,043 331,448)( 97,786)(
Delta Electronics
(Netherlands) B.V.
Delta Controls Inc. Canada Provide resolution of building
management and control
- 2,248,500 - - - 107,725 104,470 (Note 17)
Delta Electronics
(Netherlands) B.V.
Energy Dragon Global Limited British
Virgin
Islands
Equity investments 169,527 169,527 10,001 100.00 219,815 24,284 24,284 (Notes 8
and 9)
Delta Electronics
(Netherlands) B.V.
Castle Horizon Limited Republic of
Seychelles
Equity investments 790,742 790,742 471,800 100.00 1,025,336 113,304 113,304 (Notes 8
and 9)
Table 9-3

Balance as at
December 31,
2019
Balance as at
December 31,
2018 Number of shares Ownership (%) Book value
Net profit (loss)
of the investee
for the year
ended December
31, 2019
Investment income
(loss) recognised by
the Company for
the year ended
December 31, 2019 Footnote
Shares held as at December 31, 2019
Investor Investee Location Main business activities
Initial investment amount
Delta Electronics
(Netherlands) B.V.
Delta Electronics (Switzerland) AG Switzerland Equity investments, research,
development and sales of
electronic products
-$ 230,375$ - - -$ 89,899$ 48,091$ (Note 17)
Delta Electronics
(Netherlands) B.V.
Delta Greentech Electronics Industry
LLC
Turkey Marketing and sales of
electronic products
115,723 115,723 479,750 51.00 47,389 39,167)( 24,393)( (Note 8)
Delta Electronics
(Netherlands) B.V.
Delta Greentech (Brasil) S.A. Brazil Manufacturing and sales of
electronic products
213,158 213,158 4,315,657 100.00 161,644 58,758 58,758 (Note 8)
Delta Electronics
(Netherlands) B.V.
DELTA ELECTRONICS BRASIL
LTDA.
Brazil Manufacturing and sales of
electronic products
332,295 332,295 37,000,000 100.00 252,004 3,383 3,383 (Note 8)
Delta Electronics
(Netherlands) B.V.
Amerlux, LLC U.S.A Design and producing of
dedicated lighting system and
facilities
2,955,825 - - 100.00 3,027,510 125,416 74,700 (Note 8)
Delta Electronics
(Netherlands) B.V.
Drake Investment (HK) Limited Hong Kong Equity investments 5,160,048 - 304,504,306 100.00 4,492,813 382,289 18,694 (Note 17)
Delta Electronics
(Netherlands) B.V.
Boom Treasure Limited Hong Kong Equity investments 2,614,486 - 1 100.00 1,965,502 172,212 1,883 (Note 17)
Delta Electronics
(Netherlands) B.V.
Delta Electronics (H.K.) Ltd. Hong Kong Equity investments, operations
management and engineering
services
9,845,345 - 2,549,297,600 100.00 17,387,743 4,676,058 1,269,648 (Note 17)
Delta Electronics
(Netherlands) B.V.
Delta Greentech SGP Pte. Ltd. Singapore Equity investments 837,361 - 12,175,470 100.00 645,313 56,507 677 (Note 17)
Delta America Ltd. Delta Electronics (Americas) Ltd. U.S.A. Sales of electronic components 216,809 216,809 250,000 100.00 1,187,993 162,720 162,720
Delta America Ltd. Delta Solar Solutions LLC U.S.A. Equity investments 66,855 66,855 - 100.00 59,144 1,677)( 1,677)(
Delta Electronics Int'l
(Singapore) Pte. Ltd.
Loy Tec electronics GmbH Austria Consulting service of building
management and control
solutions
2,433,160 2,071,849 - 100.00 2,459,179 117,931 58,213 (Note 7)
Delta Electronics Int’l
(Singapore) Pte. Ltd.
ELTEK POWER INCORPORATED Philippines Sales of power supplies and
others
22,584 - 11,400,000 100.00 24,157 2,235)( 2,305)( (Note 7)
Delta Electronics Int'l
(Singapore) Pte. Ltd.
ELTEK POWER CO., LTD. Thailand Sales of power supplies and
others
1 - 40,000 100.00 255,800 6,769)( 6,861)( (Note 7)
Delta Electronics Int'l
(Singapore) Pte. Ltd.
ELTEK POWER (CAMBODIA) LTD. Cambodia Sales of power supplies and
others
1 - 1,000 100.00 20,489)( 8)( 8)( (Note 7)
Delta Electronics Int'l
(Singapore) Pte. Ltd.
ELTEK POWER (MALAYSIA) SDN.
BHD.
Malaysia Sales of power supplies and
others
61,919 - 300,000 100.00 63,876)( 6,293 6,287 (Note 7)
Delta Electronics Int'l
(Singapore) Pte. Ltd.
Delta Electronics (Thailand) Public
Company Limited
Thailand Manufacturing and exporting
power supplies,other electronic
parts and components
35,869,626 - 534,479,306 42.85 36,571,874 2,912,485 290,872 (Note 13)
Table 9-4

Balance as at
December 31,
2019
Balance as at
December 31,
2018 Number of shares Ownership (%) Book value
Net profit (loss)
of the investee
for the year
ended December
31, 2019
Investment income
(loss) recognised by
the Company for
the year ended
December 31, 2019 Footnote
Shares held as at December 31, 2019
Investor Investee Location Main business activities
Initial investment amount
Delta Electronics Int'l
(Singapore) Pte. Ltd.
ELTEK POWER PTE. LTD. Singapore Sales of power supplies and
others and system installation
-$ -$ - - -$ 4,775)($ 55$
Loy Tec electronics GmbH LOYTEC Americas, Inc. U.S.A. Consulting service of building
management and control
solutions
322 322 9,978 100.00 18,101 9,724 9,724
Delta Networks Holding
Limited
Delta Networks, Inc. Cayman
Islands
Equity investments 5,332,212 5,332,212 1,196,886,000 100.00 2,243,939 223,627 219,222 (Note 3)
Delta Networks, Inc. Delta Networks (H.K.) Limited Hong Kong Equity investments 1,049,300 1,049,300 35,000,000 100.00 2,218,893 220,448 220,448 (Note 4)
Delta Networks, Inc. DNI Logistics (USA) Corporation U.S.A. Trading of networking system
and peripherals
- 16,671 - - - 1,838 1,838 (Notes 4
and 21)
Cyntec Co., Ltd. Fairview Assets Ltd. Cayman
Islands
Equity investments 1,116,521 1,116,521 32,740,062 100.00 29,928,831 944,379 944,379 (Note 5)
Cyntec Co., Ltd. Power Forest Technology Corporation Taiwan IC design of power management 179,161 179,161 8,702,934 59.03 162,778 700 9,102)( (Note 5)
Vivotek Inc. Vatics Inc. Taiwan Designing and sales of
multimedia integrated circuits
305,651 305,651 20,243,849 50.53 1,408 98,050)( 46,717)( (Note 11)
Vivotek Inc. Vivotek Holdings, Inc. U.S.A. Holding company 31,555 31,555 1,050 100.00 196,957 13,960 13,960 (Note 11)
Vivotek Inc. Realwin Investment Inc. Taiwan Investment in the network
communications industry
173,696 173,696 17,369,635 100.00 92,674 14,265 17,955 (Note 11)
Vivotek Inc. Vivotek Netherlands B.V. Netherlands Sales service 11,418 11,418 3,000 100.00 10,006 1,076 1,076 (Note 11)
Vivotek Inc. Otus Imaging, Inc. Taiwan Sales of webcams and related
components
44,294 44,294 6,000,000 100.00 7,228 6,455)( 6,455)( (Note 11)
Vivotek Inc. Vivotek (Japan) Inc. Japan Sales service 17,939 17,939 6,600 100.00 25,143 6,860 6,860 (Note 11)
Vivotek Holdings, Inc. Vivotek USA, Inc. U.S.A. Sales of webcams and related
components
29,980 29,980 10,000,000 100.00 283,619 13,969 13,969 (Note 10)
Realwin Investment Inc. Skywatck INC. Taiwan Wholesale of electronic
equipment
6,211 6,211 412,070 13.64 - 4,173)( - (Note 20)
Realwin Investment Inc. Wellstates Investment, LLC U.S.A. Investment and commercial
lease of real estate
34,859 34,859 - 100.00 47,911 2,304 2,304 (Note 12)
Realwin Investment Inc. Aetek Inc. Taiwan Sales of webcams and related
components
34,045 34,045 3,372,500 56.21 37,775 12,312 6,920 (Note 12)
Realwin Investment Inc. Vivotek Middle East FZCO United Arab
Emirates
Sales of webcams and related
components
11,242 11,242 1,322 89.99 11,610)( 9,785 8,805 (Note 12)
Table 9-5

Balance as at
December 31,
2019
Balance as at
December 31,
2018 Number of shares Ownership (%) Book value
Net profit (loss)
of the investee
for the year
ended December
31, 2019
Investment income
(loss) recognised by
the Company for
the year ended
December 31, 2019 Footnote
Shares held as at December 31, 2019
Investor Investee Location Main business activities
Initial investment amount
Realwin Investment Inc. Lidlight Inc. Taiwan Sales of lighting equipment 10,200$ 10,200$ 1,020,000 51.00 2,680$ 106$ 54$ (Note 12)
Realwin Investment Inc. Vatics Inc. Taiwan Designing and sales of
multimedia integrated circuits
31,123 31,123 1,556,142 3.88 1,887 98,050)( 3,808)( (Note 12)
Delta Electronics (Thailand)
Public Company Limited
DET International Holding Limited Cayman
Islands
Equity investments 9,542,307 9,542,307 264,357,330 100.00 8,386,628 320,641 320,641 (Note 15)
Delta Electronics (Thailand)
Public Company Limited
Delta Green Industrial (Thailand) Co.,
Ltd.
Thailand Integration, sales, trading,
installation and providing
services of uninterruptible
power supply, photovoltaic
inverter, electric cars changer
and data center
208,019 208,019 20,600,000 100.00 208,019 39,501 39,501 (Note 15)
Delta Electronics (Thailand)
Public Company Limited
Delta Energy Systems (Singapore) PTE.
LTD.
Singapore Equity investments, trading,
management and consultancy
5,628,503 3,403,486 146,586,590 100.00 5,628,503 185,996 185,996 (Note 15)
Note 1: The Company’s second-tier subsidiary or subsidiary, which was recognised as investment gains/losses through Delta International Holding Limited.
Note 2: The Company’s third-tier subsidiary, which was recognised as investment gains/losses through Delta Electronics (H.K.) Ltd.
Note 3: The Company’s second-tier subsidiary, which was recognised as investment gains/losses through Delta Networks Holding Limited.
Note 4: The Company’s third-tier subsidiary, which was recognised as investment gains/losses through Delta Networks, Inc.
Note 5: The Company’s second-tier subsidiary, which was recognised as investment gains/losses through Cyntec Co., Ltd.
Note 6: The investment income /loss is net of the elimination of intercompany transactions.
Note 7: The Company’s second-tier subsidiary, which was recognised as investment gains/losses through Delta Electronics Int’l (Singapore) Pte. Ltd.
Note 8: The Company’s second-tier subsidiary, which was recognised as investment gains/losses through Delta Electronics (Netherlands) B.V.
Note 11: The Company’s second-tier subsidiary, which was recognised as investment gains/losses through Vivotek Inc.
Note 12: The Company’s third-tier subsidiary, which was recognised as investment gains/losses through Realwin Investment Inc.
Note 13: The total shareholding ratio is 63.78% when the Company’s subsidiary, Delta Electronics Int'l (Singapore) Pte. Ltd., acquired the company’s equity interests on April 2, 2019, which was including the original weighted-average comprehensive
shareholding ratio of 20.01%.
Note 14: The company was merged into the Company on April 1, 2019, and the company was dissolved after the merger.
Note 10: The Company’s third-tier subsidiary, which was recognised as investment gains/losses through Vivotek Holdings, Inc.
Note 15: The Company’s third-tier subsidiary, which was recognised as investment gains/losses through Delta Electronics (Thailand) Public Company Limited.
Note 9: The Company indirectly acquired 39.95% and 49.79% equity shares of Delta America Ltd. through Delta Electronics (Netherlands) B.V. and its subsidiaries, Castle Horizon Limited and Energy Dragon Global Limited, respectively,
considering 10.26% equity shares of DAL held by the Company, the total ownership are 100%.
Note 16: This company had been liquidated in October 2019.
Note 17: In November 2019, due to the reorganisation of the Group, Delta Electronics (Netherlands) B.V. exchanged 100% equity interests of its subsidiaries, ELTEK AS, Delta Controls Inc., and DELTA ELECTRONICS HOLDING (USA) INC. and a 51%
equity interest of its subsidiary, Delta Electronics (Switzerland) AG, for 100% equity interests of the DIH’ subsidiaries, Delta Electronics (H.K.) Ltd., Drake Investment (HK) Limited, Delta Greentech SGP Pte. Ltd. and Boom Treasure Limited.
Note 18: This company had been liquidated in November 2019.
Note 19: In December 2019, the company began liquidation process and was dissolved, but has not yet been completed as at December 31, 2019.
Note 21: In August 2019, DNI Cayman sold this company to DIH, and this company merged into its subsidiary-ALI. Under the merger, ALI was the surviving company while ALN was the dissolved company.
Note 20: The Company’s Associate was recognised as investment gains/losses due to significant influence by the Company’s second-tier subsidiary Realwin Investment Inc., which owns one board member in the Company.
Table 9-6
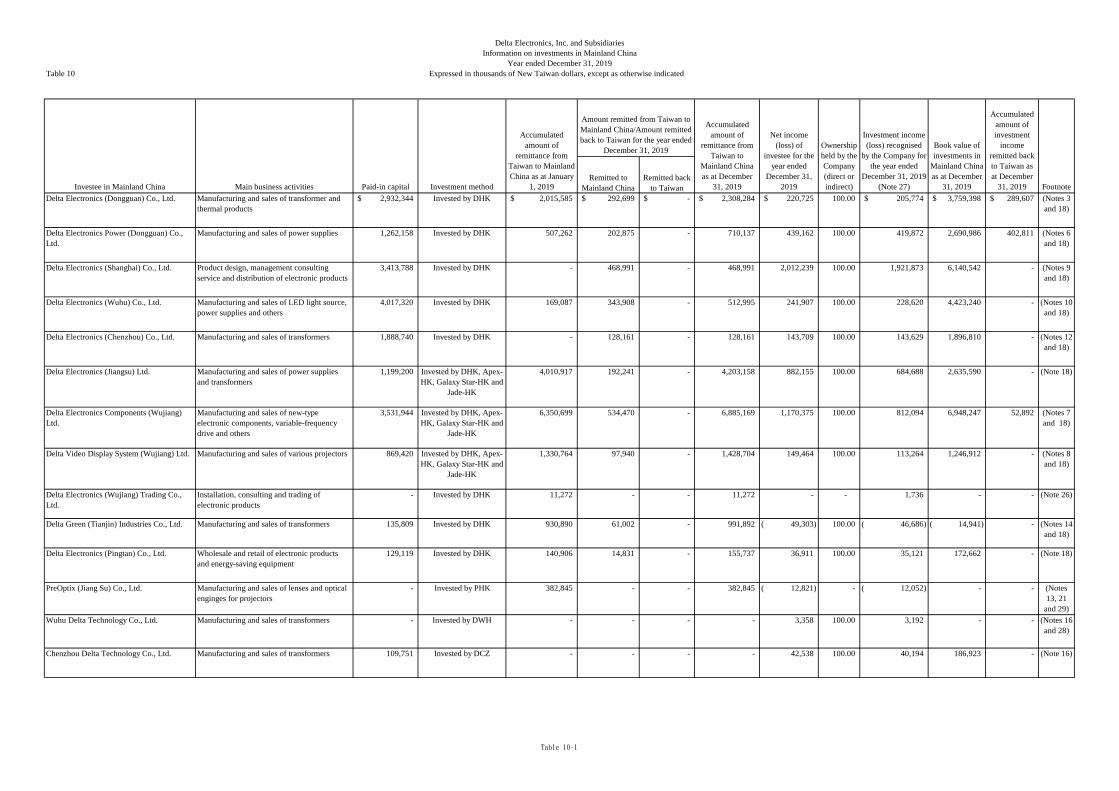
Remitted to
Mainland China
Remitted back
to Taiwan
Delta Electronics (Dongguan) Co., Ltd. Manufacturing and sales of transformer and
thermal products
2,932,344$ Invested by DHK 2,015,585$ 292,699$ -$ 2,308,284$ 220,725$ 100.00 205,774$ 3,759,398$ 289,607$ (Notes 3
and 18)
Delta Electronics Power (Dongguan) Co.,
Ltd.
Manufacturing and sales of power supplies 1,262,158 Invested by DHK 507,262 202,875 - 710,137 439,162 100.00 419,872 2,690,986 402,811 (Notes 6
and 18)
Delta Electronics (Shanghai) Co., Ltd. Product design, management consulting
service and distribution of electronic products
3,413,788 Invested by DHK - 468,991 - 468,991 2,012,239 100.00 1,921,873 6,140,542 - (Notes 9
and 18)
Delta Electronics (Wuhu) Co., Ltd. Manufacturing and sales of LED light source,
power supplies and others
4,017,320 Invested by DHK 169,087 343,908 - 512,995 241,907 100.00 228,620 4,423,240 - (Notes 10
and 18)
Delta Electronics (Chenzhou) Co., Ltd. Manufacturing and sales of transformers 1,888,740 Invested by DHK - 128,161 - 128,161 143,709 100.00 143,629 1,896,810 - (Notes 12
and 18)
Delta Electronics (Jiangsu) Ltd. Manufacturing and sales of power supplies
and transformers
1,199,200 Invested by DHK, Apex-
HK, Galaxy Star-HK and
Jade-HK
4,010,917 192,241 - 4,203,158 882,155 100.00 684,688 2,635,590 - (Note 18)
Delta Electronics Components (Wujiang)
Ltd.
Manufacturing and sales of new-type
electronic components, variable-frequency
drive and others
3,531,944 Invested by DHK, Apex-
HK, Galaxy Star-HK and
Jade-HK
6,350,699 534,470 - 6,885,169 1,170,375 100.00 812,094 6,948,247 52,892 (Notes 7
and 18)
Delta Video Display System (Wujiang) Ltd. Manufacturing and sales of various projectors 869,420 Invested by DHK, Apex-
HK, Galaxy Star-HK and
Jade-HK
1,330,764 97,940 - 1,428,704 149,464 100.00 113,264 1,246,912 - (Notes 8
and 18)
Delta Electronics (Wujiang) Trading Co.,
Ltd.
Installation, consulting and trading of
electronic products
- Invested by DHK 11,272 - - 11,272 - - 1,736 - - (Note 26)
Delta Green (Tianjin) Industries Co., Ltd. Manufacturing and sales of transformers 135,809 Invested by DHK 930,890 61,002 - 991,892 49,303)( 100.00 46,686)( 14,941)( - (Notes 14
and 18)
Delta Electronics (Pingtan) Co., Ltd. Wholesale and retail of electronic products
and energy-saving equipment
129,119 Invested by DHK 140,906 14,831 - 155,737 36,911 100.00 35,121 172,662 - (Note 18)
PreOptix (Jiang Su) Co., Ltd. Manufacturing and sales of lenses and optical
enginges for projectors
- Invested by PHK 382,845 - - 382,845 12,821)( - 12,052)( - - (Notes
13, 21
and 29)
Wuhu Delta Technology Co., Ltd. Manufacturing and sales of transformers - Invested by DWH - - - - 3,358 100.00 3,192 - - (Notes 16
and 28)
Chenzhou Delta Technology Co., Ltd. Manufacturing and sales of transformers 109,751 Invested by DCZ - - - - 42,538 100.00 40,194 186,923 - (Note 16)
Delta Electronics, Inc. and Subsidiaries
Information on investments in Mainland China
Year ended December 31, 2019
Investee in Mainland China
Book value of
investments in
Mainland China
as at December
31, 2019
Accumulated
amount of
investment
income
remitted back
to Taiwan as
at December
31, 2019
Table 10
FootnoteMain business activities Paid-in capital
Expressed in thousands of New Taiwan dollars, except as otherwise indicated
Ownership
held by the
Company
(direct or
indirect)
Investment income
(loss) recognised
by the Company for
the year ended
December 31, 2019
(Note 27)
Net income
(loss) of
investee for the
year ended
December 31,
2019
Amount remitted from Taiwan to
Mainland China/Amount remitted
back to Taiwan for the year ended
December 31, 2019
Investment method
Accumulated
amount of
remittance from
Taiwan to Mainland
China as at January
1, 2019
Accumulated
amount of
remittance from
Taiwan to
Mainland China
as at December
31, 2019
Table 10-1

Remitted to
Mainland China
Remitted back
to Taiwan
Delta Energy Technology (Dongguan) Co.,
Ltd.
Research and development of energy-saving
technology, energy-saving equipment and
energy management system as well as
technology consulting service
129,119$ Invested by DPEC and
DDG
-$ -$ -$ -$ 3,550$ 100.00 3,111$ 159,959$ -$ (Note 16)
Delta Energy Technology (Shanghai) Co.,
Ltd.
Energy performance contracting, development
of energy-saving technology, energy-saving
equipment and energy management system as
well as consulting service, installation, sales,
etc.
43,040 Invested by DPEC and
DGC
- - - - (5,242) 96.32 (5,085) 32,893 - (Note 16)
Delta Greentech (China) Co., Ltd. Sales of uninterruptible power systems 2,444,661 Invested by DIH, Ace,
Boom, Drake-HK and
DGSG
8,751,880 416,383 - 9,168,263 760,772 95.91 833,901 5,450,898 - (Notes 4
and 17)
Delta Energy Technology Puhuan
(Shanghai) Co., Ltd.
Energy technology, development and
consulting of environmental technical skills,
and design and sales of energy saving
equipment
430 Invested by DET-SH - - - - 668 96.32 4,572 8,271 - (Note 16)
Cyntec Electronics (Suzhou) Co., Ltd. Research, development, manufacturing and
sales of new-type electronic components (chip
components, sensing elements, hybrid
integrated circuits) and wholesale of similar
products
6,069,822 Invested by CHK 5,949,902 - - 5,949,902 777,637 100.00 777,637 7,587,354 - (Note 20)
Delta Networks (Dongguan) Ltd. Manufacturing and sales of other radio-
broadcast receivers and the equipment in
relation to broadband access networking
system
1,049,300 Invested by DNHK 1,340,296 - - 1,340,296 217,884 100.00 217,884 2,009,942 659,560 (Notes 5
and 19)
Delta Networks (Xiamen) Ltd. Operation of radio transmission apparatus, and
automatic data processing, reception,
conversion and transmission or regeneration
of voice, images or other data of the machine,
including switches and routers, with a special
program to control a computer or word
processor with memory business
63,476 Invested by DNHK 20,986 - - 20,986 4,149 30.00 4,061 16,342 - (Note 19)
Eltek Energy Technology (Dongguan) Ltd. Development, manufacturing and sales of
intelligent power equipment and system for
supporting access networking system, and
manufacturing and sale of intelligent power
equipment for supporting renewable energy
221,852 Invested by DHK /
ELTEK CVI LIMITED
1,123,664 12,872 - 1,136,536 10,621 100.00 10,621 170,101 - (Note 23)
DelBio (Wujiang) Co., Ltd. Manufacturing, wholesale and retail of
medical equipment
119,920 Invested by DelBio 119,920 - - 119,920 26,112 100.00 26,078 168,592 - (Note 22)
Delta Electronics (Beijing) Co., Ltd. Installation of mechanic, electronic,
telecommunication and circuit equipment
215,199 Invested by DHK - 13,712 - 13,712 23,031)( 100.00 21,914)( 153,703 - (Notes 15
and 18)
Delta Electronics (Xi'an) Co., Ltd. Sales of computer, peripheral equipment and
software
236,719 Invested by DHK 253,396 18,189 - 253,585 15,852)( 100.00 15,062)( 217,407 - (Note 18)
Investee in Mainland China Paid-in capital Investment method
Accumulated
amount of
remittance from
Taiwan to Mainland
China as at January
1, 2019
Amount remitted from Taiwan to
Mainland China/Amount remitted
back to Taiwan for the year ended
December 31, 2019
Accumulated
amount of
remittance from
Taiwan to
Mainland China
as at December
31, 2019 Footnote
Investment income
(loss) recognised
by the Company for
the year ended
December 31, 2019
(Note 27)
Book value of
investments in
Mainland China
as at December
31, 2019
Net income
(loss) of
investee for the
year ended
December 31,
2019
Ownership
held by the
Company
(direct or
indirect)
Accumulated
amount of
investment
income
remitted back
to Taiwan as
at December
31, 2019Main business activities
Table 10-2

Remitted to
Mainland China
Remitted back
to Taiwan
Beijing Industrial Foresight Technology Co.,
Ltd.
Computer system services and data process -$ Invested by Delta
Electronics (Beijing) Co.,
Ltd.
-$ -$ -$ -$ 595)($ - 448)($ -$ -$ (Note 24)
Unicom (Nanjing) System Eng. Corp Design and sales of computer, peripheral and
information system (software and hardware)
8,994 Invested by UNICOM 8,994 - - 8,994 3,771 100.00 3,771 24,771 34,009 (Note 11)
Guangzhou Amerlux Lighting Co., Ltd. Wholesale of lighting fixture and decorative
objects
14,241 Invested by Amerlux
Lighting Hong Kong
Limited
- 176,069 - 176,069 10,645 100.00 10,645 14,186 - (Note 25)
Note 1: The capital was translated based on the capital certified report of the investee companies into New Taiwan Dollars at the average exchange rate of RMB 6.96565 to US$1 and NTD 4.30398 to RMB$1.
Note 2: The accumulated remittance as at January 1, 2019, remitted or collected this period, accumulated remittance as at December 31, 2019 and investment income remitted back as at December 31, 2019 was translated into New Taiwan Dollars at the average exchange rate of NTD 29.98 to US$1 at the
balance sheet date.
Note 3: Except for the facility of US$76,994 thousand permitted by Investment Commission, the capitalisation of earnings of US$27,081 thousand permitted by Investment Commission is excluded from the Company’s amount of investment in Mainland China.
Note 4: Except for the facility of US$305,813 thousand permitted by Investment Commission, the capitalisation of earnings of US$980 thousand permitted by Investment Commission is excluded from the Company’s amount of investment in Mainland China.
Note 5: Except for the facility of US$44,706 thousand permitted by Investment Commission, the capitalisation of earnings of US$11,312 thousand permitted by Investment Commission is excluded from the Company’s amount of investment in Mainland China.
Note 6: Except for the facility of US$23,687 thousand permitted by Investment Commission, the capitalisation of earnings of US$22,654 thousand permitted by Investment Commission is excluded from the Company’s amount of investment in Mainland China.
Note 7: Except for the facility of US$229,659 thousand permitted by Investment Commission, the capitalisation of earnings of US$27,303 thousand permitted by Investment Commission is excluded from the Company’s amount of investment in Mainland China.
Note 8: Except for the facility of US$47,655 thousand permitted by Investment Commission, the capitalisation of earnings of US$8,272 thousand permitted by Investment Commission is excluded from the Company’s amount of investment in Mainland China.
Note 9: Except for the facility of US$15,643 thousand permitted by Investment Commission, the capitalisation of earnings of US$110,401 thousand permitted by Investment Commission is excluded from the Company’s amount of investment in Mainland China.
Note 10: Except for the facility of US$17,111 thousand permitted by Investment Commission, the capitalisation of earnings of US$120,320 thousand permitted by Investment Commission is excluded from the Company’s amount of investment in Mainland China.
Note 11: Indirect investment through UNICOM SYSTEM ENG. CORP.
Note 12: Except for the facility of US$4,275 thousand permitted by Investment Commission, the capitalisation of earnings of US$59,220 thousand permitted by Investment Commission is excluded from the Company’s amount of investment in Mainland China.
Note 13: Except for the facility of US$7,520 thousand permitted by Investment Commission, the investment of US$5,250 thousand by PreOptix Co., Ltd. was permitted by Investment Commission.
Note 14: Except for the facility of US$33,085 thousand permitted by Investment Commission, the capitalisation of earnings of US$265 thousand permitted by Investment Commission is excluded from the Company’s amount of investment in Mainland China.
Note 15: Except for the facility of US$457 thousand permitted by Investment Commission, the capitalisation of earnings of US$7,268 thousand permitted by Investment Commission is excluded from the Company’s amount of investment in Mainland China.
Note 16: According to the regulations of the Investment Commission, the reinvestment of the investee companies in Mainland China is not required to obtain the approval of the Investment Commission; thus the investment amounts are excluded from the calculation of the Company’s ceiling of investment
amount in Mainland China.
Note 17: Jointly invested through Drake Investment (HK) Limited., Delta Greentech SGP Pte. Ltd. and Boom Treasure Limited.
Note 18: Invest through Delta Electronics (H.K.) Ltd.
Note 19: Invest through Delta Networks (H.K.) Limited
Note 20: Invest through Cyntec Holding (H.K.) Limited.
Note 21: Invest through PreOptix (Hong Kong) Co., Ltd.
Note 23: In July 2019, this company was sold to Delta Electronics (H.K.) Ltd. by ELTEK CVI LIMITED., therefore it was invested through Delta Electronics (H.K.) Ltd.
Note 24: This company had been liquidated in July 2019.
Note 25: Invest through Amerlux Lighting Hong Kong Limited.
Note 22: Invest through DelBio Inc.
Investee in Mainland China Main business activities Paid-in capital Investment method
Accumulated
amount of
remittance from
Taiwan to Mainland
China as at January
1, 2019
Amount remitted from Taiwan to
Mainland China/Amount remitted
back to Taiwan for the year ended
December 31, 2019
Accumulated
amount of
remittance from
Taiwan to
Mainland China
as at December
31, 2019 Footnote
Net income
(loss) of
investee for the
year ended
December 31,
2019
Ownership
held by the
Company
(direct or
indirect)
Investment income
(loss) recognised
by the Company for
the year ended
December 31, 2019
(Note 27)
Book value of
investments in
Mainland China
as at December
31, 2019
Accumulated
amount of
investment
income
remitted back
to Taiwan as
at December
31, 2019
Table 10-3
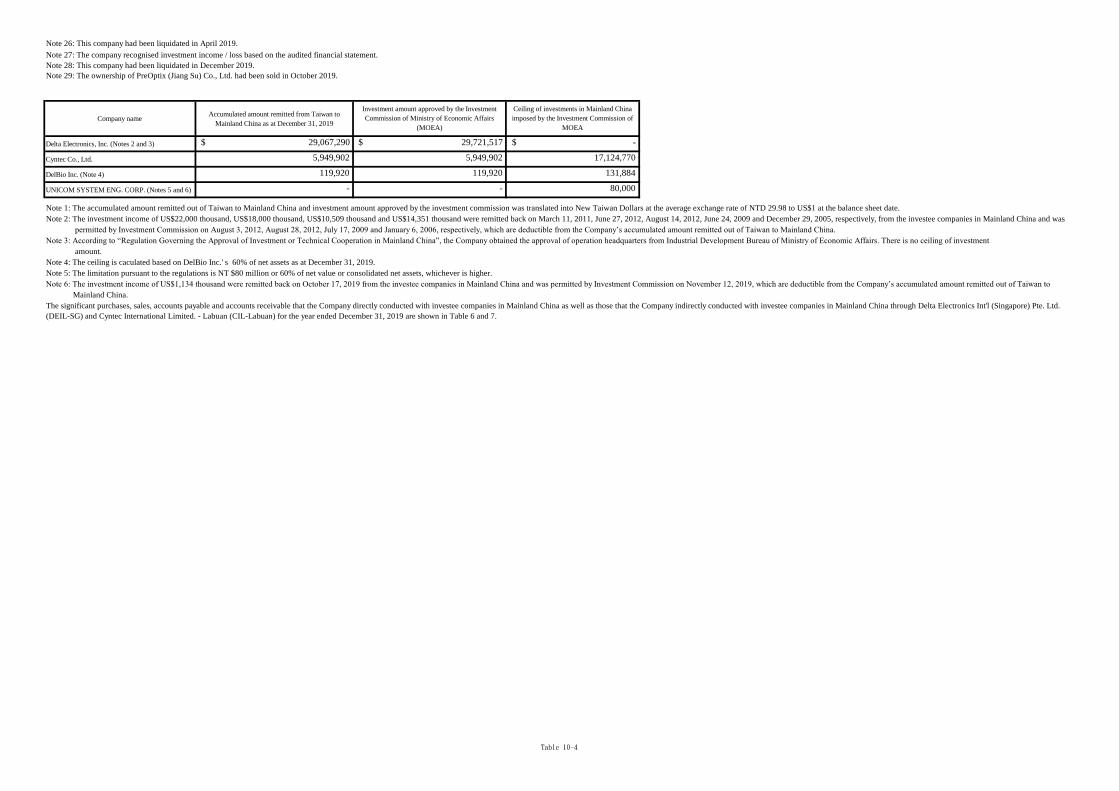
Note 26: This company had been liquidated in April 2019.
Note 27: The company recognised investment income / loss based on the audited financial statement.
Company name Accumulated amount remitted from Taiwan to
Mainland China as at December 31, 2019
Delta Electronics, Inc. (Notes 2 and 3) $ 29,067,290
Cyntec Co., Ltd. 5,949,902
DelBio Inc. (Note 4) 119,920
UNICOM SYSTEM ENG. CORP. (Notes 5 and 6) -
Note 1: The accumulated amount remitted out of Taiwan to Mainland China and investment amount approved by the investment commission was translated into New Taiwan Dollars at the average exchange rate of NTD 29.98 to US$1 at the balance sheet date.
Note 2: The investment income of US$22,000 thousand, US$18,000 thousand, US$10,509 thousand and US$14,351 thousand were remitted back on March 11, 2011, June 27, 2012, August 14, 2012, June 24, 2009 and December 29, 2005, respectively, from the investee companies in Mainland China and was
permitted by Investment Commission on August 3, 2012, August 28, 2012, July 17, 2009 and January 6, 2006, respectively, which are deductible from the Company’s accumulated amount remitted out of Taiwan to Mainland China.
Note 3: According to “Regulation Governing the Approval of Investment or Technical Cooperation in Mainland China”, the Company obtained the approval of operation headquarters from Industrial Development Bureau of Ministry of Economic Affairs. There is no ceiling of investment
amount.
Note 4: The ceiling is caculated based on DelBio Inc.' s 60% of net assets as at December 31, 2019.
Note 5: The limitation pursuant to the regulations is NT $80 million or 60% of net value or consolidated net assets, whichever is higher.
Note 6: The investment income of US$1,134 thousand were remitted back on October 17, 2019 from the investee companies in Mainland China and was permitted by Investment Commission on November 12, 2019, which are deductible from the Company’s accumulated amount remitted out of Taiwan to
Mainland China.
The significant purchases, sales, accounts payable and accounts receivable that the Company directly conducted with investee companies in Mainland China as well as those that the Company indirectly conducted with investee companies in Mainland China through Delta Electronics Int'l (Singapore) Pte. Ltd.
(DEIL-SG) and Cyntec International Limited. - Labuan (CIL-Labuan) for the year ended December 31, 2019 are shown in Table 6 and 7.
$ -
Note 28: This company had been liquidated in December 2019.
Note 29: The ownership of PreOptix (Jiang Su) Co., Ltd. had been sold in October 2019.
119,920
-
Ceiling of investments in Mainland China
imposed by the Investment Commission of
MOEA
Investment amount approved by the Investment
Commission of Ministry of Economic Affairs
(MOEA)
131,884
80,000
17,124,770
$ 29,721,517
5,949,902
Table 10-4