Embed Size (px)
Citation preview

REPORT OF THE AUDITOR-GENERAL OF RIVERS STATE ON THE 2020 FINANCIAL STATEMENTS
1
Report of the Auditor-General,
Rivers State of Nigeria on the
Accounts of the
Rivers State Government of Nigeria for the year ended
31st December, 2020.

REPORT OF THE AUDITOR-GENERAL OF RIVERS STATE ON THE 2020 FINANCIAL STATEMENTS
2
HIS EXCELLENCY
NYESOM EZENWO WIKE, CON
GOVERNOR, RIVERS STATE

REPORT OF THE AUDITOR-GENERAL OF RIVERS STATE ON THE 2020 FINANCIAL STATEMENTS
3
RT. HON. IKUINYI-OWAJI IBANI
Speaker, Rivers State House of Assembly

REPORT OF THE AUDITOR-GENERAL OF RIVERS STATE ON THE 2020 FINANCIAL STATEMENTS
4
DR. CHRISTIAN BARISUA YORKINA (FCA, FCTI, AMNIM, MBA (PhD))
Deputy Director, Head, Ministerial Accounts,
Office of the State Auditor-General
For: The Auditor-General, State

REPORT OF THE AUDITOR-GENERAL OF RIVERS STATE ON THE 2020 FINANCIAL STATEMENTS
5
TABLE OF CONTENT
PART ONE NEW RIVERS VISION AND MISSION 7
CORPORATE INFORMATION ON RIVERS STATE 8
AUDITOR-GENERAL’S REPORT 11 AUDIT CERTIFICATE 13
PART TWO
ACCOUNTANT-GENERAL’S FINANCIAL STATEMENTS REPRODUCED 14
STATEMENT OF ACCOUNTING POLICIES (IPSAS CASH-BASIS) 15
RESPONSIBILITY FOR FINANCIAL STATEMENT 23
ACCOUNTING STANDARD AND BASIS OF ACCOUNTING 24
STATEMENT NO. 1 – CASHFLOW STATEMENT 27
STATEMENT NO. 2 – STATEMENT OF ASSETS AND LIABILITIES 28
STATEMENT NO. 3 – STATEMENT OF CONSOLIDATED REVENUE FUND 29
STATEMENT NO. 4 – STATEMENT OF CAPITAL DEVELOPMENT FUND 30
NOTES TO THE FINANCIAL STATEMENTS FOR THE YEAR ENDED 2020 31 - 35
MAIN SUPPORTING DETAILS TO THE NOTES TO THE FINANCIAL STATEMENT FOR THE YEAR ENDED 2020
SUMMARY OF GROSS RECEIPTS FROM FAAC 36
SUMMARY OF GROSS RECEIPTS OF INTERNALLY GENERATED REVENUE 40
SUMMARY OF PERSONNEL EMOLUMENT 43 – 50
SUMMARY OF CONSOLIDATED REVENUE FUND CHARGES 51
SUMMARY OF OVERHEAD 52 - 59
SUMMARY OF BANK CHARGES 60
SUMMARY OF CAPITAL EXPENDITURES TO MDA’S 61 - 62 CAPITAL RECEIPTS 65
SUMMARY STATEMENT OF DEBT STOCK AND DEBT SERVICE FIGURES 66
CLOSING BANK BALANCES 75 - 76
CASH BALANCES OF TRUST AND OTHER FUNDS 72
RIVERS STATE GOVERNMENT INVESTMENT IN COMPANIES 73 - 74
SUPPLEMENTARY NOTES TO THE FINANCIAL STATEMENT FOR THE YEAR ENDED 2020
SUMMARY OF GROSS/NET RECEIPTS FROM FAAC 37
SHARE OF OTHER STATUTORY ALLOCATION 38

REPORT OF THE AUDITOR-GENERAL OF RIVERS STATE ON THE 2020 FINANCIAL STATEMENTS
6
SCHEDULE OF DEDUCTIONS AT SOURCE FROM FAAC 39 DIVIDENDS (MOFI) 41 - 42
CAPITAL EXPENDITURE 63 -64 LOAN STOCK (EXTERNAL LOAN FROM WORLD BANK) 67
EXTERNAL LOAN (LOAN STOCK AND DEBT SERVICE PAYMENT) 68
FGN CREDIT FACILITIES 69
COMMERCIAL BANK LOAN FROM ZENITH BANK 70
CLOSING CASH BOOK BALANCE 71
CASH BALANCES OF TRUST AND OTHER FUNDS 72
SUMMARY OF PENSIONS AND GRATUITY 77
DISCLOSURE NOTE X AND NOTE Z 78
SCHEDULE OF CASH RECEIPTS AND PAYMENTS 79
STATEMENT OF COMPARISON OF BUDGET AND ACTUAL AMOUNTS 80
PART THREE
OBSERVATIONS AND COMMENTS ON THE FINANCIAL STATEMENTS 81
BUDGETARY/ACTUAL PERFORMANCE REVIEW
REVENUE PERFORMANCE IN 2020
INDEPENDENT REVENUE SOURCES
EXTERNAL/DEPENDENT SOURCES (FEDERATION ACCOUNT ALLOCATION SOURCES)
RECURRENT EXPENDITURE
COMPARATIVE ANALYSIS OF CAPITAL EXPENDITURE
REPAYMENT ON BORROWINGS AND INTEREST CHARGES
BANK CHARGES
PART FOUR
OBSERVATIONS AND COMMENTS ON MDAs 93

REPORT OF THE AUDITOR-GENERAL OF RIVERS STATE ON THE 2020 FINANCIAL STATEMENTS
7
THE NEW RIVERS VISION
“To build a State that is truly United, Secure and Prosperous with boundless
opportunities for everyone who lives in it to peacefully pursue their goals and
realize their full potentials in dignity and happiness”
MISSION STATEMENT
“To actualize the aspirations of the people of Rivers State for a balanced
development and enhanced quality of life for the present and future generations
through responsive governance guided by the fear of God”

REPORT OF THE AUDITOR-GENERAL OF RIVERS STATE ON THE 2020 FINANCIAL STATEMENTS
8
PART ONE
CORPORATE INFORMATION OF RIVERS STATE
Rivers State also known as the “Treasure Base of the Nation” is named after the
many rivers that border its territory. It is one of the 36 States of Nigeria with a
population of 5,198,716 according to 2006 census data.
The State was part of the oil Rivers Protectorate from 1885 to 1893, when it became
part of the Niger Coast Protectorate in 1900. The region was merged with the
chartered territories of the Royal Niger Company to form the colony of Southern
Nigeria. The State was created on the 27th of May, 1967 by the then regime of
General Yakubu Gowon with the split of the Eastern Region of Nigeria and until
1996 the State contained the area now known as Bayelsa State.
Rivers State has a total area of 11,007km2 (4,277m2) making it the 26th largest State
in Nigeria. It is a predominantly low-lying pluvial State in Southern Nigeria, located
in the eastern part of the Niger Delta on the ocean-ward extension of the Benue
Trough. The inland part of the State consists of the tropical rainforest and towards
the coast, the typical Niger Delta environment features many mangroves, swamps,
and its topography range from flat plain with a network of rivers to tributaries. It is
bounded on the south by the Atlantic Ocean, to the north by Imo and Abia State,
to the east by Akwa-Ibom State and to the west by Bayelsa and Delta States.
Endowed by nature as the nation’s treasure base, Rivers State is blessed with vast
deposit of oil and gas, vast arable land, seaports and rivers, a vast array of wildlife
and plants. Other natural resources found within its boundaries are silica sand,
glass sand, and clay. The availability of these resources has played the role of the
main driver of the economic development of the State and has made the State the
richest and most important section of the African Zone of the British Empire.

REPORT OF THE AUDITOR-GENERAL OF RIVERS STATE ON THE 2020 FINANCIAL STATEMENTS
9
More than 60% of the country’s output of crude oil is produced in the State thereby
making it economically significant as the center of Nigeria’s oil industry and a major
contributor to the country’s Gross Domestic Product (GDP).
RIVERS STATE UNDER THE PRESENT ADMINISTRATION
It has been said that government does not create jobs but creates an enabling
environment that creates jobs. Thus, it will not be out of place to recognize and
celebrate the outstanding contribution of the Rivers State Government in creating
an enabling environment to the national development process.
There is no gainsaying that the State is enjoying a facelift under this present
administration. The level of development especially in the period under review
(2020) is obvious and conspicuous considering the number of projects that have
been initiated and commissioned for use by all and sundry.
The present administration has thus continued to fill the infrastructure gap in the
State. Notably among these projects in the year under review but in no particular
order are:
• Rebisi flyover.
• Reconstruction of Igwuruta- Chokocho Federal Road.
• Centre for Arts and Culture
• Garrison-Akpajo – East west Road.
• Second Nkpogu Bridge.
• Woji-Akpajo Road.
• Abuloma- Woji Road.
• Sakpenwa-Bori Dual Carriage Way.
• Eagle Island Bridge- Agip.
• Aluu-Rupokwu Road.
• Nkpolu-Rumuigbo-Rumuagholu-Obiri.
• Ikwere Road.
• Inauguration of Real Madrid Football Academy.
• Remodeling of Bonny/Bille Jetty.
• Rivers State Government House Clinic and Administrative Block.
• Okoronuodu flyover Isiokpo Internal Roads.

REPORT OF THE AUDITOR-GENERAL OF RIVERS STATE ON THE 2020 FINANCIAL STATEMENTS
10
BANKERS:
The 23 registered banks in Nigeria are the registered bankers of Rivers State.
AUDITORS:
Auditor-General of Rivers State,
Office of the Auditor-General,
Point Block, State Secretariat,
Port Harcourt.

REPORT OF THE AUDITOR-GENERAL OF RIVERS STATE ON THE 2020 FINANCIAL STATEMENTS
11
REPORT OF THE AUDITOR-GENERAL, RIVERS STATE ON THE ACCOUNTS OF THE
GOVERNMENT OF RIVERS STATE FOR THE YEAR ENDED 31ST DECEMBER,
2020
INTRODUCTION
The Accounts of the Government of Rivers State of Nigeria for the year ended 31st
December, 2020, have been examined in accordance with Section 125 (2) of the
Constitution of the Federal Republic of Nigeria, 1999 (as amended), Rivers State
Audit Law (No. 2) of 2020 and Section 24 of the Rivers State Finance (Control and
Management) Law No. 7 of 2010. I have certified the individual accounts as correct
subject to the observations made in this report.
RESPONSIBILITY FOR THE FINANCIAL STATEMENTS
The Accountant-General of Rivers State is responsible for the preparation of the
Financial Statements. The Accountant-General is the Chief Accounting Officer for
the receipts and payments of all Rivers State Government income and expenditure,
thus prepared and submitted to me for audit, the financial statements as
reproduced in my report.
He is responsible for the general supervision of accounting activities in all
Ministries, Departments and Agencies of the State and for the compilation of the
Annual Financial Statement of Accounts and of such other Statement of Accounts
as may be required by law. In so doing, he also has responsibilities for;
• Ensuring that all Ministries, Departments and Agencies keep proper books
and records which disclose with reasonable assurance and accuracy the
financial position of the State.
• Taking such steps as are reasonably open to him to safeguard the assets of
the State and to prevent and detect fraud and irregularities.
• Establishing and maintaining an adequate system of internal control
designed to provide reasonable assurance that the transactions recorded
reflect the deployment of all financial resources by Government.
• Ensuring that in preparing the financial statements, he uses appropriate
accounting policies consistently and supported by reasonable and prudent
judgments and estimates.
REPORT OF THE AUDITOR-GENERAL OF RIVERS STATE ON THE 2020 FINANCIAL STATEMENTS
12
RESPONSIBILITY OF THE AUDITOR-GENERAL
In accordance with Section 125 (2) of the Constitution of the Federal Republic of
Nigeria 1999 (as amended), it is the responsibility of the Auditor-General to express
an independent opinion on the financial statements of the Accountant-General
based on his audit.
The Auditor-General is responsible for the audit of accounts of all accounting
Officers and all persons entrusted with the collection, receipt, custody and issue or
payment of public funds or with the receipt, custody, issue, sale, transfer or delivery
of any stamps, securities, stores or other Government property and for the
certification of Accountant-General’s Annual Financial Statements and Annual
Appropriation Accounts of all Ministries, Departments and Agencies.
An audit in this context involves the examination on a test basis, of evidence
relevant to the amounts and disclosures in the financial statements prepared by
the Accountant-General. It also includes an assessment of the significant estimates
and judgments made in the preparation of the Financial Statements and whether
the accounting policies are appropriate to Government circumstances, consistently
applied and adequately disclosed.

REPORT OF THE AUDITOR-GENERAL OF RIVERS STATE ON THE 2020 FINANCIAL STATEMENTS
13

REPORT OF THE AUDITOR-GENERAL OF RIVERS STATE ON THE 2020 FINANCIAL STATEMENTS
14
The Accountant-General’s Financial Statements for the year 2020 are hereby
reproduced.

REPORT OF THE AUDITOR-GENERAL OF RIVERS STATE ON THE 2020 FINANCIAL STATEMENTS
15
PART TWO
RIVERS STATE GOVERNMENT OF NIGERIA
GENERAL PURPOSE FINANCIAL STATEMENTS (GPFS)
STATEMENT OF ACCOUNTING POLICIES
CASH BASIS
LIST OF ABBREVIATIONS/ACRONYMS
ABBREVIATION/TERM DESCRIPTION
CBN Central Bank of Nigeria
COA Chart of Account
FAAC Federation Accounts Allocation Committee
FGN Federal Government of Nigeria
FRC Financial Reporting Council
GAAP Generally Accepted Accounting Principles
GPFS General Purpose Financial Statement
IPSAS International Public Sector Accounting Standard
LFN Law of the Federal Republic of Nigeria
MDA Ministries. Departments and Agencies
NCOA National Chart of Account
GBE Government Business Enterprises
FRCON Financial Reporting Council of Nigeria
OAG Office of the Accountant-General
PPE Properties, Plants and Equipment

REPORT OF THE AUDITOR-GENERAL OF RIVERS STATE ON THE 2020 FINANCIAL STATEMENTS
16
2.1 INTRODUCTION:
In line with the adoption of the International Public Sector Accounting Standards
(IPSAS) in Nigeria, a Standardized Chart of Account (CoA) alongside a set of General-
Purpose Financial Statements (GPFS) have been designed and introduced by FAAC for
adoption by all tiers of Government in Nigeria.
The standardized COA and GPFS is hereby adopted by Rivers State Government to
comply with FAAC directive to harmonize public sector accounts reporting in Nigeria.
In order to ensure an effective and efficient utilization of the COA and GPFS, the
Accounting Policies have been developed as a set of guidelines to direct the Processes
and Procedures relating to financial reporting in Rivers State.
These policies shall form part of the universally agreed framework for financial
reporting in Rivers State.
2.2 IPSAS CASH BASIS OF ACCOUNTING:
The IPSAS Cash Basis of Accounting recognizes transactions and events only when
Cash (including Cash Equivalents) is received or paid by the MDAs. General Purpose
Financial Statements (GPFS) prepared under the IPSAS Cash Basis provides readers
with information about the sources of cash raised during the period, the purpose for
which cash was used and the cash balances at the reporting date.
Notes to the GPFS provide additional information about liabilities, including payables
and borrowings, and non-cash assets that shall include receivables, investments and
property, plant and equipment.
The Accounting Policy addresses the following fundamental accounting issues:
1. Definition of Accounting terminologies,
2. Recognition of Accounting items,
3. Measurement of Accounting items,
4. Treatment of Accounting items.
The Accounting Policy is subject to periodic review and updates as shall be deemed
necessary by the Accountant-General of Rivers State.

REPORT OF THE AUDITOR-GENERAL OF RIVERS STATE ON THE 2020 FINANCIAL STATEMENTS
17
2.3 ACCOUNTING TERMINOLOGIES/DEFINITIONS
i. Accounting policies are the specific principles, bases, conventions, rules
and practices adopted by the Rivers State Government in preparing and
presenting Financial Statements.
ii. Cash: Cash comprises cash in hand, demand deposits in financial
institutions and cash equivalents.
iii. Cash equivalents are short-term, highly liquid investments that are readily
convertible to known amounts of cash and which are subject to an
insignificant risk of changes in value.
iv. Cash basis means a basis of accounting that recognizes transactions and
other events only when cash is received or paid.
v. Cash flows are inflows and outflows of cash. Cash flows exclude
movements between items that constitute cash as these components are
part of the cash management of the government rather than increases or
decreases in the cash position controlled by the government.
vi. Cash receipts are cash inflows.
vii. Cash payments are cash outflows.
viii. Cash controlled by Rivers State Government: Cash is deemed to be
controlled by Rivers State Government when the government can freely
use the available cash for the achievement of its own objectives or enjoy
benefit from the cash and can exclude or regulate the access of others to
that benefit. Cash collected by, or appropriated or granted to the
government which the government can freely use to fund its operating
objectives, such as acquiring of capital assets or repaying its debts is
controlled by the government.
ix. Government Business Enterprise (GBE) means a department or agency
that has all the following characteristics:
a) Is an entity with the power to contract in its own name;
b) Has been assigned the financial and operational authority to carry on a
business;
c) Sells goods and services, in the normal course of its business, to other
MDAs and the general public at a profit or full cost recovery;

REPORT OF THE AUDITOR-GENERAL OF RIVERS STATE ON THE 2020 FINANCIAL STATEMENTS
18
d) Is not reliant on continuing government funding or subvention to
remain a going concern (other than purchases of outputs at arm’s
length); and
e) Is controlled by a public sector management or the government.
x. Notes to the GPFS shall include narrative descriptions or more detailed
schedules or analysis of amounts shown on the face of the GPFS, as well
as additional information.
2.4 GENERAL PURPOSE FINANCIAL STATEMENTS (GPFS):
The GPFS comprise of Statement of Cash Receipts and Payments and other
statements that disclose additional information about the Cash Receipts,
Payments and Balances controlled by Rivers State Government, and
Accounting Policies and Notes to the Financial Statements. In Rivers State, the
GPFS Accounting Policy include the following:
1. Statement 1 – Cash Flow Statements: Statement of cash receipts and
payments which:
▪ Recognizes all cash receipts, cash payments and cash balances
controlled by the State Government; and
▪ Separately identifies payments made by third parties on behalf of the
State Government.
2. Statement 2 – Statement of Assets and Liabilities; Statement of financial
position (also known as Balance Sheet);
3. Statement 3 – Statement of Consolidated Revenue Fund; Statement of
Recurrent Financial Performance (also known as Profit & Loss Account);
4. Statement 4 – Statement of Capital Development Fund; Statement of
Capital Financial Performance (also known as Capital Expenditure);
5. Notes to the Accounts: Additional disclosures to explain the GPFS; and
6. Accounting Policies and Explanatory Notes.
2.5 BASIS OF PREPARATION AND LEGAL PROVISIONS
The GPFS are prepared under the historical cost convention and in accordance with
International Public Sector Accounting Standards (IPSAS) and other applicable
standards as defined by the Fiscal Responsibility Law (FRL) and the Financial
Reporting Council of Nigeria. In addition, the GPFS are in compliance with the
provision of Financial Regulations of the State.

REPORT OF THE AUDITOR-GENERAL OF RIVERS STATE ON THE 2020 FINANCIAL STATEMENTS
19
2.6 FUNDAMENTAL ACCOUNTING CONCEPTS
The following fundamental accounting concepts are taken as the basis of preparation
of all accounts and all reporting in Rivers State:
• Cash basis of accounting
• Understandability
• Materiality
• Relevance
• Going Concern Concept
• Consistency Concept
• Prudence
• Completeness, etc.
2.7 ACCOUNTING PERIOD
The accounting year (fiscal year) is from 1st January to 31st December. Each
accounting year is divided into 12 calendar months (periods) and shall be set up as
such in the accounting system.
2.8 REPORTING CURRENCY
The General Purpose GPFS are prepared in Nigerian Naira (NGN).
2.9 MDA FOR CONSOLIDATION
The consolidation of the GPFS is based on the cash transactions of all Ministries,
Departments and Agencies (MDAs) of Rivers State Government except Government
Business Enterprises (GBEs).
2.10 COMPARATIVE INFORMATION
The General Purpose GPFS shall disclose all numerical information relating to
previous period (at least one year).
2.11 BUDGET FIGURES
These are figures from the approved annual budget and supplementary budget as
approved in accordance with the Appropriation Law of Rivers State.

REPORT OF THE AUDITOR-GENERAL OF RIVERS STATE ON THE 2020 FINANCIAL STATEMENTS
20
2.12 RECEIPTS
▪ These are cash inflows within the Financial Year. They comprise receipts from
Statutory Allocations (FAAC monthly disbursement), Taxes, External Assistance
(from Bilateral and Multilateral Agencies), other Aids and Grants, other
Borrowings, Capital Receipts, (Sales of Government Assets, etc), Receipts from
trading activities and other cash receipts.
▪ These items are disclosed at the face of the Statement of Cash Receipts and
Payments for the year in accordance with the standardized GPFS. Notes shall
be provided as per standardized Notes to GPFS.
2.13 EXTERNAL ASSISTANCE
▪ Receipts from loans are funds received from external sources to be paid back
at an agreed period of time. They are categorized either as Bilateral or
Multilateral.
▪ External loans receipts shall be disclosed separately under Statement of Cash
Receipts and Payments for the year.
2.14 OTHER BORROWINGS/GRANTS & AIDS RECEIVED
These shall be categorized as either short or long-term loans. Short-term loans are
those payable within one calendar year (12 months) while long term loans and debts
shall fall due beyond one calendar year (above 12 months). Loans shall be disclosed
separately and Grants shall also be separately disclosed under statement of Cash
Receipts and Payments for the year.
2.15 INTEREST RECEIVED
Interests actually received during the financial year shall be treated as a receipt under
item ‘Other Receipts’.
2.16 GOVERNMENT BUSINESS ACTIVITIES
Cash Receipts from Trading Activities shall be received net (after deducting direct
expenses) unless otherwise provided for by law or policy in force. Total receipts from
all trading activities shall be disclosed in the Statement of Cash Receipts and
payments under ‘Trading Activities’ item. Where gross revenue is received,
corresponding payments shall be charged under a corresponding payment item head
‘Government Business Activities’ in the Statement of Receipts and Payments.

REPORT OF THE AUDITOR-GENERAL OF RIVERS STATE ON THE 2020 FINANCIAL STATEMENTS
21
2.17 PAYMENTS
▪ These are Recurrent and Capital Cash Out-flows made during the financial year
and shall be categorized either by function and/or by sector in the Statement
of Cash Receipts and Payment.
▪ Payments for purchase of items of capital nature e.g, property, plant and
equipment (PPE) shall be expensed in the year in which the item has been
purchased. It shall be disclosed under capital payments. Investments in PPEs
shall be treated in the same way as Capital Purchases. At the end of the
financial year, a schedule of assets shall be provided as part of the notes to
GPFS.
2.18 LOANS GRANTED
Payments to other Government and Agencies in form of loans during the year shall
be shown separately in the statement of Receipts and Payments. Amount disclosed
shall be actual amount paid during the year.
2.19 LOAN REPAYMENTS
Cash receipts from loans granted to other agencies and government shall be classified
under loan repayments in the Statement of Receipts and Payments. Amount
disclosed shall be actual amount received during the year.
2.20 INTEREST ON LOANS
Actual interest on loans and other bank commissions charged on Bank Accounts
during the year shall be treated as payments and disclosed under interest payment
in the Statement of Cash Receipts and Payments.
2.21 FOREIGN CURRENCY TRANSACTIONS
▪ Foreign currency transactions throughout the year shall be converted into
Nigerian naira at the ruling (Central Bank of Nigeria – CBN) rate of exchange at
the dates of the transactions. Foreign currency balances, as at the year end,
shall be translated at the exchange rates prevailing on that date.
▪ At the end of the financial year, additional amounts (in cash or at bank) arising
out of Foreign Exchange Gains/Losses shall be recognized in the Statement of
Cash Receipts and Payments either as receipts/payments respectively.

REPORT OF THE AUDITOR-GENERAL OF RIVERS STATE ON THE 2020 FINANCIAL STATEMENTS
22
2.22 PREPAYMENTS
Prepaid expenses are amounts paid in advance of receipt of goods or services and are
charged directly to the respective expenditure item.
2.23 INVESTMENTS
Cash payments made for investment purposes such as purchase of Government
stock, Treasury bills, and Certificates of Deposit, are Capital Costs and are disclosed
as purchase of Financial Instruments or may be given an appropriate name as the
case may be. They are separately disclosed in the GPFS (Statement of Receipts and
Payments) under Capital Payments.
2.24 LEASES
▪ Cash payment for finance leases, which effectively transfer to the Government
substantially all the risks and benefits incidental to ownership of the leased
item, are treated as Capital Payments and disclosed in the Statement of Cash
Receipts and Payments.
▪ Operating lease cash payments, where the lessors effectively retain
substantially all the risk and benefits of ownership of the leased items, are
treated as operating expenses.
2.25 CASH BALANCES
This includes cash at Hand, at Bank and Cash Equivalents at the end of the Financial
year.
2.26 ADVANCES All Cash Advances shall be retired before the end of the financial year. However, should circumstances occur (including
an emergency) where either an advance is given out close to the financial year end or an advance is already given could
not be accounted for, such an advance (or balance outstanding) shall be treated as cash equivalent since there shall be
no proof that such funds have been utilized.

REPORT OF THE AUDITOR-GENERAL OF RIVERS STATE ON THE 2020 FINANCIAL STATEMENTS
23

REPORT OF THE AUDITOR-GENERAL OF RIVERS STATE ON THE 2020 FINANCIAL STATEMENTS
24
ACCOUNTING STANDARD AND BASIS OF ACCOUNTING
The Rivers State Government has chosen to adopt the Cash Basis of
Accounting, for recording all financial transaction of the Government and
the International Public Sector Accounting Standards (IPSAS). However,
the Government has also opted to provide additional information in the
Notes to the Financial Statements on its longer-term assets and liabilities.
Accordingly, the Accountant-General of the State has kept memorandum
records of accounts to provide information for these additional disclosure
in the Financial Statement.

REPORT OF THE AUDITOR-GENERAL OF RIVERS STATE ON THE 2020 FINANCIAL STATEMENTS
25
2.27 REFERENCES: DETAILS TO THE NOTES FOR FY 2020
Note Nos 1.0 and 1.1 are main supporting reference to Federation Allocation in Statement No. 1
and Statement No. 3 (Cash flow Statement and Statement of Consolidated Revenue Fund)
respectively. Pages 27 and 29
Notes 2.0, 3.0 – 3.2, 4.3, and 4.4 are main supporting references of IGR on Statement No. 1 and
Statement No. 3 (Cash flow Statement and Statement of Consolidated Revenue Fund)
respectively. Pages 27 and 29
Note 5.0 are main supporting reference of Personnel Cost Statement No. 1 and Statement No. 3
(Cash flow Statement and Statement of Consolidated Revenue Fund) respectively. Pages 27
and 29
Notes 5.1 – 5.5 and 6.1 are main supporting references of Pension payments in Statement No.
1 and Statement No. 3 (Cash flow Statement and Statement of Consolidated Revenue Fund)
respectively. Pages 27 and 29
Note 6.0 are main supporting reference to Overhead Cost to Statement No. 1 and Statement No.
3 (Cash flow Statement and Statement of Consolidated Revenue Fund ) respectively. Pages 27
and 29
Note 6.1 represents Bank Charges in Statement No. 1 and 3 (Cash flow Statement and Statement
of Consolidated Revenue Fund) respectively. Pages 27 and 29
Note. 7.0, 7.1, 7.2 and 7.3 are main supporting references to Capital Expenditure in Statement
No. 1 and Statement No. 4 (Cash flow Statement and Statement of Capital Development Fund)
respectively. Pages 27 and 30
Notes 8.0, 8.1, 8.2 and 8.3 are main supporting references of facilities in Statement No. 1 and
Statement No. 4 (Cash flow Statement and Statement of Capital Development Fund)
respectively. Pages 27 and 30

REPORT OF THE AUDITOR-GENERAL OF RIVERS STATE ON THE 2020 FINANCIAL STATEMENTS
26
Note 9.0, 9.1, 9.2 and 9.3 are main supporting references of loan repayments in Statement No.
1 and Statement No. 3 (Cash flow Statement and Statement of Consolidated Revenue Fund)
respectively. Pages 27 and 29
Note 10.1 represents the main supporting reference Cash held by MDAs in Statement No. 2
(Statement of Assets and Liabilities) Page 28
Note 11 represents main supporting reference in Statement No. 2 (Statement of Assets and
Liabilities) Page 28
Note 12 represents main supporting reference in Statement No. 2 (Statement of Assets and
Liabilities) Page 28

REPORT OF THE AUDITOR-GENERAL OF RIVERS STATE ON THE 2020 FINANCIAL STATEMENTS
27
STATEMENT NO. 1
RIVERS STATE GOVERNMENT OF NIGERIA
CASHFLOW STATEMENT FOR THE YEAR ENDED 31ST DECEMBER, 2020
FINALAL BUDGET
2020 NOTES ACTUAL YEAR 2020 ACTUAL YEAR 2019
CashFlows from Operating Activities:
Receipts:
102,043,853,302.52 Statutory Allocations:FAAC 1.0 130,659,400,791.80 161,290,989,363.45
14,017,446,058.00 Value Added Tax Allocation 1.1 21,367,850,953.54 17,629,628,442.94
116,061,299,360.52 Sub-total - Statutory Allocation 152,027,251,745.34 178,920,617,806.39
80,000,000,000.00 Direct Taxes 2.0 106,180,064,406.61 108,556,677,551.27
20,789,000.00 Licences 3.0 213,173,198.16 13,179,003.10
400,000,000.00 Fines 3.1 32,795,422.61 220,341,019.91
500,134,213.00 Fees 3.2 440,317,662.23 266,788,786.29
400,000,000.00 Earnings 4.0 603,297.00 196,037,637.53
150,670,000.00 Sales 4.1 668,776,879.33 130,691,758.35
100,000,000.00 Rent of Government Buildings 4.2 84,850,471.78 90,925,529.69
6,103,519,965.65 Investment Income (Dividends) 4.3 6,844,403,537.21 6,436,388,252.05
54,624,944,288.48 Other Revenue/ Receipts 4.4 2,936,203,713.00 3,976,971,100.55
258,361,356,827.65 Total Receipts 269,428,440,333.27 298,808,618,445.13
Less Payments:
70,904,973,625.00 Personnel Costs (Including Salaries on CRF Charges) 5.0 70,497,874,467.38 63,499,088,482.64
3,000,000,000.00 State Govt Contribution to Pension: 5.1 - -
2,000,000,000.00 Pension Parastatals 5.2 1,687,551,738.21 1,299,843,240.27
900,000,000.00 Death Benefit 5.3 - -
23,184,261,797.32 Pensions (Mainstream) 5.4 17,962,463,991.83 12,813,782,794.75
- Gratuity 5.5 - -
18,429,375,834.00 Overhead Charges: 6.0 13,189,751,160.00 13,008,976,848.00
500,000,000.00 Bank Charges (Other operating activities) 6.1 10,311,621,494.00 2,101,860,592.30
- Subvention to Parastatals: 6.2 - -
118,918,611,256.32 Total Payments 113,649,262,851.42 92,723,551,957.96
139,442,745,571.33 Net Cash Flow from Operating Activities 155,779,177,481.85 206,085,066,487.17
CashFlows from Investment Activities:
(9,677,403,200.00) Capital Expenditure:Administrative Sector: 7.0 20,464,897,837.98- 60,376,415,378.30-
(69,109,240,685.64) Capital Expenditure: Economic Sector: 7.1 85,278,028,393.08- 87,248,866,397.15-
(41,032,413,328.94) Capital expenditure: Social Service Sector: 7.2 23,947,396,852.26- 64,841,736,261.38-
(3,490,000,000.00) Capital Expenditure: Law and Justice: 7.3 7,207,173,735.28- 9,470,937,607.50-
(43,346,849,784.37) Special Heads 7.4 31,462,459,934.55- -
- Capital Expenditure: Funded from Aids & Grants 8.0 - -
(166,655,906,998.95) Net Cash Flow from Investment Activities: -168,359,956,753.15 -221,937,955,644.33
CashFlows from Financing Activities:
8,035,885,887.11 Proceeds from Aid and Grants (SFTAS) 8.0 950,000,000.00 -
4,706,549,340.50 Proceeds from ExernaL Loan 8.1 5,429,967,000.00 23,521,033,363.88
- Proceeds from Internal Loans: FGN/ Bonds 8.2 - 700,000,000.00
20,000,000,000.00 Proceeds of Loans from Commercial Banks 8.3 19,519,884,076.00 25,491,277,614.00
- Proceeds from InternaL Loan: NTB 8.4 - -
- Proceeds from Development of Nat Resources 8.5 - -
- Repayment of External Loans : Aids & Grants 9.0 - -
(257,771,550.00) Repayment of External Loans 9.1 2,826,077,674.00- 2,964,153,957.31-
- Repayment of Internal Loan: FGN/Bonds 9.2 892,004,674.00- 7,356,639,357.00-
(12,072,365,385.60) Repayment of Internal Loans: Commercial Banks 9.3 12,294,108,660.00- 10,884,487,181.00-
- Repayment of Internal Loans: NTB 9.4 - -
- Repayment of Loans from development of Natural Res 9.5 - -
20,412,298,292.01 Net Cash Flow from Financing Activities: 9,887,660,068.00 28,507,030,483.57
Movement in Other Cash Equivalent Accounts
(Increase)/ Decrease in Investments - -
Net (Decrease)/Increase in Other Cash Equivalents: 2,693,119,203.30- 12,654,141,326.41
Total Cashflow from other Cash equivalent Accounts 2,693,119,203.30- 12,654,141,326.41
Net Cash for the year - -
Cash & Its Equivalent as at 1st January, 2020 10.0 6,931,532,207.20 (5,722,609,119.21)
Cash & Its Equivalent as at 31st December, 2020 10.1 4,238,413,003.90 6,931,532,207.20
SIR DAGOGO R. ABERE

REPORT OF THE AUDITOR-GENERAL OF RIVERS STATE ON THE 2020 FINANCIAL STATEMENTS
28
STATEMENT NO. 2
RIVERS STATE GOVERNMENT OF NIGERIA
STATEMENT OF ASSETS AND LIABILITIES AS AT 31ST DECEMBER, 2020
NOTES CURRENT YEAR 2020 PREVIOUS YEAR 2019
ASSETS:-
Liquid Assets:-
Cash Held by AG:
Cash Held by Ministries, Department & Agencies:- 10 4,238,413,003.90 6,931,532,207.20
Cash Balances of Trust & Other Funds of the States: 11 1,400,000,000.00 1,400,000,000.00
SUB - TOTAL (1) 5,638,413,003.90 8,331,532,207.20
INVESTMENT & OTHER CASH ASSETS
State Government Investments 12 43,875,773,119.00 43,875,773,119.00
CRF Bank Balance(CBN/ CRF Bank): 13
Pension Account (CBN/ Bank): 14
Other Bank of the Treasury 15
Cash Balances with Federal Pay Offices/ Sub-Treasury: 16 - -
Remmitances 17 - -
Cash -in - Transit:- 18 140,421,942,987.95 -
Imprests:- 19 - -
Advances:- 20 - -
Revolving Loans Granted:- 21 - -
Intangible Assets 22 - -
SUB - TOTAL (2) 184,297,716,106.95 43,875,773,119.00
TOTAL ASSETS 189,936,129,110.85 52,207,305,326.20
LIABILITIES:-
PUBLIC FUNDS
Consolidated Revenue Fund: 23 7,944,300,291.00 12,165,122,809.08
Capital Development Fund: 24 67,303,592,844.85 49,763,698,522.09
Trust & Other Public Funds: 25 - -
Police Reward Fund 26 - -
TOTAL PUBLIC FUNDS 75,247,893,135.85 61,928,821,331.17
EXTERNAL AND INTERNAL LOANS
External Loans 9.1 26,681,184,544.00 24,077,295,218.04
FGN/ States/LGC Bonds & Treasury Bonds. 9.2 56,879,735,567.00 57,771,740,241.00
Internal Loans from Other Funds: Commercial Banks 9.3 31,127,315,864.00 23,901,540,448.00
Nigerian Treasury Bills (NTB) 9.4 - -
Development Loan Stock 9.5 - -
Other Internal Loans( Promissory Notes) 23 - -
TOTAL EXTERNAL AND INTERNAL LOANS 114,688,235,975.00 105,750,575,907.04
OTHER LIABILITIES
Deposits:- 27
Un-remitted Taxes:-With-holding Tax: 28
:Value Added Tax: 29
: Pay As You Earn (PAYE): 30
Un-remitted Sundry Deductions:Union Dues:- 31
National Housing Fund: 32
Co-operative Societies: 33
Staff Housing Loans: 34
National Health Insurance Scheme: 35
Pension Deductions: 36
Other Deductions:- 37
TOTAL LIABILITIES 189,936,129,110.85 167,679,397,239.21
SIR DAGOGO R. ABERE
ACCOUNTANT-GENERAL, RIVERS STATE

REPORT OF THE AUDITOR-GENERAL OF RIVERS STATE ON THE 2020 FINANCIAL STATEMENTS
29
STATEMENT NO. 3
PREVIOUS YR
EXPENDITURE 2019DETAILS NOTES
CURRENT YEAR
ACTUAL EXP. 2020
CURRENT YEAR
FINAL BUDGET 2020
CURRENT YR
INITIAL BUDGET
2020
SUP.
BUDGET
2020
VARIANCE ON
FINAL BUDGET
N N N N %
3,716,853,098.92 Opening Balance: 12,165,122,809.08 4.32
ADD: REVENUE
161,290,989,363.45 Statutory Allocations:FAAC 1.0 130,659,400,791.80 102,043,853,302.52 102,043,853,302.52 - 28.04
17,629,628,442.94 Value Added Tax Allocation 1.1 21,367,850,953.54 14,017,446,058.00 14,017,446,058.00 - 52.44
178,920,617,806.39 Sub-Total - Statutory Allocation 152,027,251,745.34 116,061,299,360.52 116,061,299,360.52 30.99
108,556,677,551.27 Direct Taxes 2.0 106,180,064,406.61 80,000,000,000.00 80,000,000,000.00 - 32.73
13,179,003.10 Licences 3.0 213,173,198.16 20,789,000.00 20,789,000.00 - 925.41
220,341,019.91 Fines 3.1 32,795,422.61 400,000,000.00 400,000,000.00 - (91.80)
266,788,786.29 Fees 3.2 440,317,662.23 500,134,213.00 500,134,213.00 - (11.96)
196,037,637.53 Earnings 4.0 603,297.00 400,000,000.00 400,000,000.00 - (99.85)
130,691,758.35 Sales 4.1 668,776,879.33 150,670,000.00 150,670,000.00 - 343.87
90,925,529.69 Rent of Government Buildings 4.2 84,850,471.78 100,000,000.00 100,000,000.00 - (15.15)
6,436,388,252.05 Investment Income (Dividend) 4.3 6,844,403,537.21 6,103,519,965.65 6,103,519,965.65 - 12.14
3,976,971,100.55 Other Revenue/Capital Receipts 4.4 2,936,203,713.00 54,624,944,285.48 54,624,944,285.48 - (94.62)
119,888,000,638.74 Sub-Total (Revenue) 117,401,188,587.93 142,300,057,464.13 142,300,057,464.13 (17.50)
302,525,471,544.05 TOTAL REVENUE: 281,593,563,142.35 258,361,356,824.65 258,361,356,824.65 8.99
LESS:EXPENDITURE
63,499,088,482.64 Personnel Costs 5.0 70,497,874,467.38 71,296,024,397.00 71,296,024,397.00 - 1.12
- States Govt Contribution to Pension: 5.1 - 3,000,000,000.00 3,000,000,000.00 - 100.00
1,299,843,240.27 Pension Parastatals 5.2 1,687,551,738.21 2,000,000,000.00 2,000,000,000.00 - 15.62
- Death Benefit 5.3 - 900,000,000.00 900,000,000.00 - 100.00
12,813,782,794.75 Pension (Mainstream) 5.4 17,962,463,991.83 23,184,261,797.32 23,184,261,797.32 - 22.52
- Gratutity 5.5 - 2,000,000.00 2,000,000.00 - 100.00
13,008,976,848.00 Overhead Charges: 6.0 13,189,751,160.00 18,429,375,834.00 18,429,375,834.00 - 28.43
2,101,860,592.30 Bank Charges 6.1 1,530,049,473.00 500,000,000.00 500,000,000.00 - (206.01)
- Subvention to Parastatals: 6.2 - - - -
92,723,551,957.96 104,867,690,830.42 119,311,662,028.32 119,311,662,028.32 12.11
OTHER RECURRENT
PAYMENTS/EXPENDITURE:
- External Loans: Aids & Grants 9.0 - - - -
205,065,996.01 External Loans 9.1 212,715,524.00 25,000,000.00 25,000,000.00 (750.86)
5,876,872,168.00 Internal Loasns: FGN/Bonds 9.2 4,063,348,058.00 - -
1,554,858,612.00 Internal Loasns: Commercial Banks 9.3 4,505,508,439.00 10,000,000,000.00 10,000,000,000.00 - 54.94
- Internal Loans: NTB 9.4 - - - -
- Development of Natural Resources 9.5 - - - -
100,360,348,733.97 TOTAL EXPENDITURE: 113,649,262,851.42 129,336,662,028.32 129,336,662,028.32 12.13
202,165,122,810.08 OPERATING BALANCE: 167,944,300,290.93 99,938,432,999.03 99,938,432,999.03 68.05
APPROPRIATIONS/TRANSFERS:
190,000,000,000.00 Transfer to Capital Development Fund: 38 160,000,000,000.00 160,000,000,000.00 160,000,000,000.00 -
12,165,122,809.08 Closing Balance: 23 7,944,300,291.00
ACCOUNTANT-GENERAL, RIVERS STATE
RIVERS STATE GOVERNMENT OF NIGERIA
STATEMENT OF CONSOLIDATED REVENUE FUND
FOR THE YEAR ENDED 31ST DECEMBER, 2020
SIR DAGOGO R. ABERE

REPORT OF THE AUDITOR-GENERAL OF RIVERS STATE ON THE 2020 FINANCIAL STATEMENTS
30
STATEMENT NO. 4
RIVERS STATE GOVERNMENT OF NIGERIA
STATEMENT OF CAPITAL DEVELOPMENT FUND FOR THE YEAR ENDED 31ST DECEMBER, 2020
PREVIOUS YR
ACTUAL EXP. 2019DETAILS NOTES
CURRENT YEAR
ACTUAL EXP. 2020
CURRENT YR
FINAL BUDGET
2020
CURRENT YR
INITIAL BUDGET
SUP.
BUDGET
2020
PERFORMANCE
ON TOTAL
N
31,989,343,188.54 Opening Balance: 49,763,698,522.00 21.12%
ADD: REVENUE
- Proceeds from Aids & Grants 8.0 950,000,000.00 8,035,885,887.05 8,035,885,887.05 0.40%
23,521,033,363.88 Proceeds from External Loans 8.1 5,429,967,000.00 4,706,549,340.50 10,000,000,000.00 2.30%
700,000,000.00 Proceeds from Internal Loans: FGN/Bonds 8.2 - - -
25,491,277,614.00
Proceeds from Internal Loans: Commercial
Banks 8.3 19,519,884,076.00 20,000,000,000.00 60,000,000,000.00 8.28%
- Proceeds from Internal Loans: NTB 8.4 - - -
- Proceeds from Deriv. of Nat. Resources 8.5 - - -
- Other Internal Loans( Promissory Notes) 23 - - -
190,000,000,000.00 Transfer from Consolidated Revenue Fund 38 160,000,000,000.00 - 160,000,000,000.00 67.89%
271,701,654,166.42 TOTAL REVENUE AVAILABLE: 235,663,549,598.00 32,742,435,227.55 238,035,885,887.05 100.00%
LESS: CAPITAL EXPENDITURE
60,376,415,378.30 Capital Expenditure:Administrative Sector: 7.0 20,464,897,837.98 9,677,403,200.00 9,677,403,200.00 12.16%
87,248,866,397.15 Capital Expenditure: Economic Sector: 7.1 85,278,028,393.08 69,109,240,685.64 69,109,240,685.64 50.65%
64,841,736,261.38 Capital Expenditure: Social Service Sector: 7.2 23,947,396,852.26 41,032,413,328.94 41,032,413,328.94 14.22%
9,470,937,607.50 Capital Expenditure: Law and Justice: 7.3 7,207,173,735.28 3,490,000,000.00 3,490,000,000.00 4.28%
- Special Heads 7.4 31,462,459,934.55 43,346,849,784.37 43,346,849,784.37 18.69%
221,937,955,644.33 TOTAL CAPITAL EXPENDITURE: 168,359,956,753.15 166,655,906,998.95 166,655,906,998.95 100.00%
- Intangible Assets 22 -
49,763,698,522.09 CLOSING BALANCE: 24 67,303,592,844.85

REPORT OF THE AUDITOR-GENERAL OF RIVERS STATE ON THE 2020 FINANCIAL STATEMENTS
31
NOTE Details Ref. Note Amount Amount Remarks
1.0 A- Share of Statutory Allocation from FAAC N N
Net Share of Statutory Allocation from FAAC A 27,989,976,936.14
Add :Deduction at source for Loan Repayment B 8,564,385,764.25 36,554,362,700.39
Share of Statutory Allocation - Other Agencies C 92,524,942,957.61
Share of Federal Accounts Allocation- Excess Crude Oil D 1,580,095,133.80
Total(GROSS) FAAC Allocation to SG 130,659,400,791.80
B. Value Added Tax
1.1 Share of Value Added Tax (VAT) E 21,367,850,953.54
Internally Generated Revenue (Independent Revenue) F Actual Budget % Variance
2.0 Direct Taxes:
RS Internal Revenue (RIRS) (a) 97,452,096,981.79
Paye/Fed MDAs(Taxes) (b) 6,447,819,603.51
Foreign Curr. Conver. (c) 2,274,628,829.20
Other Taxes (d) SSCL 5,518,992.11
Total Direct Taxes 106,180,064,406.61 80,000,000,000.00 32.73
3.0 Licences:
Min. of Agriculture 670,000.00
Min. of Housing 143,800,615.85
Min. of Transport 30,871,250.00
Min. of Lands 12,056,393.00
Min. of Energy & Nat. Res. 300,000.00
Min. of Health 21,473,599.35
Min. of Agriculture 270,000.00
RS Waste Mgt Agency 1,339,000.00
Min. of Comm & Indus. 1,345,000.00
Primary Health Care 332,339.96
Min. of Works 715,000.00
Total Licences 213,173,198.16 20,789,000.00 925.41
3.1 Fines:
Judiciary 16,965,072.03
Customary Court of Appeal 10,908,250.00
Min. of Special Duties/Fire Service 4,922,100.58
Total Fines: 32,795,422.61 400,000,000.00 -91.80
3.2 Fees:
Min. of Justice 1,640,500.00
Min. of Agriculture 480,000.00
Min. of Comm & Indus. 17,728,932.00
RS Musuem 3,506,250.00
Min. of Transport 3,216,250.00
Min. of Lands 300,000.00
Min. of Works 91,526,275.00
PH Water Corporation 86,471,520.00
RSSTWSSA 90.00
Min. of Education 200,843,633.33
RS Library Boars 16,000.00
Min. of Health 1,555,600.00
Min. of Environment 16,115,200.00
RS Urban Beau. Parks & Garden 300,045.60
RS Waste Mgt Agency 7,060,858.00
Min. of Social Welfare & Rehabilitation 536,000.00
Estab, Training & Pen. Bureau 73,508.30
Social Service Bureau 45,000.00
RS Judiciary 6,161,050.00
Min. of Health 250,000.00
Min. of Housing & Urban Dev. 20,000.00
Customary Court of Appeal 2,470,950.00
Total Fees: 440,317,662.23 500,134,213.00 -11.96
4.0 Earnings:
RS Water Resources 237,297.00
RIVERS STATE GOVERNMENT OF NIGERIA
NOTES TO THE FINANCIAL STATEMENTS FOR THEYEAR ENDED 31ST DECEMBER, 2020

REPORT OF THE AUDITOR-GENERAL OF RIVERS STATE ON THE 2020 FINANCIAL STATEMENTS
32
Min. of Employ & Empow 366,000.00
Total Earnings: 603,297.00 400,000,000.00 (99.85)
4.1 Sales:
Min. of Agriculture 460,000.00
Greater PH City Authority 667,646,268.90
Office of the Surv-General 46,080.43
RS Waste Mgt Agency 423,600.00
RS Water Board 930.00
Min. of Housing & Urban Dev. 200,000.00
Total Sales: 668,776,879.33 150,670,000.00 343.87
4.2 Rent of Government Buildings:
Head of Service 14,420,666.67
Min. of Finance (Payroll) 70,429,805.11
Total Rent of Government Buildings: 84,850,471.78 100,000,000.00 -15.15
4.3 Investment Income:
Min. of Finance Incorporated (MOFI) 6,844,403,537.21
Total Investment Income: 6,844,403,537.21 6,103,519,965.65 12.14
4.4 Other Revenue/Receipts: G
Min. of Finance 660,963.00
Auto-Reg (RIRS) 305,542,750.00
Min. of Lands (Zenith) 2,630,000,000.00
Total Other Revenue/Receipts: 2,936,203,713.00 54,624,949,285.48 -94.62
Total Revenue 269,428,440,333.27 258,361,356,827.65 8.99
A - Total Personnel Costs ( Including Salaries directly
charged to CRF in Note 4B below): H Actual Total Budget Variance
List of MDA: Administrative Sector 2,043,691,534.85 3,586,270,842.00 43.01 CRF Charges in Note 3
List of MDA: Economic Sector 4,241,350,424.26 2,842,489,355.00 - 49.21
List of MDA: Law and Justice Sector 2,409,243,828.27 2,919,395,400.99 17.47
List of MDA: Social Sector 61,590,211,138.04 61,556,818,027.01 - 0.05
Total Personnel Cost 70,284,496,925.42 70,904,973,625.00 0.88
5.0 B- Salaries directly charged to CRF
List of Parastatals and Agencies:
Auditor-General (LG) 7,087,292.76 6,613,711.00 - 7.16
Auditor-General (State) 6,738,498.24 6,613,711.00 - 1.89
Tax Appeal Commission - 93,945,214.00 100.00
Civil Service Commission 20,060,880.14 34,748,488.00 42.27
Customary Court of Appeal 13,422,936.00 9,788,987.00 - 37.12
Judiciary 58,847,277.00 66,291,779.00 11.23
RSHASC 12,311,775.98 34,748,484.00 64.57
RSIEC 47,839,226.13 64,506,638.00 25.84
LGSC 17,718,231.90 46,266,288.00 61.70
Judicial Service Commission (JSC) 29,351,423.81 27,527,472.00 - 6.63
Total 213,377,541.96 391,050,772.00 45.43
5.1 Employers Contribution to Pension according to Sector J Actual Total Budget Variance
List of MDA: Administrative Sector - 151,800,000.00 100
List of MDA: Economic Sector - 120,300,000.00 100
List of MDA: Law and Justice Sector - 123,600,000.00 100
List of MDA: Social Sector - 2,604,300,000.00 100
Total Employers Contribution to Pension - 3,000,000,000.00 100
Consolidated Revenue Fund Charges ( Incl. Bank Charges) Actual Total Budget Variance
5.2 Pensions (Parastatals) 1,687,551,738.21 2,000,000,000.00 15.62
5.3 Death Benefit - 900,000,000.00 100.00
5.4 Pensions/Gratuity 17,962,463,991.83 23,184,261,797.32 22.52
Total Consolidated Revenue Fund Charges 19,650,015,730.04 26,084,261,797.32 24.67
6.0 Overhead Costs K Actual Total Budget Variance
List of MDA: Administrative Sector 8,726,717,976.00 12,342,981,696.00 29.30
List of MDA: Economic Sector 702,866,880.00 1,073,473,159.82 34.52
List of MDA: Law and Justice Sector 2,237,156,232.00 3,481,956,130.00 35.75
L

REPORT OF THE AUDITOR-GENERAL OF RIVERS STATE ON THE 2020 FINANCIAL STATEMENTS
33
List of MDA: Social Sector 1,523,010,072.00 1,530,964,846.52 0.52
Total Overhead Cost 13,189,751,160.00 18,429,375,832.34 28.43
6.1 Bank Charges Actual Total Budget Variance
A: IGR M 270,983,884.17 -
FAAC 1,146,740,346.13 -
MOFI 6,043,595.98 -
Utilities 106,281,648.00 -
1,530,049,474.28 500,000,000.00 -206.01
B: FGN 4,063,348,059.00 -
Internal 4,505,508,438.00 -
External 212,715,524.00 -
8,781,572,021.00 10,025,000,000.00 12.40
Total Bank Charges 10,311,621,494.00 10,525,000,000.00 2.03
6.2 Subventions to Parastatals (According to Sectors-List) Actual Total Budget Variance
List of MDA: Administrative Sector - -
List of MDA: Economic Sector - -
List of MDA: Law and Justice Sector - -
Lis of MDA: Regional Sector - -
List of MDA: Social Sector - -
Total Subventions to Parastatals - -
A - Details of Total Capital Expenditures (According to
Sectors) Actual Total Budget Variance
7.0 List of MDA: Administrative Sector 20,464,897,837.98 9,677,403,200.00 -111.47
7.1 List of MDA: Economic Sector 85,278,028,393.08 69,109,240,685.64 -23.40
7.2 List of MDA: Social Sector 23,947,396,852.26 41,032,413,328.94 41.64
7.3 List of MDA: Law and Justice Sector 7,207,173,735.28 3,490,000,000.00 -106.51
7.4 List of MDA: Special Heads 31,462,459,934.55 43,346,849,784.37 27.42
Total Details of Capital Expenditures 168,359,956,753.15 166,655,906,998.95 -1.02
8.0 Details of Aid & Grants Proposed Actual Total Budget Variance
Bilateral - -
Multi Lateral - -
SFTAS 950,000,000.00 8,035,885,887.05 - 88.18
Total Details of Aid & Grants Proposed 950,000,000.00 8,035,885,887.05 - 88.18
8.1 Proceeds from External Loan 5,429,967,000.00 10,000,000,000.00 - 45.70
8.2 Proceeds from Internal Loans FGN/Bonds - -
8.3 Proceeds from Commercial Banks 19,519,884,076.00 60,000,000,000.00 - 67.47
24,949,851,076.00 70,000,000,000.00 - 64.36
9.1 External Loans:FGN/States/ LGC
List the Loans Balance as at 1/1/2020 Additional Loan Loan Paid Back Balance as at 31/12/2020
Loan 1 Multilateral/World Bank 24,077,295,218.04 5,429,967,000.00 2,826,077,674.00 26,681,184,544.00
Loan 2 - - - -
Loan 3 - - - -
Loan 4 - - - -
Total 24,077,295,218.04 5,429,967,000.00 2,826,077,674.00 26,681,184,544.00
9.2 FGN/ States/LGC Bonds & Treasury Bonds.
List the Loans Balance as at 1/1/2020 Additional Loan Loan Paid Back Balance as at 31/12/2020
FGN Bond 21,920,187,237.00 - 459,235,270.00 21,460,951,967.00
FGN Excess crude Facility 6,984,442,917.00 - 312,942,958.00 6,671,499,959.00
FGN Salary Bailout Facility 9,327,116,494.00 - 90,162,488.00 9,236,954,006.00
FGN Budget Support Facility 17,539,993,593.00 - 29,663,958.00 17,510,329,635.00
CBN MEDF 2,000,000,000.00 - - 2,000,000,000.00
Total 57,771,740,241.00 - 892,004,674.00 56,879,735,567.00
9.3 Internal Loans from Other Funds
List the Loans Balance as at 1/1/2020 Additional Loan Loan Paid Back Balance as at 31/12/2020
Access Bank - - - -

REPORT OF THE AUDITOR-GENERAL OF RIVERS STATE ON THE 2020 FINANCIAL STATEMENTS
34
Zenith Bank 23,901,540,448.00 19,519,884,076.00 12,294,108,660.00 31,127,315,864.00
Loan 3 - - - -
Loan 4 - - - -
Total 23,901,540,448.00 19,519,884,076.00 12,294,108,660.00 31,127,315,864.00
9.4 Nigerian Treasury Bills (NTB) Amount 2020 Amount 2019
Opening balance at as 1st january, 20XX - -
Add: Additional NTB Issued - -
Less: NTB Repaid - -
Loans as at 31st December, 20XX - -
Development Loan Stock
List the Loans Balance as at 31/12/2020 Additional Loan Loan Paid Back Balance as at 31/12/2020
Loan 1 - - - -
Loan 2 - - - -
Loan 3 - - - -
Loan 4 - - - -
Total - - - -
Other Internal Loans( Promissory Notes) Balance as at 31/12/2020 Additional Loan Loan Paid Back Balance as at 31/12/2020
List the Loans: - - - -
Loan 1 - - - -
Loan 2 - - - -
Loan 3 - - - -
Loan 4 - - - -
Total - - - -
Schedule of Deposit Amount 2020 Amount 2019
List of MDA: Administrative Sector - -
List of MDA: Economic Sector - -
List of MDA: Law and Justice Sector - -
Lis of MDA: Regional Sector - -
List of MDA: Sector Sector - -
Total Outstanding Deposits - -
CONTINGENT LIABILITES AS AT YEAR END Amount 2020 Amount 2019
E.G.
List All the Contigent
Liabilities
Pension and Gratuity Due - - - -
Outstanding Contractors Liabilities ( According to MDA) - - - -
Pending Litigations ( According to MDA) - - - -
Guarantees ( According to MDA) - - - -
Others - - - -
Total Contigent Liabilities - - - -
10.1 CLOSING CASH BOOK BALANCE OF MINISTRIES,
DEPARTMENTS ( By Sectors) Amount 2020 Amount 2019
List of MDA: Administrative Sector 250,066,367.23 408,960,400.22
List of MDA: Economic Sector 1,754,702,983.61 2,869,654,333.78
List of MDA: Law and Justice Sector 97,483,499.09 159,425,240.76
Lis of MDA: Social Sector 1,038,411,185.95 1,698,225,390.76
List of MDA: Special Heads 1,097,748,968.02 1,795,266,841.68
Total Details of Cash Book Balances 4,238,413,003.90 6,931,532,207.20
11 CLOSING BOOK BALANCES OF OTHER FUNDS OF THE
GOVERNMENT Amount 2020 Amount 2019
Reserve Fund 1,400,000,000.00 1,400,000,000.00
- -
- -
- -
- -
Total Closing Balance of Other Funds of RVSG 1,400,000,000.00 1,400,000,000.00
12 INVESTMENTS Amount 2020 Amount 2019
Investments in Quoted Companies 43,875,773,119.00 43,875,773,119.00
REPORT OF THE AUDITOR-GENERAL OF RIVERS STATE ON THE 2020 FINANCIAL STATEMENTS
35
Investments in unQuoted Companies - -
Loans to Government Companies - -
Loans to Other Government - -
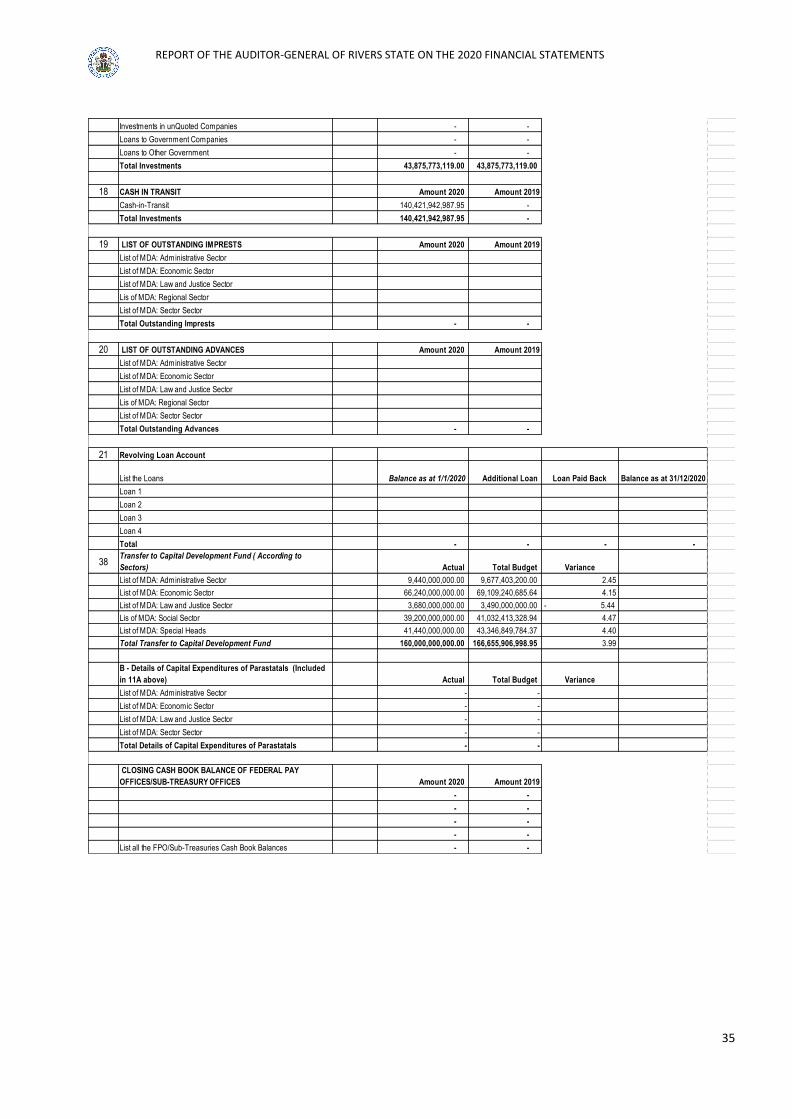
Total Investments 43,875,773,119.00 43,875,773,119.00
18 CASH IN TRANSIT Amount 2020 Amount 2019
Cash-in-Transit 140,421,942,987.95 -
Total Investments 140,421,942,987.95 -
19 LIST OF OUTSTANDING IMPRESTS Amount 2020 Amount 2019
List of MDA: Administrative Sector
List of MDA: Economic Sector
List of MDA: Law and Justice Sector
Lis of MDA: Regional Sector
List of MDA: Sector Sector
Total Outstanding Imprests - -
20 LIST OF OUTSTANDING ADVANCES Amount 2020 Amount 2019
List of MDA: Administrative Sector
List of MDA: Economic Sector
List of MDA: Law and Justice Sector
Lis of MDA: Regional Sector
List of MDA: Sector Sector
Total Outstanding Advances - -
21 Revolving Loan Account
List the Loans Balance as at 1/1/2020 Additional Loan Loan Paid Back Balance as at 31/12/2020
Loan 1
Loan 2
Loan 3
Loan 4
Total - - - -
38Transfer to Capital Development Fund ( According to
Sectors) Actual Total Budget Variance
List of MDA: Administrative Sector 9,440,000,000.00 9,677,403,200.00 2.45
List of MDA: Economic Sector 66,240,000,000.00 69,109,240,685.64 4.15
List of MDA: Law and Justice Sector 3,680,000,000.00 3,490,000,000.00 - 5.44
Lis of MDA: Social Sector 39,200,000,000.00 41,032,413,328.94 4.47
List of MDA: Special Heads 41,440,000,000.00 43,346,849,784.37 4.40
Total Transfer to Capital Development Fund 160,000,000,000.00 166,655,906,998.95 3.99
B - Details of Capital Expenditures of Parastatals (Included
in 11A above) Actual Total Budget Variance
List of MDA: Administrative Sector - -
List of MDA: Economic Sector - -
List of MDA: Law and Justice Sector - -
List of MDA: Sector Sector - -
Total Details of Capital Expenditures of Parastatals - -
CLOSING CASH BOOK BALANCE OF FEDERAL PAY
OFFICES/SUB-TREASURY OFFICES Amount 2020 Amount 2019
- -
- -
- -
- -
List all the FPO/Sub-Treasuries Cash Book Balances - -

REPORT OF THE AUDITOR-GENERAL OF RIVERS STATE ON THE 2020 FINANCIAL STATEMENTS
36
NOTE: 1.0
ECO.
CODEDESCRIPTION JAN. FEB. MAR APR MAY JUNE JULY AUGUST SEPTEMBER OCTOBER NOVEMBER DECEMBER TOTAL
11010100 STATUTORY 3,914,418,155.77 3,510,459,146.45 3,100,169,666.18 3,141,389,848.48 2,449,829,885.04 2,763,567,695.30 2,902,977,105.41 3,673,916,430.21 3,634,380,423.10 2,324,327,277.90 2,397,388,031.53 2,741,539,035.02 36,554,362,700.39
11010303 13% MINERAL 9,676,462,837.78 9,167,394,548.78 7,940,048,860.62 8,449,847,512.23 5,916,165,482.53 6,064,517,464.90 4,661,581,693.69 7,813,239,862.83 5,614,354,883.58 3,929,284,932.05 3,748,507,937.96 5,401,690,769.86 78,383,096,786.81
FGN INT. FUND - - - - - - - - - 2,133,477,465.87 2,042,541,296.89 - 4,176,018,762.76
14070102 EXCHANGE GAIN 31,788,257.92 29,334,356.06 21,407,135.94 1,529,030,878.50 766,479,304.68 799,522,046.90 954,226,681.43 - - - - - 4,131,788,661.43
FOREX EQUALIZATION - - 449,533,561.97 1,927,161,829.05 - - - - - 1,171,695,143.30 209,724,047.62 222,979,712.58 3,981,094,294.52
12021006 EXCESS BANK CHARGE - 5,008,436.93 - - 8,527,058.93 7,704,547.20 - - - - 7,609,290.21 - 28,849,333.27
13% ON EXCESS CRUDE - - - - 790,047,566.90 790,047,566.90 - - - - - - 1,580,095,133.80
FUNDS FROM NNPC - - - - - - - - - - - - -
GOODS & VALUABLE
CONSIDERATION - - - - - - - - - - - - -
DERIVATION ON ECA - - - - - - - - - - - 303,363,513.34 303,363,513.34
N50 BILLION TO STATES - - - - - - 379,938,431.63 - - - - - 379,938,431.63
SOLID MINERAL - - - - 63,224,011.25 - - - - - - - 63,224,011.25
NON-OIL REVENUE - - 123,851,250.38 - - - - - - - 341,962,588.47 - 465,813,838.85 REFUND ON EXCESS
CRUDE/SALARY
BAILOUT/BUDGET - - - - 242,539,775.00 369,215,548.75 - - - - - - 611,755,323.75
TOTAL GROSS 13,622,669,251.47 12,712,196,488.22 11,635,010,475.09 15,047,430,068.26 10,236,813,084.33 10,794,574,869.95 8,898,723,912.16 11,487,156,293.04 9,248,735,306.68 9,558,784,819.12 8,747,733,192.68 8,669,573,030.80 130,659,400,791.80
LESS: DEDUCTION 900,100,491.23 900,100,491.23 956,132,341.74 956,132,341.74 956,132,341.74 586,916,792.99 586,916,792.99 586,916,792.99 533,759,344.40 533,759,344.40 533,759,344.40 533,759,344.40 8,564,385,764.25
TOTAL NET 12,722,568,760.24 11,812,095,996.99 10,678,878,133.35 14,091,297,726.52 9,280,680,742.59 10,207,658,076.96 8,311,807,119.17 10,900,239,500.05 8,714,975,962.28 9,025,025,474.72 8,213,973,848.28 8,135,813,686.40 122,095,015,027.55
NOTE: 1.1
ECO.
CODEDESCRIPTION JAN. FEB. MAR APR MAY JUN JUL AUG SEP OCT NOV DEC TOTAL
11010202 VAT 1,828,030,953.54 1,448,820,000.00 1,495,000,000.00 1,843,000,000.00 193,000,000.00 1,606,000,000.00 2,157,000,000.00 1,945,000,000.00 2,329,000,000.00 2,264,000,000.00 1,981,000,000.00 2,278,000,000.00 21,367,850,953.54
Note 1.0 and 1.1 are main supporting referece to Federation Allocation in Statement No. 1 and Statement No. 3 (Cash flow Statement of Consolidated Revenue Fund respectively)
SUMMARY OF GROSS RECEIPTS FROM FAAC JANUARY – DECEMBER 2020

REPORT OF THE AUDITOR-GENERAL OF RIVERS STATE ON THE 2020 FINANCIAL STATEMENTS
37
NOTE: 1.0
A B
MONTHS NET STATUTORY
RECEIPTSFAAC DED. TOTAL
NET STATUTORY
RECEIPTSFAAC DED. TOTAL
JAN. 3,014,317,664.54 900,100,491.23 3,914,418,155.77 3,681,332,422.25 928,980,770.77 4,610,313,193.02
FEB. 2,610,358,655.22 900,100,491.23 3,510,459,146.45 3,357,938,777.07 928,980,770.77 4,286,919,547.84
MAR. 2,144,037,324.44 956,132,341.74 3,100,169,666.18 3,188,552,321.48 1,149,353,871.62 4,337,906,193.10
APR. 2,185,257,506.74 956,132,341.74 3,141,389,848.48 3,006,108,333.91 800,926,940.02 3,807,035,273.93
MAY 1,493,697,543.30 956,132,341.74 2,449,829,885.04 3,457,056,032.32 800,926,940.02 4,257,982,972.34
JUNE 2,176,650,902.31 586,916,792.99 2,763,567,695.30 3,869,393,758.80 800,926,940.02 4,670,320,698.82
JULY 2,316,060,312.42 586,916,792.99 2,902,977,105.41 4,230,982,974.30 800,926,940.02 5,031,909,914.32
AUG. 3,086,999,637.22 586,916,792.99 3,673,916,430.21 4,122,230,431.27 800,926,940.02 4,923,157,371.29
SEPT. 3,100,621,078.70 533,759,344.40 3,634,380,423.10 4,150,314,550.84 972,825,081.57 5,123,139,632.41
OCT. 1,790,567,933.50 533,759,344.40 2,324,327,277.90 4,038,824,743.18 900,150,491.23 4,938,975,234.41
NOV. 1,863,628,697.13 533,759,344.40 2,397,388,041.53 3,983,113,954.33 900,150,491.23 4,883,264,445.56
DEC. 2,207,779,690.62 533,759,344.40 2,741,539,035.02 3,067,647,625.55 900,150,491.23 3,967,798,116.78
TOTAL (N) 27,989,976,946.14 8,564,385,764.25 36,554,362,710.39 44,153,495,925.30 10,685,226,668.52 54,838,722,593.82
SUMMARY OF GROSS/NET RECEIPTS FROM FAAC JANUARY – DECEMBER 2020
SHARE OF FAAC (STATUTORY REVENUE)
2020 2019

REPORT OF THE AUDITOR-GENERAL OF RIVERS STATE ON THE 2020 FINANCIAL STATEMENTS
38
NOTE: 1.0
D
MONTHS 13%MINERAL EXCESS BANK
CHARGESEXCHANGE GAIN
FOREX
EQUALIZATION REFUNDSFGN INT. FUND
DERIVATION ON
ECA
SOLID
MINERALTOTAL 2020
JAN. 9,676,462,837.78 - 31,788,257.92 - - - - - 9,708,251,095.70
FEB. 9,167,394,548.78 5,008,436.93 29,334,356.06 - - - - - 9,201,737,341.77
MAR. 7,940,048,860.62 - 21,407,135.94 449,533,561.97 123,851,250.38 - - - 8,534,840,808.91
APR. 8,449,847,512.23 - 1,529,030,878.50 1,927,161,829.05 - - - - 11,906,040,219.78
MAY 5,916,165,482.53 8,527,058.93 766,479,304.68 - 242,539,775.00 - 790,047,566.90 63,224,011.25 7,786,983,199.29
JUNE 6,064,517,464.90 7,704,547.20 799,522,046.90 - 369,215,548.75 - 790,047,566.90 - 8,031,007,174.65
JULY 4,661,581,693.69 - 954,226,681.43 - - - 379,938,431.63 - 5,995,746,806.75
AUG. 7,813,239,862.83 - - - - - - - 7,813,239,862.83
SEPT. 5,614,354,883.58 - - - - - - - 5,614,354,883.58
OCT. 3,929,284,932.05 - - 1,171,695,143.30 - 2,133,477,465.87 - - 7,234,457,541.22
NOV. 3,748,507,937.96 7,609,290.21 - 209,724,047.62 341,962,588.47 2,042,541,296.89 - - 6,350,345,161.15
DEC. 5,401,690,769.86 - - 222,979,712.58 - - 303,363,513.34 - 5,928,033,995.78
TOTAL (N) 78,383,096,786.81 28,849,333.27 4,131,788,661.43 3,981,094,294.52 1,077,569,162.60 4,176,018,762.76 2,263,397,078.77 63,224,011.25 94,105,038,091.41
C
SHARE OF STATUTORY ALLOCATION

REPORT OF THE AUDITOR-GENERAL OF RIVERS STATE ON THE 2020 FINANCIAL STATEMENTS
39
S/No. DESCRIPTION JAN. FEB. MARCH APRIL MAY JUNE JULY AUGUST SEPTEMBER OCTOBER NOVEMBER DECEMBER TOTAL (N)
1 CBN Budget Support (4/36) 152,567,179.41 152,567,179.41 152,567,179.41 152,567,179.41 152,567,179.41 - - - - - - - 762,835,897.05
2
Deduction for Excess Crude
Account Loan Facility to the
States.
126,675,773.75 126,675,773.75 126,675,773.75 126,675,773.75 126,675,773.75 - - - - - - - 633,378,868.75
3 FG Salary Bailout to States 89,972,595.59 89,972,595.59 89,972,595.59 89,972,595.59 89,972,595.59 - - - - - - - 449,862,977.95
4Foreign Loans to State
Governments 224,300,373.94 224,300,373.94 280,282,224.45 280,282,224.45 280,282,224.45 280,282,224.45 280,282,224.45 280,282,224.45 227,124,775.86 227,124,775.86 227,124,775.86 227,124,775.86 3,038,793,198.02
5
Restructuring of Commercial
Bank Loans into FGN Bonds.
(50/26)
306,634,568.54 306,634,568.54 306,634,568.54 306,634,568.54 306,634,568.54 306,634,568.54 306,634,568.54 306,634,568.54 306,634,568.54 306,634,568.54 306,634,568.54 306,634,568.54 3,679,614,822.48
TOTALS (N) 900,150,491.23 900,150,491.23 956,132,341.74 956,132,341.74 956,132,341.74 586,916,792.99 586,916,792.99 586,916,792.99 533,759,344.40 533,759,344.40 533,759,344.40 533,759,344.40 8,564,485,764.25
RIVERS STATE GOVERNMENT
DEDUCTIONS AT SOURCE FROM FAAC FOR THE PERIOD JANUARY - DECEMBER 2020

REPORT OF THE AUDITOR-GENERAL OF RIVERS STATE ON THE 2020 FINANCIAL STATEMENTS
40
A) TAXES
NOTES DESCRIPTION ECO. CODE JANUARY FEBRUARY MARCH APRIL MAY JUNE JULY AUGUST SEPTEMBER OCTOBER NOVEMBER DECEMBER TOTAL(N)
With Holding Tax (a) 022000800100 8,359,577,257.55 13,702,137,084.93 9,127,212,167.02 8,754,718,067.41 7,645,761,864.73 7,721,238,915.87 6,237,134,990.26 8,043,243,228.15 7,474,765,850.40 7,170,147,712.68 5,415,466,666.79 7,800,693,176.00 97,452,096,981.79
Paye/Fed MDAs(Taxes)
(b) 022000800100 547,149,481.23 543,742,780.39 542,882,377.61 536,758,949.85 541,717,084.35 538,792,058.27 536,235,314.55 534,562,715.88 534,456,687.14 533,021,049.19 529,647,896.48 528,853,208.57 6,447,819,603.51
Foreign Curr. Conver. (c) 022000800100 104,871,582.00 361,669,773.60 176,445,266.40 402,750,612.00 173,148,916.50 139,894,866.00 154,977,718.50 185,151,258.00 121,283,649.00 171,221,760.00 132,311,166.40 150,902,260.80 2,274,628,829.20
Other Taxes (d) SSCL 868,081.44 634,000.00 2,146,665.44 115,000.00 178,998.79 158,500.00 580,332.73 96,500.00 212,581.55 94,500.00 361,832.16 72,000.00 5,518,992.11
Sub-Total (1) 9,012,466,402.22 14,608,183,638.92 9,848,686,476.47 9,694,342,629.26 8,360,806,864.37 8,400,084,340.14 6,928,928,356.04 8,763,053,702.03 8,130,718,768.09 7,874,485,021.87 6,077,787,561.83 8,480,520,645.37 106,180,064,406.61
B) EFFORTS
3.0 Licenses 011101009001 14,949,786.56 24,927,021.40 19,364,545.15 16,845,569.92 16,811,896.77 9,806,028.52 16,792,907.39 22,163,027.97 13,193,616.83 27,901,609.97 15,530,360.13 14,886,827.55 213,173,198.16
3.1 Fines 023400100100 218,002.03 7,403,400.58 892,500.00 291,000.00 1,000,000.00 - 17,185,070.00 3,435,350.00 120,100.00 1,250,000.00 890,000.00 110,000.00 32,795,422.61
3.2 Fees 012500500100 14,442,416.33 6,122,415.60 5,578,600.00 73,172,417.00 43,971,758.30 31,599,000.00 3,942,500.00 1,976,600.00 13,570,570.00 64,551,195.00 178,008,040.00 3,382,150.00 440,317,662.23
4.0 Earnings 012300100100 - 237,297.00 6,000.00 - - - - - 210,000.00 105,000.00 45,000.00 - 603,297.00
4.1 Sales 011103800100 2,026,208.14 182,898,540.17 4,807,560.26 4,349,866.12 15,634,505.34 101,428,621.31 55,753,945.79 57,106,963.34 71,820,973.77 59,340,088.48 55,794,889.07 57,814,717.54 668,776,879.33
4.2
Rent on Govt Qtrs:
(Paydirect/Payroll) 012500100100 626,807.65 6,474,837.15 6,351,236.16 6,265,996.81 6,191,584.60 6,099,745.40 11,200,835.69 6,678,529.36 6,773,596.77 9,433,739.32 12,419,947.81 6,333,615.06 84,850,471.78
4.3 Dividend 022000100200 - 1,299,858,565.00 668,937,540.00 882,762,219.78 - - 964,673,973.90 363,216,685.00 63,710,000.00 200,000,000.00 - 2,401,244,553.53 6,844,403,537.21
Sub-Total (3) 32,263,220.71 1,527,922,076.90 705,937,981.57 983,687,069.63 83,609,745.01 148,933,395.23 1,069,549,232.77 454,577,155.67 169,398,857.37 362,581,632.77 262,688,237.01 2,483,771,863.68 8,284,920,468.32
Min. of Finance 011103500200 14,417.00 239,202.00 25,500.00 105,984.00 - - - - 15,860.00 200,000.00 - 60,000.00 660,963.00
Auto-Reg 011103500200 38,871,425.00 29,716,850.00 6,651,450.00 24,563,225.00 11,488,350.00 11,068,750.00 32,286,275.00 32,365,825.00 32,701,800.00 31,395,325.00 24,386,425.00 30,047,050.00 305,542,750.00
Min. Of Lands: (Zenith) 011103500200 - - 269,000,000.00 - - - 300,000,000.00 546,000,000.00 175,000,000.00 500,000,000.00 140,000,000.00 700,000,000.00 2,630,000,000.00
Sub-Total (4) 38,885,842.00 29,956,052.00 275,676,950.00 24,669,209.00 11,488,350.00 11,068,750.00 332,286,275.00 578,365,825.00 207,717,660.00 531,595,325.00 164,386,425.00 730,107,050.00 2,936,203,713.00
Grand Total (A+B+C) 9,083,615,464.93 16,166,061,767.82 10,830,301,408.04 10,702,698,907.89 8,455,904,959.38 8,560,086,485.37 8,330,763,863.81 9,795,996,682.70 8,507,835,285.46 8,768,661,979.64 6,504,862,223.84 11,694,399,559.05 117,401,188,587.93
Notes 2.0, 3.0 - 3.2, 4.3 and 4.4 are main supporting references of IGR and other receipts in Statement No.1 and Statement No. 3 (Cashflow Statement and Statement of Consolidated Revenue Fund respectively)
NOTES: 2.0, 3.0 - 4.4
2.0
4.4
C) OTHER RECEIPTS
ORGANIZATIONAL CODE: 012500500100
SUMMARY OF GROSS RECEIPTS OF INTERNALLY GENERATED REVENUE
FOR THE PERIOD JANUARY TO DECEMBER, 2020

REPORT OF THE AUDITOR-GENERAL OF RIVERS STATE ON THE 2020 FINANCIAL STATEMENTS
41
NOTE: 4.4
S/No COMPANIES MONTH AMOUNT(N)
1 Eleme Petrochemical February 1,299,858,565.00
1,299,858,565.00
2 Eleme Petrochemical March 326,437,540.00
3 Zenith Bank March 162,500,000.00
4 Veritas March 180,000,000.00
668,937,540.00
5 Eleme Petrochemical April 215,917,213.00
6 Eleme Petrochemical April 558,293,880.00
7 FBN April 16,514,650.58
8 FBN April 1,921,034.52
9 Nig Breweries April 1,127,970.00
10 Sterling Bank April 65,871.68
11 UBA Bank April 20,800,000.00
12 UBA Bank April 57,600,000.00
13 UBA Bank April 6,921,600.00
14 Access Bank April 3,600,000.00
DIVIDENDS (MOFI) FOR THE PERIOD
JANUARY - DECEMBER, 2020

REPORT OF THE AUDITOR-GENERAL OF RIVERS STATE ON THE 2020 FINANCIAL STATEMENTS
42
882,762,219.78
15 Corporate Mortgage Bank (Zenith) July 100,000,000.00
16 Corporate Mortgage Bank (Zenith) July 100,000,000.00
17 Indorama Eleme Petrochemicals July 762,741,700.00
18 Nigerian Breweries (FBN) July 1,127,970.00
19 FBN Holding (FBN) July 804,303.90
964,673,973.90
20 Indorama Eleme Petrochemicals (Zenith) August 363,216,685.00
363,216,685.00
21 Zenith Bank (Interim Div) September 19,000,000.00
22 UBA - Veritas (Zenith Div) September 24,075,000.00
23 UBA - (APJAIZ Bank) September 4,675,000.00
24 UBA - (APJAIZ Bank) September 1,470,000.00
25 UBA - (APJAIZ Bank) September 12,240,000.00
26 Access Bank Div Payment September 2,250,000.00
63,710,000.00
27 Corporate Mortgage Bank (Zenith) October 100,000,000.00
28 Corporate Mortgage Bank (Zenith) October 100,000,000.00
200,000,000.00
NIL November NIL
29 Indorama Dividend (Zenith) December 1,057,690,583.30
30 Indorama Dividend (Zenith) December 1,343,553,970.23
2,401,244,553.53
GRAND TOTAL 6,844,403,537.21

REPORT OF THE AUDITOR-GENERAL OF RIVERS STATE ON THE 2020 FINANCIAL STATEMENTS
43
NOTE: 5.0
HEAD MDAS JANUARY FEBRUARY MARCH APRIL MAY JUNE TOTAL
412000000000 GOVERNMENT HOUSE (GH) 18,207,334.62 18,207,334.62 18,932,797.31 18,879,418.97 18,800,120.85 18,306,060.58 111,333,066.95
412010000000 OFFICE OF THE DEPUTY GOVERNOR (ODG) 3,682,910.76 3,682,910.76 3,682,910.76 3,704,566.16 3,704,566.16 3,403,575.50 21,861,440.10
412020100000RIVERS STATE CHRISTIAN PILGRIMS WELFARE
BOARD (RSCPWB) 538,800.33 538,800.33 374,738.37 374,738.37 374,738.37 374,738.37 2,576,554.14
412020200000 RIVERS STATE MUSLIM PILGRIMS WELFARE
BOARD (RSMPWB) 275,590.07 275,590.07 275,590.07 275,590.07 275,590.07 275,590.07 1,653,540.42
413000000000 SECRETARY TO GOVERNMENT (SSG) 20,785,289.53 19,862,812.69 19,482,344.71 16,645,570.91 16,645,570.91 13,620,322.18 107,041,910.93
413010000000 HEAD OF SERVICE (HOS) 10,550,067.35 10,513,895.34 10,629,003.85 10,629,003.85 10,629,003.85 10,585,666.03 63,536,640.27
413020000000 RIVERS STATE LIAISON OFFICE - ABUJA 2,494,748.37 2,494,748.37 2,494,748.37 2,494,748.37 2,494,748.37 1,855,609.14 14,329,350.99
413030000000 RIVERS STATE LIAISON OFFICE - LAGOS 1,916,271.57 1,916,271.57 1,916,271.57 1,916,271.57 1,916,271.57 2,203,979.58 11,785,337.43
413040000000 ESTABLISHMENT, TRAINING & PENSION BUREAU 7,238,150.78 6,984,670.35 6,860,676.87 6,860,676.87 6,860,676.87 6,860,676.87 41,665,528.61
413050000000 R/S PARASTATALS PENSION BOARD 1,266,711.66 1,266,711.66 1,266,711.66 1,266,711.66 1,266,711.66 1,266,711.66 7,600,269.96
413070000000 RIVERS STATE INDEPENDENT ELECTORAL
COMMISSION (RSIEC) 12,863,826.71 12,863,826.71 12,863,826.71 12,892,892.92 12,837,168.77 11,024,428.55 75,345,970.37
413120000000 URBAN BEAUTIFICATION, PARKS & GARDEN 8,036,411.16 8,036,411.16 7,947,840.87 7,901,853.37 7,855,865.87 7,855,865.87 47,634,248.30
413130000000 INFORMATION COMMUNICATION &
TECHNOLOGY DEPARTMENT (ICT) 3,183,205.89 3,183,205.89 3,183,205.89 3,183,205.89 3,183,205.89 3,183,205.89 19,099,235.34
413160000000 STATE ECONOMIC ADVISORY COUNCIL 132,017.18 132,017.18 132,017.18 132,017.18 132,017.18 132,017.18 792,103.08
420000000000 MINISTRY OF INFORMATION &
COMMUNICATIONS (MOI) 16,075,969.59 14,266,394.62 14,562,803.74 16,105,386.51 16,587,126.27 16,279,154.97 93,876,835.70
423000000000 AUDITOR-GENERAL (STATE) 8,182,777.02 8,139,439.19 8,113,139.64 8,113,139.64 8,113,139.64 8,113,139.64 48,774,774.77
423010000000 AUDITOR-GENERAL (LG) 5,099,652.40 5,099,652.40 5,099,652.40 5,099,652.40 5,099,652.40 5,073,738.36 30,572,000.36
424000000000 CIVIL SERVICE COMMISSION (CSC) 8,713,851.63 8,152,310.12 8,314,116.79 8,456,940.22 8,456,940.22 7,429,298.76 49,523,457.74
425000000000 LOCAL GOVERNMENT SERVICE COMMISSION
(LGSC) 85,649.74 85,649.74 85,649.74 85,649.74 85,649.74 2,614,447.19 3,042,695.89
432000000000 MINISTRY OF SPECIAL DUTIES/EMERGENCY
(MSD) 2,862,441.68 2,519,568.74 11,429,016.08 10,653,255.86 10,251,018.31 10,073,835.97 47,789,136.64
EMERGENCY RELIEF & FIRE SERVICE 8,337,214.42 8,337,214.42 4,837,558.05 1,318,739.07 1,248,439.12 1,248,439.12 25,327,604.20
435000000000 RIVERS STATE HOUSE OF ASSEMBLY (RVHA) 34,266,527.53 34,964,947.07 34,266,527.53 34,266,527.53 33,671,019.72 33,520,316.61 204,955,865.99
435010000000RIVERS STATE HOUSE OF ASSEMBLY SERVICE
COMMISSION (RVHASC) - - - - - - -
MINISTRY OF SPECIAL SERVICES 470,138.70 470,138.70 1,310,449.76 2,086,209.97 2,086,209.97 1,909,027.64 8,332,174.74
SUB TOTAL (1) 175,265,558.69 171,994,521.70 178,061,597.92 173,342,767.10 172,575,451.78 167,209,845.73 1,038,449,742.92
SUMMARY OF PERSONNEL EMOLUMENT (SALARIES)
FOR THE PERIOD JANUARY TO JUNE 2020
ADMINISTRATIVE SECTOR

REPORT OF THE AUDITOR-GENERAL OF RIVERS STATE ON THE 2020 FINANCIAL STATEMENTS
44
412020000000 MINISTRY OF SOCIAL WELFARE &
REHABILITATION (MSWR) 17,392,497.56 17,392,497.56 19,216,666.29 19,201,946.26 18,616,931.98 18,689,423.37 110,509,963.02
413180000000 R/S WASTE MANAGEMNT AGENCY 24,256,060.48 24,116,920.47 23,784,454.09 23,784,454.09 23,633,318.40 23,271,714.87 142,846,922.40
417000000000 MINISTRY OF EDUCATION (MOED) 44,728,641.60 43,888,477.17 43,331,137.24 43,331,137.24 43,331,137.24 43,125,234.83 261,735,765.32
417010000000 RIVERS STATE SCHOLARSHIP BOARD 897,969.11 934,141.12 1,063,073.68 1,063,073.68 1,063,073.68 1,063,073.68 6,084,404.95
417020000000 RIVERS STATE UNIVERSITY OF SCIENCE &
TECHNOLOGY 862,160,061.80 825,229,062.60 797,614,532.40 791,886,530.90 801,802,476.40 799,999,345.80 4,878,692,009.90
417030000000 PORT HARCOURT POLYTECHNIC 192,806,469.00 192,372,698.60 192,409,761.00 192,309,170.50 192,198,823.50 192,198,823.50 1,154,295,746.10
417040000000 RIVERS STATE LIBRARY BOARD 2,377,977.21 2,377,977.21 2,377,977.21 2,377,977.21 2,377,977.21 2,377,977.21 14,267,863.26
417050000000 RIVERS STATE POLYTECHNIC - BORI 305,691,999.90 307,388,938.00 305,428,672.40 304,132,867.10 307,884,439.80 307,872,474.70 1,838,399,391.90
417060000000 IGNATIUS AJURU UNIVERSITY OF EDUCATION 381,475,290.30 383,569,039.50 387,874,162.80 384,507,629.90 381,264,324.30 381,231,937.20 2,299,922,384.00
417070000000 RIVERS STATE POST PRIMARY SCHOOLS BOARD
(HQ) 873,843,456.00 863,686,947.92 860,449,202.26 858,312,043.22 853,075,109.17 850,650,185.90 5,160,016,944.47
417090000000 RIVERS STATE AGENCY FOR ADULT/NON
FORMAL EDUCATION 4,302,301.87 4,302,301.87 4,133,417.56 4,133,417.56 4,133,417.56 4,133,417.56 25,138,273.98
417100000000 UNIVERSAL BASIC EDUCATION BOARD 1,703,655,995.68 1,703,622,928.67 1,697,732,245.43 1,691,712,735.73 1,683,856,588.50 1,674,518,317.35 10,155,098,811.36
419000000000 MINISTRY OF HEALTH (MOH) 127,131,698.77 125,041,871.67 126,363,102.91 125,723,963.69 153,101,260.38 152,826,283.22 810,188,180.64
419010000000 HOSPITAL MANAGEMENT BOARD (HQ) 36,967,321.65 40,517,049.64 40,064,091.64 35,959,421.09 31,398,377.56 32,159,905.33 217,066,166.91
419020000000 HOSPITAL MANAGEMENT BOARD (ZONES) 182,736,867.29 181,954,189.30 175,889,587.39 170,351,095.81 131,598,084.99 130,371,003.98 972,900,828.76
419030000000RIVERS STATE UNIVERSITY TEACHING HOSPITAL
(BMSH) 144,578,800.38 140,755,912.23 139,828,242.93 135,768,832.67 186,797,733.18 207,397,766.86 955,127,288.25
419040000000 RIVERS STATE COLLEGE OF HEALTH SCIENCE &
TECHNOLOGY 66,771,283.01 66,804,439.78 66,864,760.20 67,697,329.25 67,815,322.06 68,362,374.71 404,315,509.01
419050000000 PRIMARY HEALTH CARE MANAGEMENT BOARD 152,327,026.50 152,094,403.75 148,753,204.52 147,436,078.01 147,288,590.37 140,288,646.66 888,187,949.81
428000000000 MINISTRY OF WOMEN AFFAIRS (MOWA) 5,763,754.35 4,842,341.80 5,700,876.90 5,643,083.59 5,639,327.73 5,639,327.73 33,228,712.10
429000000000 MINISTRY OF SPORTS (MOS) 3,858,641.08 3,858,641.08 4,692,315.51 4,464,108.37 4,464,108.37 4,286,926.03 25,624,740.44
429010000000 RIVERS STATE STADIA AUTHORITY 5,078,838.72 5,078,838.72 4,943,143.39 4,943,143.39 4,943,143.39 4,943,143.39 29,930,251.00
429020000000 RIVERS STATE SPORT COUNCIL 17,015,894.29 16,929,978.80 16,950,300.36 16,950,300.36 16,950,300.36 16,950,300.36 101,747,074.53
429030000000 RIVERS STATE SPORT INSTITUTE - ISAKA 3,686,268.84 3,686,268.84 3,686,268.84 3,609,244.61 3,609,244.61 3,609,244.61 21,886,540.35
430000000000 MINISTRY OF ENVIRONMENT (MOEN) 52,206,522.28 51,271,234.13 49,718,727.37 51,143,880.86 50,971,672.19 50,325,755.87 305,637,792.70
433000000000 MINISTRY OF LOCAL GOVERNMENT AFFAIRS
(MOLGA) 9,670,713.80 9,613,920.48 10,253,059.71 10,121,770.35 9,902,163.68 9,540,170.41 59,101,798.43
433010000000 MINISTRY OF CHIEFTAINCY & COMMUNITY
AFFAIRS (MC&CA) 7,684,593.52 7,684,593.52 8,246,135.04 9,340,970.35 8,836,742.76 8,659,560.42 50,452,595.61
435020000000 MINISTRY OF YOUTH DEVELOPMENT (MYD) 4,515,790.38 4,244,395.13 5,950,794.57 5,911,602.41 5,724,292.48 5,547,110.14 31,893,985.11
GARDEN CITY RADIO 1,354,901.60 1,354,901.60 1,354,901.60 1,354,901.60 1,354,901.60 1,354,901.60 8,129,409.60
SUB TOTAL (2) 5,234,937,636.97 5,184,614,911.16 5,144,674,815.24 5,113,172,709.80 5,143,632,883.45 5,141,394,347.29 30,962,427,303.91
SOCIAL SECTOR

REPORT OF THE AUDITOR-GENERAL OF RIVERS STATE ON THE 2020 FINANCIAL STATEMENTS
45
413100000000 MINISTRY OF CULTURE & TOURISM (MC&T) 9,647,053.01 9,238,855.48 10,566,829.36 10,566,829.36 10,395,945.05 10,218,762.71 60,634,274.97
413100100000 RIVERS STATE MUSEUM 1,813,417.47 1,813,417.47 1,813,417.47 1,813,417.47 1,813,417.47 1,813,417.47 10,880,504.82
413100400000 RIVERS STATE TOURISM DEVELOPMENT
AGENCY 591,440.81 591,440.81 591,440.81 591,440.81 591,440.81 591,440.81 3,548,644.86
413102000000 RIVERS STATE COUNCIL FOR ARTS & CULTURE 11,263,226.53 11,015,975.73 11,015,975.73 11,015,975.73 11,015,975.73 10,806,043.22 66,133,172.67
413220000000 MINISTRY OF ENERGY & NATURAL RESOURCES 5,696,104.35 5,696,104.35 5,302,994.12 5,302,994.12 5,473,878.43 5,296,696.09 32,768,771.46
414000000000 MINISTRY OF COMMERCE & INDUSTRY 16,676,973.26 15,954,231.21 15,546,022.02 16,021,648.05 16,021,648.05 15,844,465.71 96,064,988.30
415000000000 MINISTRY OF WATER RESOURCES 6,981,046.44 6,981,046.44 8,154,000.08 8,154,000.08 7,974,380.63 7,797,198.29 46,041,671.96
415010000000 RIVERS STATE SMALL TOWN WATER SUPPLY &
SANITATION AGENCY (RSSTOWSSA) 9,883,112.17 9,661,776.25 10,595,624.88 10,595,624.88 10,386,740.56 10,689,837.57 61,812,716.31
415020000000 RURAL WATER SUPPLY & SANITATION AGENCY
(RUWATSA) 1,815,164.73 1,815,164.73 1,815,164.73 1,815,164.73 1,815,164.73 1,815,164.73 10,890,988.38
416000000000 MINISTRY OF AGRICULTURE (MOA) 27,702,636.08 27,788,242.85 28,923,717.72 29,580,110.74 28,266,175.59 28,088,993.25 170,349,876.23
416020000000 RIVERS STATE SCHOOL-TO-LAND AUTHORITY 4,699,959.25 4,699,959.25 4,564,263.92 4,428,568.59 4,342,653.10 3,906,887.36 26,642,291.47
416100000000RIVERS STATE AGRICULTUTAL DEVELOPMENT
PROGRAMME (ADP) 30,772,927.68 30,912,218.62 29,453,206.21 29,299,531.07 28,660,391.84 28,531,138.53 177,629,413.95
418000000000 MINISTRY OF FINANCE (MOF) 26,279,615.86 23,659,913.07 22,858,511.76 22,858,511.76 22,858,511.76 22,760,007.74 141,275,071.95
420020000000 RIVERS STATE NEWSPAPER COPORATION 30,945,413.19 30,945,413.19 31,082,314.38 31,082,314.38 30,490,734.45 30,490,734.45 185,036,924.04
420030000000 RIVERS STATE TELEVISION AUTHORITY 29,273,271.36 26,634,076.87 28,050,028.25 28,105,938.64 27,347,203.24 26,479,486.38 165,890,004.74
420040000000 RIVERS STATE BROADCASTING COPORATION 34,316,228.78 34,151,851.57 33,758,252.01 32,961,365.36 32,961,365.36 32,187,583.62 200,336,646.70
422000000000 MINISTRY OF WORK (MOW) 24,066,169.31 24,030,061.41 23,939,145.92 23,823,138.54 23,466,247.01 23,173,954.10 142,498,716.29
422010000000 MINISTRY OF TRANSPORT (MOT) 20,683,485.96 20,626,692.65 20,866,726.42 20,707,486.09 20,538,601.77 20,361,419.43 123,784,412.32
422020000000 MINISTRY OF POWER (MOP) 30,428,105.32 30,249,955.15 30,583,238.69 28,736,899.62 28,540,960.60 28,260,248.73 176,799,408.11
431000000000 MINISTRY OF BUDGET & ECONOMIC PLANNING
(MBEP) 7,581,769.20 7,581,769.20 7,581,769.20 7,581,769.20 7,660,588.22 7,660,588.22 45,648,253.24
434000000000 MINISTRY OF LANDS & SURVEY (ML&S) 6,658,475.05 7,179,446.23 6,658,475.05 6,658,475.05 6,340,056.05 6,340,056.05 39,834,983.48
434010000000 MINISTRY OF HOUSING (MOHU) 5,803,882.62 5,803,882.62 5,669,365.60 5,683,907.28 5,593,470.88 5,242,704.23 33,797,213.23
434010100000 RIVERS STATE HOUSING & PROPERTY
DEVELOPMENT AUTHRITY 8,462,204.72 8,352,975.53 8,352,975.53 8,352,975.53 8,352,975.53 8,352,975.53 50,227,082.37
434020000000 MINISTRY OF URBAN DEVELOPMENT (MUD) 7,053,124.70 7,179,997.95 6,363,830.78 6,363,830.78 6,363,830.78 5,898,940.43 39,223,555.42
434100000000 OFFICE OF THE SURVEYOR-GENERAL 3,635,003.94 3,635,003.94 3,455,384.48 3,455,384.48 3,455,384.48 3,455,384.48 21,091,545.80
435030000000MINISTRY OF EMPOYMENT & ECONOMIC
EMPOWERMENT (MEGE) 5,575,542.63 5,575,542.63 5,399,085.18 4,837,543.66 4,837,543.66 4,660,361.32 30,885,619.08
SUB TOTAL (3) 368,305,354.42 361,775,015.20 362,961,760.30 360,394,846.00 355,565,285.78 350,724,490.45 2,159,726,752.15
ECONOMIC SECTOR

REPORT OF THE AUDITOR-GENERAL OF RIVERS STATE ON THE 2020 FINANCIAL STATEMENTS
46
421000000000 MINISTRY OF JUSTICE (MOJ) 56,878,685.57 56,525,409.29 55,478,680.57 53,361,746.97 54,001,263.08 52,686,683.34 328,932,468.82
426000000000 JUDICIARY (JUD) 99,406,649.21 99,630,572.38 99,436,672.92 99,098,423.89 98,939,488.60 98,293,975.43 594,805,782.43
426010000000 CUSTOMARY COURT OF APPEAL (CCA) 45,610,549.70 46,678,494.94 46,299,849.46 46,029,046.97 46,668,590.89 45,917,633.71 277,204,165.67
427000000000 JUDICIAL SERVICE COMMISSION (JSC) 797,238.70 797,238.70 797,238.70 797,238.70 797,238.70 797,238.70 4,783,432.20
SUB TOTAL (4) 202,693,123.18 203,631,715.31 202,012,441.65 199,286,456.53 200,406,581.27 197,695,531.18 1,205,725,849.12
GRAND TOTAL (MAINSTREAM) 5,981,201,673.26 5,922,016,163.37 5,887,710,615.11 5,846,196,779.43 5,872,180,202.28 5,857,024,214.65 35,366,329,648.10
-
413070000000 RIVERS STATE INDEPENDENT ELECTORAL
COMMISSION (RSIEC) 5,315,469.57 5,315,469.57 5,315,469.57 5,315,469.57 5,315,469.57 5,315,469.57 31,892,817.42
423000000000 AUDITOR-GENERAL (STATE) 561,541.52 561,541.52 561,541.52 561,541.52 561,541.52 561,541.52 3,369,249.12
423010000000 AUDITOR-GENERAL (LG) 590,607.73 590,607.73 590,607.73 590,607.73 590,607.73 590,607.73 3,543,646.38
424000000000 CIVIL SERVICE COMMISSION (CSC) 2,865,840.02 2,865,840.02 2,865,840.02 2,865,840.02 2,865,840.02 2,865,840.02 17,195,040.12
425000000000 LOCAL GOVERNMENT SERVICE COMMISSION
(LGSC) 3,543,646.38 3,543,646.38 3,543,646.38 3,543,646.38 3,543,646.38 - 17,718,231.90
435010000000RIVERS STATE HOUSE OF ASSEMBLY SERVICE
COMMISSION (RVHASC) 2,275,232.28 2,275,232.28 2,275,232.28 - - 5,486,079.14 12,311,775.98
426000000000 JUDICIARY (JUD) 4,903,939.75 4,903,939.75 4,903,939.75 4,903,939.75 4,903,939.75 4,903,939.75 29,423,638.50
426010000000 CUSTOMARY COURT OF APPEAL (CCA) 1,118,578.00 1,118,578.00 1,118,578.00 1,118,578.00 1,118,578.00 1,118,578.00 6,711,468.00
427000000000 JUDICIAL SERVICE COMMISSION (JSC) 3,042,521.43 3,042,521.43 3,042,521.43 3,042,521.43 3,042,521.43 1,968,730.94 17,181,338.09
SUB TOTAL (5) 24,217,376.68 24,217,376.68 24,217,376.68 21,942,144.40 21,942,144.40 22,810,786.67 139,347,205.51
GRAND TOTAL 6,005,419,049.94 5,946,233,540.05 5,911,927,991.79 5,868,138,923.83 5,894,122,346.68 5,879,835,001.32 35,505,676,853.61
RVSG COUNTERPART FUNDING (PENSION) - - - - - - -
LAW AND JUSTICE SECTOR
ADD CRFC SALARIES

REPORT OF THE AUDITOR-GENERAL OF RIVERS STATE ON THE 2020 FINANCIAL STATEMENTS
47
HEAD MDAS JULY AUG. SEPT. OCT. NOV. DEC. TOTAL
412000000000 GOVERNMENT HOUSE (GH) 18,584,711.31 17,417,346.48 18,803,553.09 18,337,805.26 18,050,491.04 17,930,049.80 109,123,956.98
412010000000 OFFICE OF THE DEPUTY GOVERNOR (ODG) 3,704,566.16 3,639,475.96 3,757,475.96 3,642,475.96 3,754,475.96 3,698,475.96 22,196,945.96
412020100000 RIVERS STATE CHRISTIAN PILGRIMS WELFARE
BOARD (RSCPWB) 374,738.37 374,738.37 528,834.38 528,834.38 528,834.38 528,834.38 2,864,814.26
412020200000 RIVERS STATE MUSLIM PILGRIMS WELFARE
BOARD (RSMPWB) 275,590.07 275,590.07 275,590.07 275,590.07 275,590.07 275,590.07 1,653,540.42
413000000000 SECRETARY TO GOVERNMENT (SSG) 16,804,319.42 17,111,601.07 16,226,949.47 18,962,400.37 16,337,113.75 15,953,242.72 101,395,626.80
413010000000 HEAD OF SERVICE (HOS) 10,189,813.31 10,387,868.22 10,558,156.09 10,410,335.16 10,213,473.48 10,208,473.48 61,968,119.74
413020000000 RIVERS STATE LIAISON OFFICE - ABUJA 1,855,609.14 1,910,759.01 1,910,759.01 1,910,759.01 1,910,759.01 1,910,759.01 11,409,404.19
413030000000 RIVERS STATE LIAISON OFFICE - LAGOS 2,203,979.58 2,167,775.58 2,167,775.58 2,167,775.58 2,167,775.58 2,167,775.58 13,042,857.48
413040000000 ESTABLISHMENT, TRAINING & PENSION BUREAU 6,588,035.53 6,529,850.95 6,553,558.56 6,535,045.72 6,535,045.72 6,451,711.21 39,193,247.69
413050000000 R/S PARASTATALS PENSION BOARD 1,266,711.66 1,264,711.66 1,266,711.66 1,268,711.66 1,266,711.66 1,266,711.66 7,600,269.96
413070000000 RIVERS STATE INDEPENDENT ELECTORAL
COMMISSION 14,247,876.89 12,838,484.65 12,838,484.65 12,729,422.68 7,433,953.11 7,423,953.11 67,512,175.09
413120000000 URBAN BEAUTIFICATION, PARKS & GARDENS 7,696,614.25 7,604,639.25 7,435,754.93 7,572,959.81 7,155,841.81 7,063,866.81 44,529,676.86
413130000000 INFORMATION COMMUNICATION &
TECHNOLOGY DEPARTMENT (ICT) 3,183,205.89 3,171,205.89 3,195,205.89 3,183,205.89 2,890,049.58 2,900,602.98 18,523,476.12
413160000000 STATE ECONOMIC ADVISORY COUNCIL 132,017.18 132,017.18 132,017.18 132,017.18 132,017.18 132,017.18 792,103.08
420000000000 MINISTRY OF INFORMATION &
COMMUNICATIONS (MOI) 16,977,860.67 17,130,801.75 14,436,853.79 14,393,853.79 18,222,072.43 17,222,072.43 98,383,514.86
423000000000 AUDITOR-GENERAL (STATE) 7,630,881.66 7,624,631.16 7,624,631.16 7,520,253.99 7,398,759.94 7,398,759.94 45,197,917.85
423010000000 AUDITOR-GENERAL (LG) 5,099,652.40 5,097,752.40 5,097,752.40 5,097,752.40 5,097,752.40 4,912,941.47 30,403,603.47
424000000000 CIVIL SERVICE COMMISSION (CSC) 5,432,368.00 7,740,726.44 8,164,863.13 8,211,489.93 8,508,489.93 8,357,489.93 46,415,427.36
425000000000 LOCAL GOVERNMENT SERVICE COMMISSION
(LGSC) 230,980.80 230,980.80 230,980.80 230,980.80 230,980.80 230,980.80 1,385,884.80
432000000000 MINISTRY OF SPECIAL DUTIES/EMERGENCY
(MSD) 10,664,095.20 11,778,453.01 11,239,026.19 11,273,293.32 11,184,540.79 11,192,728.99 67,332,137.50
EMERGENCY RELIEF & FIRE SERVICE 1,318,739.07 1,427,123.55 1,313,839.07 1,313,839.07 1,313,839.07 1,313,839.07 8,001,218.90
435000000000 RIVERS STATE HOUSE OF ASSEMBLY (RVHA) 33,520,316.61 32,635,762.70 33,518,316.61 32,682,539.29 32,665,239.29 32,665,239.29 197,687,413.79
435010000000RIVERS STATE HOUSE OF ASSEMBLY SERVICE
COMMISSION (RVHASC) - - - - - - -
MINISTRY OF SPECIAL SERVICES 2,086,209.97 1,308,449.76 1,308,449.76 1,308,449.76 1,308,449.76 1,308,449.76 8,628,458.77
SUB TOTAL (1) 170,068,893.14 169,800,745.91 168,585,539.43 169,689,791.08 164,582,256.74 162,514,565.63 1,005,241,791.93
SUMMARY OF PERSONNEL EMOLUMENT
FOR THE PERIOD JULY - DECEMBER 2020
ADMINISTRATIVE SECTOR

REPORT OF THE AUDITOR-GENERAL OF RIVERS STATE ON THE 2020 FINANCIAL STATEMENTS
48
412020000000 MINISTRY OF SOCIAL WELFARE &
REHABILITATION (MSWR) 18,866,605.71 19,016,611.90 19,143,909.87 19,227,197.44 19,183,859.62 19,029,763.60 114,467,948.14
413180000000 R/S WASTE MANAGEMNT AGENCY 23,245,191.03 22,530,366.05 23,622,487.60 22,996,640.49 22,848,022.19 22,779,118.07 138,021,825.43
417000000000 MINISTRY OF EDUCATION (MOED) 43,462,212.48 43,603,642.13 43,480,691.70 43,245,481.91 42,606,722.66 42,765,773.63 259,164,524.51
417010000000 RIVERS STATE SCHOLARSHIP BOARD 1,063,073.68 1,062,073.68 1,062,073.68 1,057,073.68 1,067,073.68 1,062,073.68 6,373,442.08
417020000000 RIVERS STATE UNIVERSITY OF SCIENCE &
TECHNOLOGY 798,271,655.00 806,497,529.30 806,691,847.20 936,836,974.90 878,722,615.50 943,239,246.00 5,170,259,867.90
417030000000 PORT HARCOURT POLYTECHNIC 192,102,031.10 192,829,883.60 192,742,628.60 192,414,373.70 192,289,607.80 191,495,990.00 1,153,874,514.80
417040000000 RIVERS STATE LIBRARY BOARD 2,377,977.21 2,373,977.21 2,373,977.21 2,387,792.02 2,387,792.02 2,387,792.02 14,289,307.69
417050000000 RIVERS STATE POLYTECHNIC - BORI 309,239,476.20 307,870,492.70 307,864,631.40 307,857,408.60 307,289,465.10 307,308,889.20 1,847,430,363.20
417060000000 IGNATIUS AJURU UNIVERSITY OF EDUCATION 380,770,409.50 379,849,670.30 382,314,835.70 381,165,714.70 378,190,758.00 379,638,364.20 2,281,929,752.40
417070000000 RIVERS STATE POST PRIMARY SCHOOLS BOARD
(HQ) 847,793,993.46 843,568,967.80 842,214,909.04 832,879,822.31 828,976,049.32 820,037,369.37 5,015,471,111.30
417090000000 RIVERS STATE AGENCY FOR ADULT/NON
FORMAL EDUCATION 4,084,108.39 4,080,908.39 4,080,908.39 4,080,908.39 3,976,531.22 3,976,531.22 24,279,896.00
417100000000 UNIVERSAL BASIC EDUCATION BOARD 1,668,508,813.71 1,664,906,718.30 1,663,501,731.82 1,641,140,443.59 1,635,092,864.27 1,625,150,966.71 9,898,301,538.40
419000000000 MINISTRY OF HEALTH (MOH) 136,965,857.50 141,908,665.03 141,889,824.99 101,040,384.44 100,255,511.05 100,841,763.53 722,902,006.54
419010000000 HOSPITAL MANAGEMENT BOARD (HQ) 34,627,689.82 39,729,545.66 38,990,945.92 32,500,140.69 32,947,559.63 33,176,876.70 211,972,758.42
419020000000 HOSPITAL MANAGEMENT BOARD (ZONES) 129,609,739.42 161,344,758.83 158,037,491.82 186,177,916.00 145,887,968.24 145,541,372.90 926,599,247.21
419030000000RIVERS STATE UNIVERSITY TEACHING HOSPITAL
(BMSH) 208,317,712.28 161,439,493.43 159,508,746.86 129,355,908.13 132,500,729.21 128,347,460.93 919,470,050.84
419040000000 RIVERS STATE COLLEGE OF HEALTH SCIENCE &
TECHNOLOGY 69,417,369.50 69,441,804.27 73,449,680.25 73,449,680.25 76,467,163.77 75,611,381.00 437,837,079.04
419050000000 PRIMARY HEALTH CARE MANAGEMENT BOARD 140,314,866.69 141,544,148.72 140,563,155.07 132,625,014.26 134,338,363.72 133,819,602.57 823,205,151.03
428000000000 MINISTRY OF WOMEN AFFAIRS (MOWA) 5,643,083.59 5,590,428.73 5,563,188.72 5,613,211.69 5,717,138.38 5,577,581.52 33,704,632.63
429000000000 MINISTRY OF SPORTS (MOS) 4,646,183.63 4,856,953.39 4,548,306.20 4,693,366.30 4,421,971.05 4,322,423.44 27,489,204.01
429010000000 RIVERS STATE STADIA AUTHORITY 4,943,143.39 4,943,143.39 5,786,855.30 4,789,047.38 4,957,931.69 4,957,931.69 30,378,052.84
429020000000 RIVERS STATE SPORT COUNCIL 16,963,909.49 17,231,766.64 17,231,766.64 17,231,766.64 17,231,766.64 17,185,779.14 103,076,755.19
429030000000 RIVERS STATE SPORT INSTITUTE - ISAKA 3,609,244.61 3,600,499.70 3,600,499.71 3,530,617.54 3,530,617.54 3,530,617.54 21,402,096.64
430000000000 MINISTRY OF ENVIRONMENT (MOEN) 50,014,215.10 49,589,864.79 49,601,864.79 48,777,708.69 48,798,557.51 50,668,153.15 297,450,364.03
433000000000 MINISTRY OF LOCAL GOVERNMENT AFFAIRS
(MLGA) 9,717,352.75 9,290,284.72 9,309,341.71 9,395,202.05 9,102,429.76 9,031,207.10 55,845,818.09
433010000000 MINISTRY OF CHIEFTAINCY & COMMUNITY
AFFAIRS (MCCA) 8,310,477.49 8,356,743.46 8,616,618.83 8,323,917.33 8,519,085.97 8,243,346.89 50,370,189.97
435020000000 MINISTRY OF YOUTH DEVELOPMENT (MYD) 5,591,348.69 5,553,087.69 5,586,087.69 5,890,173.79 5,806,737.40 5,759,926.01 34,187,361.27
GARDEN CITY RADIO 1,354,901.60 1,354,901.60 1,354,901.60 1,354,901.60 1,354,901.60 1,254,466.53 8,028,974.53
SUB TOTAL (2) 5,119,832,643.02 5,113,966,931.41 5,112,733,908.31 5,150,038,788.51 5,044,469,794.54 5,086,741,768.34 30,627,783,834.13
SOCIAL SECTOR
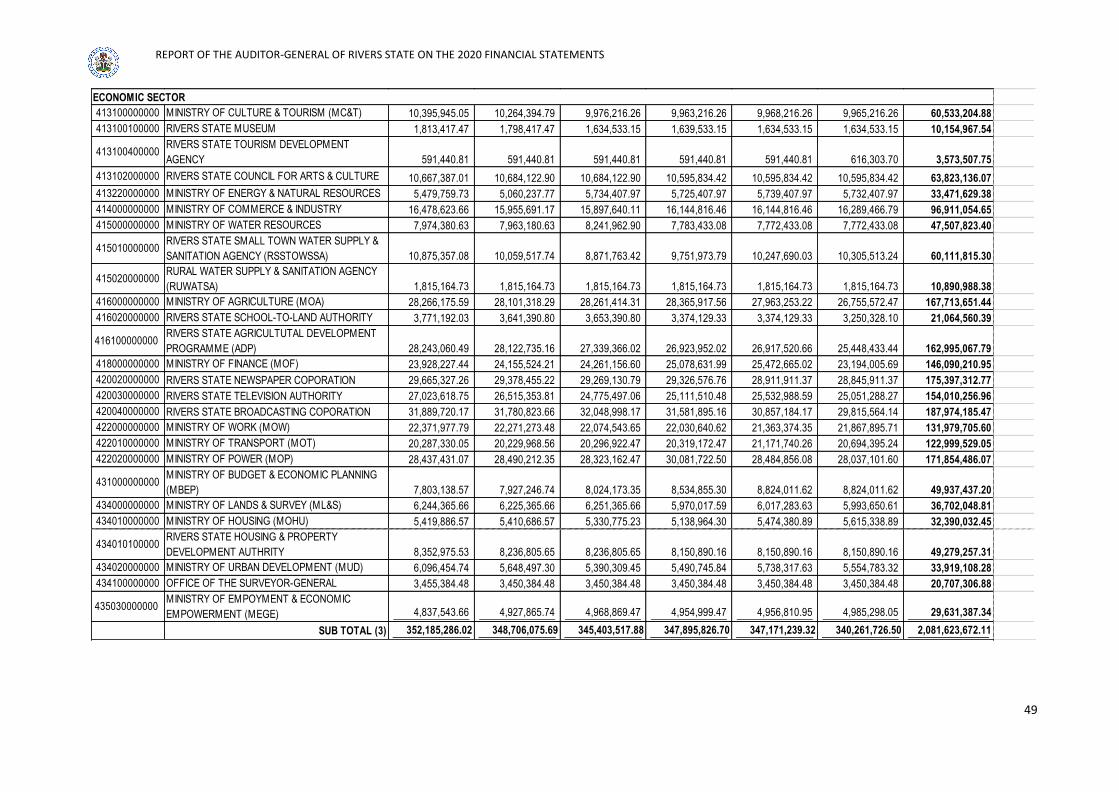
REPORT OF THE AUDITOR-GENERAL OF RIVERS STATE ON THE 2020 FINANCIAL STATEMENTS
49
413100000000 MINISTRY OF CULTURE & TOURISM (MC&T) 10,395,945.05 10,264,394.79 9,976,216.26 9,963,216.26 9,968,216.26 9,965,216.26 60,533,204.88
413100100000 RIVERS STATE MUSEUM 1,813,417.47 1,798,417.47 1,634,533.15 1,639,533.15 1,634,533.15 1,634,533.15 10,154,967.54
413100400000 RIVERS STATE TOURISM DEVELOPMENT
AGENCY 591,440.81 591,440.81 591,440.81 591,440.81 591,440.81 616,303.70 3,573,507.75
413102000000 RIVERS STATE COUNCIL FOR ARTS & CULTURE 10,667,387.01 10,684,122.90 10,684,122.90 10,595,834.42 10,595,834.42 10,595,834.42 63,823,136.07
413220000000 MINISTRY OF ENERGY & NATURAL RESOURCES 5,479,759.73 5,060,237.77 5,734,407.97 5,725,407.97 5,739,407.97 5,732,407.97 33,471,629.38
414000000000 MINISTRY OF COMMERCE & INDUSTRY 16,478,623.66 15,955,691.17 15,897,640.11 16,144,816.46 16,144,816.46 16,289,466.79 96,911,054.65
415000000000 MINISTRY OF WATER RESOURCES 7,974,380.63 7,963,180.63 8,241,962.90 7,783,433.08 7,772,433.08 7,772,433.08 47,507,823.40
415010000000 RIVERS STATE SMALL TOWN WATER SUPPLY &
SANITATION AGENCY (RSSTOWSSA) 10,875,357.08 10,059,517.74 8,871,763.42 9,751,973.79 10,247,690.03 10,305,513.24 60,111,815.30
415020000000 RURAL WATER SUPPLY & SANITATION AGENCY
(RUWATSA) 1,815,164.73 1,815,164.73 1,815,164.73 1,815,164.73 1,815,164.73 1,815,164.73 10,890,988.38
416000000000 MINISTRY OF AGRICULTURE (MOA) 28,266,175.59 28,101,318.29 28,261,414.31 28,365,917.56 27,963,253.22 26,755,572.47 167,713,651.44
416020000000 RIVERS STATE SCHOOL-TO-LAND AUTHORITY 3,771,192.03 3,641,390.80 3,653,390.80 3,374,129.33 3,374,129.33 3,250,328.10 21,064,560.39
416100000000RIVERS STATE AGRICULTUTAL DEVELOPMENT
PROGRAMME (ADP) 28,243,060.49 28,122,735.16 27,339,366.02 26,923,952.02 26,917,520.66 25,448,433.44 162,995,067.79
418000000000 MINISTRY OF FINANCE (MOF) 23,928,227.44 24,155,524.21 24,261,156.60 25,078,631.99 25,472,665.02 23,194,005.69 146,090,210.95
420020000000 RIVERS STATE NEWSPAPER COPORATION 29,665,327.26 29,378,455.22 29,269,130.79 29,326,576.76 28,911,911.37 28,845,911.37 175,397,312.77
420030000000 RIVERS STATE TELEVISION AUTHORITY 27,023,618.75 26,515,353.81 24,775,497.06 25,111,510.48 25,532,988.59 25,051,288.27 154,010,256.96
420040000000 RIVERS STATE BROADCASTING COPORATION 31,889,720.17 31,780,823.66 32,048,998.17 31,581,895.16 30,857,184.17 29,815,564.14 187,974,185.47
422000000000 MINISTRY OF WORK (MOW) 22,371,977.79 22,271,273.48 22,074,543.65 22,030,640.62 21,363,374.35 21,867,895.71 131,979,705.60
422010000000 MINISTRY OF TRANSPORT (MOT) 20,287,330.05 20,229,968.56 20,296,922.47 20,319,172.47 21,171,740.26 20,694,395.24 122,999,529.05
422020000000 MINISTRY OF POWER (MOP) 28,437,431.07 28,490,212.35 28,323,162.47 30,081,722.50 28,484,856.08 28,037,101.60 171,854,486.07
431000000000 MINISTRY OF BUDGET & ECONOMIC PLANNING
(MBEP) 7,803,138.57 7,927,246.74 8,024,173.35 8,534,855.30 8,824,011.62 8,824,011.62 49,937,437.20
434000000000 MINISTRY OF LANDS & SURVEY (ML&S) 6,244,365.66 6,225,365.66 6,251,365.66 5,970,017.59 6,017,283.63 5,993,650.61 36,702,048.81
434010000000 MINISTRY OF HOUSING (MOHU) 5,419,886.57 5,410,686.57 5,330,775.23 5,138,964.30 5,474,380.89 5,615,338.89 32,390,032.45
434010100000 RIVERS STATE HOUSING & PROPERTY
DEVELOPMENT AUTHRITY 8,352,975.53 8,236,805.65 8,236,805.65 8,150,890.16 8,150,890.16 8,150,890.16 49,279,257.31
434020000000 MINISTRY OF URBAN DEVELOPMENT (MUD) 6,096,454.74 5,648,497.30 5,390,309.45 5,490,745.84 5,738,317.63 5,554,783.32 33,919,108.28
434100000000 OFFICE OF THE SURVEYOR-GENERAL 3,455,384.48 3,450,384.48 3,450,384.48 3,450,384.48 3,450,384.48 3,450,384.48 20,707,306.88
435030000000MINISTRY OF EMPOYMENT & ECONOMIC
EMPOWERMENT (MEGE) 4,837,543.66 4,927,865.74 4,968,869.47 4,954,999.47 4,956,810.95 4,985,298.05 29,631,387.34
SUB TOTAL (3) 352,185,286.02 348,706,075.69 345,403,517.88 347,895,826.70 347,171,239.32 340,261,726.50 2,081,623,672.11
ECONOMIC SECTOR

REPORT OF THE AUDITOR-GENERAL OF RIVERS STATE ON THE 2020 FINANCIAL STATEMENTS
50
421000000000 MINISTRY OF JUSTICE (MOJ) 53,263,007.26 57,118,131.13 54,848,145.12 55,649,782.92 55,667,782.92 55,509,248.24 332,056,097.59
426000000000 JUDICIARY (JUD) 97,833,142.13 96,441,926.65 95,877,629.47 95,922,857.75 95,776,224.98 96,412,030.64 578,263,811.62
426010000000 CUSTOMARY COURT OF APPEAL (CCA) 47,732,253.06 48,637,232.87 45,933,435.42 48,114,923.45 47,802,293.87 47,498,172.49 285,718,311.16
427000000000 JUDICIAL SERVICE COMMISSION (JSC) 1,501,892.29 1,495,732.29 2,548,950.70 644,394.50 644,394.50 644,394.50 7,479,758.78
SUB TOTAL (4) 200,330,294.74 203,693,022.94 199,208,160.71 200,331,958.62 199,890,696.27 200,063,845.87 1,203,517,979.15
GRAND TOTAL (MAINSTREAM) 5,842,417,116.92 5,836,166,775.95 5,825,931,126.33 5,867,956,364.91 5,756,113,986.87 5,789,581,906.34 34,918,167,277.32
413070000000 RIVERS STATE INDEPENDENT ELECTORAL
COMMISSION (RSIEC) 5,315,469.57 - - - 5,315,469.57 5,315,469.57 15,946,408.71
423000000000 AUDITOR-GENERAL (STATE) 561,541.52 561,541.52 561,541.52 561,541.52 561,541.52 561,541.52 3,369,249.12
423010000000 AUDITOR-GENERAL (LG) 590,607.73 590,607.73 590,607.73 590,607.73 590,607.73 590,607.73 3,543,646.38
424000000000 CIVIL SERVICE COMMISSION (CSC) 2,865,840.02 - - - - - 2,865,840.02
425000000000 LOCAL GOVERNMENT SERVICE COMMISSION
(LGSC) - - - - - - -
435010000000RIVERS STATE HOUSE OF ASSEMBLY SERVICE
COMMISSION (RVHASC) - - - - - - -
426000000000 JUDICIARY (JUD) 4,903,939.75 4,903,939.75 4,903,939.75 4,903,939.75 4,903,939.75 4,903,939.75 29,423,638.50
426010000000 CUSTOMARY COURT OF APPEAL (CCA) 1,118,578.00 1,118,578.00 1,118,578.00 1,118,578.00 1,118,578.00 1,118,578.00 6,711,468.00
427000000000 JUDICIAL SERVICE COMMISSION (JSC) - - 3,042,521.43 3,042,521.43 3,042,521.43 3,042,521.43 12,170,085.72
15,355,976.59 7,174,667.00 10,217,188.43 10,217,188.43 15,532,658.00 15,532,658.00 74,030,336.45
GRAND TOTAL 5,857,773,093.51 5,843,341,442.95 5,836,148,314.76 5,878,173,553.34 5,771,646,644.87 5,805,114,564.34 34,992,197,613.77
RVSG COUNTERPART FUNDING (PENSION) - - - - - - -
Note 5.0 are main supporting reference of Personnel cost which includes the salaries of CRF charges for the year ended December 2020
ADD CRFC SALARIES
LAW AND JUSTICE SECTOR

REPORT OF THE AUDITOR-GENERAL OF RIVERS STATE ON THE 2020 FINANCIAL STATEMENTS
51
Sup. Note DESCRIPTION JAN FEB MARCH APRIL MAY JUNE JULY AUG SEPT OCT NOV DEC TOTAL (N)
5.1
RVSG Contribution (Pension
Scheme) -
Sub Total (1) - - - - - - - - - - - - -
5.2Pensions (Parastatals) 131,069,890.00 131,069,890.00 131,069,890.00 131,069,890.00 131,069,890.00 148,290,699.00 147,185,545.00 148,220,490.00 147,126,387.00 147,126,387.00 147,126,387.00 147,126,387.00 1,687,551,732.00
5.3Death Benefit - - - - - - - - - - - -
-
5.4Monthly Pensions
(Mainstream) 1,417,762,899.85 1,416,909,196.92 1,415,314,555.87 1,414,624,624.05 1,413,973,610.53 1,559,963,932.85 1,559,546,339.66 1,556,936,325.68 1,556,926,384.20 1,552,468,547.09 1,551,366,305.92 1,546,671,269.21 17,962,463,991.83
5.5 Gratuity - - - - - - - - - - - - -
Sub Total (2) 1,548,832,789.85 1,547,979,086.92 1,546,384,445.87 1,545,694,514.05 1,545,043,500.53 1,708,254,631.85 1,706,731,884.66 1,705,156,815.68 1,704,052,771.20 1,699,594,934.09 1,698,492,692.92 1,693,797,656.21 19,650,015,723.83
Utility Charges - 9,661,968.00 9,661,968.00 9,661,968.00 9,661,968.00 9,661,968.00 9,661,968.00 9,661,968.00 9,661,968.00 9,661,968.00 9,661,968.00 9,661,968.00 106,281,648.00
Bank Charges (IGR) 26,805,753.88 33,052,748.40 17,832,601.00 22,815,340.91 16,873,842.90 16,978,530.34 21,146,548.46 24,182,384.76 23,384,499.78 23,799,212.46 18,878,422.56 25,233,997.72 270,983,883.17
Bank Charges (State A/Cs) 44,817,281.11 53,428,417.95 83,052,978.48 50,267,976.82 59,223,360.88 82,800,384.28 63,921,660.64 86,280,668.14 171,178,562.25 175,548,675.12 150,593,420.33 131,670,555.11 1,152,783,941.11
FGN(Charges) 538,084,182.00 536,877,313.00 535,659,246.00 479,811,943.00 532,058,946.00 (160,876,276.00) 268,163,805.00 267,688,370.00 267,207,060.00 266,719,802.00 266,226,522.00 265,727,146.00 4,063,348,059.00
Commercial Bank 570,687,459.00 311,217,358.00 303,647,911.00 295,977,539.00 288,204,895.00 280,328,616.00 272,347,320.00 457,759,607.00 459,396,183.00 438,129,538.00 432,955,897.00 394,856,115.00 4,505,508,438.00
External Charges 15,701,026.32 15,701,026.32 19,619,755.71 19,619,755.71 19,619,755.71 19,619,755.71 19,619,755.71 19,619,755.71 15,898,734.31 15,898,734.31 15,898,734.31 15,898,734.31 212,715,524.14
Sub Total (3) 1,196,095,702.31 959,938,831.67 969,474,460.19 878,154,523.44 925,642,768.49 248,512,978.33 654,861,057.81 865,192,753.61 946,727,007.34 929,757,929.89 445,360,332.89 432,293,666.83 10,311,621,493.42
Grand Total (1+2+3) 2,744,928,492.16 2,507,917,918.59 2,515,858,906.06 2,423,849,037.49 2,470,686,269.02 1,956,767,610.18 2,361,592,942.47 2,570,349,569.29 2,650,779,778.54 2,629,352,863.98 2,143,853,025.81 2,126,091,323.04 29,961,637,217.25
Note 5.1 - 5.5 and 6.1 are main supporting references of Pension payments in Statement No. 1 and Statement No. 3 (Cashflow Statement and Statement of Consolidated Revenue Fund)
SUMMARY OF CRFC FOR THE PERIOD JANUARY - DECEMBER 2020
SOCIAL BENEFIT
6.1
CHARGES

REPORT OF THE AUDITOR-GENERAL OF RIVERS STATE ON THE 2020 FINANCIAL STATEMENTS
52
NOTE: 6.0
MDAs DES. TOTAL
JAN FEB MAR APR MAY JUN JUL AUG SEP OCT NOV DEC
GOVT. HOUSE Gross 400,000,000.00 400,000,000.00 400,000,000.00 400,000,000.00 400,000,000.00 400,000,000.00 400,000,000.00 400,000,000.00 400,000,000.00 400,000,000.00 400,000,000.00 400,000,000.00 4,800,000,000.00
Utility - - - - - - - - - - - - -
Net 400,000,000.00 400,000,000.00 400,000,000.00 400,000,000.00 400,000,000.00 400,000,000.00 400,000,000.00 400,000,000.00 400,000,000.00 400,000,000.00 400,000,000.00 400,000,000.00 4,800,000,000.00
SSG Gross 38,474,682.00 38,474,682.00 38,474,682.00 38,474,682.00 38,474,682.00 38,474,682.00 24,753,734.00 24,753,734.00 24,753,734.00 24,753,734.00 24,753,734.00 24,753,734.00 379,370,496.00
Utility - 753,734.00 753,734.00 753,734.00 753,734.00 753,734.00 753,734.00 753,734.00 753,734.00 753,734.00 753,734.00 753,734.00 8,291,074.00
Net 38,474,682.00 37,720,948.00 37,720,948.00 37,720,948.00 37,720,948.00 37,720,948.00 24,000,000.00 24,000,000.00 24,000,000.00 24,000,000.00 24,000,000.00 24,000,000.00 371,079,422.00
HOS Gross 8,697,316.00 8,697,316.00 8,697,316.00 8,697,316.00 8,697,316.00 8,697,316.00 8,697,316.00 8,697,316.00 8,697,316.00 8,697,316.00 8,697,316.00 8,697,316.00 104,367,792.00
Utility - 274,732.00 274,732.00 274,732.00 274,732.00 274,732.00 274,732.00 274,732.00 274,732.00 274,732.00 274,732.00 274,732.00 3,022,052.00
Net 8,697,316.00 8,422,584.00 8,422,584.00 8,422,584.00 8,422,584.00 8,422,584.00 8,422,584.00 8,422,584.00 8,422,584.00 8,422,584.00 8,422,584.00 8,422,584.00 101,345,740.00
LIAISON - LAGOS Gross 2,400,000.00 2,400,000.00 2,400,000.00 2,400,000.00 2,400,000.00 2,400,000.00 2,400,000.00 2,400,000.00 2,400,000.00 2,400,000.00 2,400,000.00 2,400,000.00 28,800,000.00
Utility - - - - - - - - - - - - -
Net 2,400,000.00 2,400,000.00 2,400,000.00 2,400,000.00 2,400,000.00 2,400,000.00 2,400,000.00 2,400,000.00 2,400,000.00 2,400,000.00 2,400,000.00 2,400,000.00 28,800,000.00
LIAISON - ABUJA Gross 3,000,000.00 3,000,000.00 3,000,000.00 3,000,000.00 3,000,000.00 3,000,000.00 3,000,000.00 3,000,000.00 3,000,000.00 3,000,000.00 3,000,000.00 3,000,000.00 36,000,000.00
Utility - - - - - - - - - - - - -
Net 3,000,000.00 3,000,000.00 3,000,000.00 3,000,000.00 3,000,000.00 3,000,000.00 3,000,000.00 3,000,000.00 3,000,000.00 3,000,000.00 3,000,000.00 3,000,000.00 36,000,000.00
MIN. OF SPECIAL DU. Gross 1,990,046.00 1,990,046.00 1,990,046.00 1,990,046.00 1,990,046.00 1,990,046.00 1,990,046.00 1,990,046.00 1,990,046.00 1,990,046.00 1,990,046.00 1,990,046.00 23,880,552.00
Utility - 199,005.00 199,005.00 199,005.00 199,005.00 199,005.00 199,005.00 199,005.00 199,005.00 199,005.00 199,005.00 199,005.00 2,189,055.00
Net 1,990,046.00 1,791,041.00 1,791,041.00 1,791,041.00 1,791,041.00 1,791,041.00 1,791,041.00 1,791,041.00 1,791,041.00 1,791,041.00 1,791,041.00 1,791,041.00 21,691,497.00
ESTABS. Gross 835,000.00 835,000.00 835,000.00 835,000.00 835,000.00 835,000.00 835,000.00 835,000.00 835,000.00 835,000.00 835,000.00 835,000.00 10,020,000.00
Utility - 83,500.00 83,500.00 83,500.00 83,500.00 83,500.00 83,500.00 83,500.00 83,500.00 83,500.00 83,500.00 83,500.00 918,500.00
Net 835,000.00 751,500.00 751,500.00 751,500.00 751,500.00 751,500.00 751,500.00 751,500.00 751,500.00 751,500.00 751,500.00 751,500.00 9,101,500.00
PENSION BOARD Gross 1,000,000.00 1,000,000.00 1,000,000.00 1,000,000.00 1,000,000.00 1,000,000.00 1,000,000.00 1,000,000.00 1,000,000.00 1,000,000.00 1,000,000.00 1,000,000.00 12,000,000.00
Utility - - - - - - - - - - - - -
Net 1,000,000.00 1,000,000.00 1,000,000.00 1,000,000.00 1,000,000.00 1,000,000.00 1,000,000.00 1,000,000.00 1,000,000.00 1,000,000.00 1,000,000.00 1,000,000.00 12,000,000.00
RSIEC Gross 2,500,000.00 2,500,000.00 2,500,000.00 2,500,000.00 2,500,000.00 2,500,000.00 2,500,000.00 2,500,000.00 2,500,000.00 2,500,000.00 2,500,000.00 2,500,000.00 30,000,000.00
Utility - - - - - - - - - - - - -
Net 2,500,000.00 2,500,000.00 2,500,000.00 2,500,000.00 2,500,000.00 2,500,000.00 2,500,000.00 2,500,000.00 2,500,000.00 2,500,000.00 2,500,000.00 2,500,000.00 30,000,000.00
ICT Gross 900,000.00 900,000.00 900,000.00 900,000.00 900,000.00 900,000.00 900,000.00 900,000.00 900,000.00 900,000.00 900,000.00 900,000.00 10,800,000.00
Utility - - - - - - - - - - - - -
Net 900,000.00 900,000.00 900,000.00 900,000.00 900,000.00 900,000.00 900,000.00 900,000.00 900,000.00 900,000.00 900,000.00 900,000.00 10,800,000.00
STATE SERVICOM Gross 300,000.00 300,000.00 300,000.00 300,000.00 300,000.00 300,000.00 300,000.00 300,000.00 300,000.00 300,000.00 300,000.00 300,000.00 3,600,000.00
Utility - - - - - - - - - - - - -
Net 300,000.00 300,000.00 300,000.00 300,000.00 300,000.00 300,000.00 300,000.00 300,000.00 300,000.00 300,000.00 300,000.00 300,000.00 3,600,000.00
SUMMARY OF OVERHEAD FOR THE PERIOD JANUARY - DECEMBER 2020MONTHS
ADMINISTRATIVE SECTOR

REPORT OF THE AUDITOR-GENERAL OF RIVERS STATE ON THE 2020 FINANCIAL STATEMENTS
53
MIN. OF INFORM. Gross 13,900,000.00 13,900,000.00 13,900,000.00 13,900,000.00 13,900,000.00 13,900,000.00 13,900,000.00 13,900,000.00 13,900,000.00 13,900,000.00 13,900,000.00 13,900,000.00 166,800,000.00
Utility - 240,000.00 240,000.00 240,000.00 240,000.00 240,000.00 240,000.00 240,000.00 240,000.00 240,000.00 240,000.00 240,000.00 2,640,000.00
Net 13,900,000.00 13,660,000.00 13,660,000.00 13,660,000.00 13,660,000.00 13,660,000.00 13,660,000.00 13,660,000.00 13,660,000.00 13,660,000.00 13,660,000.00 13,660,000.00 164,160,000.00
GPP Gross 244,500.00 244,500.00 244,500.00 244,500.00 244,500.00 244,500.00 244,500.00 244,500.00 244,500.00 244,500.00 244,500.00 244,500.00 2,934,000.00
Utility - - - - - - - - - - - - -
Net 244,500.00 244,500.00 244,500.00 244,500.00 244,500.00 244,500.00 244,500.00 244,500.00 244,500.00 244,500.00 244,500.00 244,500.00 2,934,000.00
STATE AUDIT Gross 800,000.00 800,000.00 800,000.00 800,000.00 800,000.00 800,000.00 800,000.00 800,000.00 800,000.00 800,000.00 800,000.00 800,000.00 9,600,000.00
Utility - 80,000.00 80,000.00 80,000.00 80,000.00 80,000.00 80,000.00 80,000.00 80,000.00 80,000.00 80,000.00 80,000.00 880,000.00
Net 800,000.00 720,000.00 720,000.00 720,000.00 720,000.00 720,000.00 720,000.00 720,000.00 720,000.00 720,000.00 720,000.00 720,000.00 8,720,000.00
LG AUDIT Gross 659,000.00 659,000.00 659,000.00 659,000.00 659,000.00 659,000.00 659,000.00 659,000.00 659,000.00 659,000.00 659,000.00 659,000.00 7,908,000.00
Utility - 65,900.00 65,900.00 65,900.00 65,900.00 65,900.00 65,900.00 65,900.00 65,900.00 65,900.00 65,900.00 65,900.00 724,900.00
Net 659,000.00 593,100.00 593,100.00 593,100.00 593,100.00 593,100.00 593,100.00 593,100.00 593,100.00 593,100.00 593,100.00 593,100.00 7,183,100.00
CIVIL SER. COMM. Gross 6,000,000.00 6,000,000.00 6,000,000.00 6,000,000.00 6,000,000.00 6,000,000.00 6,000,000.00 6,000,000.00 6,000,000.00 6,000,000.00 6,000,000.00 6,000,000.00 72,000,000.00
Utility - 600,000.00 600,000.00 600,000.00 600,000.00 600,000.00 600,000.00 600,000.00 600,000.00 600,000.00 600,000.00 600,000.00 6,600,000.00
Net 6,000,000.00 5,400,000.00 5,400,000.00 5,400,000.00 5,400,000.00 5,400,000.00 5,400,000.00 5,400,000.00 5,400,000.00 5,400,000.00 5,400,000.00 5,400,000.00 65,400,000.00
LGSC Gross 428,749.00 428,749.00 428,749.00 428,749.00 428,749.00 428,749.00 428,749.00 428,749.00 428,749.00 428,749.00 428,749.00 428,749.00 5,144,988.00
Utility - 42,500.00 42,500.00 42,500.00 42,500.00 42,500.00 42,500.00 42,500.00 42,500.00 42,500.00 42,500.00 42,500.00 467,500.00
Net 428,749.00 386,249.00 386,249.00 386,249.00 386,249.00 386,249.00 386,249.00 386,249.00 386,249.00 386,249.00 386,249.00 386,249.00 4,677,488.00
RVHASC Gross 15,000,000.00 15,000,000.00 15,000,000.00 15,000,000.00 15,000,000.00 15,000,000.00 15,000,000.00 15,000,000.00 15,000,000.00 15,000,000.00 15,000,000.00 15,000,000.00 180,000,000.00
Utility - - - - - - - - - - - - -
Net 15,000,000.00 15,000,000.00 15,000,000.00 15,000,000.00 15,000,000.00 15,000,000.00 15,000,000.00 15,000,000.00 15,000,000.00 15,000,000.00 15,000,000.00 15,000,000.00 180,000,000.00
ODG Gross 24,000,000.00 24,000,000.00 24,000,000.00 - 48,000,000.00 24,000,000.00 24,000,000.00 24,000,000.00 24,000,000.00 24,000,000.00 24,000,000.00 24,000,000.00 288,000,000.00
Utility - - - - - - - - - - - - -
Net 24,000,000.00 24,000,000.00 24,000,000.00 - 48,000,000.00 24,000,000.00 24,000,000.00 24,000,000.00 24,000,000.00 24,000,000.00 24,000,000.00 24,000,000.00 288,000,000.00
HOUSE OF ASSEM. Gross 150,000,000.00 150,000,000.00 150,000,000.00 150,000,000.00 150,000,000.00 150,000,000.00 150,000,000.00 150,000,000.00 150,000,000.00 150,000,000.00 150,000,000.00 150,000,000.00 1,800,000,000.00
Utility - - - - - - - - - - - - -
Net 150,000,000.00 150,000,000.00 150,000,000.00 150,000,000.00 150,000,000.00 150,000,000.00 150,000,000.00 150,000,000.00 150,000,000.00 150,000,000.00 150,000,000.00 150,000,000.00 1,800,000,000.00
AUTO. PAYROLL Gross 900,000.00 900,000.00 900,000.00 900,000.00 900,000.00 900,000.00 900,000.00 900,000.00 900,000.00 900,000.00 900,000.00 900,000.00 10,800,000.00
Utility - - - - - - - - - - - - -
Net 900,000.00 900,000.00 900,000.00 900,000.00 900,000.00 900,000.00 900,000.00 900,000.00 900,000.00 900,000.00 900,000.00 900,000.00 10,800,000.00
BOUNDARY COMM. Gross 6,000,000.00 6,000,000.00 6,000,000.00 6,000,000.00 6,000,000.00 6,000,000.00 6,000,000.00 6,000,000.00 6,000,000.00 6,000,000.00 6,000,000.00 6,000,000.00 72,000,000.00
Utility - - - - - - - - - - - - -
Net 6,000,000.00 6,000,000.00 6,000,000.00 6,000,000.00 6,000,000.00 6,000,000.00 6,000,000.00 6,000,000.00 6,000,000.00 6,000,000.00 6,000,000.00 6,000,000.00 72,000,000.00
CHRISTIAN PILGRIM Gross 534,500.00 534,500.00 534,500.00 534,500.00 534,500.00 534,500.00 534,500.00 534,500.00 534,500.00 534,500.00 534,500.00 534,500.00 6,414,000.00
Utility - - - - - - - - - - - - -
Net 534,500.00 534,500.00 534,500.00 534,500.00 534,500.00 534,500.00 534,500.00 534,500.00 534,500.00 534,500.00 534,500.00 534,500.00 6,414,000.00
MUSLIM PILGRIM Gross 202,500.00 202,500.00 202,500.00 202,500.00 202,500.00 202,500.00 202,500.00 202,500.00 202,500.00 202,500.00 202,500.00 202,500.00 2,430,000.00
Utility - - - - - - - - - - - - -
Net 202,500.00 202,500.00 202,500.00 202,500.00 202,500.00 202,500.00 202,500.00 202,500.00 202,500.00 202,500.00 202,500.00 202,500.00 2,430,000.00
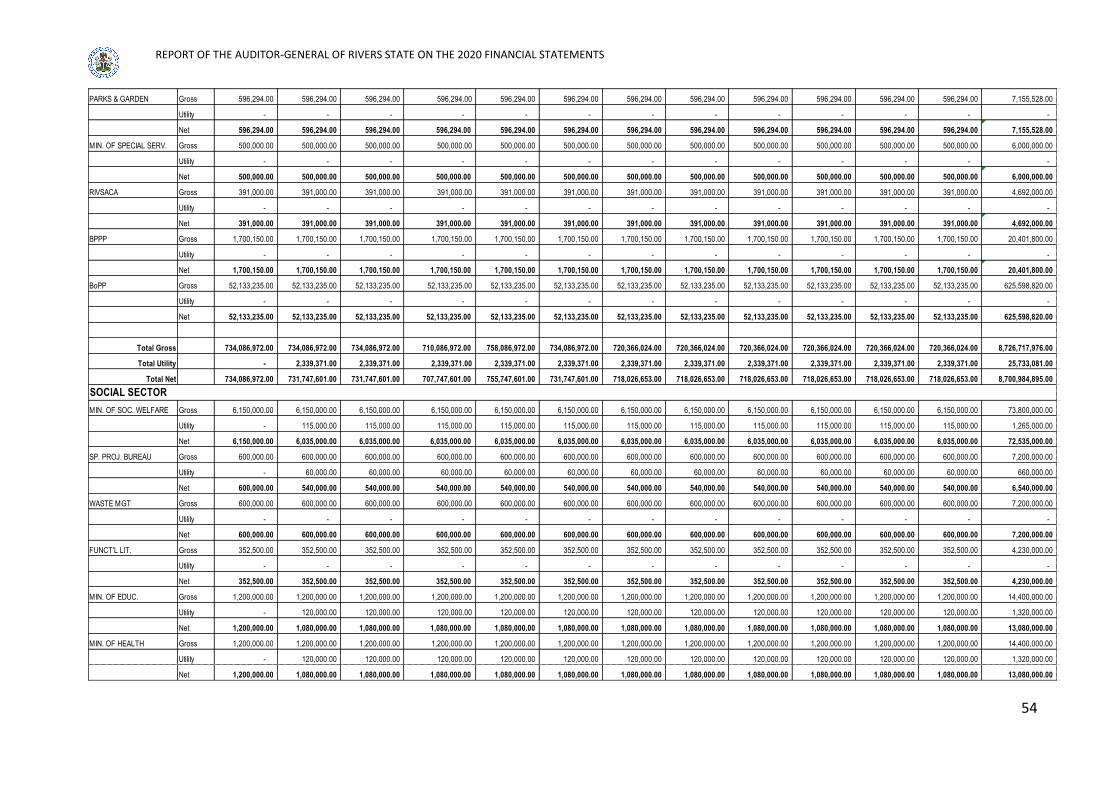
REPORT OF THE AUDITOR-GENERAL OF RIVERS STATE ON THE 2020 FINANCIAL STATEMENTS
54
PARKS & GARDEN Gross 596,294.00 596,294.00 596,294.00 596,294.00 596,294.00 596,294.00 596,294.00 596,294.00 596,294.00 596,294.00 596,294.00 596,294.00 7,155,528.00
Utility - - - - - - - - - - - - -
Net 596,294.00 596,294.00 596,294.00 596,294.00 596,294.00 596,294.00 596,294.00 596,294.00 596,294.00 596,294.00 596,294.00 596,294.00 7,155,528.00
MIN. OF SPECIAL SERV. Gross 500,000.00 500,000.00 500,000.00 500,000.00 500,000.00 500,000.00 500,000.00 500,000.00 500,000.00 500,000.00 500,000.00 500,000.00 6,000,000.00
Utility - - - - - - - - - - - - -
Net 500,000.00 500,000.00 500,000.00 500,000.00 500,000.00 500,000.00 500,000.00 500,000.00 500,000.00 500,000.00 500,000.00 500,000.00 6,000,000.00
RIVSACA Gross 391,000.00 391,000.00 391,000.00 391,000.00 391,000.00 391,000.00 391,000.00 391,000.00 391,000.00 391,000.00 391,000.00 391,000.00 4,692,000.00
Utility - - - - - - - - - - - - -
Net 391,000.00 391,000.00 391,000.00 391,000.00 391,000.00 391,000.00 391,000.00 391,000.00 391,000.00 391,000.00 391,000.00 391,000.00 4,692,000.00
BPPP Gross 1,700,150.00 1,700,150.00 1,700,150.00 1,700,150.00 1,700,150.00 1,700,150.00 1,700,150.00 1,700,150.00 1,700,150.00 1,700,150.00 1,700,150.00 1,700,150.00 20,401,800.00
Utility - - - - - - - - - - - - -
Net 1,700,150.00 1,700,150.00 1,700,150.00 1,700,150.00 1,700,150.00 1,700,150.00 1,700,150.00 1,700,150.00 1,700,150.00 1,700,150.00 1,700,150.00 1,700,150.00 20,401,800.00
BoPP Gross 52,133,235.00 52,133,235.00 52,133,235.00 52,133,235.00 52,133,235.00 52,133,235.00 52,133,235.00 52,133,235.00 52,133,235.00 52,133,235.00 52,133,235.00 52,133,235.00 625,598,820.00
Utility - - - - - - - - - - - - -
Net 52,133,235.00 52,133,235.00 52,133,235.00 52,133,235.00 52,133,235.00 52,133,235.00 52,133,235.00 52,133,235.00 52,133,235.00 52,133,235.00 52,133,235.00 52,133,235.00 625,598,820.00
Total Gross 734,086,972.00 734,086,972.00 734,086,972.00 710,086,972.00 758,086,972.00 734,086,972.00 720,366,024.00 720,366,024.00 720,366,024.00 720,366,024.00 720,366,024.00 720,366,024.00 8,726,717,976.00
Total Utility - 2,339,371.00 2,339,371.00 2,339,371.00 2,339,371.00 2,339,371.00 2,339,371.00 2,339,371.00 2,339,371.00 2,339,371.00 2,339,371.00 2,339,371.00 25,733,081.00
Total Net 734,086,972.00 731,747,601.00 731,747,601.00 707,747,601.00 755,747,601.00 731,747,601.00 718,026,653.00 718,026,653.00 718,026,653.00 718,026,653.00 718,026,653.00 718,026,653.00 8,700,984,895.00
MIN. OF SOC. WELFARE Gross 6,150,000.00 6,150,000.00 6,150,000.00 6,150,000.00 6,150,000.00 6,150,000.00 6,150,000.00 6,150,000.00 6,150,000.00 6,150,000.00 6,150,000.00 6,150,000.00 73,800,000.00
Utility - 115,000.00 115,000.00 115,000.00 115,000.00 115,000.00 115,000.00 115,000.00 115,000.00 115,000.00 115,000.00 115,000.00 1,265,000.00
Net 6,150,000.00 6,035,000.00 6,035,000.00 6,035,000.00 6,035,000.00 6,035,000.00 6,035,000.00 6,035,000.00 6,035,000.00 6,035,000.00 6,035,000.00 6,035,000.00 72,535,000.00
SP. PROJ. BUREAU Gross 600,000.00 600,000.00 600,000.00 600,000.00 600,000.00 600,000.00 600,000.00 600,000.00 600,000.00 600,000.00 600,000.00 600,000.00 7,200,000.00
Utility - 60,000.00 60,000.00 60,000.00 60,000.00 60,000.00 60,000.00 60,000.00 60,000.00 60,000.00 60,000.00 60,000.00 660,000.00
Net 600,000.00 540,000.00 540,000.00 540,000.00 540,000.00 540,000.00 540,000.00 540,000.00 540,000.00 540,000.00 540,000.00 540,000.00 6,540,000.00
WASTE MGT Gross 600,000.00 600,000.00 600,000.00 600,000.00 600,000.00 600,000.00 600,000.00 600,000.00 600,000.00 600,000.00 600,000.00 600,000.00 7,200,000.00
Utility - - - - - - - - - - - - -
Net 600,000.00 600,000.00 600,000.00 600,000.00 600,000.00 600,000.00 600,000.00 600,000.00 600,000.00 600,000.00 600,000.00 600,000.00 7,200,000.00
FUNCT'L LIT. Gross 352,500.00 352,500.00 352,500.00 352,500.00 352,500.00 352,500.00 352,500.00 352,500.00 352,500.00 352,500.00 352,500.00 352,500.00 4,230,000.00
Utility - - - - - - - - - - - - -
Net 352,500.00 352,500.00 352,500.00 352,500.00 352,500.00 352,500.00 352,500.00 352,500.00 352,500.00 352,500.00 352,500.00 352,500.00 4,230,000.00
MIN. OF EDUC. Gross 1,200,000.00 1,200,000.00 1,200,000.00 1,200,000.00 1,200,000.00 1,200,000.00 1,200,000.00 1,200,000.00 1,200,000.00 1,200,000.00 1,200,000.00 1,200,000.00 14,400,000.00
Utility - 120,000.00 120,000.00 120,000.00 120,000.00 120,000.00 120,000.00 120,000.00 120,000.00 120,000.00 120,000.00 120,000.00 1,320,000.00
Net 1,200,000.00 1,080,000.00 1,080,000.00 1,080,000.00 1,080,000.00 1,080,000.00 1,080,000.00 1,080,000.00 1,080,000.00 1,080,000.00 1,080,000.00 1,080,000.00 13,080,000.00
MIN. OF HEALTH Gross 1,200,000.00 1,200,000.00 1,200,000.00 1,200,000.00 1,200,000.00 1,200,000.00 1,200,000.00 1,200,000.00 1,200,000.00 1,200,000.00 1,200,000.00 1,200,000.00 14,400,000.00
Utility - 120,000.00 120,000.00 120,000.00 120,000.00 120,000.00 120,000.00 120,000.00 120,000.00 120,000.00 120,000.00 120,000.00 1,320,000.00
Net 1,200,000.00 1,080,000.00 1,080,000.00 1,080,000.00 1,080,000.00 1,080,000.00 1,080,000.00 1,080,000.00 1,080,000.00 1,080,000.00 1,080,000.00 1,080,000.00 13,080,000.00
SOCIAL SECTOR

REPORT OF THE AUDITOR-GENERAL OF RIVERS STATE ON THE 2020 FINANCIAL STATEMENTS
55
WOMEN AFFAIRS Gross 1,800,000.00 1,800,000.00 1,800,000.00 1,800,000.00 1,800,000.00 1,800,000.00 1,800,000.00 1,800,000.00 1,800,000.00 1,800,000.00 1,800,000.00 1,800,000.00 21,600,000.00
Utility - - - - - - - - - - - - -
Net 1,800,000.00 1,800,000.00 1,800,000.00 1,800,000.00 1,800,000.00 1,800,000.00 1,800,000.00 1,800,000.00 1,800,000.00 1,800,000.00 1,800,000.00 1,800,000.00 21,600,000.00
MIN. OF SPORTS Gross 80,000,000.00 80,000,000.00 80,000,000.00 80,000,000.00 80,000,000.00 80,000,000.00 80,000,000.00 80,000,000.00 80,000,000.00 80,000,000.00 80,000,000.00 80,000,000.00 960,000,000.00
Utility - 3,240,000.00 3,240,000.00 3,240,000.00 3,240,000.00 3,240,000.00 3,240,000.00 3,240,000.00 3,240,000.00 3,240,000.00 3,240,000.00 3,240,000.00 35,640,000.00
Net 80,000,000.00 76,760,000.00 76,760,000.00 76,760,000.00 76,760,000.00 76,760,000.00 76,760,000.00 76,760,000.00 76,760,000.00 76,760,000.00 76,760,000.00 76,760,000.00 924,360,000.00
MIN. OF ENVIRON. Gross 2,289,750.00 2,289,750.00 2,289,750.00 2,289,750.00 2,289,750.00 2,289,750.00 2,289,750.00 2,289,750.00 2,289,750.00 2,289,750.00 2,289,750.00 2,289,750.00 27,477,000.00
Utility - 228,975.00 228,975.00 228,975.00 228,975.00 228,975.00 228,975.00 228,975.00 228,975.00 228,975.00 228,975.00 228,975.00 2,518,725.00
Net 2,289,750.00 2,060,775.00 2,060,775.00 2,060,775.00 2,060,775.00 2,060,775.00 2,060,775.00 2,060,775.00 2,060,775.00 2,060,775.00 2,060,775.00 2,060,775.00 24,958,275.00
MLGA Gross 900,000.00 900,000.00 900,000.00 900,000.00 900,000.00 900,000.00 900,000.00 900,000.00 900,000.00 900,000.00 900,000.00 900,000.00 10,800,000.00
Utility - 90,000.00 90,000.00 90,000.00 90,000.00 90,000.00 90,000.00 90,000.00 90,000.00 90,000.00 90,000.00 90,000.00 990,000.00
Net 900,000.00 810,000.00 810,000.00 810,000.00 810,000.00 810,000.00 810,000.00 810,000.00 810,000.00 810,000.00 810,000.00 810,000.00 9,810,000.00
MCCA Gross 1,500,000.00 1,500,000.00 1,500,000.00 1,500,000.00 1,500,000.00 1,500,000.00 1,500,000.00 1,500,000.00 1,500,000.00 1,500,000.00 1,500,000.00 1,500,000.00 18,000,000.00
Utility - 90,000.00 90,000.00 90,000.00 90,000.00 90,000.00 90,000.00 90,000.00 90,000.00 90,000.00 90,000.00 90,000.00 990,000.00
Net 1,500,000.00 1,410,000.00 1,410,000.00 1,410,000.00 1,410,000.00 1,410,000.00 1,410,000.00 1,410,000.00 1,410,000.00 1,410,000.00 1,410,000.00 1,410,000.00 17,010,000.00
MYD Gross 1,200,000.00 1,200,000.00 1,200,000.00 1,200,000.00 1,200,000.00 1,200,000.00 1,200,000.00 1,200,000.00 1,200,000.00 1,200,000.00 1,200,000.00 1,200,000.00 14,400,000.00
Utility - 120,000.00 120,000.00 120,000.00 120,000.00 120,000.00 120,000.00 120,000.00 120,000.00 120,000.00 120,000.00 120,000.00 1,320,000.00
Net 1,200,000.00 1,080,000.00 1,080,000.00 1,080,000.00 1,080,000.00 1,080,000.00 1,080,000.00 1,080,000.00 1,080,000.00 1,080,000.00 1,080,000.00 1,080,000.00 13,080,000.00
FREE MEDICAL Gross 550,000.00 550,000.00 550,000.00 550,000.00 550,000.00 550,000.00 550,000.00 550,000.00 550,000.00 550,000.00 550,000.00 550,000.00 6,600,000.00
Utility - - - - - - - - - - - - -
Net 550,000.00 550,000.00 550,000.00 550,000.00 550,000.00 550,000.00 550,000.00 550,000.00 550,000.00 550,000.00 550,000.00 550,000.00 6,600,000.00
EMERGENCY MED Gross 525,000.00 525,000.00 525,000.00 525,000.00 525,000.00 525,000.00 525,000.00 525,000.00 525,000.00 525,000.00 525,000.00 525,000.00 6,300,000.00
Utility - - - - - - - - - - - - -
Net 525,000.00 525,000.00 525,000.00 525,000.00 525,000.00 525,000.00 525,000.00 525,000.00 525,000.00 525,000.00 525,000.00 525,000.00 6,300,000.00
SCHOLAR. BOARD Gross 586,221.00 586,221.00 586,221.00 586,221.00 586,221.00 586,221.00 586,221.00 586,221.00 586,221.00 586,221.00 586,221.00 586,221.00 7,034,652.00
Utility - 58,622.00 58,622.00 58,622.00 58,622.00 58,622.00 58,622.00 58,622.00 58,622.00 58,622.00 58,622.00 58,622.00 644,842.00
Net 586,221.00 527,599.00 527,599.00 527,599.00 527,599.00 527,599.00 527,599.00 527,599.00 527,599.00 527,599.00 527,599.00 527,599.00 6,389,810.00
LIBRARY BOARD Gross 666,887.00 666,887.00 666,887.00 666,887.00 666,887.00 666,887.00 666,887.00 666,887.00 666,887.00 666,887.00 666,887.00 666,887.00 8,002,644.00
Utility - - - - - - - - - - - - -
Net 666,887.00 666,887.00 666,887.00 666,887.00 666,887.00 666,887.00 666,887.00 666,887.00 666,887.00 666,887.00 666,887.00 666,887.00 8,002,644.00
SSSB - HQTRS Gross 2,377,875.00 2,377,875.00 2,377,875.00 2,377,875.00 2,377,875.00 2,377,875.00 2,377,875.00 2,377,875.00 2,377,875.00 2,377,875.00 2,377,875.00 2,377,875.00 28,534,500.00
Utility - - - - - - - - - - - - -
Net 2,377,875.00 2,377,875.00 2,377,875.00 2,377,875.00 2,377,875.00 2,377,875.00 2,377,875.00 2,377,875.00 2,377,875.00 2,377,875.00 2,377,875.00 2,377,875.00 28,534,500.00
SSSB - ZONES Gross 1,650,000.00 1,650,000.00 1,650,000.00 1,650,000.00 1,650,000.00 1,650,000.00 1,650,000.00 1,650,000.00 1,650,000.00 1,650,000.00 1,650,000.00 1,650,000.00 19,800,000.00
Utility - - - - - - - - - - - - -
Net 1,650,000.00 1,650,000.00 1,650,000.00 1,650,000.00 1,650,000.00 1,650,000.00 1,650,000.00 1,650,000.00 1,650,000.00 1,650,000.00 1,650,000.00 1,650,000.00 19,800,000.00
ADULT & NON-FOR. Gross 1,173,024.00 1,173,024.00 1,173,024.00 1,173,024.00 1,173,024.00 1,173,024.00 1,173,024.00 1,173,024.00 1,173,024.00 1,173,024.00 1,173,024.00 1,173,024.00 14,076,288.00
Utility - - - - - - - - - - - - -
Net 1,173,024.00 1,173,024.00 1,173,024.00 1,173,024.00 1,173,024.00 1,173,024.00 1,173,024.00 1,173,024.00 1,173,024.00 1,173,024.00 1,173,024.00 1,173,024.00 14,076,288.00

REPORT OF THE AUDITOR-GENERAL OF RIVERS STATE ON THE 2020 FINANCIAL STATEMENTS
56
UBE BOARD Gross 18,000,000.00 18,000,000.00 18,000,000.00 18,000,000.00 18,000,000.00 18,000,000.00 18,000,000.00 18,000,000.00 18,000,000.00 18,000,000.00 18,000,000.00 18,000,000.00 216,000,000.00
Utility - - - - - - - - - - - - -
Net 18,000,000.00 18,000,000.00 18,000,000.00 18,000,000.00 18,000,000.00 18,000,000.00 18,000,000.00 18,000,000.00 18,000,000.00 18,000,000.00 18,000,000.00 18,000,000.00 216,000,000.00
READERS PROJECT Gross 617,000.00 617,000.00 617,000.00 617,000.00 617,000.00 617,000.00 617,000.00 617,000.00 617,000.00 617,000.00 617,000.00 617,000.00 7,404,000.00
Utility - - - - - - - - - - - - -
Net 617,000.00 617,000.00 617,000.00 617,000.00 617,000.00 617,000.00 617,000.00 617,000.00 617,000.00 617,000.00 617,000.00 617,000.00 7,404,000.00
HMB - ZONES Gross 269,000.00 269,000.00 269,000.00 269,000.00 269,000.00 269,000.00 269,000.00 269,000.00 269,000.00 269,000.00 269,000.00 269,000.00 3,228,000.00
Utility - - - - - - - - - - - - -
Net 269,000.00 269,000.00 269,000.00 269,000.00 269,000.00 269,000.00 269,000.00 269,000.00 269,000.00 269,000.00 269,000.00 269,000.00 3,228,000.00
STADIA AUTHORITY Gross 387,916.00 387,916.00 387,916.00 387,916.00 387,916.00 387,916.00 387,916.00 387,916.00 387,916.00 387,916.00 387,916.00 387,916.00 4,654,992.00
Utility - - - - - - - - - - - - -
Net 387,916.00 387,916.00 387,916.00 387,916.00 387,916.00 387,916.00 387,916.00 387,916.00 387,916.00 387,916.00 387,916.00 387,916.00 4,654,992.00
SPORTS COUNCIL Gross 308,000.00 308,000.00 308,000.00 308,000.00 308,000.00 308,000.00 308,000.00 308,000.00 308,000.00 308,000.00 308,000.00 308,000.00 3,696,000.00
Utility - - - - - - - - - - - - -
Net 308,000.00 308,000.00 308,000.00 308,000.00 308,000.00 308,000.00 308,000.00 308,000.00 308,000.00 308,000.00 308,000.00 308,000.00 3,696,000.00
SPORTS INSTITUTE Gross 214,333.00 214,333.00 214,333.00 214,333.00 214,333.00 214,333.00 214,333.00 214,333.00 214,333.00 214,333.00 214,333.00 214,333.00 2,571,996.00
Utility - - - - - - - - - - - - -
Net 214,333.00 214,333.00 214,333.00 214,333.00 214,333.00 214,333.00 214,333.00 214,333.00 214,333.00 214,333.00 214,333.00 214,333.00 2,571,996.00
PHC MGT BOARD Gross 1,200,000.00 1,200,000.00 1,200,000.00 1,200,000.00 1,200,000.00 1,200,000.00 1,200,000.00 1,200,000.00 1,200,000.00 1,200,000.00 1,200,000.00 1,200,000.00 14,400,000.00
Utility - - - - - - - - - - - - -
Net 1,200,000.00 1,200,000.00 1,200,000.00 1,200,000.00 1,200,000.00 1,200,000.00 1,200,000.00 1,200,000.00 1,200,000.00 1,200,000.00 1,200,000.00 1,200,000.00 14,400,000.00
ENV. PROT. AGENCY Gross 600,000.00 600,000.00 600,000.00 600,000.00 600,000.00 600,000.00 600,000.00 600,000.00 600,000.00 600,000.00 600,000.00 600,000.00 7,200,000.00
Utility - - - - - - - - - - - - -
Net 600,000.00 600,000.00 600,000.00 600,000.00 600,000.00 600,000.00 600,000.00 600,000.00 600,000.00 600,000.00 600,000.00 600,000.00 7,200,000.00
Total Gross 126,917,506.00 126,917,506.00 126,917,506.00 126,917,506.00 126,917,506.00 126,917,506.00 126,917,506.00 126,917,506.00 126,917,506.00 126,917,506.00 126,917,506.00 126,917,506.00 1,523,010,072.00
Total Utility - 4,242,597.00 4,242,597.00 4,242,597.00 4,242,597.00 4,242,597.00 4,242,597.00 4,242,597.00 4,242,597.00 4,242,597.00 4,242,597.00 4,242,597.00 46,668,567.00
Total Net 126,917,506.00 122,674,909.00 122,674,909.00 122,674,909.00 122,674,909.00 122,674,909.00 122,674,909.00 122,674,909.00 122,674,909.00 122,674,909.00 122,674,909.00 122,674,909.00 1,476,341,505.00
MOC & T Gross 1,500,000.00 1,500,000.00 1,500,000.00 1,500,000.00 1,500,000.00 1,500,000.00 1,500,000.00 1,500,000.00 1,500,000.00 1,500,000.00 1,500,000.00 1,500,000.00 18,000,000.00
Utility - 150,000.00 150,000.00 150,000.00 150,000.00 150,000.00 150,000.00 150,000.00 150,000.00 150,000.00 150,000.00 150,000.00 1,650,000.00
Net 1,500,000.00 1,350,000.00 1,350,000.00 1,350,000.00 1,350,000.00 1,350,000.00 1,350,000.00 1,350,000.00 1,350,000.00 1,350,000.00 1,350,000.00 1,350,000.00 16,350,000.00
NNVS Gross 300,000.00 300,000.00 300,000.00 300,000.00 300,000.00 300,000.00 300,000.00 300,000.00 300,000.00 300,000.00 300,000.00 300,000.00 3,600,000.00
Utility - - - - - - - - - - - - -
Net 300,000.00 300,000.00 300,000.00 300,000.00 300,000.00 300,000.00 300,000.00 300,000.00 300,000.00 300,000.00 300,000.00 300,000.00 3,600,000.00
ECONOMIC SECTOR

REPORT OF THE AUDITOR-GENERAL OF RIVERS STATE ON THE 2020 FINANCIAL STATEMENTS
57
ABLESEAMEN Gross 300,000.00 300,000.00 300,000.00 300,000.00 300,000.00 300,000.00 300,000.00 300,000.00 300,000.00 300,000.00 300,000.00 300,000.00 3,600,000.00
Utility - - - - - - - - - - - - -
Net 300,000.00 300,000.00 300,000.00 300,000.00 300,000.00 300,000.00 300,000.00 300,000.00 300,000.00 300,000.00 300,000.00 300,000.00 3,600,000.00
MENR Gross 1,400,000.00 1,400,000.00 7,550,000.00 7,550,000.00 7,550,000.00 7,550,000.00 7,550,000.00 7,550,000.00 7,550,000.00 7,550,000.00 7,550,000.00 7,550,000.00 78,300,000.00
Utility - 140,000.00 140,000.00 140,000.00 140,000.00 140,000.00 140,000.00 140,000.00 140,000.00 140,000.00 140,000.00 140,000.00 1,540,000.00
Net 1,400,000.00 1,260,000.00 7,410,000.00 7,410,000.00 7,410,000.00 7,410,000.00 7,410,000.00 7,410,000.00 7,410,000.00 7,410,000.00 7,410,000.00 7,410,000.00 76,760,000.00
MIN. OF COMMERCE Gross 600,000.00 600,000.00 600,000.00 600,000.00 600,000.00 600,000.00 600,000.00 600,000.00 600,000.00 600,000.00 600,000.00 600,000.00 7,200,000.00
Utility - 60,000.00 60,000.00 60,000.00 60,000.00 60,000.00 60,000.00 60,000.00 60,000.00 60,000.00 60,000.00 60,000.00 660,000.00
Net 600,000.00 540,000.00 540,000.00 540,000.00 540,000.00 540,000.00 540,000.00 540,000.00 540,000.00 540,000.00 540,000.00 540,000.00 6,540,000.00
MIN. OF WAT.RES. Gross 1,200,000.00 1,200,000.00 1,200,000.00 1,200,000.00 1,200,000.00 1,200,000.00 1,200,000.00 1,200,000.00 1,200,000.00 1,200,000.00 1,200,000.00 1,200,000.00 14,400,000.00
Utility - 120,000.00 120,000.00 120,000.00 120,000.00 120,000.00 120,000.00 120,000.00 120,000.00 120,000.00 120,000.00 120,000.00 1,320,000.00
Net 1,200,000.00 1,080,000.00 1,080,000.00 1,080,000.00 1,080,000.00 1,080,000.00 1,080,000.00 1,080,000.00 1,080,000.00 1,080,000.00 1,080,000.00 1,080,000.00 13,080,000.00
MIN. OF AGRIC. Gross 1,200,000.00 1,200,000.00 1,200,000.00 1,200,000.00 1,200,000.00 1,200,000.00 1,200,000.00 1,200,000.00 1,200,000.00 1,200,000.00 1,200,000.00 1,200,000.00 14,400,000.00
Utility - 120,000.00 120,000.00 120,000.00 120,000.00 120,000.00 120,000.00 120,000.00 120,000.00 120,000.00 120,000.00 120,000.00 1,320,000.00
Net 1,200,000.00 1,080,000.00 1,080,000.00 1,080,000.00 1,080,000.00 1,080,000.00 1,080,000.00 1,080,000.00 1,080,000.00 1,080,000.00 1,080,000.00 1,080,000.00 13,080,000.00
MIN. OF FINANCE Gross 3,000,000.00 3,000,000.00 3,000,000.00 3,000,000.00 3,000,000.00 3,000,000.00 3,000,000.00 3,000,000.00 3,000,000.00 3,000,000.00 3,000,000.00 3,000,000.00 36,000,000.00
Utility - 150,000.00 150,000.00 150,000.00 150,000.00 150,000.00 150,000.00 150,000.00 150,000.00 150,000.00 150,000.00 150,000.00 1,650,000.00
Net 3,000,000.00 2,850,000.00 2,850,000.00 2,850,000.00 2,850,000.00 2,850,000.00 2,850,000.00 2,850,000.00 2,850,000.00 2,850,000.00 2,850,000.00 2,850,000.00 34,350,000.00
OFFICE OF AG Gross 8,400,000.00 8,400,000.00 8,400,000.00 8,400,000.00 8,400,000.00 8,400,000.00 8,400,000.00 8,400,000.00 8,400,000.00 8,400,000.00 8,400,000.00 8,400,000.00 100,800,000.00
Utility - 240,000.00 240,000.00 240,000.00 240,000.00 240,000.00 240,000.00 240,000.00 240,000.00 240,000.00 240,000.00 240,000.00 2,640,000.00
Net 8,400,000.00 8,160,000.00 8,160,000.00 8,160,000.00 8,160,000.00 8,160,000.00 8,160,000.00 8,160,000.00 8,160,000.00 8,160,000.00 8,160,000.00 8,160,000.00 98,160,000.00
MOFI Gross 1,500,000.00 1,500,000.00 1,500,000.00 1,500,000.00 1,500,000.00 1,500,000.00 1,500,000.00 1,500,000.00 1,500,000.00 1,500,000.00 1,500,000.00 1,500,000.00 18,000,000.00
Utility - 150,000.00 150,000.00 150,000.00 150,000.00 150,000.00 150,000.00 150,000.00 150,000.00 150,000.00 150,000.00 150,000.00 1,650,000.00
Net 1,500,000.00 1,350,000.00 1,350,000.00 1,350,000.00 1,350,000.00 1,350,000.00 1,350,000.00 1,350,000.00 1,350,000.00 1,350,000.00 1,350,000.00 1,350,000.00 16,350,000.00
MIN. OF WORKS Gross 3,400,000.00 3,400,000.00 3,400,000.00 3,400,000.00 3,400,000.00 3,400,000.00 3,400,000.00 3,400,000.00 3,400,000.00 3,400,000.00 3,400,000.00 3,400,000.00 40,800,000.00
Utility - 240,000.00 240,000.00 240,000.00 240,000.00 240,000.00 240,000.00 240,000.00 240,000.00 240,000.00 240,000.00 240,000.00 2,640,000.00
Net 3,400,000.00 3,160,000.00 3,160,000.00 3,160,000.00 3,160,000.00 3,160,000.00 3,160,000.00 3,160,000.00 3,160,000.00 3,160,000.00 3,160,000.00 3,160,000.00 38,160,000.00
MIN. OF TRANSPORT Gross 2,400,000.00 2,400,000.00 2,400,000.00 2,400,000.00 2,400,000.00 2,400,000.00 2,400,000.00 2,400,000.00 2,400,000.00 2,400,000.00 2,400,000.00 2,400,000.00 28,800,000.00
Utility - 240,000.00 240,000.00 240,000.00 240,000.00 240,000.00 240,000.00 240,000.00 240,000.00 240,000.00 240,000.00 240,000.00 2,640,000.00
Net 2,400,000.00 2,160,000.00 2,160,000.00 2,160,000.00 2,160,000.00 2,160,000.00 2,160,000.00 2,160,000.00 2,160,000.00 2,160,000.00 2,160,000.00 2,160,000.00 26,160,000.00
MIN. OF POWER Gross 2,400,000.00 2,400,000.00 2,400,000.00 2,400,000.00 2,400,000.00 2,400,000.00 2,400,000.00 2,400,000.00 2,400,000.00 2,400,000.00 2,400,000.00 2,400,000.00 28,800,000.00
Utility - 240,000.00 240,000.00 240,000.00 240,000.00 240,000.00 240,000.00 240,000.00 240,000.00 240,000.00 240,000.00 240,000.00 2,640,000.00
Net 2,400,000.00 2,160,000.00 2,160,000.00 2,160,000.00 2,160,000.00 2,160,000.00 2,160,000.00 2,160,000.00 2,160,000.00 2,160,000.00 2,160,000.00 2,160,000.00 26,160,000.00
MIN. OF BUDGET Gross 3,000,000.00 3,000,000.00 3,000,000.00 3,000,000.00 3,000,000.00 3,000,000.00 3,000,000.00 3,000,000.00 3,000,000.00 3,000,000.00 3,000,000.00 3,000,000.00 36,000,000.00
Utility - 300,000.00 300,000.00 300,000.00 300,000.00 300,000.00 300,000.00 300,000.00 300,000.00 300,000.00 300,000.00 300,000.00 3,300,000.00
Net 3,000,000.00 2,700,000.00 2,700,000.00 2,700,000.00 2,700,000.00 2,700,000.00 2,700,000.00 2,700,000.00 2,700,000.00 2,700,000.00 2,700,000.00 2,700,000.00 32,700,000.00
MIN. OF LANDS & SURVEY Gross 900,000.00 900,000.00 900,000.00 900,000.00 900,000.00 900,000.00 900,000.00 900,000.00 900,000.00 900,000.00 900,000.00 900,000.00 10,800,000.00
Utility - 90,000.00 90,000.00 90,000.00 90,000.00 90,000.00 90,000.00 90,000.00 90,000.00 90,000.00 90,000.00 90,000.00 990,000.00
Net 900,000.00 810,000.00 810,000.00 810,000.00 810,000.00 810,000.00 810,000.00 810,000.00 810,000.00 810,000.00 810,000.00 810,000.00 9,810,000.00
SURVEYOR-GENERAL Gross 600,000.00 600,000.00 600,000.00 600,000.00 600,000.00 600,000.00 600,000.00 600,000.00 600,000.00 600,000.00 600,000.00 600,000.00 7,200,000.00
Utility - 60,000.00 60,000.00 60,000.00 60,000.00 60,000.00 60,000.00 60,000.00 60,000.00 60,000.00 60,000.00 60,000.00 660,000.00
Net 600,000.00 540,000.00 540,000.00 540,000.00 540,000.00 540,000.00 540,000.00 540,000.00 540,000.00 540,000.00 540,000.00 540,000.00 6,540,000.00

REPORT OF THE AUDITOR-GENERAL OF RIVERS STATE ON THE 2020 FINANCIAL STATEMENTS
58
MIN. OF HOUSING Gross 2,100,000.00 2,100,000.00 2,100,000.00 2,100,000.00 2,100,000.00 2,100,000.00 2,100,000.00 2,100,000.00 2,100,000.00 2,100,000.00 2,100,000.00 2,100,000.00 25,200,000.00
Utility - 180,000.00 180,000.00 180,000.00 180,000.00 180,000.00 180,000.00 180,000.00 180,000.00 180,000.00 180,000.00 180,000.00 1,980,000.00
Net 2,100,000.00 1,920,000.00 1,920,000.00 1,920,000.00 1,920,000.00 1,920,000.00 1,920,000.00 1,920,000.00 1,920,000.00 1,920,000.00 1,920,000.00 1,920,000.00 23,220,000.00
MIN. OF URBAN DEV. Gross 12,400,000.00 12,400,000.00 12,400,000.00 12,400,000.00 12,400,000.00 12,400,000.00 12,400,000.00 12,400,000.00 12,400,000.00 12,400,000.00 12,400,000.00 12,400,000.00 148,800,000.00
Utility - 240,000.00 240,000.00 240,000.00 240,000.00 240,000.00 240,000.00 240,000.00 240,000.00 240,000.00 240,000.00 240,000.00 2,640,000.00
Net 12,400,000.00 12,160,000.00 12,160,000.00 12,160,000.00 12,160,000.00 12,160,000.00 12,160,000.00 12,160,000.00 12,160,000.00 12,160,000.00 12,160,000.00 12,160,000.00 146,160,000.00
MIN. OF EMPLOY. Gross 1,200,000.00 1,200,000.00 1,200,000.00 1,200,000.00 1,200,000.00 1,200,000.00 1,200,000.00 1,200,000.00 1,200,000.00 1,200,000.00 1,200,000.00 1,200,000.00 14,400,000.00
Utility - 120,000.00 120,000.00 120,000.00 120,000.00 120,000.00 120,000.00 120,000.00 120,000.00 120,000.00 120,000.00 120,000.00 1,320,000.00
Net 1,200,000.00 1,080,000.00 1,080,000.00 1,080,000.00 1,080,000.00 1,080,000.00 1,080,000.00 1,080,000.00 1,080,000.00 1,080,000.00 1,080,000.00 1,080,000.00 13,080,000.00
STATE PLAN. COM. Gross 600,000.00 600,000.00 600,000.00 600,000.00 600,000.00 600,000.00 600,000.00 600,000.00 600,000.00 600,000.00 600,000.00 600,000.00 7,200,000.00
Utility - - - - - - - - - - - - -
Net 600,000.00 600,000.00 600,000.00 600,000.00 600,000.00 600,000.00 600,000.00 600,000.00 600,000.00 600,000.00 600,000.00 600,000.00 7,200,000.00
RS MUSEUM Gross 147,494.00 147,494.00 147,494.00 147,494.00 147,494.00 147,494.00 147,494.00 147,494.00 147,494.00 147,494.00 147,494.00 147,494.00 1,769,928.00
Utility - - - - - - - - - - - - -
Net 147,494.00 147,494.00 147,494.00 147,494.00 147,494.00 147,494.00 147,494.00 147,494.00 147,494.00 147,494.00 147,494.00 147,494.00 1,769,928.00
ARTS & CULTURE Gross 154,352.00 154,352.00 154,352.00 154,352.00 154,352.00 154,352.00 154,352.00 154,352.00 154,352.00 154,352.00 154,352.00 154,352.00 1,852,224.00
Utility - - - - - - - - - - - - -
Net 154,352.00 154,352.00 154,352.00 154,352.00 154,352.00 154,352.00 154,352.00 154,352.00 154,352.00 154,352.00 154,352.00 154,352.00 1,852,224.00
TOURISM DEV. Gross 1,200,000.00 1,200,000.00 1,200,000.00 1,200,000.00 1,200,000.00 1,200,000.00 1,200,000.00 1,200,000.00 1,200,000.00 1,200,000.00 1,200,000.00 1,200,000.00 14,400,000.00
Utility - - - - - - - - - - - - -
Net 1,200,000.00 1,200,000.00 1,200,000.00 1,200,000.00 1,200,000.00 1,200,000.00 1,200,000.00 1,200,000.00 1,200,000.00 1,200,000.00 1,200,000.00 1,200,000.00 14,400,000.00
DIRECT. OF CO-OP. Gross 135,700.00 135,700.00 135,700.00 135,700.00 135,700.00 135,700.00 135,700.00 135,700.00 135,700.00 135,700.00 135,700.00 135,700.00 1,628,400.00
Utility - - - - - - - - - - - - -
Net 135,700.00 135,700.00 135,700.00 135,700.00 135,700.00 135,700.00 135,700.00 135,700.00 135,700.00 135,700.00 135,700.00 135,700.00 1,628,400.00
WATER BOARD Gross 1,200,000.00 1,200,000.00 1,200,000.00 1,200,000.00 1,200,000.00 1,200,000.00 1,200,000.00 1,200,000.00 1,200,000.00 1,200,000.00 1,200,000.00 1,200,000.00 14,400,000.00
Utility - - - - - - - - - - - - -
Net 1,200,000.00 1,200,000.00 1,200,000.00 1,200,000.00 1,200,000.00 1,200,000.00 1,200,000.00 1,200,000.00 1,200,000.00 1,200,000.00 1,200,000.00 1,200,000.00 14,400,000.00
ADP Gross 395,008.00 395,008.00 395,008.00 395,008.00 395,008.00 395,008.00 395,008.00 395,008.00 395,008.00 395,008.00 395,008.00 395,008.00 4,740,096.00
Utility - - - - - - - - - - - - -
Net 395,008.00 395,008.00 395,008.00 395,008.00 395,008.00 395,008.00 395,008.00 395,008.00 395,008.00 395,008.00 395,008.00 395,008.00 4,740,096.00
SCH-TO-LAND Gross 533,886.00 533,886.00 533,886.00 533,886.00 533,886.00 533,886.00 533,886.00 533,886.00 533,886.00 533,886.00 533,886.00 533,886.00 6,406,632.00
Utility - - - - - - - - - - - - -
Net 533,886.00 533,886.00 533,886.00 533,886.00 533,886.00 533,886.00 533,886.00 533,886.00 533,886.00 533,886.00 533,886.00 533,886.00 6,406,632.00
RUWASSA Gross 150,000.00 150,000.00 150,000.00 150,000.00 150,000.00 150,000.00 150,000.00 150,000.00 150,000.00 150,000.00 150,000.00 150,000.00 1,800,000.00
Utility - - - - - - - - - - - - -
Net 150,000.00 150,000.00 150,000.00 150,000.00 150,000.00 150,000.00 150,000.00 150,000.00 150,000.00 150,000.00 150,000.00 150,000.00 1,800,000.00

REPORT OF THE AUDITOR-GENERAL OF RIVERS STATE ON THE 2020 FINANCIAL STATEMENTS
59
BODY OF APPEAL Gross 530,800.00 530,800.00 530,800.00 530,800.00 530,800.00 530,800.00 530,800.00 530,800.00 530,800.00 530,800.00 530,800.00 530,800.00 6,369,600.00
Utility - - - - - - - - - - - - -
Net 530,800.00 530,800.00 530,800.00 530,800.00 530,800.00 530,800.00 530,800.00 530,800.00 530,800.00 530,800.00 530,800.00 530,800.00 6,369,600.00
HOUSING AUTH. Gross 600,000.00 600,000.00 600,000.00 600,000.00 600,000.00 600,000.00 600,000.00 600,000.00 600,000.00 600,000.00 600,000.00 600,000.00 7,200,000.00
Utility - - - - - - - - - - - - -
Net 600,000.00 600,000.00 600,000.00 600,000.00 600,000.00 600,000.00 600,000.00 600,000.00 600,000.00 600,000.00 600,000.00 600,000.00 7,200,000.00
Total Gross 53,447,240.00 53,447,240.00 59,597,240.00 59,597,240.00 59,597,240.00 59,597,240.00 59,597,240.00 59,597,240.00 59,597,240.00 59,597,240.00 59,597,240.00 59,597,240.00 702,866,880.00
Total Utility - 2,840,000.00 2,840,000.00 2,840,000.00 2,840,000.00 2,840,000.00 2,840,000.00 2,840,000.00 2,840,000.00 2,840,000.00 2,840,000.00 2,840,000.00 31,240,000.00
Total Net 53,447,240.00 50,607,240.00 56,757,240.00 56,757,240.00 56,757,240.00 56,757,240.00 56,757,240.00 56,757,240.00 56,757,240.00 56,757,240.00 56,757,240.00 56,757,240.00 671,626,880.00
MIN. OF JUSTICE Gross 7,400,000.00 7,400,000.00 7,400,000.00 7,400,000.00 7,400,000.00 7,400,000.00 7,400,000.00 7,400,000.00 7,400,000.00 7,400,000.00 7,400,000.00 7,400,000.00 88,800,000.00
Utility - 240,000.00 240,000.00 240,000.00 240,000.00 240,000.00 240,000.00 240,000.00 240,000.00 240,000.00 240,000.00 240,000.00 2,640,000.00
Net 7,400,000.00 7,160,000.00 7,160,000.00 7,160,000.00 7,160,000.00 7,160,000.00 7,160,000.00 7,160,000.00 7,160,000.00 7,160,000.00 7,160,000.00 7,160,000.00 86,160,000.00
JUDICIARY Gross 117,606,686.00 117,606,686.00 117,606,686.00 117,606,686.00 117,606,686.00 117,606,686.00 117,606,686.00 117,606,686.00 117,606,686.00 117,606,686.00 117,606,686.00 117,606,686.00 1,411,280,232.00
Utility - - - - - - - - - - - - -
Net 117,606,686.00 117,606,686.00 117,606,686.00 117,606,686.00 117,606,686.00 117,606,686.00 117,606,686.00 117,606,686.00 117,606,686.00 117,606,686.00 117,606,686.00 117,606,686.00 1,411,280,232.00
JUD. SERV. COMM. Gross 1,423,000.00 1,423,000.00 1,423,000.00 1,423,000.00 1,423,000.00 1,423,000.00 1,423,000.00 1,423,000.00 1,423,000.00 1,423,000.00 1,423,000.00 1,423,000.00 17,076,000.00
Utility - - - - - - - - - - - - -
Net 1,423,000.00 1,423,000.00 1,423,000.00 1,423,000.00 1,423,000.00 1,423,000.00 1,423,000.00 1,423,000.00 1,423,000.00 1,423,000.00 1,423,000.00 1,423,000.00 17,076,000.00
COURT OF APPEAL Gross 60,000,000.00 60,000,000.00 60,000,000.00 60,000,000.00 60,000,000.00 60,000,000.00 60,000,000.00 60,000,000.00 60,000,000.00 60,000,000.00 60,000,000.00 60,000,000.00 720,000,000.00
Utility - - - - - - - - - - - - -
Net 60,000,000.00 60,000,000.00 60,000,000.00 60,000,000.00 60,000,000.00 60,000,000.00 60,000,000.00 60,000,000.00 60,000,000.00 60,000,000.00 60,000,000.00 60,000,000.00 720,000,000.00
Total Gross 186,429,686.00 186,429,686.00 186,429,686.00 186,429,686.00 186,429,686.00 186,429,686.00 186,429,686.00 186,429,686.00 186,429,686.00 186,429,686.00 186,429,686.00 186,429,686.00 2,237,156,232.00
Total Utility - 240,000.00 240,000.00 240,000.00 240,000.00 240,000.00 240,000.00 240,000.00 240,000.00 240,000.00 240,000.00 240,000.00 2,640,000.00
Total Net 186,429,686.00 186,189,686.00 186,189,686.00 186,189,686.00 186,189,686.00 186,189,686.00 186,189,686.00 186,189,686.00 186,189,686.00 186,189,686.00 186,189,686.00 186,189,686.00 2,234,516,232.00
1,100,881,404.00 1,100,881,404.00 1,107,031,404.00 1,083,031,404.00 1,131,031,404.00 1,107,031,404.00 1,093,310,456.00 1,093,310,456.00 1,093,310,456.00 1,093,310,456.00 1,093,310,456.00 1,093,310,456.00 13,189,751,160.00
- 9,661,968.00 9,661,968.00 9,661,968.00 9,661,968.00 9,661,968.00 9,661,968.00 9,661,968.00 9,661,968.00 9,661,968.00 9,661,968.00 9,661,968.00 106,281,648.00
1,100,881,404.00 1,091,219,436.00 1,097,369,436.00 1,073,369,436.00 1,121,369,436.00 1,097,369,436.00 1,083,648,488.00 1,083,648,488.00 1,083,648,488.00 1,083,648,488.00 1,083,648,488.00 1,083,648,488.00 13,083,469,512.00
Note 6.0 are main supporting references to overhead cost on Statement No.1 and Statement No.3 (Cashflow Statement and Statement of Consolidated Revenue Fund) respectively.
TOTAL SECTORIAL GROSS
TOTAL SECTORIAL UTILITY
TOTAL SECTORIAL NET
LAW AND JUSTICE SECTOR
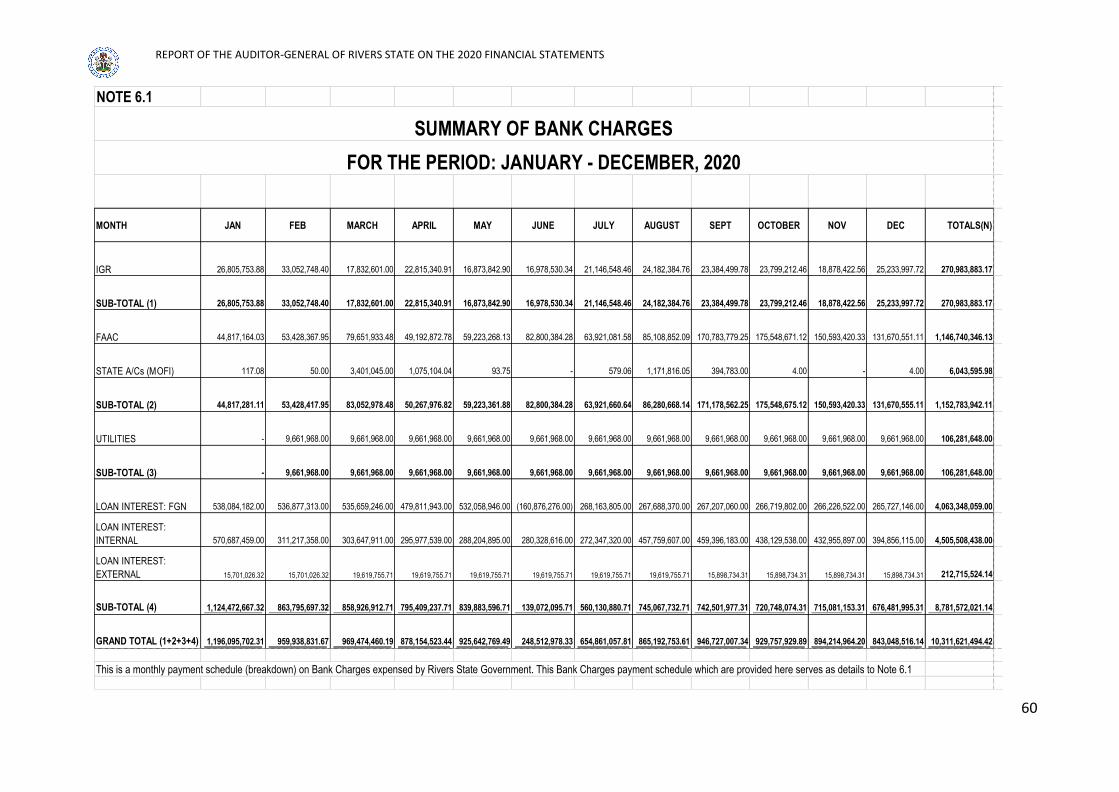
REPORT OF THE AUDITOR-GENERAL OF RIVERS STATE ON THE 2020 FINANCIAL STATEMENTS
60
NOTE 6.1
MONTH JAN FEB MARCH APRIL MAY JUNE JULY AUGUST SEPT OCTOBER NOV DEC TOTALS(N)
IGR 26,805,753.88 33,052,748.40 17,832,601.00 22,815,340.91 16,873,842.90 16,978,530.34 21,146,548.46 24,182,384.76 23,384,499.78 23,799,212.46 18,878,422.56 25,233,997.72 270,983,883.17
SUB-TOTAL (1) 26,805,753.88 33,052,748.40 17,832,601.00 22,815,340.91 16,873,842.90 16,978,530.34 21,146,548.46 24,182,384.76 23,384,499.78 23,799,212.46 18,878,422.56 25,233,997.72 270,983,883.17
FAAC 44,817,164.03 53,428,367.95 79,651,933.48 49,192,872.78 59,223,268.13 82,800,384.28 63,921,081.58 85,108,852.09 170,783,779.25 175,548,671.12 150,593,420.33 131,670,551.11 1,146,740,346.13
STATE A/Cs (MOFI) 117.08 50.00 3,401,045.00 1,075,104.04 93.75 - 579.06 1,171,816.05 394,783.00 4.00 - 4.00 6,043,595.98
SUB-TOTAL (2) 44,817,281.11 53,428,417.95 83,052,978.48 50,267,976.82 59,223,361.88 82,800,384.28 63,921,660.64 86,280,668.14 171,178,562.25 175,548,675.12 150,593,420.33 131,670,555.11 1,152,783,942.11
UTILITIES - 9,661,968.00 9,661,968.00 9,661,968.00 9,661,968.00 9,661,968.00 9,661,968.00 9,661,968.00 9,661,968.00 9,661,968.00 9,661,968.00 9,661,968.00 106,281,648.00
SUB-TOTAL (3) - 9,661,968.00 9,661,968.00 9,661,968.00 9,661,968.00 9,661,968.00 9,661,968.00 9,661,968.00 9,661,968.00 9,661,968.00 9,661,968.00 9,661,968.00 106,281,648.00
LOAN INTEREST: FGN 538,084,182.00 536,877,313.00 535,659,246.00 479,811,943.00 532,058,946.00 (160,876,276.00) 268,163,805.00 267,688,370.00 267,207,060.00 266,719,802.00 266,226,522.00 265,727,146.00 4,063,348,059.00
LOAN INTEREST:
INTERNAL 570,687,459.00 311,217,358.00 303,647,911.00 295,977,539.00 288,204,895.00 280,328,616.00 272,347,320.00 457,759,607.00 459,396,183.00 438,129,538.00 432,955,897.00 394,856,115.00 4,505,508,438.00
LOAN INTEREST:
EXTERNAL 15,701,026.32 15,701,026.32 19,619,755.71 19,619,755.71 19,619,755.71 19,619,755.71 19,619,755.71 19,619,755.71 15,898,734.31 15,898,734.31 15,898,734.31 15,898,734.31 212,715,524.14
SUB-TOTAL (4) 1,124,472,667.32 863,795,697.32 858,926,912.71 795,409,237.71 839,883,596.71 139,072,095.71 560,130,880.71 745,067,732.71 742,501,977.31 720,748,074.31 715,081,153.31 676,481,995.31 8,781,572,021.14
GRAND TOTAL (1+2+3+4) 1,196,095,702.31 959,938,831.67 969,474,460.19 878,154,523.44 925,642,769.49 248,512,978.33 654,861,057.81 865,192,753.61 946,727,007.34 929,757,929.89 894,214,964.20 843,048,516.14 10,311,621,494.42
This is a monthly payment schedule (breakdown) on Bank Charges expensed by Rivers State Government. This Bank Charges payment schedule which are provided here serves as details to Note 6.1
SUMMARY OF BANK CHARGES
FOR THE PERIOD: JANUARY - DECEMBER, 2020

REPORT OF THE AUDITOR-GENERAL OF RIVERS STATE ON THE 2020 FINANCIAL STATEMENTS
61
MDAs JANUARY FEBRUARY MARCH APRIL MAY JUNE JULY AUGUST SEPTEMBER OCTOBER NOVEMBER DECEMBER TOTAL (₦)
Government House 1,707,387,379.58 139,381,609.60 2,624,000,000.00 1,541,677,419.68 - 2,393,565,218.79 91,530,239.50 1,436,533,792.72 2,404,419,130.63 951,450,191.36 575,091,403.99 2,277,427,741.78 16,142,464,127.63
House of Assembly - - 37,000,500.00 - - 64,000,000.00 - - - - - - 101,000,500.00
Head of Service - - 180,000,000.00 - - - 66,920,776.57 - - - - - 246,920,776.57
SSG 373,025,000.00 136,721,300.00 1,107,218,440.00 66,730,000.00 550,000,000.00 90,800,000.00 66,730,000.00 240,035,997.50 307,925,196.28 375,296,500.00 166,730,000.00 110,000,000.00 3,591,212,433.78
Ministry of Information - - 60,000,000.00 - - - - - - - 44,500,000.00 - 104,500,000.00
ICT - - - - - - - 278,800,000.00 - - - - 278,800,000.00
SUB TOTAL (1) 2,080,412,379.58 276,102,909.60 4,008,218,940.00 1,608,407,419.68 550,000,000.00 2,548,365,218.79 225,181,016.07 1,955,369,790.22 2,712,344,326.91 1,326,746,691.36 786,321,403.99 2,387,427,741.78 20,464,897,837.98
Ministry of Housing - 188,125,948.45 1,022,491,430.50 1,025,791,678.00 500,000,000.00 25,100,145.00 - - - - - - 2,761,509,201.95
Road Maintenance Agency 100,000,000.00 - - - - 200,000,000.00 - - - - - - 300,000,000.00
Ministry of Transport - - 604,702,951.60 - - - - - 398,102,060.55 - - 125,000,000.00 1,127,805,012.15
Ministry of Works 668,877,764.26 646,886,975.00 12,110,579,043.61 1,326,757,801.26 8,617,064,293.77 9,118,728,787.70 2,682,882,852.24 19,457,707,117.45 2,728,930,244.22 1,113,554,000.47 1,762,971,349.97 6,524,599,523.29 66,759,539,753.24
Ministry of Power - - 787,550,854.92 - - 454,383,337.00 - 107,881,612.50 - - - - 1,349,815,804.42
Ministry of Finance - 77,300,000.00 - 101,002,000.00 213,599,243.28 - 187,781,417.70 197,541,417.70 1,352,931,201.04 26,073,000.00 41,648,000.00 31,648,000.00 2,229,524,279.72
MOFI - - - - - - - - - - - - -
RIRS - 176,216,835.40 88,108,417.70 - 88,108,417.70 - - - 88,108,417.70 88,108,417.70 88,108,417.70 88,108,417.70 704,867,341.60
Min of Lands & Survey - - - - 280,000,000.00 2,000,000,000.00 1,000,000,000.00 1,000,000,000.00 - - - - 4,280,000,000.00
RS Housing & Property Dev.
Auth. - - - - - - - - - - - - -
Min. of Culture & Tourism - - - - - - - - - - 100,000,000.00 235,000,000.00 335,000,000.00
SEEFOR 499,800,000.00 380,595,000.00 555,123,000.00 446,816,000.00 363,121,000.00 314,792,000.00 803,224,000.00 344,098,000.00 1,521,017,000.00 201,331,000.00 50,000.00 - 5,429,967,000.00
SUB TOTAL (2) 1,268,677,764.26 1,469,124,758.85 15,168,555,698.33 2,900,367,479.26 10,061,892,954.75 12,113,004,269.70 4,673,888,269.94 21,107,228,147.65 6,089,088,923.51 1,429,066,418.17 1,992,777,767.67 7,004,355,940.99 85,278,028,393.08
SUMMARY OF CAPITAL EXPENDITURES TO MDAs
FOR THE PERIOD: JANUARY - DECEMBER, 2020
ADMINISTRATIVE SECTOR
ECONOMIC SECTOR
7.0
7.1

REPORT OF THE AUDITOR-GENERAL OF RIVERS STATE ON THE 2020 FINANCIAL STATEMENTS
62
Ministry of Sports - - - - - - 190,000,000.00 - - 162,378,000.00 100,000,000.00 100,000,000.00 552,378,000.00
Waste Management Agency - 470,000,000.00 470,000,000.00 470,000,000.00 470,000,000.00 595,200,000.00 380,000,000.00 380,000,000.00 380,000,000.00 380,000,000.00 380,000,000.00 380,000,000.00 4,755,200,000.00
Bureau for Special Project - 215,202,960.00 3,047,936,618.88 664,334,309.90 279,137,551.75 1,000,000,000.00 - 4,975,540,281.34 - 101,772,040.36 1,481,267,480.92 552,644,694.73 12,317,835,937.88
Ministry of Education - 778,572,300.00 1,117,300,265.72 - - - 320,335,784.38 47,016,000.00 330,257,550.00 200,000,000.00 47,590,000.00 - 2,841,071,900.10
Ministry of Health - - 481,916,645.31 - 450,000,000.00 - - - - 404,534,583.00 174,119,125.27 - 1,510,570,353.58
SA - Real Madrid Academy - - - 520,789,708.82 - - - 341,832,315.88 343,993,400.00 - - - 1,206,615,424.70
Surveryor-General - - 15,000,000.00 - - - - - - - - - 15,000,000.00
RS Senior Sec. Schools Board - - - - - - - - - - - - -
Min of Social Welfare - - - - - - - 235,897,601.00 - - - 230,489,135.00 466,386,736.00
RSUST - - - - - - - - - 250,000,000.00 - - 250,000,000.00
RSCTR - - - - - - - - - 32,338,500.00 - - 32,338,500.00
SUB TOTAL (3) - 1,463,775,260.00 5,132,153,529.91 1,655,124,018.72 1,199,137,551.75 1,595,200,000.00 890,335,784.38 5,980,286,198.22 1,054,250,950.00 1,531,023,123.36 2,182,976,606.19 1,263,133,829.73 23,947,396,852.26
Ministry of Justice 1,199,500,000.00 - 360,000,000.00 - - - 574,000,000.00 - 575,244,735.28 - 50,000,000.00 576,000,000.00 3,334,744,735.28
Rivers State Judiciary - - - 22,429,000.00 - - - 3,450,000,000.00 200,000,000.00 - - 200,000,000.00 3,872,429,000.00
SUB TOTAL (4) 1,199,500,000.00 - 360,000,000.00 22,429,000.00 - - 574,000,000.00 3,450,000,000.00 775,244,735.28 - 50,000,000.00 776,000,000.00 7,207,173,735.28
RS House of Assembly - - - - - - - - - - - - -
Government House (Security
Vote) 3,006,850,000.00 2,473,839,000.00 2,340,449,268.27 1,335,000,000.00 1,400,000,000.00 2,131,000,000.00 3,199,900,000.00 2,254,000,000.00 1,570,000,000.00 3,750,000,000.00 1,370,000,000.00 2,922,800,000.00 27,753,838,268.27
Bureau on Pub. Pri. Partn - - - - - - - - - - - - -
RS Sustainable Dev. Agency - - - - - - - - - - - - -
RSU New Campus Dev. Pro. - - - - - - - - - - - - -
RS Neighbourhood Safety Corps
Agency - - - - - - - - - - - - -
RS Microfinance Agency (RIMA) - - - - - - - - - - - - -
RS Signage & Advertisement
Agency - - - - - - - - - - - - -
RS Investment Promotion Agency - - - - - - - - - - - - -
Boundary Commission - - - - - - - - - - - - -
RS Road Traffic Mgt Authority - - - - - - - - - - - - -
RS Soc. Serv. Contribution Trust
Fund - - - - - - - - - - - - -
Contingency Fund (GH) 520,265,774.55 142,717,630.88 6,580,849.81 - 210,000,000.00 289,155,802.45 159,384,276.45 - - 252,789,098.60 - - 1,580,893,432.74
Greater PH - - - - - - - 139,747,245.51 1,037,980,988.03 - - - 1,177,728,233.54
SFTAS - - - - - - - - - - - 950,000,000.00 950,000,000.00
SUB TOTAL (5) 3,527,115,774.55 2,616,556,630.88 2,347,030,118.08 1,335,000,000.00 1,610,000,000.00 2,420,155,802.45 3,359,284,276.45 2,393,747,245.51 2,607,980,988.03 4,002,789,098.60 1,370,000,000.00 3,872,800,000.00 31,462,459,934.55
GRAND TOTAL 8,075,705,918.39 5,825,559,559.33 27,015,958,286.32 7,521,327,917.66 13,421,030,506.50 18,676,725,290.94 9,722,689,346.84 34,886,631,381.60 13,238,909,923.73 8,289,625,331.49 6,382,075,777.85 15,303,717,512.50 168,359,956,753.15
Note 7.0, 7.1, 7.2, 7.3 and 7.4 are main supporting references to Capital Expenditure in Statement No. 1 and Statement No. 4 (Cash flow Statement and Statement of Capital Development Fund respectively)
LAW & JUSTICE
SPECIAL HEADS
SOCIAL SECTOR
7.2
7.3
7.4

REPORT OF THE AUDITOR-GENERAL OF RIVERS STATE ON THE 2020 FINANCIAL STATEMENTS
63
NOTES
ORG. CODE: MDAs BUDGET 2020 (₦) ACTUAL 2020 (₦) SURPLUS/DEFICIT (₦)
011100100100 GOVERNMENT HOUSE 65,000,000,000.00 16,142,464,127.63 48,857,535,872.37
011200300100 R/S HOUSE OF ASSEMBLY 3,704,000,000.00 101,000,500.00 3,602,999,500.00
012500100100 HEAD OF SERVICE 200,000,000.00 246,920,776.57 (46,920,776.57)
011101300100 SECRETARY TO THE STATE GOVERNMENT 920,000,000.00 3,591,212,433.78 (2,671,212,433.78)
011101300200 INFORMATION & COMM. TECHNOLOGY DEPT. 350,000,000.00 104,500,000.00 245,500,000.00
RS ICT 500,000,000.00 278,800,000.00 221,200,000.00
TOTAL 70,674,000,000.00 20,464,897,837.98 50,209,102,162.02
ORG. CODE: MDAs BUDGET 2020 (₦) ACTUAL 2020 (₦) SURPLUS/DEFICIT (₦)
025300100100 MINISTRY OF HOUSING 300,000,000.00 2,761,509,201.95 (2,461,509,201.95)
023400400100 R/S ROAD MAINTENANCE & REHAB. AGENCY 300,000,000.00 300,000,000.00 -
022900100100 MINISTRY OF TRANSPORT 400,000,000.00 1,127,805,012.15 (727,805,012.15)
023400100100 MINISTRY OF WORKS 50,000,000,000.00 66,759,539,753.24 (16,759,539,753.24)
023100100100 MINISTRY OF POWER 200,000,000.00 1,349,815,804.42 (1,149,815,804.42)
022000100100 MINISTRY OF FINANCE 224,000,000.00 2,229,524,279.72 (2,005,524,279.72)
RIRS 80,000,000.00 704,867,341.60 (624,867,341.60)
026000100100 SA - LANDS 200,000,000.00 4,280,000,000.00 (4,080,000,000.00)
MINISTRY OF CULTURE AND TOURISM 50,000,000.00 335,000,000.00 (285,000,000.00)
SEEFOR - 5,429,967,000.00 (5,429,967,000.00)
TOTAL 51,754,000,000.00 85,278,028,393.08 (33,524,028,393.08)
ORG. CODE: MDAs BUDGET 2020 (₦) ACTUAL 2020 (₦) SURPLUS/DEFICIT (₦)
053900100100 MINISTRY OF SPORTS 2,100,000,000.00 552,378,000.00 1,547,622,000.00
053505300100 R/S WASTE MANAGEMENT AGENCY 1,000,000,000.00 4,755,200,000.00 (3,755,200,000.00)
011100100307 BUREAU FOR SPECIAL PROJECT 8,074,113,328.94 12,317,835,937.88 (4,243,722,608.94)
051700100100 MINISTRY OF EDUCATION 12,000,000,000.00 2,841,071,900.10 9,158,928,099.90
052100100100 MINISTRY OF HEALTH 9,800,000,000.00 1,510,570,353.58 8,289,429,646.42
051702100200 RSUST NEW CAMPUS DEVELOPMENT PROJECT 200,000,000.00 250,000,000.00 (50,000,000.00)
MINISTRY OF SOCIAL WELFARE 300,000,000.00 466,386,736.00 (166,386,736.00)
RSCTR 300,000,000.00 32,338,500.00 267,661,500.00
SA-REAL MADRID ACADEMY - 1,206,615,424.70 (1,206,615,424.70)
SURVEYOR-GENERAL 100,000,000.00 15,000,000.00 85,000,000.00
TOTAL 33,874,113,328.94 23,947,396,852.26 9,926,716,476.68
7.0
7.1
7.2
CAPITAL EXPENDITURE FOR THE PERIOD JANUARY TO DECEMBER 2020
ADMINISTRATIVE SECTOR:
ECONOMIC SECTOR:
SOCIAL SECTOR:

REPORT OF THE AUDITOR-GENERAL OF RIVERS STATE ON THE 2020 FINANCIAL STATEMENTS
64
ORG. CODE: MDAs BUDGET 2020 (₦) ACTUAL 2020 (₦) SURPLUS/DEFICIT (₦)
032600100100 MINISTRY OF JUSTICE 3,000,000,000.00 3,334,744,735.28 (334,744,735.28)
032605100100 JUDICIAL (HIGH COURT) 300,000,000.00 3,872,429,000.00 (3,572,429,000.00)
TOTAL 3,300,000,000.00 7,207,173,735.28 (3,907,173,735.28)
ORG. CODE: MDAs BUDGET 2020 (₦) ACTUAL 2020 (₦) SURPLUS/DEFICIT (₦)
GH: SECURITY VOTE 20,000,000,000.00 27,753,838,268.27 (7,753,838,268.27)
GH: CONTINGENCY FUND 17,000,000,000.00 1,580,893,432.74 15,419,106,567.26
0234020100100 GREATER PH DEV. AUTHORITY 40,000,000.00 1,177,728,233.54 (1,137,728,233.54)
SFTAS 8,035,885,887.05 950,000,000.00 7,085,885,887.05
TOTAL 45,075,885,887.05 31,462,459,934.55 13,613,425,952.50
GRAND TOTAL (ALL SECTORS) 168,359,956,753.15
7.4E
SPECIAL HEADS
7.3
LAW AND JUSTICE SECTOR:

REPORT OF THE AUDITOR-GENERAL OF RIVERS STATE ON THE 2020 FINANCIAL STATEMENTS
65
NOTES BANK JAN. FEB MAR APR MAY JUN JUL AUG SEP OCT NOV DEC TOTAL (N)
8.0 SFTAS - - - - - - - - - - - 950,000,000.00 950,000,000.00
8.1 SEEFOR 499,800,000.00 380,595,000.00 555,123,000.00 446,816,000.00 363,121,000.00 314,792,000.00 803,224,000.00 344,098,000.00 1,521,017,000.00 201,331,000.00 50,000.00 - 5,429,967,000.00
8.1 PHWC - - - - - - - - - - - - -
8.2
FGN Bond (Bugdet
Suport) - - - - - - - - - - - -
8.3 Zenith Bank - - - - - - - - 19,519,884,076.00 - - - 19,519,884,076.00
TOTAL (N) 499,800,000.00 380,595,000.00 555,123,000.00 446,816,000.00 363,121,000.00 314,792,000.00 803,224,000.00 344,098,000.00 21,040,901,076.00 201,331,000.00 50,000.00 950,000,000.00 25,899,851,076.00
Note 8.0, 8.1, 8.2 and 8.3 are main supporting references on facilities in Statement No. 1 and Statement No. 4 (Cash flow Statement and Statement of Consolidated Revenue Fund respectively)
CAPITAL RECEIPTS FOR THE PERIOD JANUARY 2020 - DECEMBER 2020

REPORT OF THE AUDITOR-GENERAL OF RIVERS STATE ON THE 2020 FINANCIAL STATEMENTS
66
NOTE 9.1, 9.2, 9.3
COMMERCIAL BANK
LOANEXTERNAL LOAN TOTAL
ZENITH BANK FGN BONDEXCESS CRUDE
ACCOUNTSALARY BAILOUT BUDGET SUPPORT CBN MSMEDF
OPENING BALANCE 23,901,540,448.00 21,920,187,237.00 6,984,442,917.00 9,327,116,494.00 17,539,993,593.00 2,000,000,000.00 24,077,295,218.00 105,750,575,907.00
BORROWING DURING THE YEAR 19,519,884,076.00 5,429,967,000.00 24,949,851,076.00
43,421,424,524.00 21,920,187,237.00 6,984,442,917.00 9,327,116,494.00 17,539,993,593.00 2,000,000,000.00 29,507,262,218.00 130,700,426,983.00
DEBT SERVICE PAYMENT:
PRINCIPAL 12,294,108,660.00 459,235,270.00 312,942,958.00 90,162,488.00 29,663,958.00 2,826,077,674.00 16,012,191,008.00
REFUND OF PRIN OVER PAID - - - - - - - -
ACTUAL PRINCIPAL PAYMENT 12,294,108,660.00 459,235,270.00 312,942,958.00 90,162,488.00 29,663,958.00 - 2,826,077,674.00 16,012,191,008.00
INTEREST 4,505,508,439.00 3,220,379,552.00 166,443,291.00 248,487,635.00 428,037,580.00 - 212,715,524.00 8,781,572,021.00
TOTAL DEBT SERVICE PAID 16,799,617,099.00 3,679,614,822.00 479,386,249.00 338,650,123.00 457,701,538.00 - 3,038,793,198.00 24,793,763,029.00
DISBURSED OUTSTANDING LOAN 31,127,315,864.00 21,460,951,967.00 6,671,499,959.00 9,236,954,007.00 17,510,329,635.00 2,000,000,000.00 26,681,184,544.00 114,688,235,976.00
This debt stock table for the period of January 2020 - December 2020, represents loan obtained and repayments, during the Period of report.
RIVERS STATE GOVERNMENT
A SUMMARY STATEMENT OF DEBT STOCK AND DEBT SERVICE FIGURES - FY 2020
DESCRIPTION
FGN CREDIT FACILITIES

REPORT OF THE AUDITOR-GENERAL OF RIVERS STATE ON THE 2020 FINANCIAL STATEMENTS
67
NOTE 9.1
1) SEEFOR
2) PHWSS PROJECT (IDA)
3) PHWSS PROJECT (AfDB)
DESCRIPTION AMOUNT (N)
A BEGINING BAL:
EXTERNAL LOAN 24,077,295,218.00
B NEW LOAN DISBURSEMENT:
SEEFOR 5,429,967,000.00
C AVAILABLE BALANCE: 29,507,262,218.00
D DEBT SERVICE:
PRINCIPAL 2,826,077,674.00
E INTEREST:
EXTERNAL 212,715,524.00
F TOTAL DEBT SERVICE:
PRINCIPAL/INTEREST 3,038,793,198.00
G DISBURSED OUTSTANDING LOAN 26,681,184,544.00
RIVERS STATE GOVERNMENTRVSG LOAN STOCK & DEBT SERVICE - FY20
(EXTERNAL LOAN OBTAINED FROM WORLD BANK) :

REPORT OF THE AUDITOR-GENERAL OF RIVERS STATE ON THE 2020 FINANCIAL STATEMENTS
68
NOTE 9.1
JAN FEB MAR APR MAY JUN JUL AUG SEP OCT NOV DEC TOTAL
BEGINNING BALANCE 24,077,295,218.00 24,368,495,868.38 24,540,491,518.76 24,834,952,050.02 25,021,105,581.28 25,123,564,112.54 25,177,693,643.80 25,720,255,175.06 25,803,690,706.32 27,113,481,664.77 27,103,586,623.22 26,892,410,581.67 29,507,262,214.12
NEW LOAN 499,800,000.00 380,595,000.00 555,123,000.00 446,816,000.00 363,121,000.00 314,792,000.00 803,224,000.00 344,098,000.00 1,521,017,000.00 201,331,000.00 50,000.00 - 5,429,967,000.00
AVAILABLE FUND 24,577,095,218.00 24,749,090,868.38 25,095,614,518.76 25,281,768,050.02 25,384,226,581.28 25,438,356,112.54 25,980,917,643.80 26,064,353,175.06 27,324,707,706.32 27,314,812,664.77 27,103,636,623.22 26,892,410,581.67 29,507,262,214.12
DEBT SERVICE PRINCIPAL 208,599,349.62 208,599,349.62 260,662,468.74 260,662,468.74 260,662,468.74 260,662,468.74 260,662,468.74 260,662,468.74 211,226,041.55 211,226,041.55 211,226,041.55 211,226,041.55 2,826,077,674.00
INTEREST 15,701,026.32 15,701,026.32 19,619,755.71 19,619,755.71 19,619,755.71 19,619,755.71 19,619,755.71 19,619,755.71 15,898,734.31 15,898,734.31 15,898,734.31 15,898,734.31 212,715,521.00
TOTAL DEBT SERVICE 224,300,375.94 224,300,375.94 280,282,224.45 280,282,224.45 280,282,224.45 280,282,224.45 280,282,224.45 280,282,224.45 227,024,775.86 227,124,775.86 2,271,244,775.86 227,124,775.86 3,038,793,198.00
DISBURSED OUTSTANDING DEBT 24,368,495,868.38 24,540,491,518.76 24,834,952,050.02 25,021,105,581.28 25,123,564,112.54 25,177,693,643.80 25,720,255,175.06 25,803,690,706.32 27,113,481,664.77 27,103,586,623.22 26,892,410,581.67 26,681,184,540.12 26,681,184,540.12
Note 9.1 are main supporting references of External Loan (Multilateral Agencies/World Bank) and its repayment schedule as reported in Statement Nos 1 and 3 (Cashflow Statement and Consolidated Revenue Fund)
The Office of the Accountant-General Federation and DMO Abuja reconciles the Foreign Debts repayments and do all the exchange rate conversion and deduct at source in Naira from the FAAC Allocation
RIVERS STATE GOVERNMENTEXTERNAL LOAN: MULTILATERAL/WORLD BANK
FY 2020 LOAN STOCK AND DEBT SERVICE PAYMENTS

REPORT OF THE AUDITOR-GENERAL OF RIVERS STATE ON THE 2020 FINANCIAL STATEMENTS
69
NOTE 9.2
JAN '20 FEB '20 MARCH '20 APRIL '20 MAY '20 JUNE '20 JULY '20 AUG '20 SEPT '20 OCT '20 NOV '20 DEC '20 TOTAL
A BEGINING BAL:
FGN BOND 21,920,187,237 21,884,449,649 21,848,270,404 21,811,644,044 21,774,565,043 21,737,027,808 21,699,026,675 21,660,555,911 21,621,609,712 21,582,182,204 21,542,267,437 21,501,859,390 21,920,187,237
FGN EXCESS CRUDE FACILITY 6,984,442,917 6,912,117,593 6,839,249,829 6,765,835,557 6,681,859,131 6,524,112,640 6,671,499,959 6,671,499,959 6,671,499,959 6,671,499,959 6,671,499,959 6,671,499,959 6,984,442,917
FGN SALARY BAILOUT FACILITY 9,327,116,494 9,307,227,667 9,287,189,673 9,267,001,395 9,236,954,007 9,206,781,421 9,236,954,007 9,236,954,007 9,236,954,007 9,236,954,007 9,236,954,007 9,236,954,007 9,327,116,494
FGN BUDGET SUPPORT FACILITY 17,539,993,593 17,530,179,397 17,520,291,595 17,510,329,635 17,500,292,959 17,490,181,009 17,510,329,635 17,510,329,635 17,510,329,635 17,510,329,635 17,510,329,635 17,510,329,635 17,539,993,593
CBN MSMEDF LOAN 2,000,000,000 2,000,000,000 2,000,000,000 2,000,000,000 2,000,000,000 2,000,000,000 2,000,000,000 2,000,000,000 2,000,000,000 2,000,000,000 2,000,000,000 2,000,000,000 2,000,000,000
57,771,740,241 57,633,974,306 57,495,001,502 57,354,810,631 57,193,671,140 56,958,102,878 57,117,810,275 57,079,339,511 57,040,393,312 57,000,965,804 56,961,051,037 56,920,642,990 57,771,740,241
B NEW FGN BOND/LOAN DISBURSEMENT:
FGN BOND 0.00 0.00 0.00 0.00 0.00 0.00 0.00 0.00 0.00 -
FGN EXCESS CRUDE FACILITY 0.00 0.00 0.00 0.00 0.00 0.00 0.00 0.00 0.00 -
FGN SALARY BAILOUT FACILITY 0.00 0.00 0.00 0.00 0.00 0.00 0.00 0.00 0.00 -
FGN BUDGET SUPPORT FACILITY 0.00 0.00 0.00 0.00 0.00 0.00 0.00 0.00 -
CBN MSMEDF LOAN 0.00 0.00 0.00 0.00 0.00 0.00 0.00 0.00 0.00 -
- - - - - - - -
C AVAILABLE BALANCE:
FGN BOND 21,920,187,237 21,884,449,649 21,848,270,404 21,811,644,044 21,774,565,043 21,737,027,808 21,699,026,675 21,660,555,911 21,621,609,712 21,582,182,204 21,542,267,437 21,501,859,390 21,920,187,237
FGN EXCESS CRUDE FACILITY 6,984,442,917 6,912,117,593 6,839,249,829 6,765,835,557 6,681,859,131 6,524,112,640 6,671,499,959 6,671,499,959 6,671,499,959 6,671,499,959 6,671,499,959 6,671,499,959 6,984,442,917
FGN SALARY BAILOUT FACILITY 9,327,116,494 9,307,227,667 9,287,189,673 9,267,001,395 9,236,954,007 9,206,781,421 9,236,954,007 9,236,954,007 9,236,954,007 9,236,954,007 9,236,954,007 9,236,954,007 9,327,116,494
FGN BUDGET SUPPORT FACILITY 17,539,993,593 17,530,179,397 17,520,291,595 17,510,329,635 17,500,292,959 17,490,181,009 17,510,329,635 17,510,329,635 17,510,329,635 17,510,329,635 17,510,329,635 17,510,329,635 17,539,993,593
CBN MSMEDF LOAN 2,000,000,000 2,000,000,000 2,000,000,000 2,000,000,000 2,000,000,000 2,000,000,000 2,000,000,000 2,000,000,000 2,000,000,000 2,000,000,000 2,000,000,000 2,000,000,000 2,000,000,000
57,771,740,241 57,633,974,306 57,495,001,502 57,354,810,631 57,193,671,140 56,958,102,878 57,117,810,275 57,079,339,511 57,040,393,312 57,000,965,804 56,961,051,037 56,920,642,990 57,771,740,241
D DEBT SERVICE:
PRINCIPAL:
FGN BOND 35,737,588 36,179,245 36,626,360 37,079,001 37,537,236 38,001,133 38,470,764 38,946,198 39,427,509 39,914,767 40,408,047 40,907,423 459,235,270
FGN EXCESS CRUDE FACILITY 72,325,324 72,867,764 73,414,272 83,976,426 157,746,490 147,387,319- 0.00 0.00 0.00 0.00 0.00 0.00 312,942,958
FGN SALARY BAILOUT FACILITY 19,888,827 20,037,994 20,188,278 30,047,388 30,172,585.80 (30,172,585.80) 0.00 0.00 0.00 0.00 0.00 0.00 90,162,488
FGN BUDGET SUPPORT FACILITY 9,814,196 9,887,802 9,961,961 10,036,675 10,111,950 20,148,626- 0.00 0.00 0.00 0.00 0.00 0.00 29,663,958
CBN MSMEDF LOAN -
137,765,935 138,972,804 140,190,871 161,139,491 235,568,262 159,707,397- 38,470,764 38,946,198 39,427,509 39,914,767 40,408,047 40,907,423 892,004,674
237,000,356
E INTEREST:
FGN BOND 270,896,981 270,455,324 270,008,208 269,555,568 269,097,333 268,633,435 268,163,805 267,688,370 267,207,060 266,719,802 266,226,522 265,727,146 3,220,379,552
FGN EXCESS CRUDE FACILITY 54,350,450 53,808,010 53,261,502 29,040,924 81,946,634 -105,964,229 0.00 0.00 0.00 0.00 0.00 0.00 166,443,291
FGN SALARY BAILOUT FACILITY 70,083,768 69,934,602 69,784,317 38,684,947 38,559,750 -38,559,750 0.00 0.00 0.00 0.00 0.00 0.00 248,487,635
FGN BUDGET SUPPORT FACILITY 142,752,983.79 142,679,377.32 142,605,218.80 142,530,504 142,455,229 -284,985,733 0.00 0.00 0.00 0.00 0.00 0.00 428,037,580
CBN MSMEDF LOAN -
538,084,182 536,877,313 535,659,246 479,811,943 532,058,946 -160,876,276 268,163,805 267,688,370 267,207,060 266,719,802 266,226,522 265,727,146 4,063,348,058
850,994,613
F FEES:
FGN BOND 0.00 0.00 0.00 0.00 0.00 0.00 0.00 0.00 0.00 0.00 0.00 0.00 -
FGN EXCESS CRUDE FACILITY 0.00 0.00 0.00 0.00 0.00 0.00 0.00 0.00 0.00 0.00 0.00 0.00 -
FGN SALARY BAILOUT FACILITY 0.00 0.00 0.00 0.00 0.00 0.00 0.00 0.00 0.00 0.00 0.00 0.00 -
FGN BUDGET SUPPORT FACILITY 0.00 0.00 0.00 0.00 0.00 0.00 0.00 0.00 0.00 0.00 0.00 0.00 -
CBN MSMEDF LOAN 0.00 0.00 0.00 0.00 0.00 0.00 0.00 0.00 0.00 0.00 0.00 0.00 -
- - - - - - - - - - - - -
G TOTAL DEBT SERVICE:
FGN BOND 306,634,569 306,634,569 306,634,569 306,634,569 306,634,569 306,634,569 306,634,569 306,634,569 306,634,569 306,634,569 306,634,569 306,634,569 3,679,614,823
FGN EXCESS CRUDE FACILITY 126,675,774 126,675,774 126,675,774 113,017,351 239,693,124 -253,351,548 0 0 0 0 0 0 479,386,248.64
FGN SALARY BAILOUT FACILITY 89,972,596 89,972,596 89,972,596 68,732,336 68,732,336 -68,732,336 - - - - - - 338,650,122
FGN BUDGET SUPPORT FACILITY 152,567,179 152,567,179 152,567,179 152,567,179 152,567,179 -305,134,359 - - - - - - 457,701,538
CBN MSMEDF LOAN - - - - - - - - - - - - -
675,850,117 675,850,117 675,850,117 640,951,434 767,627,208 -320,583,673 306,634,569 306,634,569 306,634,569 306,634,569 306,634,569 306,634,569 4,955,352,732
H DISBURSED OUTSTANDING DEBT:
FGN BOND 21,884,449,649 21,848,270,404 21,811,644,044 21,774,565,043 21,737,027,808 21,699,026,675 21,660,555,911 21,621,609,712 21,582,182,204 21,542,267,437 21,501,859,390 21,460,951,967 21,460,951,967
FGN EXCESS CRUDE FACILITY 6,912,117,593 6,839,249,829 6,765,835,557 6,681,859,131 6,524,112,640.13 6,671,499,959 6,671,499,959 6,671,499,959 6,671,499,959 6,671,499,959 6,671,499,959 6,671,499,959 6,671,499,959
FGN SALARY BAILOUT FACILITY 9,307,227,667 9,287,189,673 9,267,001,395 9,236,954,007 9,206,781,421 9,236,954,007 9,236,954,007 9,236,954,007 9,236,954,007 9,236,954,007 9,236,954,007 9,236,954,007 9,236,954,007
FGN BUDGET SUPPORT FACILITY 17,530,179,397 17,520,291,595 17,510,329,635 17,500,292,959 17,490,181,009 17,510,329,635 17,510,329,635 17,510,329,635 17,510,329,635 17,510,329,635 17,510,329,635 17,510,329,635 17,510,329,635
CBN MSMEDF LOAN 2,000,000,000 2,000,000,000 2,000,000,000 2,000,000,000 2,000,000,000 2,000,000,000 2,000,000,000 2,000,000,000 2,000,000,000 2,000,000,000 2,000,000,000 2,000,000,000 2,000,000,000
Disbursed Outstanding Debt (DoD) 57,633,974,306 57,495,001,502 57,354,810,631 57,193,671,140 56,958,102,878 57,117,810,275 57,079,339,511 57,040,393,312 57,000,965,804 56,961,051,037 56,920,642,990 56,879,735,567 56,879,735,567
Note 9.2 are main supporting references, of FGN credit facilities for FGN, BOND, FGN Excess Crude, FGN Salary Bailout, FGN Budget Support and CBN MSMEDE and repayments schedule as reported in Statement Nos. 1 and 3
(Cashflow Statement and Statement of Consolidated Revenue Fund)
RIVERS STATE GOVERNMENT
FGN CREDIT FACILITIES
(FY20 - LOAN STOCK AND DEBT SERVICE PAYMENTS)

REPORT OF THE AUDITOR-GENERAL OF RIVERS STATE ON THE 2020 FINANCIAL STATEMENTS
70
NOTE 9.3
JAN FEB MARCH APRIL '20 MAY '20 JUNE '20 JULY '20 AUG '20 SEPT '20 OCT '20 NOV '20 DEC '20 TOTAL
A BEGINNING BALANCE:
NEW LOAN (OCT 2019) 23,901,540,448 23,341,301,828 22,773,593,360 22,198,315,446 21,615,367,159 21,024,646,229 20,426,049,019 19,819,470,513 19,204,804,294.37 18,581,942,525.72 17,950,775,933.49 17,311,193,786.69 23,901,540,448
2020 UBE LOAN - 1,476,464,219.92 1,432,592,275.90 1,388,263,332.46 -
2020 NEW RSG LOAN 16,799,084,786.45 15,585,660,039.43 14,359,595,451.29 -
23,901,540,448 23,341,301,828 22,773,593,360 22,198,315,446 21,615,367,159 21,024,646,229 20,426,049,019 19,819,470,513 19,204,804,294 36,857,491,532 34,969,028,249 33,059,052,570 23,901,540,448
B NEW LOAN DISBURSEMENT:
2020 UBE LOAN 1,519,884,075.86 1,519,884,076
2020 NEW RSG LOAN - - - 18,000,000,000.00 18,000,000,000
- - - 19,519,884,075.86 19,519,884,075.86
C TOTAL AVAILABLE FUND 23,901,540,448 23,341,301,828 22,773,593,360 22,198,315,446 21,615,367,159 21,024,646,229 20,426,049,019 19,819,470,513 38,724,688,370 43,421,424,524
D DEBT SERVICE - PRINCIPAL:
ZB PRIVATE HOSPITAL LOAN
NEW LOAN (OCT 2019) 560,238,620 567,708,468 575,277,914 582,948,287 590,720,930 598,597,210 606,578,506 614,666,219 622,861,769 631,166,592 639,582,147 648,109,908.75 7,238,456,570
2020 UBE LOAN 43,419,856 43,871,944 44,328,943 44,790,703 176,411,447
2020 NEW RSG LOAN 1,200,915,214 1,213,424,747 1,226,064,588 1,238,836,094 4,879,240,643
560,238,620 567,708,468 575,277,914 582,948,287 590,720,930 598,597,210 606,578,506 614,666,219 1,867,196,838 1,888,463,283 1,909,975,678 1,931,736,706 12,294,108,660
E DEBT SERVICE - INTEREST:
ZB PRIVATE HOSPITAL LOAN -
NEW LOAN (OCT 2019) 318,687,206 311,217,358 303,647,911 295,977,539 288,204,895 280,328,616 272,347,320 264,259,607 256,064,057 247,759,234 239,343,679 230,815,917 3,308,653,341
2020 UBE LOAN 15,832,126 15,379,838 14,922,838 14,461,078 60,595,880
2020 NEW RSG LOAN 187,500,000 174,990,467 162,350,625 149,579,119 674,420,211
318,687,206 311,217,358 303,647,911 295,977,539 288,204,895 280,328,616 272,347,320 264,259,607 459,396,183 438,129,538 416,617,143 394,856,115 4,043,669,432
F DEBT SERVICE - FEES/OTHERS:
ZB PRIVATE HOSPITAL LOAN 252,000,253 252,000,253
NEW LOAN (OCT 2019) -
2020 UBE LOAN 193,500,000 16,338,753.85 209,838,754
2020 NEW RSG LOAN
252,000,253 - - - - - - 193,500,000 - - 16,338,754 - 461,839,007
G TOTAL DEBT SERVICE:
ZB PRIVATE HOSPITAL LOAN 252,000,253 - - 252,000,253
NEW LOAN (OCT 2019) 878,925,826 878,925,826 878,925,826 878,925,826 878,925,826 878,925,826 878,925,826 878,925,826 878,925,826 878,925,826 878,925,826 878,925,826 7,910,332,433
2020 UBE LOAN - - - - - - - 193,500,000 59,251,982 59,251,782 75,590,536 59,251,782 252,751,982
2020 NEW RSG LOAN - - - - - - - - 1,388,415,214 1,388,415,214 1,388,415,214 1,388,415,214 1,388,415,214
1,130,926,079 878,925,826 878,925,826 878,925,826 878,925,826 878,925,826 878,925,826 1,072,425,826 2,326,593,021 2,326,592,821 2,342,931,575 2,326,592,821 9,803,499,882
H DISBURSED OUTSTANDING DEBT (DoD):
ZB PRIVATE HOSPITAL LOAN
NEW LOAN (OCT 2019) 23,341,301,828 22,773,593,360 22,198,315,446 21,615,367,159 21,024,646,229 20,426,049,019 19,819,470,513 19,204,804,294 18,581,942,526 17,950,775,933.49 17,311,193,786.69 16,663,083,877.94 16,663,083,878
2020 UBE LOAN - - 1,476,464,220 1,432,592,275.90 1,388,263,332.46 1,343,472,629.19 5,640,792,458
2020 NEW RSG LOAN - - 16,799,084,786 15,585,660,039.43 14,359,595,451.29 13,120,759,357.03 59,865,099,634
23,341,301,828 22,773,593,360 22,198,315,446 21,615,367,159 21,024,646,229 20,426,049,019 19,819,470,513 19,204,804,294 36,857,491,532 34,969,028,249 33,059,052,570 31,127,315,864 82,168,975,969
Note 9.3 are main supporting references of Commercial Bank Loan from Zenith Bank and its repayment schedule for the Period of January 2020 - December 2020 as reported in Statement Nos. 1 and 3.
(Cashflow Statement and Statement of Consolidated Revenue Fund). The Rivers State Financial Statement do not recognize Opening Balance of Interest, since it is not a Loan and the State never default in Principal and Interest
Loan repayment as scheduled.
RIVERS STATE GOVERNMENTRVSG LOAN STOCK & DEBT SERVICE - FY20
(COMMERCIAL BANK LOANS OBTAINED FROM ZENITH BANK)
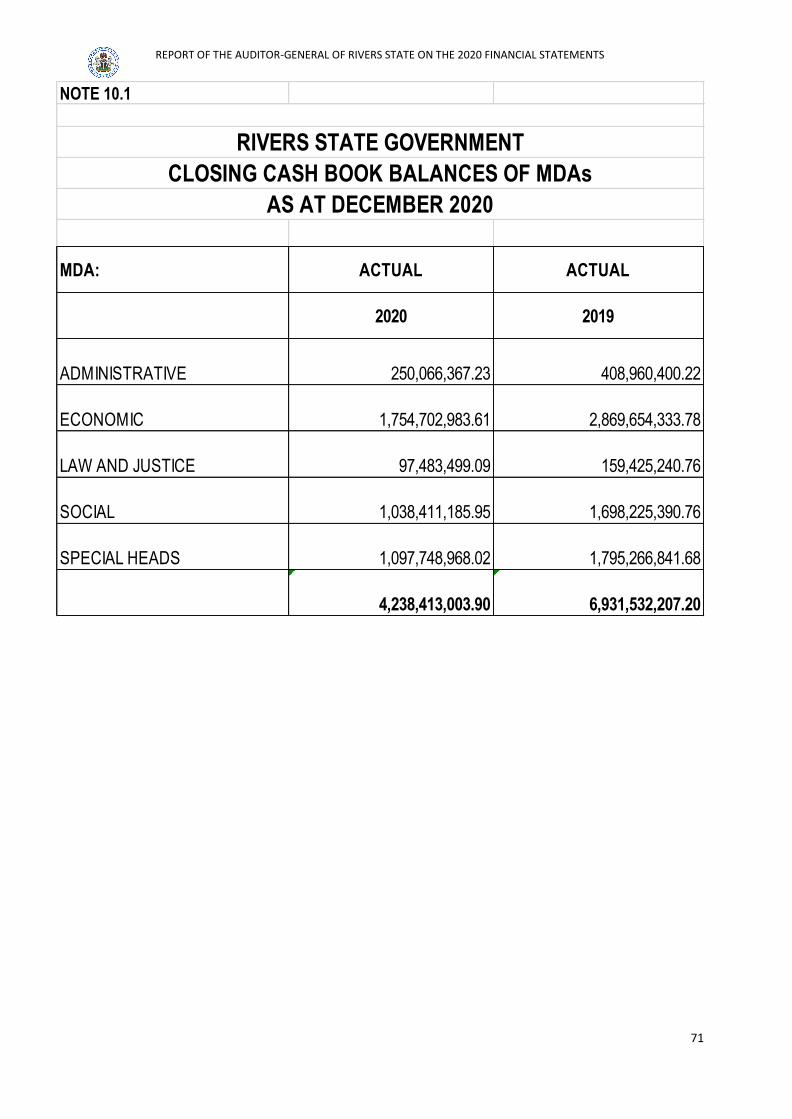
REPORT OF THE AUDITOR-GENERAL OF RIVERS STATE ON THE 2020 FINANCIAL STATEMENTS
71
NOTE 10.1
MDA: ACTUAL ACTUAL
2020 2019
ADMINISTRATIVE 250,066,367.23 408,960,400.22
ECONOMIC 1,754,702,983.61 2,869,654,333.78
LAW AND JUSTICE 97,483,499.09 159,425,240.76
SOCIAL 1,038,411,185.95 1,698,225,390.76
SPECIAL HEADS 1,097,748,968.02 1,795,266,841.68
4,238,413,003.90 6,931,532,207.20
RIVERS STATE GOVERNMENT
CLOSING CASH BOOK BALANCES OF MDAs
AS AT DECEMBER 2020

REPORT OF THE AUDITOR-GENERAL OF RIVERS STATE ON THE 2020 FINANCIAL STATEMENTS
72
RECEIPTS WITHDRAWALS BALANCE AS AT DEC 2020
May 2008 - June 2013 December 2013 - December 2014
53,000,000,000.00 51,600,000,000.00 1,400,000,000.00
In December 2013 the Reserve Fund Account with inerest and profit grew to a total of N53 Billion.
However, on approvals and mandates, withdrawals were made from the Reserve Fund Account
from December 2013 to December 2014, which the sum of N51 Billion was withdrawn.
The balance of N1.4 Billion was left without review till date.
NOTE 11
CASH BALANCES OF TRUST & OTHER FUNDS OF THE STATE

REPORT OF THE AUDITOR-GENERAL OF RIVERS STATE ON THE 2020 FINANCIAL STATEMENTS
73
S/No. NAME OF COMPANY Nominal
Price RSG Shareholding Nominal Value
Cost of
Acquisition Quoted
1 INTERNATIONAL ENERGY INS COY (MERGED WITH RIVBANK) 0.50 4,774,450,000 2,387,475,000.00 3,342,468,000 No
2 PABOD FIN. & INVESTMENT COMPANY LIMITED 1.00 5,000,005 5,000,005.00 5,000,005 Yes
3 ACCESS BANK 0.50 23,252,208 11,626,104.00 287,100,024 Yes
4 RIVIGO LTD 1.00 30,000,000 7,500,000.00 30,000,000 No
5 PABOD SUPPLIES 2.00 3,300,000 6,600,000.00 6,600,000 No
6 BAPS SERVICES 0.50 176,100 88,250.00 88,250 No
7 ELLAH LAKES 0.50 11,000,000 70,000,000.00 70,000,000 No
8 INTRA MOTORS PLC 0.50 3,300,000 1,650,000.00 1,650,000 Yes
9 PORT HARCOURT FLOURMILLS 2.00 27,500,000 55,000,000.00 55,000,000 Yes
10 PABOD BREWERIES LTD 1.00 468,462,941 468,462,941.00 991,092,065 No
11 RAGOLIS WATERS 1.00 120,000,000 120,000,000.00 400,000,000 No
12 INDORAMA ELEME PETROCHEMICAL 1.00 499,790 (Restructured) 63,481,600.00 4,030,637,081 Yes
13 UNITED (NIG) INSURANCE COMPANY 0.50 91,200 13,200.00 45,600 Yes
14 FIRST ALLUMINIUM & ALTECH PLC 0.50 3,927,530 1,960,775.00 1,960,775 Yes
15 EASTERN ENAMELWARE FACTORY LTD 0.50 132,200 6,660.00 6,660 No
16 RIVERS STATE TRANSPORT COMPANY LTD 1.00 500,000 500,000.00 500,000 No
17 RIVERS STATE MARINE COMPANY LTD 1.00 500,000 500,000.00 500,000 No
18 NIGERIA SHIP BUILDERS 1.00 50,000,000 50,000,000.00 50,000,000 Yes
19 NIG. ENGINEERING WORKS LTD 2.00 4,318,809 8,637,618.00 8,637,618 No
20 WEST AFRICAN GLASS INDUSTRY PLC - 0.50 16,500,000 8,250,000.00 Yes
REDEEMABLE PREF. 1.00 165,000 1,650,000.00
21 DELTA HOTELS 0.50 550,000 275,000.00 275,000 Yes
22 SHERATON HOTELS ABUJA (HANNS GREMLIN NIG. LTD) 1.00 15,873,016 15,873,016.00 100,000,000 No
23 TINAPA BUSINESS 0.50 250,000,000 500,000,000.00 1,000,000,000 No
24 DELTA RUBBER COMPANY LTD 1.00 2,750,000 2,750,000.00 2,750,000 No
25 RISOPALM LTD 0.50 66,000,000 33,000,000.00 33,000,000 No
26 FIRST BANK PLC 0.50 115,649,454 57,826,549.50 2,092,098,623 Yes
27 FIDELITY BANK PLC 0.50 5,269,800 2,630,400.00 16,729,344 Yes
28 DIAMOND BANK PLC 0.50 4,500,000 2,250,000.00 29,565,000 Yes
29 NAHCO 0.50 3,920,000 1,960,000.00 28,459,200 No
30 FLOUR MILLS PLC 0.50 465,000 232,500.00 39,004,200 Yes
31 DANGOTE SUGAR 0.50 3,735,050 1,867,525.00 43,588,033 Yes
32 OANDO PLC 0.50 6,715,000 3,357,500.00 88,973,750 Yes
33 UBA PLC 0.50 381,416,445 113,012,280.00 1,009,892,801 Yes
34 UNION BANK PLC 0.50 9,996,681(Restructured) 10,589,079.00 10,589,079 Yes
35 ZENITH BANK PLC 0.50 628,613,703 283,485,542.00 6,397,418,135 Yes
36 FCMB 0.50 12,000,000 6,000,000.00 6,000,000,000 Yes
37 STERLING BANK PLC 0.50 4,405,930 2,202,965.00 7,573,075 Yes
38 UNITY BANK PLC 0.50 3,329,374 1,664,687,342.50 6,500,000,000 Yes
39 P.Z 0.50 5,715,184 2,857,592.00 107,902,674 Yes
40 WAPCO (LAFARGE) 0.50 3,121,806 1,560,948.00 314,718,336 Yes
41 UACN 0.50 2,327,327 1,163,663.50 91,386,160 Yes
42 NATIONAL SALT COMPANY PLC 0.50 3,836,591 1,918,295.50 36,573,601 Yes
43 PRECO PLC 0.50 1,321,692 660,846.00 35,754,355 Yes
44 OKOMU OIL PALM PLC 0.50 1,713,300 856,650.00 64,366,684 Yes
45 CHELLARAMS PLC 0.50 35,077 17,538.50 203,797 Yes
46 FORTE OIL 0.50 211,633 10,581.50 2,205,216 Yes
47 NIGERIA BREWERIES 0.50 595,500 277,750.00 100,127,370 Yes
48 JULIUS BERGER 0.50 760,546 380,273.00 77,046,460 Yes
49 ALLCO 0.50 11,121,250 5,560,625.00 12,549,256 Yes
50 CADBUNG PLC 0.50 273,880 136,940.00 9,867,114 Yes
51 CAP PLC 0.50 378,792 189,396.00 5,301,377 Yes
52 GUINESS NIG 1.00 3,949,200 3,949,200.00 954,984,500 Yes
53 GTB 0.50 3,918,823 1,959,411.50 97,733,128 Yes
54 STANBIC IBTC 0.50 625,072 312,536.00 11,926,373 Yes
55 TOTAL FINNAELF 0.50 120,000 60,000.00 120,000,845 Yes
56 TRANSCORP 0.50 30,466,000 15,233,000.00 106,326,340 Yes
RIVERS STATE GOVERNMENT INVESTMENT IN COMPANIES
AS AT 31ST DECEMBER 2020
9,900,000
NOTE:12

REPORT OF THE AUDITOR-GENERAL OF RIVERS STATE ON THE 2020 FINANCIAL STATEMENTS
74
57 UNILEVER PLC 0.50 293,184 146,592.00 15,789,407 Yes
58 CEMENT COMPANY OF NORTHERN NIG. 0.50 500,000 250,000.00 4,579,187 Yes
59 WAPIC W/A PROV. INSURANCE COY 0.50 144,203,567 72,101,783.50 141,319,496 Yes
60 WAMCO 0.50 195,984 97,992.00 74,266,177 Yes
61 MTN 1.00 1,760 1,760.00 5,491,200 No
62 ASHAKA CEMENT CO. 0.50 6,964,058 3,482,029.00 173,544,325 Yes
63 DAAR COMMUNICATIONS LTD 1,975,000,000 Yes
64 NEWSWATCH COMMUNICATIONS 107,500,000 No
65 ATTN 100,000,000 No
66 JAP TELECOMMUNICATIONS LTD 600,000,000 No
67 COURAGE COMMUNICATIONS LTD 309,000,000 No
68 OPL 289 975,000,000 No
69 TRANSKY LTD 263,120,000 No
70 JDZ 874,943,130 No
71 CHANNELS TV 50,000,000 No
72 RIMAS ENVIRONMENTAL SYSTEMS 1,009,411,000 No
73 HABILA RESOURCES LTD 257,000,000 No
Adjustment 2013
74 Write-off of Investnent in dispute 4,448,279,000-
75 Write-off of unsubstantiable balances 71,708,000-
76 Investment wrongly omitted from 2013 financial statements 6,620,720,000
Adjustment 2014
77 Write off of Investment 999,707-
GRAND TOTAL 43,875,773,119

REPORT OF THE AUDITOR-GENERAL OF RIVERS STATE ON THE 2020 FINANCIAL STATEMENTS
75
NOTE 10.1
NAME OF BANK A/C NO. AMOUNT (N)
INTERNALLY GENERATED REVENUE:
ACCESS BANK 0006790611 215,975,088.11
DIAMOND 0013341489 51,060,747.56
ECOBANK 2162119403 1,742,352.65
FIDELITY NGNO2923129001 122,547,108.59
FCMB - IGR 0129577022 23,194,832.38
FIRST BANK 2014239360 244,981,717.14
GUARANTY TRUST BANK 0167839553 55,377,741.10
HERITAGE BANK 5600000466 90,171,240.31
STANBIC - IBTC (SOFT COPY) 0013524246 27,409,166.18
KEYSTONE 1000662597 36,796,588.42
POLARIS BANK (GARRISON BRANCH) 1790029960 22,829,666.90
STERLING BANK 0077118245 1,010,850.23
UNITY BANK 0026056782 (201,631,932.04)
UNION BANK 0030125374 2,860,514.46
UBA 1012830182 221,828,728.08
WEMA (SOFT COPY) 999NGN45035007 3,476,467.86
ZENITH - IGR 1130009156 (94,911,529.63)
RIMA GROWTH 0110229844 11,862,146.11
POLARIS BANK 1790029953 245,699,189.06
1,082,280,683.47
OTHER REVENUE A/C:
FCMB - MINISTRY OF LANDS 0663016012 4,563.83
POLARIS - PROJECT A/C 1771433142 132.79
POLARIS - MINISTRY OF LANDS 1750022114 -
ECOBANK - RSG MISC. 5262003395 3,569.30
ECOBANK 2162002026 7,703,547.84
ACCESS - PROJECT A/C 0059880527 2,391,714,678.60
ZENITH OTHER CHARGES 1010140607 1,001,153,927.38
ZENITH BANK (FAAC) 1010445728 (3,093,586,530.18)
ZENITH 1015315664 5,279,772.08
ZENITH 1014786737 7,112,648.95
ZENITH 1017248739 16,951,499.95
ZENITH 1017227518 435,072,945.27
ZENITH 1017248746 61,022,722.45
ACCESS BANK (IGR) 0696334609 46,019,105.23
ACCESS 1384199858 1,765,330.00
CLOSING BANK BALANCES AS AT 31ST DECEMBER 2020

REPORT OF THE AUDITOR-GENERAL OF RIVERS STATE ON THE 2020 FINANCIAL STATEMENTS
76
POLARIS 1790127237 1,204,763.91
POLARIS 1771141225 339,847.56
ECOBANK 3952066673 1,301,958.64
FCMB 4004888014 7,499,877.50
KEYSTONE 1000663037 9,048,142.79
FIRST BANK 2009235339 35,971,601.25
FIRST BANK 2013284710 4,190,821.96
UNION BANK 0030077033 9,341.63
HERITAGE BANK 6000644270 19,728,947.14
959,513,215.87
DOMICILIARY A/C (Exchange Rate: N470)
CITIBANK (USD) 0011267015 528,341.84 248,320,664.80
POLARIS (USD) 1750034847 76.89 36,138.30
POLARIS (USD) 1771502295 2,112.55 992,898.50
UBA (USD) 3000081152 171,571.64 80,638,670.80
ECOBANK (USD) 2162046802 48.53 22,809.10
ECOBANK (USD) 5262004055 65.63 30,846.10
UNITY (USD) 0013441708 69.95 32,876.50
KEYSTONE (USD) 1002859757 2,038.02 957,869.40
ZENITH (USD) 5070000101 3,481,409.55 1,636,262,488.50
GT BANK (USD) 0037584402 147.52 69,334.40
ACCESS (USD) 0697393852 394,327.27 185,333,816.90
ACCESS (USD) 0064889429 29,784.11 13,998,531.70
2,166,696,945.00
(Exchange Rate: N473.45)
POLARIS (EURO) 1771537899 22.81 10,799.39
ECOBANK (EURO) 2162046819 87.70 41,521.57
ZENITH (EURO) 5080000706 2,902.02 1,373,961.37
GT BANK (EURO) 0037584426 207.67 98,321.36
1,524,603.69
(Exchange Rate: N600)
ZENITH (GBP) 5060000269 46,624.17 27,974,502.00
ECOBANK (GBP) 2162046826 682.90 409,740.00
GT BANK (GBP) 0037584419 22.19 13,314.00
28,397,556.00
GRAND TOTAL 4,238,413,004.03
The balance of N for the year end 2021 represents actual closing balances of Rivers State Government
accounts for the period.

REPORT OF THE AUDITOR-GENERAL OF RIVERS STATE ON THE 2020 FINANCIAL STATEMENTS
77
S/No. Month Main Stream (₦) Parastatals (₦) Total (₦) No. of Staff
1 January 1,417,762,899.85 131,069,890.64 1,548,832,790.49 18,147
2 February 1,416,909,196.92 131,069,890.64 1,547,979,087.56 18,133
3 March 1,415,314,555.87 131,069,890.64 1,546,384,446.51 18,123
4 April 1,414,624,624.05 131,069,890.64 1,545,694,514.69 18,111
5 May 1,413,973,610.53 131,069,890.64 1,545,043,501.17 18,100
6 June 1,559,963,932.85 148,290,699.73 1,708,254,632.58 19,312
7 July 1,559,546,339.66 147,185,545.30 1,706,731,884.96 19,303
8 August 1,556,936,325.68 148,220,490.34 1,705,156,816.02 19,293
9 September 1,556,926,384.20 147,126,387.41 1,704,052,771.61 19,277
10 October 1,552,468,547.09 147,126,387.41 1,699,594,934.50 19,266
11 November 1,551,366,305.92 147,126,387.41 1,698,492,693.33 19,257
12 December 1,546,671,269.21 147,126,387.41 1,693,797,656.62 19,192
TOTAL 17,962,463,991.83 1,687,551,738.21 19,650,015,730.04
SUMMARY OF PENSIONS AND GRATUITY
FOR THE PERIOD JANUARY - DECEMBER, 2020

REPORT OF THE AUDITOR-GENERAL OF RIVERS STATE ON THE 2020 FINANCIAL STATEMENTS
78
NOTE X
DISCLOSURE NOTE IN STATE FINANCIAL STATEMENTS FOR THE YEAR 2020
Rivers State is participating in the World Bank asisted State Fiscal Transparency, Accountability and Sustainability Program for Result
(SFTAS Program). For participation in the Program, the State must fully meet the Eligibility Criteria and amount earned is determined by
performance against a set of Distributed Linked Results which terms are defined in Subsidiary Grant Agreement.
The achievement of performance by the State is verified by an Independent Verification Agent. The Program Expenditure Framework for
SFTAS Program comprises expenditures incurred in the following budget lines:
Personnel Overheads Total Personnel Overheads Total Personnel Overheads Total
Ministry of Finance 287,365,282.90 36,000,000.00 273,023,943.67 36,000,000.00 295,941,711.18 36,000,000.00
Ministry of Budget 95,585,690.44 36,000,000.00 100,212,485.85 36,000,000.00 122,263,640.06 36,000,000.00
Accountant-General's Office
Included in MOF
payroll 28,800,000.00
Included in MOF
payroll 28,800,000.00
Included in MOF
payroll 28,800,000.00
Board of Internal Revenue 704,867,341.60
O/H includes the
staff salary 704,867,341.60
O/H includes
the staff salary 704,867,341.60
O/H includes
the staff salary
The State was found eligible to participate in the Program for 2018 and 2019 for verification and disbursements occurred during the
year. Verification and disbursement for 2020 is to occur in 2021. The disbursements below were received as grants from Federal
Government in the State's (Consolidated Revenue Fund) and are reflected in the activity and balances under Note XXX (note for
cash and bank balances )
NOTE Z:
2020
Amount earned for 2018 Performance XX
Amount earned for 2019 Performance XX
Amount earned for 2020 Performance 950,000,000.00 -
-
2020 2019 2018
2019
-

REPORT OF THE AUDITOR-GENERAL OF RIVERS STATE ON THE 2020 FINANCIAL STATEMENTS
79
NotesReceipts controlled by
entity
Receipts for/by third
parties
(amounts in millions of naira)
RECEIPTS
Statutory Allocation 1 130,659,400,791.80 8,564,385,764.25
Value added tax (VAT) 1 21,367,850,953.54
Total FAAC 152,027,251,745.34
Taxation
Income Tax 2 106,180,064,406.61
Licences, Fines & Fees 3 686,286,283.00
Trading Activities
Proceeds from trading activities 4 7,598,634,185.32
Other Receipts 4.4 & 8.0 -8.3 2,936,203,713.00
Grants 950,000,000.00
Loans 24,949,851,076.00
Total Receipts 295,328,291,409.27 8,564,385,764.25
PAYMENTS
Operations
Salaries, Wages, & Employee Benefits 6 90,147,890,197.42
Operating Costs 7 14,719,800,633.00 1,530,049,473.00
CAPITAL EXPENDITURES
Purchase/Construction of property, plant &
equipment 8 168,359,956,753.15
LOANS & INTEREST REPAYMENTS
Repayment of borrowings & interest charges 9 24,793,763,029.00 8,781,572,021.00
Total Payments 298,021,410,612.57 10,311,621,494.00
Decrease/Increase in cash during the period (2,693,119,203.30)
Cash as at 1st January 2020 6,931,532,207.20
Cash as at 31st December 2020 4,238,413,003.90
RIVERS STATE GOVERNMENT OFNIGERIA
STATEMENT OF RECEIPTS & PAYMENTS
FOR THE YEAR ENDED 31ST DECEMBER, 2020

REPORT OF THE AUDITOR-GENERAL OF RIVERS STATE ON THE 2020 FINANCIAL STATEMENTS
80
Notes Actual Amounts Final BudgetDifference: Final
Budget & Actual
(amounts in millions of naira)
RECEIPTS
Statutory Allocation 1 152,027,251,745.34 116,061,299,360.52 (35,965,952,384.82)
Taxation 2 106,180,064,406.61 80,000,000,000.00 (26,180,064,406.61)
Licenses, Fines & Fees 3 686,286,283.00 920,923,213.00 234,636,930.00
Trading Activities 4 7,598,634,185.32 6,754,189,965.65 (844,444,219.67)
CAPITAL RECEIPTS:
4.4 & 8.0 -
8.3 28,836,054,789.00 54,624,944,285.48 25,788,889,496.48
IGR 2,936,203,713.00
GRANT (SFTAS) 950,000,000.00
LOAN (DOMESTIC) 24,949,851,076.00
CAPITAL RECEIPTS: 295,328,291,409.27 258,361,356,824.65 (36,966,934,584.62)
PAYMENTS
Operations
Salaries, Wages, & Employee Benefits 6 90,147,890,197.42 100,382,286,194.30 10,234,395,996.88
Operating Costs 7 14,719,800,633.00 18,929,375,834.45 4,209,575,201.45
Purchase/Construction of property, plant &
equipment 8 168,359,956,753.15 166,655,906,998.95 (1,704,049,754.20)
Repayment of borrowings & interest charges 9 24,793,763,029.00 10,025,000,000.00 (14,768,763,029.00)
Total Payments 298,021,410,612.57 295,992,569,027.70 (2,028,841,584.87)
RIVERS STATE GOVERNMENT OFNIGERIA
STATEMENT OF COMPARISON OF BUDGET & ACTUAL EXPENDITURE
FOR THE YEAR ENDED 31ST DECEMBER, 2020

REPORT OF THE AUDITOR-GENERAL OF RIVERS STATE ON THE 2020 FINANCIAL STATEMENTS
81
PART THREE
COMMENTS AND OBSERVATIONS ON THE FINANCIAL STATEMENTS
SCHEDULE OF COMPARISON OF BUDGET & ACTUAL AND
CLASSIFICATION OF RECEIPTS AND PAYMENTS
FOR THE YEAR ENDED 31ST DECEMBER, 2020
Classification Actual (N) Final Budget (N)
Difference: Favourable/ (Adverse) (N)
% Differe
nce
% of Actuals on Total
Opening Balance 12,165,122,809.08 RECEIPTS Statutory Allocation 152,027,251,745.34 116,061,299,360.52 35,965,952,384.82 30.99 51.48
Direct Taxes 106,180,064,406.61 80,000,000,000.00 26,180,064,406.61 32.73 35.95
Licences 213,173,198.16 20,789,000.00 192,384,198.16 925.41 0.07
Fines 32,795,422.61 400,000,000.00 -367,204,577.39 -91.80 0.01
Fees 440,317,662.23 500,134,213.00 - 59,816,550.77 -11.96 0.15
Earnings 603,297.00 400,000,000.00 -399,396,703.00 -99.85 0.00
Sales 668,776,879.33 150,670,000.00 518,106,879.33 343.87 0.23
Rent of Government Buildings 84,850,471.78 100,000,000.00 -15,149,528.22 -15.15 0.03
Investment Income (Dividend) 6,844,403,537.21 6,103,519,965.65 740,883,571.56 12.14 2.32
Other Revenue/ Receipts 2,936,203,713.00 54,624,944,288.48 -51,688,740,575.48 -94.62 0.99
Capital Receipts: Grant SFTAS) 950,000,000.00 - 950,000,000.00 - 0.32
Domestic Loans 24,949,851,076.00 - 24,949,851,076.00 - 8.45
Total Receipts for Y2020 295,328,291,409.27 258,361,356,827.65 36,966,934,581.62 14.31 100
Total Revenue 307,493,414,218.35 EXPENDITURE Salaries, Wages and Employee Benefits 90,147,890,197.42 100,382,286,194.30 10,234,395,996.88 10.20 30
Overhead 13,189,751,160.00 18,429,375,834.00 5,239,624,674.00 28.43 4
Bank Charges 1,530,049,473.00 500,000,000.00 - 1,030,049,473.00 -206.01 1
Interest Charges on Borrowings 24,793,763,029.00 10,025,000,000.00 -14,768,763,029.00 -147.32 8
Total Recurrent Expenses 129,661,453,859.42 129,336,662,028.30 - 324,791,831.12 - 0.25 44
Capital Expenditure 168,359,956,753.15 166,655,906,998.95 - 1,704,049,754.20 - 1.02 56
Total Expenditures 298,021,410,612.57 295,992,569,027.25 - 2,028,841,585.32 - 0.69 100

REPORT OF THE AUDITOR-GENERAL OF RIVERS STATE ON THE 2020 FINANCIAL STATEMENTS
82
3.0 BUDGETARY/ACTUAL PERFORMANCE REVIEW
The Rivers State approved budgeted expenditure stood at N295,992,569,027.25. The
approved budget had a projected revenue of N258,361,356,827.65.
However, the actual amounts stood at N298,021,410,612.57 for actual total
expenditure and N295,328,291,409.27 for actual total revenue, representing a
variance of N36,966,934,581.62 in revenue and N2,028,841,585.32 in expenditure. A
breakdown of the actual total expenditure shows recurrent expenditure which stood
at N129,661,453,859.42 represented 44% of the actual expenditure while capital
expenditure had a total of N168,359,956,753.15 representing 56% of the actual
expenditure.
Actual (N)
Budget Estimate
(N)
Total Revenue 295,328,291,409.27 258,361,356,827.65
Recurrent Expenditure 129,661,453,859.42
129,336,662,028.30
Capital Expenditure
168,359,956,753.15 166,655,906,998.95
Total Expenditure 298,021,410,612.57 295,992,569,027.25
Table 1

REPORT OF THE AUDITOR-GENERAL OF RIVERS STATE ON THE 2020 FINANCIAL STATEMENTS
83
3.1 REVENUE PERFORMANCE IN 2020
The table below shows the actual revenue performance for the year:
Classification Revenue (N)
Internal Revenue (IGR) 117,401,188,587.93
Statutory Allocation (FAAC) 130,659,400,791.80
VAT 21,367,850,953.54
Capital Receipts 25,899,851,076.00
Total Receipts 295,328,291,409.27
Table 2
This is further broken down into different revenue heads as follows;
44%
56%
Fig. 3.1 Actual Expenditure Spread
Recurrent Expenditure Capital Expenditure

REPORT OF THE AUDITOR-GENERAL OF RIVERS STATE ON THE 2020 FINANCIAL STATEMENTS
84
Classification Actual Budget
Statutory Allocation 130,659,400,791.80
VAT 21,367,850,953.54
Sub-total 152,027,251,745.34 116,061,299,360.52
Direct Taxes 106,180,064,406.61 80,000,000,000.00
Licences 213,173,198.16 20,789,000.00
Fines 32,795,422.61 400,000,000.00
Fees 440,317,662.23 500,134,213.00
Earnings 603,297.00 400,000,000.00
Sales 668,776,879.33 150,670,000.00
Rent of Government Buildings 84,850,471.78 100,000,000.00
Investment Income (Dividend) 6,844,403,537.21 6,103,519,965.65
Other Revenue/ Receipts 2,936,203,713.00 54,624,944,288.48
Sub-total - Independent Revenue 117,401,188,587.93 142,300,057,467.13
Capital Receipts: Grant SFTAS) 950,000,000.00 0.00
Domestic Loans 24,949,851,076.00 0.00
Sub-total - Capital Receipt 25,899,851,076.00 0.00
Total Receipts 295,328,291,409.27 258,361,356,827.65
Table 3
From the above table, the total receipts to the State Government during the year
ended 31st December, 2020 stood at N295,328,291,409.27 as against projected
revenue of N258,361,356,827.65. This represents a significant favourable difference
of 14.31% above projection.
3.1.1 INTERNALLY GENERATED REVENUE (IGR)
The State recorded a 2% decrease in total Internally Generated Revenue from
N119,888,000,638.74 in 2019 to N117,401,188,587.93 in 2020. Generally, the
decrease in total independent revenue can be traced to decrease in Personal Income
Taxes, Earnings, Sales and other miscellaneous income. The Rivers State Internal
Revenue Service is however, encouraged to improve on these and tap into other
sources of revenue which have not been exploited in the past, in order to further boost
IGR of the State. The Revenue Service should also ensure that all taxable sources are
brought into the tax net.

REPORT OF THE AUDITOR-GENERAL OF RIVERS STATE ON THE 2020 FINANCIAL STATEMENTS
85
COMPARISON OF 2020 AND 2019 ACTUAL RECEIPTS AND PAYMENTS
CLASSIFICATION ACTUAL YEAR
2020 (N)
ACTUAL YEAR 2019 (N) Difference %
% Difference
Statutory Allocations: FAAC
130,659,400,791.80
161,290,989,363.45
-30,631,588,571.65 -19
Value Added Tax Allocation
21,367,850,953.54
17,629,628,442.94
3,738,222,510.60 21
Sub-total - Statutory Allocation
152,027,251,745.34
178,920,617,806.39
-26,893,366,061.05
Total Internally Generated Revenue (IGR)
117,401,188,587.93
119,888,000,638.74 - 2,486,812,050.81 -2
Capital Receipts 25,899,851,076.00
25,491,277,614.00
408,573,462.00 2
Total Receipts 295,328,291,409.27
324,299,896,059.13
- 28,971,604,649.86 -9
Payments: -
Total Recurrent Payments
113,649,262,851.42
92,723,551,957.96
- 20,925,710,893.46 23
Total Capital Payments
167,409,956,753.15
221,937,955,644.33
54,527,998,891.18 -25
Total Payments 281,059,219,604.57
314,661,507,602.29
33,602,287,997.72 -11
Table 4

REPORT OF THE AUDITOR-GENERAL OF RIVERS STATE ON THE 2020 FINANCIAL STATEMENTS
86
3.1.2 EXTERNAL/DEPENDENT SOURCES (FEDERAL ACCOUNT ALLOCATION SOURCES)
Examination of the external or dependent sources revealed that the Statutory
Allocation sector with a 51% contribution to the total recorded a significant shortfall
of N35,965,952,384.82 when compared with the budgetary provision of
N116,061,299,360.52. The shortfalls can be traced to receipts from the Federation
Account.
3.2 EXPENDITURE
3.2.1 RECURRENT EXPENDITURE
The State recorded about 39.84% increase in the total recurrent expenditure from
N92,723,551,957.96 in 2019 to N129,661,453,859.42 for the year ended 31st
December, 2020 as obtained in the General Purpose Financial Statement. The actual
recurrent expenditure is also more than the projected recurrent expenditure of
N129,336,662,028.75 (as shown in the Statement of Comparison of Budget and
Actual), recording overall deficit of N324,791,830.67 in recurrent expenditure profile
for 2020. MDAs have been advised to ensure that increase in recurrent expenditure
do not escalate beyond the projected amounts. Again, compliance to this advice is not
adhered to, as recorded in this year’s report. It is, however, expected that capital
expenditure takes a substantial part of the total expenditure.
Percentage distribution of the recurrent expenditure component is as follows:
Salaries, Wages and Employee Benefits
90,147,890,197.42 69.53%
Overhead 13,189,751,160.00 10.17%
Bank Charges 1,530,049,473.00 1.18%

REPORT OF THE AUDITOR-GENERAL OF RIVERS STATE ON THE 2020 FINANCIAL STATEMENTS
87
Interest Charges on Borrowings
24,793,763,029.00 19.12%
Total 129,661,453,859.42 100.00%
A comparative analysis of the recurrent expenditure further shows the following:
2020 Actual 2019 Actual 2018 Actual
Personnel Costs 90,147,890,197.42
63,208,479,962.48
62,287,592,471.70
Operating Costs 14,719,800,633.00
13,008,976,848.00
12,985,377,015.00
Repayment of Borrowings and Interest
Charges
24,793,763,029.0
0
16,506,095,147.48 16,452,461,345.35
69.53%
10.17%
1.18%
19.12%
Fig. 3.2 Distribution of Recurrent Expenditure
Salaries, Wages and EmployeeBenefits
Overhead
Bank Charges
Interest Charges on Borrowings

REPORT OF THE AUDITOR-GENERAL OF RIVERS STATE ON THE 2020 FINANCIAL STATEMENTS
88
Total 129,661,453,859.42
92,723,551,957.96
91,725,430,832.05
Further analysis reveals that there was an overall N36,937,901,901.46 or
39.84% increase in recurrent expenditure when compared to 2019 as shown below:
2020 Actual 2019 Actual Savings/(Deficit)
Personnel
Costs 90,147,890,197.42
63,208,479,962.48 -26,939,410,234.94
Operating Costs 14,719,800,633.00
13,008,976,848.00 -1,710,823,785.00
Repayment of
Borrowings and Interest
Charges
24,793,763,029.00
16,506,095,147.48 -8,287,667,881.52
Total 129,661,453,859.42
92,723,551,957.96 -36,937,901,901.46
3.2.2 COMPARATIVE ANALYSIS OF CAPITAL EXPENDITURE
In the GPFS, major areas of Actual Capital Expenditure are itemized as shown below:
Actual Budget % Actual on Budget
% Actual on Total
Administrative Sector
20,464,897,837.98
9,677,403,200.00
-111.47% 12.16%
Economic Sector
85,278,028,393.08
69,109,240,685.64
-23.40% 50.65%
Social Services Sector
23,947,396,852.26
3,490,000,000.00
-586.17% 14.22%
Law and Justice
7,207,173,735.28
41,032,413,328.94
82.44% 4.28%
Special Heads
31,462,459,934.55
43,346,849,784.37
27.42% 18.69%

REPORT OF THE AUDITOR-GENERAL OF RIVERS STATE ON THE 2020 FINANCIAL STATEMENTS
89
TOTAL 168,359,956,753.15
166,655,906,998.95 100.00%
Administrative Sector accounted for about 12.16% of the total expenditure. While
Economic, Social Services Sectors and Law/Justice and accounted for 50.65%, 14.22%
and 4.28% respectively. Special Capital Expenditure Heads accounted for 18.69%.
Further investigations and physical project inspection exercise shows that the
significant expenditure on developmental projects across the State account for the
Economic Sector-skewed Capital Expenditure.
However, the State recorded a total savings of N53,577,998,891.18 when compared
to the actual Capital Expenditure of 2019 as shown below:
2020 Actual 2019 Actual Savings/(Deficit)
Administrative Sector
20,464,897,837.98
60,376,415,378.30 39,911,517,540.32
Economic Sector 85,278,028,393.08
87,248,866,397.15 1,970,838,004.07
Social Services Sector 23,947,396,852.26
64,841,736,261.38 2,263,763,872.22
12.16%
50.65%
14.22%
4.28%18.69%
Fig 3.3 Sectoral Distribution of Actual Capital Expenditure
Administrative Sector Economic Sector Social Services Sector
Law and Justice Special Heads

REPORT OF THE AUDITOR-GENERAL OF RIVERS STATE ON THE 2020 FINANCIAL STATEMENTS
90
Law and Justice 7,207,173,735.28
9,470,937,607.50 40,894,339,409.12
Special Heads
31,462,459,934.55 0 - 31,462,459,934.55
TOTAL 168,359,956,753.15
221,937,955,644.33 53,577,998,891.18
3.3 REPAYMENTS ON BORROWINGS AND INTEREST CHARGES
Repayments on borrowings and interest charges, representing 8.32% of Total
Expenditure for the period as detailed on the Consolidated Revenue Fund (Statement
No. 3), recorded an adverse budget as the actual expenditure was N14,768,763,029.00
more than the budget of N10,025,000,000.00 as shown below.
EXPENDITURE ACTUAL FINAL BUDGET % OF ACTUAL ON TOTAL
Salaries, Wages and Employee Benefits
90,147,890,197.42
100,382,286,194.30 30.25%
Operating Costs
14,719,800,633.00
18,929,375,834.45 4.94%
Capital Expenditure
168,359,956,753.15
166,655,906,998.95 56.49%
Repayment of borrowings & interest charges
24,793,763,029.00
10,025,000,000.00 8.32%
298,021,410,612.57
295,992,569,027.70 100.00%
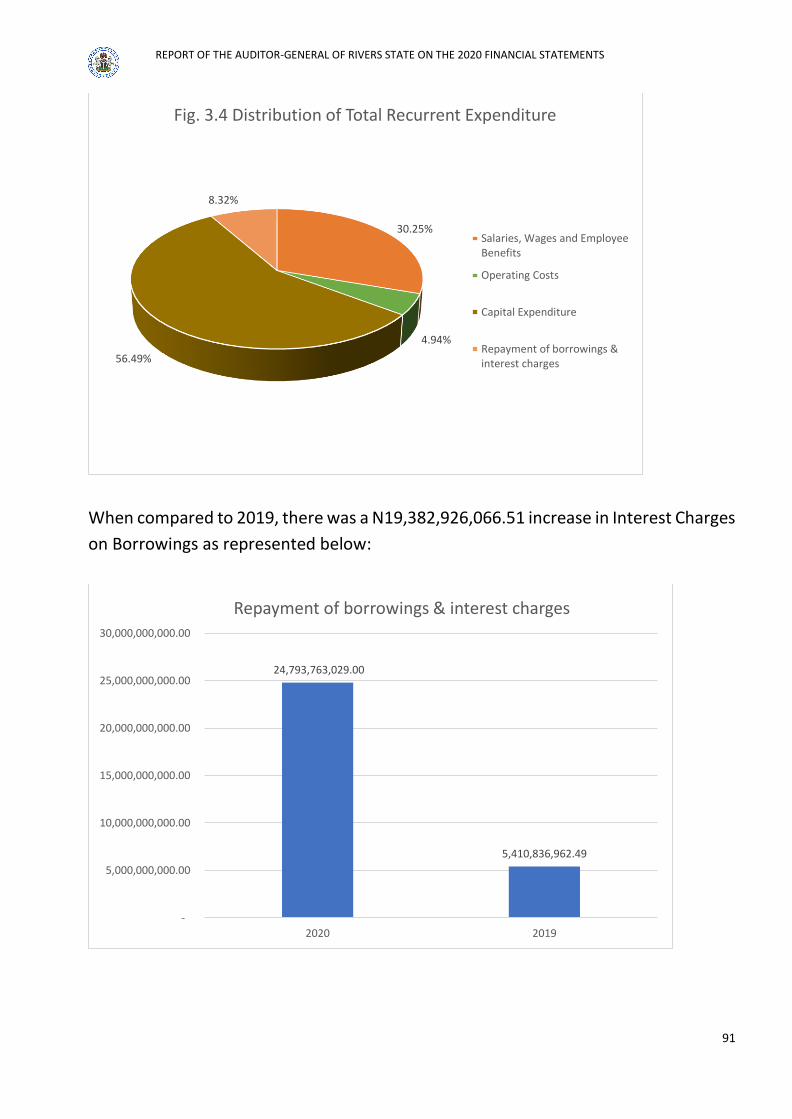
REPORT OF THE AUDITOR-GENERAL OF RIVERS STATE ON THE 2020 FINANCIAL STATEMENTS
91
When compared to 2019, there was a N19,382,926,066.51 increase in Interest Charges
on Borrowings as represented below:
30.25%
4.94%
56.49%
8.32%
Fig. 3.4 Distribution of Total Recurrent Expenditure
Salaries, Wages and EmployeeBenefits
Operating Costs
Capital Expenditure
Repayment of borrowings &interest charges
24,793,763,029.00
5,410,836,962.49
-
5,000,000,000.00
10,000,000,000.00
15,000,000,000.00
20,000,000,000.00
25,000,000,000.00
30,000,000,000.00
2020 2019
Repayment of borrowings & interest charges

REPORT OF THE AUDITOR-GENERAL OF RIVERS STATE ON THE 2020 FINANCIAL STATEMENTS
92
3.4 BANK CHARGES
There was a 27% decrease in bank charges from N2,101,860,592.30 in 2019 to N
1,530,049,473.00 in 2020. While this is still in excess of the final budget of
N500,000,000.00, it represents an improvement from the records of 2019. However,
there is still room to improve on bank reconciliation and especially on recovery of
excess bank charges.
ACTUAL BUDGET 2019
BANK CHARGES 1,530,049,473.00
500,000,000.00
2,101,860,592.30
-
500,000,000.00
1,000,000,000.00
1,500,000,000.00
2,000,000,000.00
2,500,000,000.00
2020 2019
Fig. 3.6 Bank Charges

REPORT OF THE AUDITOR-GENERAL OF RIVERS STATE ON THE 2020 FINANCIAL STATEMENTS
93
PART FOUR
OBSERVATIONS AND COMMENTS ON MINISTRIES, DEPARTMENTS AND AGENCIES
(MDAs)
4.1 EXTERNAL AUDITORS
Some MDAs are required by Section 125 (3) of the Constitution of the Federal Republic
of Nigeria 1999 (as amended), to submit their audited accounts to the Office of the
Auditor-General. Unfortunately, most MDAs do not comply with this provision or do
not take it serious. Hence, compliance is still poor. The level of compliance of these
MDAs as at 31st December, 2020 is as shown below:
LEVEL OF COMPLIANCE ON EXTERNAL AUDITORS’ REPORTS AS AT 31ST DECEMBER,
2020
S/NO MDA YEAR SUBMITTED
1 Ken Saro wiwa Polytechnic, Bori 2018
2 Rivers State Universal Basic Education Board 2016
3 Ignatius Ajuru University of Education 2012
4 Rivers State Housing and Property
Development Authority
2017
5 Rivers State Primary Health Care Management
Board
No submission
6 Hospitals Management Board 2010
7 Rivers State Micro Finance Agency 2019
8 Rivers State Waste Management Agency No submission
9 Rivers State Senior Secondary Schools Board No submission
10 Rivers State Television Authority 2017
11 Rivers State University 2011
12 Rivers State Newspaper Corporation 2009
13 Rivers State Board of Internal Revenue 2018
14 College of Health Science and Management
Technology
No submission
15 Rivers State Bureau of Public Procurement 2019
16 PABOD Finance and Investment No submission
17 Rivers State Polytechnic No submission

REPORT OF THE AUDITOR-GENERAL OF RIVERS STATE ON THE 2020 FINANCIAL STATEMENTS
94
We observed also that some MDAs complain of inadequate funds as the reason for
non-compliance. Others do not take this statutory provision serious despite our regular
observations. Again, it is our suggestion that a separate expenditure head be created
for this purpose to enable us adequately monitor compliance.
All government institutions authorized to engage External Auditors are expected to
follow laid down procedures as provided in Section 125 (3) of the Constitution of the
Federal Republic of Nigeria (as amended). External Auditors should be replaced
annually except reappointed through the same process in which he should not stay
beyond a reasonable tenure, in order not to compromise their independence.
4.2 INTERNAL CONTROL
Internal Control refer to the whole system of controls, financial and otherwise,
established by the management in order to carry on the business (in this context) of
an MDA in an orderly and efficient manner to ensure that management policies are
adhered to, so that the assets are safeguarded and to secure the completeness and
accuracy of the records of the MDAs.
We have observed in our routine audits that internal control in most MDAs is weak.
More so, they are mostly redundant. As a result, the following weaknesses were
observed:
4.2.1 Records / vouchers are not written immediately transactions take place. Hence,
records are entered in arrears.
4.2.2 In most MDAs, there are no internal audit unit to monitor the procedures
established by management. In places where there are internal audit units, the
management do not adhere to the advice of the internal auditors, thereby
overstepping the same control they established.
4.2.3 There is no separation of duties of personnel, particularly in Finance and
Accounts departments.
In view of the above, our recommendations are as follows:

REPORT OF THE AUDITOR-GENERAL OF RIVERS STATE ON THE 2020 FINANCIAL STATEMENTS
95
4.2.4 Methods of Book keeping and records
Books should be updated regularly and not allowed to fall into arrears. Also,
books should be balanced at regular intervals, and such balances should include
the reconciliation of control accounts with detailed records and supporting
documents.
Trial balances are forms of accounting control that infuse additional reliability
into the system by keeping an internal record of credits and debits to allow
businesses to identify issues early.
4.2.5 Internal Audit
The Internal Audit Unit in most MDAs is not effective, hence the inability to
perform its functions - independent appraisal of activities and operations of the
MDA to ensure orderliness, accuracy and reliability of records, prevention and
early detection of fraud and errors, and timely report of observations to
management for necessary actions.
4.2.6 Separation and rotation of duties
There should be a well-defined segregation of duties between departments,
units and individuals, such that no one person handles a particular transaction
from the beginning to the end. Also, rotate the duties of staff to ensure that no
one deals with an aspect of job permanently. The essence is to ensure that such
individual does not misappropriate assets/funds and conceal his action by
falsifying the relevant records. Strategic and sensitive units of the MDAs such as
cash withdrawals, vouching, disbursement, book-keeping, dump-site, ad-hoc
staff, stores, maintenance workshop, should be properly segregated among
experienced administrative and finance officers.
4.3 UNRETIRED NON-PERSONAL ADVANCES
In most MDAs, advances granted as non-personal advances are not retired. Those
granted for purchase of office items have no invoices, receipts and other documentary
evidence.
In some MDAs, votes are spent as though they were allowance to departmental
heads. Hence, there are no attempts to retire such votes.

REPORT OF THE AUDITOR-GENERAL OF RIVERS STATE ON THE 2020 FINANCIAL STATEMENTS
96
4.4 STATE-OWNED HIGHER INSTITUTIONS
We have advised all higher institutions to judiciously account for all internally
generated revenue. However, we are yet to record a good level of compliance.
Again, the higher institutions have in their records, more casual staff than necessary.
Hence, recording huge sums on casual staff salary arrears. Some casual staff salaries
are in arrears of over a year.
4.5 PENSION, GRATUITY AND DEATH BENEFITS VERIFICATION
It is the statutory duty of the Auditor-General to certify all pension, gratuity and death
benefit payment. Part of this duty is to ensure that monies so certified have been paid
as authorized. Financial Regulations No. 72 volume 96 (2009 Edition), Section 109 (g),
empowers the Auditor-General to carry out pre and post audit of payments of
pensions, gratuities and death benefits of the State.
The figures below, however, represent the amounts duly certified by the Auditor-
General as Pension, Gratuity and Death Benefits of the State for the period January to
December, 2020.

REPORT OF THE AUDITOR-GENERAL OF RIVERS STATE ON THE 2020 FINANCIAL STATEMENTS
97
CERTIFIED PENSIONS, GRATUITY AND DEATH BENEFITS LIABILITY 2020
Note that the number of files represents the persons that were certified as qualified
for payment of pension and gratuity. Also, death benefits liability is included in the
pension and gratuity liability.
COMPARISON OF CERTIFIED PENSION, GRATUITY AND DEATH BENEFITS LIABILITY
2020 2019 2018
NO. OF FILES CERTIFIED 1,498.00 1,811.00 1,478.00
PENSIONS (N) 3,115,470,355.50 3,673,404,924.27 2,815,246,336.20
GRATUITY 9,784,378,967.39 11,177,726,326.14 7,043,067,570.36
Again, note that the increase or decrease in the table above is due to the number of
files certified for payment in the respective years. It is also due to the grade level of
staff retired in those years; and not increase in the rate or scale used for computation.
4.6 MONTHLY PAYROLL
There is need for the Auditor-General to carry out pre and post audit of monthly wage
bill to enable the Office update its data on a regular basis.