Embed Size (px)
Citation preview
Report of the
Comptroller and Auditor General of India
on
STATE FINANCES
for the year ended 31 March 2016
Government of Madhya Pradesh Report No. 6 of the year 2016
REPORT OF THE
COMPTROLLER AND AUDITOR GENERAL OF INDIA
on
STATE FINANCES
for the year ended 31 March 2016
GOVERNMENT OF MADHYA PRADESH
Report No. 6 of the year 2016
TABLE OF CONTENTS
Description Paragraph Page
No.
Preface ix
Executive Summary xi
CHAPTER 1
FINANCES OF THE STATE GOVERNMENT
Profile of State 1
Introduction 1.1 2
Summary of fiscal transactions in 2015-16 1.1.1 2
Review of the fiscal situation 1.1.2 3
Budget Estimates and Actuals 1.1.3 5
Gender Budgeting 1.1.4 5
Resources of the State 1.2 7
Resources of the State as per Annual Finance Accounts 1.2.1 7
Funds directly transferred to State Implementing Agencies
outside the State Budget
1.2.2 9
Revenue Receipts 1.3 10
State’s Own Resources 1.3.1 12
Grants-in-aid from GoI 1.3.2 14
Central Tax transfers 1.3.3 14
Optimisation of the XIII Finance Commission Grants and
XIV Finance Commission Grants
1.3.4 15
Comparison of devolution of taxes as well as grants
awarded by XIII FC during 2014-15 and by XIV FC
during 2015-16
1.3.5 15
Foregone Revenue 1.3.6 16
Cess on ‘Transfer of Vacant Land and Land used for the
purpose of Agriculture’ lying idle/unutilised
1.3.7 16
Capital Receipts 1.4 18
Proceeds from disinvestment 1.4.1 18
Recoveries of Loans and Advances 1.4.2 18
Public Debt Receipts 1.4.3 18
Public Account Receipts 1.5 18
Application of Resources 1.6 19
Audit Report on State Finances for the year ended 31 March 2016
ii
Description Paragraph Page
No.
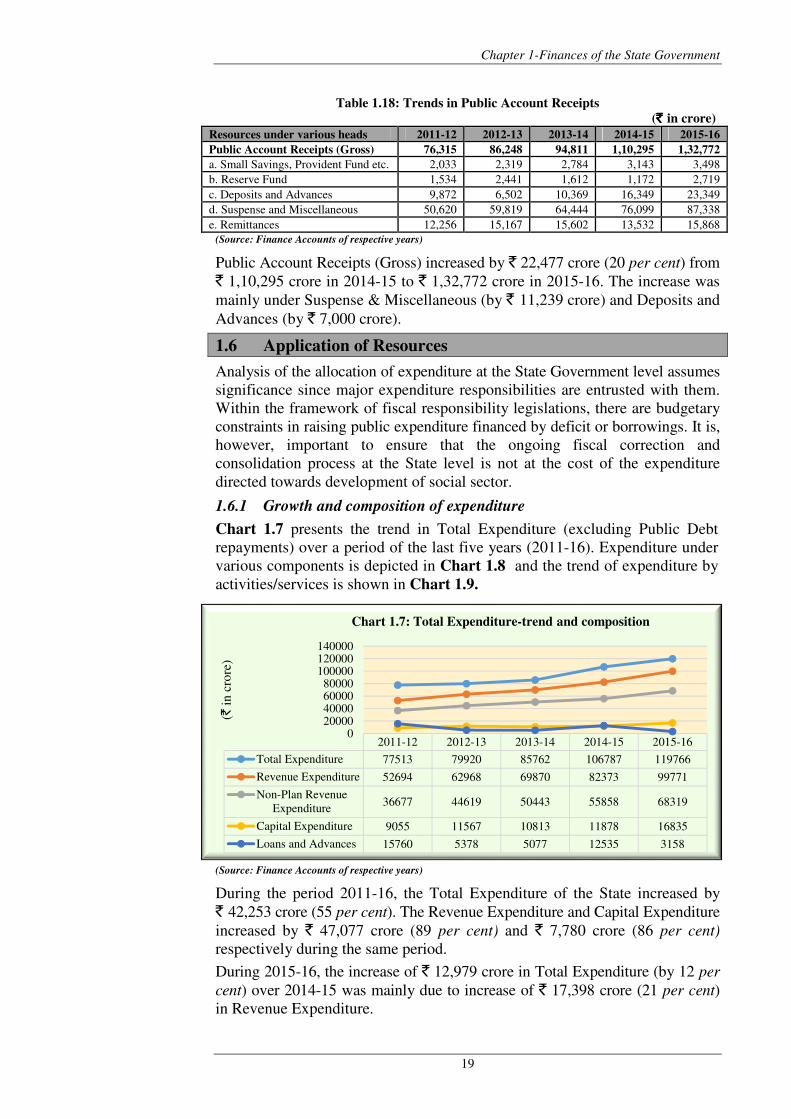
Growth and composition of expenditure 1.6.1 19
Trends in growth of Capital Expenditure (CE) 1.6.2 21
Trends in growth of Revenue Expenditure 1.6.3 22
Expenditure on salaries, interest payments, pension
payments and subsidies
1.6.4 23
Financial Assistance by State Government to Local
Bodies and other institutions
1.6.5 26
Devolution of funds and auditing arrangements of Local
Bodies
1.6.6 26
Quality of Expenditure 1.7 27
Adequacy of Public Expenditure 1.7.1 28
Efficiency of Expenditure use 1.7.2 29
Financial analysis of Government Expenditure and
Investments
1.8 30
Investment and Returns 1.8.1 30
Incomplete Projects 1.8.2 31
Loans and Advances by the State Government 1.8.3 32
Cash balances and Investment of Cash balances 1.8.4 33
Assets and Liabilities 1.9 34
Growth and composition of assets and liabilities 1.9.1 34
Fiscal liabilities 1.9.2 34
Setting-up of Sinking Fund for amortisation of all loans 1.9.3 36
Status of Guarantees – contingent liabilities 1.9.4 36
Inoperative Reserve Funds 1.9.5 37
Debt Management 1.10 37
Debt Sustainability 1.10.1 37
Sufficiency of Non-Debt Receipts 1.10.2 38
Net availability of borrowed funds 1.10.3 38
Maturity Profile of State Debt 1.10.4 39
Ujwal DISCOM Assurance Yojana (UDAY) 1.10.5 39
Fiscal Imbalances 1.11 40
Components of Fiscal Deficit and its Financing Pattern 1.11.1 41
Quality of Deficit/Surplus 1.12 42
Table of contents
iii
Description Paragraph Page
No.
Conclusion and Recommendations 1.13 42
CHAPTER 2
FINANCIAL MANAGEMENT AND BUDGETARY CONTROL
Introduction 2.1 45
Summary of Appropriation Accounts 2.2 45
Financial Accountability and Budget Management 2.3 46
Appropriation vis-à-vis Allocative Priorities-significant
savings
2.3.1 46
Persistent savings 2.3.2 47
Excess expenditure under schemes 2.3.3 49
Unutilised provisions under schemes 2.3.4 49
Excess over provisions relating to previous years
requiring regularisation
2.3.5 49
Unnecessary/excessive Supplementary provision 2.3.6 50
Excessive/unnecessary re-appropriation/surrender of
funds
2.3.7 50
Anticipated savings not surrendered 2.3.8 50
Defective sanction to re-appropriation/surrender of funds 2.3.9 50
Rush of expenditure 2.3.10 51
Drawal of funds and parking in Civil Deposit 2.3.11 51
Expenditure incurred without provision 2.3.12 51
Unrealistic Budget Estimates 2.3.13 51
Misclassification of Budget provision under Revenue
Section and Capital Section
2.3.14 52
Non-surrender of savings of budget allotment for District
Poverty Initiatives Project (DPIP)
2.3.15 52
Outcome of Review of Selected Grants 2.4 53
Audit Report on State Finances for the year ended 31 March 2016
iv
Description Paragraph Page
No.
Summarised position 2.4.1 53
Persistent savings 2.4.2 54
Substantial savings 2.4.3 54
Unutilised provisions in various schemes under selected
grants
2.4.4 54
Misclassification of Budget provision 2.4.5 55
Central Funds Parked in Civil Deposit 2.4.6 55
Conclusion and Recommendations 2.5 55
CHAPTER 3
FINANCIAL REPORTING
Delay in furnishing Utilisation Certificates 3.1 57
Status of Placement of Separate Audit Reports of
Autonomous Bodies in the State Assembly
3.2 58
Reporting of Misappropriation, Losses and Defalcations
etc.
3.3 59
Pendency in submission of Detailed Countersigned
Contingent bills against Abstract Contingent bills
3.4 61
Reconciliation of Departmental receipts and expenditure 3.5 61
Adjustment of temporary advances 3.6 62
Opaqueness in Government Accounts 3.7 63
Payment of Previous year’s liabilities from the next year’s
Budget
3.8 63
Irregular maintenance of bank accounts 3.9 64
Submission of the details of grants or loans paid to bodies
and authorities
3.10 65
Maintenance of Personal Deposit Accounts 3.11 66
Conclusion and Recommendations 3.12 70
Table of contents
v
APPENDICES
Sl. No. Particulars Page No.
1.1 State Profile (Madhya Pradesh) 73
1.2 Part-A Structure of Government Accounts 74
1.2 Part -B Statement showing apportionment of assets and liabilities of the erstwhile State of Madhya Pradesh as on 31 March 2016 between successor States of Madhya Pradesh and Chhattisgarh
75
1.3 Part -A Methodology adopted for the assessment of fiscal
position 76
1.3 Part -B Fiscal Responsibility and Budget Management
(FRBM) Act, 2005
77
1.4 Time series data on the State Government finances 79
1.5 Part -A Abstract of receipts and disbursements for the year
2015-16 82
1.5 Part -B Summarised financial position of the Government
of Madhya Pradesh as on 31 March 2016
85
1.6 Details of shortfalls in utilisation of Gender Budget under category 1 and 2
87
1.7 Optimisation of the XIII Finance Commission
grants during the year 2015-16 (` 10 lakh or
more)
89
1.8 - A Devolution of Functions by State Government to
Urban Local Bodies
90
1.8 - B Devolution of Functions by State Government to
Panchayati Raj Institutions
90
1.9 Financial position of statutory
corporations/government companies running in
loss as on 31 March 2016 for the latest year for
which accounts were finalised
91
1.10 Status of PPP projects under various sectors as on June 2016
93
2.1 Statement of various grants/appropriations where savings were ` 10 crore or more and also more than 20 per cent of the total provision
94
2.2 (A) Cases of schemes in which substantial savings occurred (` 50 crore and above in each case) in respect of grants/appropriations given in table 2.2
97
2.2 (B) Statement of various schemes under grants/
appropriations where excess expenditure was ` 10
crore or more in each case and also more than 20
per cent of the total provision
104
2.2 (C) Cases of schemes in which entire provision of 108
Audit Report on State Finances for the year ended 31 March 2016
vi
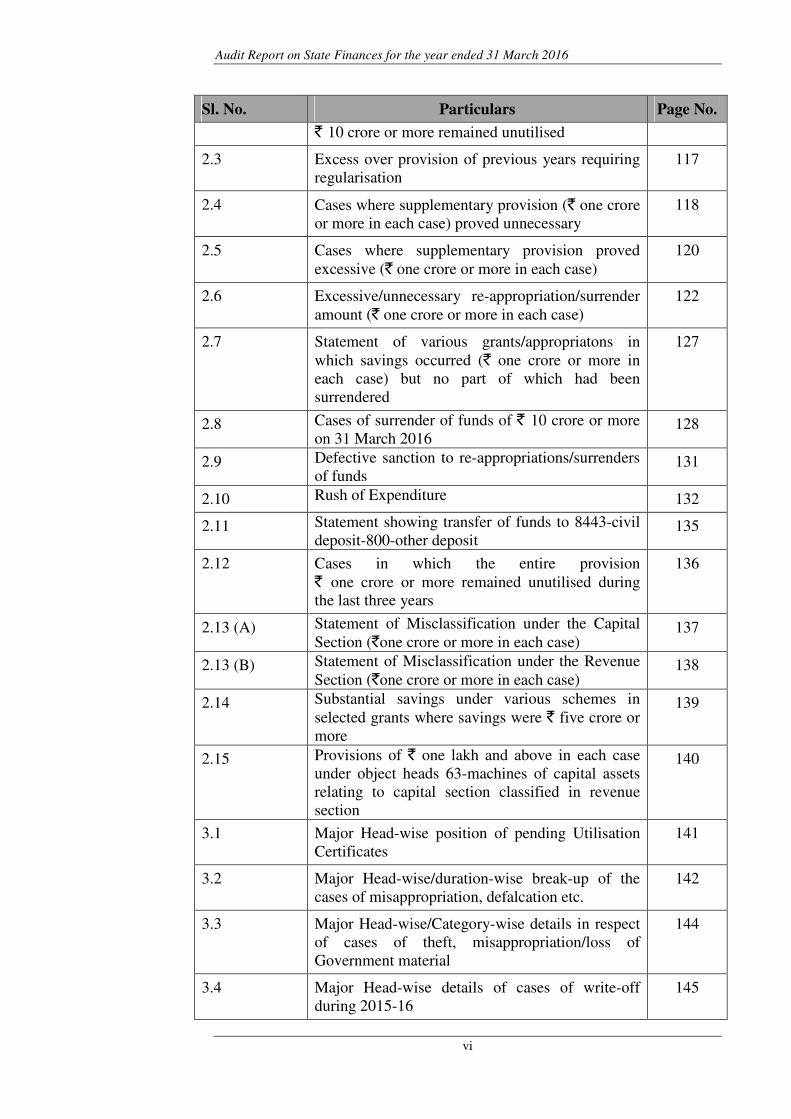
Sl. No. Particulars Page No.
` 10 crore or more remained unutilised
2.3 Excess over provision of previous years requiring
regularisation
117
2.4 Cases where supplementary provision (` one crore
or more in each case) proved unnecessary
118
2.5 Cases where supplementary provision proved
excessive (` one crore or more in each case)
120
2.6 Excessive/unnecessary re-appropriation/surrender
amount (` one crore or more in each case)
122
2.7 Statement of various grants/appropriatons in
which savings occurred (` one crore or more in
each case) but no part of which had been
surrendered
127
2.8 Cases of surrender of funds of ` 10 crore or more
on 31 March 2016 128
2.9 Defective sanction to re-appropriations/surrenders
of funds 131
2.10 Rush of Expenditure 132
2.11 Statement showing transfer of funds to 8443-civil
deposit-800-other deposit 135
2.12 Cases in which the entire provision
` one crore or more remained unutilised during
the last three years
136
2.13 (A) Statement of Misclassification under the Capital
Section (`one crore or more in each case) 137
2.13 (B) Statement of Misclassification under the Revenue
Section (`one crore or more in each case) 138
2.14 Substantial savings under various schemes in
selected grants where savings were ` five crore or
more
139
2.15 Provisions of ` one lakh and above in each case
under object heads 63-machines of capital assets
relating to capital section classified in revenue
section
140
3.1 Major Head-wise position of pending Utilisation
Certificates
141
3.2 Major Head-wise/duration-wise break-up of the
cases of misappropriation, defalcation etc.
142
3.3 Major Head-wise/Category-wise details in respect
of cases of theft, misappropriation/loss of
Government material
144
3.4 Major Head-wise details of cases of write-off
during 2015-16
145
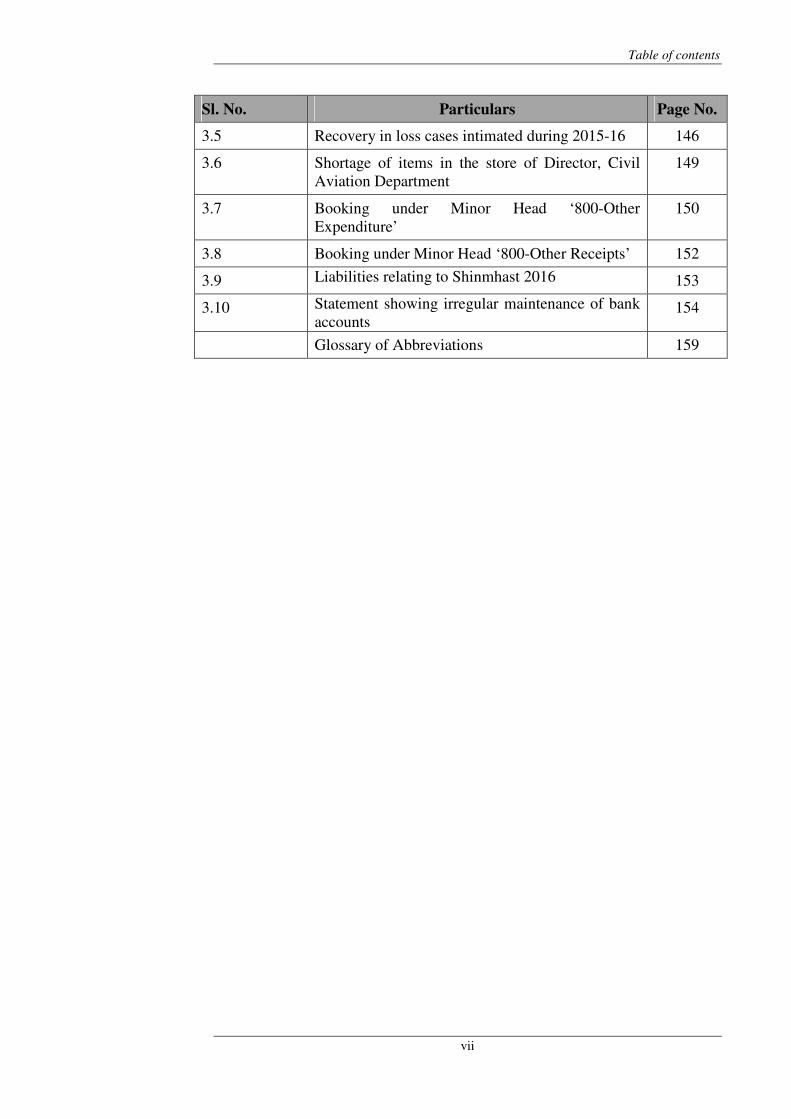
Table of contents
vii
Sl. No. Particulars Page No.
3.5 Recovery in loss cases intimated during 2015-16 146
3.6 Shortage of items in the store of Director, Civil
Aviation Department
149
3.7 Booking under Minor Head ‘800-Other
Expenditure’
150
3.8 Booking under Minor Head ‘800-Other Receipts’ 152
3.9 Liabilities relating to Shinmhast 2016 153
3.10 Statement showing irregular maintenance of bank
accounts 154
Glossary of Abbreviations 159
ix
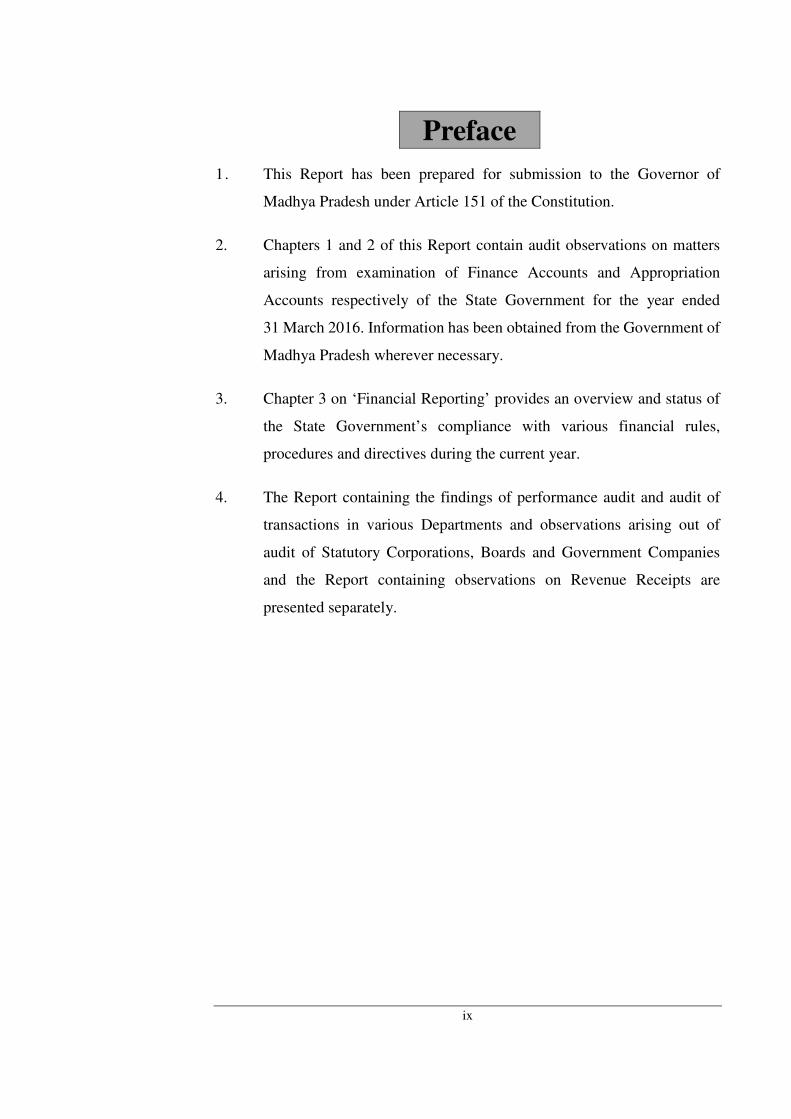
Preface
1. This Report has been prepared for submission to the Governor of
Madhya Pradesh under Article 151 of the Constitution.
2. Chapters 1 and 2 of this Report contain audit observations on matters
arising from examination of Finance Accounts and Appropriation
Accounts respectively of the State Government for the year ended
31 March 2016. Information has been obtained from the Government of
Madhya Pradesh wherever necessary.
3. Chapter 3 on ‘Financial Reporting’ provides an overview and status of
the State Government’s compliance with various financial rules,
procedures and directives during the current year.
4. The Report containing the findings of performance audit and audit of
transactions in various Departments and observations arising out of
audit of Statutory Corporations, Boards and Government Companies
and the Report containing observations on Revenue Receipts are
presented separately.

x
EXECUTIVE SUMMARY
Background
The Report on the Finances of the Government of Madhya Pradesh is brought
out with a view to assess the financial performance of the State during the year
2015-16 based on audit analysis of financial data. In order to give a perspective
to the analysis, we have attempted to compare the achievements made by the
State Government vis-a-vis the targets envisaged in the Fiscal Responsibility
and Budget Management Act (FRBM Act), 2005, State budget documents,
norms recommended by the Fourteenth Finance Commission and other
financial data obtained from various Government Departments and
organisations.
The Report
Based on the audited accounts of the Government of Madhya Pradesh for the
year ended 31 March 2016, this Report provides an analytical review of the
Annual Accounts of the State Government. The report is structured in three
Chapters.
Chapter 1 is based on audit of the Finance Accounts and makes an assessment
of the Madhya Pradesh Government’s fiscal position as on 31 March 2016. It
provides an insight into the trends in the overall finances of the State, actual
expenditure vis-à-vis budget estimates, salaries and wages, pensions, interest
payments and subsidies, expenditure and borrowing patterns, besides giving a
brief account of Central funds transferred directly to the State implementing
agencies through off-budget route. It also makes an assessment of the adequacy
of the State's fiscal priorities to developmental, social sectors and capital
expenditure.
Chapter 2 is based on audit of Appropriation Accounts and gives a grant-wise
description of appropriations and the manner in which the allocated resources
were managed by the service delivery Departments. Besides, comments arising
out of review of selected grants have also been made in this Chapter.
Chapter 3 is an inventory of the Madhya Pradesh Government’s compliance
with various reporting requirements and financial rules.
The Report also compiles the data collated from various government
Departments/organisations in support of the findings. At the end of the Report
a glossary of abbreviations is given.
Audit findings
Chapter-1: Finances of the State Government
Fiscal Situation
� The State maintained Revenue Surplus during the year 2015-16 at
` 5,740 crore, which was more than the Budget Estimate (` 5,588 crore).
However, it decreased by ` 528 crore over the previous year mainly due
to increase in Revenue Expenditure on Social Welfare and Nutrition,
Water Supply and Energy.
(Paragraphs 1.1.2 and 1.1.3)
Audit Report on State Finances for the year ended 31 March 2016
xii
� Revenue Surplus was overstated by ` 916.82 crore due to short-transfer
of contributions to State Disaster Response Fund, Guarantee
Redemption Fund, Consolidated Sinking Fund for amortisation of loans
and Contributory Pension Scheme for State Government employees.
(Paragraph 1.1.2)
� During the current year, the Fiscal Deficit of the State (` 14,065 crore)
increased from the previous year by ` 2,713 crore mainly due to increase
in net Capital Expenditure. Fiscal Deficit relative to GSDP also
increased from 2.34 per cent in 2014-15 to 2.49 per cent in the current
year. However, it was within the limits prescribed by XIV FC, FRBM
Act and Budget estimates.
(Paragraphs 1.1.2 and 1.11.1)
Resource mobilisation
� Revenue Receipts (` 1,05,511 crore) of the State grew at 19 per cent
(` 16,870 crore) during 2015-16 over the previous year due to increase
in State’s share of Union Taxes/Duties (by ` 14,291 crore) and Own Tax
Revenue (by ` 3,647 crore).
(Paragraphs 1.1.1 and 1.3)
� Revenue Buoyancy with reference to GSDP decreased from 1.52
per cent (2014-15) to 1.15 per cent (2015-16) owing to increase in
growth rate of GSDP from 11.19 per cent (2014-15) to 16.62 per cent
(2015-16).
(Paragraph 1.3)
� The State’s share of Union Taxes/Duties increased from ` 24,107 crore
in 2014-15 to ` 38,398 crore during 2015-16 due to substantial increase
in the devolution of taxes and grants under XIV FC.
(Paragraph 1.3.5)
� During the current year, 46 per cent of the Revenue Receipts came from
State’s own resources, which was lower as compared to 53 per cent
during 2014-15. The actual realisation under Tax Revenue and Non-Tax
revenue was significantly lower than the assessment made by the XIV
FC (by 19.22 per cent and 32.51 per cent respectively).
(Paragraphs 1.3 and 1.3.1)
Expenditure management and fiscal priority
� Capital Expenditure increased from ` 9,055 crore in 2011-12 to
` 16,835 crore in 2015-16 with inter-year fluctuations. During 2015-16,
it increased by ` 4,957 crore (by 42 per cent) over the previous year.
The increase was mainly under Irrigation and Flood Control (by ` 2,246
crore), Rural Development (by ` 1,170 crore) and Transport (by ` 502
crore). However, the Capital Expenditure during 2015-16 was less (by
` 1,305 crore) than the Budget Estimate of ` 18,140 crore.
(Paragraph 1.6.2)
� During 2015-16, the Revenue Expenditure (RE) of the State (` 99,771
crore) increased by 21.12 per cent over the previous year. The Non-Plan
Executive Summary
xiii
Revenue Expenditure (NPRE) increased by 22.31 per cent and
constituted 68 per cent of RE. The increase in NPRE by ` 12,461 crore
during 2015-16 was mainly due to increase in expenditure on Social
Welfare and Nutrition (by ` 3,051 crore), Energy (by ` 2,146 crore) and
Education, Sports, Art and Culture (by ` 1,466 crore). Actual NPRE
(` 68,319 crore) was slightly higher than the projection (` 68,106 crore)
made in the MTFPS of the State.
(Paragraphs 1.6.1 and 1.6.3)
� Expenditure on salaries & wages, pension payments, interest payments
and subsidies (` 48,189 crore) was 48 per cent of Revenue Expenditure
and 46 per cent of Revenue Receipts. Out of total subsidy payments of
` 11,725 crore, 60 per cent pertained to Energy Department.
(Paragraphs 1.6.4 and 1.6.4.4)
� The priority given to expenditure on Education Sector in Madhya
Pradesh was not adequate during 2015-16, when compared with General
Category States' Average.
(Paragraph 1.7.1)
Return on investment
� During 2015-16, return (` 129.64 crore) on investment of ` 16,599.57
crore made by the Government up to 2015-16 in Statutory corporations,
Government companies, Co-operatives etc. was only 0.78 per cent
against the average rate of interest on Government borrowings of 6.86
per cent during the year.
(Paragraph 1.8.1)
� Twenty six Government Companies and Statutory Corporations with an
aggregate investment of ` 14,460.30 crore for the latest years for which
accounts were finalised as of 2015-16, were running in losses which
accumulated to ` 35,542.78 crore.
(Paragraph 1.8.1)
Management of cash balance and liabilities
� The investment held in 'Cash Balance Investment Account' by the State
Government increased by ` 4,694 crore from ` 4,791 crore as on 31
March 2015 to ` 9,485 crore as on 31 March 2016. Since the market
loans as on 31 March 2016 was ` 56,141 crore, there is a need for review
of the high level of investment held in ‘Cash Balance Investment
Account’.
(Paragraph 1.8.4)
� The outstanding fiscal liabilities steadily increased over the years from
` 81,757 crore in 2011-12 to ` 1,27,144 crore at the end of 2015-16.
These liabilities increased by 16.98 per cent during 2015-16 as against
12.25 per cent in 2014-15. The increase in Fiscal Liabilities during
2015-16 over the previous year was mainly under Market Loans
(by ` 12,991 crore). Fiscal Liabilities at the end of 2015-16 were
22.50 per cent of GSDP against the limit of 24.87 per cent prescribed by
Audit Report on State Finances for the year ended 31 March 2016
xiv
XIV Finance Commission. The growing volume of debt has resulted in
increasing liability for servicing the debt.
(Paragraph 1.9.2)
Chapter-2: Financial Management and Budgetary Control
Inflated provision under original and supplementary grants
� There was large savings of ` 40,796.27 crore (24.49 per cent) against
total budget provision of ` 1,66,610.52 crore during 2015-16. In 36
cases (28 grants/appropriations), significant savings of ` 100 crore and
above and more than 20 per cent of total provision occurred in each case,
which aggregated to ` 33,602 crore, which indicate improper budget
estimation.
(Paragraphs 2.2 and 2.3.1)
Failure to surrender/delayed surrender of savings
� Only 47.70 per cent (` 19,459 crore) of total savings were surrendered
during the year. In 113 cases, savings of ` 17,330 crore (` 10 crore or
more in each case) were surrendered on the last day of the financial year,
leaving no scope for utilising the funds for other development purposes.
(Paragraphs 2.2 and 2.3.8)
Excess expenditure requiring regularisation
� Excess expenditure of ` 918.09 crore pertaining to 38 grants and 20
appropriations of previous years requires regularisation under Article
205 of the Constitution.
(Paragraph 2.3.5)
Funds transferred from Consolidated Fund of the State for parking in Civil
Deposit
� Funds of ` 54.01 crore drawn on 31 March 2016 was transferred from
Consolidated Fund of the State to Civil Deposits in Public Account to
avoid lapse of funds, which inflated the expenditure of the year under
the Consolidated Fund of the State.
(Paragraph 2.3.11)
Chapter-3: Financial Reporting
Outstanding Utilisation Certificates against the Grants
� Utilisation Certificates (27612) in respect of grants-in-aid given by
different Departments of State Government amounting to ` 21,359.28
crore were outstanding as on 31 March 2016, indicating lack of proper
monitoring by the concerned Departments of utilisation of grants.
(Paragraph 3.1)
Submission of Accounts by Autonomous Bodies
� There were significant delays (up to 205 months) in submission of
accounts by five Autonomous Bodies to the Accountant General,
resulting in delays in scrutiny of functioning of the Autonomous Bodies
(Paragraph 3.2)
Executive Summary
xv
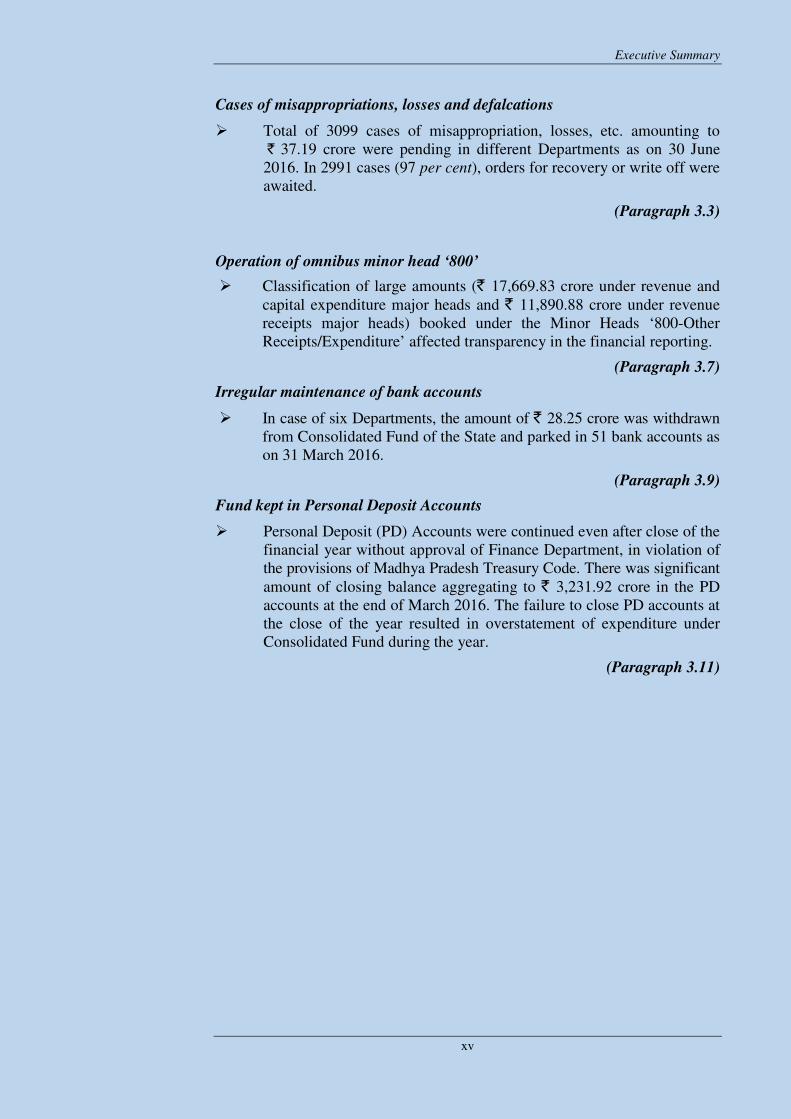
Cases of misappropriations, losses and defalcations
� Total of 3099 cases of misappropriation, losses, etc. amounting to
` 37.19 crore were pending in different Departments as on 30 June
2016. In 2991 cases (97 per cent), orders for recovery or write off were
awaited.
(Paragraph 3.3)
Operation of omnibus minor head ‘800’
� Classification of large amounts (` 17,669.83 crore under revenue and
capital expenditure major heads and ` 11,890.88 crore under revenue
receipts major heads) booked under the Minor Heads ‘800-Other
Receipts/Expenditure’ affected transparency in the financial reporting.
(Paragraph 3.7)
Irregular maintenance of bank accounts
� In case of six Departments, the amount of ` 28.25 crore was withdrawn
from Consolidated Fund of the State and parked in 51 bank accounts as
on 31 March 2016.
(Paragraph 3.9)
Fund kept in Personal Deposit Accounts
� Personal Deposit (PD) Accounts were continued even after close of the
financial year without approval of Finance Department, in violation of
the provisions of Madhya Pradesh Treasury Code. There was significant
amount of closing balance aggregating to ` 3,231.92 crore in the PD
accounts at the end of March 2016. The failure to close PD accounts at
the close of the year resulted in overstatement of expenditure under
Consolidated Fund during the year.
(Paragraph 3.11)
CHAPTER 1
Finances of the State Government
Profile of State
The State of Madhya Pradesh is located in the central part of India. It is the
second largest State in terms of geographical area (308 thousand square
kilometre) and the sixth largest by population (7.26 crore as per 2011 census).
The composite State of Madhya Pradesh was founded on 1 November 1956. In
terms of the Madhya Pradesh Reorganisation Act 2000 (No. 28 of 2000), 16
districts of the erstwhile State of Madhya Pradesh were carved out to form the
new State of Chhattisgarh on 1 November 2000.
As indicated in Appendix 1.1 the State’s population increased from 6.03 crore
in 2001 to 7.26 crore in 2011 recording a decadal growth of 20.40 per cent. The
density of population of the State increased from 196 persons per sq. km in 2001
to 236 persons per sq. km in 2011. However, Madhya Pradesh has a lower
density of population as compared to the all India average of 382 persons per
sq. km. The percentage of population below poverty line (44.30 per cent) was
higher than that of the All-India average (29.50 per cent). The State’s literacy
rate marginally decreased from 69.69 per cent in 2001 to 69.32 per cent as per
2011 census, which was lower than the All India average of 73.00 per cent
(2011 census).
The general data (including development indicators) relating to the State is
given in Appendix 1.1.
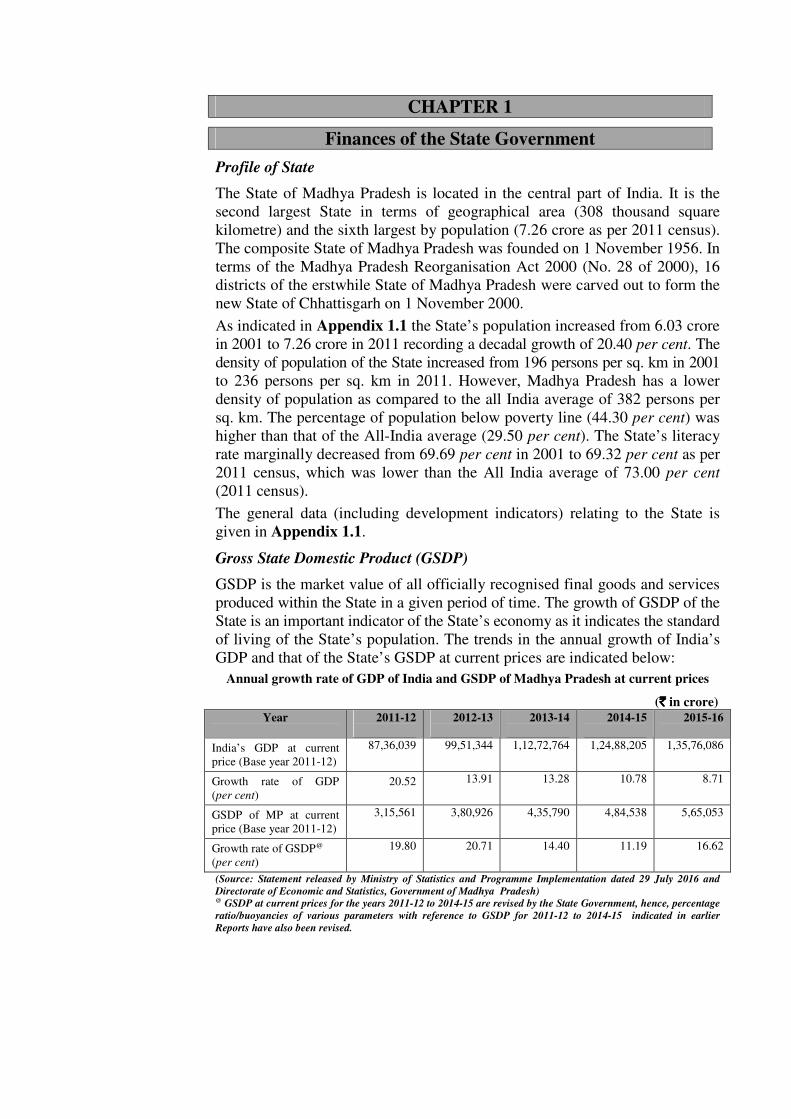
Gross State Domestic Product (GSDP)
GSDP is the market value of all officially recognised final goods and services
produced within the State in a given period of time. The growth of GSDP of the
State is an important indicator of the State’s economy as it indicates the standard
of living of the State’s population. The trends in the annual growth of India’s
GDP and that of the State’s GSDP at current prices are indicated below:
Annual growth rate of GDP of India and GSDP of Madhya Pradesh at current prices
(`̀̀̀ in crore)
Year 2011-12
2012-13
2013-14
2014-15
2015-16
India’s GDP at current
price (Base year 2011-12)
87,36,039 99,51,344 1,12,72,764 1,24,88,205 1,35,76,086
Growth rate of GDP
(per cent)
20.52 13.91 13.28 10.78 8.71
GSDP of MP at current
price (Base year 2011-12)
3,15,561 3,80,926 4,35,790 4,84,538 5,65,053
Growth rate of GSDP@
(per cent)
19.80 20.71 14.40 11.19 16.62
(Source: Statement released by Ministry of Statistics and Programme Implementation dated 29 July 2016 and
Directorate of Economic and Statistics, Government of Madhya Pradesh) @ GSDP at current prices for the years 2011-12 to 2014-15 are revised by the State Government, hence, percentage
ratio/buoyancies of various parameters with reference to GSDP for 2011-12 to 2014-15 indicated in earlier
Reports have also been revised.
Audit Report on State Finances for the year ended 31 March 2016
2
The Gross State Domestic Product (GSDP) of the State in 2015-16 at current
prices was ` 5,65,053 crore, which increased by 16.62 per cent over the previous
year. The Compound Annual Growth Rate (CAGR) of per capita GSDP of
Madhya Pradesh (14.52 per cent) was higher than that of the General Category
States (14.27 per cent) during 2006-07 to 2015-16.
1.1 Introduction
This Chapter provides an audit perspective on the finances of the Government
of Madhya Pradesh during 2015-16 and analyses the critical changes observed
in the major fiscal aggregates relative to the previous year, keeping in view the
overall trends during the last five years. The analysis is based on the Finance
Accounts of the Government of Madhya Pradesh and information provided
therein. The structure and form of Government Accounts and the layout of the
Finance Accounts are depicted in Appendix 1.2 Part-A.
The apportionment of assets and liabilities of the composite State of Madhya
Pradesh prior to the date of reorganisation as well as other financial adjustments
is carried out in accordance with the provisions of the Madhya Pradesh
Reorganisation Act, 2000 (No. 28 of 2000). The actual progress achieved in this
direction is indicated in Appendix 1.2 Part-B.
The methodology adopted for assessment of the fiscal position and
norms/ceilings prescribed under the Fiscal Responsibility and Budgetary
Management (FRBM) Act, 2005, trends in select fiscal indicators and the time
series data of State Finances are depicted in Appendix 1.3 and Appendix 1.4.
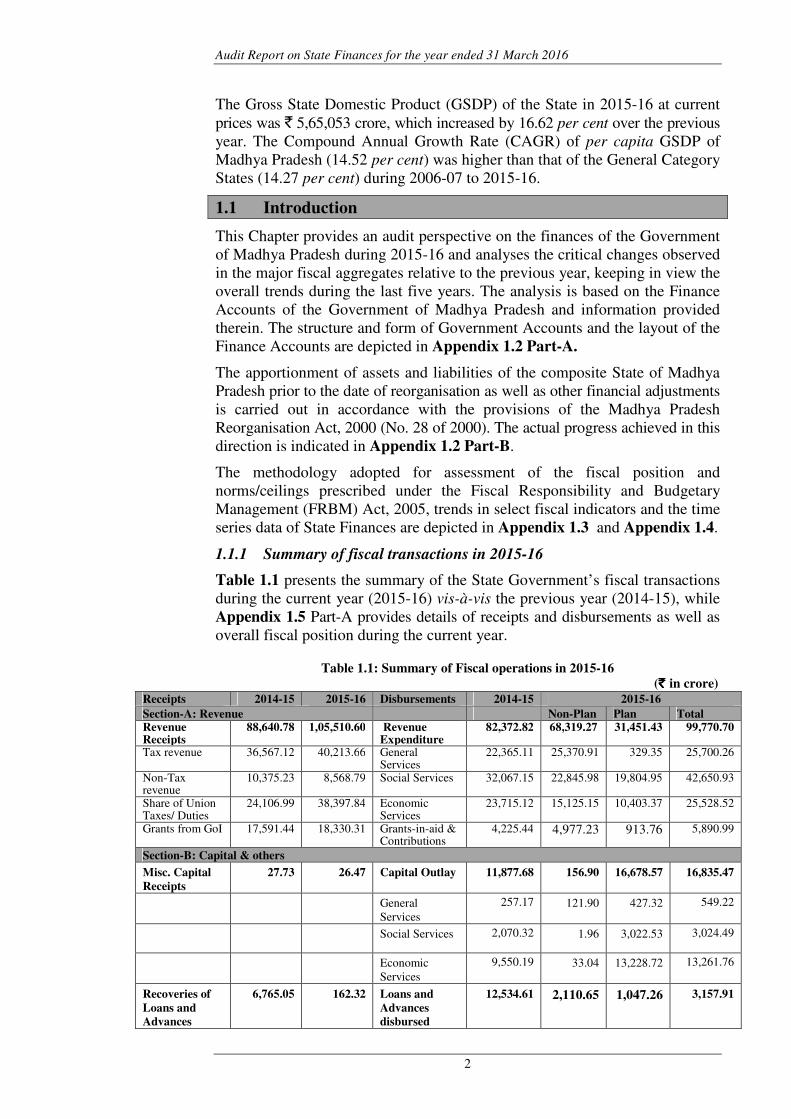
1.1.1 Summary of fiscal transactions in 2015-16
Table 1.1 presents the summary of the State Government’s fiscal transactions
during the current year (2015-16) vis-à-vis the previous year (2014-15), while
Appendix 1.5 Part-A provides details of receipts and disbursements as well as
overall fiscal position during the current year.
Table 1.1: Summary of Fiscal operations in 2015-16
(` ` ` ` in crore)
Receipts 2014-15 2015-16 Disbursements 2014-15 2015-16
Section-A: Revenue Non-Plan Plan Total Revenue Receipts
88,640.78 1,05,510.60 Revenue Expenditure
82,372.82 68,319.27 31,451.43 99,770.70
Tax revenue 36,567.12 40,213.66 General Services
22,365.11 25,370.91 329.35 25,700.26
Non-Tax revenue
10,375.23 8,568.79 Social Services 32,067.15 22,845.98 19,804.95 42,650.93
Share of Union Taxes/ Duties
24,106.99 38,397.84 Economic Services
23,715.12 15,125.15 10,403.37 25,528.52
Grants from GoI 17,591.44 18,330.31 Grants-in-aid & Contributions
4,225.44 4,977.23 913.76 5,890.99
Section-B: Capital & others
Misc. Capital
Receipts
27.73 26.47 Capital Outlay 11,877.68 156.90 16,678.57 16,835.47
General
Services
257.17 121.90 427.32 549.22
Social Services 2,070.32 1.96 3,022.53 3,024.49
Economic
Services
9,550.19 33.04 13,228.72 13,261.76
Recoveries of
Loans and
Advances
6,765.05 162.32 Loans and
Advances
disbursed
12,534.61 2,110.65 1,047.26 3,157.91
Chapter 1-Finances of the State Government
3
Receipts 2014-15 2015-16 Disbursements 2014-15 2015-16
Inter-State
settlement
0.91 1.93 Inter-State
settlement
0.98 - - 1.94
Public Debt
receipts
15,068.71 19,985.30* Repayment of
Public Debt
4,920.52 - - 4,860.36*
Contingency
Fund
300.00 1.08 Contingency
Fund
301.08 - - -
Public Account
receipts
1,10,294.74 1,32,772.19 Public Account
disbursements
1,08,165.30
- - 1,28,336.75
Opening Cash
Balance
4,477.03 5,401.96 Closing Cash
Balance
5,401.96 - - 10,898.72
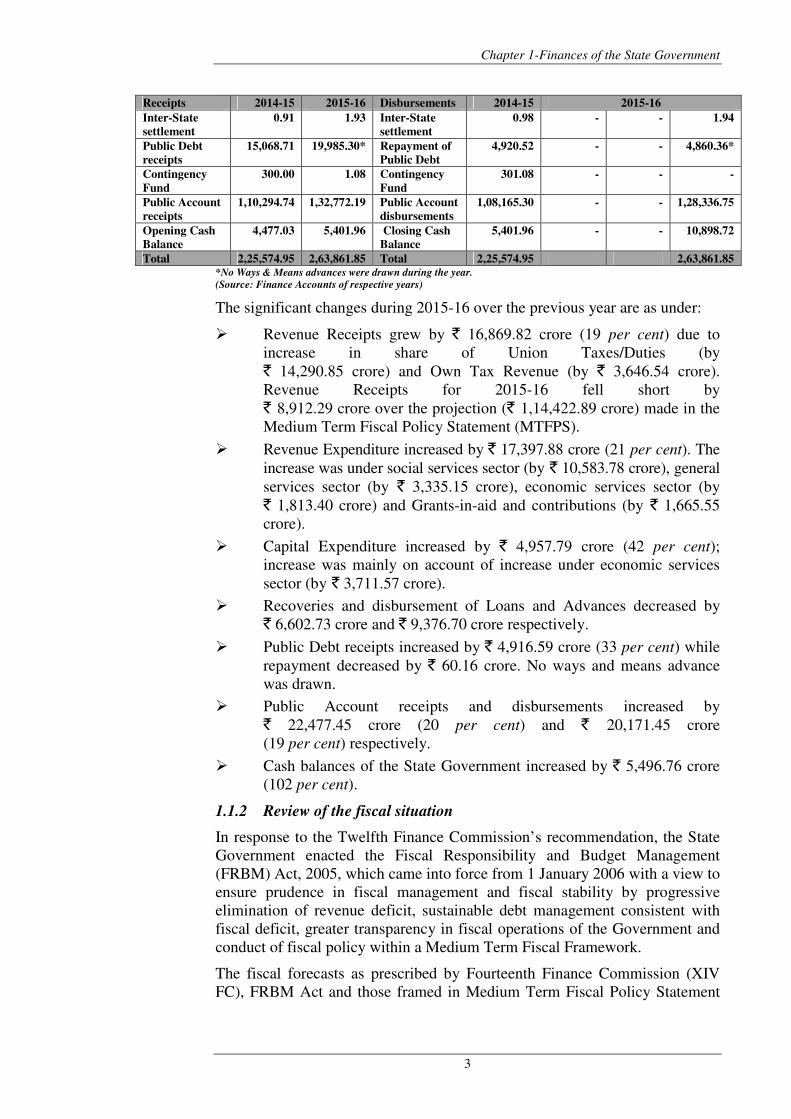
Total 2,25,574.95 2,63,861.85 Total 2,25,574.95 2,63,861.85 *No Ways & Means advances were drawn during the year.
(Source: Finance Accounts of respective years)
The significant changes during 2015-16 over the previous year are as under:
� Revenue Receipts grew by ` 16,869.82 crore (19 per cent) due to
increase in share of Union Taxes/Duties (by
` 14,290.85 crore) and Own Tax Revenue (by ` 3,646.54 crore).
Revenue Receipts for 2015-16 fell short by
` 8,912.29 crore over the projection (` 1,14,422.89 crore) made in the
Medium Term Fiscal Policy Statement (MTFPS).
� Revenue Expenditure increased by ` 17,397.88 crore (21 per cent). The
increase was under social services sector (by ` 10,583.78 crore), general
services sector (by ` 3,335.15 crore), economic services sector (by
` 1,813.40 crore) and Grants-in-aid and contributions (by ` 1,665.55
crore).
� Capital Expenditure increased by ` 4,957.79 crore (42 per cent);
increase was mainly on account of increase under economic services
sector (by ` 3,711.57 crore).
� Recoveries and disbursement of Loans and Advances decreased by
` 6,602.73 crore and ` 9,376.70 crore respectively.
� Public Debt receipts increased by ` 4,916.59 crore (33 per cent) while
repayment decreased by ` 60.16 crore. No ways and means advance
was drawn.
� Public Account receipts and disbursements increased by
` 22,477.45 crore (20 per cent) and ` 20,171.45 crore
(19 per cent) respectively.
� Cash balances of the State Government increased by ` 5,496.76 crore
(102 per cent).
1.1.2 Review of the fiscal situation
In response to the Twelfth Finance Commission’s recommendation, the State
Government enacted the Fiscal Responsibility and Budget Management
(FRBM) Act, 2005, which came into force from 1 January 2006 with a view to
ensure prudence in fiscal management and fiscal stability by progressive
elimination of revenue deficit, sustainable debt management consistent with
fiscal deficit, greater transparency in fiscal operations of the Government and
conduct of fiscal policy within a Medium Term Fiscal Framework.
The fiscal forecasts as prescribed by Fourteenth Finance Commission (XIV
FC), FRBM Act and those framed in Medium Term Fiscal Policy Statement
Audit Report on State Finances for the year ended 31 March 2016
4
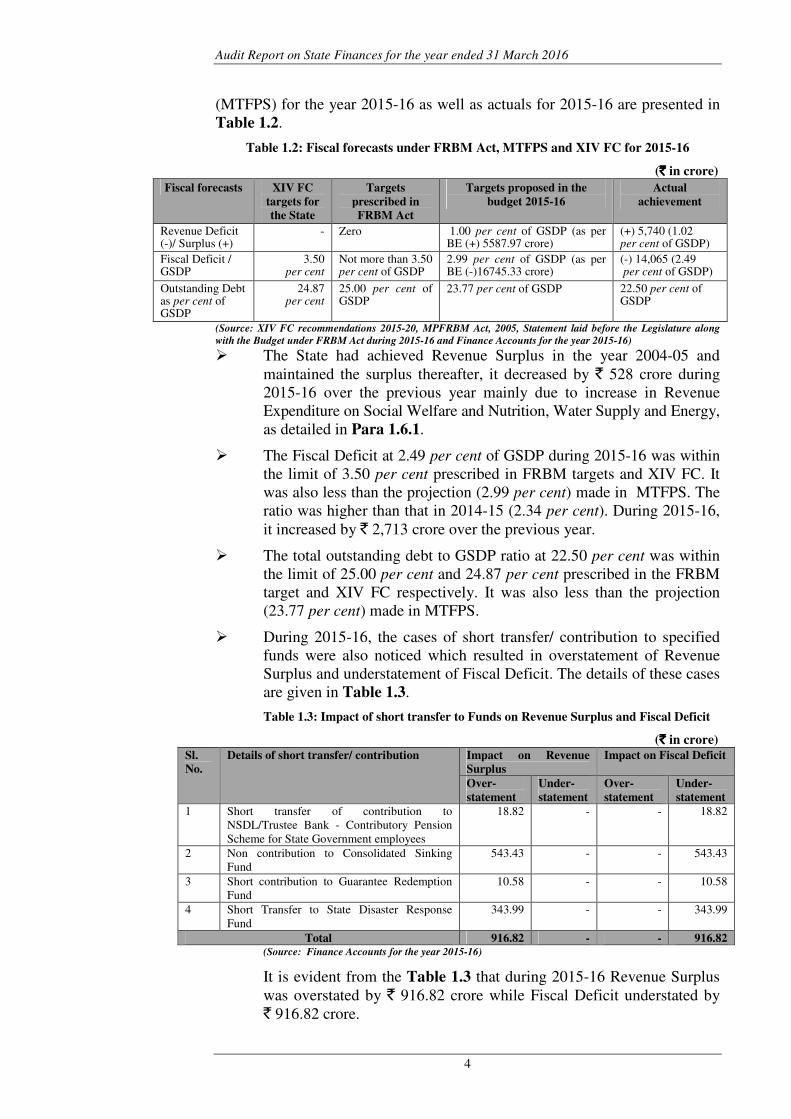
(MTFPS) for the year 2015-16 as well as actuals for 2015-16 are presented in
Table 1.2.
Table 1.2: Fiscal forecasts under FRBM Act, MTFPS and XIV FC for 2015-16
(`̀̀̀ in crore)
Fiscal forecasts XIV FC
targets for
the State
Targets
prescribed in
FRBM Act
Targets proposed in the
budget 2015-16
Actual
achievement
Revenue Deficit (-)/ Surplus (+)
- Zero 1.00 per cent of GSDP (as per BE (+) 5587.97 crore)
(+) 5,740 (1.02 per cent of GSDP)
Fiscal Deficit / GSDP
3.50 per cent
Not more than 3.50 per cent of GSDP
2.99 per cent of GSDP (as per BE (-)16745.33 crore)
(-) 14,065 (2.49 per cent of GSDP)
Outstanding Debt as per cent of GSDP
24.87 per cent
25.00 per cent of GSDP
23.77 per cent of GSDP 22.50 per cent of GSDP
(Source: XIV FC recommendations 2015-20, MPFRBM Act, 2005, Statement laid before the Legislature along
with the Budget under FRBM Act during 2015-16 and Finance Accounts for the year 2015-16)
� The State had achieved Revenue Surplus in the year 2004-05 and
maintained the surplus thereafter, it decreased by ` 528 crore during
2015-16 over the previous year mainly due to increase in Revenue
Expenditure on Social Welfare and Nutrition, Water Supply and Energy,
as detailed in Para 1.6.1.
� The Fiscal Deficit at 2.49 per cent of GSDP during 2015-16 was within
the limit of 3.50 per cent prescribed in FRBM targets and XIV FC. It
was also less than the projection (2.99 per cent) made in MTFPS. The
ratio was higher than that in 2014-15 (2.34 per cent). During 2015-16,
it increased by ` 2,713 crore over the previous year.
� The total outstanding debt to GSDP ratio at 22.50 per cent was within
the limit of 25.00 per cent and 24.87 per cent prescribed in the FRBM
target and XIV FC respectively. It was also less than the projection
(23.77 per cent) made in MTFPS.
� During 2015-16, the cases of short transfer/ contribution to specified
funds were also noticed which resulted in overstatement of Revenue
Surplus and understatement of Fiscal Deficit. The details of these cases
are given in Table 1.3.
Table 1.3: Impact of short transfer to Funds on Revenue Surplus and Fiscal Deficit
(`̀̀̀ in crore)
Sl.
No.
Details of short transfer/ contribution Impact on Revenue
Surplus
Impact on Fiscal Deficit
Over-
statement
Under-
statement
Over-
statement
Under-
statement
1 Short transfer of contribution to
NSDL/Trustee Bank - Contributory Pension
Scheme for State Government employees
18.82 - - 18.82
2 Non contribution to Consolidated Sinking
Fund
543.43 - - 543.43
3 Short contribution to Guarantee Redemption
Fund
10.58 - - 10.58
4 Short Transfer to State Disaster Response
Fund
343.99 - - 343.99
Total 916.82 - - 916.82 (Source: Finance Accounts for the year 2015-16)
It is evident from the Table 1.3 that during 2015-16 Revenue Surplus
was overstated by ` 916.82 crore while Fiscal Deficit understated by
` 916.82 crore.
Chapter 1-Finances of the State Government
5
1.1.3 Budget Estimates and Actuals
The importance of accuracy in the budget estimates of revenue receipts and
expenditure is widely accepted in the context of effective implementation of
fiscal policies for overall economic management. Deviations from the Budget
Estimates are indicative of non-attainment and non-optimisation of the desired
fiscal objectives.
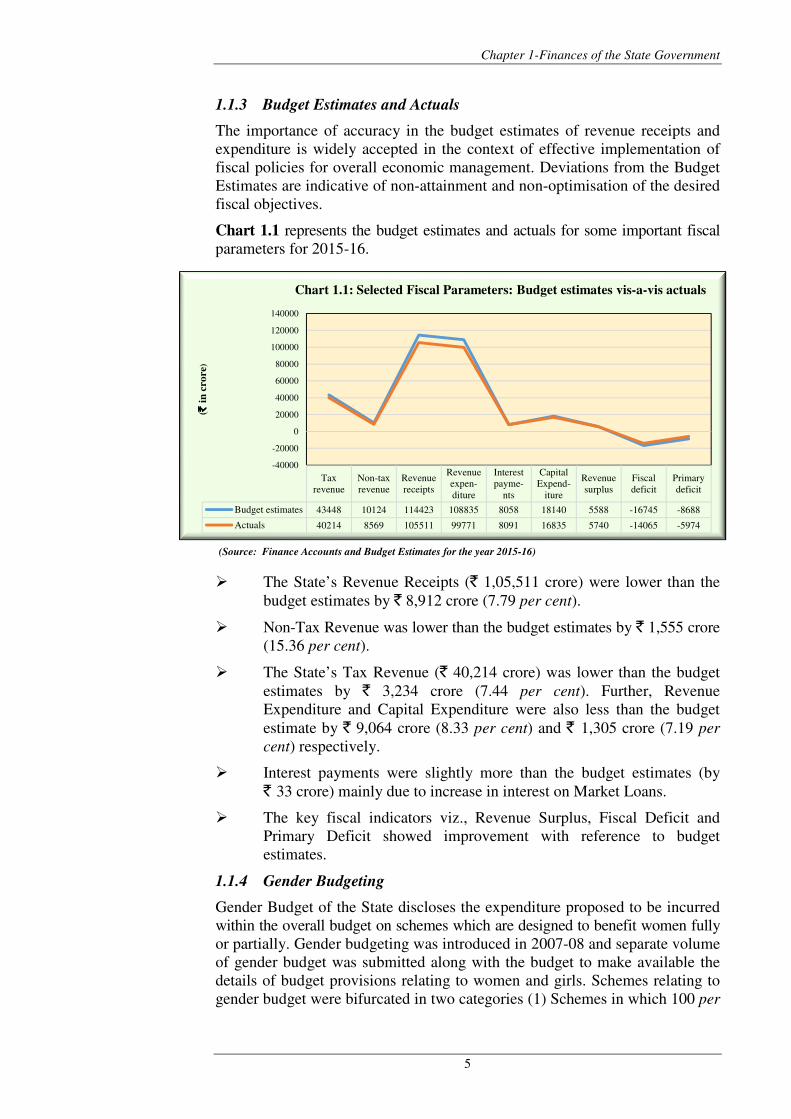
Chart 1.1 represents the budget estimates and actuals for some important fiscal
parameters for 2015-16.
(Source: Finance Accounts and Budget Estimates for the year 2015-16)
� The State’s Revenue Receipts (` 1,05,511 crore) were lower than the
budget estimates by ` 8,912 crore (7.79 per cent).
� Non-Tax Revenue was lower than the budget estimates by ` 1,555 crore
(15.36 per cent).
� The State’s Tax Revenue (` 40,214 crore) was lower than the budget
estimates by ` 3,234 crore (7.44 per cent). Further, Revenue
Expenditure and Capital Expenditure were also less than the budget
estimate by ` 9,064 crore (8.33 per cent) and ` 1,305 crore (7.19 per
cent) respectively.
� Interest payments were slightly more than the budget estimates (by
` 33 crore) mainly due to increase in interest on Market Loans.
� The key fiscal indicators viz., Revenue Surplus, Fiscal Deficit and
Primary Deficit showed improvement with reference to budget
estimates.
1.1.4 Gender Budgeting
Gender Budget of the State discloses the expenditure proposed to be incurred
within the overall budget on schemes which are designed to benefit women fully
or partially. Gender budgeting was introduced in 2007-08 and separate volume
of gender budget was submitted along with the budget to make available the
details of budget provisions relating to women and girls. Schemes relating to
gender budget were bifurcated in two categories (1) Schemes in which 100 per
Tax
revenue
Non-tax
revenue
Revenue
receipts
Revenue
expen-
diture
Interest
payme-
nts
Capital
Expend-
iture
Revenue
surplus
Fiscal
deficit
Primary
deficit
Budget estimates 43448 10124 114423 108835 8058 18140 5588 -16745 -8688
Actuals 40214 8569 105511 99771 8091 16835 5740 -14065 -5974
-40000
-20000
0
20000
40000
60000
80000
100000
120000
140000
( ` ` ` ` i
n c
rore
)
Chart 1.1: Selected Fiscal Parameters: Budget estimates vis-a-vis actuals
Audit Report on State Finances for the year ended 31 March 2016
6
cent budget provisions were related to women and (2) Schemes in which at least
30 per cent of budget provisions were related to women.
During 2015-16, budget provisions were made in 25 Departments1 (category-1:
58 schemes and category-2: 370 schemes) for benefit of women.
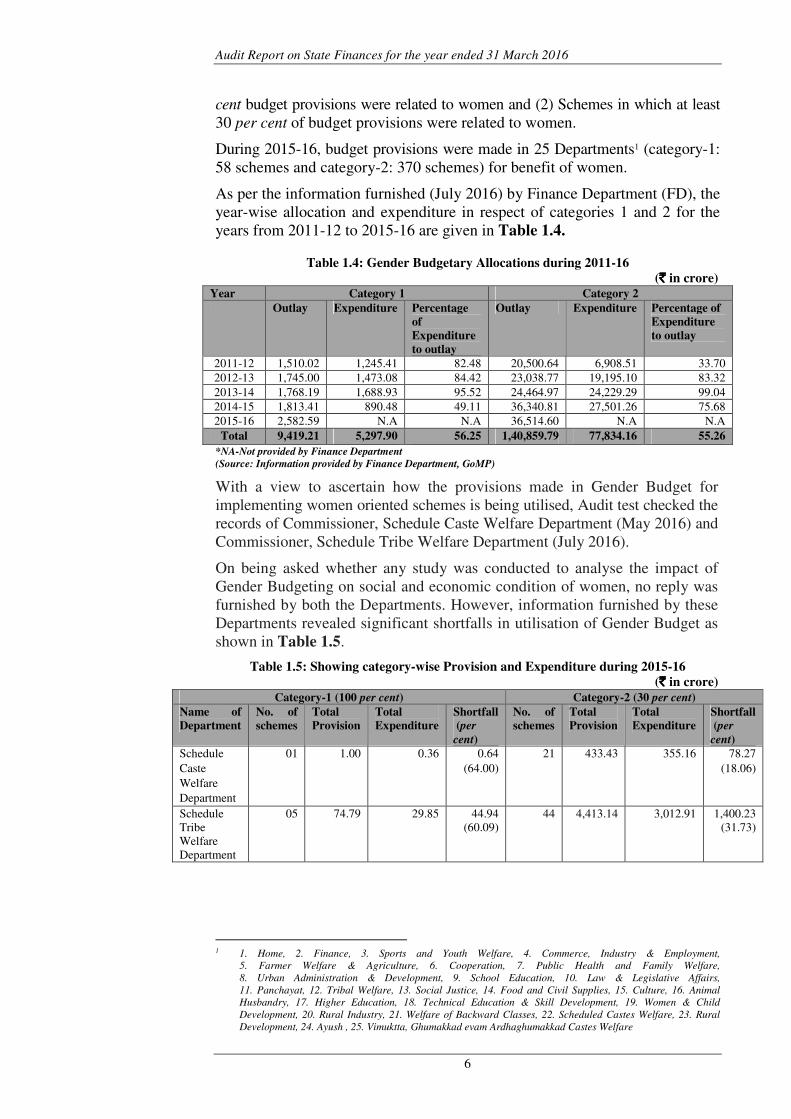
As per the information furnished (July 2016) by Finance Department (FD), the
year-wise allocation and expenditure in respect of categories 1 and 2 for the
years from 2011-12 to 2015-16 are given in Table 1.4.
Table 1.4: Gender Budgetary Allocations during 2011-16
(`̀̀̀ in crore)
Year Category 1 Category 2
Outlay Expenditure Percentage
of
Expenditure
to outlay
Outlay Expenditure Percentage of
Expenditure
to outlay
2011-12 1,510.02 1,245.41 82.48 20,500.64 6,908.51 33.70
2012-13 1,745.00 1,473.08 84.42 23,038.77 19,195.10 83.32
2013-14 1,768.19 1,688.93 95.52 24,464.97 24,229.29 99.04
2014-15 1,813.41 890.48 49.11 36,340.81 27,501.26 75.68
2015-16 2,582.59 N.A N.A 36,514.60 N.A N.A
Total 9,419.21 5,297.90 56.25 1,40,859.79 77,834.16 55.26
*NA-Not provided by Finance Department
(Source: Information provided by Finance Department, GoMP)
With a view to ascertain how the provisions made in Gender Budget for
implementing women oriented schemes is being utilised, Audit test checked the
records of Commissioner, Schedule Caste Welfare Department (May 2016) and
Commissioner, Schedule Tribe Welfare Department (July 2016).
On being asked whether any study was conducted to analyse the impact of
Gender Budgeting on social and economic condition of women, no reply was
furnished by both the Departments. However, information furnished by these
Departments revealed significant shortfalls in utilisation of Gender Budget as
shown in Table 1.5.
Table 1.5: Showing category-wise Provision and Expenditure during 2015-16
(`̀̀̀ in crore)
Category-1 (100 per cent) Category-2 (30 per cent)
Name of
Department
No. of
schemes
Total
Provision
Total
Expenditure
Shortfall
(per
cent)
No. of
schemes
Total
Provision
Total
Expenditure
Shortfall
(per
cent)
Schedule
Caste
Welfare
Department
01 1.00 0.36
0.64
(64.00)
21 433.43 355.16 78.27
(18.06)
Schedule
Tribe
Welfare
Department
05 74.79 29.85
44.94
(60.09)
44 4,413.14 3,012.91 1,400.23
(31.73)
1 1. Home, 2. Finance, 3. Sports and Youth Welfare, 4. Commerce, Industry & Employment,
5. Farmer Welfare & Agriculture, 6. Cooperation, 7. Public Health and Family Welfare,
8. Urban Administration & Development, 9. School Education, 10. Law & Legislative Affairs,
11. Panchayat, 12. Tribal Welfare, 13. Social Justice, 14. Food and Civil Supplies, 15. Culture, 16. Animal
Husbandry, 17. Higher Education, 18. Technical Education & Skill Development, 19. Women & Child
Development, 20. Rural Industry, 21. Welfare of Backward Classes, 22. Scheduled Castes Welfare, 23. Rural
Development, 24. Ayush , 25. Vimuktta, Ghumakkad evam Ardhaghumakkad Castes Welfare
Chapter 1-Finances of the State Government
7
On being asked about shortfalls, the above Departments replied that shortfalls
were due to vacant posts, expenditure as per needs and restriction by Finance
Department and funds undrawn by the districts.
It was further observed that three schemes under Category 1 and 35 schemes
under Category 2 witnessed shortfalls more than ` one crore details of which
are shown in Appendix 1.6.
It is evident that in selected two Departments the provision earmarked remained
unutilised between 69 per cent and 100 per cent under Category 1 and between
6.34 per cent and 100 per cent under Category 2, which indicated that women
oriented schemes were not implemented properly.
During the exit conference (December 2016), FD replied that a new format for
Gender Budget was under consideration.
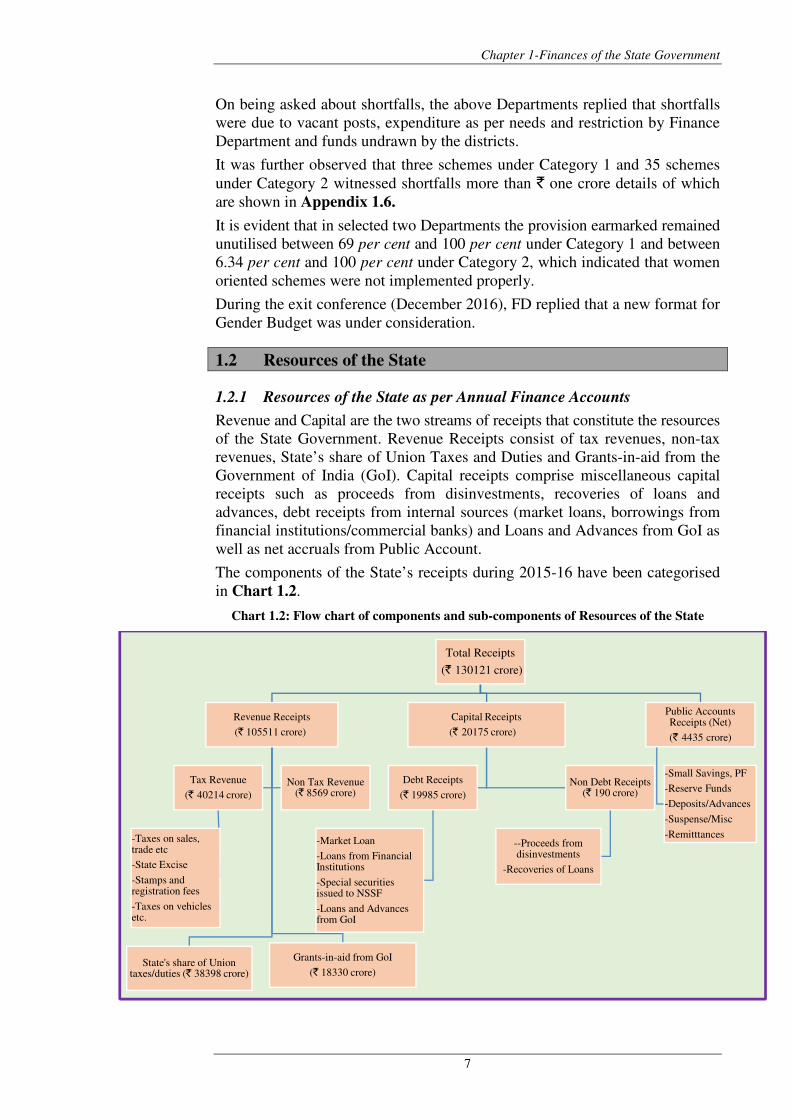
1.2 Resources of the State
1.2.1 Resources of the State as per Annual Finance Accounts
Revenue and Capital are the two streams of receipts that constitute the resources
of the State Government. Revenue Receipts consist of tax revenues, non-tax
revenues, State’s share of Union Taxes and Duties and Grants-in-aid from the
Government of India (GoI). Capital receipts comprise miscellaneous capital
receipts such as proceeds from disinvestments, recoveries of loans and
advances, debt receipts from internal sources (market loans, borrowings from
financial institutions/commercial banks) and Loans and Advances from GoI as
well as net accruals from Public Account.
The components of the State’s receipts during 2015-16 have been categorised
in Chart 1.2.
Chart 1.2: Flow chart of components and sub-components of Resources of the State
Total Receipts
(` 130121 crore)
Revenue Receipts
(` 105511 crore)
State's share of Union taxes/duties (` 38398 crore)
Grants-in-aid from GoI
(` 18330 crore)
Tax Revenue
(` 40214 crore)
-Taxes on sales, trade etc
-State Excise
-Stamps and registration fees
-Taxes on vehicles etc.
Non Tax Revenue (` 8569 crore)
Capital Receipts
(` 20175 crore)
Debt Receipts
(` 19985 crore)
-Market Loan
-Loans from Financial Institutions
-Special securities issued to NSSF
-Loans and Advances from GoI
Non Debt Receipts (` 190 crore)
--Proceeds from disinvestments
-Recoveries of Loans
Public Accounts Receipts (Net)
(` 4435 crore)
-Small Savings, PF
-Reserve Funds
-Deposits/Advances
-Suspense/Misc
-Remitttances
Audit Report on State Finances for the year ended 31 March 2016
8
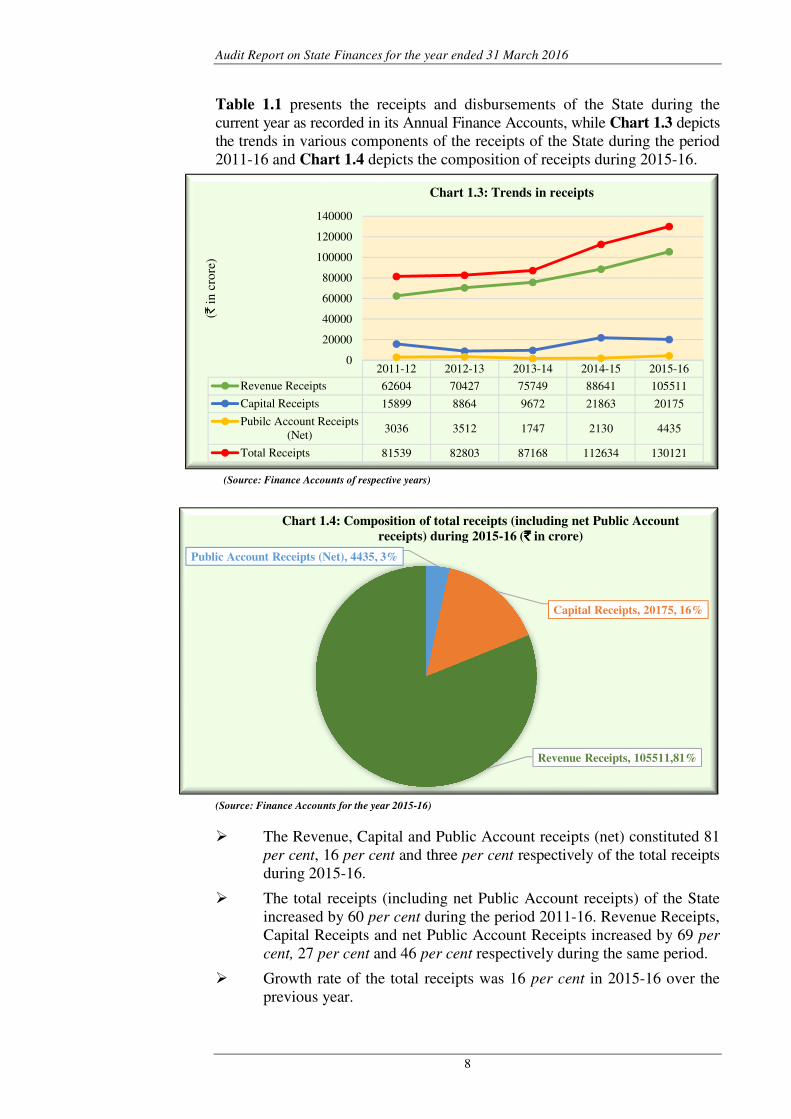
Table 1.1 presents the receipts and disbursements of the State during the
current year as recorded in its Annual Finance Accounts, while Chart 1.3 depicts
the trends in various components of the receipts of the State during the period
2011-16 and Chart 1.4 depicts the composition of receipts during 2015-16.
(Source: Finance Accounts of respective years)
(Source: Finance Accounts for the year 2015-16)
� The Revenue, Capital and Public Account receipts (net) constituted 81
per cent, 16 per cent and three per cent respectively of the total receipts
during 2015-16.
� The total receipts (including net Public Account receipts) of the State
increased by 60 per cent during the period 2011-16. Revenue Receipts,
Capital Receipts and net Public Account Receipts increased by 69 per
cent, 27 per cent and 46 per cent respectively during the same period.
� Growth rate of the total receipts was 16 per cent in 2015-16 over the
previous year.
2011-12 2012-13 2013-14 2014-15 2015-16
Revenue Receipts 62604 70427 75749 88641 105511
Capital Receipts 15899 8864 9672 21863 20175
Pubilc Account Receipts
(Net)3036 3512 1747 2130 4435
Total Receipts 81539 82803 87168 112634 130121
0
20000
40000
60000
80000
100000
120000
140000(`
in c
rore
)
Chart 1.3: Trends in receipts
Public Account Receipts (Net), 4435, 3%
Capital Receipts, 20175, 16%
Chart 1.4: Composition of total receipts (including net Public Account
receipts) during 2015-16 (`̀̀̀ in crore)
Chapter 1-Finances of the State Government
9
� The relative share of Revenue Receipts in total receipts during the years
2011-12 to 2015-16 ranged between 77 per cent and 87 per cent while
share of Capital Receipts in total receipts during the same period ranged
between 11 per cent and 19 per cent.
� During 2015-16, Revenue Receipts and Net Public Account Receipts
increased by ` 16,870 crore (19 per cent) and ` 2,305 crore (108 per
cent) respectively over the previous year while Capital Receipts
decreased by ` 1,688 crore (eight per cent).
1.2.2 Funds directly transferred to State Implementing Agencies outside
the State Budget
The GoI has been transferring a sizeable quantum of funds directly to the State
Implementing Agencies2 for implementation of various schemes/programmes in
social and economic sectors, which are recognized as critical. As in the present
mechanism these funds are not routed through the State Budget/State Treasury
System, these are not reflected in the accounts of the State Government. As
such, the Annual Finance Accounts of the State do not provide a complete
picture of the resources under the control of the State Government. However,
Government of India decided (July 2013) to transfer funds for Centrally
Sponsored Schemes/Additional Central Assistance directly to the State
Governments through Consolidated Fund of the States in a phased manner from
2014-15 onwards.
During the year 2015-16, the Government of India directly transferred
` 1,239.68 crore only to the State Implementing agencies which was higher than
the previous year by ` 384.83 crore (45.02 per cent). The major receipents were
Competent Authority of Land Acquisition Sohagpur, Distt.Shahdol (M.P) &
Project Manager Madhya Pradesh Road Development Corporation (` 209.84
crore i.e. 16.93 per cent), MPs Local Area Development Scheme (` 170 crore
i.e. 13.71 per cent), All India institute of Medical Sciences, Bhopal (` 163 crore
i.e. 13.15 per cent), Indian Institute of Technology, Indore (` 142.80 crore i.e.
11.52 per cent), Indian Institute of Science Education and Research, Bhopal
(` 134 crore i.e. 10.81 per cent), Nepa Limited (` 103.88 crore i.e. 8.38 per
cent) and Maulana Azad National Institute of Technology, Bhopal (` 56 crore
i.e. 4.52 per cent).
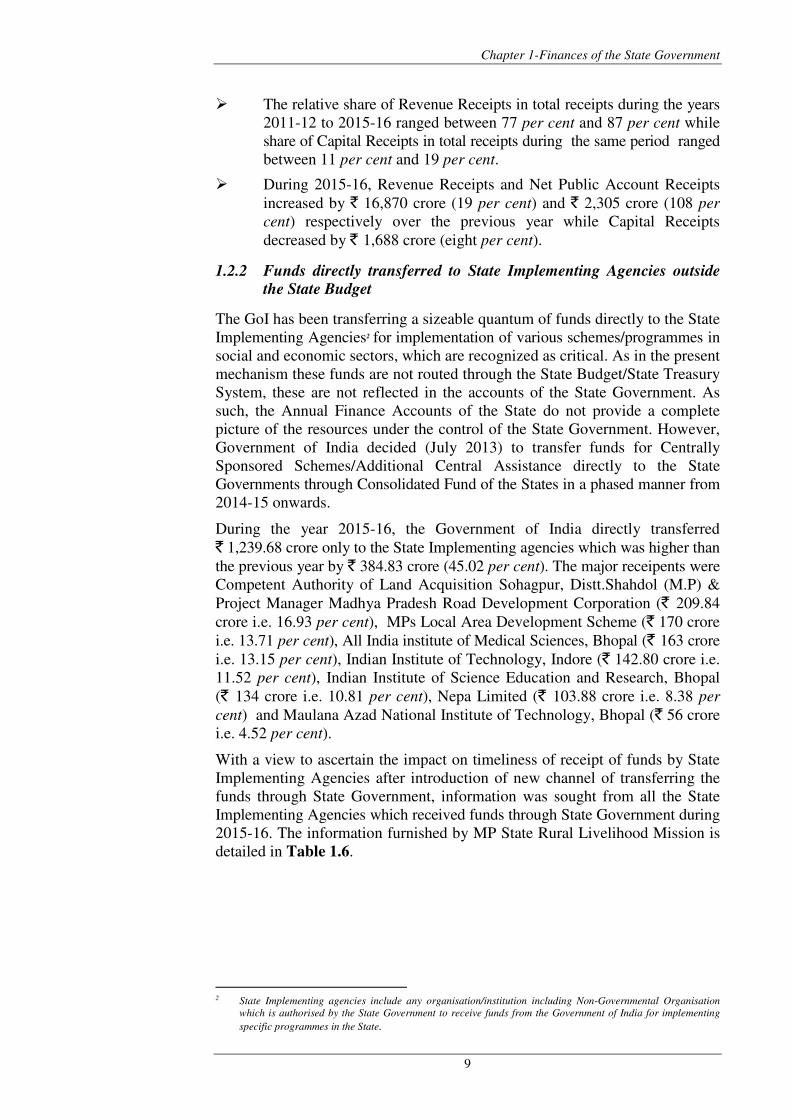
With a view to ascertain the impact on timeliness of receipt of funds by State
Implementing Agencies after introduction of new channel of transferring the
funds through State Government, information was sought from all the State
Implementing Agencies which received funds through State Government during
2015-16. The information furnished by MP State Rural Livelihood Mission is
detailed in Table 1.6.
2 State Implementing agencies include any organisation/institution including Non-Governmental Organisation
which is authorised by the State Government to receive funds from the Government of India for implementing
specific programmes in the State.
Audit Report on State Finances for the year ended 31 March 2016
10
Table 1.6: Delay in receipt of funds by Agencies
(`̀̀̀ in crore)
Sl.
No.
Date on which
GoI share
received by
State
Government
Amount and due date
by which funds to be
received by Agency
Actual date/ Amount
received from State
Govt.
Delay in receipt of
Funds
Due date Amount Actual date Amount
1. 14.05.2015 17.05. 2015 30.06 24.06. 2015 30.06 One month 07 days
2. 04.09.2015 12.09. 2015 15.03 16.11. 2015 15.03 Two months 04 days
3. 23.11.2015 26.11. 2015 18.79 18.12. 2015 18.79 22 days
4. 29.02.2016 02.03. 2016 68.85 31.03. 2016 68.85 29 days
5. 31.12.2015 03.01. 2016 6.51 26.02. 2016 6.51 One month 23 days
(Source: information furnished by MP State Rural Livelihood Mission)
Timeliness of receipt of funds by other State Implementing Agencies could not
be verified as agencies did not furnish due date and amount to be received from
the State Government.
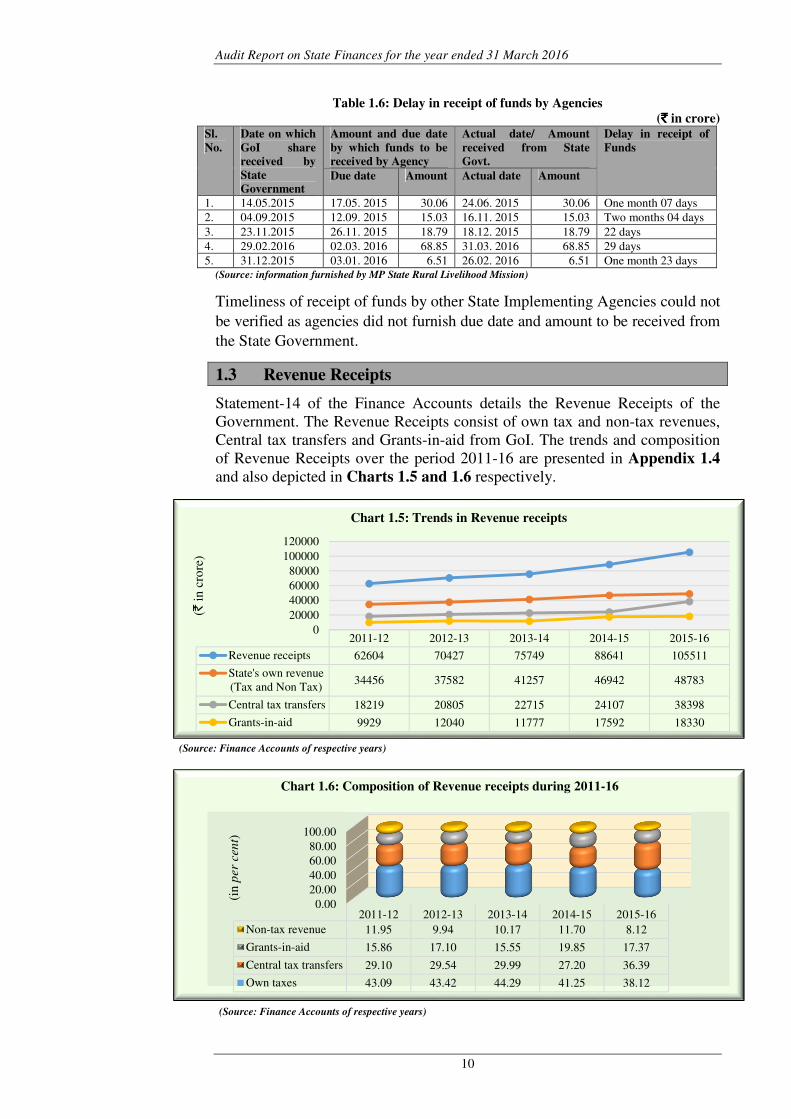
1.3 Revenue Receipts
Statement-14 of the Finance Accounts details the Revenue Receipts of the
Government. The Revenue Receipts consist of own tax and non-tax revenues,
Central tax transfers and Grants-in-aid from GoI. The trends and composition
of Revenue Receipts over the period 2011-16 are presented in Appendix 1.4
and also depicted in Charts 1.5 and 1.6 respectively.
(Source: Finance Accounts of respective years)
(Source: Finance Accounts of respective years)
2011-12 2012-13 2013-14 2014-15 2015-16
Revenue receipts 62604 70427 75749 88641 105511
State's own revenue
(Tax and Non Tax)34456 37582 41257 46942 48783
Central tax transfers 18219 20805 22715 24107 38398
Grants-in-aid 9929 12040 11777 17592 18330
0
20000
40000
60000
80000
100000
120000
(`in
cro
re)
Chart 1.5: Trends in Revenue receipts
0.00
20.00
40.00
60.00
80.00
100.00
2011-12 2012-13 2013-14 2014-15 2015-16
Non-tax revenue 11.95 9.94 10.17 11.70 8.12
Grants-in-aid 15.86 17.10 15.55 19.85 17.37
Central tax transfers 29.10 29.54 29.99 27.20 36.39
Own taxes 43.09 43.42 44.29 41.25 38.12
(in p
er
cen
t)
Chart 1.6: Composition of Revenue receipts during 2011-16
Chapter 1-Finances of the State Government
11
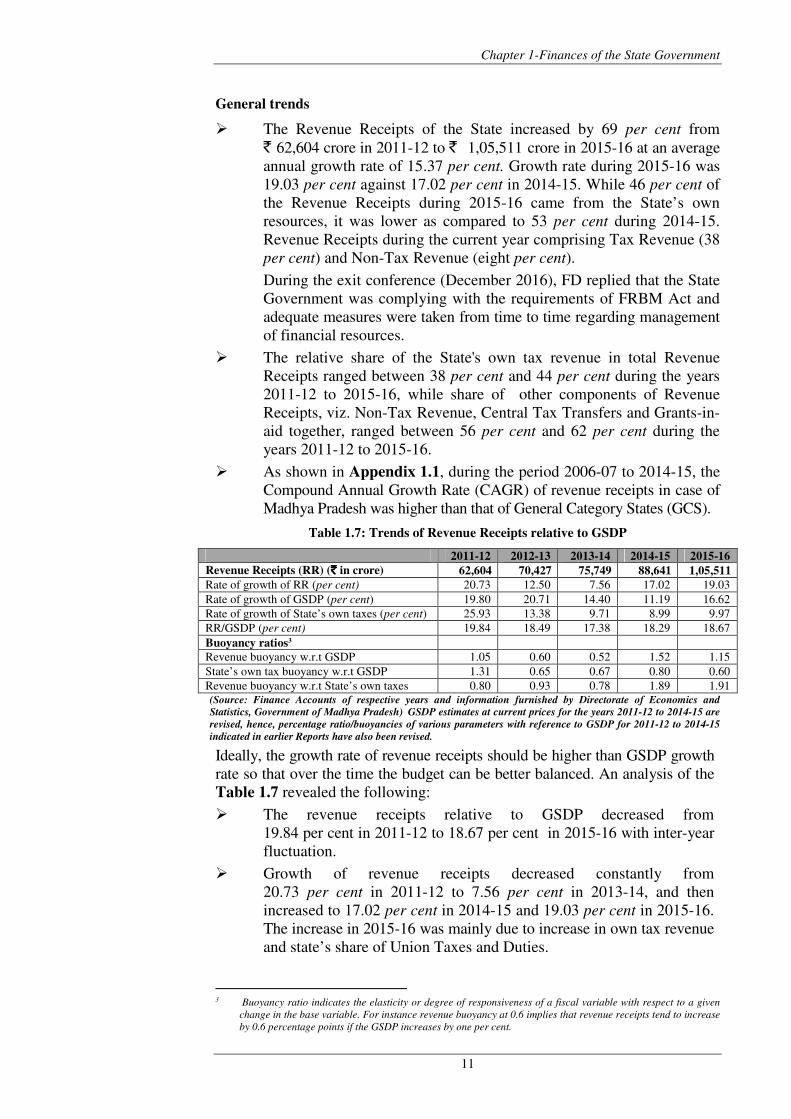
General trends
� The Revenue Receipts of the State increased by 69 per cent from
` 62,604 crore in 2011-12 to ` 1,05,511 crore in 2015-16 at an average
annual growth rate of 15.37 per cent. Growth rate during 2015-16 was
19.03 per cent against 17.02 per cent in 2014-15. While 46 per cent of
the Revenue Receipts during 2015-16 came from the State’s own
resources, it was lower as compared to 53 per cent during 2014-15.
Revenue Receipts during the current year comprising Tax Revenue (38
per cent) and Non-Tax Revenue (eight per cent).
During the exit conference (December 2016), FD replied that the State
Government was complying with the requirements of FRBM Act and
adequate measures were taken from time to time regarding management
of financial resources.
� The relative share of the State's own tax revenue in total Revenue
Receipts ranged between 38 per cent and 44 per cent during the years
2011-12 to 2015-16, while share of other components of Revenue
Receipts, viz. Non-Tax Revenue, Central Tax Transfers and Grants-in-
aid together, ranged between 56 per cent and 62 per cent during the
years 2011-12 to 2015-16.
� As shown in Appendix 1.1, during the period 2006-07 to 2014-15, the
Compound Annual Growth Rate (CAGR) of revenue receipts in case of
Madhya Pradesh was higher than that of General Category States (GCS).
Table 1.7: Trends of Revenue Receipts relative to GSDP
2011-12 2012-13 2013-14 2014-15 2015-16
Revenue Receipts (RR) (`̀̀̀ in crore) 62,604 70,427 75,749 88,641 1,05,511
Rate of growth of RR (per cent) 20.73 12.50 7.56 17.02 19.03
Rate of growth of GSDP (per cent) 19.80 20.71 14.40 11.19 16.62
Rate of growth of State’s own taxes (per cent) 25.93 13.38 9.71 8.99 9.97
RR/GSDP (per cent) 19.84 18.49 17.38 18.29 18.67
Buoyancy ratios3
Revenue buoyancy w.r.t GSDP 1.05 0.60 0.52 1.52 1.15
State’s own tax buoyancy w.r.t GSDP 1.31 0.65 0.67 0.80 0.60
Revenue buoyancy w.r.t State’s own taxes 0.80 0.93 0.78 1.89 1.91
(Source: Finance Accounts of respective years and information furnished by Directorate of Economics and
Statistics, Government of Madhya Pradesh) GSDP estimates at current prices for the years 2011-12 to 2014-15 are
revised, hence, percentage ratio/buoyancies of various parameters with reference to GSDP for 2011-12 to 2014-15
indicated in earlier Reports have also been revised.
Ideally, the growth rate of revenue receipts should be higher than GSDP growth
rate so that over the time the budget can be better balanced. An analysis of the
Table 1.7 revealed the following:
� The revenue receipts relative to GSDP decreased from
19.84 per cent in 2011-12 to 18.67 per cent in 2015-16 with inter-year
fluctuation.
� Growth of revenue receipts decreased constantly from
20.73 per cent in 2011-12 to 7.56 per cent in 2013-14, and then
increased to 17.02 per cent in 2014-15 and 19.03 per cent in 2015-16.
The increase in 2015-16 was mainly due to increase in own tax revenue
and state’s share of Union Taxes and Duties.
3 Buoyancy ratio indicates the elasticity or degree of responsiveness of a fiscal variable with respect to a given
change in the base variable. For instance revenue buoyancy at 0.6 implies that revenue receipts tend to increase
by 0.6 percentage points if the GSDP increases by one per cent.
Audit Report on State Finances for the year ended 31 March 2016
12
� The revenue buoyancy as well as State's own tax buoyancy with
reference to GSDP decreased in 2015-16 (1.15 and 0.60 respectively)
as compared to the previous year (1.52 and 0.80 respectively) owing to
increase in growth rate of GSDP from 11.19 per cent (2014-15) to
16.62 per cent (2015-16).
1.3.1 State’s Own Resources
As the State’s share in Central taxes and grants-in-aid from GoI are determined
on the basis of recommendations of the Finance Commission, the State’s
performance in mobilisation of resources is assessed in terms of its own
resources comprising own tax and non-tax sources.
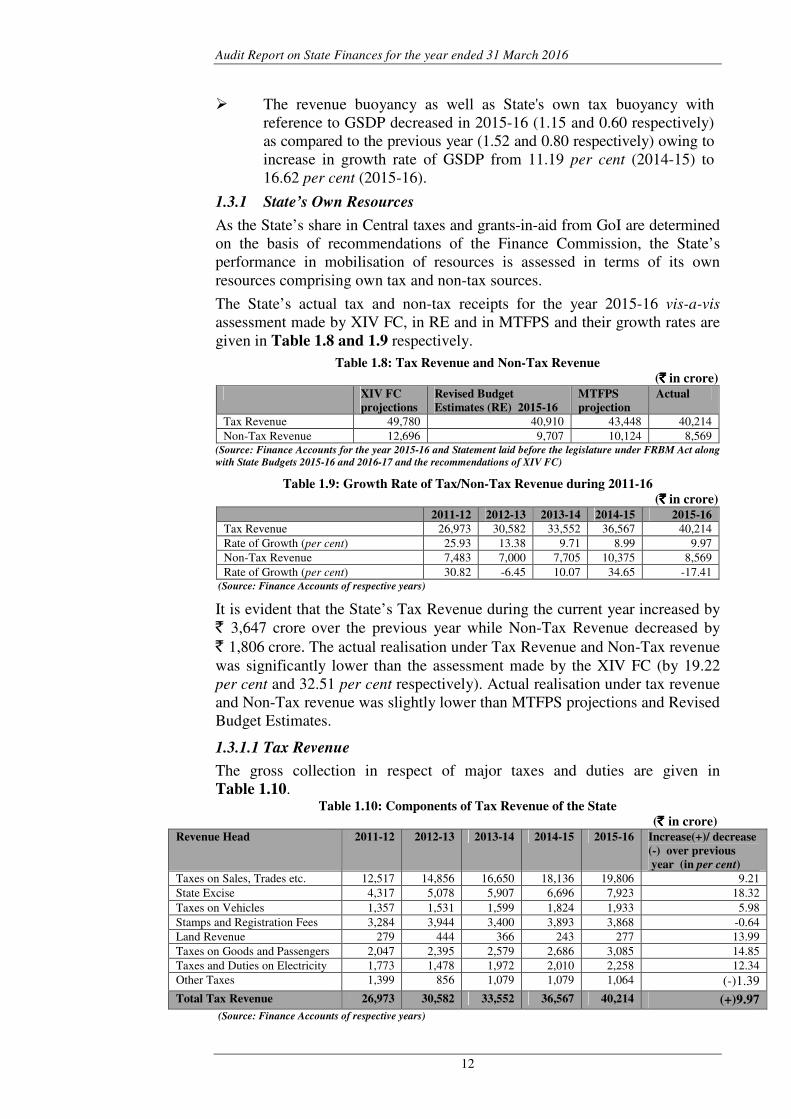
The State’s actual tax and non-tax receipts for the year 2015-16 vis-a-vis
assessment made by XIV FC, in RE and in MTFPS and their growth rates are
given in Table 1.8 and 1.9 respectively.
Table 1.8: Tax Revenue and Non-Tax Revenue
(`̀̀̀ in crore)
XIV FC
projections
Revised Budget
Estimates (RE) 2015-16
MTFPS
projection
Actual
Tax Revenue 49,780 40,910 43,448 40,214
Non-Tax Revenue 12,696 9,707 10,124 8,569 (Source: Finance Accounts for the year 2015-16 and Statement laid before the legislature under FRBM Act along
with State Budgets 2015-16 and 2016-17 and the recommendations of XIV FC)
Table 1.9: Growth Rate of Tax/Non-Tax Revenue during 2011-16
(`̀̀̀ in crore)
2011-12 2012-13 2013-14 2014-15 2015-16
Tax Revenue 26,973 30,582 33,552 36,567 40,214
Rate of Growth (per cent) 25.93 13.38 9.71 8.99 9.97
Non-Tax Revenue 7,483 7,000 7,705 10,375 8,569
Rate of Growth (per cent) 30.82 -6.45 10.07 34.65 -17.41 (Source: Finance Accounts of respective years)
It is evident that the State’s Tax Revenue during the current year increased by
` 3,647 crore over the previous year while Non-Tax Revenue decreased by
` 1,806 crore. The actual realisation under Tax Revenue and Non-Tax revenue
was significantly lower than the assessment made by the XIV FC (by 19.22
per cent and 32.51 per cent respectively). Actual realisation under tax revenue
and Non-Tax revenue was slightly lower than MTFPS projections and Revised
Budget Estimates.
1.3.1.1 Tax Revenue
The gross collection in respect of major taxes and duties are given in
Table 1.10. Table 1.10: Components of Tax Revenue of the State
(` ` ` ` in crore)
Revenue Head 2011-12 2012-13 2013-14 2014-15 2015-16 Increase(+)/ decrease
(-) over previous
year (in per cent)
Taxes on Sales, Trades etc. 12,517 14,856 16,650 18,136 19,806 9.21
State Excise 4,317 5,078 5,907 6,696 7,923 18.32
Taxes on Vehicles 1,357 1,531 1,599 1,824 1,933 5.98
Stamps and Registration Fees 3,284 3,944 3,400 3,893 3,868 -0.64
Land Revenue 279 444 366 243 277 13.99
Taxes on Goods and Passengers 2,047 2,395 2,579 2,686 3,085 14.85
Taxes and Duties on Electricity 1,773 1,478 1,972 2,010 2,258 12.34
Other Taxes 1,399 856 1,079 1,079 1,064 (-)1.39
Total Tax Revenue 26,973 30,582 33,552 36,567 40,214 (+)9.97
(Source: Finance Accounts of respective years)
Chapter 1-Finances of the State Government
13
� The State’s own tax revenue increased by 9.97 per cent during 2015-16
over the previous year. Taxes on Sales, Trades etc. were the major
contributors (49.25 per cent) of the State’s own tax revenue followed by
State Excise (19.70 per cent), Stamps and Registration Fees (9.62 per
cent), Taxes on Goods and Passengers (7.67 per cent), Taxes on Duties
on Electricity (5.61 per cent) and Taxes on Vehicles (4.81 per cent)
during 2015-16.
� The increase in receipts under Taxes on Sales, Trades etc. (by ` 1,670
crore) was mainly due to more receipts under the sub-head ‘102- State
Sales Tax Act’ (by ` 1,575 crore). The increase in State Excise receipts
(by ` 1,227 crore) was mainly under ‘800-Other receipts’. The increase
under Taxes on Goods and Passangers (by ` 398 crore) was mainly due
to increase under ‘sub head 106- Tax on entry of Goods into Local
Areas’ (by ` 450 crore) partly offset by decrease under ‘sub head 102-
Tolls on Roads’ (by ` 85 crore). Stamp and Registration Fees witnessed
slight decrease of ` 25 crore.
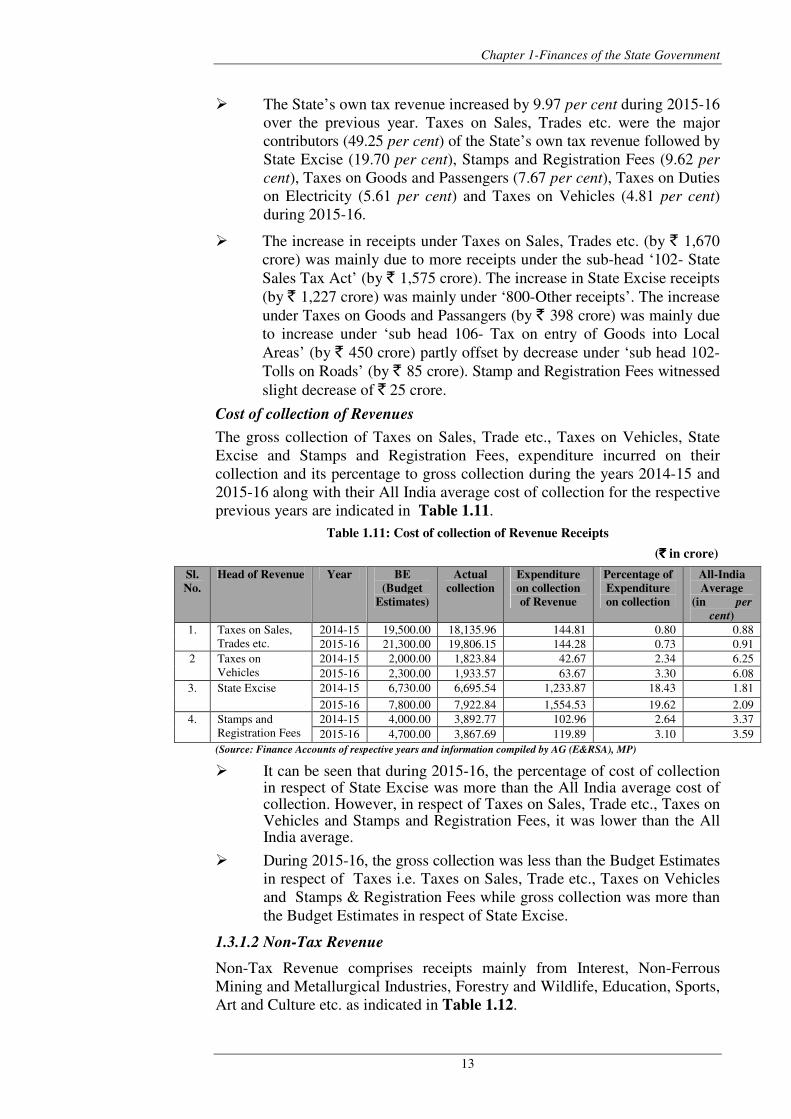
Cost of collection of Revenues
The gross collection of Taxes on Sales, Trade etc., Taxes on Vehicles, State
Excise and Stamps and Registration Fees, expenditure incurred on their
collection and its percentage to gross collection during the years 2014-15 and
2015-16 along with their All India average cost of collection for the respective
previous years are indicated in Table 1.11.
Table 1.11: Cost of collection of Revenue Receipts
(`̀̀̀ in crore)
Sl.
No.
Head of Revenue Year BE
(Budget
Estimates)
Actual
collection
Expenditure
on collection
of Revenue
Percentage of
Expenditure
on collection
All-India
Average
(in per
cent)
1. Taxes on Sales,
Trades etc.
2014-15 19,500.00 18,135.96 144.81 0.80 0.88
2015-16 21,300.00 19,806.15 144.28 0.73 0.91
2 Taxes on
Vehicles
2014-15 2,000.00 1,823.84 42.67 2.34 6.25
2015-16 2,300.00 1,933.57 63.67 3.30 6.08
3. State Excise 2014-15 6,730.00 6,695.54 1,233.87 18.43 1.81
2015-16 7,800.00 7,922.84 1,554.53 19.62 2.09
4. Stamps and
Registration Fees
2014-15 4,000.00 3,892.77 102.96 2.64 3.37
2015-16 4,700.00 3,867.69 119.89 3.10 3.59
(Source: Finance Accounts of respective years and information compiled by AG (E&RSA), MP)
� It can be seen that during 2015-16, the percentage of cost of collection in respect of State Excise was more than the All India average cost of collection. However, in respect of Taxes on Sales, Trade etc., Taxes on Vehicles and Stamps and Registration Fees, it was lower than the All India average.
� During 2015-16, the gross collection was less than the Budget Estimates
in respect of Taxes i.e. Taxes on Sales, Trade etc., Taxes on Vehicles
and Stamps & Registration Fees while gross collection was more than
the Budget Estimates in respect of State Excise.
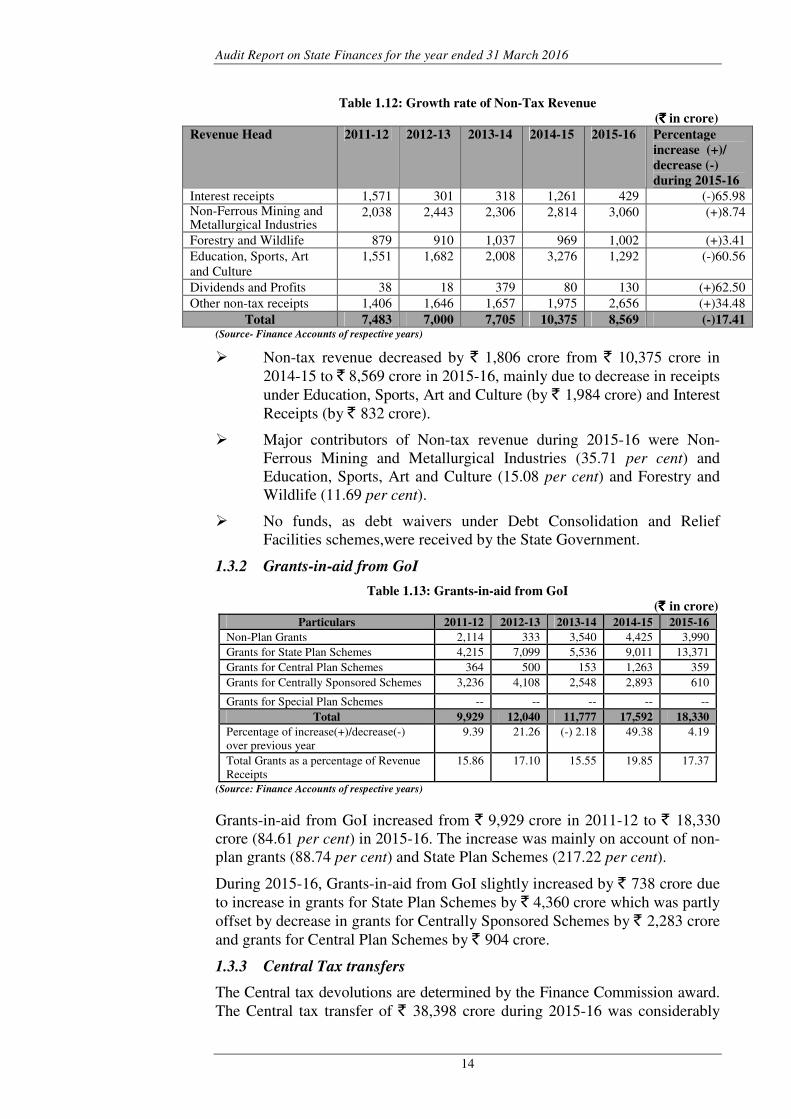
1.3.1.2 Non-Tax Revenue
Non-Tax Revenue comprises receipts mainly from Interest, Non-Ferrous
Mining and Metallurgical Industries, Forestry and Wildlife, Education, Sports,
Art and Culture etc. as indicated in Table 1.12.
Audit Report on State Finances for the year ended 31 March 2016
14
Table 1.12: Growth rate of Non-Tax Revenue
(`̀̀̀ in crore)
Revenue Head 2011-12 2012-13 2013-14 2014-15 2015-16 Percentage
increase (+)/
decrease (-)
during 2015-16
Interest receipts 1,571 301 318 1,261 429 (-)65.98 Non-Ferrous Mining and Metallurgical Industries
2,038 2,443 2,306 2,814 3,060 (+)8.74
Forestry and Wildlife 879 910 1,037 969 1,002 (+)3.41
Education, Sports, Art
and Culture
1,551 1,682 2,008 3,276 1,292 (-)60.56
Dividends and Profits 38 18 379 80 130 (+)62.50
Other non-tax receipts 1,406 1,646 1,657 1,975 2,656 (+)34.48
Total 7,483 7,000 7,705 10,375 8,569 (-)17.41 (Source- Finance Accounts of respective years)
� Non-tax revenue decreased by ` 1,806 crore from ` 10,375 crore in
2014-15 to ` 8,569 crore in 2015-16, mainly due to decrease in receipts
under Education, Sports, Art and Culture (by ` 1,984 crore) and Interest
Receipts (by ` 832 crore).
� Major contributors of Non-tax revenue during 2015-16 were Non-
Ferrous Mining and Metallurgical Industries (35.71 per cent) and
Education, Sports, Art and Culture (15.08 per cent) and Forestry and
Wildlife (11.69 per cent).
� No funds, as debt waivers under Debt Consolidation and Relief
Facilities schemes,were received by the State Government.
1.3.2 Grants-in-aid from GoI
Table 1.13: Grants-in-aid from GoI
(` ` ` ` in crore)
Particulars 2011-12 2012-13 2013-14 2014-15 2015-16
Non-Plan Grants 2,114 333 3,540 4,425 3,990
Grants for State Plan Schemes 4,215 7,099 5,536 9,011 13,371
Grants for Central Plan Schemes 364 500 153 1,263 359
Grants for Centrally Sponsored Schemes 3,236 4,108 2,548 2,893 610
Grants for Special Plan Schemes -- -- -- -- --
Total 9,929 12,040 11,777 17,592 18,330
Percentage of increase(+)/decrease(-)
over previous year
9.39 21.26 (-) 2.18 49.38 4.19
Total Grants as a percentage of Revenue
Receipts
15.86 17.10 15.55 19.85 17.37
(Source: Finance Accounts of respective years)
Grants-in-aid from GoI increased from ` 9,929 crore in 2011-12 to ` 18,330
crore (84.61 per cent) in 2015-16. The increase was mainly on account of non-
plan grants (88.74 per cent) and State Plan Schemes (217.22 per cent).
During 2015-16, Grants-in-aid from GoI slightly increased by ` 738 crore due
to increase in grants for State Plan Schemes by ` 4,360 crore which was partly
offset by decrease in grants for Centrally Sponsored Schemes by ` 2,283 crore
and grants for Central Plan Schemes by ` 904 crore.
1.3.3 Central Tax transfers
The Central tax devolutions are determined by the Finance Commission award.
The Central tax transfer of ` 38,398 crore during 2015-16 was considerably
Chapter 1-Finances of the State Government
15
higher than the estimated amount of ` 30,450 crore as given in Macro Economic
Framework Statement. It also increased by ` 14,291 crore from ` 24,107 crore
in 2014-15 mainly due to increase under Corporation Tax (by ` 3,660 crore),
Service Tax (by ` 3,102 crore), Union Excise Duties (by ` 2,899 crore) and
Taxes on Income other than Corporation Tax (by ` 2,389 crore).
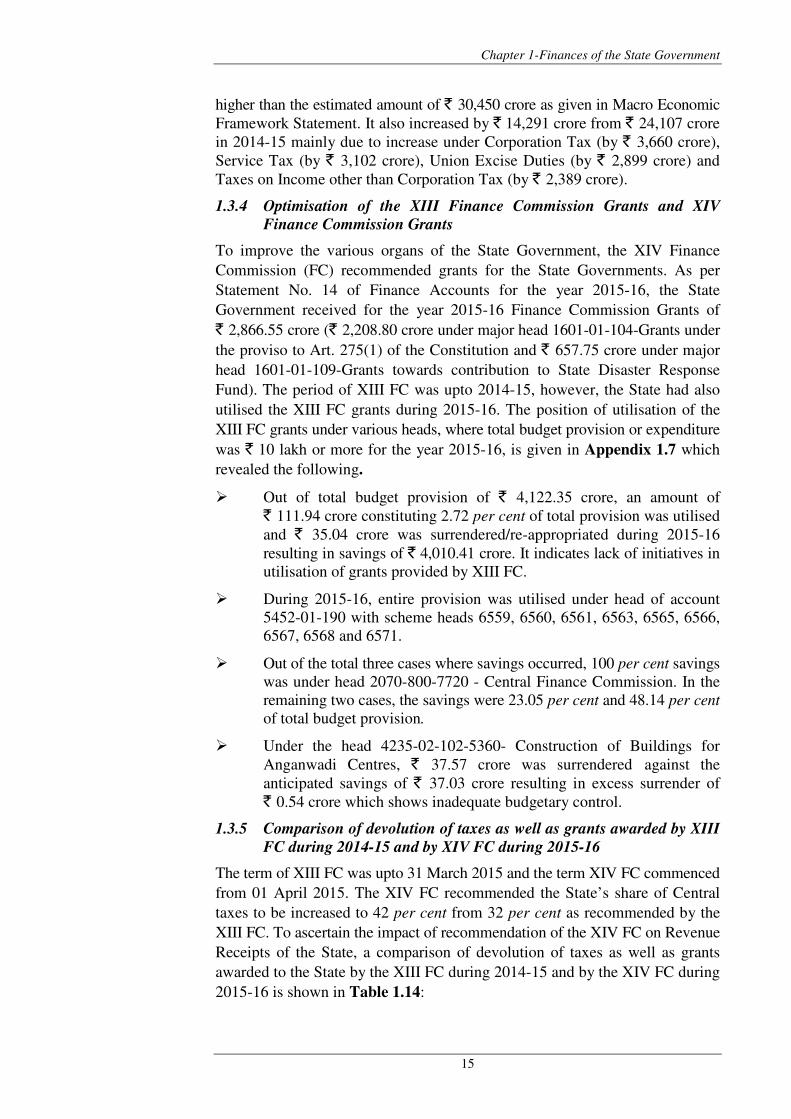
1.3.4 Optimisation of the XIII Finance Commission Grants and XIV
Finance Commission Grants
To improve the various organs of the State Government, the XIV Finance
Commission (FC) recommended grants for the State Governments. As per
Statement No. 14 of Finance Accounts for the year 2015-16, the State
Government received for the year 2015-16 Finance Commission Grants of
` 2,866.55 crore (` 2,208.80 crore under major head 1601-01-104-Grants under
the proviso to Art. 275(1) of the Constitution and ` 657.75 crore under major
head 1601-01-109-Grants towards contribution to State Disaster Response
Fund). The period of XIII FC was upto 2014-15, however, the State had also
utilised the XIII FC grants during 2015-16. The position of utilisation of the
XIII FC grants under various heads, where total budget provision or expenditure
was ` 10 lakh or more for the year 2015-16, is given in Appendix 1.7 which
revealed the following.
� Out of total budget provision of ` 4,122.35 crore, an amount of
` 111.94 crore constituting 2.72 per cent of total provision was utilised
and ` 35.04 crore was surrendered/re-appropriated during 2015-16
resulting in savings of ` 4,010.41 crore. It indicates lack of initiatives in
utilisation of grants provided by XIII FC.
� During 2015-16, entire provision was utilised under head of account
5452-01-190 with scheme heads 6559, 6560, 6561, 6563, 6565, 6566,
6567, 6568 and 6571.
� Out of the total three cases where savings occurred, 100 per cent savings
was under head 2070-800-7720 - Central Finance Commission. In the
remaining two cases, the savings were 23.05 per cent and 48.14 per cent
of total budget provision.
� Under the head 4235-02-102-5360- Construction of Buildings for
Anganwadi Centres, ` 37.57 crore was surrendered against the
anticipated savings of ` 37.03 crore resulting in excess surrender of
` 0.54 crore which shows inadequate budgetary control.
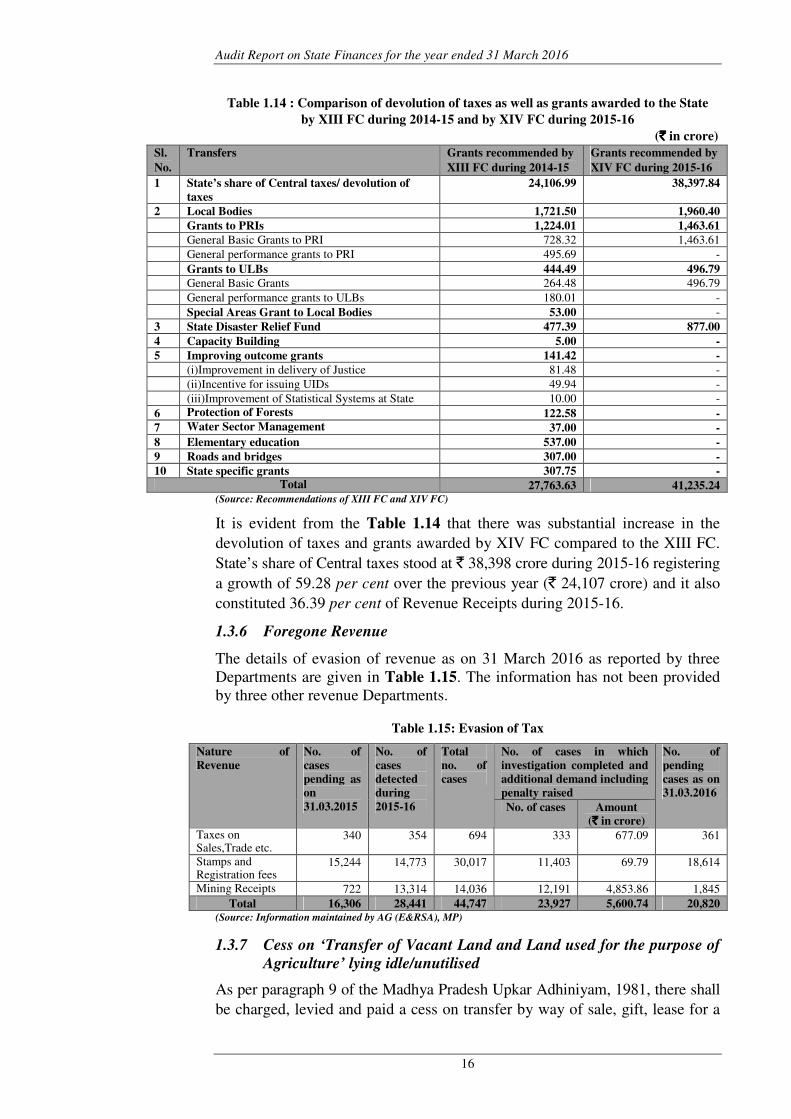
1.3.5 Comparison of devolution of taxes as well as grants awarded by XIII
FC during 2014-15 and by XIV FC during 2015-16
The term of XIII FC was upto 31 March 2015 and the term XIV FC commenced
from 01 April 2015. The XIV FC recommended the State’s share of Central
taxes to be increased to 42 per cent from 32 per cent as recommended by the
XIII FC. To ascertain the impact of recommendation of the XIV FC on Revenue
Receipts of the State, a comparison of devolution of taxes as well as grants
awarded to the State by the XIII FC during 2014-15 and by the XIV FC during
2015-16 is shown in Table 1.14:
Audit Report on State Finances for the year ended 31 March 2016
16
Table 1.14 : Comparison of devolution of taxes as well as grants awarded to the State
by XIII FC during 2014-15 and by XIV FC during 2015-16
(`̀̀̀ in crore)
Sl.
No.
Transfers Grants recommended by
XIII FC during 2014-15
Grants recommended by
XIV FC during 2015-16
1 State’s share of Central taxes/ devolution of
taxes
24,106.99 38,397.84
2 Local Bodies 1,721.50 1,960.40
Grants to PRIs 1,224.01 1,463.61
General Basic Grants to PRI 728.32 1,463.61
General performance grants to PRI 495.69 -
Grants to ULBs 444.49 496.79
General Basic Grants 264.48 496.79
General performance grants to ULBs 180.01 -
Special Areas Grant to Local Bodies 53.00 -
3 State Disaster Relief Fund 477.39 877.00
4 Capacity Building 5.00 -
5 Improving outcome grants 141.42 -
(i)Improvement in delivery of Justice 81.48 -
(ii)Incentive for issuing UIDs 49.94 -
(iii)Improvement of Statistical Systems at State 10.00 -
6 Protection of Forests 122.58 -
7 Water Sector Management 37.00 -
8 Elementary education 537.00 -
9 Roads and bridges 307.00 -
10 State specific grants 307.75 - Total 27,763.63 41,235.24
(Source: Recommendations of XIII FC and XIV FC)
It is evident from the Table 1.14 that there was substantial increase in the
devolution of taxes and grants awarded by XIV FC compared to the XIII FC.
State’s share of Central taxes stood at ` 38,398 crore during 2015-16 registering
a growth of 59.28 per cent over the previous year (` 24,107 crore) and it also
constituted 36.39 per cent of Revenue Receipts during 2015-16.
1.3.6 Foregone Revenue
The details of evasion of revenue as on 31 March 2016 as reported by three
Departments are given in Table 1.15. The information has not been provided
by three other revenue Departments.
Table 1.15: Evasion of Tax
Nature of
Revenue
No. of
cases
pending as
on
31.03.2015
No. of
cases
detected
during
2015-16
Total
no. of
cases
No. of cases in which
investigation completed and
additional demand including
penalty raised
No. of
pending
cases as on
31.03.2016
No. of cases Amount
(`̀̀̀ in crore)
Taxes on Sales,Trade etc.
340 354 694 333 677.09 361
Stamps and Registration fees
15,244 14,773 30,017 11,403 69.79 18,614
Mining Receipts 722 13,314 14,036 12,191 4,853.86 1,845
Total 16,306 28,441 44,747 23,927 5,600.74 20,820 (Source: Information maintained by AG (E&RSA), MP)
1.3.7 Cess on ‘Transfer of Vacant Land and Land used for the purpose of
Agriculture’ lying idle/unutilised
As per paragraph 9 of the Madhya Pradesh Upkar Adhiniyam, 1981, there shall
be charged, levied and paid a cess on transfer by way of sale, gift, lease for a
Chapter 1-Finances of the State Government
17
period of thirty years or more or usufructuary mortgage, of vacant land and land
used for the purpose of agriculture at the rate of five per cent of the amount of
stamp duty with which instrument of each such transfer is chargeable in
accordance with the relevant article in Schedule 1- A of the Indian Stamp Act,
1899. The proceeds of the cess shall be applied to rural development specially
for providing employment in rural areas.
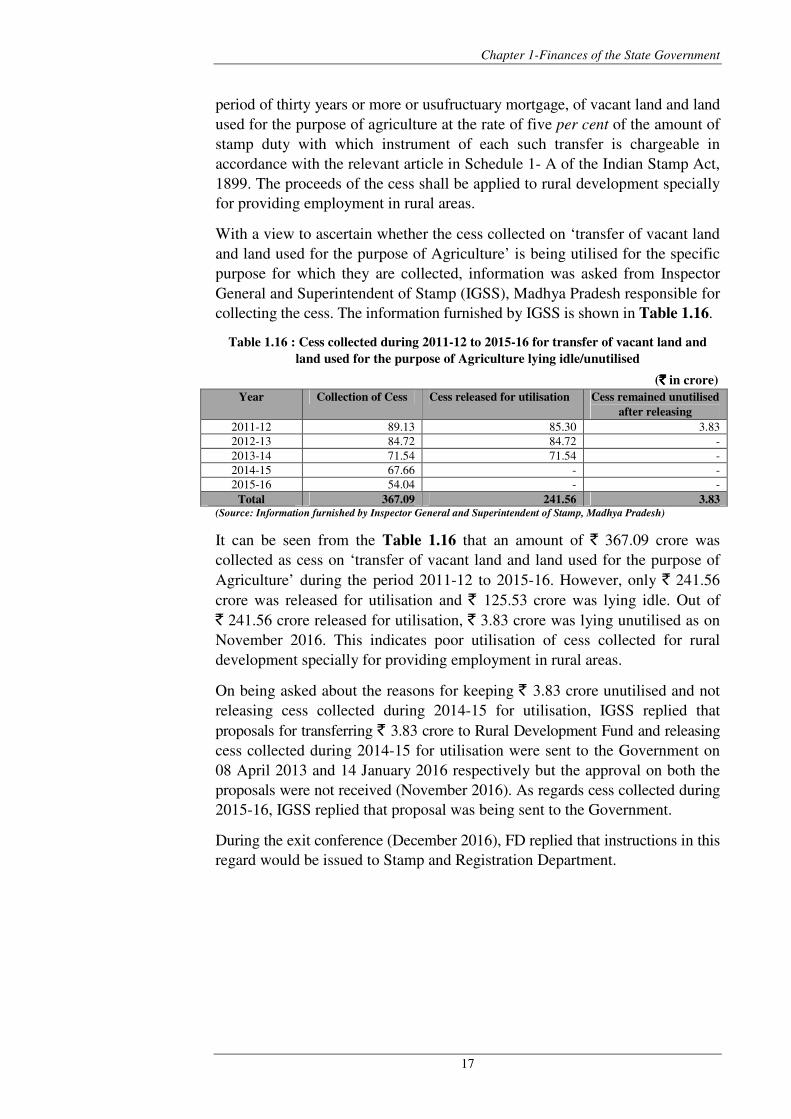
With a view to ascertain whether the cess collected on ‘transfer of vacant land
and land used for the purpose of Agriculture’ is being utilised for the specific
purpose for which they are collected, information was asked from Inspector
General and Superintendent of Stamp (IGSS), Madhya Pradesh responsible for
collecting the cess. The information furnished by IGSS is shown in Table 1.16.
Table 1.16 : Cess collected during 2011-12 to 2015-16 for transfer of vacant land and
land used for the purpose of Agriculture lying idle/unutilised
(`̀̀̀ in crore)
Year Collection of Cess Cess released for utilisation Cess remained unutilised
after releasing
2011-12 89.13 85.30 3.83
2012-13 84.72 84.72 -
2013-14 71.54 71.54 -
2014-15 67.66 - -
2015-16 54.04 - -
Total 367.09 241.56 3.83 (Source: Information furnished by Inspector General and Superintendent of Stamp, Madhya Pradesh)
It can be seen from the Table 1.16 that an amount of ` 367.09 crore was
collected as cess on ‘transfer of vacant land and land used for the purpose of
Agriculture’ during the period 2011-12 to 2015-16. However, only ` 241.56
crore was released for utilisation and ` 125.53 crore was lying idle. Out of
` 241.56 crore released for utilisation, ` 3.83 crore was lying unutilised as on
November 2016. This indicates poor utilisation of cess collected for rural
development specially for providing employment in rural areas.
On being asked about the reasons for keeping ` 3.83 crore unutilised and not
releasing cess collected during 2014-15 for utilisation, IGSS replied that
proposals for transferring ` 3.83 crore to Rural Development Fund and releasing
cess collected during 2014-15 for utilisation were sent to the Government on
08 April 2013 and 14 January 2016 respectively but the approval on both the
proposals were not received (November 2016). As regards cess collected during
2015-16, IGSS replied that proposal was being sent to the Government.
During the exit conference (December 2016), FD replied that instructions in this
regard would be issued to Stamp and Registration Department.
Audit Report on State Finances for the year ended 31 March 2016
18
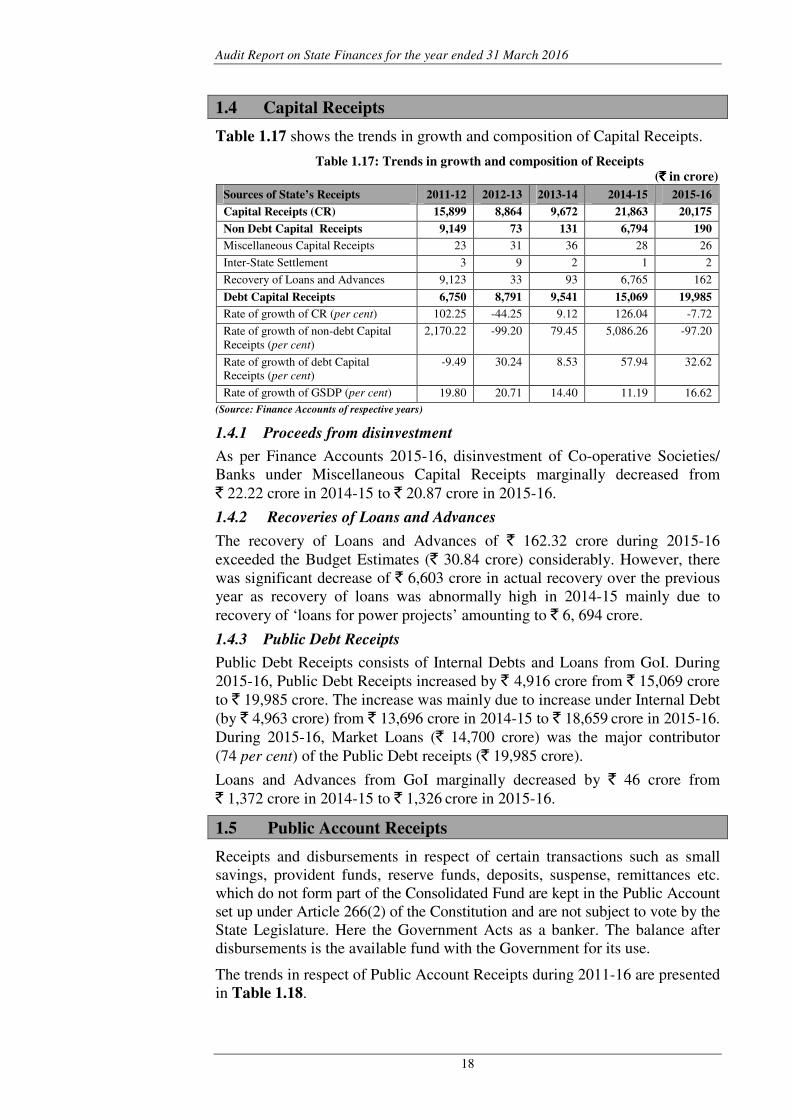
1.4 Capital Receipts
Table 1.17 shows the trends in growth and composition of Capital Receipts.
Table 1.17: Trends in growth and composition of Receipts
(`̀̀̀ in crore)
Sources of State’s Receipts 2011-12 2012-13 2013-14 2014-15 2015-16
Capital Receipts (CR) 15,899 8,864 9,672 21,863 20,175
Non Debt Capital Receipts 9,149 73 131 6,794 190
Miscellaneous Capital Receipts 23 31 36 28 26
Inter-State Settlement 3 9 2 1 2
Recovery of Loans and Advances 9,123 33 93 6,765 162
Debt Capital Receipts 6,750 8,791 9,541 15,069 19,985
Rate of growth of CR (per cent) 102.25 -44.25 9.12 126.04 -7.72
Rate of growth of non-debt Capital
Receipts (per cent)
2,170.22 -99.20 79.45 5,086.26 -97.20
Rate of growth of debt Capital
Receipts (per cent)
-9.49 30.24 8.53 57.94 32.62
Rate of growth of GSDP (per cent) 19.80 20.71 14.40 11.19 16.62
(Source: Finance Accounts of respective years)
1.4.1 Proceeds from disinvestment
As per Finance Accounts 2015-16, disinvestment of Co-operative Societies/
Banks under Miscellaneous Capital Receipts marginally decreased from
` 22.22 crore in 2014-15 to ` 20.87 crore in 2015-16.
1.4.2 Recoveries of Loans and Advances
The recovery of Loans and Advances of ` 162.32 crore during 2015-16
exceeded the Budget Estimates (` 30.84 crore) considerably. However, there
was significant decrease of ` 6,603 crore in actual recovery over the previous
year as recovery of loans was abnormally high in 2014-15 mainly due to
recovery of ‘loans for power projects’ amounting to ` 6, 694 crore.
1.4.3 Public Debt Receipts
Public Debt Receipts consists of Internal Debts and Loans from GoI. During
2015-16, Public Debt Receipts increased by ` 4,916 crore from ` 15,069 crore
to ` 19,985 crore. The increase was mainly due to increase under Internal Debt
(by ` 4,963 crore) from ` 13,696 crore in 2014-15 to ` 18,659 crore in 2015-16.
During 2015-16, Market Loans (` 14,700 crore) was the major contributor
(74 per cent) of the Public Debt receipts (` 19,985 crore).
Loans and Advances from GoI marginally decreased by ` 46 crore from
` 1,372 crore in 2014-15 to ` 1,326 crore in 2015-16.
1.5 Public Account Receipts
Receipts and disbursements in respect of certain transactions such as small
savings, provident funds, reserve funds, deposits, suspense, remittances etc.
which do not form part of the Consolidated Fund are kept in the Public Account
set up under Article 266(2) of the Constitution and are not subject to vote by the
State Legislature. Here the Government Acts as a banker. The balance after
disbursements is the available fund with the Government for its use.
The trends in respect of Public Account Receipts during 2011-16 are presented
in Table 1.18.
Chapter 1-Finances of the State Government
19
Table 1.18: Trends in Public Account Receipts
(`̀̀̀ in crore)
Resources under various heads 2011-12 2012-13 2013-14 2014-15 2015-16
Public Account Receipts (Gross) 76,315 86,248 94,811 1,10,295 1,32,772
a. Small Savings, Provident Fund etc. 2,033 2,319 2,784 3,143 3,498
b. Reserve Fund 1,534 2,441 1,612 1,172 2,719
c. Deposits and Advances 9,872 6,502 10,369 16,349 23,349
d. Suspense and Miscellaneous 50,620 59,819 64,444 76,099 87,338
e. Remittances 12,256 15,167 15,602 13,532 15,868
(Source: Finance Accounts of respective years)
Public Account Receipts (Gross) increased by ` 22,477 crore (20 per cent) from
` 1,10,295 crore in 2014-15 to ` 1,32,772 crore in 2015-16. The increase was
mainly under Suspense & Miscellaneous (by ` 11,239 crore) and Deposits and
Advances (by ` 7,000 crore).
1.6 Application of Resources
Analysis of the allocation of expenditure at the State Government level assumes
significance since major expenditure responsibilities are entrusted with them.
Within the framework of fiscal responsibility legislations, there are budgetary
constraints in raising public expenditure financed by deficit or borrowings. It is,
however, important to ensure that the ongoing fiscal correction and
consolidation process at the State level is not at the cost of the expenditure
directed towards development of social sector.
1.6.1 Growth and composition of expenditure
Chart 1.7 presents the trend in Total Expenditure (excluding Public Debt
repayments) over a period of the last five years (2011-16). Expenditure under
various components is depicted in Chart 1.8 and the trend of expenditure by
activities/services is shown in Chart 1.9.
(Source: Finance Accounts of respective years)
During the period 2011-16, the Total Expenditure of the State increased by
` 42,253 crore (55 per cent). The Revenue Expenditure and Capital Expenditure
increased by ` 47,077 crore (89 per cent) and ` 7,780 crore (86 per cent)
respectively during the same period.
During 2015-16, the increase of ` 12,979 crore in Total Expenditure (by 12 per
cent) over 2014-15 was mainly due to increase of ` 17,398 crore (21 per cent)
in Revenue Expenditure.
2011-12 2012-13 2013-14 2014-15 2015-16
Total Expenditure 77513 79920 85762 106787 119766
Revenue Expenditure 52694 62968 69870 82373 99771
Non-Plan Revenue
Expenditure36677 44619 50443 55858 68319
Capital Expenditure 9055 11567 10813 11878 16835
Loans and Advances 15760 5378 5077 12535 3158
020000400006000080000
100000120000140000
(`in
cro
re)
Chart 1.7: Total Expenditure-trend and composition
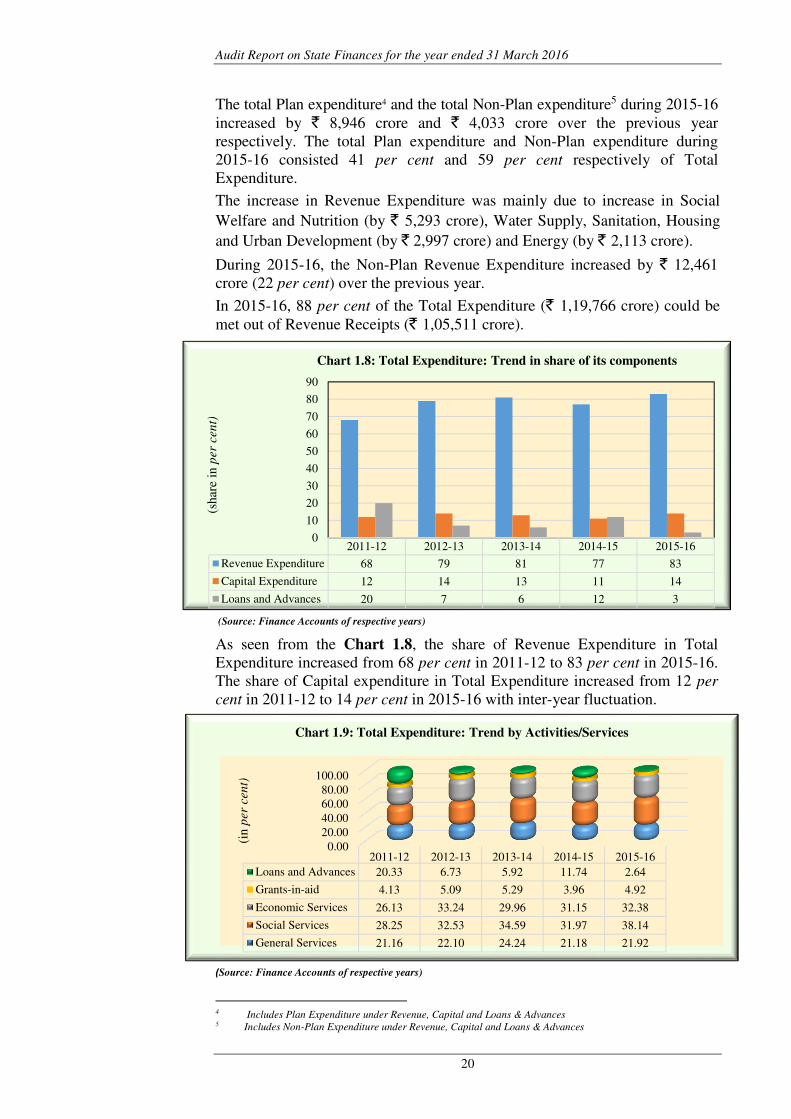
Audit Report on State Finances for the year ended 31 March 2016
20
The total Plan expenditure4 and the total Non-Plan expenditure5 during 2015-16
increased by ` 8,946 crore and ` 4,033 crore over the previous year
respectively. The total Plan expenditure and Non-Plan expenditure during
2015-16 consisted 41 per cent and 59 per cent respectively of Total
Expenditure.
The increase in Revenue Expenditure was mainly due to increase in Social
Welfare and Nutrition (by ` 5,293 crore), Water Supply, Sanitation, Housing
and Urban Development (by ` 2,997 crore) and Energy (by ` 2,113 crore).
During 2015-16, the Non-Plan Revenue Expenditure increased by ` 12,461
crore (22 per cent) over the previous year.
In 2015-16, 88 per cent of the Total Expenditure (` 1,19,766 crore) could be
met out of Revenue Receipts (` 1,05,511 crore).
(Source: Finance Accounts of respective years)
As seen from the Chart 1.8, the share of Revenue Expenditure in Total
Expenditure increased from 68 per cent in 2011-12 to 83 per cent in 2015-16.
The share of Capital expenditure in Total Expenditure increased from 12 per
cent in 2011-12 to 14 per cent in 2015-16 with inter-year fluctuation.
(Source: Finance Accounts of respective years)
4 Includes Plan Expenditure under Revenue, Capital and Loans & Advances 5 Includes Non-Plan Expenditure under Revenue, Capital and Loans & Advances
2011-12 2012-13 2013-14 2014-15 2015-16
Revenue Expenditure 68 79 81 77 83
Capital Expenditure 12 14 13 11 14
Loans and Advances 20 7 6 12 3
0
10
20
30
40
50
60
70
80
90
(shar
e in
per
cen
t)
Chart 1.8: Total Expenditure: Trend in share of its components
0.00
20.00
40.00
60.00
80.00
100.00
2011-12 2012-13 2013-14 2014-15 2015-16
Loans and Advances 20.33 6.73 5.92 11.74 2.64
Grants-in-aid 4.13 5.09 5.29 3.96 4.92
Economic Services 26.13 33.24 29.96 31.15 32.38
Social Services 28.25 32.53 34.59 31.97 38.14
General Services 21.16 22.10 24.24 21.18 21.92
(in p
er
cen
t)
Chart 1.9: Total Expenditure: Trend by Activities/Services
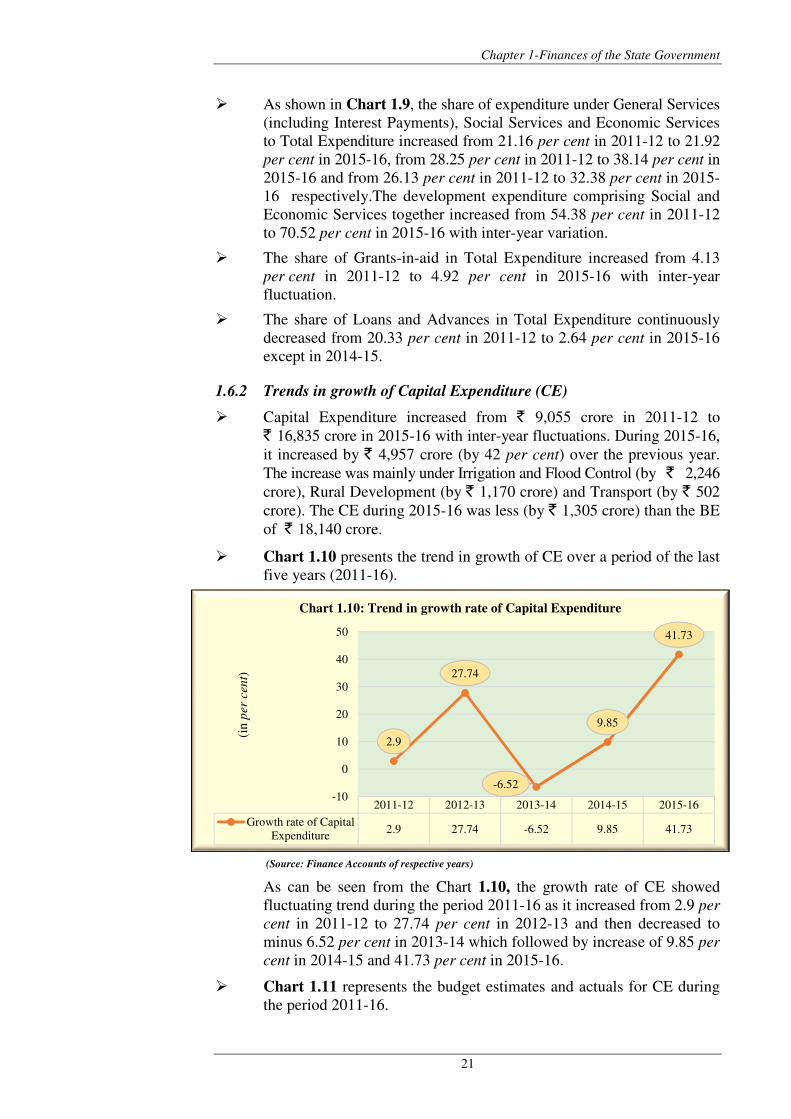
Chapter 1-Finances of the State Government
21
� As shown in Chart 1.9, the share of expenditure under General Services
(including Interest Payments), Social Services and Economic Services
to Total Expenditure increased from 21.16 per cent in 2011-12 to 21.92
per cent in 2015-16, from 28.25 per cent in 2011-12 to 38.14 per cent in
2015-16 and from 26.13 per cent in 2011-12 to 32.38 per cent in 2015-
16 respectively.The development expenditure comprising Social and
Economic Services together increased from 54.38 per cent in 2011-12
to 70.52 per cent in 2015-16 with inter-year variation.
� The share of Grants-in-aid in Total Expenditure increased from 4.13
per cent in 2011-12 to 4.92 per cent in 2015-16 with inter-year
fluctuation.
� The share of Loans and Advances in Total Expenditure continuously
decreased from 20.33 per cent in 2011-12 to 2.64 per cent in 2015-16
except in 2014-15.
1.6.2 Trends in growth of Capital Expenditure (CE)
� Capital Expenditure increased from ` 9,055 crore in 2011-12 to
` 16,835 crore in 2015-16 with inter-year fluctuations. During 2015-16,
it increased by ` 4,957 crore (by 42 per cent) over the previous year.
The increase was mainly under Irrigation and Flood Control (by ` 2,246
crore), Rural Development (by ` 1,170 crore) and Transport (by ` 502
crore). The CE during 2015-16 was less (by ` 1,305 crore) than the BE
of ` 18,140 crore.
� Chart 1.10 presents the trend in growth of CE over a period of the last
five years (2011-16).
(Source: Finance Accounts of respective years)
As can be seen from the Chart 1.10, the growth rate of CE showed
fluctuating trend during the period 2011-16 as it increased from 2.9 per
cent in 2011-12 to 27.74 per cent in 2012-13 and then decreased to
minus 6.52 per cent in 2013-14 which followed by increase of 9.85 per
cent in 2014-15 and 41.73 per cent in 2015-16.
� Chart 1.11 represents the budget estimates and actuals for CE during
the period 2011-16.
2011-12 2012-13 2013-14 2014-15 2015-16
Growth rate of Capital
Expenditure2.9 27.74 -6.52 9.85 41.73
2.9
27.74
-6.52
9.85
41.73
-10
0
10
20
30
40
50
(in p
er
cen
t)
Chart 1.10: Trend in growth rate of Capital Expenditure
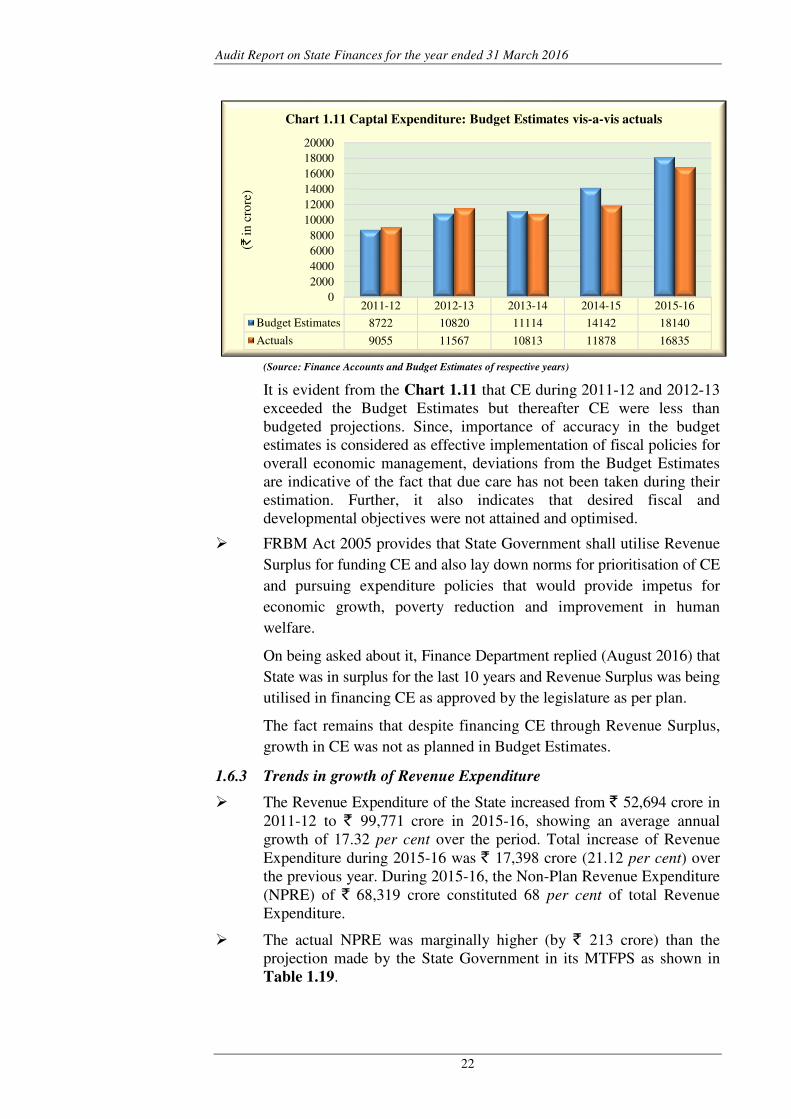
Audit Report on State Finances for the year ended 31 March 2016
22
(Source: Finance Accounts and Budget Estimates of respective years)
It is evident from the Chart 1.11 that CE during 2011-12 and 2012-13
exceeded the Budget Estimates but thereafter CE were less than
budgeted projections. Since, importance of accuracy in the budget
estimates is considered as effective implementation of fiscal policies for
overall economic management, deviations from the Budget Estimates
are indicative of the fact that due care has not been taken during their
estimation. Further, it also indicates that desired fiscal and
developmental objectives were not attained and optimised.
� FRBM Act 2005 provides that State Government shall utilise Revenue
Surplus for funding CE and also lay down norms for prioritisation of CE
and pursuing expenditure policies that would provide impetus for
economic growth, poverty reduction and improvement in human
welfare.
On being asked about it, Finance Department replied (August 2016) that
State was in surplus for the last 10 years and Revenue Surplus was being
utilised in financing CE as approved by the legislature as per plan.
The fact remains that despite financing CE through Revenue Surplus,
growth in CE was not as planned in Budget Estimates.
1.6.3 Trends in growth of Revenue Expenditure
� The Revenue Expenditure of the State increased from ` 52,694 crore in
2011-12 to ` 99,771 crore in 2015-16, showing an average annual
growth of 17.32 per cent over the period. Total increase of Revenue
Expenditure during 2015-16 was ` 17,398 crore (21.12 per cent) over
the previous year. During 2015-16, the Non-Plan Revenue Expenditure
(NPRE) of ` 68,319 crore constituted 68 per cent of total Revenue
Expenditure.
� The actual NPRE was marginally higher (by ` 213 crore) than the
projection made by the State Government in its MTFPS as shown in
Table 1.19.
2011-12 2012-13 2013-14 2014-15 2015-16
Budget Estimates 8722 10820 11114 14142 18140
Actuals 9055 11567 10813 11878 16835
0
2000
4000
6000
8000
10000
12000
14000
16000
18000
20000
(`in
cro
re)
Chart 1.11 Captal Expenditure: Budget Estimates vis-a-vis actuals
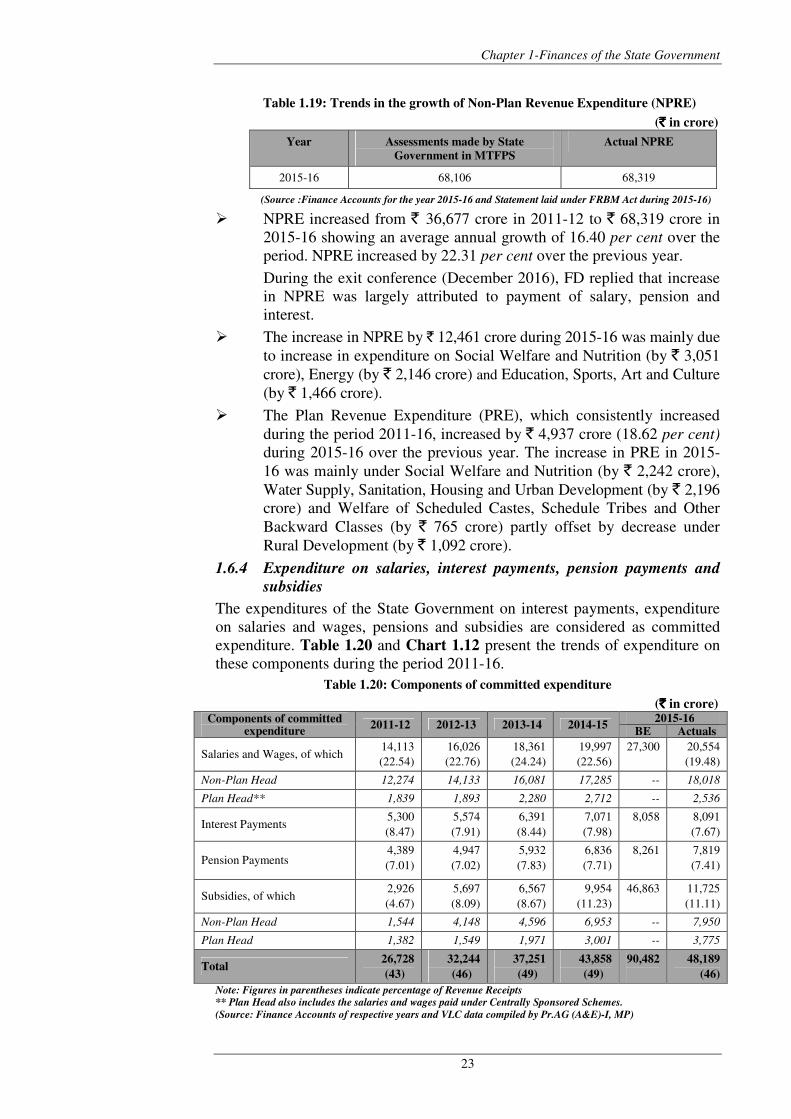
Chapter 1-Finances of the State Government
23
Table 1.19: Trends in the growth of Non-Plan Revenue Expenditure (NPRE)
(`̀̀̀ in crore)
Year Assessments made by State
Government in MTFPS
Actual NPRE
2015-16 68,106 68,319
(Source :Finance Accounts for the year 2015-16 and Statement laid under FRBM Act during 2015-16)
� NPRE increased from ` 36,677 crore in 2011-12 to ` 68,319 crore in
2015-16 showing an average annual growth of 16.40 per cent over the
period. NPRE increased by 22.31 per cent over the previous year.
During the exit conference (December 2016), FD replied that increase
in NPRE was largely attributed to payment of salary, pension and
interest.
� The increase in NPRE by ` 12,461 crore during 2015-16 was mainly due
to increase in expenditure on Social Welfare and Nutrition (by ` 3,051
crore), Energy (by ` 2,146 crore) and Education, Sports, Art and Culture
(by ` 1,466 crore).
� The Plan Revenue Expenditure (PRE), which consistently increased
during the period 2011-16, increased by ` 4,937 crore (18.62 per cent)
during 2015-16 over the previous year. The increase in PRE in 2015-
16 was mainly under Social Welfare and Nutrition (by ` 2,242 crore),
Water Supply, Sanitation, Housing and Urban Development (by ` 2,196
crore) and Welfare of Scheduled Castes, Schedule Tribes and Other
Backward Classes (by ` 765 crore) partly offset by decrease under
Rural Development (by ` 1,092 crore).
1.6.4 Expenditure on salaries, interest payments, pension payments and
subsidies
The expenditures of the State Government on interest payments, expenditure
on salaries and wages, pensions and subsidies are considered as committed
expenditure. Table 1.20 and Chart 1.12 present the trends of expenditure on
these components during the period 2011-16.
Table 1.20: Components of committed expenditure
(`̀̀̀ in crore) Components of committed
expenditure 2011-12 2012-13 2013-14 2014-15
2015-16 BE Actuals
Salaries and Wages, of which 14,113
(22.54)
16,026
(22.76)
18,361
(24.24)
19,997
(22.56)
27,300 20,554
(19.48)
Non-Plan Head 12,274 14,133 16,081 17,285 -- 18,018
Plan Head** 1,839 1,893 2,280 2,712 -- 2,536
Interest Payments 5,300
(8.47)
5,574
(7.91)
6,391
(8.44)
7,071
(7.98)
8,058 8,091
(7.67)
Pension Payments 4,389
(7.01)
4,947
(7.02)
5,932
(7.83)
6,836
(7.71)
8,261 7,819
(7.41)
Subsidies, of which 2,926
(4.67)
5,697
(8.09)
6,567
(8.67)
9,954
(11.23)
46,863 11,725
(11.11)
Non-Plan Head 1,544 4,148 4,596 6,953 -- 7,950
Plan Head 1,382 1,549 1,971 3,001 -- 3,775
Total 26,728
(43)
32,244
(46)
37,251
(49)
43,858
(49)
90,482
48,189
(46)
Note: Figures in parentheses indicate percentage of Revenue Receipts
** Plan Head also includes the salaries and wages paid under Centrally Sponsored Schemes.
(Source: Finance Accounts of respective years and VLC data compiled by Pr.AG (A&E)-I, MP)
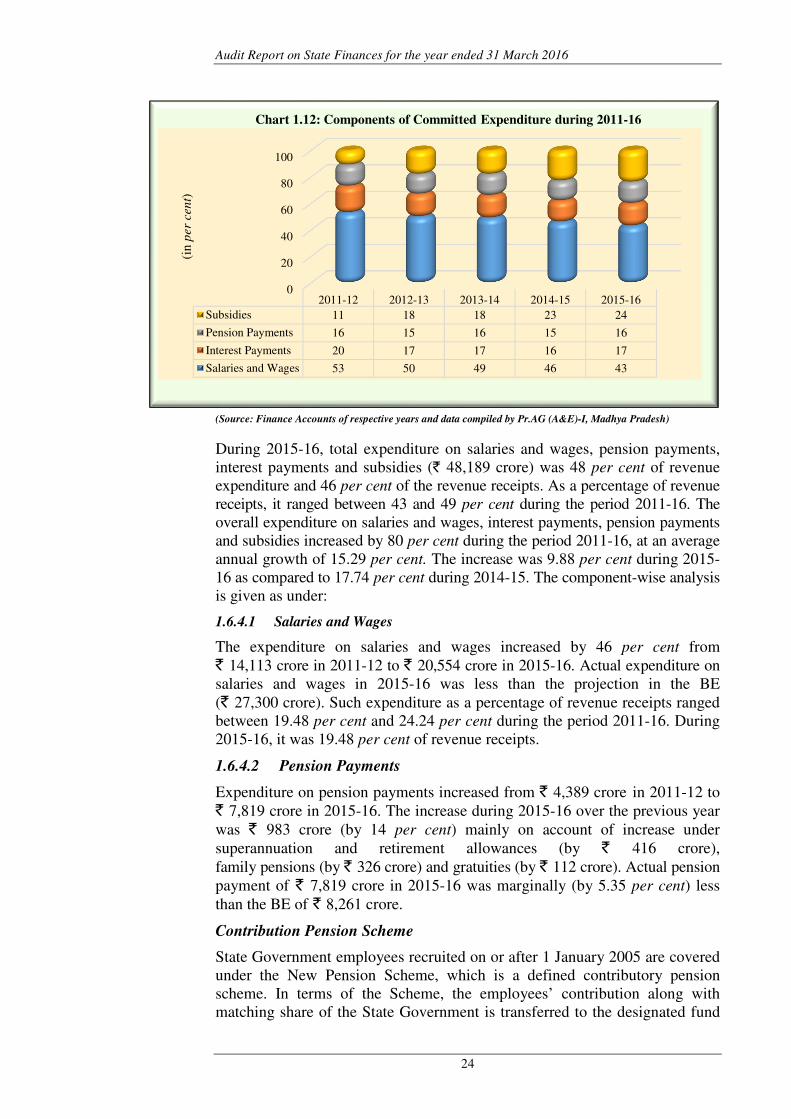
Audit Report on State Finances for the year ended 31 March 2016
24
(Source: Finance Accounts of respective years and data compiled by Pr.AG (A&E)-I, Madhya Pradesh)
During 2015-16, total expenditure on salaries and wages, pension payments,
interest payments and subsidies (` 48,189 crore) was 48 per cent of revenue
expenditure and 46 per cent of the revenue receipts. As a percentage of revenue
receipts, it ranged between 43 and 49 per cent during the period 2011-16. The
overall expenditure on salaries and wages, interest payments, pension payments
and subsidies increased by 80 per cent during the period 2011-16, at an average
annual growth of 15.29 per cent. The increase was 9.88 per cent during 2015-
16 as compared to 17.74 per cent during 2014-15. The component-wise analysis
is given as under:
1.6.4.1 Salaries and Wages
The expenditure on salaries and wages increased by 46 per cent from
` 14,113 crore in 2011-12 to ` 20,554 crore in 2015-16. Actual expenditure on
salaries and wages in 2015-16 was less than the projection in the BE
(` 27,300 crore). Such expenditure as a percentage of revenue receipts ranged
between 19.48 per cent and 24.24 per cent during the period 2011-16. During
2015-16, it was 19.48 per cent of revenue receipts.
1.6.4.2 Pension Payments
Expenditure on pension payments increased from ` 4,389 crore in 2011-12 to
` 7,819 crore in 2015-16. The increase during 2015-16 over the previous year
was ` 983 crore (by 14 per cent) mainly on account of increase under
superannuation and retirement allowances (by ` 416 crore),
family pensions (by ` 326 crore) and gratuities (by ` 112 crore). Actual pension
payment of ` 7,819 crore in 2015-16 was marginally (by 5.35 per cent) less
than the BE of ` 8,261 crore.
Contribution Pension Scheme
State Government employees recruited on or after 1 January 2005 are covered
under the New Pension Scheme, which is a defined contributory pension
scheme. In terms of the Scheme, the employees’ contribution along with
matching share of the State Government is transferred to the designated fund
0
20
40
60
80
100
2011-12 2012-13 2013-14 2014-15 2015-16
Subsidies 11 18 18 23 24
Pension Payments 16 15 16 15 16
Interest Payments 20 17 17 16 17
Salaries and Wages 53 50 49 46 43
(in p
er
cen
t)
Chart 1.12: Components of Committed Expenditure during 2011-16
Chapter 1-Finances of the State Government
25
manager through the National Securities Depository Limited (NSDL)/Trustee
Bank. However, actual amount of employees’ contribution and the matching
contribution of State Government has not been estimated. The State
Government follows the method of budgeting and booking employees’
contributions in the New Pension Scheme under the Receipt Major Head “0071-
Contributions and Recoveries towards Pension and Other Retirement Benefits”.
These contributions are subsequently transferred to the Fund by operating the
minor head “900-Deduct Refunds” under the same Major Head. Since the
Consolidated Fund is closed to Government at the end of the year, any shortfall
in the remittance of the contributions to the Fund in any year is not available in
the accounts of subsequent years.
During 2015-16, against employees’ contribution of ` 264.29 crore,
Government contributed ` 284.92 crore. Under the present accounting
methodology, it cannot be ascertained whether the Government contribution in
excess of employees’ contribution for 2015-16 was against the shortfalls of
earlier years. We observed that out of total contribution of ` 549.21 crore
credited under Major Head 0071, the State Government transferred only
` 530.39 crore to NSDL/Trustee Bank as of March 2016 resulting in short
transfer of ` 18.82 crore. Since this amount was not retained in a Fund, it got
lapsed to Government account at the end of the financial year.
During the exit conference (December 2016), FD replied that the matter would
be scrutinised and necessary action, if necessary, would be taken.
1.6.4.3 Interest Payments
Interest payments made during the years 2011-12 to 2015-16 are given in
Table 1.21. Table 1.21: Interest Payments
(`̀̀̀ in crore) 2011-12 2012-13 2013-14 2014-15 2015-16
Interest Payments 5,300 5,574 6,391 7,071 8,091 (Source: Finance Accounts of respective years)
Interest Payments of ` 8,091 crore during 2015-16 accounted for 7.67 per cent
of the revenue receipts and constituted 8.11 per cent of revenue expenditure.
Interest payments were mainly on market loans (` 3,891 crore), Special
Securities issued to National Small Saving Fund (NSSF) of the Central
Government (` 1,854 crore), State Provident Fund (` 1,072 crore) and other
internal debt (` 538 crore).
The increase of ` 1,020 crore (14.43 per cent ) in interest payment during
2015-16 over the previous year was the result of increase under interest on market
loans (by ` 735 crore), interest on Special Securities issued to NSSF of the
Central Government by State Government (by ` 99 crore) and State Provident
Fund (by ` 95 crore). Interest payments of ` 8,091 crore during the year were
slightly higher than the BE of ` 8,058 crore.
1.6.4.4 Subsidies
Subsidy payment of ` 11,725 crore (Non-plan: ` 7,950 crore and Plan:
` 3,775 crore) accounted for 11.11 per cent of the revenue receipts and
constituted 11.75 per cent of the revenue expenditure during 2015-16.
Audit Report on State Finances for the year ended 31 March 2016
26
During 2015-16, out of the total subsidies of ` 11,725 crore, ` 7,052 crore
(60 per cent) was under the Energy Department. Actual subsidies in 2015-16
was considerably less than the BE of ` 46,863 crore.
The increase in the amount of subsidy (by ` 1,771 crore) in 2015-16 over the
previous year was mainly due to increase in subsidy of Energy
(by ` 2,128 crore) which was partly offset by decrease in Food and Civil
Supplies (by ` 1,269 crore).
1.6.5 Financial assistance by State Government to Local Bodies and other
Institutions
The quantum of assistance provided by way of Grants and Loans to Local
Bodies and other institutions during the period 2014-15 to 2015-16 is presented
in Table 1.22.
Table 1.22: Financial assistance to Local Bodies and other Institutions
(`̀̀̀ in crore)
Financial Assistance to Institutions 2014-15 2015-16
Educational Institutions 4,457.99 5,465.29
Medical and Public Health 792.14 828.87
Housing 829.19 1,019.60
Urban Development 565.49 1,439.19
Welfare of SC/ST/OBC 500.28 520.64
Social Security and Welfare 687.16 1,054.36
Rural Development 5,941.93 5,368.29
Panchayati Raj 3,995.44 5,633.30
Water Supply and Sanitation 179.35 590.48
Other Institutions 718.82 735.50
Total 18,667.79 22,655.52
Assistance as a percentage of Revenue
Expenditure
22.66 22.71
(Source: VLC data of Pr.AG (A&E)-I, Madhya Pradesh)
� Financial assistance to Local Bodies and other Institutions increased by
` 3,987.73 crore from ` 18,667.79 crore in 2014-15 to ` 22,655.52 crore
in 2015-16. The increase was mainly on account of Financial Assistance
to Panchayati Raj (by ` 1,637.86 crore) and Educational Institutions
(by ` 1,007.30 crore).
� The assistance as a percentage of Revenue Expenditure marginally
increased from 22.66 per cent in 2014-15 to 22.71 per cent in
2015-16.
1.6.6 Devolution of funds and auditing arrangements of Local Bodies
After enactment of the 73rd and 74th Constitution (Amendment) Act, 1992, the
Urban Local Bodies (ULBs) and Panchayat Raj Institutions (PRIs) were made
full-fledged and vibrant institutions of Local Self Government by vesting them
with clearly defined functions and responsibilities. Accordingly, the State
Government organised ULBs and PRIs into three types6. At present, there are
379 ULBs7 and 23,189 PRIs8 in the State.
6 ULBs:Municipal Corporations(MC) for larger urban areas, Municipal Councils for smaller urban areas and
Nagar Parishads(NP) for a transitional areas. PRIs: Zila Panchayat (ZP) at district level, Janpad Panchayat
(JP) at block level and Gram Panchayat (GP) at village level. 7 ULBs:16 MC, 98 Muncipal Councils, 265 NP 8 PRIs:51 ZP, 313 JP, 22825 GP
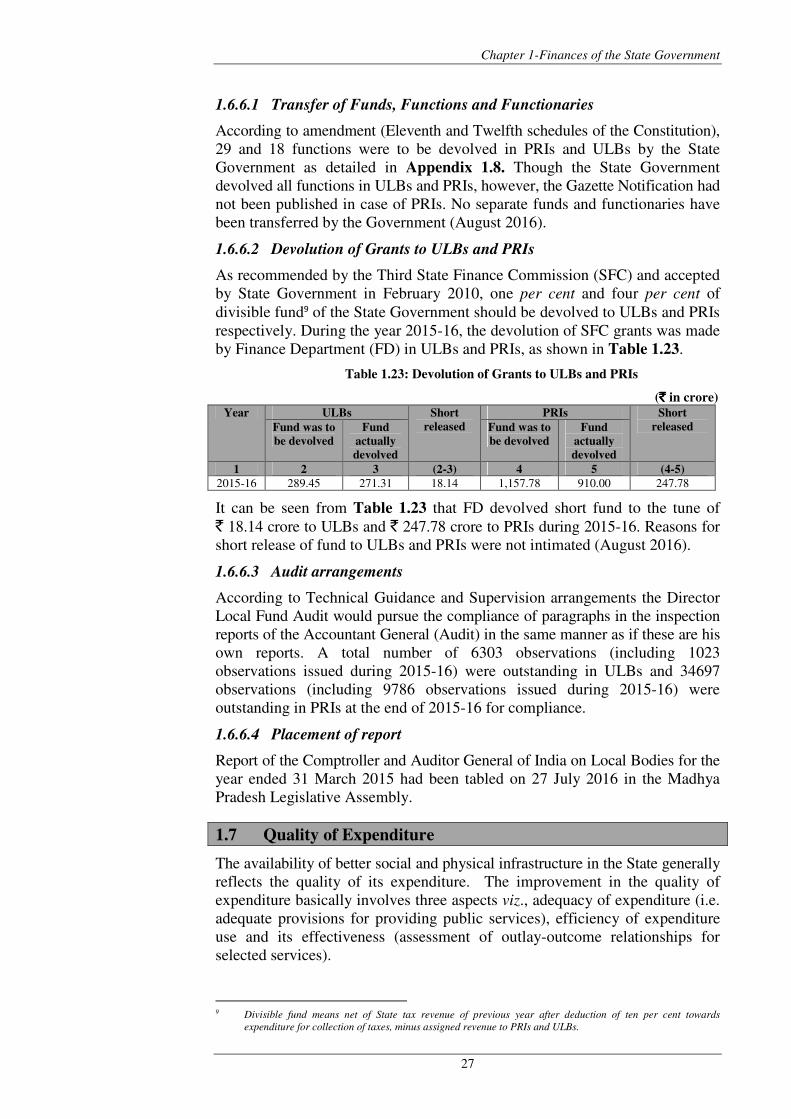
Chapter 1-Finances of the State Government
27
1.6.6.1 Transfer of Funds, Functions and Functionaries
According to amendment (Eleventh and Twelfth schedules of the Constitution),
29 and 18 functions were to be devolved in PRIs and ULBs by the State
Government as detailed in Appendix 1.8. Though the State Government
devolved all functions in ULBs and PRIs, however, the Gazette Notification had
not been published in case of PRIs. No separate funds and functionaries have
been transferred by the Government (August 2016).
1.6.6.2 Devolution of Grants to ULBs and PRIs
As recommended by the Third State Finance Commission (SFC) and accepted
by State Government in February 2010, one per cent and four per cent of
divisible fund9 of the State Government should be devolved to ULBs and PRIs
respectively. During the year 2015-16, the devolution of SFC grants was made
by Finance Department (FD) in ULBs and PRIs, as shown in Table 1.23.
Table 1.23: Devolution of Grants to ULBs and PRIs
(`̀̀̀ in crore)
Year ULBs Short
released
PRIs Short
released Fund was to
be devolved
Fund
actually
devolved
Fund was to
be devolved
Fund
actually
devolved
1 2 3 (2-3) 4 5 (4-5)
2015-16 289.45 271.31 18.14 1,157.78 910.00 247.78
It can be seen from Table 1.23 that FD devolved short fund to the tune of
` 18.14 crore to ULBs and ` 247.78 crore to PRIs during 2015-16. Reasons for
short release of fund to ULBs and PRIs were not intimated (August 2016).
1.6.6.3 Audit arrangements
According to Technical Guidance and Supervision arrangements the Director
Local Fund Audit would pursue the compliance of paragraphs in the inspection
reports of the Accountant General (Audit) in the same manner as if these are his
own reports. A total number of 6303 observations (including 1023
observations issued during 2015-16) were outstanding in ULBs and 34697
observations (including 9786 observations issued during 2015-16) were
outstanding in PRIs at the end of 2015-16 for compliance.
1.6.6.4 Placement of report
Report of the Comptroller and Auditor General of India on Local Bodies for the
year ended 31 March 2015 had been tabled on 27 July 2016 in the Madhya
Pradesh Legislative Assembly.
1.7 Quality of Expenditure
The availability of better social and physical infrastructure in the State generally
reflects the quality of its expenditure. The improvement in the quality of
expenditure basically involves three aspects viz., adequacy of expenditure (i.e.
adequate provisions for providing public services), efficiency of expenditure
use and its effectiveness (assessment of outlay-outcome relationships for
selected services).
9 Divisible fund means net of State tax revenue of previous year after deduction of ten per cent towards
expenditure for collection of taxes, minus assigned revenue to PRIs and ULBs.
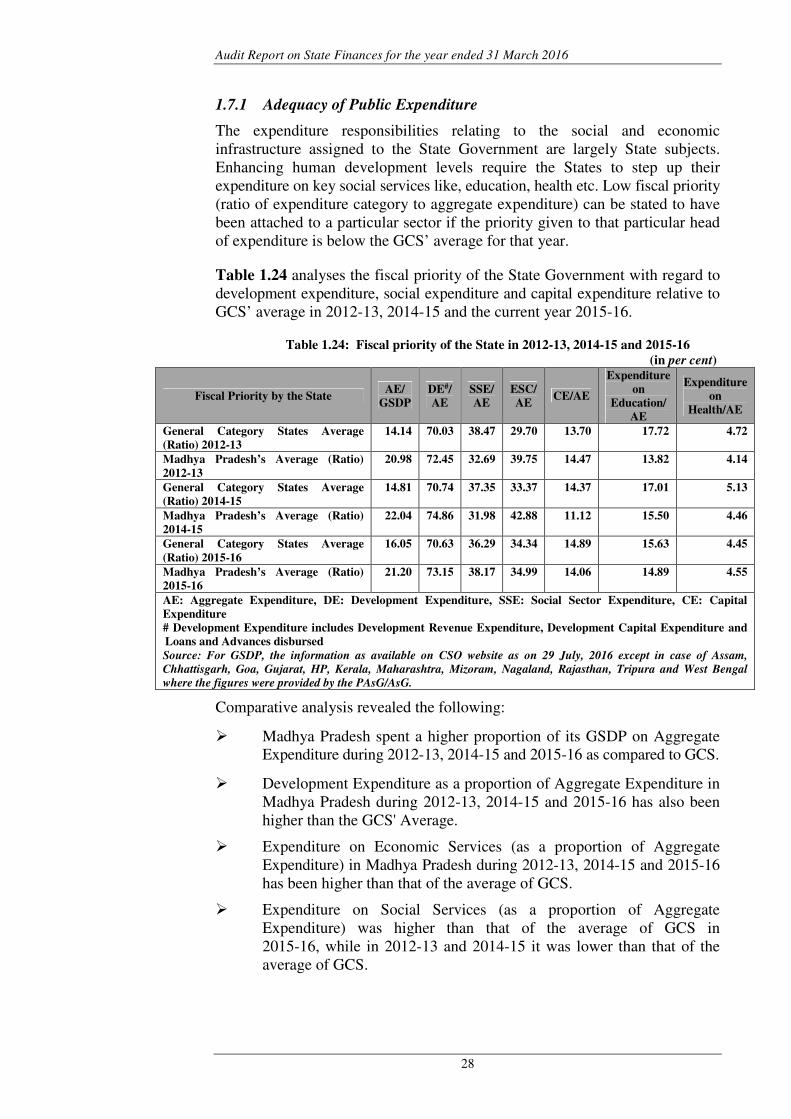
Audit Report on State Finances for the year ended 31 March 2016
28
1.7.1 Adequacy of Public Expenditure
The expenditure responsibilities relating to the social and economic
infrastructure assigned to the State Government are largely State subjects.
Enhancing human development levels require the States to step up their
expenditure on key social services like, education, health etc. Low fiscal priority
(ratio of expenditure category to aggregate expenditure) can be stated to have
been attached to a particular sector if the priority given to that particular head
of expenditure is below the GCS’ average for that year.
Table 1.24 analyses the fiscal priority of the State Government with regard to
development expenditure, social expenditure and capital expenditure relative to
GCS’ average in 2012-13, 2014-15 and the current year 2015-16.
Table 1.24: Fiscal priority of the State in 2012-13, 2014-15 and 2015-16
(in per cent)
Fiscal Priority by the State AE/
GSDP
DE#/
AE
SSE/
AE
ESC/
AE CE/AE
Expenditure
on
Education/
AE
Expenditure
on
Health/AE
General Category States Average
(Ratio) 2012-13
14.14 70.03 38.47 29.70 13.70 17.72 4.72
Madhya Pradesh’s Average (Ratio)
2012-13
20.98
72.45 32.69 39.75 14.47 13.82 4.14
General Category States Average
(Ratio) 2014-15
14.81 70.74 37.35 33.37 14.37 17.01 5.13
Madhya Pradesh’s Average (Ratio)
2014-15
22.04 74.86 31.98 42.88 11.12 15.50 4.46
General Category States Average
(Ratio) 2015-16
16.05 70.63 36.29 34.34 14.89 15.63 4.45
Madhya Pradesh’s Average (Ratio)
2015-16
21.20 73.15 38.17 34.99 14.06 14.89 4.55
AE: Aggregate Expenditure, DE: Development Expenditure, SSE: Social Sector Expenditure, CE: Capital
Expenditure
# Development Expenditure includes Development Revenue Expenditure, Development Capital Expenditure and
Loans and Advances disbursed
Source: For GSDP, the information as available on CSO website as on 29 July, 2016 except in case of Assam,
Chhattisgarh, Goa, Gujarat, HP, Kerala, Maharashtra, Mizoram, Nagaland, Rajasthan, Tripura and West Bengal
where the figures were provided by the PAsG/AsG.
Comparative analysis revealed the following:
� Madhya Pradesh spent a higher proportion of its GSDP on Aggregate
Expenditure during 2012-13, 2014-15 and 2015-16 as compared to GCS.
� Development Expenditure as a proportion of Aggregate Expenditure in
Madhya Pradesh during 2012-13, 2014-15 and 2015-16 has also been
higher than the GCS' Average.
� Expenditure on Economic Services (as a proportion of Aggregate
Expenditure) in Madhya Pradesh during 2012-13, 2014-15 and 2015-16
has been higher than that of the average of GCS.
� Expenditure on Social Services (as a proportion of Aggregate
Expenditure) was higher than that of the average of GCS in
2015-16, while in 2012-13 and 2014-15 it was lower than that of the
average of GCS.
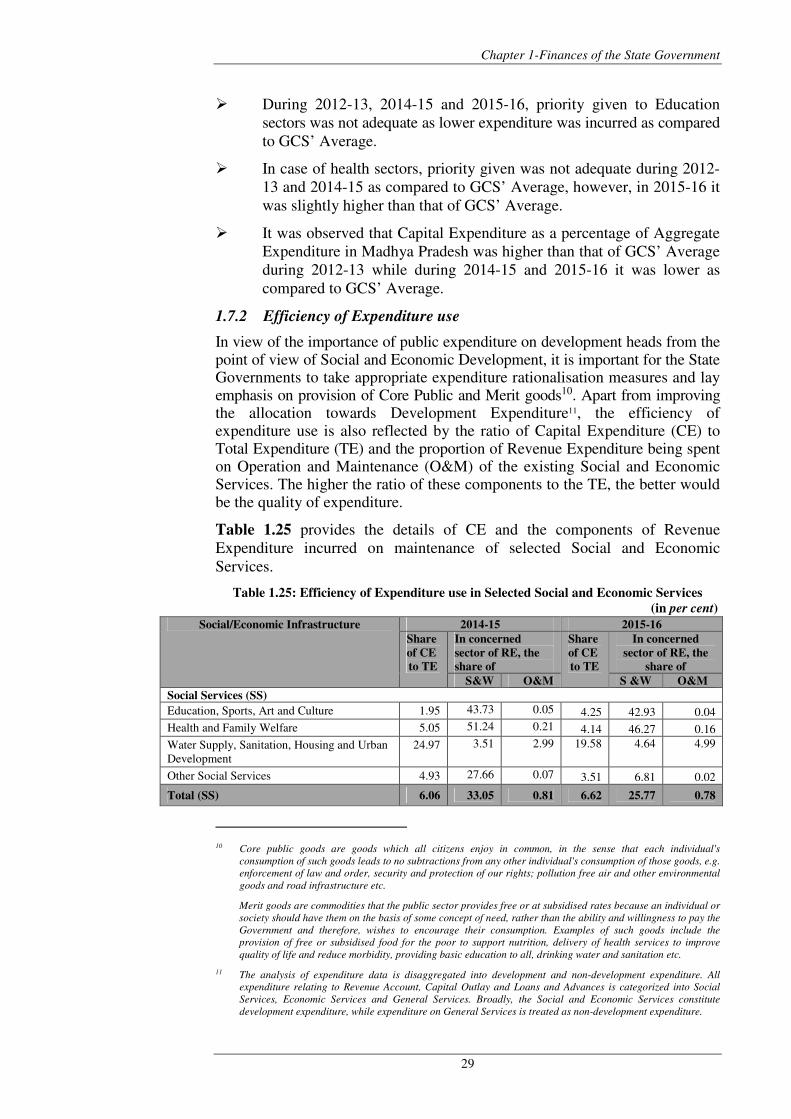
Chapter 1-Finances of the State Government
29
� During 2012-13, 2014-15 and 2015-16, priority given to Education
sectors was not adequate as lower expenditure was incurred as compared
to GCS’ Average.
� In case of health sectors, priority given was not adequate during 2012-
13 and 2014-15 as compared to GCS’ Average, however, in 2015-16 it
was slightly higher than that of GCS’ Average.
� It was observed that Capital Expenditure as a percentage of Aggregate
Expenditure in Madhya Pradesh was higher than that of GCS’ Average
during 2012-13 while during 2014-15 and 2015-16 it was lower as
compared to GCS’ Average.
1.7.2 Efficiency of Expenditure use
In view of the importance of public expenditure on development heads from the point of view of Social and Economic Development, it is important for the State Governments to take appropriate expenditure rationalisation measures and lay emphasis on provision of Core Public and Merit goods10. Apart from improving the allocation towards Development Expenditure11, the efficiency of expenditure use is also reflected by the ratio of Capital Expenditure (CE) to Total Expenditure (TE) and the proportion of Revenue Expenditure being spent on Operation and Maintenance (O&M) of the existing Social and Economic Services. The higher the ratio of these components to the TE, the better would be the quality of expenditure.
Table 1.25 provides the details of CE and the components of Revenue
Expenditure incurred on maintenance of selected Social and Economic
Services.
Table 1.25: Efficiency of Expenditure use in Selected Social and Economic Services
(in per cent)
Social/Economic Infrastructure 2014-15 2015-16
Share
of CE
to TE
In concerned
sector of RE, the
share of
Share
of CE
to TE
In concerned
sector of RE, the
share of
S&W O&M S &W O&M
Social Services (SS)
Education, Sports, Art and Culture 1.95 43.73 0.05 4.25 42.93 0.04
Health and Family Welfare 5.05 51.24 0.21 4.14 46.27 0.16
Water Supply, Sanitation, Housing and Urban
Development
24.97 3.51 2.99 19.58 4.64 4.99
Other Social Services 4.93 27.66 0.07 3.51 6.81 0.02
Total (SS) 6.06 33.05 0.81 6.62 25.77 0.78
10 Core public goods are goods which all citizens enjoy in common, in the sense that each individual's
consumption of such goods leads to no subtractions from any other individual's consumption of those goods, e.g.
enforcement of law and order, security and protection of our rights; pollution free air and other environmental
goods and road infrastructure etc.
Merit goods are commodities that the public sector provides free or at subsidised rates because an individual or
society should have them on the basis of some concept of need, rather than the ability and willingness to pay the
Government and therefore, wishes to encourage their consumption. Examples of such goods include the
provision of free or subsidised food for the poor to support nutrition, delivery of health services to improve
quality of life and reduce morbidity, providing basic education to all, drinking water and sanitation etc.
11 The analysis of expenditure data is disaggregated into development and non-development expenditure. All
expenditure relating to Revenue Account, Capital Outlay and Loans and Advances is categorized into Social
Services, Economic Services and General Services. Broadly, the Social and Economic Services constitute
development expenditure, while expenditure on General Services is treated as non-development expenditure.
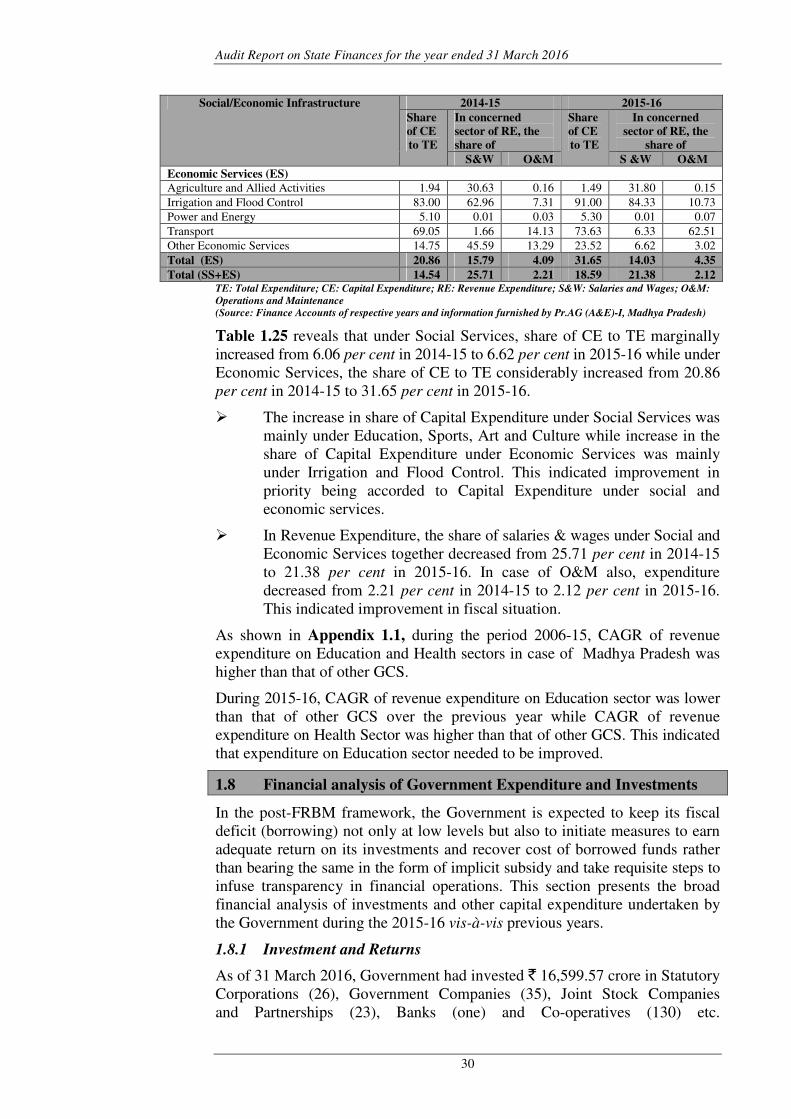
Audit Report on State Finances for the year ended 31 March 2016
30
Social/Economic Infrastructure 2014-15 2015-16
Share
of CE
to TE
In concerned
sector of RE, the
share of
Share
of CE
to TE
In concerned
sector of RE, the
share of
S&W O&M S &W O&M
Economic Services (ES)
Agriculture and Allied Activities 1.94 30.63 0.16 1.49 31.80 0.15
Irrigation and Flood Control 83.00 62.96 7.31 91.00 84.33 10.73
Power and Energy 5.10 0.01 0.03 5.30 0.01 0.07
Transport 69.05 1.66 14.13 73.63 6.33 62.51
Other Economic Services 14.75 45.59 13.29 23.52 6.62 3.02
Total (ES) 20.86 15.79 4.09 31.65 14.03 4.35
Total (SS+ES) 14.54 25.71 2.21 18.59 21.38 2.12 TE: Total Expenditure; CE: Capital Expenditure; RE: Revenue Expenditure; S&W: Salaries and Wages; O&M:
Operations and Maintenance
(Source: Finance Accounts of respective years and information furnished by Pr.AG (A&E)-I, Madhya Pradesh)
Table 1.25 reveals that under Social Services, share of CE to TE marginally
increased from 6.06 per cent in 2014-15 to 6.62 per cent in 2015-16 while under
Economic Services, the share of CE to TE considerably increased from 20.86
per cent in 2014-15 to 31.65 per cent in 2015-16.
� The increase in share of Capital Expenditure under Social Services was
mainly under Education, Sports, Art and Culture while increase in the
share of Capital Expenditure under Economic Services was mainly
under Irrigation and Flood Control. This indicated improvement in
priority being accorded to Capital Expenditure under social and
economic services.
� In Revenue Expenditure, the share of salaries & wages under Social and
Economic Services together decreased from 25.71 per cent in 2014-15
to 21.38 per cent in 2015-16. In case of O&M also, expenditure
decreased from 2.21 per cent in 2014-15 to 2.12 per cent in 2015-16.
This indicated improvement in fiscal situation.
As shown in Appendix 1.1, during the period 2006-15, CAGR of revenue
expenditure on Education and Health sectors in case of Madhya Pradesh was
higher than that of other GCS.
During 2015-16, CAGR of revenue expenditure on Education sector was lower
than that of other GCS over the previous year while CAGR of revenue
expenditure on Health Sector was higher than that of other GCS. This indicated
that expenditure on Education sector needed to be improved.
1.8 Financial analysis of Government Expenditure and Investments
In the post-FRBM framework, the Government is expected to keep its fiscal
deficit (borrowing) not only at low levels but also to initiate measures to earn
adequate return on its investments and recover cost of borrowed funds rather
than bearing the same in the form of implicit subsidy and take requisite steps to
infuse transparency in financial operations. This section presents the broad
financial analysis of investments and other capital expenditure undertaken by
the Government during the 2015-16 vis-à-vis previous years.
1.8.1 Investment and Returns
As of 31 March 2016, Government had invested ` 16,599.57 crore in Statutory
Corporations (26), Government Companies (35), Joint Stock Companies
and Partnerships (23), Banks (one) and Co-operatives (130) etc.
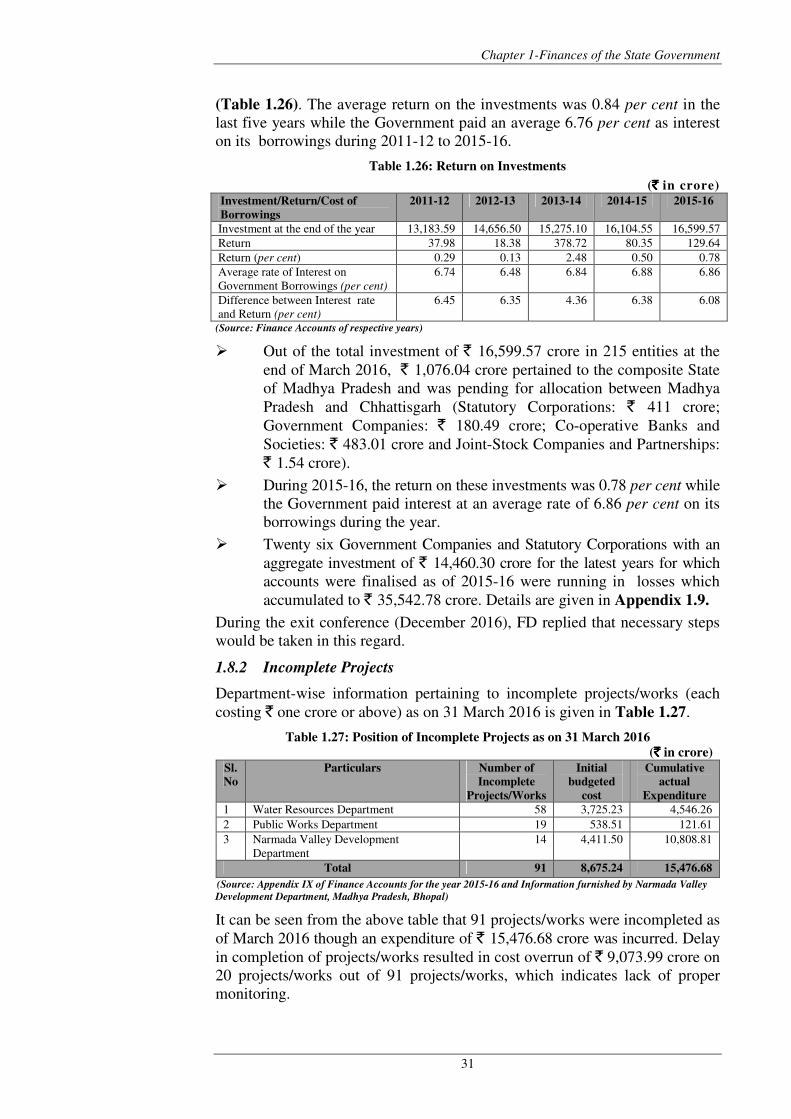
Chapter 1-Finances of the State Government
31
(Table 1.26). The average return on the investments was 0.84 per cent in the
last five years while the Government paid an average 6.76 per cent as interest
on its borrowings during 2011-12 to 2015-16.
Table 1.26: Return on Investments
(` ` ` ` in crore)
Investment/Return/Cost of
Borrowings
2011-12 2012-13 2013-14 2014-15 2015-16
Investment at the end of the year 13,183.59 14,656.50 15,275.10 16,104.55 16,599.57
Return 37.98 18.38 378.72 80.35 129.64
Return (per cent) 0.29 0.13 2.48 0.50 0.78
Average rate of Interest on
Government Borrowings (per cent)
6.74 6.48 6.84 6.88 6.86
Difference between Interest rate
and Return (per cent)
6.45 6.35 4.36 6.38 6.08
(Source: Finance Accounts of respective years)
� Out of the total investment of ` 16,599.57 crore in 215 entities at the
end of March 2016, ` 1,076.04 crore pertained to the composite State
of Madhya Pradesh and was pending for allocation between Madhya
Pradesh and Chhattisgarh (Statutory Corporations: ` 411 crore;
Government Companies: ` 180.49 crore; Co-operative Banks and
Societies: ` 483.01 crore and Joint-Stock Companies and Partnerships:
` 1.54 crore).
� During 2015-16, the return on these investments was 0.78 per cent while
the Government paid interest at an average rate of 6.86 per cent on its
borrowings during the year.
� Twenty six Government Companies and Statutory Corporations with an
aggregate investment of ` 14,460.30 crore for the latest years for which
accounts were finalised as of 2015-16 were running in losses which
accumulated to ` 35,542.78 crore. Details are given in Appendix 1.9.
During the exit conference (December 2016), FD replied that necessary steps
would be taken in this regard.
1.8.2 Incomplete Projects
Department-wise information pertaining to incomplete projects/works (each
costing ` one crore or above) as on 31 March 2016 is given in Table 1.27.
Table 1.27: Position of Incomplete Projects as on 31 March 2016
(`̀̀̀ in crore)
Sl.
No
Particulars Number of
Incomplete
Projects/Works
Initial
budgeted
cost
Cumulative
actual
Expenditure
1 Water Resources Department 58 3,725.23 4,546.26
2 Public Works Department 19 538.51 121.61
3 Narmada Valley Development
Department
14 4,411.50 10,808.81
Total 91 8,675.24 15,476.68
(Source: Appendix IX of Finance Accounts for the year 2015-16 and Information furnished by Narmada Valley
Development Department, Madhya Pradesh, Bhopal)
It can be seen from the above table that 91 projects/works were incompleted as
of March 2016 though an expenditure of ` 15,476.68 crore was incurred. Delay
in completion of projects/works resulted in cost overrun of ` 9,073.99 crore on
20 projects/works out of 91 projects/works, which indicates lack of proper
monitoring.
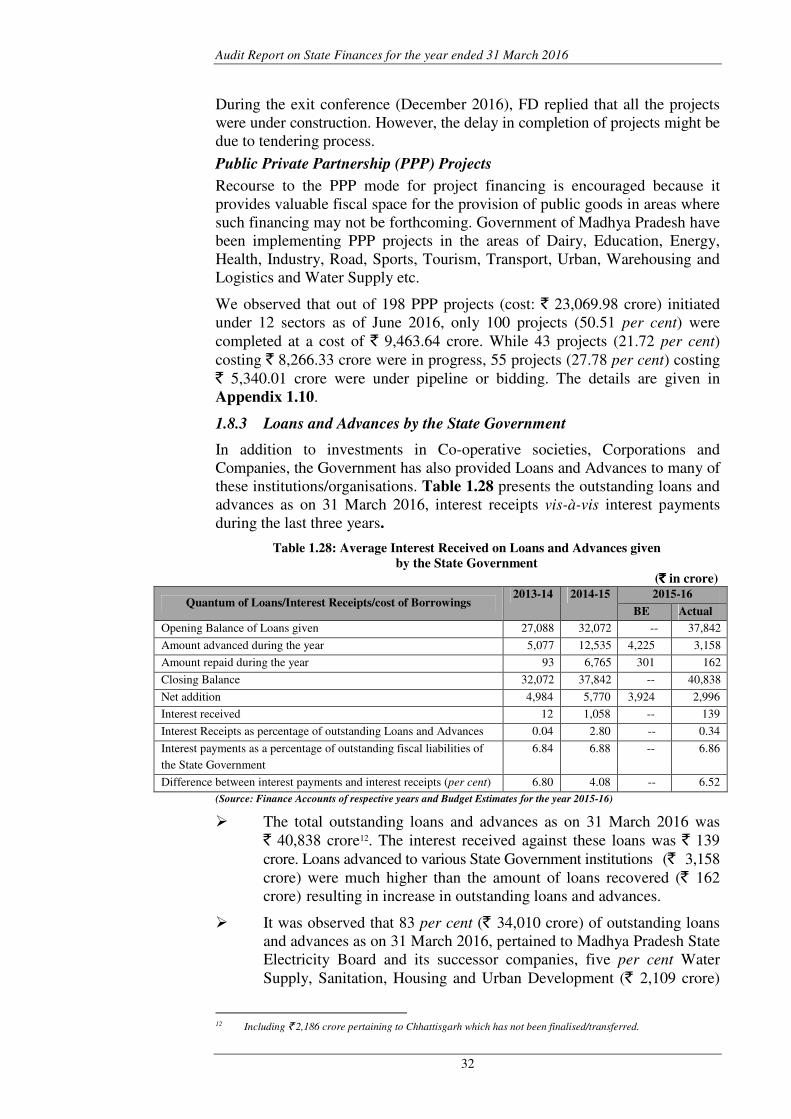
Audit Report on State Finances for the year ended 31 March 2016
32
During the exit conference (December 2016), FD replied that all the projects
were under construction. However, the delay in completion of projects might be
due to tendering process.
Public Private Partnership (PPP) Projects
Recourse to the PPP mode for project financing is encouraged because it
provides valuable fiscal space for the provision of public goods in areas where
such financing may not be forthcoming. Government of Madhya Pradesh have
been implementing PPP projects in the areas of Dairy, Education, Energy,
Health, Industry, Road, Sports, Tourism, Transport, Urban, Warehousing and
Logistics and Water Supply etc.
We observed that out of 198 PPP projects (cost: ` 23,069.98 crore) initiated
under 12 sectors as of June 2016, only 100 projects (50.51 per cent) were
completed at a cost of ` 9,463.64 crore. While 43 projects (21.72 per cent)
costing ` 8,266.33 crore were in progress, 55 projects (27.78 per cent) costing
` 5,340.01 crore were under pipeline or bidding. The details are given in
Appendix 1.10.
1.8.3 Loans and Advances by the State Government
In addition to investments in Co-operative societies, Corporations and
Companies, the Government has also provided Loans and Advances to many of
these institutions/organisations. Table 1.28 presents the outstanding loans and
advances as on 31 March 2016, interest receipts vis-à-vis interest payments
during the last three years.
Table 1.28: Average Interest Received on Loans and Advances given
by the State Government
(`̀̀̀ in crore)
Quantum of Loans/Interest Receipts/cost of Borrowings 2013-14 2014-15 2015-16
BE Actual
Opening Balance of Loans given 27,088 32,072 -- 37,842
Amount advanced during the year 5,077 12,535 4,225 3,158
Amount repaid during the year 93 6,765 301 162
Closing Balance 32,072 37,842 -- 40,838
Net addition 4,984 5,770 3,924 2,996
Interest received 12 1,058 -- 139
Interest Receipts as percentage of outstanding Loans and Advances 0.04 2.80 -- 0.34
Interest payments as a percentage of outstanding fiscal liabilities of
the State Government
6.84 6.88 -- 6.86
Difference between interest payments and interest receipts (per cent) 6.80 4.08 -- 6.52
(Source: Finance Accounts of respective years and Budget Estimates for the year 2015-16)
� The total outstanding loans and advances as on 31 March 2016 was
` 40,838 crore12. The interest received against these loans was ` 139
crore. Loans advanced to various State Government institutions (` 3,158
crore) were much higher than the amount of loans recovered (` 162
crore) resulting in increase in outstanding loans and advances.
� It was observed that 83 per cent (` 34,010 crore) of outstanding loans
and advances as on 31 March 2016, pertained to Madhya Pradesh State
Electricity Board and its successor companies, five per cent Water
Supply, Sanitation, Housing and Urban Development (` 2,109 crore)
12 Including ` 2,186 crore pertaining to Chhattisgarh which has not been finalised/transferred.
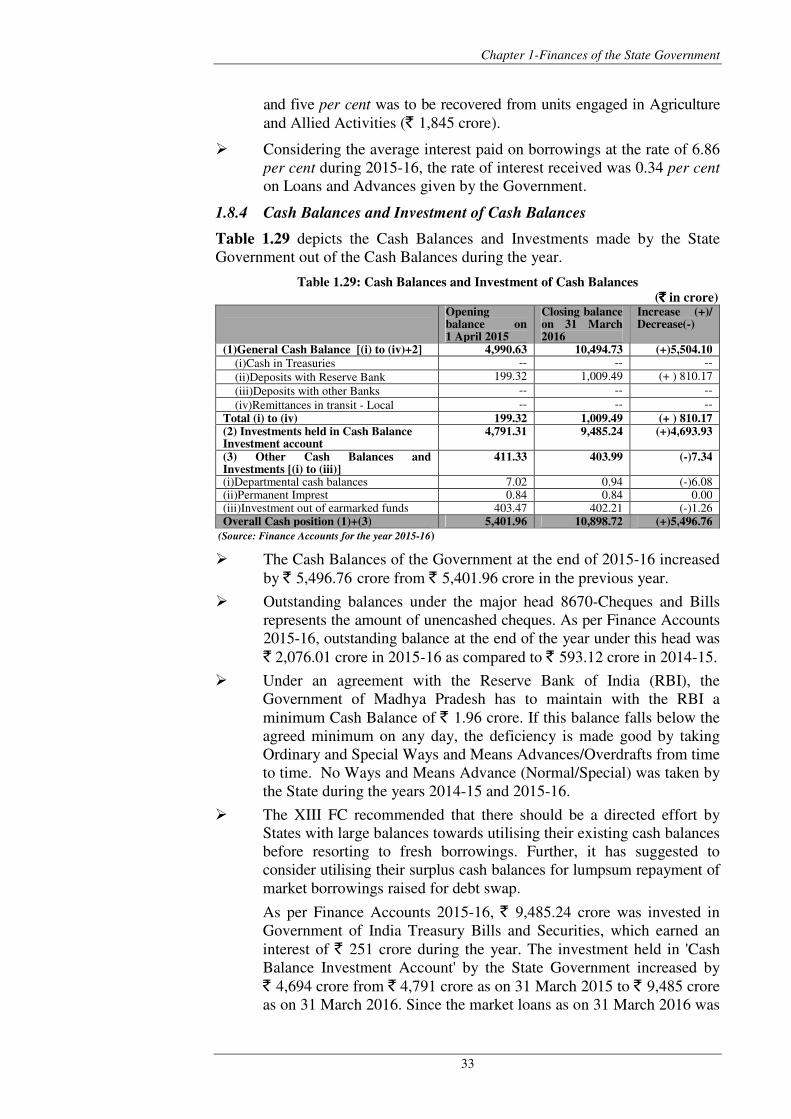
Chapter 1-Finances of the State Government
33
and five per cent was to be recovered from units engaged in Agriculture
and Allied Activities (` 1,845 crore).
� Considering the average interest paid on borrowings at the rate of 6.86
per cent during 2015-16, the rate of interest received was 0.34 per cent
on Loans and Advances given by the Government.
1.8.4 Cash Balances and Investment of Cash Balances
Table 1.29 depicts the Cash Balances and Investments made by the State
Government out of the Cash Balances during the year.
Table 1.29: Cash Balances and Investment of Cash Balances
(`̀̀̀ in crore) Opening
balance on 1 April 2015
Closing balance on 31 March 2016
Increase (+)/ Decrease(-)
(1)General Cash Balance [(i) to (iv)+2] 4,990.63 10,494.73 (+)5,504.10
(i)Cash in Treasuries -- -- --
(ii)Deposits with Reserve Bank 199.32 1,009.49 (+ ) 810.17
(iii)Deposits with other Banks -- -- --
(iv)Remittances in transit - Local -- -- --
Total (i) to (iv) 199.32 1,009.49 (+ ) 810.17 (2) Investments held in Cash Balance Investment account
4,791.31 9,485.24 (+)4,693.93
(3) Other Cash Balances and Investments [(i) to (iii)]
411.33 403.99 (-)7.34
(i)Departmental cash balances 7.02 0.94 (-)6.08 (ii)Permanent Imprest 0.84 0.84 0.00 (iii)Investment out of earmarked funds 403.47 402.21 (-)1.26 Overall Cash position (1)+(3) 5,401.96 10,898.72 (+)5,496.76
(Source: Finance Accounts for the year 2015-16)
� The Cash Balances of the Government at the end of 2015-16 increased
by ` 5,496.76 crore from ` 5,401.96 crore in the previous year.
� Outstanding balances under the major head 8670-Cheques and Bills
represents the amount of unencashed cheques. As per Finance Accounts
2015-16, outstanding balance at the end of the year under this head was
` 2,076.01 crore in 2015-16 as compared to ` 593.12 crore in 2014-15.
� Under an agreement with the Reserve Bank of India (RBI), the
Government of Madhya Pradesh has to maintain with the RBI a
minimum Cash Balance of ` 1.96 crore. If this balance falls below the
agreed minimum on any day, the deficiency is made good by taking
Ordinary and Special Ways and Means Advances/Overdrafts from time
to time. No Ways and Means Advance (Normal/Special) was taken by
the State during the years 2014-15 and 2015-16.
� The XIII FC recommended that there should be a directed effort by
States with large balances towards utilising their existing cash balances
before resorting to fresh borrowings. Further, it has suggested to
consider utilising their surplus cash balances for lumpsum repayment of
market borrowings raised for debt swap.
As per Finance Accounts 2015-16, ` 9,485.24 crore was invested in
Government of India Treasury Bills and Securities, which earned an
interest of ` 251 crore during the year. The investment held in 'Cash
Balance Investment Account' by the State Government increased by
` 4,694 crore from ` 4,791 crore as on 31 March 2015 to ` 9,485 crore
as on 31 March 2016. Since the market loans as on 31 March 2016 was
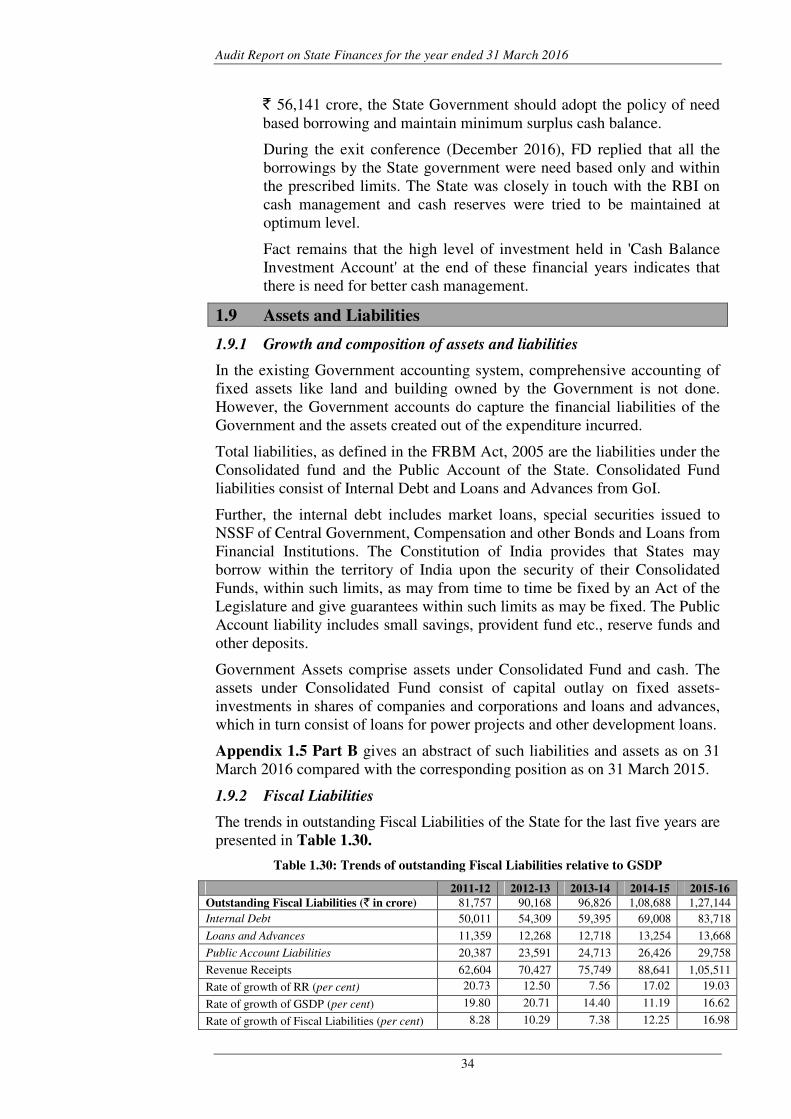
Audit Report on State Finances for the year ended 31 March 2016
34
` 56,141 crore, the State Government should adopt the policy of need
based borrowing and maintain minimum surplus cash balance.
During the exit conference (December 2016), FD replied that all the
borrowings by the State government were need based only and within
the prescribed limits. The State was closely in touch with the RBI on
cash management and cash reserves were tried to be maintained at
optimum level.
Fact remains that the high level of investment held in 'Cash Balance
Investment Account' at the end of these financial years indicates that
there is need for better cash management.
1.9 Assets and Liabilities
1.9.1 Growth and composition of assets and liabilities
In the existing Government accounting system, comprehensive accounting of
fixed assets like land and building owned by the Government is not done.
However, the Government accounts do capture the financial liabilities of the
Government and the assets created out of the expenditure incurred.
Total liabilities, as defined in the FRBM Act, 2005 are the liabilities under the
Consolidated fund and the Public Account of the State. Consolidated Fund
liabilities consist of Internal Debt and Loans and Advances from GoI.
Further, the internal debt includes market loans, special securities issued to
NSSF of Central Government, Compensation and other Bonds and Loans from
Financial Institutions. The Constitution of India provides that States may
borrow within the territory of India upon the security of their Consolidated
Funds, within such limits, as may from time to time be fixed by an Act of the
Legislature and give guarantees within such limits as may be fixed. The Public
Account liability includes small savings, provident fund etc., reserve funds and
other deposits.
Government Assets comprise assets under Consolidated Fund and cash. The
assets under Consolidated Fund consist of capital outlay on fixed assets-
investments in shares of companies and corporations and loans and advances,
which in turn consist of loans for power projects and other development loans.
Appendix 1.5 Part B gives an abstract of such liabilities and assets as on 31
March 2016 compared with the corresponding position as on 31 March 2015.
1.9.2 Fiscal Liabilities
The trends in outstanding Fiscal Liabilities of the State for the last five years are
presented in Table 1.30.
Table 1.30: Trends of outstanding Fiscal Liabilities relative to GSDP
2011-12 2012-13 2013-14 2014-15 2015-16
Outstanding Fiscal Liabilities (` in crore) 81,757 90,168 96,826 1,08,688 1,27,144
Internal Debt 50,011 54,309 59,395 69,008 83,718
Loans and Advances 11,359 12,268 12,718 13,254 13,668
Public Account Liabilities 20,387 23,591 24,713 26,426 29,758
Revenue Receipts 62,604 70,427 75,749 88,641 1,05,511
Rate of growth of RR (per cent) 20.73 12.50 7.56 17.02 19.03
Rate of growth of GSDP (per cent) 19.80 20.71 14.40 11.19 16.62
Rate of growth of Fiscal Liabilities (per cent) 8.28 10.29 7.38 12.25 16.98
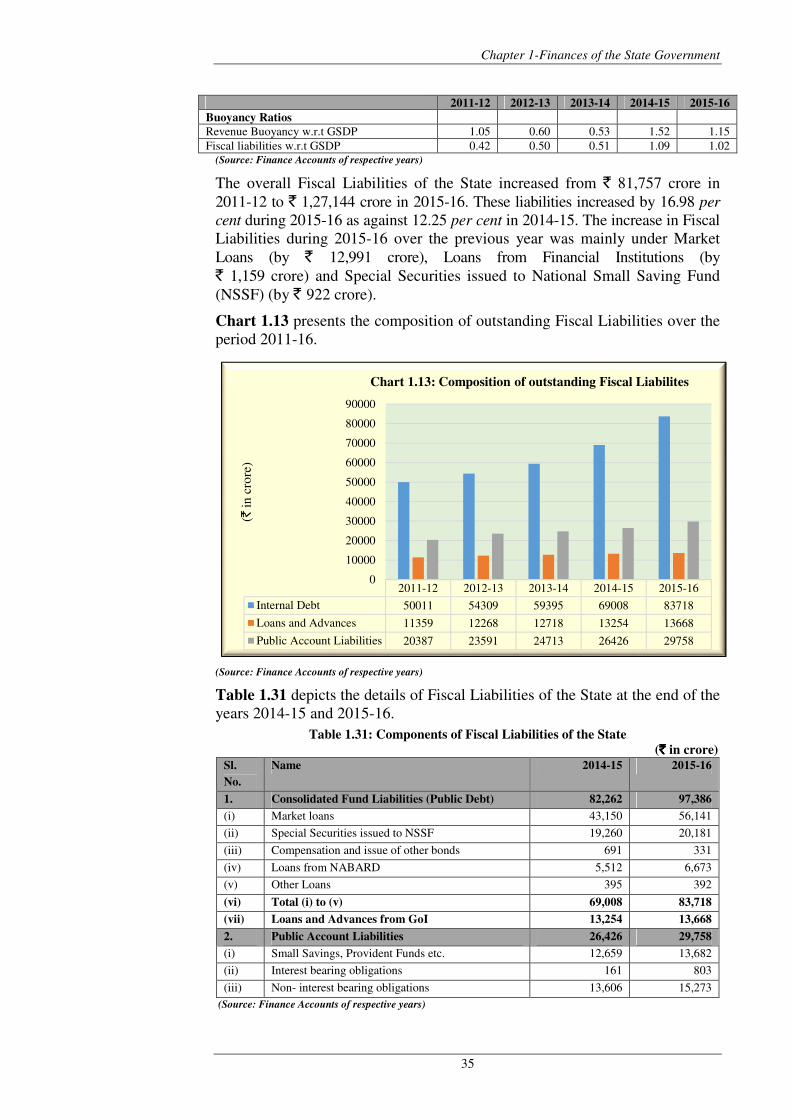
Chapter 1-Finances of the State Government
35
2011-12 2012-13 2013-14 2014-15 2015-16
Buoyancy Ratios
Revenue Buoyancy w.r.t GSDP 1.05 0.60 0.53 1.52 1.15
Fiscal liabilities w.r.t GSDP 0.42 0.50 0.51 1.09 1.02
(Source: Finance Accounts of respective years)
The overall Fiscal Liabilities of the State increased from ` 81,757 crore in
2011-12 to ` 1,27,144 crore in 2015-16. These liabilities increased by 16.98 per
cent during 2015-16 as against 12.25 per cent in 2014-15. The increase in Fiscal
Liabilities during 2015-16 over the previous year was mainly under Market
Loans (by ` 12,991 crore), Loans from Financial Institutions (by
` 1,159 crore) and Special Securities issued to National Small Saving Fund
(NSSF) (by ` 922 crore).
Chart 1.13 presents the composition of outstanding Fiscal Liabilities over the
period 2011-16.
(Source: Finance Accounts of respective years)
Table 1.31 depicts the details of Fiscal Liabilities of the State at the end of the
years 2014-15 and 2015-16.
Table 1.31: Components of Fiscal Liabilities of the State
(`̀̀̀ in crore)
Sl.
No.
Name 2014-15 2015-16
1. Consolidated Fund Liabilities (Public Debt) 82,262 97,386
(i) Market loans 43,150 56,141
(ii) Special Securities issued to NSSF 19,260 20,181
(iii) Compensation and issue of other bonds 691 331
(iv) Loans from NABARD 5,512 6,673
(v) Other Loans 395 392
(vi) Total (i) to (v) 69,008 83,718
(vii) Loans and Advances from GoI 13,254 13,668
2. Public Account Liabilities 26,426 29,758
(i) Small Savings, Provident Funds etc. 12,659 13,682
(ii) Interest bearing obligations 161 803
(iii) Non- interest bearing obligations 13,606 15,273
(Source: Finance Accounts of respective years)
2011-12 2012-13 2013-14 2014-15 2015-16
Internal Debt 50011 54309 59395 69008 83718
Loans and Advances 11359 12268 12718 13254 13668
Public Account Liabilities 20387 23591 24713 26426 29758
0
10000
20000
30000
40000
50000
60000
70000
80000
90000
(`in
cro
re)
Chart 1.13: Composition of outstanding Fiscal Liabilites
Audit Report on State Finances for the year ended 31 March 2016
36
Fiscal Liabilities at the end of 2015-16 were 22.50 per cent of GSDP against
the limit of 24.87 per cent prescribed by XIV Finance Commission. These were
1.21 times of the Revenue Receipts and 2.61 times of the State’s Own
Resources. The buoyancy of these liabilities with respect to GSDP increased
from 0.42 in 2011-12 to 1.02 in 2015-16 mainly due to increase in the growth
rate of these liabilities.
1.9.3 Setting-up of Sinking Fund for amortisation of all loans
The Twelfth Finance Commission in its report’s para no.12.59 recommended
that States should set up Sinking Funds for amortisation of loans. In terms of
the guidelines of the Reserve Bank of India, States are required to contribute to
the Consolidated Sinking Fund, a minimum of 0.50 per cent of their outstanding
liabilities as at the end of the previous year.
In view of total outstanding liabilities of ` 1,08,686.71 crore as on 31 March
2015, State Government was required to contribute ` 543.43 crore to
Consolidated Sinking Fund. However, State Government did not constitute the
Consolidated Sinking Fund.
During the exit conference (December 2016), FD replied that a decision would
be taken in case setting up of Sinking Fund was necessitated.
1.9.4 Status of Guarantees – contingent liabilities
Guarantees are liabilities contingent on the Consolidated Fund of the State in
cases of default by the borrowers for whom the guarantee are extended.
Madhya Pradesh State Government Guarantee Rules (MPSGGR), 2009
(amended) came into force from 20 November 2009 and apply in all cases where
State Government stands guarantee for repayment of loans and interest thereon
under article 293 of the Constitution of India. Sanction orders of the guarantees
are issued by the Finance Department.
Clause 9(2)(d) of the MPFRBM Act, 2005 prescribes the fiscal target of limiting
annual incremental guarantees so as to ensure that the total guarantees do not
exceed 80 per cent of the total revenue receipts in the year preceding the current
year. During the year 2015-16, the annual incremental guarantees were within
the ceiling limit fixed under the MPFRBM Act.
As recorded in Statement 9 of the Finance Accounts, the maximum amount for
which guarantees were given by the State and outstanding guarantees for the
last three years are given in Table 1.32.
Table 1.32: Guarantees given by the Government of MP
(`̀̀̀ in crore)
Particulars of Guarantees 2013-14 2014-15 2015-16
Maximum amount Guaranteed 21,472.12 31,884.57 40,170.97
Outstanding amount of Guarantees 9,977.62 20,124.25 27,530.40
80 per cent of the total Revenue Receipts in the year preceding
the current year ( criterion as per FRBM Act)
56,341.60 60,599.39 70,912.80
Percentage of maximum amount of Guarantee to total Revenue
Receipts
28.35 35.97 38.07
Percentage of outstanding Guarantee to total Revenue Receipts
of preceding year
14.17 26.57 31.06
Guarantee or fee receivable 102.86 171.81 127.33
Guarantee or fee received 2.50 5.29 14.21 (Source: Finance Accounts of respective years)
Chapter 1-Finances of the State Government
37
During the year 2015-16, guarantees were given in respect of Power Sector (57),
Co-operative Sector (10), State Financial Corporation Sector (25), Urban
Development and Housing Sector (446) and other infrastructure (95). Maximum
amount guaranteed during 2015-16 increased substantially by ` 8,286.40 crore
over the previous year.
Guarantee Redemption Fund
The State Government constituted the Guarantee Redemption Fund during the
year 2005-06, which had a closing balance of ` 394.58 crore at the end of
2015-16. The whole amount stood invested.
Guarantee Fee at the rate of one per cent is charged from the principal debtors
unless exempted specially. The proceeds of the fees so realised are credited to
the revenue of the Government. During the year 2015-16, a sum of ` 14.21 crore
(11.16 per cent) out of ` 127.33 crore receivable, was recovered as Guarantee
Fees and credited to the Government Account. No Guarantee was invoked
during 2015-16.
As per Gazzette notification dated 27 January 2006 issued by the Finance
Department, Government of Madhya Pradesh, contribution to the fund every
year should be the guarantee fees realised in the preceding year and matching
contribution by the State Government. Guarantee fees of ` 5.29 crore was
realised during 2014-15 thus ` 10.58 crore was to be contributed by the State to
the Fund during 2015-16 but no amount was contributed by the State
Government to the fund. Consequently, the Revenue Surplus of the State
Government was overstated by ` 10.58 crore.
1.9.5 Inoperative Reserve Funds
We observed that Reserve Fund under the Major Head 8229-200-Compensatory
Forestation Fund have credit balance of ` 31.81 crore as on 31 March 2016
which were neither utilised nor invested since last eight years.
During the exit conference (December 2016), FD replied that the concerned
Department would be instructed to take adequate action in this regard.
1.10 Debt Management
1.10.1 Debt Sustainability
Debt sustainability implies State's ability to service the debt. Apart from the
magnitude of debt of the State Government, it is important to analyse the various
indicators that determine the debt sustainability13 of the State. The analysis of
various debt sustainability indicators of the State for the period of five years
beginning from 2011-12 is given by Table 1.33.
Table 1.33: Debt Sustainability: Indicators and Trend
Indicators of Debt Sustainability 2011-12 2012-13 2013-14 2014-15 2015-16
Rate of growth of outstanding debt 8.28 10.29 7.38 12.25 16.98
Rate of growth of GSDP 19.80 20.71 14.40 11.19 16.62
13 Debt Sustainability is defined as the ability of the State to maintain a constant debt-GSDP ratio over a period
of time and also embodies the concern about the ability to service its debt. Sustainability of debt, therefore,
also refers to sufficiency of liquid assets to meet current or committed obligations and the capacity to keep a
balance between costs of additional borrowings with returns from such borrowings. It means that the rise in
fiscal deficit should match the increase in capacity to service the debt.
Audit Report on State Finances for the year ended 31 March 2016
38
Indicators of Debt Sustainability 2011-12 2012-13 2013-14 2014-15 2015-16
Average interest rate of outstanding debt 6.74 6.48 6.84 6.88 6.86
Interest Payments/ Revenue Receipt (per cent) 8.47 7.91 8.44 7.98 7.67
Debt Repayment/ Debt Receipts 0.68 0.57 0.71 0.67 0.63
Net debt available to the State (` in crore) 955 2,838 569 4,793 10,367
(Source: Finance Accounts of respective years)
Table 1.33 reveals that rate of growth of outstanding debt increased from 8.28
per cent in 2011-12 to 16.98 per cent in 2015-16 with inter-year fluctuatons
while rate of growth of GSDP decreased from 19.80 per cent in 2011-12 to
16.62 per cent in 2015-16.
The net debt available to State after providing for interest and repayment
increased from ` 955 crore in 2011-12 to ` 10,367 crore in 2015-16. The
percentage of interest payment on the total liabilities to the revenue receipts of
the State for the period 2011-12 to 2015-16 ranged between 7.67 per cent to
8.47 per cent. During 2015-16, percentage of interest payment to revenue
receipts i.e. 7.67 per cent slightly exceeded the limit of 6.74 per cent prescribed
by XIV FC.
1.10.2 Sufficiency of Non-Debt Receipts
Another indicator of debt sustainability is the ‘sufficiency of incremental non-
debt receipts’14 of the State to cover the incremental interest liabilities and
incremental primary expenditure. Debt sustainability could be facilitated if the
incremental non-debt receipts could meet the incremental interest burden and
the incremental primary expenditure. A positive resource gap strengthens the
capacity of the State to sustain the debt in the medium to long run while a
negative resource gap indicates otherwise.
During the periods 2011-12 to 2015-16, incremental non-debt receipts were
not enough to meet the incremental primary expenditure resulting in a negative
resource gap.
1.10.3 Net availability of borrowed funds15
Debt Redemption ratio indicated a fluctuating trend ranged between 0.79 to 0.98
during the period 2011-16 (Appendix 1.4), leaving very less funds for asset
creation. During the year 2015-16, internal debt repayment (` 3,948 crore) was
21 per cent of fresh internal debt receipts (` 18,659 crore), repayment of GoI
loans (` 912 crore) was 69 per cent of fresh debt receipts of ` 1,326 crore while
in case of other obligations, repayment (` 26,206 crore) was 89 per cent of fresh
receipts of ` 29,539 crore. This indicated that fresh debt receipts were partly
utilised for repayment of debt.
Out of receipts of ` 18,659 crore under internal debt during the year, the
Government raised ` 14,700 crore from market loans at an average interest rate
14 Adequacy of incremental Non-debt receipts of the State to cover the incremental interest liabilities and
incremental Primary Expenditure. The Debt Sustainability could be significantly facilitated if the incremental
Non-debt receipts could meet the incremental interest burden and the incremental Primary Expenditure. 15 Defined as the ratio of the Debt Redemption (Principal + Interest Payments) to total Debt Receipts and
indicates the extent to which the debt receipts are used in Debt Redemption indicating the Net Availability of
Borrowed Funds.
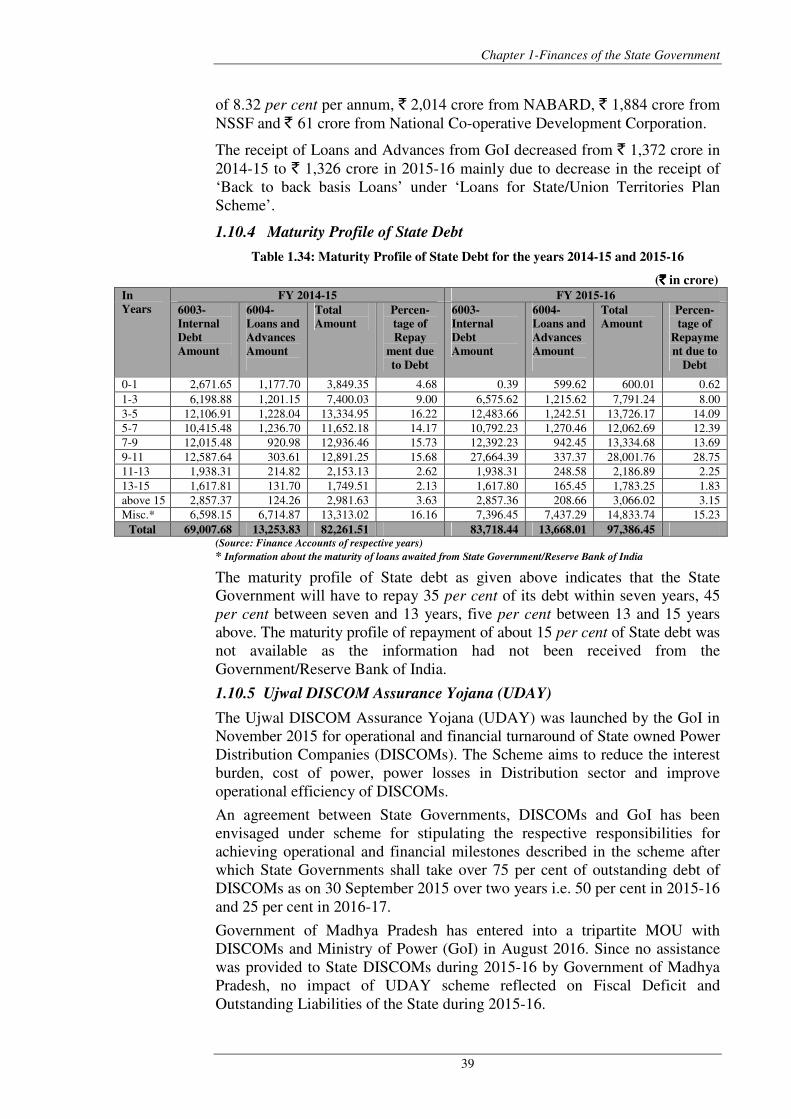
Chapter 1-Finances of the State Government
39
of 8.32 per cent per annum, ` 2,014 crore from NABARD, ` 1,884 crore from
NSSF and ` 61 crore from National Co-operative Development Corporation.
The receipt of Loans and Advances from GoI decreased from ` 1,372 crore in
2014-15 to ` 1,326 crore in 2015-16 mainly due to decrease in the receipt of
‘Back to back basis Loans’ under ‘Loans for State/Union Territories Plan
Scheme’.
1.10.4 Maturity Profile of State Debt
Table 1.34: Maturity Profile of State Debt for the years 2014-15 and 2015-16
(`̀̀̀ in crore)
In
Years
FY 2014-15 FY 2015-16
6003-
Internal
Debt
Amount
6004-
Loans and
Advances
Amount
Total
Amount
Percen-
tage of
Repay
ment due
to Debt
6003-
Internal
Debt
Amount
6004-
Loans and
Advances
Amount
Total
Amount
Percen-
tage of
Repayme
nt due to
Debt
0-1 2,671.65 1,177.70 3,849.35 4.68 0.39 599.62 600.01 0.62
1-3 6,198.88 1,201.15 7,400.03 9.00 6,575.62 1,215.62 7,791.24 8.00
3-5 12,106.91 1,228.04 13,334.95 16.22 12,483.66 1,242.51 13,726.17 14.09
5-7 10,415.48 1,236.70 11,652.18 14.17 10,792.23 1,270.46 12,062.69 12.39
7-9 12,015.48 920.98 12,936.46 15.73 12,392.23 942.45 13,334.68 13.69
9-11 12,587.64 303.61 12,891.25 15.68 27,664.39 337.37 28,001.76 28.75
11-13 1,938.31 214.82 2,153.13 2.62 1,938.31 248.58 2,186.89 2.25
13-15 1,617.81 131.70 1,749.51 2.13 1,617.80 165.45 1,783.25 1.83
above 15 2,857.37 124.26 2,981.63 3.63 2,857.36 208.66 3,066.02 3.15
Misc.* 6,598.15 6,714.87 13,313.02 16.16 7,396.45 7,437.29 14,833.74 15.23
Total 69,007.68 13,253.83 82,261.51 83,718.44 13,668.01 97,386.45 (Source: Finance Accounts of respective years)
* Information about the maturity of loans awaited from State Government/Reserve Bank of India
The maturity profile of State debt as given above indicates that the State
Government will have to repay 35 per cent of its debt within seven years, 45
per cent between seven and 13 years, five per cent between 13 and 15 years
above. The maturity profile of repayment of about 15 per cent of State debt was
not available as the information had not been received from the
Government/Reserve Bank of India.
1.10.5 Ujwal DISCOM Assurance Yojana (UDAY)
The Ujwal DISCOM Assurance Yojana (UDAY) was launched by the GoI in
November 2015 for operational and financial turnaround of State owned Power
Distribution Companies (DISCOMs). The Scheme aims to reduce the interest
burden, cost of power, power losses in Distribution sector and improve
operational efficiency of DISCOMs.
An agreement between State Governments, DISCOMs and GoI has been
envisaged under scheme for stipulating the respective responsibilities for
achieving operational and financial milestones described in the scheme after
which State Governments shall take over 75 per cent of outstanding debt of
DISCOMs as on 30 September 2015 over two years i.e. 50 per cent in 2015-16
and 25 per cent in 2016-17.
Government of Madhya Pradesh has entered into a tripartite MOU with
DISCOMs and Ministry of Power (GoI) in August 2016. Since no assistance
was provided to State DISCOMs during 2015-16 by Government of Madhya
Pradesh, no impact of UDAY scheme reflected on Fiscal Deficit and
Outstanding Liabilities of the State during 2015-16.
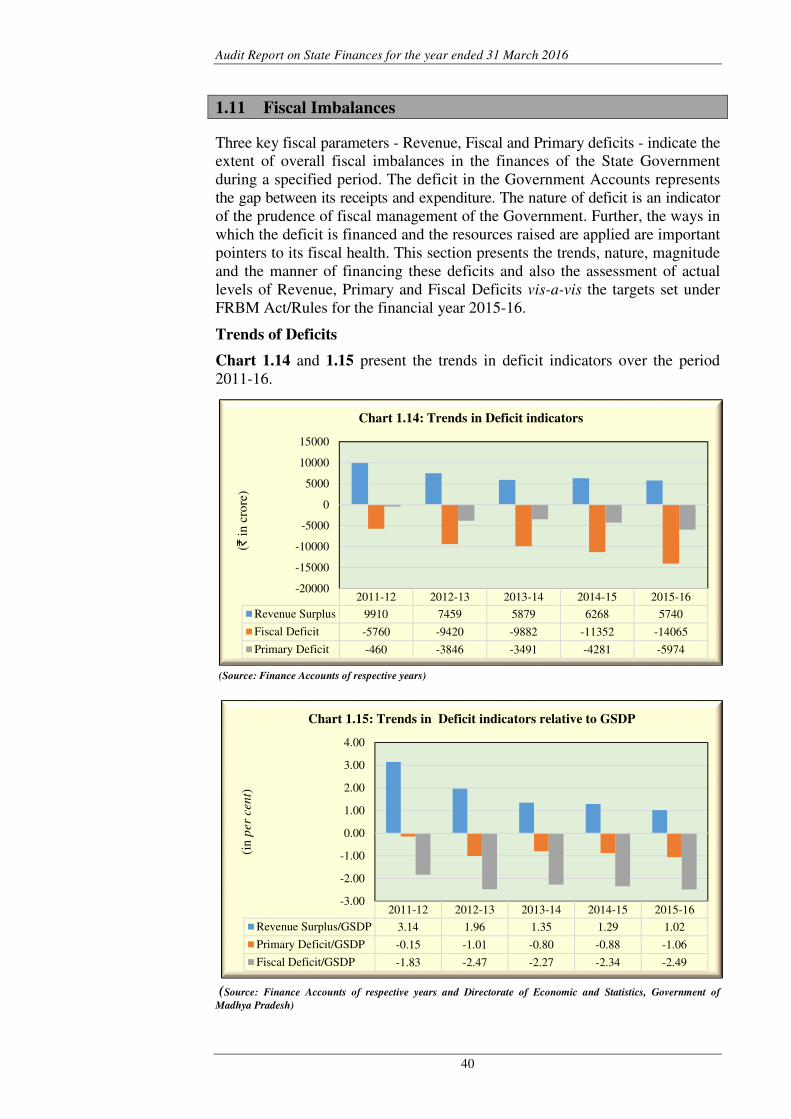
Audit Report on State Finances for the year ended 31 March 2016
40
1.11 Fiscal Imbalances
Three key fiscal parameters - Revenue, Fiscal and Primary deficits - indicate the
extent of overall fiscal imbalances in the finances of the State Government
during a specified period. The deficit in the Government Accounts represents
the gap between its receipts and expenditure. The nature of deficit is an indicator
of the prudence of fiscal management of the Government. Further, the ways in
which the deficit is financed and the resources raised are applied are important
pointers to its fiscal health. This section presents the trends, nature, magnitude
and the manner of financing these deficits and also the assessment of actual
levels of Revenue, Primary and Fiscal Deficits vis-a-vis the targets set under
FRBM Act/Rules for the financial year 2015-16.
Trends of Deficits
Chart 1.14 and 1.15 present the trends in deficit indicators over the period
2011-16.
(Source: Finance Accounts of respective years)
(Source: Finance Accounts of respective years and Directorate of Economic and Statistics, Government of
Madhya Pradesh)
2011-12 2012-13 2013-14 2014-15 2015-16
Revenue Surplus 9910 7459 5879 6268 5740
Fiscal Deficit -5760 -9420 -9882 -11352 -14065
Primary Deficit -460 -3846 -3491 -4281 -5974
-20000
-15000
-10000
-5000
0
5000
10000
15000
(`in
cro
re)
Chart 1.14: Trends in Deficit indicators
2011-12 2012-13 2013-14 2014-15 2015-16
Revenue Surplus/GSDP 3.14 1.96 1.35 1.29 1.02
Primary Deficit/GSDP -0.15 -1.01 -0.80 -0.88 -1.06
Fiscal Deficit/GSDP -1.83 -2.47 -2.27 -2.34 -2.49
-3.00
-2.00
-1.00
0.00
1.00
2.00
3.00
4.00
(in p
er
cen
t)
Chart 1.15: Trends in Deficit indicators relative to GSDP
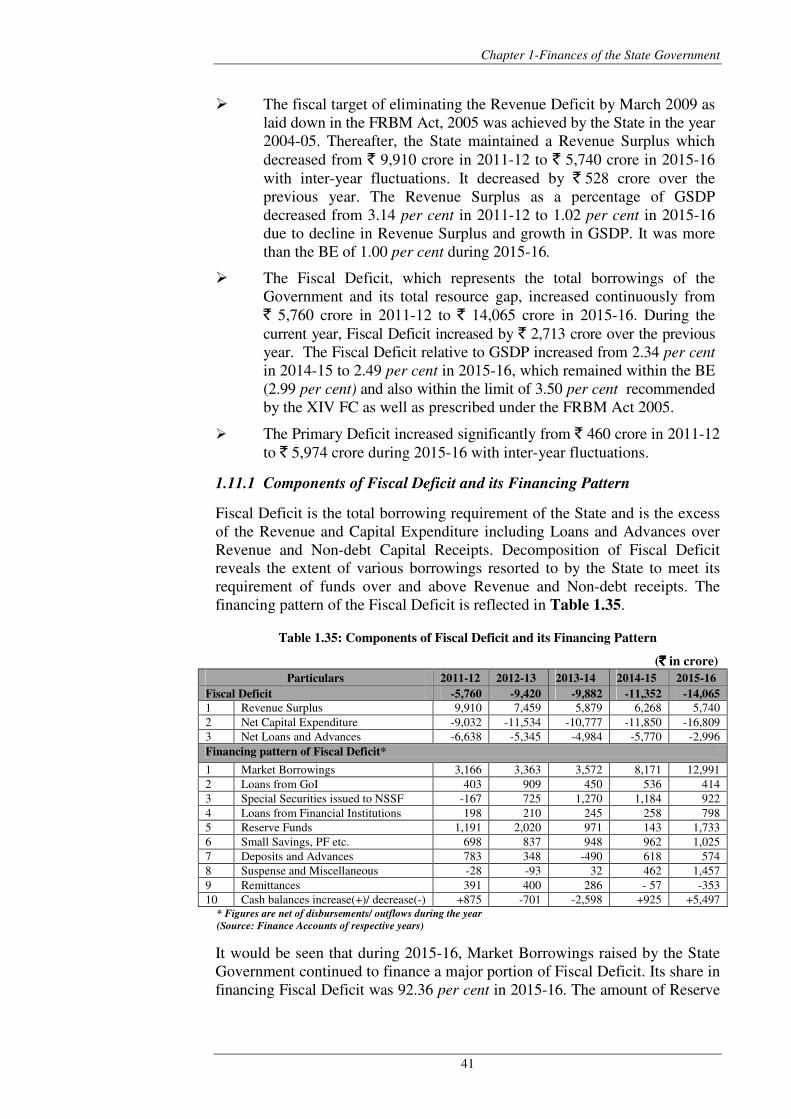
Chapter 1-Finances of the State Government
41
� The fiscal target of eliminating the Revenue Deficit by March 2009 as
laid down in the FRBM Act, 2005 was achieved by the State in the year
2004-05. Thereafter, the State maintained a Revenue Surplus which
decreased from ` 9,910 crore in 2011-12 to ` 5,740 crore in 2015-16
with inter-year fluctuations. It decreased by ` 528 crore over the
previous year. The Revenue Surplus as a percentage of GSDP
decreased from 3.14 per cent in 2011-12 to 1.02 per cent in 2015-16
due to decline in Revenue Surplus and growth in GSDP. It was more
than the BE of 1.00 per cent during 2015-16.
� The Fiscal Deficit, which represents the total borrowings of the
Government and its total resource gap, increased continuously from
` 5,760 crore in 2011-12 to ` 14,065 crore in 2015-16. During the
current year, Fiscal Deficit increased by ` 2,713 crore over the previous
year. The Fiscal Deficit relative to GSDP increased from 2.34 per cent
in 2014-15 to 2.49 per cent in 2015-16, which remained within the BE
(2.99 per cent) and also within the limit of 3.50 per cent recommended
by the XIV FC as well as prescribed under the FRBM Act 2005.
� The Primary Deficit increased significantly from ` 460 crore in 2011-12
to ` 5,974 crore during 2015-16 with inter-year fluctuations.
1.11.1 Components of Fiscal Deficit and its Financing Pattern
Fiscal Deficit is the total borrowing requirement of the State and is the excess
of the Revenue and Capital Expenditure including Loans and Advances over
Revenue and Non-debt Capital Receipts. Decomposition of Fiscal Deficit
reveals the extent of various borrowings resorted to by the State to meet its
requirement of funds over and above Revenue and Non-debt receipts. The
financing pattern of the Fiscal Deficit is reflected in Table 1.35.
Table 1.35: Components of Fiscal Deficit and its Financing Pattern
(`̀̀̀ in crore)
Particulars 2011-12 2012-13 2013-14 2014-15 2015-16
Fiscal Deficit -5,760 -9,420 -9,882 -11,352 -14,065
1 Revenue Surplus 9,910 7,459 5,879 6,268 5,740
2 Net Capital Expenditure -9,032 -11,534 -10,777 -11,850 -16,809
3 Net Loans and Advances -6,638 -5,345 -4,984 -5,770 -2,996
Financing pattern of Fiscal Deficit*
1 Market Borrowings 3,166 3,363 3,572 8,171 12,991
2 Loans from GoI 403 909 450 536 414
3 Special Securities issued to NSSF -167 725 1,270 1,184 922
4 Loans from Financial Institutions 198 210 245 258 798
5 Reserve Funds 1,191 2,020 971 143 1,733
6 Small Savings, PF etc. 698 837 948 962 1,025
7 Deposits and Advances 783 348 -490 618 574
8 Suspense and Miscellaneous -28 -93 32 462 1,457
9 Remittances 391 400 286 - 57 -353
10 Cash balances increase(+)/ decrease(-) +875 -701 -2,598 +925 +5,497 * Figures are net of disbursements/ outflows during the year
(Source: Finance Accounts of respective years)
It would be seen that during 2015-16, Market Borrowings raised by the State
Government continued to finance a major portion of Fiscal Deficit. Its share in
financing Fiscal Deficit was 92.36 per cent in 2015-16. The amount of Reserve
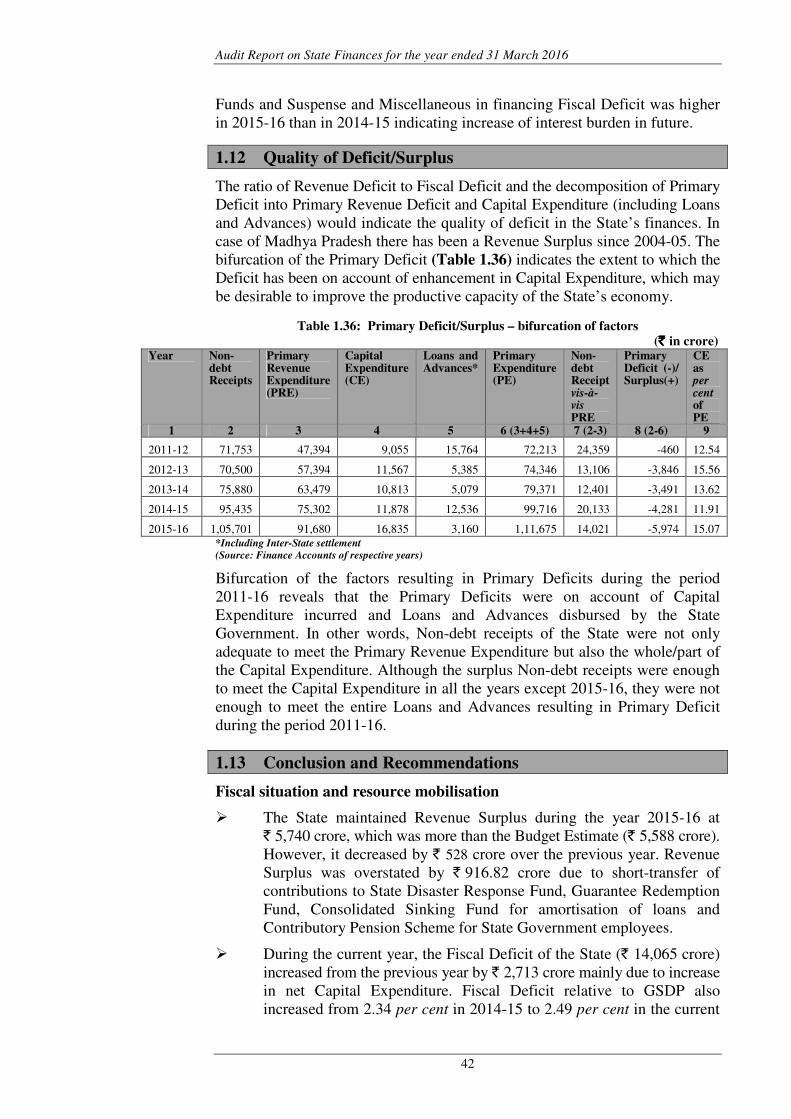
Audit Report on State Finances for the year ended 31 March 2016
42
Funds and Suspense and Miscellaneous in financing Fiscal Deficit was higher
in 2015-16 than in 2014-15 indicating increase of interest burden in future.
1.12 Quality of Deficit/Surplus
The ratio of Revenue Deficit to Fiscal Deficit and the decomposition of Primary
Deficit into Primary Revenue Deficit and Capital Expenditure (including Loans
and Advances) would indicate the quality of deficit in the State’s finances. In
case of Madhya Pradesh there has been a Revenue Surplus since 2004-05. The
bifurcation of the Primary Deficit (Table 1.36) indicates the extent to which the
Deficit has been on account of enhancement in Capital Expenditure, which may
be desirable to improve the productive capacity of the State’s economy.
Table 1.36: Primary Deficit/Surplus – bifurcation of factors
(` ` ` ` in crore) Year Non-
debt Receipts
Primary Revenue Expenditure (PRE)
Capital Expenditure (CE)
Loans and Advances*
Primary Expenditure (PE)
Non-debt Receipt vis-à-vis PRE
Primary Deficit (-)/ Surplus(+)
CE as per cent of PE
1 2 3 4 5 6 (3+4+5) 7 (2-3) 8 (2-6) 9
2011-12 71,753 47,394 9,055 15,764 72,213 24,359 -460 12.54
2012-13 70,500 57,394 11,567 5,385 74,346 13,106 -3,846 15.56
2013-14 75,880 63,479 10,813 5,079 79,371 12,401 -3,491 13.62
2014-15 95,435 75,302 11,878 12,536 99,716 20,133 -4,281 11.91
2015-16 1,05,701 91,680 16,835 3,160 1,11,675 14,021 -5,974 15.07
*Including Inter-State settlement
(Source: Finance Accounts of respective years)
Bifurcation of the factors resulting in Primary Deficits during the period
2011-16 reveals that the Primary Deficits were on account of Capital
Expenditure incurred and Loans and Advances disbursed by the State
Government. In other words, Non-debt receipts of the State were not only
adequate to meet the Primary Revenue Expenditure but also the whole/part of
the Capital Expenditure. Although the surplus Non-debt receipts were enough
to meet the Capital Expenditure in all the years except 2015-16, they were not
enough to meet the entire Loans and Advances resulting in Primary Deficit
during the period 2011-16.
1.13 Conclusion and Recommendations
Fiscal situation and resource mobilisation
� The State maintained Revenue Surplus during the year 2015-16 at
` 5,740 crore, which was more than the Budget Estimate (` 5,588 crore).
However, it decreased by ` 528 crore over the previous year. Revenue
Surplus was overstated by ` 916.82 crore due to short-transfer of
contributions to State Disaster Response Fund, Guarantee Redemption
Fund, Consolidated Sinking Fund for amortisation of loans and
Contributory Pension Scheme for State Government employees.
� During the current year, the Fiscal Deficit of the State (` 14,065 crore)
increased from the previous year by ` 2,713 crore mainly due to increase
in net Capital Expenditure. Fiscal Deficit relative to GSDP also
increased from 2.34 per cent in 2014-15 to 2.49 per cent in the current
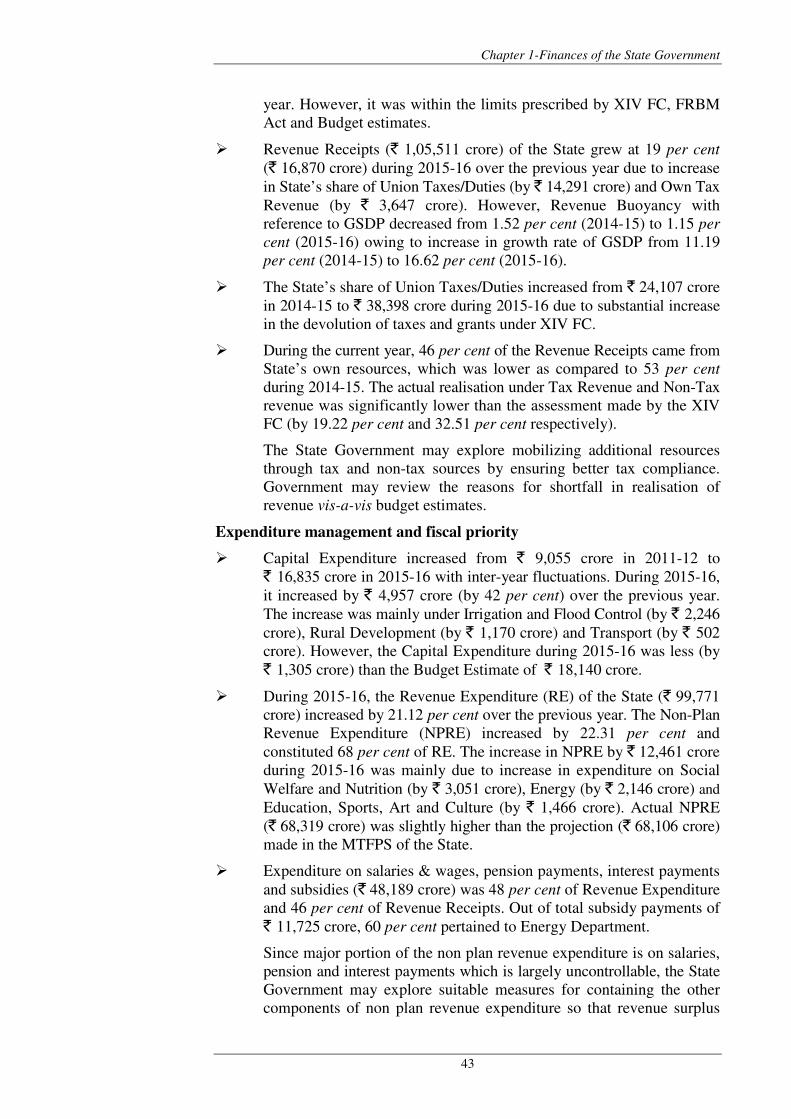
Chapter 1-Finances of the State Government
43
year. However, it was within the limits prescribed by XIV FC, FRBM
Act and Budget estimates.
� Revenue Receipts (` 1,05,511 crore) of the State grew at 19 per cent
(` 16,870 crore) during 2015-16 over the previous year due to increase
in State’s share of Union Taxes/Duties (by ` 14,291 crore) and Own Tax
Revenue (by ` 3,647 crore). However, Revenue Buoyancy with
reference to GSDP decreased from 1.52 per cent (2014-15) to 1.15 per
cent (2015-16) owing to increase in growth rate of GSDP from 11.19
per cent (2014-15) to 16.62 per cent (2015-16).
� The State’s share of Union Taxes/Duties increased from ` 24,107 crore
in 2014-15 to ` 38,398 crore during 2015-16 due to substantial increase
in the devolution of taxes and grants under XIV FC.
� During the current year, 46 per cent of the Revenue Receipts came from
State’s own resources, which was lower as compared to 53 per cent
during 2014-15. The actual realisation under Tax Revenue and Non-Tax
revenue was significantly lower than the assessment made by the XIV
FC (by 19.22 per cent and 32.51 per cent respectively).
The State Government may explore mobilizing additional resources
through tax and non-tax sources by ensuring better tax compliance.
Government may review the reasons for shortfall in realisation of
revenue vis-a-vis budget estimates.
Expenditure management and fiscal priority
� Capital Expenditure increased from ` 9,055 crore in 2011-12 to
` 16,835 crore in 2015-16 with inter-year fluctuations. During 2015-16,
it increased by ` 4,957 crore (by 42 per cent) over the previous year.
The increase was mainly under Irrigation and Flood Control (by ` 2,246
crore), Rural Development (by ` 1,170 crore) and Transport (by ` 502
crore). However, the Capital Expenditure during 2015-16 was less (by
` 1,305 crore) than the Budget Estimate of ` 18,140 crore.
� During 2015-16, the Revenue Expenditure (RE) of the State (` 99,771
crore) increased by 21.12 per cent over the previous year. The Non-Plan
Revenue Expenditure (NPRE) increased by 22.31 per cent and
constituted 68 per cent of RE. The increase in NPRE by ` 12,461 crore
during 2015-16 was mainly due to increase in expenditure on Social
Welfare and Nutrition (by ` 3,051 crore), Energy (by ` 2,146 crore) and
Education, Sports, Art and Culture (by ` 1,466 crore). Actual NPRE
(` 68,319 crore) was slightly higher than the projection (` 68,106 crore)
made in the MTFPS of the State.
� Expenditure on salaries & wages, pension payments, interest payments
and subsidies (` 48,189 crore) was 48 per cent of Revenue Expenditure
and 46 per cent of Revenue Receipts. Out of total subsidy payments of
` 11,725 crore, 60 per cent pertained to Energy Department.
Since major portion of the non plan revenue expenditure is on salaries,
pension and interest payments which is largely uncontrollable, the State
Government may explore suitable measures for containing the other
components of non plan revenue expenditure so that revenue surplus
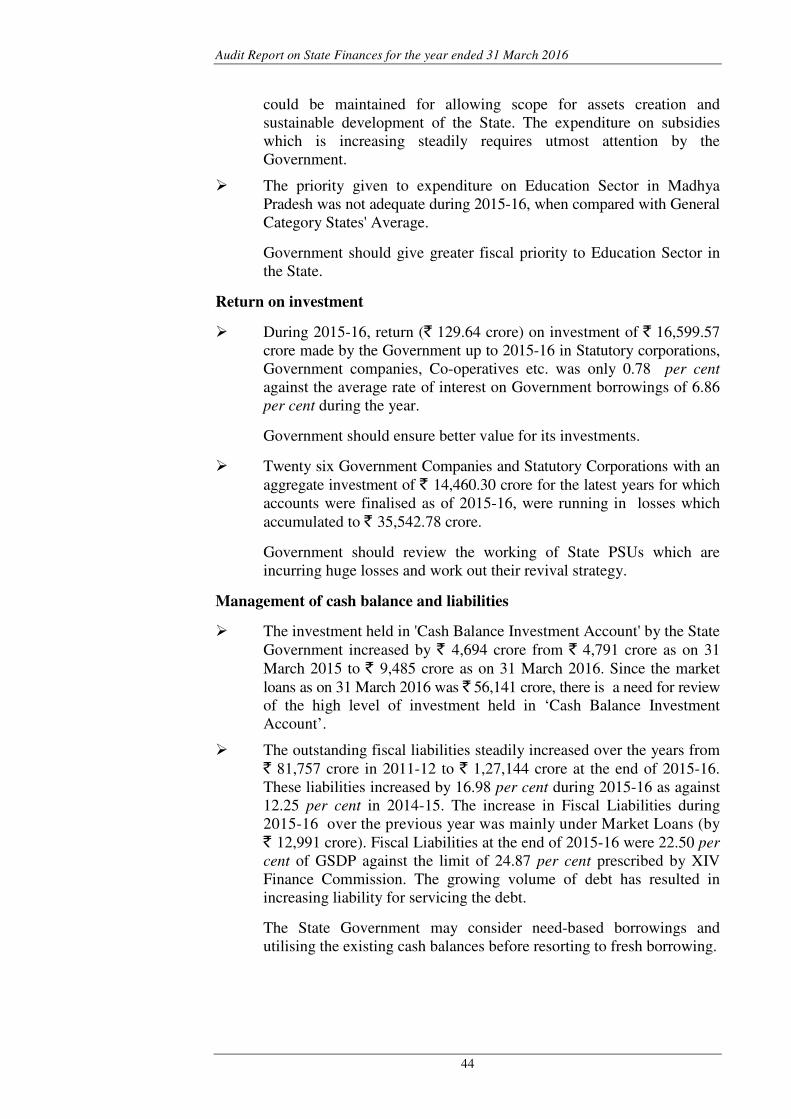
Audit Report on State Finances for the year ended 31 March 2016
44
could be maintained for allowing scope for assets creation and
sustainable development of the State. The expenditure on subsidies
which is increasing steadily requires utmost attention by the
Government.
� The priority given to expenditure on Education Sector in Madhya
Pradesh was not adequate during 2015-16, when compared with General
Category States' Average.
Government should give greater fiscal priority to Education Sector in
the State.
Return on investment
� During 2015-16, return (` 129.64 crore) on investment of ` 16,599.57
crore made by the Government up to 2015-16 in Statutory corporations,
Government companies, Co-operatives etc. was only 0.78 per cent
against the average rate of interest on Government borrowings of 6.86
per cent during the year.
Government should ensure better value for its investments.
� Twenty six Government Companies and Statutory Corporations with an
aggregate investment of ` 14,460.30 crore for the latest years for which
accounts were finalised as of 2015-16, were running in losses which
accumulated to ` 35,542.78 crore.
Government should review the working of State PSUs which are
incurring huge losses and work out their revival strategy.
Management of cash balance and liabilities
� The investment held in 'Cash Balance Investment Account' by the State
Government increased by ` 4,694 crore from ` 4,791 crore as on 31
March 2015 to ` 9,485 crore as on 31 March 2016. Since the market
loans as on 31 March 2016 was ` 56,141 crore, there is a need for review
of the high level of investment held in ‘Cash Balance Investment
Account’.
� The outstanding fiscal liabilities steadily increased over the years from
` 81,757 crore in 2011-12 to ` 1,27,144 crore at the end of 2015-16.
These liabilities increased by 16.98 per cent during 2015-16 as against
12.25 per cent in 2014-15. The increase in Fiscal Liabilities during
2015-16 over the previous year was mainly under Market Loans (by
` 12,991 crore). Fiscal Liabilities at the end of 2015-16 were 22.50 per
cent of GSDP against the limit of 24.87 per cent prescribed by XIV
Finance Commission. The growing volume of debt has resulted in
increasing liability for servicing the debt.
The State Government may consider need-based borrowings and
utilising the existing cash balances before resorting to fresh borrowing.

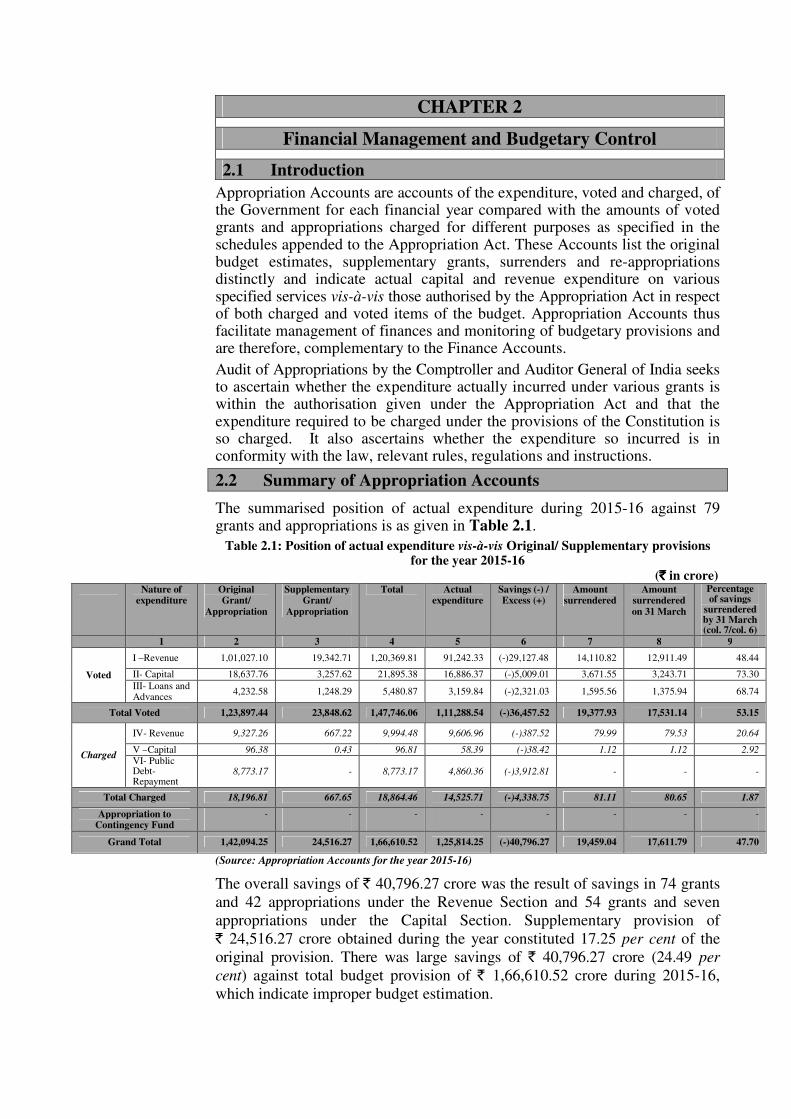
CHAPTER 2
Financial Management and Budgetary Control
2.1 Introduction
Appropriation Accounts are accounts of the expenditure, voted and charged, of the Government for each financial year compared with the amounts of voted grants and appropriations charged for different purposes as specified in the schedules appended to the Appropriation Act. These Accounts list the original budget estimates, supplementary grants, surrenders and re-appropriations distinctly and indicate actual capital and revenue expenditure on various specified services vis-à-vis those authorised by the Appropriation Act in respect of both charged and voted items of the budget. Appropriation Accounts thus facilitate management of finances and monitoring of budgetary provisions and are therefore, complementary to the Finance Accounts.
Audit of Appropriations by the Comptroller and Auditor General of India seeks to ascertain whether the expenditure actually incurred under various grants is within the authorisation given under the Appropriation Act and that the expenditure required to be charged under the provisions of the Constitution is so charged. It also ascertains whether the expenditure so incurred is in conformity with the law, relevant rules, regulations and instructions.
2.2 Summary of Appropriation Accounts
The summarised position of actual expenditure during 2015-16 against 79 grants and appropriations is as given in Table 2.1.
Table 2.1: Position of actual expenditure vis-à-vis Original/ Supplementary provisions for the year 2015-16
(`̀̀̀ in crore) Nature of
expenditure Original Grant/
Appropriation
Supplementary Grant/
Appropriation
Total Actual expenditure
Savings (-) / Excess (+)
Amount surrendered
Amount surrendered on 31 March
Percentage of savings
surrendered by 31 March (col. 7/col. 6)
1 2 3 4 5 6 7 8 9
Voted
I –Revenue 1,01,027.10 19,342.71 1,20,369.81 91,242.33 (-)29,127.48 14,110.82 12,911.49 48.44
II- Capital 18,637.76 3,257.62 21,895.38 16,886.37 (-)5,009.01 3,671.55 3,243.71 73.30
III- Loans and Advances
4,232.58 1,248.29 5,480.87 3,159.84 (-)2,321.03 1,595.56 1,375.94 68.74
Total Voted 1,23,897.44 23,848.62 1,47,746.06 1,11,288.54 (-)36,457.52 19,377.93 17,531.14 53.15
Charged
IV- Revenue 9,327.26 667.22 9,994.48 9,606.96 (-)387.52 79.99 79.53 20.64
V –Capital 96.38 0.43 96.81 58.39 (-)38.42 1.12 1.12 2.92 VI- Public Debt-Repayment
8,773.17 - 8,773.17 4,860.36 (-)3,912.81 - - -
Total Charged 18,196.81 667.65 18,864.46 14,525.71 (-)4,338.75 81.11 80.65 1.87
Appropriation to Contingency Fund
- - - - - - - -
Grand Total 1,42,094.25 24,516.27 1,66,610.52 1,25,814.25 (-)40,796.27 19,459.04 17,611.79 47.70
(Source: Appropriation Accounts for the year 2015-16)
The overall savings of ` 40,796.27 crore was the result of savings in 74 grants
and 42 appropriations under the Revenue Section and 54 grants and seven
appropriations under the Capital Section. Supplementary provision of
` 24,516.27 crore obtained during the year constituted 17.25 per cent of the
original provision. There was large savings of ` 40,796.27 crore (24.49 per
cent) against total budget provision of ` 1,66,610.52 crore during 2015-16,
which indicate improper budget estimation.
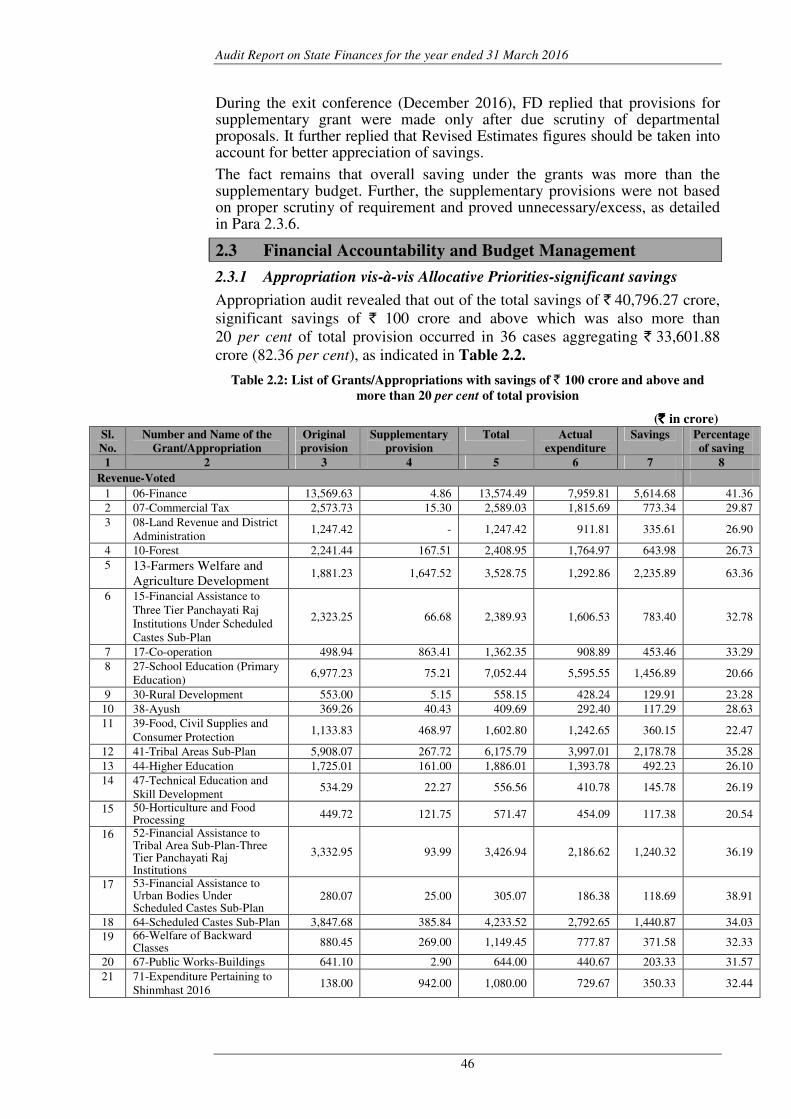
Audit Report on State Finances for the year ended 31 March 2016
46
During the exit conference (December 2016), FD replied that provisions for supplementary grant were made only after due scrutiny of departmental proposals. It further replied that Revised Estimates figures should be taken into account for better appreciation of savings.
The fact remains that overall saving under the grants was more than the supplementary budget. Further, the supplementary provisions were not based on proper scrutiny of requirement and proved unnecessary/excess, as detailed in Para 2.3.6.
2.3 Financial Accountability and Budget Management
2.3.1 Appropriation vis-à-vis Allocative Priorities-significant savings
Appropriation audit revealed that out of the total savings of ` 40,796.27 crore,
significant savings of ` 100 crore and above which was also more than
20 per cent of total provision occurred in 36 cases aggregating ` 33,601.88 crore (82.36 per cent), as indicated in Table 2.2.
Table 2.2: List of Grants/Appropriations with savings of ` 100 crore and above and
more than 20 per cent of total provision
(`̀̀̀ in crore)
Sl.
No.
Number and Name of the
Grant/Appropriation
Original
provision
Supplementary
provision
Total Actual
expenditure
Savings Percentage
of saving
1 2 3 4 5 6 7 8
Revenue-Voted
1 06-Finance 13,569.63 4.86 13,574.49 7,959.81 5,614.68 41.36
2 07-Commercial Tax 2,573.73 15.30 2,589.03 1,815.69 773.34 29.87
3 08-Land Revenue and District
Administration 1,247.42 - 1,247.42 911.81 335.61 26.90
4 10-Forest 2,241.44 167.51 2,408.95 1,764.97 643.98 26.73
5 13-Farmers Welfare and
Agriculture Development 1,881.23 1,647.52 3,528.75 1,292.86 2,235.89 63.36
6 15-Financial Assistance to
Three Tier Panchayati Raj
Institutions Under Scheduled
Castes Sub-Plan
2,323.25 66.68 2,389.93 1,606.53 783.40 32.78
7 17-Co-operation 498.94 863.41 1,362.35 908.89 453.46 33.29
8 27-School Education (Primary
Education) 6,977.23 75.21 7,052.44 5,595.55 1,456.89 20.66
9 30-Rural Development 553.00 5.15 558.15 428.24 129.91 23.28
10 38-Ayush 369.26 40.43 409.69 292.40 117.29 28.63
11 39-Food, Civil Supplies and
Consumer Protection 1,133.83 468.97 1,602.80 1,242.65 360.15 22.47
12 41-Tribal Areas Sub-Plan 5,908.07 267.72 6,175.79 3,997.01 2,178.78 35.28
13 44-Higher Education 1,725.01 161.00 1,886.01 1,393.78 492.23 26.10
14 47-Technical Education and
Skill Development 534.29 22.27 556.56 410.78 145.78 26.19
15 50-Horticulture and Food Processing
449.72 121.75 571.47 454.09 117.38 20.54
16 52-Financial Assistance to Tribal Area Sub-Plan-Three Tier Panchayati Raj Institutions
3,332.95 93.99 3,426.94 2,186.62 1,240.32 36.19
17 53-Financial Assistance to Urban Bodies Under Scheduled Castes Sub-Plan
280.07 25.00 305.07 186.38 118.69 38.91
18 64-Scheduled Castes Sub-Plan 3,847.68 385.84 4,233.52 2,792.65 1,440.87 34.03
19 66-Welfare of Backward Classes
880.45 269.00 1,149.45 777.87 371.58 32.33
20 67-Public Works-Buildings 641.10 2.90 644.00 440.67 203.33 31.57
21 71-Expenditure Pertaining to
Shinmhast 2016 138.00 942.00 1,080.00 729.67 350.33 32.44
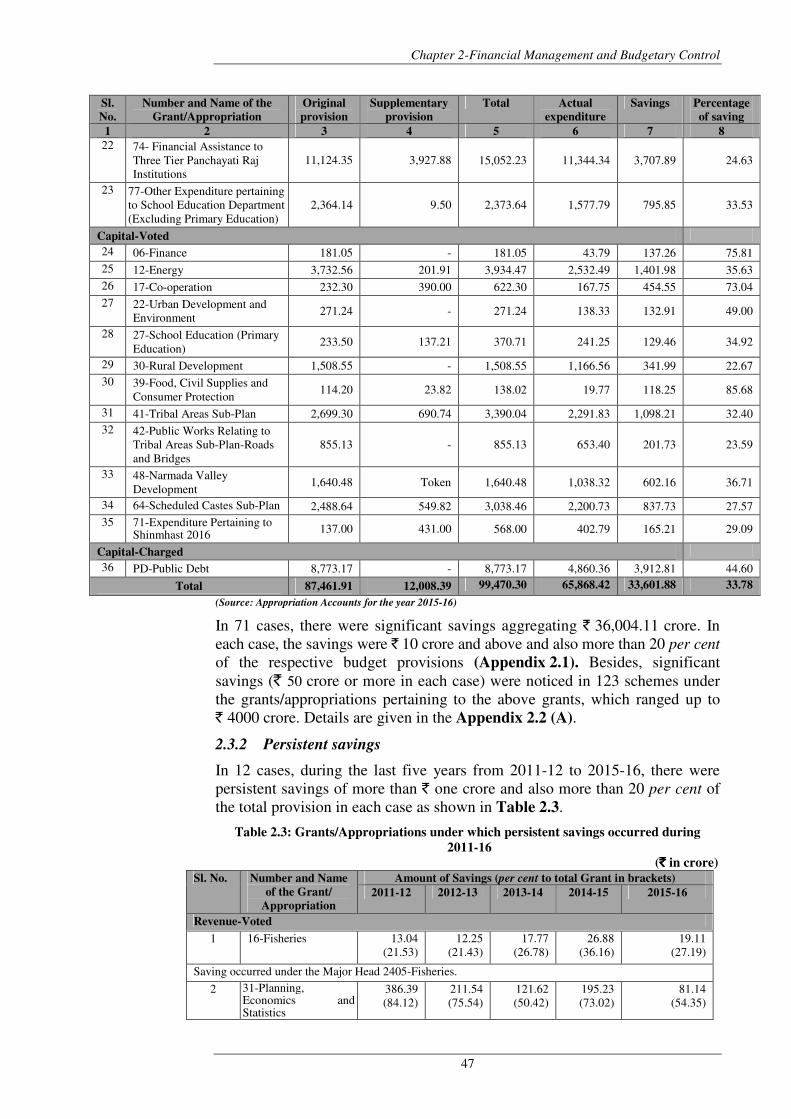
Chapter 2-Financial Management and Budgetary Control
47
Sl.
No.
Number and Name of the
Grant/Appropriation
Original
provision
Supplementary
provision
Total Actual
expenditure
Savings Percentage
of saving
1 2 3 4 5 6 7 8
22 74- Financial Assistance to
Three Tier Panchayati Raj
Institutions
11,124.35 3,927.88 15,052.23 11,344.34 3,707.89 24.63
23 77-Other Expenditure pertaining
to School Education Department
(Excluding Primary Education)
2,364.14 9.50 2,373.64 1,577.79 795.85 33.53
Capital-Voted
24 06-Finance 181.05 - 181.05 43.79 137.26 75.81
25 12-Energy 3,732.56 201.91 3,934.47 2,532.49 1,401.98 35.63
26 17-Co-operation 232.30 390.00 622.30 167.75 454.55 73.04
27 22-Urban Development and
Environment 271.24 - 271.24 138.33 132.91 49.00
28 27-School Education (Primary
Education) 233.50 137.21 370.71 241.25 129.46 34.92
29 30-Rural Development 1,508.55 - 1,508.55 1,166.56 341.99 22.67
30 39-Food, Civil Supplies and
Consumer Protection 114.20 23.82 138.02 19.77 118.25 85.68
31 41-Tribal Areas Sub-Plan 2,699.30 690.74 3,390.04 2,291.83 1,098.21 32.40
32 42-Public Works Relating to
Tribal Areas Sub-Plan-Roads
and Bridges
855.13 - 855.13 653.40 201.73 23.59
33 48-Narmada Valley
Development 1,640.48 Token 1,640.48 1,038.32 602.16 36.71
34 64-Scheduled Castes Sub-Plan 2,488.64 549.82 3,038.46 2,200.73 837.73 27.57
35 71-Expenditure Pertaining to Shinmhast 2016
137.00 431.00 568.00 402.79 165.21 29.09
Capital-Charged
36 PD-Public Debt 8,773.17 - 8,773.17 4,860.36 3,912.81 44.60
Total 87,461.91 12,008.39 99,470.30 65,868.42 33,601.88 33.78
(Source: Appropriation Accounts for the year 2015-16)
In 71 cases, there were significant savings aggregating ` 36,004.11 crore. In
each case, the savings were ` 10 crore and above and also more than 20 per cent
of the respective budget provisions (Appendix 2.1). Besides, significant
savings (` 50 crore or more in each case) were noticed in 123 schemes under
the grants/appropriations pertaining to the above grants, which ranged up to
` 4000 crore. Details are given in the Appendix 2.2 (A).
2.3.2 Persistent savings
In 12 cases, during the last five years from 2011-12 to 2015-16, there were
persistent savings of more than ` one crore and also more than 20 per cent of
the total provision in each case as shown in Table 2.3.
Table 2.3: Grants/Appropriations under which persistent savings occurred during
2011-16
(`̀̀̀ in crore)
Sl. No. Number and Name
of the Grant/
Appropriation
Amount of Savings (per cent to total Grant in brackets)
2011-12 2012-13 2013-14 2014-15 2015-16
Revenue-Voted
1 16-Fisheries 13.04
(21.53)
12.25
(21.43)
17.77
(26.78)
26.88
(36.16)
19.11
(27.19)
Saving occurred under the Major Head 2405-Fisheries.
2 31-Planning, Economics and Statistics
386.39
(84.12)
211.54
(75.54)
121.62
(50.42)
195.23
(73.02)
81.14
(54.35)
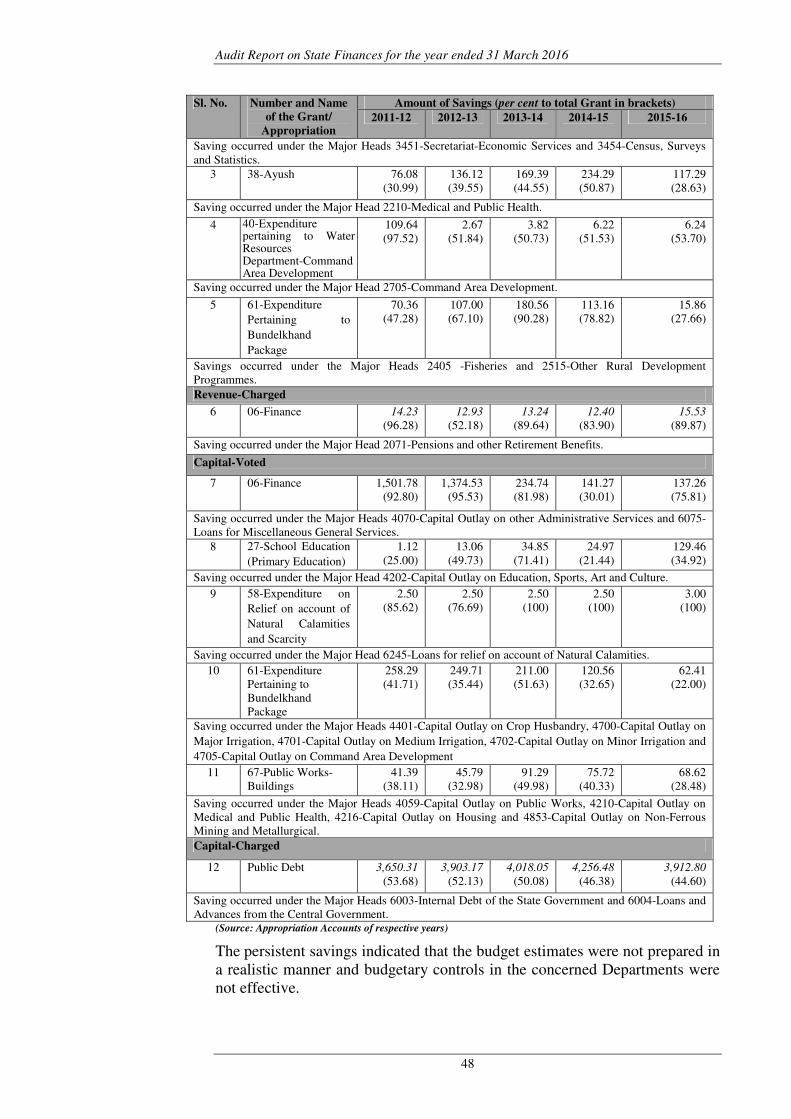
Audit Report on State Finances for the year ended 31 March 2016
48
Sl. No. Number and Name
of the Grant/
Appropriation
Amount of Savings (per cent to total Grant in brackets)
2011-12 2012-13 2013-14 2014-15 2015-16
Saving occurred under the Major Heads 3451-Secretariat-Economic Services and 3454-Census, Surveys
and Statistics.
3 38-Ayush 76.08
(30.99)
136.12
(39.55)
169.39
(44.55)
234.29
(50.87)
117.29
(28.63)
Saving occurred under the Major Head 2210-Medical and Public Health.
4 40-Expenditure pertaining to Water Resources Department-Command Area Development
109.64
(97.52)
2.67
(51.84)
3.82
(50.73)
6.22
(51.53)
6.24
(53.70)
Saving occurred under the Major Head 2705-Command Area Development.
5 61-Expenditure
Pertaining to
Bundelkhand
Package
70.36
(47.28)
107.00
(67.10)
180.56
(90.28)
113.16
(78.82)
15.86
(27.66)
Savings occurred under the Major Heads 2405 -Fisheries and 2515-Other Rural Development
Programmes.
Revenue-Charged
6 06-Finance 14.23
(96.28)
12.93
(52.18)
13.24
(89.64)
12.40
(83.90)
15.53
(89.87)
Saving occurred under the Major Head 2071-Pensions and other Retirement Benefits.
Capital-Voted
7 06-Finance 1,501.78
(92.80)
1,374.53
(95.53)
234.74
(81.98)
141.27
(30.01)
137.26
(75.81)
Saving occurred under the Major Heads 4070-Capital Outlay on other Administrative Services and 6075-
Loans for Miscellaneous General Services.
8 27-School Education
(Primary Education)
1.12
(25.00)
13.06
(49.73)
34.85
(71.41)
24.97
(21.44)
129.46
(34.92)
Saving occurred under the Major Head 4202-Capital Outlay on Education, Sports, Art and Culture.
9 58-Expenditure on
Relief on account of
Natural Calamities
and Scarcity
2.50
(85.62)
2.50
(76.69)
2.50
(100)
2.50
(100)
3.00
(100)
Saving occurred under the Major Head 6245-Loans for relief on account of Natural Calamities.
10 61-Expenditure
Pertaining to
Bundelkhand
Package
258.29
(41.71)
249.71
(35.44)
211.00
(51.63)
120.56
(32.65)
62.41
(22.00)
Saving occurred under the Major Heads 4401-Capital Outlay on Crop Husbandry, 4700-Capital Outlay on
Major Irrigation, 4701-Capital Outlay on Medium Irrigation, 4702-Capital Outlay on Minor Irrigation and
4705-Capital Outlay on Command Area Development
11 67-Public Works-
Buildings
41.39
(38.11)
45.79
(32.98)
91.29
(49.98)
75.72
(40.33)
68.62
(28.48)
Saving occurred under the Major Heads 4059-Capital Outlay on Public Works, 4210-Capital Outlay on
Medical and Public Health, 4216-Capital Outlay on Housing and 4853-Capital Outlay on Non-Ferrous
Mining and Metallurgical.
Capital-Charged
12 Public Debt 3,650.31
(53.68)
3,903.17
(52.13)
4,018.05
(50.08)
4,256.48
(46.38)
3,912.80
(44.60)
Saving occurred under the Major Heads 6003-Internal Debt of the State Government and 6004-Loans and
Advances from the Central Government. (Source: Appropriation Accounts of respective years)
The persistent savings indicated that the budget estimates were not prepared in
a realistic manner and budgetary controls in the concerned Departments were
not effective.
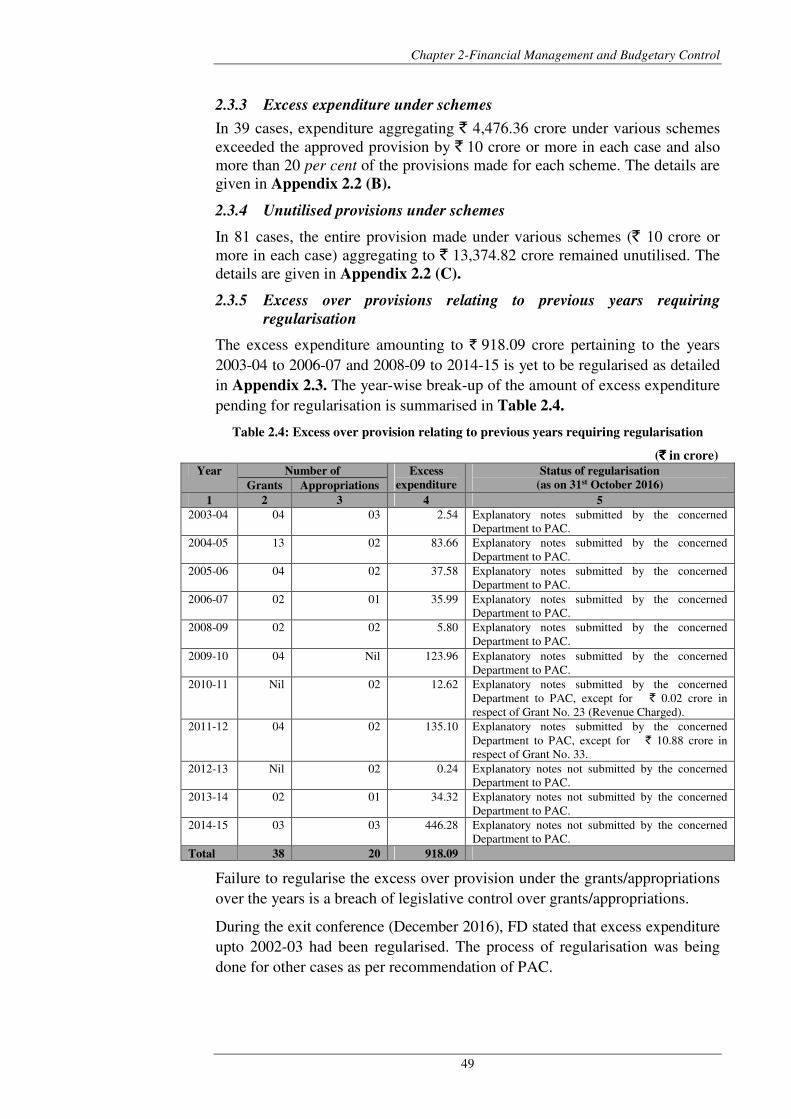
Chapter 2-Financial Management and Budgetary Control
49
2.3.3 Excess expenditure under schemes
In 39 cases, expenditure aggregating ` 4,476.36 crore under various schemes
exceeded the approved provision by ` 10 crore or more in each case and also
more than 20 per cent of the provisions made for each scheme. The details are
given in Appendix 2.2 (B).
2.3.4 Unutilised provisions under schemes
In 81 cases, the entire provision made under various schemes (` 10 crore or
more in each case) aggregating to ` 13,374.82 crore remained unutilised. The
details are given in Appendix 2.2 (C).
2.3.5 Excess over provisions relating to previous years requiring
regularisation
The excess expenditure amounting to ` 918.09 crore pertaining to the years
2003-04 to 2006-07 and 2008-09 to 2014-15 is yet to be regularised as detailed
in Appendix 2.3. The year-wise break-up of the amount of excess expenditure
pending for regularisation is summarised in Table 2.4.
Table 2.4: Excess over provision relating to previous years requiring regularisation
(`̀̀̀ in crore)
Year Number of Excess
expenditure
Status of regularisation
(as on 31st October 2016) Grants Appropriations
1 2 3 4 5
2003-04 04 03 2.54 Explanatory notes submitted by the concerned
Department to PAC.
2004-05 13 02 83.66 Explanatory notes submitted by the concerned
Department to PAC.
2005-06 04 02 37.58 Explanatory notes submitted by the concerned
Department to PAC.
2006-07 02 01 35.99 Explanatory notes submitted by the concerned
Department to PAC.
2008-09 02 02 5.80 Explanatory notes submitted by the concerned
Department to PAC.
2009-10 04 Nil 123.96 Explanatory notes submitted by the concerned
Department to PAC.
2010-11 Nil 02 12.62 Explanatory notes submitted by the concerned
Department to PAC, except for ` 0.02 crore in
respect of Grant No. 23 (Revenue Charged).
2011-12 04 02 135.10 Explanatory notes submitted by the concerned
Department to PAC, except for ` 10.88 crore in
respect of Grant No. 33.
2012-13 Nil 02 0.24 Explanatory notes not submitted by the concerned
Department to PAC.
2013-14 02 01 34.32 Explanatory notes not submitted by the concerned
Department to PAC.
2014-15 03 03 446.28 Explanatory notes not submitted by the concerned
Department to PAC.
Total 38 20 918.09
Failure to regularise the excess over provision under the grants/appropriations
over the years is a breach of legislative control over grants/appropriations.
During the exit conference (December 2016), FD stated that excess expenditure
upto 2002-03 had been regularised. The process of regularisation was being
done for other cases as per recommendation of PAC.
Audit Report on State Finances for the year ended 31 March 2016
50
The fact remains that regularisation of excess expenditure was pending over
the years.
2.3.6 Unnecessary/excessive Supplementary provision
In 54 cases of grants/appropriations, supplementary provision of ` one crore or
more in each case aggregating ` 6,089.83 crore obtained during the year proved
entirely unnecessary as the actual expenditure was less than the original
provision. Details are shown in Appendix 2.4.
In 27 cases, against the additional requirement of ` 9,945.92 crore,
supplementary provision of ` 17,980.89 crore proved excessive. The resultant
savings exceeding ` one crore or more in each case, aggregating ` 8,034.97
crore are shown in Appendix 2.5.
2.3.7 Excessive/unnecessary re-appropriation/surrender of funds
Re-appropriation is transfer of funds within a grant from one unit of
appropriation, where savings are anticipated, to another unit where additional
funds are required. We observed injudicious re-appropriations or surrenders
in 46 cases (` one crore or more in each case), which resulted in savings of more
than ` one crore in each case in respect of 12 grants (14 cases) and also excess
of more than ` one crore in each case in respect of 17 grants (32 cases), as
detailed in Appendix 2.6.
2.3.8 Anticipated savings not surrendered
According to para 26.9 of the Madhya Pradesh Budget Manual (MPBM),
statements of anticipated savings in expenditure are required to be submitted by
the Budget Controlling Officers to the Finance Department by 15th January.
At the close of the year 2015-16, there were 32 cases (in 18 grants and five appropriations) in which savings (` one crore or more in each case) occurred but no part of these was surrendered by the concerned Departments. The amount involved in these cases was ` 6,729.45 crore (16.49 per cent of the total savings of ` 40,796.27 crore) (Appendix 2.7).
In 113 cases (surrender of funds of ` 10 crore or more in each case), savings
aggregating ` 17,329.84 crore (Appendix 2.8) were surrendered on the last date
of the financial year, leaving no scope for utilising the funds for other
development purposes.
During the exit conference (December 2016), FD replied that standing
instructions were given to all Departments and the same would be reiterated.
2.3.9 Defective sanction to re-appropriation/surrender of funds
As per instructions (February 2012) of the State Government and its financial
rules, (i) all sanctions for re-appropriations/surrenders should be issued before
the end of the financial year and should be received in Accountant General
(A&E)’s office well in time for incorporation in the accounts, (ii) proper detail
of schemes should be furnished and total of sanctions should be correct (iii)
re-appropriation from one grant to another grant is not permissible (iv)
provision in concerned heads should be available from which surrenders/
re-appropriations are sanctioned.
Chapter 2-Financial Management and Budgetary Control
51
A total of 66 sanctions (under 32 Grants/Approprations) of re-appropriation or
surrender of ` 2,501.27 crore issued during the year 2015-16 in violation of
these instructions and therefore, these were not accepted by the Accountant
General (A&E) for inclusion in the accounts. Details are given in
Appendix 2.9.
2.3.10 Rush of expenditure
According to para 26.13 of the Madhya Pradesh Budget Manual (MPBM), rush
of expenditure particularly in the closing months of the financial year will
ordinarily be regarded as a financial irregularity.
We noticed that in respect of 49 cases1 of 26 grants/appropriations ` 4,497.24 crore (87 per cent of total expenditure under these grants/appropriations) was incurred during the last quarter of the financial year. Of these, expenditure of ` 4,463.11 crore was incurred in the month of March. Percentage of expenditure incurred during the month of March to total expenditure in each case ranged between 50 and 100. Details are given in Appendix 2.10. These indicated deficient financial management due to which uniform flow of expenditure was not maintained, which is a primary requirement of budgetary control.
2.3.11 Drawal of funds and parking in Civil Deposit
As per the provisions of the Madhya Pradesh Treasury Code (MPTC) Part I Subsidiary Rule 284, no money should be drawn from the treasury unless it is required for immediate disbursement.
During 2015-16, a sum of ` 54.01 crore was drawn on 31 March 2016 and transferred to 8443-Civil Deposits-800-Other Deposits by showing the amounts as final expenditure under the relevant schemes in the accounts, as shown in Appendix 2.11. Thus, funds were drawn in excess of requirement and to avoid lapse of funds, which was contrary to the codal provision.
During the exit conference (December 2016), FD stated that parking of funds in Civil Deposit had been discouraged. Transfer to Public Account from Consolidated Fund was done in exceptional cases only.
The reply is not acceptable as the funds were credited to Civil Deposit heads on 31 March 2016 to avoid lapse of funds.
2.3.12 Expenditure incurred without provision
We observed that expenditure of ` 0.20 lakh was incurred under the head ‘6003-101-002-11.00 per cent Madhya Pradesh State Development Loan, 2001’ and ` 0.29 lakh under the head ‘6003-101-8134-11.50 per cent Madhya Pradesh State Development Loan, 2011’ (under Charged Appropriation - Public Debt) without any provision in the budget estimates. Reason for expenditure under these heads without any provision was not intimated (November 2016).
2.3.13 Unrealistic Budget Estimates
As per para B-7 and 8 of MP Government Budget Manual Vol-I (Part-B), all Budget Controlling Officers (BCOs) are responsible for collating estimates of expenditure and receipts prepared by the Drawing and Disbursement Officer (DDOs) under them as well as for preparing estimates of off budget funds likely to be received for departmental schemes during the ensuing financial year.
1 Where expenditure during last quarter exceeded ` 10 crore.
Audit Report on State Finances for the year ended 31 March 2016
52
BCOs should collate all estimates prepared by DDOs and review the same for finalisation of estimates of expenditure and receipts.
During scrutiny of Appropriation Accounts, we observed that in the year 2013-14, 2014-15 and 2015-16, budget provisions of ` 2,259.38 crore, ` 2,210.35 crore and ` 2,134.24 crore respectively were made under seven schemes (where savings were more than ` one crore in each case) which remained entirely unutilised. It indicates that budget provisions were prepared on ad hoc basis without assessing the actual requirement. The details are given in Appendix 2.12.
2.3.14 Misclassification of Budget provision under Revenue Section and
Capital Section
Indian Government Accounting Standard (IGAS)-2 regarding accounting and
classification of Grants-in-aid prescribes that the Grants-in-aid disbursed by a
grantor shall be classified and accounted for as revenue expenditure in the
Financial Statements of the grantor irrespective of the purpose for which the
funds were disbursed. Only in cases specifically authorised by the President of
India on the advice of the Comptroller and Auditor General of India, these can
be debited to a capital head of account in the Financial Statements of the
Government.
Audit observed that Grants-in-aid of ` 370.59 crore in three major heads were
misclassified under Capital Expenditure.
Further, as per Rule 30 (1) of Government Accounting Rule, 1990, the
expenditure of a capital nature shall broadly be defined as expenditure incurred
with the object of increasing concrete assets of a material and permanent
character. Expenditure of a capital nature shall be distinguished from revenue
expendiutre in Government Accounts.
Audit observed that ` 39.86 crore towards Maintenance were misclassified
under Capital Expenditure in four major heads where budget provision was
` one crore or more in each case. The details are given in Appendix 2.13 (A).
Further, an amount of ` 678.92 crore towards Machinery in 19 major heads and
` 3.17 crore towards Major Works in two major heads were misclassified under
Revenue Expenditure, where budget provision was ` one crore or more in each
case. The details are given in Appendix 2.13 (B).
2.3.15 Non-surrender of savings of budget allotment for District Poverty Initiatives Project (DPIP)
As per istructions laid down in Para 8.3.10 of Madhya Pradesh Budget Manual,
BCOs are required to surrender appropriations or portions of grants placed at
their disposal which are not likely to be required during the year as soon as
lapses on savings are foreseen. All the savings anticipated by the BCO should
be reported with full details along with reasons to the Finance Department
immediately as soon as they are foreseen, unless these are required to meet the
anticipated additional requirements of funds under some other head of same
grant.
Audit observed that under Grant No. 59-Externally Aided Projects pertaining to
Rural Development Department, under Grant No. 41-Tribal Areas Sub-Plan and
64-Scheduled Castes Sub-Plan ` 10 crore, ` 11.20 crore and ` nine crore were
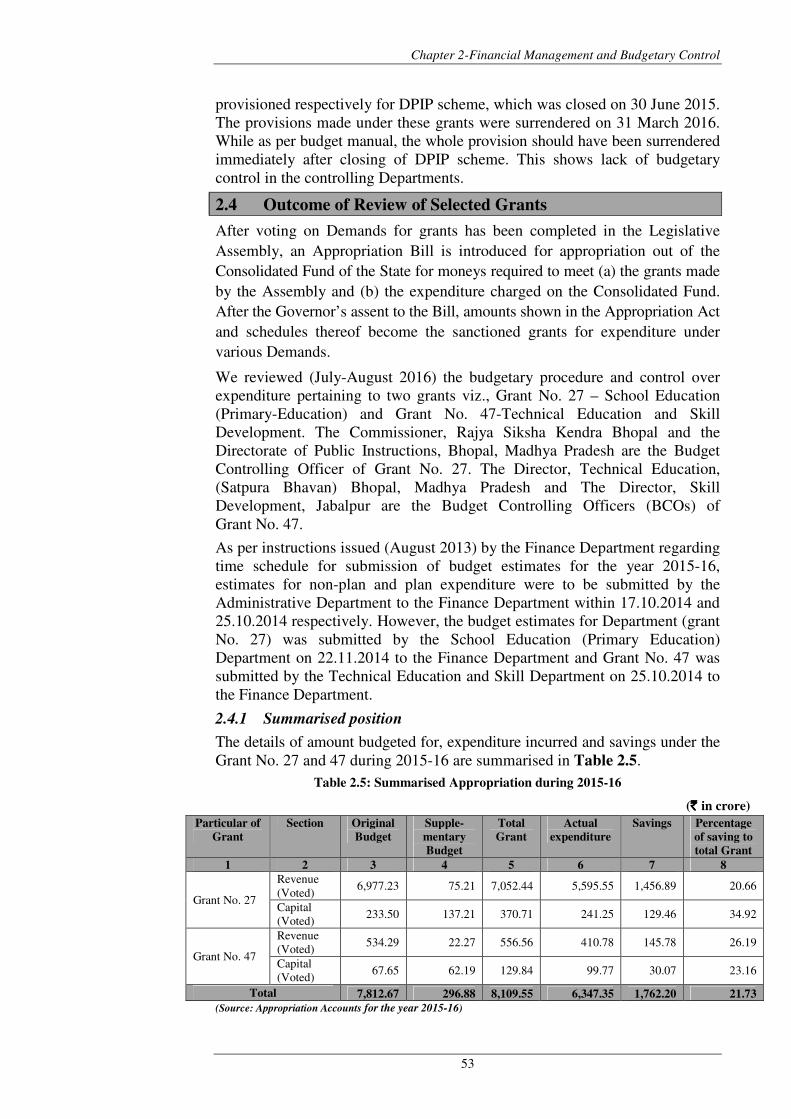
Chapter 2-Financial Management and Budgetary Control
53
provisioned respectively for DPIP scheme, which was closed on 30 June 2015.
The provisions made under these grants were surrendered on 31 March 2016.
While as per budget manual, the whole provision should have been surrendered
immediately after closing of DPIP scheme. This shows lack of budgetary
control in the controlling Departments.
2.4 Outcome of Review of Selected Grants
After voting on Demands for grants has been completed in the Legislative
Assembly, an Appropriation Bill is introduced for appropriation out of the
Consolidated Fund of the State for moneys required to meet (a) the grants made
by the Assembly and (b) the expenditure charged on the Consolidated Fund.
After the Governor’s assent to the Bill, amounts shown in the Appropriation Act
and schedules thereof become the sanctioned grants for expenditure under
various Demands.
We reviewed (July-August 2016) the budgetary procedure and control over
expenditure pertaining to two grants viz., Grant No. 27 – School Education
(Primary-Education) and Grant No. 47-Technical Education and Skill
Development. The Commissioner, Rajya Siksha Kendra Bhopal and the
Directorate of Public Instructions, Bhopal, Madhya Pradesh are the Budget
Controlling Officer of Grant No. 27. The Director, Technical Education,
(Satpura Bhavan) Bhopal, Madhya Pradesh and The Director, Skill
Development, Jabalpur are the Budget Controlling Officers (BCOs) of
Grant No. 47.
As per instructions issued (August 2013) by the Finance Department regarding
time schedule for submission of budget estimates for the year 2015-16,
estimates for non-plan and plan expenditure were to be submitted by the
Administrative Department to the Finance Department within 17.10.2014 and
25.10.2014 respectively. However, the budget estimates for Department (grant
No. 27) was submitted by the School Education (Primary Education)
Department on 22.11.2014 to the Finance Department and Grant No. 47 was
submitted by the Technical Education and Skill Department on 25.10.2014 to
the Finance Department.
2.4.1 Summarised position
The details of amount budgeted for, expenditure incurred and savings under the
Grant No. 27 and 47 during 2015-16 are summarised in Table 2.5.
Table 2.5: Summarised Appropriation during 2015-16
(`̀̀̀ in crore)
(Source: Appropriation Accounts for the year 2015-16)
Particular of
Grant
Section Original
Budget
Supple-
mentary
Budget
Total
Grant
Actual
expenditure
Savings Percentage
of saving to
total Grant
1 2 3 4 5 6 7 8
Grant No. 27
Revenue
(Voted) 6,977.23 75.21 7,052.44 5,595.55 1,456.89 20.66
Capital
(Voted) 233.50 137.21 370.71 241.25 129.46 34.92
Grant No. 47
Revenue
(Voted) 534.29 22.27 556.56 410.78 145.78 26.19
Capital
(Voted) 67.65 62.19 129.84 99.77 30.07 23.16
Total 7,812.67 296.88 8,109.55 6,347.35 1,762.20 21.73
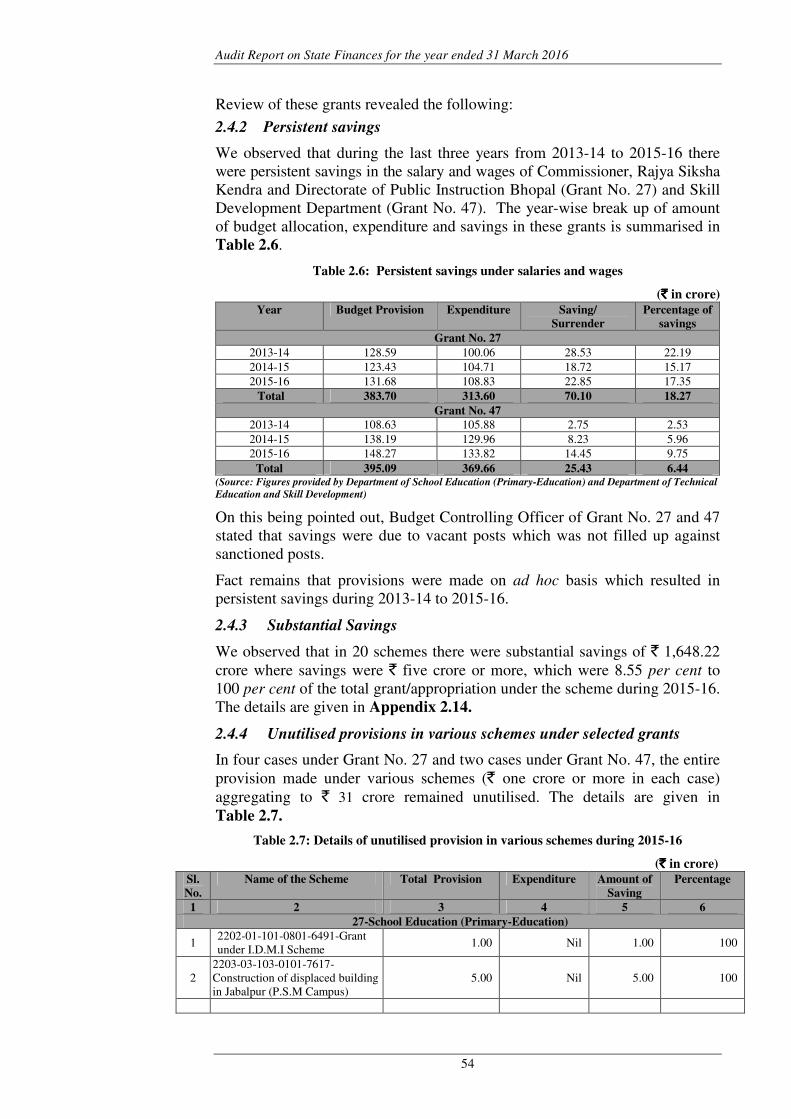
Audit Report on State Finances for the year ended 31 March 2016
54
Review of these grants revealed the following:
2.4.2 Persistent savings
We observed that during the last three years from 2013-14 to 2015-16 there
were persistent savings in the salary and wages of Commissioner, Rajya Siksha
Kendra and Directorate of Public Instruction Bhopal (Grant No. 27) and Skill
Development Department (Grant No. 47). The year-wise break up of amount
of budget allocation, expenditure and savings in these grants is summarised in
Table 2.6.
Table 2.6: Persistent savings under salaries and wages
(`̀̀̀ in crore)
Year Budget Provision Expenditure Saving/
Surrender
Percentage of
savings
Grant No. 27
2013-14 128.59 100.06 28.53 22.19
2014-15 123.43 104.71 18.72 15.17
2015-16 131.68 108.83 22.85 17.35
Total 383.70 313.60 70.10 18.27
Grant No. 47
2013-14 108.63 105.88 2.75 2.53
2014-15 138.19 129.96 8.23 5.96
2015-16 148.27 133.82 14.45 9.75
Total 395.09 369.66 25.43 6.44 (Source: Figures provided by Department of School Education (Primary-Education) and Department of Technical
Education and Skill Development)
On this being pointed out, Budget Controlling Officer of Grant No. 27 and 47
stated that savings were due to vacant posts which was not filled up against
sanctioned posts.
Fact remains that provisions were made on ad hoc basis which resulted in
persistent savings during 2013-14 to 2015-16.
2.4.3 Substantial Savings
We observed that in 20 schemes there were substantial savings of ` 1,648.22
crore where savings were ` five crore or more, which were 8.55 per cent to
100 per cent of the total grant/appropriation under the scheme during 2015-16.
The details are given in Appendix 2.14.
2.4.4 Unutilised provisions in various schemes under selected grants
In four cases under Grant No. 27 and two cases under Grant No. 47, the entire
provision made under various schemes (` one crore or more in each case)
aggregating to ` 31 crore remained unutilised. The details are given in
Table 2.7.
Table 2.7: Details of unutilised provision in various schemes during 2015-16
(`̀̀̀ in crore)
Sl.
No.
Name of the Scheme Total Provision Expenditure Amount of
Saving
Percentage
1 2 3 4 5 6
27-School Education (Primary-Education)
1 2202-01-101-0801-6491-Grant
under I.D.M.I Scheme 1.00 Nil 1.00 100
2
2203-03-103-0101-7617-
Construction of displaced building
in Jabalpur (P.S.M Campus)
5.00 Nil 5.00 100
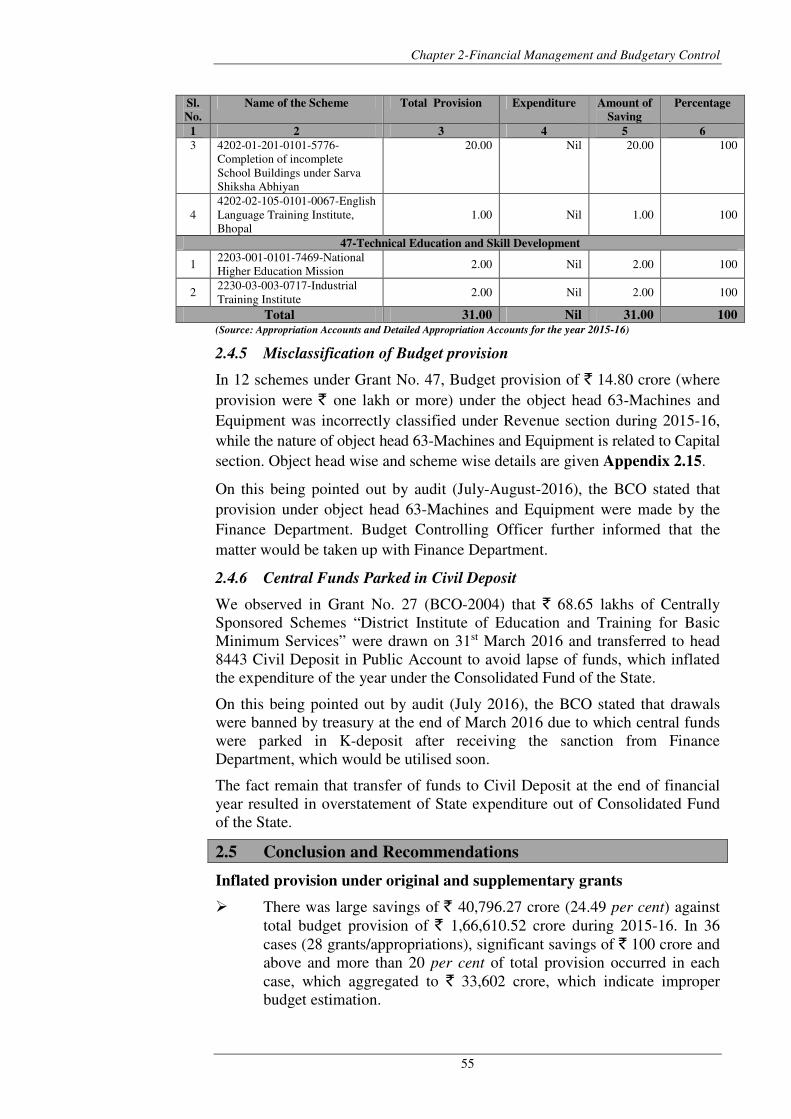
Chapter 2-Financial Management and Budgetary Control
55
Sl.
No.
Name of the Scheme Total Provision Expenditure Amount of
Saving
Percentage
1 2 3 4 5 6
3 4202-01-201-0101-5776-
Completion of incomplete
School Buildings under Sarva
Shiksha Abhiyan
20.00 Nil 20.00 100
4
4202-02-105-0101-0067-English
Language Training Institute,
Bhopal
1.00 Nil 1.00 100
47-Technical Education and Skill Development
1 2203-001-0101-7469-National
Higher Education Mission 2.00 Nil 2.00 100
2 2230-03-003-0717-Industrial
Training Institute 2.00 Nil 2.00 100
Total 31.00 Nil 31.00 100 (Source: Appropriation Accounts and Detailed Appropriation Accounts for the year 2015-16)
2.4.5 Misclassification of Budget provision
In 12 schemes under Grant No. 47, Budget provision of ` 14.80 crore (where
provision were ` one lakh or more) under the object head 63-Machines and
Equipment was incorrectly classified under Revenue section during 2015-16,
while the nature of object head 63-Machines and Equipment is related to Capital
section. Object head wise and scheme wise details are given Appendix 2.15.
On this being pointed out by audit (July-August-2016), the BCO stated that
provision under object head 63-Machines and Equipment were made by the
Finance Department. Budget Controlling Officer further informed that the
matter would be taken up with Finance Department.
2.4.6 Central Funds Parked in Civil Deposit
We observed in Grant No. 27 (BCO-2004) that ` 68.65 lakhs of Centrally
Sponsored Schemes “District Institute of Education and Training for Basic
Minimum Services” were drawn on 31st March 2016 and transferred to head
8443 Civil Deposit in Public Account to avoid lapse of funds, which inflated
the expenditure of the year under the Consolidated Fund of the State.
On this being pointed out by audit (July 2016), the BCO stated that drawals
were banned by treasury at the end of March 2016 due to which central funds
were parked in K-deposit after receiving the sanction from Finance
Department, which would be utilised soon.
The fact remain that transfer of funds to Civil Deposit at the end of financial
year resulted in overstatement of State expenditure out of Consolidated Fund
of the State.
2.5 Conclusion and Recommendations
Inflated provision under original and supplementary grants
� There was large savings of ` 40,796.27 crore (24.49 per cent) against
total budget provision of ` 1,66,610.52 crore during 2015-16. In 36
cases (28 grants/appropriations), significant savings of ` 100 crore and
above and more than 20 per cent of total provision occurred in each
case, which aggregated to ` 33,602 crore, which indicate improper
budget estimation.
Audit Report on State Finances for the year ended 31 March 2016
56
Budgetary control mechanism should be strengthened in the
Government Departments by proper monitoring of expenditure.
Unnecessary provision of Supplementary grant should be avoided.
Failure to surrender/delayed surrender of savings
� Only 47.70 per cent (` 19,459 crore) of total savings were surrendered
during the year. In 113 cases, savings of ` 17,330 crore (` 10 crore or
more in each case) were surrendered on the last day of the financial year,
leaving no scope for utilising the funds for other development
purposes.
All anticipated savings should be surrendered on time so that the funds
can be utilised for other development purposes.
Excess expenditure requiring regularisation
� Excess expenditure of ` 918.09 crore pertaining to 38 grants and
20 appropriations of previous years requires regularisation under
Article 205 of the Constitution.
Regularisation of excess expenditure pending since 2003-04 may be
done on priority basis.
Funds transferred from Consolidated Fund of the State for parking in
Civil Deposit
� Funds of ` 54.01 crore drawn on 31 March 2016 was transferred from
Consolidated Fund of the State to Civil Deposits in Public Account to
avoid lapse of funds, which inflated the expenditure of the year under
the Consolidated Fund of the State.
Transfer of unutilised funds from Consolidate Fund of the State to
Civil Deposit at the end of financial year results in overstatement of
State expenditure and should be avoided.
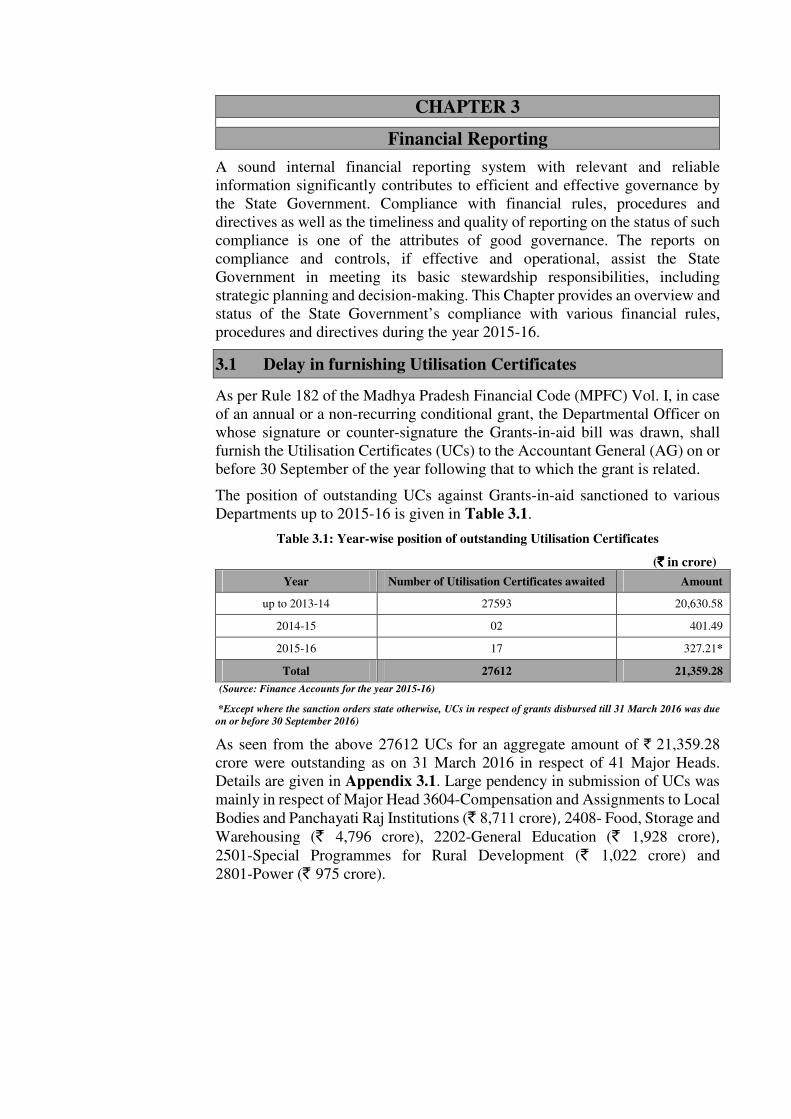
CHAPTER 3
Financial Reporting
A sound internal financial reporting system with relevant and reliable
information significantly contributes to efficient and effective governance by
the State Government. Compliance with financial rules, procedures and
directives as well as the timeliness and quality of reporting on the status of such
compliance is one of the attributes of good governance. The reports on
compliance and controls, if effective and operational, assist the State
Government in meeting its basic stewardship responsibilities, including
strategic planning and decision-making. This Chapter provides an overview and
status of the State Government’s compliance with various financial rules,
procedures and directives during the year 2015-16.
3.1 Delay in furnishing Utilisation Certificates
As per Rule 182 of the Madhya Pradesh Financial Code (MPFC) Vol. I, in case
of an annual or a non-recurring conditional grant, the Departmental Officer on
whose signature or counter-signature the Grants-in-aid bill was drawn, shall
furnish the Utilisation Certificates (UCs) to the Accountant General (AG) on or
before 30 September of the year following that to which the grant is related.
The position of outstanding UCs against Grants-in-aid sanctioned to various
Departments up to 2015-16 is given in Table 3.1.
Table 3.1: Year-wise position of outstanding Utilisation Certificates
(`̀̀̀ in crore)
Year Number of Utilisation Certificates awaited Amount
up to 2013-14 27593 20,630.58
2014-15 02 401.49
2015-16 17 327.21*
Total 27612 21,359.28
(Source: Finance Accounts for the year 2015-16)
*Except where the sanction orders state otherwise, UCs in respect of grants disbursed till 31 March 2016 was due
on or before 30 September 2016)
As seen from the above 27612 UCs for an aggregate amount of ` 21,359.28
crore were outstanding as on 31 March 2016 in respect of 41 Major Heads.
Details are given in Appendix 3.1. Large pendency in submission of UCs was
mainly in respect of Major Head 3604-Compensation and Assignments to Local
Bodies and Panchayati Raj Institutions (` 8,711 crore), 2408- Food, Storage and
Warehousing (` 4,796 crore), 2202-General Education (` 1,928 crore),
2501-Special Programmes for Rural Development (` 1,022 crore) and
2801-Power (` 975 crore).
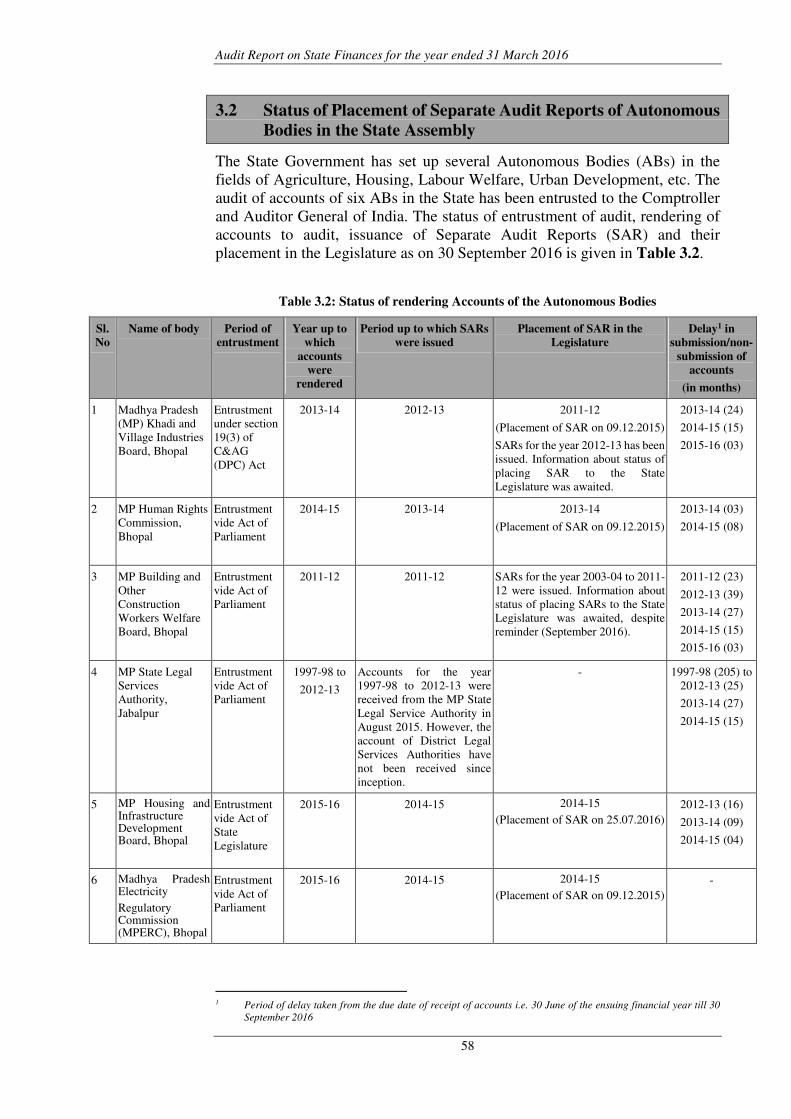
Audit Report on State Finances for the year ended 31 March 2016
58
3.2 Status of Placement of Separate Audit Reports of Autonomous
Bodies in the State Assembly
The State Government has set up several Autonomous Bodies (ABs) in the
fields of Agriculture, Housing, Labour Welfare, Urban Development, etc. The
audit of accounts of six ABs in the State has been entrusted to the Comptroller
and Auditor General of India. The status of entrustment of audit, rendering of
accounts to audit, issuance of Separate Audit Reports (SAR) and their
placement in the Legislature as on 30 September 2016 is given in Table 3.2.
Table 3.2: Status of rendering Accounts of the Autonomous Bodies
Sl.
No
Name of body Period of
entrustment
Year up to
which
accounts
were
rendered
Period up to which SARs
were issued
Placement of SAR in the
Legislature
Delay1 in
submission/non-
submission of
accounts
(in months)
1 Madhya Pradesh
(MP) Khadi and
Village Industries
Board, Bhopal
Entrustment
under section
19(3) of
C&AG
(DPC) Act
2013-14 2012-13 2011-12
(Placement of SAR on 09.12.2015)
SARs for the year 2012-13 has been
issued. Information about status of
placing SAR to the State
Legislature was awaited.
2013-14 (24)
2014-15 (15)
2015-16 (03)
2 MP Human Rights
Commission,
Bhopal
Entrustment
vide Act of
Parliament
2014-15 2013-14 2013-14
(Placement of SAR on 09.12.2015)
2013-14 (03)
2014-15 (08)
3 MP Building and
Other
Construction
Workers Welfare
Board, Bhopal
Entrustment
vide Act of
Parliament
2011-12 2011-12 SARs for the year 2003-04 to 2011-
12 were issued. Information about
status of placing SARs to the State
Legislature was awaited, despite
reminder (September 2016).
2011-12 (23)
2012-13 (39)
2013-14 (27)
2014-15 (15)
2015-16 (03)
4 MP State Legal
Services
Authority,
Jabalpur
Entrustment
vide Act of
Parliament
1997-98 to
2012-13
Accounts for the year
1997-98 to 2012-13 were
received from the MP State
Legal Service Authority in
August 2015. However, the
account of District Legal
Services Authorities have
not been received since
inception.
- 1997-98 (205) to
2012-13 (25)
2013-14 (27)
2014-15 (15)
5 MP Housing and Infrastructure Development Board, Bhopal
Entrustment
vide Act of
State
Legislature
2015-16 2014-15 2014-15
(Placement of SAR on 25.07.2016)
2012-13 (16)
2013-14 (09)
2014-15 (04)
6 Madhya Pradesh Electricity
Regulatory Commission (MPERC), Bhopal
Entrustment
vide Act of
Parliament
2015-16 2014-15 2014-15
(Placement of SAR on 09.12.2015)
-
1 Period of delay taken from the due date of receipt of accounts i.e. 30 June of the ensuing financial year till 30
September 2016
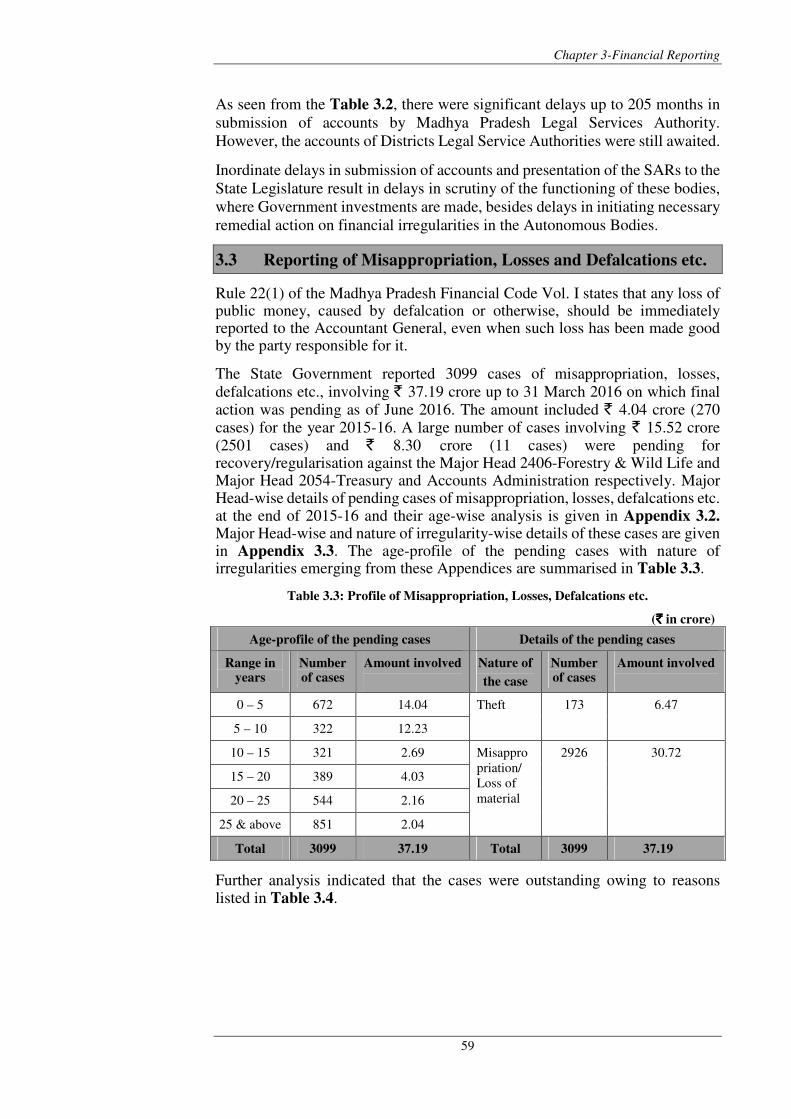
Chapter 3-Financial Reporting
59
As seen from the Table 3.2, there were significant delays up to 205 months in
submission of accounts by Madhya Pradesh Legal Services Authority.
However, the accounts of Districts Legal Service Authorities were still awaited.
Inordinate delays in submission of accounts and presentation of the SARs to the
State Legislature result in delays in scrutiny of the functioning of these bodies,
where Government investments are made, besides delays in initiating necessary
remedial action on financial irregularities in the Autonomous Bodies.
3.3 Reporting of Misappropriation, Losses and Defalcations etc.
Rule 22(1) of the Madhya Pradesh Financial Code Vol. I states that any loss of public money, caused by defalcation or otherwise, should be immediately reported to the Accountant General, even when such loss has been made good by the party responsible for it.
The State Government reported 3099 cases of misappropriation, losses, defalcations etc., involving ` 37.19 crore up to 31 March 2016 on which final action was pending as of June 2016. The amount included ` 4.04 crore (270 cases) for the year 2015-16. A large number of cases involving ` 15.52 crore (2501 cases) and ` 8.30 crore (11 cases) were pending for recovery/regularisation against the Major Head 2406-Forestry & Wild Life and Major Head 2054-Treasury and Accounts Administration respectively. Major Head-wise details of pending cases of misappropriation, losses, defalcations etc. at the end of 2015-16 and their age-wise analysis is given in Appendix 3.2. Major Head-wise and nature of irregularity-wise details of these cases are given in Appendix 3.3. The age-profile of the pending cases with nature of irregularities emerging from these Appendices are summarised in Table 3.3.
Table 3.3: Profile of Misappropriation, Losses, Defalcations etc.
(`̀̀̀ in crore)
Age-profile of the pending cases Details of the pending cases
Range in years
Number of cases
Amount involved
Nature of
the case
Number of cases
Amount involved
0 – 5 672 14.04 Theft 173 6.47
5 – 10 322 12.23
10 – 15 321 2.69 Misappro
priation/
Loss of
material
2926 30.72
15 – 20 389 4.03
20 – 25 544 2.16
25 & above 851 2.04
Total 3099 37.19 Total 3099 37.19
Further analysis indicated that the cases were outstanding owing to reasons listed in Table 3.4.
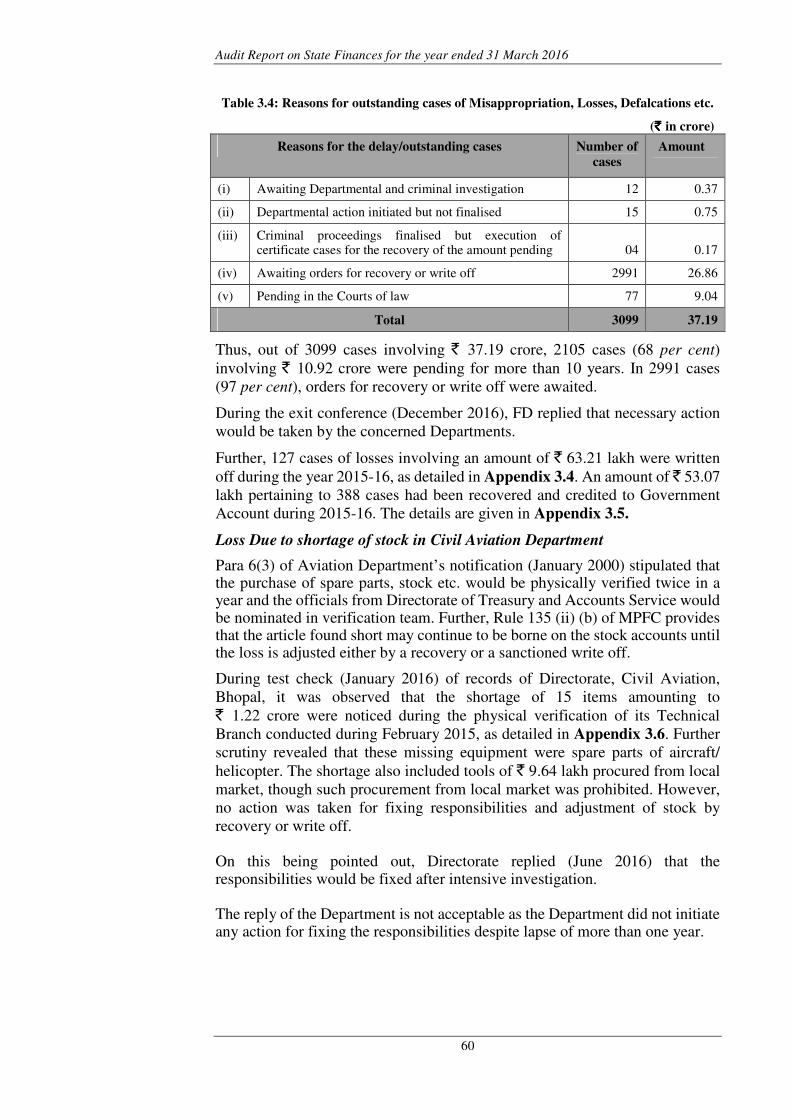
Audit Report on State Finances for the year ended 31 March 2016
60
Table 3.4: Reasons for outstanding cases of Misappropriation, Losses, Defalcations etc.
(` ` ` ` in crore)
Reasons for the delay/outstanding cases Number of
cases
Amount
(i) Awaiting Departmental and criminal investigation 12 0.37
(ii) Departmental action initiated but not finalised 15 0.75
(iii) Criminal proceedings finalised but execution of certificate cases for the recovery of the amount pending 04 0.17
(iv) Awaiting orders for recovery or write off 2991 26.86
(v) Pending in the Courts of law 77 9.04
Total 3099 37.19
Thus, out of 3099 cases involving ` 37.19 crore, 2105 cases (68 per cent)
involving ` 10.92 crore were pending for more than 10 years. In 2991 cases
(97 per cent), orders for recovery or write off were awaited.
During the exit conference (December 2016), FD replied that necessary action
would be taken by the concerned Departments.
Further, 127 cases of losses involving an amount of ` 63.21 lakh were written
off during the year 2015-16, as detailed in Appendix 3.4. An amount of ` 53.07
lakh pertaining to 388 cases had been recovered and credited to Government
Account during 2015-16. The details are given in Appendix 3.5.
Loss Due to shortage of stock in Civil Aviation Department
Para 6(3) of Aviation Department’s notification (January 2000) stipulated that the purchase of spare parts, stock etc. would be physically verified twice in a year and the officials from Directorate of Treasury and Accounts Service would be nominated in verification team. Further, Rule 135 (ii) (b) of MPFC provides that the article found short may continue to be borne on the stock accounts until the loss is adjusted either by a recovery or a sanctioned write off.
During test check (January 2016) of records of Directorate, Civil Aviation,
Bhopal, it was observed that the shortage of 15 items amounting to
` 1.22 crore were noticed during the physical verification of its Technical
Branch conducted during February 2015, as detailed in Appendix 3.6. Further
scrutiny revealed that these missing equipment were spare parts of aircraft/
helicopter. The shortage also included tools of ` 9.64 lakh procured from local
market, though such procurement from local market was prohibited. However,
no action was taken for fixing responsibilities and adjustment of stock by
recovery or write off.
On this being pointed out, Directorate replied (June 2016) that the responsibilities would be fixed after intensive investigation.
The reply of the Department is not acceptable as the Department did not initiate any action for fixing the responsibilities despite lapse of more than one year.
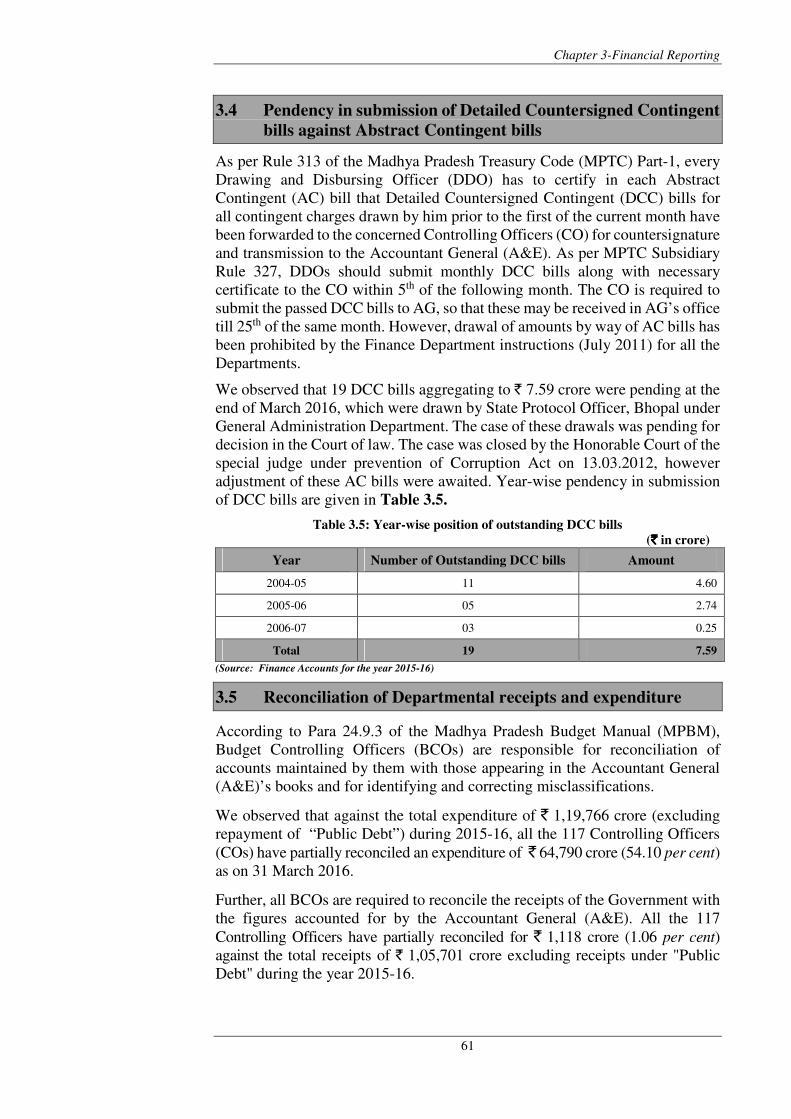
Chapter 3-Financial Reporting
61
3.4 Pendency in submission of Detailed Countersigned Contingent
bills against Abstract Contingent bills
As per Rule 313 of the Madhya Pradesh Treasury Code (MPTC) Part-1, every
Drawing and Disbursing Officer (DDO) has to certify in each Abstract
Contingent (AC) bill that Detailed Countersigned Contingent (DCC) bills for
all contingent charges drawn by him prior to the first of the current month have
been forwarded to the concerned Controlling Officers (CO) for countersignature
and transmission to the Accountant General (A&E). As per MPTC Subsidiary
Rule 327, DDOs should submit monthly DCC bills along with necessary
certificate to the CO within 5th of the following month. The CO is required to
submit the passed DCC bills to AG, so that these may be received in AG’s office
till 25th of the same month. However, drawal of amounts by way of AC bills has
been prohibited by the Finance Department instructions (July 2011) for all the
Departments.
We observed that 19 DCC bills aggregating to ` 7.59 crore were pending at the
end of March 2016, which were drawn by State Protocol Officer, Bhopal under
General Administration Department. The case of these drawals was pending for
decision in the Court of law. The case was closed by the Honorable Court of the
special judge under prevention of Corruption Act on 13.03.2012, however
adjustment of these AC bills were awaited. Year-wise pendency in submission
of DCC bills are given in Table 3.5.
Table 3.5: Year-wise position of outstanding DCC bills (`̀̀̀ in crore)
Year Number of Outstanding DCC bills Amount
2004-05 11 4.60
2005-06 05 2.74
2006-07 03 0.25
Total 19 7.59
(Source: Finance Accounts for the year 2015-16)
3.5 Reconciliation of Departmental receipts and expenditure
According to Para 24.9.3 of the Madhya Pradesh Budget Manual (MPBM),
Budget Controlling Officers (BCOs) are responsible for reconciliation of
accounts maintained by them with those appearing in the Accountant General
(A&E)’s books and for identifying and correcting misclassifications.
We observed that against the total expenditure of ` 1,19,766 crore (excluding
repayment of “Public Debt”) during 2015-16, all the 117 Controlling Officers
(COs) have partially reconciled an expenditure of ̀ 64,790 crore (54.10 per cent)
as on 31 March 2016.
Further, all BCOs are required to reconcile the receipts of the Government with
the figures accounted for by the Accountant General (A&E). All the 117
Controlling Officers have partially reconciled for ` 1,118 crore (1.06 per cent)
against the total receipts of ` 1,05,701 crore excluding receipts under "Public
Debt" during the year 2015-16.
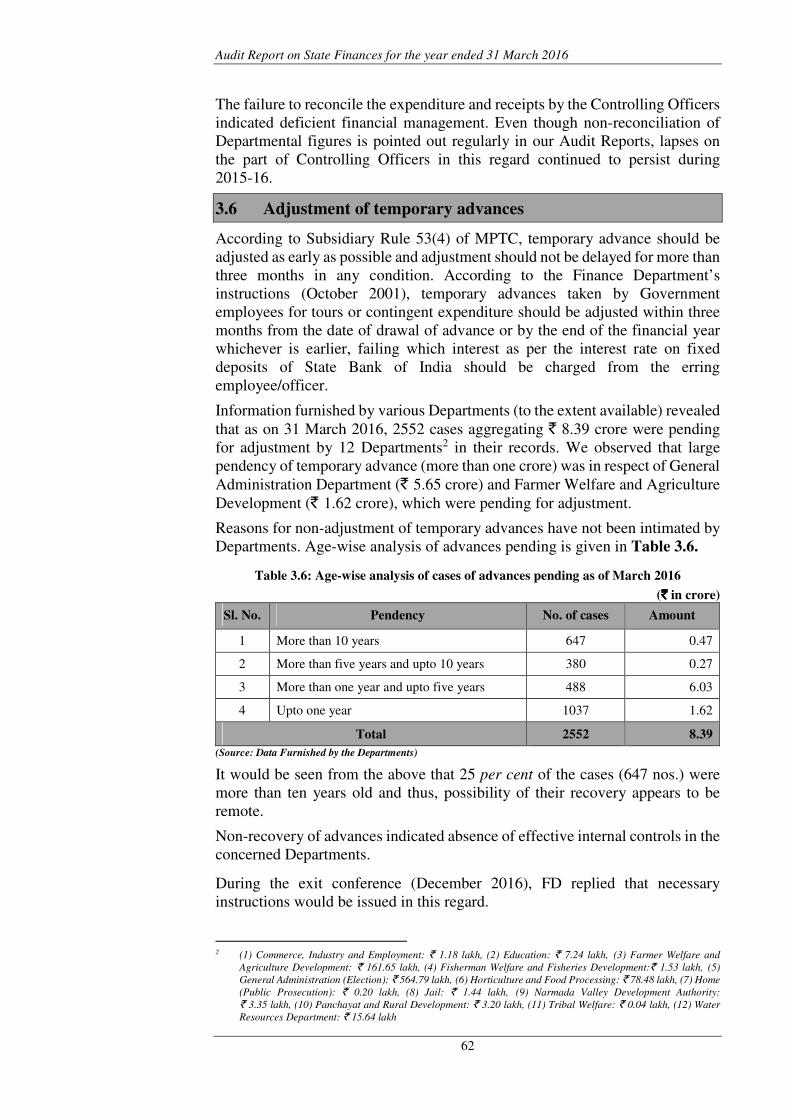
Audit Report on State Finances for the year ended 31 March 2016
62
The failure to reconcile the expenditure and receipts by the Controlling Officers
indicated deficient financial management. Even though non-reconciliation of
Departmental figures is pointed out regularly in our Audit Reports, lapses on
the part of Controlling Officers in this regard continued to persist during
2015-16.
3.6 Adjustment of temporary advances
According to Subsidiary Rule 53(4) of MPTC, temporary advance should be
adjusted as early as possible and adjustment should not be delayed for more than
three months in any condition. According to the Finance Department’s
instructions (October 2001), temporary advances taken by Government
employees for tours or contingent expenditure should be adjusted within three
months from the date of drawal of advance or by the end of the financial year
whichever is earlier, failing which interest as per the interest rate on fixed
deposits of State Bank of India should be charged from the erring
employee/officer.
Information furnished by various Departments (to the extent available) revealed
that as on 31 March 2016, 2552 cases aggregating ` 8.39 crore were pending
for adjustment by 12 Departments2 in their records. We observed that large
pendency of temporary advance (more than one crore) was in respect of General
Administration Department (` 5.65 crore) and Farmer Welfare and Agriculture
Development (` 1.62 crore), which were pending for adjustment.
Reasons for non-adjustment of temporary advances have not been intimated by
Departments. Age-wise analysis of advances pending is given in Table 3.6.
Table 3.6: Age-wise analysis of cases of advances pending as of March 2016
(`̀̀̀ in crore)
Sl. No. Pendency No. of cases Amount
1 More than 10 years 647 0.47
2 More than five years and upto 10 years 380 0.27
3 More than one year and upto five years 488 6.03
4 Upto one year 1037 1.62
Total 2552 8.39
(Source: Data Furnished by the Departments)
It would be seen from the above that 25 per cent of the cases (647 nos.) were
more than ten years old and thus, possibility of their recovery appears to be
remote.
Non-recovery of advances indicated absence of effective internal controls in the
concerned Departments.
During the exit conference (December 2016), FD replied that necessary
instructions would be issued in this regard.
2 (1) Commerce, Industry and Employment: ` 1.18 lakh, (2) Education: ` 7.24 lakh, (3) Farmer Welfare and
Agriculture Development: ` 161.65 lakh, (4) Fisherman Welfare and Fisheries Development:` 1.53 lakh, (5)
General Administration (Election): ` 564.79 lakh, (6) Horticulture and Food Processing: ` 78.48 lakh, (7) Home
(Public Prosecution): ` 0.20 lakh, (8) Jail: ` 1.44 lakh, (9) Narmada Valley Development Authority:
` 3.35 lakh, (10) Panchayat and Rural Development: ` 3.20 lakh, (11) Tribal Welfare: ` 0.04 lakh, (12) Water
Resources Department: ` 15.64 lakh
Chapter 3-Financial Reporting
63
3.7 Opaqueness in Government Accounts
Since most of the government activities are well defined in the list of Major and
Minor Heads of Accounts of Union and States, issued by the Controller General
of Accounts, and also provided in para 8.3.5(vi) of MP Budget Manual, the
Budget Controlling Officers are to ensure that operation of the minor head
‘800-Other Receipts/ Expenditure’ should be minimised.
Scrutiny of Finance Accounts 2015-16 disclosed that expenditure of
` 17,669.83 crore, consisting 15.15 per cent of total expenditure of
` 1,16,606.17 crore under revenue and capital major heads was classified under
the minor head ‘800-Other Expenditure’.
We also observed that under 37 major heads of accounts (revenue and capital),
substantial portion (10 per cent or more) of an amount of ` 16,148.78 crore,
which constituted 53.93 per cent of total expenditure of ̀ 29,942.10 crore under
these major heads, were classified under the minor head of accounts ‘800-Other
Expenditure’. Such expenditure ranged between 11 per cent and 100 per cent
of total expenditure under the respective major heads, as detailed in
Appendix 3.7.
Similarly, revenue receipts of ` 11,890.88 crore, constituting 11.27 per cent of
the total revenue receipts (` 1,05,510.60 crore) recorded under the respective
major heads, were classified under the minor head ‘800-Other Receipts’. Under
30 revenue receipt major heads of accounts, substantial portion (10 per cent or
more) of an amount of ` 11,747.50 crore, which constituted 60.31 per cent of
total receipts (` 19,477.79 crore) under these major heads, were classified under
‘800-Other Receipts’. The booking under minor head ‘800-Other Receipts’ in
these cases ranged between 10 and 100 per cent of total revenue receipts under
the respective major heads. Details are given in Appendix 3.8.
Large amounts booked under the minor head ‘800-Other Receipts’ and
‘800-Other Expenditure’ affects the transparency in financial reporting as it fails
to indicate disaggregated information on different activities of the Government
separately in the accounts.
3.8 Payment of Previous year’s liabilities from the next year’s
Budget
Subsidiary rule 283 of MPTC provides that all charges actually incurred must be drawn and paid at once, and under no circumstances they be allowed to stand over to be paid from the grant of another year. To the extent possible, expenditure should be postponed till the sanction of new budget, but on no account the charge be incurred in one year and thrown on the grant of another year.
Test check of records of Office of the Superintendent of Police (Radio), Bhopal
(July 2016) revealed that the Department purchased CCTVs and Digital Radio
Tracking System (on turnkey basis), Data SIMs and other equipment costing
` 36.94 crore for Shinmhast 2016 from seven firms during the financial year
2015-16. However, despite availability of budget, the balance payment of
` 28.29 crore was not made to respective firms during the financial year
2015-16 (Appendix 3.9). Thus, the charges incurred in one year was thrown on
the grant of another year, which was in contravention to subsidiary rule 283 of
MPTC.
Audit Report on State Finances for the year ended 31 March 2016
64
The Department replied that the pending bills were not passed due to unavailability of budget allotment.
The reply is not acceptable, as an amount of ` 36.32 crore was allotted to the
Department for Shinmhast 2016, out of which only ` 9.99 crore was incurred
by the Department leaving a balance of ` 26.33 crore.
The matter was referred to the Government (August 2016); their reply had not been received (November 2016). However, during the exit conference (December 2016), FD replied that the concerned Department would take necessary action.
3.9 Irregular Maintenance of bank accounts
Rule 6 of MPFC and Subsidiary Rule 284 of MPTC provide that withdrawal of funds from Consolidated Fund of the State without immediate requirement is totally prohibited. According to Rule 9 of MPTC a Government servant may not, except with the special permission of the Government, deposit in a bank moneys withdrawn from the Consolidated Fund and Public Account of the State. Finance Department, Government of Madhya Pradesh directed (February 2009) that Government Offices, which had withdrawn funds of various schemes and deposited in bank accounts opened without permission of Finance Department, may withdraw money immediately from these bank accounts and deposit into Government Accounts.
With a view to ascertain whether Government money was being parked in bank
accounts, information on deposit of funds in bank account by departmental
authorities was called from all Departments of Government of Madhya Pradesh.
As per information received from 35 Departments, there were no cases of
deposits in bank accounts by departmental authorities of these Departments.
Information from 12 Departments was still awaited (November 2016).
In case of six Departments3, the amount of ` 28.25 crore was withdrawn from
Consolidated Fund and deposited in 51 bank accounts, which were being
operated by 40 Drawing and Disbursement Officers (DDOs) as on 31 March
2016. The amount parked in these accounts should have been withdrawn and
deposited in Government Accounts as per the direction of FD, but the same was
not complied with. Details of balances in the bank accounts of these 40 DDOs
are shown in Appendix 3.10.
Audit scrutiny (June 2016) of records of Office of the Deputy Director (DD),
Horticulture and Food Processing, Satna4 revealed that DD, withdrew ` 21.75
lakh5 during April 2012 to January 2014 from treasury for payment to
beneficiaries under Special Central Assistance Programme for Tribal Sub-Plan
Area and deposited the same in its bank account. However, it remained
unutilised.
3 (1) Commerce, Industry and Employment, (2) Higher Education, (3) Finance, (4) Fisherman Welfare and
Fisheries Development, (5) Gas Tragedy, Relief & Rehabilitation (6) Horticulture and Food Processing
4 included in 40 DDOs mentioned in Appendix 3.10 5 (1) ` 1.75 lakh (April 2012), (2) ` 15.00 lakh (October 2013), (3) ` 5.00 lakh (January 2014)
Chapter 3-Financial Reporting
65
On this being pointed out, DD replied (June 2016) that the amount was
withdrawn and deposited in bank account as prior selection of beneficiary
farmers was not done and budget was getting lapsed.
Reply is not acceptable as permission of FD was not obtained to deposit money
in bank. Further, withdrawal of funds without immediate requirement and
depositing the same in bank was in contravention to the directions of FD and
provision of MPTC.
The above matter was referred to the Government (May 2016); their reply was
awaited (November 2016).
During the exit conference (December 2016), FD replied that directions in this
regard were already issued to all the Departments. However, specific cases
would be taken up with the concerned Departments.
3.10 Submission of the details of grants or loans paid to bodies and
authorities
In order to identify bodies or authorities, which attract audit under Sections 14
and 15 of the Comptroller and Auditor General’s (Duties, Powers and
Conditions of Service) Act 1971 (C&AG’S DPC Act), the Government/Heads
of the Departments are required to furnish to Audit every year the detailed
information about the financial assistance given to various institutions, the
purpose for which the assistance is granted and the total expenditure of the
institutions. Further, Regulation on Audit and Accounts 2007 provides that
Governments and heads of Departments which sanction grants and or loans to
bodies or authorities shall furnish to the Audit Office by the end of July every
year a statement of such bodies and authorities to which grants and/or loans
aggregating ` 10 lakh or more were paid during the preceding year indicating
(a) the amount of assistance (b) the purpose for which the assistance was
sanctioned and (c) the total expenditure of the body or authority.
During 2015-16 information regarding financial assistance to various
institutions were received from only six bodies6. In the absence of complete
information on the financial assistance given by the Government, reasonable
assurance could not be provided to the Legislature/Government about the
manner in which the grants sanctioned/paid by them had been utilised. This
dilutes the legislative control over the government expenditure systems.
The matter was taken up with Finance Department in May 2016. The reply was
awaited as of November 2016.
6 (1) Chief Administrative Officer, Bharat Bhawan Nyas (Trust), Bhopal, (2) Directorate of Town and Country
Planning issued grant to Body and Authority (3) Kasturba Vanwasi Kanya Ashsram Niwali, Badwani, (4) Madhya
Pradesh Vanwasi Sewa Mandal, Mandla, (5) Project Administrator/Secretary Special Backward Caste Baiga
Development Agency, Dindori, (6) State Health Samiti (National Health Mission, Public Health and Family
Welfare)
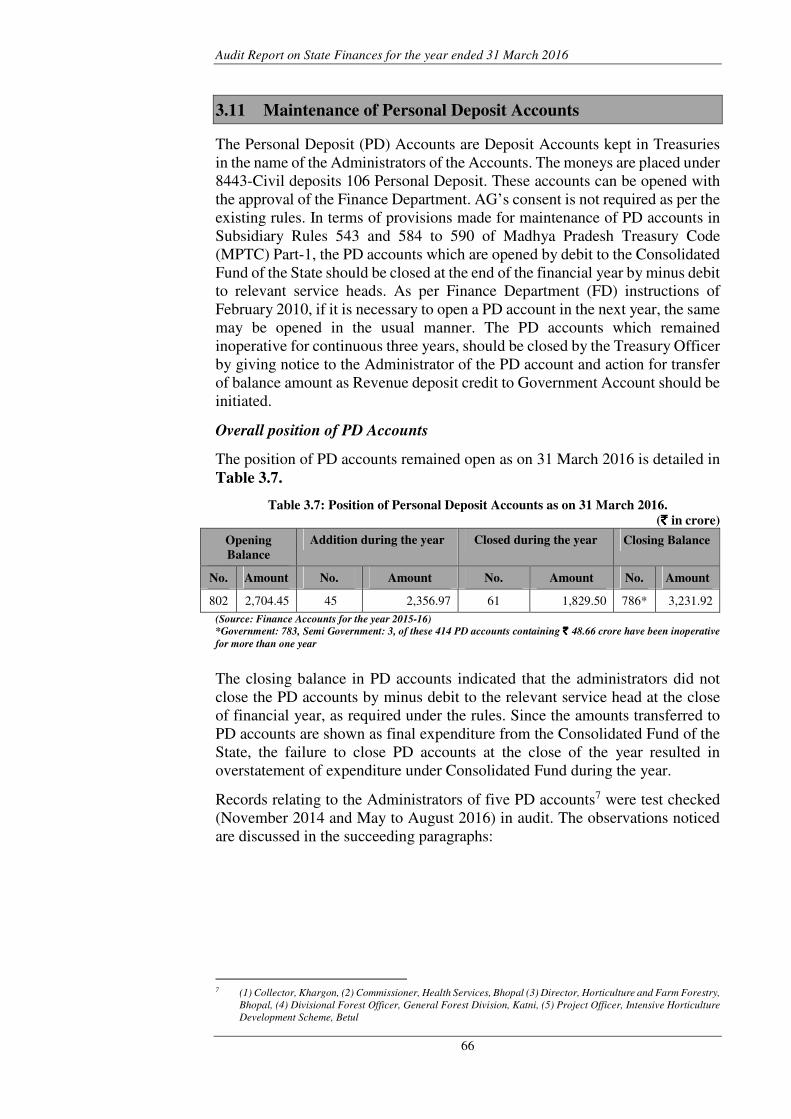
Audit Report on State Finances for the year ended 31 March 2016
66
3.11 Maintenance of Personal Deposit Accounts
The Personal Deposit (PD) Accounts are Deposit Accounts kept in Treasuries
in the name of the Administrators of the Accounts. The moneys are placed under
8443-Civil deposits 106 Personal Deposit. These accounts can be opened with
the approval of the Finance Department. AG’s consent is not required as per the
existing rules. In terms of provisions made for maintenance of PD accounts in
Subsidiary Rules 543 and 584 to 590 of Madhya Pradesh Treasury Code
(MPTC) Part-1, the PD accounts which are opened by debit to the Consolidated
Fund of the State should be closed at the end of the financial year by minus debit
to relevant service heads. As per Finance Department (FD) instructions of
February 2010, if it is necessary to open a PD account in the next year, the same
may be opened in the usual manner. The PD accounts which remained
inoperative for continuous three years, should be closed by the Treasury Officer
by giving notice to the Administrator of the PD account and action for transfer
of balance amount as Revenue deposit credit to Government Account should be
initiated.
Overall position of PD Accounts
The position of PD accounts remained open as on 31 March 2016 is detailed in
Table 3.7.
Table 3.7: Position of Personal Deposit Accounts as on 31 March 2016.
(` ` ` ` in crore)
Opening
Balance
Addition during the year Closed during the year Closing Balance
No. Amount No. Amount No. Amount No. Amount
802 2,704.45 45 2,356.97 61 1,829.50 786* 3,231.92
(Source: Finance Accounts for the year 2015-16)
*Government: 783, Semi Government: 3, of these 414 PD accounts containing `̀̀̀ 48.66 crore have been inoperative
for more than one year
The closing balance in PD accounts indicated that the administrators did not
close the PD accounts by minus debit to the relevant service head at the close
of financial year, as required under the rules. Since the amounts transferred to
PD accounts are shown as final expenditure from the Consolidated Fund of the
State, the failure to close PD accounts at the close of the year resulted in
overstatement of expenditure under Consolidated Fund during the year.
Records relating to the Administrators of five PD accounts7 were test checked
(November 2014 and May to August 2016) in audit. The observations noticed
are discussed in the succeeding paragraphs:
7 (1) Collector, Khargon, (2) Commissioner, Health Services, Bhopal (3) Director, Horticulture and Farm Forestry,
Bhopal, (4) Divisional Forest Officer, General Forest Division, Katni, (5) Project Officer, Intensive Horticulture
Development Scheme, Betul
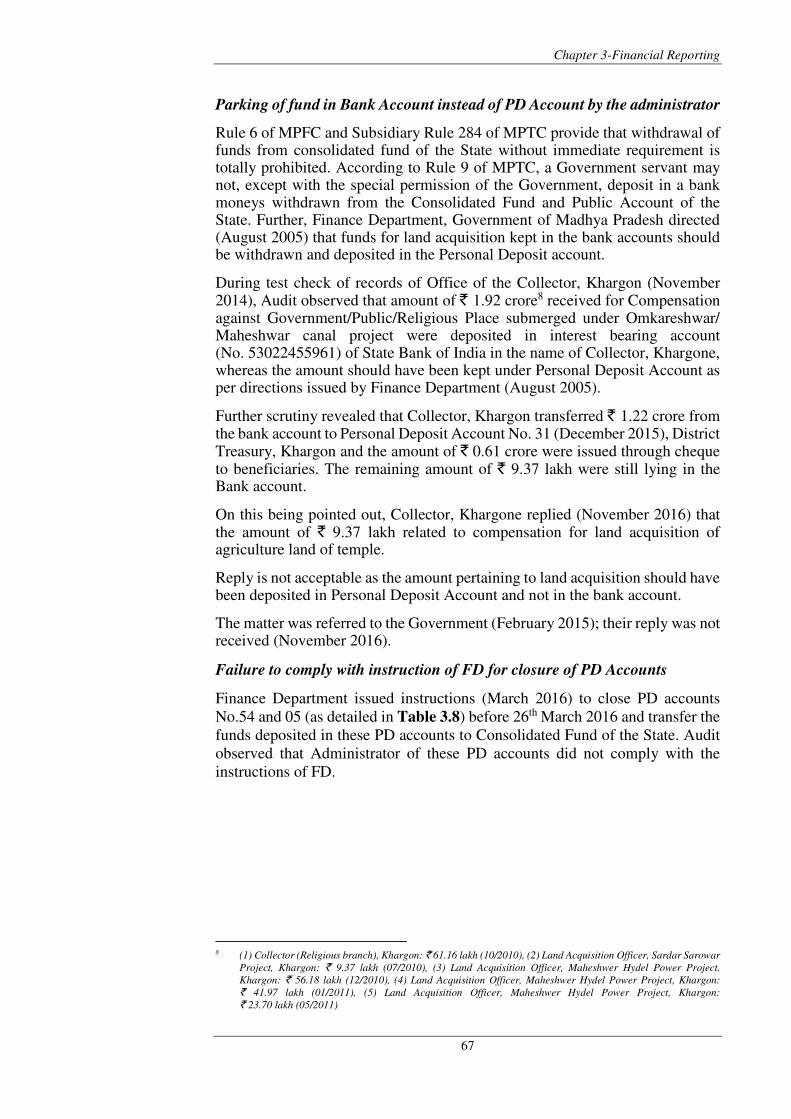
Chapter 3-Financial Reporting
67
Parking of fund in Bank Account instead of PD Account by the administrator
Rule 6 of MPFC and Subsidiary Rule 284 of MPTC provide that withdrawal of funds from consolidated fund of the State without immediate requirement is totally prohibited. According to Rule 9 of MPTC, a Government servant may not, except with the special permission of the Government, deposit in a bank moneys withdrawn from the Consolidated Fund and Public Account of the State. Further, Finance Department, Government of Madhya Pradesh directed (August 2005) that funds for land acquisition kept in the bank accounts should be withdrawn and deposited in the Personal Deposit account.
During test check of records of Office of the Collector, Khargon (November 2014), Audit observed that amount of ` 1.92 crore8 received for Compensation against Government/Public/Religious Place submerged under Omkareshwar/ Maheshwar canal project were deposited in interest bearing account (No. 53022455961) of State Bank of India in the name of Collector, Khargone, whereas the amount should have been kept under Personal Deposit Account as per directions issued by Finance Department (August 2005).
Further scrutiny revealed that Collector, Khargon transferred ` 1.22 crore from the bank account to Personal Deposit Account No. 31 (December 2015), District Treasury, Khargon and the amount of ` 0.61 crore were issued through cheque to beneficiaries. The remaining amount of ` 9.37 lakh were still lying in the Bank account.
On this being pointed out, Collector, Khargone replied (November 2016) that the amount of ` 9.37 lakh related to compensation for land acquisition of agriculture land of temple.
Reply is not acceptable as the amount pertaining to land acquisition should have been deposited in Personal Deposit Account and not in the bank account.
The matter was referred to the Government (February 2015); their reply was not received (November 2016).
Failure to comply with instruction of FD for closure of PD Accounts
Finance Department issued instructions (March 2016) to close PD accounts
No.54 and 05 (as detailed in Table 3.8) before 26th March 2016 and transfer the
funds deposited in these PD accounts to Consolidated Fund of the State. Audit
observed that Administrator of these PD accounts did not comply with the
instructions of FD.
8 (1) Collector (Religious branch), Khargon: ` 61.16 lakh (10/2010), (2) Land Acquisition Officer, Sardar Sarowar
Project, Khargon: ` 9.37 lakh (07/2010), (3) Land Acquisition Officer, Maheshwer Hydel Power Project,
Khargon: ` 56.18 lakh (12/2010), (4) Land Acquisition Officer, Maheshwer Hydel Power Project, Khargon:
` 41.97 lakh (01/2011), (5) Land Acquisition Officer, Maheshwer Hydel Power Project, Khargon:
` 23.70 lakh (05/2011)
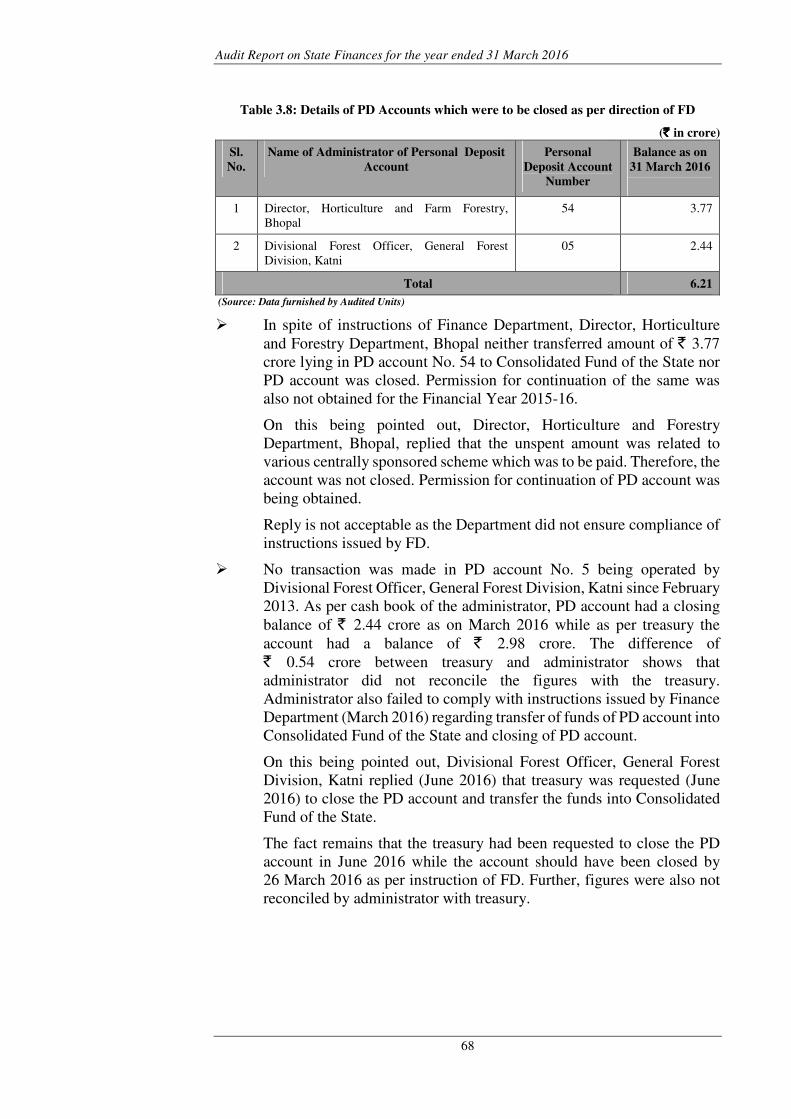
Audit Report on State Finances for the year ended 31 March 2016
68
Table 3.8: Details of PD Accounts which were to be closed as per direction of FD
(` ` ` ` in crore)
Sl.
No.
Name of Administrator of Personal Deposit
Account
Personal
Deposit Account
Number
Balance as on
31 March 2016
1 Director, Horticulture and Farm Forestry,
Bhopal
54 3.77
2 Divisional Forest Officer, General Forest
Division, Katni
05 2.44
Total 6.21
(Source: Data furnished by Audited Units)
� In spite of instructions of Finance Department, Director, Horticulture
and Forestry Department, Bhopal neither transferred amount of ` 3.77
crore lying in PD account No. 54 to Consolidated Fund of the State nor
PD account was closed. Permission for continuation of the same was
also not obtained for the Financial Year 2015-16.
On this being pointed out, Director, Horticulture and Forestry
Department, Bhopal, replied that the unspent amount was related to
various centrally sponsored scheme which was to be paid. Therefore, the
account was not closed. Permission for continuation of PD account was
being obtained.
Reply is not acceptable as the Department did not ensure compliance of
instructions issued by FD.
� No transaction was made in PD account No. 5 being operated by
Divisional Forest Officer, General Forest Division, Katni since February
2013. As per cash book of the administrator, PD account had a closing
balance of ` 2.44 crore as on March 2016 while as per treasury the
account had a balance of ` 2.98 crore. The difference of
` 0.54 crore between treasury and administrator shows that
administrator did not reconcile the figures with the treasury.
Administrator also failed to comply with instructions issued by Finance
Department (March 2016) regarding transfer of funds of PD account into
Consolidated Fund of the State and closing of PD account.
On this being pointed out, Divisional Forest Officer, General Forest
Division, Katni replied (June 2016) that treasury was requested (June
2016) to close the PD account and transfer the funds into Consolidated
Fund of the State.
The fact remains that the treasury had been requested to close the PD
account in June 2016 while the account should have been closed by
26 March 2016 as per instruction of FD. Further, figures were also not
reconciled by administrator with treasury.
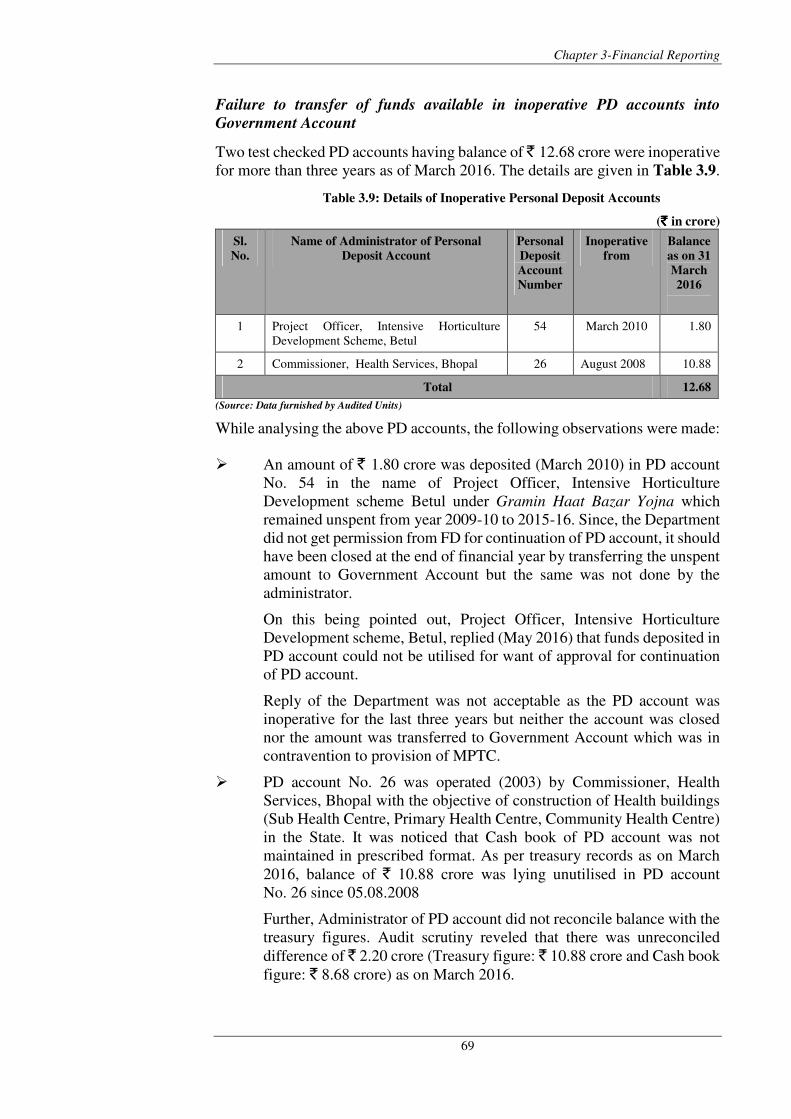
Chapter 3-Financial Reporting
69
Failure to transfer of funds available in inoperative PD accounts into
Government Account
Two test checked PD accounts having balance of ̀ 12.68 crore were inoperative
for more than three years as of March 2016. The details are given in Table 3.9.
Table 3.9: Details of Inoperative Personal Deposit Accounts
(` ` ` ` in crore)
Sl.
No.
Name of Administrator of Personal
Deposit Account
Personal
Deposit
Account
Number
Inoperative
from
Balance
as on 31
March
2016
1 Project Officer, Intensive Horticulture
Development Scheme, Betul
54 March 2010 1.80
2 Commissioner, Health Services, Bhopal 26 August 2008 10.88
Total 12.68
(Source: Data furnished by Audited Units)
While analysing the above PD accounts, the following observations were made:
� An amount of ` 1.80 crore was deposited (March 2010) in PD account
No. 54 in the name of Project Officer, Intensive Horticulture
Development scheme Betul under Gramin Haat Bazar Yojna which
remained unspent from year 2009-10 to 2015-16. Since, the Department
did not get permission from FD for continuation of PD account, it should
have been closed at the end of financial year by transferring the unspent
amount to Government Account but the same was not done by the
administrator.
On this being pointed out, Project Officer, Intensive Horticulture
Development scheme, Betul, replied (May 2016) that funds deposited in
PD account could not be utilised for want of approval for continuation
of PD account.
Reply of the Department was not acceptable as the PD account was
inoperative for the last three years but neither the account was closed
nor the amount was transferred to Government Account which was in
contravention to provision of MPTC.
� PD account No. 26 was operated (2003) by Commissioner, Health
Services, Bhopal with the objective of construction of Health buildings
(Sub Health Centre, Primary Health Centre, Community Health Centre)
in the State. It was noticed that Cash book of PD account was not
maintained in prescribed format. As per treasury records as on March
2016, balance of ` 10.88 crore was lying unutilised in PD account
No. 26 since 05.08.2008
Further, Administrator of PD account did not reconcile balance with the
treasury figures. Audit scrutiny reveled that there was unreconciled
difference of ` 2.20 crore (Treasury figure: ` 10.88 crore and Cash book
figure: ` 8.68 crore) as on March 2016.
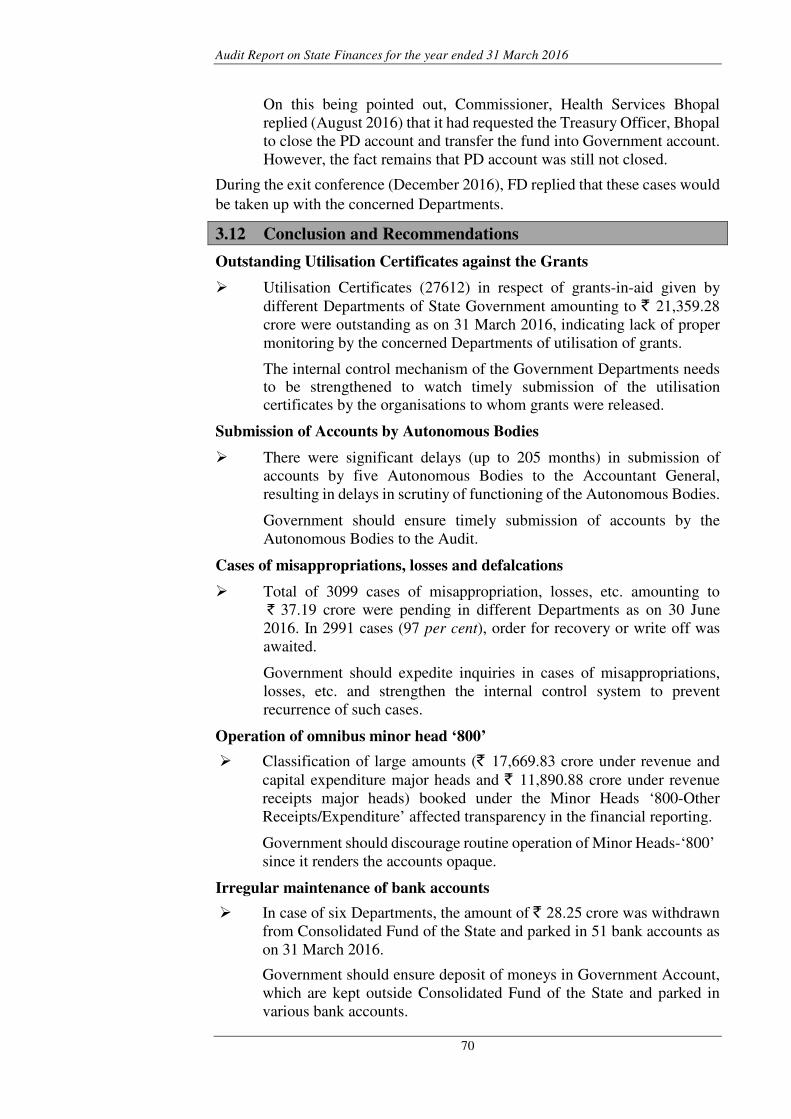
Audit Report on State Finances for the year ended 31 March 2016
70
On this being pointed out, Commissioner, Health Services Bhopal
replied (August 2016) that it had requested the Treasury Officer, Bhopal
to close the PD account and transfer the fund into Government account.
However, the fact remains that PD account was still not closed.
During the exit conference (December 2016), FD replied that these cases would
be taken up with the concerned Departments.
3.12 Conclusion and Recommendations
Outstanding Utilisation Certificates against the Grants
� Utilisation Certificates (27612) in respect of grants-in-aid given by
different Departments of State Government amounting to ` 21,359.28
crore were outstanding as on 31 March 2016, indicating lack of proper
monitoring by the concerned Departments of utilisation of grants.
The internal control mechanism of the Government Departments needs to be strengthened to watch timely submission of the utilisation certificates by the organisations to whom grants were released.
Submission of Accounts by Autonomous Bodies
� There were significant delays (up to 205 months) in submission of
accounts by five Autonomous Bodies to the Accountant General,
resulting in delays in scrutiny of functioning of the Autonomous Bodies.
Government should ensure timely submission of accounts by the
Autonomous Bodies to the Audit.
Cases of misappropriations, losses and defalcations
� Total of 3099 cases of misappropriation, losses, etc. amounting to
` 37.19 crore were pending in different Departments as on 30 June
2016. In 2991 cases (97 per cent), order for recovery or write off was
awaited.
Government should expedite inquiries in cases of misappropriations,
losses, etc. and strengthen the internal control system to prevent
recurrence of such cases.
Operation of omnibus minor head ‘800’
� Classification of large amounts (` 17,669.83 crore under revenue and
capital expenditure major heads and ` 11,890.88 crore under revenue
receipts major heads) booked under the Minor Heads ‘800-Other
Receipts/Expenditure’ affected transparency in the financial reporting.
Government should discourage routine operation of Minor Heads-‘800’
since it renders the accounts opaque.
Irregular maintenance of bank accounts
� In case of six Departments, the amount of ` 28.25 crore was withdrawn
from Consolidated Fund of the State and parked in 51 bank accounts as
on 31 March 2016.
Government should ensure deposit of moneys in Government Account,
which are kept outside Consolidated Fund of the State and parked in
various bank accounts.
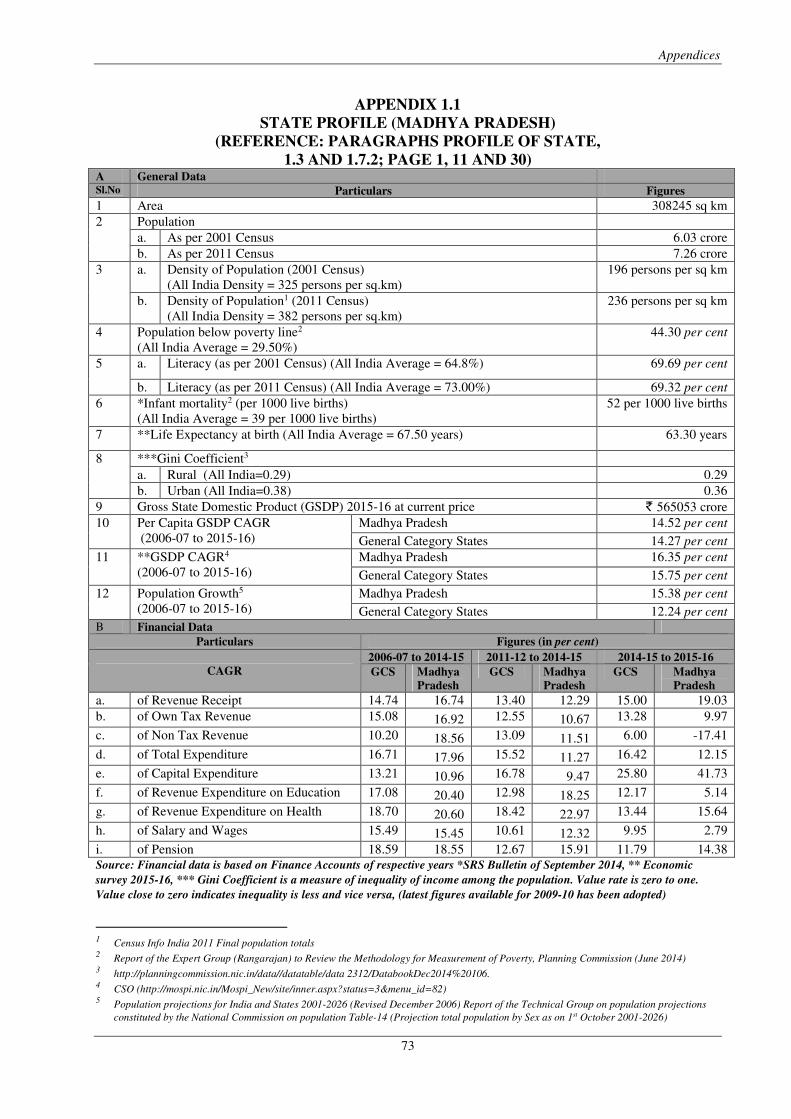
Appendices
73
APPENDIX 1.1
STATE PROFILE (MADHYA PRADESH)
(REFERENCE: PARAGRAPHS PROFILE OF STATE,
1.3 AND 1.7.2; PAGE 1, 11 AND 30)
Source: Financial data is based on Finance Accounts of respective years *SRS Bulletin of September 2014, ** Economic
survey 2015-16, *** Gini Coefficient is a measure of inequality of income among the population. Value rate is zero to one.
Value close to zero indicates inequality is less and vice versa, (latest figures available for 2009-10 has been adopted)
1 Census Info India 2011 Final population totals 2 Report of the Expert Group (Rangarajan) to Review the Methodology for Measurement of Poverty, Planning Commission (June 2014) 3 http://planningcommission.nic.in/data//datatable/data 2312/DatabookDec2014%20106. 4 CSO (http://mospi.nic.in/Mospi_New/site/inner.aspx?status=3&menu_id=82) 5 Population projections for India and States 2001-2026 (Revised December 2006) Report of the Technical Group on population projections
constituted by the National Commission on population Table-14 (Projection total population by Sex as on 1st October 2001-2026)
A General Data Sl.No Particulars Figures
1 Area 308245 sq km
2 Population
a. As per 2001 Census 6.03 crore
b. As per 2011 Census 7.26 crore
3 a. Density of Population (2001 Census)
(All India Density = 325 persons per sq.km)
196 persons per sq km
b. Density of Population1 (2011 Census)
(All India Density = 382 persons per sq.km)
236 persons per sq km
4 Population below poverty line2
(All India Average = 29.50%)
44.30 per cent
5 a. Literacy (as per 2001 Census) (All India Average = 64.8%) 69.69 per cent
b. Literacy (as per 2011 Census) (All India Average = 73.00%) 69.32 per cent
6 *Infant mortality2 (per 1000 live births)
(All India Average = 39 per 1000 live births)
52 per 1000 live births
7 **Life Expectancy at birth (All India Average = 67.50 years) 63.30 years
8 ***Gini Coefficient3
a. Rural (All India=0.29) 0.29
b. Urban (All India=0.38) 0.36
9 Gross State Domestic Product (GSDP) 2015-16 at current price ` 565053 crore
10 Per Capita GSDP CAGR
(2006-07 to 2015-16)
Madhya Pradesh 14.52 per cent
General Category States 14.27 per cent
11 **GSDP CAGR4
(2006-07 to 2015-16)
Madhya Pradesh 16.35 per cent
General Category States 15.75 per cent
12 Population Growth5
(2006-07 to 2015-16)
Madhya Pradesh 15.38 per cent
General Category States 12.24 per cent B Financial Data
Particulars Figures (in per cent)
CAGR
2006-07 to 2014-15 2011-12 to 2014-15 2014-15 to 2015-16
GCS Madhya
Pradesh
GCS Madhya
Pradesh
GCS Madhya
Pradesh
a. of Revenue Receipt 14.74 16.74 13.40 12.29 15.00 19.03
b. of Own Tax Revenue 15.08 16.92 12.55 10.67 13.28 9.97
c. of Non Tax Revenue 10.20 18.56 13.09 11.51 6.00 -17.41
d. of Total Expenditure 16.71 17.96 15.52 11.27 16.42 12.15
e. of Capital Expenditure 13.21 10.96 16.78 9.47 25.80 41.73
f. of Revenue Expenditure on Education 17.08 20.40 12.98 18.25 12.17 5.14
g. of Revenue Expenditure on Health 18.70 20.60 18.42 22.97 13.44 15.64
h. of Salary and Wages 15.49 15.45 10.61 12.32 9.95 2.79
i. of Pension 18.59 18.55 12.67 15.91 11.79 14.38
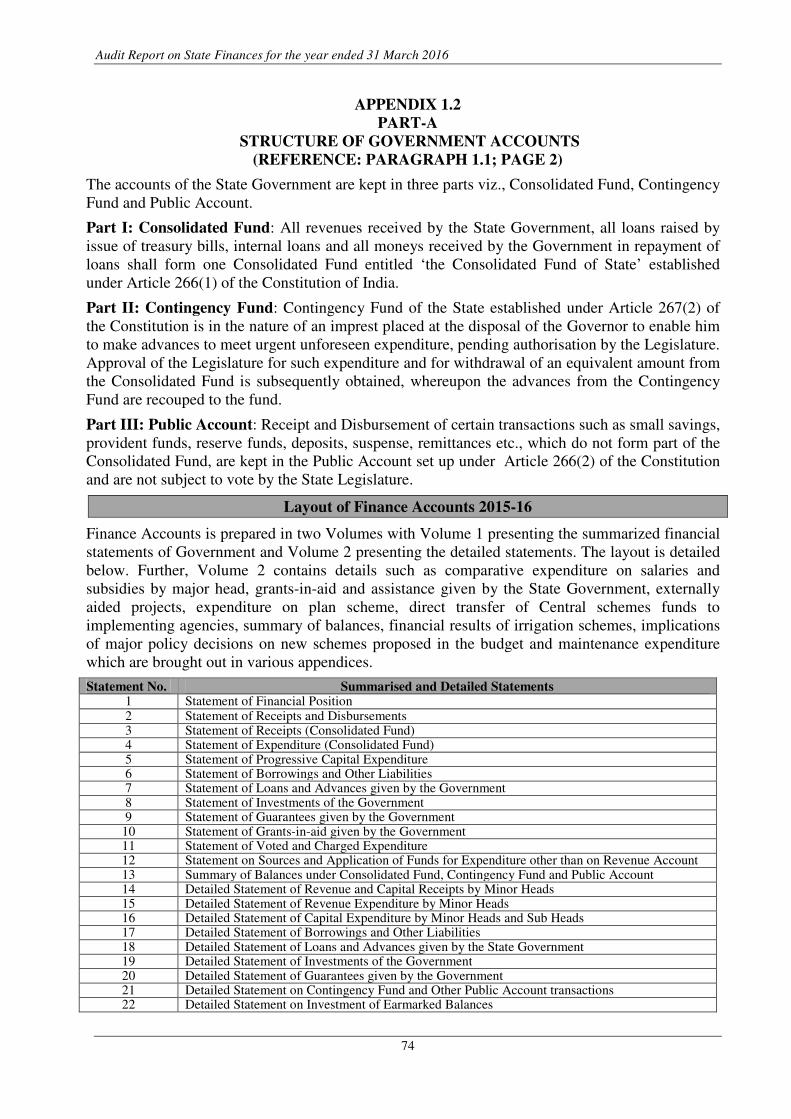
Audit Report on State Finances for the year ended 31 March 2016
74
APPENDIX 1.2
PART-A
STRUCTURE OF GOVERNMENT ACCOUNTS
(REFERENCE: PARAGRAPH 1.1; PAGE 2)
The accounts of the State Government are kept in three parts viz., Consolidated Fund, Contingency
Fund and Public Account.
Part I: Consolidated Fund: All revenues received by the State Government, all loans raised by
issue of treasury bills, internal loans and all moneys received by the Government in repayment of
loans shall form one Consolidated Fund entitled ‘the Consolidated Fund of State’ established
under Article 266(1) of the Constitution of India.
Part II: Contingency Fund: Contingency Fund of the State established under Article 267(2) of
the Constitution is in the nature of an imprest placed at the disposal of the Governor to enable him
to make advances to meet urgent unforeseen expenditure, pending authorisation by the Legislature.
Approval of the Legislature for such expenditure and for withdrawal of an equivalent amount from
the Consolidated Fund is subsequently obtained, whereupon the advances from the Contingency
Fund are recouped to the fund.
Part III: Public Account: Receipt and Disbursement of certain transactions such as small savings,
provident funds, reserve funds, deposits, suspense, remittances etc., which do not form part of the
Consolidated Fund, are kept in the Public Account set up under Article 266(2) of the Constitution
and are not subject to vote by the State Legislature.
Layout of Finance Accounts 2015-16
Finance Accounts is prepared in two Volumes with Volume 1 presenting the summarized financial
statements of Government and Volume 2 presenting the detailed statements. The layout is detailed
below. Further, Volume 2 contains details such as comparative expenditure on salaries and
subsidies by major head, grants-in-aid and assistance given by the State Government, externally
aided projects, expenditure on plan scheme, direct transfer of Central schemes funds to
implementing agencies, summary of balances, financial results of irrigation schemes, implications
of major policy decisions on new schemes proposed in the budget and maintenance expenditure
which are brought out in various appendices.
Statement No. Summarised and Detailed Statements 1 Statement of Financial Position 2 Statement of Receipts and Disbursements 3 Statement of Receipts (Consolidated Fund) 4 Statement of Expenditure (Consolidated Fund) 5 Statement of Progressive Capital Expenditure 6 Statement of Borrowings and Other Liabilities 7 Statement of Loans and Advances given by the Government 8 Statement of Investments of the Government 9 Statement of Guarantees given by the Government
10 Statement of Grants-in-aid given by the Government 11 Statement of Voted and Charged Expenditure 12 Statement on Sources and Application of Funds for Expenditure other than on Revenue Account 13 Summary of Balances under Consolidated Fund, Contingency Fund and Public Account 14 Detailed Statement of Revenue and Capital Receipts by Minor Heads 15 Detailed Statement of Revenue Expenditure by Minor Heads 16 Detailed Statement of Capital Expenditure by Minor Heads and Sub Heads 17 Detailed Statement of Borrowings and Other Liabilities 18 Detailed Statement of Loans and Advances given by the State Government 19 Detailed Statement of Investments of the Government 20 Detailed Statement of Guarantees given by the Government 21 Detailed Statement on Contingency Fund and Other Public Account transactions 22 Detailed Statement on Investment of Earmarked Balances
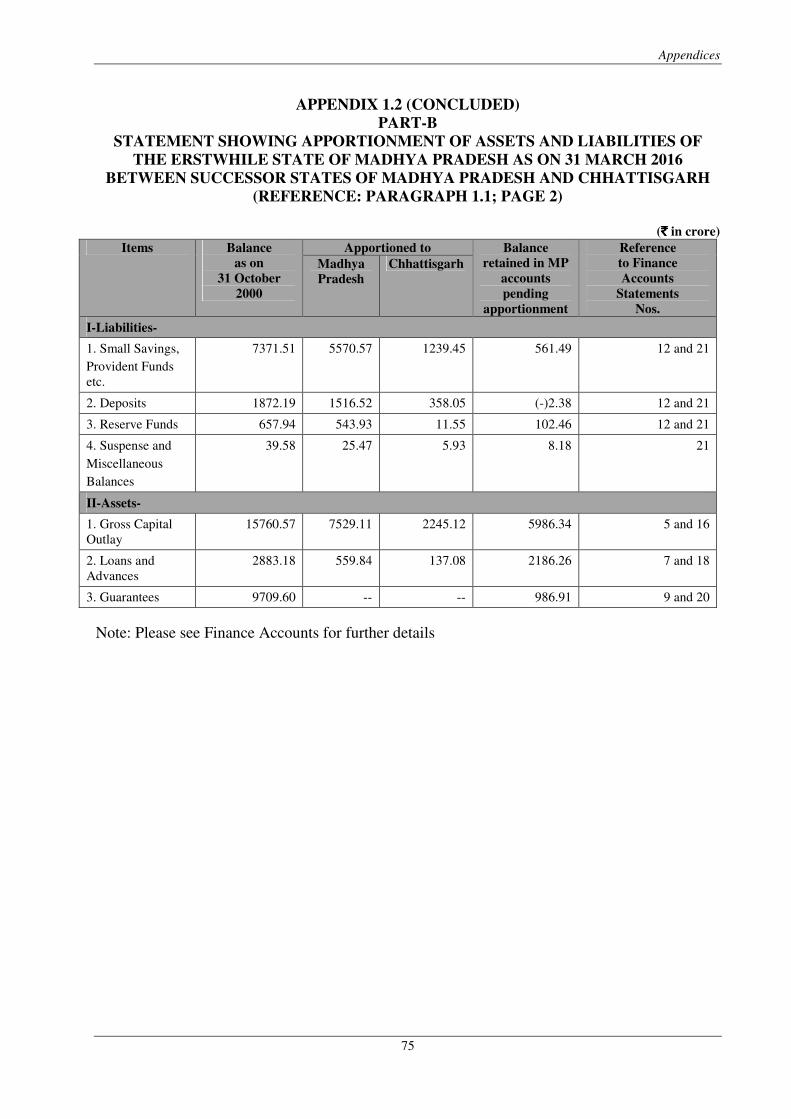
Appendices
75
APPENDIX 1.2 (CONCLUDED)
PART-B
STATEMENT SHOWING APPORTIONMENT OF ASSETS AND LIABILITIES OF
THE ERSTWHILE STATE OF MADHYA PRADESH AS ON 31 MARCH 2016
BETWEEN SUCCESSOR STATES OF MADHYA PRADESH AND CHHATTISGARH
(REFERENCE: PARAGRAPH 1.1; PAGE 2)
(`̀̀̀ in crore)
Items Balance
as on
31 October
2000
Apportioned to Balance
retained in MP
accounts
pending
apportionment
Reference
to Finance
Accounts
Statements
Nos.
Madhya
Pradesh
Chhattisgarh
I-Liabilities-
1. Small Savings,
Provident Funds
etc.
7371.51 5570.57 1239.45 561.49 12 and 21
2. Deposits 1872.19 1516.52 358.05 (-)2.38 12 and 21
3. Reserve Funds 657.94 543.93 11.55 102.46 12 and 21
4. Suspense and
Miscellaneous
Balances
39.58 25.47 5.93 8.18 21
II-Assets-
1. Gross Capital
Outlay
15760.57 7529.11 2245.12 5986.34 5 and 16
2. Loans and
Advances
2883.18 559.84 137.08 2186.26 7 and 18
3. Guarantees 9709.60 -- -- 986.91 9 and 20
Note: Please see Finance Accounts for further details
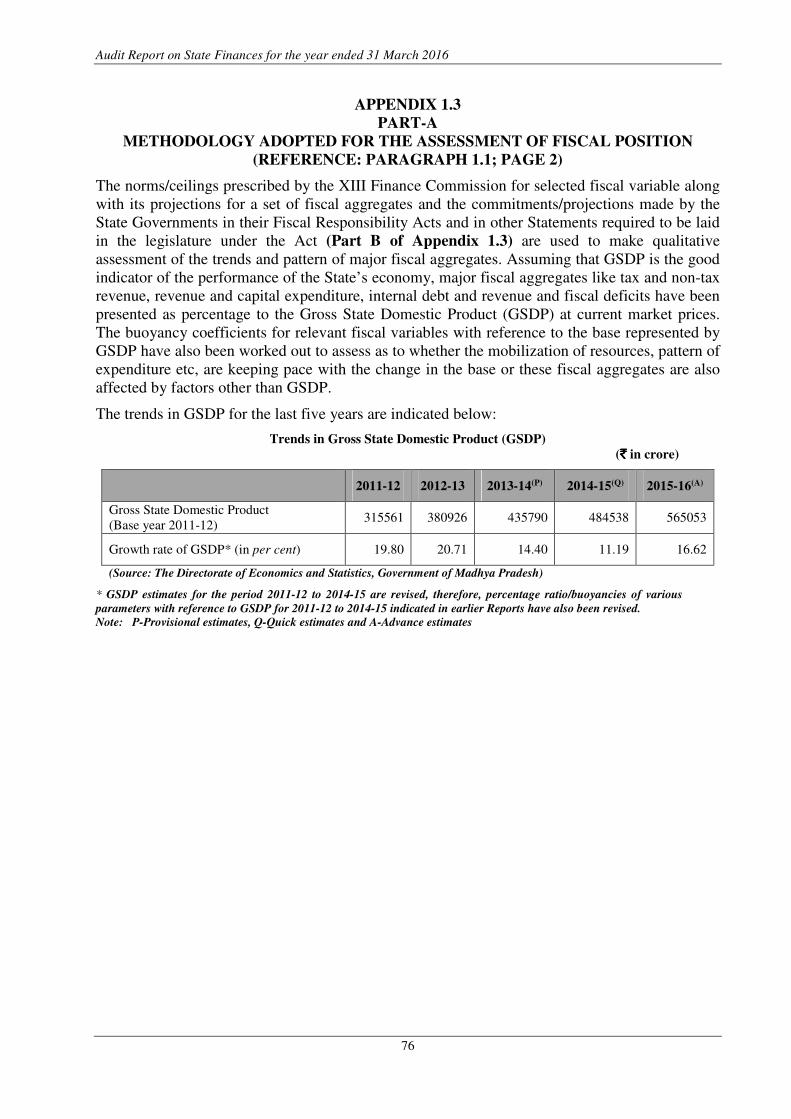
Audit Report on State Finances for the year ended 31 March 2016
76
APPENDIX 1.3
PART-A
METHODOLOGY ADOPTED FOR THE ASSESSMENT OF FISCAL POSITION
(REFERENCE: PARAGRAPH 1.1; PAGE 2)
The norms/ceilings prescribed by the XIII Finance Commission for selected fiscal variable along
with its projections for a set of fiscal aggregates and the commitments/projections made by the
State Governments in their Fiscal Responsibility Acts and in other Statements required to be laid
in the legislature under the Act (Part B of Appendix 1.3) are used to make qualitative
assessment of the trends and pattern of major fiscal aggregates. Assuming that GSDP is the good
indicator of the performance of the State’s economy, major fiscal aggregates like tax and non-tax
revenue, revenue and capital expenditure, internal debt and revenue and fiscal deficits have been
presented as percentage to the Gross State Domestic Product (GSDP) at current market prices.
The buoyancy coefficients for relevant fiscal variables with reference to the base represented by
GSDP have also been worked out to assess as to whether the mobilization of resources, pattern of
expenditure etc, are keeping pace with the change in the base or these fiscal aggregates are also
affected by factors other than GSDP.
The trends in GSDP for the last five years are indicated below:
Trends in Gross State Domestic Product (GSDP)
(`̀̀̀ in crore)
* GSDP estimates for the period 2011-12 to 2014-15 are revised, therefore, percentage ratio/buoyancies of various
parameters with reference to GSDP for 2011-12 to 2014-15 indicated in earlier Reports have also been revised.
Note: P-Provisional estimates, Q-Quick estimates and A-Advance estimates
2011-12 2012-13 2013-14(P) 2014-15(Q) 2015-16(A)
Gross State Domestic Product
(Base year 2011-12) 315561 380926 435790 484538 565053
Growth rate of GSDP* (in per cent) 19.80 20.71 14.40 11.19 16.62
(Source: The Directorate of Economics and Statistics, Government of Madhya Pradesh)
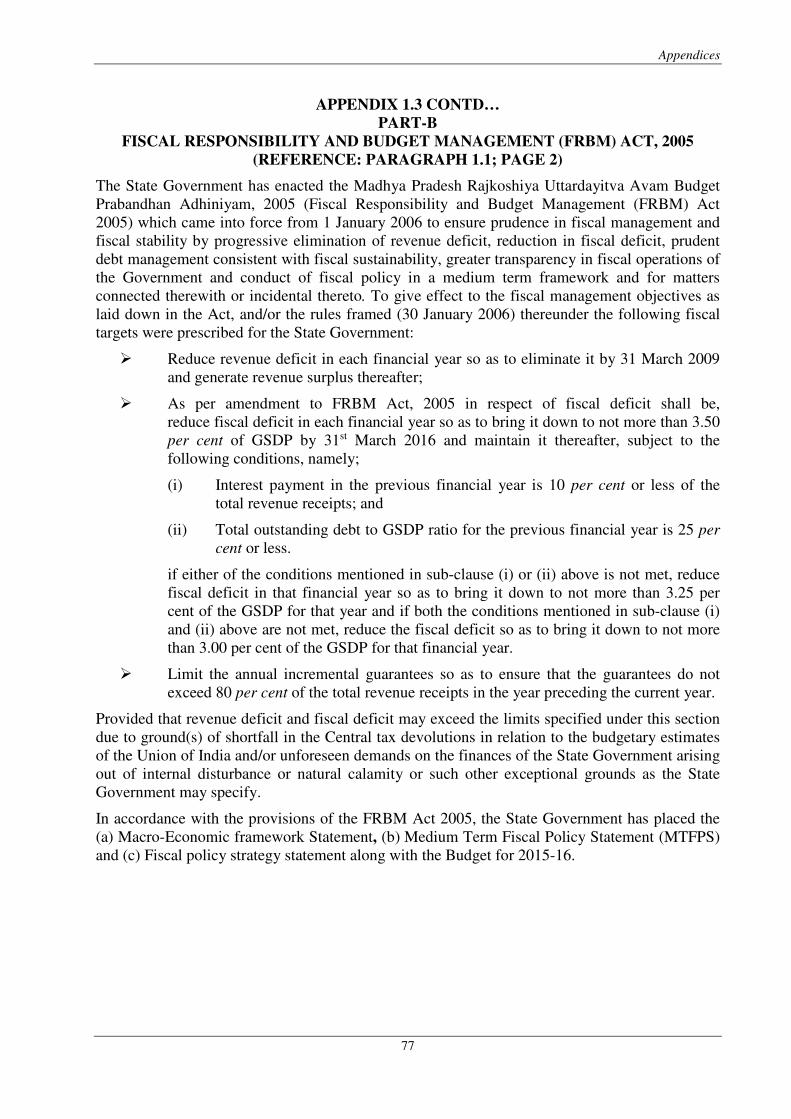
Appendices
77
APPENDIX 1.3 CONTD…
PART-B FISCAL RESPONSIBILITY AND BUDGET MANAGEMENT (FRBM) ACT, 2005
(REFERENCE: PARAGRAPH 1.1; PAGE 2)
The State Government has enacted the Madhya Pradesh Rajkoshiya Uttardayitva Avam Budget
Prabandhan Adhiniyam, 2005 (Fiscal Responsibility and Budget Management (FRBM) Act
2005) which came into force from 1 January 2006 to ensure prudence in fiscal management and
fiscal stability by progressive elimination of revenue deficit, reduction in fiscal deficit, prudent
debt management consistent with fiscal sustainability, greater transparency in fiscal operations of
the Government and conduct of fiscal policy in a medium term framework and for matters
connected therewith or incidental thereto. To give effect to the fiscal management objectives as
laid down in the Act, and/or the rules framed (30 January 2006) thereunder the following fiscal
targets were prescribed for the State Government:
� Reduce revenue deficit in each financial year so as to eliminate it by 31 March 2009
and generate revenue surplus thereafter;
� As per amendment to FRBM Act, 2005 in respect of fiscal deficit shall be,
reduce fiscal deficit in each financial year so as to bring it down to not more than 3.50
per cent of GSDP by 31st March 2016 and maintain it thereafter, subject to the
following conditions, namely;
(i) Interest payment in the previous financial year is 10 per cent or less of the
total revenue receipts; and
(ii) Total outstanding debt to GSDP ratio for the previous financial year is 25 per
cent or less.
if either of the conditions mentioned in sub-clause (i) or (ii) above is not met, reduce
fiscal deficit in that financial year so as to bring it down to not more than 3.25 per
cent of the GSDP for that year and if both the conditions mentioned in sub-clause (i)
and (ii) above are not met, reduce the fiscal deficit so as to bring it down to not more
than 3.00 per cent of the GSDP for that financial year.
� Limit the annual incremental guarantees so as to ensure that the guarantees do not
exceed 80 per cent of the total revenue receipts in the year preceding the current year.
Provided that revenue deficit and fiscal deficit may exceed the limits specified under this section
due to ground(s) of shortfall in the Central tax devolutions in relation to the budgetary estimates
of the Union of India and/or unforeseen demands on the finances of the State Government arising
out of internal disturbance or natural calamity or such other exceptional grounds as the State
Government may specify.
In accordance with the provisions of the FRBM Act 2005, the State Government has placed the
(a) Macro-Economic framework Statement, (b) Medium Term Fiscal Policy Statement (MTFPS)
and (c) Fiscal policy strategy statement along with the Budget for 2015-16.
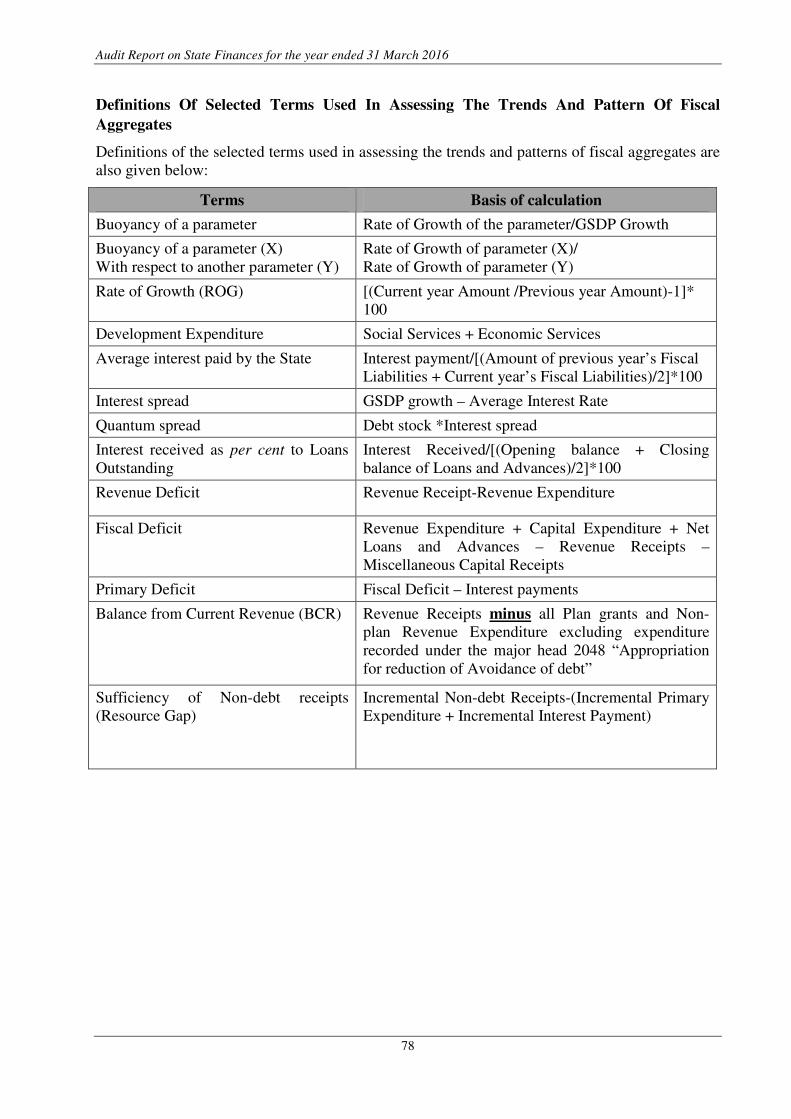
Audit Report on State Finances for the year ended 31 March 2016
78
Definitions Of Selected Terms Used In Assessing The Trends And Pattern Of Fiscal
Aggregates
Definitions of the selected terms used in assessing the trends and patterns of fiscal aggregates are
also given below:
Terms Basis of calculation
Buoyancy of a parameter Rate of Growth of the parameter/GSDP Growth
Buoyancy of a parameter (X)
With respect to another parameter (Y)
Rate of Growth of parameter (X)/
Rate of Growth of parameter (Y)
Rate of Growth (ROG) [(Current year Amount /Previous year Amount)-1]*
100
Development Expenditure Social Services + Economic Services
Average interest paid by the State Interest payment/[(Amount of previous year’s Fiscal
Liabilities + Current year’s Fiscal Liabilities)/2]*100
Interest spread GSDP growth – Average Interest Rate
Quantum spread Debt stock *Interest spread
Interest received as per cent to Loans
Outstanding
Interest Received/[(Opening balance + Closing
balance of Loans and Advances)/2]*100
Revenue Deficit Revenue Receipt-Revenue Expenditure
Fiscal Deficit Revenue Expenditure + Capital Expenditure + Net
Loans and Advances – Revenue Receipts –
Miscellaneous Capital Receipts
Primary Deficit Fiscal Deficit – Interest payments
Balance from Current Revenue (BCR) Revenue Receipts minus all Plan grants and Non-
plan Revenue Expenditure excluding expenditure
recorded under the major head 2048 “Appropriation
for reduction of Avoidance of debt”
Sufficiency of Non-debt receipts
(Resource Gap)
Incremental Non-debt Receipts-(Incremental Primary
Expenditure + Incremental Interest Payment)
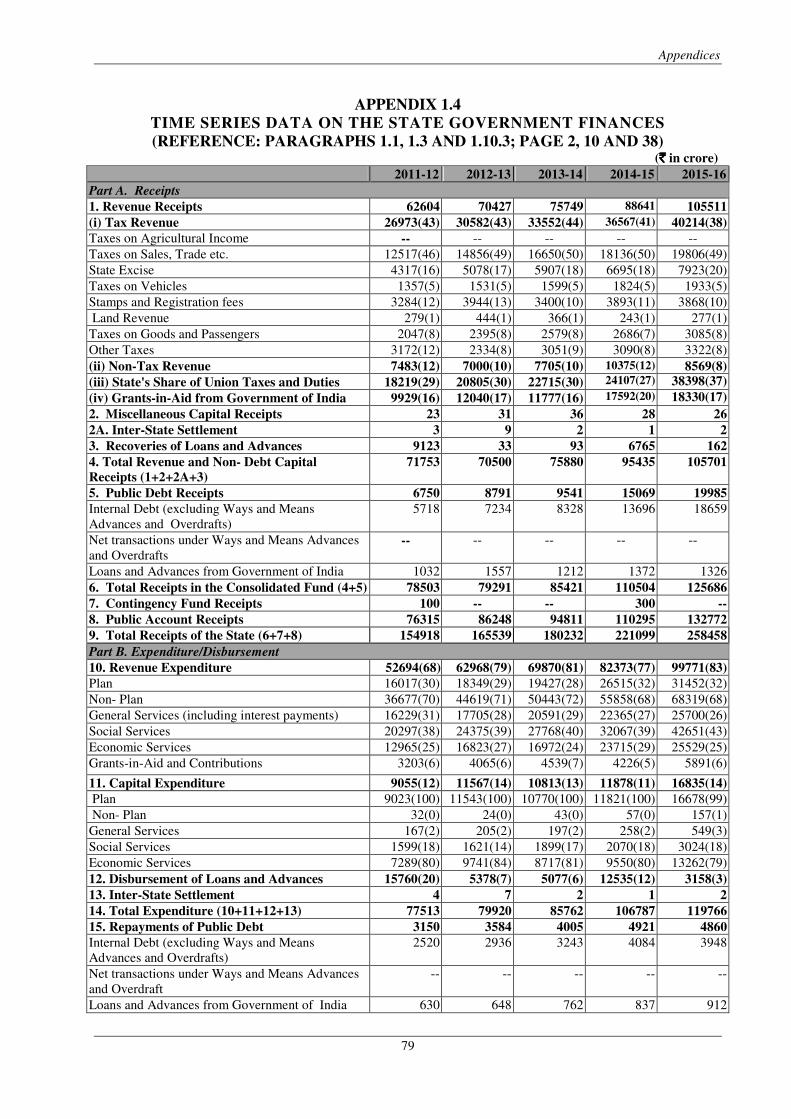
Appendices
79
APPENDIX 1.4
TIME SERIES DATA ON THE STATE GOVERNMENT FINANCES
(REFERENCE: PARAGRAPHS 1.1, 1.3 AND 1.10.3; PAGE 2, 10 AND 38)
(`̀̀̀ in crore) 2011-12 2012-13 2013-14 2014-15 2015-16
Part A. Receipts
1. Revenue Receipts 62604 70427 75749 88641 105511
(i) Tax Revenue 26973(43) 30582(43) 33552(44) 36567(41) 40214(38)
Taxes on Agricultural Income -- -- -- -- --
Taxes on Sales, Trade etc. 12517(46) 14856(49) 16650(50) 18136(50) 19806(49)
State Excise 4317(16) 5078(17) 5907(18) 6695(18) 7923(20)
Taxes on Vehicles 1357(5) 1531(5) 1599(5) 1824(5) 1933(5)
Stamps and Registration fees 3284(12) 3944(13) 3400(10) 3893(11) 3868(10)
Land Revenue 279(1) 444(1) 366(1) 243(1) 277(1)
Taxes on Goods and Passengers 2047(8) 2395(8) 2579(8) 2686(7) 3085(8)
Other Taxes 3172(12) 2334(8) 3051(9) 3090(8) 3322(8)
(ii) Non-Tax Revenue 7483(12) 7000(10) 7705(10) 10375(12) 8569(8)
(iii) State's Share of Union Taxes and Duties 18219(29) 20805(30) 22715(30) 24107(27) 38398(37)
(iv) Grants-in-Aid from Government of India 9929(16) 12040(17) 11777(16) 17592(20) 18330(17)
2. Miscellaneous Capital Receipts 23 31 36 28 26
2A. Inter-State Settlement 3 9 2 1 2
3. Recoveries of Loans and Advances 9123 33 93 6765 162
4. Total Revenue and Non- Debt Capital
Receipts (1+2+2A+3)
71753 70500 75880 95435 105701
5. Public Debt Receipts 6750 8791 9541 15069 19985
Internal Debt (excluding Ways and Means
Advances and Overdrafts)
5718 7234 8328 13696 18659
Net transactions under Ways and Means Advances
and Overdrafts -- -- -- -- --
Loans and Advances from Government of India 1032 1557 1212 1372 1326
6. Total Receipts in the Consolidated Fund (4+5) 78503 79291 85421 110504 125686
7. Contingency Fund Receipts 100 -- -- 300 --
8. Public Account Receipts 76315 86248 94811 110295 132772
9. Total Receipts of the State (6+7+8) 154918 165539 180232 221099 258458
Part B. Expenditure/Disbursement
10. Revenue Expenditure 52694(68) 62968(79) 69870(81) 82373(77) 99771(83)
Plan 16017(30) 18349(29) 19427(28) 26515(32) 31452(32)
Non- Plan 36677(70) 44619(71) 50443(72) 55858(68) 68319(68)
General Services (including interest payments) 16229(31) 17705(28) 20591(29) 22365(27) 25700(26)
Social Services 20297(38) 24375(39) 27768(40) 32067(39) 42651(43)
Economic Services 12965(25) 16823(27) 16972(24) 23715(29) 25529(25)
Grants-in-Aid and Contributions 3203(6) 4065(6) 4539(7) 4226(5) 5891(6)
11. Capital Expenditure 9055(12) 11567(14) 10813(13) 11878(11) 16835(14)
Plan 9023(100) 11543(100) 10770(100) 11821(100) 16678(99)
Non- Plan 32(0) 24(0) 43(0) 57(0) 157(1)
General Services 167(2) 205(2) 197(2) 258(2) 549(3)
Social Services 1599(18) 1621(14) 1899(17) 2070(18) 3024(18)
Economic Services 7289(80) 9741(84) 8717(81) 9550(80) 13262(79)
12. Disbursement of Loans and Advances 15760(20) 5378(7) 5077(6) 12535(12) 3158(3)
13. Inter-State Settlement 4 7 2 1 2
14. Total Expenditure (10+11+12+13) 77513 79920 85762 106787 119766
15. Repayments of Public Debt 3150 3584 4005 4921 4860
Internal Debt (excluding Ways and Means
Advances and Overdrafts)
2520 2936 3243 4084 3948
Net transactions under Ways and Means Advances
and Overdraft
-- -- -- -- --
Loans and Advances from Government of India 630 648 762 837 912
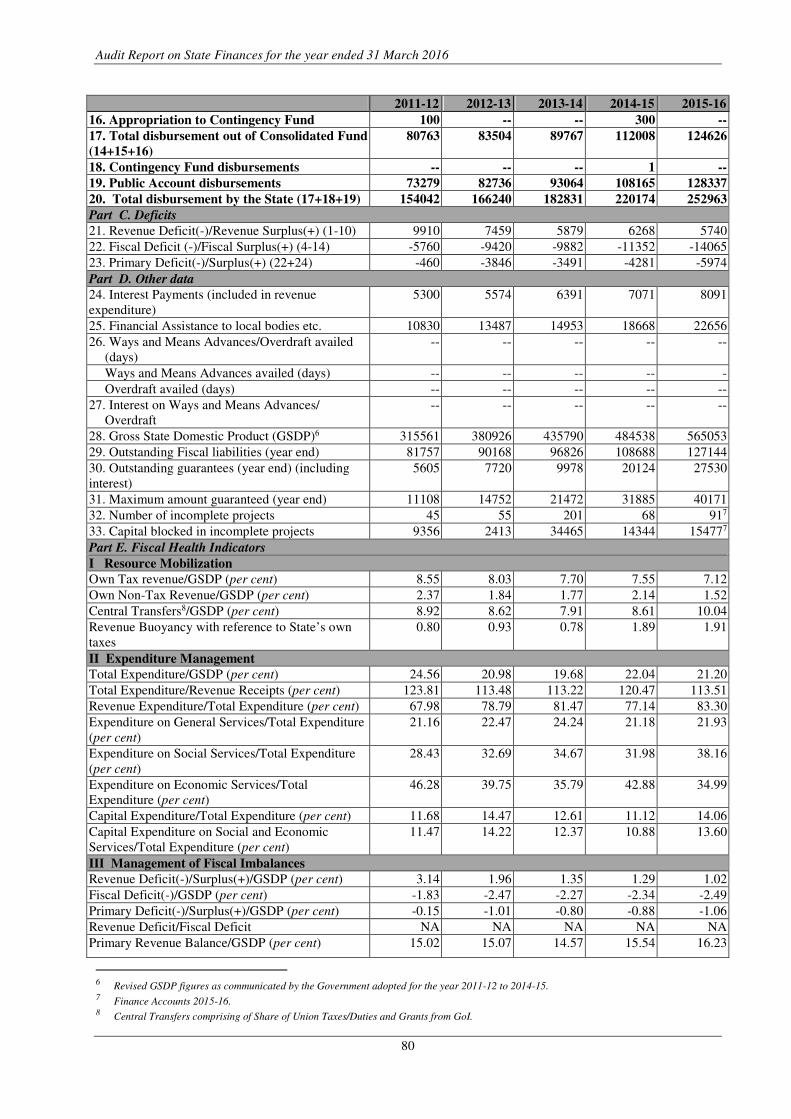
Audit Report on State Finances for the year ended 31 March 2016
80
2011-12 2012-13 2013-14 2014-15 2015-16
16. Appropriation to Contingency Fund 100 -- -- 300 --
17. Total disbursement out of Consolidated Fund
(14+15+16)
80763 83504 89767 112008 124626
18. Contingency Fund disbursements -- -- -- 1 --
19. Public Account disbursements 73279 82736 93064 108165 128337
20. Total disbursement by the State (17+18+19) 154042 166240 182831 220174 252963
Part C. Deficits
21. Revenue Deficit(-)/Revenue Surplus(+) (1-10) 9910 7459 5879 6268 5740
22. Fiscal Deficit (-)/Fiscal Surplus(+) (4-14) -5760 -9420 -9882 -11352 -14065
23. Primary Deficit(-)/Surplus(+) (22+24) -460 -3846 -3491 -4281 -5974
Part D. Other data
24. Interest Payments (included in revenue
expenditure)
5300 5574 6391 7071 8091
25. Financial Assistance to local bodies etc. 10830 13487 14953 18668 22656
26. Ways and Means Advances/Overdraft availed
(days)
-- -- -- -- --
Ways and Means Advances availed (days) -- -- -- -- -
Overdraft availed (days) -- -- -- -- --
27. Interest on Ways and Means Advances/
Overdraft
-- -- -- -- --
28. Gross State Domestic Product (GSDP)6 315561 380926 435790 484538 565053
29. Outstanding Fiscal liabilities (year end) 81757 90168 96826 108688 127144
30. Outstanding guarantees (year end) (including
interest)
5605 7720 9978 20124 27530
31. Maximum amount guaranteed (year end) 11108 14752 21472 31885 40171
32. Number of incomplete projects 45 55 201 68 917
33. Capital blocked in incomplete projects 9356 2413 34465 14344 154777
Part E. Fiscal Health Indicators
I Resource Mobilization
Own Tax revenue/GSDP (per cent) 8.55 8.03 7.70 7.55 7.12
Own Non-Tax Revenue/GSDP (per cent) 2.37 1.84 1.77 2.14 1.52
Central Transfers8/GSDP (per cent) 8.92 8.62 7.91 8.61 10.04
Revenue Buoyancy with reference to State’s own
taxes
0.80 0.93 0.78 1.89 1.91
II Expenditure Management
Total Expenditure/GSDP (per cent) 24.56 20.98 19.68 22.04 21.20
Total Expenditure/Revenue Receipts (per cent) 123.81 113.48 113.22 120.47 113.51
Revenue Expenditure/Total Expenditure (per cent) 67.98 78.79 81.47 77.14 83.30
Expenditure on General Services/Total Expenditure
(per cent)
21.16 22.47 24.24 21.18 21.93
Expenditure on Social Services/Total Expenditure
(per cent)
28.43 32.69 34.67 31.98 38.16
Expenditure on Economic Services/Total
Expenditure (per cent)
46.28 39.75 35.79 42.88 34.99
Capital Expenditure/Total Expenditure (per cent) 11.68 14.47 12.61 11.12 14.06
Capital Expenditure on Social and Economic
Services/Total Expenditure (per cent)
11.47 14.22 12.37 10.88 13.60
III Management of Fiscal Imbalances
Revenue Deficit(-)/Surplus(+)/GSDP (per cent) 3.14 1.96 1.35 1.29 1.02
Fiscal Deficit(-)/GSDP (per cent) -1.83 -2.47 -2.27 -2.34 -2.49
Primary Deficit(-)/Surplus(+)/GSDP (per cent) -0.15 -1.01 -0.80 -0.88 -1.06
Revenue Deficit/Fiscal Deficit NA NA NA NA NA
Primary Revenue Balance/GSDP (per cent) 15.02 15.07 14.57 15.54 16.23
6 Revised GSDP figures as communicated by the Government adopted for the year 2011-12 to 2014-15. 7 Finance Accounts 2015-16. 8 Central Transfers comprising of Share of Union Taxes/Duties and Grants from GoI.
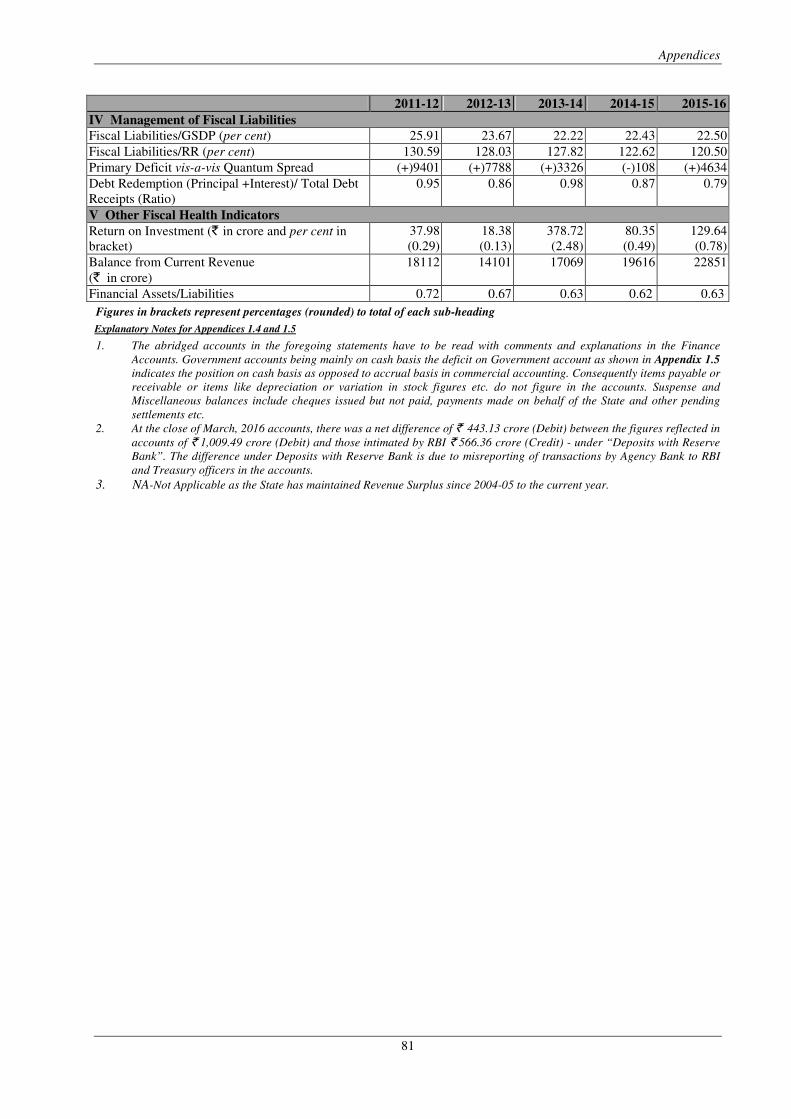
Appendices
81
2011-12 2012-13 2013-14 2014-15 2015-16
IV Management of Fiscal Liabilities
Fiscal Liabilities/GSDP (per cent) 25.91 23.67 22.22 22.43 22.50
Fiscal Liabilities/RR (per cent) 130.59 128.03 127.82 122.62 120.50
Primary Deficit vis-a-vis Quantum Spread (+)9401 (+)7788 (+)3326 (-)108 (+)4634
Debt Redemption (Principal +Interest)/ Total Debt
Receipts (Ratio)
0.95 0.86 0.98 0.87 0.79
V Other Fiscal Health Indicators
Return on Investment (` in crore and per cent in
bracket)
37.98
(0.29)
18.38
(0.13)
378.72
(2.48)
80.35
(0.49)
129.64
(0.78)
Balance from Current Revenue
(` in crore)
18112 14101 17069 19616 22851
Financial Assets/Liabilities 0.72 0.67 0.63 0.62 0.63
Figures in brackets represent percentages (rounded) to total of each sub-heading
Explanatory Notes for Appendices 1.4 and 1.5
1. The abridged accounts in the foregoing statements have to be read with comments and explanations in the Finance
Accounts. Government accounts being mainly on cash basis the deficit on Government account as shown in Appendix 1.5
indicates the position on cash basis as opposed to accrual basis in commercial accounting. Consequently items payable or
receivable or items like depreciation or variation in stock figures etc. do not figure in the accounts. Suspense and
Miscellaneous balances include cheques issued but not paid, payments made on behalf of the State and other pending
settlements etc.
2. At the close of March, 2016 accounts, there was a net difference of ` 443.13 crore (Debit) between the figures reflected in
accounts of ` 1,009.49 crore (Debit) and those intimated by RBI ` 566.36 crore (Credit) - under “Deposits with Reserve
Bank”. The difference under Deposits with Reserve Bank is due to misreporting of transactions by Agency Bank to RBI
and Treasury officers in the accounts.
3. NA-Not Applicable as the State has maintained Revenue Surplus since 2004-05 to the current year.
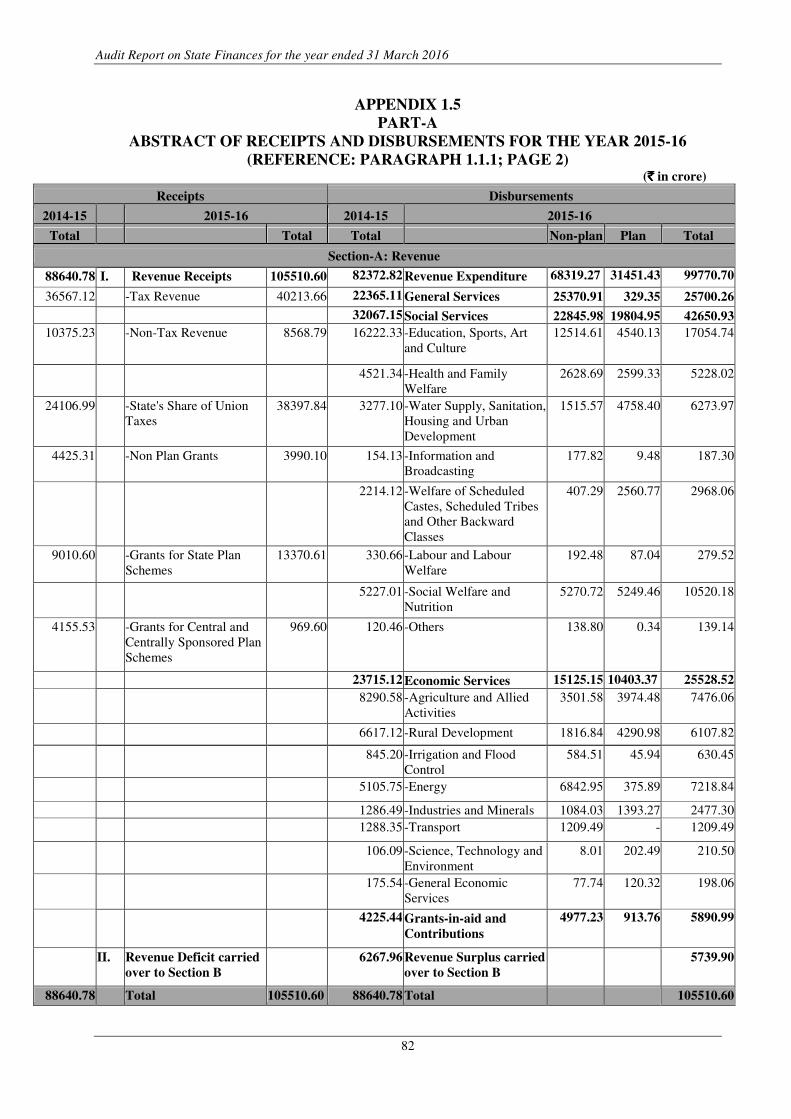
Audit Report on State Finances for the year ended 31 March 2016
82
APPENDIX 1.5
PART-A
ABSTRACT OF RECEIPTS AND DISBURSEMENTS FOR THE YEAR 2015-16
(REFERENCE: PARAGRAPH 1.1.1; PAGE 2) (`̀̀̀ in crore)
Receipts Disbursements
2014-15 2015-16 2014-15 2015-16
Total Total Total Non-plan Plan Total
Section-A: Revenue
88640.78 I. Revenue Receipts 105510.60 82372.82 Revenue Expenditure 68319.27 31451.43 99770.70
36567.12 -Tax Revenue 40213.66 22365.11 General Services 25370.91 329.35 25700.26
32067.15 Social Services 22845.98 19804.95 42650.93
10375.23 -Non-Tax Revenue 8568.79 16222.33 -Education, Sports, Art
and Culture
12514.61 4540.13 17054.74
4521.34 -Health and Family
Welfare
2628.69 2599.33 5228.02
24106.99 -State's Share of Union
Taxes
38397.84 3277.10 -Water Supply, Sanitation,
Housing and Urban
Development
1515.57 4758.40 6273.97
4425.31 -Non Plan Grants 3990.10 154.13 -Information and
Broadcasting
177.82 9.48 187.30
2214.12 -Welfare of Scheduled
Castes, Scheduled Tribes
and Other Backward
Classes
407.29 2560.77 2968.06
9010.60 -Grants for State Plan
Schemes
13370.61 330.66 -Labour and Labour
Welfare
192.48 87.04 279.52
5227.01
-Social Welfare and
Nutrition
5270.72 5249.46 10520.18
4155.53 -Grants for Central and
Centrally Sponsored Plan
Schemes
969.60 120.46 -Others 138.80 0.34 139.14
23715.12 Economic Services 15125.15 10403.37 25528.52
8290.58 -Agriculture and Allied
Activities
3501.58 3974.48 7476.06
6617.12 -Rural Development 1816.84 4290.98 6107.82
845.20 -Irrigation and Flood
Control
584.51 45.94 630.45
5105.75 -Energy 6842.95 375.89 7218.84
1286.49 -Industries and Minerals 1084.03 1393.27 2477.30
1288.35 -Transport 1209.49 - 1209.49
106.09 -Science, Technology and
Environment
8.01 202.49 210.50
175.54 -General Economic
Services
77.74 120.32 198.06
4225.44 Grants-in-aid and
Contributions
4977.23 913.76 5890.99
II. Revenue Deficit carried
over to Section B
6267.96 Revenue Surplus carried
over to Section B
5739.90
88640.78 Total 105510.60 88640.78 Total 105510.60
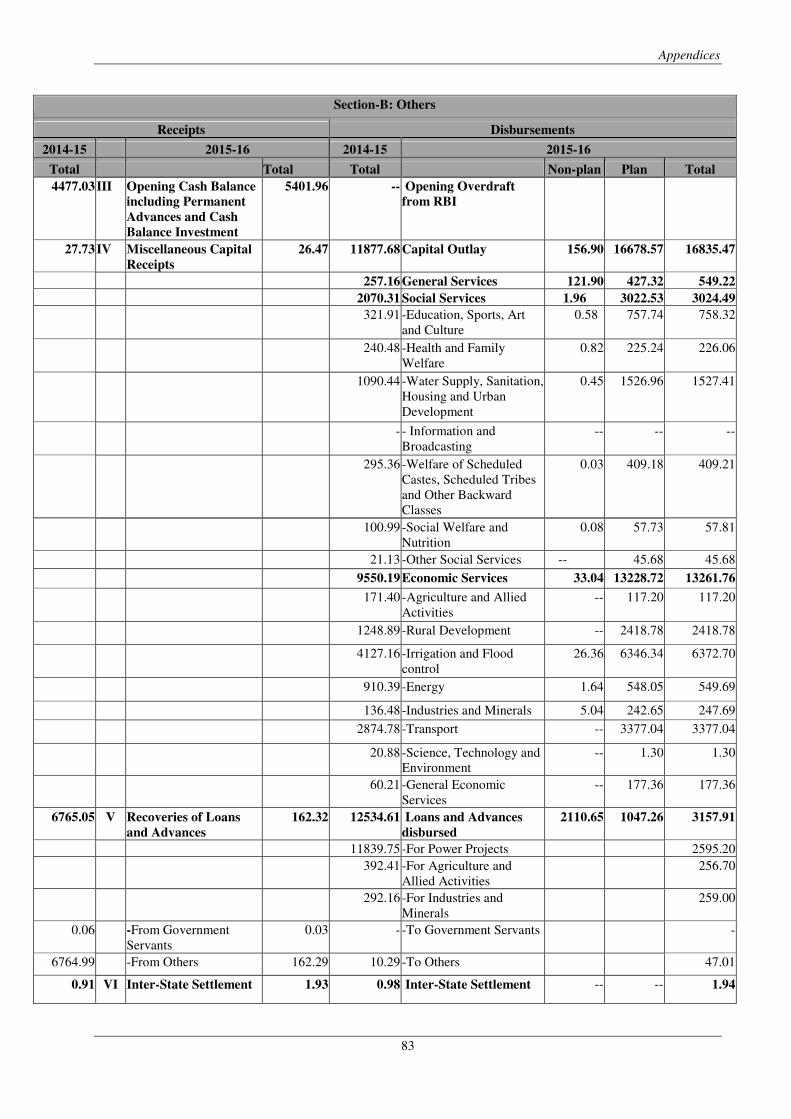
Appendices
83
Section-B: Others
Receipts Disbursements
2014-15 2015-16 2014-15 2015-16
Total Total Total Non-plan Plan Total
4477.03 III Opening Cash Balance
including Permanent
Advances and Cash
Balance Investment
5401.96 -- Opening Overdraft
from RBI
27.73 IV Miscellaneous Capital
Receipts
26.47 11877.68 Capital Outlay 156.90 16678.57 16835.47
257.16 General Services 121.90 427.32 549.22
2070.31 Social Services 1.96 3022.53 3024.49
321.91 -Education, Sports, Art
and Culture
0.58 757.74 758.32
240.48 -Health and Family
Welfare
0.82 225.24 226.06
1090.44 -Water Supply, Sanitation,
Housing and Urban
Development
0.45 1526.96 1527.41
- - Information and
Broadcasting
-- -- --
295.36 -Welfare of Scheduled
Castes, Scheduled Tribes
and Other Backward
Classes
0.03 409.18 409.21
100.99 -Social Welfare and
Nutrition
0.08 57.73 57.81
21.13 -Other Social Services -- 45.68 45.68
9550.19 Economic Services 33.04 13228.72 13261.76
171.40 -Agriculture and Allied
Activities
-- 117.20 117.20
1248.89 -Rural Development -- 2418.78 2418.78
4127.16 -Irrigation and Flood
control
26.36 6346.34 6372.70
910.39 -Energy 1.64 548.05 549.69
136.48 -Industries and Minerals 5.04 242.65 247.69
2874.78 -Transport -- 3377.04 3377.04
20.88 -Science, Technology and
Environment
-- 1.30 1.30
60.21 -General Economic
Services
-- 177.36 177.36
6765.05 V Recoveries of Loans
and Advances
162.32 12534.61 Loans and Advances
disbursed
2110.65 1047.26 3157.91
11839.75 -For Power Projects 2595.20
392.41 -For Agriculture and
Allied Activities
256.70
292.16 -For Industries and
Minerals
259.00
0.06 -From Government
Servants
0.03 - -To Government Servants -
6764.99 -From Others 162.29 10.29 -To Others 47.01
0.91 VI Inter-State Settlement 1.93 0.98 Inter-State Settlement -- -- 1.94
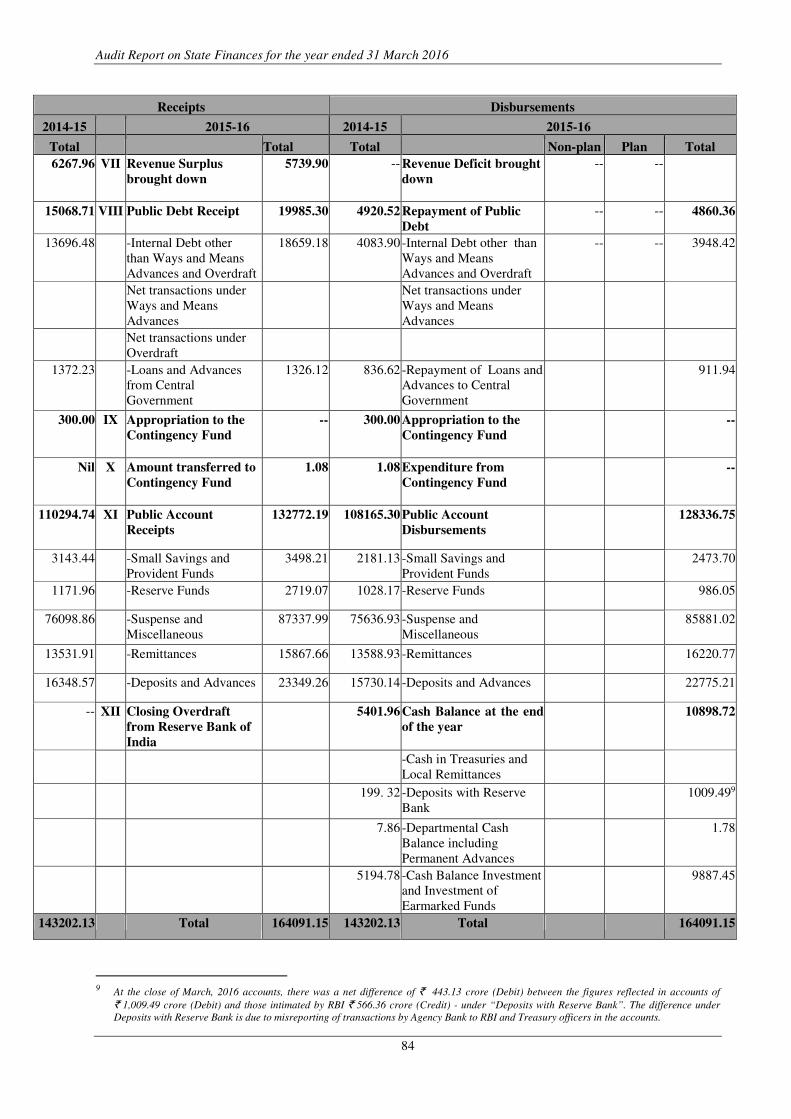
Audit Report on State Finances for the year ended 31 March 2016
84
Receipts Disbursements
2014-15 2015-16 2014-15 2015-16
Total Total Total Non-plan Plan Total
6267.96 VII Revenue Surplus
brought down
5739.90 -- Revenue Deficit brought
down
-- --
15068.71 VIII Public Debt Receipt 19985.30 4920.52 Repayment of Public
Debt
-- -- 4860.36
13696.48 -Internal Debt other
than Ways and Means
Advances and Overdraft
18659.18 4083.90 -Internal Debt other than
Ways and Means
Advances and Overdraft
-- -- 3948.42
Net transactions under
Ways and Means
Advances
Net transactions under
Ways and Means
Advances
Net transactions under
Overdraft
1372.23 -Loans and Advances
from Central
Government
1326.12 836.62 -Repayment of Loans and
Advances to Central
Government
911.94
300.00 IX Appropriation to the
Contingency Fund
-- 300.00 Appropriation to the
Contingency Fund
--
Nil X Amount transferred to
Contingency Fund
1.08 1.08 Expenditure from
Contingency Fund
--
110294.74 XI Public Account
Receipts
132772.19
108165.30 Public Account
Disbursements
128336.75
3143.44 -Small Savings and
Provident Funds
3498.21 2181.13 -Small Savings and
Provident Funds
2473.70
1171.96 -Reserve Funds 2719.07 1028.17 -Reserve Funds 986.05
76098.86 -Suspense and
Miscellaneous
87337.99 75636.93 -Suspense and
Miscellaneous
85881.02
13531.91 -Remittances 15867.66 13588.93 -Remittances 16220.77
16348.57 -Deposits and Advances 23349.26 15730.14 -Deposits and Advances 22775.21
-- XII Closing Overdraft
from Reserve Bank of
India
5401.96 Cash Balance at the end
of the year
10898.72
-Cash in Treasuries and
Local Remittances
199. 32 -Deposits with Reserve
Bank
1009.499
7.86 -Departmental Cash
Balance including
Permanent Advances
1.78
5194.78 -Cash Balance Investment
and Investment of
Earmarked Funds
9887.45
143202.13 Total 164091.15 143202.13 Total 164091.15
9 At the close of March, 2016 accounts, there was a net difference of ` 443.13 crore (Debit) between the figures reflected in accounts of
` 1,009.49 crore (Debit) and those intimated by RBI ` 566.36 crore (Credit) - under “Deposits with Reserve Bank”. The difference under
Deposits with Reserve Bank is due to misreporting of transactions by Agency Bank to RBI and Treasury officers in the accounts.
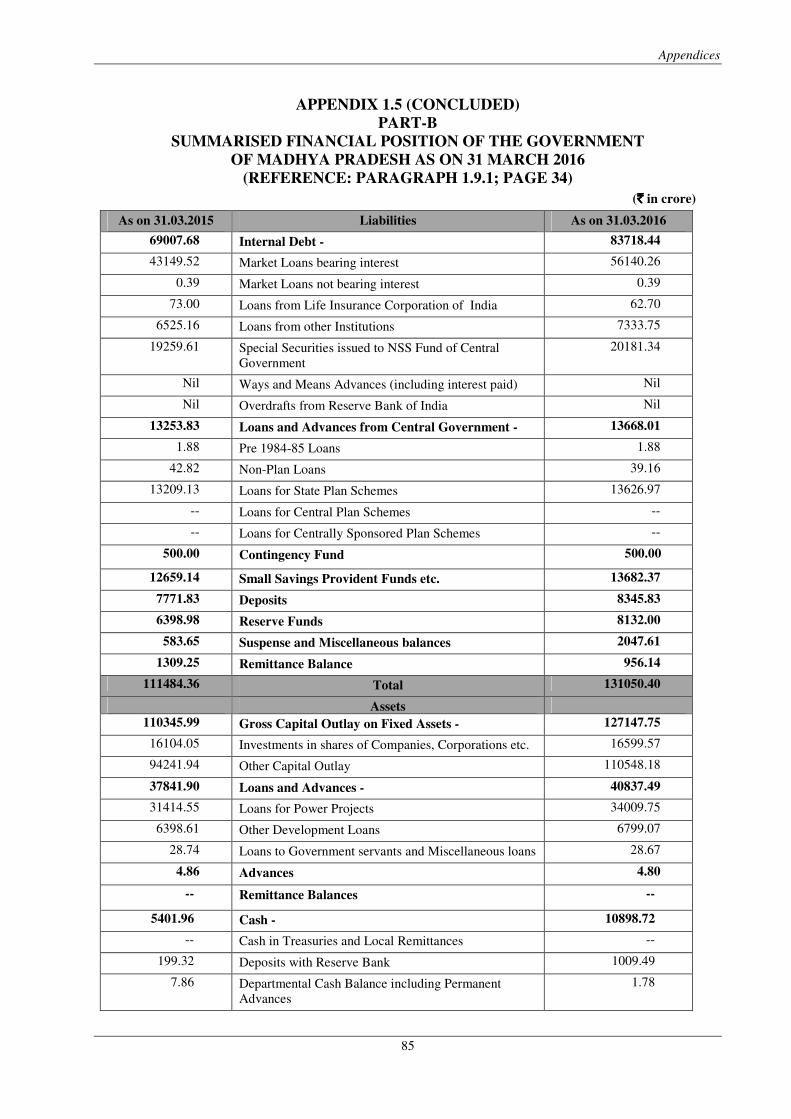
Appendices
85
APPENDIX 1.5 (CONCLUDED)
PART-B
SUMMARISED FINANCIAL POSITION OF THE GOVERNMENT
OF MADHYA PRADESH AS ON 31 MARCH 2016
(REFERENCE: PARAGRAPH 1.9.1; PAGE 34)
(`̀̀̀ in crore)
As on 31.03.2015 Liabilities As on 31.03.2016
69007.68 Internal Debt - 83718.44
43149.52 Market Loans bearing interest 56140.26
0.39 Market Loans not bearing interest 0.39
73.00 Loans from Life Insurance Corporation of India 62.70
6525.16 Loans from other Institutions 7333.75
19259.61 Special Securities issued to NSS Fund of Central
Government
20181.34
Nil Ways and Means Advances (including interest paid) Nil
Nil Overdrafts from Reserve Bank of India Nil
13253.83 Loans and Advances from Central Government - 13668.01
1.88 Pre 1984-85 Loans 1.88
42.82 Non-Plan Loans 39.16
13209.13 Loans for State Plan Schemes 13626.97
-- Loans for Central Plan Schemes --
-- Loans for Centrally Sponsored Plan Schemes --
500.00 Contingency Fund 500.00
12659.14 Small Savings Provident Funds etc. 13682.37
7771.83 Deposits 8345.83
6398.98 Reserve Funds 8132.00
583.65 Suspense and Miscellaneous balances 2047.61
1309.25 Remittance Balance 956.14
111484.36 Total 131050.40
Assets
110345.99 Gross Capital Outlay on Fixed Assets - 127147.75
16104.05 Investments in shares of Companies, Corporations etc. 16599.57
94241.94 Other Capital Outlay 110548.18
37841.90 Loans and Advances - 40837.49
31414.55 Loans for Power Projects 34009.75
6398.61 Other Development Loans 6799.07
28.74 Loans to Government servants and Miscellaneous loans 28.67
4.86 Advances 4.80
-- Remittance Balances --
5401.96 Cash - 10898.72
-- Cash in Treasuries and Local Remittances --
199.32 Deposits with Reserve Bank 1009.49
7.86 Departmental Cash Balance including Permanent
Advances
1.78
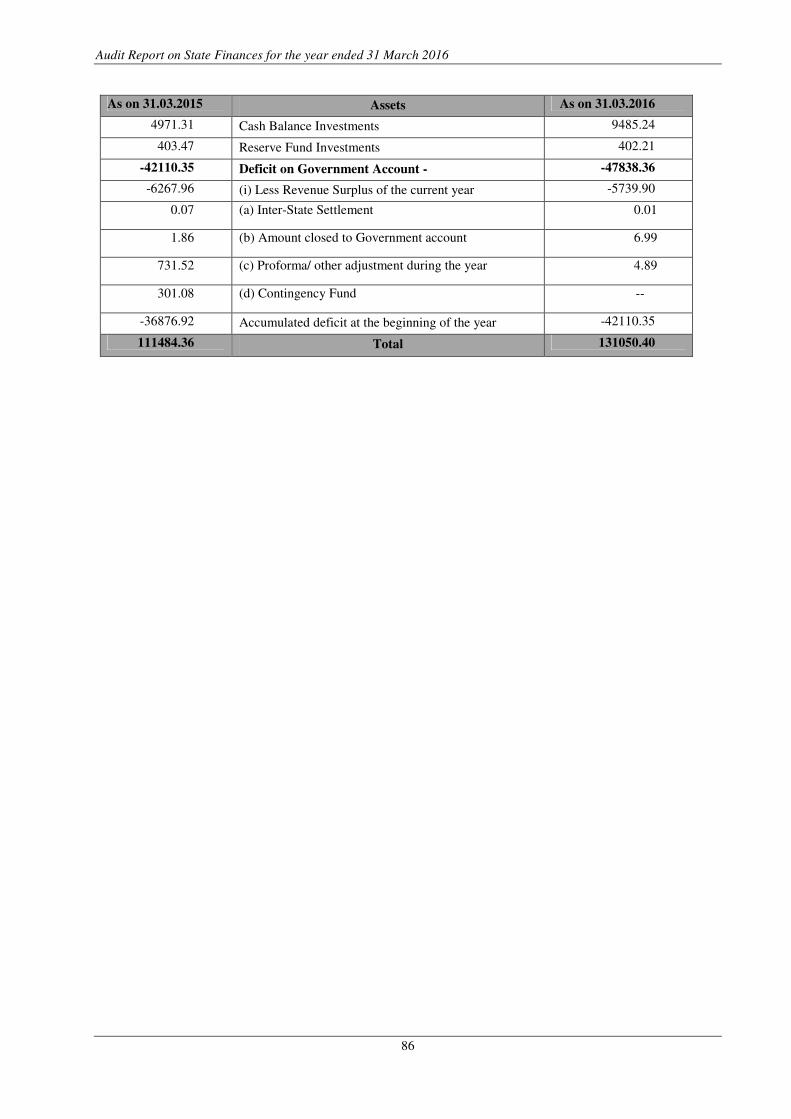
Audit Report on State Finances for the year ended 31 March 2016
86
As on 31.03.2015 Assets As on 31.03.2016
4971.31 Cash Balance Investments 9485.24
403.47 Reserve Fund Investments 402.21
-42110.35 Deficit on Government Account - -47838.36
-6267.96 (i) Less Revenue Surplus of the current year -5739.90
0.07 (a) Inter-State Settlement 0.01
1.86 (b) Amount closed to Government account 6.99
731.52 (c) Proforma/ other adjustment during the year 4.89
301.08 (d) Contingency Fund --
-36876.92 Accumulated deficit at the beginning of the year -42110.35
111484.36 Total 131050.40
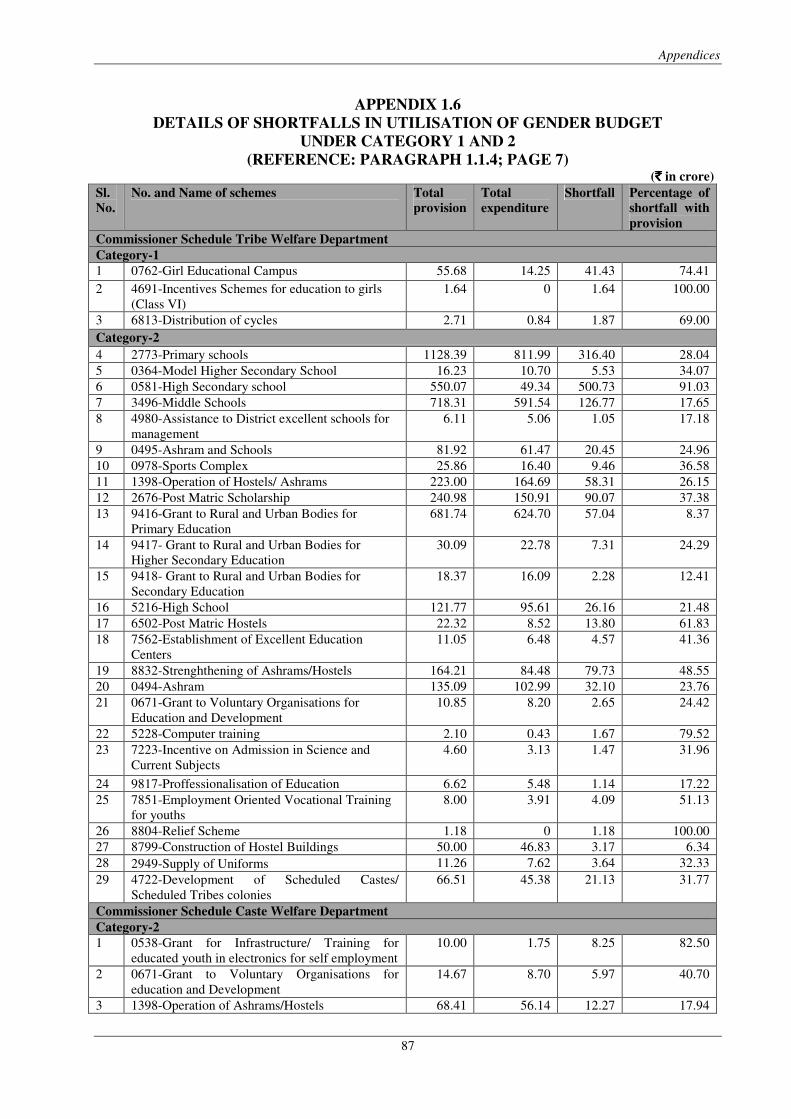
Appendices
87
APPENDIX 1.6
DETAILS OF SHORTFALLS IN UTILISATION OF GENDER BUDGET
UNDER CATEGORY 1 AND 2
(REFERENCE: PARAGRAPH 1.1.4; PAGE 7) (`̀̀̀ in crore)
Sl.
No.
No. and Name of schemes Total
provision
Total
expenditure
Shortfall Percentage of
shortfall with
provision
Commissioner Schedule Tribe Welfare Department
Category-1
1 0762-Girl Educational Campus 55.68 14.25 41.43 74.41
2 4691-Incentives Schemes for education to girls
(Class VI)
1.64 0 1.64 100.00
3 6813-Distribution of cycles 2.71 0.84 1.87 69.00
Category-2
4 2773-Primary schools 1128.39 811.99 316.40 28.04
5 0364-Model Higher Secondary School 16.23 10.70 5.53 34.07
6 0581-High Secondary school 550.07 49.34 500.73 91.03
7 3496-Middle Schools 718.31 591.54 126.77 17.65
8 4980-Assistance to District excellent schools for
management
6.11 5.06 1.05 17.18
9 0495-Ashram and Schools 81.92 61.47 20.45 24.96
10 0978-Sports Complex 25.86 16.40 9.46 36.58
11 1398-Operation of Hostels/ Ashrams 223.00 164.69 58.31 26.15
12 2676-Post Matric Scholarship 240.98 150.91 90.07 37.38
13 9416-Grant to Rural and Urban Bodies for
Primary Education
681.74 624.70 57.04 8.37
14 9417- Grant to Rural and Urban Bodies for
Higher Secondary Education
30.09 22.78 7.31 24.29
15 9418- Grant to Rural and Urban Bodies for
Secondary Education
18.37 16.09 2.28 12.41
16 5216-High School 121.77 95.61 26.16 21.48
17 6502-Post Matric Hostels 22.32 8.52 13.80 61.83
18 7562-Establishment of Excellent Education
Centers
11.05 6.48 4.57 41.36
19 8832-Strenghthening of Ashrams/Hostels 164.21 84.48 79.73 48.55
20 0494-Ashram 135.09 102.99 32.10 23.76
21 0671-Grant to Voluntary Organisations for
Education and Development
10.85 8.20 2.65 24.42
22 5228-Computer training 2.10 0.43 1.67 79.52
23 7223-Incentive on Admission in Science and
Current Subjects
4.60 3.13 1.47 31.96
24 9817-Proffessionalisation of Education 6.62 5.48 1.14 17.22
25 7851-Employment Oriented Vocational Training
for youths
8.00 3.91 4.09 51.13
26 8804-Relief Scheme 1.18 0 1.18 100.00
27 8799-Construction of Hostel Buildings 50.00 46.83 3.17 6.34
28 2949-Supply of Uniforms 11.26 7.62 3.64 32.33
29 4722-Development of Scheduled Castes/
Scheduled Tribes colonies
66.51 45.38 21.13 31.77
Commissioner Schedule Caste Welfare Department
Category-2
1 0538-Grant for Infrastructure/ Training for
educated youth in electronics for self employment
10.00 1.75 8.25 82.50
2 0671-Grant to Voluntary Organisations for
education and Development
14.67 8.70 5.97 40.70
3 1398-Operation of Ashrams/Hostels 68.41 56.14 12.27 17.94
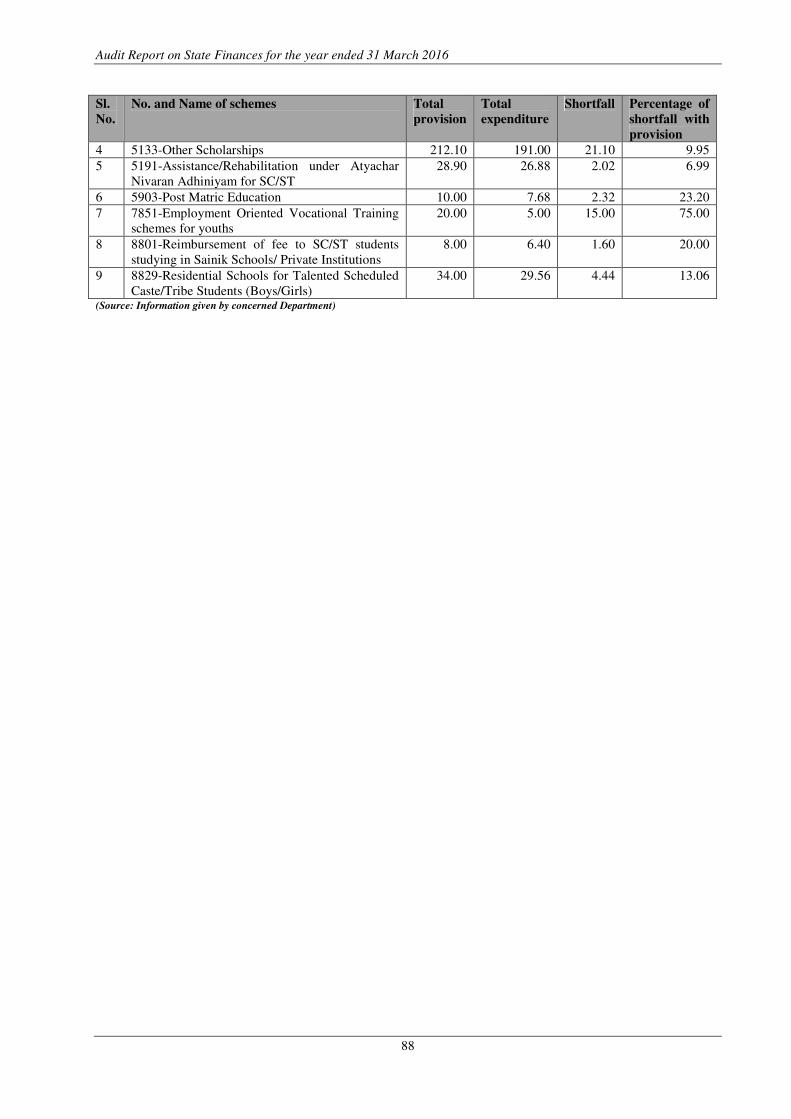
Audit Report on State Finances for the year ended 31 March 2016
88
Sl.
No.
No. and Name of schemes Total
provision
Total
expenditure
Shortfall Percentage of
shortfall with
provision
4 5133-Other Scholarships 212.10 191.00 21.10 9.95
5 5191-Assistance/Rehabilitation under Atyachar
Nivaran Adhiniyam for SC/ST
28.90 26.88 2.02 6.99
6 5903-Post Matric Education 10.00 7.68 2.32 23.20
7 7851-Employment Oriented Vocational Training
schemes for youths
20.00 5.00 15.00 75.00
8 8801-Reimbursement of fee to SC/ST students
studying in Sainik Schools/ Private Institutions
8.00 6.40 1.60 20.00
9 8829-Residential Schools for Talented Scheduled
Caste/Tribe Students (Boys/Girls)
34.00 29.56 4.44 13.06
(Source: Information given by concerned Department)
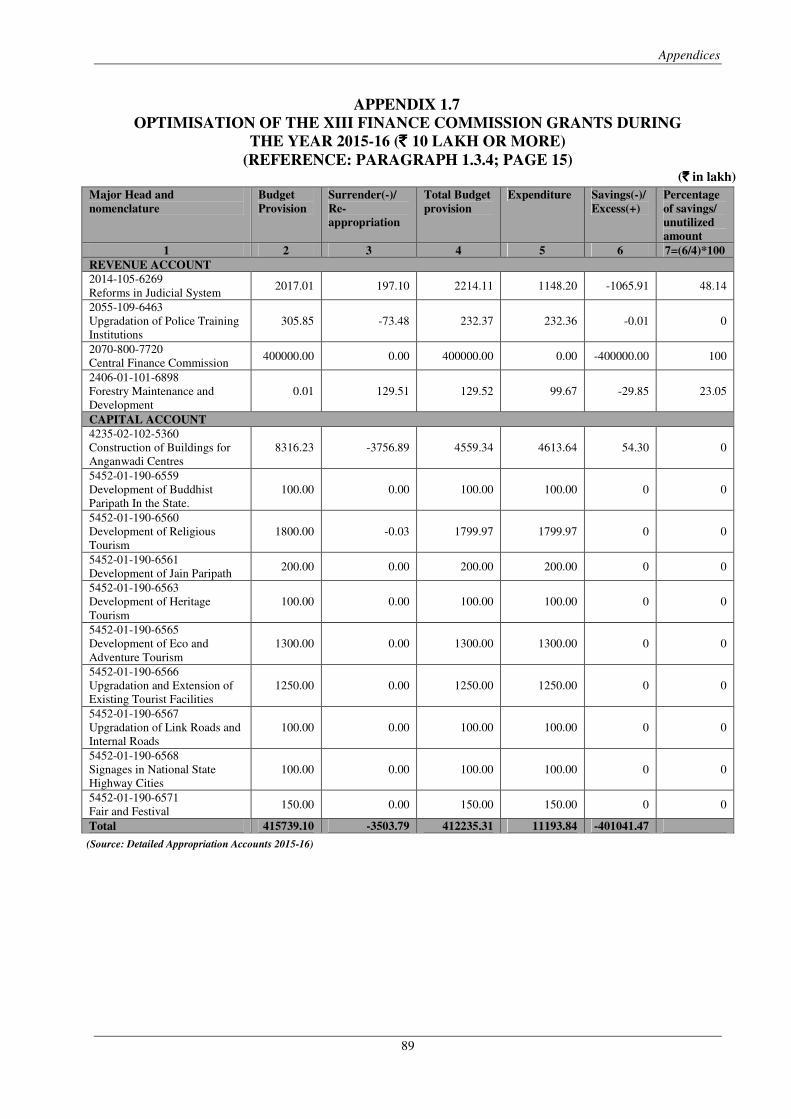
Appendices
89
APPENDIX 1.7
OPTIMISATION OF THE XIII FINANCE COMMISSION GRANTS DURING
THE YEAR 2015-16 (` ` ` ` 10 LAKH OR MORE)
(REFERENCE: PARAGRAPH 1.3.4; PAGE 15) (`̀̀̀ in lakh)
(Source: Detailed Appropriation Accounts 2015-16)
Major Head and
nomenclature
Budget
Provision
Surrender(-)/
Re-
appropriation
Total Budget
provision
Expenditure Savings(-)/
Excess(+)
Percentage
of savings/
unutilized
amount
1 2 3 4 5 6 7=(6/4)*100
REVENUE ACCOUNT
2014-105-6269
Reforms in Judicial System 2017.01 197.10 2214.11 1148.20 -1065.91 48.14
2055-109-6463
Upgradation of Police Training
Institutions
305.85 -73.48 232.37 232.36 -0.01 0
2070-800-7720
Central Finance Commission 400000.00 0.00 400000.00 0.00 -400000.00 100
2406-01-101-6898
Forestry Maintenance and
Development
0.01 129.51 129.52 99.67 -29.85 23.05
CAPITAL ACCOUNT
4235-02-102-5360
Construction of Buildings for
Anganwadi Centres
8316.23 -3756.89 4559.34 4613.64 54.30 0
5452-01-190-6559
Development of Buddhist
Paripath In the State.
100.00 0.00 100.00 100.00 0 0
5452-01-190-6560
Development of Religious
Tourism
1800.00 -0.03 1799.97 1799.97 0 0
5452-01-190-6561
Development of Jain Paripath 200.00 0.00 200.00 200.00 0 0
5452-01-190-6563
Development of Heritage
Tourism
100.00 0.00 100.00 100.00 0 0
5452-01-190-6565
Development of Eco and
Adventure Tourism
1300.00 0.00 1300.00 1300.00 0 0
5452-01-190-6566
Upgradation and Extension of
Existing Tourist Facilities
1250.00 0.00 1250.00 1250.00 0 0
5452-01-190-6567
Upgradation of Link Roads and
Internal Roads
100.00 0.00 100.00 100.00 0 0
5452-01-190-6568
Signages in National State
Highway Cities
100.00 0.00 100.00 100.00 0 0
5452-01-190-6571
Fair and Festival 150.00 0.00 150.00 150.00 0 0
Total 415739.10 -3503.79 412235.31 11193.84 -401041.47
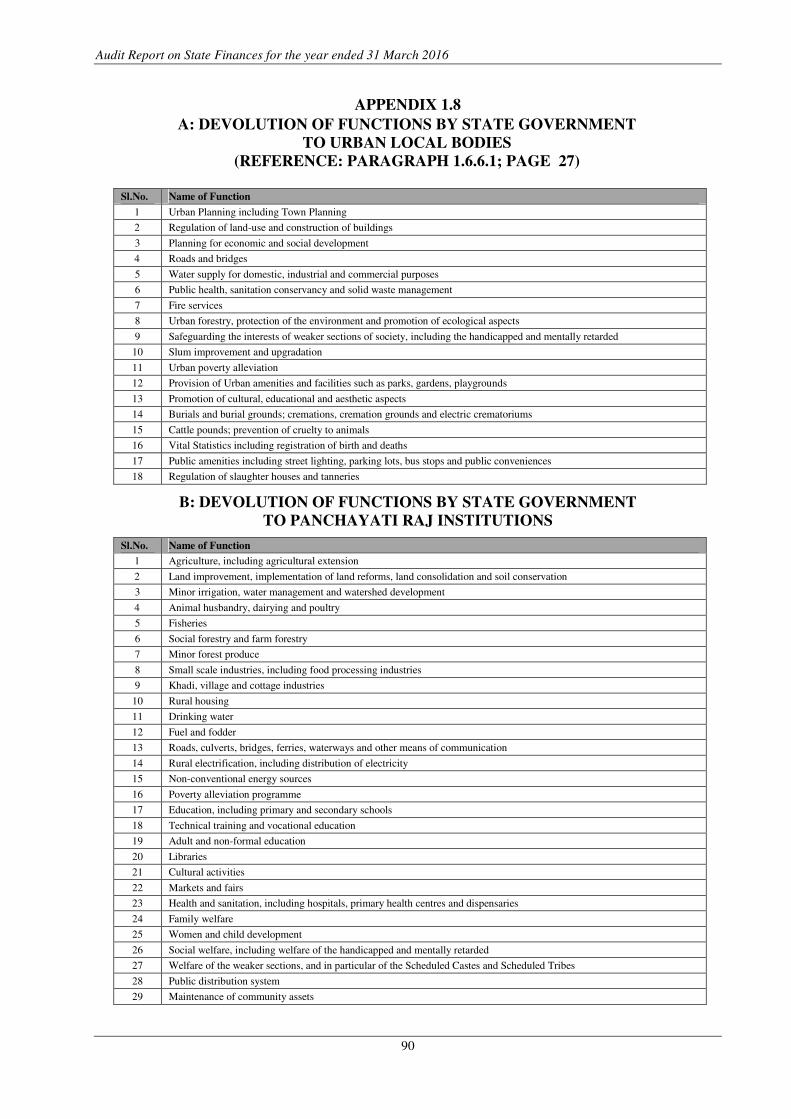
Audit Report on State Finances for the year ended 31 March 2016
90
APPENDIX 1.8
A: DEVOLUTION OF FUNCTIONS BY STATE GOVERNMENT
TO URBAN LOCAL BODIES
(REFERENCE: PARAGRAPH 1.6.6.1; PAGE 27)
Sl.No. Name of Function
1 Urban Planning including Town Planning
2 Regulation of land-use and construction of buildings
3 Planning for economic and social development
4 Roads and bridges
5 Water supply for domestic, industrial and commercial purposes
6 Public health, sanitation conservancy and solid waste management
7 Fire services
8 Urban forestry, protection of the environment and promotion of ecological aspects
9 Safeguarding the interests of weaker sections of society, including the handicapped and mentally retarded
10 Slum improvement and upgradation
11 Urban poverty alleviation
12 Provision of Urban amenities and facilities such as parks, gardens, playgrounds
13 Promotion of cultural, educational and aesthetic aspects
14 Burials and burial grounds; cremations, cremation grounds and electric crematoriums
15 Cattle pounds; prevention of cruelty to animals
16 Vital Statistics including registration of birth and deaths
17 Public amenities including street lighting, parking lots, bus stops and public conveniences
18 Regulation of slaughter houses and tanneries
B: DEVOLUTION OF FUNCTIONS BY STATE GOVERNMENT
TO PANCHAYATI RAJ INSTITUTIONS
Sl.No. Name of Function
1 Agriculture, including agricultural extension
2 Land improvement, implementation of land reforms, land consolidation and soil conservation
3 Minor irrigation, water management and watershed development
4 Animal husbandry, dairying and poultry
5 Fisheries
6 Social forestry and farm forestry
7 Minor forest produce
8 Small scale industries, including food processing industries
9 Khadi, village and cottage industries
10 Rural housing
11 Drinking water
12 Fuel and fodder
13 Roads, culverts, bridges, ferries, waterways and other means of communication
14 Rural electrification, including distribution of electricity
15 Non-conventional energy sources
16 Poverty alleviation programme
17 Education, including primary and secondary schools
18 Technical training and vocational education
19 Adult and non-formal education
20 Libraries
21 Cultural activities
22 Markets and fairs
23 Health and sanitation, including hospitals, primary health centres and dispensaries
24 Family welfare
25 Women and child development
26 Social welfare, including welfare of the handicapped and mentally retarded
27 Welfare of the weaker sections, and in particular of the Scheduled Castes and Scheduled Tribes
28 Public distribution system
29 Maintenance of community assets
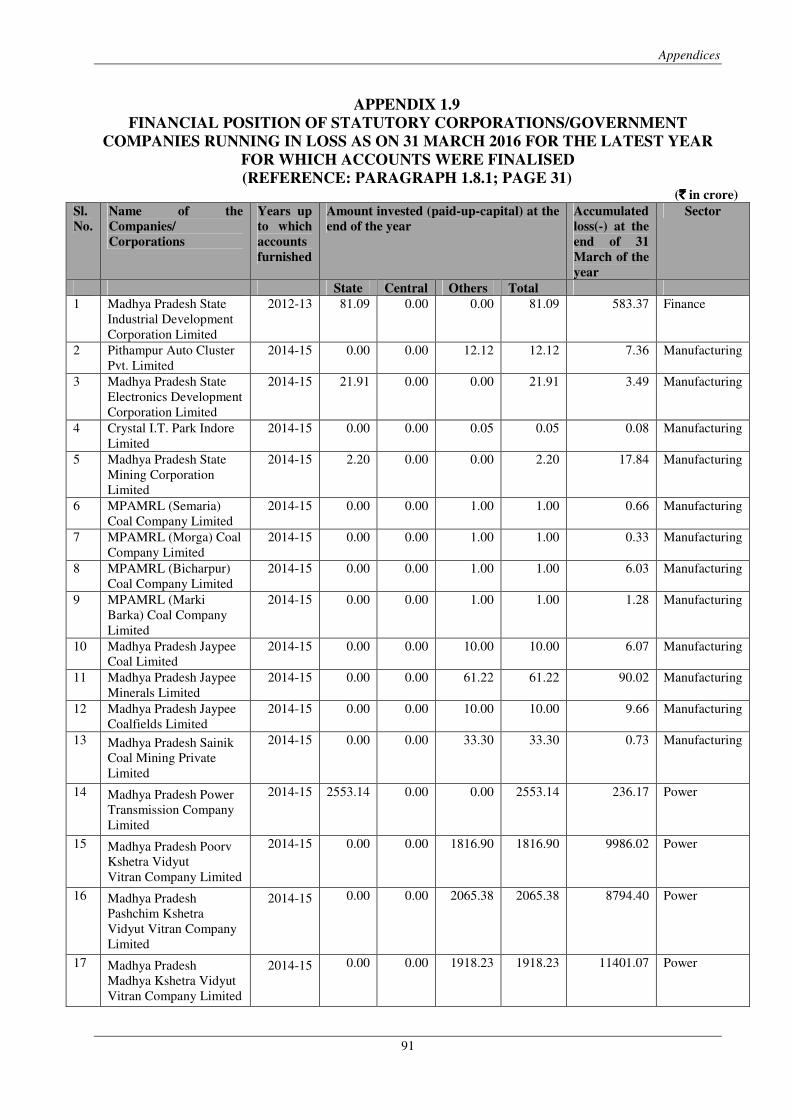
Appendices
91
APPENDIX 1.9
FINANCIAL POSITION OF STATUTORY CORPORATIONS/GOVERNMENT
COMPANIES RUNNING IN LOSS AS ON 31 MARCH 2016 FOR THE LATEST YEAR
FOR WHICH ACCOUNTS WERE FINALISED
(REFERENCE: PARAGRAPH 1.8.1; PAGE 31) (`̀̀̀ in crore)
Sl.
No.
Name of the
Companies/
Corporations
Years up
to which
accounts
furnished
Amount invested (paid-up-capital) at the
end of the year
Accumulated
loss(-) at the
end of 31
March of the
year
Sector
State Central Others Total
1 Madhya Pradesh State
Industrial Development
Corporation Limited
2012-13 81.09 0.00 0.00 81.09 583.37 Finance
2 Pithampur Auto Cluster
Pvt. Limited
2014-15 0.00 0.00 12.12 12.12 7.36 Manufacturing
3 Madhya Pradesh State
Electronics Development
Corporation Limited
2014-15 21.91 0.00 0.00 21.91 3.49 Manufacturing
4 Crystal I.T. Park Indore
Limited
2014-15 0.00 0.00 0.05 0.05 0.08 Manufacturing
5 Madhya Pradesh State
Mining Corporation
Limited
2014-15 2.20 0.00 0.00 2.20 17.84 Manufacturing
6 MPAMRL (Semaria)
Coal Company Limited
2014-15 0.00 0.00 1.00 1.00 0.66 Manufacturing
7 MPAMRL (Morga) Coal
Company Limited
2014-15 0.00 0.00 1.00 1.00 0.33 Manufacturing
8 MPAMRL (Bicharpur)
Coal Company Limited
2014-15 0.00 0.00 1.00 1.00 6.03 Manufacturing
9 MPAMRL (Marki
Barka) Coal Company
Limited
2014-15 0.00 0.00 1.00 1.00 1.28 Manufacturing
10 Madhya Pradesh Jaypee
Coal Limited
2014-15 0.00 0.00 10.00 10.00 6.07 Manufacturing
11 Madhya Pradesh Jaypee
Minerals Limited
2014-15 0.00 0.00 61.22 61.22 90.02 Manufacturing
12 Madhya Pradesh Jaypee
Coalfields Limited
2014-15 0.00 0.00 10.00 10.00 9.66 Manufacturing
13 Madhya Pradesh Sainik
Coal Mining Private
Limited
2014-15 0.00 0.00 33.30 33.30 0.73 Manufacturing
14 Madhya Pradesh Power
Transmission Company
Limited
2014-15 2553.14 0.00 0.00 2553.14 236.17 Power
15 Madhya Pradesh Poorv
Kshetra Vidyut
Vitran Company Limited
2014-15 0.00 0.00 1816.90 1816.90 9986.02 Power
16 Madhya Pradesh
Pashchim Kshetra
Vidyut Vitran Company
Limited
2014-15 0.00 0.00 2065.38 2065.38 8794.40 Power
17 Madhya Pradesh
Madhya Kshetra Vidyut
Vitran Company Limited
2014-15 0.00 0.00 1918.23 1918.23 11401.07 Power
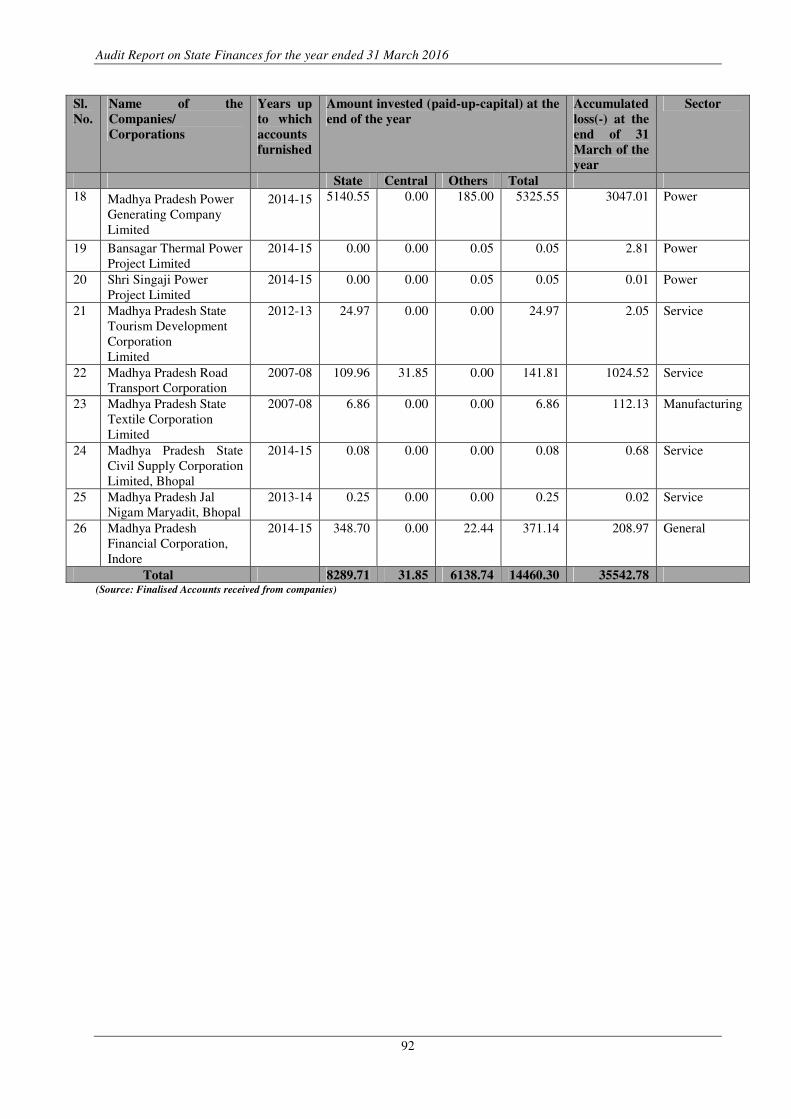
Audit Report on State Finances for the year ended 31 March 2016
92
Sl.
No.
Name of the
Companies/
Corporations
Years up
to which
accounts
furnished
Amount invested (paid-up-capital) at the
end of the year
Accumulated
loss(-) at the
end of 31
March of the
year
Sector
State Central Others Total
18 Madhya Pradesh Power
Generating Company
Limited
2014-15 5140.55 0.00 185.00 5325.55 3047.01 Power
19 Bansagar Thermal Power
Project Limited
2014-15 0.00 0.00 0.05 0.05 2.81 Power
20 Shri Singaji Power
Project Limited
2014-15 0.00 0.00 0.05 0.05 0.01 Power
21 Madhya Pradesh State
Tourism Development
Corporation
Limited
2012-13 24.97 0.00 0.00 24.97 2.05 Service
22 Madhya Pradesh Road
Transport Corporation
2007-08 109.96 31.85 0.00 141.81 1024.52 Service
23 Madhya Pradesh State
Textile Corporation
Limited
2007-08 6.86 0.00 0.00 6.86 112.13 Manufacturing
24 Madhya Pradesh State
Civil Supply Corporation
Limited, Bhopal
2014-15 0.08 0.00 0.00 0.08 0.68 Service
25 Madhya Pradesh Jal
Nigam Maryadit, Bhopal
2013-14 0.25 0.00 0.00 0.25 0.02 Service
26 Madhya Pradesh
Financial Corporation,
Indore
2014-15 348.70 0.00 22.44 371.14 208.97 General
Total 8289.71 31.85 6138.74 14460.30 35542.78 (Source: Finalised Accounts received from companies)
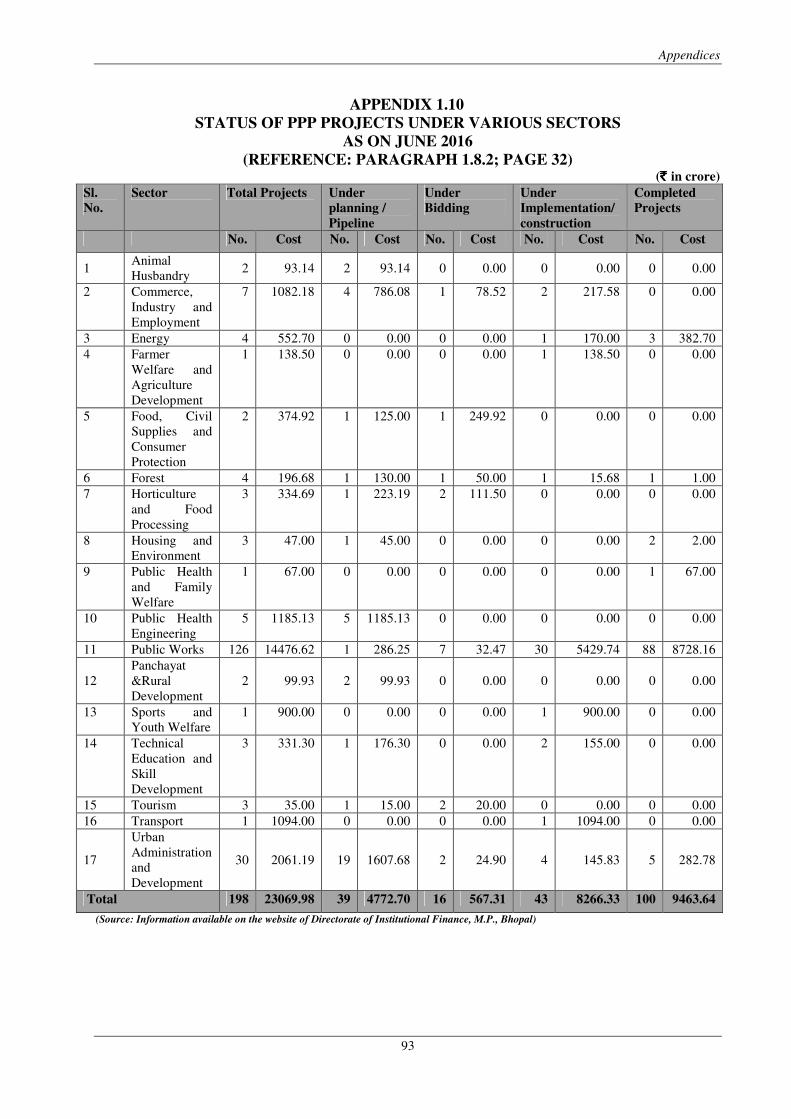
Appendices
93
APPENDIX 1.10
STATUS OF PPP PROJECTS UNDER VARIOUS SECTORS
AS ON JUNE 2016
(REFERENCE: PARAGRAPH 1.8.2; PAGE 32) (` ` ` ` in crore)
Sl.
No.
Sector Total Projects Under
planning /
Pipeline
Under
Bidding
Under
Implementation/
construction
Completed
Projects
No. Cost No. Cost No. Cost No. Cost No. Cost
1 Animal
Husbandry 2 93.14 2 93.14 0 0.00 0 0.00 0 0.00
2 Commerce,
Industry and
Employment
7 1082.18 4 786.08 1 78.52 2 217.58 0 0.00
3 Energy 4 552.70 0 0.00 0 0.00 1 170.00 3 382.70
4 Farmer
Welfare and
Agriculture
Development
1 138.50 0 0.00 0 0.00 1 138.50 0 0.00
5 Food, Civil
Supplies and
Consumer
Protection
2 374.92 1 125.00 1 249.92 0 0.00 0 0.00
6 Forest 4 196.68 1 130.00 1 50.00 1 15.68 1 1.00
7 Horticulture
and Food
Processing
3 334.69 1 223.19 2 111.50 0 0.00 0 0.00
8 Housing and
Environment
3 47.00 1 45.00 0 0.00 0 0.00 2 2.00
9 Public Health
and Family
Welfare
1 67.00 0 0.00 0 0.00 0 0.00 1 67.00
10 Public Health
Engineering
5 1185.13 5 1185.13 0 0.00 0 0.00 0 0.00
11 Public Works 126 14476.62 1 286.25 7 32.47 30 5429.74 88 8728.16
12
Panchayat
&Rural
Development
2 99.93 2 99.93 0 0.00 0 0.00 0 0.00
13 Sports and
Youth Welfare
1 900.00 0 0.00 0 0.00 1 900.00 0 0.00
14 Technical
Education and
Skill
Development
3 331.30 1 176.30 0 0.00 2 155.00 0 0.00
15 Tourism 3 35.00 1 15.00 2 20.00 0 0.00 0 0.00
16 Transport 1 1094.00 0 0.00 0 0.00 1 1094.00 0 0.00
17
Urban
Administration
and
Development
30 2061.19 19 1607.68 2 24.90 4 145.83 5 282.78
Total 198 23069.98 39 4772.70 16 567.31 43 8266.33 100 9463.64
(Source: Information available on the website of Directorate of Institutional Finance, M.P., Bhopal)
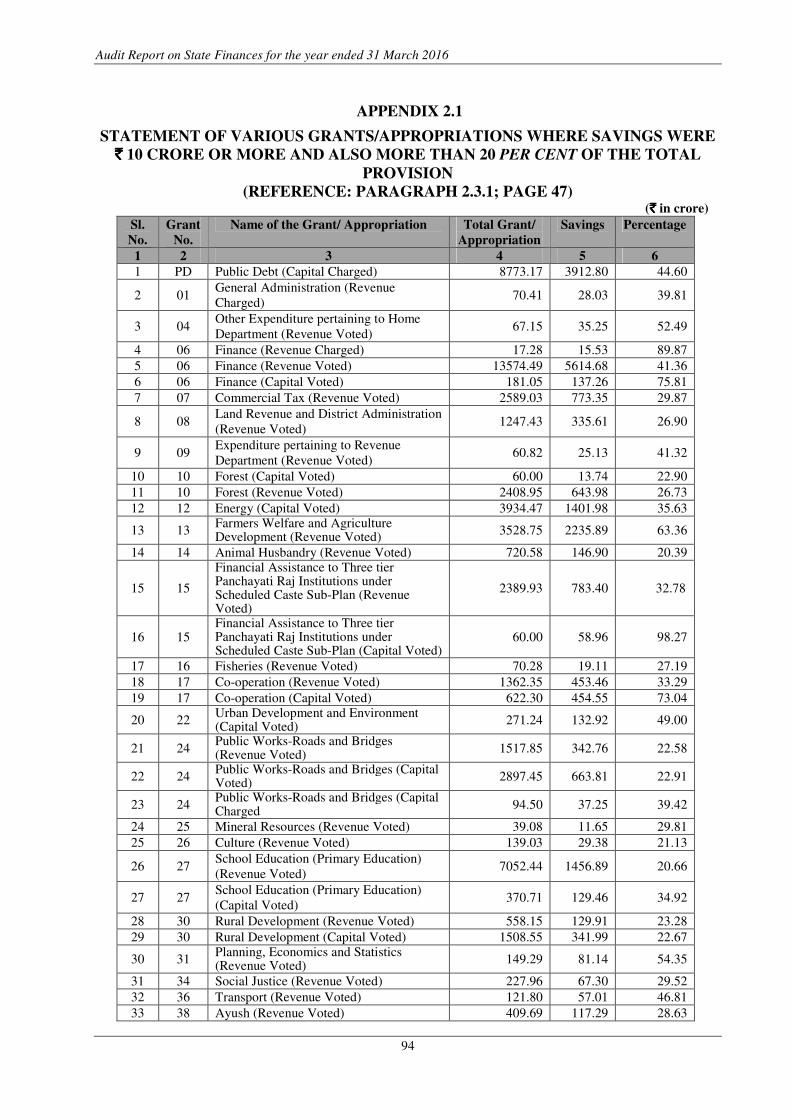
Audit Report on State Finances for the year ended 31 March 2016
94
APPENDIX 2.1
STATEMENT OF VARIOUS GRANTS/APPROPRIATIONS WHERE SAVINGS WERE
`̀̀̀ 10 CRORE OR MORE AND ALSO MORE THAN 20 PER CENT OF THE TOTAL
PROVISION
(REFERENCE: PARAGRAPH 2.3.1; PAGE 47) (`̀̀̀ in crore)
Sl.
No.
Grant
No.
Name of the Grant/ Appropriation Total Grant/
Appropriation
Savings Percentage
1 2 3 4 5 6
1 PD Public Debt (Capital Charged) 8773.17 3912.80 44.60
2 01 General Administration (Revenue
Charged) 70.41 28.03 39.81
3 04 Other Expenditure pertaining to Home
Department (Revenue Voted) 67.15 35.25 52.49
4 06 Finance (Revenue Charged) 17.28 15.53 89.87
5 06 Finance (Revenue Voted) 13574.49 5614.68 41.36
6 06 Finance (Capital Voted) 181.05 137.26 75.81
7 07 Commercial Tax (Revenue Voted) 2589.03 773.35 29.87
8 08 Land Revenue and District Administration
(Revenue Voted) 1247.43 335.61 26.90
9 09 Expenditure pertaining to Revenue
Department (Revenue Voted) 60.82 25.13 41.32
10 10 Forest (Capital Voted) 60.00 13.74 22.90
11 10 Forest (Revenue Voted) 2408.95 643.98 26.73
12 12 Energy (Capital Voted) 3934.47 1401.98 35.63
13 13 Farmers Welfare and Agriculture Development (Revenue Voted)
3528.75 2235.89 63.36
14 14 Animal Husbandry (Revenue Voted) 720.58 146.90 20.39
15 15
Financial Assistance to Three tier Panchayati Raj Institutions under Scheduled Caste Sub-Plan (Revenue Voted)
2389.93 783.40 32.78
16 15 Financial Assistance to Three tier Panchayati Raj Institutions under Scheduled Caste Sub-Plan (Capital Voted)
60.00 58.96 98.27
17 16 Fisheries (Revenue Voted) 70.28 19.11 27.19
18 17 Co-operation (Revenue Voted) 1362.35 453.46 33.29
19 17 Co-operation (Capital Voted) 622.30 454.55 73.04
20 22 Urban Development and Environment (Capital Voted)
271.24 132.92 49.00
21 24 Public Works-Roads and Bridges (Revenue Voted)
1517.85 342.76 22.58
22 24 Public Works-Roads and Bridges (Capital Voted)
2897.45 663.81 22.91
23 24 Public Works-Roads and Bridges (Capital Charged
94.50 37.25 39.42
24 25 Mineral Resources (Revenue Voted) 39.08 11.65 29.81
25 26 Culture (Revenue Voted) 139.03 29.38 21.13
26 27 School Education (Primary Education)
(Revenue Voted) 7052.44 1456.89 20.66
27 27 School Education (Primary Education)
(Capital Voted) 370.71 129.46 34.92
28 30 Rural Development (Revenue Voted) 558.15 129.91 23.28
29 30 Rural Development (Capital Voted) 1508.55 341.99 22.67
30 31 Planning, Economics and Statistics (Revenue Voted)
149.29 81.14 54.35
31 34 Social Justice (Revenue Voted) 227.96 67.30 29.52
32 36 Transport (Revenue Voted) 121.80 57.01 46.81
33 38 Ayush (Revenue Voted) 409.69 117.29 28.63
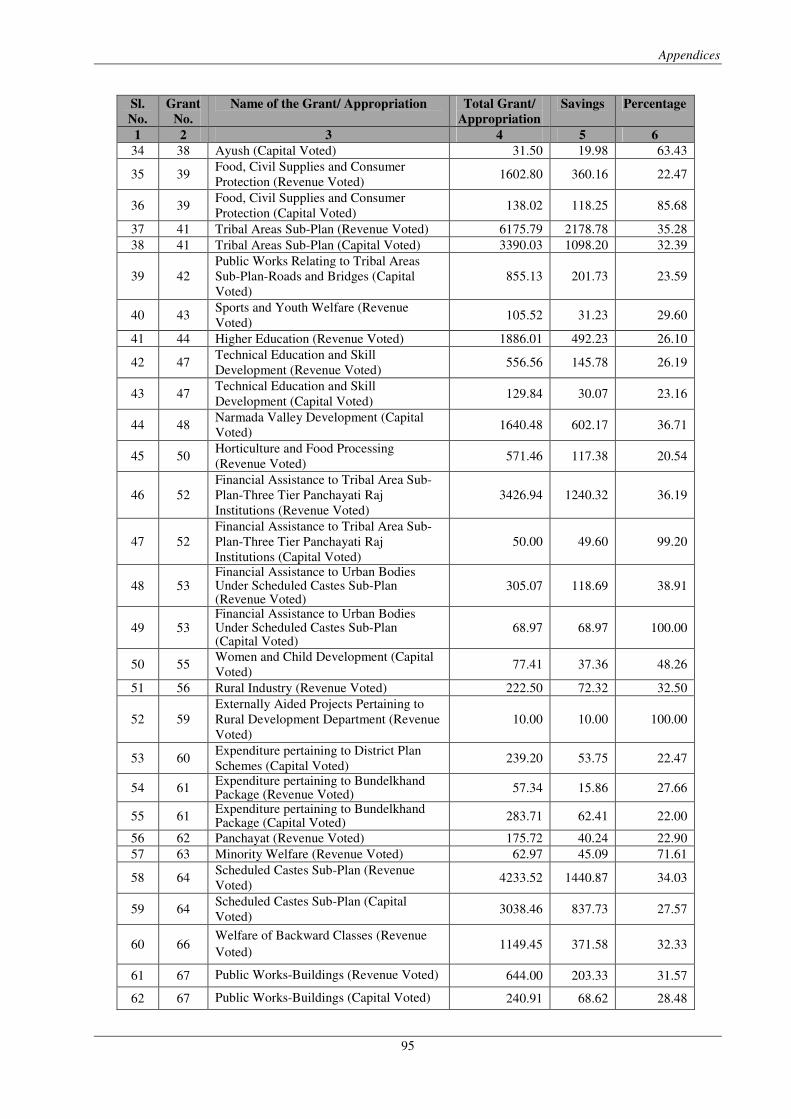
Appendices
95
Sl.
No.
Grant
No.
Name of the Grant/ Appropriation Total Grant/
Appropriation
Savings Percentage
1 2 3 4 5 6
34 38 Ayush (Capital Voted) 31.50 19.98 63.43
35 39 Food, Civil Supplies and Consumer
Protection (Revenue Voted) 1602.80 360.16 22.47
36 39 Food, Civil Supplies and Consumer
Protection (Capital Voted) 138.02 118.25 85.68
37 41 Tribal Areas Sub-Plan (Revenue Voted) 6175.79 2178.78 35.28
38 41 Tribal Areas Sub-Plan (Capital Voted) 3390.03 1098.20 32.39
39 42
Public Works Relating to Tribal Areas
Sub-Plan-Roads and Bridges (Capital
Voted)
855.13 201.73 23.59
40 43 Sports and Youth Welfare (Revenue
Voted) 105.52 31.23 29.60
41 44 Higher Education (Revenue Voted) 1886.01 492.23 26.10
42 47 Technical Education and Skill
Development (Revenue Voted) 556.56 145.78 26.19
43 47 Technical Education and Skill
Development (Capital Voted) 129.84 30.07 23.16
44 48 Narmada Valley Development (Capital
Voted) 1640.48 602.17 36.71
45 50 Horticulture and Food Processing
(Revenue Voted) 571.46 117.38 20.54
46 52
Financial Assistance to Tribal Area Sub-
Plan-Three Tier Panchayati Raj
Institutions (Revenue Voted)
3426.94 1240.32 36.19
47 52
Financial Assistance to Tribal Area Sub-
Plan-Three Tier Panchayati Raj
Institutions (Capital Voted)
50.00 49.60 99.20
48 53 Financial Assistance to Urban Bodies Under Scheduled Castes Sub-Plan (Revenue Voted)
305.07 118.69 38.91
49 53 Financial Assistance to Urban Bodies Under Scheduled Castes Sub-Plan (Capital Voted)
68.97 68.97 100.00
50 55 Women and Child Development (Capital
Voted) 77.41 37.36 48.26
51 56 Rural Industry (Revenue Voted) 222.50 72.32 32.50
52 59
Externally Aided Projects Pertaining to
Rural Development Department (Revenue
Voted)
10.00 10.00 100.00
53 60 Expenditure pertaining to District Plan
Schemes (Capital Voted) 239.20 53.75 22.47
54 61 Expenditure pertaining to Bundelkhand Package (Revenue Voted)
57.34 15.86 27.66
55 61 Expenditure pertaining to Bundelkhand Package (Capital Voted)
283.71 62.41 22.00
56 62 Panchayat (Revenue Voted) 175.72 40.24 22.90
57 63 Minority Welfare (Revenue Voted) 62.97 45.09 71.61
58 64 Scheduled Castes Sub-Plan (Revenue
Voted) 4233.52 1440.87 34.03
59 64 Scheduled Castes Sub-Plan (Capital
Voted) 3038.46 837.73 27.57
60 66 Welfare of Backward Classes (Revenue
Voted) 1149.45 371.58 32.33
61 67 Public Works-Buildings (Revenue Voted) 644.00 203.33 31.57
62 67 Public Works-Buildings (Capital Voted) 240.91 68.62 28.48
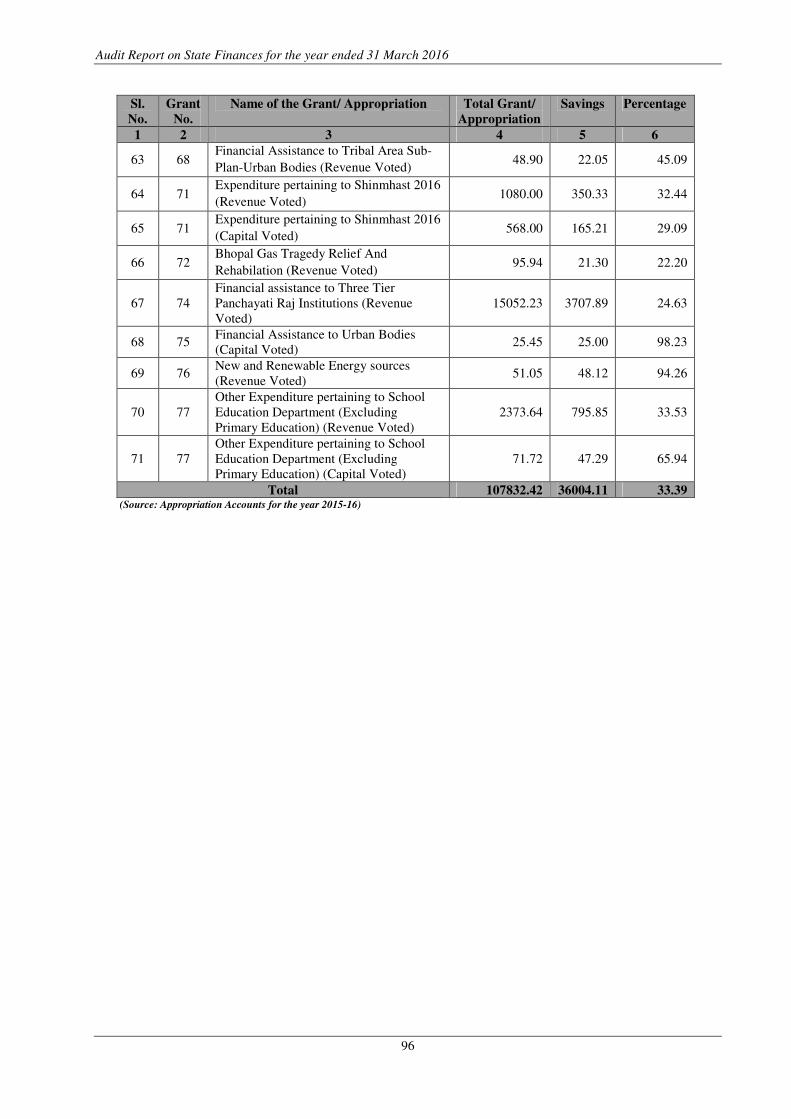
Audit Report on State Finances for the year ended 31 March 2016
96
Sl.
No.
Grant
No.
Name of the Grant/ Appropriation Total Grant/
Appropriation
Savings Percentage
1 2 3 4 5 6
63 68 Financial Assistance to Tribal Area Sub-
Plan-Urban Bodies (Revenue Voted) 48.90 22.05 45.09
64 71 Expenditure pertaining to Shinmhast 2016
(Revenue Voted) 1080.00 350.33 32.44
65 71 Expenditure pertaining to Shinmhast 2016
(Capital Voted) 568.00 165.21 29.09
66 72 Bhopal Gas Tragedy Relief And
Rehabilation (Revenue Voted) 95.94 21.30 22.20
67 74
Financial assistance to Three Tier
Panchayati Raj Institutions (Revenue
Voted)
15052.23 3707.89 24.63
68 75 Financial Assistance to Urban Bodies
(Capital Voted) 25.45 25.00 98.23
69 76 New and Renewable Energy sources
(Revenue Voted) 51.05 48.12 94.26
70 77
Other Expenditure pertaining to School
Education Department (Excluding
Primary Education) (Revenue Voted)
2373.64 795.85 33.53
71 77
Other Expenditure pertaining to School
Education Department (Excluding
Primary Education) (Capital Voted)
71.72 47.29 65.94
Total 107832.42 36004.11 33.39 (Source: Appropriation Accounts for the year 2015-16)
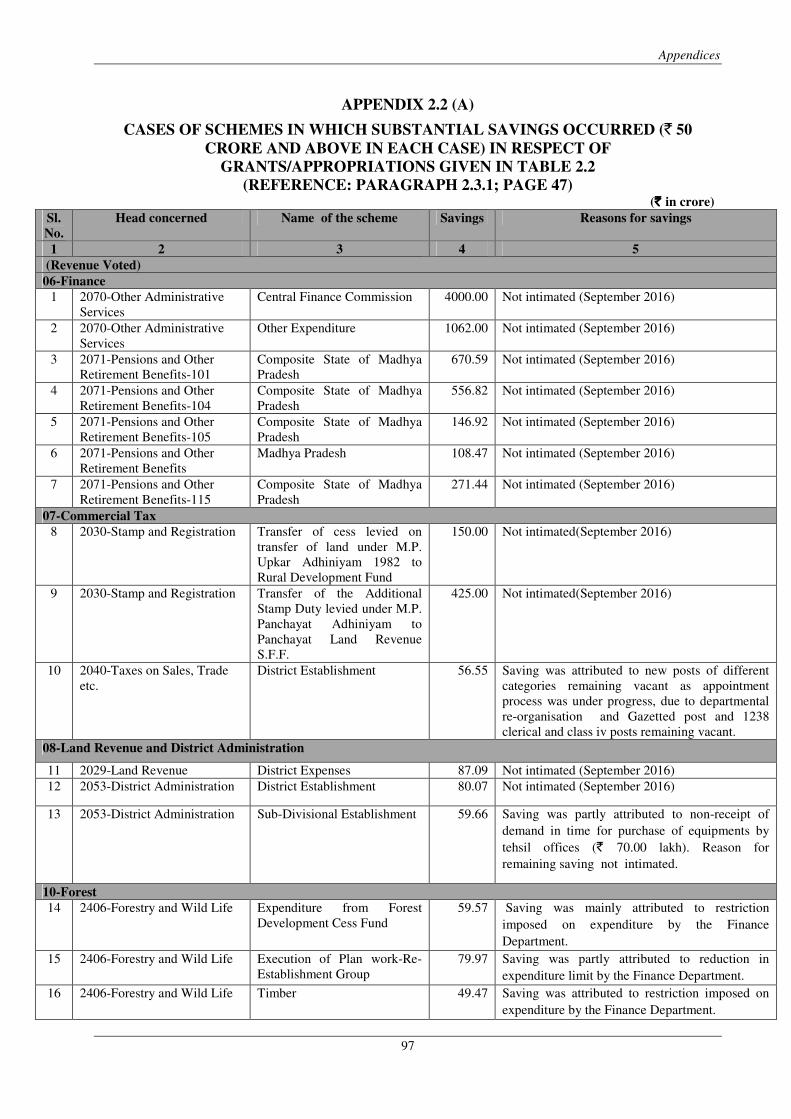
Appendices
97
APPENDIX 2.2 (A)
CASES OF SCHEMES IN WHICH SUBSTANTIAL SAVINGS OCCURRED (` 50
CRORE AND ABOVE IN EACH CASE) IN RESPECT OF
GRANTS/APPROPRIATIONS GIVEN IN TABLE 2.2
(REFERENCE: PARAGRAPH 2.3.1; PAGE 47) (` ` ` ` in crore)
Sl.
No.
Head concerned Name of the scheme Savings Reasons for savings
1 2 3 4 5
(Revenue Voted)
06-Finance
1 2070-Other Administrative
Services
Central Finance Commission 4000.00 Not intimated (September 2016)
2 2070-Other Administrative
Services
Other Expenditure 1062.00 Not intimated (September 2016)
3 2071-Pensions and Other
Retirement Benefits-101
Composite State of Madhya
Pradesh
670.59 Not intimated (September 2016)
4 2071-Pensions and Other
Retirement Benefits-104
Composite State of Madhya
Pradesh
556.82 Not intimated (September 2016)
5 2071-Pensions and Other
Retirement Benefits-105
Composite State of Madhya
Pradesh
146.92 Not intimated (September 2016)
6 2071-Pensions and Other
Retirement Benefits
Madhya Pradesh 108.47 Not intimated (September 2016)
7 2071-Pensions and Other
Retirement Benefits-115
Composite State of Madhya
Pradesh
271.44 Not intimated (September 2016)
07-Commercial Tax
8 2030-Stamp and Registration Transfer of cess levied on
transfer of land under M.P.
Upkar Adhiniyam 1982 to
Rural Development Fund
150.00 Not intimated(September 2016)
9 2030-Stamp and Registration Transfer of the Additional
Stamp Duty levied under M.P.
Panchayat Adhiniyam to
Panchayat Land Revenue
S.F.F.
425.00 Not intimated(September 2016)
10 2040-Taxes on Sales, Trade
etc.
District Establishment 56.55 Saving was attributed to new posts of different
categories remaining vacant as appointment
process was under progress, due to departmental
re-organisation and Gazetted post and 1238
clerical and class iv posts remaining vacant.
08-Land Revenue and District Administration
11 2029-Land Revenue District Expenses 87.09 Not intimated (September 2016)
12 2053-District Administration District Establishment 80.07 Not intimated (September 2016)
13 2053-District Administration Sub-Divisional Establishment 59.66 Saving was partly attributed to non-receipt of
demand in time for purchase of equipments by
tehsil offices (` 70.00 lakh). Reason for
remaining saving not intimated.
10-Forest
14 2406-Forestry and Wild Life Expenditure from Forest
Development Cess Fund
59.57 Saving was mainly attributed to restriction
imposed on expenditure by the Finance
Department.
15 2406-Forestry and Wild Life Execution of Plan work-Re-
Establishment Group
79.97 Saving was partly attributed to reduction in
expenditure limit by the Finance Department.
16 2406-Forestry and Wild Life Timber 49.47 Saving was attributed to restriction imposed on
expenditure by the Finance Department.
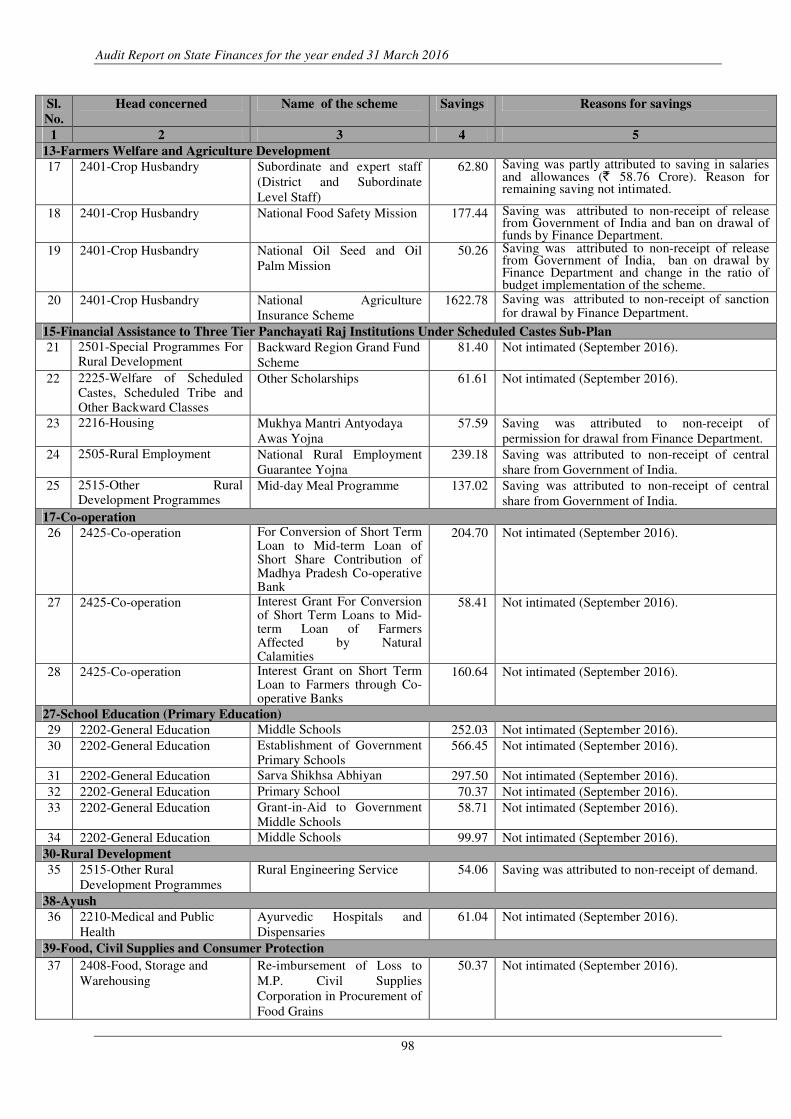
Audit Report on State Finances for the year ended 31 March 2016
98
Sl.
No.
Head concerned Name of the scheme Savings Reasons for savings
1 2 3 4 5
13-Farmers Welfare and Agriculture Development
17 2401-Crop Husbandry Subordinate and expert staff
(District and Subordinate
Level Staff)
62.80 Saving was partly attributed to saving in salaries and allowances (` 58.76 Crore). Reason for remaining saving not intimated.
18 2401-Crop Husbandry National Food Safety Mission 177.44 Saving was attributed to non-receipt of release from Government of India and ban on drawal of funds by Finance Department.
19 2401-Crop Husbandry National Oil Seed and Oil
Palm Mission
50.26 Saving was attributed to non-receipt of release from Government of India, ban on drawal by Finance Department and change in the ratio of budget implementation of the scheme.
20 2401-Crop Husbandry National Agriculture
Insurance Scheme
1622.78 Saving was attributed to non-receipt of sanction for drawal by Finance Department.
15-Financial Assistance to Three Tier Panchayati Raj Institutions Under Scheduled Castes Sub-Plan
21 2501-Special Programmes For Rural Development
Backward Region Grand Fund
Scheme
81.40 Not intimated (September 2016).
22 2225-Welfare of Scheduled Castes, Scheduled Tribe and Other Backward Classes
Other Scholarships 61.61 Not intimated (September 2016).
23 2216-Housing Mukhya Mantri Antyodaya
Awas Yojna
57.59 Saving was attributed to non-receipt of
permission for drawal from Finance Department.
24 2505-Rural Employment National Rural Employment
Guarantee Yojna
239.18 Saving was attributed to non-receipt of central
share from Government of India.
25 2515-Other Rural Development Programmes
Mid-day Meal Programme 137.02 Saving was attributed to non-receipt of central
share from Government of India.
17-Co-operation
26 2425-Co-operation For Conversion of Short Term Loan to Mid-term Loan of Short Share Contribution of Madhya Pradesh Co-operative Bank
204.70 Not intimated (September 2016).
27 2425-Co-operation Interest Grant For Conversion of Short Term Loans to Mid-term Loan of Farmers Affected by Natural Calamities
58.41 Not intimated (September 2016).
28 2425-Co-operation Interest Grant on Short Term Loan to Farmers through Co-operative Banks
160.64 Not intimated (September 2016).
27-School Education (Primary Education)
29 2202-General Education Middle Schools 252.03 Not intimated (September 2016).
30 2202-General Education Establishment of Government Primary Schools
566.45 Not intimated (September 2016).
31 2202-General Education Sarva Shikhsa Abhiyan 297.50 Not intimated (September 2016).
32 2202-General Education Primary School 70.37 Not intimated (September 2016).
33 2202-General Education Grant-in-Aid to Government Middle Schools
58.71 Not intimated (September 2016).
34 2202-General Education Middle Schools 99.97 Not intimated (September 2016).
30-Rural Development
35 2515-Other Rural
Development Programmes
Rural Engineering Service 54.06 Saving was attributed to non-receipt of demand.
38-Ayush
36 2210-Medical and Public
Health
Ayurvedic Hospitals and
Dispensaries
61.04 Not intimated (September 2016).
39-Food, Civil Supplies and Consumer Protection
37 2408-Food, Storage and
Warehousing
Re-imbursement of Loss to
M.P. Civil Supplies
Corporation in Procurement of
Food Grains
50.37 Not intimated (September 2016).
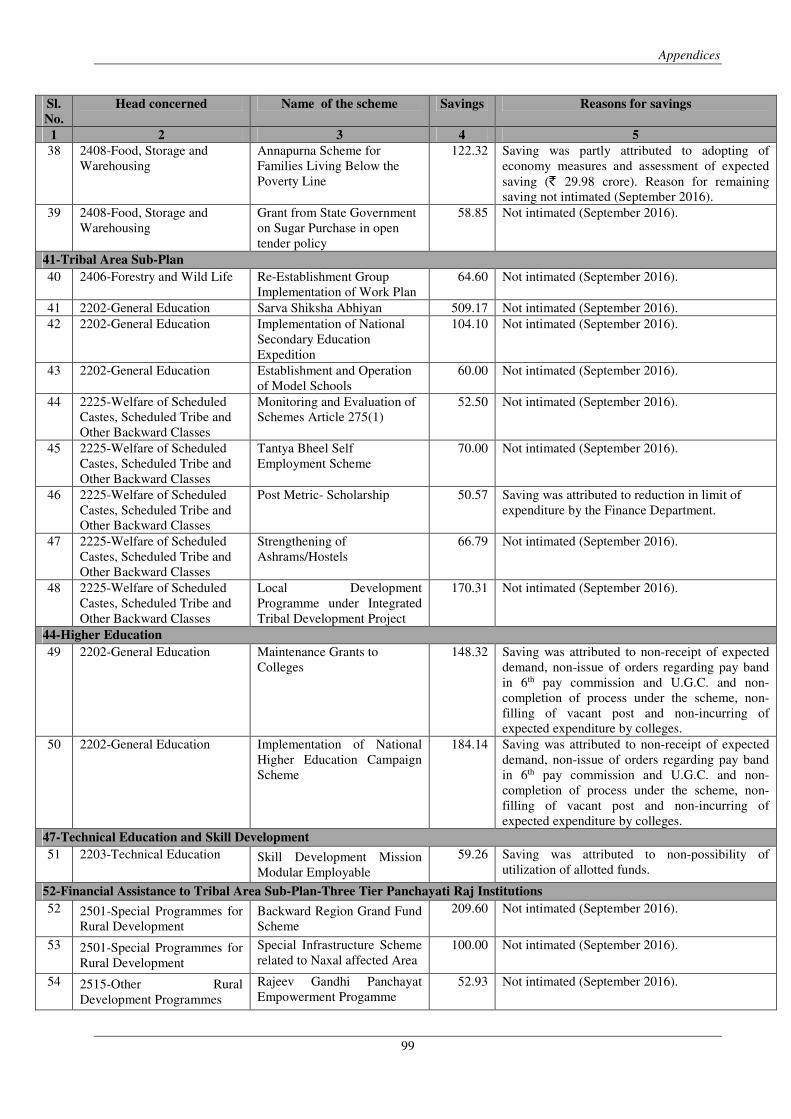
Appendices
99
Sl.
No.
Head concerned Name of the scheme Savings Reasons for savings
1 2 3 4 5
38 2408-Food, Storage and
Warehousing
Annapurna Scheme for
Families Living Below the
Poverty Line
122.32 Saving was partly attributed to adopting of
economy measures and assessment of expected
saving (` 29.98 crore). Reason for remaining
saving not intimated (September 2016).
39 2408-Food, Storage and
Warehousing
Grant from State Government
on Sugar Purchase in open
tender policy
58.85 Not intimated (September 2016).
41-Tribal Area Sub-Plan
40 2406-Forestry and Wild Life Re-Establishment Group
Implementation of Work Plan
64.60 Not intimated (September 2016).
41 2202-General Education Sarva Shiksha Abhiyan 509.17 Not intimated (September 2016).
42 2202-General Education Implementation of National
Secondary Education
Expedition
104.10 Not intimated (September 2016).
43 2202-General Education Establishment and Operation
of Model Schools
60.00 Not intimated (September 2016).
44 2225-Welfare of Scheduled
Castes, Scheduled Tribe and
Other Backward Classes
Monitoring and Evaluation of
Schemes Article 275(1)
52.50 Not intimated (September 2016).
45 2225-Welfare of Scheduled
Castes, Scheduled Tribe and
Other Backward Classes
Tantya Bheel Self
Employment Scheme
70.00 Not intimated (September 2016).
46 2225-Welfare of Scheduled
Castes, Scheduled Tribe and
Other Backward Classes
Post Metric- Scholarship 50.57 Saving was attributed to reduction in limit of
expenditure by the Finance Department.
47 2225-Welfare of Scheduled
Castes, Scheduled Tribe and
Other Backward Classes
Strengthening of
Ashrams/Hostels
66.79 Not intimated (September 2016).
48 2225-Welfare of Scheduled
Castes, Scheduled Tribe and
Other Backward Classes
Local Development
Programme under Integrated
Tribal Development Project
170.31 Not intimated (September 2016).
44-Higher Education
49 2202-General Education Maintenance Grants to
Colleges
148.32 Saving was attributed to non-receipt of expected
demand, non-issue of orders regarding pay band
in 6th pay commission and U.G.C. and non-
completion of process under the scheme, non-
filling of vacant post and non-incurring of
expected expenditure by colleges.
50 2202-General Education Implementation of National
Higher Education Campaign
Scheme
184.14 Saving was attributed to non-receipt of expected
demand, non-issue of orders regarding pay band
in 6th pay commission and U.G.C. and non-
completion of process under the scheme, non-
filling of vacant post and non-incurring of
expected expenditure by colleges.
47-Technical Education and Skill Development
51 2203-Technical Education Skill Development Mission
Modular Employable
59.26 Saving was attributed to non-possibility of
utilization of allotted funds.
52-Financial Assistance to Tribal Area Sub-Plan-Three Tier Panchayati Raj Institutions
52 2501-Special Programmes for
Rural Development
Backward Region Grand Fund
Scheme
209.60 Not intimated (September 2016).
53 2501-Special Programmes for
Rural Development
Special Infrastructure Scheme
related to Naxal affected Area
100.00 Not intimated (September 2016).
54 2515-Other Rural
Development Programmes
Rajeev Gandhi Panchayat
Empowerment Progamme
52.93 Not intimated (September 2016).
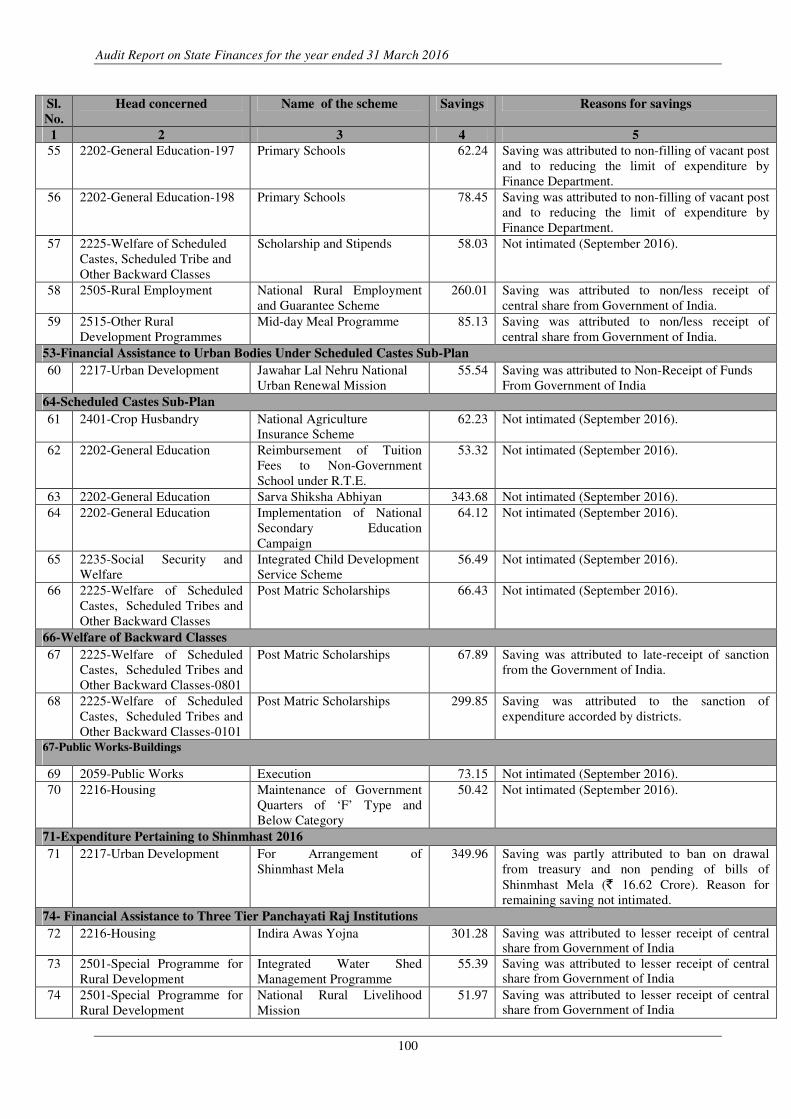
Audit Report on State Finances for the year ended 31 March 2016
100
Sl.
No.
Head concerned Name of the scheme Savings Reasons for savings
1 2 3 4 5
55 2202-General Education-197 Primary Schools 62.24 Saving was attributed to non-filling of vacant post
and to reducing the limit of expenditure by
Finance Department.
56 2202-General Education-198 Primary Schools 78.45 Saving was attributed to non-filling of vacant post
and to reducing the limit of expenditure by
Finance Department.
57 2225-Welfare of Scheduled
Castes, Scheduled Tribe and
Other Backward Classes
Scholarship and Stipends 58.03
Not intimated (September 2016).
58 2505-Rural Employment National Rural Employment
and Guarantee Scheme
260.01 Saving was attributed to non/less receipt of
central share from Government of India.
59 2515-Other Rural
Development Programmes
Mid-day Meal Programme 85.13 Saving was attributed to non/less receipt of
central share from Government of India.
53-Financial Assistance to Urban Bodies Under Scheduled Castes Sub-Plan
60 2217-Urban Development Jawahar Lal Nehru National
Urban Renewal Mission
55.54 Saving was attributed to Non-Receipt of Funds
From Government of India
64-Scheduled Castes Sub-Plan
61 2401-Crop Husbandry National Agriculture
Insurance Scheme
62.23 Not intimated (September 2016).
62 2202-General Education Reimbursement of Tuition
Fees to Non-Government
School under R.T.E.
53.32 Not intimated (September 2016).
63 2202-General Education Sarva Shiksha Abhiyan 343.68 Not intimated (September 2016).
64 2202-General Education Implementation of National
Secondary Education
Campaign
64.12 Not intimated (September 2016).
65 2235-Social Security and
Welfare
Integrated Child Development
Service Scheme
56.49 Not intimated (September 2016).
66 2225-Welfare of Scheduled
Castes, Scheduled Tribes and
Other Backward Classes
Post Matric Scholarships 66.43 Not intimated (September 2016).
66-Welfare of Backward Classes
67 2225-Welfare of Scheduled
Castes, Scheduled Tribes and
Other Backward Classes-0801
Post Matric Scholarships 67.89 Saving was attributed to late-receipt of sanction
from the Government of India.
68 2225-Welfare of Scheduled
Castes, Scheduled Tribes and
Other Backward Classes-0101
Post Matric Scholarships 299.85 Saving was attributed to the sanction of
expenditure accorded by districts.
67-Public Works-Buildings
69 2059-Public Works Execution 73.15 Not intimated (September 2016).
70 2216-Housing Maintenance of Government
Quarters of ‘F’ Type and
Below Category
50.42 Not intimated (September 2016).
71-Expenditure Pertaining to Shinmhast 2016
71 2217-Urban Development For Arrangement of
Shinmhast Mela
349.96 Saving was partly attributed to ban on drawal
from treasury and non pending of bills of
Shinmhast Mela (` 16.62 Crore). Reason for
remaining saving not intimated.
74- Financial Assistance to Three Tier Panchayati Raj Institutions
72 2216-Housing Indira Awas Yojna 301.28 Saving was attributed to lesser receipt of central share from Government of India
73 2501-Special Programme for
Rural Development
Integrated Water Shed
Management Programme
55.39 Saving was attributed to lesser receipt of central share from Government of India
74 2501-Special Programme for
Rural Development
National Rural Livelihood
Mission
51.97 Saving was attributed to lesser receipt of central share from Government of India
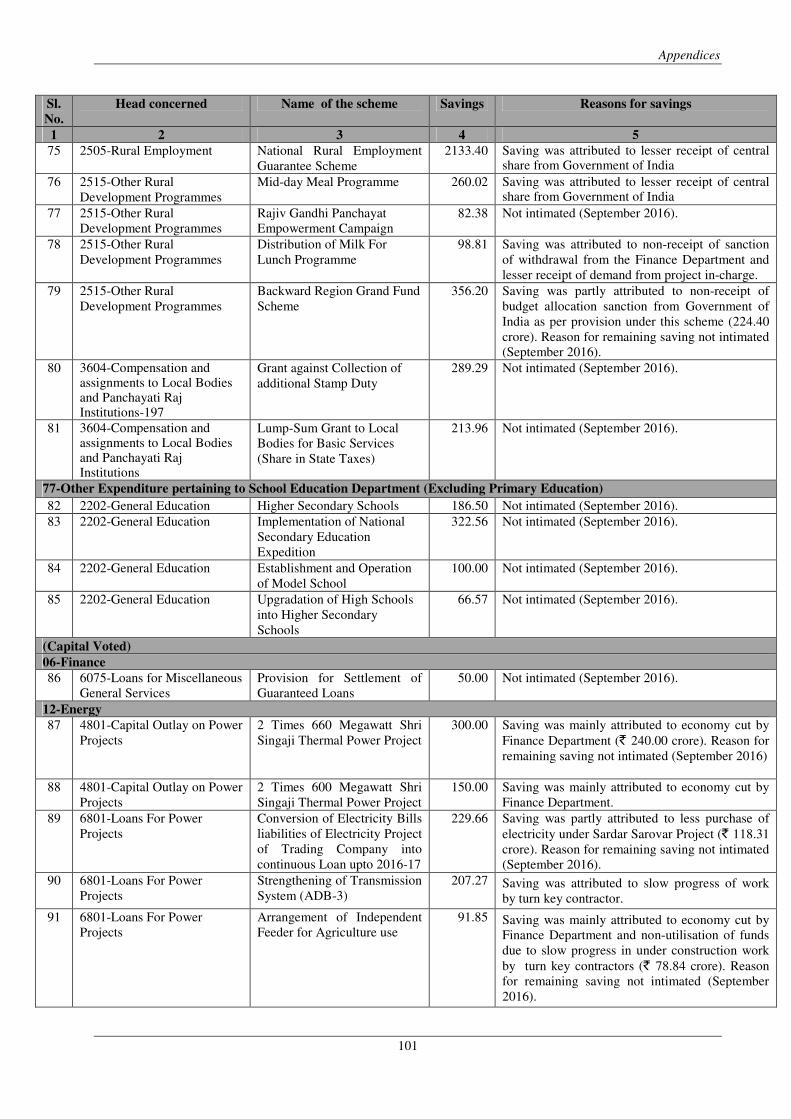
Appendices
101
Sl.
No.
Head concerned Name of the scheme Savings Reasons for savings
1 2 3 4 5
75 2505-Rural Employment National Rural Employment
Guarantee Scheme
2133.40 Saving was attributed to lesser receipt of central share from Government of India
76 2515-Other Rural
Development Programmes
Mid-day Meal Programme 260.02 Saving was attributed to lesser receipt of central share from Government of India
77 2515-Other Rural
Development Programmes
Rajiv Gandhi Panchayat
Empowerment Campaign
82.38 Not intimated (September 2016).
78 2515-Other Rural
Development Programmes
Distribution of Milk For
Lunch Programme
98.81 Saving was attributed to non-receipt of sanction
of withdrawal from the Finance Department and
lesser receipt of demand from project in-charge.
79 2515-Other Rural
Development Programmes
Backward Region Grand Fund
Scheme
356.20 Saving was partly attributed to non-receipt of
budget allocation sanction from Government of
India as per provision under this scheme (224.40
crore). Reason for remaining saving not intimated
(September 2016).
80 3604-Compensation and assignments to Local Bodies and Panchayati Raj Institutions-197
Grant against Collection of
additional Stamp Duty
289.29 Not intimated (September 2016).
81 3604-Compensation and assignments to Local Bodies and Panchayati Raj Institutions
Lump-Sum Grant to Local
Bodies for Basic Services
(Share in State Taxes)
213.96 Not intimated (September 2016).
77-Other Expenditure pertaining to School Education Department (Excluding Primary Education)
82 2202-General Education Higher Secondary Schools 186.50 Not intimated (September 2016).
83 2202-General Education Implementation of National
Secondary Education
Expedition
322.56 Not intimated (September 2016).
84 2202-General Education Establishment and Operation
of Model School
100.00 Not intimated (September 2016).
85 2202-General Education Upgradation of High Schools
into Higher Secondary
Schools
66.57 Not intimated (September 2016).
(Capital Voted)
06-Finance
86 6075-Loans for Miscellaneous
General Services
Provision for Settlement of
Guaranteed Loans
50.00 Not intimated (September 2016).
12-Energy
87 4801-Capital Outlay on Power
Projects
2 Times 660 Megawatt Shri
Singaji Thermal Power Project
300.00 Saving was mainly attributed to economy cut by
Finance Department (` 240.00 crore). Reason for
remaining saving not intimated (September 2016)
88 4801-Capital Outlay on Power
Projects
2 Times 600 Megawatt Shri
Singaji Thermal Power Project
150.00 Saving was mainly attributed to economy cut by
Finance Department.
89 6801-Loans For Power
Projects
Conversion of Electricity Bills
liabilities of Electricity Project
of Trading Company into
continuous Loan upto 2016-17
229.66 Saving was partly attributed to less purchase of
electricity under Sardar Sarovar Project (` 118.31
crore). Reason for remaining saving not intimated
(September 2016).
90 6801-Loans For Power
Projects
Strengthening of Transmission
System (ADB-3)
207.27 Saving was attributed to slow progress of work
by turn key contractor.
91 6801-Loans For Power
Projects
Arrangement of Independent
Feeder for Agriculture use
91.85 Saving was mainly attributed to economy cut by
Finance Department and non-utilisation of funds
due to slow progress in under construction work
by turn key contractors (` 78.84 crore). Reason
for remaining saving not intimated (September
2016).
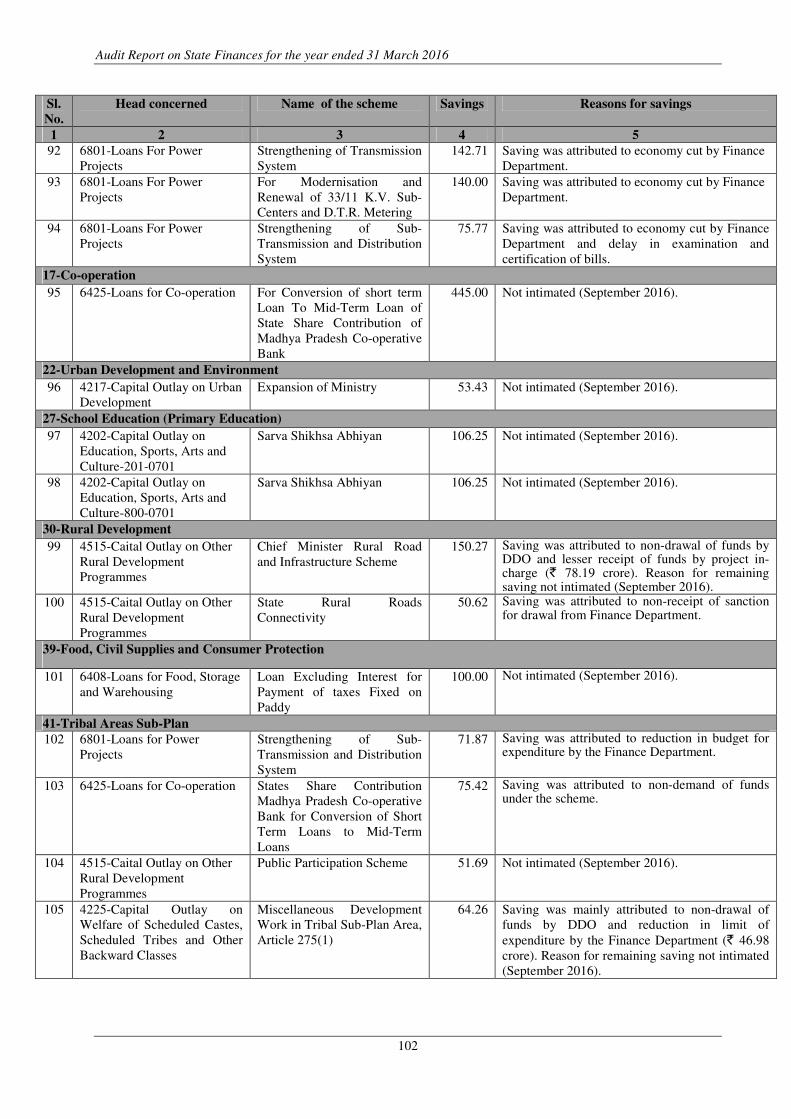
Audit Report on State Finances for the year ended 31 March 2016
102
Sl.
No.
Head concerned Name of the scheme Savings Reasons for savings
1 2 3 4 5
92 6801-Loans For Power
Projects
Strengthening of Transmission
System
142.71 Saving was attributed to economy cut by Finance
Department.
93 6801-Loans For Power
Projects
For Modernisation and
Renewal of 33/11 K.V. Sub-
Centers and D.T.R. Metering
140.00 Saving was attributed to economy cut by Finance
Department.
94 6801-Loans For Power
Projects
Strengthening of Sub-
Transmission and Distribution
System
75.77 Saving was attributed to economy cut by Finance
Department and delay in examination and
certification of bills.
17-Co-operation
95 6425-Loans for Co-operation For Conversion of short term
Loan To Mid-Term Loan of
State Share Contribution of
Madhya Pradesh Co-operative
Bank
445.00 Not intimated (September 2016).
22-Urban Development and Environment
96 4217-Capital Outlay on Urban
Development
Expansion of Ministry 53.43 Not intimated (September 2016).
27-School Education (Primary Education)
97 4202-Capital Outlay on
Education, Sports, Arts and
Culture-201-0701
Sarva Shikhsa Abhiyan 106.25 Not intimated (September 2016).
98 4202-Capital Outlay on
Education, Sports, Arts and
Culture-800-0701
Sarva Shikhsa Abhiyan 106.25 Not intimated (September 2016).
30-Rural Development
99 4515-Caital Outlay on Other
Rural Development
Programmes
Chief Minister Rural Road
and Infrastructure Scheme
150.27 Saving was attributed to non-drawal of funds by DDO and lesser receipt of funds by project in-charge (` 78.19 crore). Reason for remaining saving not intimated (September 2016).
100 4515-Caital Outlay on Other
Rural Development
Programmes
State Rural Roads
Connectivity
50.62 Saving was attributed to non-receipt of sanction for drawal from Finance Department.
39-Food, Civil Supplies and Consumer Protection
101 6408-Loans for Food, Storage
and Warehousing
Loan Excluding Interest for
Payment of taxes Fixed on
Paddy
100.00 Not intimated (September 2016).
41-Tribal Areas Sub-Plan
102 6801-Loans for Power
Projects
Strengthening of Sub-
Transmission and Distribution
System
71.87 Saving was attributed to reduction in budget for expenditure by the Finance Department.
103 6425-Loans for Co-operation States Share Contribution
Madhya Pradesh Co-operative
Bank for Conversion of Short
Term Loans to Mid-Term
Loans
75.42 Saving was attributed to non-demand of funds under the scheme.
104 4515-Caital Outlay on Other
Rural Development
Programmes
Public Participation Scheme 51.69 Not intimated (September 2016).
105 4225-Capital Outlay on
Welfare of Scheduled Castes,
Scheduled Tribes and Other
Backward Classes
Miscellaneous Development
Work in Tribal Sub-Plan Area,
Article 275(1)
64.26 Saving was mainly attributed to non-drawal of
funds by DDO and reduction in limit of
expenditure by the Finance Department (` 46.98
crore). Reason for remaining saving not intimated
(September 2016).
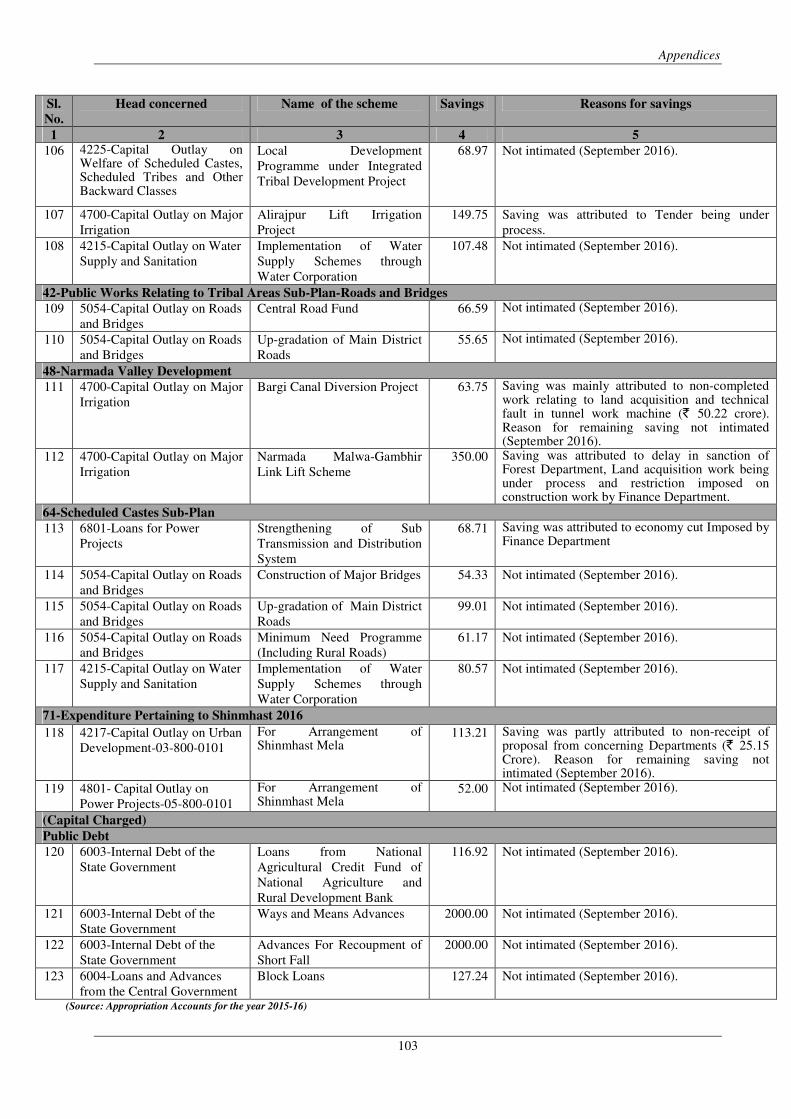
Appendices
103
Sl.
No.
Head concerned Name of the scheme Savings Reasons for savings
1 2 3 4 5
106 4225-Capital Outlay on Welfare of Scheduled Castes, Scheduled Tribes and Other Backward Classes
Local Development
Programme under Integrated
Tribal Development Project
68.97 Not intimated (September 2016).
107 4700-Capital Outlay on Major
Irrigation
Alirajpur Lift Irrigation
Project
149.75 Saving was attributed to Tender being under
process.
108 4215-Capital Outlay on Water
Supply and Sanitation
Implementation of Water
Supply Schemes through
Water Corporation
107.48 Not intimated (September 2016).
42-Public Works Relating to Tribal Areas Sub-Plan-Roads and Bridges
109 5054-Capital Outlay on Roads
and Bridges
Central Road Fund 66.59 Not intimated (September 2016).
110 5054-Capital Outlay on Roads
and Bridges
Up-gradation of Main District
Roads
55.65 Not intimated (September 2016).
48-Narmada Valley Development
111 4700-Capital Outlay on Major
Irrigation
Bargi Canal Diversion Project 63.75 Saving was mainly attributed to non-completed work relating to land acquisition and technical fault in tunnel work machine (` 50.22 crore). Reason for remaining saving not intimated (September 2016).
112 4700-Capital Outlay on Major
Irrigation
Narmada Malwa-Gambhir
Link Lift Scheme
350.00 Saving was attributed to delay in sanction of Forest Department, Land acquisition work being under process and restriction imposed on construction work by Finance Department.
64-Scheduled Castes Sub-Plan
113 6801-Loans for Power
Projects
Strengthening of Sub
Transmission and Distribution
System
68.71 Saving was attributed to economy cut Imposed by Finance Department
114 5054-Capital Outlay on Roads
and Bridges
Construction of Major Bridges 54.33 Not intimated (September 2016).
115 5054-Capital Outlay on Roads
and Bridges
Up-gradation of Main District
Roads
99.01 Not intimated (September 2016).
116 5054-Capital Outlay on Roads
and Bridges
Minimum Need Programme
(Including Rural Roads)
61.17 Not intimated (September 2016).
117 4215-Capital Outlay on Water
Supply and Sanitation
Implementation of Water
Supply Schemes through
Water Corporation
80.57 Not intimated (September 2016).
71-Expenditure Pertaining to Shinmhast 2016
118 4217-Capital Outlay on Urban
Development-03-800-0101
For Arrangement of Shinmhast Mela
113.21 Saving was partly attributed to non-receipt of proposal from concerning Departments (` 25.15 Crore). Reason for remaining saving not intimated (September 2016).
119 4801- Capital Outlay on
Power Projects-05-800-0101
For Arrangement of Shinmhast Mela
52.00 Not intimated (September 2016).
(Capital Charged)
Public Debt
120 6003-Internal Debt of the
State Government
Loans from National
Agricultural Credit Fund of
National Agriculture and
Rural Development Bank
116.92 Not intimated (September 2016).
121 6003-Internal Debt of the
State Government
Ways and Means Advances 2000.00 Not intimated (September 2016).
122 6003-Internal Debt of the
State Government
Advances For Recoupment of
Short Fall
2000.00 Not intimated (September 2016).
123 6004-Loans and Advances
from the Central Government
Block Loans 127.24 Not intimated (September 2016).
(Source: Appropriation Accounts for the year 2015-16)
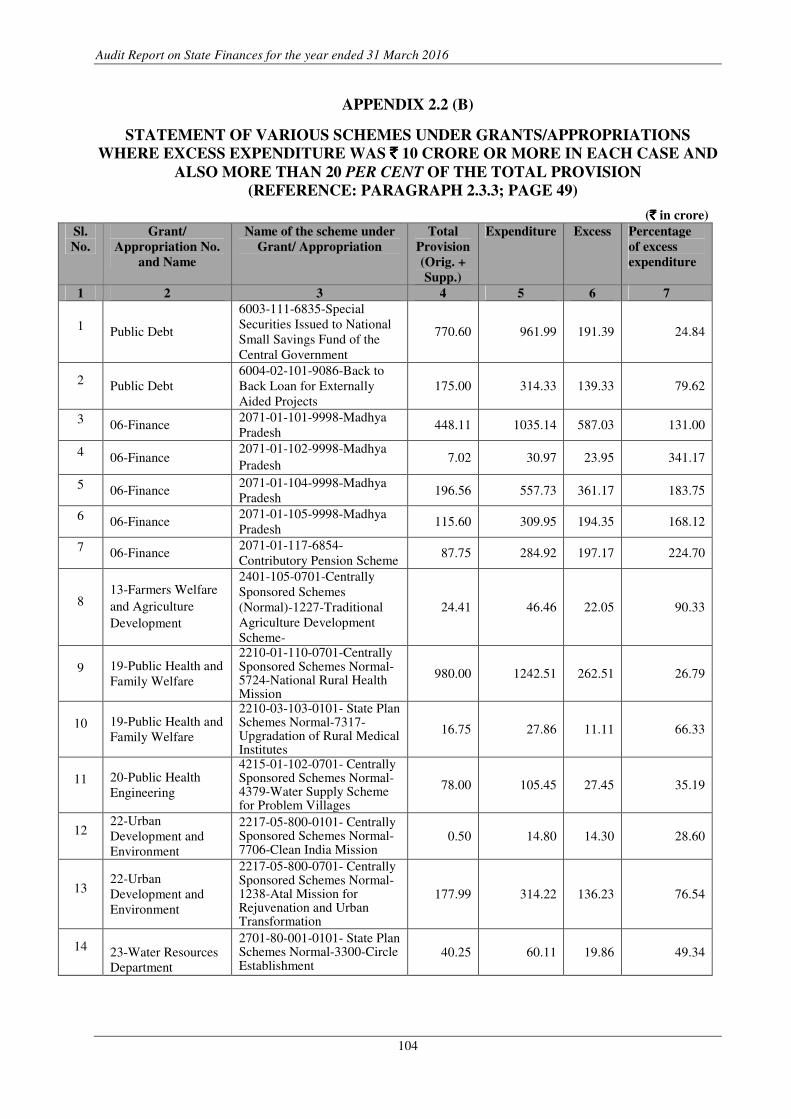
Audit Report on State Finances for the year ended 31 March 2016
104
APPENDIX 2.2 (B)
STATEMENT OF VARIOUS SCHEMES UNDER GRANTS/APPROPRIATIONS
WHERE EXCESS EXPENDITURE WAS `̀̀̀ 10 CRORE OR MORE IN EACH CASE AND
ALSO MORE THAN 20 PER CENT OF THE TOTAL PROVISION
(REFERENCE: PARAGRAPH 2.3.3; PAGE 49)
(`̀̀̀ in crore)
Sl.
No.
Grant/
Appropriation No.
and Name
Name of the scheme under
Grant/ Appropriation
Total
Provision
(Orig. +
Supp.)
Expenditure Excess Percentage
of excess
expenditure
1 2 3 4 5 6 7
1 Public Debt
6003-111-6835-Special
Securities Issued to National
Small Savings Fund of the
Central Government
770.60 961.99 191.39 24.84
2 Public Debt
6004-02-101-9086-Back to
Back Loan for Externally
Aided Projects
175.00 314.33 139.33 79.62
3 06-Finance 2071-01-101-9998-Madhya
Pradesh 448.11 1035.14 587.03 131.00
4 06-Finance 2071-01-102-9998-Madhya
Pradesh 7.02 30.97 23.95 341.17
5 06-Finance
2071-01-104-9998-Madhya
Pradesh 196.56 557.73 361.17 183.75
6 06-Finance 2071-01-105-9998-Madhya
Pradesh 115.60 309.95 194.35 168.12
7 06-Finance 2071-01-117-6854-
Contributory Pension Scheme 87.75 284.92 197.17 224.70
8 13-Farmers Welfare
and Agriculture
Development
2401-105-0701-Centrally
Sponsored Schemes
(Normal)-1227-Traditional
Agriculture Development
Scheme-
24.41 46.46 22.05 90.33
9 19-Public Health and
Family Welfare
2210-01-110-0701-Centrally Sponsored Schemes Normal-5724-National Rural Health Mission
980.00 1242.51 262.51 26.79
10 19-Public Health and
Family Welfare
2210-03-103-0101- State Plan Schemes Normal-7317-Upgradation of Rural Medical Institutes
16.75 27.86 11.11 66.33
11 20-Public Health
Engineering
4215-01-102-0701- Centrally Sponsored Schemes Normal-4379-Water Supply Scheme for Problem Villages
78.00 105.45 27.45 35.19
12 22-Urban
Development and
Environment
2217-05-800-0101- Centrally Sponsored Schemes Normal-7706-Clean India Mission
0.50 14.80 14.30 28.60
13 22-Urban
Development and
Environment
2217-05-800-0701- Centrally Sponsored Schemes Normal-1238-Atal Mission for Rejuvenation and Urban Transformation
177.99 314.22 136.23 76.54
14
23-Water Resources
Department
2701-80-001-0101- State Plan Schemes Normal-3300-Circle Establishment
40.25 60.11 19.86 49.34
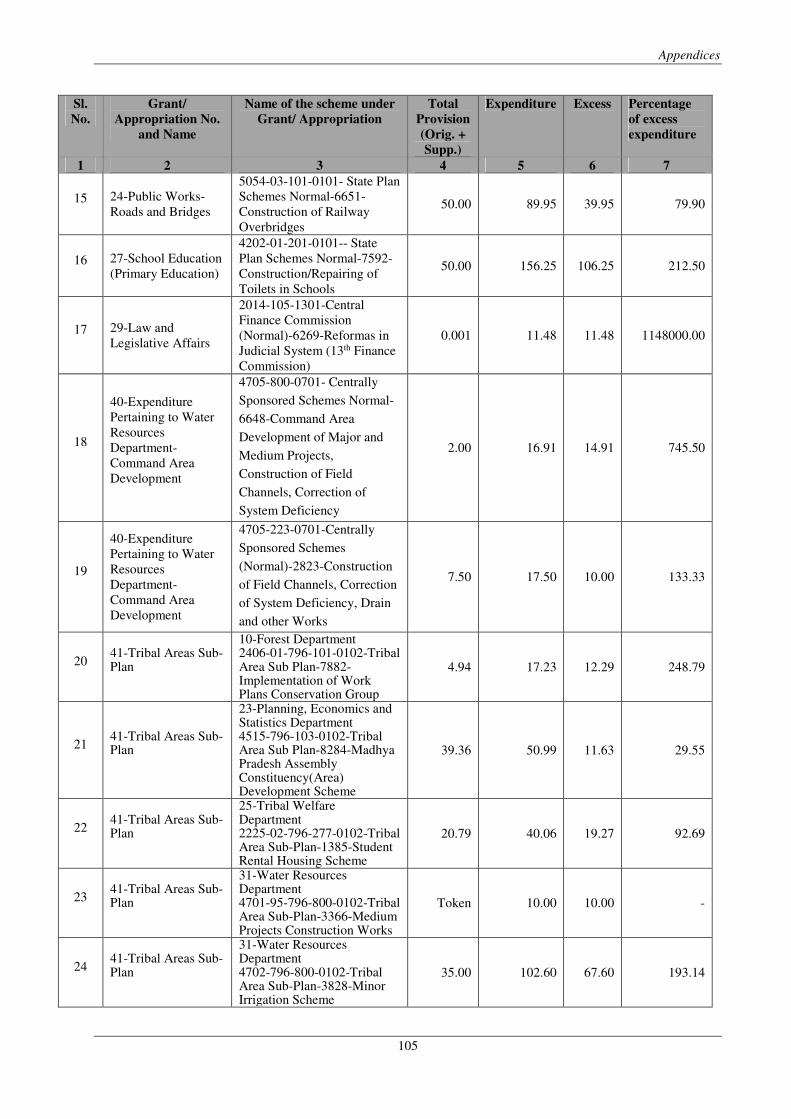
Appendices
105
Sl.
No.
Grant/
Appropriation No.
and Name
Name of the scheme under
Grant/ Appropriation
Total
Provision
(Orig. +
Supp.)
Expenditure Excess Percentage
of excess
expenditure
1 2 3 4 5 6 7
15 24-Public Works-
Roads and Bridges
5054-03-101-0101- State Plan
Schemes Normal-6651-
Construction of Railway
Overbridges
50.00 89.95 39.95 79.90
16 27-School Education
(Primary Education)
4202-01-201-0101-- State
Plan Schemes Normal-7592-
Construction/Repairing of
Toilets in Schools
50.00 156.25 106.25 212.50
17 29-Law and
Legislative Affairs
2014-105-1301-Central
Finance Commission
(Normal)-6269-Reformas in
Judicial System (13th Finance
Commission)
0.001 11.48 11.48 1148000.00
18
40-Expenditure
Pertaining to Water
Resources
Department-
Command Area
Development
4705-800-0701- Centrally
Sponsored Schemes Normal-
6648-Command Area
Development of Major and
Medium Projects,
Construction of Field
Channels, Correction of
System Deficiency
2.00 16.91 14.91 745.50
19
40-Expenditure
Pertaining to Water
Resources
Department-
Command Area
Development
4705-223-0701-Centrally
Sponsored Schemes
(Normal)-2823-Construction
of Field Channels, Correction
of System Deficiency, Drain
and other Works
7.50 17.50 10.00 133.33
20 41-Tribal Areas Sub- Plan
10-Forest Department 2406-01-796-101-0102-Tribal Area Sub Plan-7882-Implementation of Work Plans Conservation Group
4.94 17.23 12.29 248.79
21 41-Tribal Areas Sub- Plan
23-Planning, Economics and Statistics Department 4515-796-103-0102-Tribal Area Sub Plan-8284-Madhya Pradesh Assembly Constituency(Area) Development Scheme
39.36 50.99 11.63 29.55
22 41-Tribal Areas Sub- Plan
25-Tribal Welfare Department 2225-02-796-277-0102-Tribal Area Sub-Plan-1385-Student Rental Housing Scheme
20.79 40.06 19.27 92.69
23 41-Tribal Areas Sub- Plan
31-Water Resources Department 4701-95-796-800-0102-Tribal Area Sub-Plan-3366-Medium Projects Construction Works
Token 10.00 10.00 -
24 41-Tribal Areas Sub- Plan
31-Water Resources Department 4702-796-800-0102-Tribal Area Sub-Plan-3828-Minor Irrigation Scheme
35.00 102.60 67.60 193.14
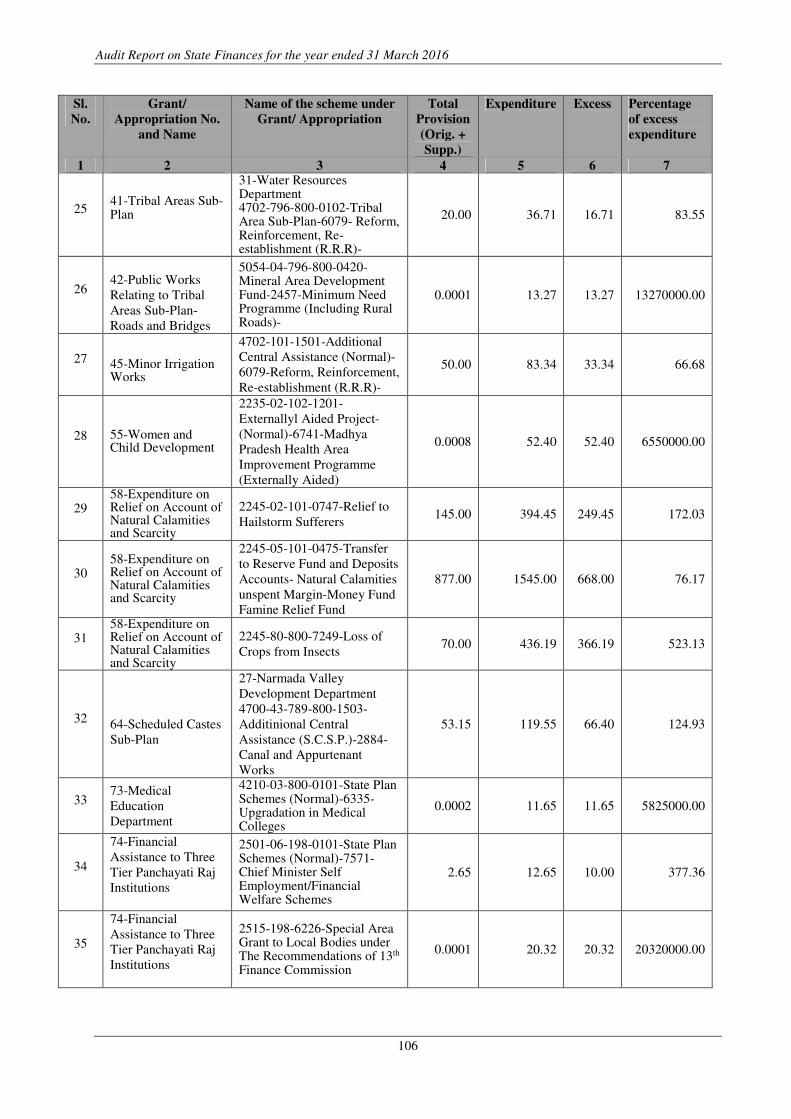
Audit Report on State Finances for the year ended 31 March 2016
106
Sl.
No.
Grant/
Appropriation No.
and Name
Name of the scheme under
Grant/ Appropriation
Total
Provision
(Orig. +
Supp.)
Expenditure Excess Percentage
of excess
expenditure
1 2 3 4 5 6 7
25 41-Tribal Areas Sub- Plan
31-Water Resources Department 4702-796-800-0102-Tribal Area Sub-Plan-6079- Reform, Reinforcement, Re-establishment (R.R.R)-
20.00 36.71 16.71 83.55
26
42-Public Works
Relating to Tribal
Areas Sub-Plan-
Roads and Bridges
5054-04-796-800-0420-Mineral Area Development Fund-2457-Minimum Need Programme (Including Rural Roads)-
0.0001 13.27 13.27 13270000.00
27 45-Minor Irrigation Works
4702-101-1501-Additional
Central Assistance (Normal)-
6079-Reform, Reinforcement,
Re-establishment (R.R.R)-
50.00 83.34 33.34 66.68
28 55-Women and Child Development
2235-02-102-1201-
Externallyl Aided Project-
(Normal)-6741-Madhya
Pradesh Health Area
Improvement Programme
(Externally Aided)
0.0008 52.40 52.40 6550000.00
29 58-Expenditure on Relief on Account of Natural Calamities and Scarcity
2245-02-101-0747-Relief to
Hailstorm Sufferers 145.00 394.45 249.45 172.03
30 58-Expenditure on Relief on Account of Natural Calamities and Scarcity
2245-05-101-0475-Transfer
to Reserve Fund and Deposits
Accounts- Natural Calamities
unspent Margin-Money Fund
Famine Relief Fund
877.00 1545.00 668.00 76.17
31 58-Expenditure on Relief on Account of Natural Calamities and Scarcity
2245-80-800-7249-Loss of
Crops from Insects 70.00 436.19 366.19 523.13
32
64-Scheduled Castes
Sub-Plan
27-Narmada Valley
Development Department
4700-43-789-800-1503-
Additinional Central
Assistance (S.C.S.P.)-2884-
Canal and Appurtenant
Works
53.15 119.55 66.40 124.93
33 73-Medical
Education
Department
4210-03-800-0101-State Plan Schemes (Normal)-6335-Upgradation in Medical Colleges
0.0002 11.65 11.65 5825000.00
34
74-Financial
Assistance to Three
Tier Panchayati Raj
Institutions
2501-06-198-0101-State Plan Schemes (Normal)-7571-Chief Minister Self Employment/Financial Welfare Schemes
2.65 12.65 10.00 377.36
35
74-Financial
Assistance to Three
Tier Panchayati Raj
Institutions
2515-198-6226-Special Area Grant to Local Bodies under The Recommendations of 13th Finance Commission
0.0001 20.32 20.32 20320000.00
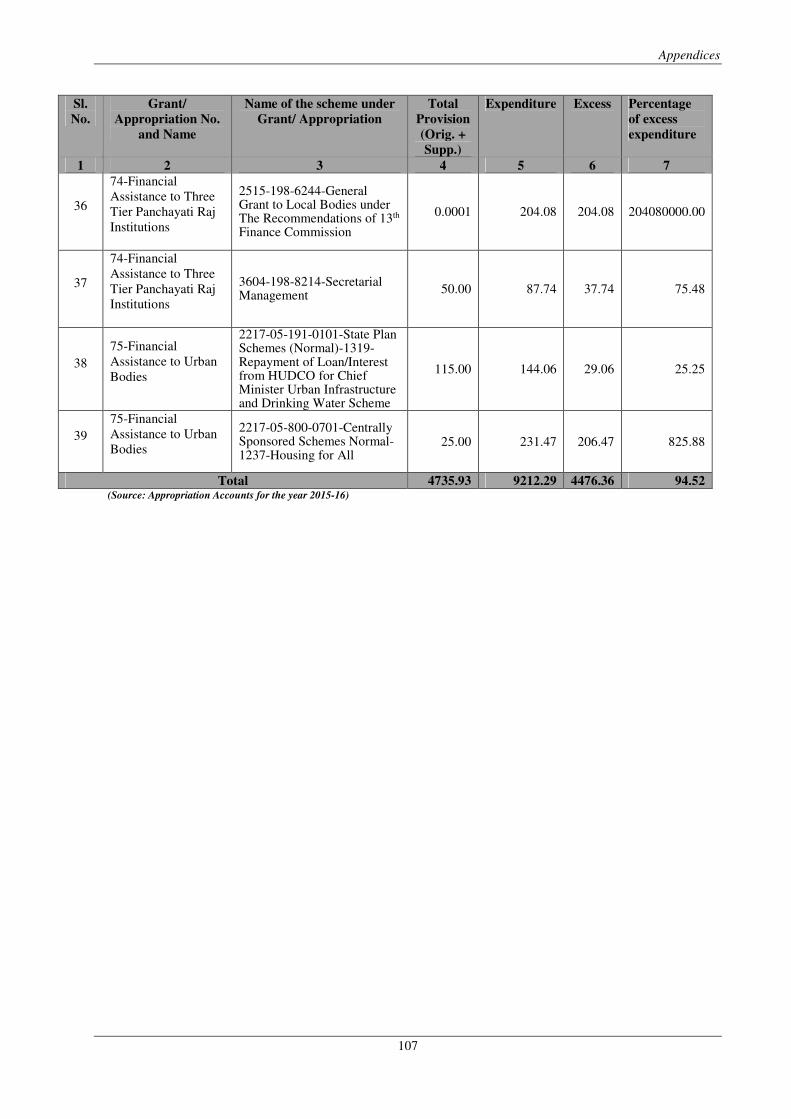
Appendices
107
Sl.
No.
Grant/
Appropriation No.
and Name
Name of the scheme under
Grant/ Appropriation
Total
Provision
(Orig. +
Supp.)
Expenditure Excess Percentage
of excess
expenditure
1 2 3 4 5 6 7
36
74-Financial
Assistance to Three
Tier Panchayati Raj
Institutions
2515-198-6244-General Grant to Local Bodies under The Recommendations of 13th Finance Commission
0.0001 204.08 204.08 204080000.00
37
74-Financial
Assistance to Three
Tier Panchayati Raj
Institutions
3604-198-8214-Secretarial Management
50.00 87.74 37.74 75.48
38
75-Financial
Assistance to Urban
Bodies
2217-05-191-0101-State Plan Schemes (Normal)-1319-Repayment of Loan/Interest from HUDCO for Chief Minister Urban Infrastructure and Drinking Water Scheme
115.00 144.06 29.06 25.25
39
75-Financial
Assistance to Urban
Bodies
2217-05-800-0701-Centrally Sponsored Schemes Normal-1237-Housing for All
25.00 231.47 206.47 825.88
Total 4735.93 9212.29 4476.36 94.52 (Source: Appropriation Accounts for the year 2015-16)
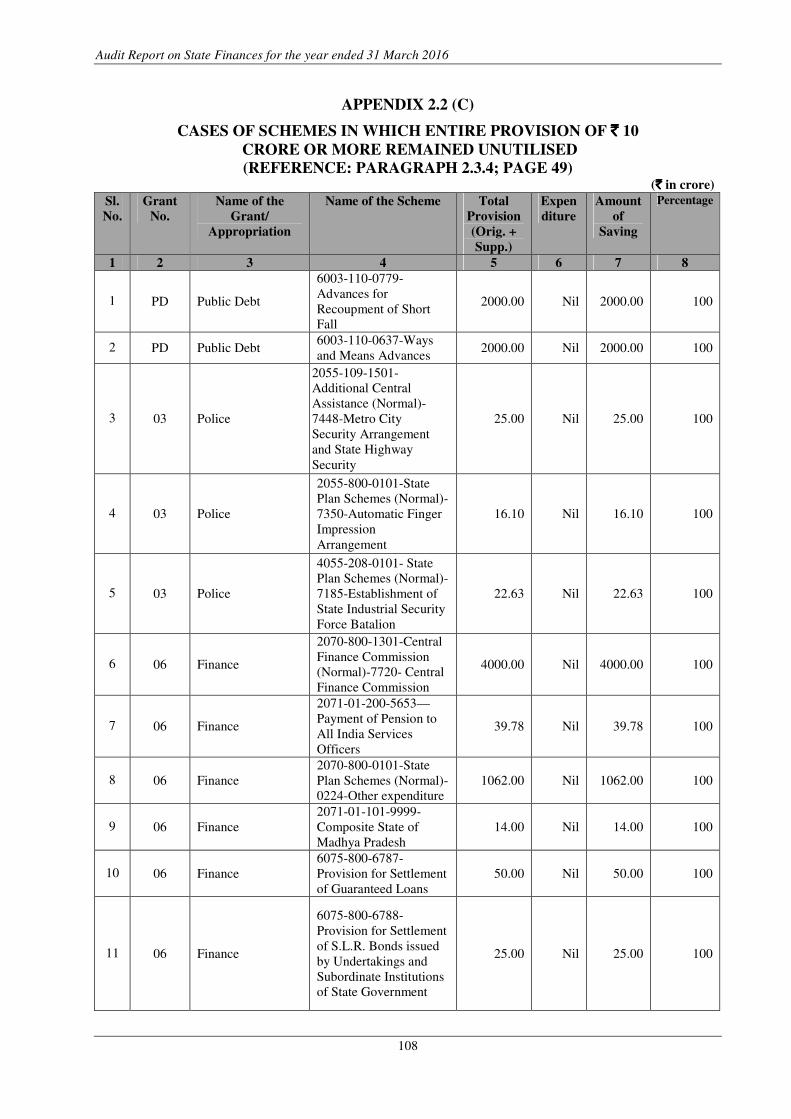
Audit Report on State Finances for the year ended 31 March 2016
108
APPENDIX 2.2 (C)
CASES OF SCHEMES IN WHICH ENTIRE PROVISION OF `̀̀̀ 10
CRORE OR MORE REMAINED UNUTILISED
(REFERENCE: PARAGRAPH 2.3.4; PAGE 49) (`̀̀̀ in crore)
Sl.
No.
Grant
No.
Name of the
Grant/
Appropriation
Name of the Scheme Total
Provision
(Orig. +
Supp.)
Expen
diture
Amount
of
Saving
Percentage
1 2 3 4 5 6 7 8
1 PD Public Debt
6003-110-0779-
Advances for
Recoupment of Short
Fall
2000.00 Nil 2000.00 100
2 PD Public Debt 6003-110-0637-Ways
and Means Advances 2000.00 Nil 2000.00 100
3 03 Police
2055-109-1501-
Additional Central
Assistance (Normal)-
7448-Metro City
Security Arrangement
and State Highway
Security
25.00 Nil 25.00 100
4 03 Police
2055-800-0101-State
Plan Schemes (Normal)-
7350-Automatic Finger
Impression
Arrangement
16.10 Nil 16.10 100
5 03 Police
4055-208-0101- State
Plan Schemes (Normal)-
7185-Establishment of
State Industrial Security
Force Batalion
22.63 Nil 22.63 100
6 06 Finance
2070-800-1301-Central
Finance Commission
(Normal)-7720- Central
Finance Commission
4000.00 Nil 4000.00 100
7 06 Finance
2071-01-200-5653—
Payment of Pension to
All India Services
Officers
39.78 Nil 39.78 100
8 06 Finance
2070-800-0101-State
Plan Schemes (Normal)-
0224-Other expenditure
1062.00 Nil 1062.00 100
9 06 Finance
2071-01-101-9999-
Composite State of
Madhya Pradesh
14.00 Nil 14.00 100
10 06 Finance
6075-800-6787-
Provision for Settlement
of Guaranteed Loans
50.00 Nil 50.00 100
11 06 Finance
6075-800-6788-
Provision for Settlement
of S.L.R. Bonds issued
by Undertakings and
Subordinate Institutions
of State Government
25.00 Nil 25.00 100
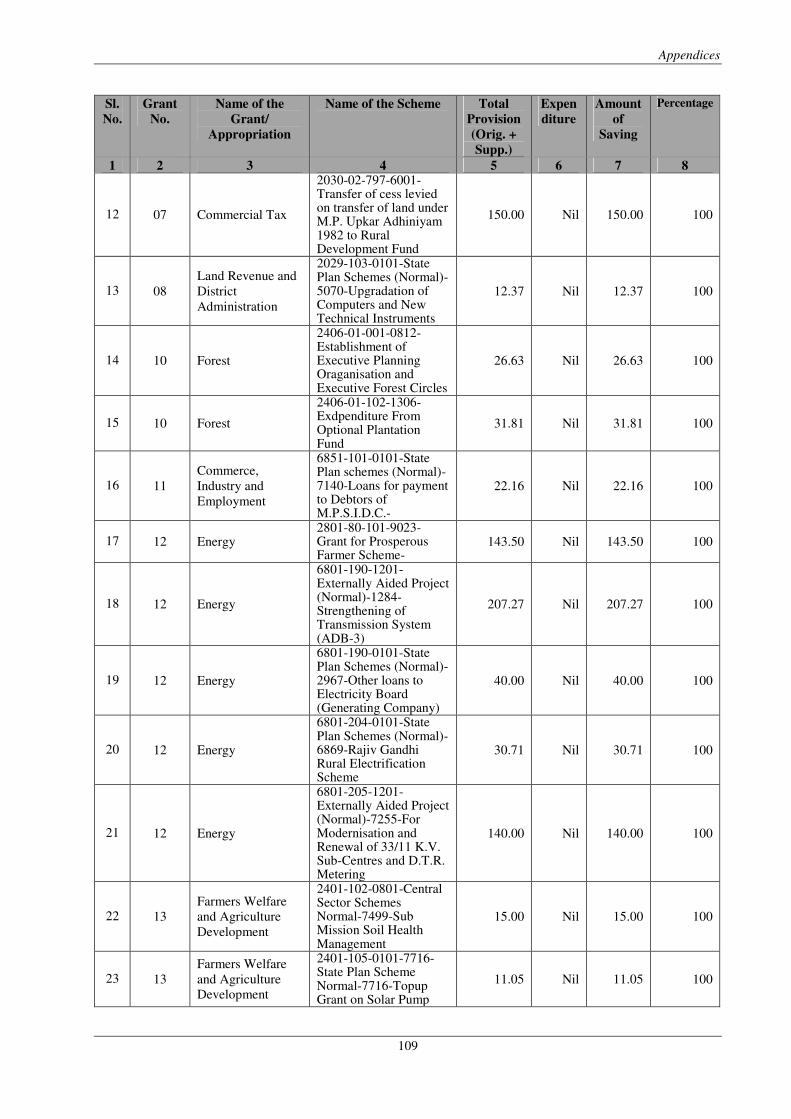
Appendices
109
Sl.
No.
Grant
No.
Name of the
Grant/
Appropriation
Name of the Scheme Total
Provision
(Orig. +
Supp.)
Expen
diture
Amount
of
Saving
Percentage
1 2 3 4 5 6 7 8
12 07 Commercial Tax
2030-02-797-6001-Transfer of cess levied on transfer of land under M.P. Upkar Adhiniyam 1982 to Rural Development Fund
150.00 Nil 150.00 100
13 08
Land Revenue and
District
Administration
2029-103-0101-State Plan Schemes (Normal)-5070-Upgradation of Computers and New Technical Instruments
12.37 Nil 12.37 100
14 10 Forest
2406-01-001-0812-Establishment of Executive Planning Oraganisation and Executive Forest Circles
26.63 Nil 26.63 100
15 10 Forest
2406-01-102-1306-Exdpenditure From Optional Plantation Fund
31.81 Nil 31.81 100
16 11
Commerce,
Industry and
Employment
6851-101-0101-State Plan schemes (Normal)-7140-Loans for payment to Debtors of M.P.S.I.D.C.-
22.16 Nil 22.16 100
17 12 Energy 2801-80-101-9023-Grant for Prosperous Farmer Scheme-
143.50 Nil 143.50 100
18 12 Energy
6801-190-1201-Externally Aided Project (Normal)-1284-Strengthening of Transmission System (ADB-3)
207.27 Nil 207.27 100
19 12 Energy
6801-190-0101-State Plan Schemes (Normal)- 2967-Other loans to Electricity Board (Generating Company)
40.00 Nil 40.00 100
20 12 Energy
6801-204-0101-State Plan Schemes (Normal)-6869-Rajiv Gandhi Rural Electrification Scheme
30.71 Nil 30.71 100
21 12 Energy
6801-205-1201- Externally Aided Project (Normal)-7255-For Modernisation and Renewal of 33/11 K.V. Sub-Centres and D.T.R. Metering
140.00 Nil 140.00 100
22 13
Farmers Welfare
and Agriculture
Development
2401-102-0801-Central Sector Schemes Normal-7499-Sub Mission Soil Health Management
15.00 Nil 15.00 100
23 13
Farmers Welfare
and Agriculture
Development
2401-105-0101-7716-State Plan Scheme Normal-7716-Topup Grant on Solar Pump
11.05 Nil 11.05 100
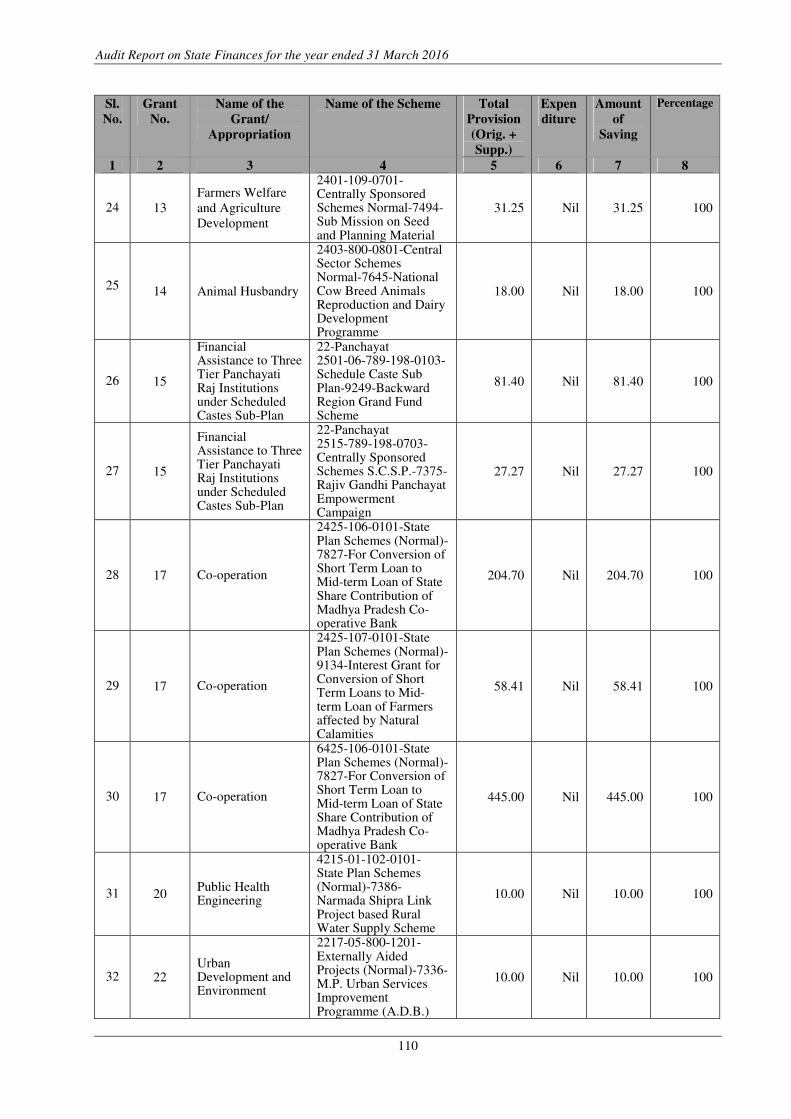
Audit Report on State Finances for the year ended 31 March 2016
110
Sl.
No.
Grant
No.
Name of the
Grant/
Appropriation
Name of the Scheme Total
Provision
(Orig. +
Supp.)
Expen
diture
Amount
of
Saving
Percentage
1 2 3 4 5 6 7 8
24 13
Farmers Welfare
and Agriculture
Development
2401-109-0701-Centrally Sponsored Schemes Normal-7494-Sub Mission on Seed and Planning Material
31.25 Nil 31.25 100
25 14 Animal Husbandry
2403-800-0801-Central Sector Schemes Normal-7645-National Cow Breed Animals Reproduction and Dairy Development Programme
18.00 Nil 18.00 100
26 15
Financial Assistance to Three Tier Panchayati Raj Institutions under Scheduled Castes Sub-Plan
22-Panchayat 2501-06-789-198-0103-Schedule Caste Sub Plan-9249-Backward Region Grand Fund Scheme
81.40 Nil 81.40 100
27 15
Financial Assistance to Three Tier Panchayati Raj Institutions under Scheduled Castes Sub-Plan
22-Panchayat 2515-789-198-0703-Centrally Sponsored Schemes S.C.S.P.-7375-Rajiv Gandhi Panchayat Empowerment Campaign
27.27 Nil 27.27 100
28 17 Co-operation
2425-106-0101-State Plan Schemes (Normal)-7827-For Conversion of Short Term Loan to Mid-term Loan of State Share Contribution of Madhya Pradesh Co-operative Bank
204.70 Nil 204.70 100
29 17 Co-operation
2425-107-0101-State Plan Schemes (Normal)-9134-Interest Grant for Conversion of Short Term Loans to Mid-term Loan of Farmers affected by Natural Calamities
58.41 Nil 58.41 100
30 17 Co-operation
6425-106-0101-State Plan Schemes (Normal)-7827-For Conversion of Short Term Loan to Mid-term Loan of State Share Contribution of Madhya Pradesh Co-operative Bank
445.00 Nil 445.00 100
31 20 Public Health Engineering
4215-01-102-0101- State Plan Schemes (Normal)-7386-Narmada Shipra Link Project based Rural Water Supply Scheme
10.00 Nil 10.00 100
32 22 Urban Development and Environment
2217-05-800-1201- Externally Aided Projects (Normal)-7336- M.P. Urban Services Improvement Programme (A.D.B.)
10.00 Nil 10.00 100
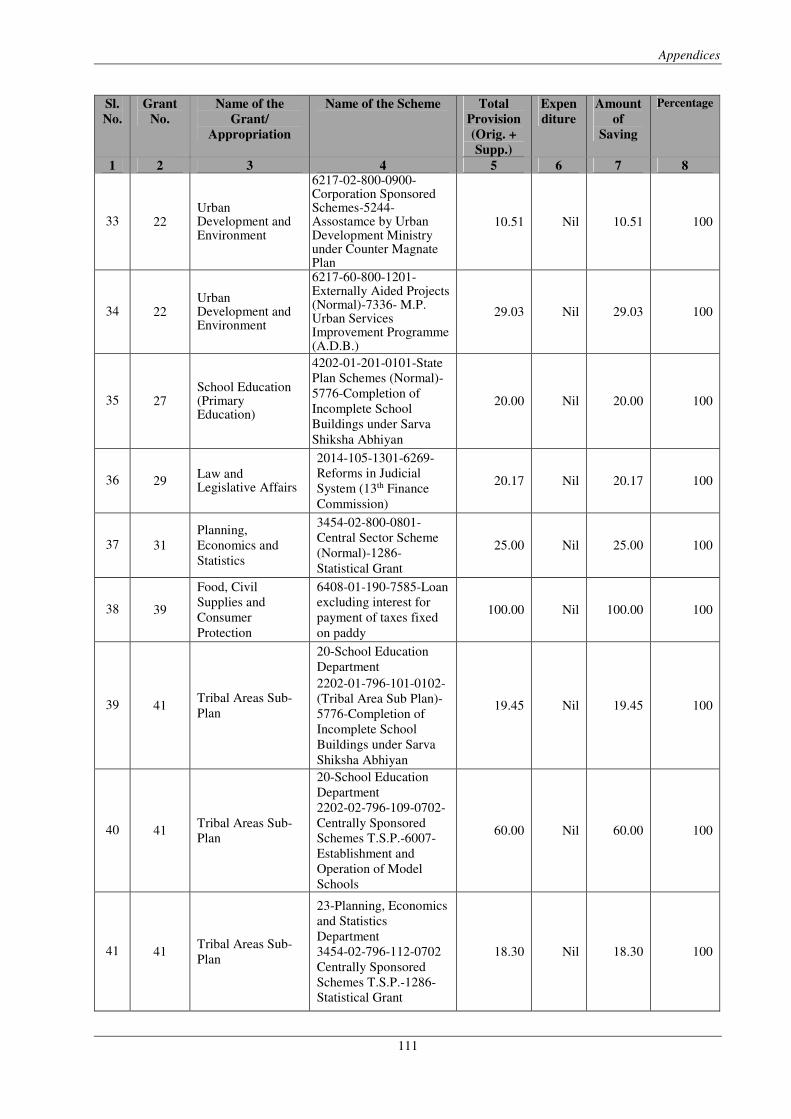
Appendices
111
Sl.
No.
Grant
No.
Name of the
Grant/
Appropriation
Name of the Scheme Total
Provision
(Orig. +
Supp.)
Expen
diture
Amount
of
Saving
Percentage
1 2 3 4 5 6 7 8
33 22 Urban Development and Environment
6217-02-800-0900-Corporation Sponsored Schemes-5244-Assostamce by Urban Development Ministry under Counter Magnate Plan
10.51 Nil 10.51 100
34 22 Urban Development and Environment
6217-60-800-1201- Externally Aided Projects (Normal)-7336- M.P. Urban Services Improvement Programme (A.D.B.)
29.03 Nil 29.03 100
35 27 School Education (Primary Education)
4202-01-201-0101-State
Plan Schemes (Normal)-
5776-Completion of
Incomplete School
Buildings under Sarva
Shiksha Abhiyan
20.00 Nil 20.00 100
36 29 Law and Legislative Affairs
2014-105-1301-6269-
Reforms in Judicial
System (13th Finance
Commission)
20.17 Nil 20.17 100
37 31
Planning,
Economics and
Statistics
3454-02-800-0801-
Central Sector Scheme
(Normal)-1286-
Statistical Grant
25.00 Nil 25.00 100
38 39
Food, Civil
Supplies and
Consumer
Protection
6408-01-190-7585-Loan
excluding interest for
payment of taxes fixed
on paddy
100.00 Nil 100.00 100
39 41 Tribal Areas Sub-
Plan
20-School Education
Department
2202-01-796-101-0102-
(Tribal Area Sub Plan)-
5776-Completion of
Incomplete School
Buildings under Sarva
Shiksha Abhiyan
19.45 Nil 19.45 100
40 41 Tribal Areas Sub-
Plan
20-School Education
Department
2202-02-796-109-0702-
Centrally Sponsored
Schemes T.S.P.-6007-
Establishment and
Operation of Model
Schools
60.00 Nil 60.00 100
41 41 Tribal Areas Sub-
Plan
23-Planning, Economics
and Statistics
Department
3454-02-796-112-0702
Centrally Sponsored
Schemes T.S.P.-1286-
Statistical Grant
18.30 Nil 18.30 100
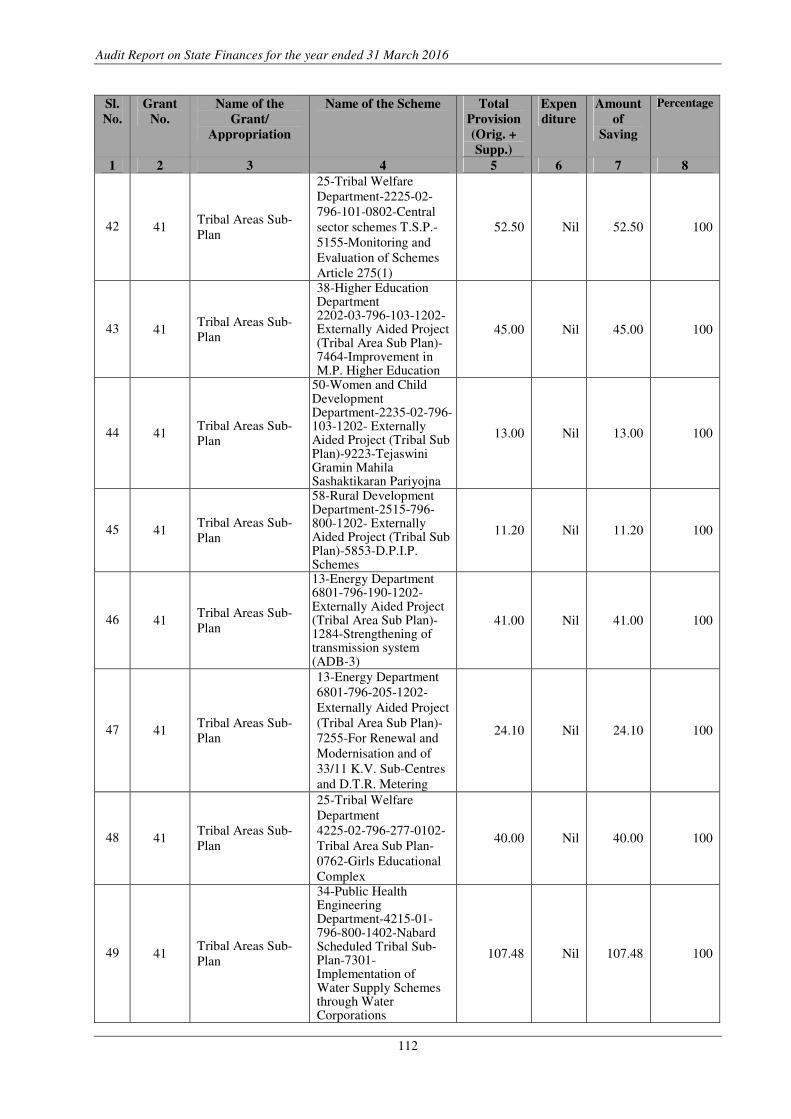
Audit Report on State Finances for the year ended 31 March 2016
112
Sl.
No.
Grant
No.
Name of the
Grant/
Appropriation
Name of the Scheme Total
Provision
(Orig. +
Supp.)
Expen
diture
Amount
of
Saving
Percentage
1 2 3 4 5 6 7 8
42 41 Tribal Areas Sub-
Plan
25-Tribal Welfare
Department-2225-02-
796-101-0802-Central
sector schemes T.S.P.-
5155-Monitoring and
Evaluation of Schemes
Article 275(1)
52.50 Nil 52.50 100
43 41 Tribal Areas Sub-
Plan
38-Higher Education Department 2202-03-796-103-1202-Externally Aided Project (Tribal Area Sub Plan)-7464-Improvement in M.P. Higher Education
45.00 Nil 45.00 100
44 41 Tribal Areas Sub-
Plan
50-Women and Child Development Department-2235-02-796-103-1202- Externally Aided Project (Tribal Sub Plan)-9223-Tejaswini Gramin Mahila Sashaktikaran Pariyojna
13.00 Nil 13.00 100
45 41 Tribal Areas Sub-
Plan
58-Rural Development Department-2515-796-800-1202- Externally Aided Project (Tribal Sub Plan)-5853-D.P.I.P. Schemes
11.20 Nil 11.20 100
46 41 Tribal Areas Sub-
Plan
13-Energy Department 6801-796-190-1202-Externally Aided Project (Tribal Area Sub Plan)-1284-Strengthening of transmission system (ADB-3)
41.00 Nil 41.00 100
47 41 Tribal Areas Sub-
Plan
13-Energy Department
6801-796-205-1202-
Externally Aided Project
(Tribal Area Sub Plan)-
7255-For Renewal and
Modernisation and of
33/11 K.V. Sub-Centres
and D.T.R. Metering
24.10 Nil 24.10 100
48 41 Tribal Areas Sub-
Plan
25-Tribal Welfare
Department
4225-02-796-277-0102-
Tribal Area Sub Plan-
0762-Girls Educational
Complex
40.00 Nil 40.00 100
49 41 Tribal Areas Sub-
Plan
34-Public Health Engineering Department-4215-01-796-800-1402-Nabard Scheduled Tribal Sub-Plan-7301-Implementation of Water Supply Schemes through Water Corporations
107.48 Nil 107.48 100
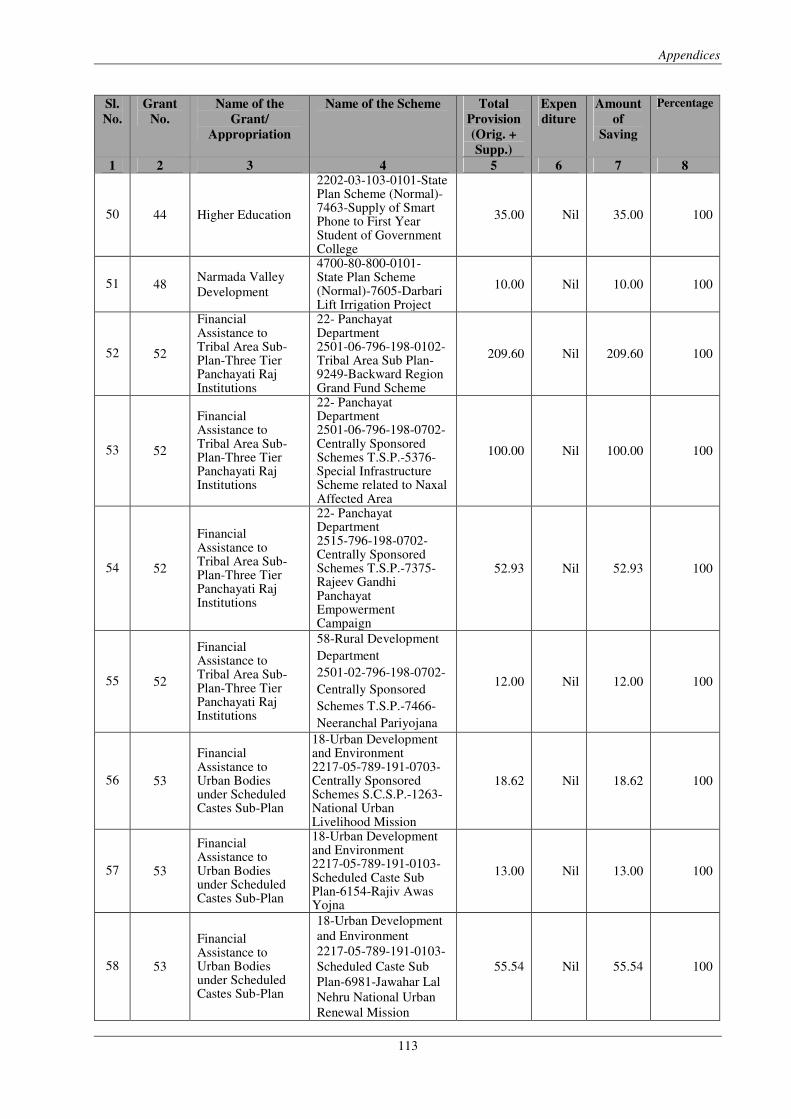
Appendices
113
Sl.
No.
Grant
No.
Name of the
Grant/
Appropriation
Name of the Scheme Total
Provision
(Orig. +
Supp.)
Expen
diture
Amount
of
Saving
Percentage
1 2 3 4 5 6 7 8
50 44 Higher Education
2202-03-103-0101-State Plan Scheme (Normal)-7463-Supply of Smart Phone to First Year Student of Government College
35.00 Nil 35.00 100
51 48 Narmada Valley
Development
4700-80-800-0101- State Plan Scheme (Normal)-7605-Darbari Lift Irrigation Project
10.00 Nil 10.00 100
52 52
Financial Assistance to Tribal Area Sub-Plan-Three Tier Panchayati Raj Institutions
22- Panchayat Department 2501-06-796-198-0102-Tribal Area Sub Plan-9249-Backward Region Grand Fund Scheme
209.60 Nil 209.60 100
53 52
Financial Assistance to Tribal Area Sub-Plan-Three Tier Panchayati Raj Institutions
22- Panchayat Department 2501-06-796-198-0702-Centrally Sponsored Schemes T.S.P.-5376-Special Infrastructure Scheme related to Naxal Affected Area
100.00 Nil 100.00 100
54 52
Financial Assistance to Tribal Area Sub-Plan-Three Tier Panchayati Raj Institutions
22- Panchayat Department 2515-796-198-0702-Centrally Sponsored Schemes T.S.P.-7375-Rajeev Gandhi Panchayat Empowerment Campaign
52.93 Nil 52.93 100
55 52
Financial Assistance to Tribal Area Sub-Plan-Three Tier Panchayati Raj Institutions
58-Rural Development
Department
2501-02-796-198-0702-
Centrally Sponsored
Schemes T.S.P.-7466-
Neeranchal Pariyojana
12.00 Nil 12.00 100
56 53
Financial Assistance to Urban Bodies under Scheduled Castes Sub-Plan
18-Urban Development and Environment 2217-05-789-191-0703-Centrally Sponsored Schemes S.C.S.P.-1263-National Urban Livelihood Mission
18.62 Nil 18.62 100
57 53
Financial Assistance to Urban Bodies under Scheduled Castes Sub-Plan
18-Urban Development and Environment 2217-05-789-191-0103-Scheduled Caste Sub Plan-6154-Rajiv Awas Yojna
13.00 Nil 13.00 100
58 53
Financial Assistance to Urban Bodies under Scheduled Castes Sub-Plan
18-Urban Development
and Environment
2217-05-789-191-0103-
Scheduled Caste Sub
Plan-6981-Jawahar Lal
Nehru National Urban
Renewal Mission
55.54 Nil 55.54 100
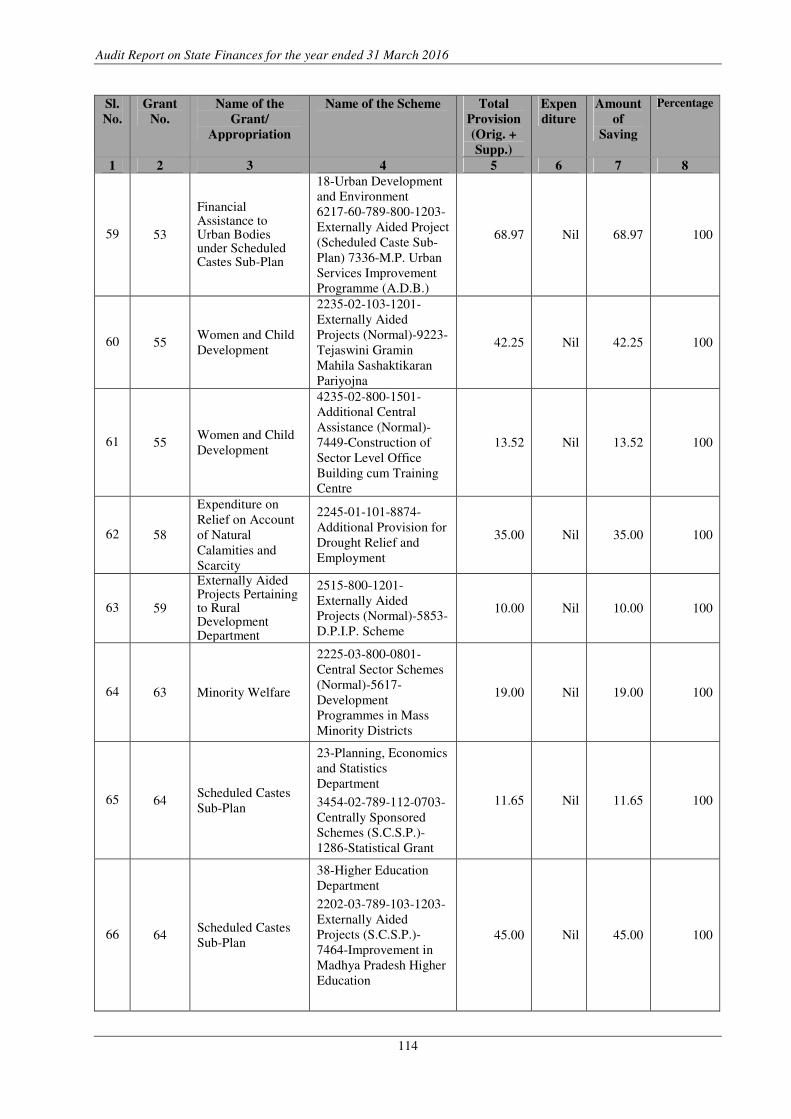
Audit Report on State Finances for the year ended 31 March 2016
114
Sl.
No.
Grant
No.
Name of the
Grant/
Appropriation
Name of the Scheme Total
Provision
(Orig. +
Supp.)
Expen
diture
Amount
of
Saving
Percentage
1 2 3 4 5 6 7 8
59 53
Financial Assistance to Urban Bodies under Scheduled Castes Sub-Plan
18-Urban Development
and Environment
6217-60-789-800-1203-
Externally Aided Project
(Scheduled Caste Sub-
Plan) 7336-M.P. Urban
Services Improvement
Programme (A.D.B.)
68.97 Nil 68.97 100
60 55 Women and Child
Development
2235-02-103-1201-
Externally Aided
Projects (Normal)-9223-
Tejaswini Gramin
Mahila Sashaktikaran
Pariyojna
42.25 Nil 42.25 100
61 55 Women and Child
Development
4235-02-800-1501-
Additional Central
Assistance (Normal)-
7449-Construction of
Sector Level Office
Building cum Training
Centre
13.52 Nil 13.52 100
62 58
Expenditure on
Relief on Account
of Natural
Calamities and
Scarcity
2245-01-101-8874-
Additional Provision for
Drought Relief and
Employment
35.00 Nil 35.00 100
63 59
Externally Aided Projects Pertaining to Rural Development Department
2515-800-1201-
Externally Aided
Projects (Normal)-5853-
D.P.I.P. Scheme
10.00 Nil 10.00 100
64 63 Minority Welfare
2225-03-800-0801-
Central Sector Schemes
(Normal)-5617-
Development
Programmes in Mass
Minority Districts
19.00 Nil 19.00 100
65 64 Scheduled Castes
Sub-Plan
23-Planning, Economics
and Statistics
Department
3454-02-789-112-0703-
Centrally Sponsored
Schemes (S.C.S.P.)-
1286-Statistical Grant
11.65 Nil 11.65 100
66 64 Scheduled Castes
Sub-Plan
38-Higher Education
Department
2202-03-789-103-1203-
Externally Aided
Projects (S.C.S.P.)-
7464-Improvement in
Madhya Pradesh Higher
Education
45.00 Nil 45.00 100
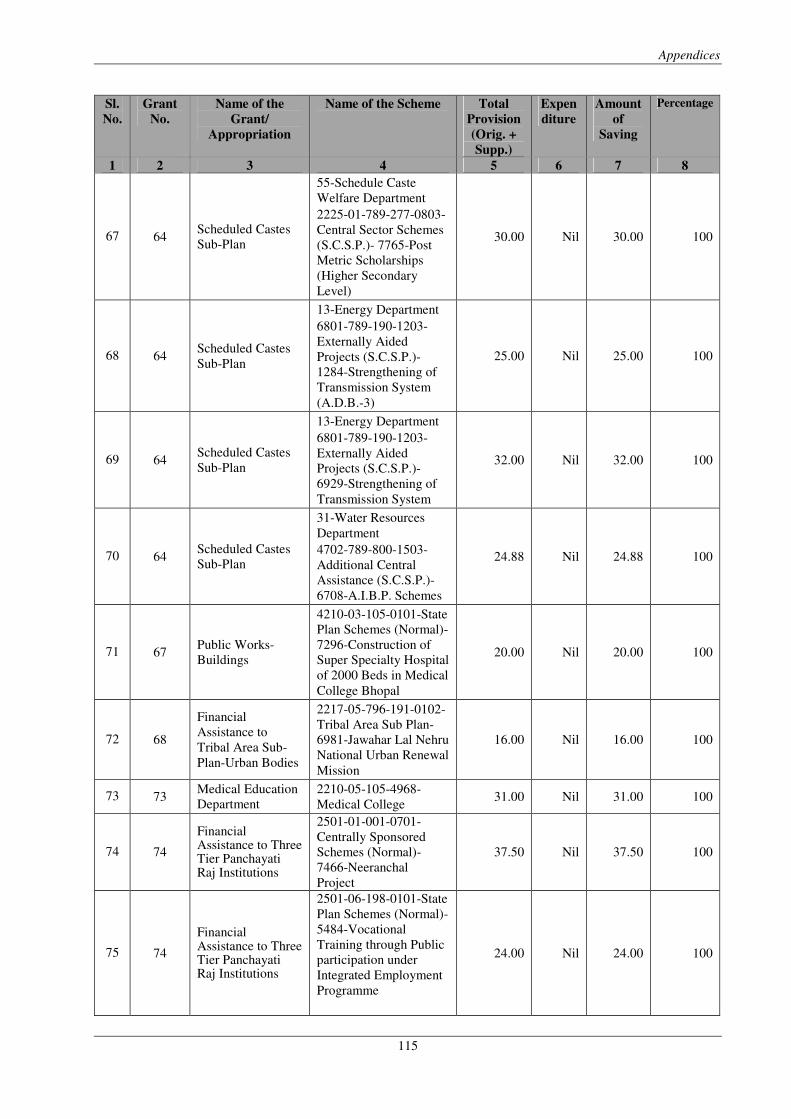
Appendices
115
Sl.
No.
Grant
No.
Name of the
Grant/
Appropriation
Name of the Scheme Total
Provision
(Orig. +
Supp.)
Expen
diture
Amount
of
Saving
Percentage
1 2 3 4 5 6 7 8
67 64 Scheduled Castes
Sub-Plan
55-Schedule Caste
Welfare Department
2225-01-789-277-0803-
Central Sector Schemes
(S.C.S.P.)- 7765-Post
Metric Scholarships
(Higher Secondary
Level)
30.00 Nil 30.00 100
68 64 Scheduled Castes
Sub-Plan
13-Energy Department
6801-789-190-1203-
Externally Aided
Projects (S.C.S.P.)-
1284-Strengthening of
Transmission System
(A.D.B.-3)
25.00 Nil 25.00 100
69 64 Scheduled Castes
Sub-Plan
13-Energy Department
6801-789-190-1203-
Externally Aided
Projects (S.C.S.P.)-
6929-Strengthening of
Transmission System
32.00 Nil 32.00 100
70 64 Scheduled Castes
Sub-Plan
31-Water Resources
Department
4702-789-800-1503-
Additional Central
Assistance (S.C.S.P.)-
6708-A.I.B.P. Schemes
24.88 Nil 24.88 100
71 67 Public Works-
Buildings
4210-03-105-0101-State
Plan Schemes (Normal)-
7296-Construction of
Super Specialty Hospital
of 2000 Beds in Medical
College Bhopal
20.00 Nil 20.00 100
72 68
Financial
Assistance to
Tribal Area Sub-
Plan-Urban Bodies
2217-05-796-191-0102-
Tribal Area Sub Plan-
6981-Jawahar Lal Nehru
National Urban Renewal
Mission
16.00 Nil 16.00 100
73 73 Medical Education
Department
2210-05-105-4968-
Medical College 31.00 Nil 31.00 100
74 74
Financial Assistance to Three Tier Panchayati Raj Institutions
2501-01-001-0701-
Centrally Sponsored
Schemes (Normal)-
7466-Neeranchal
Project
37.50 Nil 37.50 100
75 74
Financial Assistance to Three Tier Panchayati Raj Institutions
2501-06-198-0101-State
Plan Schemes (Normal)-
5484-Vocational
Training through Public
participation under
Integrated Employment
Programme
24.00 Nil 24.00 100
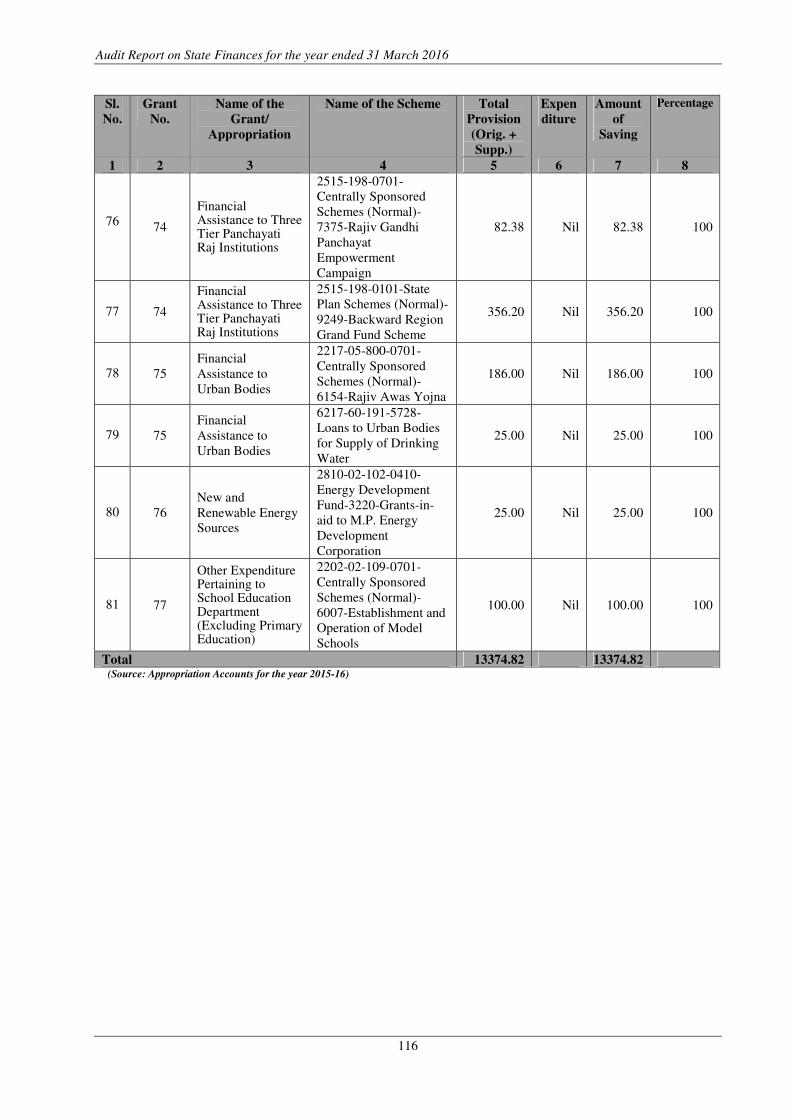
Audit Report on State Finances for the year ended 31 March 2016
116
Sl.
No.
Grant
No.
Name of the
Grant/
Appropriation
Name of the Scheme Total
Provision
(Orig. +
Supp.)
Expen
diture
Amount
of
Saving
Percentage
1 2 3 4 5 6 7 8
76 74
Financial Assistance to Three Tier Panchayati Raj Institutions
2515-198-0701-
Centrally Sponsored
Schemes (Normal)-
7375-Rajiv Gandhi
Panchayat
Empowerment
Campaign
82.38 Nil 82.38 100
77 74
Financial Assistance to Three Tier Panchayati Raj Institutions
2515-198-0101-State
Plan Schemes (Normal)-
9249-Backward Region
Grand Fund Scheme
356.20 Nil 356.20 100
78 75
Financial
Assistance to
Urban Bodies
2217-05-800-0701-
Centrally Sponsored
Schemes (Normal)-
6154-Rajiv Awas Yojna
186.00 Nil 186.00 100
79 75
Financial
Assistance to
Urban Bodies
6217-60-191-5728-
Loans to Urban Bodies
for Supply of Drinking
Water
25.00 Nil 25.00 100
80 76
New and
Renewable Energy
Sources
2810-02-102-0410-
Energy Development
Fund-3220-Grants-in-
aid to M.P. Energy
Development
Corporation
25.00 Nil 25.00 100
81 77
Other Expenditure Pertaining to School Education Department (Excluding Primary Education)
2202-02-109-0701-
Centrally Sponsored
Schemes (Normal)-
6007-Establishment and
Operation of Model
Schools
100.00 Nil 100.00 100
Total 13374.82 13374.82 (Source: Appropriation Accounts for the year 2015-16)
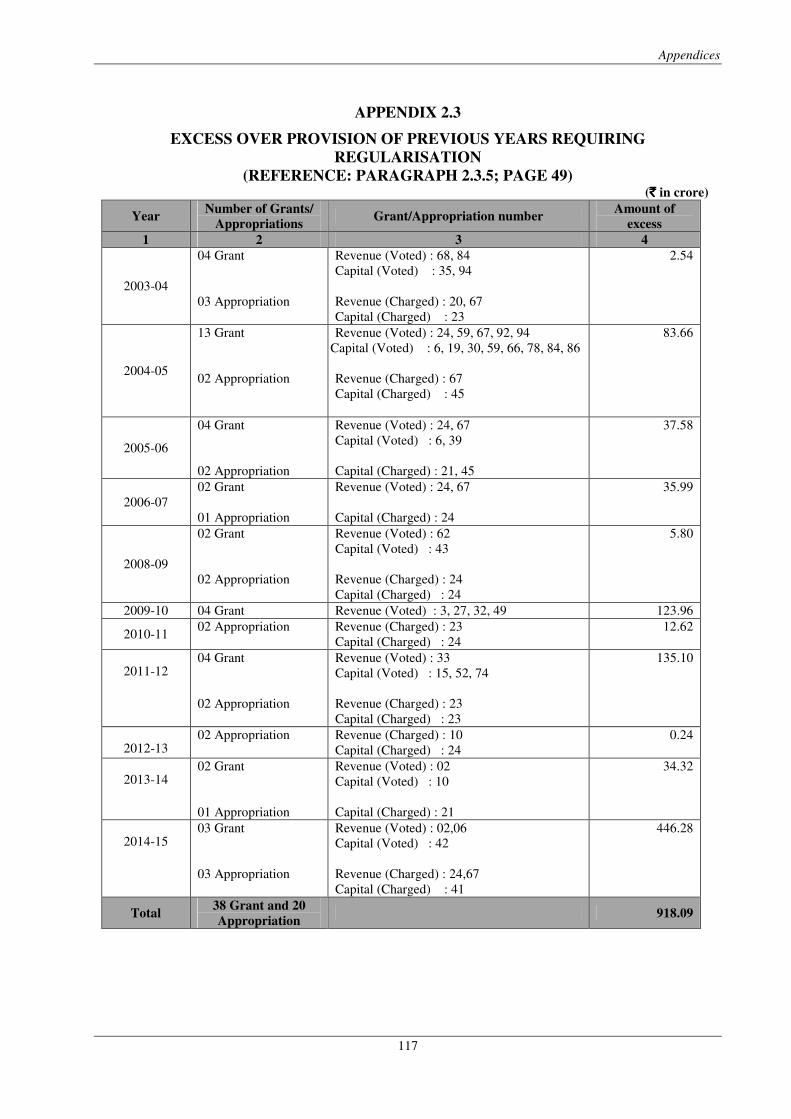
Appendices
117
APPENDIX 2.3
EXCESS OVER PROVISION OF PREVIOUS YEARS REQUIRING
REGULARISATION
(REFERENCE: PARAGRAPH 2.3.5; PAGE 49) (`̀̀̀ in crore)
Year Number of Grants/
Appropriations Grant/Appropriation number
Amount of
excess
1 2 3 4
2003-04
04 Grant
03 Appropriation
Revenue (Voted) : 68, 84
Capital (Voted) : 35, 94
Revenue (Charged) : 20, 67
Capital (Charged) : 23
2.54
2004-05
13 Grant
02 Appropriation
Revenue (Voted) : 24, 59, 67, 92, 94
Capital (Voted) : 6, 19, 30, 59, 66, 78, 84, 86
Revenue (Charged) : 67
Capital (Charged) : 45
83.66
2005-06
04 Grant
02 Appropriation
Revenue (Voted) : 24, 67
Capital (Voted) : 6, 39
Capital (Charged) : 21, 45
37.58
2006-07
02 Grant
01 Appropriation
Revenue (Voted) : 24, 67
Capital (Charged) : 24
35.99
2008-09
02 Grant
02 Appropriation
Revenue (Voted) : 62
Capital (Voted) : 43
Revenue (Charged) : 24
Capital (Charged) : 24
5.80
2009-10 04 Grant Revenue (Voted) : 3, 27, 32, 49 123.96
2010-11 02 Appropriation Revenue (Charged) : 23
Capital (Charged) : 24
12.62
2011-12 04 Grant
02 Appropriation
Revenue (Voted) : 33
Capital (Voted) : 15, 52, 74
Revenue (Charged) : 23
Capital (Charged) : 23
135.10
2012-13 02 Appropriation Revenue (Charged) : 10
Capital (Charged) : 24
0.24
2013-14 02 Grant
01 Appropriation
Revenue (Voted) : 02
Capital (Voted) : 10
Capital (Charged) : 21
34.32
2014-15 03 Grant
03 Appropriation
Revenue (Voted) : 02,06
Capital (Voted) : 42
Revenue (Charged) : 24,67
Capital (Charged) : 41
446.28
Total 38 Grant and 20
Appropriation 918.09
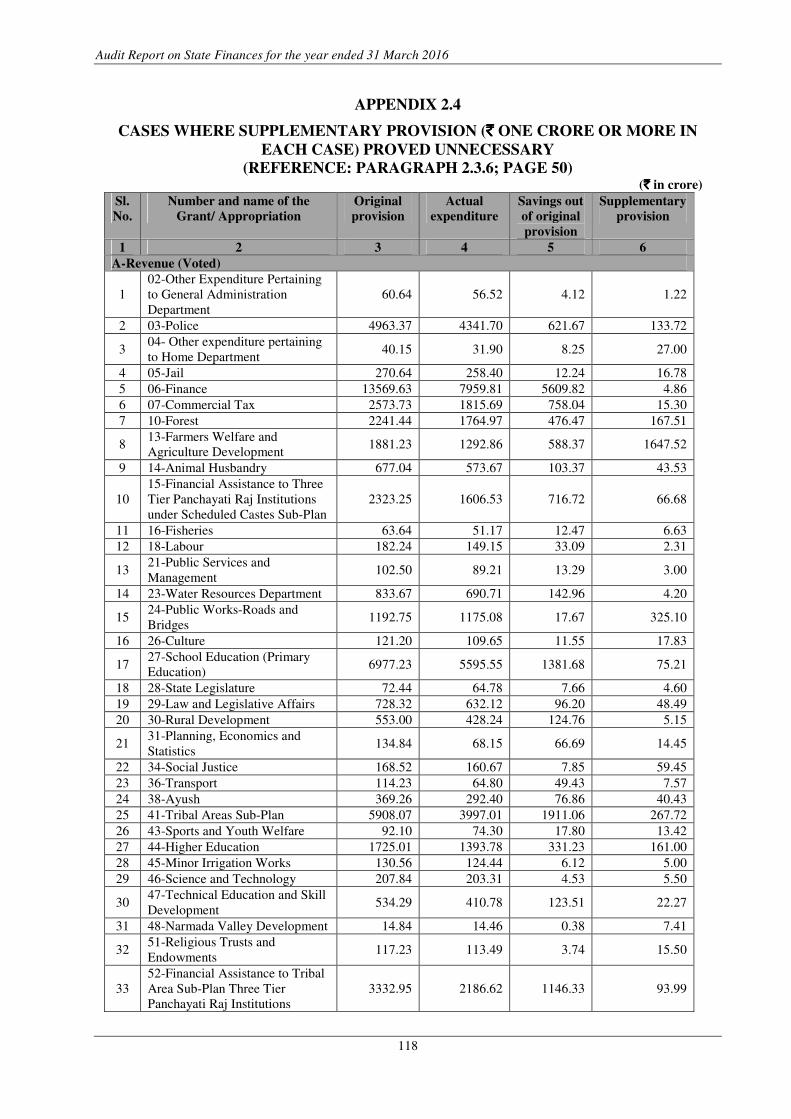
Audit Report on State Finances for the year ended 31 March 2016
118
APPENDIX 2.4
CASES WHERE SUPPLEMENTARY PROVISION (`̀̀̀ ONE CRORE OR MORE IN
EACH CASE) PROVED UNNECESSARY
(REFERENCE: PARAGRAPH 2.3.6; PAGE 50) (`̀̀̀ in crore)
Sl.
No.
Number and name of the
Grant/ Appropriation
Original
provision
Actual
expenditure
Savings out
of original
provision
Supplementary
provision
1 2 3 4 5 6
A-Revenue (Voted)
1
02-Other Expenditure Pertaining
to General Administration
Department
60.64 56.52 4.12 1.22
2 03-Police 4963.37 4341.70 621.67 133.72
3 04- Other expenditure pertaining
to Home Department 40.15 31.90 8.25 27.00
4 05-Jail 270.64 258.40 12.24 16.78
5 06-Finance 13569.63 7959.81 5609.82 4.86
6 07-Commercial Tax 2573.73 1815.69 758.04 15.30
7 10-Forest 2241.44 1764.97 476.47 167.51
8 13-Farmers Welfare and
Agriculture Development 1881.23 1292.86 588.37 1647.52
9 14-Animal Husbandry 677.04 573.67 103.37 43.53
10
15-Financial Assistance to Three
Tier Panchayati Raj Institutions
under Scheduled Castes Sub-Plan
2323.25 1606.53 716.72 66.68
11 16-Fisheries 63.64 51.17 12.47 6.63
12 18-Labour 182.24 149.15 33.09 2.31
13 21-Public Services and
Management 102.50 89.21 13.29 3.00
14 23-Water Resources Department 833.67 690.71 142.96 4.20
15 24-Public Works-Roads and
Bridges 1192.75 1175.08 17.67 325.10
16 26-Culture 121.20 109.65 11.55 17.83
17 27-School Education (Primary
Education) 6977.23 5595.55 1381.68 75.21
18 28-State Legislature 72.44 64.78 7.66 4.60
19 29-Law and Legislative Affairs 728.32 632.12 96.20 48.49
20 30-Rural Development 553.00 428.24 124.76 5.15
21 31-Planning, Economics and
Statistics 134.84 68.15 66.69 14.45
22 34-Social Justice 168.52 160.67 7.85 59.45
23 36-Transport 114.23 64.80 49.43 7.57
24 38-Ayush 369.26 292.40 76.86 40.43
25 41-Tribal Areas Sub-Plan 5908.07 3997.01 1911.06 267.72
26 43-Sports and Youth Welfare 92.10 74.30 17.80 13.42
27 44-Higher Education 1725.01 1393.78 331.23 161.00
28 45-Minor Irrigation Works 130.56 124.44 6.12 5.00
29 46-Science and Technology 207.84 203.31 4.53 5.50
30 47-Technical Education and Skill
Development 534.29 410.78 123.51 22.27
31 48-Narmada Valley Development 14.84 14.46 0.38 7.41
32 51-Religious Trusts and
Endowments 117.23 113.49 3.74 15.50
33
52-Financial Assistance to Tribal
Area Sub-Plan Three Tier
Panchayati Raj Institutions
3332.95 2186.62 1146.33 93.99
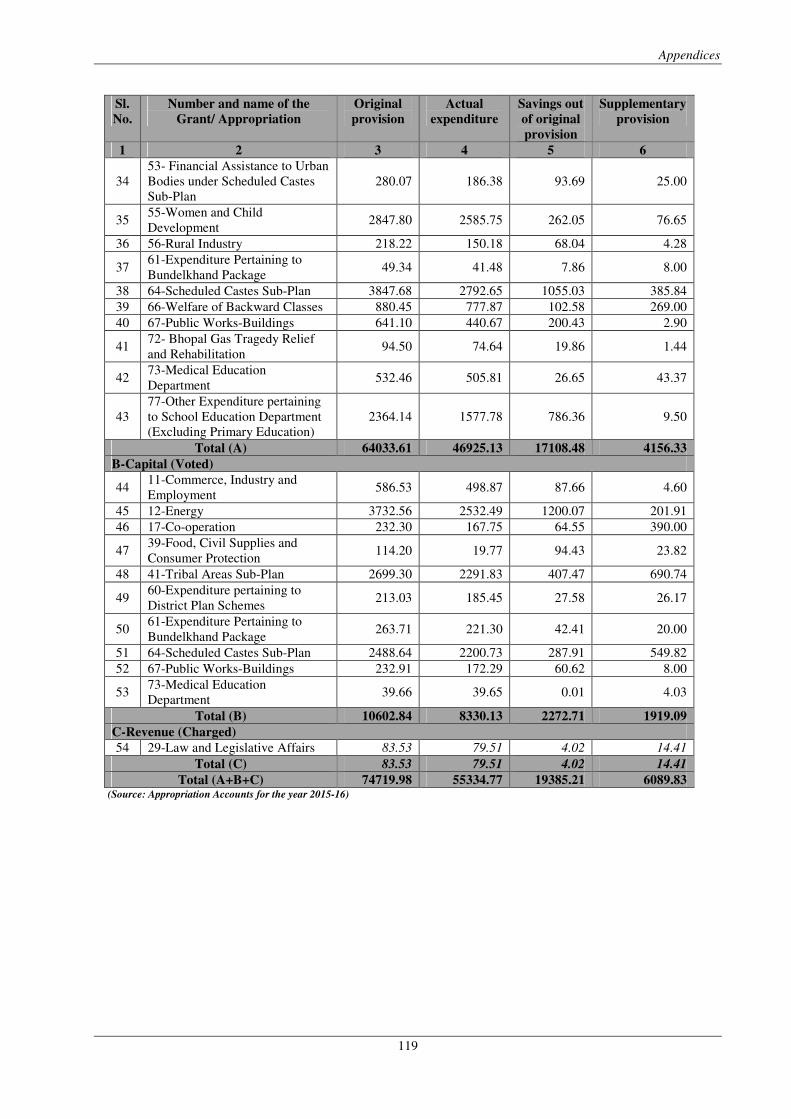
Appendices
119
Sl.
No.
Number and name of the
Grant/ Appropriation
Original
provision
Actual
expenditure
Savings out
of original
provision
Supplementary
provision
1 2 3 4 5 6
34
53- Financial Assistance to Urban
Bodies under Scheduled Castes
Sub-Plan
280.07 186.38 93.69 25.00
35 55-Women and Child
Development 2847.80 2585.75 262.05 76.65
36 56-Rural Industry 218.22 150.18 68.04 4.28
37 61-Expenditure Pertaining to
Bundelkhand Package 49.34 41.48 7.86 8.00
38 64-Scheduled Castes Sub-Plan 3847.68 2792.65 1055.03 385.84
39 66-Welfare of Backward Classes 880.45 777.87 102.58 269.00
40 67-Public Works-Buildings 641.10 440.67 200.43 2.90
41 72- Bhopal Gas Tragedy Relief
and Rehabilitation 94.50 74.64 19.86 1.44
42 73-Medical Education
Department 532.46 505.81 26.65 43.37
43
77-Other Expenditure pertaining
to School Education Department
(Excluding Primary Education)
2364.14 1577.78 786.36 9.50
Total (A) 64033.61 46925.13 17108.48 4156.33
B-Capital (Voted)
44 11-Commerce, Industry and
Employment 586.53 498.87 87.66 4.60
45 12-Energy 3732.56 2532.49 1200.07 201.91
46 17-Co-operation 232.30 167.75 64.55 390.00
47 39-Food, Civil Supplies and
Consumer Protection 114.20 19.77 94.43 23.82
48 41-Tribal Areas Sub-Plan 2699.30 2291.83 407.47 690.74
49 60-Expenditure pertaining to
District Plan Schemes 213.03 185.45 27.58 26.17
50 61-Expenditure Pertaining to
Bundelkhand Package 263.71 221.30 42.41 20.00
51 64-Scheduled Castes Sub-Plan 2488.64 2200.73 287.91 549.82
52 67-Public Works-Buildings 232.91 172.29 60.62 8.00
53 73-Medical Education
Department 39.66 39.65 0.01 4.03
Total (B) 10602.84 8330.13 2272.71 1919.09
C-Revenue (Charged)
54 29-Law and Legislative Affairs 83.53 79.51 4.02 14.41
Total (C) 83.53 79.51 4.02 14.41
Total (A+B+C) 74719.98 55334.77 19385.21 6089.83 (Source: Appropriation Accounts for the year 2015-16)
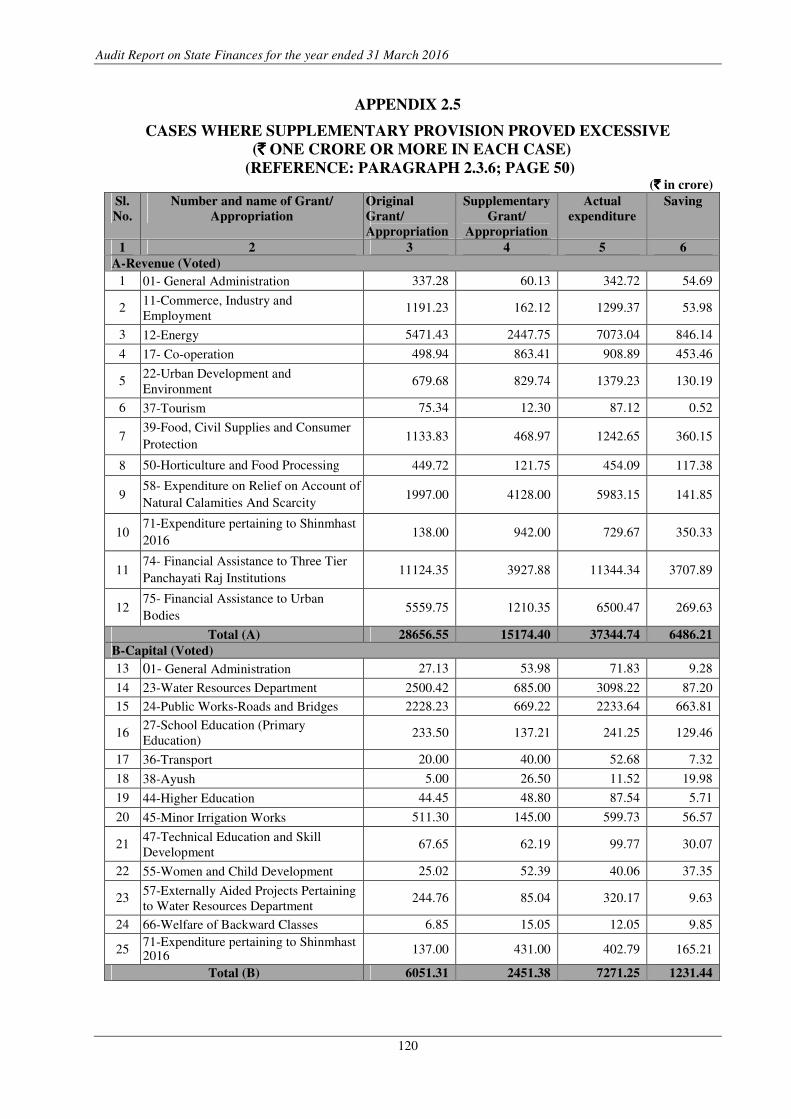
Audit Report on State Finances for the year ended 31 March 2016
120
APPENDIX 2.5
CASES WHERE SUPPLEMENTARY PROVISION PROVED EXCESSIVE
(`̀̀̀ ONE CRORE OR MORE IN EACH CASE)
(REFERENCE: PARAGRAPH 2.3.6; PAGE 50) (`̀̀̀ in crore)
Sl.
No.
Number and name of Grant/
Appropriation
Original
Grant/
Appropriation
Supplementary
Grant/
Appropriation
Actual
expenditure
Saving
1 2 3 4 5 6
A-Revenue (Voted) 1 01- General Administration 337.28 60.13 342.72 54.69
2 11-Commerce, Industry and
Employment 1191.23 162.12 1299.37 53.98
3 12-Energy 5471.43 2447.75 7073.04 846.14
4 17- Co-operation 498.94 863.41 908.89 453.46
5 22-Urban Development and
Environment 679.68 829.74 1379.23 130.19
6 37-Tourism 75.34 12.30 87.12 0.52
7 39-Food, Civil Supplies and Consumer
Protection 1133.83 468.97 1242.65 360.15
8 50-Horticulture and Food Processing 449.72 121.75 454.09 117.38
9 58- Expenditure on Relief on Account of
Natural Calamities And Scarcity 1997.00 4128.00 5983.15 141.85
10 71-Expenditure pertaining to Shinmhast
2016 138.00 942.00 729.67 350.33
11 74- Financial Assistance to Three Tier
Panchayati Raj Institutions 11124.35 3927.88 11344.34 3707.89
12 75- Financial Assistance to Urban
Bodies 5559.75 1210.35 6500.47 269.63
Total (A) 28656.55 15174.40 37344.74 6486.21
B-Capital (Voted)
13 01- General Administration 27.13 53.98 71.83 9.28
14 23-Water Resources Department 2500.42 685.00 3098.22 87.20
15 24-Public Works-Roads and Bridges 2228.23 669.22 2233.64 663.81
16 27-School Education (Primary
Education) 233.50 137.21 241.25 129.46
17 36-Transport 20.00 40.00 52.68 7.32
18 38-Ayush 5.00 26.50 11.52 19.98
19 44-Higher Education 44.45 48.80 87.54 5.71
20 45-Minor Irrigation Works 511.30 145.00 599.73 56.57
21 47-Technical Education and Skill
Development 67.65 62.19 99.77 30.07
22 55-Women and Child Development 25.02 52.39 40.06 37.35
23 57-Externally Aided Projects Pertaining
to Water Resources Department 244.76 85.04 320.17 9.63
24 66-Welfare of Backward Classes 6.85 15.05 12.05 9.85
25 71-Expenditure pertaining to Shinmhast 2016
137.00 431.00 402.79 165.21
Total (B) 6051.31 2451.38 7271.25 1231.44
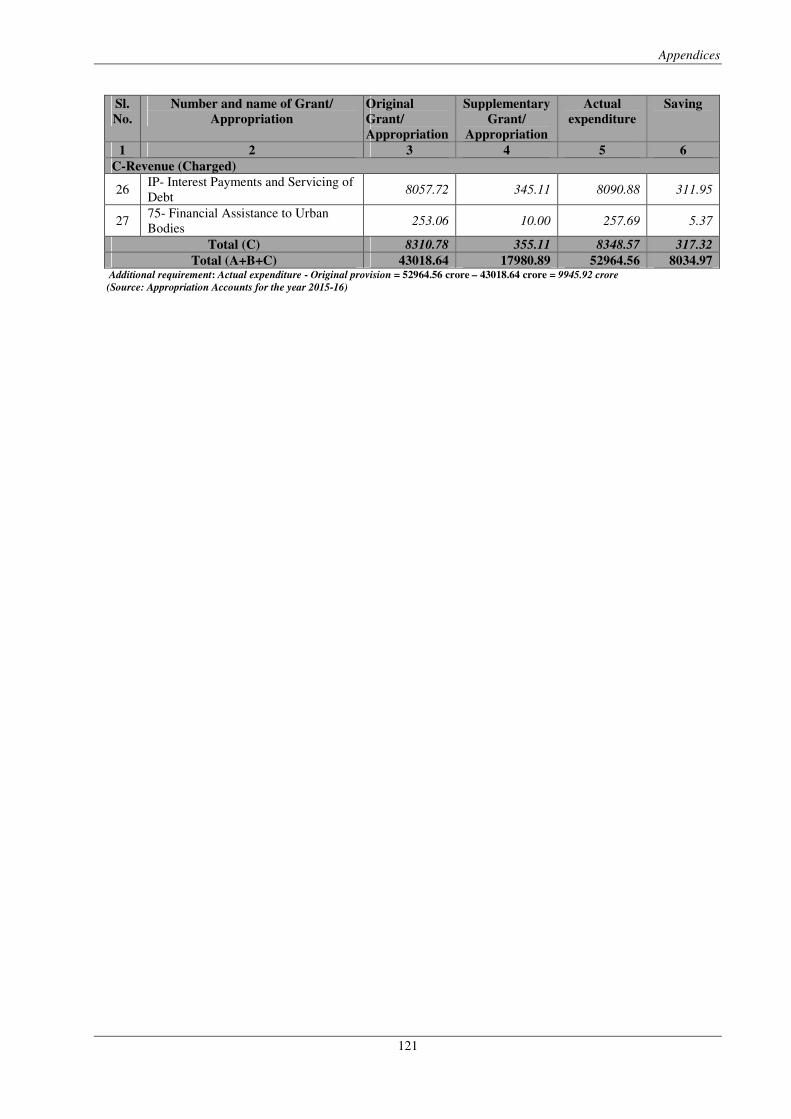
Appendices
121
Sl.
No.
Number and name of Grant/
Appropriation
Original
Grant/
Appropriation
Supplementary
Grant/
Appropriation
Actual
expenditure
Saving
1 2 3 4 5 6
C-Revenue (Charged)
26 IP- Interest Payments and Servicing of
Debt 8057.72 345.11 8090.88 311.95
27 75- Financial Assistance to Urban
Bodies 253.06 10.00 257.69 5.37
Total (C) 8310.78 355.11 8348.57 317.32
Total (A+B+C) 43018.64 17980.89 52964.56 8034.97 Additional requirement: Actual expenditure - Original provision = 52964.56 crore – 43018.64 crore = 9945.92 crore
(Source: Appropriation Accounts for the year 2015-16)
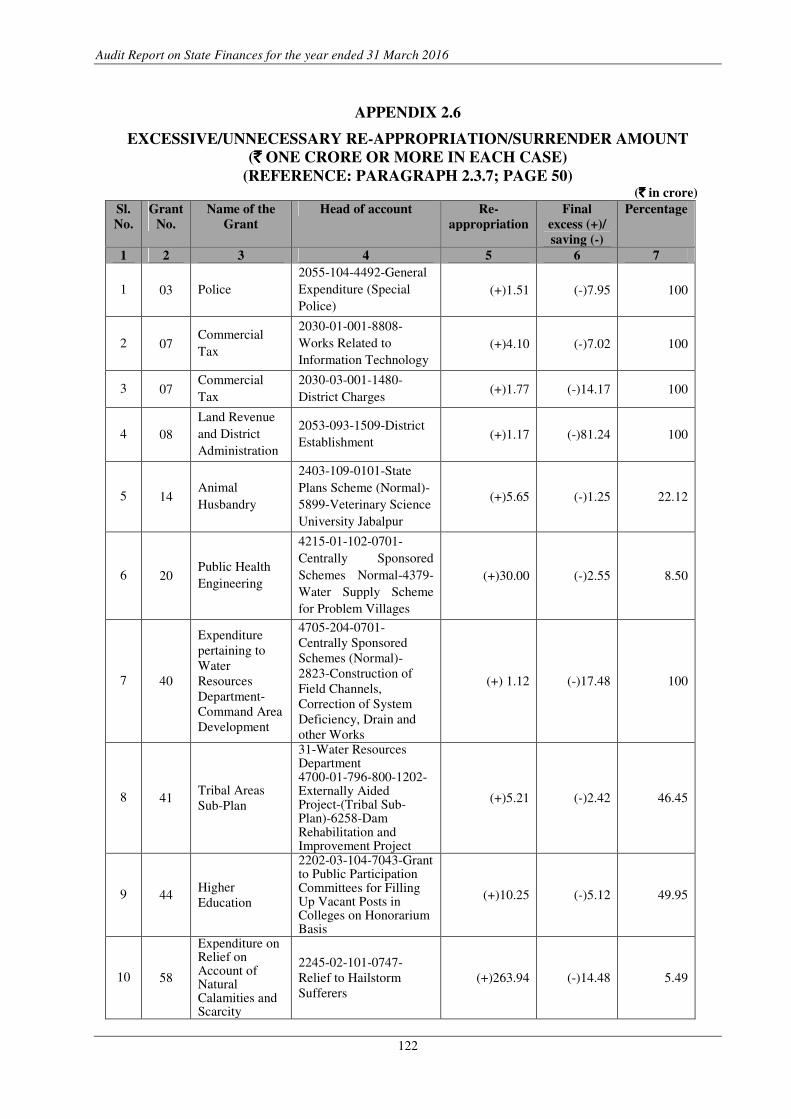
Audit Report on State Finances for the year ended 31 March 2016
122
APPENDIX 2.6
EXCESSIVE/UNNECESSARY RE-APPROPRIATION/SURRENDER AMOUNT
(`̀̀̀ ONE CRORE OR MORE IN EACH CASE)
(REFERENCE: PARAGRAPH 2.3.7; PAGE 50) (`̀̀̀ in crore)
Sl.
No.
Grant
No.
Name of the
Grant
Head of account Re-
appropriation
Final
excess (+)/
saving (-)
Percentage
1 2 3 4 5 6 7
1 03 Police
2055-104-4492-General
Expenditure (Special
Police)
(+)1.51 (-)7.95 100
2 07 Commercial
Tax
2030-01-001-8808-
Works Related to
Information Technology
(+)4.10 (-)7.02 100
3 07 Commercial
Tax
2030-03-001-1480-
District Charges (+)1.77 (-)14.17 100
4 08
Land Revenue
and District
Administration
2053-093-1509-District
Establishment (+)1.17 (-)81.24 100
5 14 Animal
Husbandry
2403-109-0101-State
Plans Scheme (Normal)-
5899-Veterinary Science
University Jabalpur
(+)5.65 (-)1.25 22.12
6 20 Public Health
Engineering
4215-01-102-0701-
Centrally Sponsored
Schemes Normal-4379-
Water Supply Scheme
for Problem Villages
(+)30.00 (-)2.55 8.50
7 40
Expenditure
pertaining to
Water
Resources
Department-
Command Area
Development
4705-204-0701-
Centrally Sponsored
Schemes (Normal)-
2823-Construction of
Field Channels,
Correction of System
Deficiency, Drain and
other Works
(+) 1.12 (-)17.48 100
8 41 Tribal Areas
Sub-Plan
31-Water Resources Department 4700-01-796-800-1202-Externally Aided Project-(Tribal Sub-Plan)-6258-Dam Rehabilitation and Improvement Project
(+)5.21 (-)2.42 46.45
9 44 Higher
Education
2202-03-104-7043-Grant to Public Participation Committees for Filling Up Vacant Posts in Colleges on Honorarium Basis
(+)10.25 (-)5.12 49.95
10 58
Expenditure on Relief on Account of Natural Calamities and Scarcity
2245-02-101-0747-
Relief to Hailstorm
Sufferers
(+)263.94 (-)14.48 5.49
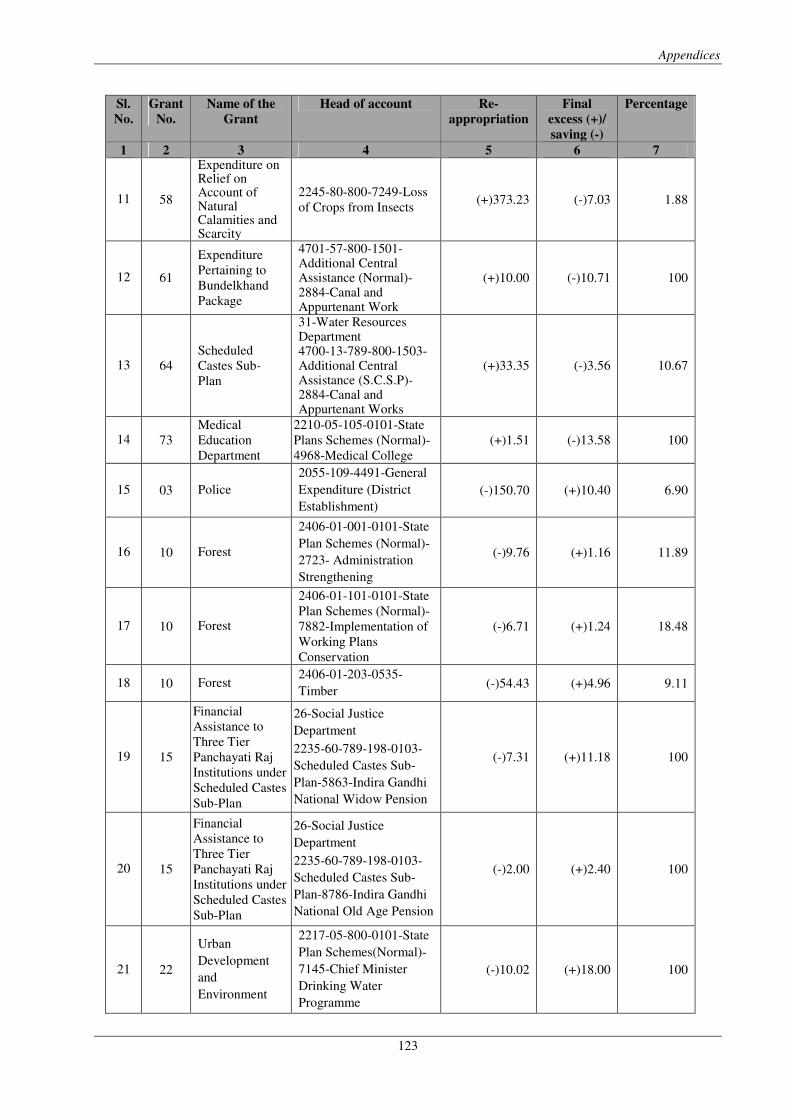
Appendices
123
Sl.
No.
Grant
No.
Name of the
Grant
Head of account Re-
appropriation
Final
excess (+)/
saving (-)
Percentage
1 2 3 4 5 6 7
11 58
Expenditure on Relief on Account of Natural Calamities and Scarcity
2245-80-800-7249-Loss
of Crops from Insects (+)373.23 (-)7.03 1.88
12 61
Expenditure
Pertaining to
Bundelkhand
Package
4701-57-800-1501-Additional Central Assistance (Normal)-2884-Canal and Appurtenant Work
(+)10.00 (-)10.71 100
13 64
Scheduled
Castes Sub-
Plan
31-Water Resources Department 4700-13-789-800-1503-Additional Central Assistance (S.C.S.P)- 2884-Canal and Appurtenant Works
(+)33.35 (-)3.56 10.67
14 73
Medical
Education
Department
2210-05-105-0101-State
Plans Schemes (Normal)-
4968-Medical College
(+)1.51 (-)13.58 100
15 03 Police
2055-109-4491-General
Expenditure (District
Establishment)
(-)150.70 (+)10.40 6.90
16 10 Forest
2406-01-001-0101-State
Plan Schemes (Normal)-
2723- Administration
Strengthening
(-)9.76 (+)1.16 11.89
17 10 Forest
2406-01-101-0101-State
Plan Schemes (Normal)-
7882-Implementation of
Working Plans
Conservation
(-)6.71 (+)1.24 18.48
18 10 Forest 2406-01-203-0535-
Timber (-)54.43 (+)4.96 9.11
19 15
Financial
Assistance to
Three Tier
Panchayati Raj
Institutions under
Scheduled Castes
Sub-Plan
26-Social Justice
Department
2235-60-789-198-0103-
Scheduled Castes Sub-
Plan-5863-Indira Gandhi
National Widow Pension
(-)7.31 (+)11.18 100
20 15
Financial
Assistance to
Three Tier
Panchayati Raj
Institutions under
Scheduled Castes
Sub-Plan
26-Social Justice
Department
2235-60-789-198-0103-
Scheduled Castes Sub-
Plan-8786-Indira Gandhi
National Old Age Pension
(-)2.00 (+)2.40 100
21 22
Urban
Development
and
Environment
2217-05-800-0101-State
Plan Schemes(Normal)-
7145-Chief Minister
Drinking Water
Programme
(-)10.02 (+)18.00 100
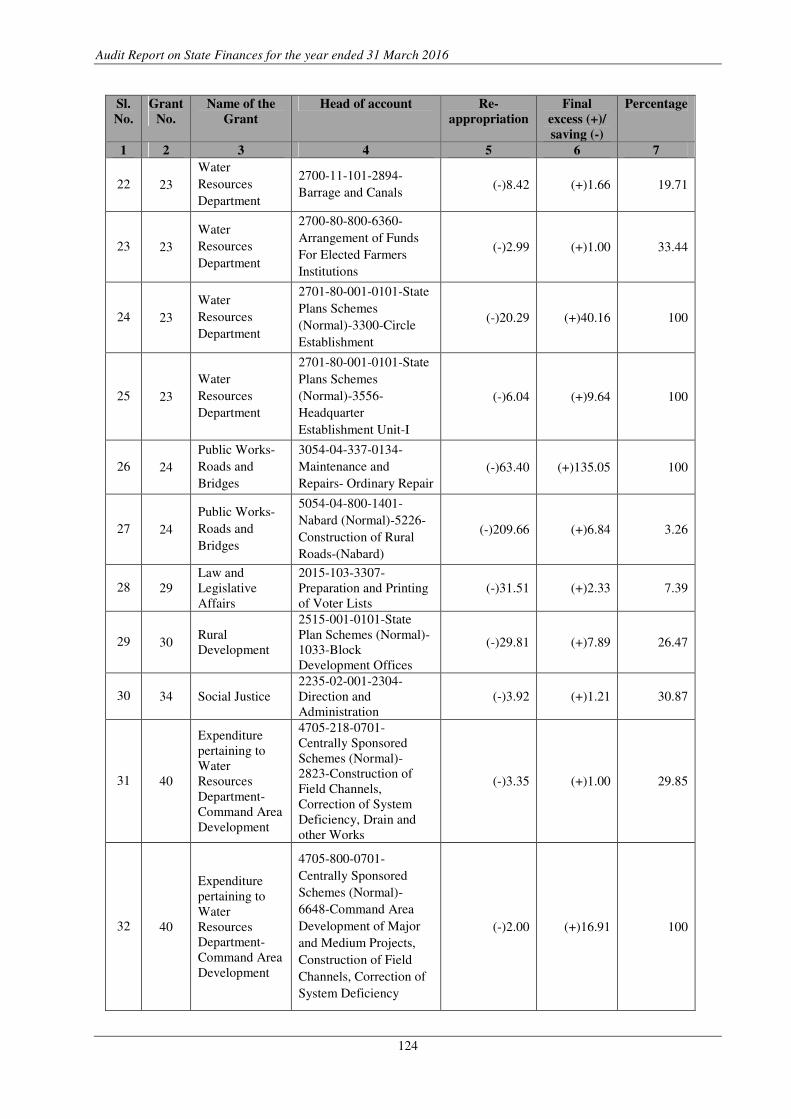
Audit Report on State Finances for the year ended 31 March 2016
124
Sl.
No.
Grant
No.
Name of the
Grant
Head of account Re-
appropriation
Final
excess (+)/
saving (-)
Percentage
1 2 3 4 5 6 7
22 23
Water
Resources
Department
2700-11-101-2894-
Barrage and Canals (-)8.42 (+)1.66 19.71
23 23
Water
Resources
Department
2700-80-800-6360-
Arrangement of Funds
For Elected Farmers
Institutions
(-)2.99 (+)1.00 33.44
24 23
Water
Resources
Department
2701-80-001-0101-State
Plans Schemes
(Normal)-3300-Circle
Establishment
(-)20.29 (+)40.16 100
25 23
Water
Resources
Department
2701-80-001-0101-State
Plans Schemes
(Normal)-3556-
Headquarter
Establishment Unit-I
(-)6.04 (+)9.64 100
26 24
Public Works-
Roads and
Bridges
3054-04-337-0134-
Maintenance and
Repairs- Ordinary Repair
(-)63.40 (+)135.05 100
27 24
Public Works-
Roads and
Bridges
5054-04-800-1401-
Nabard (Normal)-5226-
Construction of Rural
Roads-(Nabard)
(-)209.66 (+)6.84 3.26
28 29
Law and
Legislative
Affairs
2015-103-3307-
Preparation and Printing
of Voter Lists
(-)31.51 (+)2.33 7.39
29 30 Rural
Development
2515-001-0101-State
Plan Schemes (Normal)-
1033-Block
Development Offices
(-)29.81 (+)7.89 26.47
30 34 Social Justice
2235-02-001-2304-
Direction and
Administration
(-)3.92 (+)1.21 30.87
31 40
Expenditure
pertaining to
Water
Resources
Department-
Command Area
Development
4705-218-0701-
Centrally Sponsored
Schemes (Normal)-
2823-Construction of
Field Channels,
Correction of System
Deficiency, Drain and
other Works
(-)3.35 (+)1.00 29.85
32 40
Expenditure
pertaining to
Water
Resources
Department-
Command Area
Development
4705-800-0701-
Centrally Sponsored
Schemes (Normal)-
6648-Command Area
Development of Major
and Medium Projects,
Construction of Field
Channels, Correction of
System Deficiency
(-)2.00 (+)16.91 100
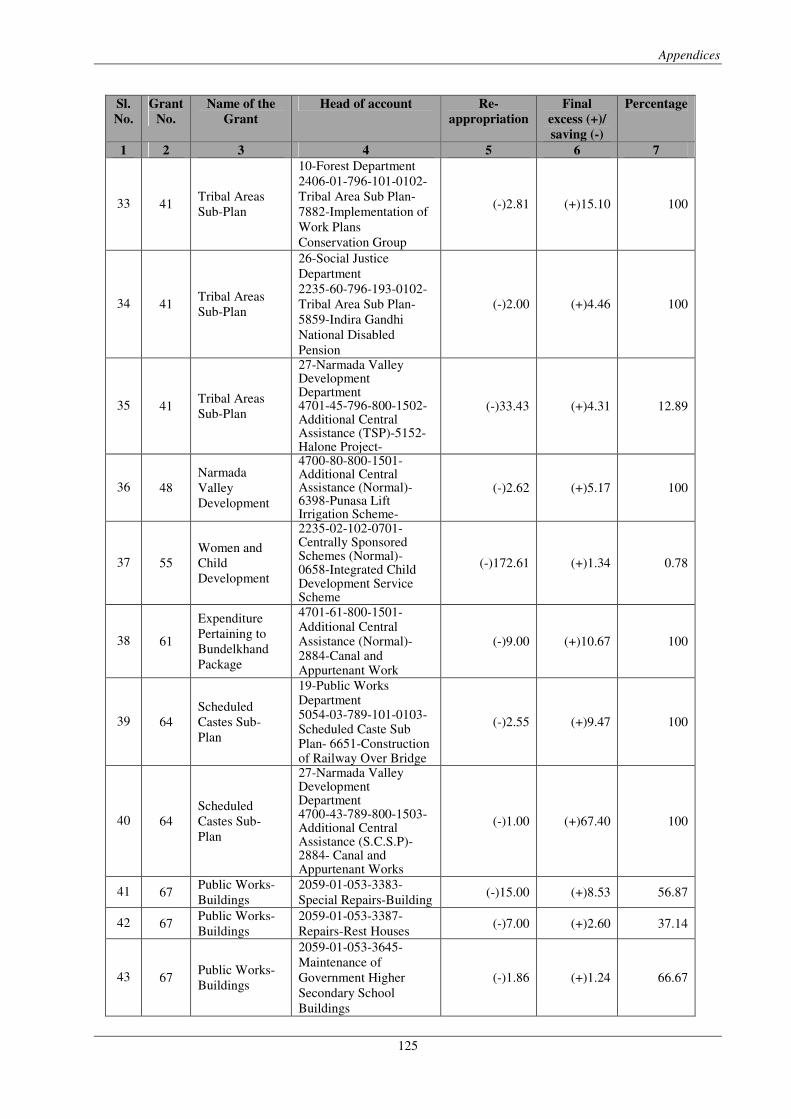
Appendices
125
Sl.
No.
Grant
No.
Name of the
Grant
Head of account Re-
appropriation
Final
excess (+)/
saving (-)
Percentage
1 2 3 4 5 6 7
33 41 Tribal Areas
Sub-Plan
10-Forest Department
2406-01-796-101-0102-
Tribal Area Sub Plan-
7882-Implementation of
Work Plans
Conservation Group
(-)2.81 (+)15.10 100
34 41 Tribal Areas
Sub-Plan
26-Social Justice
Department
2235-60-796-193-0102-
Tribal Area Sub Plan-
5859-Indira Gandhi
National Disabled
Pension
(-)2.00 (+)4.46 100
35 41 Tribal Areas
Sub-Plan
27-Narmada Valley Development Department 4701-45-796-800-1502-Additional Central Assistance (TSP)-5152-Halone Project-
(-)33.43 (+)4.31 12.89
36 48
Narmada
Valley
Development
4700-80-800-1501-Additional Central Assistance (Normal)- 6398-Punasa Lift Irrigation Scheme-
(-)2.62 (+)5.17 100
37 55
Women and
Child
Development
2235-02-102-0701-Centrally Sponsored Schemes (Normal)- 0658-Integrated Child Development Service Scheme
(-)172.61 (+)1.34 0.78
38 61
Expenditure
Pertaining to
Bundelkhand
Package
4701-61-800-1501-Additional Central Assistance (Normal)-2884-Canal and Appurtenant Work
(-)9.00 (+)10.67 100
39 64
Scheduled
Castes Sub-
Plan
19-Public Works Department 5054-03-789-101-0103- Scheduled Caste Sub Plan- 6651-Construction of Railway Over Bridge
(-)2.55 (+)9.47 100
40 64
Scheduled
Castes Sub-
Plan
27-Narmada Valley Development Department 4700-43-789-800-1503-Additional Central Assistance (S.C.S.P)- 2884- Canal and Appurtenant Works
(-)1.00 (+)67.40 100
41 67 Public Works-
Buildings
2059-01-053-3383-
Special Repairs-Building (-)15.00 (+)8.53 56.87
42 67 Public Works-
Buildings
2059-01-053-3387-
Repairs-Rest Houses (-)7.00 (+)2.60 37.14
43 67 Public Works-
Buildings
2059-01-053-3645-
Maintenance of
Government Higher
Secondary School
Buildings
(-)1.86 (+)1.24 66.67

Audit Report on State Finances for the year ended 31 March 2016
126
Sl.
No.
Grant
No.
Name of the
Grant
Head of account Re-
appropriation
Final
excess (+)/
saving (-)
Percentage
1 2 3 4 5 6 7
44 67 Public Works-
Buildings
4059-01-051-0101- State
Plans Schemes
(Normal)-7094-
Construction Works
under Jail Improvement
Scheme
(-)3.00 (+)1.92 64.00
45 75
Financial
Assistance to
Urban Bodies
2235-02-193-0101-State
Plan Schemes (Normal)-
5859-Indira Gandhi
National Disabled
Pension
(-)2.20 (+)2.51 100
46 75
Financial
Assistance to
Urban Bodies
2235-02-193-0101-State
Plan Schemes (Normal)-
9142-Social Security and
Welfare
(-)9.02 (+)11.95 100
(Source: Appropriation Accounts for the year 2015-16)
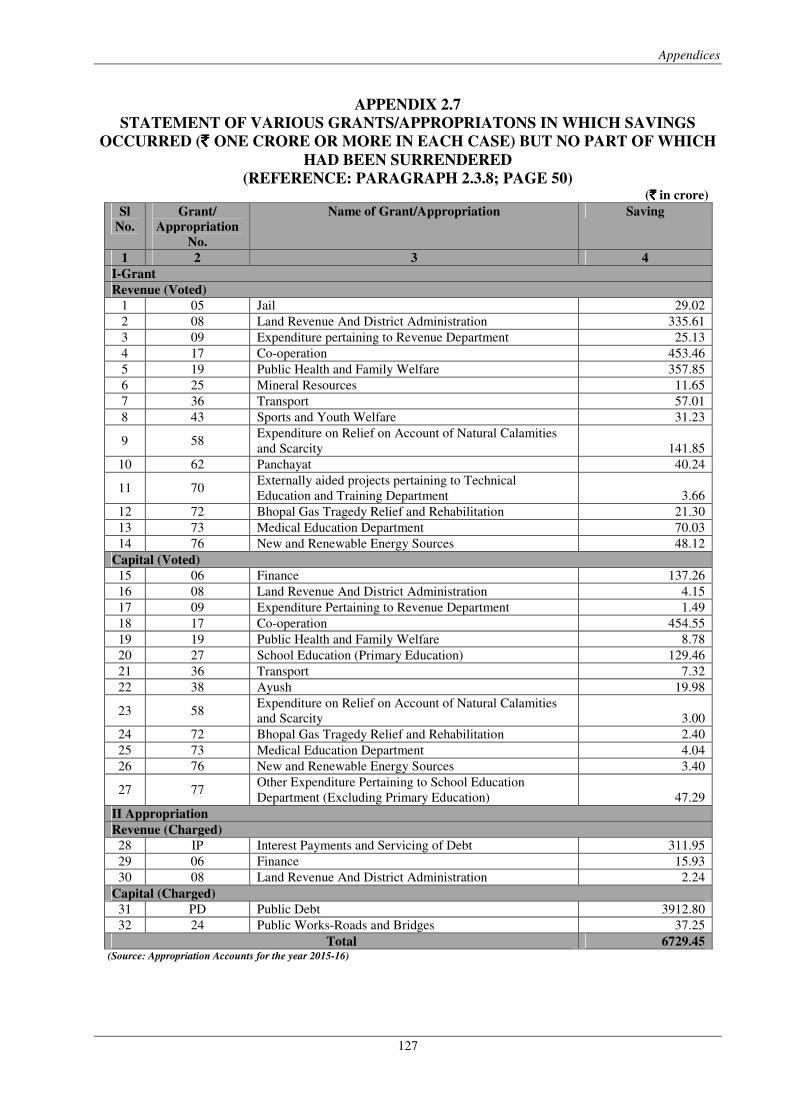
Appendices
127
APPENDIX 2.7
STATEMENT OF VARIOUS GRANTS/APPROPRIATONS IN WHICH SAVINGS
OCCURRED (` ` ` ` ONE CRORE OR MORE IN EACH CASE) BUT NO PART OF WHICH
HAD BEEN SURRENDERED
(REFERENCE: PARAGRAPH 2.3.8; PAGE 50) (`̀̀̀ in crore)
Sl
No.
Grant/
Appropriation
No.
Name of Grant/Appropriation Saving
1 2 3 4
I-Grant
Revenue (Voted)
1 05 Jail 29.02
2 08 Land Revenue And District Administration 335.61
3 09 Expenditure pertaining to Revenue Department 25.13
4 17 Co-operation 453.46
5 19 Public Health and Family Welfare 357.85
6 25 Mineral Resources 11.65
7 36 Transport 57.01
8 43 Sports and Youth Welfare 31.23
9 58 Expenditure on Relief on Account of Natural Calamities
and Scarcity 141.85
10 62 Panchayat 40.24
11 70 Externally aided projects pertaining to Technical
Education and Training Department 3.66
12 72 Bhopal Gas Tragedy Relief and Rehabilitation 21.30
13 73 Medical Education Department 70.03
14 76 New and Renewable Energy Sources 48.12
Capital (Voted)
15 06 Finance 137.26
16 08 Land Revenue And District Administration 4.15
17 09 Expenditure Pertaining to Revenue Department 1.49
18 17 Co-operation 454.55
19 19 Public Health and Family Welfare 8.78
20 27 School Education (Primary Education) 129.46
21 36 Transport 7.32
22 38 Ayush 19.98
23 58 Expenditure on Relief on Account of Natural Calamities
and Scarcity 3.00
24 72 Bhopal Gas Tragedy Relief and Rehabilitation 2.40
25 73 Medical Education Department 4.04
26 76 New and Renewable Energy Sources 3.40
27 77 Other Expenditure Pertaining to School Education
Department (Excluding Primary Education) 47.29
II Appropriation
Revenue (Charged)
28 IP Interest Payments and Servicing of Debt 311.95
29 06 Finance 15.93
30 08 Land Revenue And District Administration 2.24
Capital (Charged)
31 PD Public Debt 3912.80
32 24 Public Works-Roads and Bridges 37.25
Total 6729.45 (Source: Appropriation Accounts for the year 2015-16)
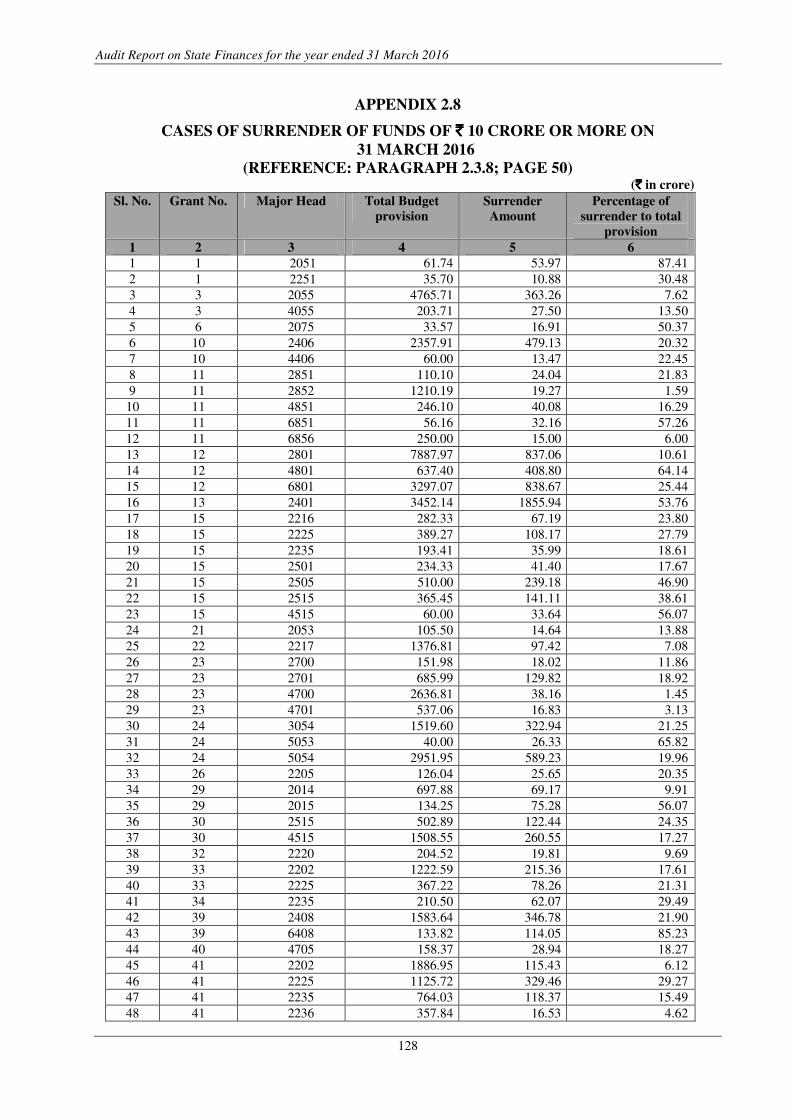
Audit Report on State Finances for the year ended 31 March 2016
128
APPENDIX 2.8
CASES OF SURRENDER OF FUNDS OF `̀̀̀ 10 CRORE OR MORE ON
31 MARCH 2016
(REFERENCE: PARAGRAPH 2.3.8; PAGE 50) (`̀̀̀ in crore)
Sl. No. Grant No. Major Head Total Budget
provision
Surrender
Amount
Percentage of
surrender to total
provision
1 2 3 4 5 6
1 1 2051 61.74 53.97 87.41
2 1 2251 35.70 10.88 30.48
3 3 2055 4765.71 363.26 7.62
4 3 4055 203.71 27.50 13.50
5 6 2075 33.57 16.91 50.37
6 10 2406 2357.91 479.13 20.32
7 10 4406 60.00 13.47 22.45
8 11 2851 110.10 24.04 21.83
9 11 2852 1210.19 19.27 1.59
10 11 4851 246.10 40.08 16.29
11 11 6851 56.16 32.16 57.26
12 11 6856 250.00 15.00 6.00
13 12 2801 7887.97 837.06 10.61
14 12 4801 637.40 408.80 64.14
15 12 6801 3297.07 838.67 25.44
16 13 2401 3452.14 1855.94 53.76
17 15 2216 282.33 67.19 23.80
18 15 2225 389.27 108.17 27.79
19 15 2235 193.41 35.99 18.61
20 15 2501 234.33 41.40 17.67
21 15 2505 510.00 239.18 46.90
22 15 2515 365.45 141.11 38.61
23 15 4515 60.00 33.64 56.07
24 21 2053 105.50 14.64 13.88
25 22 2217 1376.81 97.42 7.08
26 23 2700 151.98 18.02 11.86
27 23 2701 685.99 129.82 18.92
28 23 4700 2636.81 38.16 1.45
29 23 4701 537.06 16.83 3.13
30 24 3054 1519.60 322.94 21.25
31 24 5053 40.00 26.33 65.82
32 24 5054 2951.95 589.23 19.96
33 26 2205 126.04 25.65 20.35
34 29 2014 697.88 69.17 9.91
35 29 2015 134.25 75.28 56.07
36 30 2515 502.89 122.44 24.35
37 30 4515 1508.55 260.55 17.27
38 32 2220 204.52 19.81 9.69
39 33 2202 1222.59 215.36 17.61
40 33 2225 367.22 78.26 21.31
41 34 2235 210.50 62.07 29.49
42 39 2408 1583.64 346.78 21.90
43 39 6408 133.82 114.05 85.23
44 40 4705 158.37 28.94 18.27
45 41 2202 1886.95 115.43 6.12
46 41 2225 1125.72 329.46 29.27
47 41 2235 764.03 118.37 15.49
48 41 2236 357.84 16.53 4.62
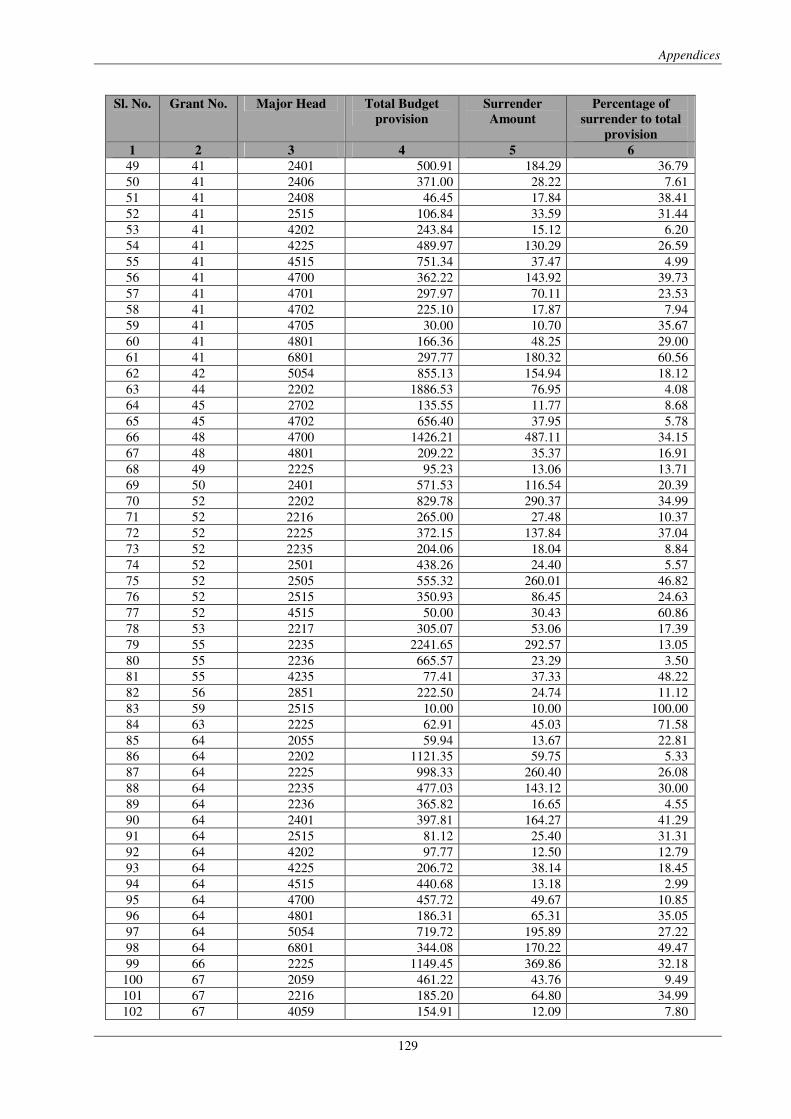
Appendices
129
Sl. No. Grant No. Major Head Total Budget
provision
Surrender
Amount
Percentage of
surrender to total
provision
1 2 3 4 5 6
49 41 2401 500.91 184.29 36.79
50 41 2406 371.00 28.22 7.61
51 41 2408 46.45 17.84 38.41
52 41 2515 106.84 33.59 31.44
53 41 4202 243.84 15.12 6.20
54 41 4225 489.97 130.29 26.59
55 41 4515 751.34 37.47 4.99
56 41 4700 362.22 143.92 39.73
57 41 4701 297.97 70.11 23.53
58 41 4702 225.10 17.87 7.94
59 41 4705 30.00 10.70 35.67
60 41 4801 166.36 48.25 29.00
61 41 6801 297.77 180.32 60.56
62 42 5054 855.13 154.94 18.12
63 44 2202 1886.53 76.95 4.08
64 45 2702 135.55 11.77 8.68
65 45 4702 656.40 37.95 5.78
66 48 4700 1426.21 487.11 34.15
67 48 4801 209.22 35.37 16.91
68 49 2225 95.23 13.06 13.71
69 50 2401 571.53 116.54 20.39
70 52 2202 829.78 290.37 34.99
71 52 2216 265.00 27.48 10.37
72 52 2225 372.15 137.84 37.04
73 52 2235 204.06 18.04 8.84
74 52 2501 438.26 24.40 5.57
75 52 2505 555.32 260.01 46.82
76 52 2515 350.93 86.45 24.63
77 52 4515 50.00 30.43 60.86
78 53 2217 305.07 53.06 17.39
79 55 2235 2241.65 292.57 13.05
80 55 2236 665.57 23.29 3.50
81 55 4235 77.41 37.33 48.22
82 56 2851 222.50 24.74 11.12
83 59 2515 10.00 10.00 100.00
84 63 2225 62.91 45.03 71.58
85 64 2055 59.94 13.67 22.81
86 64 2202 1121.35 59.75 5.33
87 64 2225 998.33 260.40 26.08
88 64 2235 477.03 143.12 30.00
89 64 2236 365.82 16.65 4.55
90 64 2401 397.81 164.27 41.29
91 64 2515 81.12 25.40 31.31
92 64 4202 97.77 12.50 12.79
93 64 4225 206.72 38.14 18.45
94 64 4515 440.68 13.18 2.99
95 64 4700 457.72 49.67 10.85
96 64 4801 186.31 65.31 35.05
97 64 5054 719.72 195.89 27.22
98 64 6801 344.08 170.22 49.47
99 66 2225 1149.45 369.86 32.18
100 67 2059 461.22 43.76 9.49
101 67 2216 185.20 64.80 34.99
102 67 4059 154.91 12.09 7.80
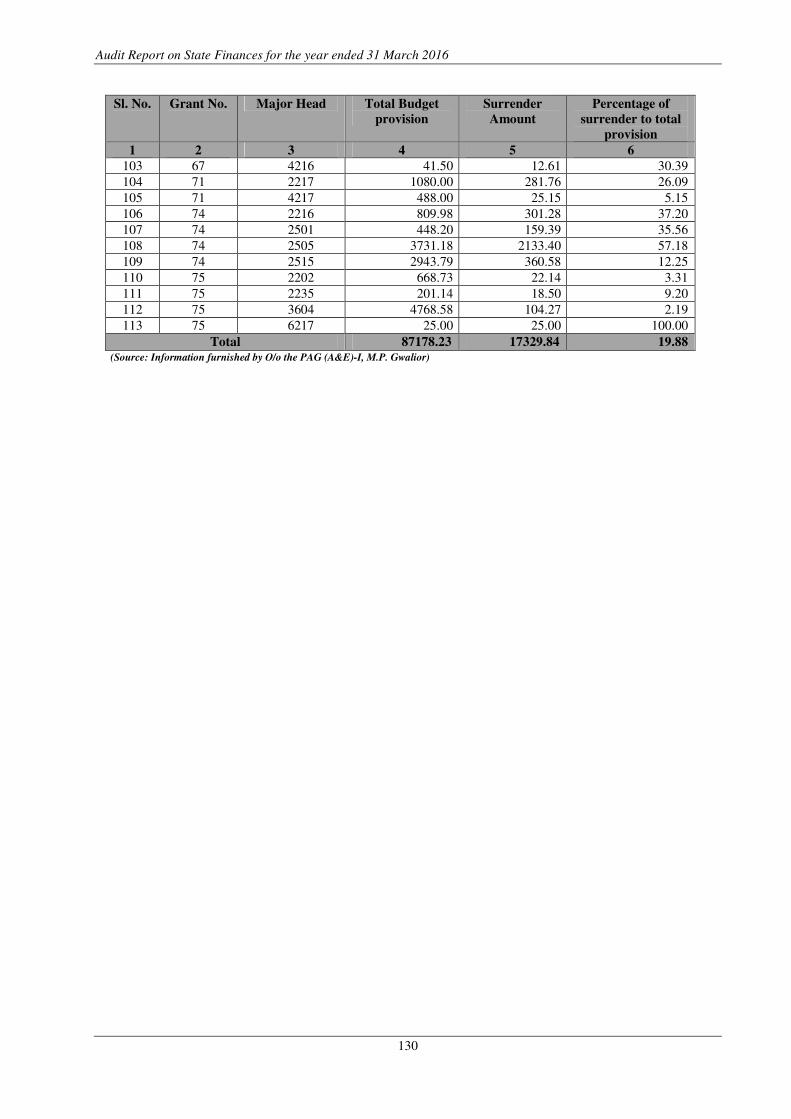
Audit Report on State Finances for the year ended 31 March 2016
130
Sl. No. Grant No. Major Head Total Budget
provision
Surrender
Amount
Percentage of
surrender to total
provision
1 2 3 4 5 6
103 67 4216 41.50 12.61 30.39
104 71 2217 1080.00 281.76 26.09
105 71 4217 488.00 25.15 5.15
106 74 2216 809.98 301.28 37.20
107 74 2501 448.20 159.39 35.56
108 74 2505 3731.18 2133.40 57.18
109 74 2515 2943.79 360.58 12.25
110 75 2202 668.73 22.14 3.31
111 75 2235 201.14 18.50 9.20
112 75 3604 4768.58 104.27 2.19
113 75 6217 25.00 25.00 100.00
Total 87178.23 17329.84 19.88 (Source: Information furnished by O/o the PAG (A&E)-I, M.P. Gwalior)
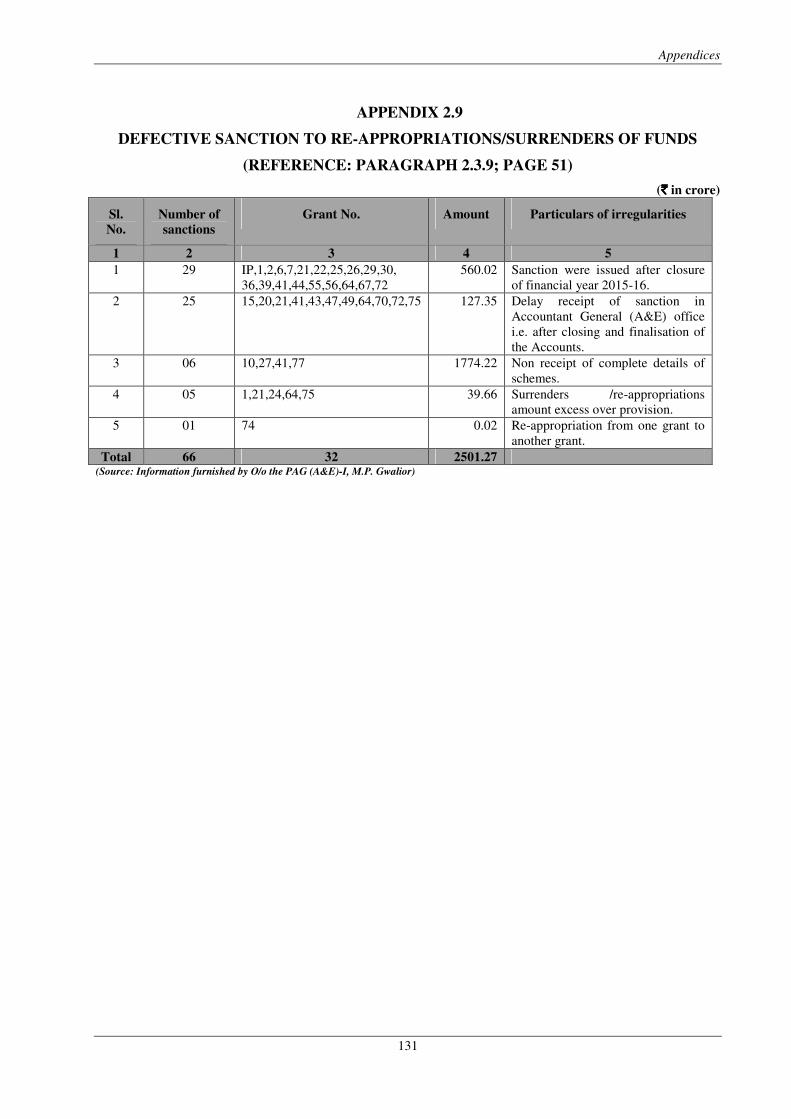
Appendices
131
APPENDIX 2.9
DEFECTIVE SANCTION TO RE-APPROPRIATIONS/SURRENDERS OF FUNDS
(REFERENCE: PARAGRAPH 2.3.9; PAGE 51)
(`̀̀̀ in crore)
Sl.
No.
Number of
sanctions
Grant No. Amount Particulars of irregularities
1 2 3 4 5
1 29 IP,1,2,6,7,21,22,25,26,29,30,
36,39,41,44,55,56,64,67,72
560.02 Sanction were issued after closure
of financial year 2015-16.
2 25 15,20,21,41,43,47,49,64,70,72,75 127.35 Delay receipt of sanction in
Accountant General (A&E) office
i.e. after closing and finalisation of
the Accounts.
3 06 10,27,41,77 1774.22 Non receipt of complete details of
schemes.
4 05 1,21,24,64,75 39.66 Surrenders /re-appropriations
amount excess over provision.
5 01 74 0.02 Re-appropriation from one grant to
another grant.
Total 66 32 2501.27 (Source: Information furnished by O/o the PAG (A&E)-I, M.P. Gwalior)
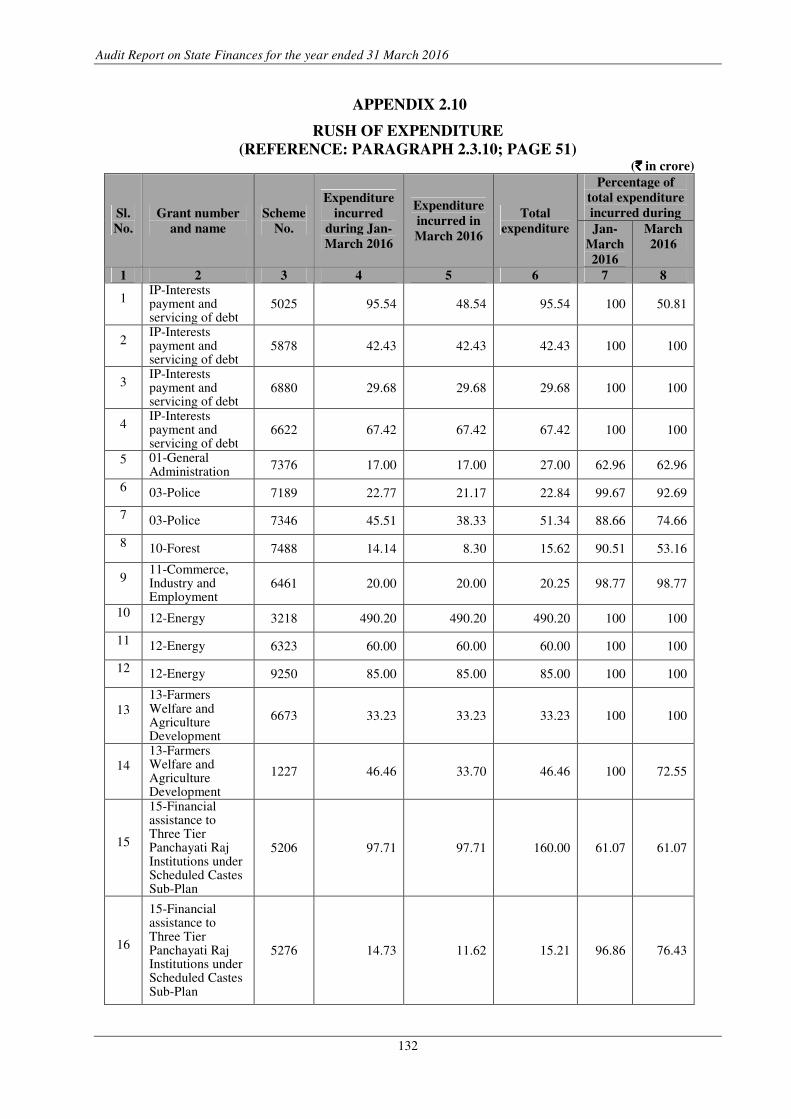
Audit Report on State Finances for the year ended 31 March 2016
132
APPENDIX 2.10
RUSH OF EXPENDITURE
(REFERENCE: PARAGRAPH 2.3.10; PAGE 51) (`̀̀̀ in crore)
Sl.
No.
Grant number
and name
Scheme
No.
Expenditure
incurred
during Jan-
March 2016
Expenditure
incurred in
March 2016
Total
expenditure
Percentage of
total expenditure
incurred during
Jan-
March
2016
March
2016
1 2 3 4 5 6 7 8
1 IP-Interests payment and servicing of debt
5025 95.54 48.54 95.54 100 50.81
2 IP-Interests payment and servicing of debt
5878 42.43 42.43 42.43 100 100
3 IP-Interests payment and servicing of debt
6880 29.68 29.68 29.68 100 100
4 IP-Interests payment and servicing of debt
6622 67.42 67.42 67.42 100 100
5 01-General Administration
7376 17.00 17.00 27.00 62.96 62.96
6 03-Police 7189 22.77 21.17 22.84 99.67 92.69
7 03-Police 7346 45.51 38.33 51.34 88.66 74.66
8 10-Forest 7488 14.14 8.30 15.62 90.51 53.16
9 11-Commerce, Industry and Employment
6461 20.00 20.00 20.25 98.77 98.77
10 12-Energy 3218 490.20 490.20 490.20 100 100
11 12-Energy 6323 60.00 60.00 60.00 100 100
12 12-Energy 9250 85.00 85.00 85.00 100 100
13
13-Farmers Welfare and Agriculture Development
6673 33.23 33.23 33.23 100 100
14
13-Farmers Welfare and Agriculture Development
1227 46.46 33.70 46.46 100 72.55
15
15-Financial assistance to Three Tier Panchayati Raj Institutions under Scheduled Castes Sub-Plan
5206 97.71 97.71 160.00 61.07 61.07
16
15-Financial assistance to Three Tier Panchayati Raj Institutions under Scheduled Castes Sub-Plan
5276 14.73 11.62 15.21 96.86 76.43
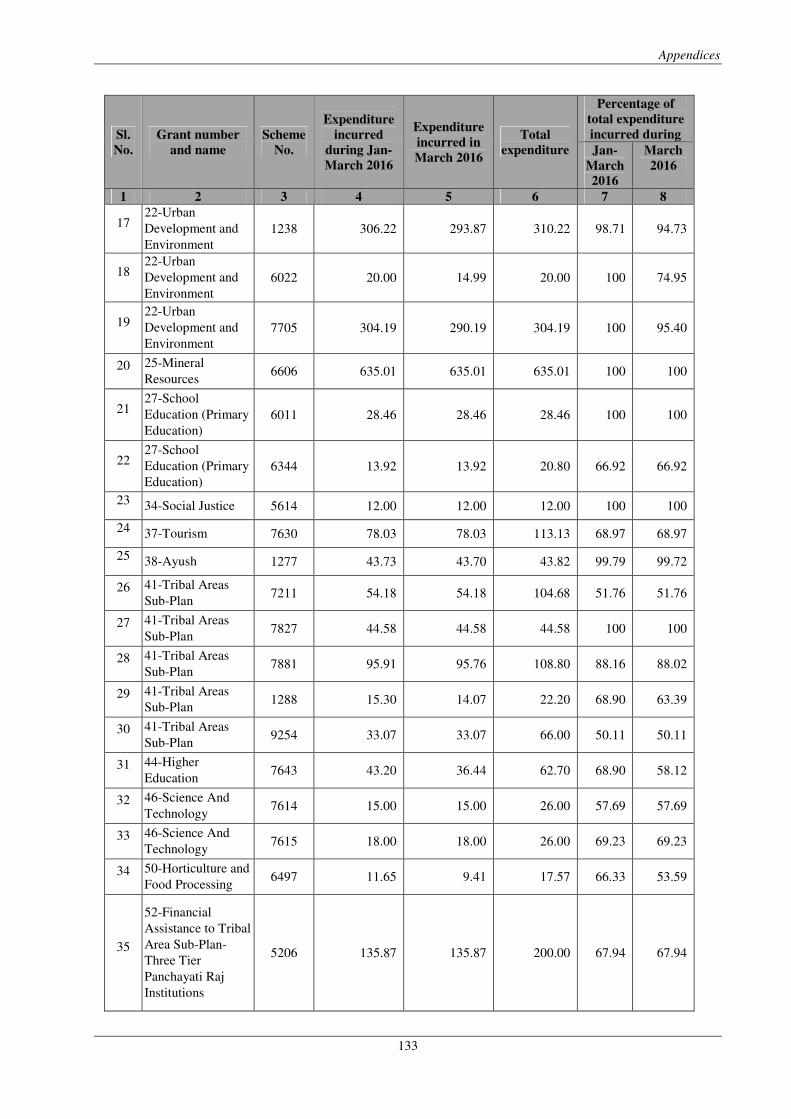
Appendices
133
Sl.
No.
Grant number
and name
Scheme
No.
Expenditure
incurred
during Jan-
March 2016
Expenditure
incurred in
March 2016
Total
expenditure
Percentage of
total expenditure
incurred during
Jan-
March
2016
March
2016
1 2 3 4 5 6 7 8
17 22-Urban
Development and
Environment
1238 306.22 293.87 310.22 98.71 94.73
18 22-Urban
Development and
Environment
6022 20.00 14.99 20.00 100 74.95
19 22-Urban
Development and
Environment
7705 304.19 290.19 304.19 100 95.40
20 25-Mineral
Resources 6606 635.01 635.01 635.01 100 100
21 27-School
Education (Primary
Education)
6011 28.46 28.46 28.46 100 100
22 27-School
Education (Primary
Education)
6344 13.92 13.92 20.80 66.92 66.92
23 34-Social Justice 5614 12.00 12.00 12.00 100 100
24 37-Tourism 7630 78.03 78.03 113.13 68.97 68.97
25 38-Ayush 1277 43.73 43.70 43.82 99.79 99.72
26 41-Tribal Areas
Sub-Plan 7211 54.18 54.18 104.68 51.76 51.76
27 41-Tribal Areas
Sub-Plan 7827 44.58 44.58 44.58 100 100
28 41-Tribal Areas
Sub-Plan 7881 95.91 95.76 108.80 88.16 88.02
29 41-Tribal Areas
Sub-Plan 1288 15.30 14.07 22.20 68.90 63.39
30 41-Tribal Areas
Sub-Plan 9254 33.07 33.07 66.00 50.11 50.11
31 44-Higher
Education 7643 43.20 36.44 62.70 68.90 58.12
32 46-Science And
Technology 7614 15.00 15.00 26.00 57.69 57.69
33 46-Science And
Technology 7615 18.00 18.00 26.00 69.23 69.23
34 50-Horticulture and
Food Processing 6497 11.65 9.41 17.57 66.33 53.59
35
52-Financial
Assistance to Tribal
Area Sub-Plan-
Three Tier
Panchayati Raj
Institutions
5206 135.87 135.87 200.00 67.94 67.94
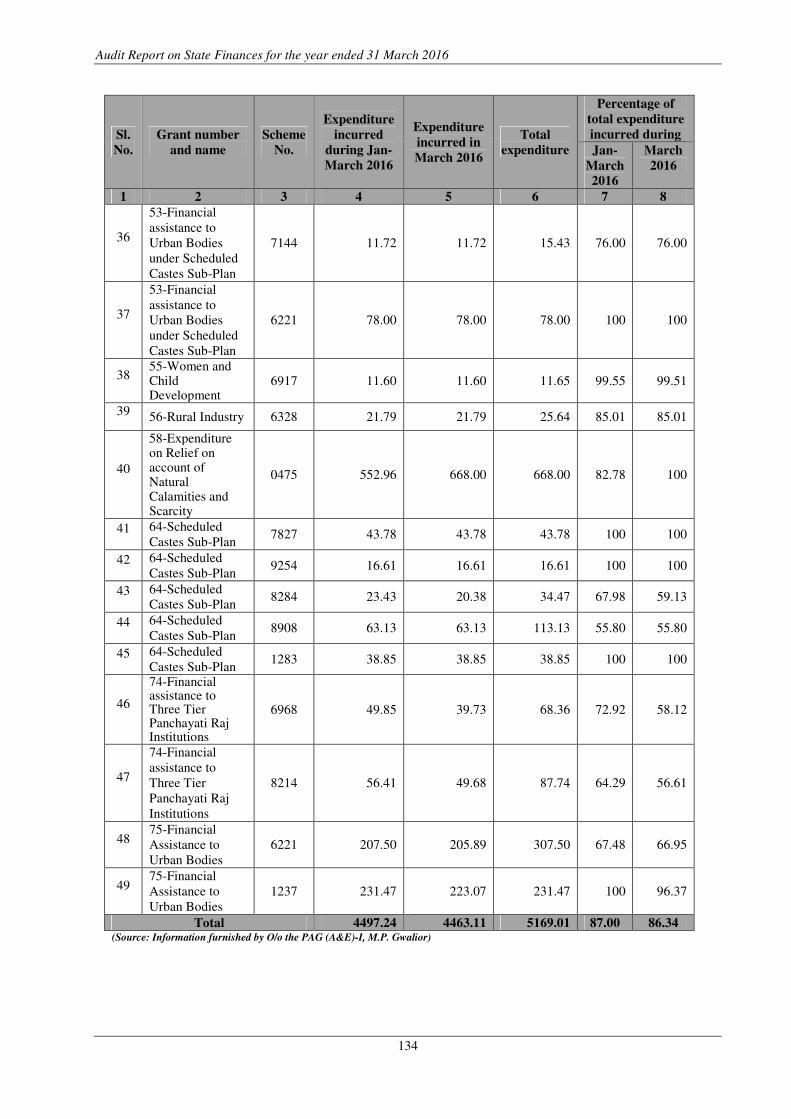
Audit Report on State Finances for the year ended 31 March 2016
134
Sl.
No.
Grant number
and name
Scheme
No.
Expenditure
incurred
during Jan-
March 2016
Expenditure
incurred in
March 2016
Total
expenditure
Percentage of
total expenditure
incurred during
Jan-
March
2016
March
2016
1 2 3 4 5 6 7 8
36
53-Financial
assistance to
Urban Bodies
under Scheduled
Castes Sub-Plan
7144 11.72 11.72 15.43 76.00 76.00
37
53-Financial
assistance to
Urban Bodies
under Scheduled
Castes Sub-Plan
6221 78.00 78.00 78.00 100 100
38 55-Women and Child Development
6917 11.60 11.60 11.65 99.55 99.51
39 56-Rural Industry 6328 21.79 21.79 25.64 85.01 85.01
40
58-Expenditure on Relief on account of Natural Calamities and Scarcity
0475 552.96 668.00 668.00 82.78 100
41 64-Scheduled
Castes Sub-Plan 7827 43.78 43.78 43.78 100 100
42 64-Scheduled
Castes Sub-Plan 9254 16.61 16.61 16.61 100 100
43 64-Scheduled
Castes Sub-Plan 8284 23.43 20.38 34.47 67.98 59.13
44 64-Scheduled
Castes Sub-Plan 8908 63.13 63.13 113.13 55.80 55.80
45 64-Scheduled
Castes Sub-Plan 1283 38.85 38.85 38.85 100 100
46
74-Financial assistance to Three Tier Panchayati Raj Institutions
6968 49.85 39.73 68.36 72.92 58.12
47
74-Financial
assistance to
Three Tier
Panchayati Raj
Institutions
8214 56.41 49.68 87.74 64.29 56.61
48 75-Financial
Assistance to
Urban Bodies
6221 207.50 205.89 307.50 67.48 66.95
49 75-Financial
Assistance to
Urban Bodies
1237 231.47 223.07 231.47 100 96.37
Total 4497.24 4463.11 5169.01 87.00 86.34 (Source: Information furnished by O/o the PAG (A&E)-I, M.P. Gwalior)
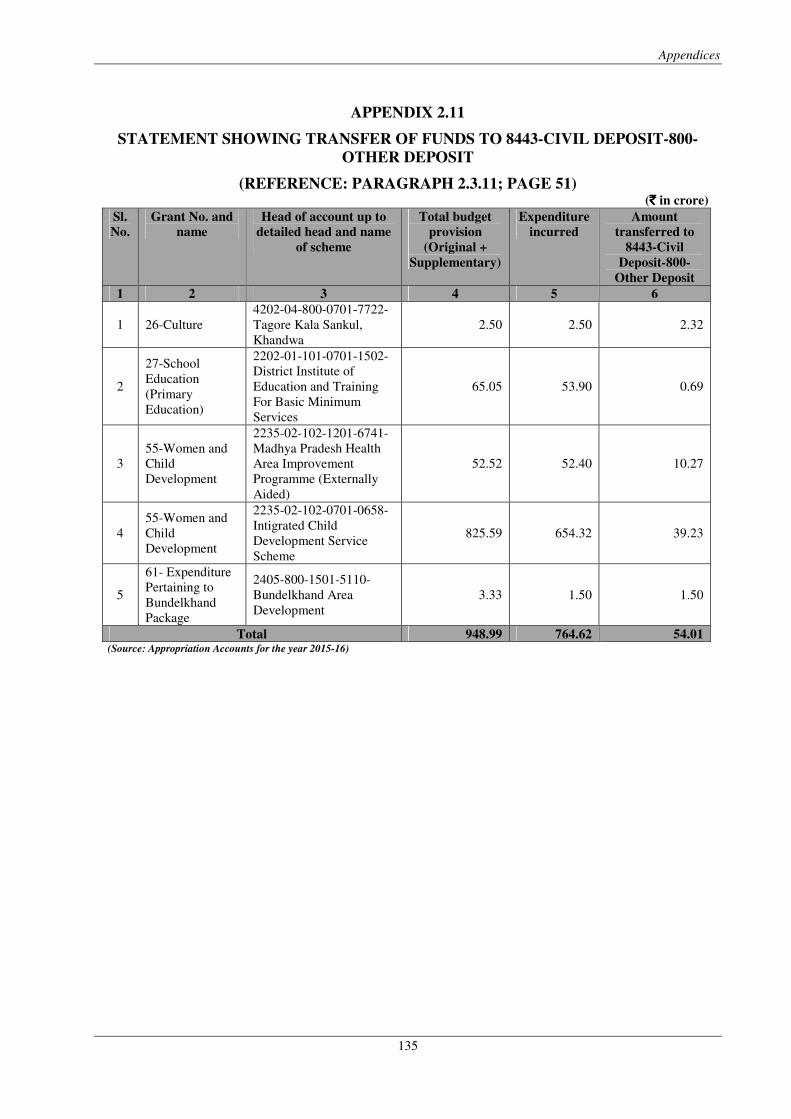
Appendices
135
APPENDIX 2.11
STATEMENT SHOWING TRANSFER OF FUNDS TO 8443-CIVIL DEPOSIT-800-
OTHER DEPOSIT
(REFERENCE: PARAGRAPH 2.3.11; PAGE 51) (`̀̀̀ in crore)
Sl.
No.
Grant No. and
name
Head of account up to
detailed head and name
of scheme
Total budget
provision
(Original +
Supplementary)
Expenditure
incurred
Amount
transferred to
8443-Civil
Deposit-800-
Other Deposit
1 2 3 4 5 6
1 26-Culture
4202-04-800-0701-7722-
Tagore Kala Sankul,
Khandwa
2.50 2.50 2.32
2
27-School
Education
(Primary
Education)
2202-01-101-0701-1502-
District Institute of
Education and Training
For Basic Minimum
Services
65.05 53.90 0.69
3
55-Women and
Child
Development
2235-02-102-1201-6741-
Madhya Pradesh Health
Area Improvement
Programme (Externally
Aided)
52.52 52.40 10.27
4
55-Women and
Child
Development
2235-02-102-0701-0658-
Intigrated Child
Development Service
Scheme
825.59 654.32 39.23
5
61- Expenditure
Pertaining to
Bundelkhand
Package
2405-800-1501-5110-
Bundelkhand Area
Development
3.33 1.50 1.50
Total 948.99 764.62 54.01 (Source: Appropriation Accounts for the year 2015-16)
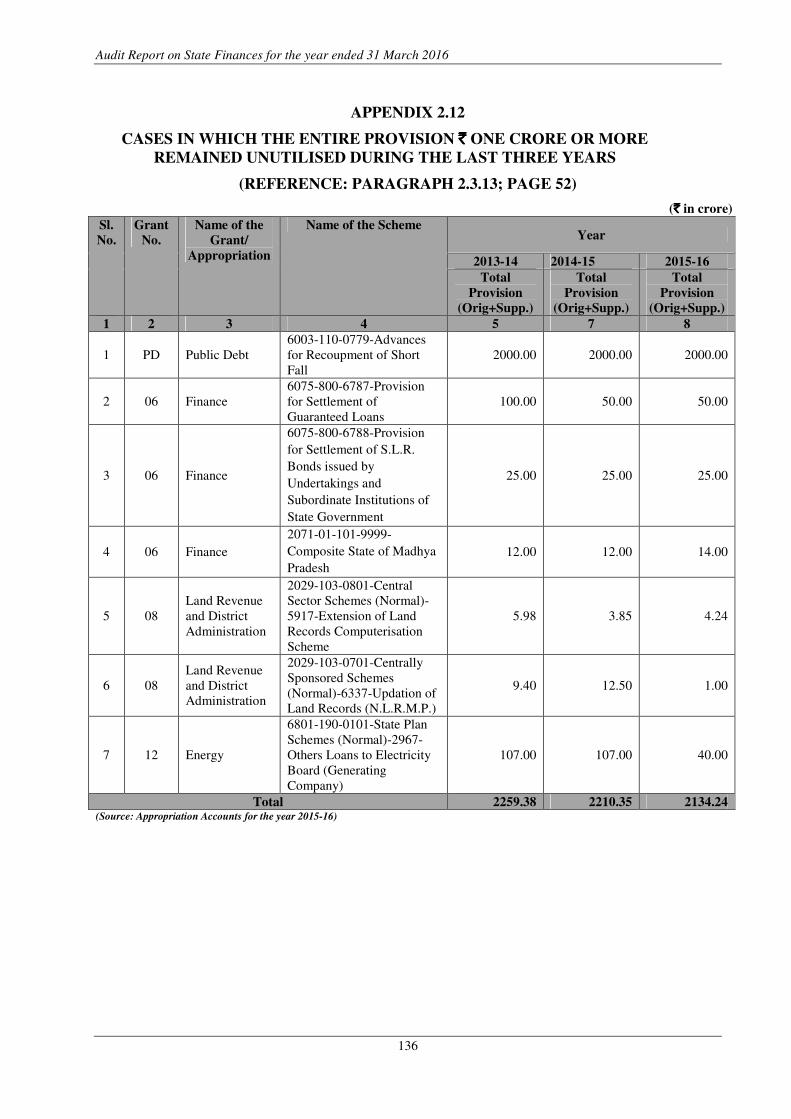
Audit Report on State Finances for the year ended 31 March 2016
136
APPENDIX 2.12
CASES IN WHICH THE ENTIRE PROVISION `̀̀̀ ONE CRORE OR MORE
REMAINED UNUTILISED DURING THE LAST THREE YEARS
(REFERENCE: PARAGRAPH 2.3.13; PAGE 52)
(`̀̀̀ in crore)
Sl.
No.
Grant
No.
Name of the
Grant/
Appropriation
Name of the Scheme Year
2013-14 2014-15 2015-16
Total
Provision
(Orig+Supp.)
Total
Provision
(Orig+Supp.)
Total
Provision
(Orig+Supp.)
1 2 3 4 5 7 8
1 PD Public Debt
6003-110-0779-Advances
for Recoupment of Short
Fall
2000.00 2000.00 2000.00
2 06 Finance
6075-800-6787-Provision
for Settlement of
Guaranteed Loans
100.00 50.00 50.00
3 06 Finance
6075-800-6788-Provision
for Settlement of S.L.R.
Bonds issued by
Undertakings and
Subordinate Institutions of
State Government
25.00 25.00 25.00
4 06 Finance
2071-01-101-9999-
Composite State of Madhya
Pradesh
12.00 12.00 14.00
5 08
Land Revenue
and District
Administration
2029-103-0801-Central
Sector Schemes (Normal)-
5917-Extension of Land
Records Computerisation
Scheme
5.98 3.85 4.24
6 08
Land Revenue
and District
Administration
2029-103-0701-Centrally
Sponsored Schemes
(Normal)-6337-Updation of
Land Records (N.L.R.M.P.)
9.40 12.50 1.00
7 12 Energy
6801-190-0101-State Plan
Schemes (Normal)-2967-
Others Loans to Electricity
Board (Generating
Company)
107.00 107.00 40.00
Total 2259.38 2210.35 2134.24 (Source: Appropriation Accounts for the year 2015-16)
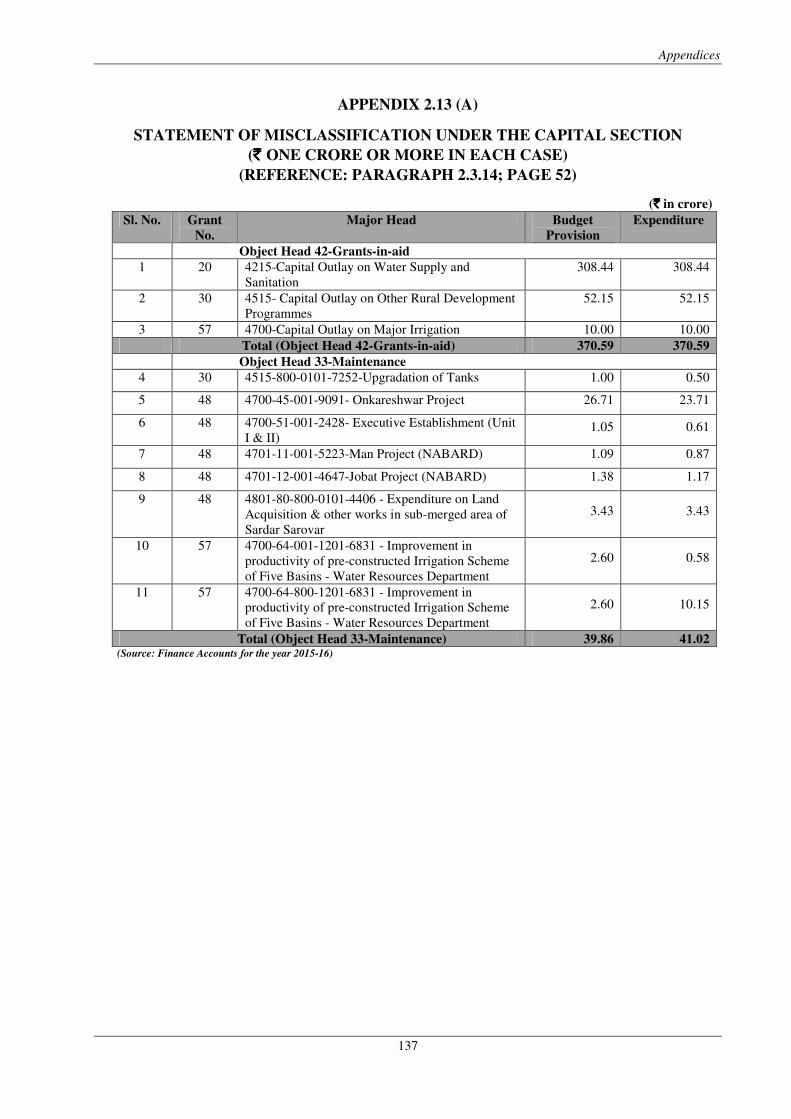
Appendices
137
APPENDIX 2.13 (A)
STATEMENT OF MISCLASSIFICATION UNDER THE CAPITAL SECTION
(` ` ` ` ONE CRORE OR MORE IN EACH CASE)
(REFERENCE: PARAGRAPH 2.3.14; PAGE 52)
(`̀̀̀ in crore)
Sl. No. Grant
No.
Major Head Budget
Provision
Expenditure
Object Head 42-Grants-in-aid
1 20 4215-Capital Outlay on Water Supply and
Sanitation
308.44 308.44
2 30 4515- Capital Outlay on Other Rural Development
Programmes
52.15 52.15
3 57 4700-Capital Outlay on Major Irrigation 10.00 10.00
Total (Object Head 42-Grants-in-aid) 370.59 370.59
Object Head 33-Maintenance
4 30 4515-800-0101-7252-Upgradation of Tanks 1.00 0.50
5 48 4700-45-001-9091- Onkareshwar Project 26.71 23.71
6 48 4700-51-001-2428- Executive Establishment (Unit
I & II) 1.05 0.61
7 48 4701-11-001-5223-Man Project (NABARD) 1.09 0.87
8 48 4701-12-001-4647-Jobat Project (NABARD) 1.38 1.17
9 48 4801-80-800-0101-4406 - Expenditure on Land
Acquisition & other works in sub-merged area of
Sardar Sarovar
3.43 3.43
10 57 4700-64-001-1201-6831 - Improvement in
productivity of pre-constructed Irrigation Scheme
of Five Basins - Water Resources Department
2.60 0.58
11 57 4700-64-800-1201-6831 - Improvement in
productivity of pre-constructed Irrigation Scheme
of Five Basins - Water Resources Department
2.60 10.15
Total (Object Head 33-Maintenance) 39.86 41.02 (Source: Finance Accounts for the year 2015-16)
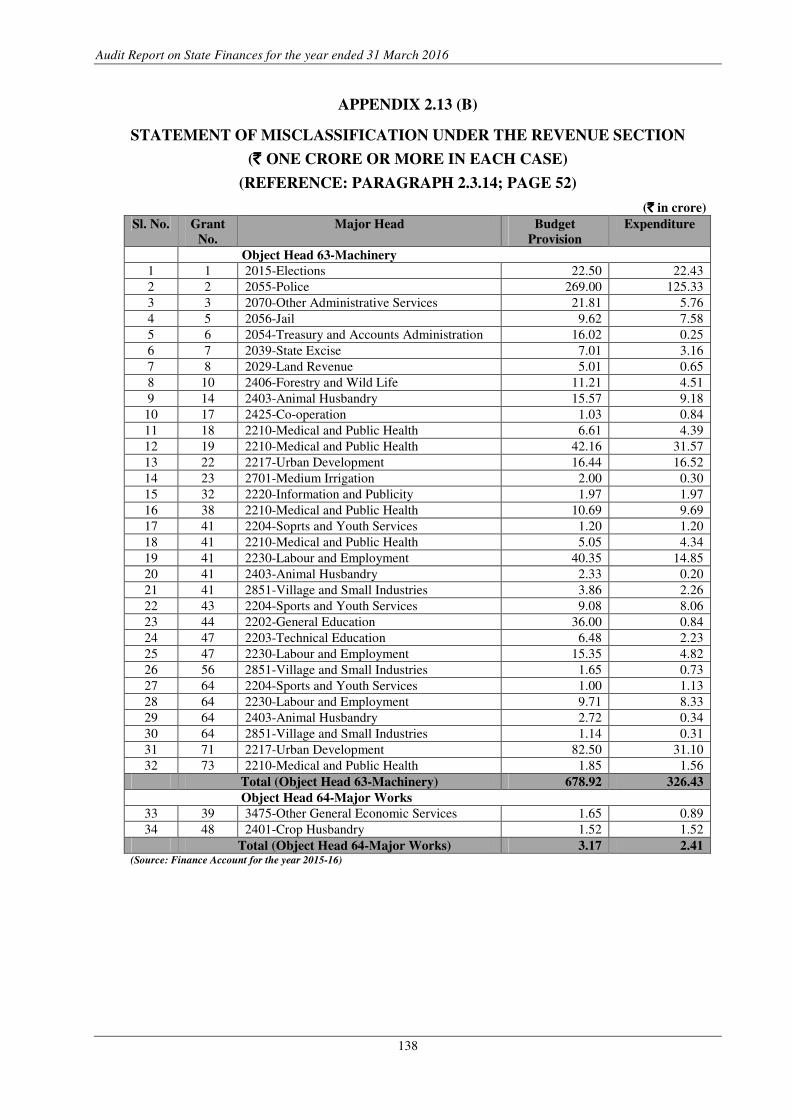
Audit Report on State Finances for the year ended 31 March 2016
138
APPENDIX 2.13 (B)
STATEMENT OF MISCLASSIFICATION UNDER THE REVENUE SECTION
(` ` ` ` ONE CRORE OR MORE IN EACH CASE)
(REFERENCE: PARAGRAPH 2.3.14; PAGE 52)
(`̀̀̀ in crore)
Sl. No. Grant
No.
Major Head Budget
Provision
Expenditure
Object Head 63-Machinery
1 1 2015-Elections 22.50 22.43
2 2 2055-Police 269.00 125.33
3 3 2070-Other Administrative Services 21.81 5.76
4 5 2056-Jail 9.62 7.58
5 6 2054-Treasury and Accounts Administration 16.02 0.25
6 7 2039-State Excise 7.01 3.16
7 8 2029-Land Revenue 5.01 0.65
8 10 2406-Forestry and Wild Life 11.21 4.51
9 14 2403-Animal Husbandry 15.57 9.18
10 17 2425-Co-operation 1.03 0.84
11 18 2210-Medical and Public Health 6.61 4.39
12 19 2210-Medical and Public Health 42.16 31.57
13 22 2217-Urban Development 16.44 16.52
14 23 2701-Medium Irrigation 2.00 0.30
15 32 2220-Information and Publicity 1.97 1.97
16 38 2210-Medical and Public Health 10.69 9.69
17 41 2204-Soprts and Youth Services 1.20 1.20
18 41 2210-Medical and Public Health 5.05 4.34
19 41 2230-Labour and Employment 40.35 14.85
20 41 2403-Animal Husbandry 2.33 0.20
21 41 2851-Village and Small Industries 3.86 2.26
22 43 2204-Sports and Youth Services 9.08 8.06
23 44 2202-General Education 36.00 0.84
24 47 2203-Technical Education 6.48 2.23
25 47 2230-Labour and Employment 15.35 4.82
26 56 2851-Village and Small Industries 1.65 0.73
27 64 2204-Sports and Youth Services 1.00 1.13
28 64 2230-Labour and Employment 9.71 8.33
29 64 2403-Animal Husbandry 2.72 0.34
30 64 2851-Village and Small Industries 1.14 0.31
31 71 2217-Urban Development 82.50 31.10
32 73 2210-Medical and Public Health 1.85 1.56
Total (Object Head 63-Machinery) 678.92 326.43
Object Head 64-Major Works
33 39 3475-Other General Economic Services 1.65 0.89
34 48 2401-Crop Husbandry 1.52 1.52
Total (Object Head 64-Major Works) 3.17 2.41 (Source: Finance Account for the year 2015-16)
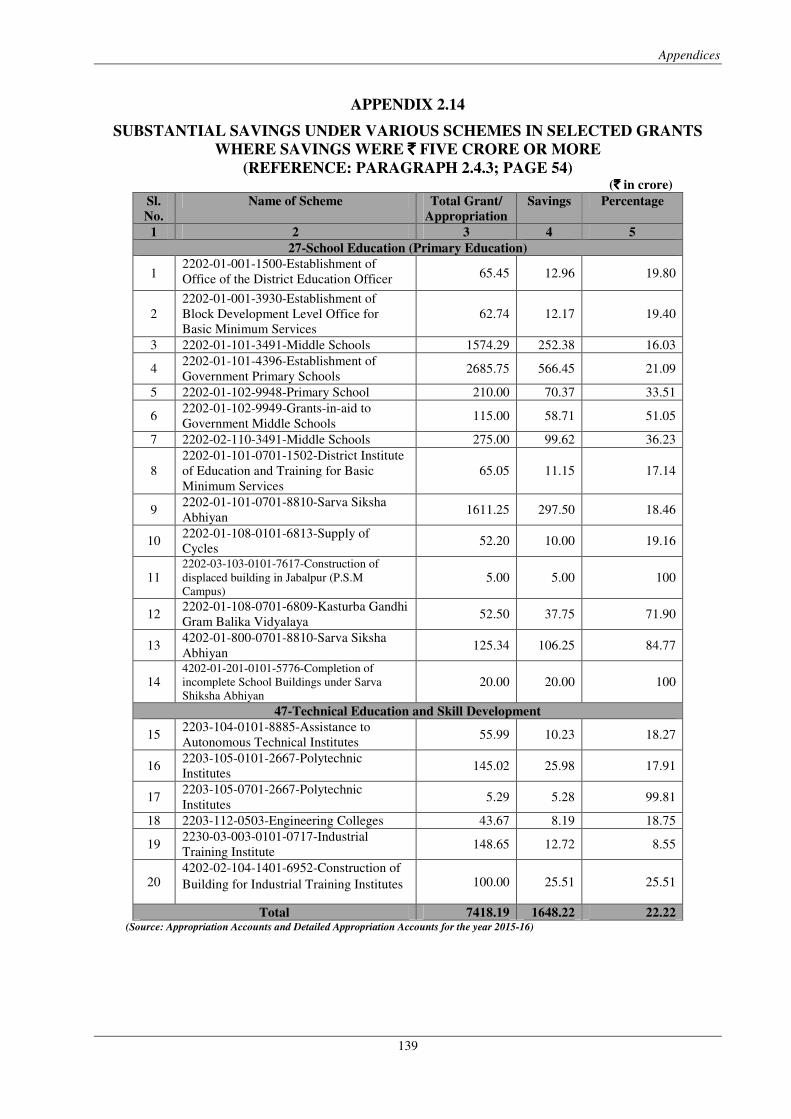
Appendices
139
APPENDIX 2.14
SUBSTANTIAL SAVINGS UNDER VARIOUS SCHEMES IN SELECTED GRANTS
WHERE SAVINGS WERE `̀̀̀ FIVE CRORE OR MORE
(REFERENCE: PARAGRAPH 2.4.3; PAGE 54) (`̀̀̀ in crore)
Sl.
No.
Name of Scheme Total Grant/
Appropriation
Savings Percentage
1 2 3 4 5
27-School Education (Primary Education)
1 2202-01-001-1500-Establishment of
Office of the District Education Officer 65.45 12.96 19.80
2
2202-01-001-3930-Establishment of
Block Development Level Office for
Basic Minimum Services
62.74 12.17 19.40
3 2202-01-101-3491-Middle Schools 1574.29 252.38 16.03
4 2202-01-101-4396-Establishment of
Government Primary Schools 2685.75 566.45 21.09
5 2202-01-102-9948-Primary School 210.00 70.37 33.51
6 2202-01-102-9949-Grants-in-aid to
Government Middle Schools 115.00 58.71 51.05
7 2202-02-110-3491-Middle Schools 275.00 99.62 36.23
8
2202-01-101-0701-1502-District Institute
of Education and Training for Basic
Minimum Services
65.05 11.15 17.14
9 2202-01-101-0701-8810-Sarva Siksha
Abhiyan 1611.25 297.50 18.46
10 2202-01-108-0101-6813-Supply of
Cycles 52.20 10.00 19.16
11 2202-03-103-0101-7617-Construction of
displaced building in Jabalpur (P.S.M
Campus) 5.00 5.00 100
12 2202-01-108-0701-6809-Kasturba Gandhi
Gram Balika Vidyalaya 52.50 37.75 71.90
13 4202-01-800-0701-8810-Sarva Siksha
Abhiyan 125.34 106.25 84.77
14 4202-01-201-0101-5776-Completion of
incomplete School Buildings under Sarva
Shiksha Abhiyan 20.00 20.00 100
47-Technical Education and Skill Development
15 2203-104-0101-8885-Assistance to
Autonomous Technical Institutes 55.99 10.23 18.27
16 2203-105-0101-2667-Polytechnic
Institutes 145.02 25.98 17.91
17 2203-105-0701-2667-Polytechnic
Institutes 5.29 5.28 99.81
18 2203-112-0503-Engineering Colleges 43.67 8.19 18.75
19 2230-03-003-0101-0717-Industrial
Training Institute 148.65 12.72 8.55
20 4202-02-104-1401-6952-Construction of
Building for Industrial Training Institutes 100.00 25.51 25.51
Total 7418.19 1648.22 22.22 (Source: Appropriation Accounts and Detailed Appropriation Accounts for the year 2015-16)
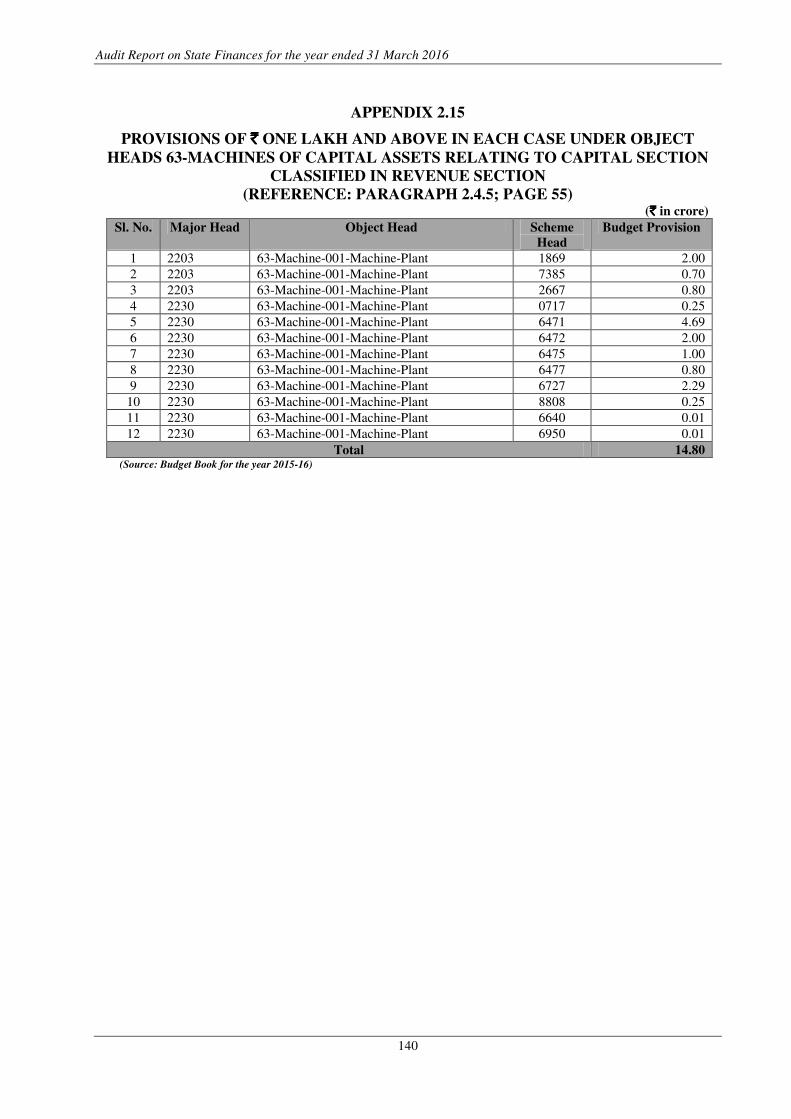
Audit Report on State Finances for the year ended 31 March 2016
140
APPENDIX 2.15
PROVISIONS OF `̀̀̀ ONE LAKH AND ABOVE IN EACH CASE UNDER OBJECT
HEADS 63-MACHINES OF CAPITAL ASSETS RELATING TO CAPITAL SECTION
CLASSIFIED IN REVENUE SECTION
(REFERENCE: PARAGRAPH 2.4.5; PAGE 55) (`̀̀̀ in crore)
Sl. No. Major Head Object Head Scheme
Head
Budget Provision
1 2203 63-Machine-001-Machine-Plant 1869 2.00
2 2203 63-Machine-001-Machine-Plant 7385 0.70
3 2203 63-Machine-001-Machine-Plant 2667 0.80
4 2230 63-Machine-001-Machine-Plant 0717 0.25
5 2230 63-Machine-001-Machine-Plant 6471 4.69
6 2230 63-Machine-001-Machine-Plant 6472 2.00
7 2230 63-Machine-001-Machine-Plant 6475 1.00
8 2230 63-Machine-001-Machine-Plant 6477 0.80
9 2230 63-Machine-001-Machine-Plant 6727 2.29
10 2230 63-Machine-001-Machine-Plant 8808 0.25
11 2230 63-Machine-001-Machine-Plant 6640 0.01
12 2230 63-Machine-001-Machine-Plant 6950 0.01
Total 14.80 (Source: Budget Book for the year 2015-16)
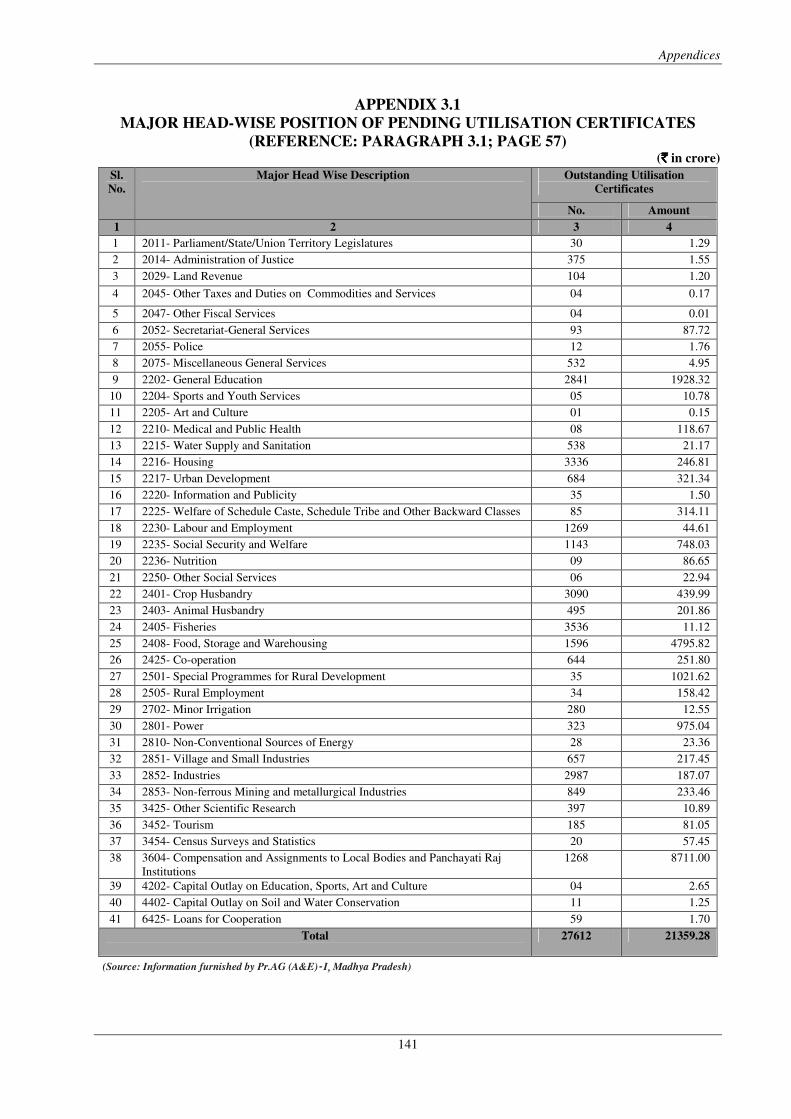
Appendices
141
APPENDIX 3.1
MAJOR HEAD-WISE POSITION OF PENDING UTILISATION CERTIFICATES
(REFERENCE: PARAGRAPH 3.1; PAGE 57) (`̀̀̀ in crore)
Sl.
No.
Major Head Wise Description
Outstanding Utilisation
Certificates
No. Amount
1 2 3 4
1 2011- Parliament/State/Union Territory Legislatures 30 1.29
2 2014- Administration of Justice 375 1.55
3 2029- Land Revenue 104 1.20
4 2045- Other Taxes and Duties on Commodities and Services 04 0.17
5 2047- Other Fiscal Services 04 0.01
6 2052- Secretariat-General Services 93 87.72
7 2055- Police 12 1.76
8 2075- Miscellaneous General Services 532 4.95
9 2202- General Education 2841 1928.32
10 2204- Sports and Youth Services 05 10.78
11 2205- Art and Culture 01 0.15
12 2210- Medical and Public Health 08 118.67
13 2215- Water Supply and Sanitation 538 21.17
14 2216- Housing 3336 246.81
15 2217- Urban Development 684 321.34
16 2220- Information and Publicity 35 1.50
17 2225- Welfare of Schedule Caste, Schedule Tribe and Other Backward Classes 85 314.11
18 2230- Labour and Employment 1269 44.61
19 2235- Social Security and Welfare 1143 748.03
20 2236- Nutrition 09 86.65
21 2250- Other Social Services 06 22.94
22 2401- Crop Husbandry 3090 439.99
23 2403- Animal Husbandry 495 201.86
24 2405- Fisheries 3536 11.12
25 2408- Food, Storage and Warehousing 1596 4795.82
26 2425- Co-operation 644 251.80
27 2501- Special Programmes for Rural Development 35 1021.62
28 2505- Rural Employment 34 158.42
29 2702- Minor Irrigation 280 12.55
30 2801- Power 323 975.04
31 2810- Non-Conventional Sources of Energy 28 23.36
32 2851- Village and Small Industries 657 217.45
33 2852- Industries 2987 187.07
34 2853- Non-ferrous Mining and metallurgical Industries 849 233.46
35 3425- Other Scientific Research 397 10.89
36 3452- Tourism 185 81.05
37 3454- Census Surveys and Statistics 20 57.45
38 3604- Compensation and Assignments to Local Bodies and Panchayati Raj
Institutions
1268 8711.00
39 4202- Capital Outlay on Education, Sports, Art and Culture 04 2.65
40 4402- Capital Outlay on Soil and Water Conservation 11 1.25
41 6425- Loans for Cooperation 59 1.70
Total
27612 21359.28
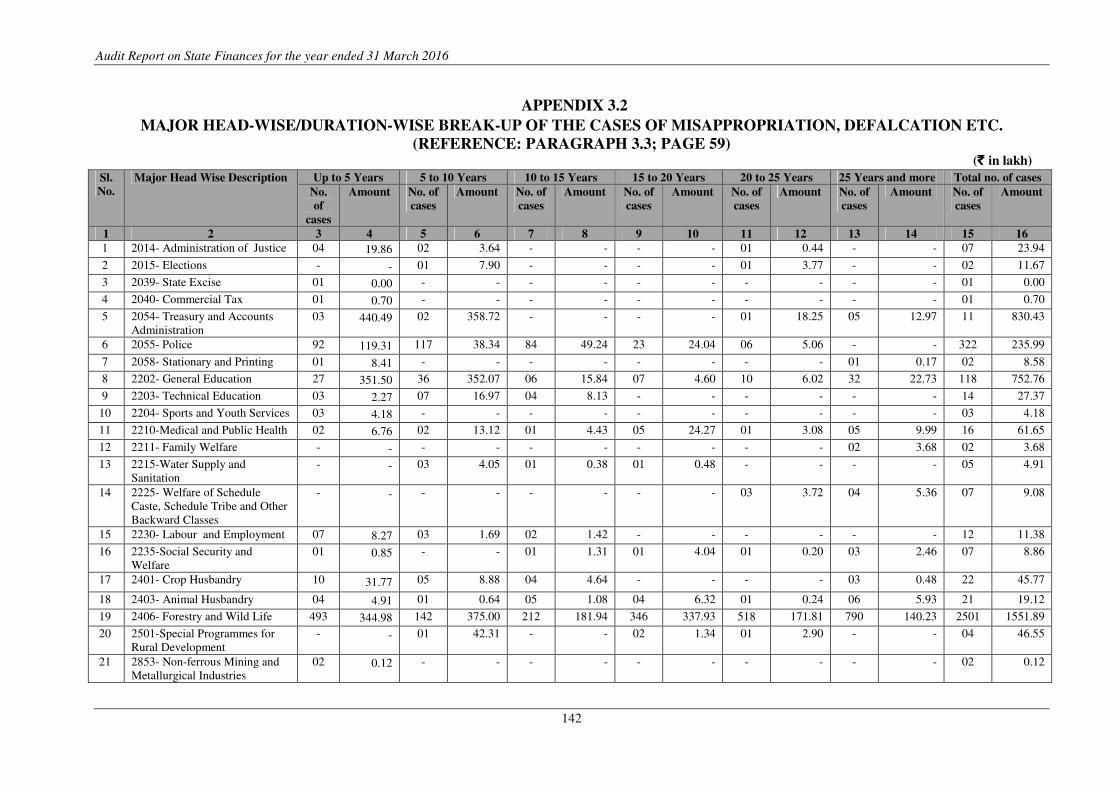
Audit Report on State Finances for the year ended 31 March 2016
142
APPENDIX 3.2
MAJOR HEAD-WISE/DURATION-WISE BREAK-UP OF THE CASES OF MISAPPROPRIATION, DEFALCATION ETC.
(REFERENCE: PARAGRAPH 3.3; PAGE 59) (` ` ` ` in lakh)
Sl.
No.
Major Head Wise Description Up to 5 Years 5 to 10 Years 10 to 15 Years 15 to 20 Years 20 to 25 Years 25 Years and more Total no. of cases
No.
of
cases
Amount No. of
cases
Amount No. of
cases
Amount No. of
cases
Amount No. of
cases
Amount No. of
cases
Amount No. of
cases
Amount
1 2 3 4 5 6 7 8 9 10 11 12 13 14 15 16
1 2014- Administration of Justice 04 19.86 02 3.64 - - - - 01 0.44 - - 07 23.94
2 2015- Elections - - 01 7.90 - - - - 01 3.77 - - 02 11.67
3 2039- State Excise 01 0.00 - - - - - - - - - - 01 0.00
4 2040- Commercial Tax 01 0.70 - - - - - - - - - - 01 0.70
5 2054- Treasury and Accounts
Administration
03 440.49 02 358.72 - - - - 01 18.25 05 12.97 11 830.43
6 2055- Police 92 119.31 117 38.34 84 49.24 23 24.04 06 5.06 - - 322 235.99
7 2058- Stationary and Printing 01 8.41 - - - - - - - - 01 0.17 02 8.58
8 2202- General Education 27 351.50 36 352.07 06 15.84 07 4.60 10 6.02 32 22.73 118 752.76
9 2203- Technical Education 03 2.27 07 16.97 04 8.13 - - - - - - 14 27.37
10 2204- Sports and Youth Services 03 4.18 - - - - - - - - - - 03 4.18
11 2210-Medical and Public Health 02 6.76 02 13.12 01 4.43 05 24.27 01 3.08 05 9.99 16 61.65
12 2211- Family Welfare - - - - - - - - - - 02 3.68 02 3.68
13 2215-Water Supply and
Sanitation
- - 03 4.05 01 0.38 01 0.48 - - - - 05 4.91
14 2225- Welfare of Schedule
Caste, Schedule Tribe and Other
Backward Classes
- - - - - - - - 03 3.72 04 5.36 07 9.08
15 2230- Labour and Employment 07 8.27 03 1.69 02 1.42 - - - - - - 12 11.38
16 2235-Social Security and
Welfare
01 0.85 - - 01 1.31 01 4.04 01 0.20 03 2.46 07 8.86
17 2401- Crop Husbandry 10 31.77 05 8.88 04 4.64 - - - - 03 0.48 22 45.77
18 2403- Animal Husbandry 04 4.91 01 0.64 05 1.08 04 6.32 01 0.24 06 5.93 21 19.12
19 2406- Forestry and Wild Life 493 344.98 142 375.00 212 181.94 346 337.93 518 171.81 790 140.23 2501 1551.89
20 2501-Special Programmes for
Rural Development
- - 01 42.31 - - 02 1.34 01 2.90 - - 04 46.55
21 2853- Non-ferrous Mining and
Metallurgical Industries
02 0.12 - - - - - - - - - - 02 0.12
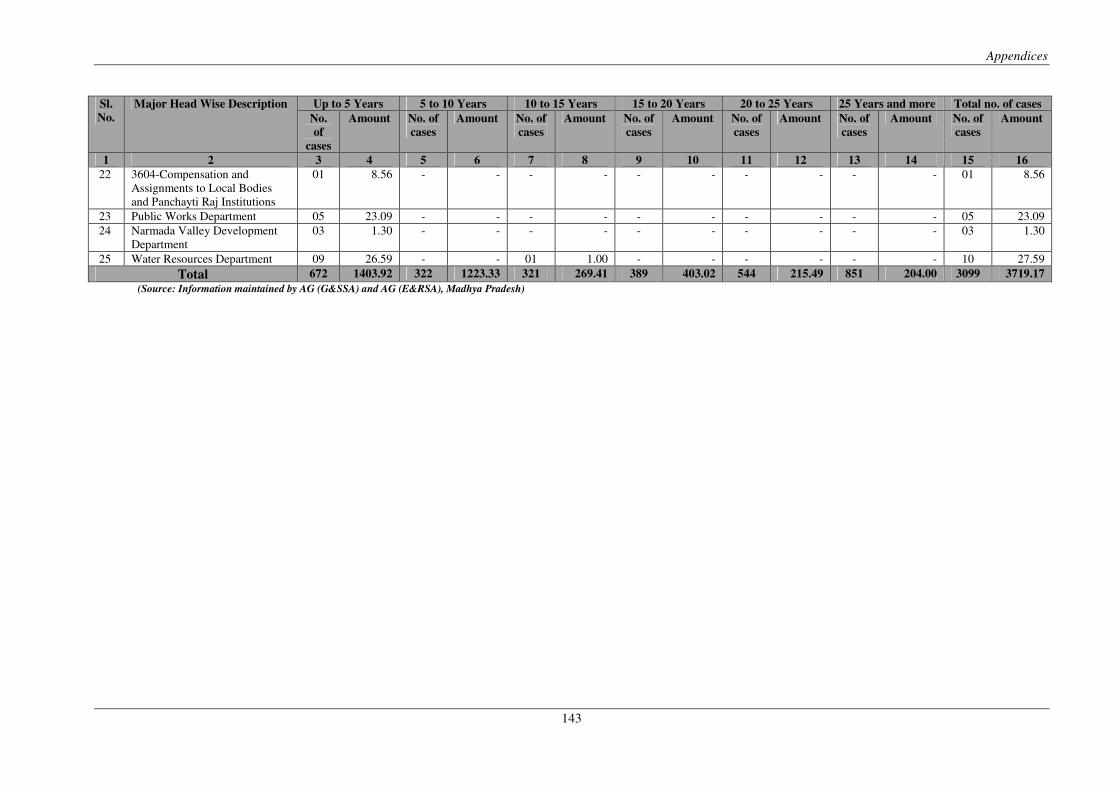
Appendices
143
Sl.
No.
Major Head Wise Description Up to 5 Years 5 to 10 Years 10 to 15 Years 15 to 20 Years 20 to 25 Years 25 Years and more Total no. of cases
No.
of
cases
Amount No. of
cases
Amount No. of
cases
Amount No. of
cases
Amount No. of
cases
Amount No. of
cases
Amount No. of
cases
Amount
1 2 3 4 5 6 7 8 9 10 11 12 13 14 15 16
22 3604-Compensation and
Assignments to Local Bodies
and Panchayti Raj Institutions
01 8.56 - - - - - - - - - - 01 8.56
23 Public Works Department 05 23.09 - - - - - - - - - - 05 23.09
24 Narmada Valley Development
Department
03 1.30 - - - - - - - - - - 03 1.30
25 Water Resources Department 09 26.59 - - 01 1.00 - - - - - - 10 27.59
Total 672 1403.92 322 1223.33 321 269.41 389 403.02 544 215.49 851 204.00 3099 3719.17
(Source: Information maintained by AG (G&SSA) and AG (E&RSA), Madhya Pradesh)
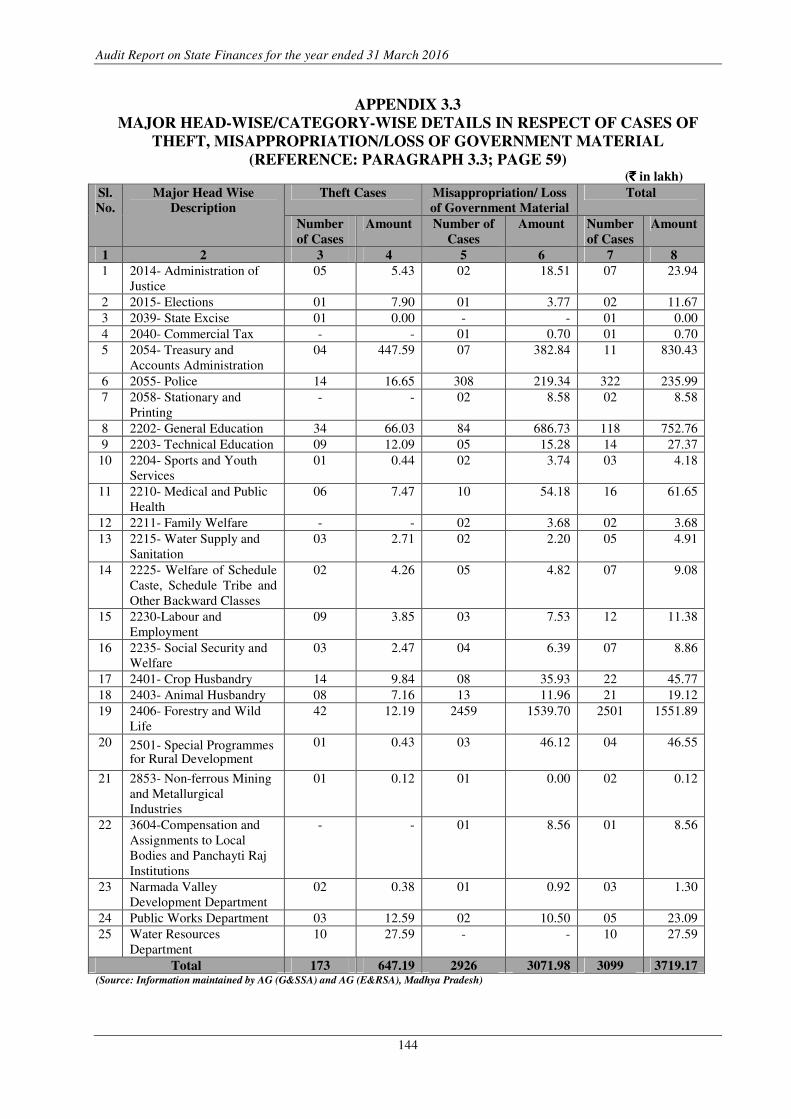
Audit Report on State Finances for the year ended 31 March 2016
144
APPENDIX 3.3
MAJOR HEAD-WISE/CATEGORY-WISE DETAILS IN RESPECT OF CASES OF
THEFT, MISAPPROPRIATION/LOSS OF GOVERNMENT MATERIAL
(REFERENCE: PARAGRAPH 3.3; PAGE 59) (`̀̀̀ in lakh)
Sl.
No.
Major Head Wise
Description
Theft Cases Misappropriation/ Loss
of Government Material
Total
Number
of Cases
Amount Number of
Cases
Amount
Number
of Cases
Amount
1 2 3 4 5 6 7 8
1 2014- Administration of
Justice
05 5.43 02 18.51 07 23.94
2 2015- Elections 01 7.90 01 3.77 02 11.67
3 2039- State Excise 01 0.00 - - 01 0.00
4 2040- Commercial Tax - - 01 0.70 01 0.70
5 2054- Treasury and
Accounts Administration
04 447.59 07 382.84 11 830.43
6 2055- Police 14 16.65 308 219.34 322 235.99
7 2058- Stationary and
Printing
- - 02 8.58 02 8.58
8 2202- General Education 34 66.03 84 686.73 118 752.76
9 2203- Technical Education 09 12.09 05 15.28 14 27.37
10 2204- Sports and Youth
Services
01 0.44 02 3.74 03 4.18
11 2210- Medical and Public
Health
06 7.47 10 54.18 16 61.65
12 2211- Family Welfare - - 02 3.68 02 3.68
13 2215- Water Supply and
Sanitation
03 2.71 02 2.20 05 4.91
14 2225- Welfare of Schedule
Caste, Schedule Tribe and
Other Backward Classes
02 4.26 05 4.82 07 9.08
15 2230-Labour and
Employment
09 3.85 03 7.53 12 11.38
16 2235- Social Security and
Welfare
03 2.47 04 6.39 07 8.86
17 2401- Crop Husbandry 14 9.84 08 35.93 22 45.77
18 2403- Animal Husbandry 08 7.16 13 11.96 21 19.12
19 2406- Forestry and Wild
Life
42 12.19 2459 1539.70 2501 1551.89
20 2501- Special Programmes for Rural Development
01 0.43 03 46.12 04 46.55
21 2853- Non-ferrous Mining
and Metallurgical
Industries
01 0.12 01 0.00 02 0.12
22 3604-Compensation and
Assignments to Local
Bodies and Panchayti Raj
Institutions
- - 01 8.56 01 8.56
23 Narmada Valley
Development Department
02 0.38 01 0.92 03 1.30
24 Public Works Department 03 12.59 02 10.50 05 23.09
25 Water Resources
Department
10 27.59 - - 10 27.59
Total 173 647.19 2926 3071.98 3099 3719.17 (Source: Information maintained by AG (G&SSA) and AG (E&RSA), Madhya Pradesh)
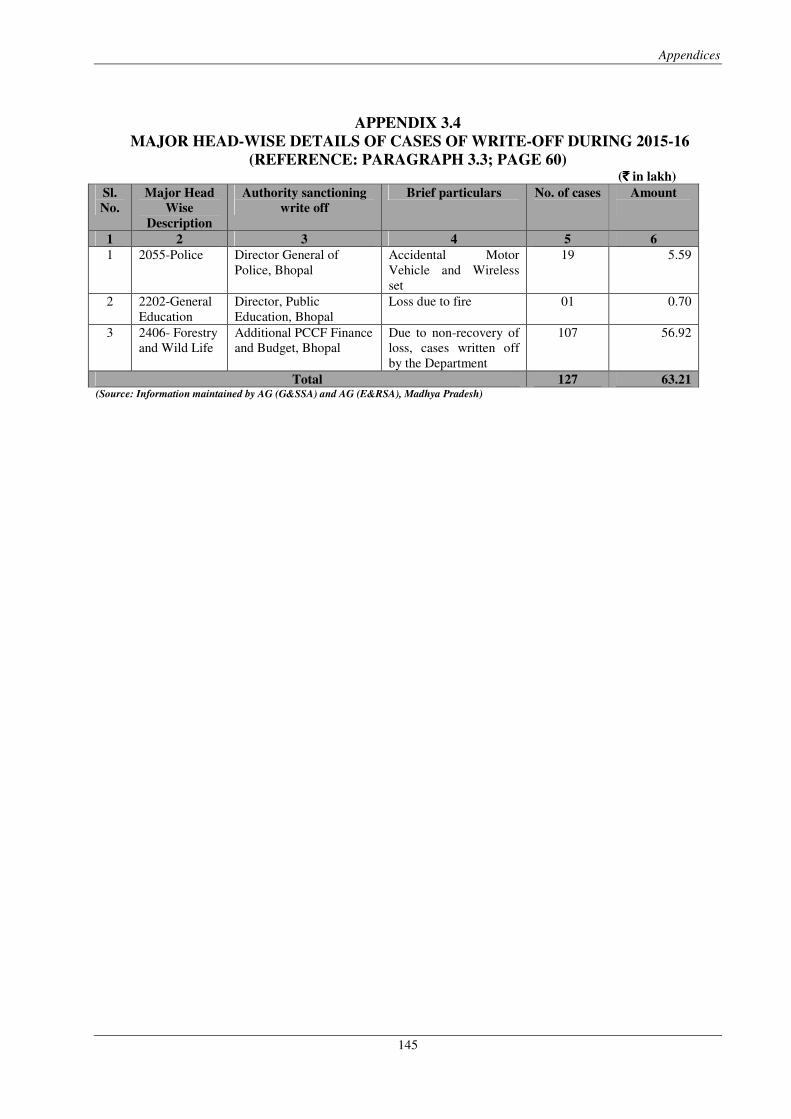
Appendices
145
APPENDIX 3.4
MAJOR HEAD-WISE DETAILS OF CASES OF WRITE-OFF DURING 2015-16
(REFERENCE: PARAGRAPH 3.3; PAGE 60) (`̀̀̀ in lakh)
Sl.
No.
Major Head
Wise
Description
Authority sanctioning
write off
Brief particulars No. of cases Amount
1 2 3 4 5 6
1 2055-Police Director General of
Police, Bhopal
Accidental Motor
Vehicle and Wireless
set
19 5.59
2 2202-General
Education
Director, Public
Education, Bhopal
Loss due to fire 01 0.70
3 2406- Forestry
and Wild Life
Additional PCCF Finance
and Budget, Bhopal
Due to non-recovery of
loss, cases written off
by the Department
107 56.92
Total 127 63.21 (Source: Information maintained by AG (G&SSA) and AG (E&RSA), Madhya Pradesh)
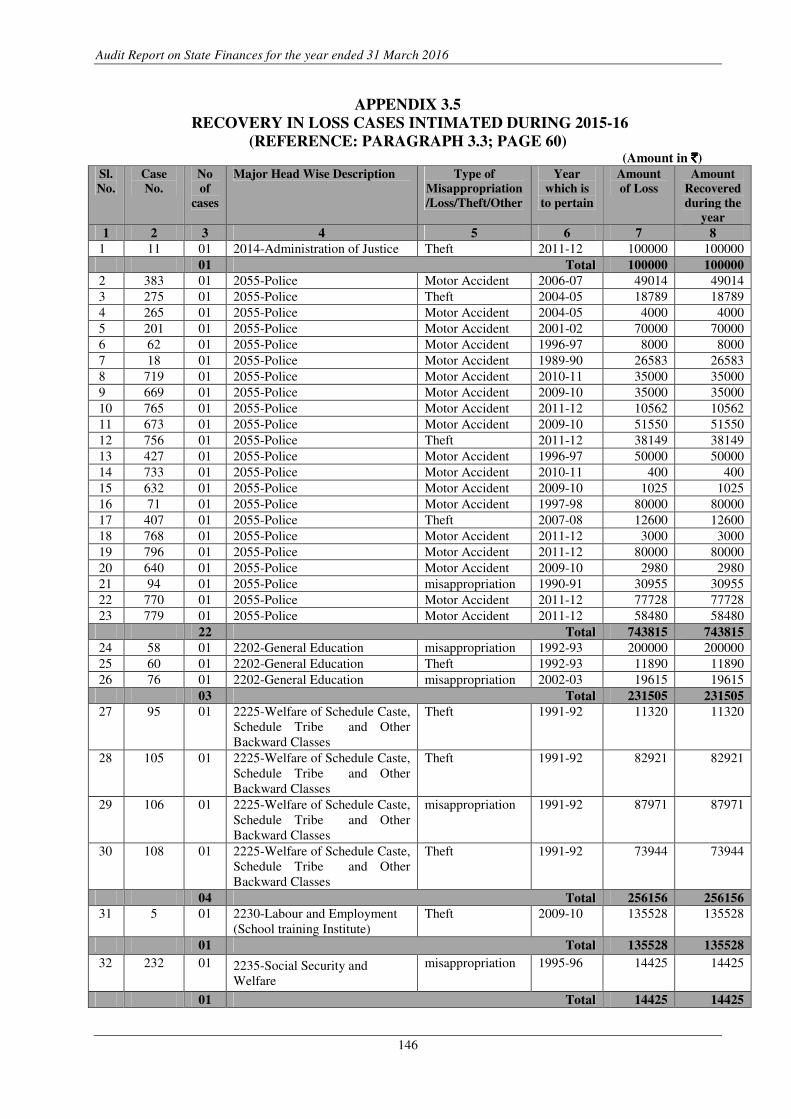
Audit Report on State Finances for the year ended 31 March 2016
146
APPENDIX 3.5
RECOVERY IN LOSS CASES INTIMATED DURING 2015-16
(REFERENCE: PARAGRAPH 3.3; PAGE 60) (Amount in `̀̀̀)
Sl.
No.
Case
No.
No
of
cases
Major Head Wise Description Type of
Misappropriation
/Loss/Theft/Other
Year
which is
to pertain
Amount
of Loss
Amount
Recovered
during the
year
1 2 3 4 5 6 7 8
1 11 01 2014-Administration of Justice Theft 2011-12 100000 100000
01 Total 100000 100000
2 383 01 2055-Police Motor Accident 2006-07 49014 49014
3 275 01 2055-Police Theft 2004-05 18789 18789
4 265 01 2055-Police Motor Accident 2004-05 4000 4000
5 201 01 2055-Police Motor Accident 2001-02 70000 70000
6 62 01 2055-Police Motor Accident 1996-97 8000 8000
7 18 01 2055-Police Motor Accident 1989-90 26583 26583
8 719 01 2055-Police Motor Accident 2010-11 35000 35000
9 669 01 2055-Police Motor Accident 2009-10 35000 35000
10 765 01 2055-Police Motor Accident 2011-12 10562 10562
11 673 01 2055-Police Motor Accident 2009-10 51550 51550
12 756 01 2055-Police Theft 2011-12 38149 38149
13 427 01 2055-Police Motor Accident 1996-97 50000 50000
14 733 01 2055-Police Motor Accident 2010-11 400 400
15 632 01 2055-Police Motor Accident 2009-10 1025 1025
16 71 01 2055-Police Motor Accident 1997-98 80000 80000
17 407 01 2055-Police Theft 2007-08 12600 12600
18 768 01 2055-Police Motor Accident 2011-12 3000 3000
19 796 01 2055-Police Motor Accident 2011-12 80000 80000
20 640 01 2055-Police Motor Accident 2009-10 2980 2980
21 94 01 2055-Police misappropriation 1990-91 30955 30955
22 770 01 2055-Police Motor Accident 2011-12 77728 77728
23 779 01 2055-Police Motor Accident 2011-12 58480 58480
22 Total 743815 743815
24 58 01 2202-General Education misappropriation 1992-93 200000 200000
25 60 01 2202-General Education Theft 1992-93 11890 11890
26 76 01 2202-General Education misappropriation 2002-03 19615 19615
03 Total 231505 231505
27 95 01 2225-Welfare of Schedule Caste,
Schedule Tribe and Other
Backward Classes
Theft 1991-92 11320 11320
28 105 01 2225-Welfare of Schedule Caste,
Schedule Tribe and Other
Backward Classes
Theft 1991-92 82921 82921
29 106 01 2225-Welfare of Schedule Caste,
Schedule Tribe and Other
Backward Classes
misappropriation 1991-92 87971 87971
30 108 01 2225-Welfare of Schedule Caste,
Schedule Tribe and Other
Backward Classes
Theft 1991-92 73944 73944
04 Total 256156 256156
31 5 01 2230-Labour and Employment
(School training Institute)
Theft 2009-10 135528 135528
01 Total 135528 135528
32 232 01 2235-Social Security and
Welfare
misappropriation 1995-96 14425 14425
01 Total 14425 14425
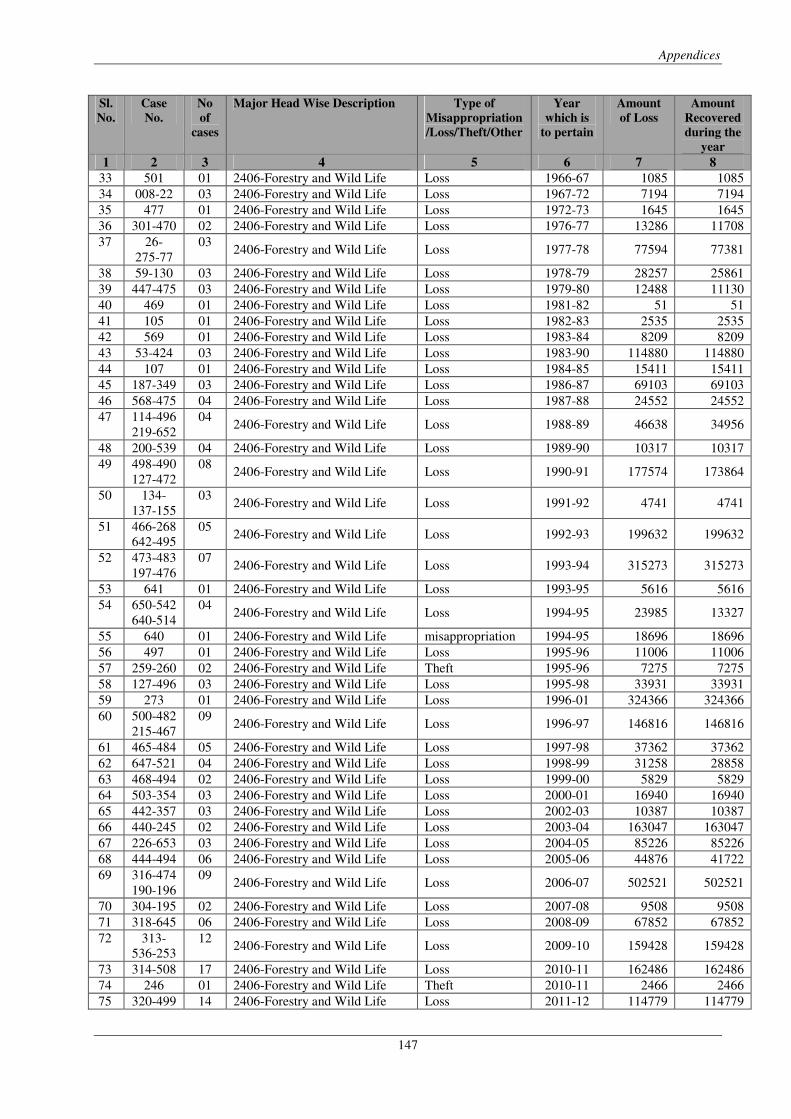
Appendices
147
Sl.
No.
Case
No.
No
of
cases
Major Head Wise Description Type of
Misappropriation
/Loss/Theft/Other
Year
which is
to pertain
Amount
of Loss
Amount
Recovered
during the
year
1 2 3 4 5 6 7 8
33 501 01 2406-Forestry and Wild Life Loss 1966-67 1085 1085
34 008-22 03 2406-Forestry and Wild Life Loss 1967-72 7194 7194
35 477 01 2406-Forestry and Wild Life Loss 1972-73 1645 1645
36 301-470 02 2406-Forestry and Wild Life Loss 1976-77 13286 11708
37 26-
275-77
03 2406-Forestry and Wild Life Loss 1977-78 77594 77381
38 59-130 03 2406-Forestry and Wild Life Loss 1978-79 28257 25861
39 447-475 03 2406-Forestry and Wild Life Loss 1979-80 12488 11130
40 469 01 2406-Forestry and Wild Life Loss 1981-82 51 51
41 105 01 2406-Forestry and Wild Life Loss 1982-83 2535 2535
42 569 01 2406-Forestry and Wild Life Loss 1983-84 8209 8209
43 53-424 03 2406-Forestry and Wild Life Loss 1983-90 114880 114880
44 107 01 2406-Forestry and Wild Life Loss 1984-85 15411 15411
45 187-349 03 2406-Forestry and Wild Life Loss 1986-87 69103 69103
46 568-475 04 2406-Forestry and Wild Life Loss 1987-88 24552 24552
47 114-496
219-652
04 2406-Forestry and Wild Life Loss 1988-89 46638 34956
48 200-539 04 2406-Forestry and Wild Life Loss 1989-90 10317 10317
49 498-490
127-472
08 2406-Forestry and Wild Life Loss 1990-91 177574 173864
50 134-
137-155
03 2406-Forestry and Wild Life Loss 1991-92 4741 4741
51 466-268
642-495
05 2406-Forestry and Wild Life Loss 1992-93 199632 199632
52 473-483
197-476
07 2406-Forestry and Wild Life Loss 1993-94 315273 315273
53 641 01 2406-Forestry and Wild Life Loss 1993-95 5616 5616
54 650-542
640-514
04 2406-Forestry and Wild Life Loss 1994-95 23985 13327
55 640 01 2406-Forestry and Wild Life misappropriation 1994-95 18696 18696
56 497 01 2406-Forestry and Wild Life Loss 1995-96 11006 11006
57 259-260 02 2406-Forestry and Wild Life Theft 1995-96 7275 7275
58 127-496 03 2406-Forestry and Wild Life Loss 1995-98 33931 33931
59 273 01 2406-Forestry and Wild Life Loss 1996-01 324366 324366
60 500-482
215-467
09 2406-Forestry and Wild Life Loss 1996-97 146816 146816
61 465-484 05 2406-Forestry and Wild Life Loss 1997-98 37362 37362
62 647-521 04 2406-Forestry and Wild Life Loss 1998-99 31258 28858
63 468-494 02 2406-Forestry and Wild Life Loss 1999-00 5829 5829
64 503-354 03 2406-Forestry and Wild Life Loss 2000-01 16940 16940
65 442-357 03 2406-Forestry and Wild Life Loss 2002-03 10387 10387
66 440-245 02 2406-Forestry and Wild Life Loss 2003-04 163047 163047
67 226-653 03 2406-Forestry and Wild Life Loss 2004-05 85226 85226
68 444-494 06 2406-Forestry and Wild Life Loss 2005-06 44876 41722
69 316-474
190-196
09 2406-Forestry and Wild Life Loss 2006-07 502521 502521
70 304-195 02 2406-Forestry and Wild Life Loss 2007-08 9508 9508
71 318-645 06 2406-Forestry and Wild Life Loss 2008-09 67852 67852
72 313-
536-253
12 2406-Forestry and Wild Life Loss 2009-10 159428 159428
73 314-508 17 2406-Forestry and Wild Life Loss 2010-11 162486 162486
74 246 01 2406-Forestry and Wild Life Theft 2010-11 2466 2466
75 320-499 14 2406-Forestry and Wild Life Loss 2011-12 114779 114779
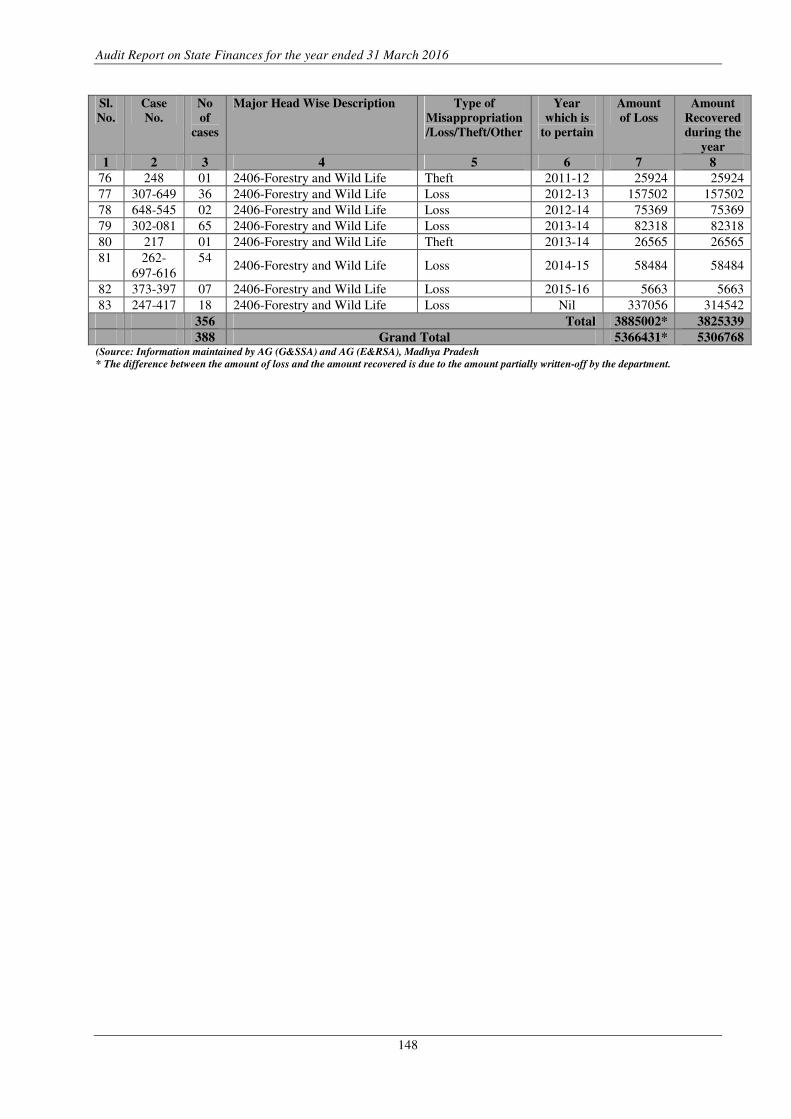
Audit Report on State Finances for the year ended 31 March 2016
148
Sl.
No.
Case
No.
No
of
cases
Major Head Wise Description Type of
Misappropriation
/Loss/Theft/Other
Year
which is
to pertain
Amount
of Loss
Amount
Recovered
during the
year
1 2 3 4 5 6 7 8
76 248 01 2406-Forestry and Wild Life Theft 2011-12 25924 25924
77 307-649 36 2406-Forestry and Wild Life Loss 2012-13 157502 157502
78 648-545 02 2406-Forestry and Wild Life Loss 2012-14 75369 75369
79 302-081 65 2406-Forestry and Wild Life Loss 2013-14 82318 82318
80 217 01 2406-Forestry and Wild Life Theft 2013-14 26565 26565
81 262-
697-616
54 2406-Forestry and Wild Life Loss 2014-15 58484 58484
82 373-397 07 2406-Forestry and Wild Life Loss 2015-16 5663 5663
83 247-417 18 2406-Forestry and Wild Life Loss Nil 337056 314542
356 Total 3885002* 3825339
388 Grand Total 5366431* 5306768 (Source: Information maintained by AG (G&SSA) and AG (E&RSA), Madhya Pradesh
* The difference between the amount of loss and the amount recovered is due to the amount partially written-off by the department.
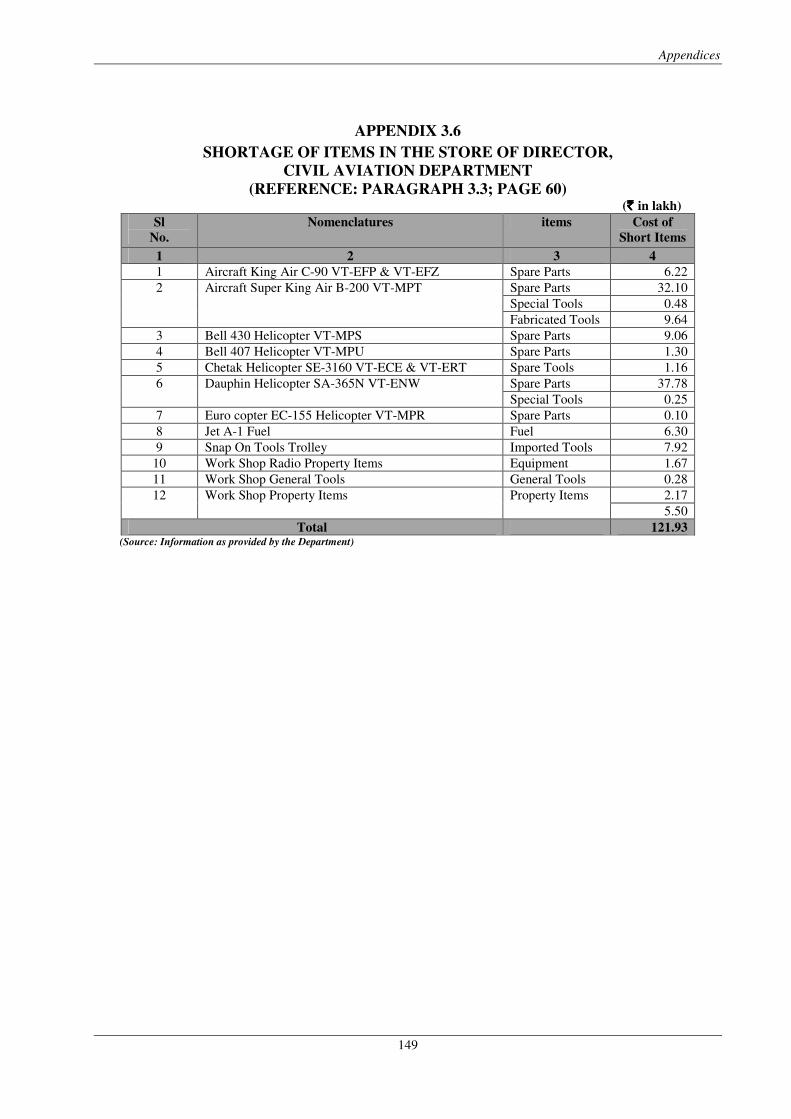
Appendices
149
APPENDIX 3.6
SHORTAGE OF ITEMS IN THE STORE OF DIRECTOR,
CIVIL AVIATION DEPARTMENT
(REFERENCE: PARAGRAPH 3.3; PAGE 60) (` ` ` ` in lakh)
Sl
No.
Nomenclatures items Cost of
Short Items
1 2 3 4
1 Aircraft King Air C-90 VT-EFP & VT-EFZ Spare Parts 6.22
2 Aircraft Super King Air B-200 VT-MPT Spare Parts 32.10
Special Tools 0.48
Fabricated Tools 9.64
3 Bell 430 Helicopter VT-MPS Spare Parts 9.06
4 Bell 407 Helicopter VT-MPU Spare Parts 1.30
5 Chetak Helicopter SE-3160 VT-ECE & VT-ERT Spare Tools 1.16
6 Dauphin Helicopter SA-365N VT-ENW Spare Parts 37.78
Special Tools 0.25
7 Euro copter EC-155 Helicopter VT-MPR Spare Parts 0.10
8 Jet A-1 Fuel Fuel 6.30
9 Snap On Tools Trolley Imported Tools 7.92
10 Work Shop Radio Property Items Equipment 1.67
11 Work Shop General Tools General Tools 0.28
12 Work Shop Property Items Property Items 2.17
5.50
Total 121.93 (Source: Information as provided by the Department)
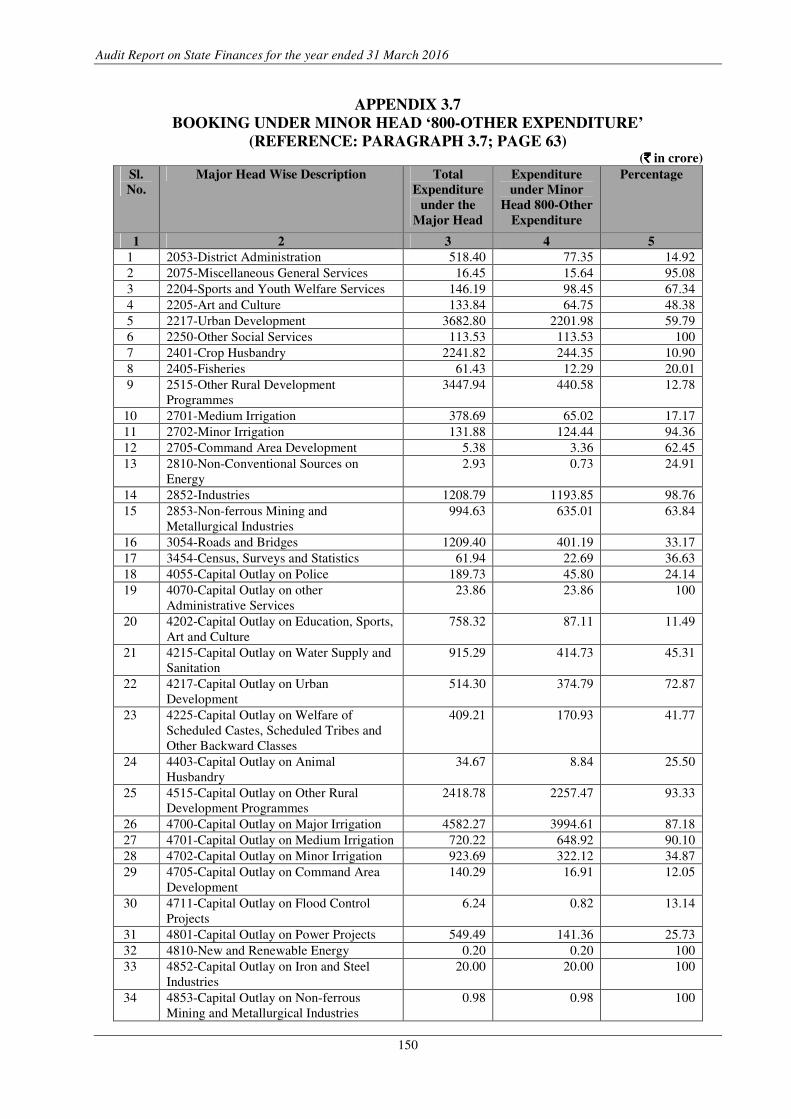
Audit Report on State Finances for the year ended 31 March 2016
150
APPENDIX 3.7
BOOKING UNDER MINOR HEAD ‘800-OTHER EXPENDITURE’
(REFERENCE: PARAGRAPH 3.7; PAGE 63) (`̀̀̀ in crore)
Sl.
No.
Major Head Wise Description Total
Expenditure
under the
Major Head
Expenditure
under Minor
Head 800-Other
Expenditure
Percentage
1 2 3 4 5
1 2053-District Administration 518.40 77.35 14.92
2 2075-Miscellaneous General Services 16.45 15.64 95.08
3 2204-Sports and Youth Welfare Services 146.19 98.45 67.34
4 2205-Art and Culture 133.84 64.75 48.38
5 2217-Urban Development 3682.80 2201.98 59.79
6 2250-Other Social Services 113.53 113.53 100
7 2401-Crop Husbandry 2241.82 244.35 10.90
8 2405-Fisheries 61.43 12.29 20.01
9 2515-Other Rural Development
Programmes
3447.94 440.58 12.78
10 2701-Medium Irrigation 378.69 65.02 17.17
11 2702-Minor Irrigation 131.88 124.44 94.36
12 2705-Command Area Development 5.38 3.36 62.45
13 2810-Non-Conventional Sources on
Energy
2.93 0.73 24.91
14 2852-Industries 1208.79 1193.85 98.76
15 2853-Non-ferrous Mining and
Metallurgical Industries
994.63 635.01 63.84
16 3054-Roads and Bridges 1209.40 401.19 33.17
17 3454-Census, Surveys and Statistics 61.94 22.69 36.63
18 4055-Capital Outlay on Police 189.73 45.80 24.14
19 4070-Capital Outlay on other
Administrative Services
23.86 23.86 100
20 4202-Capital Outlay on Education, Sports,
Art and Culture
758.32 87.11 11.49
21 4215-Capital Outlay on Water Supply and
Sanitation
915.29 414.73 45.31
22 4217-Capital Outlay on Urban
Development
514.30 374.79 72.87
23 4225-Capital Outlay on Welfare of
Scheduled Castes, Scheduled Tribes and
Other Backward Classes
409.21 170.93 41.77
24 4403-Capital Outlay on Animal
Husbandry
34.67 8.84 25.50
25 4515-Capital Outlay on Other Rural
Development Programmes
2418.78 2257.47 93.33
26 4700-Capital Outlay on Major Irrigation 4582.27 3994.61 87.18
27 4701-Capital Outlay on Medium Irrigation 720.22 648.92 90.10
28 4702-Capital Outlay on Minor Irrigation 923.69 322.12 34.87
29 4705-Capital Outlay on Command Area
Development
140.29 16.91 12.05
30 4711-Capital Outlay on Flood Control
Projects
6.24 0.82 13.14
31 4801-Capital Outlay on Power Projects 549.49 141.36 25.73
32 4810-New and Renewable Energy 0.20 0.20 100
33 4852-Capital Outlay on Iron and Steel
Industries
20.00 20.00 100
34 4853-Capital Outlay on Non-ferrous
Mining and Metallurgical Industries
0.98 0.98 100
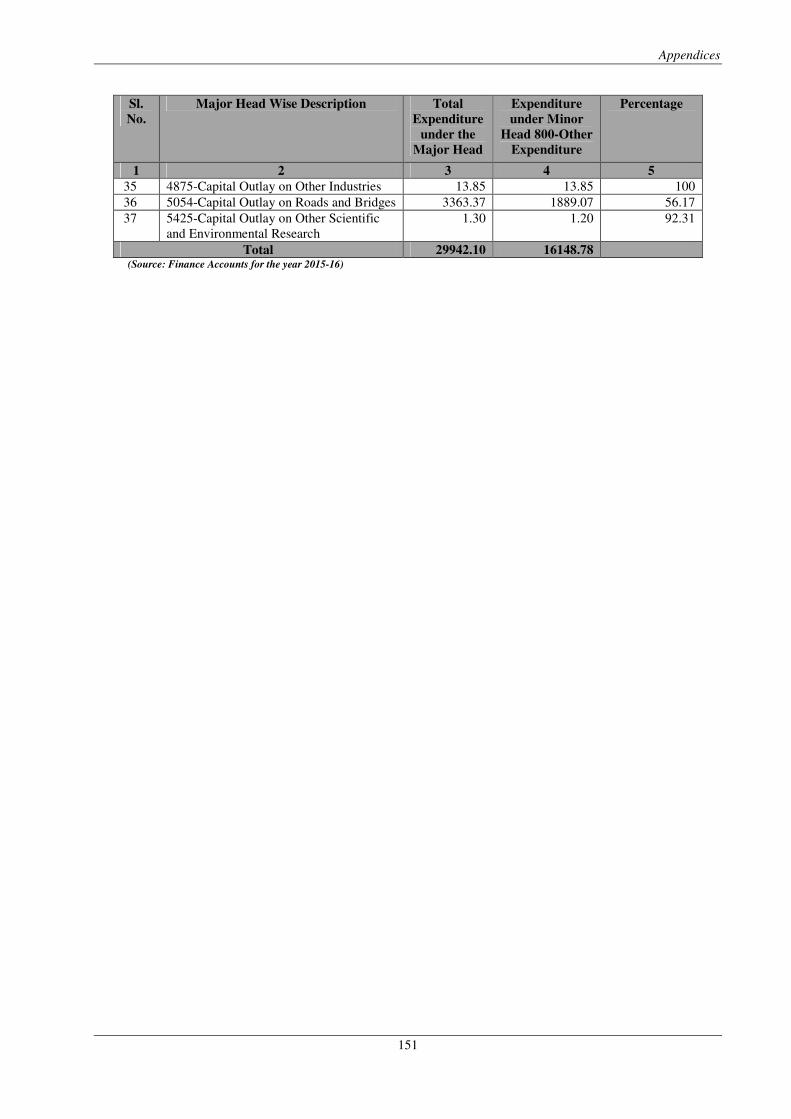
Appendices
151
Sl.
No.
Major Head Wise Description Total
Expenditure
under the
Major Head
Expenditure
under Minor
Head 800-Other
Expenditure
Percentage
1 2 3 4 5
35 4875-Capital Outlay on Other Industries 13.85 13.85 100
36 5054-Capital Outlay on Roads and Bridges 3363.37 1889.07 56.17
37 5425-Capital Outlay on Other Scientific
and Environmental Research
1.30 1.20 92.31
Total 29942.10 16148.78 (Source: Finance Accounts for the year 2015-16)
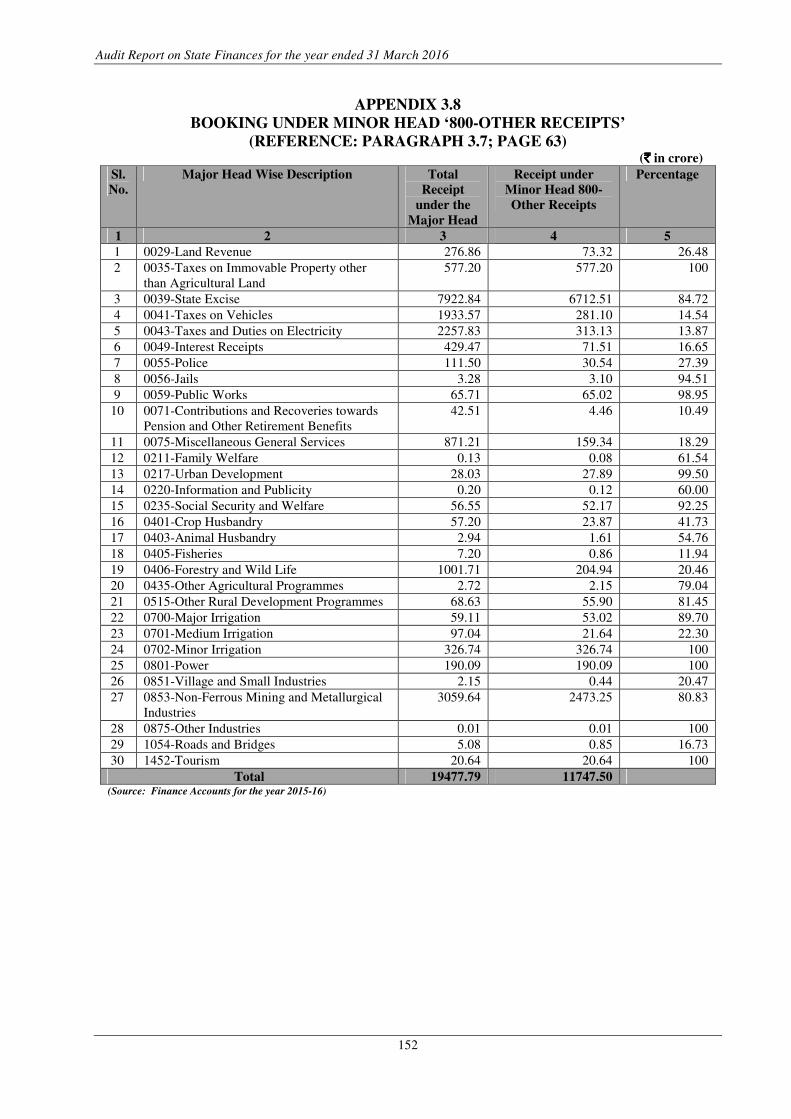
Audit Report on State Finances for the year ended 31 March 2016
152
APPENDIX 3.8
BOOKING UNDER MINOR HEAD ‘800-OTHER RECEIPTS’
(REFERENCE: PARAGRAPH 3.7; PAGE 63) (`̀̀̀ in crore)
Sl.
No.
Major Head Wise Description Total
Receipt
under the
Major Head
Receipt under
Minor Head 800-
Other Receipts
Percentage
1 2 3 4 5
1 0029-Land Revenue 276.86 73.32 26.48
2 0035-Taxes on Immovable Property other
than Agricultural Land
577.20 577.20 100
3 0039-State Excise 7922.84 6712.51 84.72
4 0041-Taxes on Vehicles 1933.57 281.10 14.54
5 0043-Taxes and Duties on Electricity 2257.83 313.13 13.87
6 0049-Interest Receipts 429.47 71.51 16.65
7 0055-Police 111.50 30.54 27.39
8 0056-Jails 3.28 3.10 94.51
9 0059-Public Works 65.71 65.02 98.95
10 0071-Contributions and Recoveries towards
Pension and Other Retirement Benefits
42.51 4.46 10.49
11 0075-Miscellaneous General Services 871.21 159.34 18.29
12 0211-Family Welfare 0.13 0.08 61.54
13 0217-Urban Development 28.03 27.89 99.50
14 0220-Information and Publicity 0.20 0.12 60.00
15 0235-Social Security and Welfare 56.55 52.17 92.25
16 0401-Crop Husbandry 57.20 23.87 41.73
17 0403-Animal Husbandry 2.94 1.61 54.76
18 0405-Fisheries 7.20 0.86 11.94
19 0406-Forestry and Wild Life 1001.71 204.94 20.46
20 0435-Other Agricultural Programmes 2.72 2.15 79.04
21 0515-Other Rural Development Programmes 68.63 55.90 81.45
22 0700-Major Irrigation 59.11 53.02 89.70
23 0701-Medium Irrigation 97.04 21.64 22.30
24 0702-Minor Irrigation 326.74 326.74 100
25 0801-Power 190.09 190.09 100
26 0851-Village and Small Industries 2.15 0.44 20.47
27 0853-Non-Ferrous Mining and Metallurgical
Industries
3059.64 2473.25 80.83
28 0875-Other Industries 0.01 0.01 100
29 1054-Roads and Bridges 5.08 0.85 16.73
30 1452-Tourism 20.64 20.64 100
Total 19477.79 11747.50 (Source: Finance Accounts for the year 2015-16)
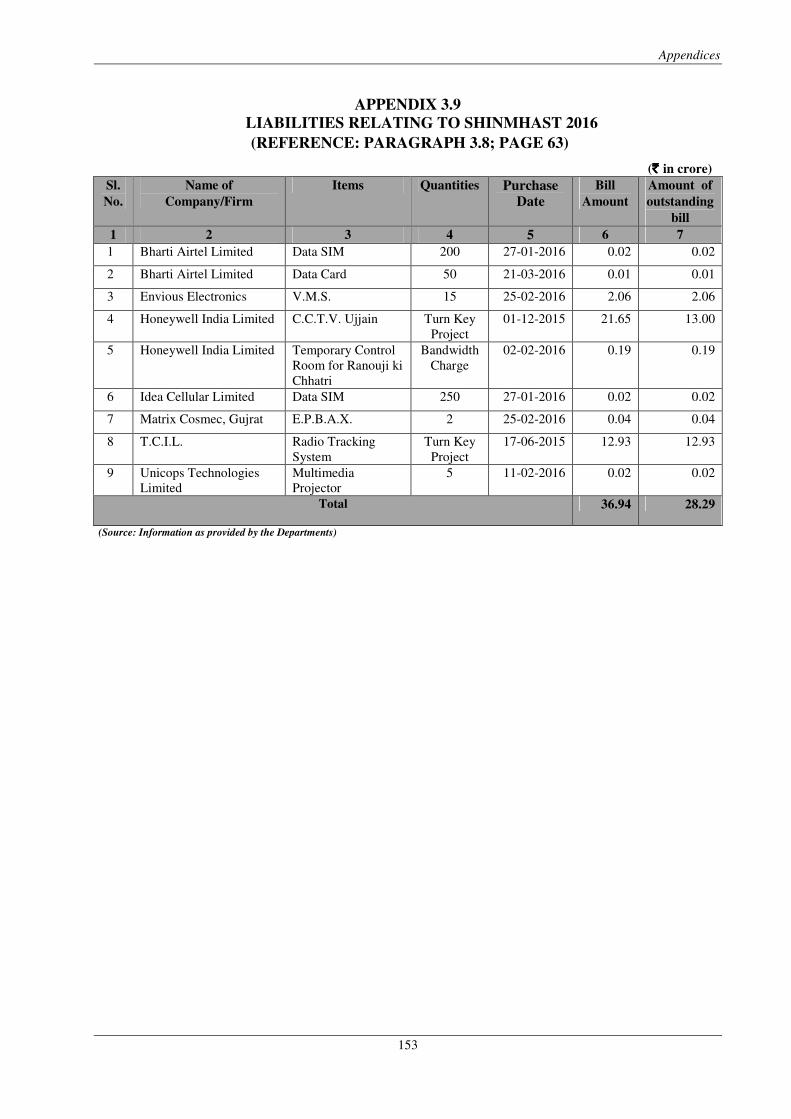
Appendices
153
APPENDIX 3.9
LIABILITIES RELATING TO SHINMHAST 2016
(REFERENCE: PARAGRAPH 3.8; PAGE 63)
(` ` ` ` in crore)
Sl.
No.
Name of
Company/Firm
Items Quantities Purchase
Date
Bill
Amount
Amount of
outstanding
bill
1 2 3 4 5 6 7
1 Bharti Airtel Limited Data SIM 200 27-01-2016 0.02 0.02
2 Bharti Airtel Limited Data Card 50 21-03-2016 0.01 0.01
3 Envious Electronics V.M.S. 15 25-02-2016 2.06 2.06
4 Honeywell India Limited C.C.T.V. Ujjain
Turn Key
Project
01-12-2015 21.65 13.00
5 Honeywell India Limited Temporary Control
Room for Ranouji ki
Chhatri
Bandwidth
Charge
02-02-2016 0.19 0.19
6 Idea Cellular Limited Data SIM 250 27-01-2016 0.02 0.02
7 Matrix Cosmec, Gujrat E.P.B.A.X. 2 25-02-2016 0.04 0.04
8 T.C.I.L. Radio Tracking
System
Turn Key
Project
17-06-2015 12.93 12.93
9 Unicops Technologies
Limited
Multimedia
Projector
5 11-02-2016 0.02 0.02
Total 36.94 28.29
(Source: Information as provided by the Departments)
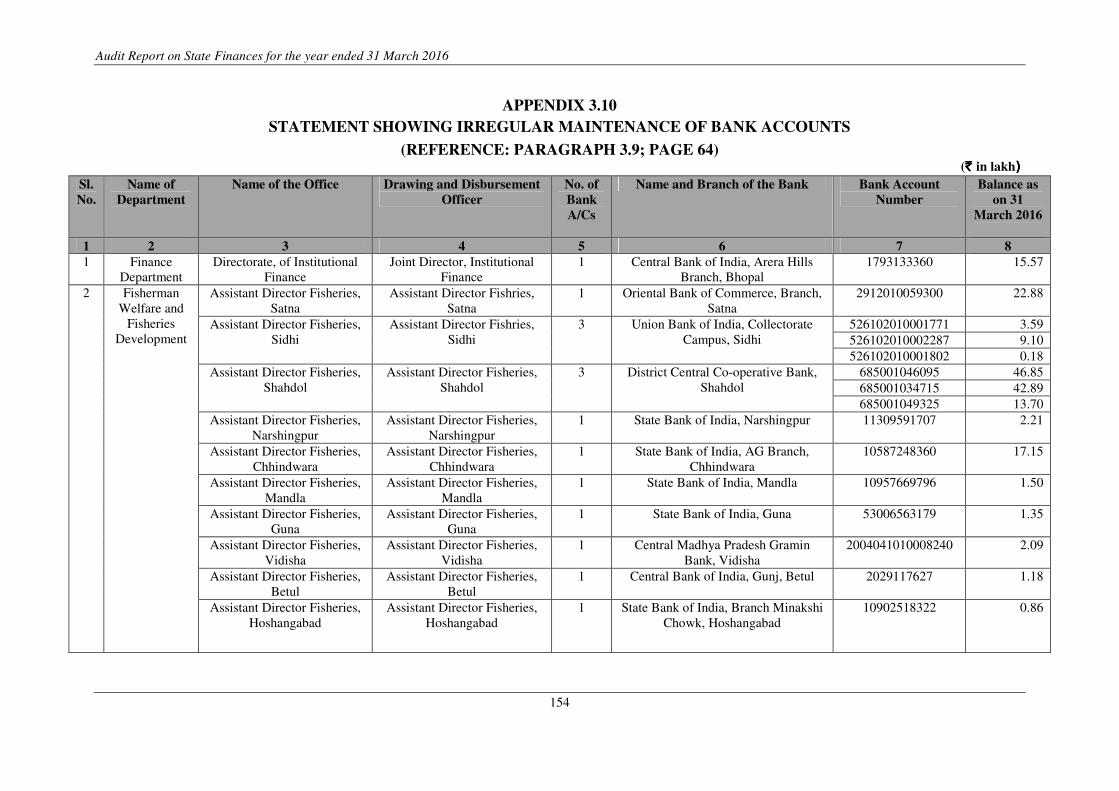
Audit Report on State Finances for the year ended 31 March 2016
154
APPENDIX 3.10
STATEMENT SHOWING IRREGULAR MAINTENANCE OF BANK ACCOUNTS
(REFERENCE: PARAGRAPH 3.9; PAGE 64) (` ` ` ` in lakh))))
Sl.
No.
Name of
Department
Name of the Office Drawing and Disbursement
Officer
No. of
Bank
A/Cs
Name and Branch of the Bank Bank Account
Number
Balance as
on 31
March 2016
1 2 3 4 5 6 7 8
1 Finance
Department
Directorate, of Institutional
Finance
Joint Director, Institutional
Finance
1 Central Bank of India, Arera Hills
Branch, Bhopal
1793133360 15.57
2 Fisherman
Welfare and
Fisheries
Development
Assistant Director Fisheries,
Satna
Assistant Director Fishries,
Satna
1 Oriental Bank of Commerce, Branch,
Satna
2912010059300 22.88
Assistant Director Fisheries,
Sidhi
Assistant Director Fishries,
Sidhi
3 Union Bank of India, Collectorate
Campus, Sidhi
526102010001771 3.59
526102010002287 9.10
526102010001802 0.18
Assistant Director Fisheries,
Shahdol
Assistant Director Fisheries,
Shahdol
3 District Central Co-operative Bank,
Shahdol
685001046095 46.85
685001034715 42.89
685001049325 13.70
Assistant Director Fisheries,
Narshingpur
Assistant Director Fisheries,
Narshingpur
1 State Bank of India, Narshingpur 11309591707 2.21
Assistant Director Fisheries,
Chhindwara
Assistant Director Fisheries,
Chhindwara
1 State Bank of India, AG Branch,
Chhindwara
10587248360 17.15
Assistant Director Fisheries,
Mandla
Assistant Director Fisheries,
Mandla
1 State Bank of India, Mandla 10957669796 1.50
Assistant Director Fisheries,
Guna
Assistant Director Fisheries,
Guna
1 State Bank of India, Guna 53006563179 1.35
Assistant Director Fisheries,
Vidisha
Assistant Director Fisheries,
Vidisha
1 Central Madhya Pradesh Gramin
Bank, Vidisha
2004041010008240 2.09
Assistant Director Fisheries,
Betul
Assistant Director Fisheries,
Betul
1 Central Bank of India, Gunj, Betul 2029117627 1.18
Assistant Director Fisheries,
Hoshangabad
Assistant Director Fisheries,
Hoshangabad
1 State Bank of India, Branch Minakshi
Chowk, Hoshangabad
10902518322 0.86
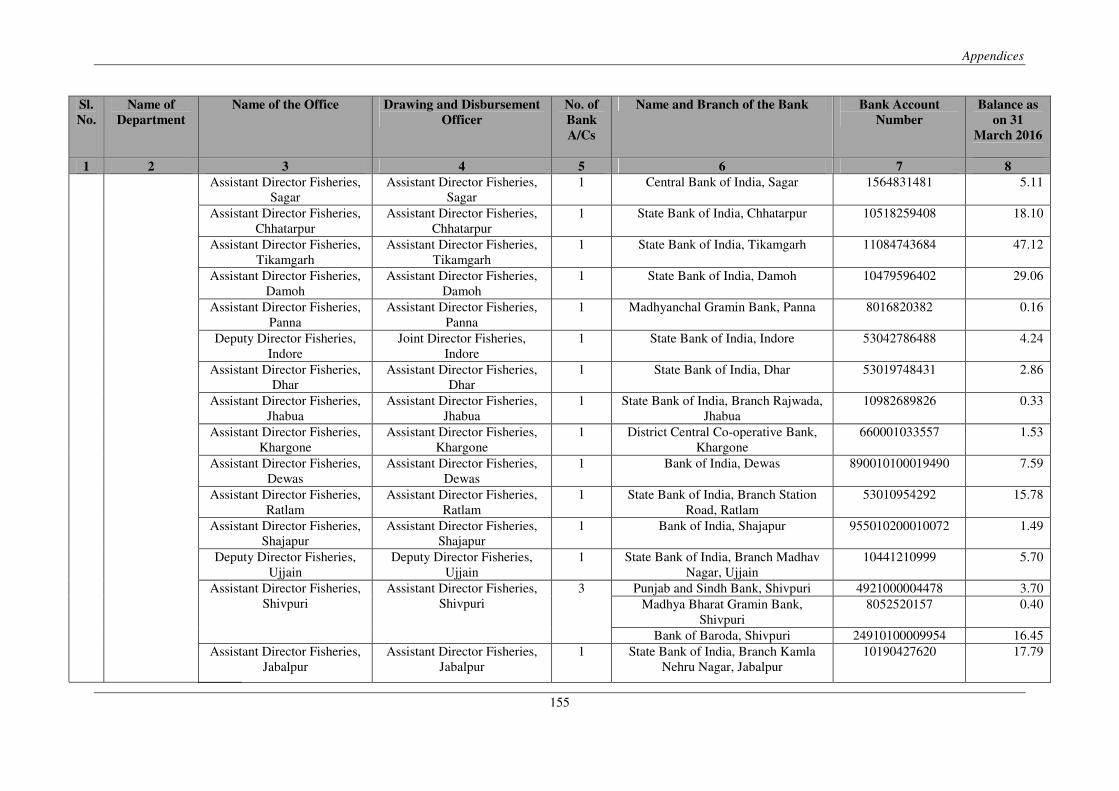
Appendices
155
Sl.
No.
Name of
Department
Name of the Office Drawing and Disbursement
Officer
No. of
Bank
A/Cs
Name and Branch of the Bank Bank Account
Number
Balance as
on 31
March 2016
1 2 3 4 5 6 7 8
Assistant Director Fisheries,
Sagar
Assistant Director Fisheries,
Sagar
1 Central Bank of India, Sagar 1564831481 5.11
Assistant Director Fisheries,
Chhatarpur
Assistant Director Fisheries,
Chhatarpur
1 State Bank of India, Chhatarpur 10518259408 18.10
Assistant Director Fisheries,
Tikamgarh
Assistant Director Fisheries,
Tikamgarh
1 State Bank of India, Tikamgarh 11084743684 47.12
Assistant Director Fisheries,
Damoh
Assistant Director Fisheries,
Damoh
1 State Bank of India, Damoh 10479596402 29.06
Assistant Director Fisheries,
Panna
Assistant Director Fisheries,
Panna
1 Madhyanchal Gramin Bank, Panna 8016820382 0.16
Deputy Director Fisheries,
Indore
Joint Director Fisheries,
Indore
1 State Bank of India, Indore 53042786488 4.24
Assistant Director Fisheries,
Dhar
Assistant Director Fisheries,
Dhar
1 State Bank of India, Dhar 53019748431 2.86
Assistant Director Fisheries,
Jhabua
Assistant Director Fisheries,
Jhabua
1 State Bank of India, Branch Rajwada,
Jhabua
10982689826 0.33
Assistant Director Fisheries,
Khargone
Assistant Director Fisheries,
Khargone
1 District Central Co-operative Bank,
Khargone
660001033557 1.53
Assistant Director Fisheries,
Dewas
Assistant Director Fisheries,
Dewas
1 Bank of India, Dewas 890010100019490 7.59
Assistant Director Fisheries,
Ratlam
Assistant Director Fisheries,
Ratlam
1 State Bank of India, Branch Station
Road, Ratlam
53010954292 15.78
Assistant Director Fisheries,
Shajapur
Assistant Director Fisheries,
Shajapur
1 Bank of India, Shajapur 955010200010072 1.49
Deputy Director Fisheries,
Ujjain
Deputy Director Fisheries,
Ujjain
1 State Bank of India, Branch Madhav
Nagar, Ujjain
10441210999 5.70
Assistant Director Fisheries,
Shivpuri
Assistant Director Fisheries,
Shivpuri
3 Punjab and Sindh Bank, Shivpuri 4921000004478 3.70
Madhya Bharat Gramin Bank,
Shivpuri
8052520157 0.40
Bank of Baroda, Shivpuri 24910100009954 16.45
Assistant Director Fisheries,
Jabalpur
Assistant Director Fisheries,
Jabalpur
1 State Bank of India, Branch Kamla
Nehru Nagar, Jabalpur
10190427620 17.79
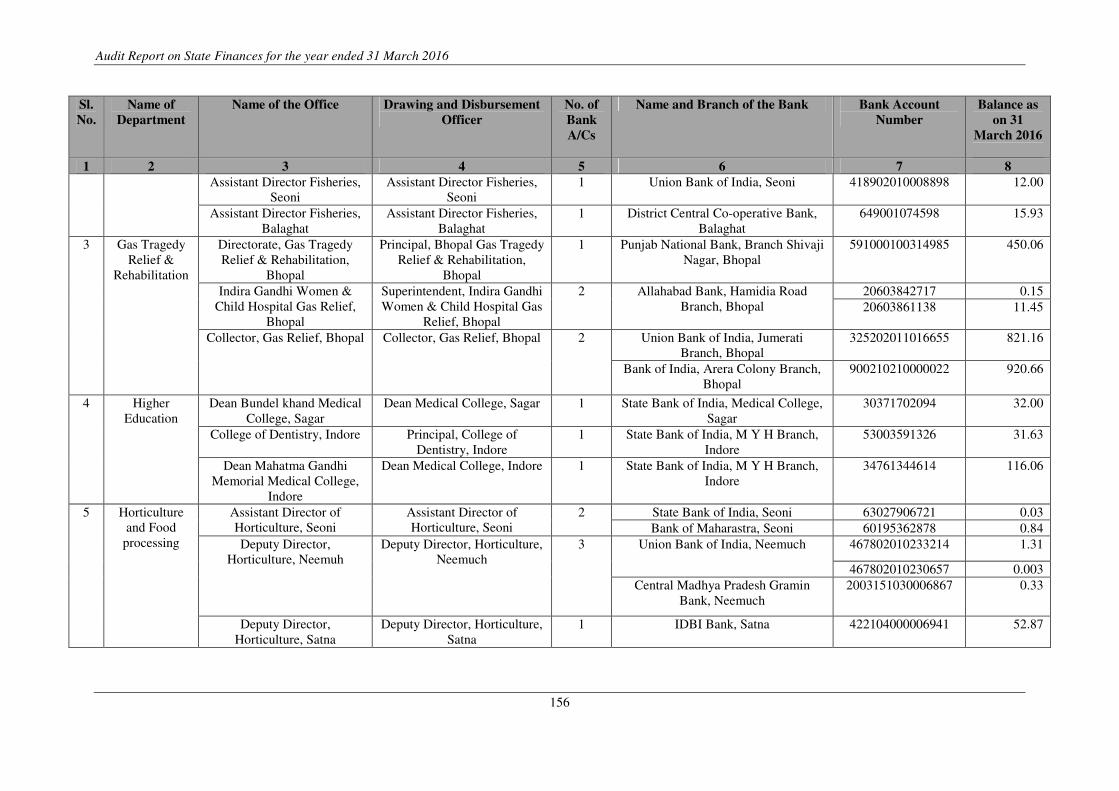
Audit Report on State Finances for the year ended 31 March 2016
156
Sl.
No.
Name of
Department
Name of the Office Drawing and Disbursement
Officer
No. of
Bank
A/Cs
Name and Branch of the Bank Bank Account
Number
Balance as
on 31
March 2016
1 2 3 4 5 6 7 8
Assistant Director Fisheries,
Seoni
Assistant Director Fisheries,
Seoni
1 Union Bank of India, Seoni 418902010008898 12.00
Assistant Director Fisheries,
Balaghat
Assistant Director Fisheries,
Balaghat
1 District Central Co-operative Bank,
Balaghat
649001074598 15.93
3 Gas Tragedy
Relief &
Rehabilitation
Directorate, Gas Tragedy
Relief & Rehabilitation,
Bhopal
Principal, Bhopal Gas Tragedy
Relief & Rehabilitation,
Bhopal
1 Punjab National Bank, Branch Shivaji
Nagar, Bhopal
591000100314985 450.06
Indira Gandhi Women &
Child Hospital Gas Relief,
Bhopal
Superintendent, Indira Gandhi
Women & Child Hospital Gas
Relief, Bhopal
2 Allahabad Bank, Hamidia Road
Branch, Bhopal
20603842717 0.15
20603861138 11.45
Collector, Gas Relief, Bhopal Collector, Gas Relief, Bhopal 2 Union Bank of India, Jumerati
Branch, Bhopal
325202011016655 821.16
Bank of India, Arera Colony Branch,
Bhopal
900210210000022 920.66
4 Higher
Education
Dean Bundel khand Medical
College, Sagar
Dean Medical College, Sagar 1 State Bank of India, Medical College,
Sagar
30371702094 32.00
College of Dentistry, Indore Principal, College of
Dentistry, Indore
1 State Bank of India, M Y H Branch,
Indore
53003591326 31.63
Dean Mahatma Gandhi
Memorial Medical College,
Indore
Dean Medical College, Indore 1 State Bank of India, M Y H Branch,
Indore
34761344614 116.06
5 Horticulture
and Food
processing
Assistant Director of
Horticulture, Seoni
Assistant Director of
Horticulture, Seoni
2 State Bank of India, Seoni 63027906721 0.03
Bank of Maharastra, Seoni 60195362878 0.84
Deputy Director,
Horticulture, Neemuh
Deputy Director, Horticulture,
Neemuch
3 Union Bank of India, Neemuch 467802010233214 1.31
467802010230657 0.003
Central Madhya Pradesh Gramin
Bank, Neemuch
2003151030006867 0.33
Deputy Director,
Horticulture, Satna
Deputy Director, Horticulture,
Satna
1 IDBI Bank, Satna 422104000006941 52.87
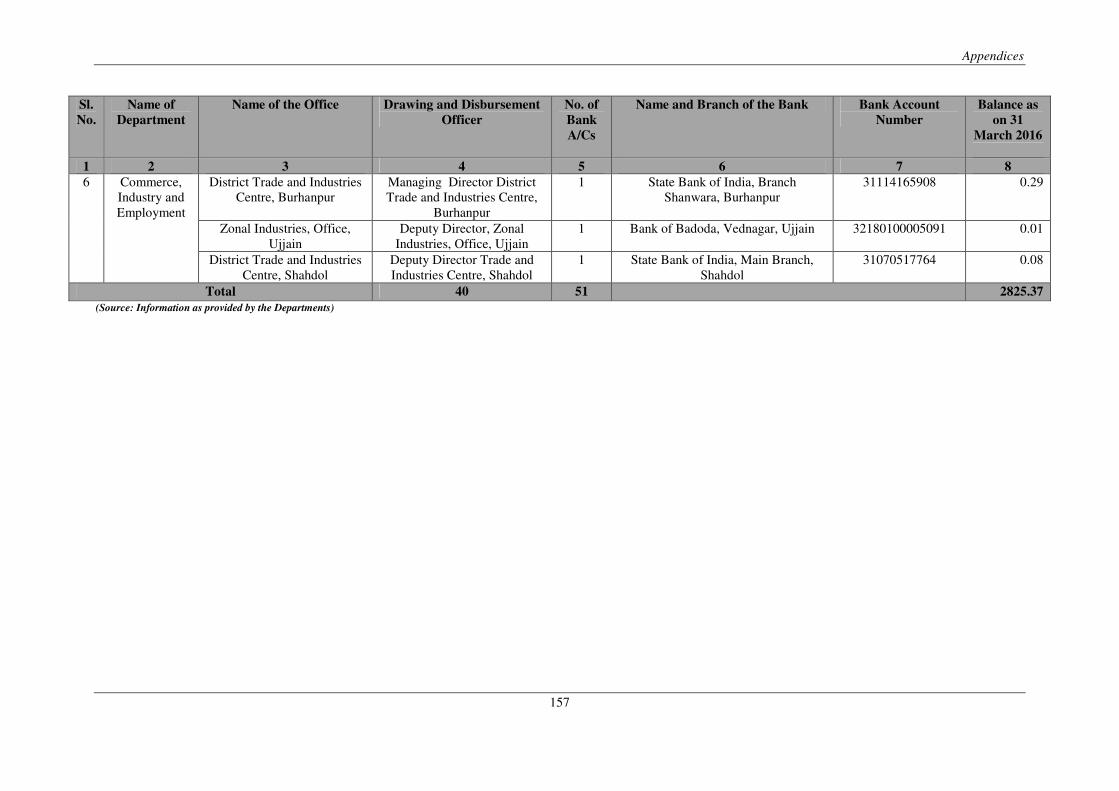
Appendices
157
Sl.
No.
Name of
Department
Name of the Office Drawing and Disbursement
Officer
No. of
Bank
A/Cs
Name and Branch of the Bank Bank Account
Number
Balance as
on 31
March 2016
1 2 3 4 5 6 7 8
6 Commerce,
Industry and
Employment
District Trade and Industries
Centre, Burhanpur
Managing Director District
Trade and Industries Centre,
Burhanpur
1 State Bank of India, Branch
Shanwara, Burhanpur
31114165908 0.29
Zonal Industries, Office,
Ujjain
Deputy Director, Zonal
Industries, Office, Ujjain
1 Bank of Badoda, Vednagar, Ujjain 32180100005091 0.01
District Trade and Industries
Centre, Shahdol
Deputy Director Trade and
Industries Centre, Shahdol
1 State Bank of India, Main Branch,
Shahdol
31070517764 0.08
Total 40 51 2825.37
(Source: Information as provided by the Departments)
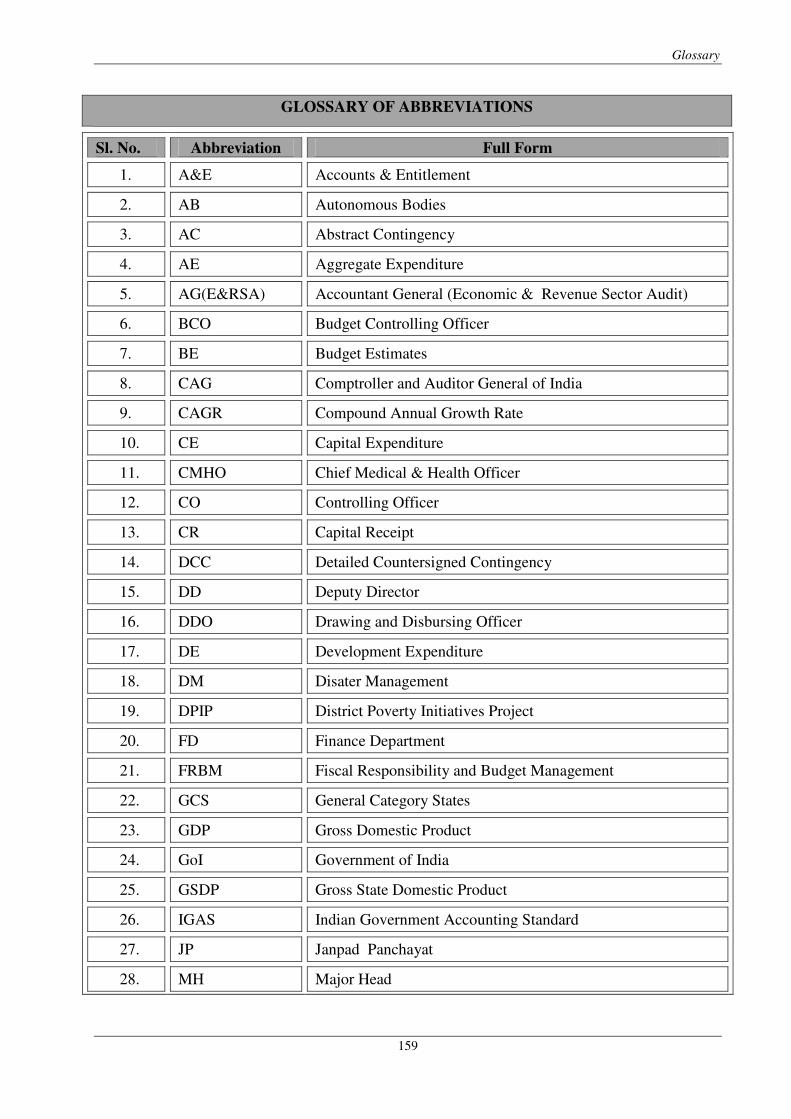
Glossary
159
GLOSSARY OF ABBREVIATIONS
Sl. No. Abbreviation Full Form
1. A&E Accounts & Entitlement
2. AB Autonomous Bodies
3. AC Abstract Contingency
4. AE Aggregate Expenditure
5. AG(E&RSA) Accountant General (Economic & Revenue Sector Audit)
6. BCO Budget Controlling Officer
7. BE Budget Estimates
8. CAG Comptroller and Auditor General of India
9. CAGR Compound Annual Growth Rate
10. CE Capital Expenditure
11. CMHO Chief Medical & Health Officer
12. CO Controlling Officer
13. CR Capital Receipt
14. DCC Detailed Countersigned Contingency
15. DD Deputy Director
16. DDO Drawing and Disbursing Officer
17. DE Development Expenditure
18. DM Disater Management
19. DPIP District Poverty Initiatives Project
20. FD Finance Department
21. FRBM Fiscal Responsibility and Budget Management
22. GCS General Category States
23. GDP Gross Domestic Product
24. GoI Government of India
25. GSDP Gross State Domestic Product
26. IGAS Indian Government Accounting Standard
27. JP Janpad Panchayat
28. MH Major Head
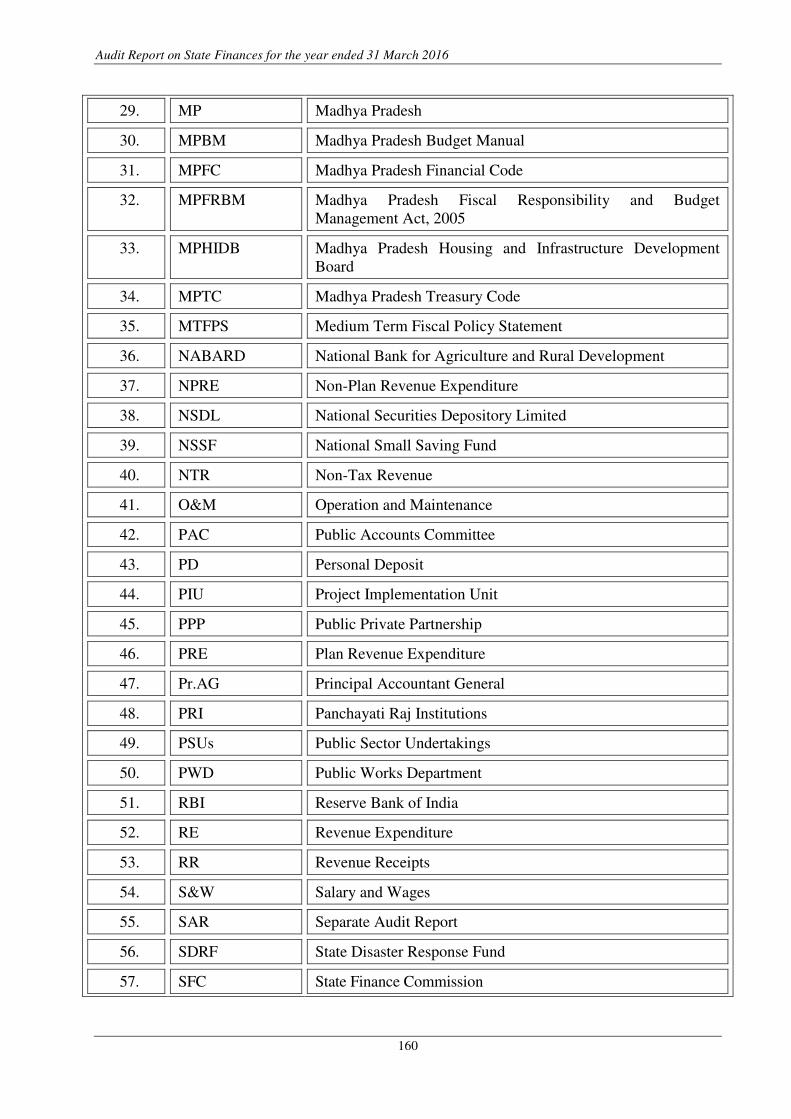
Audit Report on State Finances for the year ended 31 March 2016
160
29. MP Madhya Pradesh
30. MPBM Madhya Pradesh Budget Manual
31. MPFC Madhya Pradesh Financial Code
32. MPFRBM Madhya Pradesh Fiscal Responsibility and Budget
Management Act, 2005
33. MPHIDB Madhya Pradesh Housing and Infrastructure Development
Board
34. MPTC Madhya Pradesh Treasury Code
35. MTFPS Medium Term Fiscal Policy Statement
36. NABARD National Bank for Agriculture and Rural Development
37. NPRE Non-Plan Revenue Expenditure
38. NSDL National Securities Depository Limited
39. NSSF National Small Saving Fund
40. NTR Non-Tax Revenue
41. O&M Operation and Maintenance
42. PAC Public Accounts Committee
43. PD Personal Deposit
44. PIU Project Implementation Unit
45. PPP Public Private Partnership
46. PRE Plan Revenue Expenditure
47. Pr.AG Principal Accountant General
48. PRI Panchayati Raj Institutions
49. PSUs Public Sector Undertakings
50. PWD Public Works Department
51. RBI Reserve Bank of India
52. RE Revenue Expenditure
53. RR Revenue Receipts
54. S&W Salary and Wages
55. SAR Separate Audit Report
56. SDRF State Disaster Response Fund
57. SFC State Finance Commission
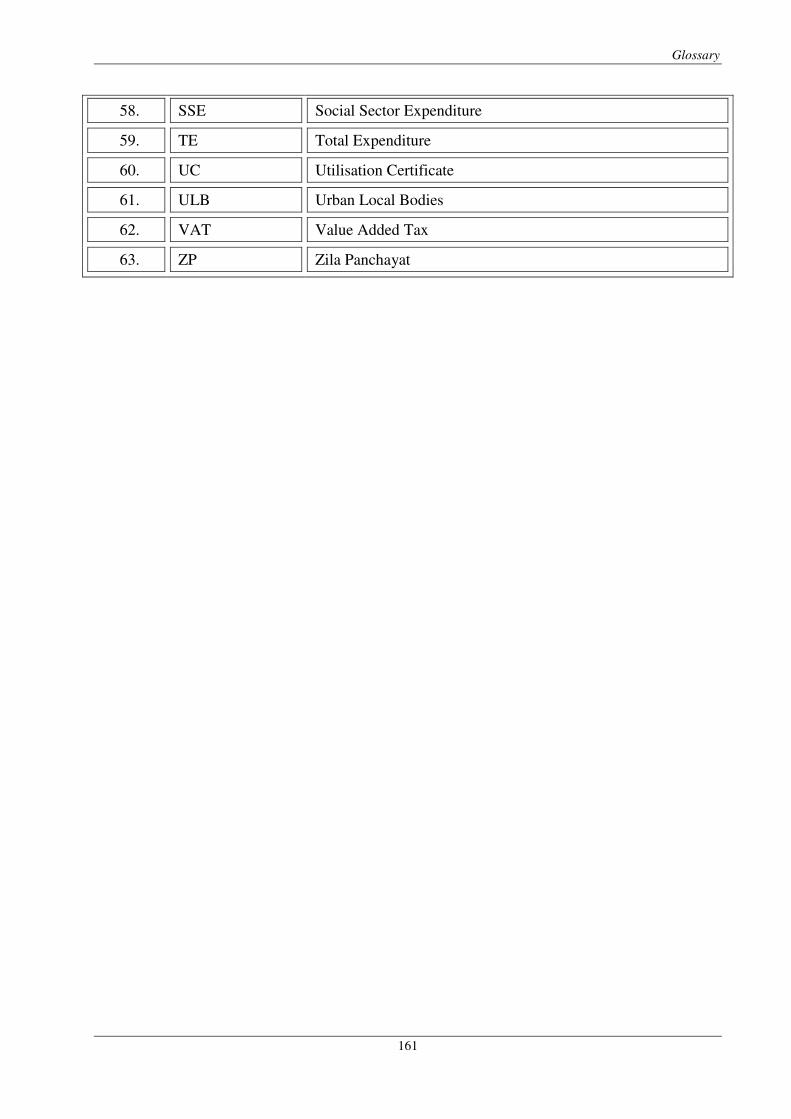
Glossary
161
58. SSE Social Sector Expenditure
59. TE Total Expenditure
60. UC Utilisation Certificate
61. ULB Urban Local Bodies
62. VAT Value Added Tax
63. ZP Zila Panchayat


![[1 Family Pension] - Comptroller and Auditor General of India](https://img.pdfslide.net/doc/110x75/615a061d7147f407e647de30/1-family-pension-comptroller-and-auditor-general-of-india.jpg)