Embed Size (px)
Citation preview

Report of the
Comptroller and Auditor General of India Compliance Audit
for the year ended March 2020
Government of Tamil Nadu Report No. 3 of 2021
लोकिहताथ स यिन ा Dedicated to Truth in Public Interest

Report of the Comptroller and Auditor General of India
Compliance Audit
for the year ended March 2020
Government of Tamil Nadu Report No. 3 of 2021

i
TABLE OF CONTENTS
Paragraph Page
Preface v
Overview vii
CHAPTER I – INTRODUCTION
About this Report 1.1 1
Profile of Audited Entities 1.2 1
Authority for Audit 1.3 2
Planning and conduct of Audit 1.4 3
Response to Audit 1.5 3
Recommendations 1.6 3
Follow-up on Audit Reports 1.7 4
CHAPTER II – SPECIFIC AREA COMPLIANCE AUDIT
HIGHER EDUCATION DEPARTMENT
Outcomes in Higher Education 2.1 5
CHAPTER III - COMPLIANCE AUDIT
Avoidable/Unfruitful expenditure 3.1
HEALTH AND FAMILY WELFARE
Unfruitful expenditure on revival of Anti Snake Venom Serum manufacturing unit
3.1.1 61
RURAL DEVELOPMENT AND PANCHAYAT RAJ DEPARTMENT
Unfruitful expenditure on purchase of bio-digester tanks
3.1.2 65
AGRICULTURE DEPARTMENT
Non-recovery of misused subsidy 3.1.3 69

Audit Report (Compliance Audit), Tamil Nadu for the year ended March 2020
ii
Paragraph Page
Loss/Short collection of revenue 3.2
REVENUE AND DISASTER MANAGEMENT DEPARTMENT
Encroachment of Government land and short collection of revenue
3.2.1 71
Blocking of funds/Idle investments 3.3
RURAL DEVELOPMENT AND PANCHAYAT RAJ DEPARTMENT GANDARVAKOTTAI PANCHAYAT UNION
Unfruitful expenditure on construction of a new bus stand
3.3.1 75
SINGAMPUNARI PANCHAYAT UNION
Idling of houses and related infrastructure 3.3.2 78
NATHAM PANCHAYAT UNION
Idling of a newly constructed Community hall 3.3.3 82
SOCIAL WELFARE AND NUTRITIOUS MEAL PROGRAMME DEPARTMENT CHILD DEVELOPMENT PROJECT OFFICES
Unjustified purchase of Aadhaar enrolment kits 3.3.4 85
Regularity issues 3.4
ADI DRAVIDAR AND TRIBAL WELFARE DEPARTMENT
Payment of scholarship to ineligible students 3.4.1 87
Inadmissible excess reimbursement of fees to private schools
3.4.2 89

Table of Contents
iii
APPENDICES
Appendix No.
Details Page No.
1.1 Department-wise details of outstanding Inspection Reports and Paragraphs
93
2.1 Audit criteria 94
2.2 Sampled colleges 95
2.3 Department-wise details of research projects undertaken during 2014-19
97
2.4 Details of reduction in intake capacity of PG programmes during 2014-19 in University of Madras
101
2.5 Details of unserviceable equipment 104
2.6 Non-compliance with affiliation norms 105
2.7 List of colleges wherein new programmes were started and intake increased pending approval by the University of Madras
106
2.8 List of colleges which started new programmes pending approval by Alagappa University
109
2.9 Financial position of sampled universities 110
3.1 Details of tractors found to be subsequently registered in the name of persons other than the beneficiaries under Components 3 and 4 of SMAM
111
3.2 Short collection of lease rent 112
3.3 Details of works done for Samathuvapuram at Kottaivengaipatti, Kannamangalapatti village, Singampunari PU, Sivagangai district
113
3.4 Details of HESS sanctioned to ineligible SC/ST students during 2017-20
114
3.5 Details of excess fees claimed by private schools during the Academic Years 2018-19 and 2019-20
115
Glossary of abbreviations 116

v
P R E F A C E
This Report for the year ended March 2020 has been prepared for submission to the Governor of Tamil Nadu under Article 151 of the Constitution of India.
The Report contains significant results of the Specific area Compliance Audit and Compliance Audit of the departments of the Government of Tamil Nadu under the audit purview of Principal Accountant General (Audit-I), Tamil Nadu, Chennai, which included the departments of Adi Dravidar and Tribal Welfare, Agriculture, Health & Family Welfare, Higher Education, Revenue & Disaster Management, Rural Development and Panchayat Raj, School Education and Social Welfare & Nutritious Meal Programme.
The instances mentioned in this Report are those, which came to notice in the course of test audit for the period 2019-20 as well as those which came to notice in earlier years but could not be reported in the previous Audit Reports; instances relating to the period subsequent to 2019-20 have also been included, wherever necessary.
The audit has been conducted in conformity with the Auditing Standards issued by the Comptroller and Auditor General of India.
v

OVERVIEW


vii
OVERVIEW
This Report contains a Specific area Compliance Audit of Outcomes in Higher Education and 10 compliance audit paragraphs.
Specific area Compliance Audit of ‘Outcomes in Higher Education’
Higher education is passing through a phase of unprecedented expansion in terms of number of students and number of higher education institutions (HEI). Higher education includes both general streams and professional or technical streams. Government of Tamil Nadu (GoTN) seeks to provide equitable access to good quality higher education.
The present Specific area Compliance Audit attempts to ascertain the outcomes of higher education in general stream in the State, in terms of its contribution to employability and research, the level of equitable access to quality higher education, and the adequacy and effectiveness of governance and management structures. The Audit focused on the role played by GoTN and four sampled universities towards the fulfilment of these objectives.
The State performed well in student enrolment, pass percentage, access and affordability. Audit, however, found issues mainly with student-faculty ratio in colleges, valuation of answer papers, poor research output, regional disparity in access and ineffective functioning of governance structures.
Student-Faculty Ratio (SFR) is a determinant of quality in higher education. Significant delays in recruitment of regular teaching staff for Government colleges resulted in colleges being run with low number of regular faculty members, and thereby having an adverse impact on the quality of education imparted.
(Paragraph 2.1.6) Large number of revaluation requests and change of marks after
revaluation cast doubt on the efficiency of answer sheet evaluation system. The moderation exercise and award of grace marks lacked transparency in the absence of any guidelines.
(Paragraph 2.1.7) Only a handful of university departments were active in research.
Majority had poor or nil research output. Further, the sampled universities largely depended on research grants from Government of India for carrying out research.
(Paragraph 2.1.8) The State has a higher college density than the all India average.
However, regional disparity within the State is a matter of concern as 14 districts have lower college density than the all India average.
(Paragraph 2.1.9.1)

Audit Report (Compliance Audit), Tamil Nadu for the year ended March 2020
viii
The Gross Enrolment Rate (GER) of SC and ST students was much below the State’s overall GER.
(Paragraph 2.1.9.2) The autonomous bodies charged with the responsibility of
Governance of higher education at State level were not active in discharging their roles.
(Paragraph 2.1.10.1) The University of Madras, the oldest in the State, continues to face
financial crisis due to mismanagement and inadequate financial support from GoTN. As a result, funds meant for research and development activities were diverted for salaries and regular non-plan expenditure.
(Paragraph 2.1.10.7)
Compliance Audit Paragraphs
Launching a project at King Institute of Preventive Medicine, Chennai, to revive Anti Snake Venom Serum manufacturing, without comprehensive technical and financial feasibility study and ensuring source of funding, resulted in unfruitful expenditure of ` 16.77 crore.
(Paragraph 3.1.1)
Poor planning and implementation of installation of bio-digester/bio-tank toilets under Swachh Bharat Mission (Gramin), resulted in non-achievement of objective of improved sanitation in rural areas and also led to unfruitful expenditure of ` 4.44 crore.
(Paragraph 3.1.2)
Failure of the Agriculture Department to frame a comprehensive guideline and to enforce the existing guidelines resulted in misuse of subsidy of ` 3.01 crore, besides non-achievement of the intended objectives of agricultural mechanisation.
(Paragraph 3.1.3)
Failure of the Government and Revenue authorities to take timely action had resulted in unauthorised occupation of Government land worth ` 14.16 crore at Madurai, and short collection of revenue of ` 7.38 crore.
(Paragraph 3.2.1)
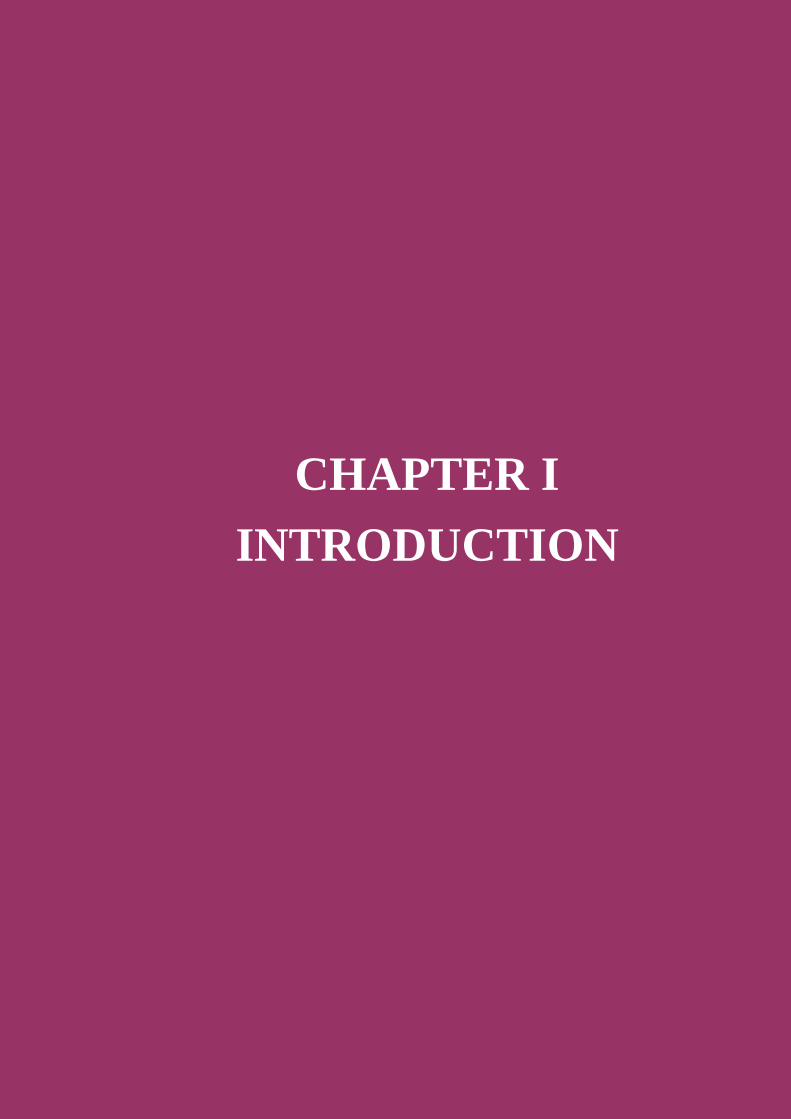
Failure to consult the local body and to acquire land for approach road before commencement of a bus stand project at Gandarvakottai in Pudukottai district, resulted in idling of the new bus stand constructed at a cost of ` 3.91 crore.
(Paragraph 3.3.1)

Overview
ix
Failure to select beneficiaries for Samathuvapuram housing scheme before commencement of construction, resulted in the idling of infrastructure created at a cost of ₹ 2.42 crore for over six years and consequent damage to the properties thus rendering them unfit for occupation.
(Paragraph 3.3.2)
Lack of comprehensive planning by Natham Panchayat Union in Dindigul district, leading to piecemeal construction, delay in obtaining electrical connection, non-provision of water supply and toilet facilities, etc., had resulted in idle investment of ₹ 84.46 lakh.
(Paragraph 3.3.3)
Failure to restrict the requirement for Aadhaar enrolment kits based on actual need of Child Development Project Offices had resulted in accessories of Aadhaar enrolment kits valuing ` 7.85 crore lying unutilised for more than two years.
(Paragraph 3.3.4)
Non-adherence to Government’s orders by the Director of Adi Dravidar Welfare and District Adi Dravidar and Tribal Welfare Officers had resulted in an inadmissible expenditure of ` 1.81 crore towards sanction of Higher Education Special Scholarship to ineligible students.
(Paragraph 3.4.1)
Non-adherence of Government’s orders by the Director of Adi Dravidar Welfare and failure of Government to check repeated violations had resulted in inadmissible excess reimbursement of fees to the tune of ` 1.62 crore to private schools.
(Paragraph 3.4.2)
CHAPTER I INTRODUCTION


1
CHAPTER I
INTRODUCTION
1.1 About this Report
This Report of the Comptroller and Auditor General of India (CAG) on Government of Tamil Nadu (GoTN) relates to matters arising from Specific area Compliance Audit of selected programmes and activities and Compliance Audit of Government departments, Autonomous Bodies and Panchayat Raj Institutions (PRIs) which come under the audit jurisdiction of the Principal Accountant General (Audit-I), Tamil Nadu.
The primary purpose of the Report is to bring important results of audit to the notice of the State Legislature. Auditing standards issued by the CAG require that the materiality level for reporting should be commensurate with the nature, volume and magnitude of transactions. The audit findings are expected to enable the Executive to take corrective actions as also to frame appropriate policies and directives that will lead to improved financial management of the organisations, thus, contributing to better governance.
Compliance Audit refers to examination of transactions relating to expenditure, receipts, assets and liabilities of audited entities to ascertain whether provisions of the Constitution of India, applicable laws, rules, regulations and various orders and instructions issued by the competent authorities are being complied with.
Specific area Compliance Audit examines the extent to which objectives of an organisation, programme or scheme are achieved economically, efficiently and effectively.
This Chapter provides profile of audited entities, planning and extent of audit and follow-up of Audit Reports. Chapter II of this Report deals with findings of Specific area Compliance Audit and Chapter III deals with findings of Compliance Audit of various departments, Autonomous Bodies and Local Bodies.
1.2 Profile of Audited Entities
There are 35 departments in the State at the Secretariat level, headed by Additional Chief Secretaries/Principal Secretaries/Secretaries who are assisted by Commissioners/Directors and Subordinate Officers in the field. Of these, 23 departments including 17 Public Sector Undertakings and 798 Autonomous Bodies/PRIs, falling under these departments, were under the audit jurisdiction of the Principal Accountant General (Audit-I), Tamil Nadu.
Abbreviations used in this report are listed in the Glossary at Page 116 Abbreviations used in this report are listed in the Glossary at Page 130

Audit Report (Compliance Audit), Tamil Nadu for the year ended March 2020
2
A comparative position of expenditure incurred by the Government during the year 2019-20 and in the preceding four years is given in Table 1.1.
Table 1.1: Comparative position of expenditure (` in crore)
Disbursements 2015-16 2016-17 2017-18 2018-19 2019-20
Revenue expenditure 1,40,993 1,53,195 1,67,874 1,97,200 2,10,435
General services 45,512 51,452 60,451 72,450 78,138
Social services 54,806 55,297 59,790 70,202 73,999
Economic services 29,943 33,980 36,162 39,669 42,610
Grants-in-aid and contributions 10,732 12,466 11,471 14,879 15,688
Capital expenditure 18,995 20,709 20,203 24,311 25,632
Loans and advances 2,331 26,046 6,517 6,478 4,022
Repayment of public debt 6,605 8,200 8,991 15,064 17,866
Contingency fund 19 Nil Nil 10 Nil
Public account 1,77,442 1,73,007 1,84,209 2,23,930 2,44,023
Total 3,46,385 3,81,157 3,87,794 4,66,993 5,01,978
(Source: Finance Accounts for the respective years)
1.3 Authority for Audit
The authority for audit by the CAG is derived from Articles 149 and 151 of the Constitution of India and the Comptroller and Auditor General’s (Duties, Powers and Conditions of Services) (DPC) Act, 1971. The CAG conducts audit of expenditure of the departments of GoTN under Section 131 of the CAG’s (DPC) Act. The CAG is the sole auditor in respect of one Autonomous Body which is audited under Section 19(2) 2 of the CAG’s (DPC) Act. Audit of Government companies is also conducted under Section 19(1) of the CAG’s (DPC) Act. In addition, the CAG conducts audit of PRIs and other Autonomous Bodies which are substantially funded by the State Government under Section 143 of the CAG’s (DPC) Act. The principles and methodologies for various audits are prescribed in the Regulations on Audit and Accounts (Amendments) 2020 and CAG’s Auditing Standards, 2017.
1 Audit of (i) all transactions from the Consolidated Fund of the State, (ii) all transactions
relating to the Contingency Fund and the Public Account and (iii) all trading, manufacturing, profit & loss accounts, balance sheets & other subsidiary accounts.
2 Audit of the accounts of Corporations (not being Companies) established by or under law made by the Parliament in accordance with the provisions of the respective legislations.
3 Audit of (i) all receipts and expenditure of a body/authority substantially financed by grants or loans from the Consolidated Fund of the State and (ii) all receipts and expenditure of any body or authority where the grants or loans to such body or authority from the Consolidated Fund of the State in a financial year is not less than ` 1 crore.

Chapter I - Introduction
3
1.4 Planning and conduct of Audit
Audit process starts with the risk assessment of the Departments/organisations as a whole and that of each unit based on expenditure incurred and its type, criticality/complexity of activities, level of delegated financial powers, assessment of internal controls, concerns of stakeholders and the likely impact of such risks. Previous audit findings are also considered in this exercise. Based on this risk assessment, the frequency and extent of audit are decided. An Annual Audit Plan is formulated to conduct audit on the basis of such risk assessment.
After completion of audit of units, Inspection Reports (IRs) containing audit findings are issued to the Heads of the audited entities. The entities are requested to furnish replies to the audit findings within one month of receipt of the IRs. Whenever replies are received, audit findings are either settled or further action for compliance is advised. Important audit observations pointed out in these IRs are processed for inclusion in the CAG’s Audit Reports, which are submitted to the Governor of Tamil Nadu under Article 151 of the Constitution of India for being laid before the State Legislature.
1.5 Response to Audit
1.5.1 Draft Paragraphs and Performance Audit (Specific area Compliance Audit)
One draft Performance Audit (Specific area Compliance Audit) and 10 draft Paragraphs were forwarded demi-officially to Additional Chief Secretaries/ Principal Secretaries/Secretaries of the departments concerned between September 2020 and February 2021, requesting them to furnish their responses within six weeks. Government replies for two draft Paragraphs were received. The replies received are suitably incorporated in the Report. Replies of Heads of Department and the views expressed by the representatives of the Government during Exit Conferences/Exit meetings were also considered while finalising the Report.
1.5.2 Pendency of Inspection Reports
A review of the IRs issued up to 30 September 2019 revealed that 4,346 IRs with 18,083 paragraphs remained outstanding for more than six months at the end of March 2020, as detailed in Appendix 1.1.
Large pendency of IRs was indicative of the fact that Heads of Offices and Heads of Departments did not initiate appropriate and adequate action to rectify the defects, omissions and irregularities pointed out in the IRs.
1.6 Recommendations
This Report contains specific recommendations on a number of issues involving non-observance of the prescribed internal procedure and systems, compliance with which would help in promoting good governance and better

Audit Report (Compliance Audit), Tamil Nadu for the year ended March 2020
4
oversight on implementation of departmental programmes and objectives at large. The State Government is requested to take cognizance of these recommendations and take appropriate action in a time bound manner.
1.7 Follow-up on Audit Reports
The Committee on Public Accounts of the Legislature prescribed a time limit of two months from the date of placement of the Audit Reports for furnishing Explanatory Notes by Government departments on the audit observations included in the Audit Report. The Explanatory Note should indicate the corrective action taken or proposed to be taken by them.
The position of pendency of paragraphs/Performance Audits, for which Explanatory Notes were not received as of 31 March 2021 is shown in Table 1.2.
Table 1.2: Paragraphs/PAs for which Explanatory Notes not received
Details of number of Paragraphs/ Performance Audits for which Explanatory Notes are awaited
Audit Report
Up to 2015-16
2016-17 2017-18
Government Departments/Autonomous Bodies
161 21 13
Panchayat Raj Institutions 29 2 -
Further, Government departments are to submit Action Taken Notes (ATNs) on the recommendations of PAC. As of March 2021, Government departments did not furnish ATNs on 1,140 recommendations made by PAC in respect of Audit Reports on Government departments, Autonomous Bodies and PRIs pertaining to the period 1979-80 to 2015-16.

CHAPTER II SPECIFIC AREA
COMPLIANCE AUDIT


5
HIGHER EDUCATION DEPARTMENT
2.1 Specific area Compliance Audit of outcomes in higher education
Executive Summary
This Specific area Compliance Audit was conducted to ascertain the outcomes of higher education in the State in terms of its contribution to employability and research, the level of equitable access to quality higher education, and the adequacy and effectiveness of Governance and Management structures. The State performed well in student enrolment, pass percentage, access and affordability. Audit, however, found issues mainly with student-faculty ratio in colleges, valuation of answer papers, poor research output, regional disparity in access and ineffective functioning of governance structures.
Student-Faculty Ratio was quite healthy in the sampled universities, but the abnormal delays in recruitment of regular teaching staff resulted in engagement of large number of guest faculty for Government colleges.
Large number of revaluation requests and change of marks after revaluation cast doubt on the efficiency of answer sheet evaluation system. The moderation exercise and award of grace marks lacked transparency.
Only a handful of university departments were active in research. Majority had poor or nil research output.
The State has a higher college density than the all India average. However, regional disparity within the State is a matter of concern as 14 districts have lower college density than the all India average of 28 colleges per one lakh of population in the age group of 18 to 23 years.
The Gross Enrolment Ratio of SC and ST students at 41.6 and 37.8 per cent respectively was much below the state’s overall ratio of 49 per cent.
The State level bodies, established to ensure good governance were not fully functional. The TN State Council for Higher Education did not play its envisaged roles due to non-constitution of its main organ, viz., The Council. The TN State Academic Audit & Accreditation Council has not started functioning since its establishment in 2010.
While their applications for formal approval were pending with the University, affiliated colleges started new programmes and increased intake capacities. The routine post facto approval for such new programmes by the universities is indicative of slackness in governance.

Audit Report (Compliance Audit), Tamil Nadu for the year ended March 2020
6
While all the State public universities were accredited under the quality framework of NAAC, only 103 out of the 258 eligible Arts and Science colleges (40 per cent) affiliated to the sampled universities were accredited. This showed that 60 per cent of Arts and Science colleges were not meeting the desired quality standards.
The University of Madras continued to face financial crisis due to mismanagement and inadequate financial support from GoTN. As a result, funds meant for research and development activities were diverted for salaries and regular non-plan expenditure.
2.1.1 Introduction
2.1.1.1 Higher education indicators Higher education in India is currently defined as the education which is obtained after completing 12 years of schooling and is of the duration of at least three years. This education may be of the nature of General, Vocational, Professional or Technical education.
Inclusive and quality education for all is a powerful and proven vehicle for sustainable development. Higher education is passing through a phase of unprecedented expansion in terms of number of students and number of higher education institutions (HEI). Government of Tamil Nadu (GoTN) has recognised that Access, Equity, Quality and Governance as target areas. ‘Vision 2023’ of GoTN envisages progress in Human Development Index by providing inclusive higher education, addressing both access and equity issues.
College density1 and Gross Enrolment Ratio2 (GER) are major indicators of performance of higher education sector in the State. A comparison between Tamil Nadu and India in terms of number of HEIs, college density, and GER in the years 2010-11 and 2018-19 is given in Table 2.1.
Table 2.1: Number of Higher Education Institutions and Gross Enrolment Ratio
Year Number of universities*
Number of colleges* College Density GER
Tamil Nadu
All India Tamil Nadu
All India Tamil Nadu
All India
Tamil Nadu
All India
2010-11 59 621 1,985 32,974 27 23 32.9 19.4
2018-19 59 993 2,466 39,931 35 28 49.0 26.3
Change during 2010-19
- (No
change)
372 (60
per cent increase)
481 (24
per cent increase)
6,957 (21
per cent increase)
8 5 16.1 6.9
* Includes all types of universities/colleges - Medical, Engineering, Agriculture, Management, Arts, Science, etc.
(Source: All India Survey on Higher Education)
1 Number of colleges per lakh of population in 18 to 23 age group. 2 Number of students as a percentage of population in the age group of 18 to 23 years.

Chapter II – Specific area Compliance Audit
7
It can be observed from Table 2.1 that, number and density of colleges and the GER of Tamil Nadu had increased over the years and was above the national average.
2.1.1.2 Funding for State universities and colleges
GoTN provides funds through State budget to universities as grant-in-aid3, mainly for salary of teaching and non-teaching staff. GoTN also provides funds through budget for running Government colleges and salary grants to Government aided colleges. Apart from State budget, universities and colleges receive assistance from Government of India (GoI), Ministry of Human Resources Development (MHRD) under Rashtriya Uchchatar Shiksha Abhiyan (RUSA) scheme and also from the University Grant Commission (UGC) for infrastructure, research, etc. HEIs also mobilise funds through fee from students, sponsored research and consultancy projects, etc. The funding pattern and related findings are discussed in detail in Paragraph 2.1.10.
2.1.2 Organisational set-up
At Government level, Department of Higher Education is headed by the Principal Secretary to deal with the affairs of universities and colleges providing higher education in general stream. The Director of Collegiate Education heads the field formation in charge of colleges.
At the University level, the Vice Chancellor (VC) who is the ex-officio Chairman of Senate, Syndicate and Academic Council, is the principal executive and academic officer of the University. The VC is assisted by Registrar, Controller of Finance and Financial Adviser, Controller of Examination, Heads of departments, etc. The Senate is the highest governing body of the University and is responsible for making statutes and passing resolutions on the annual accounts and the financial estimates. The Syndicate is the Chief Executive body responsible for making, amending and cancelling Ordinances and it appoints teaching as well as non-teaching staff and defines their duties, emoluments and conditions of services. University affiliates Government and private colleges.
2.1.3 Planning and execution of audit
2.1.3.1 Audit Objectives
The objectives of the Specific area Compliance Audit of outcomes in higher education were to assess whether:
The system of higher education in Tamil Nadu led to betterment of society by ensuring increased employability and research through high quality teaching/learning processes,
Equitable access to quality higher education was ensured for all, and
3 In the form of Block Grants and Additionalty grants.

Audit Report (Compliance Audit), Tamil Nadu for the year ended March 2020
8
Governance and management of higher education system was adequate and effective.
2.1.3.2 Audit Criteria
The Specific area Compliance Audit was conducted against the criteria derived from the standards/goals set by Central and State Governments and their agencies, as listed out in Appendix 2.1.
2.1.3.3 Scope of Audit and Audit Methodology (i) Scope of Audit
This Specific area Compliance Audit was conducted during September 2019 to February 2020, covering academic years (AY) 2014-15 to 2018-19 to examine aspects of access, equity, quality and governance of higher education. Four out of the nine (44 per cent) State public affiliating universities providing education in general streams (Science/Arts/Commerce), viz., Alagappa University (AU), Karaikudi, Bharathidasan University (BDU), Tiruchirappalli, Mother Teresa Women’s University (MTWU), Kodaikanal and University of Madras (UoM), Chennai, and 32 out of the 294 (11 per cent) 4 colleges affiliated to the sampled universities were selected through random sampling method (Appendix 2.2).
Besides this, records of Higher Education Department, Directorate of Collegiate Education and Tamil Nadu State Council for Higher Education were also scrutinised.
(ii) Audit Methodology
The Audit was conducted between September 2019 and February 2020, by scrutiny of records in the Higher Education Department, Directorate of Collegiate Education and sampled universities and colleges. Audit evidence was collected from relevant records and databases of the entities, joint physical inspections, discussion papers, photographs and feedback through a student’s survey conducted by issuing a questionnaire for evaluation of quality of education to 438 students in the sampled universities and 969 students in the sampled colleges.
An Entry Conference was held (September 2019) with the Principal Secretary to Government, Higher Education Department, Government of Tamil Nadu and Vice-Chancellors of all four selected universities, in which audit objectives, scope of audit, audit methodology and criteria were discussed. An Exit Conference was held on 17 November 2020 to discuss the audit findings and recommendations.
2.1.3.4 Acknowledgement
Audit acknowledges the co-operation extended by the Higher Education Department, Directorate of Collegiate Education, Vice-Chancellors and 4 Seven Government colleges, four university constituent colleges, and 21 private
colleges. One of the sampled college was closed down during the period covered by audit.

Chapter II – Specific area Compliance Audit
9
concerned officers of AU, BDU, MTWU and UoM and Principals of sampled Government colleges, Government Aided colleges and Self-financing colleges in conduct of this Audit.
2.1.4 Assessing quality through student performance
2.1.4.1 Examination results
Performance of students in examinations serves as an indicator of extent of effectiveness of teaching and better outcome in higher education. Performing well in examinations is a pre-requisite for getting employment of choice and for exercising the option of higher studies.
(a) Pass percentage in universities
The average percentage of students passing in examinations during 2014-19 in the sampled universities are given in Exhibit 2.1.
(Source: Information collected from respective university)
The high pass percentage, though an indicator of good performance, should be seen in the backdrop of lack of a defined policy for revaluation of answer scripts, coupled with high percentage of revaluations and liberal award of grace marks in the name of moderation, as commented in Paragraph 2.1.7.
(b) Pass percentage in affiliated colleges
The pass percentage of students of Arts, Science and Commerce streams in UG and PG programmes in all colleges affiliated to four sampled universities are shown in Exhibits 2.2 and 2.3.
83.23
77.66
89.4188.40
94.7391.91 90.19 90.9394.37
91.20
85.71
80.90
86.45 81.2890.6988.01 83.95
82.5780.70 80.37
50556065707580859095
100
2014-15 2015-16 2016-17 2017-18 2018-19
Exhibit 2.1: Average pass percentage of students in examinations
AU BDU MTWU UOM

Audit Report (Compliance Audit), Tamil Nadu for the year ended March 2020
10
71
41
81 77
93 99
61
45
81
61
83
71 79
92
68
57
82
62
92 89 88 98
84
66
020406080
100120
2014
-15
2018
-19
2014
-15
2018
-19
2014
-15
2018
-19
2014
-15
2018
-19
AU BDU MTWU UOM
Exhibit 2.2: UG - Percantage of pass in different streams
ARTS SCIENCE COMMERCE
(Source: Data furnished by respective universities)
As seen from the above Exhibits, the average pass percentage of UG students showed a declining trend in the affiliated colleges of AU, BDU and UoM, but improved in MTWU. In AU and UoM, the average pass percentage in all streams of UG programmes was below 80 as of 2018-19, while in the colleges of BDU and MTWU, the average pass percentage in UG programmes exceeded 80. In PG programmes, except in Science streams of colleges in AU and UoM, colleges of all sampled universities showed an average pass percentage of over 80.
(c) Pass percentage in sampled colleges
In respect of 32 sampled colleges affiliated to the four universities, the overall pass percentage in UG and PG programmes for the years 2014-19 is given in Exhibits 2.4 and 2.5.
(Source: Data furnished by respective colleges)
Audit analysed the effect of vacancies in faculty position in eight colleges with low pass percentage and found that the lack of regular faculty did impact the pass percentage as given in Exhibit 2.6.
90 83 86 82
97 94 100
100
92 78 81 82
96 98 83
64
87 89 88 88
100
78
100
100
020406080
100120
2014
-15
2018
-19
2014
-15
2018
-19
2014
-15
2018
-19
2014
-15
2018
-19
AU BDU MTWU UOM
Exhibit 2.3: PG - Percantage of pass in different streams
ARTS SCIENCE COMMERCE
60.83 58.8842.07 36.87 33.11
84.18 79.41 83.46 83.7680.76
95.8 97.34 97.76 97.47 97.01
68.37 63.77 61.69 57.21 60.95
020406080
100120
2014-15 2015-16 2016-17 2017-18 2018-19
Exhibit 2.4: Sampled colleges UG
AU BDU MTWU UOM
7571.43
100
91.1190.58 91.48 90.44
87.9096.15 98.25 98.75 99.32 96.36
78.44 85.1885.82
79.85 83
0
20
40
60
80
100
120
2014-15 2015-16 2016-17 2017-18 2018-19
Exhibit 2.5: Sampled colleges PG
AU BDU MTWU UoM

Chapter II – Specific area Compliance Audit
11
PTMTMC: Pasumpon Thiru Muthuramalinga Thevar Memorial College, Kamuthi; SIVET: SIVET College, Gowrivakkam, Chennai; GASC: Government Arts & Science College, Mudukulathur; SSGAC: Sri Subramaniaswamy Government Arts College, Tiruttani; UCC: University Constituent College, Thiruvottiyur; PAASC: Pattammal Alagesan Arts & Science College, Athur, Chengalpet; SSCAS: Sri Santhoshi College of Arts & Science, Maduranthakam and TMGCAS: TMG College of Arts & Science, Manimangalam, Chennai. (Source: Data furnished by respective colleges)
In AU, the results of Government and aided colleges were very low, and could be linked to poor faculty strength. Audit found that in Government-aided PTMTM College, Kamuthi, with 48 per cent vacancy in sanctioned posts, the result in UG programmes was only 17 per cent. Similarly, the Government Arts College, Mudukulathur had no regular faculty members and the College was run with only Guest lecturers on a consolidated pay of ` 15,000 per month.
In UoM, in both UG and PG programmes, Government and Government aided colleges performed better than self-financing colleges. Audit observed that one of the main reasons for low performance in self-financing colleges was posting of temporary/ unqualified teachers and high attrition rate of teachers in self-financing colleges of UoM. In the six sampled self-financing colleges, during 2014-19, 297 faculty members had resigned during the middle of academic year, bringing discontinuity in teaching process.
A survey of 272 students in the eight colleges revealed that on an average, 52 per cent of them were not satisfied with the teachers’ knowledge, teaching ability, punctuality, guidance, communication skill and evaluation. Further, 47 per cent of students were not completely satisfied with the teachers ability to identify strength/ weaknesses in them and inform the outcomes of the programs.
Thus, from the samples studied, Audit observed that the pass percentage was adversely impacted by vacancies of teachers in Government and University Constituent colleges, and in self-financing colleges, appointment of unqualified teachers impacted the pass percentage.
17.00
50.8940.00 40.88 46.00
39.9728.00
20.50
48.00
11.72
95.00
63.73
100.00
16.67
0.00 0.000
20
40
60
80
100
120
PTMTMC SIVET GASC SSGAC UCC PAASC SSCAS TMGCAS
Exhibit 2.6: Colleges with low pass percentages
Pass percentage percentage of vacancy in faculty posts

Audit Report (Compliance Audit), Tamil Nadu for the year ended March 2020
12
2.1.4.2 Employability
Producing employable graduates forms an integral function of higher education system. Students should be imparted with requisite skills, competencies and knowledge so that they can cope with the rapidly changing job market requirements. The presence of facilitators like career counselling, placement cell and alumni association helps in enhancing the potential of job aspirants in identifying areas of employment, honing skills and increasing acceptability by the recruiters. They also facilitate the availability of this pool of trained human resource to the potential employers.
(Source: Data furnished by respective universities and colleges)
In the sampled universities, approximately 28 per cent of the students who passed out during 2014-19 were successful in getting placements in various sectors (Exhibit 2.7). In 18 of the 32 affiliated colleges5 that maintained placement data, the percentage of students getting placed was 18 per cent (Exhibit 2.8). Among the sampled universities, AU and UoM performed well with 33 per cent placement, followed by BDU with 17 per cent.
An analysis of placement performance disclosed that:
Thirty five per cent students of colleges affiliated to UoM were placed when compared to only 10 per cent and 4 per cent in colleges affiliated to BDU and MTWU respectively.
Students of 14 sampled colleges (AU-4, BDU-7 and UoM-3) were not given the benefit of placements mainly due to non-establishment of a placement cell as discussed in Paragraph 2.1.4.3 (ii).
In AU, the Management stream, with 473 placements out of the 705 students graduating during 2016-19, accounted for a larger chunk of placements. Audit, however, found that placement of students from other streams was quite low with PG programmes in
5 13 colleges did not have placement cell and one college was closed.
0
41,446
5,794
21,994
0 4,28
4
222
7,73
9
010 4
35
0
10
20
30
40
010,00020,00030,00040,00050,000
AU BDU MTWU UOM
Exhibit 2.8: Placement of students against passed students of sampled colleges - 2014-19
No. of students passed No. of students placedPercentage of placement
4,91
9
3,29
6
816
4,92
6
1,60
6
576
22
1,64
5
33
173
33
0
10
20
30
40
01,0002,0003,0004,0005,0006,000
AU BDU MTWU UOM
Exhibit 2.7: Placement of students against passed students of sampled universities - 2014-19
No. of students passed No. of students placedPercentage of placement

Chapter II – Specific area Compliance Audit
13
Arts having a placement of just 13 per cent6 and PG programmes in Science streams having a placement of just five per cent7.
BDU also had higher percentage of placement in respect of few programmes, such as, M.Tech in Geological Technology and Geo informatics (58 per cent), M.A. in HR Management and M.A. in Sociology (56 per cent), M.A. in Development studies (50 per cent), M.B.A. (46 per cent) and Master in Social Work (40 per cent). Whereas, programmes like M.A. in Economics, Tamil, etc., had low placement record of less than 10 per cent.
In MTWU, only 89 out of 816 students of University Departments attended campus placement programme during 2014-19 of which only 22 (25 per cent) students got placements. Registrar, MTWU reasoned that Kodaikanal being a tourist place, the students were in a position to earn their livelihood by working in shops and hotels and were hesitant to move away from their native place. Audit opined that it is the responsibility of the University to create avenues for better placement and encourage students to strive for better employment.
UoM organised job fairs to benefit students from all departments/programmes. Besides this, HoDs of 53 out of 86 PG programmes arranged campus interviews, and the students of the remaining 33 PG programmes did not have this facility. It was found that while the placement of students from the programmes with campus interview facility was 45 per cent during 2016-19, the overall placement percentage during the period was only 26 per cent.
The Department of Management Studies in UoM, which had a separate placement cell with a dedicated placement officer, had a higher placement record of 64 per cent during 2014-19.
Urban-Rural divide in placement
Twenty three out of thirty two sampled colleges were located in rural areas and nine colleges in urban areas. Placement cells were not available in 57 per cent of the colleges located in rural areas.
Placement of students from colleges in urban areas at 18 per cent was slightly better compared to students of colleges in rural areas at 16 per cent.
The survey conducted by Audit among 757 students of rural colleges found that 18 per cent of them were dissatisfied with the facilities available for career guidance and placement cell. Whereas, a survey of 210 students of urban colleges disclosed that the percentage of students dissatisfied with career guidance and placement cell was five per cent and four per cent respectively. This points to lack of placement facilities in rural colleges when compared with the colleges in urban centres. This is a pointer to the fact that
6 Only 48 out of 365 students who graduated during 2016-19 were placed. 7 Only 70 out of 1,288 students who graduated during 2016-19 were placed.

Audit Report (Compliance Audit), Tamil Nadu for the year ended March 2020
14
placement cells in those colleges were not responsive to the needs of the students for jobs leading to the students being dissatisfied with the performance of these cells in their colleges.
2.1.4.3 Facilitation for placement
Employability enhancement programmes envisage bridging the gap between skills possessed by the students and the skills that are looked for by the employers.
(i) Soft skills programme
The soft skill courses are intended to improve language and communication skills, personal habits, cognitive or emotional empathy, time management, and teamwork and leadership traits for employability. UGC’s quality mandate also envisages training students in essential professional and soft skills.
Among the sampled universities, AU and MTWU had made soft skill courses mandatory only for UG programmes and PG students were not benefitted. BDU and UoM had made soft skill courses mandatory for UG as well as PG level.
In all colleges of AU, MTWU and UoM, courses on Communicative English and other employability/soft skills were integrated with the course curricula and was compulsory at UG level.
In the affiliated colleges of BDU, soft skill courses were offered as one among the non-major Electives at UG level. These courses were not compulsory. Among the four sampled Government colleges, three colleges did not maintain any data on students completing soft skill courses and in one college out of 8,182 students enrolled in soft skill courses, only 1,125 students (14 per cent) had completed the courses during 2014-19.
Thus, Audit observed that AU and MTWU had not attached the due importance to soft skill courses at PG level and BDU had made the soft skill programmes optional. This meant that though the job aspirants had the requisite academic skillset, they were not provided the means to hone their practical skills.
(ii) Placement Cell and job fairs
As per UGC guidelines, Career and Counselling Cells (Placement Cell) should be established in all universities and colleges. The Placement Cell should gather information on job avenues and placements and organise seminars and guidance workshops for informing students about the emerging professional trends, market needs and to impart training in soft skills.
Placement Cells are functioning in AU and MTWU for the students of the university concerned and affiliated colleges.

Chapter II – Specific area Compliance Audit
15
The Placement Cell in BDU works only for the students of the affiliated colleges.
In UoM, Placement Cell is available only for MBA students. For other students, annual job fairs are conducted and campus interviews are arranged by University departments.
A survey conducted by Audit among 438 students of the sampled universities revealed that 39 per cent and 44 per cent of the students were either dissatisfied or not fully satisfied with career counselling and Placement Cell respectively. Similarly, 36 per cent of them were dissatisfied or not fully satisfied with the training and internship opportunities.
Fourteen of the thirty two sampled colleges (43 per cent) did not have Placement Cells and 15,526 students who graduated from these colleges during 2014-19 were not given the opportunity of getting placements through campus placement programme.
Job fairs provide prospective employers access to large pools of qualified candidates. All sampled universities were active in organising job fairs. Audit, however, found that none of the sampled colleges organised any job fairs.
Thus, Audit observed that BDU and UoM need to strengthen their Placement Cells. Forty three per cent of sampled colleges had not taken any initiatives on Placement Cells and none of them had organised job fairs.
2.1.4.4 Further education
As per para 5.2 of NAAC Manual, HEI’s concern for student progression to higher studies is a pertinent issue. Progression is enabled through building systematic approaches to postgraduate and higher progression. Data on student progression to higher education, furnished by the universities disclosed that 32 per cent of students of AU progressed to M.Ed., M.Phil, Ph.D., etc., compared to only 12 to 16 per cent in the other three universities. A ‘School of Education’ functioning in AU, offering B.Ed., M.Ed., M.Phil., etc., was one of the reasons for higher progression of students of AU. Other sampled universities did not have such a School.
Audit found that the data on student progression to higher education was not maintained uniformly by all colleges. Eleven colleges did not maintain any data. Audit observed that this data was essential for colleges to enable them in guiding and empowering students to make informed choices.
2.1.5 Assessing quality through effectiveness of learning processes
Audit of the efforts taken by the sampled HEIs in the State in attaining the desired outcome through quality enhancement are discussed hereunder:

Audit Report (Compliance Audit), Tamil Nadu for the year ended March 2020
16
2.1.5.1 Course curricula
The UGC mandated that the curricula be revised once in three years and the syllabi be made relevant in tune with job market dynamics as also in tune with advances in research and development. Every department of the universities has a Board of Studies (BoS) with members having academic/industry background. The BoS designs the curricula after studying the new developments in the field of study and the needs of employers. The curricula designed by the BoS is put up to the Standing Committee on Academic Affairs/Academic committee of the University for approval.
In AU, curricula of 11 PG programmes8 were not revised for more than three years. Among them, the curriculum of MBA in Bank Management was last revised in 2012 and that of M.Phil in International Business was last revised in 2013.
BDU and MTWU had updated the curricula of all their programmes.
In UoM, the curricula of 75 out of the 86 programmes offered (87 per cent) were revised during 2014-19. Curricula of five programmes were not revised within the stipulated three years and details of revision were not furnished for six programmes. Further, the University did not revise curricula in respect of 25 out of 70 UG programmes and 48 out of 63 PG programmes offered by affiliated colleges. Specific reasons for non-revision were not available. Audit also found that the sampled departments9 did not maintain any documentary evidence for the feedback obtained from alumni and employers while revising curriculum.
Audit observed that programmes like Banking, Information Technology, Business Management, etc., have seen large scale changes. Relying on a syllabus last revised in 2012 and 2013 could have a detrimental impact and would leave students completely unequipped to work in these dynamic sectors. Similarly Computer science, Biochemistry, Pharmacology, etc., are fields where research-based changes are happening swiftly. Therefore, not revising the curricula periodically would lead to mismatch between what is taught and the new developments existing in industry which is required by employers.
From the above data, Audit observed that there were significant shortfalls in curricula revision in two of the four sampled universities, which had resulted in failure to update the curricula based on new developments in the field of study.
8 MBA (Bank Management), MCA (Regular), M.Sc (CS), MCA (WEP), M.Phil (CS),
M.Sc (Bioelectronics & Biosensors), MA (English), MBA and M.Phil (International Business), M.Sc and M.Phil (Physics) and MBA (Corporate Secretaryship).
9 Anatomy, Computer science, Endocrinology, Genetics, Mathematics, Medical biochemistry, Microbiology, Pathology, Pharmacology and Environmental Toxicology, Physiology and Statistics.

Chapter II – Specific area Compliance Audit
17
2.1.5.2 Field projects and internship
Field projects and internships are intended to impart practical knowledge related to the field of study.
(i) Internships/field projects by university students
All the PG students of AU, MTWU and UoM undertook internship/field projects during 2014-19. Audit, however, found that in BDU, only 56 per cent of the students enrolled in 29 PG programmes of two/three year duration during 2014-19, undertook internship/field projects. In their reply, the Registrar, BDU, stated that students were allowed to complete their course by doing research projects instead of field projects or internship. The reply attested the Audit observations that in BDU students completed their programmes without having the benefit of internships.
(ii) Internship/field projects by students of sampled colleges
Audit found that the affiliated colleges did not provide adequate avenues for student internship, leading to poor performance as given in Table 2.2.
Table 2.2: Internships in sampled constituent/affiliated colleges
Colleges Percentage of students who underwent internship Government and
Constituent Government
Aided Self -finance
4 colleges in AU Nil Nil 100 14 colleges in BDU 3 8 9 2 colleges in MTWU Not Applicable 100 100 12 colleges in UoM 7 8 17 (Source: Details furnished by respective colleges)
On analysis, Audit found that:
As per the Choice Based Credit System regulations issued by UGC, internship is an optional part of the curricula. The sampled universities had not made internship a compulsory part of the course curricula for UG programmes, but made it compulsory for PG programmes of affiliated colleges.
In three sampled colleges (two self-financing and one Government aided) of AU and MTWU, all the students got opportunity to undertake internship/field projects.
In nine of the sampled colleges, including three colleges with PG programmes, none of the students under took internship/field projects.
In the remaining 20 sampled colleges, only an average of seven per cent of UG students undertook internship.
Audit found that while the Universities had formal linkages with industry through University Industry Community Interface Centres, there was no such mechanism at college level. Despite that, three of the sampled colleges

Audit Report (Compliance Audit), Tamil Nadu for the year ended March 2020
18
performed well by tying up with local industries/institutions for field projects and internships.
Thus, Audit observed that a significant number of BDU students and a majority of students of 29 out of the 32 sampled colleges did not gain practical knowledge through field projects/internships to make them ready for the job market.
2.1.5.3 Career oriented curricula in universities
The Quality Mandate (May 2018) of UGC envisages “learning outcome-based curriculum framework”. The programmes offered in universities/colleges should have focus on enhancing the employability. Some of the career oriented UG/PG programmes offered by the sampled HEIs include Business Administration, Biotechnology, Microbiology, Journalism, etc. These programmes enjoyed higher placement. The total number of PG programmes offered in the sampled universities and the number of career oriented programmes among them are given in Exhibit 2.9.
2.1.5.4 Career oriented curricula of colleges
Analysis of data on career oriented programmes offered by sampled colleges revealed the following:
Eight out of the nine sampled colleges in urban areas (89 per cent) and 14 out of the 23 colleges in rural areas (61 per cent) offered career oriented programmes like Microbiology, Business Administration, Biochemistry, Computer applications, Commerce, Fashion Technology, Textile science, Tourism, Visual Communication, etc.
Career oriented programmes had a higher placement record of 24 per cent and 14 per cent in urban areas and rural areas respectively. Whereas, basic programmes such as History, Tamil, English, Mathematics, Physics, Chemistry, etc., had a placement record of 16 per cent and 12 per cent in urban areas and rural areas respectively.
Nine sampled colleges in rural areas and one in urban area offered only basic programmes such as History, Tamil, English, Mathematics, Physics, Chemistry, Commerce, etc.
Thus, Audit observed that 10 of the total of sampled 32 colleges (31 per cent) affiliated to the sampled universities offered only basic degree programmes on traditional subjects such as History, Tamil, English, Mathematics, Physics and
43 4326
86
23 2514
69
0
20
40
60
80
100
AU BDU MTWU UOM
Exhibit 2.9: Career oriented programmes
Total number of programmes Career oriented programmes
(Source: Respective universities)

Chapter II – Specific area Compliance Audit
19
Chemistry. The colleges needed to introduce career oriented programmes which provide better placement avenues.
2.1.6 Quality through effective teaching processes
2.1.6.1 Student-Faculty Ratio
Student-teacher ratio or student-faculty ratio (SFR) is the ratio between the number of students who attend a college or university and the number of teachers in the institution. Low SFR allows the teachers to better manage the class and devote more time and energy for research and other development works.
The sampled universities had a healthy SFR with reference to the ratio of 20:1 recommended by RUSA. The sampled colleges, however, had a poor SFR, which continued to worsen during the last five years (Table 2.3).
Table 2.3: Student-Faculty ratio in sampled institutions
University/ colleges
2014-15 2018-19
Number of Students
Number of Teachers
SFR Number of Students
Number of Teachers
SFR
AU 2,353 157 15 3,752 208 18
BDU 1,994 182 11 2,269 156 15
MTWU 441 49 9 578 54 11
UoM 2,978 261 11 3,317 215 15
Colleges 68,622 2,734 25 79,689 3,039 26
(Source: Data furnished by respective universities/colleges)
SFR in Universities
SFR in the sampled universities are calculated on the basis of student strength and the number of regularly appointed teachers. Universities, being centres of academic research, the teachers’ strength cannot be directly linked to student strength.
The issues relating to SFR in universities are discussed below:
Three departments in UoM10 and three departments in MTWU11, which did not carry out any research activity during 2014-19, had an SFR of less than 5:1. Low SFR in departments without any research output indicated significant excess academic staff with reference to the norm of one faculty member per 20 students. The Universities had not reviewed the SFR, especially in departments where no research work was taking place.
In BDU, the SFR as of 2018-19 was 15:1. Audit, however, found wide variance in availability of faculty in different departments.
10 Education, Hindi and Kannada Departments. 11 Library Information Science, Social Work and Women studies departments.

Audit Report (Compliance Audit), Tamil Nadu for the year ended March 2020
20
While five departments 12 had a SFR of less than 5:1, in four departments13 SFR ranged from 30:1 to 93:1.
In UoM, the SFR as of 2018-19 was 15:1. Audit, however, found that the SFR had gone above the RUSA prescribed minimum of 20:1 in Geology and Computer Science Departments. In the Geology Department, the total student strength had increased from 48 in 2014-15 to 60 in 2018-19, while faculty strength had decreased from 5 to 3 during the same period. In the Computer Science Department, the SFR, which was 29:1 in 2014-15 came down to 21:1 in 2018-19 due to reduction in intake from 144 to 104 during the same period.
It was further noticed that in addition to the regular academic staff on UGC scale, during 2018-19, UoM appointed a total of 63 full-time guest faculty on consolidated salary of ` 20,000. If the number of full time guest faculty are taken into account, the SFR of UoM as of March 2019 would be 11:1. Though, there is no defined benchmark for maximum number of faculty members in a department, the University had not reviewed the need for available teachers in departments which are not doing any research work. Audit observed that such a review could identify surplus academic staff for possible shifting to constituent colleges of the University.
SFR in sampled colleges
SFR in colleges is calculated by considering the number of regularly appointed teachers and full-time guest faculty. Table 2.4 shows the SFR in the sampled colleges as of March 2019.
Table 2.4: Student faculty ratio in sampled colleges
Colleges SFR in all colleges
SFR in Government/ Aided/Constituent
colleges
SFR in Self-finance
colleges 4 colleges affiliated to AU 31:1 35:1 20:1 13 colleges affiliated to BDU 24:1 25:1 20:1 2 colleges affiliated to MTWU 30:1 41:1 21:1 12 colleges affiliated to UoM 29:1 33:1 24:1
(Source: Data furnished by respective colleges)
Audit noticed that the SFR exceeded double the norm in four sampled colleges:
In three UoM colleges, viz., Government College, Tiruttani, University Constituent College, Thiruvottiyur and Pachaiyappa’s College for Women, Kanchipuram, the SFR was 72:1, 71:1 and 62:1 respectively.
In Government Arts College for Women, Pudukkottai affiliated to BDU, the SFR was 72:1.
12 Economics, Environmental Biotechnology, Marine Biotechnology, Marine Science
and Social works. 13 Biotechnology, Bharathidasan School of Management, English and History.

Chapter II – Specific area Compliance Audit
21
Government Arts College, Mudukulathur, affiliated to AU, offers five programmes, but had only one permanent faculty for a total 460 students enrolled during 2014-19. The vacancies were managed by engaging guest lecturers.
2.1.6.2 Vacancies in faculty positions
Audit found that the unfilled vacancies of sanctioned posts of faculty in the sampled universities and colleges were a cause for the increasing SFR. The person in position (PIP) in the sampled universities, against sanctioned strength as of March 2019, is given in Exhibit 2.10. All the universities had engaged full-time guest lecturers in excess of the vacant of regular posts.
(i) Vacancies in universities
Analysing the reasons for the increasing SFR in all the sampled universities, Audit observed that a ban on recruitment, in force from April 2017 to June 2018, and the system of freezing of block grants from Government towards salaries, as discussed in Paragraph 2.1.10.7 (i), contributed to the vacancies.
In AU, 4 out of the 38 departments functioned with an Associate Professor as HoD, which showed that these departments did not have sufficiently senior academicians to head them.
In BDU, the Department of Statistics and the Department of Sociology were run with only guest lecturers. Further, three14 out of thirty nine departments functioned only with Assistant Professors. Department of Medical Physics and the Department of Remote Sensing did not have HoDs. Audit also found that there were no admissions in the PG programmes on Medical Physics during 2015-18 and Remote Sensing during 2014-17.
In MTWU, despite having a healthy SFR of 11:1, five of the seventeen departments were headed by Associate Professors and three by Assistant professors. Thus 8 of the 17 departments were deprived of senior academicians to head them.
14 Bharathidasan School of Management, Geography and History.
288231
85
473
208156
54
234310
257
71
297
0
100
200
300
400
500
AU BDU MTWU UoM
Exhibit 2.10: Sanctioned posts and Person in position
Sanctioned PIP (Regular) PIP ( including full time Guest Lecturers)
(Source: Respective universities)

Audit Report (Compliance Audit), Tamil Nadu for the year ended March 2020
22
In UoM, the vacancies against sanctioned posts of Professors, Associate Professors and Assistant Professors as of March 2019 were 37 per cent, 75 per cent and 51 per cent respectively. Despite having a healthy overall SFR of 15:1, the vacancies of Associate Professors and Assistant Professors remained unfilled.
Inter alia due to shortage of faculty, UoM had revised the sanctioned intake of students from 3,728 in 2016-17 to 1,614 in 94 programmes for 2017-18, despite year-on-year increase in admissions in the University.
In the Department of Endocrinology, due to shortage of faculty members, M.Sc course was withdrawn from the academic year 2014-15.
Though the student intake in Centre for Cyber Forensic and Information Security was increased from 20 to 25, it is functioning only with one Assistant Professor and by engaging 43 part-time guest lecturers. As the subject is in great demand, the University should have engaged regular faculty rather than depending on guest lecturers.
(ii) Vacancies in sampled colleges
Against the total sanctioned strength of 10,079 teachers in Government colleges in the State, only 4,889 permanent teachers were on roll, leaving 5,190 posts (51 per cent) vacant. The vacancy position in aided colleges was 22 per cent (2,380 vacancies against a sanctioned strength of 10,610). The large number of vacancies was managed mainly by engaging full-time guest lectures.
In the 32 sampled colleges, vacancies ranged up to 72 per cent in Government colleges and up to 48 per cent in Government aided colleges. Among the sampled colleges, University Constituent College, Thiruvottiyur and Government College, Muthukulathur had no permanent faculty members and the colleges were run with guest lecturers. Audit found that both these colleges had a poor pass percentage of 46 and 40 per cent respectively during 2014-19.
Analysing the issue of unfilled vacancies, Audit found that:
During 2014-19, 17 programmes were newly started in 10 Government colleges and 1,318 students were admitted, without any teachers for handling these programmes.
The TN Teachers Recruitment Board (TRB), the agency responsible for recruitment of teachers for Government colleges, planned to recruit 1,883 teachers for different subjects in 2016. Government, however, banned all recruitments between April 2017 and June 2018, leading to non-completion of the recruitment process. In October 2019, TRB notified recruitment of 2,331 posts, but the recruitment process was incomplete as on February 2021.

Chapter II – Specific area Compliance Audit
23
The unfilled vacancies were filled up by appointment of guest lecturers. As on March 2020, 4,084 guest lecturers were posted in Government colleges with salary of ` 15,000 per month. The salary paid to guest lecturers by GoTN was much below the UGC recommended salary of ` 50,000.
Thus, Audit observed that delays by TRB in recruitment of teachers caused vacancies to increase. Guest lecturers were taken on contract basis to cater to the need, and were not recruited through transparent merit-based recruitment process. Many were not paid adequately and hence would be in the lookout for better paying jobs. As they are not eligible for research grants, they would not contribute to further research, which would have an adverse impact on the institution as a centre of higher learning.
2.1.6.3 Availability of qualified teachers
In the 32 sampled colleges, 1,305 out of 2,495 teachers as of March 2019 did not possess required qualification of Ph.D or NET/SLET. The percentage of fully qualified teachers in the sampled colleges affiliated to the four universities is given in Exhibit 2.11 and the management-wise percentage of fully qualified teachers is presented in Exhibit 2.12.
(Source: Data furnished by respective colleges)
The percentage of fully qualified teachers in self-financing colleges and self-supporting wings of aided colleges was only 33 per cent, while in Government/Aided/Constituent colleges 64 per cent of total teachers were qualified.
As per the conditions governing affiliation of colleges, all colleges, are expected to pay salary to teachers as per UGC’s scale of pay. The starting salary of an Assistant Professor in UGC scale is around ` 70,000 per month15. However, Audit noticed that the monthly consolidated salary paid to teachers in the sampled self-financing colleges ranged as low as ` 7,500 to ` 12,000 in colleges affiliated to UoM. In one sampled aided college (self-financing
15 Basic pay ` 57,700 + Allowances.
56 55
37 37
0
10
20
30
40
50
60
4 Colleges inAU
14 Colleges inBDU
2 Colleges inMTWU
12 Colleges inUoM
Exhibit 2.11: Percentage of fully qualified teachers in colleges
55
87
5233
0102030405060708090
100
Government Aided Constituent Self-financing
Exhibit 2.12: Management-wise percentage of fully qualified teachers

Audit Report (Compliance Audit), Tamil Nadu for the year ended March 2020
24
stream) affiliated to AU, the salary range was between ` 4,000 and ` 11,500 per month during 2018-19.
Audit also observed that in addition to the inability of self-financing colleges to attract fully qualified teachers, the low salary structure could possibly be the reason for high attrition rate in these colleges. Audit noticed that 297 teaching faculty had resigned during 2014-19 in the self-supporting streams in aided colleges and self-finance colleges affiliated to UoM. Similarly, in one self-financing college of MTWU, during 2014-19, 42 teachers had left the institution and in the one sampled self-financed college of AU (commenced in 2016-17), 18 teachers had left in the first three years of its functioning.
Impact of not having fully qualified teachers
The absence of fully qualified teachers reflected in the performance of students of self-financing colleges. While the pass percentage of students in the sampled self-financing colleges and self-supporting programmes in aided colleges affiliated to UoM, ranged between 20 per cent and 74 per cent, the students of the sampled Government/aided colleges performed well with pass percentage between 41 per cent and 89 per cent during 2014-19.
The pre-condition for UGC’s recognition to colleges under Section 2(f) and 12B of the UGC Act, 1956, includes employment of qualified teachers and payment of UGC scale of pay. Faculty in such colleges alone are eligible for financial assistance from UGC for undertaking research projects. In the 32 sampled colleges, only 16 colleges had 2(f) recognition, wherein, 90 faculty members received research grant totalling ` 5.48 crore from UGC during 2014-19. Faculty in colleges without UGC scale of pay were thus denied opportunity for UGC funded research.
The universities stipulated payment of UGC scales to teaching staff as one of the conditions for grant/continuation of affiliation. Audit, however, found that the four sampled universities, overlooked the non-fulfilment of this condition by private colleges and thus failed in the role of governance with respect to colleges affliated to them.
2.1.6.4 Coverage of Syllabus (i) Universities
The class time table for each department in universities is prepared for six hours of teaching for five days in a week. As a part of the internal quality assessment, all universities obtain a student feedback, including on syllabus coverage by teachers. The feedback results were, however, not compiled for a meaningful analysis, after 2014 by the universities.
Audit conducted a survey covering 438 students of the four universities which revealed the following:

Chapter II – Specific area Compliance Audit
25
Fifty seven per cent of students in UoM, 45 per cent of students in AU, 40 per cent of students in BDU and 12 per cent of students in MTWU had said that faculty had covered less than 85 per cent of syllabus.
In UoM, 28 out of the 240 students (12 per cent) who took part in the survey had suggested in their feedback that faculty can be more regular to class and cover syllabus early to avoid rushing up of portions before examinations.
(ii) Sampled colleges
The survey conducted by Audit among 969 students from the sampled colleges revealed that 52, 27, 9 and 32 per cent of students in colleges affiliated to AU, BDU, MTWU and UoM respectively had recorded that syllabus covered was less than 85 per cent.
Thus, Audit observed that the less than 100 per cent coverage of the syllabus by significant number of teachers of universities and colleges reflected poorly on the quality of teaching in HEIs.
2.1.6.5 Professional development training of faculty
Based on National Policy on Education, 1986, UGC envisaged setting up of Academic Staff Colleges (ASC) in each university. ASCs, now renamed as Human Resource Development Centre (HRDC) were to impart orientation training to newly recruited Assistant Professors and refresher training to existing teachers for promotion under career advancement scheme. UGC has prescribed curricula for orientation programme/refresher course. Audit scrutiny of achievements under this activity is discussed below:
BDU and UoM with HRDC, could impart training to all faculty at least once during 2014-19.
AU and MTWU did not have a HRDC as mandated by UGC to train academic staff. As a result, only 15 per cent and 18 per cent of their faculty members had attended refresher training in HRDCs of other universities during the years 2014-19.
The HRDC of UoM earmarked only 80 slots per year for staff of affiliated colleges which was insufficient to meet the needs of training of all faculty members. Audit found that none of the 318 faculty members employed in five sampled colleges 16 underwent any training course during 2014-19. In the remaining seven sampled colleges17 two to twenty eight per cent of the faculty
16 Jaya College of Arts & Science, Thiruninravur; Nazerath College of Arts & Science,
Avadi; Pachaiyappa's College for Women, Kancheepuram; TMG College of Arts & Science, Manimangalam, Chennai and University Constituent College, Thiruvottiyur.
17 Annai Veilankanni’s College for Women, Chennai; Pattammal Alagesan Arts & Science College, Chengalpet; Chellammal Women’s College, Chennai; SIVET college, Chennai; Queen Mary’s College, Chennai; Sri Subramaniaswamy Government Arts College, Tiruttani and Sri Santhoshi Arts and Science college, Maduranthakam.

Audit Report (Compliance Audit), Tamil Nadu for the year ended March 2020
26
members attended training during this period. Audit found that no steps were taken by UoM to increase the training slots for college teachers.
Out of four sampled colleges affiliated to AU, none of the faculty of two colleges attended training programmes and 12 and 15 per cent of average number of faculty attended training programme in the other two colleges.
In the two sampled colleges affiliated to MTWU, while all the faculty attended training programme in one test-checked college, only 13 per cent of average number of faculty attended training programme in another College.
Out of 14 sampled colleges affiliated to BDU, average of 51 per cent of Regular faculty in eight colleges attended Orientation/Refresher/Short-term and Faculty development programmes during 2014-19.
Thus, lack of HRDC in two universities, insufficient capacity in HRDCs to train teachers of affiliated colleges, and failure to address the need for increased capacity, resulted in the professional development trainings being carried out by HEIs on a limited basis. This could impact the quality of education imparted by HEIs.
2.1.7 Examination and evaluation system
Audit found that all the four sampled universities were prompt in following the stipulated process for setting question papers, conducting examinations, and publishing results.
The system of external evaluation, however, differed among the sampled universities, as per the evaluation policies framed by the Academic Council of the university concerned and approved by the syndicate of the university.
AU followed double valuation system, wherein the answer scripts are evaluated by two different evaluators, one from the University department and one from outside the University. The average of the two scores is taken.
UoM and BDU followed a system of internal and single valuation, wherein answer papers are valued only once internally within the department concerned.
In MTWU, the system followed is single external valuation where answer papers are evaluated by faculty of other universities.
In February 2016, the Academic Council of UoM, stressing the need for accountability by the examiners, resolved to bring back double valuation system. But UoM had not taken a decision on the issue (March 2020).
Single external valuation system is followed for affiliated colleges.

Chapter II – Specific area Compliance Audit
27
Audit observed a need for standardising and strengthening the evaluation process in view of the spate of revaluation requests being received every year as discussed in Paragraph 2.1.7.2.
2.1.7.1 Moderation of marks
As per the regulations, a student has to score a minimum of 40 per cent in both the internal and external examinations to pass in the examination. In addition to the mark scored by the examinees, the sampled universities awarded moderation or grace marks. During 2014-19, the moderation marks awarded ranged from a minimum 1 to a maximum of 18.
In UoM, if there were any question from outside the syllabus, full mark for the question is allowed to the examinees who had attempted the question. UoM awarded grace marks to 792 border line students out of the 1.24 lakh UG/PG students of affiliated colleges who appeared in university examinations during 2014-19.
In BDU, a Passing Board is formed in each of the University departments with all the faculty being the members of the Board. In the meetings held each year, they decide on the need to provide additional marks to students. During 2014-19, additional marks, ranging from 1 to 18, were granted to 844 out of the 10,840 PG students of University departments who appeared in examination during 2014-19.
In AU, Board of Examiners of each programme meet at the respective valuation centres and recommend grace marks to moderate the percentage of results. The decisions so taken in the valuation centres are approved by the Vice-Chancellor.
An analysis of the moderation marks awarded disclosed that:
The authority concerned in the sampled universities, while deciding award of moderation marks, did not give any justification therefore.
The Controller of Examinations of UoM, while approving the grace marks for border line cases in November 2019 examinations, had recorded that the individual minutes were not giving any rationale for the award of grace marks and that the different sets of considerations by Boards need reconciliation. The VC instructed (January 2020) to draw up clear guidelines to decide the award of grace marks, but no action was on record as of December 2020.
Instances of abnormal increase in marks are highlighted below:
In the April 2016 examinations in BDU, 18 additional marks were awarded to an examinee in an arrear paper in Biomedical Sciences, which made the student pass the paper where he/she had scored only 17 out of 75.
In the April 2017 examinations, BDU awarded 15 grace marks to each examinee of two subjects relating to Computer Science and Engineering Department.

Audit Report (Compliance Audit), Tamil Nadu for the year ended March 2020
28
In the November 2018 examinations of BDU, four marks per subject and a maximum 12 marks per candidate were awarded as grace marks in Mathematics, Microbiology, Biomedical Science, Botany, Bioinformatics, Zoology, Biotechnology and Physics. An additional three per cent of students passed the examination after award of moderation marks.
If the moderation marks were not taken into consideration, the results in BDU would be in the range between 74.26 per cent and 82.31 per cent against the results published after award of moderation marks which was in the range between 94.30 per cent and 99.31 per cent during 2014-19.
In the April 2019 examination for M.Sc/Chemistry, the Board in UoM resolved to add eight marks to all examinees to increase pass percentage.
In the November 2019 examination for M.Sc/Computer Science and M.Sc/Information Technology, the Board in UoM decided to award three marks for all students to increase pass percentage significantly.
Audit observed that award of moderation marks without any defined yardsticks and seemingly with the only objective of increasing pass percentage would impact the quality of higher education imparted.
2.1.7.2 Revaluation
The sampled universities had not issued any guidelines for revaluation of answer sheets. The failed candidates and the passed candidates who had doubt in marks awarded to them, apply for revaluation without stating any justification for their application. All such applications were taken for revaluation. A scrutiny of the data relating to revaluation of answer sheets of students of 294 affiliated colleges of the four universities disclosed that AU did not maintain data on revaluation. In BDU, MTWU and UOM a total of 1,48,356 students had applied for revaluation during 2014-19, out of them 74,889 students (50 per cent) had got their marks changed through revaluation as given in Exhibit 2.13.
Audit found that during 2014-19, 58 per cent of students of colleges affiliated to UoM applied for revaluation, which was highest among the sampled universities. Further, the percentage of change of marks after revaluation ranged from 37 to 74 per cent which indicated that the original valuation was not proper.
7452
37
01020304050607080
MTWU UOM BDU
Exhibit 2.13: Percentage of students whose marks changed on revaluation during 2014-19
(Source: Respective universities)

Chapter II – Specific area Compliance Audit
29
MTWU stated that since the first and second valuation were done by different examiners, the valuation differs on their perspectives. Audit however noticed that in respect of 18 to 40 per cent of students the change in percentage of marks was above 10, which should not happen even if examiners might have different perspectives. BDU and UoM did not explain the reasons for such wide variations in evaluation. Audit found that the universities did not have any system to analyse the reasons wherever abnormal changes happened on revaluation.
Thus, Audit observed that the efficacy of the evaluation system in the sampled universities was an area of concern in the light of substantial changes in marks received by students on re-evaluation.
2.1.8 Quality through effective research
Higher education’s contribution to knowledge base is through effective research. The outcome of research includes patents for new inventions, publications, consultancy services by faculty, etc. The National Institutional Ranking Framework (NIRF) ranks universities on the basis of five parameters including Research and Professional Practices (RP). Three of the four sampled universities, viz., AU, BDU and UoM, were ranked (2020) among the top 100 universities in India, with all India rank of 36, 53 and 22 respectively. It was, however, seen that in terms of RP, all the three universities showed poor performance as shown in Table 2.5.
Table 2.5: NIRF scores of universities
University (All India
rank in bracket)
Score out of 100 Teaching
and learning
Research and
Professional practices
Graduation outcome
Outreach and
inclusivity
Peer perception
AU (36) 63.66 22.69 68.36 51.63 44.76 BDU (53) 63.49 28.38 50.92 46.57 40.09 UoM (22) 65.37 33.16 68.21 55.23 38.30
(Source: NIRF website)
It was further noticed that the scores of the three sampled universities in RP were much lower than the average of score of the top 10 universities which was 50.48 out of 100. The poor scores in RP was one reason that brought down the ranking of these universities.
2.1.8.1 Patents, research projects and consultancies
The details of number of patents awarded, revenue through consultancies by faculty and number of researchers doing research in the sampled universities during 2014-19 are given in Table 2.6.

Audit Report (Compliance Audit), Tamil Nadu for the year ended March 2020
30
Table 2.6: Patents, research projects and consultancies during 2014-19
Name of University
Number of
patents awarded
Research projects Consultancies
Number Number of JRFs, SRFs and PDFs
enrolled
Number Revenue generated
(` in crore)
AU 0 107 226 + 5 + 5 = 236 16 2.53
BDU 0 218 682 + 98 +116 = 896 21 0.23
MTWU 0 28 7 + 0 + 13 = 20 3 0.14
UoM 9 390 52 + 192 + 7 = 251 55 1.02
JRF - Junior Research Fellowship; SRF - Senior Research Fellowship; PDF - Post Doctoral Fellowship (Source: Data furnished by universities)
Performances in terms of department-wise research projects in the four universities are given in Appendix 2.3. Although 838 research/ consultancy projects were taken up by the sampled universities during 2014-19, only nine patents were obtained and the research and consultancies culminated in research papers, publication or consultancy reports. Research projects, consultancies and research guidance also contribute to Academic Performance Indicator for career advancement of academic staff. Audit, however, found that:
In AU, 1118 out of the 38 departments, having 28 faculty members did not carry out any research during 2014-19.
In BDU, 26 faculty members of 1119 out of 39 departments had not done any research project during 2014-19.
In MTWU, four20 out of the 17 departments having 11 faculty members did not undertake any research during 2014-19.
In UoM, 3721 out of 74 departments with 96 faculty members, including 24 Professors and 17 Associate Professors had not undertaken any research projects during 2014-19.
18 Alagappa institute of Education sciences, Alagappa institute of Skill development,
Botany, Computational logistics, Computer science, Fine arts, Geology, History, Logistics management, Social work and Tourism & hotel management.
19 Computer science, Centre for study of social exclusion and inclusive policy, English, Geology, Industrial biotechnology, Lifelong learning, Performing arts, Sociology, Statistics, Tamil and Women’s studies.
20 English, Mathematics, Physical Education and Visual communication. 21 Adult & Continuing Education; Anna Centre for Public Affairs; Anthropology;
Arabic, Persian & Urdu; Bioinformatics; Centre For Sangappalagai for Tamil Development; Christian Studies; Computer Science; Counselling Psychology; Cyber Forensic & Information Security; Defence & Strategic Studies; Education; English; French; Hindi; Indian Music; JBAS Centre For Islamic Studies; Jainology; Kannada; Legal Studies; Library & Information Science; Malayalam; Management Studies; Material Science; Network System & Information Technology; Physical Chemistry; Physical Education; Politics & Public Administration; Saiva Siddhanta; Sanskrit; Social Work; Sociology; South East Asian Studies; Tamil Language; Tamil Literature; Telugu and Vaishnavism.

Chapter II – Specific area Compliance Audit
31
In 16 out of 32 sampled colleges, which had recognition under Section 2(f) of UGC Act, 90 faculty members conducted 92 research projects during 2014-19 with UGC funds.
Thus, Audit observed that the universities lacked research-orientation due to lack of initiatives by several of their faculty members. Further, the Universities did not monitor the situation of research activity and probe the underlying reasons behind the failure of faculty to undertake research. 2.1.8.2 Other Audit findings on research
(i) Submission of thesis beyond prescribed time
During 2014-19, a total of 3,151 students enrolled for Ph.D in different departments of AU (881), BDU (1,000), MTWU (346) and UoM (924). Audit, however, found instances of non-completion of their research and submission of thesis within the stipulated time.
In BDU, 437 scholars had not submitted the thesis within the prescribed time limit of three to five years.
In MTWU, out of 111 students registered for Ph.D between 2010-11 and 2012-13, there was no response from 29 students.
Details of scholars who did not submit their thesis within the prescribed time limit was not compiled by AU and UoM.
(ii) Ineligible scholars enrolled in Ph.D
In AU, 881 (476 full time and 405 part time) Ph.D scholars were enrolled during 2014-19, and the enrolment was increasing over the years. Research Advisory committee (RAC) had fixed the minimum cut off marks for Ph.D pre-registration as 45 per cent in the qualifying entrance examination. It was seen from the minutes of the meeting of RAC held between September 2014 and April 2018 that in order to ensure availability of enough number of candidates for Ph.D in every discipline, the cut off marks were reduced so that at least one third of the candidates who appeared in the entrance examination qualified for registration. Audit observed that pursuing Ph.D requires a good academic background, and selection of unqualified students would have an adverse impact on the quality of research. The University replied (November 2020) that the practice of reducing cut off marks is withdrawn. (iii) Publication of theses in Shodh Ganga
UGC envisaged (June 2009) uploading of electronic version of theses and dissertations by the researchers in the UGC sponsored online repository called Shodh Ganga. The objective of Shodh Ganga is to facilitate open access to Indian theses and dissertation to the academic community world-wide. Online availability of electronic theses through centrally-maintained digital repositories, will not only ensure easy access and archiving of Indian doctoral theses but will also help in raising the standard and quality of research. This would also prevent problems of duplication of research and poor quality resulting from the “poor visibility”.
In AU, theses relating to 1,230 Ph.Ds awarded during the period 1990 to 2018, were uploaded in the Shodh Ganga website with

Audit Report (Compliance Audit), Tamil Nadu for the year ended March 2020
32
delay ranging from one to nine years. In 878 cases, the delay was more than five years.
MTWU had uploaded only 51 theses in the Shodh Ganga website out of 330 Ph. D’s awarded during 2014 -19.
UoM performed well and had uploaded all theses during 2014-19 in the Shodh Ganga project. The University had uploaded 11,685 theses as of September 2020; and obtained second place in uploading highest number of thesis at all India level, after University of Calcutta.
As of December 2020, BDU had uploaded all the 5,931 theses in Shodh Ganga website for Ph.Ds. The University did not maintain year-wise details of theses uploading.
Non-uploading and delayed uploading of theses by AU and MTWU could delay the acrual of benefits to the scientific community through further research in that area. (iv) Research centres
The goal of a research centre is to enable interaction among faculty, scholars, students and industry to enhance research opportunities, academic excellence, real-world problem solving, knowledge creation and dissemination.
Audit found that in UoM, eight22 out of fourteen research centres were not functioning as they neither handled any research projects nor trained a Ph.D scholar. Thus, the intended purpose of offering programmes and research activities was not achieved. In two centres23, sampled by Audit, it was found that there were no physical buildings or separate rooms for the centres and no students were enrolled for any course in the centres. Audit however, observed that during 2016-19, these non-functional centres incurred contingent expenditure of ` 0.34 lakh on electricity, wages, etc. 2.1.8.3 Research papers and publications
According to UGC Regulations, 2016, the Academic Performance Indicators for career advancement inter alia stipulates publication of a minimum five research papers for promotion from Assistant Professor to Associate Professor and three more research papers to qualify for promotion to the level of Professor for career advancements.
The number of research papers published in UGC notified Journals and number of books and chapters in edited volumes/books published by teachers of the sampled universities during 2014-19 is given in Table 2.7.
22 Centre for Population studies, Centre for Ocean & Coastal studies, Centres for
Natural Hazards & Disaster studies, Endangered languages, Water resource management, Neurotoxicity, Stem cell and Infrastructure management studies.
23 Centre for Population studies and Centre for Ocean & Coastal studies.

Chapter II – Specific area Compliance Audit
33
Table 2.7: No of research papers published during 2014-19
Name of university
Average number of full time teachers
during 2014-19
Papers published Books and chapters in edited volumes/published, and papers in national/international conference
proceedings Number Average
per teacher Number Average per
teacher (1) (2) (3) (4) (5) (6)
AU 201 4,482 22 2,317 12 BDU 156 1,921 12 789 5 MTWU 60 727 12 276 5 UoM 257 899 4 2,460 10
(Source: Data furnished by respective universities)
AU, despite being a small and a relatively new University, performed well in terms of research output through papers and publication. It was also observed that UoM with 50 per cent of faculty positions lying vacant, as commented in Paragraph 2.1.6.2, performed poorly.
2.1.8.4 Receipt and utilisation of research grants
As per para 3.3 of NAAC Manual, HEIs have to be actively engaged in promotion of research through evolving appropriate policies and practices, making adequate resources available and encouraging active research involvement of teachers and scholars in research. Analysis of grants received for research activities disclosed that all the sampled universities, except BDU, depended largely on Government grants as given in Table 2.8.
Table 2.8: Receipt and utilisation of research funds Name of
University Grants received from
(` in crore) Utilisation of grants received
from (in per cent) Number of research projects
undertaken during 2014-19
Number of research projects completed within
the prescribed time period
Govern-ment
Sources
Non- Govern-
ment sources
Total Govern-ment
sources
Non- Govern-
ment sources
Total grants
AU 16.81 1.19 18.00 91 99 91 107 56 (42 in progress)
BDU 70.92 13.65 84.57 100 57 93 218 145 (55 in progress)
MTWU 1.84 0 1.84 66 0 66 28 8 (9 in progress)
UoM 140.34 0.58 140.92 48 67 48 390 Details not maintained
(Source: Records of respective universities)
Audit scrutiny of financial records relating to conduct of research programmes in UoM revealed that for two projects 24 under the Centre for Potential Excellence in Particular Area (CPEPA) project, UGC allocated ` 1.75 crore for creation of capital assets (for purchase of equipment). UoM could spend only ` 70 lakh for the purpose and failed to create the additional assets. As UGC instructed UoM (April 2018) to return the unspent amount along with interest, the work remained incomplete. Thus, UoM failed to utilise the grant as planned in the two projects and lost the grant of ` 1.75 crore. 24 CPEPA Life Science - Department of drugs from medicinal plants for human welfare
and CPEPA Earth Science - Climate change and its impact on mangrove ecosystem.

Audit Report (Compliance Audit), Tamil Nadu for the year ended March 2020
34
Thus, Audit observed that the universities are far from becoming self-reliant on research funds through sponsored projects. Except in the case of BDU, the universities received over 90 per cent of research funds only from Government sources.
2.1.9 Access and equity in higher education
2.1.9.1 Easy access to higher education
Access to higher education has been defined as availability of sufficient number of institutions across the serviced region to adequately fulfil the demand from that region. Equity means equal opportunity to all sections of the society to participate in higher education.
Ensuring equitable access to quality higher education is one of the major outcomes expected by Government. Every year, MHRD conducts a web-based All India Survey on Higher Education (AISHE). As per AISHE reports, the number of universities, colleges, college density and average enrolment per college in Tamil Nadu during 2014-19 were as shown in Table 2.9.
Table 2.9: Number of all types of higher education institutions in Tamil Nadu
Year Number of all types of
universities
Number of all type of colleges
Colleges density
Average enrolment per college
2014-15 58 2,477 33 854 2015-16 58 2,368 32 895 2016-17 58 2,368 33 922 2017-18 58 2,472 35 919 2018-19 59 2,466 35 924
(Source: AISHE Reports)
In Tamil Nadu, the number of universities increased from 58 to 59 during 2014-19 and the number of colleges marginally declined from 2,477 in 2014-15 to 2,466 in 2018-19, despite Government starting 31 new Arts and Science colleges during this period. The decline in the number of colleges was due to closure of some self-financing colleges, especially Engineering colleges during this period. The college density in the State at 35 per one lakh of age group population was higher than the national average of 28 colleges per one lakh population.
Despite a reduction in the number of colleges, the college density increased from 33 to 35 per one lakh of age group population due to decrease in age group population over the years.
(i) Disparity in accessibility of higher education
The ‘Vision 2023’ of GoTN seeks to provide inclusive higher education addressing both access and equity issues. In pursuance of this vision, GoTN established 31 Government Arts and Science Colleges, during the years 2014-19.


Audit Report (Compliance Audit), Tamil Nadu for the year ended March 2020
38
(iii) Availability of academic choice (a) Enrolment
Position of degree-wise enrolment for the years 2016-17 to 2018-19 is shown in Table 2.11.
Table 2.11: Degree programme-wise enrolment Year Type of
college Total no. of
colleges
Total enrol-ment
UG PG M.Phil Ph.D
Male Female Male Female Male Female Male Female
2016-17 Govt. 256 5,79,028 2,08,999 2,83,948 31,422 47,001 2,027 3,557 919 1,155
Private 467 4,06,949 1,67,112 2,03,106 18,486 16,565 601 786 136 157
2017-18 Govt. 259 5,79,088 2,09,117 2,82,941 33,140 48,257 1,210 2,400 858 1,165
Private 496 3,60,329 1,46,478 1,54,689 18,474 16,895 22,886 590 155 162
2018-19 Govt. 271 5,27,645 1,83,054 2,75,240 16,802 45,585 1,072 2,185 1,592 2,115
Private 542 3,89,966 1,78,563 1,69,856 19,956 18,956 768 1,532 181 154
(Source: Details furnished by DCE)
Fifty nine per cent of total enrolment was in Government and Government aided colleges. Enrolment in both Government and private colleges had decreased by nine and four per cent respectively in 2018-19 when compared to that in 2016-17. Enrolment of female students was more than male students in both Government and private Arts and Science colleges, due to higher number of boys opting for career oriented courses such as catering, courses in Industrial Technical Institutes and other professional courses.
Instances of significantly poor admission in few of the programmes offered by the sampled universities are discussed below:
Alagappa University: The average enrolment of students ranged between 25 and 59 per cent of the sanctioned strength in respect of six programmes viz., Tamil, Master of Social Work, History, Nanoscience, Oceanography and Bioinformatics.
Bharathidasan University: In five programmes, viz., Economics, Environmental Science & Technology, Human Resource Management, Development Studies and Sociology, the demand and admission were less than 20 per cent of the sanctioned intake during 2014-19.
Mother Teresa Women’s University: The enrolment during 2014-19 was only 26 to 32 per cent of the sanctioned intake.
PG programmes in Computer Science had no enrolment during 2014-19.
PG programmes on Counselling, Visual Communication, Economics and Library Information Science did not have any admission for four years during the five year period of 2014-19.
In seven PG programmes in Biotechnology, Textiles and Clothing, Social Works, Women Studies, Mass communication, Education and History, the average enrolment of students during 2014-19 was 3 to 24 per cent.

Chapter II – Specific area Compliance Audit
39
MTWU reasoned that the location of the University in a hilly terrain with high cost of living and poor socio-economic background of the students was the reason for low enrolment.
Audit, however, observed that the University failing to attract students could be attributed to factors like low placement record, non-introduction of popular career oriented programmes, etc., as commented in Paragraphs 2.1.4.2 and 2.1.5.3.
University of Madras: In UoM, the demand was more for PG programmes in the Schools of Mathematics, Physical Science, Life Science and Chemical Science, where only 3 to 19 per cent of aspirants secured admission during 2014-19. It was found that the sanctioned intake for these programmes could not be increased for want of faculty and facilities. In the meantime, due to low demand, the intake capacity of 63 programmes were reduced by 68 per cent during 2014-19 (Appendix 2.4). In the 2014-19 period, no admissions were made during one to five years in 27 approved Masters programmes of the University.
Despite demand, students are admitted in the Masters programme in Law only on alternative years due to non-availability of adequate faculty members.
Student admissions was stopped for M.D. (Pathology) and M.Sc. (Biomedical Science) programmes, which had high demand, due to non-availability of faculty members. M.D. (Pathology) and M.Sc. (Biomedical Science) programmes were also discontinued from 2014-15 and 2016-17 respectively, as the retired faculty members were not replaced.
Due to lack of demand, admissions were not made in M.A. in South and South East Asian Studies, M.A. in Divyaprabandam and M.A.in Folk Music during 2014-19 and no admissions were made during one to three years in M.A. in Christian Studies, M.A. in Financial Economics and M.A. in Saiva Siddhantha.
Audit observed that the universities did not review the reasons for low demand for several of their courses, and non-availabilty of faculty was instrumental in students being unable to pursue higher studies in key areas such as law and pathology. The lack of faculty put potential students at a disadvantage.
(iv) Enrolment in sampled colleges
Government colleges and aided colleges prepared rank list for student admission. The sampled self-financing colleges, however, admitted students by following spot admission procedure for all programmes. Audit observed that the spot admissions for self-supported courses, was essentially on first come first served basis which was contrary to the admission procedure in Government colleges which granted admissions in the order of merit. Table 2.12 shows the demand, sanctioned intake and admission during 2014-19.

Audit Report (Compliance Audit), Tamil Nadu for the year ended March 2020
40
Table 2.12: Sanctioned intake and students admitted in affiliated colleges
Nature of college Demand Sanctioned Intake
Admitted
Government 1,75,265 54,818 51,300
Aided 1,25,563 56,832 49,730
Self-finance 31,671 46,603 29,898
(Source: Data furnished by respective colleges)
The above Table 2.12 shows that demand was about 3.4 times, 2.5 times and 1.5 times of the sanctioned intake in Government, Aided and self-financing colleges respectively. Admission was, however, less than the sanctioned intake and very less in self-financing colleges.
2.1.9.2 Ensuring equity
(i) Gross Enrolment Ratio of disadvantaged groups
Data of GER of SC and ST categories and Gender Parity Index of All India and Tamil Nadu for the period 2014-19 are given in Table 2.13.
Table 2.13: GER of SC and ST category and Gender Parity Index Year GER of SC GER of ST Gender Parity Index
India Tamil Nadu India Tamil Nadu India Tamil Nadu
2014-15 19.10 33.20 13.70 32.30 0.92 0.92
2015-16 19.90 34.40 14.20 31.80 0.92 0.92
2016-17 21.10 38.30 15.40 36.00 0.94 0.95
2017-18 21.80 42.10 15.90 40.50 0.97 0.98
2018-19 23.00 41.60 17.20 37.80 1.00 0.97
(Source: AISHE Reports)
It was observed that the GER of SC and ST students in the State was much higher than all India GER of SC and ST students. Audit, however, found that the GER of SC students (41.6 per cent) and the GER of ST students (37.8 per cent) in the State as of 2018-19 was much lower than the overall GER of 49 per cent. In this context, it is pertinent to mention that districts with major SC and ST populations had lesser accessibility to higher education as commented in Paragraph 2.1.9.1 (i).
(ii) Gender equity
As of 2018-19, the State had a Gender Parity Index of 0.97, which meant that 97 female students were enrolled in higher education for every 100 boys enrolled. The State performed poorer with an index of 0.97 in comparison with all India Gender Parity Index of 1.0. The State had a higher sex ratio of 999 females per 1,000 males, as against 943 females per 1,000 males at national level.
The HEIs of the State fared well with reference to national statistics regarding equitable access to higher education. However, Audit observed that some districts, mostly with significant population of disadvantaged groups, lagged behind the State average in enrolment and college density.

Chapter II – Specific area Compliance Audit
41
2.1.9.3 Infrastructure (i) Information and Communication Technology facilities
UGC envisages the use of Information and Communication Technology (ICT) for teaching and learning in HEIs. ICT-enabled facilities include LCD projectors, Wi-Fi/LAN, smart class, Learning Management System, audio video recording facilities etc. NAAC also considers percentage of ICT-enabled classrooms and student-computer ratio while granting accreditation to an institution. The details of ICT-enabled classrooms in the sampled institutions was as given in Exhibit 2.18.
(Source: Data collected by Audit from respective universities/colleges)
In UoM, 110 classrooms were ICT-enabled. However, data on the total number of classrooms was not made available.
(a) ICT facilities in universities
AU, BDU and MTWU had upgraded 66 per cent, 100 per cent and 14 per cent of classrooms as ICT-enabled classrooms.
University of Madras: During joint physical verifications of classrooms in 15 sampled departments of the University in January 2020, Audit found that only 35 of the 38 reportedly ICT-enabled classrooms29 had some form of ICT facilities; of which, 19 classrooms had only a white board and a projector, two classrooms had only projectors, five classrooms had only computers and three classrooms had just air conditioning facility. Three had no ICT facilities and only six were fully equipped.
Audit found that in 2012, UGC approved ` 1.70 crore for creating ICT infrastructure. Out of which, only a sum of ` 1.04 crore was utilised as of March 2020. Due to delay in implementing the project and non-furnishing of utilisation certificate, the University did not receive the entire sanctioned amount from UGC, leading to non-provision of ICT infrastructure in all classrooms. 29 As reported by UoM to NAAC.
14255
127
1,478
948
127211
0
200
400
600
800
1,000
1,200
1,400
1,600
AU MTWU BDU 32 Colleges
Exhibit 2.18: ICT-enabled classrooms in sampled institutions as of 2018-19
Total classrooms ICT-enabled classrooms

Audit Report (Compliance Audit), Tamil Nadu for the year ended March 2020
42
0% 20% 40% 60% 80% 100%
Toilet facility
Drinking water
Hostel facility
Medical facility
Grievance redressal
845
1001
999
857
917
562
406
408
550
490
Exhibit 2.19: Student survey- Percentage satisfaction
Satisfied Not satisfied
(b) ICT facilities in sampled colleges
Among the 32 sampled colleges, seven30 colleges did not have any ICT-enabled classrooms. Though 25 colleges claimed that they had 1 to 34 ICT-enabled classrooms, such classrooms had just one projector and a screen. Other gadgets viz., Wi-fi/LAN, smart class, Learning Management System, audio video recording facilities etc., were not available in these classrooms.
Thus, Audit observed that while the universities except MTWU had fair degree of ICT penetration, the colleges continue to lag behind.
(ii) Built environment
Regulation 3.1 of UGC (Affiliation of Colleges by Universities) Regulations, 2009 prescribed that affiliated colleges should have minimum infrastructure facilities such as a college building, classrooms, laboratory, library, etc., as specified in the Regulations.
The survey conducted by the Audit teams among 1,407 students of the sampled institutions disclosed that about 29 to 40 per cent of the respondents were not satisfied with toilet facilities, medical facilities, drinking water facilities, hostel facilities and grievance redressal mechanism (Exhibit 2.19). Audit found that the level of dissatisfaction with toilet facilities, drinking water facilities, hostel facilities, medical facilities and grievance redressal mechanism was the highest with Government colleges wherein 54, 44, 40, 54 and 48 per cent respectively of the students expressed dissatisfaction. Whereas, aided colleges presented a better picture with lower dissatisfaction levels at 16 to 31 per cent on toilet facilities, drinking water facilities, hostel facilities, medical facilities and grievance redressal mechanism. Self-financing colleges also performed substantially better in terms of student’s satisfaction with these facilities.
Thus, Audit observed that while the above discussed facilities do not relate to the classroom, they are essential for a conducive academic environment and the absence of these facilities in Government colleges would make it difficult for students.
30 Alagappa University Model Constituent College of Arts & Science, Paramakudi;
Bharathidasan University Constituent Arts & Science College, Nannilam; Bharathidasan University Model College, Aranthangi; Government Arts College, Tiruttani; Pachaiyappa's College for Women, Kancheepuram; Sri Santhoshi College of Arts & Science, Maduranthakam and University Constituent College, Thiruvottiyur.
(Source: Student survey by Audit)

Chapter II – Specific area Compliance Audit
43
(a) Built environment in universities (i) Incomplete building in UoM
With a view to facilitate research and to overcome the problem of water logging in the existing main building located in a low lying area, UoM commenced (December 2012) the work of constructing a modern multi-storeyed building at its Taramani campus. The contractor stopped (December 2014) the work after completing 68 per cent of the work, due to non-payment of outstanding bills to the tune of ` 6.44 crore. Due to paucity of funds, UoM could not pay the bills of the contractor and approached (December 2014) GoTN for funds.
This issue was included in the CAG’s Audit Report (G&SSA) for the year ended 31 March 2017. To an Audit enquiry on the present status (Exhibit 2.20), UoM replied (February 2020) that GoTN had sanctioned (December 2019) ` 24.15 crore for completing the balance work. The work was entrusted (January 2020) to the Public Works Department. The work was yet to start (December 2020).
(Source:Audit Team)
The abnormal delay had caused the Basic Medical Science Departments to function from an unsafe building. The failure to complete the building, impacted achievement of the objective of furthering and facilitating research in bio-medical sciences with better laboratory infrastructure.
(ii) Cleanliness of buildings in UoM
A joint physical inspection (February 2020) of the campus buildings of UoM revealed poor maintenance of various buildings. In the ground floor of the Centenary building, outside Controller of Examinations’ room and Ph.D. Section rooms, lot of old answer paper bundles and old research theses were kept in the open, obstructing the passage. Old unserviceable computers and furniture in large numbers were also kept in the ground floor corridors, thereby affecting the aesthetics of the building (Exhibits 2.21 and 2.22).
Exhibit 2.20: Facade of the incomplete building

Audit Report (Compliance Audit), Tamil Nadu for the year ended March 2020
44
Exhibit 2.21: Waste records not disposed Exhibit 2.22: Stacking of unused material
(Source: Joint physical inspection)
Audit noticed that there was no system for periodical inspection of buildings and to prioritise immediate repair. Wastes were dumped along university corridors and waste dumps on the campus were not cleared. The buildings (Exhibits 2.23 and 2.24) had broken ceilings and walls, water leakages, damaged floor, unclean toilets, broken windows and doors and bad odour due to leaky sewer lines. As a result of neglect, the aesthetically designed buildings of this University had lost their visual appeal and concerns of hygiene and sanitation could not be ruled out.
Exhibit 2.23: Damaged roof and time expired fire extinguisher
Exhibit 2.24: Leaky sewer lines in Chepauk campus
(Source: Joint physical verification)
(iii) Laboratories of UoM
There are 16 science departments running PG/M.Phil/Ph.D programmes in UoM. A joint physical verification of the laboratories of nine31 departments revealed that three laboratories were seen cramped with equipment. Equipment in working condition were kept in corridor due to want of space.
31 Biochemistry, Biophysics, Biotechnology, Botany, Nanoscience and
Nanotechnology, Nuclear physics, Organic chemistry, Theoretical Physics and Zoology.

Chapter II – Specific area Compliance Audit
45
Equipment purchased using project funds were kept in faculty’s small rooms, causing inconvenience to accommodate all the students. It was further noticed that UoM had not established a system for annual physical verification of labarotory equipment and for disposal of unserviceable equipment. Obsolete equipment were strewn along the corridor, obstructing free movement. Details of equipment lying idle for several years are given in Table 2.14.
Table 2.14: Equipment kept idle
Department/ Laboratory
Name of equipment Cost (` in
crore)
Status
Nanoscience Confocal Raman Microscope, X-ray photon spectroscopy, Field emission scanning electron microscope, High Resolution transmission electron microscope
14.89 Purchased in 2010-11. Not working from 2015 due to expiry of AMC. Students go to IIT for experiments.
Nuclear Physics Positron Angular Correlation 1.00 Source not purchased (Source: Data collected from respective departments of UoM)
Audit observed that funds in the range of ` 11,000 to ` 4.68 lakh provided to various departments every year, during 2014-15 to 2018-19, was not sufficient for the departments for maintaining the equipment resulting in several equipment not being repaired and hence could not be used by the students. A list of unserviceable equipment in the sampled departments is given in Appendix 2.5.
Besides, the 63 Students’ labs and 105 Research labs of the University had just two regular Lab Assistants/Lab Attenders and six casual/contract staff. Out of the 30 sanctioned posts of Lab Assistants/Lab Attenders, 28 were vacant. As a result, the research scholars and faculty members handled all lab related maintenance works.
Thus, by not providing adequate funds and manpower to run the laboratories, costly equipment were lying unutilised and this impacted the support required by students in research and practical work.
(iv) Non-establishment of Commonwealth Mother Teresa Women’s International Centre
With a view to enrich higher education and to build diverse culture and perspectives in the classrooms, which would prepare students for global work place, GoTN and the Association of Commonwealth Universities had agreed in principle to establish Tamil Nadu Commonwealth Mother Teresa Women’s International Centre at MTWU, Kodaikanal with international students and academics.
The plan was to initially offer Certificate and Diploma programme in the areas of Yoga, Ayurvedic science, Music, Dance and Culture studies, etc., which would be open to all women who had completed school education including international students obtaining Commonwealth/other scholarships from universities across the globe.

Audit Report (Compliance Audit), Tamil Nadu for the year ended March 2020
46
GoTN sanctioned (October 2013) and released (December 2013 to July 2017) ` 5 crore for construction of building, purchase of books, computers and furniture and for recurring cost for three years. The building for the Centre was completed (August 2016) at a cost of ` 3.85 crore, and the balance grant of ` 1.15 crore was retained by the University. The Centre, however, has not started functioning. In the Exit Conference held on 17 November 2020, the Registrar, MTWU stated that steps were being taken to offer short-term courses by the Centre. In the absence of a tie up with the Association of Commonwealth Universities, the objective of the project was not achieved and the building constructed at a cost of ` 3.85 crore remained largely unutilised (Exhibits 2.25 and 2.26). Exhibits 2.25 and 2.26: Commonwealth Mother Teresa Women’s International Centre
(Source: Joint physical verification)
Thus, the project failed to take off due to lack of adequate efforts by the University. (v) Idle equipment in BDU
School of Physics: Two expensive equipment, viz., Physical Property Measurement System (PPMS) and Vibrating Sample Magnetometer (VSM) with accessories were procured (2009 and 2014 respectively) at a total cost of ` 2.29 crore, using funds provided by Department of Science & Technology, Government of India. The PPMS and VSM required regular refilling of high purity helium gas and liquid helium besides provision of Uninterrupted Power Supply (UPS). These equipment are used for research mainly by Ph.D scholars. During 2009-18, thirteen Ph.D students worked on these equipment and three more Ph.D students enrolled from January 2019 to July 2019. These equipment, however, could not be put to regular use from November 2018, due to non-refilling of helium and non-availability of batteries for the UPS. The Department estimated a requirement of ` 4.50 lakh for purchase of batteries and ` 3 lakh per year for regular maintenance of the equipment. The University did not sanction the required funds for purchase of helium and batteries (March 2020). As a result, these equipment could not be used for research, and 14 Ph.D scholars could not complete their research within the stipulated time.

Chapter II – Specific area Compliance Audit
47
School of Chemistry: The Single-crystal X-ray diffraction equipment, in which X-ray methods are employed to determine arrangement of atoms within a crystalline specimen, and Electron Paramagnetic Resonance (EPR) spectroscope, an equipment for examination of free radicals and the other paramagnetic centres, purchased in January 2008 and June 2009 at a cost of ` 0.68 crore32 and ` 0.92 crore33 respectively were under repair from 2011 and 2013. BDU did not provide funds for rectifying the defects in the equipment leaving the scholars and faculty to take samples/experiments/analysis outside BDU on payment.
(b) Built environment in sampled colleges (i) Inadequate infrastructure
The availability of the prescribed minimum infrastructure in the sampled colleges, with reference to the affiliation norms, disclosed shortage of selected important infrastructure as given in Exhibit 2.27.
(Source: Respective colleges)
Audit observed that shortage of prescribed minimum infrastructure would have an adverse impact on the environment provided to the students in the pursuit of higher education.
Improper upkeep and maintenance of building in the sampled colleges are discussed below: (ii) Kundavai Naachaiyar Government Arts College for Women
Three helipads were formed in the playground of the college in 1995 in connection with VIP visit to the town. The helipads were still not removed and hence the playground could not be utilised for sports and games. As a result,
32 As per December 2020 exchange rate. 33 Purchase process was 1.35 crore in Japanese Yen equivalent to ` 0.92 crore as per
December 2020 exchange rate.
29
29
25
26
18
2
2
6
5
7
0% 20% 40% 60% 80% 100%
Sufficient land
Library
Classroom
Play ground
Girls common room incoeducational colleges
Exhibit 2.27: Shortage of infrastructure in sampled colleges
Available Not available

Audit Report (Compliance Audit), Tamil Nadu for the year ended March 2020
48
55 of the 107 girl students, who had joined on sports quota had to travel two to four kilometres to other stadiums for practicing football, handball, hockey and athletics.
The allotment of ` 15,000 to each department for purchase and another ` 1,500 for maintenance of equipment was inadequate. As a result, 210 out of 255 compound microscopes, 109 out of 155 dissection microscopes and seven other equipment34 in Botany Department were not in working condition, leaving the students to use the working instruments in batches. Similarly, in Zoology lab, three instruments35 were unserviceable since 2018, as the funds allocated were not sufficient for purchase of new equipment and maintenance of those under repair.
(iii) Arignar Anna Government College, Musiri
In May 2015, the College purchased Emission spectrometer and IR and UV Spectrometers at a cost of ` 8.64 lakh and ` 11.99 lakh respectively using assistance provided by UGC. Audit scrutinised the log book and observed that the equipment were in a state of disrepair since February 2017 and were not rectified for want of funds. The students, therefore had to approach other colleges for conducting experiments involving these equipment.
2.1.10 Governance and management
2.1.10.1 State level Governance
(i) State Higher Education Council
Tamil Nadu State Council for Higher Education (TANSCHE), established in 1992, through an Act of Legislature is the agency for promotion and coordination of higher education in the State. GoTN constituted the Council of TANSCHE under the chairmanship of the Minister in charge of higher education with members drawn from academics, industry, scientific community and Government officers. In September 2013, GoI directed that State Higher Education Councils should be headed by eminent academicians. GoTN did not take any action to reconstitute the Council on the suggested lines. The Council of TANSCHE has not been reconstituted after 2015, leading to functioning of TANSCHE without the Council, the body envisaged under the Act to deliberate and guide its functioning. As a result:
TANSCHE has not been functioning as an autonomous statutory body of experts with defined powers and responsibilities.
Perspective plan for higher education was not placed before the Council for its approval.
34 PH meter, digital based spectrophotometer, microcontroller based spectrophotometer,
rotary shaker, research microscope, electronic top pan balance and refrigerator. 35 Photo micrographic unit, UV-VIS Spectrophotometer and Cooling Centrifuge.

Chapter II – Specific area Compliance Audit
49
TANSCHE did not serve as an interface between HEIs and UGC, All India Council for Technical Education, etc., in matters such as implementation of RUSA, NAAC accreditation, etc., leading to deficiencies in implementing RUSA and shortfalls in obtaining NAAC accreditation as commented in Paragraphs 2.1.10.8 and 2.1.10.6 respectively.
Another envisaged function of TANSCHE was to manage research and innovation funds under RUSA. In the absence of the Council to decide on distribution of such funds, TANSCHE was not involved in this activity and hence the envisaged system of administering and routing of GoI/GoTN grants/funds in a transparent manner was not achieved.
(ii) State Level Quality Assurance Cell
NAAC mandates setting up of State Quality Assurance Cell (SQAC) to promote quality in higher education. GoTN has not constituted the SQAC and no reasons were furnished to Audit for non-constitution. It was also found that there was no alternative institutional arrangement for carrying out the functions envisaged for SQAC. As a result, the State lacked an action plan for quality improvement in higher education through NAAC accreditation, leading to large number of colleges, especially Government colleges functioning without NAAC accreditation as commented in Paragraph 2.1.10.6.
TN State Academic Audit & Accreditation Council (TNSAAAC): GoTN formed (April 2008) TNSAAAC to carry out accreditation of all Arts and Science colleges once in two years. The State Council met twice in 2010 but is yet to commence its function (May 2019). No reason was furnished to Audit for the TNSAAAC’s dormancy. Thus, the colleges are not accredited after academic audit at State Level and TNSAAAC was not facilitating NAAC accreditation as commented in Paragraph 2.1.10.6.
2.1.10.2 Institutional level governance
(i) Governing bodies of universities
Senate is the highest body of the sampled universities, except MTWU, which has an Academic Committee at the top. Besides reviewing policies and programmes, these bodies provide academic, administrative and financial oversight. In the sampled universities, except MTWU, the Syndicate is the executive body, which makes statues and exercises those powers that are not delegated to officers of the University36. In MTWU, the Executive Council makes statutes and exercises powers not delegated to officers of the University.
Audit scrutiny of the role played by these governing bodies disclosed the following: 36 Chancellor, Pro-Chancellor, Vice-Chancellor, Registrar, Finance Officer and
Controller of Examination.

Audit Report (Compliance Audit), Tamil Nadu for the year ended March 2020
50
According to the respective Acts of the sampled universities, the Senate of the University is a body with broad-based membership representing different groups including (a) ex-officio members from Government and the University, (b) members nominated by the Chancellor and (c) other members elected from different sections, such as, university graduates, Head Masters (HM) of high schools in the jurisdictional area of the University, elected members of Local Bodies, etc. It was noticed that the Senate of the universities had membership only from the ex-officio and nominated category. The Senates did not have elected members. Thus, the envisaged broad-basing, which would help in strengthening the functioning of the Senate was not achieved.
Audit found that on an average 85 per cent of members attended Senate meetings, which is convened twice a year. Government officers from Education, Revenue, Finance, Health & Family Welfare and Social Welfare, who are ex-officio members, did not attend any Senate meetings of AU, BDU and UoM 37 and the Academic Committee meetings of MTWU during the period 2014-19. Thus inter departmental coordination and multi-disciplinary expertise in decision making was not facilitated due to the absences of Government officers in Senate meetings.
(ii) Internal Quality Assurance Cell (IQAC)
The UGC has taken a policy decision to direct all universities to establish IQACs. All sampled universities had established IQACs. Audit, however, found the following deficiencies in the functioning of IQACs:
(a) Feedback from stakeholders: Receiving feedbacks on curriculum, course design, and pedagogy of classroom interaction, extent of learning, etc., from students, parents and other stakeholders on quality related issues is one of the functions of IQACs. Audit found that in UoM the feedback was not consolidated since November 2014. Similarly, in MTWU, the feedback was not consolidated during 2014-18. Audit observed that non-consolidation of feedback by two universities proved that the feedback was not put to use for quality improvement.
(b) Maintenance of database: Development and maintenance of institutional database through Management Information System is also a function of IQACs. In UoM, the IQAC, inter-alia, maintains database of enrolment, student placement and students going for higher education. Audit found that the figures furnished to National Institutional Ranking Framework (NIRF) were in variance with the data shown in the Annual Report and Annual Quality Assurance Reports as given in Table 2.15. The wide variations in the data made it unreliable.
37 Except three officers attending Senate meetings of BDU in 2017 and three others
attending the Senate meeting of UoM in March 2018.

Chapter II – Specific area Compliance Audit
51
Table 2.15: Inaccuracies in data
Year Number of students placed as per
Number of students pursued higher studies as per
Enrolment as per details furnished in/by
NIRF AQAR AR NIRF AR NIRF AQAR AR
2014-15 153 153 604 148 240 1,195 2,371 1,187
2015-16 179 179 364 104 197 1,077 1,174 1,110
2016-17 254 268 337 151 205 1,162 1,309 1,194
2017-18 266 346 0 147 0 1,298 1,488 1,378
AQAR-Annual Quality Assurance Report AR-Annual Report (Source: Details furnished by University of Madras)
(c) Academic and Administrative Audit by IQAC: As per NAAC guidelines, as a quality assurance mechanism, IQAC should conduct Academic and Administrative Audit (AAA) every year and follow up the recommendations. Audit found that the IQAC in UoM did not conduct AAA since its formation in 2005. In BDU, IQAC conducted AAA once in three years instead of every year.
(d) IQACs in sampled colleges: Out of the 32 sampled colleges, only the 12 accredited colleges had IQAC.
Thus, IQACs, although established did not receive adequate importance thus failing in its achievement of its goal to improve the academic and administrative performance of the universities and colleges.
Audit observed that the lapses in institutional level governance contributed to deficiencies in the college and course affiliations, as discussed in Paragraph 2.1.10.3. Further, the deficiencies in SFR (Paragraph 2.1.6.1) and the issue of engagement of unqualified teachers (Paragraph 2.1.6.3) were issues which could have been monitored and checked by governing bodies and IQACs in universities and colleges.
2.1.10.3 Affiliation to colleges (i) Non-compliance with affiliation norms
Affiliation norms include existence of a functional management body for the college, availability of prescribed physical infrastructure such as land, buildings, laboratories, library books, playground, constitution of college council etc. Major issues of non-compliance with affiliation norms in respect of the sampled colleges are discussed below. Appendix 2.6 gives a detailed list of non-compliance with affiliation norm.
Management body was not constituted in six colleges (AU-3, BDU-2 and UoM-1) and College Council was not constituted in any of the sampled colleges.
Minimum mandated land requirement of two acres in Chennai and five acres in other places were not met by two colleges of UoM.

Audit Report (Compliance Audit), Tamil Nadu for the year ended March 2020
52
There was no library in two constituent colleges (BDU-1 and UoM-1). In one college38 under AU, furniture was not provided in the library.
Toilet facility was not available for boys and girls in two colleges (AU-1 and UoM-1).
Playgrounds and space for physical exercise were not available in five colleges (AU-2, BDU-2 and UoM-1).
Despite major deficiencies in minimum requirements, these colleges continued functioning with temporary affiliation, since their inceptions. In the Exit Conference (November 2020) the representatives of universities opined that the universities lacked manpower to periodically verify adherence to affiliation norms.
(ii) Programmes started by colleges without affiliation (a) University of Madras
UoM had granted affiliation to 93 colleges for 451 programmes during the years 2014-19. Test check of records relating to affiliation for 194 programmes in 72 colleges disclosed the following:
Pending approval of their application for starting new programmes and increasing intake capacities etc., 53 colleges started 123 new programmes and/or increased the intake during 2014-19 (Appendix 2.7). UoM accorded post facto approval for all these unapproved programmes after a delay of one to eight years, without any penalty.
Among the 12 sampled colleges affiliated to UoM, 10 colleges had started 40 new programmes or increased intake capacity of programmes without prior permission. In all but one case, UoM had accorded post facto approval with specific conditions to be fulfilled. Audit found that nine of the colleges had not fulfilled the conditions even after one to five years of granting course affiliations with conditions.
As of March 2020, one college39 was running four programmes without the approval. UoM replied to Audit that the college had been repeatedly advised to satisfy affiliation norms. The University, however, did not take any action to publicise the list of colleges running unapproved programmes. Audit observed that routine ratification of violations by colleges would tantamount to lapses in governance and could lead to private colleges running programmes without adequate academic staff and environment.
38 Government Arts and Science College, Mudukulathur. 39 Sri Santhoshi College of Arts & Science, Maduranthakam.

Chapter II – Specific area Compliance Audit
53
(b) Alagappa University
The Standing Committee on Academic Affairs (SCAA) inter alia gives approval for starting new programmes and for increasing the sanctioned intake for a programme.
During 2014-19, 31 colleges started 187 new programmes or increased the intake capacity without waiting for formal approval. SCAA ratified the actions of the colleges and accorded post facto approval (Appendix 2.8).
The proposals for ratifying new programmes and increasing intake were taken up by SCAA belatedly. As the colleges had already started these programmes, SCAA, as fait accompli, was forced to grant post facto approval by ratifying the actions of the colleges in starting the programmes and increasing intake. This situation arose due to failure in conducting SCAA meetings on time.
To an audit enquiry, AU stated that in future, issues would be placed before the SCAA well in advance instead of getting ratification as a matter of routine.
(iii) Permanent affiliation to constituent/affiliated colleges
Colleges can apply for permanent affiliation to the university after five years of continuous operation. As of March 2020, only 23 per cent of the total colleges affiliated to the four sampled universities had permanent affiliation.
In UoM, 40 out of 114 colleges had obtained permanent affiliation and applications from six colleges seeking permanent affiliation were pending with the University.
BDU had not given permanent affiliations to any of the 132 affiliated colleges. Colleges affiliated to BDU had not applied for permanent affiliation and BDU had not taken any action in this regard for reasons not on records.
MTWU had given permanent affiliation to 10 out of 11 colleges.
In AU, only 20 out of 43 colleges had permanent affiliation.
Five out of the seven sampled Government colleges did not have permanent affiliation even though they were functioning for more than five years.
Audit observed that permanent affiliation being an indicator of availability of infrastructure, teaching and non-teaching staff, and other systems as per norms in the colleges, 228 colleges (77 per cent) in the sampled universities were functioning with temporary affiliation, even after five years of their commencement.
Audit observed that universities repeatedly ratified violation of affiliation norms by colleges, often without any penalties, and allowed them to function with temporary affiliation. This practice would render affiliation norms weak in the long run.

Audit Report (Compliance Audit), Tamil Nadu for the year ended March 2020
54
2.1.10.4 Autonomy of higher education institutions
As of March 2020, at the State level, 130 out of the 795 Arts and Science colleges (16 per cent) are autonomous. This is marginally above the target of granting autonomy to 10 per cent of the colleges by 2017. In the sampled universities, 17 per cent of total 294 colleges had autonomous status. The status of autonomous colleges in the sampled universities is given in Exhibit 2.28.
(Source: Sampled universities)
As could be seen from Exhibit 2.28, Government aided colleges fared better than Government colleges in obtaining autonomy and only four per cent self-financing colleges were autonomous.
Audit noticed that non-accreditation by NAAC and lack of permanent affiliation, which are pre-requisite for applying for autonomy, were the main reasons for not granting autonomy to several colleges.
2.1.10.5 De-burdening of universities
In the State, out of the nine public universities, five universities, viz., Bharathiyar University, Coimbatore, BDU, Tiruchirappalli, Periyar University, Salem, Tiruvalluvar University, Vellore and UoM, Chennai have more than 100 affiliated colleges.
Ideally, as the number of universities in the State should be increasing by keeping pace with the number of colleges. GoTN, however, has not started any new university after 2002. Of the nine public universities in the State, seven were started between 1982 and 2002.
2.1.10.6 Accreditation of higher education institutions
As of March 2020, all the State public universities and 210 out of 784 Arts and Science colleges (27 per cent) were accredited by NAAC.
Colleges become eligible for accreditation after the first batch of students graduate. Out of 294 colleges affiliated to the sampled universities, 258 colleges were due for accreditation as of March 2019. Out of which, only 103 colleges (40 per cent) had obtained NAAC accreditation.
It was found that out of 11 Government colleges in the sampled universities, only four (36 per cent) were accredited by NAAC. Whereas, five out of
58 50
186
15(25 per cent)
27(52 per cent) 8
(4 per cent)0
50
100
150
200
Government Aided SF Government Aided SF
Total number of colleges Number of autonomous colleges
Exhibit 2.28: Autonomous colleges in sampled universities

Chapter II – Specific area Compliance Audit
55
the nine aided colleges (56 per cent) and 1 out of the 12 self-financing colleges (eight per cent) were accredited by NAAC. This indicated poor performance of Government colleges and self-financing colleges in obtaining NAAC accreditation. These colleges would also have obtained accreditation if the SQAC and TNSAAAC functioned effectively and carried out the mandate entrusted to these bodies.
As a result of non-accreditation, 65 per cent of the colleges in the sampled universities were ineligible for UGC funding for development activities. Audit observed that non-establishment of State level Quality Assurance Cell and non-functioning of TN State Academic Audit and Accreditation Council, as commented in Paragraph 2.1.10.1 (ii) adversely impacted the ability of colleges to obtain accreditation, as these agencies were expected to provide necessary help in obtaining NAAC accreditation. Further, gaps in infrastructure and manpower in the colleges as discussed in Paragraph 2.1.9.3 (ii) (b) and 2.1.6.2 (ii) also contributed to inability to obtain NAAC accreditation.
(i) Colleges with Potential for Excellence (CPE)/Colleges of Excellence (CoE)
As of April 2017, in Tamil Nadu, 20 colleges have been awarded with CPE status and four colleges have been awarded CoE status. Audit found that none of the Government colleges in the State have figured in the list of colleges with CPE/CoE status. Only two40 (six per cent) of the sampled colleges were having CPE status.
Audit observed that one of the envisaged functions of TANSCHE was to identify and promote ‘Institutes of excellence’. However, the Council was defunct since October 2015, as commented in Paragraph 2.1.10.1 (i), leading to lack of a system to encourage colleges to apply for CPE/CoE.
Non-obtaining of CPE/CoE denied opportunity for upgrading facilities using financial assistance from UGC.
2.1.10.7 Financial Management
Government of Tamil Nadu provides funds from State budget to State public universities as grant-in-aid for salary of teaching and non-teaching staffers. Government and aided colleges also receive funds through State budget. Apart from this, the universities and colleges receive assistance from MHRD and UGC under RUSA and other schemes for infrastructure, research, etc.
(i) Financial position of universities
Financial resources have a direct bearing on the quality of higher education. Non-plan grants from GoTN, fees collected from students and interest
40 Jamal Mohamed College (Autonomous), Tiruchirappalli and National College
(Autonomous), Tiruchirappalli.

Audit Report (Compliance Audit), Tamil Nadu for the year ended March 2020
56
943.
04
840.
11
990.
96
570.
08
636.
8971.
36
843.
39
989.
76
545.
98
657.
04
0200400600800
10001200
2014-15 2015-16 2016-17 2017-18 2018-19
(` in
cro
re)
Exhibit 2.29: Receipts and charges of UoM during 2014-19
Receipts Charges
received from the corpus funds are the major sources of receipts of universities. Salaries to teaching staff is the major class of expenditure.
Receipts and expenditure of universities broadly fall under four parts.
Part I - Non Plan, includes receipts in the form of grants from GoTN, fees collected, etc., and expenditure on salaries, maintenance, operations, etc. Block grants which are periodically fixed, based on the excess of expenditure over revenue of the universities and additionalty grant to compensate the universities for meeting increase in salary expenditure are the main non-plan grants from GoTN.
Part II - Plan, includes receipt from GoTN, UGC and other agencies for specific development activities and research activities and expenditure met therefrom.
Part III - Earmarked fund, mainly includes transactions under endowments created for specific fields of studies.
Part IV - Other Funds, includes Provident Fund, Pension Fund and Contributory Pension Fund.
The financial position of the sampled universities are given in Appendix 2.9 and discussed hereunder.
(a) University of Madras
The receipts and charges of UoM during 2014-19 are given in Exhibit 2.29. The excess of expenditure over receipts during 2014-15, 2015-16 and 2018-19 was on account of increasing deficit under Part I Non-Plan account as shown in Exhibit 2.30.
(Source: Annual Accounts of UoM)
Diversion of funds from Plan account: During 2014-19, the expenditure on salaries and other non-plan expenditure exceeded the receipts by ` 78.14 crore. The accumulated deficit under non-plan account of UoM as on 31 March 2019 was ` 61.03 crore. UoM financed the deficit mainly through temporary diversion of funds from Part II Plan account, which is meant for research and development activities. In their reply (February 2021),
145.
67
109.
13
243.
16
275.
29
186.
70
156.
77
153.
87
263.
83
256.
23
207.
39
050
100150200250300
2014-15 2015-16 2016-17 2017-18 2018-19
(` in
cro
re)
Exhibit 2.30: Part I Non-plan account of UoM during 2014-19
Receipts Charges

Chapter II – Specific area Compliance Audit
57
UoM stated that the transfer of funds from Plan to Non-plan account was a temporary measure and would be reversed.
Deficiencies in managing the finances of UoM are discussed below:
The University did not revise the fee structure for over 15 years despite continuous increase in salary and other expenditure. Thus, while expenditure has increased substantially, revenue has remained stagnant due to non-revision of fees.
Issues in block grant fixation: The block grants are periodically fixed by GoTN by calculating the excess of the expenditure on salaries, building maintenance, stationery and printing, etc., over receipts through fees, income from land and building, etc. After its revision in 1996-97, in August 2017, GoTN constituted a Committee for revision of block grants to the universities under the control of State Higher Education Department. The Committee made its recommendation based on the audited annual accounts for the year 2015-16. Scrutiny of working papers41 of the Committee for recommendation for revised block grant in respect of UoM disclosed that the Committee fixed the revised block grant as ` 759.68 lakh instead of ` 860.22 lakh by inadvertently taking ` 100.54 lakh received towards fee concession for SC/ST students as income pertaining to the year 2015-16. However, this item of “revenue” was pertaining to the period from 2004-05 to 2013-14 towards reimbursement of tuition fees and was reimbursed by the Government in 2015-16. UoM did not point out this error in calculation of block grants.
The following expenditure, which were treated as ineligible for the purpose of calculation of block grants, caused short receipt of grants by UoM from GoTN:
Salaries to the tune of ` 1.88 crore paid to staff occupying posts not approved by GoTN were disallowed at the time of fixation of block grant.
GoTN disallowed excess expenditure of ` 6.43 crore per annum on granting higher benefits, in deviation of Government orders. GoTN had not accepted the independence exercised by the University in deciding higher scales of pay and promotions for its staff.
Expenditure of ` 71.28 crore incurred by the University in respect of its constituent colleges was not included in the block grant calculation.
Idle investment in buildings: The Chairman of the Senate in its meeting dated 25 March 2017, opined that construction of many buildings during the last ten years, with or without demand, was one of the reasons for the increasing deficit. It is pertinent to mention
41 In Higher Education Department.

Audit Report (Compliance Audit), Tamil Nadu for the year ended March 2020
58
that CAG’s Audit Report (G&SSA), 2016-17 and 2017-18 pointed out unfruitful expenditure totalling ` 32.89 crore42 in respect of two separate buildings. As already pointed out by Audit and opined by the Chairman of the Senate, the University squandered huge sums in construction of buildings without assessing the need therefor.
The above lapses resulted in financial constraints leading to diversion of funds from Plan account to Non-Plan account. Consequently, the University compromised on research and development activities which are to be funded through the Plan account. Audit observed that if left unchecked, the widening gap in Non-plan account would lead to lesser focus on research and development and thereby could seriously impact the functioning of UoM.
(b) Alagappa University
The overall receipts of the University continued to be in excess of the expenditure. Audit, however, found that the accumulated deficit under the General Account of the University increased from ` 62.24 crore in March 2014 to ` 118.35 crore in March 2019. The University was able to manage the deficit by transferring from the Distant Education (DDE) Fund. During 2014-19, ` 83.30 crore was transferred from DDE fund to the General Fund to meet the deficit in General Account. Audit observed that the funds transferred from DDE exceeded the ceiling of 15 per cent of receipts stipulated for transfer. Thus, over reliance on DDE would not be a sustainable option for the University.
(c) Mother Theresa Women’s University
Total expenditure was in excess of receipts during the years 2016-17 and 2018-19. Audit noticed that the deficit of MTWU was mainly due to non-release of grant to meet salary expenditure in respect of all the 85 teaching and 109 non-teaching staff for MTWU. GoTN considered the salary expenditure of only 33 teaching and 45 non-teaching posts for additionalty grant.
Thus, Audit observed that the sampled universities had to rely mainly on GoTN due to inadequate internal generation of revenue.
2.1.10.8 Funds under RUSA
RUSA funds are sanctioned under 12 components including infrastructure creation, research and innovation etc. Sanction is norm-based and outcome dependent. The funds flow from GoI to State and then to the identified HEIs. The details of RUSA funds received by the four sampled universities and 5 of the 32 sampled colleges during 2015-19 is given in Table 2.16.
42 Audit Report 2016-17 (` 22.79 crore) and Audit Report 2017-18 (` 10.10 crore).

Chapter II – Specific area Compliance Audit
59
Table 2.16: Funds released under RUSA (` in crore)
Year Approved outlay for the state
Funds released Funds released to
state universities
Funds released to
Government colleges
Central share
State share
Total
2015-16 RUSA I
55.22 34.94 90.15 51.97 33.19
2016-17 53.60 36.55 90.15 47.26 42.87
2017-18 RUSA II
41.23 38.13 79.35 32.72 36.63
2018-19 55.95 73.88 129.83 111.30 13.53
Total 206.00 183.50 389.48 243.25 126.22
(Source: Information provided by State Government)
(i) University of Madras:
Diversion of grant: UoM received an Infrastructure grant of ` 20 crore during March 2016 to December 201843 out of which ` 7 crore was sanctioned for new buildings for the School of Mathematics and Boys Hostel in the Guindy Campus, after demolishing the existing old buildings. After receiving the funds, the University diverted it to fund the ongoing construction of a multi-storey building at Guindy Campus, which was originally proposed to be constructed using University funds.
To an audit enquiry, UoM replied (March 2020) that due to difficulty in finding a place to relocate the existing School of Mathematics and the Boys hostel and issues in getting plan approval on account of the proximity of the site to Cooum river, the sanctioned fund was diverted.
The reply is not acceptable because the issues pointed out in the reply ought to have been considered while the proposal was submitted to avail RUSA grant. A joint physical verification of the two buildings revealed that both the existing buildings were very old and dilapidated.
Audit therefore concluded that the financial position of the sampled universities was not satisfactory. Universities had to divert funds from other heads, including those earmarked for research, to manage administrative expenses.
2.1.11 Recommendations
GoTN may speed up the recruitment process and consider adhering to UGC guidelines on guest faculty honorarium.
GoTN may consider the feasibility of shifting surplus teachers in university departments with low SFR to the constituent colleges of the university.
43 March 2016 (` 10 crore), May 2018 (` 5 crore) and in December 2018 (` 5 crore).

Audit Report (Compliance Audit), Tamil Nadu for the year ended March 2020
60
Government may consider setting up of new Government or constituent colleges in districts with low college density and facilitate more number of private colleges in these districts to synergise the efforts by Government. Special emphasis should be given for starting new colleges in the districts having sizable SC/ST population, so as to address the issue of lower GER among the under previllaged communities.
In order to narrow down the gap between overall GER and GER of SC/ST students, Government should work on increasing accessibility to higher education in districts with higher population of SC/STs.
Government should speed up the long pending process of fee fixation for self-financing colleges and self-supporting programmes in aided colleges.
Government should frame guidelines for HEIs to assess the availability of funds for recurring expenditure on repairs and maintenance of costly equipment and other infrastructure before accepting/utilising GoTN/GoI/UGC funds for capital expenditure.
Government should prioritise constitution of the Council of TANSCHE as envisaged in the Act with enough independence and defined roles so as to strengthen governance at State level.
SQAC and TNSAAAC should be reactivated to ensure quality of HEIs and facilitating NAAC accreditation.
Institution level monitoring should be strengthened and universities should avoid the practice of routine ratifications of programmes started by affiliated colleges without seeking prior approval. Universities should set annual time lines for submitting applications for approval of new programmes and take timely decisions on such applications.
Universities should concentrate on measures to augment revenue generation. The University of Madras should refrain from diverting funds from Plan Account for Non-Plan expenditure.

CHAPTER III COMPLIANCE AUDIT


61
CHAPTER III
COMPLIANCE AUDIT
Compliance Audit of Departments of the Government and their field formations as well as autonomous bodies brought out several lapses in management of resources and failures in observance of norms of regularity, propriety and economy. These have been presented in the succeeding paragraphs.
3.1 Avoidable/Unfruitful expenditure
HEALTH AND FAMILY WELFARE DEPARTMENT 3.1.1 Unfruitful expenditure on revival of Anti Snake Venom
Serum manufacturing unit
Launching a project to revive Anti Snake Venom Serum manufacturing, without comprehensive technical and financial feasibility study and ensuring source of funding, resulted in unfruitful expenditure of ` 16.77 crore.
Snakebite is an acute life threatening medical emergency. It is a preventable public health hazard often faced by the rural population. Tamil Nadu reported 63,236 snake bite cases and 241 deaths during the period 2014-18. Timely treatment with Anti snake venom serum1 (ASVS) is the medical option for preventing casualty.
King Institute of Preventive Medicine and Research, Chennai (KIPMR), established in the year 1899, is a medicine research institute functioning under the Directorate of Medical Education (DME). It is the only Tamil Nadu government institution for manufacturing ASVS. The Department of Anti Toxin (DAT) of KIPMR had been manufacturing ASVS since 1982 and supplying them to various government hospitals and private firms. KIPMR was having the licence to manufacture the vaccines till December 2000. Thereafter, the license was not renewed due to amendment of Good Manufacturing Practices (GMP) norms. The Central Drugs Standard Control Organisation (CDSCO), after inspecting DAT of KIPMR in 2001, 2004 and
1 ASVS is the only antidote and life-saving treatment for venomous snakebite. DAT
was manufacturing ASVS to treat bites by the four common poisonous snakes found in India - Cobra, Russell’s viper, Common Krait and Saw-scaled viper. ASVS is produced by hyper immunising the horses and extracting the serum from the blood of hyper immunised horses.

Audit Report (Compliance Audit), Tamil Nadu for the year ended March 2020
62
2006, found that the manufacturing unit was not compliant with the GMP norms, as specified under Part I and Part I-A of Schedule M of the Drugs and Cosmetic Act, 1940. CDSCO recommended (December 2006) construction of a new facility if KIPMR intended to renew its license and continue vaccine manufacture. Following this, KIPMR submitted proposals to DME in March 2007, June 2008 and June 2009 for modification to the existing facility, to become GMP compliant.
In February 2010, DME submitted the final proposal of KIPMR to the Government of Tamil Nadu (GoTN) for modification/upgradation of DAT building, as proposed by a cGMP (current GMP) consultant, at a cost of ` 4.71 crore. The Public Works Department (PWD) authorities, however, after inspecting the site, suggested (June 2011) construction of a new building instead of modification of the existing DAT building, as it was of a load bearing type, wherein alterations were difficult. Accordingly, PWD prepared (March 2012/February 2014) rough cost estimates and plan for construction of a new building to house the ASVS production facility, complying with cGMP norms, and modification of old DAT building which was proposed to be used as a Quality control and Quality assurance block. Further, DME proposed (June 2012) the revival of ASVS production in two phases - Phase I for construction of buildings and Phase II, called ‘production phase’, for other requirements such as purchase of equipment, horses, medicines and chemicals, etc., which was also accepted (November 2013) by GoTN. On completion of this project, KIPMR was envisaged to become a centre of excellence with state of the art facility in compliance with cGMP and WHO guidelines, with an initial target to manufacture two lakh vials of ASVS per year, to meet the annual requirement of ASVS in Tamil Nadu.
Exhibit 3.1: Newly constructed DAT building Exhibit 3.2: Interior of the building
(Source: Joint physical verification)

Chapter III - Compliance Audit
63
Phase I (Construction of buildings)
GoTN sanctioned an aggregate sum of ` 17.35 crore2 in December 2012 and December 2014 for construction of a new cGMP compliant building and improvement/renovation of the old DAT building so as to revive ASVS production. The work commenced in August 2013 and the civil part of the buildings, completed at a cost of ` 16.77 crore3, were handed over to KIPMR in June 2017 and inaugurated by the Chief Minister on 05 August 2016.
Phase II (Production phase)
Audit found that while proposing to revive ASVS manufacturing in 2010, DME and KIPMR did not have a clear project report incorporating technical and financial feasibility study. Therefore, the project proposal was getting revised repeatedly as given in Table 3.1.
Table 3.1: Proposals of KIPMR for Phase II (Production stage)
Sl. No.
Date of proposal
Components Cost (` in crore)
Recurring Non-recurring
Total
1 June 2012
(a) Equipment, (b) Horses, (c) Venoms and Chemicals, (d) Computer and accessories and (e) Glass wares.
1.81 5.63 7.44
2 June 2013
(a) Equipment, (b) Horses, (c) Venoms and chemicals, (d) Civil and electrical works, (e) Manpower, (f) Computers and accessories, (g) cGMP consultation fees and training and (h) Laboratory glassware.
24.65 12.25 36.90
3 February 2014
(a) cGMP compliant equipment, (b) Additional amenities in new DAT building, (c) Modification of existing DAT building for Quality control, Quality assurance and R & D lab, (d) Manpower, (e) Purchase of increased number of horses-300, (f) Horse feed and medicines, (g) Consumables, (h) Computers and accessories and (i) cGMP consultation fees.
42.77* 19.60 62.37
* Covering a three year period (Source: Records of KIPMR)
After prolonged deliberations and back and forth communication between GoTN, DME and KIPMR, in May 2014, it was decided that the Phase II proposal be forwarded to Government of India (GoI) for sanction of funds under National Health Mission (NHM). Accordingly, KIPMR engaged (October 2015) a consultant to prepare a Detailed Project Report (DPR) for
2 (i) Construction of a new DAT building (AS - ` 7.36 crore/December 2012; RAS -
` 7.99 crore/April 2015), (ii) Provision of additional infrastructure facilities in the new DAT building (AS - ` 7.06 crore/December 2014) and (iii) Improvement and renovation of the old DAT building (AS - ` 2.30 crore/December 2014).
3 (i) ASVS new building - ` 7.36 crore; (ii) Additional infrastructure facilities for the new building - ` 7.06 crore; (iii) Improvement and renovation of old DAT building - ` 2.30 crore and (iv) Consultancy charges - ` 0.05 crore.

Audit Report (Compliance Audit), Tamil Nadu for the year ended March 2020
64
Phase II. The Mission Director, State Health Society - Tamil Nadu (MD SHS-TN) forwarded (December 2015) the DPR and the revised Phase II proposals to GoI for sanction of ` 56.28 crore4. GoI, however, returned (January 2016) the proposal stating that financial support was not available for manufacturing units under NHM. The Health Secretary, GoTN, however, directed (May 2018) that the project should be resubmitted to GoI as a special scheme with funding from GoI and GoTN in the ratio of 60:40. DME and KIPMR did not follow up this suggestion.
Simultaneously, KIPMR also attempted funding by Tamil Nadu Medical Services Corporation Limited (TNMSC), Tamil Nadu Health Systems Reforms Project and Tamil Nadu Innovation Initiatives. None of these agencies came forward for funding this project. The Health Secretary, during a review meeting in April 2019, instructed KIPMR to redo the project to minimise the cost in consultation with MD, TNMSC and submit revised proposal. The MD, TNMSC, while observing that the project was financially unviable, stated (October 2019) that the recurring cost projected in Phase II was equal to the amount spent by TNMSC on purchase of ASVS every year from private manufacturers and suggested considering Public Private Partnership mode for implementing the project. DME and KIPMR did not follow up on this suggestion.
Audit observed that DME and KIPMR, while submitting the proposal for reviving ASVS manufacturing, failed to comprehensively assess the feasibility of the project. Audit also found that the requirement of ASVS by government medical institutions were met by TNMSC through private suppliers. During 2016-19, TNMSC procured an annual average of 1.70 lakh vials of ASVS at an average price of ` 308.59 per 10 ml vial. Other than the Central Research Institute, Kasauli, which is under GoI, there were five private manufacturers in India for manufacturing ASVS. As could be seen from the remarks of MD, TNMSC, there was no shortage or impending scarcity for ASVS. DME, while justifying the need for this project, incorrectly calculated (December 2010) that the cost of production would be only ` 23.90 per vial. Audit, however, found that the cost of production worked out by DME was inaccurate as it did not include the salaries, overheads, depreciation cost of plant and machinery, interest on capital investment etc.
Thus, Audit observed that GoTN launched the project without a detailed technical and financial feasibility study, and without ascertaining the eligibility of GoI assistance for this project. Further, GoTN did not provide the required funds for the project which resulted in non-revival of manufacture of ASVS at KIPMR and an unfruitful expenditure of ` 16.77 crore on construction of new buildings and modification of existing building.
4 (a) Building & civil works (Veterinary Section) - ` 14.25 crore, (b) Equipment
for production - ` 26.43 crore, (c) Quality control and lab instruments - ` 3.55 crore, (d) Veterinary Section equipment - ` 1.07 crore, (e) 300 horses – ` 3 crore, (f) Pre-operative expenses - ` 4.77 crore, (g) Preliminary expenses - ` 0.05 crore, (h) Contingencies - ` 1.82 crore and (i) Margin for working capital - ` 1.33 crore.

Chapter III - Compliance Audit
65
Audit recommends that Government may take an early decision on the project, and initiate action for utilisation of the new facilities.
The matter was referred to Government in November 2020; reply has not been received (June 2021).
RURAL DEVELOPMENT AND PANCHAYAT RAJ DEPARTMENT
PANCHAYAT UNIONS IN SALEM DISTRICT
3.1.2 Unfruitful expenditure on purchase of bio-digester tanks
Poor planning and implementation of installation of bio-digester/bio-tank toilets resulted in non-achievement of objective of improved sanitation in rural areas and also led to unfruitful expenditure of ` 4.44 crore.
The scheme for provision of Individual House Hold Latrine (IHHL) with bio-digester/bio-tank was under implementation under the erstwhile Nirmal Bharat Abhiyan programme. The scheme was subsumed as a component under Swachh Bharat Mission (Gramin) (SBM (G)) with effect from 2 October 2014. The IHHLs envisaged under SBM (G) consisted of a super structure with water facility and a sub structure for decomposition of human wastes. Bio-digester based toilets employs a technology developed by the Defence Research Development Organisation which includes a Fibre Reinforced Plastic tank and microbial seed digester. The technology uses anaerobic bacteria for bio-digestion of human waste, resulting in conversion of the waste into treated effluent water and release of methane gas in an eco-friendly manner.
The cost of construction of latrines was funded through an incentive (subsidy) of ` 12,000 to the Below Poverty Line families, which was to be shared in the ratio of 60:40 by GoI and GoTN. The Panchayat Unions (PU) implementing the scheme were to procure and supply the bio-digester tanks with digester5, and release subsidy to the beneficiary after reducing the cost of bio-digester tank. Government of India (GoI) also provided the approved list of firms for Transfer of Technology (TOT) for establishment of bio-digester toilets under IHHL.
Audit scrutiny (March/May 2019) of records of the District Rural Development Agency (DRDA), Salem and test check in six6 out of 20 PUs
5 Seed material of microorganisms to facilitate anaerobic decomposition of organic
waste. 6 Attur, Gangavalli, Magudanchavady, Salem, Tharamangalam and Yercaud.

Audit Report (Compliance Audit), Tamil Nadu for the year ended March 2020
66
revealed that the Project Director, DRDA, Salem directed (January 2015) the PUs in the District to procure 500 numbers of bio-digester tanks each for distribution to the beneficiaries under SBM (G). Accordingly, 17 out of 20 PUs in Salem district invited (February-July 2015) quotations from three firms and the lowest quote of a Chennai based firm was selected for supply of a total of 7,950 bio-digester tanks.
The contracted firm supplied (February-August 2015) 7,950 tanks of 500 litre capacity valued ` 4.53 crore at ` 5,700 per tank and the PUs paid a total sum of ` 4.44 crore to the supplier as of December 2020. Of this, 2,722 were issued (December 2020) to beneficiaries for installation and the remaining 5,228 valued ` 2.98 crore were lying undistributed in the custody of the respective PUs (December 2020) for more than four years (Exhibit 3.3). Records scrutinised, did not indicate installation of these tanks by the beneficiaries. Further, a joint physical verification (March and May 2019) by Audit and PU officers in the sampled PUs, disclosed that 65 out of 100 tanks supplied to beneficiaries in test-checked eight Village Panchayats (VPs) were being used for water storage (Exhibit 3.4) and the balance tanks were kept unutilised.
Exhibit 3.3: Tanks lying undistributed in the custody of Tharamangalam PU
Exhibit 3.4: Tanks supplied for Bio-digester toilets used for water storage in
Attur PU
(Source: Joint physical verification)
Audit observed the following:
Commissioner of Rural Development and Panchayat Raj, Chennai (CRDPR) had not issued any guideline for implementing the IHHL scheme under the newly launched SBM (G). Thus, the decision (January 2015) by DRDA, Salem to set a target of 500 bio-digesters in each PU in the District did not have the concurrence of the Head

Chapter III - Compliance Audit
67
of the Department viz., CRDPR. The PD, DRDA, Salem, however, replied (May 2019) to Audit that State level authorities gave oral instructions to implement the bio-digester based toilet scheme in Salem district. Audit could not verify the “oral” instruction, but observed that implementing a scheme on a large outlay, based on an “oral” instruction, was against the tenets of propriety and good governance.
DRDA, Salem’s directions to purchase 500 bio-digesters by each PU in the District issued in January 2015 was followed up by placing work orders from February 2015 and supplies being received from March 2015. As per the records produced to Audit, need based analysis was neither carried out by DRDA, Salem, nor any beneficiary list prepared after making beneficiaries understand the concept of bio-digester latrines. Procurement of bio-tanks without finalising beneficiary list was one of the reasons for 5,228 bio-tanks lying undistributed with the PUs.
The cost incurred by each PU for the bio-digesters amounted to ` 28.50 lakh at the accepted rate of ` 5,700 per tank. Though the Tamil Nadu Transparency in Tenders Rules, 2000 requires calling of tenders for procurements exceeding ` 25 lakh, the PUs neither floated tenders nor called for quotations from the GoI’s approved list of TOT holders. Though the supplier selected from the quotations called for was stated to be a dealer7 of one of the approved TOT holders, there were no records to substantiate that the supplier had the technical know-how with regard to installation and functioning of the bio-digester.
The supplier was responsible for the installation and functioning of the tanks. Only three PUs had included a condition to retain 10 per cent of the cost of supply till completion of the work in the payment terms. As a result, 14 of the 17 PUs had paid the full amount to the supplier without ensuring installation of bio-digester tanks and the remaining three PUs paid 90 per cent of the order value of ` 28.50 lakh per PU.
A joint physical inspection of sites (May 2019) by Audit along with the staff of six PUs revealed that though the invoices indicate supply of ‘Anti bacterial bio-tank with digesters’, the tanks were supplied without the ‘digesters’. The PUs sampled by Audit attributed (May 2019) non-supply of digesters for non-utilisation of the tanks for the intended use. Audit noticed that despite the ‘digesters’ not being supplied, 14 of the 17 PUs made 100 per cent payment and three others made 90 per cent payment without inspecting and ensuring the supply of goods and services as per the
7 M/s. Asterisk Technologies, Chennai.

Audit Report (Compliance Audit), Tamil Nadu for the year ended March 2020
68
purchase order. No action was contemplated against the supplier for not supplying goods as per specifications.
The work orders did not have any condition on warranty period and Bank Guarantee for default. Hence, the PUs had no hold on the supplier to help installation of the bio-digesters. Further, the bio-tank capacity and technical details of the digester were not given in the work order. The deficiencies in the work orders also contributed to settlement of supplier’s bills without ensuring functioning of the bio-digester toilets.
SBM (G) guidelines emphasised effective information, education and communication strategies to nudge communities into adopting safe and sustainable sanitation practices. Audit, however observed that no action was taken by the DRDA, Salem to educate the beneficiaries about the uses of the new technology. One among the sampled PUs had attributed (May 2019) reluctance of the beneficiaries to switch over to the innovative technology for the non-utilisation of tanks for intended use.
DRDA, Salem replied (May 2019) that the decision to construct bio-digester/ bio-tank models at all PUs in the District was taken up on an experimental basis and based on field requirements. Audit, however, observed that the decision to procure 7,950 bio-digester tanks simultaneously in all the PUs of the District could not be considered as an experimental project. It was indeed a large scale implementation of the project. Further, the field requirement quoted in the reply was not substantiated.
Thus, failure of DRDA, Salem (i) in carrying out the decision to purchase the bio-digesters without proper guidance from CRDPR, (ii) to follow tender procedures for selection of technically qualified supplier, (iii) to ensure installation of bio-digester tanks prior to making payments, and (iv) to create awareness of the innovative technology, had resulted in non-achievement of the objective of improving sanitation levels in rural areas in an eco-friendly manner and also resulted in the idling of 7,950 tanks purchased at a cost of ` 4.44 crore and ineffective usage of the bio-digester tanks supplied to the beneficiaries. Hence, Audit concluded that the entire expenditure of ` 4.44 crore was unfruitful.
Audit recommends that Government may order an enquiry into the procurement process, and investigate the circumstances under which full payment was made by PUs before completing installation. Responsibility may be fixed for these lapses. Action may also be taken to utilise the tanks in construction of latrines sanctioned under SBM (G).
The matter was referred to Government in January 2021, reply has not been received (June 2021).

Chapter III - Compliance Audit
69
AGRICULTURE DEPARTMENT
3.1.3 Non-recovery of misused subsidy
Failure of the department to frame a comprehensive guideline and to enforce the existing guidelines resulted in misuse of subsidy of ` 3.01 crore, besides non-achievement of the intended objectives of SMAM.
The Sub Mission on Agricultural Mechanisation (SMAM), a scheme sponsored by the Government of India (GoI), is being implemented by the Government of Tamil Nadu (GoTN) since 2014-15. The scheme has eight components, of which four8 components are being implemented in Tamil Nadu with GoI and GoTN meeting 60 per cent and 40 per cent of the expenditure respectively. The scheme is implemented as per GoI’s Operational Guidelines and State level implementation guidelines issued by GoTN and the Chief Engineer (CE), Agricultural Engineering (AE) Department, monitors the implementation of the scheme at the state level. The objective of SMAM is to increase the reach of farm mechanisation to small and marginal farmers and to the regions where availability of farm power is low.
Under the component ‘Financial Assistance for Procurement of Agriculture Machinery and Equipment’, a subsidy of 40 to 50 per cent9of the cost of the machinery/equipment is available to individual farmers for procuring tractor, tiller, rotavator, paddy transplanter, etc. Under the component ‘Farm Machinery Banks for Custom Hiring’, financial assistance10 upto ` 10 lakh is available for establishing Custom Hiring Centres (CHC). As per the modalities issued by CE (AE), subsidy is released electronically to the beneficiary. As per the guidelines (June 2017), the beneficiary farmers and CHCs are not allowed to sell the machineries/equipment purchased by them within four years of purchase.
Test check of records relating to implementation of SMAM in 11 divisions of Agricultural Engineering Department (AED) disclosed that in five11 divisions audited between November 2020 and February 2021, 105 beneficiaries, to whom a total subsidy of ₹ 3.01 crore had been released for purchase of a total of 109 tractors (Appendix 3.1), had sold the tractors purchased by them using Government subsidies. As per the data on vehicle ownership available in the
8 (i) Component 3: Financial assistance for procurement of agriculture machinery and
equipment; (ii) Component 4: Establish farm machinery banks for custom hiring; (iii) Component 5: Establish hi-tech, high productive equipment hub for custom hiring and (iv) Component 6: Promotion of farm mechanisation in selected villages.
9 50 per cent to small, marginal, SC, ST and women farmers and 40 per cent to other farmers or the maximum permissible subsidy amount fixed by GoI, whichever is less.
10 The unit cost for establishing a CHC is ₹ 25 lakh. Forty per cent of the total cost or a maximum amount of ₹10 lakh per CHC and the balance 60 per cent is the beneficiary contribution.
11 Cuddalore, Kancheepuram, Ramanathapuram, Tiruvallur and Tiruvannamalai.

Audit Report (Compliance Audit), Tamil Nadu for the year ended March 2020
70
website12 of the Ministry of Road Transport and Highways of GoI, these 109 tractors were not in the name of the original beneficiaries but registered in the name of new owners to whom they were eventually sold within 1 to 35 months of purchase.
Audit observed that purchasing tractors using 40 to 50 per cent Government subsidy and selling it to others amounted to misuse of subsidy for personal gain and would consequently adversely impact achievement of objectives of the scheme.
In this connection, the following observations are made:
Although the scheme modalities and the agreement signed with the beneficiary made it mandatory for the beneficiaries to retain the tractors for a minimum of four years, no attempt was made to prevent the beneficiary from selling the tractors by making suitable endorsement in the vehicle registration certificate (RC). Such an endorsement in RC was made mandatory only in October 2020.
CE (AE) made the Divisional Executive Engineers (EE) responsible for furnishing a monthly report on the availability of machineries/equipment in the CHCs in their jurisdiction. But this system was not followed. CE (AE) stated (March 2021) that EEs were unable to furnish the monthly reports due to heavy work load. Audit found that the reply was acceptable in view of the large number of beneficiaries. But, the reply proved that the system of monthly report envisaged by CE (AE) was impractical to check misuse of subsidy, and in effect the Department did not have a system to check misuse of subsidy by beneficiaries.
Even though GoTN has taken necessary steps to prevent recurrence of malpractice by making it mandatory to make endorsement in RC, no action was taken to recover the subsidy from those beneficiaries who misused government scheme for personal gain.
Thus, the failure of GoTN to frame a comprehensive guideline with enough provision to prevent misuse of subsidy and failure of AED to strictly enforce the existing guidelines/modalities resulted in misuse of subsidy to the tune of ₹ 3.01 crore, besides non-achievement of the intended objectives of SMAM.
In their response to the above findings and the recommendation to recover the misused subsidy, GoTN replied (March 2021) that proactive action was taken by the Government to prevent any misuse by getting an agreement signed with the beneficiary on stamp paper and endorsing the RC book of tractors. GoTN, further, stated that GoI sponsored schemes are implemented based on guidelines issued by them, and GoI guidelines was not clear on recovery of misused subsidy. In this connection Audit found that the guidelines issued by GoI had made GoTN responsible for “effective implementation and
12 https://vahan.parivahan.gov.in

Chapter III - Compliance Audit
71
supervision of Scheme”. Further, the guidelines had also envisaged engaging of Village Panchayats in implementing the scheme; which was also not done by GoTN. Thus, the primary responsibility of preventing misuse by building in safeguards rested with the implementing State Government department.
While appreciating the action taken by GoTN and CE (AE) in making RC book endorsement mandatory, Audit observed that the action taken could, in future, check the misuse of subsidy for tractors alone. It is, however, observed that there was still no system to prevent misuse of subsidy in respect of other machinery/implements which do not require RTO registration. Further, action has not been initiated for recovery of the misused amount, despite breach of the agreement executed by the beneficiaries, on stamp paper, undertaking not to dispose of the machinery within four years.
Audit recommends that:
The Audit findings, being based on sample Divisions, CE (AE) may undertake a comprehensive survey of ownership of all subsidised tractors and other machinery.
Action may be initiated to recover the misused subsidy and lapses on the part of field level functionaries may be investigated to fix responsibility.
GoTN should consider instituting a robust system to monitor retention of all machineries/equipment by all beneficiaries for the stipulated four year period.
3.2 Loss/Short collection of revenue
REVENUE AND DISASTER MANAGEMENT DEPARTMENT
3.2.1 Encroachment of Government land and short collection of revenue
Failure of the Government and Revenue authorities to take timely action had resulted in unauthorised occupation of Government land worth ` 14.16 crore and short collection of revenue of ` 7.38 crore.
Revenue Standing Order 24-A (RSO 24-A) stipulates that, Government may grant temporary occupation of State’s land for non-agricultural purpose, to a company, association or society for a maximum period of 20 years. The lease rent is fixed as per orders of Government and should be revised at the time of renewal of lease or once in three years, whichever is earlier. RSO 24-A further stipulates that the lease rent shall be paid within 90 days from date of

Audit Report (Compliance Audit), Tamil Nadu for the year ended March 2020
72
order of lease, failing which the lease is liable for cancellation. Further, Section 6 of Tamil Nadu Land Encroachment Act, 1905 empowers the authorised officers to evict unauthorised occupants after issuing notice under Section 7 of the Act.
Scrutiny of records of Tiruparankundram Taluk Office during March 2019 and Revenue Department of GoTN in September 2020 revealed that way back in 1980s a private school13 (School) had encroached Government land14 of eight acres adjoining its campus at Pasumalai in Madurai. Based on the request (1987) of the School for leasing out the already encroached eight acres of land for expanding the school, GoTN accorded sanction (June 1993) for leasing three acres (1,30,680 sq. ft.) of land for the purpose of establishing playground facilities for the School subject to the condition that the remaining five acres of land which was under occupation of the School should be returned to Government. The lease deed was for a period of 20 years, from 9 June 1993. The lease rent was fixed at seven per cent of market value of land, to be revised once in three years. The lease rent was initially fixed as ` 0.93 lakh per annum, payable in advance.
Audit found that the School continued to unauthorisedly hold the five acres of adjoining land ordered to be handed over to Government and had provided fencing around the entire eight acres of land. Further, the School also held the three acres of leased land by paying lease rent at 1993 rates, and without extension of lease agreement beyond June 2013.
The chronology of events that contributed to unauthorised occupation of Government land and short collection of lease rent are discussed below:
Despite clear instructions (June 1993) by GoTN to take back the five acres of land adjoining the leased land, the Revenue Officers entertained a request (January 1994) from the School to lease out this parcel of five acres as well. Based on recommendations from District Revenue authorities, the Commissioner of Land Administration (CLA) recommended (October 1998) to Government for leasing of an additional two acres, out of the additional five acres requested by the School. Even as this proposal was under examination by GoTN, the School management requested (June 1999) GoTN to sell the entire land to them on a concessional rate. Acting on this request, GoTN directed (August 1999) CLA to furnish a report on the request made by the School. The proposal for sale of the entire eight acres of land was recommended by Tahsildar (April 2000), Revenue Divisional Officer (June 2000) and District Revenue Officer (DRO) (November 2001) along with
13 Devasagayam Matriculation School, Pasumalai, Madurai. 14 Unassessed wasteland forming part of a total extant of 180.10 acres in Madakulam
Village, Madurai District.

Chapter III - Compliance Audit
73
the ‘no objection’ provided (March 2001) by the Madurai City Municipal Corporation. CLA, however, did not agree to the valuation done by the Revenue officers and directed (November 2001) the DRO to submit revised proposals based on market value of the land. Further, Government had also required (February 2002/September 2002) speedy action on the above proposal.
The School management, GoTN, CLA and District authorities had protracted communication, on leasing additional land/outright sale of the land to the School, since October 1997. As GoTN had not conveyed any decision on these proposals till November 2020, the School continued to unauthorisedly occupy the entire eight acres by paying lease rent for three acres at the old rates. Meanwhile, the Tahsildar, Tiruparankundram Taluk, who is responsible for ensuring timely collection of lease rent, did not initiate any action to revise and collect lease rent in respect of the three acres which was leased out to the School, till May 2005. Action to renew the lease agreement was taken in June 2015, though the agreement validity was over in June 2013.
In March 2015, CLA cited a Government letter of 2002 and directed the District Authorities to revise the lease rent periodically based on market rates decided by them. Following this, the Tahsildar, Tiruparankundram raised (April 2017) a demand for ` 4.45 crore from the School by revising the lease rent retrospectively from June 1996.
The School did not pay the revised lease rent and also refused (2018) to apply for renewal of the lease on the pretext that their request for outright sale of the land was still under consideration by GoTN.
Exhibit 3.5: Land being unauthorisedly used as playground
(Source: School website)

Audit Report (Compliance Audit), Tamil Nadu for the year ended March 2020
74
As per the provisions of RSO-24-A and the lease agreement, non-renewal of lease and failure to pay lease rent would amount to cancellation of lease after issue of show cause notice. It was, however, noticed that the Revenue authorities failed to initiate action to vacate the land occupied by the lessee on completion of the lease period of 20 years and on the refusal to pay lease rent at the revised rates. Also, except for raising a consolidated demand for the pending lease rent dues, no further action was taken for its recovery.
As seen from the records produced to Audit, the Tahsildar, Tiruparankundram, issued eviction notice under Section 7 of Tamil Nadu Land Encroachment Act, 1905, only in March 2019 despite five acres of land being under encroachment since June 1993 and the lease period of another three acres ending in June 2013.
On being pointed out, the Tahsildar, Tiruparankundram replied (September 2020) that the revised proposal for renewal of lease agreement could not be sent to Government, as the application for renewal of lease was not forthcoming from the School. No reply was given for the failure to evict the School from the five acres of land encroached upon.
Audit observed that the Revenue authorities turned a blind eye to the encroachment and failed to evict the School from the five acres of unauthorisedly held land. Further, the inordinate delay on the part of Revenue Department to process the decision on the School’s request for lease of additional land/outright sale of land under its occupation and thereby indirectly contributed to unauthorised occupation of Government land valued15 at ` 14.16 crore for more than 30 years. Further, failure of Tahsildar to propose for revision of lease rent for the three acres officially leased out to the School and its non-renewal since June 2013 had resulted in short collection of revenue of ` 7.38 crore (Appendix 3.2) and its unauthorised utilisation by the School for more than seven years.
Audit recommends that Government may establish suitable monitoring mechanism within their web-based system “TAMIL NILAM”16 for monitoring timely renewal of lease rent and collection of revised lease rent by District/Taluk authorities.
The matter was referred to Government in January 2021; reply has not been received (June 2021).
15 Five acres or 2,17,800 Square feet (5 acres x 43,560) at ` 650 per sq.ft. = ` 14.16 crore. 16 Web based information system of GoTN on land administration and management.

Chapter III - Compliance Audit
75
3.3 Blocking of funds/Idle investments
RURAL DEVELOPMENT AND PANCHAYAT RAJ DEPARTMENT
GANDARVAKOTTAI PANCHAYAT UNION
3.3.1 Unfruitful expenditure on construction of a new bus stand
Failure to consult the local body and to acquire land for approach road before commencement of the project resulted in idling of a new bus stand constructed at a cost of ` 3.91 crore at Gandarvakottai in Pudukottai district.
Article 156 of the Tamil Nadu Financial Code (TNFC) stipulates that the Local Authority concerned should always be consulted about the suitability of the site for any new building. Para 2.9 of Technical Handbook (Buildings) of Rural Development and Panchayat Raj Department provides that before according the Administrative Sanction (AS), the ownership of the land in which the work has to be carried out is to be verified.
In a Collectors’ conference chaired by the Honourable Chief Minister, it was decided (December 2012) to expand the bus stand at Gandarvakottai, a town in Pudukottai. As there was no space to expand the existing bus stand, the District Collector (DC) cum Chairman, District Rural Development Agency (DRDA), Pudukottai proposed (May 2013) for construction of a new bus stand at Akkachipatti, a Village Panchayat adjoining Gandarvakottai. The new bus stand was proposed on a donated land measuring four acres located at about one kilometer away from the existing bus stand.
The new bus stand complex comprised a building with 10 bus bays, approach road, 11 shops and other utilities17. The Regional Transport Authority, Pudukottai approved (November 2013) the proposal for construction of the new bus stand at Akkachipatti, after ensuring that the existing bus stand had limited area for expansion.
Administrative sanctions for the new bus stand were accorded as shown in Table 3.2.
17 Drivers/conductors rest room, gents and ladies toilets, arches at the entrance and exit,
solar lighting, chairs for passengers, sanitary arrangements and electrification works.

Audit Report (Compliance Audit), Tamil Nadu for the year ended March 2020
76
Table 3.2: Administrative Sanction for the New Bus Stand
Component of the project
Source of fund Estimated cost (` in lakh)
Sanctioning authority
Bus stand building Scheme Component of Pooled Assigned Revenue
163 District Collector
Approach road with retaining wall
Infrastructure Gap Filling Fund
198 Commissioner of Rural Development and Panchayat Raj
Water and electricity supply
Panchayat Union General Fund
46 Panchayat Union Council
(Source: Panchayat Union, Gandarvakottai)
Audit scrutiny (October 2018/ March 2019) of records of the Gandarvakottai PU for the period 2014-18 revealed that all the works were awarded (January 2014 to February 2016) through tenders for the sanctioned sum of ` 4.07 crore. Of this, the construction of bus stand was completed at a cost of ` 1.61 crore in November 2015 (Exhibit 3.6), allied works (except black topping of the approach roads) were completed at ` 1.86 crore during August 2015 to September 2016 and the other works at ` 0.44 crore during May 2015 to January 2017.
Despite the project being completed, except for blacktopping of the approach road, the new bus stand was not commissioned for more than four years. The Block Development Officer (BDO), Gandarvakottai, did not furnish any specific reason for non-commissioning of the bus stand, but stated (November 2020) that the bus stand would be commissioned after due instructions from the Government.
Audit found the following issues in the implementation of the project:
The decision to shift the Gandarvakottai bus stand to the adjoining Akkachipatti village was taken by the DC without the consent of the Gandarvakottai Village Panchayat. Audit found that the members of the Village Panchayat unanimously passed a resolution on December 2013, requesting the DC to drop this plan and requested to develop the existing bus stand. Several individuals from the village made representations to the DC and multiple court cases were also filed18. The DC, however, stood firm on his decision.
18 One case was disposed of as the DC agreed to shift the site, albeit in the same
location. One case, filed by the President of Gandarvakottai Village Panchayat was withdrawn by her and another case was disposed of by directing the authorities to consider the remedy sought by the plaintiff.
Exhibit 3.6: New bus stand at Gandarvakottai
(Source: Joint physical verification)
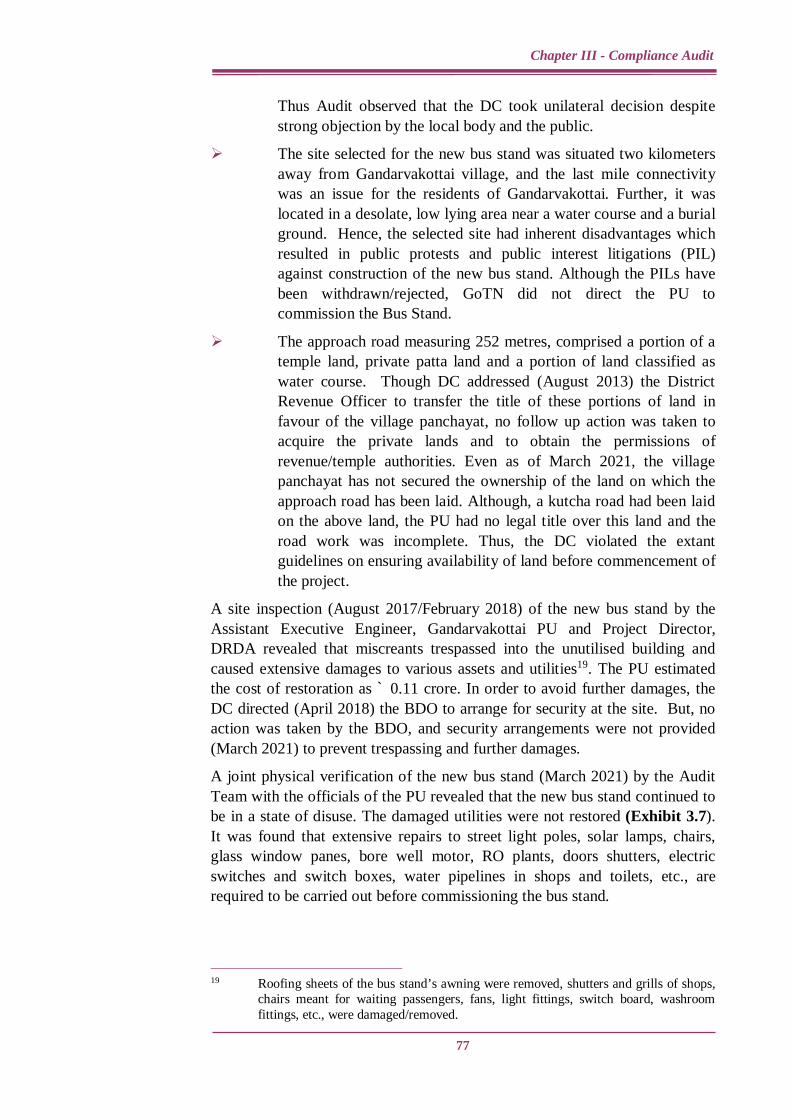
Chapter III - Compliance Audit
77
Thus Audit observed that the DC took unilateral decision despite strong objection by the local body and the public.
The site selected for the new bus stand was situated two kilometers away from Gandarvakottai village, and the last mile connectivity was an issue for the residents of Gandarvakottai. Further, it was located in a desolate, low lying area near a water course and a burial ground. Hence, the selected site had inherent disadvantages which resulted in public protests and public interest litigations (PIL) against construction of the new bus stand. Although the PILs have been withdrawn/rejected, GoTN did not direct the PU to commission the Bus Stand.
The approach road measuring 252 metres, comprised a portion of a temple land, private patta land and a portion of land classified as water course. Though DC addressed (August 2013) the District Revenue Officer to transfer the title of these portions of land in favour of the village panchayat, no follow up action was taken to acquire the private lands and to obtain the permissions of revenue/temple authorities. Even as of March 2021, the village panchayat has not secured the ownership of the land on which the approach road has been laid. Although, a kutcha road had been laid on the above land, the PU had no legal title over this land and the road work was incomplete. Thus, the DC violated the extant guidelines on ensuring availability of land before commencement of the project.
A site inspection (August 2017/February 2018) of the new bus stand by the Assistant Executive Engineer, Gandarvakottai PU and Project Director, DRDA revealed that miscreants trespassed into the unutilised building and caused extensive damages to various assets and utilities19. The PU estimated the cost of restoration as ` 0.11 crore. In order to avoid further damages, the DC directed (April 2018) the BDO to arrange for security at the site. But, no action was taken by the BDO, and security arrangements were not provided (March 2021) to prevent trespassing and further damages.
A joint physical verification of the new bus stand (March 2021) by the Audit Team with the officials of the PU revealed that the new bus stand continued to be in a state of disuse. The damaged utilities were not restored (Exhibit 3.7). It was found that extensive repairs to street light poles, solar lamps, chairs, glass window panes, bore well motor, RO plants, doors shutters, electric switches and switch boxes, water pipelines in shops and toilets, etc., are required to be carried out before commissioning the bus stand.
19 Roofing sheets of the bus stand’s awning were removed, shutters and grills of shops,
chairs meant for waiting passengers, fans, light fittings, switch board, washroom fittings, etc., were damaged/removed.

Audit Report (Compliance Audit), Tamil Nadu for the year ended March 2020
78
Exhibit 3.7: Damages caused to the asset
(Source: Joint physical verification)
The BDO, Gandarvakottai PU, informed (March 2021) Audit that action was being taken to prepare an estimate to restore the bus stand facilities in damaged condition. Further, the BDO attributed paucity of funds with Akkachipatti Panchayat for non-provision of security arrangements.
Thus, the failure of the DC to consider the views of the local body and local community and the failure to acquire ownership of the approach road had resulted in the new bus stand not being put to use. The public asset constructed at a cost of ` 3.91 crore has remained idle for over four years and has been vandalised due to lack of security.
Audit recommends that DC, Pudukottai should take action to acquire ownership of the approach road, secure the government property and put the new bus stand to public use at the earliest.
The matter was referred to Government in January 2021; reply has not been received (June 2021).
SINGAMPUNARI PANCHAYAT UNION
3.3.2 Idling of houses and related infrastructure
Failure to select beneficiaries for Samathuvapuram housing scheme before commencement of construction resulted in the idling of infrastructure created at a cost of ₹ 2.42 crore for over six years and consequent damage to the properties thus rendering them unfit for occupation.
The Government of Tamil Nadu (GoTN) launched (October 1997) a housing scheme ‘Samathuvapuram’20, wherein model habitations were established in rural areas in which all communities live with unity and brotherhood and share
20 ‘Equality village’. The scheme was renamed as ‘Periyar Ninaivu Samathuvapuram
Thittam’ (Periyar Memorial Equality Village) in April 1999.
Window grills removed Roofing sheets of awning

Chapter III - Compliance Audit
79
all basic civic infrastructure and amenities21 without any discrimination. The entire cost of establishing these Samathuvapurams was met by GoTN and each habitation comprised 100 houses. The houses were allotted to beneficiaries, belonging to different communities, selected by a selection committee. In 2008, GoTN issued orders and detailed guidelines for establishment of 95 Samathuvapurams during 2008-11 and an amount of ₹ 225 crore was sanctioned for implementing the scheme.
At the state level, the Director of Rural Development and Panchayat Raj (DRD) administers implementation of the scheme. At the district level, the Project Director, District Rural Development Agency (PD, DRDA) and the Block Development Officer (BDO) implements the scheme at the PU level. The Samathuvapuram scheme was discontinued after 2010-11.
Scrutiny of the records of BDO, Singampunari PU in Sivagangai District and the Office of the PD, DRDA, Sivagangai in May/June 2018 and July 2018 respectively disclosed that 100 houses constructed (2015) in a Samathuvapuram, at Kottaivengaipatti village in Singampunari PU, were not allotted to beneficiaries for more than five years. The reasons for non-allotment of houses to beneficiaries are discussed below:
(a) Delay in completion of construction activities: As per the scheme guidelines, the construction of Samathuvapurams is to be completed within 12 months from the date of work order. Audit, however, found that the construction, which commenced in August 2010, took almost five years to complete. The total expenditure incurred was ₹ 2.42 crore, as given in Appendix 3.3 and an unspent balance of ₹ 10.94 lakh was lying in the bank account of BDO.
The BDO, Singampunari, in reply to an Audit enquiry stated (August 2019) that the delay in construction activities was due to paucity of construction materials and monsoon. The reply, however, was not substantiated on verification of scheme implementation records. Audit observed that the delay was attributable to the contractor and DRD directed (March 2013) PD, DRDA to take appropriate action against the contractor for the delay in completion by forfeiting the Security Deposit (SD). The BDO settled contractor’s bills and forfeited SD. Audit observed that the delay of four years in completion of civil works had a cascading effects on commissioning of the project.
(b) Selection of beneficiaries: As per the scheme guidelines, a Selection Committee, headed by the PD, DRDA22, is to select the beneficiaries from amongst the applicants who are very poor and are willing to stay at
21 Like borewells, road, street lights, Public distribution shop etc. 22 The other members of the Selection Committee are BDO, Tahsildar of the Taluk,
President of the Village Panchayat where the Samathuvapuram is located, concerned Village Administrative Officer(s) and one Panchayat Level Federation member from the Samathuvapuram village.

Audit Report (Compliance Audit), Tamil Nadu for the year ended March 2020
80
Samathuvapuram on a permanent basis. The beneficiary selection and allotment of house sites is to be done upfront before the construction of houses so that each beneficiary is aware of the house site allotted to him/her and to get involved in the construction process from the beginning itself.
The Selection Committee was formed only in January 2013, more than two years after commencement of construction.
The BDO, in reply to an Audit enquiry stated (August 2019) that the beneficiaries’ list, though finalised by the Selection Committee in 2013, was delayed due to administrative reasons and list was sent to PD, DRDA only in July 2017.
The PD, DRDA, in reply to an Audit enquiry, stated (November 2020) that the houses are yet to be allotted to the beneficiaries since the approved list of allotment has not been received from DRD, Chennai.
DRD informed (March 2021) Audit that the beneficiaries list of 2017 was not final as it was not approved by the District Collector, and fresh requests for allotment were received from public, as well as through the District Differently Abled Welfare Officer. DRD also informed that Selection Committee has been tasked to scrutinise all the applications and select beneficiaries afresh.
Thus, Audit observed that the beneficiary list was not finalised even six years after completion of construction.
Exhibit 3.8: Street view of houses lying unoccupied
(Source: Joint inspection)
A joint inspection (Exhibit 3.8) of the Samathuvapuram was conducted in March 2021 by Audit along with BDO and Assistant Engineer of Singampunari PU and found the following:

Chapter III - Compliance Audit
81
Electricity connection had not been provided to the houses. All the electrical wiring in 90 houses were removed/damaged and switch boards were broken with no switches available.
The entire door fittings and doors of bathrooms/latrines constructed outside the houses were removed/stolen in 81 out of 100 houses.
There was no water supply from Over Head Tank (OHT) due to poor yield of ground water. Hence the power motor was dismantled and kept in the VP office.
Street fountains provided for public water supply were damaged.
All the street light wiring and fittings were damaged and no bulbs/ tubes were available.
Compliant was not lodged in the local police station regarding the theft of Government property. Subsequent to the inspection report issued by Audit, the BDO lodged a complaint with the Inspector of Police in Singampunari Police station reporting a loss of more than ₹ 6 lakh to the Government and to identify the anti-social elements and initiate criminal action against them.
The BDO, Singampunari, to whom the completed houses and civic infrastructure were handed over, had not taken adequate measures to protect the assets.
Thus, the failure of PD, DRDA, to select beneficiaries before commencement of construction, inordinate delay in construction, and further delay in finalisation of the list of beneficiaries, had resulted in the infrastructure created at a cost of ₹ 2.42 crore, lying idle and damaged due to lack of protection rendering them unfit for occupation.
Audit recommends that GoTN/DRD may initiate early action to complete the beneficiary selection process, and simultaneously action may be taken to make the houses ready for occupation.
The matter was referred to Government in January 2021; reply is awaited (June 2021).

Audit Report (Compliance Audit), Tamil Nadu for the year ended March 2020
82
NATHAM PANCHAYAT UNION
3.3.3 Idling of a newly constructed Community hall
Lack of comprehensive plan leading to piecemeal construction of community hall, delay in obtaining electrical connection, non-provision of water supply and toilet facilities, etc., had resulted in idle investment of ₹ 84.46 lakh.
The Committee on Public Accounts (PAC) of the Tamil Nadu Legislative Assembly, which discussed an Audit para on idling of newly constructed Community halls, included in C&AG’s Audit report, 2005-06 (Local Bodies), recommended (February 2013) that the demand for community hall (in the villages) should be ensured and all basic amenities should be created so as to enable proper utilisation of the community halls constructed with Government/Local Bodies (LB) funds.
An audit of the office of Block Development Officer (BDO), Natham PU in Dindigul District was taken up during November 2019. It was noticed that a Multipurpose Centre (Community Hall) was constructed in 2016 by the PU at Uluppagudi hamlet of Punnapatti Panchayat at a cost of ₹ 84.46 lakh without assessing the need for the same and it was not put to use for more than four years. The building was designed to serve as a public hall for conducting marriages and other functions in the village. It has a dining hall, a kitchen and a store room at the ground floor and a large hall and two rooms at the first floor.
The reasons for non-commissioning of this public asset are discussed below:
(a) Lack of comprehensive planning and piecemeal execution: Article 158 (b) of the Tamil Nadu Financial Code cautions against evading the necessity of obtaining sanction from the appropriate authority by splitting the work and sanctioning it in instalments. According to extant orders23, the District Collector (DC) has the powers to accord Administrative Sanction (AS) for civil works costing up to ₹ 50 lakh in PUs and the Director of Rural Development and Panchayat Raj (DRD) has the powers to accord AS for works costing over ₹ 50 lakh.
Similarly, the Executive Engineer, Rural Development and Panchayat Raj (EE, RD&PR) has the powers to accord Technical Sanction (TS) for civil works costing up to ₹ 30 lakh and the Superintending Engineer (SE), RD&PR has the powers to accord TS for works costing over ₹ 30 lakh.
It was, however found that the single work of construction of a Community Hall was split into four different works as given in Table 3.3. The fact that three separate AS and TS were taken in a short span of three months established that the motive was to avoid AS and TS by appropriate higher authorities. Both the DC and the EE, RD&PR routinely accorded AS and TS
23 Tamil Nadu Panchayats (Preparation of plans and estimates for works and mode and
conditions of contracts) Rules, 2007.

Chapter III - Compliance Audit
83
respectively without pointing out the splitting of a single work for avoiding AS/TS by higher authorities. Audit observed that splitting of the work into four different components resulted in lack of a comprehensive plan and the consequent delayed provision of electricity and non-ensuring of water supply, compound wall and toilet facilities for guests. The deliberate avoidance of obtaining AS from DRD, facilitated the BDO in obtaining approval for the project from DC and EE (RD&PR) without detailed justification and avoided examination by higher authorities.
Table 3.3: Details of Works carried out
Sl. No.
Component of Work
Source of Fund
Date of AS Esti-mate (₹ in lakh)
Approval of tender and
issue of work order
Scheduled date of
completion
Amount paid to
the Contrac-
tor (₹ in lakh)
1 Ground floor MPLADS24 16-11-2015
30 .00 08-12-2015/ 09-12-2015
08-03-2016 29.98
2 Water supply 5.00 5.00
3 First floor PU General Fund
06-01-2016 30.00 19-01-2016/ 20-01-2016
17-03-2016 29.99
4 Addition to first floor 29-01-2016 19.50
23-02-2016/ 24-02-2016
15-04-2016 19.49
Total 84.50 84.46
(Source: Details furnished by Natham PU)
In the estimate for ‘water supply’ component, provision was made for bringing water from a bore well near a water body across the road. Although the work was reportedly completed, joint physical inspection by the audit team along with the BDO disclosed no supply of water. The BDO replied (November 2020) that the water pipelines were damaged during road widening and action would be taken to restore water supply.
Execution of the work in a piecemeal manner had resulted in non-provision of funds in any of the four estimates for obtaining electricity connection, despite earmarking ₹ 3.17 lakh in the estimates for electrification in the ground floor (₹ 2 lakh) and first floor (₹ 1.17 lakh). As a result, the building was not electrified for more than four years, and power connection was obtained only in August 2020 through a separate sanction.
Similarly, lack of comprehensive planning had resulted in non-provision of compound wall and toilet block for proper utilisation of the building. The BDO replied (November 2019) that funds had been sought under MPLADS for execution of these works. It is pertinent to point out that operation of the MPLADS itself is under suspension for two years from March 2020, and therefore the PU Council (PUC) didn’t seem to have any viable plan to commission the building.
24 Members of Parliament Local Area Development Scheme.

Audit Report (Compliance Audit), Tamil Nadu for the year ended March 2020
84
(Source: Joint physical inspection by Audit Team with the BDO)
(b) Failure to take follow-up action: GoTN, in its orders (June 1999) on ‘Devolution of powers’ to the Local Bodies had authorised the PUs to maintain the community assets owned by them and also to determine the rates of lease/rent for these revenue yielding properties and duly realise the income so derived from these assets. However, rental charges for letting out the building were not yet fixed, even after more than four years of completion of the building.
To an audit enquiry, the BDO, Natham PU replied (November 2020) that rent rates would be fixed with due approval of the PUC and the hall would soon be released for public use on rental basis.
The fact, however, remains that the public asset could not be commissioned due to lack of required utilities. Audit observed that unplanned piecemeal execution of works in violation of codal provisions, non-provision of required amenities and continued inaction in putting the constructed building to use, had resulted in idle investment of ` 84.46 lakh besides denial of better facilities to the community at reasonable cost.
Audit recommends that:
Early action may be taken to commission the Community Hall.
GoTN/DRD should issue suitable guidelines to implement the PAC recommendation on assessing the need and provision of amenities for community halls and similar revenue earning assets.
Community Halls/Buildings may be constructed in a planned and time bound manner adhering to existing codal provisions.
The circumstances under which the officers concerned violated the codal provisions may be enquired into.
The matter was referred to Government in January 2021; reply has not been received (June 2021).
Exhibit 3.9: Full view of the Multipurpose hall
Exhibit 3.10: Ground floor of the hall being used as temporary stores for water pipes

Chapter III - Compliance Audit
85
SOCIAL WELFARE AND NUTRITIOUS MEAL PROGRAMME DEPARTMENT
CHILD DEVELOPMENT PROJECT OFFICES
3.3.4 Unjustified purchase of Aadhaar enrolment kits
Failure to restrict the requirement for Aadhaar enrolment kits based on actual need has resulted in accessories of Aadhaar enrolment kits valuing ` 7.85 crore lying unutilised for more than two years.
With a view to give further impetus to Aadhaar enrolment drive, GoI decided (July 2017) to set up permanent Aadhaar enrolment facility in the offices of Child Development Project Offices (CDPOs), which are sub-district level offices managing the Anganwadis in the field. Accordingly, the Integrated Child Development Services (ICDS) Department of Government of Tamil Nadu (GoTN) and all 434 CDPOs in the State were notified (October 2017) as Registrar and Enrolment Agencies respectively for carrying out Aadhaar enrolment.
Scrutiny of records (November 2020) at the office of the Director, ICDS, Chennai and District Project Offices revealed the following:
GoI had approved (December 2017) the project at a total cost of ` 19.53 crore (Central share: ` 11.72 crore and State share: ` 7.81 crore) to procure three sets of Aadhaar enrolment kits for each of the 434 CDPOs in the State. A set of Aadhaar enrolment kit include one desktop with peripherals such as scanner, printer, slap fingerprint scanner, Iris scanner and GPS device25, another set include one laptop together with peripherals, and the third set include one Tablet with fingerprint scanner. The desktop and laptop with peripherals are intended for use in the CDPOs for Aadhaar enrolment of adults visiting the Enrolment Centre. Whereas, the Tablet with peripherals are intended to be used as mobile Aadhaar enrolment kits for enrolling children below five years of age at Anganwadis.
The Director, ICDS procured through GeM (Government e-Market place) portal, and supplied the desktop-based enrolment kits and laptop-based enrolment kits in September/October 2018 and the tablet-based enrolment kits in December 2018 to all 434 CDPOs at a total cost of ` 13.48 crore26. Though all the Aadhaar enrolment kits were installed as on January 2019, Audit found that, Aadhaar enrolment was done only for children using the tablet-based enrolment kits. CDPOs did not start Aadhaar enrolment services for adult residents using desktop/laptop-based kits. Hence, the Aadhaar enrolment accessories27 of desktop/laptop-based kits were not put to use for more than
25 Global Positioning System device used for accessing the Aadhaar server. 26 Desktop kit - ` 6.43 crore, Laptop kit - ` 6.26 crore and Tablets – ` 0.79 crore. 27 Finger print reader, Iris scanner, focus lamp, Webcam and GPS receiver.

Audit Report (Compliance Audit), Tamil Nadu for the year ended March 2020
86
two years, resulting in idling of these accessories, valued at ` 7.85 crore (Table 3.4). The desktop and laptop computers were, however, used for routine office work.
Table 3.4: Details of Aadhaar enrolment accessories procured for 868 desktops and laptops
Name of the item Cost per item (in `)
Total cost (Col. 2 x 868)
(` in lakh)
(1) (2) (3)
Finger print reader 48,000 416.64
Iris scanner 34,000 295.12
Focus lamp 550 4.77
Webcam 4,495 39.02
GPS Receiver 3,430 29.77
Total 785.32
(Source: Director, ICDS)
In this connection, the following observations are made:
The Annual Reports of Unique Identification Authority of India for the year 2017-18 indicated that Tamil Nadu had an overall saturation of 93.4 per cent in respect of Aadhaar seeding, as compared to only 48 per cent in respect of age group 0 to 5 years. In this background, the Director, ICDS, in his letter dated 4 December 2017 proposed to the Government that Aadhaar enrolment services for adult are already provided by Tamil Nadu Arasu Cable TV Corporation Limited, a GoTN Public Sector Undertaking, and the pressure is only on providing this service to children below five years. He proposed procurement of only Tablets with sim cards for extending Aadhaar enrolment services to Anganwadi children. It was, however, found that in the Empowered Committee Meeting for Anganwadi Services, Chaired by the Secretary to GoI, Ministry of Women and Child Development on 6 December 2017, a decision was made to procure both desktop/laptop-based kits for adult enrolment and Tablet-based kits for child enrolment.
By failing to exercise due diligence and restrict the procurement to tablet-based kits for enroling children below five years alone, GoTN incurred an unjustified expenditure of ` 7.85 crore on the accessories which are lying idle for more than two years.
Audit recommends that GoTN may take action either to start Aadhaar enrolment services for adult residents at CDPOs or to transfer the Aadhaar enrolment accessories of desktop and laptop- based kits to Tamil Nadu Arasu Cable TV Corporation Limited on cost basis so that these accessories can be utilised.
The matter was referred to Government in February 2021; reply has not been received (June 2021).

Chapter III - Compliance Audit
87
3.4 Regularity issues
ADI DRAVIDAR AND TRIBAL WELFARE DEPARTMENT
3.4.1 Payment of scholarship to ineligible students
Non-adherence to Government’s orders by the Director of Adi Dravidar Welfare and District Adi Dravidar and Tribal Welfare Officers, and lack of clarity in the order had resulted in an inadmissible expenditure of ` 1.81 crore towards sanction of Higher Education Special Scholarship to ineligible students.
In 1971-72, the Government of Tamil Nadu (GoTN) launched a loan cum scholarship scheme for Scheduled Caste/Scheduled Tribe (SC/ST) students pursuing higher studies as hostellers. The scheme underwent modifications in 1996-97, 2002-03 and 2011-12. The modified ‘Higher Education Special Scholarship’ (HESS) scheme envisaged a scholarship of ` 7,500 and ` 8,000 per annum to eligible students28 studying in undergraduate and post graduate/professional courses respectively. At the state level, HESS is implemented by the Director of Adi Dravidar Welfare (DADW) and at the district level, the District Adi Dravidar and Tribal Welfare Officers (DADWO) implement the scheme.
Consequent on launching (2013-14) of the centrally sponsored ‘Post Matric Scholarship scheme’ (PMSS) in the current form, GoTN decided (March 2017) to review the need for continuation of HESS as both the schemes offered similar benefits resulting in duplication and increased expenditure. Based on the review, while issuing orders (March 2018) for continuation of HESS for the academic year 2017-18, GoTN restricted the grant of new HESS only to students of Government and Government aided institutions, staying in hostels of the institution or in hostels approved by the institution. The DADW, while allocating scheme funds to DADWOs during 2017-20, also reiterated the above condition for grant of HESS.
Audit scrutiny of the records relating to the implementation of the scheme for the period 2017-20 at the offices of the DADW and sampled DADWOs in 12 districts29 revealed that:
DADWOs of four30 districts continued to sanction HESS to students studying in self-financing institutions. During this period, new scholarships under
28 The applicants should belong to SC/ST communities including SC converted to
Christianity students, be staying in paid hostels and their parental/guardian annual income not to exceed ` 2.50 lakh.
29 Out of 32. 30 Chennai, Kancheepuram, Tirunelveli and Villupuram.

Audit Report (Compliance Audit), Tamil Nadu for the year ended March 2020
88
HESS were sanctioned to 889 students studying in 29 self-financing institutions. This resulted in an irregular expenditure of ` 0.70 crore (Appendix 3.4) to ineligible students. The audit findings were sent to GoTN in December 2020, along with an abstract of district-wise irregular payments, details of which had already been given to respective DADWOs during field audits. GoTN in its reply to the draft Audit Para, sought (3 February 2021) institution-wise and year-wise student data for ascertaining the fact included in the draft Audit Para. The details requested by GoTN were sent (4 February 2021) to DADW to facilitate rechecking of the facts brought out by Audit. Further reply was not received (June 2021).
It was also found that DADWOs of seven31 districts, during the same period, sanctioned an amount of ` 1.11 crore as HESS to 1,440 students studying self-supporting courses in 19 Government aided institutions during the same period. Audit found that DADWOs of three other sampled districts32 did not entertain scholarship applications from students studying self-supported courses in Government aided colleges. In this connection, Audit observed that Government aided private colleges in the State conduct both aided and self-supported courses. Students of self-supported courses in Government aided private colleges are on the same footing as the students of self-financing private colleges, as they pay full tuition fee. GoTN’s order restricting the scheme to students of Government and Government aided institutions was silent as to whether the students of self-supported courses in Government aided private colleges are eligible to receive HESS. The lack of clarity in the Government Order had resulted in a situation where some districts were allowing HESS to students of self-supported courses in Government aided private colleges, and others did not allow. As the scheme is meant only for students of Government and aided colleges, Audit observed that the payment of new HESS scholarships of ` 1.11 crore to 1,440 students studying in self-supporting courses in Government aided institutions was irregular (Appendix 3.4). GoTN, in its reply (February 2021) claimed that all students of Government aided colleges are eligible to receive HESS. Government, however, did not clarify how the students of self-supported courses in partly aided colleges were different from similarly placed students of other private colleges who are not eligible for HESS.
Thus, the failure of DADWOs to disallow HESS claims of students of self-financing institutions and lack of clarity in GoTN’s order and failure to restrict HESS only to students studying aided courses in Government aided institutions had resulted in an inadmissible expenditure of ` 1.81 crore (` 0.70 crore + ` 1.11 crore) towards grant of HESS to ineligible students.
31 Chennai, Cuddalore, Dindigul, Erode, Madurai, Tiruchirappalli and Tirunelveli. 32 Coimbatore, Tiruvallur and Vellore.

Chapter III - Compliance Audit
89
Audit recommends that the ineligible payments to students of self-financing colleges may be recovered and the policy on eligibility of students of self-supported courses in Government aided colleges needs to be clarified to avoid confusion.
3.4.2 Inadmissible excess reimbursement of fees to private schools
Non adherence of Government’s orders by the Director of Adi Dravidar Welfare and failure of Government to check repeated violations had resulted in inadmissible reimbursement of ` 1.62 crore as fees to private schools.
The Government of Tamil Nadu (GoTN) introduced (December 2008) the scheme of ‘Provision of top class education to meritorious Adi Dravidar33 (Scheduled caste) and Tribal (SC/ST) students studying in Standard V in Government and Government aided schools’. Under this scheme, 385 meritorious SC/ST students34 are selected every year at the rate of one student from each of the 385 blocks by conducting a special examination and are admitted in Standard VI in reputed private residential schools. The Government bears the cost of education of the student till Standard XII. The District Collectors prepare the list of reputed schools located within their districts. It is left to the parents of the selected students to admit their wards to any of the schools in the list.
Audit scrutiny of the records relating to the implementation of the scheme at the offices of the Director of Adi Dravidar Welfare (DADW) and District Adi Dravidar and Tribal Welfare Officers (DADWO) in 15 districts during 2018-20 disclosed the following.
While launching the scheme in December 2008, GoTN fixed a ceiling of ` 40,000 per student per annum for reimbursement of school fees (` 17,000) and hostel fee (` 23,000). This ceiling, however, was used only for earmarking funds in the budget, and DADW did not restrict the reimbursement within the ceiling. GoTN notified the detailed revised scheme guidelines in October 2015, which were implemented from the academic year (AY) 2016-17. As per the revised guidelines, the financial assistance was allowed as per the fees fixed by the ‘Private Schools Fee Determination Committee’
33 Including Adi Dravidar converted to Christianity. 34 One student each from the 385 Panchayat Union (Development) blocks in
Tamil Nadu.

Audit Report (Compliance Audit), Tamil Nadu for the year ended March 2020
90
(PSFDC35) constituted by GoTN. In addition, hostel fees of ` 15,000 and maintenance fee of ` 5,000 per annum were also payable. Prior to the issue of revised guidelines in October 2015, there was no restriction on the amount of school fees that could be reimbursed to the schools. While proposing (May 2014) the revised guidelines, incorporating a ceiling for reimbursement, DADW requested GoTN that the reimbursement of fees for students, admitted prior to the issue of guidelines, may be continued at pre-existing rates. Accordingly, GoTN ordered (January 2016) that the ceiling on fee reimbursement, as per the revised guidelines, are applicable to students admitted from the AY 2016-17.
The authorities of private schools, where these students are admitted, were to lodge their claim through respective DADWOs. Every year, the DADWOs were to compile the list of students admitted and fees payable to the private schools and forward the same to the Directorate for obtaining GoTN’s sanction to settle the claims made by the schools.
While implementing the scheme, DADWOs reported difficulties. The DADWOs stated that although the fee fixed by PSFDC for every school was different, the schools were reluctant to admit the students, as the fixed amount admissible for hostel and maintenance were not commensurate with the quality of facilities afforded in every school. Based on the DADWOs’ reports, the DADW requested (November 2016) GoTN to amend the guidelines, so as to reimburse the entire amount claimed by the private schools. GoTN, however, had not amended (November 2020) the guidelines, as proposed by the DADW. Simultaneously, the schools continued to claim the fees in excess of the amount stipulated in the guidelines, which were admitted by GoTN for the AYs 2016-17 and 2017-18, as the DADW requested sanction citing difficulties in adhering to the scheme guidelines.
GoTN, however, took a firm stand in January 2019 and directed DADW to strictly adhere to the scheme guidelines and limit the release of fees to the schools to the extent provided in the guidelines for the AY 2018-19.
Despite that, Audit found that 32 private schools, in 1036 out of the 15 sampled districts, had claimed an amount of ` 1.62 crore in excess of the fees stipulated by the revised guidelines, in respect of 258 students admitted during the AYs 2018-19 and 2019-20. The claims were admitted by DADW without limiting them to the ceiling prescribed (Appendix 3.5).
35 PSFDC is constituted as per the provisions of Section 5 of the Tamil Nadu Schools
(Regulation of Collection of Fee) Act, 2009 for the purpose of determination of the fee for admission to any Standard or course of study in private schools. PSFDC determines the fee based on various factors inter alia the location of the school and the available infrastructure.
36 Ariyalur, Kancheepuram, Karur, Perambalur, Thanjavur, Tirunelveli, Tiruppur, Tiruvallur, Vellore and Villupuram.

The 22 July 2021
The 23 July 2021

APPENDICES


93
Appendix 1.1 (Reference: Paragraph 1.5.2; Page 3)
Department-wise details of outstanding Inspection Reports and Paragraphs
Sl. No.
Name of the Department Number of outstanding
Inspection Reports
Audit Observations
1 Adi-Dravidar and Tribal Welfare 135 627
2 Agriculture 175 701
3 Animal Husbandry, Diary Development and Fisheries 101 486
4 Backward Classes, Most Backward Classes and Minorities Welfare 49 203
5 Co-operation, Food and Consumer Protection 126 301
6 Finance 55 24
7 Health and Family Welfare 555 2,671
8 Higher Education 160 670
9 Home (Fire, Prohibition and Excise) 29 171
10 Labour and Employment 59 249
11 Personnel and Administrative Reforms 19 157
12 Planning, Development and Special Initiatives 8 54
13 Public 34 110
14 Public Works Department (Water Resources) 136 376
15 Revenue and Disaster Management 1,524 6,048
16 Rural Development and Panchayat Raj 574 2,897
17 School Education 328 1,187
18 Social Welfare and Nutritious Meal Programme 138 592
19 Special Programme Implementation 3 10
20 Tamil Development and Information 39 87
21 Welfare of Differently Abled Persons 65 325
22 Youth Welfare and Sports Development 34 137
Total 4,346 18,083

Audit Report (Compliance Audit), Tamil Nadu for the year ended March 2020
94
Appendix 2.1
(Reference: Paragraph 2.1.3.2; Page 8) Audit criteria
1 Inclusive & Qualitative expansion of Higher education - 12th Five Year Plan (2012-17).
2 Guidelines/Regulations issued by University Grants Commission.
3 NITI Aayog three year action plan.
4 Guidelines and Manual issued by National Assessment and Accreditation Council (NAAC).
5 Internal Quality Assurance Cell Manual issued by NAAC.
6 National Institutional Ranking Framework Manual.
7 Self-Study Report of test checked Universities submitted to NAAC.
8 Circulars/orders issued by Department of Higher Education/Director of Collegiate Education etc.
9 Hand books, circulars and guidelines issued by the selected Universities/ Colleges.
10 Minutes of the meeting of the Senate, Syndicate, Academic Council, Board of Inspection, Finance Committee etc., of the selected Universities and bodies of Colleges.
11 Annual Accounts/Annual Report/NAAC Assessment Report of the selected University.

Appendices
95
Appendix 2.2 (Reference: Paragraph 2.1.3.3 (i); Page 8)
Sampled Colleges
Sl. No.
Name of College Type of College
ALAGAPPA UNIVERSITY, KARAIKUDI
1 1 Government Arts & Science College (GASC), Mudukulathur, Ramanathapuram G
2 2 Pasumpon Thiru Muthuramalinga Thevar Memorial College (PTMTMC), Kamuthi GA & SF
3 3 Alagappa University Model Constituent College of Arts & Science (AUMCCAS), Paramakudi UCC
4 4 Vidhyaa Giri College of Arts & Science (VGCAS), Puduvayal, Karaikudi SF
BHARATHIDASAN UNIVERSITY, TIRUCHIRAPALLY
5 1 Arignar Anna Government Arts College (AAGAC), Musiri, Trichy G
6 2 Government Arts College for Women (Autonomous) [(GACW (A)], Pudukkottai G
7 3 Kunthavai Naacchyiaar Government Arts College for Women (Autonomous) [KNGACW (A)], Thanjavur G
8 4 Periyar EVR College (Autonomous) [PEVRC (A)], Trichy G
9 5 Bharathidasan University Constituent Arts & Science College (BUCASC), Nannilam UCC
10 6 Bharathidasan University Model College (BUMC), Aranthangi UCC
11 7 Ganesar Senthamil College of Arts & Science (GSCAS), Melaisivapuri, Pudukkottai GA
12 8 Jamal Mohamed College (Autonomous) [JMC (A)], Trichy GA
13 9 Khadir Mohideen College (KMC), Adirampattinam GA
14 10 National College (Autonomous) [NC (A)], Trichy GA
15 11 Annai Khadeeja Arts & Science College for Women (AKASCW), Kandanivayal Village, Pudukottai SF
16 12 Elizabeth College of Arts and Science (ECAS), Perambalur SF
17 13 Meenakshi Ramasamy Arts & Science College (MRASC), Thathanur, Ariyalur SF
18 14 Swami Dayananda College of Arts & Science (SDCAS), Manjakkudi SF
MOTHER TERESA WOMEN’S UNIVERSITY, KODAIKANAL
19 1 Arulmigu Palaniandavar Arts College for Women (Autonomous) (APACW (A), Palani GA & SF
20 2 Sri Adi Chunchanagiri Women's College (SACWC), Cumbam SF
UNIVERSITY OF MADRAS
21 1 Sri Subramaniaswamy Government Arts College (SSGAC), Tiruttani G
22 2 Queen Mary’s College (Autonomous) (QMC (A)], Chennai G

Audit Report (Compliance Audit), Tamil Nadu for the year ended March 2020
96
Sl No.
Name of College Type of College
23 3 University Constituent College (UCC), Tiruvottiyur, G
24 4 Chellammal Women’s College (CWC), Guindy, Chennai GA
25 5 Pachaiyappa's College for Women (PCW), Kanchipuram GA
26 6 SIVET College (SIVETC), Gowrivakkam, Chennai GA
27 7 AnnaiVeilankanni’s College for Women (AVCW), Saidapet, Chennai SF
28 8 Jaya College of Arts & Science (JCAS), Thiruninravur SF
29 9 Nazerath College of Arts & Science (NCAS), Avadi SF
30 10 PattammalAlagesan Arts & Science College (PAASC), Athur, Chengalpattu SF
31 11 Sri Santhoshi College of Arts & Science (SSCAS), Maduranthakam SF
32 12 TMG College of Arts & Science (TMGCAS), Manimangalam, Chennai SF
G-Government, GA-Government aided, SF-Self-financing, UCC-University Constituent College

Appendices
97
Appendix 2.3
(Reference: Paragraph 2.1.8.1; Page 30) Department wise details of research projects undertaken
during 2014-19
Sl. No.
Name of the Department Number of research projects undertaken
Alagappa University
1 Alagappa Institute of Management 1
2 Animal Health & Management 7
3 Banking Management 1
4 Bioelectronics & Biosensors 8
5 Bioinformatics 9
6 Biomedical Services 1
7 Biotechnology 19
8 Commerce 1
9 Computer Application 2
10 Corporate Secretaryship 3
11 Economics and Rural Development 2
12 Education 11
13 Energy Science 4
14 English & Foreign Language 1
15 Industrial Chemistry 12
16 International Business 1
17 Library and Informatics science 3
18 Lifelong learning 2
19 Mathematics 1
20 Microbiology 3
21 Nano Science & Technology 4
22 Oceanography 3
23 Physical Education 1
24 Physics 4
25 Special Education 1
26 Tamil 1
27 Women Studies 1
Total 107

Audit Report (Compliance Audit), Tamil Nadu for the year ended March 2020
98
Sl. No.
Name of the Department Number of research projects undertaken
Bharathidasan University
1 Animal Science 17
2 BD School of Management 1
3 Biochemistry 12
4 Bioinformatics 7
5 Biomedical Science 12
6 Biotechnology and Genetic Engineering 3
7 Botany 7
8 Chemistry 15
9 Commerce and Financial Studies 4
10 Economics 17
11 Education 2
12 Educational Technology 2
13 Environmental Biotechnology 16
14 Environmental Science and Management 3
15 Geography 2
16 History 1
17 Library and Information Science 5
18 Marine Biotechnology 7
19 Marine Science 8
20 Mathematics 1
21 Medical Physics 1
22 Microbiology 21
23 National Facility for Marine Cyanobacteria and Bioinformatics Centre
7
24 Non-linear Dynamics 10
25 Physical Education 1
26 Physics 19
27 Remote Sensing 16
28 Social Work 1
Total 218

Appendices
99
Sl. No.
Name of the Department Number of research projects undertaken
Mother Teresa Women’s University
1 Biotechnology 6
2 Chemistry 1
3 Commerce 1
4 Computer Science 2
5 Economics 1
6 Education 4
7 Heritage & Tourism 1
8 Home Science 1
9 Management 1
10 Physics 4
11 Sociology 1
12 Tamil 1
13 Women studies 4
Total 28
University of Madras
1 Analytical Chemistry 11
2 Anatomy 15
3 Ancient History 4
4 Applied Geology 8
5 Biochemistry 28
6 Biotechnology 10
7 CAS in Biophysics 27
8 CAS in Botany 25
9 Commerce 4
10 Criminology 8
11 Econometrics 2
12 Economics 4
13 Endocrinology 14
14 Energy 9
15 Genetics 33
16 Geography 15
17 Geology 11
18 Indian History 3

Audit Report (Compliance Audit), Tamil Nadu for the year ended March 2020
100
Sl. No.
Name of the Department Number of research projects undertaken
19 Inorganic Chemistry 4
20 Journalism 3
21 Medical Biochemistry 10
22 Microbiology 5
23 Nano science & NT 36
24 NCUFP 5
25 Nuclear Physics 19
26 Organic Chemistry 15
27 Pathology 4
28 Pharmacology & ET 2
29 Philosophy 2
30 Physiology 1
31 Polymer Science 13
32 Psychology 2
33 Ramanujam Institute of Advanced Study in Mathematics
4
34 Statistics 3
35 Theoretical Physics 3
36 Women Studies 2
37 Zoology 26
Total 390
Appendices
101
Appendix 2.4
(Reference: Paragraph 2.1.9.1 (iii); Page 39) Details of reduction in intake capacity of PG programmes during
2014-19 in University of Madras
Sl. No.
Name of the PG programme Sanctioned strength
Original Revised during 2017-18
School of Basic Medical Sciences
1 Toxicology 20 10
School of Chemical Sciences
2 Analytical Chemistry 20 15
3 Energy & Material Science 20 0
4 Inorganic Chemistry 20 15
5 Organic Chemistry 20 15
6 Physical Chemistry 20 15
7 Polymer Science 20 15
School of Earth & Atmospheric Science
8 Geo-informatics 20 10
School of Economics
9 Economics 60 40
10 Econometrics 60 25
11 Financial Economics 60 25
School of English and Foreign languages
12 English 60 30
13 French 60 20
School of Fine & Performing Arts
15 Bharatanatyam 60 10
16 Indian Music 60 20
17 Folk Music 60 0
18 Rhythomology 60 0
School of Historical studies
19 Ancient History & Archeology 60 20
20 Indian History 60 30
School of Information and Communication Studies
21 Journalism & Communication 60 20
22 Online media 20 10

Audit Report (Compliance Audit), Tamil Nadu for the year ended March 2020
102
Sl. No.
Name of the PG Programme Sanctioned strength
Original Revised during 2017-18
School of Life Sciences
23 Biotechnology (SS) 20 15
School of Management studies
24 International Business & Finance 60 30
25 MBA 95 90
School of Nano science and Photonics
26 Photonics & Bio-photonics 20 10
27 Nano Science & Nano Technology (M Tech) 20 10
School of Philosophy & Religious thought
28 Comparative religion & Philosophy with specialisation in Christian studies 60 10
29 Comparative religion & Philosophy with specialisation in Saiva Siddhanta 60 5
30 Christian Scriptures 60 0
31 Indian Philosophy 60 10
32 Islamic studies 60 10
33 Jaina studies 60 20
34 Saiva Siddhanta 60 5
35 Vaishnavism 60 10
School of Political & International Studies
36 Defence & Strategic studies 60 20
37 International relations 60 20
38 Legal studies - Constitutional Law & Legal Order 60 20
39 Legal studies - International law & Organization 60 20
40 Political Science 60 20
41 Post modern Development Administration (5 yr Integrated course) 60 40
42 Public Administration 60 20
43 Public Administration (Tamil) 60 10
44 Public Affairs 60 10
45 South & South East Asian Studies 60 20

Appendices
103
Sl. No.
Name of the PG Programme Sanctioned strength
Original Revised during 2017-18
School of Sanskrit and other Indian languages
46 Applied Sanskrit 60 0
47 Sanskrit 60 10
48 Arabic 60 15
49 Hindi 60 5
50 Urdu 60 5
School of Social Sciences
51 Anthropology 60 20
52 Criminology & Criminal Justice 60 30
53 Human Resource Development Psychology 35 30
54 Human Resource Development Psychology (SS) 35 10
55 Human Resource Management 60 20
56 Life long learning 60 0
57 Sociology 60 30
58 Women studies 60 10
School of Tamil and other Dravidian languages
59 Tamil studies 60 20
60 Tamil literature & culture 60 30
61 Kannada 60 5
62 Malayalam 60 5
63 Telugu 60 5
Total 3,225 1,020

Audit Report (Compliance Audit), Tamil Nadu for the year ended March 2020
104
Appendix 2.5 (Reference: Paragraph 2.1.9.3 (ii) (a) (iii); Page 45)
Details of unserviceable equipment
Sl. No.
Name of the department
Name of the equipment Value of the equipment
Year of purchase
Period from
which not working
1 Genetics 7900HT Fast Real-Time PCR System
47,05,800 2008 2015
2 Endocrinology Real time PCR machine 19,72,441 2012 2019
3 Endocrinology Ultra centrifuge CP 100MX 19,58,787 2002 2014
4 Ultrafast Millennia V 5W Pump laser for femtosecond laser
19,50,000 1998 2018
5 Endocrinology Gel documentation system with CCD camera
10,50,000 2005 2016
6 Endocrinology High speed refrigerated centrifuge 7,20,705 2007 2014
7 Anatomy EMG-ECG 6,00,000 2005 2016
8 Endocrinology CO2 incubator (Hongkong) 5,73,138 2007 2015
9 Endocrinology Walk-in cold room 3,20,625 2007 2012
10 Pathology Leica Microtome 2,42,955 2001 2016

Appendices
105
Appendix 2.6 (Reference: Paragraph 2.1.10.3 (i); Page 51)
Non-compliance with affiliation norms Sl
No. Non-compliance of affiliation norms Name of the College
1 Constitution of Management Body
1 Alagappa University Model Constituent College of Arts & Science, Paramakudi
2 Pasumpon Thiru Muthuramalinga Thever Memorial College, Kamuthi
3 Government Arts & Science College, Mudukulathur. 4 Bharathidasan University Model College, Aranthangi 5 Bharathidasan University Constituent Arts & Science College,
Nannilam 6 University Constituent College, Tiruvottiyur, Chennai
2 Constitution of College Council
All test-checked colleges
3 Minimum Land Requirement 1 University Constituent College, Tiruvottiyur, Chennai 2 Sri Santhoshi College of Arts & Science, Maduranthakam.
4 Availability of Library 1 Bharathidasan University Constituent Arts & Science College, Nannilam
2 University Constituent College, Tiruvottiyur, Chennai
5 Availability of Toilets 1 Arignar Anna Government Arts College, Musiri 2 University Constituent College, Tiruvottiyur, Chennai
6 Availability of Hostel 1 Alagappa University Model Constituent College of Arts & Science, Paramakudi
2 Pasumpon Thiru Muthuramalinga Thever Memorial College, Kamuthi
3 Government Arts & Science College, Mudukulathur. 4 Bharathidasan University Model College, Aranthangi 5 Bharathidasan University Constituent Arts & Science College,
Nannilam 6 Ganesar Senthamil College of Arts & Science, Melaisivapuri 7 University Constituent College, Tiruvottiyur, Chennai 8 Pachaiyappa's College for Women, Kanchipuram 9 Pattammal Alagesan Arts & Science College, Athur,
Chengalpattu 10 Sri Santhoshi College of Arts & Science, Maduranthakam.
7 Availability of Playground facilities
1 Alagappa University Model Constituent College of Arts & Science, Paramakudi
2 Alagappa University Model Constituent College of Arts & Science, Paramakudi
3 Government Arts & Science College, Mudukulathur. 4 Bharathidasan University Model College, Aranthangi 5 Bharathidasan University Constituent Arts & Science College,
Nannilam 6 University Constituent College, Tiruvottiyur, Chennai

Audit Report (Compliance Audit), Tamil Nadu for the year ended March 2020
106
Appendix 2.7 (Reference: Paragraph 2.1.10.3 (ii) (a); Page 52)
List of colleges wherein new programmes were started and intake increased pending approval by the University of Madras
Sl. No.
Name of the College No. of programmes started/ programmes
in which intake increased or
curriculum revised without prior
approval
List of new programmes started/ programmes in which intake increased or
curriculum revised without prior approval
1 Anna Adarsh College for Women, Chennai 1 M.Sc. (Mathematics)
2 Annai Therasa Arts & Science College, Thirukazhukundram 1 B.Sc. (Chemistry)
3 Annai Veilankanni College, Chennai 4
B.Com. (Computer Applications), M.Sc. (Computer Science), M.Com. and B.A. (English)
4 Annai Violet Arts and Science College, Chennai 3
B.Com. (Bank Management), B.Com. (Information System Management) and B.Sc. (Chemistry)
5 Apollo Arts & Science College, Kancheepuram 1 B.Com. (Corporate Secretaryship)
6 Asan Memorial College of Arts and Science, Jaladampet, Chennai
2 B.Com. (Computer Applications) and B.Sc. (Computer Science)
7 Bhakatavatsalam Memorial College for Women, Korattur, Chennai
2 B.Com. (Accounting & Finance) and M.A. (English)
8 C. Kandaswami Naidu College for Men, Chennai 3 B.A. (English), B.Com. (Accounting &
Finance) and B.Com. (General) 9 Chellammal Women’s College,
Chennai 5 M.A. (English), M.Com., B.Com. (Accounting & Finance), B.B.A and M.A. (Economics)
10 D.B. Jain College, Thoraipakkam, Chennai 1 B.Com. (Co-operation)
11 D.G. Vaishnav College, Chennai 1 B.Com. (Honours) 12 D.N Bhatt Vaishnav College for
Women, Chrompet, Chennai 2 B.Sc. (Clinical Nutrition & Dietetics) and M.A. (English)
13 D.R.B.C.C.C.Hindu College, Pattabiram, Chennai 2 B.A. (Tamil) and B.A. (English)
14 Dhanraj Baid Jain College, Thoraipakkam, Chennai 1 B.Sc. (Visual Communication)
15 Don Bosco Arts & Science College, Chennai 3
B.Com. (General), B.Com. (Corporate Secretaryship) and B.Sc. (Visual Communication)
16 Ethiraj College for Women, Chennai 1 B.Com. (Honours)

Appendices
107
Sl. No.
Name of the College No. of programmes started/ programmes
in which intake increased or
curriculum revised without prior
approval
List of new programmes started/ programmes in which intake increased or
curriculum revised without prior approval
17 Government Arts College, Vyasarpadi, Chennai
5
B.A. (Defence & Strategic Studies), B.Sc. (Home Science Nutrition Food Service Management & Dietetics), B.Sc. (Plant Biology & Plant Biotechnology), B.Sc. (Visual Communication) and M.A. (Economics)
18 Guru Nanak College, Chennai 1 B.Com. (Honours) 19 L.N. Government College
(Autonomous), Ponneri 3 B.Com. (General), B.A. (Tamil) and BCA
20 L.N. Government College (Autonomous), Ponneri 2 B.Com. (Co-operation) and BA. (Economics)
21 M.O.P. Vaishnav College for Women, Chennai 1 M.A. (Human Resource Management)
22 Madha Arts and Science College, Chennai 1 B.C.A.
23 Madras School of Social work, Chennai 1 B.Sc., (Psychology)
24 Mar Gregorios College, Chennai 1 B.Com. (General)
25 Meenakshi Ammal Arts & Science College, Uthiramerur 4 B.B.A, B.Sc. (Mathematics), B.Sc. (Physics)
and M.Com. 26 Mohamed Sathak College of Arts
& Science, Sholinganallur 5 B.C.A. & B.Sc. (Computer Science) B.Com. (Computer Application), B.Sc. (Mathematics) & M.Sc. (Visual Communication)
27 Nazareth College of Arts & Science, Chennai 5 M.A. (English), B.Com. (General), BBA,
BCA and Master of Social Work 28 New College, Chennai 3 B.Com. (Honours), B.Sc. (Biotechnology) and
M.Com. (Corporate Secretaryship) 29 New Prince Shri Bhavani Arts
and Science College, Chennai 1 M.Sc. (Computer Science)
30 Patrician College of Arts and Science, Chennai 1 M.A. (English)
31 Ponnusamy Nadar College of Arts and Science, Thiruvallur 1 M.Com.
32 Presidency College (Autonomous), Chennai 2 B.Com. (General) and Master of Social Work
33 Mar Gregorios College of Arts and Science, Chennai 2 M.Com. (General) and B.A. (Tamil)
34 R.B Gothi Jain College for Women, Red Hills, Chennai 1 B.Sc. (Mathematics)
35 R.V.Government Arts College, Chengalpattu 2 B.A. (Tamil) and B.Sc. (Computer Science)
36 Rajeswari Vedachalam Government Arts College, Chengalpattu
3 B.C.A., B.A. (Political Science) and M.Sc. (Computer Science)
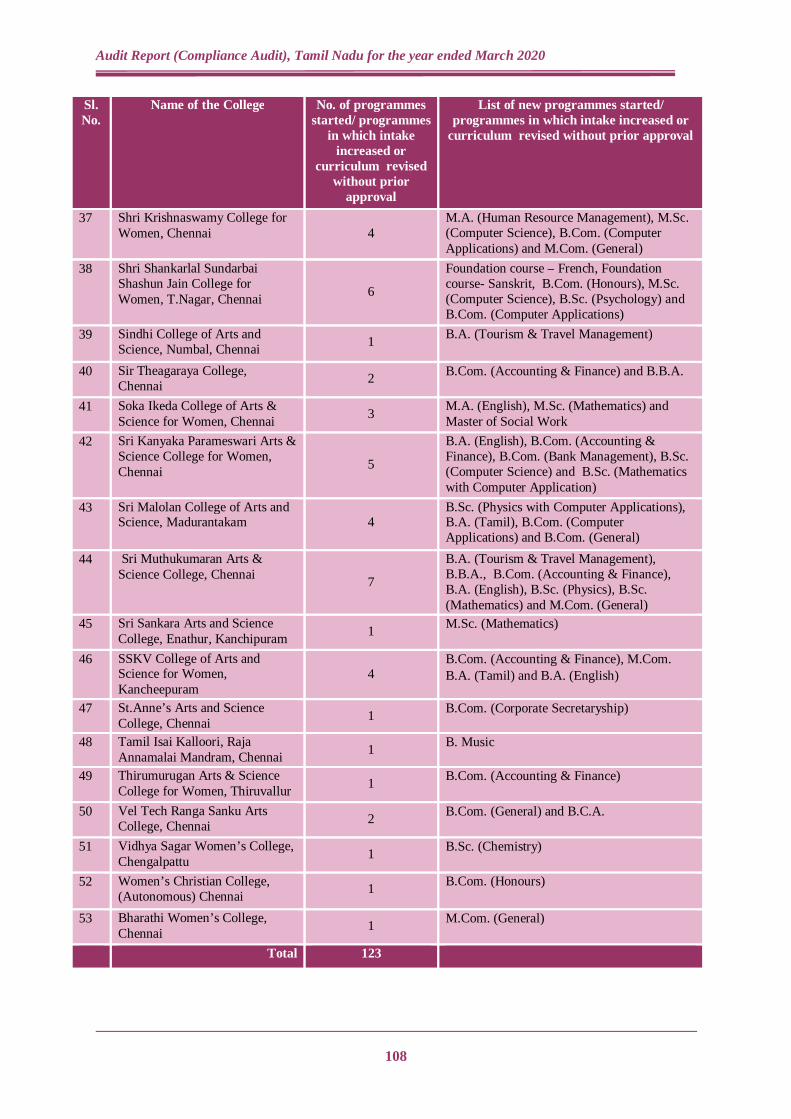
Audit Report (Compliance Audit), Tamil Nadu for the year ended March 2020
108
Sl. No.
Name of the College No. of programmes started/ programmes
in which intake increased or
curriculum revised without prior
approval
List of new programmes started/ programmes in which intake increased or
curriculum revised without prior approval
37 Shri Krishnaswamy College for Women, Chennai 4
M.A. (Human Resource Management), M.Sc. (Computer Science), B.Com. (Computer Applications) and M.Com. (General)
38 Shri Shankarlal Sundarbai Shashun Jain College for Women, T.Nagar, Chennai 6
Foundation course – French, Foundation course- Sanskrit, B.Com. (Honours), M.Sc. (Computer Science), B.Sc. (Psychology) and B.Com. (Computer Applications)
39 Sindhi College of Arts and Science, Numbal, Chennai 1 B.A. (Tourism & Travel Management)
40 Sir Theagaraya College, Chennai 2 B.Com. (Accounting & Finance) and B.B.A.
41 Soka Ikeda College of Arts & Science for Women, Chennai 3 M.A. (English), M.Sc. (Mathematics) and
Master of Social Work 42 Sri Kanyaka Parameswari Arts &
Science College for Women, Chennai 5
B.A. (English), B.Com. (Accounting & Finance), B.Com. (Bank Management), B.Sc. (Computer Science) and B.Sc. (Mathematics with Computer Application)
43 Sri Malolan College of Arts and Science, Madurantakam 4
B.Sc. (Physics with Computer Applications), B.A. (Tamil), B.Com. (Computer Applications) and B.Com. (General)
44 Sri Muthukumaran Arts & Science College, Chennai 7
B.A. (Tourism & Travel Management), B.B.A., B.Com. (Accounting & Finance), B.A. (English), B.Sc. (Physics), B.Sc. (Mathematics) and M.Com. (General)
45 Sri Sankara Arts and Science College, Enathur, Kanchipuram 1 M.Sc. (Mathematics)
46 SSKV College of Arts and Science for Women, Kancheepuram
4 B.Com. (Accounting & Finance), M.Com. B.A. (Tamil) and B.A. (English)
47 St.Anne’s Arts and Science College, Chennai 1 B.Com. (Corporate Secretaryship)
48 Tamil Isai Kalloori, Raja Annamalai Mandram, Chennai 1 B. Music
49 Thirumurugan Arts & Science College for Women, Thiruvallur 1 B.Com. (Accounting & Finance)
50 Vel Tech Ranga Sanku Arts College, Chennai 2 B.Com. (General) and B.C.A.
51 Vidhya Sagar Women’s College, Chengalpattu 1 B.Sc. (Chemistry)
52 Women’s Christian College, (Autonomous) Chennai 1 B.Com. (Honours)
53 Bharathi Women’s College, Chennai 1 M.Com. (General)
Total 123

Appendices
109
Appendix 2.8 (Reference: Paragraph 2.1.10.3 (ii) (b); Page 53)
List of colleges which started new programmes pending approval by Alagappa University
Sl. No.
Name of College No. of new programmes started or curriculum
revised or intake increased without prior approval of
University 1 Alagappa Government Arts College, Karaikudi 14 2 Alagappa University Evening College, Ramanathapuram 1 3 Anandha College, Devakottai 2 4 Arumugam Pillai Seethai Ammal College, Tiruppattur 10 5 Caussanel College of Arts and Science, Muthupettai 3 6 Dr. Umayal Ramanathan College for Women, Karaikudi 7 7 Dr. Zakir Hussain College, Ilayangudi 5 8 Government Arts and Science College, Thiruvadanai 4 9 Government Arts College, Paramakudi 13
10 Government Arts College for Women, Sivaganga 4 11 Idhaya College for Women, Sarugani 3 12 Madurai Sivakasi Nadars Pioneer Meenakshi Women’s College,
Poovanthi 4
13 Mohamed Sathak Hamid College of Arts and Science for Women, Sakkarakkottai 6
14 Morning Star Arts and Science College for Women, Pasumpon 5 15 Nachiappa Swamigal Arts and Science College, Koviloor 4 16 Puratchi Thalaivar Dr. M.G.R. Arts and Science College for Women,
Uchippuli, Ramanathapuram 7
17 Raja College of Arts and Science, Kunjarvalasai 5 18 Raja Doraisingam Government Arts College, Sivaganga 10 19 Seethalakshmi Achi College for Women, Pallathur 2 20 Sethupathy Government Arts College, Ramanathapuram 10 21 Singai Sithar Ayya College of Arts and Science, A.Thekkur 5 22 Sonai Meenal Arts and Science College, Mudukulathur 2 23 Sree Sevugan Annamalai College, Devakottai 1 24 St. Joseph’s Arts and Science College for Women, South Singampunari 6 25 St. Justin Arts and Science College for Women, Cholapuram 3 26 Syed Ammal Arts and Science College, Ramanathapuram 10 27 Syed Hameedha Arts and Science College, Kilakarai 2 28 Thassim Beevi Abdul Kader College for Women, Kilakarai 6 29 Thiyagi Dharmakkan Amirtham College of Arts and Science,
Kannirajapuram 10
30 V.S.S. Government Arts College, Pulankurichi 9 31 Vidhyaa Giri College of Arts and Science, Puduvayal 14
Total 187

Audit Report (Compliance Audit), Tamil Nadu for the year ended March 2020
110
Appendix 2.9 (Reference: Paragraph 2.1.10.7 (i); Page 56)
Financial position of sampled Universities
(` in crore)
Financial Year
Receipts and Charges of sampled Universities
AU BDU MTWU UoM
Receipts Charges Receipts Charges Receipts Charges Plan Non-plan
Receipts Charges Receipts Charges
2014-15 131.18 104.83 213.32 226.35 46.05 45.78 943.04 971.36 145.67 156.77
2015-16 146.58 113.99 265.92 267.98 50.20 46.40 840.11 843.39 109.13 153.87
2016-17 186.77 160.01 198.77 191.43 72.79 75.32 990.96 989.76 243.16 263.83
2017-18 193.39 198.28 441.50 402.76 65.60 61.50 570.08 545.98 275.29 256.23
2018-19 255.83 199.25 29.18 26.31 69.26 71.72 636.80 657.04 186.70 207.39

Appendices
111
Appendix 3.1 (Reference: Paragraph 3.1.3; Page 69)
Details of tractors found to be subsequently registered in the name of persons other than the beneficiaries under Components 3 and 4 of SMAM
Sl. No.
Division Year Classi-fication
No. of benefi-ciaries
No. of tractors
purchased
Subsidy released
(in ₹) 1 Cuddalore division
Chidambaram Sub-Division 2018-19 Individual 2 2 5,56,350 Sub – Total (1) 2 2 5,56,350
2 Kancheepuram division (a) Nandanam Sub-Division 2018-19 CHC 3 3 8,05,032 (b) Madurantagam
Sub-Division 2018-19 CHC 11 15 40,63,707
Sub – Total (2) 14 18 48,68,739 3 Ramanathapuram division
(a) Paramakudi Sub-Division 2017-18
Individual 6 6 7,00,000 CHC 6 6 17,29,331
2018-19
Individual 7 7 12,98,618 CHC 6 6 16,78,243
Village Farm Bank 3 3 15,27,560
2019-20 Individual 15 15 40,73,451 (b) Ramanathapuram
Sub-Division 2017-18 Individual 8 8 9,25,000
2018-19 Individual 2 2 2,50,000
CHC 1 1 2,97,480 2019-20 Individual 3 3 10,01,890
Sub – Total (3) 57 57 1,34,81,573 4 Tiruvallur division
Tiruvallur Sub-Division 2018-19
Individual 2 2 2,50,000 CHC 3 3 7,74,135
Sub – Total (4) 5 5 10,24,135
5
Tiruvannamalai division
(a) Arani Sub-Division
2017-18 Village Farm Bank 6 6 29,44,908
2018-19 CHC 2 2 5,34,762
2019-20 Individual 5 5 19,76,006
CHC 2 2 5,61,367
(b) Tiruvannamalai Sub-Division 2018-19
Individual 4 4 11,78,169 CHC 3 3 7,93,180
Village Farm Bank 1 1 5,84,117
2019-20 Individual 4 4 15,72,353 Sub-Total (5) 27 27 1,01,44,862 Grand Total 105 109 3,00,75,659

Audit Report (Compliance Audit), Tamil Nadu for the year ended March 2020
112
Appendix 3.2 (Reference: Paragraph 3.2.1; Page 74)
Short collection of lease rent
Extent of land: Three acres or 1,30,680 Square feet (3.00 Acres x 43,560)
(Amount in `)
Period of lease Due date for revising lease rent
Market value per
sq.ft.
Market value for 1,30,680
Sq.ft.
Period of levy
Lease rent leviable (Col.
(5) x 7 per cent) x Col (6)
From To
(1) (2) (3) (4) (5) (6) (7)
09-06-1993 08-06-1996 09-06-1996 - - 3 years 2,79,351#
09-06-1996 08-06-1999 09-06-1999 25.00 32,67,000 3 years 6,86,070
09-06-1999 08-06-2002 09-06-2002 70.30 91,86,804 3 years 19,29,229
09-06-2002 08-06-2005 09-06-2005 98.75 1,29,04,650 3 years 27,09,977
09-06-2005 08-06-2008 09-06-2008 138.73 1,81,29,236 3 years 38,07,140
09-06-2008 08-06-2011 09-06-2011 380.00 4,96,58,400 3 years 1,04,28,264
09-06-2011 08-06-2013 09-06-2013 534.00 6,97,83,120 2 years 97,69,637
09-06-2013 08-06-2016 09-06-2016 650.00 8,49,42,000 3 years 1,78,37,820
09-06-2016 08-06-2019 09-06-2019 650.00 8,49,42,000 3 years 1,78,37,820
09-06-2019 08-06-2022* 09-06-2022 650.00 8,49,42,000 2 years* 1,18,91,880
Total 7,71,77,188
Less: Amount paid by the lessee 34,22,610
Amount of short collection 7,37,54,578
# ` 93,711 per annum as per lease agreement
* Lease rent due calculated for two years, up to 09-06-2021

Appendices
113
Appendix 3.3 (Reference: Paragraph 3.3.2; Page 79)
Details of works done for Samathuvapuram at Kottaivengaipatti,
Kannamangalapatti village, Singampunari PU, Sivagangai district
Sl. No.
Name of Work/ Construction
No./ Quan-
tity
Date of AS/ RAS
Estimate/ Revised Estimate Amount
Total Expend-
iture incurred
Status of Work
(₹ in lakh)
Source of Fund: Samathuvapuram Fund
1 Houses 100 21-06-2010 193.00 193.00 Completed
2 OHT 1 12-08-2010/ 22-09-2010
2.20 2.20 Completed
3 Pump room 1 12-08-2010 0.47 0.47 Completed
4 Public Distribution System shop
1 12-08-2010 3.30 3.30 Completed
5 Drinking water pipeline 2
12-08-2010/ 22-09-2010
2.43 2.42 Completed
6 Entrance Arch 1 10-12-2010 2.90 2.90 Completed
7 Bituminous Road 1 10-12-2010 28.05 28.05 Completed
8 Electrical poles and Street lights 51/44 28-02-2011 4.80 4.80 Completed
9 Water fountains 12 28-02-2011 2.90 - Pending
10 RCC Pipe culvert 1 28-02-2011 2.90 2.90 Completed
11 Borewell 1 23-09-2010 1.62 1.62 Completed
Total (₹ in lakh) 244.57 241.66
Total (₹ in crore) 2.45 2.42
Date of completion of Works: 16-06-2016

Audit Report (Compliance Audit), Tamil Nadu for the year ended March 2020
114
Appendix 3.4
(Reference: Paragraph 3.4.1; Page 88) Details of HESS sanctioned to ineligible SC/ST students during 2017-20
I Self-financing educational institutions
Sl. No.
District No. of insti-
tutions
2017-18 2018-19 2019-20 Total
No. of
stud-ents
Amount (in `)
No. of
stud-ents
Amount (in `)
No. of
stud-ents
Amount (in `)
No. of
stud-ents
Amount (in `)
1 Chennai 5 44 3,41,000 0 0 0 0 44 3,41,000
2 Kancheepuram 15 171 13,60,500 355 28,40,000 39 2,94,000 565 44,94,500
3 Tirunelveli 10 234 18,27,500 21 1,68,000 21 1,57,500 276 21,53,000
4 Villupuram 1 4 32,000 0 0 0 0 4 32,000
Total 31 453 35,61,000 376 30,08,000 60 4,51,500 889 70,20,000
Total HESS paid (` in crore) 0.36 0.30 0.05 0.70
II Self-supporting courses in Government aided educational institutions
Sl. No.
District No. of institu-tions
2017-18 2018-19 2019-20 Total
No. of
stud-ents
Amount (in `)
No. of
stud-ents
Amount (in `)
No. of
stud-ents
Amount (in `)
No. of
stud-ents
Amount (in `)
1 Chennai 2 62 4,96,000 97 7,76,000 200 16,00,000 359 28,72,000
2 Cuddalore 1 52 4,00,000 131 10,12,000 138 10,79,000 321 24,91,000
3 Dindigul 2 2 15,000 62 4,70,000 29 2,26,000 93 7,11,000
4 Erode 2 0 0 0 0 10 75,500 10 75,500
5 Madurai 4 46 3,52,500 9 69,500 7 54,000 62 4,76,000
6 Tiruchirappalli 4 109 8,28,500 157 11,90,500 232 17,51,500 498 37,70,500
7 Tirunelveli 4 10 76,500 34 2,58,500 53 4,04,500 97 7,39,500
Total 19 281 21,68,500 490 37,76,500 669 51,90,500 1,440 1,11,35,500
Total HESS paid (` in crore) 0.22 0.38 0.52 1.11

Appendices
115
Appendix 3.5 (Reference: Paragraph 3.4.2; Page 90)
Details of excess fees claimed by private schools during
the Academic Years 2018-19 and 2019-20 Sl. No.
District Academic Year
Stan-dard
No. of Private schools
No. of students admitted during 2018-20
Excess fee reimbursed during the AY
2018-19 2019-20 Total
(In `)
1 Ariyalur
2018-19 VI 1 3 78,300 - 78,300
2019-20 VI 2 4 - 60,615 60,615
2019-20 VII 1 3 89,607 - 89,607
2 Kancheepuram
2018-19 VI 4 11 15,68,000 - 15,68,000 2019-20 VI 3 13 - 19,18,140 19,18,140 2019-20 VII 2 9 12,35,320 - 12,35,320
3 Karur
2018-19 VI 2 6 1,38,500 - 1,38,500 2019-20 VI 0 0 0 0 0 2019-20 VII 2 6 1,52,050 - 1,52,050
4 Perambalur
2018-19 VI 2 3 40,730 - 40,730 2019-20 VI 2 2 - 32,900 32,900 2019-20 VII 2 3 60,250 - 60,250
5 Thanjavur
2018-19 VI 4 6 1,42,850 - 1,42,850 2019-20 VI 2 3 - 69,850 69,850 2019-20 VII 4 6 1,47,850 - 1,47,850
6 Tirunelveli
2018-19 VI 4 4 1,63,165 - 1,63,165 2019-20 VI 5 8 - 2,86,390 2,86,390 2019-20 VII 3 3 1,71,300 - 1,71,300
7 Tiruppur
2018-19 VI 5 11 2,92,670 - 2,92,670 2019-20 VI 3 10 - 2,51,917 2,51,917 2019-20 VII 4 10 2,43,895 - 2,43,895
8 Tiruvallur
2018-19 VI 4 14 17,97,550 - 17,97,550 2019-20 VI 4 13 - 17,89,790 17,89,790 2019-20 VII 4 14 16,68,750 - 16,68,750
9 Vellore
2018-19 VI 1 8 6,21,600 - 6,21,600 2019-20 VI 4 13 - 14,18,080 14,18,080 2019-20 VII 1 8 6,92,400 - 6,92,400
10 Villupuram
2018-19 VI 1 21 1,49,100 0 1,49,100 2019-20 VI 1 22 - 5,17,000 5,17,000 2019-20 VII 1 21 4,35,750 - 4,35,750
Total
258 98,89,637 63,44,682 1,62,34,319

Audit Report (Compliance Audit), Tamil Nadu for the year ended March 2020
116
Glossary of abbreviations
Abbreviations Full Form AAA Academic and Administrative Audit
AE Agricultural Engineering
AED Agriculture Engineering Department
AISHE All India Survey on Higher Education
AS Administrative Sanction
ASC Academic Staff Colleges
ASVS Anti Snake Venom Serum
ATNs Action Taken Notes
AU Alagappa University
AY Academic Years
BDO Block Development Officer
BDU Bharathidasan University
BoS Board of Studies
CAG Comptroller and Auditor General of India
CDPOs Child Development Project Offices
CDSCO Central Drugs Standard Control Organization
CoE Colleges of Excellence
CE Chief Engineer cGMP current Good Manufacturing Practices CHC Custom Hiring Centres
CLA Commissioner of Land Administration
CPE Colleges with Potential for Excellence
CPEPA Centre for Potential Excellence in Particular Area
CRDPR Commissioner of Rural Development and Panchayat Raj DADW Director of Adi Dravidar Welfare DADWO District Adi Dravidar and Tribal Welfare Officer
DAT Department of Anti Toxin
DC District Collector
DDE Directorate of Distant Education
DME Directorate of Medical Education
DPC Duties, Powers and Conditions of Services
DPR Detailed Project Report

Appendices
117
Abbreviations Full Form DRD Director of Rural Development and Panchayat Raj
DRDA District Rural Development Agency
DRO District Revenue Officer
EE Executive Engineer
EE, RD&PR Executive Engineer, Rural Development and Panchayat Raj
EPR Electron Paramagnetic Resonance
GER Gross Enrolment Ratio
GMP Good Manufacturing Practices
GoI Government of India
GoTN Government of Tamil Nadu
G&SSA General and Social Sector Audit
HEI Higher Education Institutions
HESS Higher Education Special Scholarship
HM Head Master
HRDC Human Resource Development Centre
ICDS Integrated Child Development Services
ICT Information and Communication Technology
IHHL Individual House Hold Latrine
IQAC Internal Quality Assurance Cell
IRs Inspection Reports
KIPMR King Institute of Preventive Medicine and Research, Chennai
LB Local Bodies
MD SHS - TN Mission Director, State Health Society - Tamil Nadu
MHRD Ministry of Human Resources Development
MTWU Mother Teresa Women’s University
NHM National Health Mission
NIRF National Institutional Ranking Framework
OHT Over Head Tank PAC Committee on Public Accounts PD, DRDA Project Director, District Rural Development Agency
PIL Public Interest Litigations
PIP Person in Position
PMSS Post Matric Scholarship Scheme
PPMS Physical Property Measurement System

Audit Report (Compliance Audit), Tamil Nadu for the year ended March 2020
118
Abbreviations Full Form PRIs Panchayat Raj Institutions
PSFDC Private Schools Fee Determination Committee
PU Panchayat Union
PUC PU Council
PWD Public Works Department
RAC Research Advisory Committee
RC Registration Certificate
RP Research and Professional Practices
RSO Revenue Standing Order
RUSA Rastriya Uchchatar Shiksha Abhiyan
SBM (G) Swachh Bharat Mission (Gramin)
SC/ST Scheduled Caste/Scheduled Tribe
SCAA Standing Committee on Academic Affairs
SD Security Deposit
SE Superintending Engineer
SFR Student-faculty Ratio
SMAM Sub Mission on Agricultural Mechanisation
SQAC State Quality Assurance Cell
TANSCHE Tamil Nadu State Council for Higher Education
TNFC Tamil Nadu Financial Code
TNMSC Tamil Nadu Medical Services Corporation Limited
TNSAAAC TN State Academic Audit & Accreditation Council
TOT Transfer of Technology
TRB Teachers Recruitment Board
TS Technical Sanction
UGC University Grant Commission
UoM University of Madras
UPS Uninterrupted Power Supply
VC Vice Chancellor
VPs Village Panchayats
VSM Vibrating Sample Magnetometer

© COMPTROLLER AND
AUDITOR GENERAL OF INDIA www.cag.gov.in
http://www.cag.gov.in/ag1/tamil-nadu/en


![[1 Family Pension] - Comptroller and Auditor General of India](https://img.pdfslide.net/doc/110x75/615a061d7147f407e647de30/1-family-pension-comptroller-and-auditor-general-of-india.jpg)