Embed Size (px)
Citation preview
JWGBIRD REPORT 2016
Report of the OSPAR/HELCOM/ICES Working Group on Marine Birds (JWGBIRD)
10–14 October 2016
Thetford, UK
ICES ADVISORY COMMITTEE
ICES CM 2016/ACOM:29
REF. ACOM, SCICOM, OSPAR, HELCOM
Recommended format for purposes of citation:
JWGBIRD. 2017. Report of the OSPAR/HELCOM/ICES Working Group on Marine Birds (JWGBIRD), 10–14 October 2016, Thetford, UK. ICES CM 2016/ACOM:29. 124 pp. For permission to reproduce material from this publication, please apply to the Gen-eral Secretary at ICES.
The document is a report of an Expert Group under the auspices of the OSPAR Commission, Baltic Sea Environment Protection Commission, International Council for the Exploration of the Sea and does not necessarily represent the views of the Council.
© 2017 OSPAR Commission, Baltic Marine Environment Protection Commission, International Council for the Exploration of the Sea
International Council for the Exploration of the Sea (ICES)Conseil International pour l’Exploration de la Mer H. C. Andersens Boulevard 44–46DK-1553 Copenhagen VDenmarkTelephone (+45) 33 38 67 00Telefax (+45) 33 93 42 [email protected]
JWGBIRD REPORT 2016 | i
Contents
Executive summary ................................................................................................................ 5
1 Introduction .................................................................................................................... 7
2 Develop a concept for incorporating at-sea data in the abundance indicators of HELCOM and OSPAR .......................................................................... 9
2.1 Introduction ........................................................................................................... 9 2.2 Review of offshore seabird monitoring programmes in the
HELCOM and OSPAR regions: status and previous studies in the single contracting parties ................................................................................... 10
2.3 Concept for coordinated large-scale at-sea surveys in the HELCOM and OSPAR areas ............................................................................. 20
2.4 Methodological considerations for the development of abundance indicators derived from at-sea data, in combination with land-based count data ................................................................................................. 25
2.5 References ............................................................................................................ 26 2.6 Annex 1 ................................................................................................................ 27
2.7 Annex 2 ................................................................................................................ 47
3 Implementation of the EU Plan of Action on Seabird Bycatch ........................... 58
3.1 Introduction ......................................................................................................... 58 3.2 Collaboration with WGBYC .............................................................................. 60
3.3 ToR b i) Gap analysis of measures already implemented to identify further action ....................................................................................................... 60 3.3.1 Lessons from gap analysis of measures already
implemented ........................................................................................... 61 3.3.2 Methodology .......................................................................................... 61 3.3.3 Key points from Actions under Specific Objective 1:
Identifying and addressing weaknesses and incoherencies in current measures both in EU and non-EU waters (See Table 3.1, below) .................................................................................... 62
3.3.4 Key points from Actions under Specific Objective 2: Collecting data critical to establishing the extent of seabird bycatch, particularly in fisheries/areas in EU and non-EU waters where the information is limited, only anecdotal and/or not available (See Table 3.2, below) ........................................ 69
3.3.5 Key points from Actions under Specific Objective 3: Implementation of mitigation measures where information indicates occurrence of seabird bycatch (See Table 3.3, below) ...................................................................................................... 73
3.3.6 Key points from Actions under Specific Objective 4: Provide education and training to fishermen in the use and benefits of mitigation measures and accurate identification
ii | JWGBIRD REPORT 2016
of seabirds for identification purposes (See Table 3.4, below) ...................................................................................................... 80
3.3.7 Key points from Actions under Specific Objective 5: Instigating research into practical and effective mitigation measures for all fishing gears which impact on seabirds (See Table 3.5, below) ............................................................................ 83
3.4 What more could/should be done, and identification of further mitigation measures? ......................................................................................... 87 3.4.1 Purse seines............................................................................................. 87 3.4.2 Recreational fisheries ............................................................................. 88 3.4.3 Case study: Risk assessment of seabird bycatch in UK
waters ...................................................................................................... 90 3.4.4 BirdLife International mitigation case study 1: Seabird Task
Force Lithuania: Interim Project Report-Effectiveness of Gillnet Bycatch Mitigation Measures .................................................. 91
3.4.5 BirdLife International mitigation case study 2: Seabird Task Force Germany ....................................................................................... 92
3.4.6 BirdLife International mitigation case study 3: Seabird Task Force Portugal ........................................................................................ 93
3.5 Recent work to assess and mitigate seabird bycatch in non-EU countries ............................................................................................................... 94 3.5.1 Norway .................................................................................................... 94 3.5.2 Iceland ..................................................................................................... 95
3.6 ToR b ii) Assess ways of improving the limited knowledge of the extent of seabird bycatch in the NE Atlantic longlining fleets ..................... 96
3.7 Recommendations .............................................................................................. 98
3.8 References ............................................................................................................ 99
3.9 Acknowledgements .......................................................................................... 101
4 Anthropogenic threats to OSPAR/HELCOM seabirds in other parts of their annual range ...................................................................................................... 102
4.1 Introduction ....................................................................................................... 102 4.2 Deliberate capture of seabirds for export for human consumption
off West Africa .................................................................................................. 102 4.3 Trapping of terns in West Africa .................................................................... 103
4.4 Spring hunting in Arctic Russia ...................................................................... 104
4.5 Winter hunting in Greenland .......................................................................... 104
4.6 Bycatch in fisheries ........................................................................................... 104 4.7 Other threats ...................................................................................................... 105
4.8 References .......................................................................................................... 105
5 Review the process of data collation for the new OSPAR Marine Bird Database and the HELCOM bird abundance indicators and recommend how this might be improved ............................................................. 107
5.1 OSPAR ................................................................................................................ 107 5.1.1 Background ........................................................................................... 107
JWGBIRD REPORT 2016 | iii
5.1.2 Data entry format ................................................................................. 108 5.1.3 Data submission ................................................................................... 109 5.1.4 Other recommendations ..................................................................... 109 5.1.5 Other issues .......................................................................................... 110
5.2 HELCOM ........................................................................................................... 110 5.2.1 References ............................................................................................. 111
6 Review the content drafted for the State/trends (two paragraphs) of marine seabirds for the Ecosystem Overviews of the Iceland Sea and Norwegian Sea ecoregions ....................................................................................... 112
6.1 Text reviewed by JWGBIRD ............................................................................ 112 6.1.1 Review of Seabird text extracted from the Eos Iceland Sea ........... 112 6.1.2 Review of Seabird text extracted from the EOs_Norwegian
Sea .......................................................................................................... 113
6.2 New Text Drafted by JWGBIRD ..................................................................... 115 6.2.1 Seabird text for the EO Baltic Sea ...................................................... 115 6.2.2 Seabird text for the EO Oceanic Northeast Atlantic ........................ 115
Annex 1: Participants list .................................................................................... 116
Annex 2: Recommendations .............................................................................. 119
Annex 3: Draft JWGBird Terms of Reference for 2017 ................................. 120

JWGBIRD REPORT 2016 | 5
Executive summary
Hosted by the British Trust for Ornithology, the Joint OSPAR/HELCOM/ICES Work-ing Group on Seabirds met in Thetford, U.K., 10–14 October 2016. The meeting was chaired by Morten Frederiksen, Ian Mitchell and Volker Dierschke, and was attended by 20 members and invited experts representing eleven countries, two of them by correspondence. Following the tradition of the preceding meetings, the objectives were to continue development of OSPAR and HELCOM seabird indicators under the Marine Strategy Framework Directive and to discuss seabird-related issues relevant to human uses of the sea. The meeting consisted of a series of interconnected work-shops, where subgroups with floating membership discussed Terms of Reference. Report chapters were drafted by Term of Reference leads and collated by the chairs.
Based on JWGBIRD’s work of the preceding years, both OSPAR and HELCOM sea-bird indicators are currently in operation. During 2016, counts of seabirds at breeding sites and along coast during the non-breeding season were used to calculate the indi-cators, with the results ready to feed the OSPAR Intermediate Assessment (IA 2017) and the HELCOM Holistic Assessment (HOLAS II, in 2018). However, the analyses for the NE Atlantic and the Baltic suffered from database problems and late data de-liveries, and a Term of Reference of the meeting was designated to discuss how such problems could be circumvented in future.
Another Term of Reference dealt with the possibilities of integrating at-sea data of seabirds from the non-breeding season into the abundance indicators, because such data can be used to indicate the status of marine areas off the coast, can be linked more directly to environmental data (including fisheries) and allow to include species not breeding in the respective regions. The review of at-sea monitoring projects in place or planned in most OSPAR and HELCOM contracting parties opened perspec-tives to combine the respective aerial and ship-based surveys in an internationally coordinated way. Therefore, a general approach including recommendations for analyses was reported to the meeting and is attached as an annex to this report. Based on this, the meeting discussed related issues such as the choice of species covered and appropriate survey seasons, spatial coverage and transect designs, data formats, how to deal with ice cover during surveys, and how to combine at-sea and coastal data. Funding for coordinated at-sea surveys needs clarification, and it was recommended to form a steering group under the umbrella of a legal body to enable fund-raising.
An ongoing problem for many seabird species is the bycatch in fishing gear, namely in gillnets and at longlines. To reduce the number of seabirds incidentally caught, the European Union adopted an ‘Action Plan for reducing incidental catches of seabirds in fishing gears’ (COM(2012)665final) in 2012. In a Term of Reference, the meeting reviewed the implementation of this Action Plan in the EU Member States, including additional information from non-EU countries. Relevant issues discussed and result-ing in recommendations by JWGBIRD are the monitoring of bycatch (including Re-mote Electronic Monitoring) and fishing effort (e.g. adapting VMS-tracking technology to small-scale vessels), risk assessments in order to identify areas of over-lap of high fishing effort and high densities of vulnerable seabirds, and mitigation measures. JWGBIRD welcomes the offer of closer collaboration with the ICES Work-ing Group on Bycatch of Protected Species (WGBYC).
Many seabird species living in European waters and covered by OSPAR and HEL-COM indicators are not continuously present in those areas, but either migrate west- or southwards for wintering or have their breeding origin further east in the Russian
6 | JWGBIRD REPORT 2016
Arctic. This means that bird numbers measured in the indicators are exposed to vari-ous threats acting outside the reporting areas of OSPAR and HELCOM, and thus may have impact on the indicator results. As it is meaningful to know more about such external influence on indicator output, the meeting reviewed threats occurring in West Africa (capture of gannets for human consumption, trapping of terns), in the South Atlantic (longline fisheries) and in Arctic Russia and Greenland (hunting) as some prominent examples. Altogether it appeared that there is only little knowledge about such threats outside European waters and that more attention should be paid to this.
JWGBIRD REPORT 2016 | 7
1 Introduction
The Joint OSPAR/HELCOM/ICES Working Group on Seabirds (JWGBIRD), chaired by Ian Mitchell (OSPAR/UK), Morten Frederiksen (ICES/Denmark) and Volker Di-erschke (HELCOM/Germany), met at British Trust for Ornithology in Thetford, U.K., 10–14 October 2016 to address the following terms of reference:
a ) Develop a concept for incorporating at-sea data in the abundance indica-tors of HELCOM and OSPAR (OSPAR MSFD common indicator B1 and HELCOM wintering waterbirds abundance core indicator). This will in-clude: i ) Review of relevant data available from previous studies in the OSPAR
area (respective information on seabird monitoring surveys carried out in the HELCOM area/ Baltic Sea since 1991 was already made available in the HELCOM BALSAM seabird meta-database).
ii ) Concept for coordinated large-scale at-sea surveys in the HELCOM and OSPAR areas in future years that will deliver the necessary data basis for the abundance indicator work (based on experiences during the HELCOM joint winter survey 2015/2016 and previous work in the North Sea using the ESAS data, see Annex 1 of the OSPAR CEMAP Guidelines for indicator B1-marine bird abundance). An assessment of the potential costs of such surveys should be included.
iii ) Methodological considerations for the development of abundance in-dicators derived from at-sea data, in combination with land-based count data where applicable.
b ) Review the implementation of the EU Plan of Action on Seabird Bycatch, potentially in collaboration with WGBYC. i ) Carry out a gap analysis of measures that have already been imple-
mented in order to identify what more could/should be done. Identify further mitigation measures appropriate to the bycatch-relevant fish-ing métiers in the OSPAR and HELCOM areas.
ii ) Assess ways of improving the limited knowledge of the extent of sea-bird bycatch in the NE Atlantic longlining fleets.
c ) Review threats to marine birds that breed or overwinter in the OSPAR and HELCOM areas and spend the rest of the year elsewhere (e.g. northern gannets that overwinter in Mauretania; roseate terns in overwinter along the coast of West Africa; long-tailed ducks that breed in Arctic Russia).
d ) Review the content drafted for the State/trends (two paragraphs) of marine seabirds for the Ecosystem Overviews of the Iceland Sea and Norwegian Sea ecoregions. Draft text (around 150 words and 1–2 graphs if needed) of the state and trends of seabirds for the Baltic Sea ecoregion. Provide draft text on that could be used for an Ecosystem Overview for the Oceanic Northeast Atlantic.
e ) Review the process of data collation for the new OSPAR Marine Bird Da-tabase and the HELCOM bird abundance indicators and recommend how this might be improved.
The meeting was attended by 15 group members and three invited experts, and a fur-ther four members (Lena Avellan, Pep Arcos, Liz Humphreys, Mardik Leopold,) and

8 | JWGBIRD REPORT 2016
the following non-members provided input via correspondence: Ana Almeida, Bruna Campos, Rory Crawford, Kim Detloff, Kirstin Fangel, Sven Koschinski, Mark Lewis, Thiery Micol, Christian Pusch, Marguerite Tarzia, Ingrid Tulp, markus Vetemaa, Oli Yates.
JWGBIRD REPORT 2016 | 9
2 Develop a concept for incorporating at-sea data in the abun-dance indicators of HELCOM and OSPAR
2.1 Introduction
Seabirds are top predators in the marine environment and therefore dealt with in a number of indicators used to describe and assess the state of marine areas. In both the NE Atlantic and the Baltic Sea, the abundance of seabirds is a metric in some of the indicators, namely:
• OSPAR indicator “B1 Marine bird abundance” (ICES, 2015b); • HELCOM indicator “Abundance of waterbirds in the breeding season”
(HELCOM, 2015a); and • HELCOM indicator “Abundance of waterbirds in the wintering season”
(HELCOM; 2015b).
So far, these indicators are fed with data from breeding bird surveys and from coastal surveys of non-breeding birds. The validity of conclusions from the latter surveys is clearly restricted to coastal marine areas. In the case of breeding birds it is less clear to which specific marine area seabird trends are connected, mainly because many of the species are wide-ranging even during the breeding season. Thus, the abundance indi-cators in their current versions cannot directly assess the environmental state of off-shore sections of the marine regions, which is required e.g. by EU Marine Strategy Framework Direction (MSFD). Therefore, it is aimed to include data from at-sea sur-veys (and respective monitoring programmes) into the seabird abundance indicators. The advantages of considering at-sea data were listed in ICES (2015a), namely:
• Seabirds spend most of their lives at sea, i.e. are good indicators for condi-tions at sea.
• Early warning system (abundance of immature birds included, i.e. changes can be detected 5–10 years earlier compared to breeding numbers).
• Inclusion of species breeding outside the assessment area or which cannot be assessed at breeding sites.
• Linking seabird data with environmental parameters and pressure data (e.g. from fisheries).
• More relevance for MSFD D4 indicators (foodwebs).
Potential problems of considering at-sea data for the abundance indicators include the lack of monitoring programmes in some CPs of OSPAR and HELCOM (though several CPs do already operate such schemes) and that the coverage of large marine areas by aerial or ship-based surveys can be expected to be time-consuming and ex-pensive. This report section describes how these problems could be overcome by summarizing the monitoring programmes already existing in the OSPAR and HEL-COM regions (based on compilations done during preparation of JWGBIRD 2016 meeting) and by presenting concepts for large-scale surveys and ways for analysing the resulting data as discussed during the JWGBIRD 2016 meeting.
10 | JWGBIRD REPORT 2016
2.2 Review of offshore seabird monitoring programmes in the HELCOM and OSPAR regions: status and previous studies in the single contract-ing parties
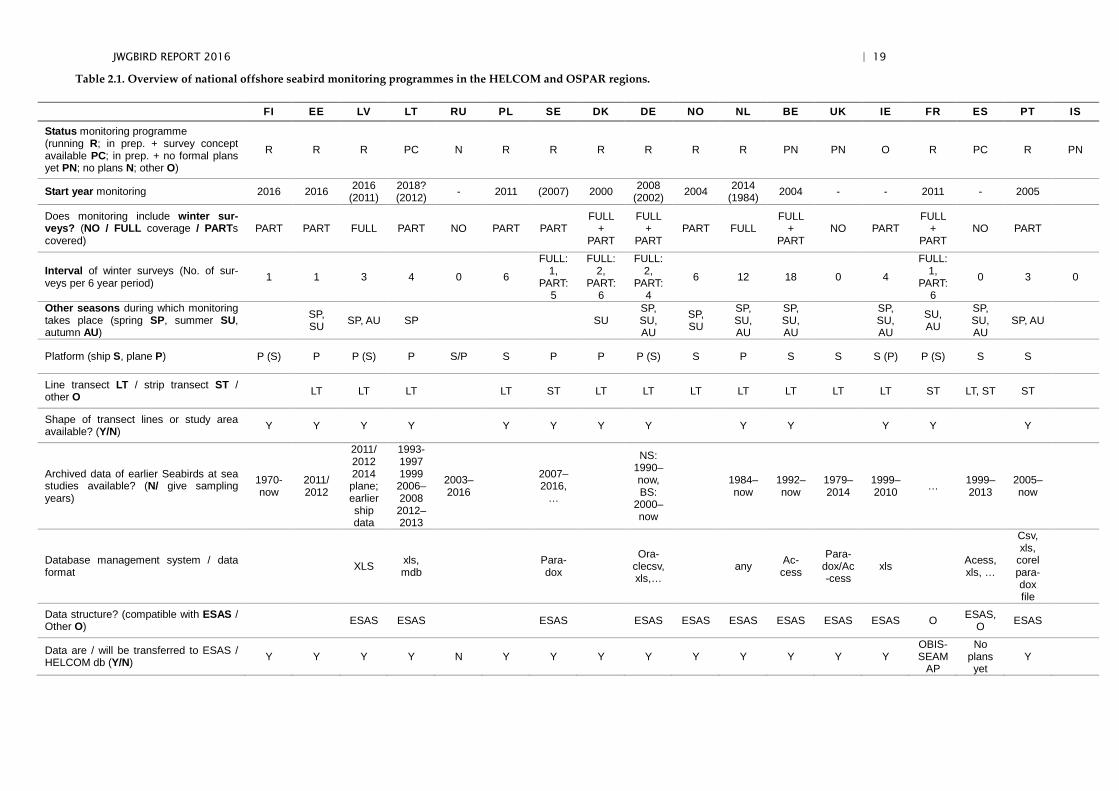
A necessary prerequisite for setting up a procedure to derive HELCOM and OSPAR abundance indicators based on at-sea data is a dataset covering large areas and pref-erably already long time periods. The following section gives a review of monitoring programmes and relevant archived data from previous studies in the OSPAR and HELCOM regions as of October 2016 (see Table 2.1 for an overview of the most im-portant details). For the HELCOM region, more details on offshore seabird monitor-ing surveys carried out since 1991 are available in the HELCOM BALSAM seabird meta-database (HELCOM, 2015c).
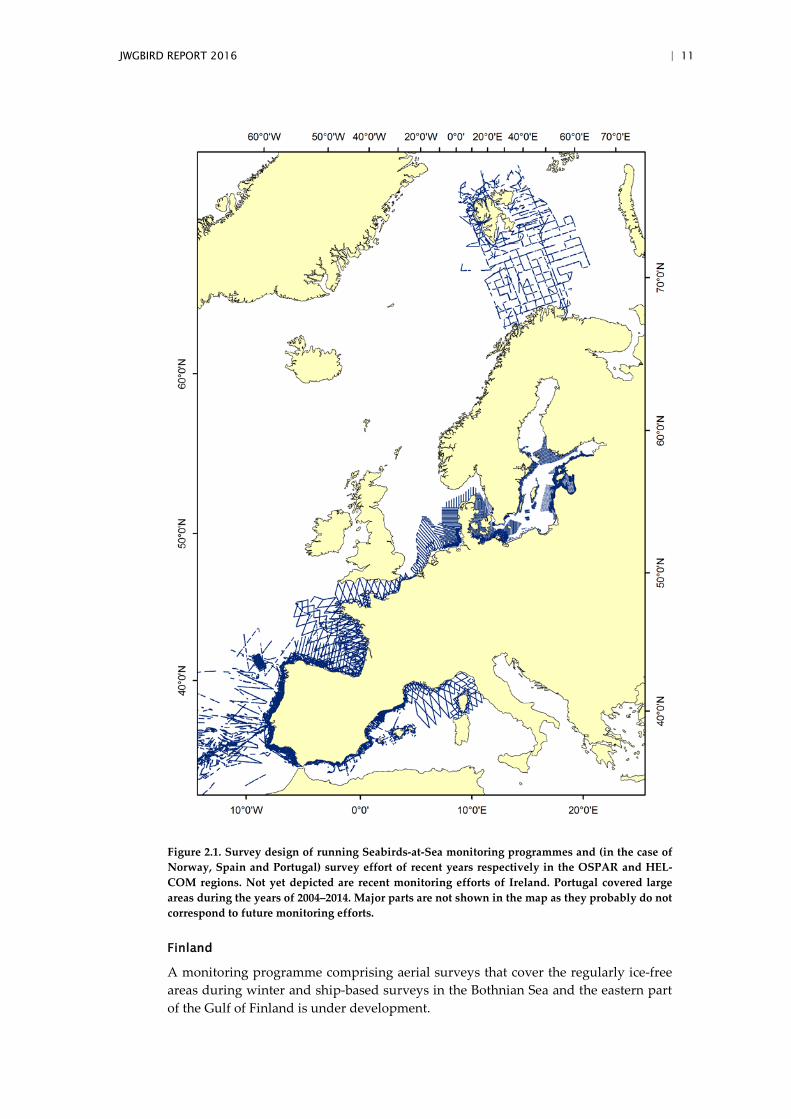
Overall, a substantial part of the OSPAR and HELCOM regions is already covered by national monitoring programmes (Figure 2.1). Between countries, there are differ-ences regarding coverage (e.g. whole marine areas, SPAs only), survey platform, transect design and time interval between surveys, but also funding opportunities and database structure. However, with respect to future coordinated surveys these differences can probably be overcome, allowing joint analyses. There are also differ-ences with respect to availability of previous at-sea data and accessibility of commer-cial data (for instance, related to offshore wind farms).
JWGBIRD REPORT 2016 | 11
Figure 2.1. Survey design of running Seabirds-at-Sea monitoring programmes and (in the case of Norway, Spain and Portugal) survey effort of recent years respectively in the OSPAR and HEL-COM regions. Not yet depicted are recent monitoring efforts of Ireland. Portugal covered large areas during the years of 2004–2014. Major parts are not shown in the map as they probably do not correspond to future monitoring efforts.
Finland
A monitoring programme comprising aerial surveys that cover the regularly ice-free areas during winter and ship-based surveys in the Bothnian Sea and the eastern part of the Gulf of Finland is under development.
12 | JWGBIRD REPORT 2016
Previous studies: Four routes in the Åland Sea and Archipelago Sea are regularly covered by ship. Three of the routes have started in the early 1970s and have been carried out yearly since 1996. The total length of these three routes is ca. 180 km. The fourth route is placed in the middle of the Archipelago Sea along the ship route from mainland to Åland. This has been carried out regularly since 1994 and is ca. 80 km long.
Contact: Pekka Rusanen, Markku Mikkola-Roos
Estonia
The national monitoring programme started with the full coverage aerial survey in winter 2015/2016. Monitoring surveys will be carried out by plane in spring, summer (moulting period, August) and winter. A full coverage survey is scheduled once per six year period (next: 2019/2020). Geographically floating partial coverage surveys will be carried out in the remaining years.
Previous studies: GORWIND project.
Contact: Leho Luigujoe
Latvia
The national monitoring programme started with the full coverage aerial survey in winter 2015/2016. Monitoring surveys are planned to be carried out by plane in au-tumn and winter and by ship in spring. Full coverage surveys are scheduled two times per six year period in autumn (October/November) and three times per six year period in winter (next winter survey probably 2017/2018). Ship-based surveys in spring will cover SPA sites two times per six year period.
Previous studies: Aerial surveys have been carried out in the Gulf of Riga in spring, summer, autumn and winter in GORWIND project (2011/2012) and in winter in MARMONI project (2014). Most part of the Latvian territorial waters have been cov-ered in different seasons by ship surveys in Baltic MPA project (2006–2008).
Notes: The biodiversity monitoring programme has been underfunded, so there is no guarantee to have funding for the planned activities.
Contact: Ainars Aunins
Lithuania
Starting in 2017, a new State environment monitoring programme will come into force that includes surveys of seabirds in marine Natura 2000 sites. Three aerial sur-veys will be carried out in December–March period, once in three years. However, when the first surveys will actually take place is currently uncertain.
Monitoring of seabirds in Lithuanian marine waters is foreseen also under the im-plementation of MSFD. It should cover somewhat larger marine areas, but the fre-quency will probably be the same. Harmonization of the two schemes is needed.
Previous studies: Aerial surveys (sort of total counts) were carried out since the late 1980s (for several years also included the Russian waters of the Kaliningrad Region), but they covered only coastal waters and ended in the early 2000s. Offshore areas were surveyed from various ships by G. Vaitkus in 1993–1997 for his doctoral thesis. Another offshore ship-based survey was carried out in March 1999.
JWGBIRD REPORT 2016 | 13
Notes: The monitoring programme is known to be underfunded so there is no guar-antee to have funding for the planned activities.
Contact: Mindaugas Dagys
Russia
At present no official fixed seabird monitoring scheme (ship/plane) is carried out in the Kaliningrad region and the Gulf of Finland.
In the Gulf of Finland, two aerial surveys have been carried out in spring 2016 for “Nord Stream 2 AG”. These have been the first surveys of that kind for the region.
In the Kaliningrad region, seabird monitoring was conducted in previous years to evaluate the impact of oil extraction by "Lukoil - Kaliningradmorneft". Currently, these works are not carried out and are not planned. The database and Geographic Information System «Ecomorneft» for the study period from 2003 to 2015 is owned by “Lukoil - Kaliningradmorneft”.
Contact: Julia Bublichenko (Gulf of Finland), Gennady Grishanov (Kaliningrad re-gion)
Poland
The national monitoring programme started in 2011. It comprises yearly ship-based surveys in January along a constant route. All important areas for wintering seabirds are covered.
Contact: Włodzimierz Meissner
Sweden
An official Natura 2000/MSFD programme for offshore bird monitoring is currently under discussion. If implemented, the monitoring scheme will match the Natu-ra2000/MSFD reporting intervals, i.e. with large-scale coverage surveys every six years. Ideally a subset of areas will be covered in the years between, this to get better data for trend analyses and annual indices in the years between. This subset will most likely comprise the three big offshore banks (Hoburg and Midsjö Banks) plus a sam-ple of other areas (could be a selection of survey lines in some areas along the coasts).
A ship-based pilot survey in the offshore waters is scheduled for January 2017.
Data are at the moment in a PARADOX database but it will be changed into another format as Paradox is no longer supported. The development of a new database struc-ture will be influenced by what exchange formats that will be available for interna-tional reporting.
Previous studies: Offshore surveys with differing coverage have been carried out since 2007 (large-scale in 2009 and 2016).
Contact: Leif Nilsson, Fredrik Haas
Denmark
The national monitoring programme started in the year 2000. It currently comprises a full coverage of inner Danish waters and a good part of the North Sea every third winter as well as reduced parts in summer every six years for moulting surveys. In addition, annual total counts are derived for a subset of areas for trend analyses (three days of aerial surveys plus land-based counts).
14 | JWGBIRD REPORT 2016
The monitoring schedule for the coming six years has recently been settled. This means that the present monitoring scheme for wintering and moulting waterbirds will continue with minor changes. Monitoring requirements in relation to the MSFD will in the future be coordinated with this monitoring scheme.
In Denmark there is access to seabird monitoring data from a number of offshore wind farms. Such data, collected in restricted areas, but with a high temporal fre-quency, has proven valuable in combination with more large-scale surveys at lower temporal frequency.
In a new approach, survey data are used to calculate bird days per area in selected SPAs, allowing to estimate food consumption of benthic feeding seaducks and thus relate bird occurrence more closely to management requirements (Petersen et al., 2016).
Contact: Ib Krag Petersen
Germany
The national Natura 2000/MSFD offshore monitoring programme started in 2008 (in 2004 in the Schleswig-Holstein offshore area). Large-scale aerial surveys are comple-mented by ship-based surveys (dedicated surveys as well as usage of ships of oppor-tunity). Full-coverage aerial surveys are carried out 2–3 times per six year period in winter and late summer in the Baltic Sea and the North Sea. A subset of the most im-portant areas is covered in the years between as well as during other seasons. There are promising plans to maintain or increase survey effort. The future monitoring pro-gramme is likely to comprise a share of digital surveys. Applicability of digital sur-vey methods in offshore seabird monitoring is currently evaluated.
Previous studies: A comprehensive dataset comprising ship-based survey data from 1990 onwards for the German North Sea and from the year 2000 onwards for the German Baltic Sea as well as large-scale aerial survey data of both seas from 2002 onwards is maintained using an ESAS compatible data structure.
Contact: Nele Markones, Nils Guse, Stefan Garthe
Norway
SEAPOP has participated with seabird observers on the annual Ecosystem Survey (August–October) in the Barents Sea since 2004. All seabird species are monitored according to the standard ESAS procedure. Data are used for 1) habitat modelling, 2) monitoring changes in abundance at sea and 3) monitoring changes in at-sea distribu-tion. The last ten years, SEAPOP has also conducted several surveys in the Norwe-gian Sea (spring and summer) and in the Barents Sea (summer and winter). In the North Sea, however, there has not been conducted any Norwegian seabirds at sea surveys since 2006, and SEAPOP would appreciate a joint effort to update the North Sea datasets.
Contact: Per Fauchald, Tycho Anker-Nilssen
Iceland
There are no immediate plans for systematic surveys of offshore waterbirds in Ice-land. Knowledge of winter distribution of selected species (for instance long-tailed duck and divers) for selected areas would be very desirable. The expertise for con-
JWGBIRD REPORT 2016 | 15
ducting such surveys is there, but at the moment no signs of the necessary funding for the purpose.
Contact: Yann Kolbeinsson, Ib Krag Petersen
The Netherlands
The national seabird monitoring programme has been running since 1984, yet recent-ly the methodological set-up was revised. The most important reason for this was to get a better spatial coverage of (proposed) marine Natura 2000 sites, but also for ex-ample survey height was reduced to allow better species recognition for similarly looking species such as guillemot/razorbill. From 1984 until 2013, the Dutch sector of the North Sea was surveyed along standard transects every two months. Since 2014, the new programme comprises two modules:
1 ) Dutch Continental Shelf (DCS). Aerial surveys; line transect counts. Survey of the whole Dutch North Sea in August, November, January and Febru-ary. Additional surveys of just the coastal zone (up to 20 nm offshore) in April and June.
2 ) 2) Dutch Wadden Sea and Coastal Zone Netherlands. Aerial survey; inte-gral count special for seaducks. In November and January.
Ship-based surveys no longer cover the entire Dutch EEZ (only wind farm studies have been done, lately), but this would still be possible, also in an international set-ting, e.g. by joining the IBTS surveys (not yet planned, unfortunately).
Contact: Floor Arts, Ruben Fijn, Mardik Leopold
Belgium
Belgium has been carrying out a more or less regular saebird count for a long time (2004 to present) and less frequently during 1992–2003. However, survey routes, ob-servers and research vessels changed a lot during this period. The programme con-sists of monthly ship-based surveys of all seabirds and sea mammals following ESAS standard. For the moment the money for the monitoring comes from the wind indus-try. For this reason the monitoring is biased to the eastern part of the Belgian marine waters in areas with wind farm development, while SPA-coverage is very poor. The western part would be far more interesting (higher densities, more species and more protected species). There usually is a dedicated seaduck survey in February or March when numbers peak.
Contact: Eric Stienen
UK
Currently there is no funding perspective for national offshore monitoring. JNCC is developing a marine strategy. This might involve volunteer-based surveys using ves-sels of opportunity. These would use ESAS trained observers on e.g. ferries, merchant ships, research vessels, cruise ships, etc. The aim would be to provide all training and cover subsistence costs (many costs on board ships are expected to be covered by op-erators through good will). A similar model for collecting cetacean data already exists and works well. These surveys would be supplemented through acquisition of pri-vate sector ESAS survey data (OWF studies) so broad targeting of areas would be possible.
16 | JWGBIRD REPORT 2016
Previous studies: From 2010–2014 3–4 ESAS surveys using IBTS vessels per year were carried out by contract surveyors (mainly covering N North Sea). Presently on hold due to uncertainty over budgets.
Data from aerial surveys of birds were collected under the strategic offshore wind farms development in the Wash, the Thames Estuary and in the Irish Sea. These ex-tensive datasets have regional scale geographical coverage and high temporal fre-quency and can be regarded valuable contribution to the above mentioned data.
Notes: JNCC currently administer the ESAS database which will probably be revised soon. JNCC is also drafting an ESAS handbook which will be circulated to ESAS partners for review in the next few months.
Contact: Tim Dunn, Mark Lewis
Ireland
There is currently no cohesive national plan for offshore seabird monitoring in Ire-land but several separate commercial and research projects are currently in operation.
The majority of the recent offshore seabird data collected has been done so on RV Celtic Explorer and RV Celtic Voyager since 2009 by BirdWatch Ireland and Marine and Freshwater Research Centre GMIT through use of berths offered up during fish-eries surveys (ongoing) and also during the six 'Cetaceans on the Frontier' trips (2009–2014), in which targeted surveying for cetaceans and seabirds was undertaken.
In recent years UCC/MaREI have been involved in aerial seabird surveys through various projects taking place in the Irish EEZ, including ObSERVE Aerial. The recent Trans-Atlantic research surveys (2014–2016) from Ireland to Newfoundland have in-volved a collaboration between UCC/MaREI and MFRC GMIT.
Contact: Niall Keogh
France
The overall MSFD monitoring programme for seabirds comprises at-sea surveys and land-based counts that are carried out by several different survey teams.
Large scale marine surveys consist of two main actions:
1 ) Once every six years it is planned to have an aerial survey in summer and in winter for cetaceans, seabirds, and other marine megafauna across the Channel, the Bay of Biscay and the northwest Mediterranean. Surveys with such an extent were for the first time carried out in winter 2011–2012 and summer 2012 (SAMM surveys). No precise schedule for the next survey, will be coordinated with survey programme of other countries.
2 ) Besides, there is a yearly monitoring of cetaceans and seabirds distribu-tions by dedicated observers embarking on fish stock surveys in the Chan-nel (IBTS, January), Bay of Biscay (PELGAS, May; EVHOE, November), Gulf of Lions (PELMED, July), and western Channel (CGFS, September).
Contact: Aurélie Blanck, Vincent Ridoux, Jerome Spitz, Olivier Van Canneyt
JWGBIRD REPORT 2016 | 17
Spain
Every year, seabird surveys are carried out on different oceanographic surveys cover-ing the Bay of Biscay and the northern Spanish coast (including Galicia), the Gulf of Cadiz and the Mediterranean Iberian Shelf. During most surveys the seabird counts are supplemented by systematic recording of marine mammals, human activities and marine debris. Every year, the following surveys are performed:
• Northern Spanish continental shelf: PELACUS oceanographic cruise (March–April) since 2007. Responsible: Spanish Institute of Oceanography (Begoña Santos, Camilo Saavedra, Xulio Valeiras, Salvador García-Barcelona).
• Northern Spanish continental shelf: DEMERSALES oceanographic cruise (September–October) addressed to evaluate demersal fish stocks (trawling survey), organized by the Spanish Institute of Oceanography (IEO). Tran-sect surveys for seabirds were conducted in 2006 and again from 2010 to present. Responsible: SEO/BirdLife and Spanish Institute of Oceanography (Pep Arcos).
• Bay of Biscay: BIOMAN oceanographic cruise (May) since 2016. Responsi-ble: AZTI (Maite Louzao).
• Bay of Biscay: JUVENA oceanographic cruise (September) since 2012. Re-sponsible: AZTI (Maite Louzao).
• Gulf of Cádiz: ECOCADIZ oceanographic cruise (June–August) from 2006–2010 and since 2013 to present. Responsible: University of Cádiz and Spanish Institute of Oceanography (Gonzalo Muñoz/Fernando Ramos).
• Mediterranean Iberian shelf (early summer): MEDIAS oceanographic cruise. Responsible: SEO/BirdLife and Spanish Institute of Oceanography (Pep Arcos).
In addition, a new survey collected seabird counts in the northern Bay of Biscay tak-ing advantage of the TRIENAL surveys in March 2016. This survey is conducted eve-ry three years and the idea is to collect seabird and marine mammal counts in the future surveys. Responsible: AZTI (Maite Louzao).
A more comprehensive MSFD monitoring programme is in preparation, pending on-ly due to administrative difficulties. All the five Spanish MS subregions ("demarca-tions") include a monitoring programme to count seabirds at sea by boat. There are no detailed specifications in terms of effort and coverage/type of survey. The philos-ophy is to take profit of oceanographic surveys already in place, or initiated to meet other requirements of the MSFD. Thus, the specific coverage will depend on the availability of oceanographic cruises. Data will be collected on all species, though key ones might be shearwaters (Balearic, Cory's, Sooty and Great), storm-petrels, gannets and auks.
Previous studies: In previous years (2004–2012) a wider area of Spanish waters was covered within the scope of two LIFE projects that aimed at the identification of ma-rine IBAs and their designation as SPAs. All the subregions were covered at relevant times of year by taking profit of ongoing cruises. An overview of the work done dur-ing the last LIFE project (INDEMARES) is given in the project report (see specifically pp. 6–17). In the Gulf of Cadiz, transect band surveys for seabirds were conducted in 2010–2011 in the frame of the ARSA oceanographic cruise (November–December) addressed to evaluate demersal fish stocks (trawling survey), organized by the Span-
18 | JWGBIRD REPORT 2016
ish Institute of Oceanography (IEO). On the Galician Bank diverse cruises in the area allowed to conduct seabird transect surveys between 2006 and 2012. Responsible for these surveys: SEO/BirdLife, in collaboration with the Spanish Institute of Oceanog-raphy and CEMMA (Pep Arcos).
Contact: Pep Arcos, Maite Louzao, Begoña Santos, Gonzalo Muñoz
Portugal
The national monitoring started ten years ago and consists of an annual ship-based survey in (winter/) spring and a second survey every two years in Octo-ber/November. These surveys cover the Portuguese coastal waters up to 20 miles off-shore. Transects lines are placed 8 miles part perpendicular to the coast. Surveys are targeting the evaluation of the sardine stock. Dedicated observers record seabird oc-currence following ESAS methodology. In addition, monthly land-based counts are carried out. More details are given in the Portuguese Seabird Atlas. Other areas that should be regularly monitored are the marine IBAs in the Azores and Madeira as well as some other sites identified by the marine IBA project, see also http://maps.birdlife.org/marineIBAs/default.html.
Contact: Pedro Geraldes, Joana Andrade, Nuno Oliveira (seaducks), Pedro Rodrigues (database)
JWGBIRD REPORT 2016 | 19
Table 2.1. Overview of national offshore seabird monitoring programmes in the HELCOM and OSPAR regions.
FI EE LV LT RU PL SE DK DE NO NL BE UK IE FR ES PT IS
Status monitoring programme (running R; in prep. + survey concept available PC; in prep. + no formal plans yet PN; no plans N; other O)
R R R PC N R R R R R R PN PN O R PC R PN
Start year monitoring 2016 2016 2016 (2011)
2018? (2012) - 2011 (2007) 2000 2008
(2002) 2004 2014 (1984) 2004 - - 2011 - 2005
Does monitoring include winter sur-veys? (NO / FULL coverage / PARTs covered)
PART PART FULL PART NO PART PART FULL
+ PART
FULL +
PART PART FULL
FULL +
PART NO PART
FULL +
PART NO PART
Interval of winter surveys (No. of sur-veys per 6 year period) 1 1 3 4 0 6
FULL: 1,
PART: 5
FULL: 2,
PART: 6
FULL:2,
PART: 4
6 12 18 0 4
FULL: 1,
PART: 6
0 3 0
Other seasons during which monitoring takes place (spring SP, summer SU, autumn AU)
SP, SU SP, AU SP SU
SP, SU, AU
SP, SU
SP, SU, AU
SP, SU, AU
SP, SU, AU
SU, AU
SP, SU, AU
SP, AU
Platform (ship S, plane P) P (S) P P (S) P S/P S P P P (S) S P S S S (P) P (S) S S
Line transect LT / strip transect ST / other O LT LT LT LT ST LT LT LT LT LT LT LT ST LT, ST ST
Shape of transect lines or study area available? (Y/N) Y Y Y Y Y Y Y Y Y Y Y Y Y
Archived data of earlier Seabirds at sea studies available? (N/ give sampling years)
1970-now
2011/ 2012
2011/ 2012 2014 plane; earlier ship data
1993-1997 1999 2006–2008 2012–2013
2003–2016
2007–2016,
…
NS: 1990–now, BS:
2000–now
1984–now
1992–now
1979–2014
1999–2010 … 1999–
2013 2005–now
Database management system / data format XLS xls,
mdb Para-dox
Ora-clecsv, xls,…
any Ac-cess
Para-dox/Ac-cess
xls Acess, xls, …
Csv, xls,
corel para-dox file
Data structure? (compatible with ESAS / Other O) ESAS ESAS ESAS ESAS ESAS ESAS ESAS ESAS ESAS O ESAS,
O ESAS
Data are / will be transferred to ESAS / HELCOM db (Y/N) Y Y Y Y N Y Y Y Y Y Y Y Y Y
OBIS-SEAM
AP
No plans yet
Y
20 | JWGBIRD REPORT 2016
2.3 Concept for coordinated large-scale at-sea surveys in the HELCOM and OSPAR areas
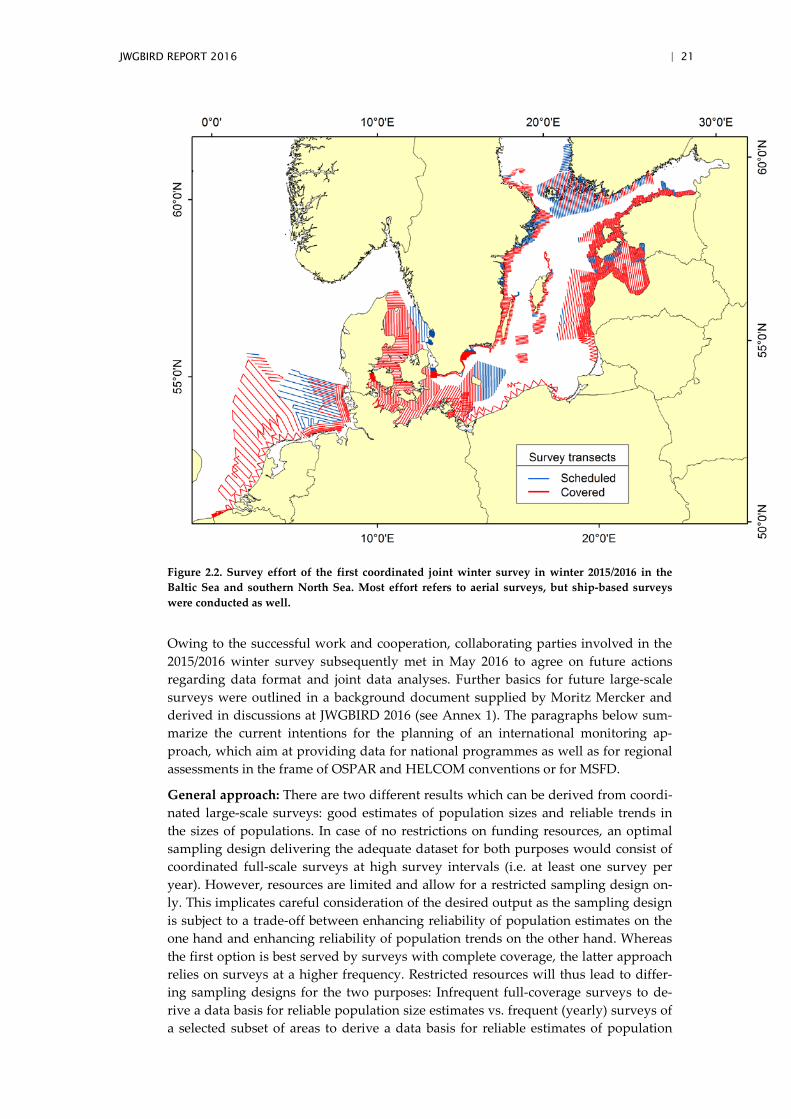
In winter 2015/2016, a first coordinated joint survey initiated by HELCOM BALSAM and the European Seaduck Working Group was carried out in the Baltic Sea and the southern North Sea. This survey effectively covered substantial parts of these areas during a short time window (Figure 2.2). Surveys were undertaken by all countries of the Baltic Sea region (except for Russia). In addition, Belgium, The Netherlands and Germany covered major parts of the southern North Sea. Counts were carried out using standardized aerial and ship-based survey methodology (mostly following Camphuysen et al., 2004). If funding will be available in time, results from the Baltic can enter the updated report on the HELCOM core indicator “Abundance of water-birds in the wintering season” as information supplementary to the coastal birds dealt with exclusively so far. Combined analysis with coastal data from IWC is not feasible at this stage, because at-sea data can only provide large-scale data for two datapoints, 2009 (from SOWBAS, Skov et al., 2011) and 2016 (from the recent survey), compared to the much longer time-series of coastal surveys. Data covering a longer period are available from a restricted number of countries only (see Table 2.1). These data can be further extended by including all available datasets from the different countries (see above and Table 2.1). However to enable this a substantial effort is re-quired to compile all data in a common data format and preferably joint database. In future, the proposed merging of national monitoring programmes to coordinated surveys will enhance the availability of large-scale data and allow the combination of both coastal and at-sea monitoring results, for instance as outlined in Section 4.
JWGBIRD REPORT 2016 | 21
Figure 2.2. Survey effort of the first coordinated joint winter survey in winter 2015/2016 in the Baltic Sea and southern North Sea. Most effort refers to aerial surveys, but ship-based surveys were conducted as well.
Owing to the successful work and cooperation, collaborating parties involved in the 2015/2016 winter survey subsequently met in May 2016 to agree on future actions regarding data format and joint data analyses. Further basics for future large-scale surveys were outlined in a background document supplied by Moritz Mercker and derived in discussions at JWGBIRD 2016 (see Annex 1). The paragraphs below sum-marize the current intentions for the planning of an international monitoring ap-proach, which aim at providing data for national programmes as well as for regional assessments in the frame of OSPAR and HELCOM conventions or for MSFD.
General approach: There are two different results which can be derived from coordi-nated large-scale surveys: good estimates of population sizes and reliable trends in the sizes of populations. In case of no restrictions on funding resources, an optimal sampling design delivering the adequate dataset for both purposes would consist of coordinated full-scale surveys at high survey intervals (i.e. at least one survey per year). However, resources are limited and allow for a restricted sampling design on-ly. This implicates careful consideration of the desired output as the sampling design is subject to a trade-off between enhancing reliability of population estimates on the one hand and enhancing reliability of population trends on the other hand. Whereas the first option is best served by surveys with complete coverage, the latter approach relies on surveys at a higher frequency. Restricted resources will thus lead to differ-ing sampling designs for the two purposes: Infrequent full-coverage surveys to de-rive a data basis for reliable population size estimates vs. frequent (yearly) surveys of a selected subset of areas to derive a data basis for reliable estimates of population
22 | JWGBIRD REPORT 2016
trends. The experts of JWGBIRD recommend to conduct (1) synchronous full-scale surveys covering major parts of the HELCOM and OSPAR regions once per six year reporting cycle and (2) surveys covering a subset of relevant areas at higher frequen-cy in the years in between. This general approach allows to estimate population sizes in reasonable time intervals, whereas trends can be calculated in a reliable way based on the smaller scaled surveys. Further, it is possible to serve the demands from vari-ous directives (e.g. Bird Directive, MSFD) and national monitoring schemes.
Survey platform: In general, both platforms used extensively in the past four decades can provide sufficient data for at-sea surveys, as both results ship-based and aerial surveys apply comparable methods (mostly line-transect counts) and produce results in the same units (bird numbers per area surveyed, i.e. bird densities). Advantages and disadvantages of survey platforms have been discussed before (e.g. Camphuysen et al., 2004), and which platform is actually used depends on the demands concerning the area and species to be covered, but also on the “tradition” of such investigations in different countries and not least the availability of suitable ships/planes and the respective funding. Though currently too expensive for the purpose of large-scale monitoring, digital imaging from planes (Buckland et al., 2012) may be another option in future. Results from digital imaging appear to be well combinable with those from surveys done by observers from ships or planes.
Season: Monitoring surveys need to focus on seasons of most important bird occur-rence. Given the high mobility of birds it is wise to conduct large-scale surveys at the time of lowest amount of movements. Although flights between staging sites do oc-cur on both a local and regional scale also in winter, that season fits best the demands of large-scale surveys with respect to avoiding double-counting and achieving com-plete coverage. In addition, several seabird species reach their maximum numbers in European sea areas during winter. In many European countries winter sea-bird/waterbird counts have not only a tradition of being conducted from the coast (e.g. for IWC), but also most of the monitoring programmes running at sea are focus-ing on winter. Compared to migratory seasons (mainly spring and autumn), the low-er amount of movements overrides disadvantages such as short day length (especially at northern latitudes) and variable or unpredictable conditions regarding ice-cover. Currently, only Portugal and Spain do not carry out monitoring surveys in winter, which is attributed to a dependency on vessels of opportunity as platforms and to the focus on regionally important periods of bird occurrence. When assessing the status of marine areas on a smaller scale, it is advisable to focus on the seasons that are most important with respect to occurrence of relevant bird species. This may imply additional monitoring surveys in other seasons than winter. For instance, the status of the German Bight (SE North Sea) might be assessed based on the occurrence of divers in spring when numbers of resting divers on migration peak there (Garthe et al., 2015). Other marine areas are valuable owing to their role as moulting areas. Re-garding trend assessments it is possible and at least in some cases recommendable to combine results from different seasons, whereas this is not an option for assessments of population sizes. Correspondingly, previous analyses for the OSPAR abundance indicator are also based on data from differing seasons, depending on the area to be assessed. While the status of the OSPAR region II (Greater North Sea) e.g. is assessed based on data from winter counts, the status of the subdivision southern North Sea bases on an average of monthly counts conducted year-round.
Species: Large-scale surveys of marine birds at sea should ideally cover all species living there. In most national monitoring programmes so far all species are recorded during the surveys, but for instance gulls are not considered in Sweden. However,
JWGBIRD REPORT 2016 | 23
even if some species are not covered everywhere during a large-scale survey, the re-spective data could be used in part of the area, e.g. in assessments of subdivisions (OSPAR) or subbasins (HELCOM).
Transect design: Based on the pre-selection of season and species (see above), but also on the choice of survey platform, meaningful spatial coverage and transect de-sign have to be aspired. Currently, national monitoring programmes vary from full coverage to concentration on coastal areas or SPAs or commercial (wind farm) areas. The concept developed for large-scale surveys (Annex 1) gives cues about transect designs appropriate for the analysis method recommended. To derive an optimal sampling design, preliminary analyses should identify strata of differing abundance and provide estimates of the proportion of area that needs to be covered in the differ-ent strata to derive a reliable data basis. These analyses should be done based on available data from earlier surveys.
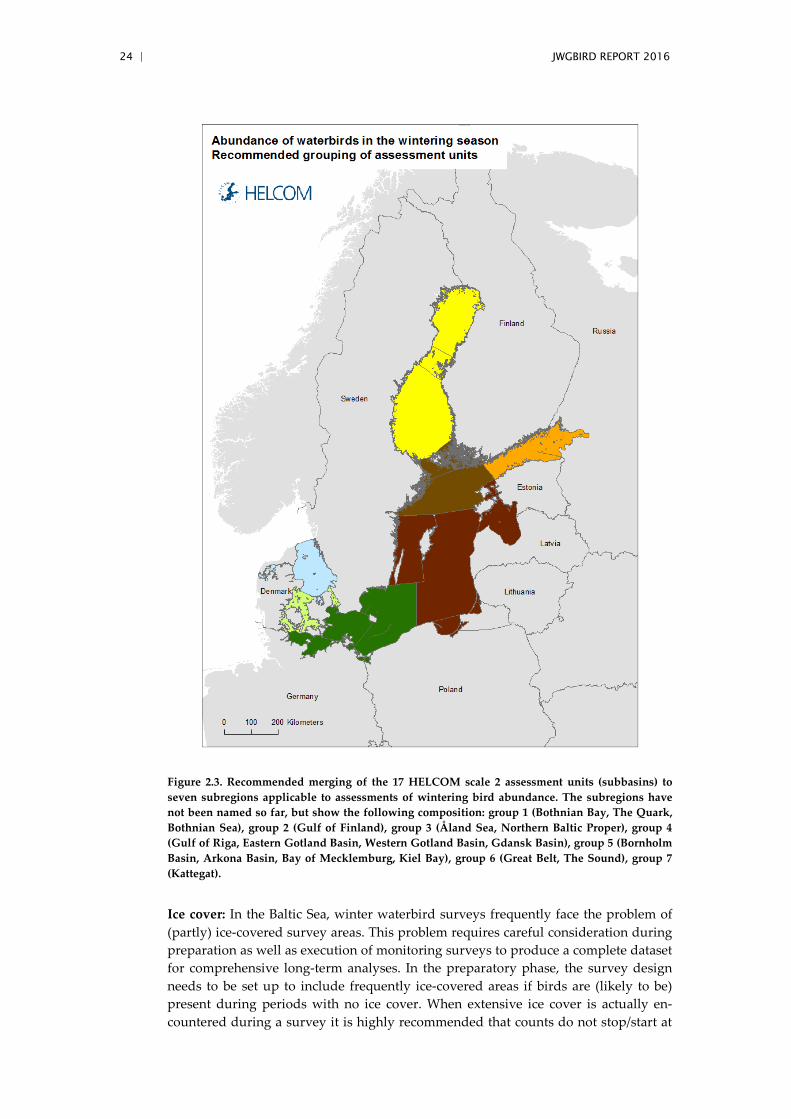
Surveys should always be carried out along the same transect lines in order to mini-mize the between-year variance. For coordinated large-scale surveys it may be bene-ficial to include additional transect lines in order to get a good coverage regarding population size estimates (see above). In addition, the spatial coverage of both coor-dinated large-scale surveys and those used for trend analyses has to ensure that anal-yses can be undertaken at the level of subdivisions in the OSPAR and HELCOM areas. The OSPAR region is currently divided into five subregions, two of which (Arctic Waters, North Sea) are even split into subdivisions (ICES, 2015b). HELCOM uses a system of four scales of assessment units for the Baltic Sea, with scale 1 being the entire Baltic and scale 2 a total of 17 subbasins. Because assessments on the basis of these subbasins were identified as being not useful due to movements of birds within survey periods (ICES, 2015b), bird experts at JWGBIRD 2016 recommended to merge subbasins to a total of seven subregions (see Figure 2.3), which need to be cov-ered by surveys for subregional assessments.
24 | JWGBIRD REPORT 2016
Figure 2.3. Recommended merging of the 17 HELCOM scale 2 assessment units (subbasins) to seven subregions applicable to assessments of wintering bird abundance. The subregions have not been named so far, but show the following composition: group 1 (Bothnian Bay, The Quark, Bothnian Sea), group 2 (Gulf of Finland), group 3 (Åland Sea, Northern Baltic Proper), group 4 (Gulf of Riga, Eastern Gotland Basin, Western Gotland Basin, Gdansk Basin), group 5 (Bornholm Basin, Arkona Basin, Bay of Mecklemburg, Kiel Bay), group 6 (Great Belt, The Sound), group 7 (Kattegat).
Ice cover: In the Baltic Sea, winter waterbird surveys frequently face the problem of (partly) ice-covered survey areas. This problem requires careful consideration during preparation as well as execution of monitoring surveys to produce a complete dataset for comprehensive long-term analyses. In the preparatory phase, the survey design needs to be set up to include frequently ice-covered areas if birds are (likely to be) present during periods with no ice cover. When extensive ice cover is actually en-countered during a survey it is highly recommended that counts do not stop/start at
JWGBIRD REPORT 2016 | 25
the ice edge. Instead transects should be continued at least for a certain stretch or preferably all the way over the ice (at least if ice cover is <100%, because high num-bers of birds may squeeze into the tiniest ice-free spots). Implementation of these rec-ommendations will ensure a comprehensive dataset that allows easy incorporation of ice coverage as a predictor variable and prevents false extrapolations during analyses.
Combination of at-sea and coastal data: see Section 4.
Data format: To ensure an optimal and consistent data collection and analysis, a standard data exchange format should be used by all contributing countries when transferring data to be used in joint analyses. Currently, many national databases use the ESAS data format, extensions of it or a format compatible to it. For the HELCOM region, such an extension has been developed in the project BalticBOOST, and final amendments were discussed at JWGBIRD 2016. The structure of the respective data-base is shown in Annex 2.
Funding needs: The preparation of coordinated large-scale monitoring requires elab-orate preliminary analyses e.g. for the identification of an optimal sampling design. These analyses cannot be carried out within the frame of JWGBIRD work but call for a dedicated project with extra funding. A respective project could also provide funds for collating all available datasets from previous studies to allow an incorporation of at-sea data in trend analyses such as the HELCOM and OSPAR indicator work. The project might also serve as a kick-off for the envisaged future large-scale surveys cov-ering OSPAR and HELCOM areas. Currently, funding for adequate survey effort de-livering the data basis needed for OSPAR and HELCOM indicator work (as well as other requirements by conservation directives) is still lacking in several countries (see Section 2, Table 2.1 and Figure 2.1). In addition, there is no arrangement for a secured long-term funding for data analyses. Previous analyses for OSPAR and HELCOM indicator work were funded in the frame of short-term arrangements supported by single contracting parties. JWGBIRD experts thus aim to apply for funding for a kick-off project for large-scale at-sea monitoring in the OSPAR and HELCOM regions. Advice and support by OSPAR, HELCOM, national and EU administrations will be highly appreciated. Furthermore, JWGBIRD experts recommend to set up long-term arrangements for indicator analysis work by OSPAR and HELCOM.
Steering group: Experts at JWGBIRD 2016 recommended the foundation of a steering group in order to (1) prepare and execute the coordination of forthcoming large-scale surveys, (2) to calibrate survey methodology, (3) to coordinate and carry out joint analyses, (4) to highlight research needs and (5) to apply for and administer funding for joint data collection and analysis (see above). For the latter it needs to form a legal body, which is able to be funded by national or EU administrations. Such a steering group could work under the umbrella of an NGO (e.g. European Bird Census Coun-cil, EBCC) or be organized as a research group at a university.
2.4 Methodological considerations for the development of abundance indicators derived from at-sea data, in combination with land-based count data
Methodological considerations for the integration of at-sea data in the abundance indicators of HELCOM and OSPAR are twofold. A basic need is the identification or development of an adequate methodology for calculating trend analyses based on at-sea data. In addition to this, it is aspired to combine these analyses with the existing trend analyses based on IWC data in a single indicator. This can be achieved by set-ting up a procedure for integrating both survey methods either already during the
26 | JWGBIRD REPORT 2016
calculation of indicator indices or based on separately achieved results later during evaluation process. In order to avoid multiple assessments for a bird species in a giv-en area, it appears beneficial to conduct combined analyses of coastal and at-sea data.
Seabirds-at-Sea (SAS) data consist of temporal-spatial bird count data from moving ships and planes. The analysis of trends in bird abundance based on these data is challenging, since (1) raw data usually show high temporal and spatial autocorrela-tion, aggravated by the fact that temporal correlation may appear on the scale of minutes as well as on the scale of years; (2) the detection probability of bird flocks may decrease with increasing distance from the observer with strength and shape of decline being influenced by various covariates; (3) the detection of flocks on the tran-sect line can be imperfect, and may depend on additional covariates [issues under 2 and 3 may become less important if digital imaging is applied]; (4) various covariates may influence the abundance of birds, while these dependencies often show a highly nonlinear behaviour (such as seasonal patterns). An appropriate differentiation be-tween all above mentioned processes, corresponding covariates, as well as existing autocorrelation structures is indispensable in order to prevent from bias and increase precision of trend estimates. A careful review of methods showed that Generalized (Additive Mixed) Models qualify for analysing trends based on such data as different modelling approaches can be combined in a highly flexible manner (Mercker, 2016 in Annex 1). These models enable the visualization of highly nonlinear trends, a valid estimation of an overall log-linear trend as well as the comparison between popula-tion estimates of selected years. Furthermore, varying trends in different subregions can be integrated either by appropriate mixed modelling structures including a ran-dom slope (if these varying trends are not in the main focus), or by the consideration of appropriate fixed interaction terms in conjunction with post hoc analysis (which allows distinct comparison between the trends of different subregions).
The combination of trend analyses based on SAS and IWC data requires adequate mathematical tools. Due to their different nature the two different datasets cannot be pooled in one joint analysis. Instead it is recommended to combine results of sepa-rately undertaken trend analyses by an approach frequently used in meta-analysis studies (Mercker, 2016 in Annex 1). This is done by calculating the regression coeffi-cient of interest (in our case e.g. the average annual population change) as a weighted average, with weights which should be related to (1) the reliability of the underlying estimate (commonly expressed by the inverse squared standard error), and (2) the percentage of the overall monitored population which uses the corresponding habi-tat.
2.5 References Buckland ST, Burt ML, Rexstad EA, Mellor M, Williams AE, Woodward R. 2012. Aerial surveys
of seabirds: the advent of digital methods. Journal of Applied Ecology 49: 960–967.
Camphuysen CJ, Fox AD, Leopold MF, Petersen IK. 2004. Towards standardised seabirds at sea census techniques in connection with environmental impact assessments for offshore wind farms in the U.K. COWRIE-BAM 02-2002.
Garthe S, Schwemmer H, Markones N, Müller S, Schwemmer P. 2015. Verbreitung, Jahresdy-namik und Bestandsentwicklung der Seetaucher Gavia spec. in der Deutschen Bucht (Nordsee). Vogelwarte 53: 121–138.
HELCOM. 2015a. Abundance of waterbirds in the breeding season. HELCOM core indicator report. http://helcom.fi/baltic-sea-trends/indicators/abundance-of-waterbirds-in-the-breeding-season/
JWGBIRD REPORT 2016 | 27
HELCOM. 2015b. Abundance of waterbirds in the wintering season. HELCOM core indicator report. http://helcom.fi/baltic-sea-trends/indicators/abundance-of-waterbirds-in-the-wintering-season/
HELCOM. 2015c. Improving the Coordination in the Monitoring of the Baltic Marine Envi-ronment. BALSAM Project final report.http://helcom.fi/Lists/Publications/BALSAM%20Project%20Final%20Report.pdf.
ICES. 2015a. Report of the Joint OSPAR/HELCOM/ICES Working Group on Seabirds (JWG-BIRD), 17–21 November 2014, Copenhagen, Denmark. ICES CM 2014/ACOM:30. 115 pp.
ICES. 2015b. Report of the Joint OSPAR/HELCOM/ICES Working Group on Seabirds (JWG-BIRD), 9–13 November 2015, Copenhagen, Denmark. ICES CM 2015/ACOM:28. 196 pp.
Petersen IK, Clausen P, Nielsen RD, Laursen K. 2016. Tilvejebringelse af måltal for dykænder i seks danske Fuglebeskyttelsesområder. DCE - Nationalt Center for Miljø og Energi, Aar-hus Universitet.
Skov H, Heinänen S, Žydelis R, Bellebaum J, Bzoma S, Dagys M, Durinck J, Garthe S, Grishanov G, Hario M, Kieckbusch JJ, Kube J, Kuresoo A, Larsson K, Luigujoe L, Meissner W, Nehls HW, Nilsson L, Petersen IK, Mikkola Roos M, Pihl S, Sonntag N, Stock A, Stip-niece A. 2011. Waterbird populations and pressures in the Baltic Sea. TemaNord 2011:550. Nordic Council of Ministers, Copenhagen.
2.6 Annex 1 Mercker M. 2016. Trend analysis and census of seabirds: Recommended statistical approach.
Biostatistisches Büro Bionum. Report to JWGBIRD on behalf of Research and Technology Centre (FTZ), University of Kiel.
See below.
Trend analysis and census of seabirds:
Recommended statistical approach
Report to JWGBIRD on behalf of Research and Technology
Centre (FTZ), University of Kiel
Moritz Mercker - Biostatistisches Büro Bionum - www.bionum.de
October 31, 2016
Executive Summary
The biological aim of this study is to estimate population sizes and trends for differentbird species e.g. in the Baltic Sea and North Sea (and applicable to other marine areas).These data can be e.g. used to assess the environmental state of marine areas (e.g. in theframe of MSFD or to serve OSPAR and HELCOM biodiversity indicators) to establish awarning system for population declines.The statistical aim in the following summary is to develop a sampling and analysis ap-proach, leading to an optimal ratio between sampling effort and quality of results (i.e., lowbias and high power). In summary, we suggest the following approach:
• Sampling strategy: We recommend to use a regular spatial grid of the study areain intersection with transect lines as a basis to define spatially well separated sam-pling units. The optimal grid size will be determined a posteriori, balancing a highspatial resolution with a manageable amount of spatio-temporal autocorrelation.The necessary sample size (e.g. in terms of overall transect-length per country andyear) to detect trends of a certain strength can be evaluated a priori via power anal-ysis studies. However, this approach makes probably only sense if the sample size ingeneral is discussible. Furthermore, this approach gives only a rough estimate of therequired sample size.Regarding the spatial sampling design, we highly recommend a stratified samplingdesign, where we especially suggest to choose the strata based on a predictive re-gression model (e.g. GAM(M)) using previous count data. Existing transect layoutsshould be modified accordingly, which means mostly to prolongate single (randomlyor systematically chosen) transect lines into regions further offshore.Regarding the temporal sampling design we suggest always using the same transectsin each year in order to minimize the between-year-variance.Finally, we recommend the integration of existing ground count data (such as theIWC-coordinated counts) into the approach for trend and census estimation, in orderto decrease bias and enhance power especially for species strongly associated withthe coast line.
• Data handling: In order to allow for an optimal and consistent data collectionand analysis, we recommend an universal sampling protocol and database for allcontributing countries.
28
Trend analysis and census of seabirds
• Statistical approach: For both projects, the trend as well as the census project, werecommend the use of Generalized Additive Mixed Models (GAMMs) in conjunctionwith distance sampling methods as the most appropriate and flexible available toolto model species-specific trends and population estimates. Here, an important stepis that uncertainties resulting from the detection process are correctly propagated touncertainties of final regression coefficients. The latter can be e.g. performed usingbootstrap techniques, the delta-method, or hierarchical Bayesian regression methods,where the choice of the most appropriate method strongly depends on final data prop-erties (such as data size, autocorrelation, et cetera). These regression approaches canbe supplemented by appropriate multivariate techniques, such as MAFA or DynamicTrend analysis.Onshore point count data (such as the IWC-coordinated counts) can also be assessedby GLMMs or GAMMs; appropriate statistical methods to analyze and combine in-formation from these data with those from offshore counts are based on weightedaverage approaches
All the above mentioned suggestions are explained in detail within the following sectionsof the main document.
Biostatistisches Büro ”Bionum” – [email protected] – www.bionum.de – Tel: +49 163 2357 602
29
Trend analysis and census of seabirds
Table of contents
1 Objective and resources 4
2 Sampling design 42.1 Survey boundaries . . . . . . . . . . . . . . . . . . . . . . . . . . . . . . . . . . . 42.2 Spatio-temporal sampling unit . . . . . . . . . . . . . . . . . . . . . . . . . . . . 42.3 Sample size . . . . . . . . . . . . . . . . . . . . . . . . . . . . . . . . . . . . . . . 5
2.3.1 Within-year replicates . . . . . . . . . . . . . . . . . . . . . . . . . . . . . 52.3.2 Between-year replicates . . . . . . . . . . . . . . . . . . . . . . . . . . . . 5
2.4 Spatial sampling design . . . . . . . . . . . . . . . . . . . . . . . . . . . . . . . . 62.4.1 Sampling technique . . . . . . . . . . . . . . . . . . . . . . . . . . . . . . . 62.4.2 Method to select the Strata for the stratified random design . . . . . . . . 72.4.3 Transect layout . . . . . . . . . . . . . . . . . . . . . . . . . . . . . . . . . 72.4.4 Ship-based versus aerial surveys . . . . . . . . . . . . . . . . . . . . . . . 7
2.5 Temporal sampling design . . . . . . . . . . . . . . . . . . . . . . . . . . . . . . . 8
3 Data handling 8
4 Statistical approach 84.1 Trend project: possible methods . . . . . . . . . . . . . . . . . . . . . . . . . . . 84.2 Census project: possible methods . . . . . . . . . . . . . . . . . . . . . . . . . . . 104.3 Combining offshore and onshore bird count data . . . . . . . . . . . . . . . . . . 104.4 Final GAMMs: Frequentist versus Bayesian approach . . . . . . . . . . . . . . . 134.5 Dealing with the detection problem in GAM(M)s . . . . . . . . . . . . . . . . . . 14
Biostatistisches Büro ”Bionum” – [email protected] – www.bionum.de – Tel: +49 163 2357 602
30
Trend analysis and census of seabirds
1 Objective and resources
The biological aim of this study is to estimate population sizes (”census project’) and trends(”trend project”) for different bird species e.g. in the Baltic Sea and North Sea (and applicableto other marine areas) as well as in defined subdivisions in the study area. Based on this,the ecological importance of different subareas can be evaluated and, furthermore, a warningsystem for strong population declines can be established.
The data basis for these two projects are regular ship-based and aerial bird count surveys or-ganized and performed by every country of the study area. Extensive counts for the censusproject are planned, additional counts in subareas are planned for the years inbetween.
The statistical aim is to develop the overall approach (i.e., sampling design, data handling, andstatistical analysis) such that an optimal ratio between sampling effort and quality of results isachieved. Here, a high result quality is defined by a maximal statistical power in combinationwith a minimal bias in both, trend detection and census estimates.
In the following, the statistical suggestions are explained in more detail. In most of the cases,the census project and the trend project require the same optimal approach. We distinguishbetween both approaches only in case there is a methodelogical difference.
2 Sampling design
2.1 Survey boundaries
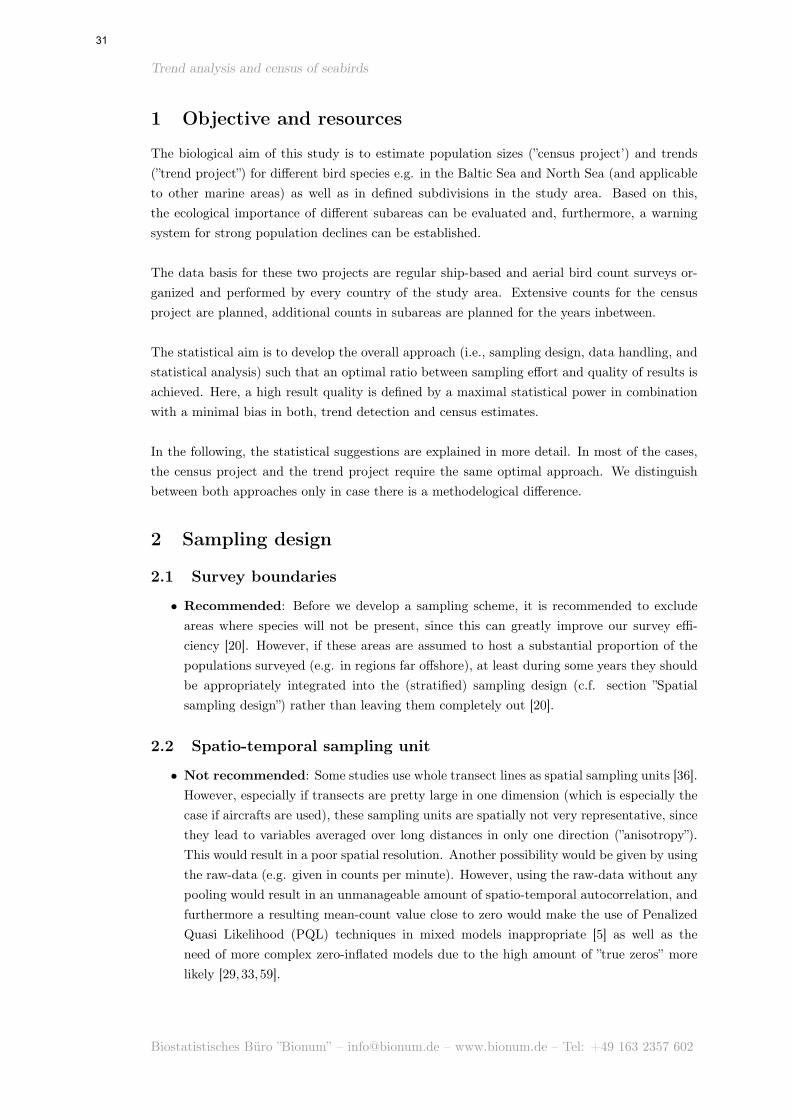
• Recommended: Before we develop a sampling scheme, it is recommended to excludeareas where species will not be present, since this can greatly improve our survey effi-ciency [20]. However, if these areas are assumed to host a substantial proportion of thepopulations surveyed (e.g. in regions far offshore), at least during some years they shouldbe appropriately integrated into the (stratified) sampling design (c.f. section ”Spatialsampling design”) rather than leaving them completely out [20].
2.2 Spatio-temporal sampling unit
• Not recommended: Some studies use whole transect lines as spatial sampling units [36].However, especially if transects are pretty large in one dimension (which is especially thecase if aircrafts are used), these sampling units are spatially not very representative, sincethey lead to variables averaged over long distances in only one direction (”anisotropy”).This would result in a poor spatial resolution. Another possibility would be given by usingthe raw-data (e.g. given in counts per minute). However, using the raw-data without anypooling would result in an unmanageable amount of spatio-temporal autocorrelation, andfurthermore a resulting mean-count value close to zero would make the use of PenalizedQuasi Likelihood (PQL) techniques in mixed models inappropriate [5] as well as theneed of more complex zero-inflated models due to the high amount of ”true zeros” morelikely [29,33,59].
Biostatistisches Büro ”Bionum” – [email protected] – www.bionum.de – Tel: +49 163 2357 602
31
Trend analysis and census of seabirds
• Better: Segmentation of transect-lines into equidistant sub-parts (e.g., as possible withthe TREND software [49]). However, this may lead (in most transect-designs) to anspatially highly anisotropic subdivision and thus a poor/anisotropic spatial resolution.
• Recommended: We recommend to use a regular grid [20] of the study ares (for instancethe entire Baltic Sea) as a basis. Based on this, each transect line (in each survey) canbe split into corresponding subunits which are spatially well and isotropically separated.Finally, since usually not each entire cell-area is sampled during one transect (but only anintersection), only the intersected sub-area and its averaged coordinates are used withinthe statistical analysis.The optimal size of grid is a priori not known, this has to be evaluated during dataanalysis constituting a balancing of high local spatial resolution on the one hand, anda manageable amount of spatial / temporal autocorrelation and data-size on the otherhand. Our recent results indicate that e.g. a spatial grid of 10x10 or 20x20 km is idealfor certain sea duck species in the German Baltic Sea [34].
2.3 Sample size
2.3.1 Within-year replicates
Different theoretical studies show that replicates of the same sampling areas each year at thesame date (with a maximal temporal distance between them) can strongly increase the powerof a trend analyses. Recommended are 2-4 revisits per year [41, 52], where with > 3 revisitsthis effect appears to saturate [52].However, restricted funding resources will prohibit more than one revisit per year. Thus,an ”optimal” time of year is chosen from a biological perspective and recommended for allparticipating countries. The most suitable period is probably the winter time, since abundanceof many species peaks in most countries during this season and birds usually aggregate incertain feeding ground and are less mobile than in other seasons [2]. Furthermore, it would bebeneficial to perform all offshore-counts around the 15th of January, in order to synchronizethe offshore counts with the annual ground counts coordinated by the International WaterbirdCensus (IWC) [2].
2.3.2 Between-year replicates
Here, we have two different possible approaches. We are not sure which one to recommend, sincethis depends very much on on the question how fix the planned sampling effort is (respectivelyhow much ample scope is given).
1. Fixed sampling effort: Here, we assume that the sampling effort per year (i.e., thenumber and length of sampled transects per country and year) is already maximal andrather fixed, e.g., due to financial constraints. In this case, an a priori power analysis doesnot make much sense. We thus would hope that the resulting data are enough to obtainat least for most of the species a relatively high power regarding trend and abundanceestimates.
2. Flexible sampling effort / power analysis: Alternatively, one could perform an apriori power analysis [13, 19, 41, 56] in order to analyze the minimal sampling intensity
Biostatistisches Büro ”Bionum” – [email protected] – www.bionum.de – Tel: +49 163 2357 602
32
Trend analysis and census of seabirds
required (e.g. for each species) in order to achieve a certain power, which means tosignificantly detect trends with a certain strength, or to estimate abundance with a certainconfidence. However, such power analyses usually require assumptions e.g. regarding thespatio-temporal distribution patterns of different species, wich are only partially known apriori. However, such information can be found in already sampled data (e.g. data fromthe entire Baltic Sea from 2016) which we could use as a basis for the power analysis.Thus, we would evaluate if there are any considerable problems with the existing spatio-temporal sampling intensity, which species are affected, and how modification of existingtransect lines could improve the design without changing overall length of the transects.Related software comparing different designs are given in the R package DSsim [32] andversion 7 of the DISTANCE software [8]. We want to point out that corresponding powerestimates are based on simulated processes and thus give only a rough estimate and nota guarantee for required sample sizes.
2.4 Spatial sampling design
2.4.1 Sampling technique
• Not recommended: Random sampling. Here, grid cells are chosen completely at ran-dom. Although the advantage is that this design shows a low bias (i.e., samples are veryrepresentative), the disadvantage is that we will have many counts with less or no birds.This would result in a poor power.
• Not recommended: Sampling only in areas which are known for high bird densities(”bird hot spots”). Although some previous works suggested this design to detect trends[6,19,47] due to its high power, more recent and complex studies indicate that these designsmay produce biased results [20, 21, 41]: If sampling is performed only in one subregion/ habitat, this trend might not be representative for the overall population (e.g., due todifferent trends in different strata respectively spatial population shifts) and results thusare biased.
• Recommended: Based on the suggestions of [13, 20, 21, 31, 41, 48] we recommend astratified sampling approach. The advantage of this approach is that sampling intensitycan be optimally adapted to
– expected bird-densities respectively biodiversity,
– expected variance,
– monitoring capacity of each country,
– survey cost,
– additional constraints, such as the constraint that certain subdivisions (e.g., the 17sub-basins of the Baltic) have to be sampled at least once per year,
leading to an optimal compromise between low bias, high power, and additional externalconstraints.
Biostatistisches Büro ”Bionum” – [email protected] – www.bionum.de – Tel: +49 163 2357 602
33
Trend analysis and census of seabirds
2.4.2 Method to select the Strata for the stratified random design
• ”Easy method” (Applicable, but not optimal): The strata (e.g. separating regionswith high from those with low abundance or variance) are chosen ”by hand” based onpersonal experience of regular bird watchers. Already rough estimates of abundance andvariance for a stratified design can greatly improve our survey efficiency [20].
• Recommended: An optimal usage of existing knowledge to define the strata would bethe following approach:
1. Using all previous available bird count data from the Baltic Sea to build a regressionmodel (e.g. based on Generalized Additive Models (GAM)) using several covariates(such as depth, distance to the coast, time of year,...) as predictors (c.f., followingsubsection ”Transect layout” which would also require such an approach).
2. Based on this model, plotting a prediction map for the entire study area (e.g. theBaltic Sea). As outcome variable, different reasonable measures have to be comparedand discussed, such as total abundance, diversity, or combinations of them (e.g. viathe Shannon-Weaner-Index [58]). Of course, also a re-weighting of certain speciesof interest in contrast to species of least concern is possible in order to make thesampling design more appropriate for some endangered species.
3. Finally, based on this prediction map, reasonable strata can be defined, dependingin an optimal manner on the predicted local variance, abundance, bio-diversity, andpossibly cost.
2.4.3 Transect layout
Various transect lengths and layouts have been used to monitore birds, most prominent layoutsare parallel, equally spaced transects with a random start and sawtooth or zigzag designs. Thechoice of an appropriate design depends on many different variables, such as survey platformcost, survey boundary shape, environmental gradients (possibly reflecting gradients in birddensity) in interplay with possible stratification, encounter rate variance, light conditions, orthe method (ships versus aircrafts) [2, 7, 41,49].
• Recommended: Existing transect layouts can be retained for the most part, however,they should be adapted to the stratified design (c.f., previous sections). In practice, thise.g. means that single transect lines are prolongated to more offshore regions in order tosample each stratum in an appropriate intensity.
2.4.4 Ship-based versus aerial surveys
Depending on different variables (such as local bird density, detectability of bird species, orthe length of daylight, accessibility of survey area), sometimes ship-based and sometimes aerialsurveys are preferable. These parameters should be carefully considered by choosing an appro-priate method for a certain area; a good overview regarding the important criteria and detailedcomparisons and descriptions of available methods are given in Ref. [2].
Biostatistisches Büro ”Bionum” – [email protected] – www.bionum.de – Tel: +49 163 2357 602
34
Trend analysis and census of seabirds
2.5 Temporal sampling design
• Not recommended: Changing the transects between subsequent years. This wouldincrease unnecessarily the between-year-variance [21].
• Recommended: Using always the same transects each year, and (if possible) also withthe same observers. This minimizes the unexplained variance between years – the ”site”and ”observers” effects – to produce the most precise and accurate census numbers andtrend estimates [21,41,51,52].
3 Data handling
In order to allow an optimal and consistent data collection and analysis, we strongly suggest to
1. design one general sampling protocol respectively sampling sheet for all contributing coun-tries, containing a detailed description of the field method as well as necessary covariates;
2. use one database for all data, allowing data entry only in a predefined manner (e.g.predefined ranges or levels).
4 Statistical approach
There are several possible statistical techniques analyzing both: trend and census data. Withinthe next subsections, we distinguish between the trend and the census project since some of theavailable methods differ.
4.1 Trend project: possible methods
• Not recommended:
– TRIM and TRIMmaps are ”classical” tools calculating trend analysis based on log-linear models (c.f., e.g., Ref. [38]). However, limitations of these approaches areversatile: E.g., they are limited regarding the type of additional covariates, spatialautocorrelation, mixed or hierarchical modeling, additive modeling, missing data(i.e., they need an imputation algorithm which again produces additional bias /uncertainties), offset-modeling, zero-inflated models, or the diverse modern methodsto model overdispersion, such as observation-level random intercepts or the Tweedie-distribution.
– Multivariate autoregressive state-space (MARSS) models are a modern tool in trendanalysis [24] and have been e.g. used to estimate population trends of the world’smonitored seabirds [37]. They can be also used in conjunction with the Kalmanfilter. The advantage of these models is that they explicitly distinguish betweenprocess error and observation error by combining two linear equations. However, forour purposes they are not ideal since (1) possibly strong bias is produced due tothe underlying assumption of normality and additivity, and (2) we know more aboutthe true nature of our observation error (c.f. subsection ”Dealing with the detectionproblem”) and thus can model this more explicitly depending on specific covariates.
Biostatistisches Büro ”Bionum” – [email protected] – www.bionum.de – Tel: +49 163 2357 602
35
Trend analysis and census of seabirds
• Better:
– There is a variety of fast developing new methods in the context of species distri-bution models, such as BRT (Boosted Regression Trees), Random-forest Regressiontrees, and GDM (Generalized Dissimilarity Model) (e.g. summarized in [17]). Thesemethods (and available software) could be carefully checked as possible supplementa-tion for planned GAM(M) regression approaches, since if these methods make betterspatial predictions compared to GAMMs, they probably also have the capacity tohave more power in trend estimation.
– Dynamic Trend Analysis and MAFA. These two techniques are related to each otherand provide a possibility to extract trends for a multivariate dataset, e.g. extractingmost prominent trends for (not a priori defined) clusters of species [58]. Since weare primarily interested in the trend of single species, they can be only seen as asupplement / validation of the below mentioned regression methods, but do notdisplay an alternative.
• Recommended:
– Generalized (Additive Mixed) Models as extensions of the methods as presentedby [18, 45, 46]. Here, the combination of different modeling approaches is possi-ble in a highly flexible manner. This includes additive predictors using differentsmoothers like LOESS smoothers or various regression splines [18, 34], or alterna-tively the Kalman-filter, wich is an optimal smoothing method for time series [46].Furthermore, GAMs can be extended to mixed modeling approaches including differ-ent temporal or spatial autoregression structures, allowing (among others) varyinglog-linear trends between different subdivisions (such as the 17 sub-basins of theBaltic) and hence do not require the assumption of ”synchronicity” between differ-ent habitats [39, 40]. Furthermore, the problem of detection probability can be e.g.included via ”one-stage approaches” using zero-inflated [33, 53, 57, 60] respectivelyhierarchical Bayesian models [1, 28], or based on ”two-stage approaches”, as sum-marized by [36]. Additionally, overdispersion can be modeled with various differentapproaches, such as negative-binomial or quasi-Poisson-models [58–60], but also withmodern methods such as an observation-level random factor [29, 60] or the Tweediedistribution [12,36].Furthermore, varying trends in different sub-regions can be integrated either byappropriate mixed modeling structures including a random slope (if these varyingtrends are not in the main focus), or by the consideration of appropriate fixed inter-action terms in conjunction with post hoc analysis (which allows distinct comparisonbetween the trends of different sub-regions).Finally, with these models the visualization of highly nonlinear trends [18, 34], avalid estimation of an overall log-linear trend [34] as well as the comparison betweenpopulation estimates of selected years [18] is possible.If spatial and temporal autocorrelation structures are present and/or GAMMs willnot converge e.g. due to complex autocorrelation, methods of "Generalized Estima-tion Equations" (GEEs) are an alternative/extension. Although these methods havesome disadvantages against GAMM’s/GLMM’s (such as the need of larger sample
Biostatistisches Büro ”Bionum” – [email protected] – www.bionum.de – Tel: +49 163 2357 602
36
Trend analysis and census of seabirds
sizes in order to be sufficiently accurate, or non-robustness to non-randomly miss-ing longitudinal data), they usually show a better convergence / robust behaviorespecially in the presence of complex correlation structures. Furthermore, they havebeen recently successfully applied to offshore bird count data in conjunction withdistance correction [30].
4.2 Census project: possible methods
• Basic approach: Estimating census numbers by counting in randomly chosen sub-regions(within strata), correcting these raw data regarding the detection probability (e.g., usingTRIM, c.f., following section) and simply extrapolating these numbers to the overall areaof each stratum. The disadvantage of this approach is that neither the true variance ofthe data nor the uncertainty connected to the detection process is correctly propagatedto a confidence interval for the final census estimate.
• Better: For density and abundance estimates, the classical distance sampling approachis frequently used in conjunction with a Horvitz-Thompson-like estimator in order toestimate abundance and variance [8, 49]. Thus total numbers of species are calculatedincluding the uncertainty induced by both, the detection process as well as the naturalvariance of the data. Alternatively, bootstrap-methods can be used to obtain confidencelimits [56]. The disadvantage of this approach is that the extrapolation is purely ”design-based” instead of ”model-based”, and possibly different covariates regarding unsampeled(and extrapolated) sub-regions are neglected, which may produce bias.
• Recommended: We recommend the use of GAM(M)-regression techniques (as describedin more detail within the previous subsection) in conjunction with distance sampling meth-ods to extrapolate counted sub-areas to whole strata in a model-based manner (”DensitySurface Modeling” [27, 36]). Here, possibly differing covariates in uncounted regions areautomatically considered allowing a straight-forward estimation of population numbersfor the entire study area based on GAMM-prediction, embedded in a stratified design.
4.3 Combining offshore and onshore bird count data
Beside the offshore data (from ships and aircrafts), there exist also various data based on reg-ular ground counts: Ground counts based on coastal surveys are carried out in all Baltic Seacountries [2]. Since many Baltic Sea species occur only close to the coastline (respectively haveonshore roosting sites), an appropriate monitoring of these species from aircrafts or ships is notpossible. More details regarding possible methods and modifications of point transect surveysincluding correction factors regarding distance and observation time are e.g. given in [20,42].
In order to estimate population sizes and trends, it is desirable to base these estimates on bothdatasets, since each dataset represents a distinct part of the overall population. However, thereare different statistical techniques based on the joint consideration and evaluation of data fromdifferent scientific studies or approaches, in order to obtain a pooled estimate. Some of thesetechniques focus on different appropriate models (respectively covariates) based on the sameset of data (e.g. multimodel interference / model averaging techniques, c.f. [10, 29]) whereas
Biostatistisches Büro ”Bionum” – [email protected] – www.bionum.de – Tel: +49 163 2357 602
37
Trend analysis and census of seabirds
other techniques rather assume that the data can be assessed by the same statistical modelsbut data sources may be different (e.g., integrative data analysis (IDA), c.f. [16, 26]).
However, SAS data and IWC data differ in nearly all respects, especially
• SAS data are based on line-transects whereas IWC data are based on point counts;
• SAS data have been collected at varying places and seasons of year, whereas IWC-countshave been performed at fixed locations and one time point (however not all are coveredat all times);
• SAS data use distance-corrected data, whereas IWC data do not (yet) correct for visibilitybias;
• both datasets asses different distribution areas (close to the coast versus offshore) thathost different proportions of the bird population and thus are based on different datasets;
• both data require very different models respectively covariates (respectively types of co-variates: fixed, random and smooth), which is the result of differences in both: samplingmethods and habitats;
• at the moment, even the outcome variable differs between both methods: SAS dataevaluate bird densities, whereas IWC data (still) consider total bird numbers (but areasizes will be available within the next months).
In this context we want to point out that a detection-/distance-correction for the (IWC) pointcount data is highly desirable, since these methods are well established (e.g., [8]) and wouldreduce bias and increase the precision, which is especially the case für abundance estimates ofbirds species mainly associated with the coast line. However, this would require that corre-sponding field methods are modified to the effect that distance classes are recorded as well.
• Not recommended:
Ignoring these data from onshore point counts, since they are a potentially valuable sourceof data for some species occurring only close to the coast. Since multimodel inference/ model averaging techniques require the same underlying set of data (otherwise, e.g.AIC/BIC values are not comparable [29, 58, 59]), these techniques are not suitable forthe present question. Furthermore, discussions with experts in IDA (”integrative dataanalysis”) reveal that IDA-approaches are not appropriate for the present question, for acouple of reasons [25]. One problem is for example given by the fact that number andnature of covariates strongly differ between both methods, e.g. the location in SAS datais given by an additive smooth of continuous coordinates, whereas fixed locations in IWCdata are rather introduced as a random intercept.
Biostatistisches Büro ”Bionum” – [email protected] – www.bionum.de – Tel: +49 163 2357 602
38
Trend analysis and census of seabirds
• Recommended:
– Average annual trend : We think that the most appropriate method for integratingsuch heterogeneous datasets and models are approaches frequently used in Meta-analysis studies [22]. Here, an appropriate method is to calculate for the regressioncoefficient of interest (in our case e.g. the average annual population change) asa weighted average, with weights which should be related to (1) the reliability ofthe underlying estimate (commonly expressed by the inverse squared standard er-ror [23]), and (2) the percentage of the overall monitored population which usesthe corresponding habitat (which is an idea commonly used in the context stratifiedsampling [20,31]). Thus, the final trend estimate β is given by [23]
β =(P1/SE
21) · β1 + (P2/SE
22) · β2
(P1/SE21) + (P2/SE2
2), (1)
where the index ”1” and ”2” refer to the SAS-method and the IWC-method, re-spectively, Pi is the a-priori estimate of the population proportion within the cor-responding habitat (offshore vs. near-shore), and SEi is the standard error of themethod/model-specific estimate.
The final standard error is then given by [23]
SE =
√1
(P1/SE21) + (P2/SE2
2). (2)
If SE1 = SE2 as well as P1 = P2 = 0.5 holds, we see that β becomes the simpleaverage and SE the simple standard error. Corresponding p-values can be calculatede.g. using the Students-t-distribution.
– Visualization nonlinear trend : For the visualization of the nonlinear (smooth) trend,the same principles can be applied. I.e., for each year, the relative population size(set to ”1” for the first considered year) can be calculated as a weighted average fromboth models/approaches. An appropriate procedure for appropriately calculatingconfidence bands for the resulting smooth has yet to be developed.
– The problem of the time of year : The IWC data are usually based on annual countsin January. In contrast, SAS data are based on counts during the entire year. Ad-ditional complexity is given by the fact that the strength of a trend may dependon the time of year, and thus these two datasets are not directly comparable. Onepossibility is given by the restriction of the SAS data to the data collected at wintertime, the disadvantage is that this would probably cause a distinct loss in statisticalpower. A probably better possibility is to consider within the SAS model the termsβ(1)1 · Y EAR as well as the additional interaction term β
(2)1 · Y EAR : WINTER,
Biostatistisches Büro ”Bionum” – [email protected] – www.bionum.de – Tel: +49 163 2357 602
39
Trend analysis and census of seabirds
the latter being a dummy variable which is ”1” for winter time and ”0” else. Theestimate β1 from the SAS data would then be given by
β1 = β(1)1 + β
(2)1
and the standard error by
SE1 =
√(SE
(1)1 )2 + (SE
(2)1 )2 + 2 · Cov(β(1)
1 , β(2)1 ).
The advantage of this approach would be that all estimates rely on much more datathan regression based on restricted data, and thus the estimate for β1 is probably lessbiased and shows a smaller standard error. Of course, to verify this, both approaches(and resulting standard errors) can be evaluated and compared.
4.4 Final GAMMs: Frequentist versus Bayesian approach
In order to fit the GAM(M) models for the trend respectively census project, two possible mainapproaches are available, each having its advantages and disadvantages:
• Frequentist approach: GAM’s including mixed modeling structures, spatial or tem-poral autocorrelation, offset, and some probability distributions of the outcome variable(such as Poisson- or negative-binomial distribution) can be modeled e.g. via the mgcvpackage in R. Model coefficient uncertainties (such as regression coefficient standard er-rors and p-values) are here based on the frequentist approach. The advantages of thisapproach are:
– computation times even for complex models are relatively fast (compared to theBayesian approach), which is important especially since we deal with relatively largedatasets;
– the R language as well as the ”classical” frequentist approach is well known for manyscientists.
The disadvantage of this approach (ignoring here the general statistical and philosophicaldebate comparing Bayesian with frequentist approaches) is: Each R package has it’slimitations, and thus different stochastic and deterministic regression model parts cannotbe combined in an arbitrary way. E.g., the package mgcv cannot handle both – spatialand temporal autocorrelation – at the same time, and furthermore, hierarchical models(such as zero-inflated models) cannot be combined with overdispersed data and mixedmodeling in an arbitrary way. Thus, it may appear that models based on R do notdisplay the ”optimal model” in terms of the model structure, wich can lead to both: biasand a loss in power.
• Bayesian approach: In contrast, the Bayesian approach (respectively appropriate soft-ware such as WinBUGS, OpenBUGS, Stan, and it’s interfaces to R [28, 29]) allow anarbitrary model structure since these softwares are not relied on certain packages, butallow to program regression models ”piecewise”. Possible disadvantages are:
Biostatistisches Büro ”Bionum” – [email protected] – www.bionum.de – Tel: +49 163 2357 602
40
Trend analysis and census of seabirds
– computation times are much longer, wich is especially critically in the context oflarge data sets;
– the programming language to set up these models as well as the underlying approachto calculate uncertainties is not (yet) well known to many scientist. This can be apossible hurdle for some scientists to use or modify these models.
Recommended: Referring to the planned project we recommend the use of frequentist meth-ods rather than Bayesian approaches, since (1) expected data are relatively large and thuscomputation times for complex models with possible spatial and temporal autocorrelation maybe beyond the scope of Bayesian methods; (2) the programming language to set up these mod-els as well as the underlying approach should be understandable and modifiable for differentinvolved scientists including non-experts in statistics.
4.5 Dealing with the detection problem in GAM(M)s
There are several covariates (and their interactions) possibly affecting the visibility and thusthe detection probability of birds/bird flocks, such as the distance to the observer, the method(ship-based versus aerial survey), ship/aircraft speed or type, sea state, light conditions, weatherconditions, flock size, species sex/age/size, or observer experience, for instance [43]. All thesedetection-related processes can be mainly separated into two categories: (1) processes/covariatesinfluencing the ”overall detectability” of birds (i.e. the detectability on the transect line re-spectively the distance-independent detectability); and (2) processes/covariates influencing thequantitative and qualitative decrease of detectability with the distance (i.e., the shape of thedistance-dependent detection function). Furthermore, all these dependencies can qualitativelyand quantitatively differ between the detectability of bird flocks, and the detectability of birdindividuals within already detected flocks. However, our recent works reveal for different seabirdspecies that the detectability of bird flocks is the dominant distance-dependent process, whereasthe detection of bird individuals within already detected flocks does not (measurable) dependon the distance. We thus assume in the following that distance-correction regarding bird flocksis sufficient.
• Not recommended:
Completely neglecting the bias due to (distance-dependent and distance-independent)detection probability. In case of the trend analysis, this neglect would be not as fatal asin estimating census data since it can be assumed that the resulting relative bias doesnot correlate with the variable "year", and relative trends are thus mainly unaffected bythis bias. However, our recent results show that both approaches (the distance-correctedversus the distance-uncorrected approach) indeed show roughly the same qualitative andquantitative trend behavior, but also distinct differences in certain time periods can beobserved, leading to trend estimates locally differing by > 20% [34]. Since we have toconsider the problem of detection-correction anyway in the context of the census project,we should therefore use these proper models in the context of the trend project as well.
Biostatistisches Büro ”Bionum” – [email protected] – www.bionum.de – Tel: +49 163 2357 602
41
Trend analysis and census of seabirds
• Recommended:
General model structure and distance sampling: To account for these above mentionedprocesses and connected uncertainties, we propose a two-step analysis procedure, firstlyaccounting for detectability (based on distance-sampling methods [6,8,14,20,27,36,43,50]),and secondly for various abundance-related covariates including the variable year for trendanalysis based on a GAMM. Here, the detection probability estimated in the first step isusually used as an offset in the second step [8, 36]. Such a ”two-stage-approach” has theadvantage over an ”one-stage-/ full likelihood-approach” [1,8,28] that [35] (1) modeling thedistance-dependent detection process (qualitatively and quantitatively differing betweenship-based and aerial surveys) ”correct” is a time-consuming and relatively complex pro-cess and should be treated as a separate carefully constructed modeling exercise basedon appropriate established software; (2) in a one-stage-approach, one has to fit the wholespatial model in order to do model checking on just the distance-dependent detectionfunction part of the model, which can be very time consuming; (3) usually, the optimalfitting procedures for detection functions wouldn’t fit into the GAM(M) frameworks, e.g.as provided by the mgcv -package in R;
Distance-independent detection: To consider the fact that detection on the transect lineis usually imperfect and may depend on various covariates (such as method or sea state)three different approaches are currently available and should be compared applied to thedata: (1) if data are based on ”double-observer” surveys, it is possible to directly gaugehow many birds are overlooked at the transect line using the idea of mark-recapture tech-niques [3,4,8,9,11,36]. However, these methods distinctly increase costs and complexity ofboth, field work and data analysis [8]. (2) An attractive alternative which does not rely ondouble-observer data is given by the function gdistsamp() from the R-package unmarked,which allows for estimation of imperfect detection on the line (under certain assumptions)based on replicated counts [14, 15], the latter in our case given by the different spatio-temporal sampling units. Here, estimates are based on the multinomial-Poisson mixturemodels of Ref. [44] which allows to use different covariates for detection on the transect-lineas well as for distance-dependent detection [14]. (3) Finally, covariates probably influenc-ing distance-independent detection can be estimated in final GAMM models togetherwith abundance-related covariates. This is the easiest and probably most robust way tointegrate distance-independent detection [34]. The disadvantage ist however that theseestimates are separated from the the distance-related correction via detection functions,thus only relative differences between different covariates influencing overall detection areevaluated. For trend estimates this does not pose a problem. For abundance estimates,however, we have to assume that at least one combination of distance-independent detec-tion covariates (such as ”method=ship” and ”sea state = 0”) allows for an approximatelyperfect detection on the transect line.Thus, we recommend for now to perform as many double-observer surveys as possible,in order to compare all three above mentioned approaches and their estimates applied toreal data.
Biostatistisches Büro ”Bionum” – [email protected] – www.bionum.de – Tel: +49 163 2357 602
42
Trend analysis and census of seabirds
Variance propagation: The correction for imperfect detection is however connected to un-certainties, e.g. expressed via standard errors of the regression coefficients of the detection-functions. These uncertainties have to be correctly propagated into final GAMM-standarderrors. Here, possible approaches are bootstrap techniques, the Delta-method, or tech-niques based on GAM theory [8,30,36,54,55]. Again, the choice of the most appropriatemethod may depend on specific properties of the collected data.
References
[1] Courtney L. Amundson, J. Andrew Royle, and Colleen M. Hande. A hierarchical modelcombining distance sampling and time removal to estimate detection probability duringavian point counts. The Auk, 131:476–494, 2014.
[2] A. Aunins. Guidlines for coordinated cost-effective futire monitoring of marine birds. 2015.
[3] Earl F. Becker and Aaron M. Christ. Correction: A unimodal model for double observerdistance sampling surveys. PLoS One, 10(10):e0140913, 2015.
[4] Earl F. Becker and Aaron M. Christ. A unimodal model for double observer distancesampling surveys. PLoS One, 10(8):e0136403, 2015.
[5] Benjamin M. Bolker, Mollie E. Brooks, Connie J. Clark, Shane W. Geange, John R.Poulsen, M Henry H. Stevens, and Jada-Simone S. White. Generalized linear mixed models:a practical guide for ecology and evolution. Trends Ecol Evol, 24(3):127–135, Mar 2009.
[6] S.T. Buckland, D.R. Anderson, K.P. Burnham, J.L. Laake, D.L. Borchers, and L. Thomas.Introduction to Distance Sampling: Estimating Abundance of Biological Populations. Ox-ford University Press, New York, 2001.
[7] S.T Buckland, S.J. Mardsen, and R.E. Freen. Estimating bird abundance: making methodswork. Bird Conservation International, 18:S91–S108, 2008.
[8] S.T. Buckland, E.A. Rexstad, T.A. Marques, and C.S. Oedekoven. Distance Sampling:Methods and Applications. Springer, 2015.
[9] Stephen T. Buckland, Jeffrey L. Laake, and David L. Borchers. Double-observer linetransect methods: levels of independence. Biometrics, 66(1):169–177, Mar 2010.
[10] K.P. Burnham and D. R. Anderson. Model selection and Multimodel Inference. Springer,2002.
[11] M.L. Burt, D.L. Bochers, K.J. Jenkings, and T.A. Marques. Using mark-recapture distancesampling methods on line transect surveys. Methods in Ecology and Evolution, 5(11):1180–1191, 2014.
[12] S. Candy. Modelling catch snd effort data using generalized linear models , the tweediedistribution, random vessel effects and random stratum-by-year effects. CCAMLR Science,11:59–80, 2004.
[13] M. Carlson and F. Schmiegelow. Cost-effective sampling designaplied to large-scale moni-toring of boreal birds. Conservation Biology, 6(2), 2002.
Biostatistisches Büro ”Bionum” – [email protected] – www.bionum.de – Tel: +49 163 2357 602
43
Trend analysis and census of seabirds
[14] R. Chandler. Distance sampling analysis in unmarked. https://cran.r-project.org/web/packages/unmarked/vignettes/distsamp.pdf, 2015.
[15] R. Chandler. Written communication. 2016.
[16] Patrick J. Curran and Andrea M. Hussong. Integrative data analysis: the simultaneousanalysis of multiple data sets. Psychol Methods, 14(2):81–100, Jun 2009.
[17] J. et al Elith. Novel methods improve prediction of species distributions from ocurrencedata. Ecography, 29:129–151, 2006.
[18] R.M. Fewster, S.T. Buckland, G.M. Siriwardena, S.R. Baillie, and J.D. Wilson. Analy-sis of population trends for farmland birds using generalized additive models. Ecology,81(7):1970–1984, 2000.
[19] T. Gerodette. A power analysis for detecting trends. Ecology, 68:1364–1372, 1987.
[20] Gibbons D.W. et Donald P.F. Gregory, R.D. Bird census and survey techniques. In: BirdEcology and Conservation; a Handbook of Techniques. : 17–56. Oxford University Press,Oxford, 2004.
[21] R.D. Gregory. written communication (2016).
[22] J. Gurevitch, P.S: Curtis, and M.H. Jones. Meta-analysis in ecology. Advances in EcologicalResearch, 32:199–247, 2011.
[23] J. Hartung, G. Knapp, and B. K. Sinha. Statistical meta-analysis with applications. JohnWiley & Sons. ISBN 978-0-470-29089-7., 2008.
[24] Elizabeth E. Holmes, Eric J. Ward, and Kellie Wills. Marss: Multivariate autoregressivestate-space models for analyzing time-series data. The R Journal, 4(1):11–19, 2012.
[25] A. Hussong, S. Bainter, and P.J. Curran. Written communication. 2016.
[26] Andrea M. Hussong, Patrick J. Curran, and Daniel J. Bauer. Integrative data analysis inclinical psychology research. Annu Rev Clin Psychol, 9:61–89, 2013.
[27] D.S. Johnson, J.L. Laake, and J.M. Ver Hoef. A model-based approach for making ecolog-ical inference from distance sampling data. BIOMETRICS, 66:310–319, 2010.
[28] M. Kery and J. A. Royle. Applied Hierarchical Modeling in Ecology. Elsevier, 2016.
[29] F. Korner-Nievergelt, T. Roth, S. von Felten, J. Guelat, B. Almasi, and P. Korner-Nievergelt. Bayesian Data Analysis in Ecology Using Linear Models with R, BUGS, andStan. Elsevier, 2015.
[30] I. K.Petersen, R. D. Nielsen, and M. L. Mackenzie. Post-construction evaluation of birdabundances and distributions in the horns rev 2 offshore wind farm area, 2011 and 2012.Aarhus University, Department of Bioscience: Report commissioned by DONG Energy,2014.
[31] S. Lohr. Sampling: design and analysis. Second edition. Brooks/Cole, Pacific Grove,California, USA, 2010.
Biostatistisches Büro ”Bionum” – [email protected] – www.bionum.de – Tel: +49 163 2357 602
44
Trend analysis and census of seabirds
[32] M. Marshall. DSsim: Distance Sampling Simulations. R package versions 1.0.1., 2014.
[33] Tara G. Martin, Brendan A. Wintle, Jonathan R. Rhodes, Petra M. Kuhnert, Scott A.Field, Samantha J. Low-Choy, Andrew J. Tyre, and Hugh P. Possingham. Zero toleranceecology: improving ecological inference by modelling the source of zero observations. EcolLett, 8(11):1235–1246, Nov 2005.
[34] M. Mercker. Trend analysis of seabirds in the north- and baltic sea (FTZ Büsum). unpub-lished, Bionum, 2016.
[35] D.L. Miller. written communication. 2016.
[36] D.L. Miller, M.L. Burt, E.A. Rexstad, and L. Thomas. Spatial models for distance sam-pling data: recent developments and future directions. Methods in Ecology and Evolution,4:1001–1010, 2013.
[37] Michelle Paleczny, Edd Hammill, Vasiliki Karpouzi, and Daniel Pauly. Population trendof the world’s monitored seabirds, 1950-2010. PLoS One, 10(6):e0129342, 2015.
[38] J. Pannekoek and A. van Strien. Trim 3 manual. Statistics Netherlands, Voorburg, 2005.
[39] M. Parsons, P.I. Mitchell, A. Butler, R.A. Mavor, N. Ratcliffe, and S. Forster. Naturalheritage trends: abundance of breeding seabirds in scotland. Scottish Natural HeritageCommissioned Report (ROAME No. FO5NB01), 222:64 pp, 2006.
[40] Matt Parsons, Ian Mitchell, Adam Butler, Norman Ratcliffe, Morten Frederiksen, SimonFoster, and James B. Reid. Seabirds as indicators of the marine environment. ICES Journalof Marine Science, 65:1520–1526, 2008.
[41] L.J. Rachowicz, A.E. Hubbard, and S.R. Beissinger. Evaluating at-sea sampling designsfor marbled murrelets using a spatially explicit model. Ecological Modelling, 196:329–344,2006.
[42] C.J. Ralph, J.R. Sauer, and S. Droege. Monitoring bird populations by point counts.www.rsl.psw.fd.fed.us/projects/wild/gtrl49/gtr149.html, 1995.
[43] R.A. Ronconi and A.E. Burger. estimating seabird densities from vessel transects: distancesampling and implications for strip transects. Aquatic Biology, 4:297–309, 2009.
[44] J.A. Royle. N-mixture models for estimating population size from spatially replicatedcounts. Biometrics, 60:108–115, 2004.
[45] C.J. Schwarz. Detecting trends over time. In ”Course Notes for Beginning and IntermediateStatistics”, 2015.
[46] L. Soldaat, H. Visser, M. van Roomen, and A. van Strien. Smoothing and trend detectionin waterbird monitoring data using structural time-series analysis and the kalman filter. JOrnithol, 148:S351–S357, 2007.
[47] D.L. Strayer. Statistical power of presence-absence data to detect population declines.Conservation Biology, 13:1034–1038, 1999.
Biostatistisches Büro ”Bionum” – [email protected] – www.bionum.de – Tel: +49 163 2357 602
45
Trend analysis and census of seabirds
[48] W.J. Sutherland. The Conservation handbook: research, management and policy. BlackwellScientific, Oxford, 2000.
[49] Len Thomas, Stephen T. Buckland, Eric A. Rexstad, Jeff L. Laake, Samantha Strindberg,Sharon L. Hedley, Jon Rb Bishop, Tiago A. Marques, and Kenneth P. Burnham. Distancesoftware: design and analysis of distance sampling surveys for estimating population size.J Appl Ecol, 47(1):5–14, Feb 2010.
[50] W.L. Thomson. towards reliable bird surveys: accountimg for individuals present but notdetected. The Auk, 119(1):18–25, 2002.
[51] N.S. Urquhart and T.M. Kincaid. Designs for detecting trend from repeated surveysof ecolgical resources. Journal of Agricultural, Biological, and Environmental Statistics,4(4):404–414, 1999.
[52] A. V. Vecchia. Water-quality trend analysis and sampling design for streams in northdakota, 1971-2000. Water-Resources Investigations Report 03-4094, 2003.
[53] Seth J. Wenger and Mary C. Freeman. Estimating species occurrence, abundance, anddetection probability using zero-inflated distributions. Ecology, 89(10):2953–2959, Oct2008.
[54] Rob Williams, Sharon L. Hedley, Trevor A. Branch, Mark V. Bravington, Alexandre N.Zerbini, and Ken P. Findlay. Chilean blue whales as a case study to illustrate methodsto estimate abundance and evaluate conservation status of rare species. Conserv Biol,25(3):526–535, Jun 2011.
[55] Wood. Generalized Additive Models: An Introduction with R. Chapman & Hall/CRC.,2006.
[56] S.R. Wotton, I. Carter, A.V. Cross, B. Etheridge, N. Snell, K. Duffy, R. Thorpe, and R.D.Gregory. Breeding status of the red kite milvus milvus in britain in 2000. Bird Study,49:278–286, 2002.
[57] Elise F. Zipkin, Beth Gardner, Andrew T. Gilbert, Allan F O’Connell, Jr, J Andrew Royle,and Emily D. Silverman. Distribution patterns of wintering sea ducks in relation to thenorth atlantic oscillation and local environmental characteristics. Oecologia, 163(4):893–902, Aug 2010.
[58] A. Zuur, E. Ieno, and G.M. Smith. Analysing Ecological Data. Springer Science+BusinessMedia, LLC, 2007.
[59] A.F. Zuur, E.N. Ieno, N.J. Walker, A.A. Saveliev, and G.M. Smith. Mixed Effect Modelsand Extensions in Ecology with R. Springer Science+Business Media, LLC, 2009.
[60] A.F. Zuur, A.A. Saveliev, and E.N. Ieno. Zero inflated models and gerneralized linearmixed models withh R. Highland Statistics Ltd., 2012.
Biostatistisches Büro ”Bionum” – [email protected] – www.bionum.de – Tel: +49 163 2357 602
46

JWGBIRD REPORT 2016 | 47
2.7 Annex 2
Extended ESAS database structure for offshore surveys as proposed in HELCOM BALSAM project and developed in HELCOM BalticBOOST project
The data model is based on the structure of the original ESAS database along with the extensions to it used in the database of the Research and Technology Centre (FTZ), University of Kiel.
Additions to the original ESAS structure (including those used in the FTZ database) are printed red, mandatory fields are printed bold.
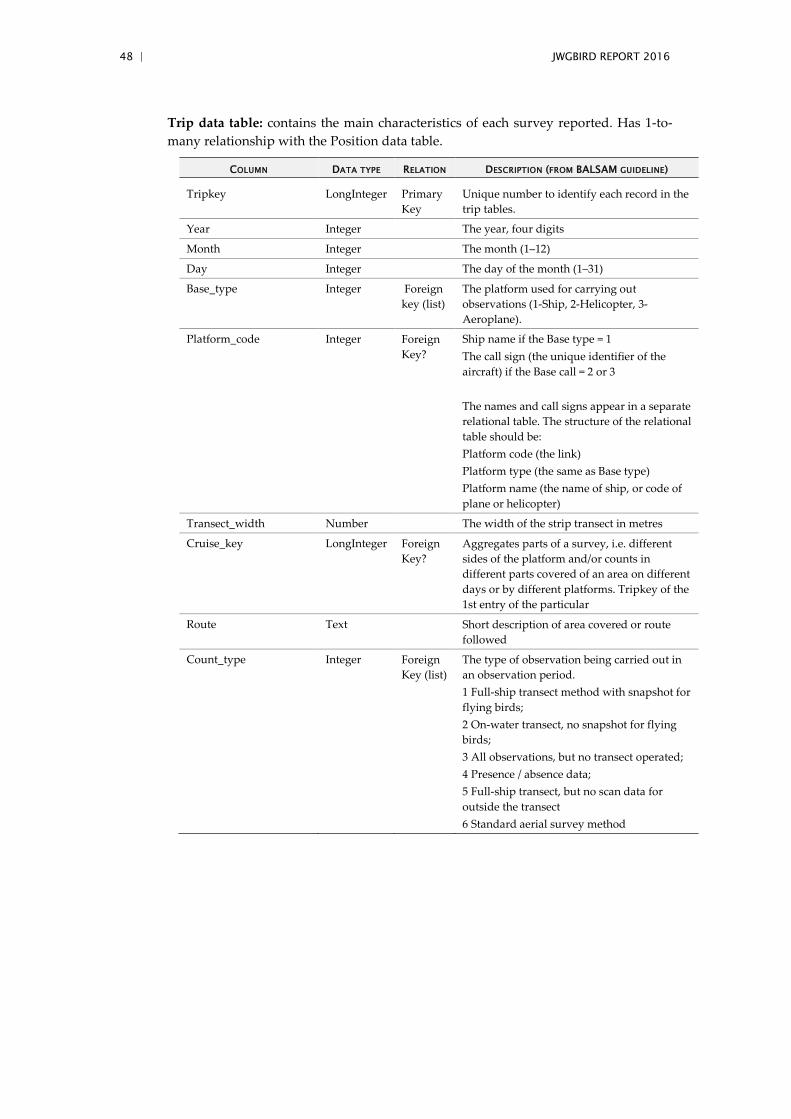
48 | JWGBIRD REPORT 2016
Trip data table: contains the main characteristics of each survey reported. Has 1-to-many relationship with the Position data table.
COLUMN DATA TYPE RELATION DESCRIPTION (FROM BALSAM GUIDELINE)
Tripkey LongInteger Primary Key
Unique number to identify each record in the trip tables.
Year Integer The year, four digits
Month Integer The month (1–12)
Day Integer The day of the month (1–31)
Base_type Integer Foreign key (list)
The platform used for carrying out observations (1-Ship, 2-Helicopter, 3-Aeroplane).
Platform_code Integer Foreign Key?
Ship name if the Base type = 1 The call sign (the unique identifier of the aircraft) if the Base call = 2 or 3 The names and call signs appear in a separate relational table. The structure of the relational table should be: Platform code (the link) Platform type (the same as Base type) Platform name (the name of ship, or code of plane or helicopter)
Transect_width Number The width of the strip transect in metres
Cruise_key LongInteger Foreign Key?
Aggregates parts of a survey, i.e. different sides of the platform and/or counts in different parts covered of an area on different days or by different platforms. Tripkey of the 1st entry of the particular
Route Text Short description of area covered or route followed
Count_type Integer Foreign Key (list)
The type of observation being carried out in an observation period. 1 Full-ship transect method with snapshot for flying birds; 2 On-water transect, no snapshot for flying birds; 3 All observations, but no transect operated; 4 Presence / absence data; 5 Full-ship transect, but no scan data for outside the transect 6 Standard aerial survey method
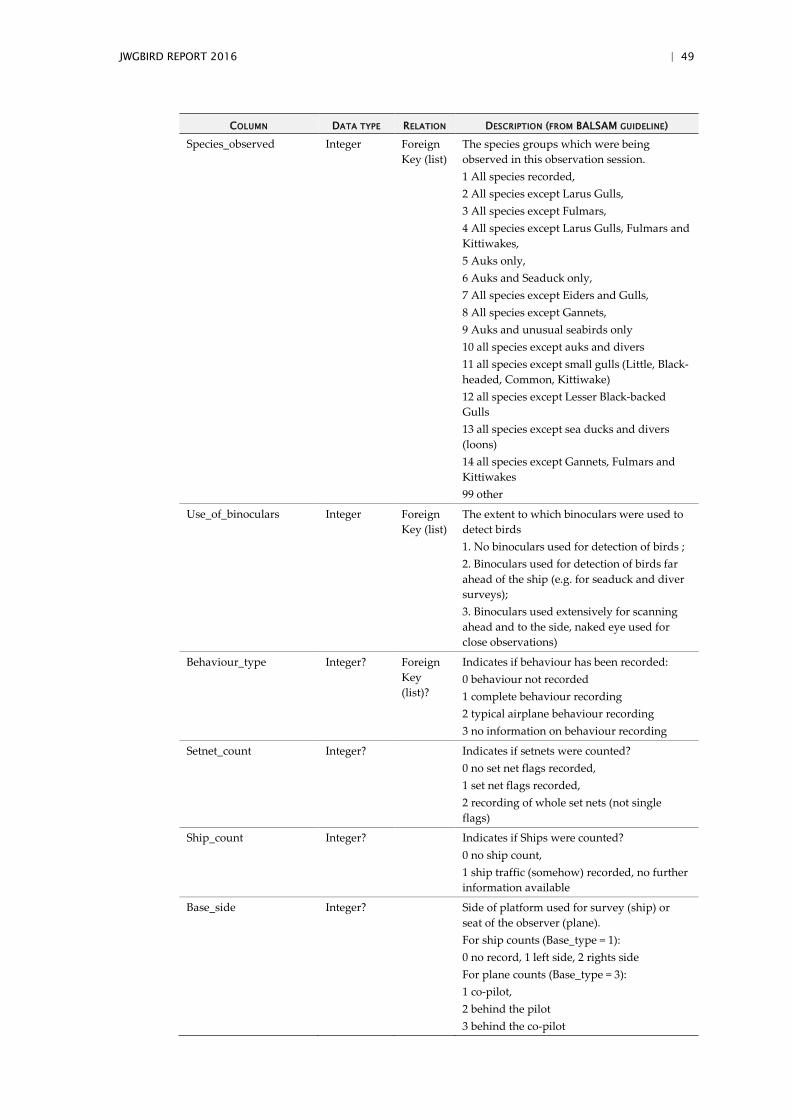
JWGBIRD REPORT 2016 | 49
COLUMN DATA TYPE RELATION DESCRIPTION (FROM BALSAM GUIDELINE)
Species_observed Integer Foreign Key (list)
The species groups which were being observed in this observation session. 1 All species recorded, 2 All species except Larus Gulls, 3 All species except Fulmars, 4 All species except Larus Gulls, Fulmars and Kittiwakes, 5 Auks only, 6 Auks and Seaduck only, 7 All species except Eiders and Gulls, 8 All species except Gannets, 9 Auks and unusual seabirds only 10 all species except auks and divers 11 all species except small gulls (Little, Black-headed, Common, Kittiwake) 12 all species except Lesser Black-backed Gulls 13 all species except sea ducks and divers (loons) 14 all species except Gannets, Fulmars and Kittiwakes 99 other
Use_of_binoculars Integer Foreign Key (list)
The extent to which binoculars were used to detect birds 1. No binoculars used for detection of birds ; 2. Binoculars used for detection of birds far ahead of the ship (e.g. for seaduck and diver surveys); 3. Binoculars used extensively for scanning ahead and to the side, naked eye used for close observations)
Behaviour_type Integer? Foreign Key (list)?
Indicates if behaviour has been recorded: 0 behaviour not recorded 1 complete behaviour recording 2 typical airplane behaviour recording 3 no information on behaviour recording
Setnet_count Integer? Indicates if setnets were counted? 0 no set net flags recorded, 1 set net flags recorded, 2 recording of whole set nets (not single flags)
Ship_count Integer? Indicates if Ships were counted? 0 no ship count, 1 ship traffic (somehow) recorded, no further information available
Base_side Integer? Side of platform used for survey (ship) or seat of the observer (plane). For ship counts (Base_type = 1): 0 no record, 1 left side, 2 rights side For plane counts (Base_type = 3): 1 co-pilot, 2 behind the pilot 3 behind the co-pilot
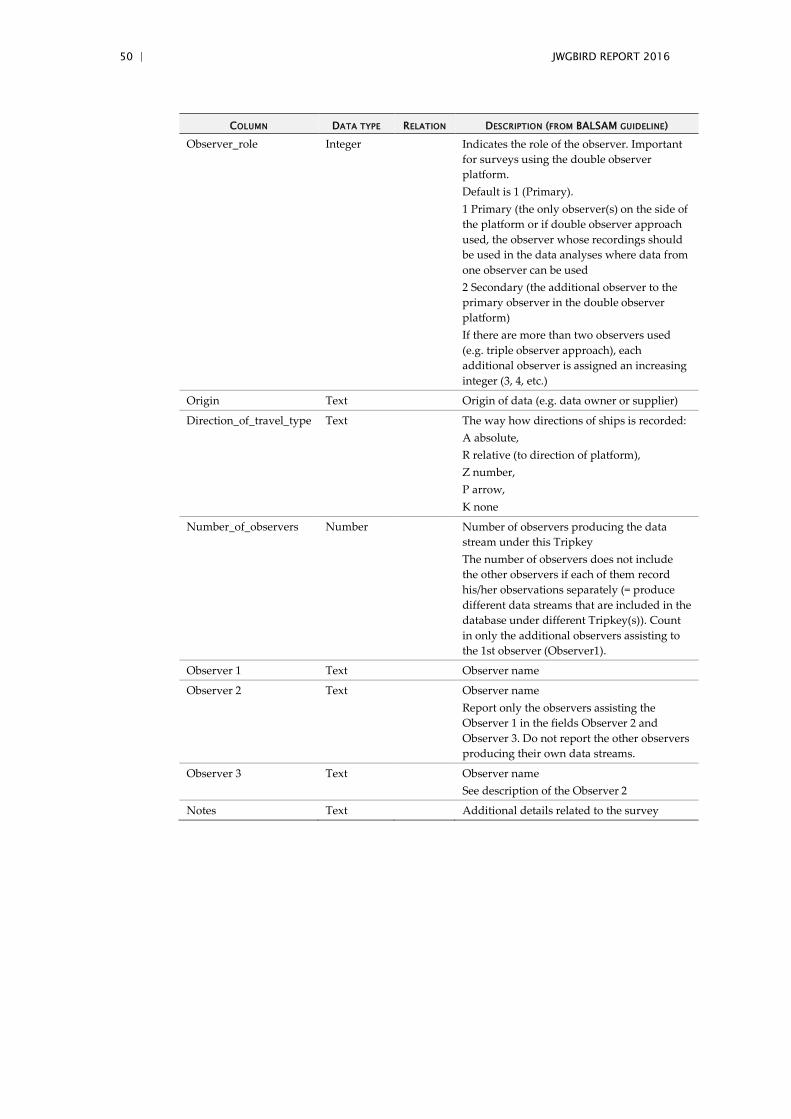
50 | JWGBIRD REPORT 2016
COLUMN DATA TYPE RELATION DESCRIPTION (FROM BALSAM GUIDELINE)
Observer_role Integer Indicates the role of the observer. Important for surveys using the double observer platform. Default is 1 (Primary). 1 Primary (the only observer(s) on the side of the platform or if double observer approach used, the observer whose recordings should be used in the data analyses where data from one observer can be used 2 Secondary (the additional observer to the primary observer in the double observer platform) If there are more than two observers used (e.g. triple observer approach), each additional observer is assigned an increasing integer (3, 4, etc.)
Origin Text Origin of data (e.g. data owner or supplier)
Direction_of_travel_type Text The way how directions of ships is recorded: A absolute, R relative (to direction of platform), Z number, P arrow, K none
Number_of_observers Number Number of observers producing the data stream under this Tripkey The number of observers does not include the other observers if each of them record his/her observations separately (= produce different data streams that are included in the database under different Tripkey(s)). Count in only the additional observers assisting to the 1st observer (Observer1).
Observer 1 Text Observer name
Observer 2 Text Observer name Report only the observers assisting the Observer 1 in the fields Observer 2 and Observer 3. Do not report the other observers producing their own data streams.
Observer 3 Text Observer name See description of the Observer 2
Notes Text Additional details related to the survey
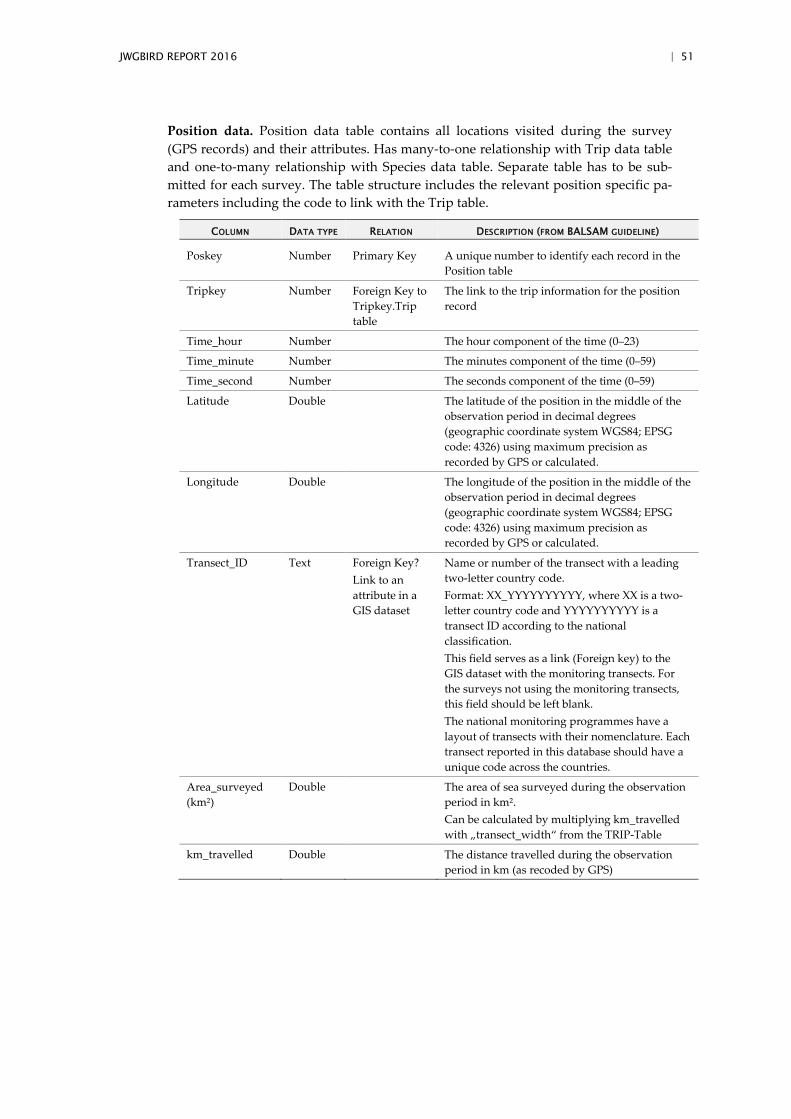
JWGBIRD REPORT 2016 | 51
Position data. Position data table contains all locations visited during the survey (GPS records) and their attributes. Has many-to-one relationship with Trip data table and one-to-many relationship with Species data table. Separate table has to be sub-mitted for each survey. The table structure includes the relevant position specific pa-rameters including the code to link with the Trip table.
COLUMN DATA TYPE RELATION DESCRIPTION (FROM BALSAM GUIDELINE)
Poskey Number Primary Key A unique number to identify each record in the Position table
Tripkey Number Foreign Key to Tripkey.Trip table
The link to the trip information for the position record
Time_hour Number The hour component of the time (0–23)
Time_minute Number The minutes component of the time (0–59)
Time_second Number The seconds component of the time (0–59)
Latitude Double The latitude of the position in the middle of the observation period in decimal degrees (geographic coordinate system WGS84; EPSG code: 4326) using maximum precision as recorded by GPS or calculated.
Longitude Double The longitude of the position in the middle of the observation period in decimal degrees (geographic coordinate system WGS84; EPSG code: 4326) using maximum precision as recorded by GPS or calculated.
Transect_ID Text Foreign Key? Link to an attribute in a GIS dataset
Name or number of the transect with a leading two-letter country code. Format: XX_YYYYYYYYYY, where XX is a two-letter country code and YYYYYYYYYY is a transect ID according to the national classification. This field serves as a link (Foreign key) to the GIS dataset with the monitoring transects. For the surveys not using the monitoring transects, this field should be left blank. The national monitoring programmes have a layout of transects with their nomenclature. Each transect reported in this database should have a unique code across the countries.
Area_surveyed (km²)
Double The area of sea surveyed during the observation period in km². Can be calculated by multiplying km_travelled with „transect_width“ from the TRIP-Table
km_travelled Double The distance travelled during the observation period in km (as recoded by GPS)
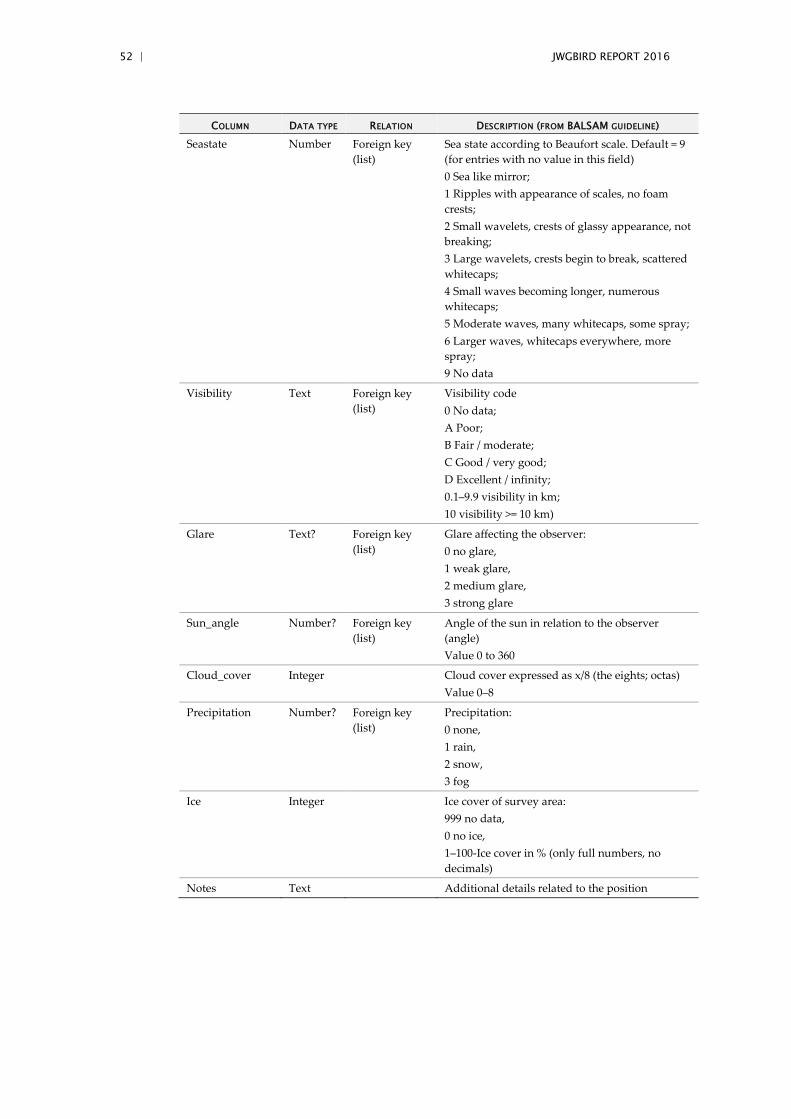
52 | JWGBIRD REPORT 2016
COLUMN DATA TYPE RELATION DESCRIPTION (FROM BALSAM GUIDELINE)
Seastate Number Foreign key (list)
Sea state according to Beaufort scale. Default = 9 (for entries with no value in this field) 0 Sea like mirror; 1 Ripples with appearance of scales, no foam crests; 2 Small wavelets, crests of glassy appearance, not breaking; 3 Large wavelets, crests begin to break, scattered whitecaps; 4 Small waves becoming longer, numerous whitecaps; 5 Moderate waves, many whitecaps, some spray; 6 Larger waves, whitecaps everywhere, more spray; 9 No data
Visibility Text Foreign key (list)
Visibility code 0 No data; A Poor; B Fair / moderate; C Good / very good; D Excellent / infinity; 0.1–9.9 visibility in km; 10 visibility >= 10 km)
Glare Text? Foreign key (list)
Glare affecting the observer: 0 no glare, 1 weak glare, 2 medium glare, 3 strong glare
Sun_angle Number? Foreign key (list)
Angle of the sun in relation to the observer (angle) Value 0 to 360
Cloud_cover Integer Cloud cover expressed as x/8 (the eights; octas) Value 0–8
Precipitation Number? Foreign key (list)
Precipitation: 0 none, 1 rain, 2 snow, 3 fog
Ice Integer Ice cover of survey area: 999 no data, 0 no ice, 1–100-Ice cover in % (only full numbers, no decimals)
Notes Text Additional details related to the position
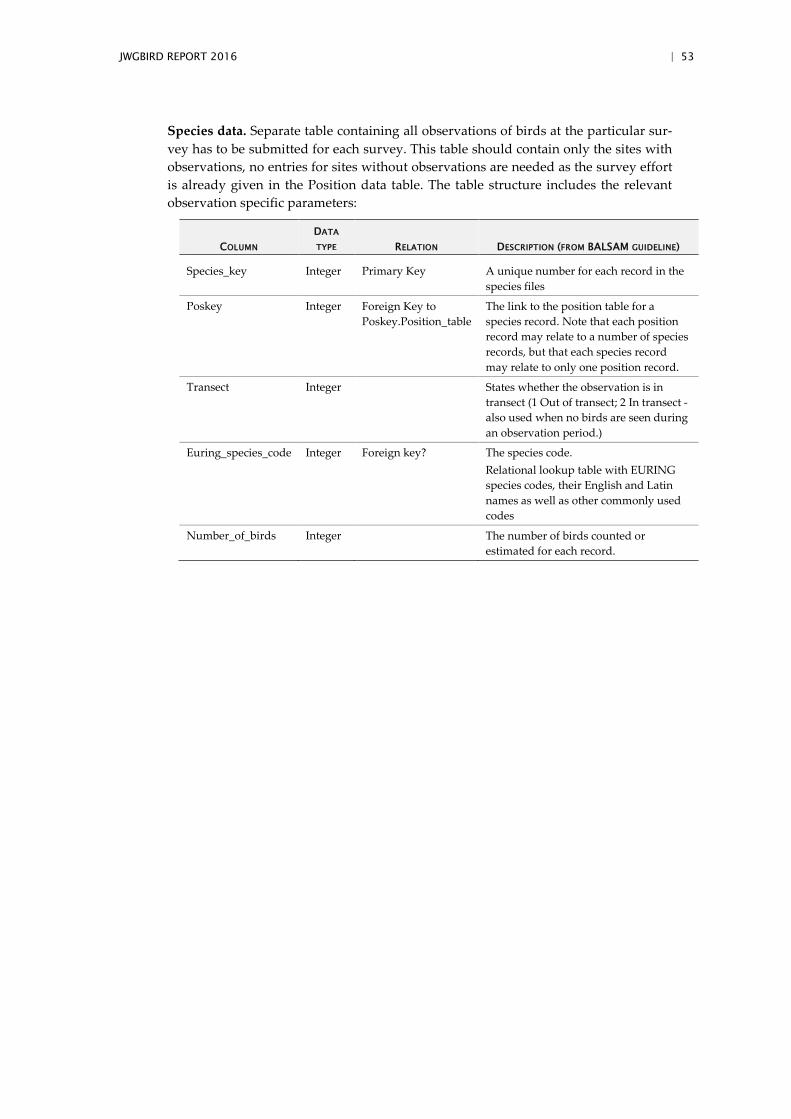
JWGBIRD REPORT 2016 | 53
Species data. Separate table containing all observations of birds at the particular sur-vey has to be submitted for each survey. This table should contain only the sites with observations, no entries for sites without observations are needed as the survey effort is already given in the Position data table. The table structure includes the relevant observation specific parameters:
COLUMN DATA
TYPE RELATION DESCRIPTION (FROM BALSAM GUIDELINE)
Species_key Integer Primary Key A unique number for each record in the species files
Poskey Integer Foreign Key to Poskey.Position_table
The link to the position table for a species record. Note that each position record may relate to a number of species records, but that each species record may relate to only one position record.
Transect Integer States whether the observation is in transect (1 Out of transect; 2 In transect - also used when no birds are seen during an observation period.)
Euring_species_code Integer Foreign key? The species code. Relational lookup table with EURING species codes, their English and Latin names as well as other commonly used codes
Number_of_birds Integer The number of birds counted or estimated for each record.
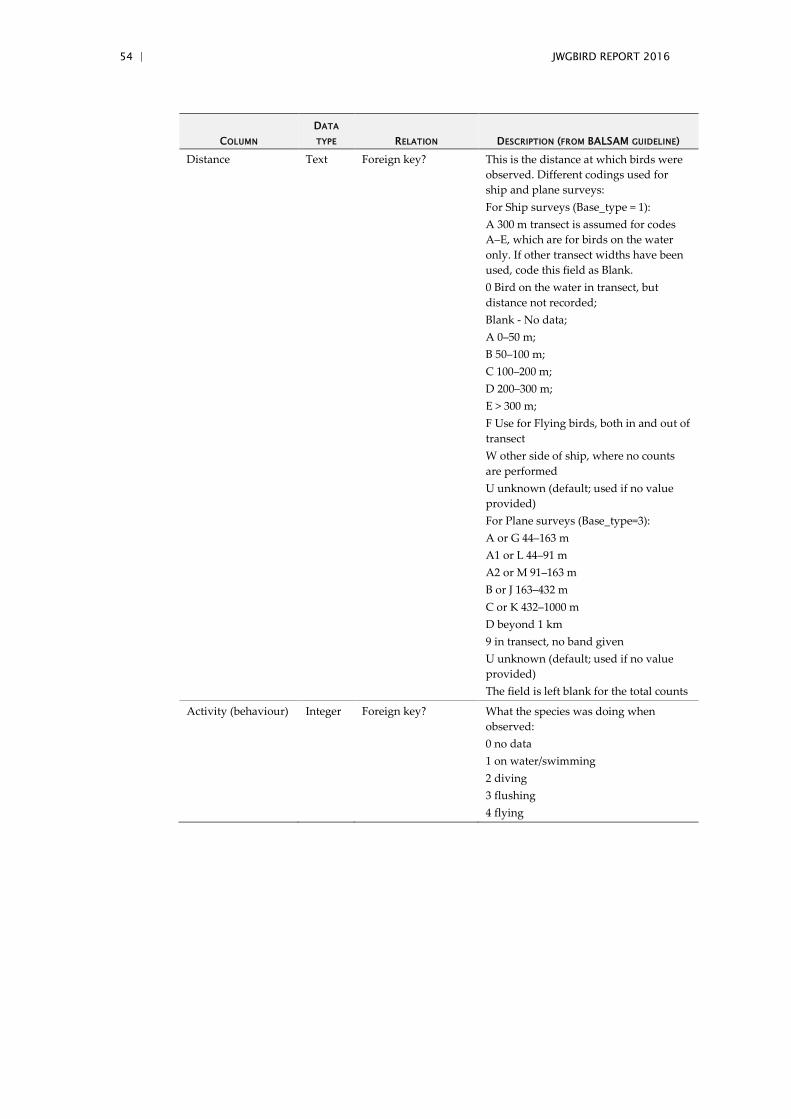
54 | JWGBIRD REPORT 2016
COLUMN DATA
TYPE RELATION DESCRIPTION (FROM BALSAM GUIDELINE)
Distance Text Foreign key? This is the distance at which birds were observed. Different codings used for ship and plane surveys: For Ship surveys (Base_type = 1): A 300 m transect is assumed for codes A–E, which are for birds on the water only. If other transect widths have been used, code this field as Blank. 0 Bird on the water in transect, but distance not recorded; Blank - No data; A 0–50 m; B 50–100 m; C 100–200 m; D 200–300 m; E > 300 m; F Use for Flying birds, both in and out of transect W other side of ship, where no counts are performed U unknown (default; used if no value provided) For Plane surveys (Base_type=3): A or G 44–163 m A1 or L 44–91 m A2 or M 91–163 m B or J 163–432 m C or K 432–1000 m D beyond 1 km 9 in transect, no band given U unknown (default; used if no value provided) The field is left blank for the total counts
Activity (behaviour) Integer Foreign key? What the species was doing when observed: 0 no data 1 on water/swimming 2 diving 3 flushing 4 flying
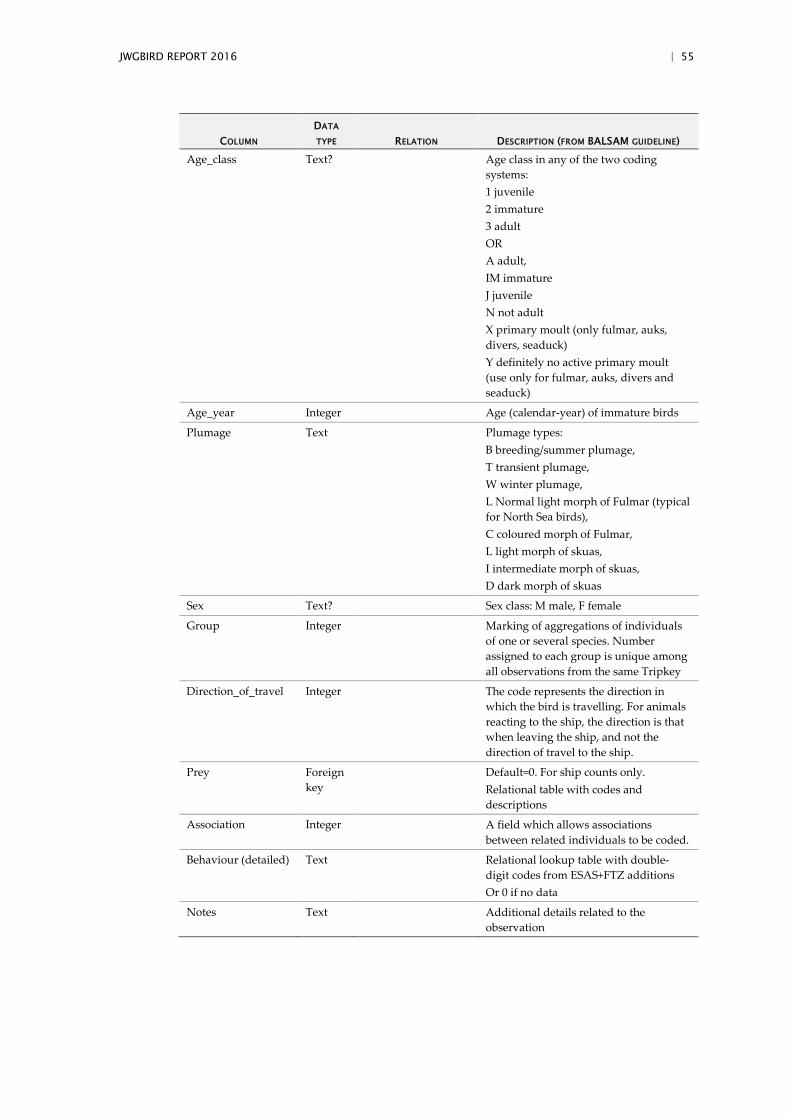
JWGBIRD REPORT 2016 | 55
COLUMN DATA
TYPE RELATION DESCRIPTION (FROM BALSAM GUIDELINE)
Age_class Text? Age class in any of the two coding systems: 1 juvenile 2 immature 3 adult OR A adult, IM immature J juvenile N not adult X primary moult (only fulmar, auks, divers, seaduck) Y definitely no active primary moult (use only for fulmar, auks, divers and seaduck)
Age_year Integer Age (calendar-year) of immature birds
Plumage Text Plumage types: B breeding/summer plumage, T transient plumage, W winter plumage, L Normal light morph of Fulmar (typical for North Sea birds), C coloured morph of Fulmar, L light morph of skuas, I intermediate morph of skuas, D dark morph of skuas
Sex Text? Sex class: M male, F female
Group Integer Marking of aggregations of individuals of one or several species. Number assigned to each group is unique among all observations from the same Tripkey
Direction_of_travel Integer The code represents the direction in which the bird is travelling. For animals reacting to the ship, the direction is that when leaving the ship, and not the direction of travel to the ship.
Prey Foreign key
Default=0. For ship counts only. Relational table with codes and descriptions
Association Integer A field which allows associations between related individuals to be coded.
Behaviour (detailed) Text Relational lookup table with double-digit codes from ESAS+FTZ additions Or 0 if no data
Notes Text Additional details related to the observation
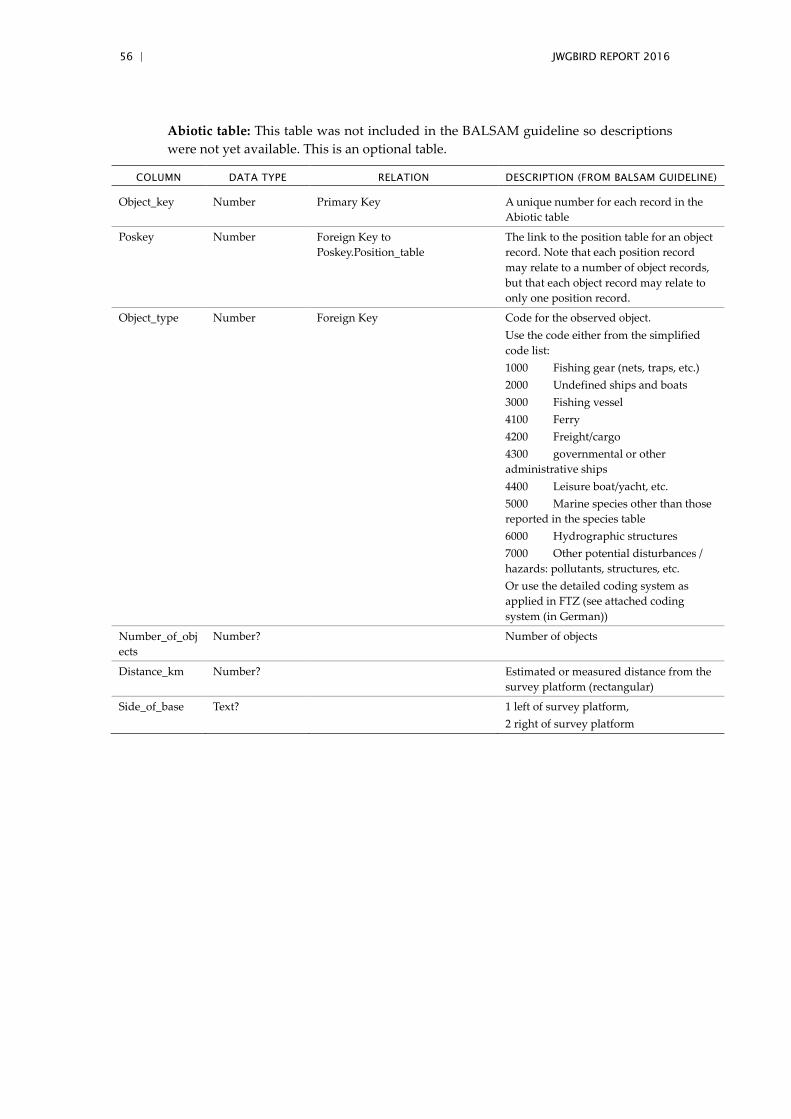
56 | JWGBIRD REPORT 2016
Abiotic table: This table was not included in the BALSAM guideline so descriptions were not yet available. This is an optional table.
COLUMN DATA TYPE RELATION DESCRIPTION (FROM BALSAM GUIDELINE)
Object_key Number Primary Key A unique number for each record in the Abiotic table
Poskey Number Foreign Key to Poskey.Position_table
The link to the position table for an object record. Note that each position record may relate to a number of object records, but that each object record may relate to only one position record.
Object_type Number Foreign Key Code for the observed object. Use the code either from the simplified code list: 1000 Fishing gear (nets, traps, etc.) 2000 Undefined ships and boats 3000 Fishing vessel 4100 Ferry 4200 Freight/cargo 4300 governmental or other administrative ships 4400 Leisure boat/yacht, etc. 5000 Marine species other than those reported in the species table 6000 Hydrographic structures 7000 Other potential disturbances / hazards: pollutants, structures, etc. Or use the detailed coding system as applied in FTZ (see attached coding system (in German))
Number_of_objects
Number? Number of objects
Distance_km Number? Estimated or measured distance from the survey platform (rectangular)
Side_of_base Text? 1 left of survey platform, 2 right of survey platform
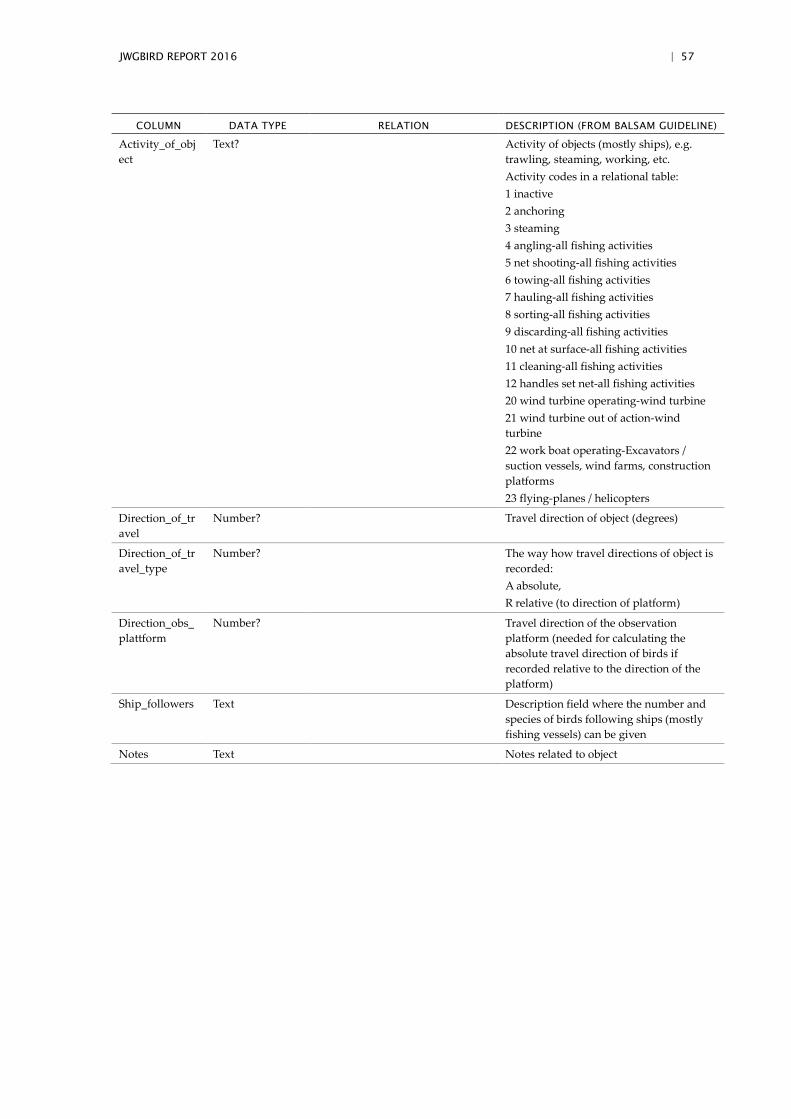
JWGBIRD REPORT 2016 | 57
COLUMN DATA TYPE RELATION DESCRIPTION (FROM BALSAM GUIDELINE)
Activity_of_object
Text? Activity of objects (mostly ships), e.g. trawling, steaming, working, etc. Activity codes in a relational table: 1 inactive 2 anchoring 3 steaming 4 angling-all fishing activities 5 net shooting-all fishing activities 6 towing-all fishing activities 7 hauling-all fishing activities 8 sorting-all fishing activities 9 discarding-all fishing activities 10 net at surface-all fishing activities 11 cleaning-all fishing activities 12 handles set net-all fishing activities 20 wind turbine operating-wind turbine 21 wind turbine out of action-wind turbine 22 work boat operating-Excavators / suction vessels, wind farms, construction platforms 23 flying-planes / helicopters
Direction_of_travel
Number? Travel direction of object (degrees)
Direction_of_travel_type
Number? The way how travel directions of object is recorded: A absolute, R relative (to direction of platform)
Direction_obs_plattform
Number? Travel direction of the observation platform (needed for calculating the absolute travel direction of birds if recorded relative to the direction of the platform)
Ship_followers Text Description field where the number and species of birds following ships (mostly fishing vessels) can be given
Notes Text Notes related to object
58 | JWGBIRD REPORT 2016
3 Implementation of the EU Plan of Action on Seabird Bycatch
Terms of Reference b): Review the implementation of the EU Plan of Action on Sea-bird Bycatch, potentially in collaboration with WKBYCS.
i ) Carry out a gap analysis of measures that have already been implement-ed in order to identify what more could/should be done. Identify further mitigation measures appropriate to the bycatch-relevant fishing métiers in the OSPAR and HELCOM areas.
ii ) Assess ways of improving the limited knowledge of the extent of seabird bycatch in the NE Atlantic longlining fleets.
3.1 Introduction
In November 2012, the Commission published an ‘Action Plan for reducing inci-dental catches of seabirds in fishing gears’ (European Commission, 2012). The objec-tive of the Action Plan (hereafter EU-POA) is ‘to minimise and, where possible, eliminate the incidental catches of seabirds, with priority action focussing on individuals belonging to at least 49 threatened seabird populations by EU vessels operating in EU and non-EU waters, as well as by non-EU vessels operating in EU waters. For other species where the populations are stable but bycatch are[sic] at levels that are cause for concern, bycatch should be reduced as a first step towards elimination’.
This objective is in line with the objectives of the Common Fisheries Policy as re-formed in 2013 (Regulation (EU) No 1380/2013), in particular Article 2(3) committing to ‘implement the ecosystem-based approach to fisheries management so as to ensure that neg-ative impacts of fishing activities on the marine ecosystem are minimised...’.
The origins of the EU-POA lie in the FAO International Plan of Action for Reducing Incidental Catch of Seabirds in Longline Fisheries (IPOA-Seabirds) adopted by the FAO Committee on Fisheries (FAO-COFI, Rome, 1999), which encouraged member countries to assess their own seabird bycatch problem and to develop and implement a National Plan of Action (NPOA-Seabirds), based on the IPOA-Seabirds recommen-dations. In 2007, FAO-COFI identified that best practice technical guidelines could assist countries in implementing the IPOA-Seabirds for not just longline, but also oth-er relevant fisheries. In 2009, following a FAO Expert Consultation (Bergen, Norway) the FAO therefore published ‘Best practices to reduce incidental catches of seabirds in capture fisheries’. Based on these initiatives, the Commission sought to develop a ‘Community Plan of Action’, culminating in the EU-POA in 2012.
The EU-POA addresses all fisheries and gears relevant to seabird bycatch and in-cludes both binding and non-binding measures; there are 30 separate actions address-ing five specific objectives:
1 ) identifying and addressing weaknesses and incoherencies in current man-agement measures (seven actions);
2 ) data collection to establish the extent of seabird bycatch (six actions); 3 ) implementation of mitigation measures (eight actions); 4 ) providing education and training to fishermen in the use and benefit of
mitigation measures and identification of seabirds for reporting purposes (five actions); and
5 ) instigating research into effective mitigation measures (four actions).
JWGBIRD REPORT 2016 | 59
The essentially voluntary nature of the EU-POA has been strengthened by some Member States considering the need to act on it by establishing measures and moni-toring towards achieving Good Environmental Status under the Marine Strategy Framework Directive (2008/56/EC). Hitherto, however, there has been no specific legal requirement for Member States to require their vessels to (a) take measures to reduce the incidental catch of seabirds in fishing gears; (b) collect and report data on incidental catch of seabirds.
This is likely to change in future with the ongoing revision of, respectively, the Tech-nical Measures Regulation (currently made up of several regulations) and the Data Collection Framework (EC No 199/2008). In both cases the Commission’s current proposals would, if adopted into law, go some way to remedying these deficits, mak-ing it a requirement to take steps to, respectively, avoid bycatch and to monitor its occurrence. The Commission’s Technical Measures Regulation proposal (COM (2016) 134 final) is explicit in requiring provisions for all sea basins to include ‘measures to protect sensitive species (e.g. marine mammals, reptiles and seabirds) and habitats (e.g. coldwater corals) including those listed in the Habitats and Birds Directives;’ The wording of the EU-POA’s overall aim is closely echoed by the Commission proposal’s Article 3.2(b), namely ‘ensure that bycatches of marine species listed under Directives 92/43/EEC and 2009/147/EC and other sensitive species that result from fishing are minimised and where possible eliminated such that they do not represent a threat to the conservation status of these species;’ It should be noted that calling for mitigation measures predicated on proving that a bycatch level actually represents ‘a threat to the conservation status of a spe-cies’ sets in practice a very high threshold for evidence of harm, and the precaution-ary approach also needs to be invoked here.
The Technical Measures Regulation, once adopted, sets default regional sea measures. In order to set measures differing from 'default', the relevant regional Member States decide these regionally in the context of their multiannual plans (MAPs) for fisheries, and then recommend them to the European Commission to be adopted as a delegated act. The first regional MAP in EU waters, namely the Baltic MAP (European Commission, 2016) agreed in March 2016, specifies the inclusion of measures to minimise the negative impact of fisheries on the ecosystem, which im-plicitly includes minimising seabird bycatch. Comparable language is being sought by conservationists in the North Sea MAP, currently under negotiation.
With the prospect of the EU adopting revised regulations on technical measures and data collection in 2017, the emergence of multi-annual plans for regional seas, and with the additional driver the Marine Strategy Framework Directive, it is therefore timely for JWGBIRD to review the implementation of the EU-POA.
ToR b builds in particular on the work undertaken by WKBYCS 2013 (ICES CM 2013/ACOM:77) to address three issues that DG MARE requested ICES to consider:
i ) to review and update current seabird bycatch data and identify fisheries where appropriate follow-up monitoring to establish bycatch levels would be desirable;
ii ) to explore the criteria and/or metrics that could be used to define a sea-bird bycatch problem; and
iii ) to establish a standard data reporting format for recording seabird by-catch and develop a database of seabird bycatch data in European fisher-ies, similar to the database developed by ICES WKBYCS for marine mammal bycatch.
60 | JWGBIRD REPORT 2016
The request to ICES in 2013 arose because the European Council did not adopt formal conclusions on the EU-POA when the issue was on its April 2013 agenda. Rather the Council called for more evidence to demonstrate the impact on seabirds as a result of incidental capture by fishing gears. WKBYCS 2013 report was therefore an assess-ment of the scale of the problem and how Member States could and should establish the need for action.
JWGBIRD decided to expand the scope of ToR b to consider also implementation of measures in Nordic fisheries which are not accountable to the EU-POA or the associ-ated legislative framework described above. This was considered a useful extension, firstly because NE Atlantic seabird populations and the threats they face range be-yond EU waters, secondly because some EU vessels fish in Norwegian waters (as rec-ognised in EU-POA Annex I, Specific Objective 1), and thirdly because some Nordic countries have implemented innovative measures which can inform how the EU, col-lectively and at Member State level, might tackle seabird bycatch in their own waters. This report therefore includes two case studies from, respectively, Norway and Ice-land.
3.2 Collaboration with WGBYC
WGBYC Report 2016 (ICES CM 2016/ACOM:27; see Annex 6) recommended that JWGBIRD coordinate with WGBYC on matters related to bycatch risk assessment (as it relates to OSPAR indicator B.1) and mitigation of seabird bycatch. In correspond-ence, JWGBIRD has proposed to the WGBYC chair cross-participation of experts in group meetings. WGBYC chair welcomed this proposal and invited a JWGBIRD member to attend WGBYC 2017 meeting (June 12–15, Woods Hole, USA). JWGBIRD will ensure participation of one of its members at this meeting.
3.3 ToR b i) Gap analysis of measures already implemented to identify further action
The approach to this analysis was to populate a spreadsheet (Tables 3.1–3.5) for each of the five Specific Objectives in EU-POA Annex 1, listing all 30 actions and to collect information on the implementation of these by the ‘Responsible Parties’ identified in Annex 1. These include the Regional Fisheries Management Organisations (RFMOs, namely NEAFC in the context of the NE Atlantic), the Advisory Councils (ACs, known as ‘RACs’ at the time the EU-POA was produced) and Scientific, Technical and Economic Committee for Fisheries (STECF) but no information was provid-ed/available on any implementation of the EU-POA by these three parties.
Instead, the focus falls mainly on the Member States and NGOs (the latter being in-cluded as a ‘Responsible Party’ in the EU-POA Annex 1) in the OSPAR and HEL-COM areas. Other EU marine regions were not considered, in keeping with the restricted scope of ToR b. As noted in the introduction (above), some information was gathered for Norway and Iceland but is provided elsewhere in this report and not included in the EU-POA table.
The Tables include the Commission’s timetable setting indicative timelines for im-plementation of the actions but no attention was given to this by JWGBIRD, except to note that, with rare exceptions, confined mainly to the actions taken by the Commis-sion itself and ICES, these deadlines have not been met and, in the majority of cases, missed badly. Paragraph 3.5 of the EU-POA specifies the intention that ‘Member States should report biennially to the Commission on the level of seabird bycatch observed by fishery and gear type, the implementation of any mitigation measures and the effectiveness of
JWGBIRD REPORT 2016 | 61
these mitigation measures. The Commission working with the relevant scientific body will develop a standard reporting format to facilitate Member States to submit information to the Commission and which could also be used to facilitate data access to the wider public.’
To the best of JWGBIRD’s knowledge, ‘biennial reporting’ by Member States did not follow the communication of the EU-POA in November 2012. To do so would at least have needed to be facilitated by the standard reporting format requested by the Commission and provided by WKBYCS 2013 but JWGBIRD has no knowledge of the extent to which this format has since become part of the monitoring procedures of Member States. In any case, apart from how Member States choose to transpose the Marine Strategy Framework Directive, there has, since 2012, been no legal obligation on Member States to report on the level of seabird bycatch and the implementation of mitigation measures, and the EU-POA does not plug that legal gap. As noted in the Introduction (above), the ongoing revision of the Data Collection and the Technical Measures regulations, along with continuation of measures to achieve Good Envi-ronmental Status (especially Descriptor 1 in the context of seabirds) under the MSFD, may well remedy that compliance gap and oblige Member States to implement these actions that the EU-POA is currently only able to encourage them to undertake. The role of the DCF (Data Collection Framework) in improving knowledge of the extent of seabird bycatch is considered further under ToR b ii) (below).
3.3.1 Lessons from gap analysis of measures already implemented
3.3.2 Methodology
JWGBIRD originally considered to score the progress of Member States by a traffic light system (no/some/sufficient implementation against each of the Annex 1 actions) but the data submitted and assembled were much too few, patchy and variable in extent of detail to do this and it was therefore considered invidious to score perfor-mance. What follows, therefore, is essentially a qualitative rather than a quantitative assessment. Much more data-gathering, and consistency in levels of input, would be needed to obtain a comprehensive enough overview to enable comparison between Member States of their implementation of the EU-POA.
It is important to emphasise that an empty cell does not necessarily mean that no ac-tion has been taken by a Member State or other Responsible Party but rather that none was known to JWGBIRD or could be sourced from others in time to conduct this assessment. Also, given that the EU-POA contains 30 actions, some are more im-portant than others and this weighting needs to be kept in mind when evaluating the significance of blank cells.
For, example, JWGBIRD had no information for Ireland, and little or none was avail-able for some of the Baltic countries, especially Finland, Estonia, Latvia and Sweden. Some feedback on Estonia (Markus Vetemaa, pers comm) appears to conform with what we understand for the other three, namely that the bycatch risk from gillnets to long-tailed duck (the most impacted seaduck species) has declined in recent years, apparently due to the increasing population of grey seals (Halichoerus grypus) which destroy nets and fish catch. This has made gillnetting locally unprofitable, resulting in reduced fishing effort.
Bycatch is also not considered a significant problem in the Netherlands or Belgium although the main focus in these two countries has been on monitoring gillnet by-catch of harbour porpoise (Phocoena phocoena). In the Netherlands, there have been some exercises on paper, to evaluate the possibility of bycatch in a new marine Natu-
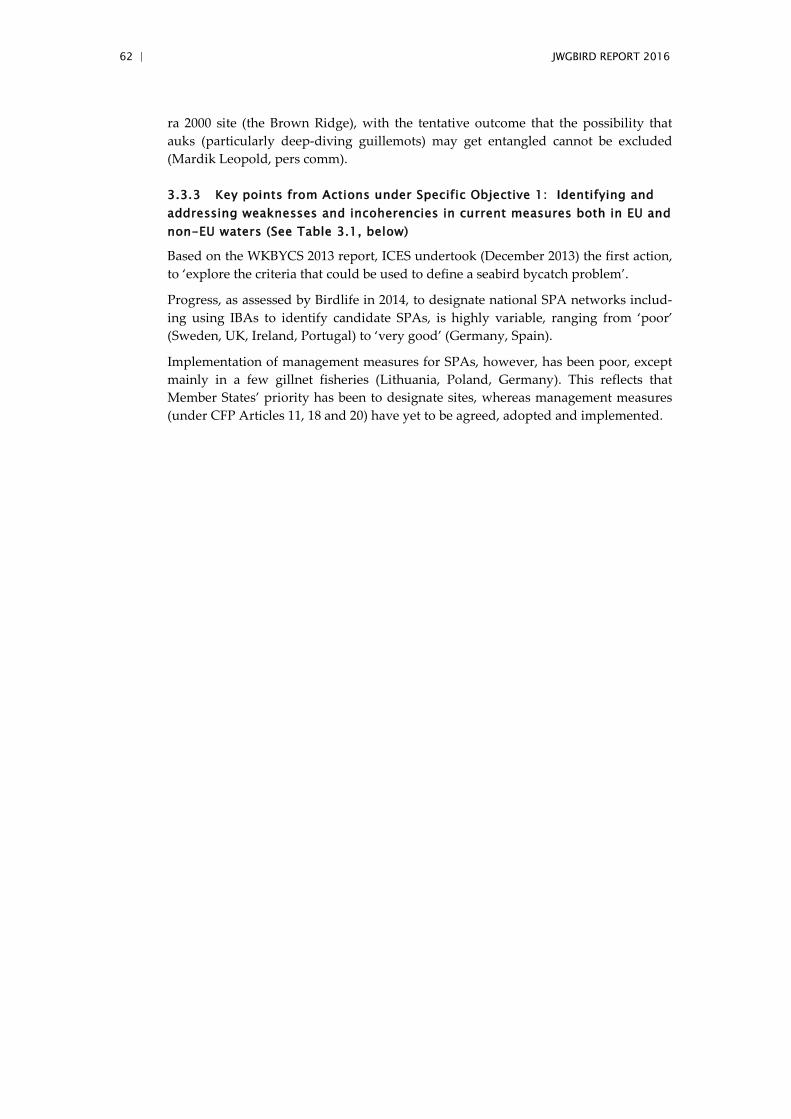
62 | JWGBIRD REPORT 2016
ra 2000 site (the Brown Ridge), with the tentative outcome that the possibility that auks (particularly deep-diving guillemots) may get entangled cannot be excluded (Mardik Leopold, pers comm).
3.3.3 Key points from Actions under Specific Objective 1: Identifying and addressing weaknesses and incoherencies in current measures both in EU and non-EU waters (See Table 3.1, below)
Based on the WKBYCS 2013 report, ICES undertook (December 2013) the first action, to ‘explore the criteria that could be used to define a seabird bycatch problem’.
Progress, as assessed by Birdlife in 2014, to designate national SPA networks includ-ing using IBAs to identify candidate SPAs, is highly variable, ranging from ‘poor’ (Sweden, UK, Ireland, Portugal) to ‘very good’ (Germany, Spain).
Implementation of management measures for SPAs, however, has been poor, except mainly in a few gillnet fisheries (Lithuania, Poland, Germany). This reflects that Member States’ priority has been to designate sites, whereas management measures (under CFP Articles 11, 18 and 20) have yet to be agreed, adopted and implemented.
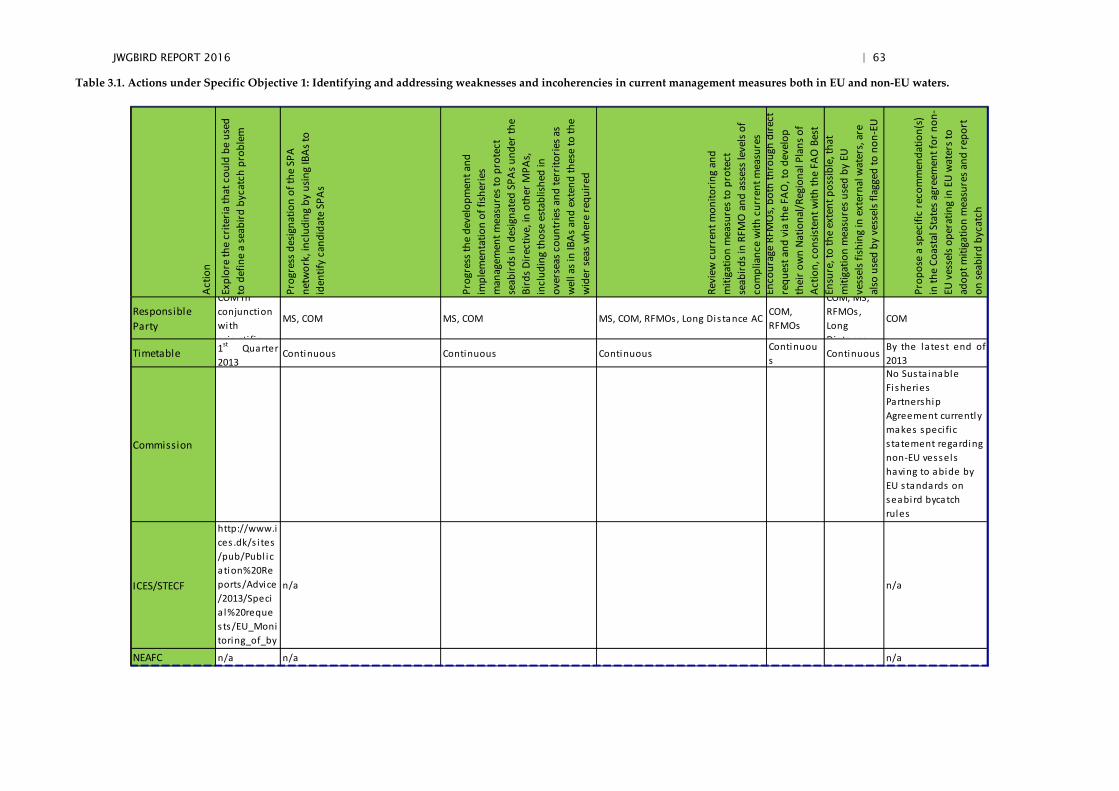
JWGBIRD REPORT 2016 | 63
Table 3.1. Actions under Specific Objective 1: Identifying and addressing weaknesses and incoherencies in current management measures both in EU and non-EU waters.
Actio
n
Expl
ore
the
crite
ria th
at c
ould
be
used
to
def
ine
a se
abird
byc
atch
pro
blem
Prog
ress
des
igna
tion
of th
e SP
A ne
twor
k, in
clud
ing
by u
sing
IBAs
to
iden
tify
cand
idat
e SP
As
Prog
ress
the
deve
lopm
ent a
nd
impl
emen
tatio
n of
fish
erie
s m
anag
emen
t mea
sure
s to
prot
ect
seab
irds i
n de
signa
ted
SPAs
und
er th
e Bi
rds D
irect
ive,
in o
ther
MPA
s, in
clud
ing
thos
e es
tabl
ished
in
over
seas
cou
ntrie
s and
terr
itorie
s as
wel
l as i
n IB
As a
nd e
xten
d th
ese
to th
e w
ider
seas
whe
re re
quire
d
Revi
ew c
urre
nt m
onito
ring
and
miti
gatio
n m
easu
res t
o pr
otec
t se
abird
s in
RFM
O a
nd a
sses
s lev
els o
f co
mpl
ianc
e w
ith c
urre
nt m
easu
res
Enco
urag
e RF
MO
s, bo
th th
roug
h di
rect
re
ques
t and
via
the
FAO
, to
deve
lop
thei
r ow
n Na
tiona
l/Reg
iona
l Pla
ns o
f Ac
tion,
con
siste
nt w
ith th
e FA
O B
est
Ensu
re, t
o th
e ex
tent
pos
sible
, tha
t m
itiga
tion
mea
sure
s use
d by
EU
vess
els f
ishin
g in
ext
erna
l wat
ers,
are
also
use
d by
ves
sels
flagg
ed to
non
-EU
Prop
ose
a sp
ecifi
c re
com
men
datio
n(s)
in
the
Coas
tal S
tate
s agr
eem
ent f
or n
on-
EU v
esse
ls op
erat
ing
in E
U w
ater
s to
adop
t miti
gatio
n m
easu
res a
nd re
port
on
seab
ird b
ycat
ch
Responsible Party
COM in conjunction with scienti fi c
MS, COM MS, COM MS, COM, RFMOs, Long Dis tance ACCOM, RFMOs
COM, MS, RFMOs, Long Dis tance
COM
Timetable 1st Quarter2013
Continuous Continuous ContinuousContinuous
ContinuousBy the latest end of2013
Commission
No Susta inable Fisheries Partnership Agreement currently makes speci fic s tatement regarding non-EU vessels having to abide by EU s tandards on seabird bycatch rules
ICES/STECF
http://www.ices .dk/s i tes/pub/Publ ication%20Reports/Advice/2013/Specia l%20requests/EU_Monitoring_of_by
n/a n/a
NEAFC n/a n/a n/a
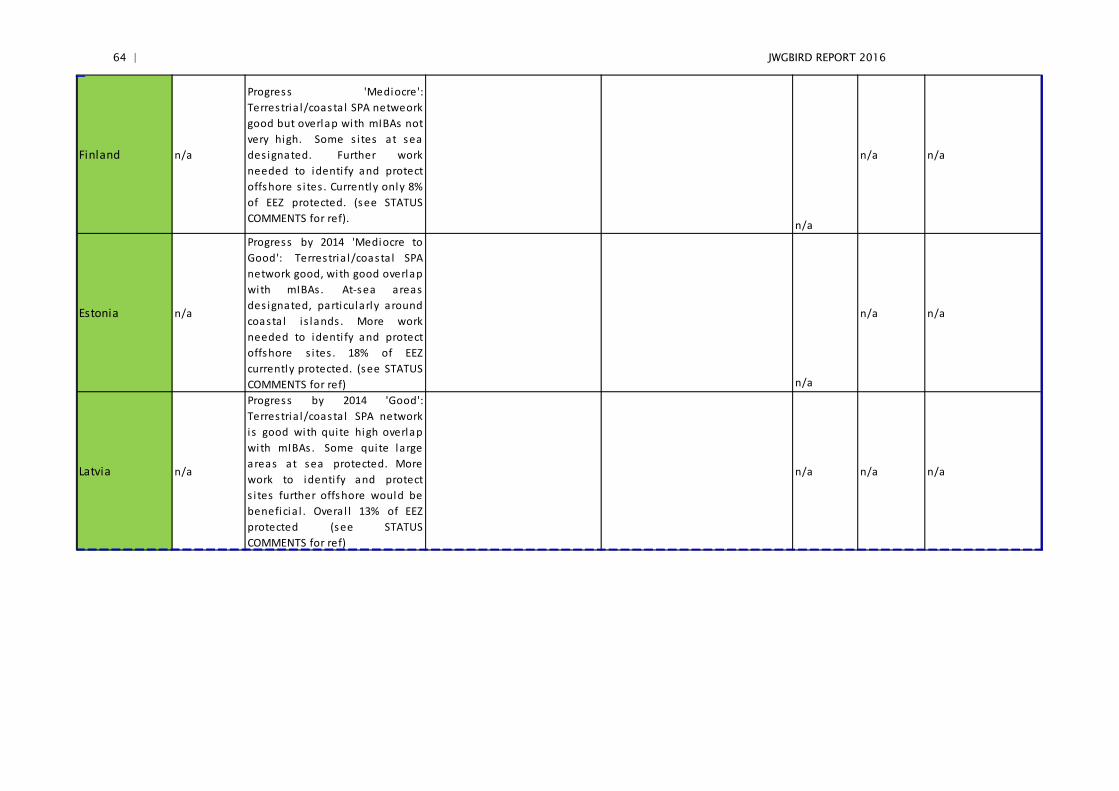
64 | JWGBIRD REPORT 2016
Finland n/a
Progress 'Mediocre':Terrestria l/coasta l SPA netweork good but overlap with mIBAs notvery high. Some s i tes at seades ignated. Further workneeded to identi fy and protectoffshore s i tes . Currently only 8%of EEZ protected. (see STATUSCOMMENTS for ref). n/a
n/a n/a
Estonia n/a
Progress by 2014 'Mediocre toGood': Terrestria l/coasta l SPAnetwork good, with good overlap with mIBAs . At-sea areasdes ignated, particularly aroundcoasta l i s lands . More workneeded to identi fy and protectoffshore s i tes . 18% of EEZcurrently protected. (see STATUSCOMMENTS for ref) n/a
n/a n/a
Latvia n/a
Progress by 2014 'Good':Terrestria l/coasta l SPA networkis good with quite high overlapwith mIBAs . Some quite largeareas at sea protected. Morework to identi fy and protects i tes further offshore would bebeneficia l . Overa l l 13% of EEZprotected (see STATUSCOMMENTS for ref)
n/a n/a n/a
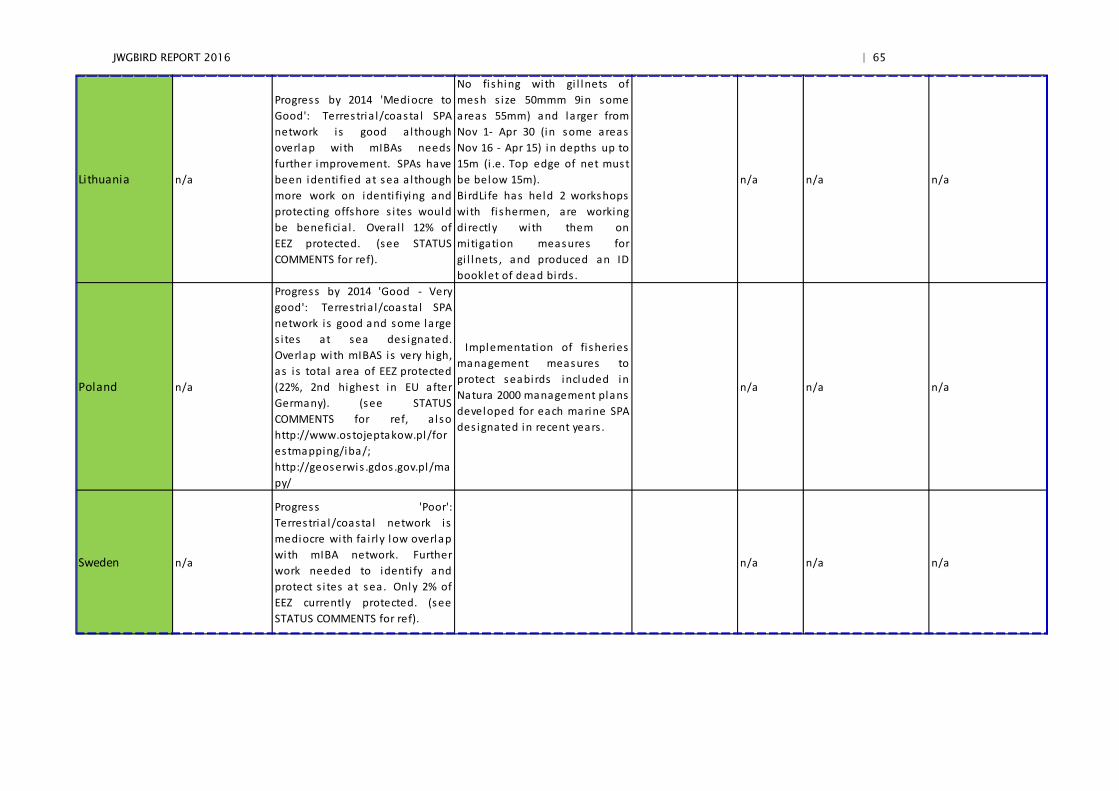
JWGBIRD REPORT 2016 | 65
Lithuania n/a
Progress by 2014 'Mediocre toGood': Terrestria l/coasta l SPAnetwork is good althoughoverlap with mIBAs needsfurther improvement. SPAs havebeen identi fied at sea al thoughmore work on identi fiying andprotecting offshore s i tes wouldbe beneficia l . Overa l l 12% ofEEZ protected. (see STATUSCOMMENTS for ref).
No fishing with gi l lnets ofmesh s ize 50mmm 9in someareas 55mm) and larger fromNov 1- Apr 30 (in some areasNov 16 - Apr 15) in depths up to15m (i .e. Top edge of net mustbe below 15m).Bi rdLi fe has held 2 workshopswith fi shermen, are workingdirectly with them onmitigation measures forgi l lnets , and produced an IDbooklet of dead bi rds .
n/a n/a n/a
Poland n/a
Progress by 2014 'Good - Verygood': Terrestria l/coasta l SPAnetwork is good and some larges i tes at sea des ignated.Overlap with mIBAS is very high,as is tota l area of EEZ protected(22%, 2nd highest in EU afterGermany). (see STATUSCOMMENTS for ref, a lsohttp://www.ostojeptakow.pl/forestmapping/iba/; http://geoserwis .gdos .gov.pl/mapy/
Implementation of fi sheriesmanagement measures toprotect seabirds included inNatura 2000 management plans developed for each marine SPAdes ignated in recent years .
n/a n/a n/a
Sweden n/a
Progress 'Poor':Terrestria l/coasta l network ismediocre with fa i rly low overlapwith mIBA network. Furtherwork needed to identi fy andprotect s i tes at sea. Only 2% ofEEZ currently protected. (seeSTATUS COMMENTS for ref).
n/a n/a n/a
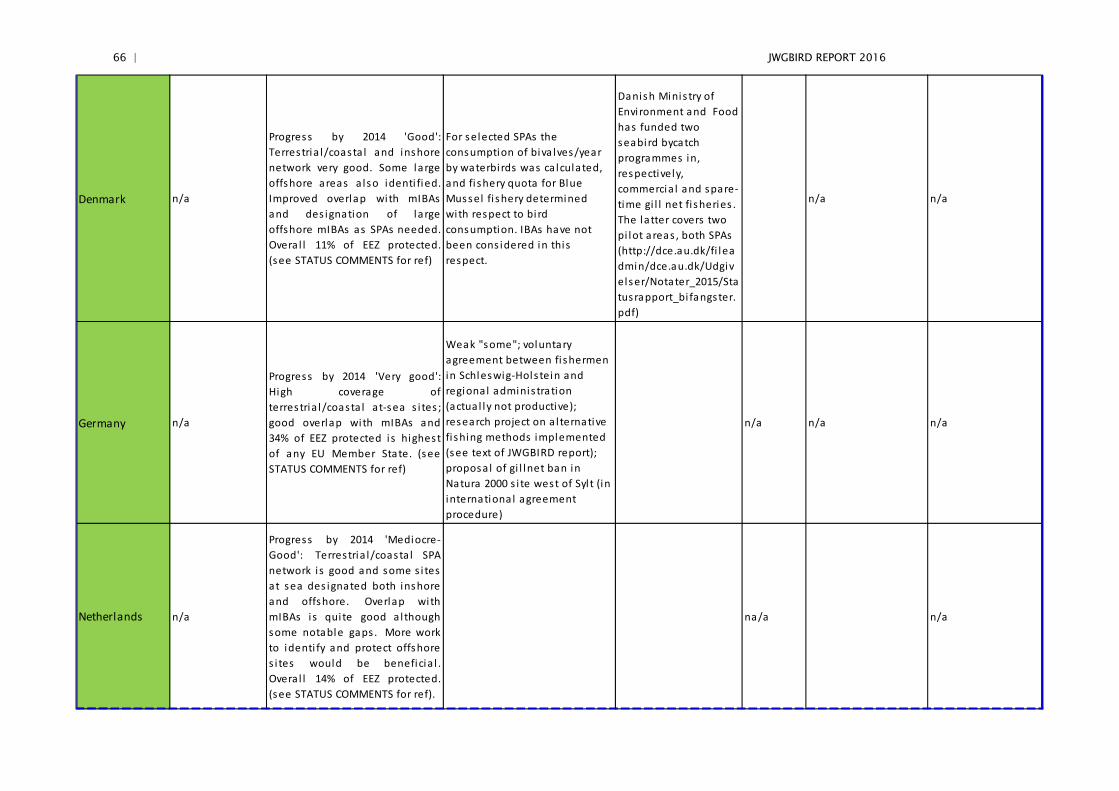
66 | JWGBIRD REPORT 2016
Denmark n/a
Progress by 2014 'Good':Terrestria l/coasta l and inshorenetwork very good. Some largeoffshore areas a lso identi fied.Improved overlap with mIBAsand des ignation of largeoffshore mIBAs as SPAs needed.Overa l l 11% of EEZ protected.(see STATUS COMMENTS for ref)
For selected SPAs the consumption of biva lves/year by waterbirds was ca lculated, and fi shery quota for Blue Mussel fi shery determined with respect to bi rd consumption. IBAs have not been cons idered in this respect.
Danish Minis try of Envi ronment and Food has funded two seabird bycatch programmes in, respectively, commercia l and spare-time gi l l net fi sheries . The latter covers two pi lot areas , both SPAs (http://dce.au.dk/fi leadmin/dce.au.dk/Udgivelser/Notater_2015/Statusrapport_bi fangster.pdf)
n/a n/a
Germany n/a
Progress by 2014 'Very good':High coverage ofterrestria l/coasta l at-sea s i tes ;good overlap with mIBAs and34% of EEZ protected is highestof any EU Member State. (seeSTATUS COMMENTS for ref)
Weak "some"; voluntary agreement between fi shermen in Schleswig-Hols tein and regional adminis tration (actua l ly not productive); research project on a l ternative fi shing methods implemented (see text of JWGBIRD report); proposa l of gi l lnet ban in Natura 2000 s i te west of Syl t (in international agreement procedure)
n/a n/a n/a
Netherlands n/a
Progress by 2014 'Mediocre-Good': Terrestria l/coasta l SPAnetwork is good and some s i tesat sea des ignated both inshoreand offshore. Overlap withmIBAs is qui te good althoughsome notable gaps . More workto identi fy and protect offshores i tes would be beneficia l .Overa l l 14% of EEZ protected.(see STATUS COMMENTS for ref).
na/a n/a
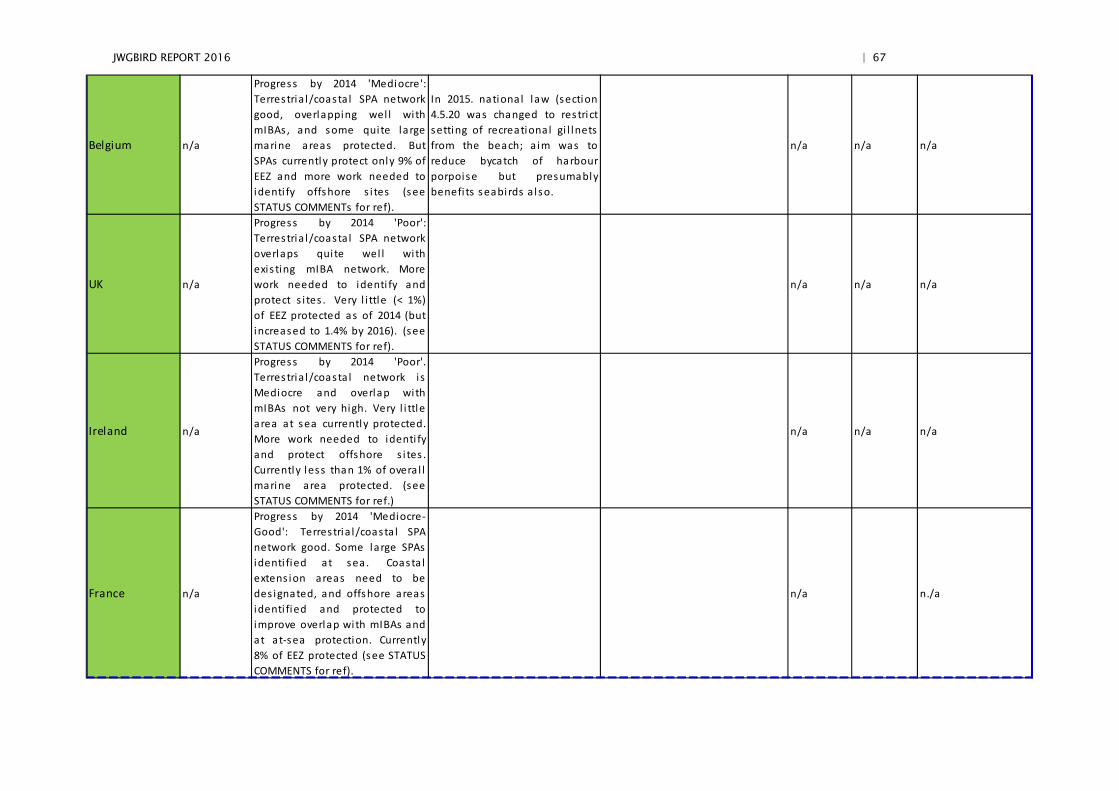
JWGBIRD REPORT 2016 | 67
Belgium n/a
Progress by 2014 'Mediocre':Terrestria l/coasta l SPA networkgood, overlapping wel l withmIBAs , and some quite largemarine areas protected. ButSPAs currently protect only 9% ofEEZ and more work needed toidenti fy offshore s i tes (seeSTATUS COMMENTs for ref).
In 2015. national law (section4.5.20 was changed to restrictsetting of recreational gi l lnetsfrom the beach; a im was toreduce bycatch of harbourporpoise but presumablybenefi ts seabirds a lso.
n/a n/a n/a
UK n/a
Progress by 2014 'Poor':Terrestria l/coasta l SPA networkoverlaps quite wel l withexis ting mIBA network. Morework needed to identi fy andprotect s i tes . Very l i ttle (< 1%)of EEZ protected as of 2014 (butincreased to 1.4% by 2016). (seeSTATUS COMMENTS for ref).
n/a n/a n/a
Ireland n/a
Progress by 2014 'Poor'.Terrestria l/coasta l network isMediocre and overlap withmIBAs not very high. Very l i ttlearea at sea currently protected.More work needed to identi fyand protect offshore s i tes .Currently less than 1% of overa l lmarine area protected. (seeSTATUS COMMENTS for ref.)
n/a n/a n/a
France n/a
Progress by 2014 'Mediocre-Good': Terrestria l/coasta l SPAnetwork good. Some large SPAsidenti fied at sea. Coasta lextens ion areas need to bedes ignated, and offshore areasidenti fied and protected toimprove overlap with mIBAs andat at-sea protection. Currently8% of EEZ protected (see STATUSCOMMENTS for ref).
n/a n./a
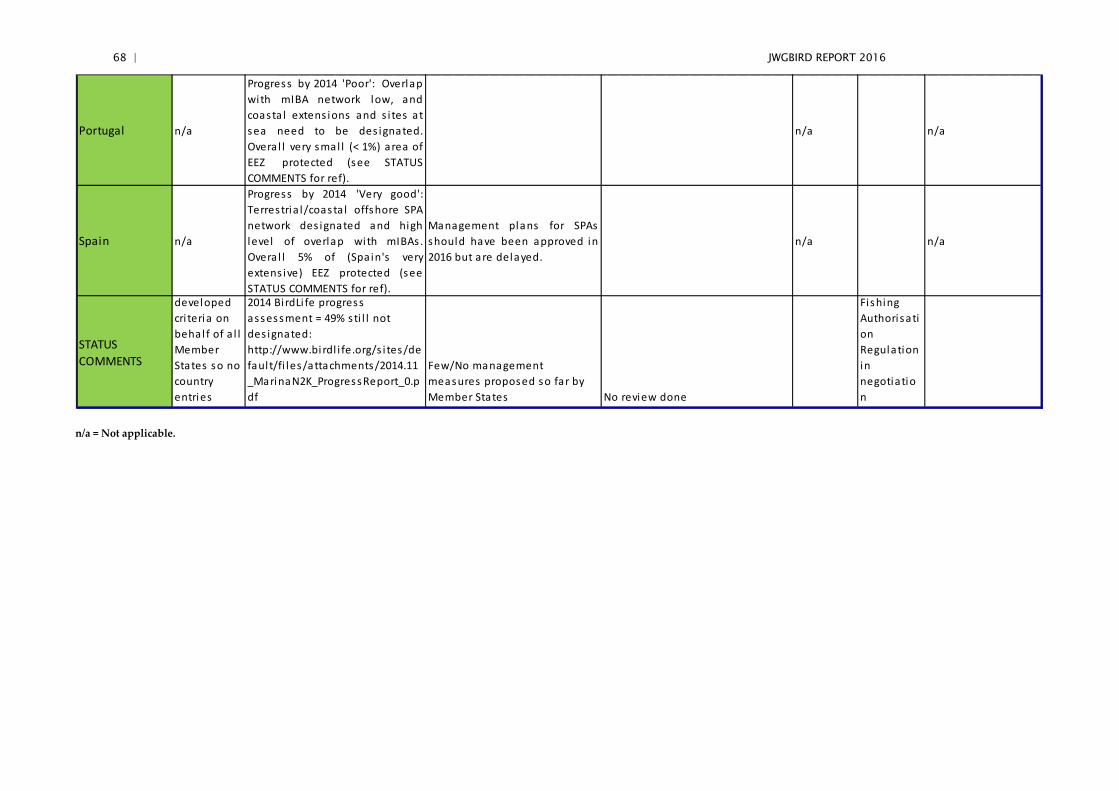
68 | JWGBIRD REPORT 2016
Portugal n/a
Progress by 2014 'Poor': Overlapwith mIBA network low, andcoasta l extens ions and s i tes atsea need to be des ignated.Overa l l very smal l (< 1%) area ofEEZ protected (see STATUSCOMMENTS for ref).
n/a n/a
Spain n/a
Progress by 2014 'Very good':Terrestria l/coasta l offshore SPAnetwork des ignated and highlevel of overlap with mIBAs .Overa l l 5% of (Spain's veryextens ive) EEZ protected (seeSTATUS COMMENTS for ref).
Management plans for SPAsshould have been approved in2016 but are delayed.
n/a n/a
STATUS COMMENTS
developed cri teria on behal f of a l l Member States so no country entries
2014 Bi rdLi fe progress assessment = 49% sti l l not des ignated: http://www.birdl i fe.org/s i tes/defaul t/fi les/attachments/2014.11_MarinaN2K_ProgressReport_0.pdf
Few/No management measures proposed so far by Member States No review done
Fishing Authorisation Regulation in negotiation
n/a = Not applicable.
JWGBIRD REPORT 2016 | 69
3.3.4 Key points from Actions under Specific Objective 2: Collecting data critical to establishing the extent of seabird bycatch, particularly in fisher-ies/areas in EU and non-EU waters where the information is limited, only an-ecdotal and/or not available (See Table 3.2, below)
The UK has undertaken a GIS-based spatial and temporal risk assessment of seabirds to bycatch from relevant fisheries to identify ‘hotspots’ where management measures may be needed (see case study, below, for more detail). This adds to the existing as-sessment (Sonntag et al., 2012) of the conflict potential and vulnerability to bycatch of birds in gillnets in the southern Baltic.
Table 3.2 shows that Poland has also taken a proactive and systematic approach to monitoring seabird bycatch, fishing effort and implementing management measures for static gears. Similarly, Denmark has initiated a project to assess the magnitude of seabird bycatch in gillnet fisheries using Remote Electronic Monitoring (see Section 3.3.7, below, for details).
Clarification is needed on the status and use of the standard reporting format and seabird bycatch database (ICES).
Regarding the action ‘Considering the feasibility of incorporating the monitoring of seabirds under the new DCF’, steps to effect such incorporation are well advanced (see Introduction, above, and ToR b ii), below).
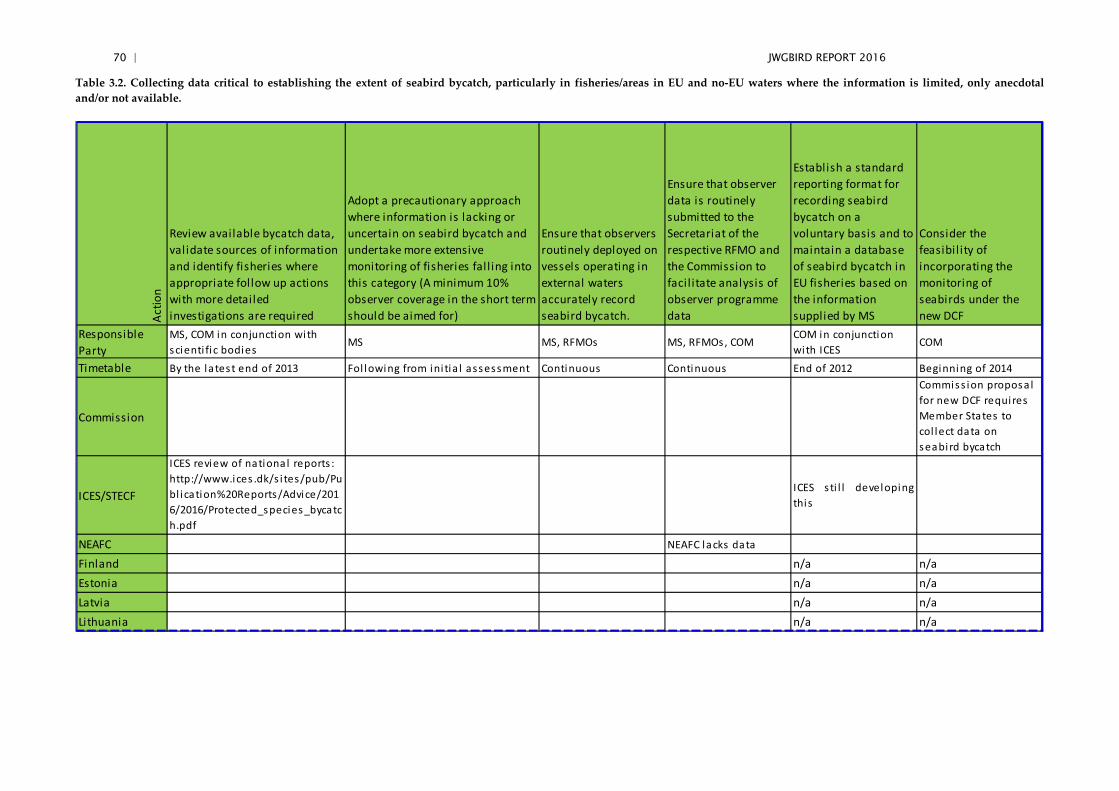
70 | JWGBIRD REPORT 2016
Table 3.2. Collecting data critical to establishing the extent of seabird bycatch, particularly in fisheries/areas in EU and no-EU waters where the information is limited, only anecdotal and/or not available.
Actio
n
Review available bycatch data, validate sources of information and identify fisheries where appropriate follow up actions with more detailed investigations are required
Adopt a precautionary approach where information is lacking or uncertain on seabird bycatch and undertake more extensive monitoring of fisheries fall ing into this category (A minimum 10% observer coverage in the short term should be aimed for)
Ensure that observers routinely deployed on vessels operating in external waters accurately record seabird bycatch.
Ensure that observer data is routinely submitted to the Secretariat of the respective RFMO and the Commission to facil itate analysis of observer programme data
Establish a standard reporting format for recording seabird bycatch on a voluntary basis and to maintain a database of seabird bycatch in EU fisheries based on the information supplied by MS
Consider the feasibil ity of incorporating the monitoring of seabirds under the new DCF
Responsible Party
MS, COM in conjunction with scienti fi c bodies
MS MS, RFMOs MS, RFMOs, COMCOM in conjunction with ICES
COM
Timetable By the latest end of 2013 Fol lowing from ini tia l assessment Continuous Continuous End of 2012 Beginning of 2014
Commission
Commiss ion proposa l for new DCF requires Member States to col lect data on seabird bycatch
ICES/STECF
ICES review of national reports : http://www.ices .dk/s i tes/pub/Publ ication%20Reports/Advice/2016/2016/Protected_species_bycatch.pdf
ICES sti l l developingthis
NEAFC NEAFC lacks data
Finland n/a n/aEstonia n/a n/aLatvia n/a n/aLithuania n/a n/a
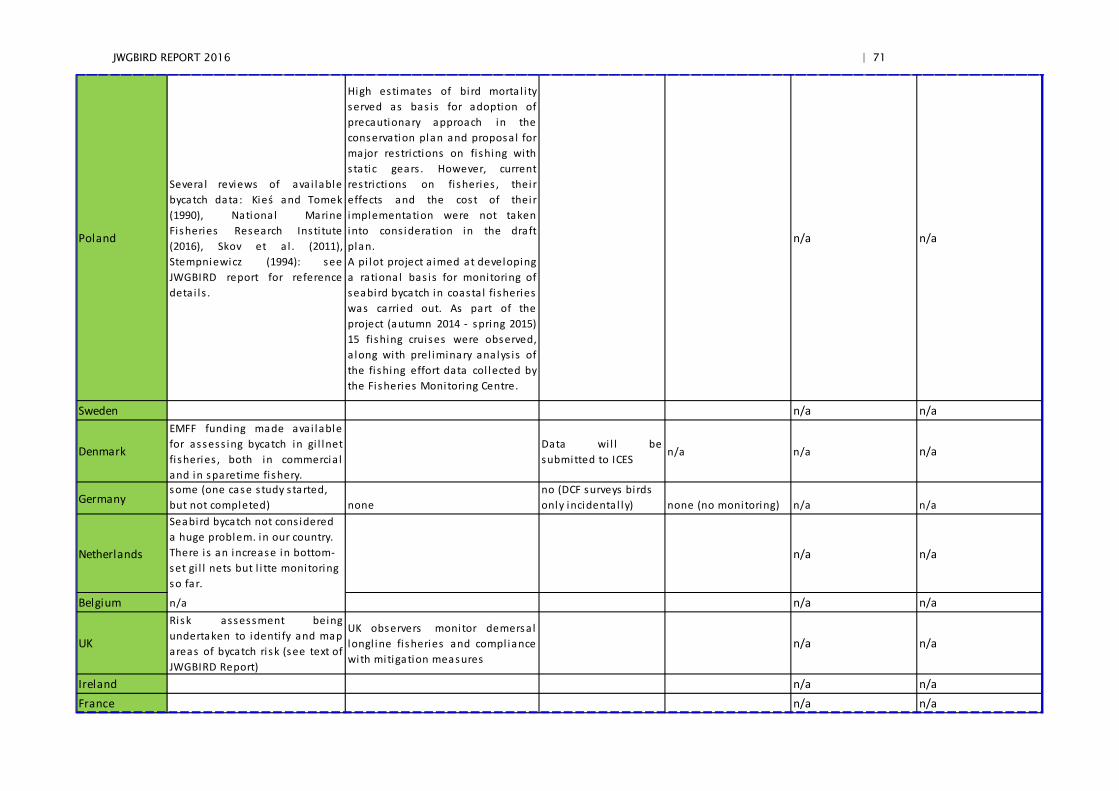
JWGBIRD REPORT 2016 | 71
Poland
Severa l reviews of ava i lablebycatch data: Kieś and Tomek(1990), National MarineFisheries Research Insti tute(2016), Skov et a l . (2011),Stempniewicz (1994): seeJWGBIRD report for referencedeta i l s .
High estimates of bi rd morta l i tyserved as bas is for adoption ofprecautionary approach in theconservation plan and proposa l formajor restrictions on fishing withstatic gears . However, currentrestrictions on fisheries , thei reffects and the cost of theirimplementation were not takeninto cons ideration in the draftplan.A pi lot project a imed at developinga rational bas is for monitoring ofseabird bycatch in coasta l fi sherieswas carried out. As part of theproject (autumn 2014 - spring 2015)15 fishing cruises were observed,a long with prel iminary analys is ofthe fishing effort data col lected bythe Fisheries Monitoring Centre.
n/a n/a
Sweden n/a n/a
Denmark
EMFF funding made avai lablefor assess ing bycatch in gi l lnetfi sheries , both in commercia land in sparetime fi shery.
Data wi l l besubmitted to ICES
n/a n/a n/a
Germanysome (one case s tudy s tarted, but not completed) none
no (DCF surveys bi rds only incidenta l ly) none (no monitoring) n/a n/a
Netherlands
Seabird bycatch not cons idered a huge problem. in our country. There i s an increase in bottom-set gi l l nets but l i tte monitoring so far.
n/a n/a
Belgium n/a n/a n/a
UK
Risk assessment beingundertaken to identi fy and mapareas of bycatch risk (see text ofJWGBIRD Report)
UK observers monitor demersa llongl ine fi sheries and compl iancewith mitigation measures
n/a n/a
Ireland n/a n/aFrance n/a n/a
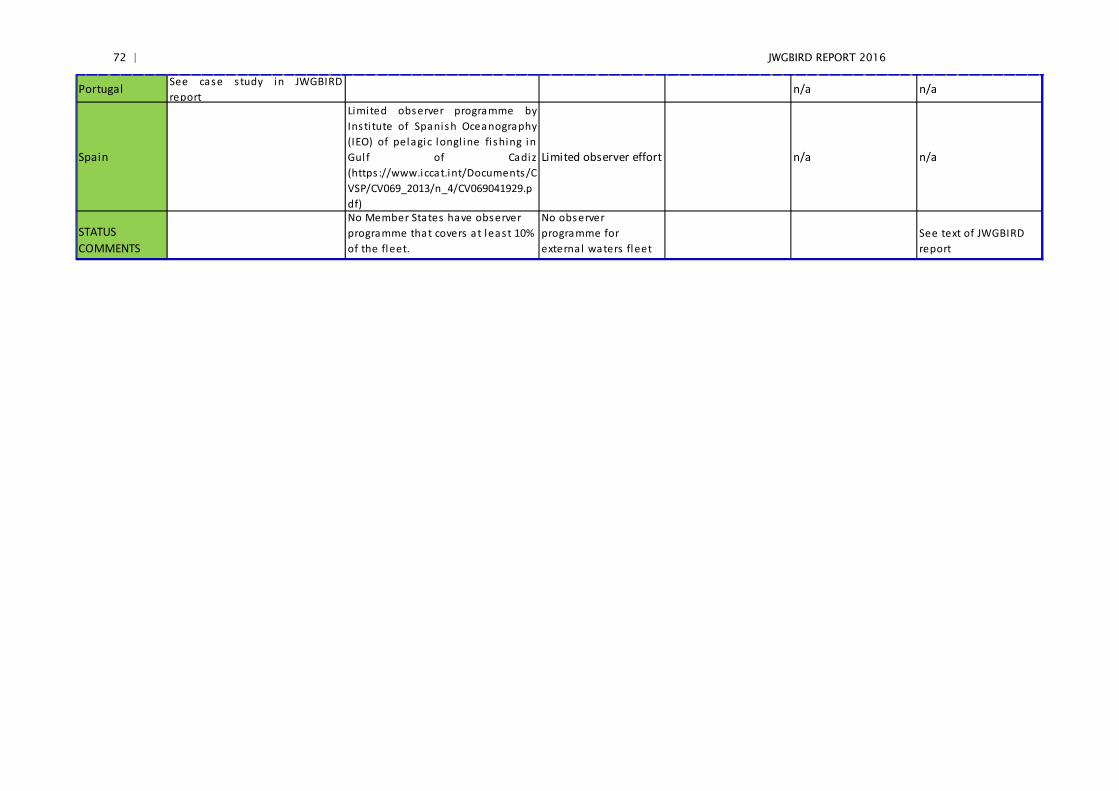
72 | JWGBIRD REPORT 2016
Portugal See case study in JWGBIRDreport
n/a n/a
Spain
Limited observer programme byInsti tute of Spanish Oceanography(IEO) of pelagic longl ine fi shing inGul f of Cadiz(https ://www.iccat.int/Documents/CVSP/CV069_2013/n_4/CV069041929.pdf)
Limited observer effort n/a n/a
STATUS COMMENTS
No Member States have observer programme that covers at least 10% of the fleet.
No observer programme for external waters fleet
See text of JWGBIRD report
JWGBIRD REPORT 2016 | 73
3.3.5 Key points from Actions under Specific Objective 3: Implementation of mitigation measures where information indicates occurrence of seabird by-catch (See Table 3.3, below)
Table 3.3 shows there has been significant activity by NGOs, in particular BirdLife International partners, engaging with fishermen) in several Member States to assist in assessing seabird-fishery conflicts, raise awareness and help develop tailored solu-tions for mitigating bycatch in particular metiers (mostly gillnets in the Baltic and longlines in Iberian waters) and fleets. Some of this BirdLife activity is detailed in separate case studies (Lithuania, Germany, Portugal), below, to complement the short summary statements in Table 3.3.
The focus in the Baltic and elsewhere on innovation and trials of potential mitigation measures for gillnets and other static gears, whether technical adaptations of the gear itself or testing alternative possible gears (such as traps), is a direct and welcome re-sponse to Action 3 (under Specific Objective 3), highlighting the widely known chal-lenge that mitigation measures for static gears have been poorly researched, developed and implemented compared with those for longline fisheries (see EU-POA page 5). Recent research, as revealed by this JWGBIRD review, has centred mainly on increasing the visibility of the net to birds (visual alerts), with some promising re-sults, though much work needs to be done and the indications are that, as is often the case, what works for one seabird species at risk may not work (or may even be coun-ter-productive) for another. Trials have featured close cooperation with local fisher-men as equal stakeholders and have sought to ensure that reducing seabird bycatch has not been at the expense of also reducing fish catch. This area of mitigation re-search needs the support and commitment of Member States, building on the initia-tives already taken by the NGO sector. Progress in incorporating mitigation measures for seabird bycatch in the European Commission's proposal for revision of the Tech-nical Measures Regulation is a policy highlight, as described in the Introduction (above).
Only two countries (UK and Spain) are working towards a National Plan of Action (NPOA-Seabirds), at least in the case of the UK driven more by the legal requirement of compliance with the MSFD than by the EU-POA per se. JWGBIRD urges other Member States to follow these precedents by developing and implementing their own NPOA-Seabirds aligned with the EU-POA.
Uptake of support from the European Fisheries Fund (EFF) or its successor, the Euro-pean Maritime and Fisheries Fund (EMFF), for mitigation projects has not been well documented and would be a valuable assessment to make (see also the 3rd action under Specific Objective 4).
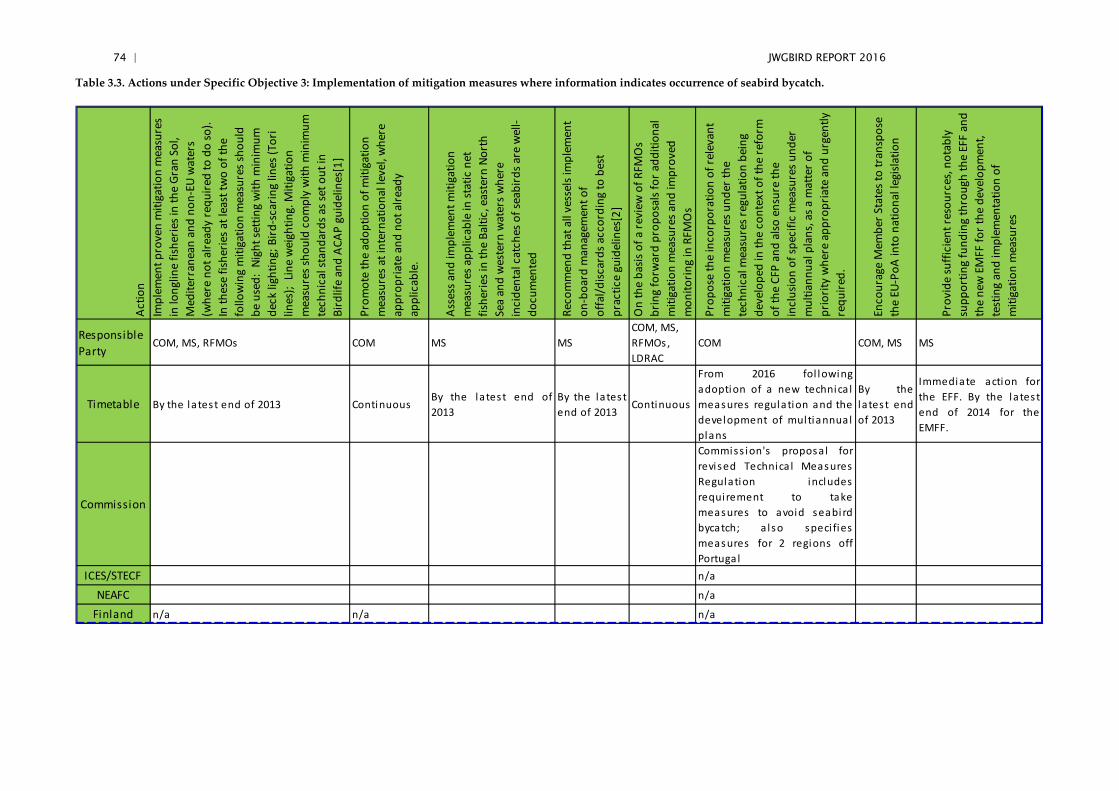
74 | JWGBIRD REPORT 2016
Table 3.3. Actions under Specific Objective 3: Implementation of mitigation measures where information indicates occurrence of seabird bycatch.
Actio
nIm
plem
ent p
rove
n m
itiga
tion
mea
sure
s in
long
line
fishe
ries i
n th
e Gr
an S
ol,
Med
iterr
anea
n an
d no
n-EU
wat
ers
(whe
re n
ot a
lread
y re
quire
d to
do
so).
In th
ese
fishe
ries a
t lea
st tw
o of
the
follo
win
g m
itiga
tion
mea
sure
s sho
uld
be u
sed:
Nig
ht se
tting
with
min
imum
de
ck li
ghtin
g; B
ird-s
carin
g lin
es (T
ori
lines
); Li
ne w
eigh
ting.
Miti
gatio
n m
easu
res s
houl
d co
mpl
y w
ith m
inim
um
tech
nica
l sta
ndar
ds a
s set
out
in
Bird
life
and
ACAP
gui
delin
es[1
]
Prom
ote
the
adop
tion
of m
itiga
tion
mea
sure
s at i
nter
natio
nal l
evel
, whe
re
appr
opria
te a
nd n
ot a
lread
y ap
plic
able
.
Asse
ss a
nd im
plem
ent m
itiga
tion
mea
sure
s app
licab
le in
stat
ic n
et
fishe
ries i
n th
e Ba
ltic,
eas
tern
Nor
th
Sea
and
wes
tern
wat
ers w
here
in
cide
ntal
cat
ches
of s
eabi
rds a
re w
ell-
docu
men
ted
Reco
mm
end
that
all
vess
els i
mpl
emen
t on
-boa
rd m
anag
emen
t of
offa
l/disc
ards
acc
ordi
ng to
bes
t pr
actic
e gu
idel
ines
[2]
On
the
basis
of a
revi
ew o
f RFM
Os
brin
g fo
rwar
d pr
opos
als f
or a
dditi
onal
m
itiga
tion
mea
sure
s and
impr
oved
m
onito
ring
in R
FMO
s
Prop
ose
the
inco
rpor
atio
n of
rele
vant
m
itiga
tion
mea
sure
s und
er th
e te
chni
cal m
easu
res r
egul
atio
n be
ing
deve
lope
d in
the
cont
ext o
f the
refo
rm
of th
e CF
P an
d al
so e
nsur
e th
e in
clus
ion
of sp
ecifi
c m
easu
res u
nder
m
ultia
nnua
l pla
ns, a
s a m
atte
r of
prio
rity
whe
re a
ppro
pria
te a
nd u
rgen
tly
requ
ired.
Enco
urag
e M
embe
r Sta
tes t
o tr
ansp
ose
the
EU-P
oA in
to n
atio
nal l
egisl
atio
n
Prov
ide
suffi
cien
t res
ourc
es, n
otab
ly
supp
ortin
g fu
ndin
g th
roug
h th
e EF
F an
d th
e ne
w E
MFF
for t
he d
evel
opm
ent,
test
ing
and
impl
emen
tatio
n of
m
itiga
tion
mea
sure
s
Responsible Party
COM, MS, RFMOs COM MS MSCOM, MS, RFMOs, LDRAC
COM COM, MS MS
Timetable By the latest end of 2013 ContinuousBy the latest end of2013
By the latestend of 2013
Continuous
From 2016 fol lowingadoption of a new technica lmeasures regulation and thedevelopment of multiannualplans
By thelatest endof 2013
Immediate action forthe EFF. By the latestend of 2014 for theEMFF.
Commission
Commiss ion's proposa l forrevised Technica l MeasuresRegulation includesrequirement to takemeasures to avoid seabirdbycatch; a lso speci fiesmeasures for 2 regions offPortugal
ICES/STECF n/a
NEAFC n/a
Finland n/a n/a n/a
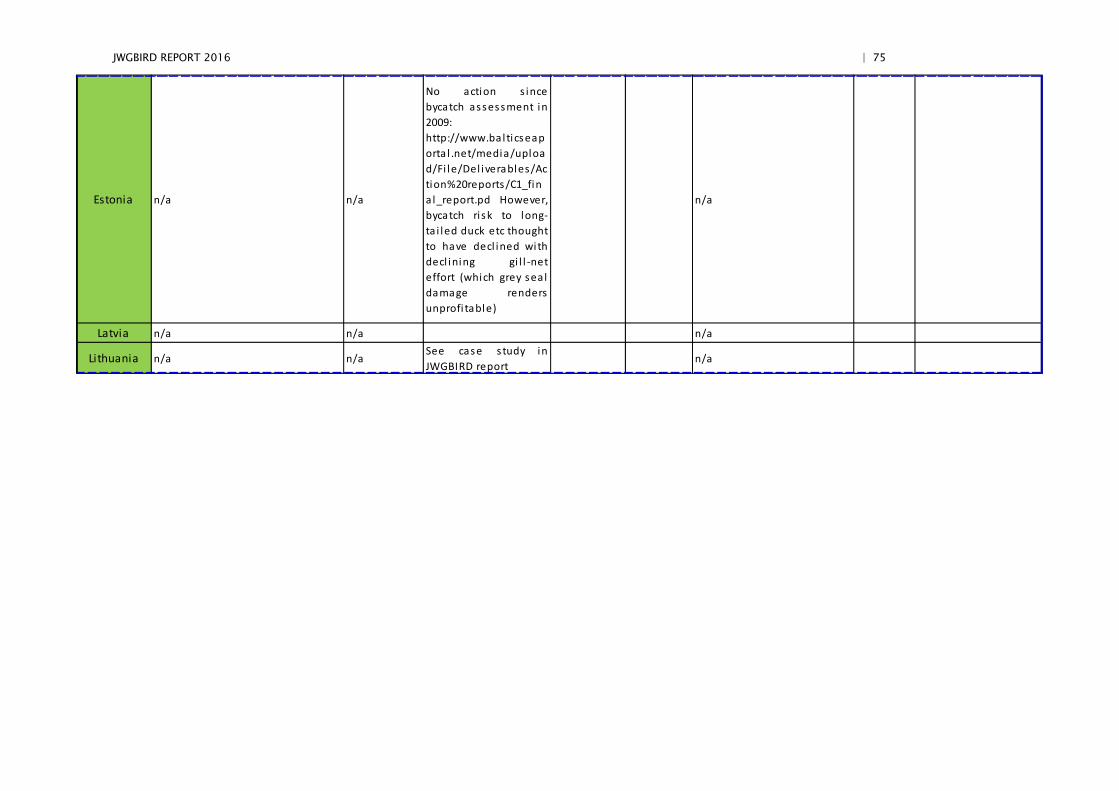
JWGBIRD REPORT 2016 | 75
Estonia n/a n/a
No action s incebycatch assessment in2009: http://www.bal ticseaporta l .net/media/upload/Fi le/Del iverables/Action%20reports/C1_fina l_report.pd However,bycatch risk to long-ta i led duck etc thoughtto have decl ined withdecl ining gi l l -neteffort (which grey sealdamage rendersunprofi table)
n/a
Latvia n/a n/a n/a
Lithuania n/a n/aSee case study inJWGBIRD report
n/a
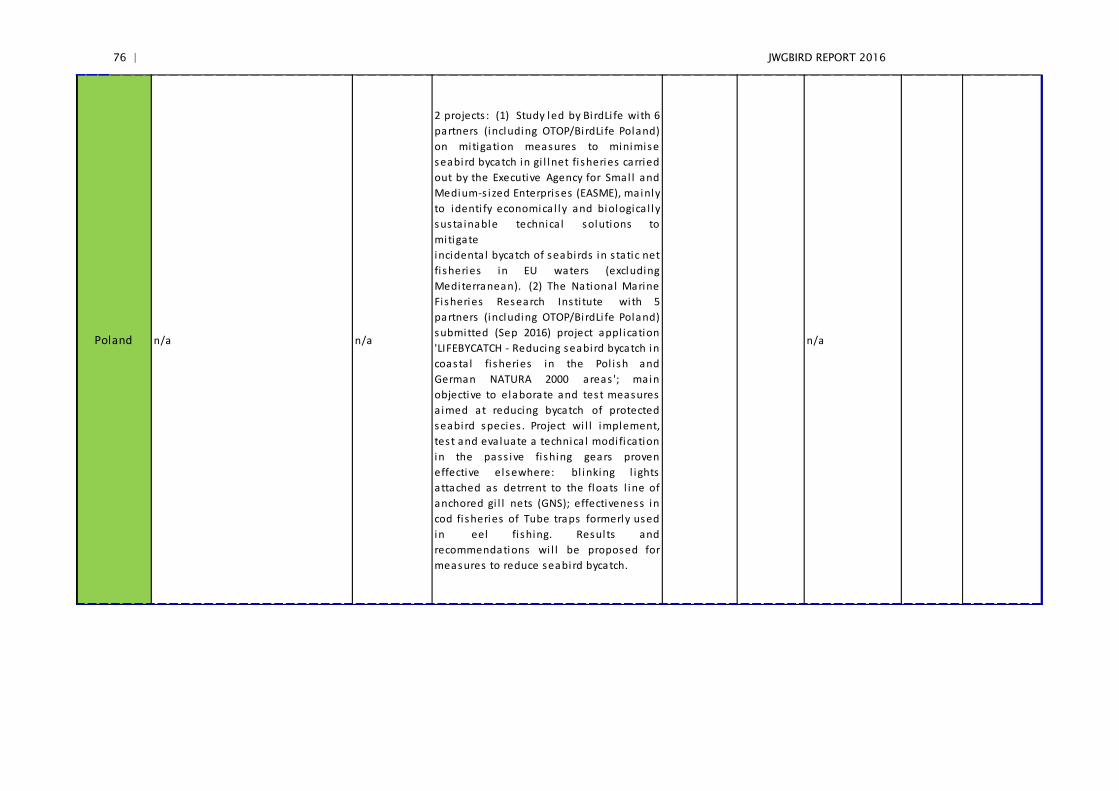
76 | JWGBIRD REPORT 2016
Poland n/a n/a
2 projects : (1) Study led by BirdLi fe with 6partners (including OTOP/BirdLi fe Poland)on mitigation measures to minimiseseabird bycatch in gi l lnet fi sheries carriedout by the Executive Agency for Smal l andMedium-s ized Enterprises (EASME), mainly to identi fy economica l ly and biologica l lysusta inable technica l solutions tomitigateincidenta l bycatch of seabirds in s tatic net fi sheries in EU waters (excludingMediterranean). (2) The National MarineFisheries Research Insti tute with 5partners (including OTOP/BirdLi fe Poland)submitted (Sep 2016) project appl ication'LIFEBYCATCH - Reducing seabird bycatch in coasta l fi sheries in the Pol i sh andGerman NATURA 2000 areas '; mainobjective to elaborate and test measuresa imed at reducing bycatch of protectedseabird species . Project wi l l implement,test and eva luate a technica l modi fication in the pass ive fi shing gears proveneffective elsewhere: bl inking l ightsattached as detrrent to the floats l ine ofanchored gi l l nets (GNS); effectiveness incod fisheries of Tube traps formerly usedin eel fi shing. Resul ts andrecommendations wi l l be proposed formeasures to reduce seabird bycatch.
n/a
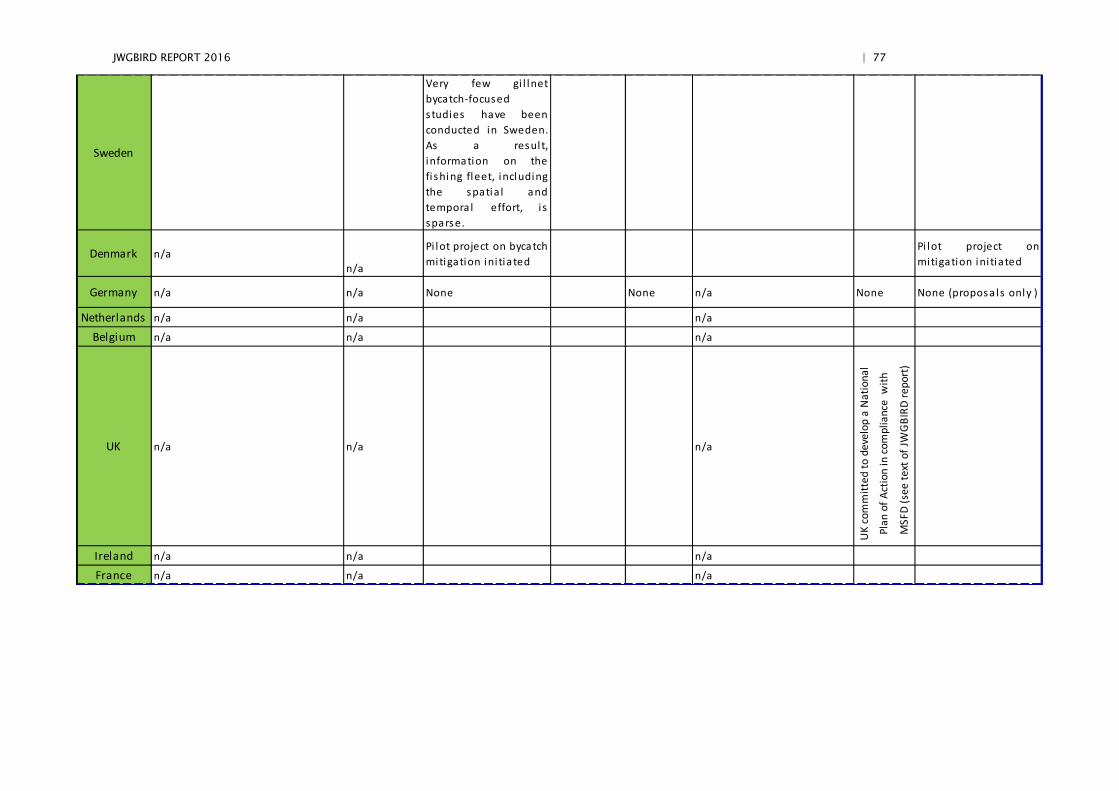
JWGBIRD REPORT 2016 | 77
Sweden
Very few gi l lnetbycatch-focused s tudies have beenconducted in Sweden.As a resul t,information on thefishing fleet, includingthe spatia l andtempora l effort, i ssparse.
Denmark n/an/a
Pi lot project on bycatchmitigation ini tiated
Pi lot project onmitigation ini tiated
Germany n/a n/a None None n/a None None (proposa ls only )
Netherlands n/a n/a n/a
Belgium n/a n/a n/a
UK n/a n/a n/a
UK
com
mitt
ed to
dev
elop
a N
atio
nal
Plan
of A
ctio
n in
com
plia
nce
with
MSF
D (s
ee te
xt o
f JW
GBI
RD re
port
)
Ireland n/a n/a n/a
France n/a n/a n/a

78 | JWGBIRD REPORT 2016
Portugal
See case study in JWGBIRD report; fordemersa l l ines , the mitigation measuresproposed by SPEA under Li fe+MarPro in agood practice manual were:*Night setting*improve s inking time*Use a l ternative hooks*Use of submerged funnel when setting*tori l ines*painted ba i t (with natura l dye)
n/a n/a
Spain
SEO BirdLi fe has held 5 workshops with fi shermen - see WGBYC 2016, section 6.2.7.3 for other col laborations to assess and mitigate bycatch ri sk. Current use of mitigation measures includes GRUPO REGAL demersa l longl iners (fi shing area includes Gran Sol ) land, us ing s treamer (tori ) l ines , dyed ba i t, l ighting l imitation etc. Spa in has a lso adopted mitigation measures for pelagic longl ines under national law: https ://www.boe.es/boe/dias/2014/04/28/pdfs/BOE-A-2014-4514.pdf (see Article 19 which addresses measures for a l l longl ine vessels to avoid bycatch of seabirds and turtles )
n/a n/a
Min
istr
y of
Agr
icul
ture
, Fis
herie
s &
Foo
d ha
d m
eetin
g of
exp
erts
to s
et b
asis
for a
Nat
iona
l Pl
an o
f Act
ion.
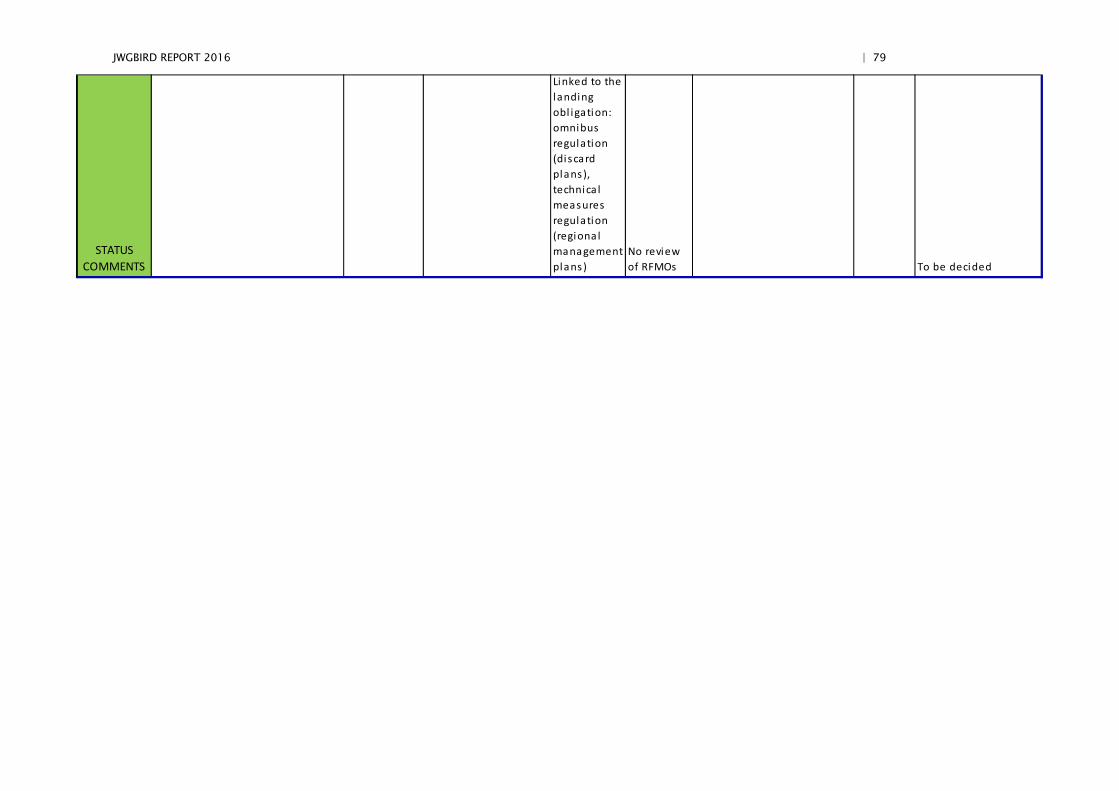
JWGBIRD REPORT 2016 | 79
STATUS COMMENTS
Linked to the landing obl igation: omnibus regulation (discard plans), technica l measures regulation (regional management plans)
No review of RFMOs To be decided

80 | JWGBIRD REPORT 2016
3.3.6 Key points from Actions under Specific Objective 4: Provide education and training to fishermen in the use and benefits of mitigation measures and accurate identification of seabirds for identification purposes (See Table 3.4, below)
The European Commission held a constructive workshop (16 May 2013) to inform stakeholders (including attendance by a Norwegian expert on longline mitigation measures) on the EU-POA.
The NGOs have been the most active in engaging directly with fishermen and sup-plying them with awareness-raising materials, seabird identification guides, etc. See below for BirdLife International case studies (Lithuania, Germany, Portugal).
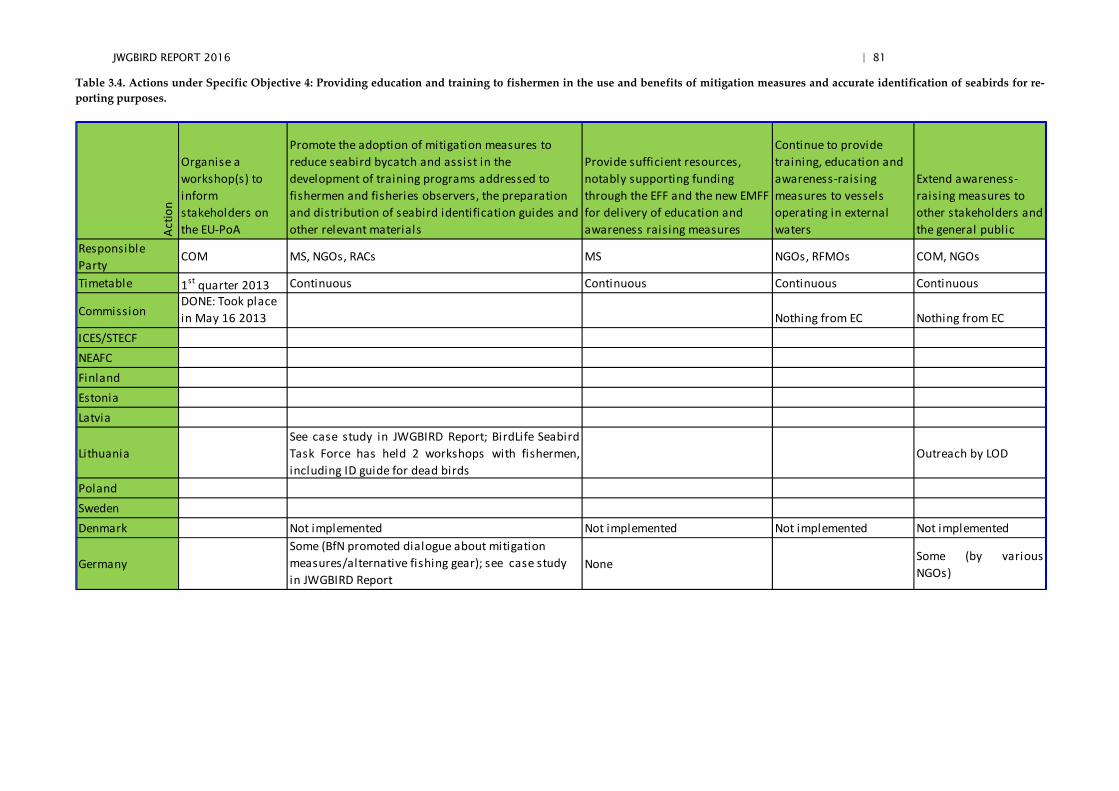
JWGBIRD REPORT 2016 | 81
Table 3.4. Actions under Specific Objective 4: Providing education and training to fishermen in the use and benefits of mitigation measures and accurate identification of seabirds for re-porting purposes.
Actio
nOrganise a workshop(s) to inform stakeholders on the EU-PoA
Promote the adoption of mitigation measures to reduce seabird bycatch and assist in the development of training programs addressed to fishermen and fisheries observers, the preparation and distribution of seabird identification guides and other relevant materials
Provide sufficient resources, notably supporting funding through the EFF and the new EMFF for delivery of education and awareness raising measures
Continue to provide training, education and awareness-raising measures to vessels operating in external waters
Extend awareness-raising measures to other stakeholders and the general public
Responsible Party
COM MS, NGOs, RACs MS NGOs, RFMOs COM, NGOs
Timetable 1st quarter 2013 Continuous Continuous Continuous Continuous
CommissionDONE: Took place in May 16 2013 Nothing from EC Nothing from EC
ICES/STECFNEAFCFinlandEstoniaLatvia
LithuaniaSee case study in JWGBIRD Report; BirdLife SeabirdTask Force has held 2 workshops with fishermen,including ID guide for dead birds
Outreach by LOD
PolandSwedenDenmark Not implemented Not implemented Not implemented Not implemented
GermanySome (BfN promoted dialogue about mitigation measures/alternative fishing gear); see case study in JWGBIRD Report
None Some (by variousNGOs)
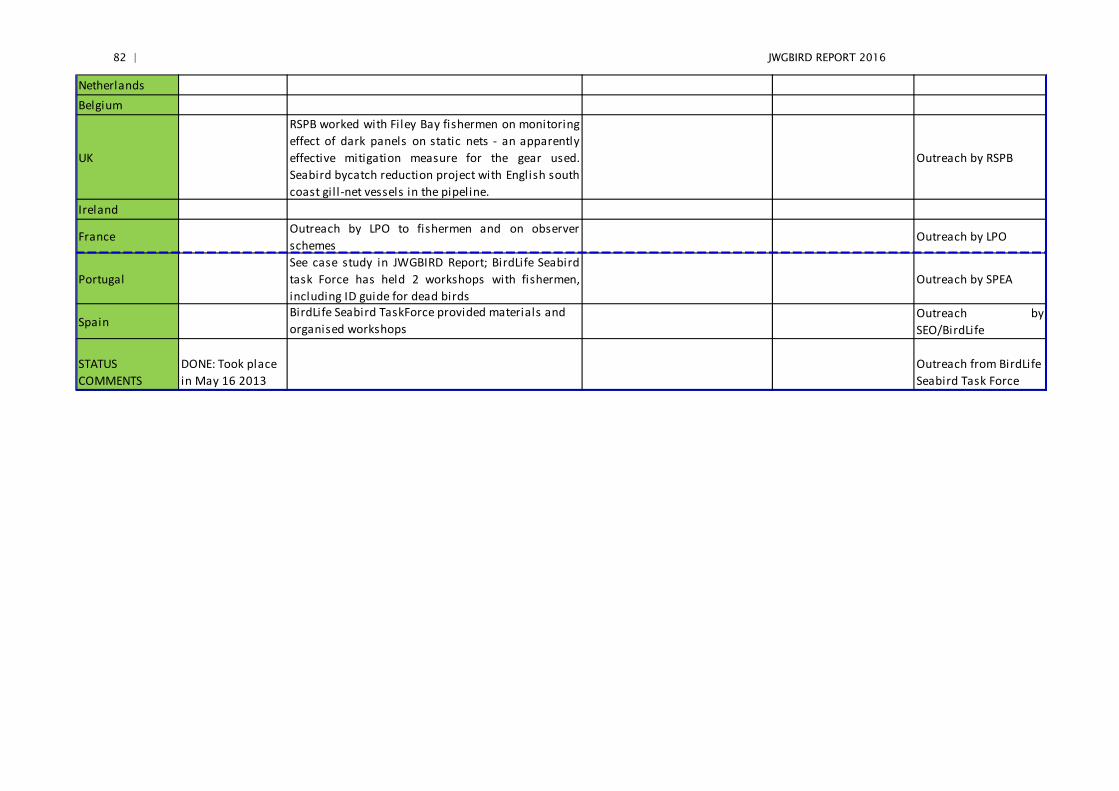
82 | JWGBIRD REPORT 2016
NetherlandsBelgium
UK
RSPB worked with Filey Bay fishermen on monitoringeffect of dark panels on static nets - an apparentlyeffective mitigation measure for the gear used.Seabird bycatch reduction project with English southcoast gil l-net vessels in the pipeline.
Outreach by RSPB
Ireland
France Outreach by LPO to fishermen and on observerschemes
Outreach by LPO
PortugalSee case study in JWGBIRD Report; BirdLife Seabirdtask Force has held 2 workshops with fishermen,including ID guide for dead birds
Outreach by SPEA
SpainBirdLife Seabird TaskForce provided materials and organised workshops
Outreach bySEO/BirdLife
STATUS COMMENTS
DONE: Took place in May 16 2013
Outreach from BirdLife Seabird Task Force
JWGBIRD REPORT 2016 | 83
3.3.7 Key points from Actions under Specific Objective 5: Instigating re-search into practical and effective mitigation measures for all fishing gears which impact on seabirds (See Table 3.5, below)
The NGOs have initiated most of the research in direct contact with fishermen, nota-bly in Lithuania, Germany and Portugal (see case studies, below).
The EMFF-funded Danish pilot project on mitigation is a welcome development, as is the Danish pioneering of Remote Electronic Monitoring (REM) technology (see Box, below):
84 | JWGBIRD REPORT 2016
The REM-systems used on gillnet vessels in Denmark include three on-deck water-proof armoured dome cameras, a GPS-sensor and a computer for storing data. The cameras focus on the sorting table, part of the deck and a close-up view of the area where the nets appear from the surface during hauling. This produces videos that enable the detection of bycatch, whether the seabirds are hauled on-board or fall out of the net when hauled from the water.
Two different REM-systems have been used in Denmark; both systems record video and GPS positions from when the systems are turned on until they are turned off and both log a position every ten seconds, but differ in data storage. The EMI system made by Archipelago Marine Research Ltd, Canada, uses a replaceable 500 GB hard drive installed in the wheelhouse. This hard drive has to be manually replaced when it is ca. 80% full. The Blackbox-system made by Anchor Lab, Denmark, stores data on a computer in the wheelhouse and when a 4G internet connection is found, it auto-matically uploads the data directly to servers at DTU Aqua.
Given the cost implications of observer programmes and the data confidence issues associated with self-reporting, JWGBIRD recommends that Member States and other responsible parties give serious consideration to REM as a rapidly-developing new technology for informing the extent of seabird bycatch. This is consistent with action 3 under Annex 1 Specific Objective 5: ‘If monitoring of bycatch of seabirds is included in the EU Multiannual Programme for Data Collection 2014–2020, assess how novel electronic monitoring technologies can be used to monitor seabird bycatch and, as appropriate, ensure their implementation’.
REM could be applied as a standalone measure or could also serve to ground-truth self-reporting. As the use of this technology spreads, installation costs are expected to fall, making it more cost-effective as an option. Installation could potentially be facilitated by EMFF support. Cameras (more than one, as described above in the Danish example, though deployment will vary with vessel size and design) need to be positioned appropriately to record seabird bycatch and to generate images of suf-ficient quality to enable species identification when downloaded. REM would be fea-sible for both offshore and inshore small-scale longlining vessels (excluding very small ones with insufficient power supply to run REM). See also Section 3.7.2 of ICES WKBYCS Report 2013 for other caveats, guidance and reference to pilot studies on using REM.
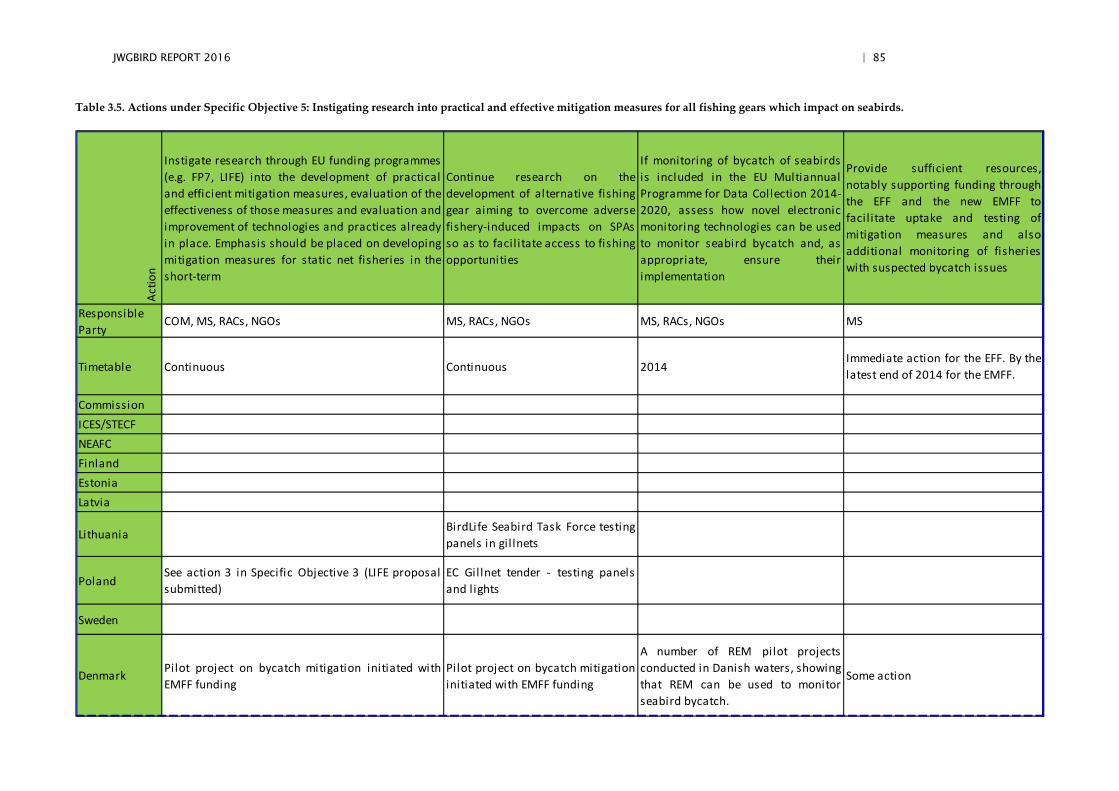
JWGBIRD REPORT 2016 | 85
Table 3.5. Actions under Specific Objective 5: Instigating research into practical and effective mitigation measures for all fishing gears which impact on seabirds.
Actio
nInstigate research through EU funding programmes(e.g. FP7, LIFE) into the development of practicaland efficient mitigation measures, evaluation of the effectiveness of those measures and evaluation and improvement of technologies and practices alreadyin place. Emphasis should be placed on developingmitigation measures for static net fisheries in theshort-term
Continue research on thedevelopment of alternative fishinggear aiming to overcome adversefishery-induced impacts on SPAsso as to facil itate access to fishingopportunities
If monitoring of bycatch of seabirdsis included in the EU MultiannualProgramme for Data Collection 2014-2020, assess how novel electronicmonitoring technologies can be usedto monitor seabird bycatch and, asappropriate, ensure theirimplementation
Provide sufficient resources,notably supporting funding throughthe EFF and the new EMFF tofacil itate uptake and testing ofmitigation measures and alsoadditional monitoring of fisherieswith suspected bycatch issues
Responsible Party
COM, MS, RACs, NGOs MS, RACs, NGOs MS, RACs, NGOs MS
Timetable Continuous Continuous 2014Immediate action for the EFF. By thelatest end of 2014 for the EMFF.
Commission ICES/STECFNEAFCFinlandEstoniaLatvia
Lithuania BirdLife Seabird Task Force testingpanels in gil lnets
PolandSee action 3 in Specific Objective 3 (LIFE proposalsubmitted)
EC Gillnet tender - testing panelsand lights
Sweden
Denmark Pilot project on bycatch mitigation initiated withEMFF funding
Pilot project on bycatch mitigationinitiated with EMFF funding
A number of REM pilot projectsconducted in Danish waters, showingthat REM can be used to monitorseabird bycatch.
Some action
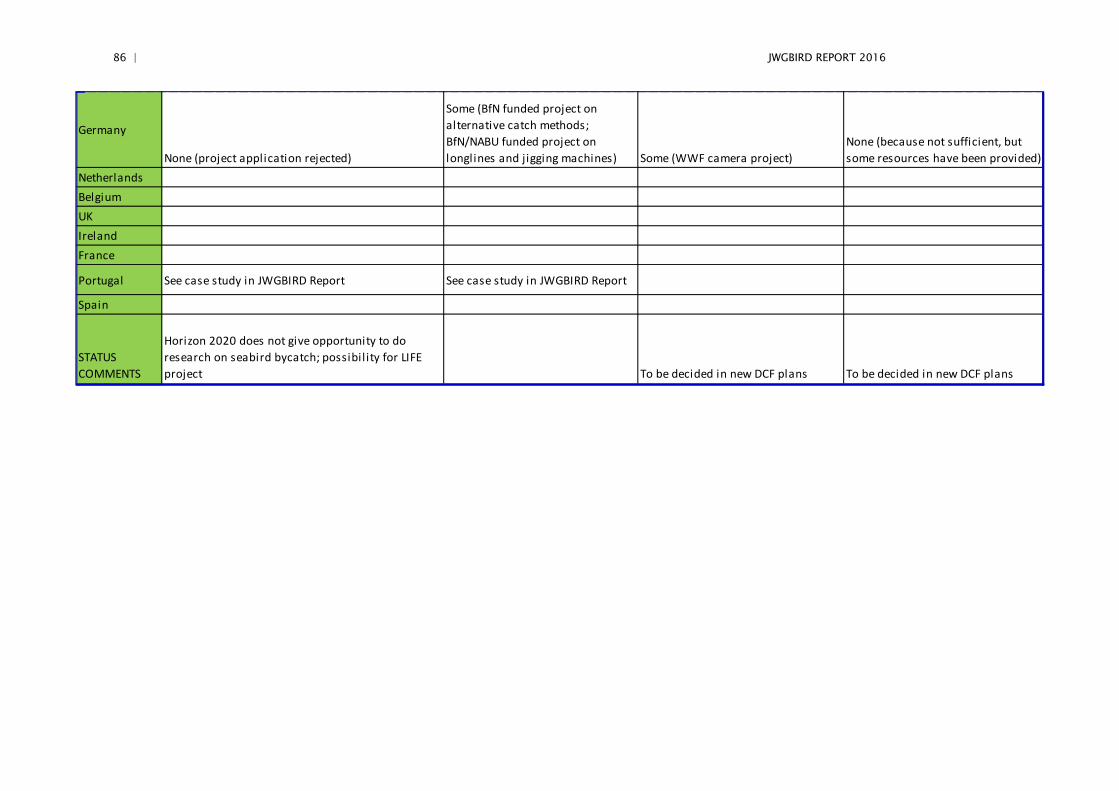
86 | JWGBIRD REPORT 2016
Germany
None (project application rejected)
Some (BfN funded project on alternative catch methods; BfN/NABU funded project on longlines and jigging machines) Some (WWF camera project)
None (because not sufficient, but some resources have been provided)
NetherlandsBelgiumUKIrelandFrance
Portugal See case study in JWGBIRD Report See case study in JWGBIRD Report
Spain
STATUS COMMENTS
Horizon 2020 does not give opportunity to do research on seabird bycatch; possibil ity for LIFE project To be decided in new DCF plans To be decided in new DCF plans
JWGBIRD REPORT 2016 | 87
3.4 What more could/should be done, and identification of further mitigation measures?
With notable exceptions, there is insufficient investment in monitoring across Mem-ber States. Among the available tools and methodologies, there is a need for more observer programmes, questionnaire approaches, reporting through logbooks and surveillance by REM.
Risk assessment studies of seabirds-fisheries overlap to define bycatch ‘hotspots’ is a fundamental action under Specific Objective 2 and JWGBIRD recommends that the UK approach, once publically available, should inform and encourage a similar mod-elling approach by other Member States, particularly those with larger EEZs and off-shore fleets operating mobile gears. It is particularly important to extend assessment effort to areas with no or few data, and to prioritise perceived threats to SPAs and other MPAs in which seabirds are a qualifying feature.
Related to this, and given that gillnets and other static gears are almost certainly re-sponsible for most seabird bycatch in the OSPAR and HELCOM regions, there is an urgent need to apply and adapt tracking technology to small-scale (<12 m length) vessels equivalent to Vessel Monitoring Systems (VMS) on larger vessels. As of 2012, all EU, Faroese and Norwegian vessels fishing in EU waters which exceed 12 m over-all length must be fitted with VMS units, although in Norwegian waters VMS is re-quired only on vessels over 15 m overall length. Up to 90% of Baltic vessels are less than 12 m long.
There is still considerable scope for developing, tailoring and implementing mitiga-tion measures, adapted to the specificities of individual fisheries and metiers. The NGOs have usefully initiated collaborative projects with fishermen, working on deck to pilot and finesse innovative mitigation measures and alternative fishing gears. Such collaboration, which raises awareness of the bycatch issue and harnesses fish-ermen’s knowledge in finding operational solutions that meet the particular condi-tions and needs of their local fishery, is essential if compliance with regulation is to be achieved long term.
Alongside these collaborative initiatives, the European Maritime and Fisheries Fund (EMFF) and emerging new instruments (data collection, technical measures) under the reformed Common Fisheries Policy offer powerful drivers for ‘minimising and where possible eliminating’ the incidental catch of seabirds, and the efficacy of these new measures will be important for JWGBIRD to revisit in future.
3.4.1 Purse seines
The table shows that gillnets, other static gear, and longlines are subject to a variety of interventions. However, in terms of gap analysis, a conspicuous gear type in need of further assessment and mitigation research is purse seine. The threat posed by purse seines was highlighted by WKBYCS 2013 Executive summary: ‘The mortality of Balearic shearwater in longline, purse-seine and other fisheries off Iberia and in the Mediter-ranean, however, is probably not sustainable for the population;’ And again Section 3.3.9, p. 19: ‘However, the fishery seems of particular risk to one of the seabird species of top con-cern, the Critically Endangered Balearic shearwater. Moreover, this bycatch seems to occur on an irregular basis, but can affect large numbers of birds at a time, thus raising maximum con-cern.’ This concern was echoed in EU-POA (p. 4: ‘Evidence is emerging that purse seines can take significant bycatch of species such as shearwaters.’)
88 | JWGBIRD REPORT 2016
A recent paper by Oliveira et al., 2015 concludes that, based on interviews and on-board data: ‘Although more observation effort is required, our results suggest that substantial numbers of Balearic shearwater might be bycaught annually, mainly in purse seine and setnets.’ (http://acap.aq/en/news/latest-news/1957-critically-endangered-balearic-shearwaters-are-killed-by-portuguese-purse-seines-and-set-nets?highlight=WyJwdXJzZSIsInNlaW5lIiwibmV0cyIsInB1cnNlIHNlaW5lIl0)
ACAP (Agreement on the Conservation of Albatrosses and Petrels) has recently agreed that it is of priority to develop effective mitigation for bycatch of seabirds (and especially shearwater species) in purse seines. The 9th meeting of ACAP’s Advisory Committee ‘Encouraged further data collection and analysis on the mitigation methods pre-sented for purse seine fisheries’, and ‘Encouraged the development of best practice mitigation advice on purse seine fisheries for the next meeting of the SBWG.’(Seabird Bycatch Work-ing Group) (see Section 11.1.8 in http://www.acap.aq/en/documents/advisory-committee/ac9/2845-ac9-report/file)
The urgent need to develop mitigation measures for international purse seine bycatch fisheries has also been recognised by Birdlife International: http://www.rspb.org.uk/community/getinvolved/b/albatross/archive/2014/05/07/workshop-on-gillnet-and-purse-seine-fisheries.aspx
In Chile, where pink-footed shearwater (Puffinus creatopus) is one of the main by-caught species, attention has focused on altering the purse seine net by to reduce the ‘hanging ratio’ by removing excess netting such that the seine hangs more vertically on deployment, leaving less ‘ceiling’ netting to entangle the diving shearwaters when they surface. JWGBIRD recommends that, as a matter of priority, this and other miti-gation solutions be developed and implemented in EU waters, especially those where the Critically Endangered Balearic shearwater and other shearwater species are threatened by this fishing gear.
3.4.2 Recreational fisheries
Particularly in the Baltic, where 35–70% of the cod is apparently caught by recrea-tional fishermen, the possibility cannot be excluded that this activity takes a hidden bycatch of seabirds. The Table below is indicative of the scale of this activity:
Country/location Scale of recreational fishing
Schleswig-Holstein, Germany 800 ‘hobby fishers’, each allowed to use a longline of 100 hooks, four single fish traps or two eelpots (pair fish traps), no gillnets.
Mecklenburg-Vorpommern, Germany ca. 250 recreational fishermen (not registered as semi-professionals or professionals), in need of environmental awareness-raising ; each allowed to use a longline of 100 hooks, eight eelpots and 100 m of gillnet.
Denmark ca. 30 000 persons annually buy a licence for fishing with nets or fykes. Each individual can catch fish with up to three nets of 50–60 m length; however the realised fishing effort is not known.
Sweden ‘Similar number’ of nets allowed, as in DK.
Finland 100 000 recreational fishermen, each allowed eight nets of 50 m length, no fishery /environmental education needed; bycatch apparently not a big issue but not investigated.

JWGBIRD REPORT 2016 | 89
It may be that such recreational fishing does not add significantly to the seabird by-catch impact of commercial fishing but this needs to be established. JWGBIRD could discuss the assessment of potential impact of recreational fishing in collaboration with WGBYC in 2017, with the possibility of engaging also the ICES Working Group for Recreational Fisheries (WGFRS).
90 | JWGBIRD REPORT 2016
3.4.3 Case study: Risk assessment of seabird bycatch in UK waters
This project (MB0126, in prep) commissioned by the UK Government is designed to identify UK sea areas with a high risk to seabird populations from bycatch in com-mercial fishing gears. The work will enable Defra (Department for Environment, Food & Rural Affairs), the Devolved Administrations and their agencies to assess whether bycatch will prevent the achievement of Good Environmental Status (GES) in UK waters under the MSFD. The results will also be used to inform what further monitoring of bycatch is necessary to assess impacts and to instruct management measures. By meeting these aims, the project will also help to progress the overall aim of the EU-POA.
The methodology for developing the risk assessment tool involves five related tasks and objectives:
• Objective 1: Construct marine bird density GIS layers (3 km x 3 km grid cells), using inshore and offshore survey data on numbers, distribution and seasonal variation.
• Objective 2: Assess the sensitivity of seabirds to bycatch by species and gear.
• Objective 3: Produce GIS vulnerability layers that map areas in UK waters where seabirds are vulnerable to bycatch at different times of year, by combining the sensitivity scores (Obj 2) with the GIS layers of density es-timates (Obj 1).
• Objective 4: Construct fishing intensity GIS layers using existing inshore and offshore data on fishing effort (mainly VMS-derived), gear type, depth and seasonal variation.
• Objective 5: Produce a GIS risk tool to map the degree of risk from bycatch based on the extent of overlap between the GIS layers on vulnerability and fishing intensity created under Objs 3 & 4.
The tool will enable identification of:
• areas of highest risk, i.e. where areas of high vulnerability experience high levels of relevant fishing activity;
• areas where seabirds are vulnerable to bycatch but where data on fishing activity are lacking, such that risk cannot be assessed; this is important for developing a risk-based approach to future monitoring of bycatch and a precautionary approach to bycatch mitigation.
A noteworthy caveat of this project is that only VMS data on fishing effort were in-cluded. Data from small-scale vessels not fitted with VMS and operating mainly in-shore have therefore not been captured. This is important as inshore areas are especially important for a number of seabird species vulnerable to bycatch in gillnets and other static gears.
This study explicitly builds on the growing body of previous studies on bycatch risk assessment, notably Garthe and Hüppop, 2004; Hobday et al., 2011; Small et al., 2012; Sonntag et al., 2012; Tuck et al., 2011 and Waugh et al., 2012.
For comparison with the UK study, and in the context of HELCOM, the assessment by Sonntag et al., 2012 is particularly relevant; it addresses bycatch of in southern Bal-
JWGBIRD REPORT 2016 | 91
tic gillnets by (i) assessing the vulnerability of diving birds to drowning by develop-ing a vulnerability index based on weighted bird occurrence, (ii) providing infor-mation on setnet fishing activities, and (iii) using a spatial overlap approach to indicate the potential conflicts between diving birds and fishing activities.
3.4.4 BirdLife International mitigation case study 1: Seabird Task Force Lithuania: Interim Project Report-Effectiveness of Gillnet Bycatch Mitigation Measures
The Lithuanian coast is internationally important for wintering seaduck, including velvet scoter (Melanitta fusca), common scoter (M. nigra), long-tailed duck (Clangula hyemalis) and red-throated diver (Gavia stellata), which overlap extensively with gill-net fisheries, resulting in bycatch (Dagys and Zydelis, 2002; Zydelis, 2002; Zydelis, 2006). From October 2015–April 2016 the BirdLife Seabird Task Force in Lithuania (hosted by the Lithuanian Ornithological Society, LOD) collected data on seabird by-catch from 78 trips on seven different cod gillnet vessels.
Each vessel conducted a paired trial, comparing sets of standard gillnets (the control) with sets of experimental nets. Experimental nets had black and white ‘high visibility panels’ attached every 4 m, placed centrally on the net (as described in Martin and Crawford, 2015); the purpose was to determine whether the net panels impacted the bycatch rate of the gillnet. A total of 202 sets were monitored.
For each set, the soak time and size of the net were recorded, allowing calculation of a measure of effort (m2 days). No account was taken of potential differences in net col-our, mesh size, or thickness as these were not deemed to be relevant (mesh size used was predominantly 60 mm, range 45–75 mm; mesh thickness was not thought to im-pact bycatch rates; colour was not considered relevant with low incident light levels on the Baltic seabed).
The number of birds caught was also recorded for each set, and birds’ species, sex, and age recorded where possible. Owing to the small sample size of caught birds, differences among these variables were not examined. Data on fish catch were calcu-lated by taking the snout-tail lengths of fishes, and estimating mass from length-mass relationships provided for cod (27.643 × length–463.06) and flounder (24.831 × length–403.13) from the Baltic Sea.
Results and preliminary analysis
In total, 53 birds were caught in control sets versus 36 in experimental sets; four spe-cies were recorded, with velvet scoter the most-captured species (Figure 3.1). As the sampling wasn’t paired uniformly, bycatch was adjusted for fishing effort as detailed below.
A paired inverse beta-binomial model was applied which compares normalized counts of subjects before and after treatment. Counts (bycatch) were normalized us-ing fishing effort and both control and treatment nets matched within a set. The same analysis was performed on fish catch data.
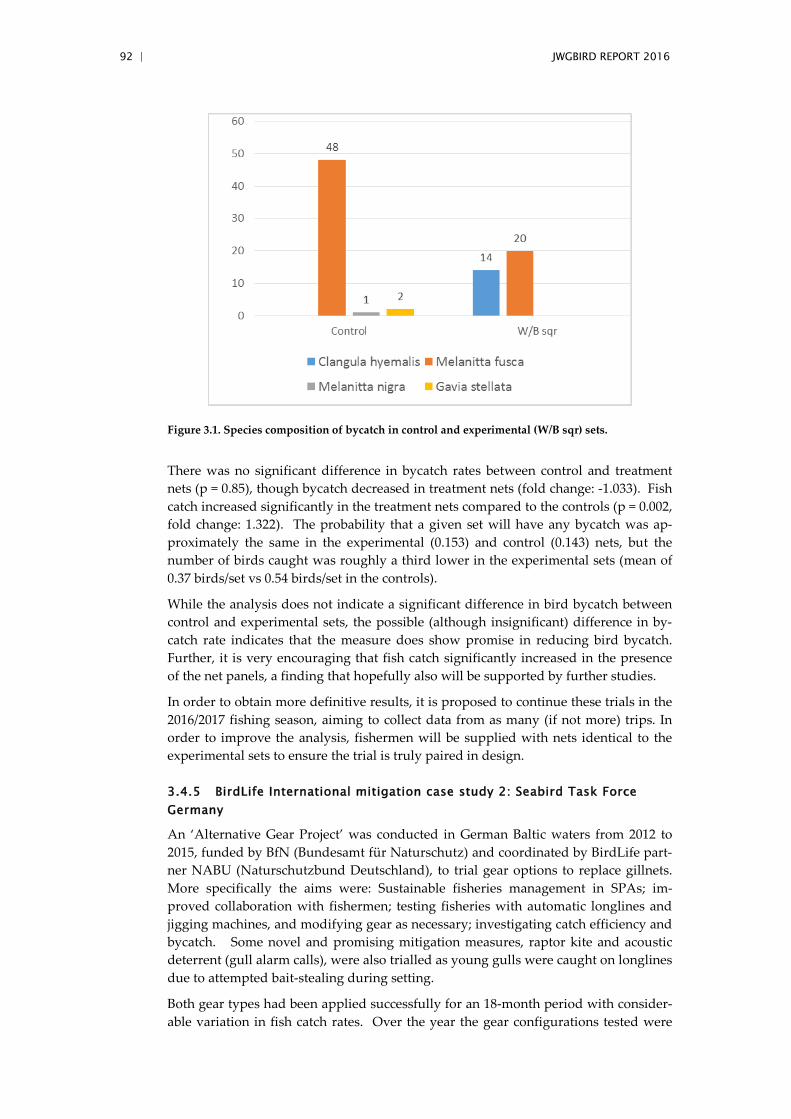
92 | JWGBIRD REPORT 2016
Figure 3.1. Species composition of bycatch in control and experimental (W/B sqr) sets.
There was no significant difference in bycatch rates between control and treatment nets (p = 0.85), though bycatch decreased in treatment nets (fold change: -1.033). Fish catch increased significantly in the treatment nets compared to the controls (p = 0.002, fold change: 1.322). The probability that a given set will have any bycatch was ap-proximately the same in the experimental (0.153) and control (0.143) nets, but the number of birds caught was roughly a third lower in the experimental sets (mean of 0.37 birds/set vs 0.54 birds/set in the controls).
While the analysis does not indicate a significant difference in bird bycatch between control and experimental sets, the possible (although insignificant) difference in by-catch rate indicates that the measure does show promise in reducing bird bycatch. Further, it is very encouraging that fish catch significantly increased in the presence of the net panels, a finding that hopefully also will be supported by further studies.
In order to obtain more definitive results, it is proposed to continue these trials in the 2016/2017 fishing season, aiming to collect data from as many (if not more) trips. In order to improve the analysis, fishermen will be supplied with nets identical to the experimental sets to ensure the trial is truly paired in design.
3.4.5 BirdLife International mitigation case study 2: Seabird Task Force Germany
An ‘Alternative Gear Project’ was conducted in German Baltic waters from 2012 to 2015, funded by BfN (Bundesamt für Naturschutz) and coordinated by BirdLife part-ner NABU (Naturschutzbund Deutschland), to trial gear options to replace gillnets. More specifically the aims were: Sustainable fisheries management in SPAs; im-proved collaboration with fishermen; testing fisheries with automatic longlines and jigging machines, and modifying gear as necessary; investigating catch efficiency and bycatch. Some novel and promising mitigation measures, raptor kite and acoustic deterrent (gull alarm calls), were also trialled as young gulls were caught on longlines due to attempted bait-stealing during setting.
Both gear types had been applied successfully for an 18-month period with consider-able variation in fish catch rates. Over the year the gear configurations tested were
JWGBIRD REPORT 2016 | 93
found not to be economically competitive with gillnets. Additional technical and op-erational improvements are needed. Moreover, the current collapse of the western Baltic cod stock has created adverse conditions for changing fishers’ behaviour and willingness to cooperate with innovation. In conclusion, it is difficult to replace gill-nets with just one different technique so there is a need to develop different gear types and accompanying measures (no-take zones, exclusive fishing rights). Further collaborative work is envisaged, enlisting EMFF and BfN support.
3.4.6 BirdLife International mitigation case study 3: Seabird Task Force Por-tugal
i ) Assessing the problem
Over 2010–2012, as part of various projects (FAME: Future of the Atlantic Marine En-vironment, MarPro (Conservation of Marine Protected Species in Mainland Portugal) and LIFE Berlengas, Portuguese Society for the Study of Birds (SPEA) undertook an assessment of seabird bycatch in mainland coastal fisheries by conducting on-board observations and questionnaire interviews with skippers: http://www.sciencedirect.com/science/article/pii/S2351989414000687
The study showed that the fishing gears with the biggest impact for seabird bycatch are demersal longlines (highest incidental catch), setnets and purse seines, deployed mostly by vessels less than 12 m length. The species most frequently caught are northern gannet (the most common) and the Critically Endangered Balearic shearwa-ter.
Although more observation effort is required, the results suggested that substantial numbers of Balearic shearwaters might be caught annually, mainly in purse seine and setnets. Bycatch events of this species do not seem to be frequent in purse seines but when incidents did occur several individuals were caught together (average of 7.75 birds caught per set). The species’ gregarious behaviour and its close association with fishing boats suggest that occasional ‘mass mortality’ is likely to occur when longline boats and purse seine vessels operate close to flocks (Arcos et al., 2008). The SPEA results support the findings of Louzao et al., 2011 that bycatch of this species is fairly common but often occurs irregularly, with occasions of up to a hundred or more birds bycaught in a single purse seine event. The SPEA study suggests that set-nets also contribute to adult Balearic shearwater mortality.
The study concluded that:
• Further work should be developed to improve estimates of the real fishing effort per gear by the Portuguese fleet, mainly for boats using setnets and demersal longlines.
• An on-board observer programme should be implemented. • The need for study and implementation of mitigation measures is urgent
and needs to include fishermen, marine researchers, seabird conservation-ists, and policy makers.
ii ) Mitigation trials (gillnets and longlines)
As part of the BirdLife Seabird Task Force programme and under the LIFE Berlengas project, SPEA is currently working on a project that addresses the trialling of mitiga-tion measures on gillnets. Following operational testing, fieldwork is starting in the Berlengas SPA to test the efficacy of high contrast panels attached to the net, as de-
94 | JWGBIRD REPORT 2016
scribed (above) in the Lithuanian case study. The study will include not only bycatch monitoring but also economic aspects of using the mitigation measure. The study period is September 2016–March 2017, using three boats and four fisheries observers.
Mitigation measures for longlines will also be tested in Berlengas SPA but analysis is still ongoing into which measures are likely to be most effective. Those proposed un-der Life+MarPro in a good-practice manual were: night setting, improve sinking time, use of alternative hooks, use of submerged funnel when setting, streamer (tori) lines, painted bait (with natural dye). However, uptake by fishermen of these measures is currently very low, and the only precautionary behaviour shown is to avoid line-setting in areas where they see large flocks of birds.
3.5 Recent work to assess and mitigate seabird bycatch in non-EU countries
3.5.1 Norway
Norway has not decided to implement the EU-POA for seabird bycatch. Neverthe-less, substantial effort has been made in recent years to assess and document the ex-tent of the problem in time and space for different commercial fisheries in Norwegian waters. Most of this work has been part of the Norwegian Seabird Bycatch Project that was initiated in 2008 with the aims to: 1) identify fisheries with potentially high bycatch rates, 2) quantify bycatch and 3) suggest relevant actions to mitigate bycatch of seabirds. The project started out with a literature review (Christensen-Dalsgaard et al., 2008) before a pilot study was carried out in 2009–2012 to test out survey methods and identify fisheries with potential for high bycatch rates (Fangel et al., 2015).
This was followed up by a more detailed study of the demersal longline fishery for Greenland halibut in 2012–2014 that was recently published (Fangel et al., 2016), and four more studies are ongoing. One is focussing on the coastal gillnet fisheries for cod based on a longer term dataseries on seabird bycatch reported to the Institute of Ma-rine Research (IMR) in Bergen since 2006 by their coastal reference fleet, which in-cludes data from self-reporting by skippers of 38 fishing vessels (<21 m LOA). Another study (started in 2012) focusses on the gillnet fishery for lumpsucker, and a third study (started 2016) deals with the flow-line fishery for haddock. The fourth study is a review of seabird bycatch in lumpsucker fisheries across the North Atlantic that will be made in cooperation with the Circumpolar Seabird Working Group of CAFF (CBird) with financial support from the Nordic Council.
As seabirds are not restricted by national borders, standardizing data and comparing bycatch rates and implementation of mitigation measures across borders are impera-tive for addressing the problem in its full extent. The up-coming Pan-Atlantic review of the lumpsucker fisheries is thus one important step in that direction. At the nation-al level, building further on the IMR reference fleet scheme could provide a valuable system for monitoring the gillnet bycatch of seabirds in commercial coastal fisheries for demersal fish (mainly cod) in Norway. The possibilities to establish a parallel sys-tem for monitoring bycatch in Norwegian offshore fisheries should also be consid-ered, even if opportunities may be restricted because there is no obligatory tracking of vessels between 12-15 m LOA and the sensitivity of information may restrict the use of tracking data for larger vessels.
Northern fulmar (Fulmarus glacialis) is the species that occurs most often as bycatch, both on longlines (98% in Greenland halibut) and in gillnets set for cod (37%). The total bycatch in the latter fishery is <20 000 birds annually, but can vary much from
JWGBIRD REPORT 2016 | 95
year to year. Besides fulmars, 35% of the birds taken are common guillemots (Uria aalge). Bycatch rate increases dramatically when the gillnets are set in shallow waters (depths <50 m), and is characterized by few incidents of bycatch with relatively high bycatch numbers. The gillnet fishery for lumpsucker has a relatively high bycatch rate (0.84 birds/trip up to and including 2015), impacting mainly on black guillemots (Cepphus grylle) (49%) and cormorants (Phalacrocorax spp.) (23%). As most of the black guillemots taken proved to be adult birds (79%), this fishery may well be an im-portant mortality factor for this species, with the potential for having significant pop-ulation effects, at least at the local level. In the demersal longline fishery for Greenland halibut, the mean bycatch rate of seabirds (almost exclusively fulmars) reported by both voluntary fishermen and observers was 0.24 birds/trip (SE=0.09, n=309 trips), corresponding to 0.017 birds/1000 hooks, and somewhat lower (0.016 birds/trip) when using a stratified estimator (Fangel et al., 2016). This is much lower than indicated by the initial survey based on access point interviews of fishermen on vessels <15 m LOA (Fangel et al., 2015), but that study covered only 19 trips. The find-ings of the larger study also suggested that the use of swivel hooks can significantly reduce incidental bycatch of fulmars.
3.5.2 Iceland
As in Norway, Iceland has not adopted the EU-POA on seabird bycatch and does not have a National Plan of Action. However, there have been estimates of seabird by-catch in Iceland, and more recently the issue has been subject to targeted research by the Fisheries Directorate and BirdLife International work with the lumpsucker gillnet fleet.
Petersen (2002) estimated overall Icelandic bycatch in all fishing gears using ringed bird recoveries and historical data. This estimate across all fisheries was 100 000–200 000 birds killed each year, and was considered to still stand at the time of a global gillnet bycatch review by Zydelis et al., 2013, in which a figure of 100 000 birds killed/year was used for gillnet fisheries in Iceland. Studies in the 1980s and 1990s formed the basis of this estimate, and at that time, bycatch in gillnets was not thought to be impacting populations, as common guillemot was the most commonly caught species and their population was increasing. It was, however, suspected that black guillemot and red-throated diver populations could have been affected (A. Petersen, pers. comm.).
Recent research by the Fisheries Directorate (Pálsson et al., 2015) used data from ob-servers, scientific cod gillnet surveys (conducted in April each year) and self-reported data (from about one third of the lumpsucker fleet) to estimate bycatch levels in Ice-landic waters. It should be noted that while bycatch reporting is now mandatory, re-turns of electronic log books have been low. In addition, some differences have been noted between observer-collected data and self-reported data on bycatch (perhaps reflected in the differences below between self-reported bycatch levels in the lump-sucker fishery and those observed in the past two years). Irrespective of this, Pálsson et al. (2015) and personal communication with the Iceland Marine Research Institute (for longlines, from soon to be published observer data, coverage of ~1% of the fleet) give the following estimates of annual mortality rates:
96 | JWGBIRD REPORT 2016
Cod longlines
Northern fulmar 4037/year
Northern gannet Morus bassanus 327/year
Black guillemot 327/year
Great cormorant Phalacrocorax carbo 218/year
Great black-backed gull Larus marinus 218/year
Cod gillnets
Common guillemot 4400/year
Northern fulmar 1100/year
Lumpsucker gillnets (2014)
Black guillemot 2017
Common eider Somateria mollissima 1882
Cormorants Phalacrocoracidae 851
Common guillemot 269
Observer data from the BirdLife project (collected across 12 trips in 2015 and 31 in 2016) are yet to be published, but identify, respectively, black guillemot, common eider and great cormorant as the three most caught species. Data are currently un-dergoing analysis, but preliminary outputs from 2016 suggest higher bycatch levels than those self-reported in 2014.
3.6 ToR b ii) Assess ways of improving the limited knowledge of the extent of seabird bycatch in the NE Atlantic longlining fleets
i ) Operational options
Successful, tried-and-tested mitigation measures for demersal longline fisheries in the NE Atlantic have been known for nearly twenty years (Løkkeborg, 2008; FAO, 2009) but the level of compliance with those measures and the scale of bycatch are still less well understood. Potential methods of data collection include (but are not limited to) interview surveys, independent and randomized observations on vessels (including remote electronic monitoring systems), experimental fishing and the use of systemat-ic reports from reference vessels. In addition, standardized reporting on fishing effort and key data on the seabirds caught are needed, including their species, age and sex distribution, as well as any parameters that can indicate the origin of their breeding populations (Fangel et al., 2015: http://www.sciencedirect.com/science/article/pii/S2351989415000621).
Of these monitoring methods, by far the best and most robust traditional option for quantitative data collection is a programme of independent observers, experienced and trained in seabird identification. This is supported by EU- POA Annex 1 actions specified under Specific Objective 2, which include that a ‘minimum 10% observer cov-erage in the short term should be aimed for’. As a compromise, training current observers currently serving on onboard for monitoring other species (fish catches plus bycatch of other taxa) would also be a step forward. There is no regular observer programme in the Gran Sol longline fleet, but the Spanish Institute of Oceanography has supplied several observers in the past.
JWGBIRD REPORT 2016 | 97
Failing the implementation of a national observer programme, however, self-reporting by skippers is needed, even though the outputs are less reliable. One factor in favour of this option is that the temporal irregularity of bycatch incidents can make it difficult to justify bespoke observer programmes, at least low-budget ones covering a small fraction of the fishing effort.
Self-reporting systems, however, need to be systematic and standardised across the fleet. Fangel et al. (2015) cites the parameters of the Norwegian Reference fleet ap-proach: ‘Besides being representative in terms of gear and areas (cf. Bjørge et al., 2013), the selected crews should be well reputed[sic] and supportive of sustainable management. The Reference fleet gathers a range of fisheries-specific data and takes samples according to a pro-tocol developed by IMR’ (Norwegian Institute of Marine Research). In addition, most skippers lack seabird identification skills. In order to be effective, therefore, self-reporting demands awareness-raising and training on what/when/how to report (see EU-POA Annex 1 actions under Specific Objective 4).
Given the cost implications of observer programmes and the data confidence issues associated with self-reporting, Remote Electronic Monitoring (REM) could be applied to a Reference fleet. It is a rapidly evolving technology (for discussion see ToR b (i) - Key points from Actions under Specific Objective 5) which could potentially make a significant advance in our knowledge of the extent of seabird bycatch in the NE At-lantic longline fishery.
ii ) Policy options
The EU-POA has an action (under Specific Objective 5) to ‘Consider the feasibility of incorporating the monitoring of seabirds under the new DCF’ (Data Collection Frame-work). In June 2015, the Commission proposed a regulation concerning the establish-ment of a Union framework for the collection, management and use of data in the fisheries sector and support for scientific advice regarding the Common Fisheries Policy (COM (2015)294 final). This new Multi-Annual Programme amends the current Council Regulation (EC) N° 199/2008. The new proposal is still under negotiation and will not be adopted until 2017.
Under the current legislation, vessels are not obliged to provide data on how many seabirds they have caught. In changing the scope of the new DCF and the rules it sets out, this missing information could be provided on a yearly basis, allowing for great-er understanding of the impact of the fisheries on seabirds, as well as informing the needed mitigation measures.
In this regard, the scope of the Commission’s proposed new DCF does include the requirement to collect data to assess the impact of the fisheries on the marine ecosys-tems, including seabird bycatch. Section 3.2.1 of the proposal includes the statement: ‘The current DCF does not provide sufficient data on some ecosystem impacts of fisheries which are however required for implementing efficiently the MSFD. This is the case of inci-dental catches of protected species (birds, marine mammals, turtles etc.), effects on food webs (predator–prey relations), and the impact of fishing on habitats. Relevant data on these three impacts could be collected through existing or modified DCF mechanisms and therefore, at minimum costs, also serve the purpose of improving knowledge of the marine environment.’ And Article 5.2(b) of the proposal requires Multi-Annual Programmes to establish data requirements that include: ‘ecosystem data to assess the impact of Union fisheries on the marine ecosystem in Union and external waters, including data on by-catch of non-target
98 | JWGBIRD REPORT 2016
species, in particular species protected under international or Union law, data on impacts of fisheries on marine habitats and data on impacts of fisheries on food webs;’
An unprecedented legal obligation to collect and report data systematically could be an important change in improving the limited knowledge of the extent of seabird by-catch in the NE Atlantic longlining fleets.
3.7 Recommendations
1 ) JWGBIRD welcomed the invitation to collaborate with WGBYC and will send a member to the WGBYC 2017 meeting. Some of the recommenda-tions below could be discussed in cooperation.
2 ) Clarification is needed on the current status and use of the standard re-porting format and seabird bycatch database (ICES) recommended by the EU-POA.
3 ) Member States and other countries in the OSPAR and HELCOM areas should commit to and support taking forward the NGOs’ joint initiatives with fishermen to develop innovative mitigation measures for gillnets and other static gears.
4 ) JWGBIRD urges greater commitment by Member States and other coun-tries in the OSPAR and HELCOM areas to develop and implement their own national plans of action (NPOA-Seabirds) aligned with the EU-POA.
5 ) Uptake of EFF/EMFF funding for mitigation projects has not been well documented and would be a valuable assessment for JWGBIRD to make.
6 ) JWGBIRD considers that Member States and other countries could invest more in monitoring seabird bycatch. In particular, they should give serious consideration to Remote Electronic Monitoring (REM) as a rapidly-developing new technology that could significantly advance our knowledge of incidental mortality of seabirds in fishing gears.
7 ) JWGBIRD recommends that the risk assessment tools developed by the UK for its waters and by Sonntag et al., 2012 for the southern Baltic could in-form and encourage a similar modelling approach by other Member States and countries in the OSPAR and HELCOM areas.
8 ) Given that gillnets and other static gears are almost certainly responsible for most seabird bycatch in the OSPAR and HELCOM regions, there is an urgent need to adapt VMS-tracking technology to small-scale (<12 m length) vessels.
9 ) As a matter of priority, and reflecting the global focus given to this issue by the Agreement on the Conservation of Albatrosses (ACAP), measures to mitigate bycatch of seabirds in purse seines should be developed and im-plemented in EU waters, especially those where the Critically Endangered Balearic shearwater and other shearwater species are under threat from this gear.
10 ) Considering the significant level of recreational fishing activity in the HELCOM area and some other EU regions and adjacent waters, JWGBIRD could discuss the assessment of the potential impact of this activity in col-laboration with WGBYC in 2017, and possibly also engage with the ICES Working Group for Recreational Fisheries (WGFRS).
JWGBIRD REPORT 2016 | 99
11 ) Closer cooperation between the EU and Nordic countries would help de-velop synergies and compare approaches such as Norway’s coastal refer-ence fleet.
12 ) JWGBIRD recommends the establishment of observer programmes as best practice for improving the limited knowledge of seabird bycatch in the NE Atlantic longlining fleets.
13 ) Forthcoming EU legislation on, respectively, data collection and technical measures should be given high priority by Member States towards mini-mising and where possible eliminating seabird bycatch, as part of formu-lating multi-annual plans for regional seas in the OSPAR and HELCOM areas.
3.8 References Agreement on the Conservation of Albatrosses and Petrels. Report of the Ninth Meeting of the
Advisory Committee. La Serena, Chile, 9–13 May 2016.
Arcos, J.M., M. Louzao, and Oro, D. 2008. Fishery ecosystem impacts and management in the Medi-terranean: seabirds point of view. In J. Nielsen, J. Dodson, K. Friedland, T. Hamon, N. Hughes, J. Musick, E. Verspoor (Eds.), Proceedings of the Fourth World Fisheries Con-gress: Reconciling Fisheries with Conservation, Symposium, vol. 49, , American Fisheries Society, Bethesda, MD, USA (2008), pp. 587–596.
Bjørge, A., Skern-Mauritzen, M. and Rossman, M. C. 2013. Estimated bycatch of harbour por-poise (Phocoena phocoena) in two coastal gillnet fisheries in Norway, 2006–2008. Mitigation and implications for conservation. Biological Conservation 161: 164–173.
Christensen-Dalsgaard, S., Fangel, K., Dervo, B.K. and Anker-Nilssen, T. 2008. Bifangst av sjøfugl i norske fiskerier - eksisterende kunnskap og forslag til kartleggingsprosjekt. Nor-wegian Institute for Nature Research, NINA Rapport 382. 62 pp.
Dagys, M. and Zydelis, R. 2002. Bird bycatch in fishing nets in Lithuanian coastal waters in wintering season 2001–2002. Acta Zoologica Lituanica 12 (3): 276–282.
European Commission. 2012. Action Plan for reducing incidental catches of seabirds in fishing gears. COM(2012)665final.
European Commission. 2016. Regulation (EU) 2016/1139 of the European Parliament and of the Council of 6 July 2016 establishing a multiannual plan for the stocks of cod, herring and sprat in the Baltic Sea and the fisheries exploiting those stocks, amending Council Regulation (EC) No 2187/2005 and repealing Council Regulation (EC) No 1098/2007.
Fangel, K., Aas, Ø., Vølstad, J.H., Baerum, K.M., Christensen-Dalsgaard, S., Nedreaas, K., Overvik, M., Wold, L.C. and Anker-Nilssen, T. 2015. Assessing incidental bycatch of sea-birds in Norwegian coastal commercial fisheries: Empirical and methodological lessons. Global Ecology and Conservation 4: 127–136.
Fangel, K., Bærum, K.M., Christensen-Dalsgaard, S., Aas, Ø. and Anker-Nilssen, T. 2016. Inci-dental bycatch of northern fulmars in the small-vessel demersal longline fishery for Green-land halibut in coastal Norway 2012–2014. ICES Journal of Marine Science (doi:10.1093/icesjms/fsw149).
FAO. 2009. Fishing Operations: 2) Best practices to reduce incidental catch of seabirds in cap-ture fisheries. FAO Technical Guidelines for Responsible Fisheries 1: Suppl. 2. FAO, Rome.
García-Barcelona, S, José C. Báez, J.C., Ortiz de Urbina, J.M., Gómez-Vives, M.J. and Macías, D. 2013. Bycatch of Cory’s shearwater in the commercial longline fisheries based in the Medi-terranean coast and operating in East Atlantic waters: first approach to incidental catches of seabird in the area. Collect. Vol. Sci. Pap. ICCAT, 69(4): 1929–1934. (SCRS/2012/183).
100 | JWGBIRD REPORT 2016
Garthe, S. and Hüppop,O. 2004. Scaling possible adverse effects of marine wind farms on seabirds: developing and applying a vulnerability index. Journal of Applied Ecology 41: 724–734.
Hobday, A. J., Smith, A.D.M., Stobutzki, I.C., Bulman, C., Daley, R., Dambacher, J.M., Deng, R.A., Dowdney, J., Fuller M., Furlani, D., Griffiths, S.P., Johnson, D., Kenyon, R., Knuckey, I.A., Ling, S.D., Pitcher, R.K., Sainsbury, J., Sporcic M., Smith, T., Turnbull, C., Walker, T.I., Wayte, S.E., Webb, H., Williams, A., Wise, B.S. and Zhou, S. 2011. Ecological Risk Assessment for the effects of fishing. Fisheries Research 108: 372–384.
ICES. WKBYCS Report. 2013. Report of the Workshop to Review and Advise on Seabird By-catch, 14–18 October 2013, Copenhagen. ICES CM 2013 / ACOM:77. Pp. 79.
Kieś B., Tomek T. 1990. Bird Mortality in Fishing Nets in the Gulf of Gdańsk, Polish Baltic Coast. Pelagicus 5: 23–27.
Løkkeborg, S. 2008. Review and assessment of mitigation measures to reduce incidental catch of seabirds in longline trawl and gillnet fisheries. FAO Fisheries and Aquaculture Circular. No. 1040. Rome, FAO. 25 pp.
Louzao, M., Arcos, J.M., Laneria, K., Beldae, E., Guallartf, J., Sánchez, A., Giménez, M., Maes-tre, R., and Oro, D. 2011. Evidence of the incidental capture of the Balearic Shearwater at sea. In: Proceedings of the 6 CONGRESS of GIAM and the International Workshop on Petrels and Shearwaters Ecology at Southern Europe 34, pp. 165–168.
Martin, G. R, and Crawford, R. 2015. Reducing bycatch in gillnets: a sensory ecology perspec-tive. Global Ecology and Conservation 3: 28–50.
National Marine Fisheries Research Institute. 2016. Developing a rational basis for monitoring birds’ bycatch for the purpose of the sustainable management of coastal fisheries in NATURA 2000 marine areas. I. Psuty (ed.), NMFRI Publishing House, Gdynia online [http://www.mir.gdynia.pl/przylowy].
Ólafur Karvel Pálsson, Þorvaldur Gunnlaugsson and Droplaug Ólafsdóttir. 2015. Meðafli sjófugla og sjávarspendýra í fiskveiðum á Íslandsmiðum [Bycatch of sea birds and marine mammals in Icelandic fisheries]. Hafrannsóknir nr. 178.
Oliveira, N., Henriques, A., Miodonski, J., Pereira, J., Marujo, D., Almeida, A., Barros, N., An-drade, J., Marçalo, A., Santos, J., Benta Oliveira, I., Ferreira, M., Araújo, H., Monteiro, S., Vingada, J. and Ramírez, I. 2015. Seabird bycatch in Portuguese mainland coastal fisheries: An assessment through on-board observations and fishermen interviews. Global Ecology and Conservation 3: 51–61.
Petersen, A. 2002. Fugladauði í Veiðarfærum í sjó við Ísland [Seabird bycatch in fishing gear in Iceland]. Náttúrufræðingurinn 71 (1–2): 52–61.
Skov H., Heinänen S., Žydelis R., Bellebaum J., Bzoma S., Dagys M., Durinck J., Garthe S., Grishanov G., Hario M., Kieckbusch J. J., Kube J., Kuresoo A., Larsson K., Luigujoe L., Meissner W., Nehls H. W., Nilsson L., Petersen I. K., Roos M. M., Pihl S., Sonntag N., Stock A., Stipniece A. 2011. Waterbird Populations and Pressures in the Baltic Sea. Nordic Coun-cil of Ministers. Copenhagen.
Small, C., Waugh, S.M. and Phillips, R.A. 2012. The justification, design and implementation of Ecological Risk Assesments of the effects of fishing on seabirds. Marine Policy, http://dx.doi.org/10.1016/j.marpol.2012.05.001.
Sonntag, N., Schwemmer, H., Fock, H.O., Belllebaum, J. and Garthe, S. 2012. Seabirds, set-nets and conservation management: assessment of conflict potential and vulnerability of birds to bycatch in gillnets. ICES J. Mar. Sci. 69(4), 578–589.
Stempniewicz L. 1994. Marine birds drowning in fishing nets in the Gulf of Gdańsk (southern Baltic): numbers, species composition, age and sex structure. Ornis Svecica 4: 123–132.
Tuck G.N., Phillips R.A., Small C, Thomson R.B., Klaer, N and Taylor, F. 2011. An assessment of seabird–fishery interactions. ICES Journal of Marine Science 68: 1628–1637.
JWGBIRD REPORT 2016 | 101
Waugh S.M., Filippi D.P., Kirby D.S., Abraham, E. and Walker, K. 2012. Ecological Risk Assessment for seabird interactions in the Western and Central Pacific longline fisheries. Marine Policy 36: 933–946.
Zydelis, R. 2002. Habitat Selection of Waterbirds Wintering in Lithuanian Coastal Zone of the Baltic Sea. PhD thesis, Institute of Ecology of Vilnius University, Vilnius, Lithuania.
Zydelis, R., Dagys, M. and Vaitkus, G. 2006. Beached bird surveys in Lithuania reflect marine oil pollution and bird mortality in fishing nets. Marine Ornithology 34: 161–166.
Zydelis, R., Small, C. and French, G. 2013. The incidental catch of seabirds in gillnet fisheries: A global review. Biological Conservation 162: 76–88.
3.9 Acknowledgements
Ana Almeida (SPEA)
Pep Arcos (SEO/BirdLife)
Bruna Campos (BirdLife International)
Rory Crawford (RSPB)
Kim Detloff (NABU)
Kirstin Fangel (NINA)
Sven Koschinski (Meereszoologie)
Mardik Leopold (Wageningen UR)
Thiery Micol (LPO)
Christian Pusch (BfN)
Marguerite Tarzia (BirdLife International)
Ingrid Tulp (Wageningen UR)
Markus Vetemaa (University of Tartu)
Oli Yates (RSPB)
102 | JWGBIRD REPORT 2016
4 Anthropogenic threats to OSPAR/HELCOM seabirds in other parts of their annual range
Term of reference: Review threats to marine birds that breed or overwinter in the OSPAR and HELCOM areas and spend the rest of the year elsewhere (e.g. northern gannets that overwinter in Mauretania; roseate terns in overwinter along the coast of West Africa; long-tailed ducks that breed in Arctic Russia).
4.1 Introduction
Many of the seabird species occurring in the OSPAR and HELCOM areas spend a substantial part of their annual cycle outside these areas. Some breed in the OSPAR/HELCOM areas and spend the non-breeding season in other parts of the At-lantic, typically further south but in a few cases in the Northwest Atlantic or the Med-iterranean. Others occur mainly as non-breeders in the OSPAR/HELCOM areas and breed further east in the Russian Arctic; most of these (sea ducks and divers) mainly breed at freshwater sites. There are also a few species (shearwaters) that breed in the southern hemisphere and occur in the OSPAR area as non-breeding migrants. Finally, some species occur only as passage migrants in the OSPAR/HELCOM areas, breeding either in the high Arctic or terrestrially, and wintering further south.
Population changes of seabirds may be driven by conditions in either breeding or non-breeding areas (or a combination, e.g. Reiertsen et al. (2014)). Thus, in order to understand the causes of population fluctuations, and not least to interpret indicators of seabird abundance in the OSPAR and HELCOM areas, it is necessary to include knowledge on conditions and threats facing the birds during the part of the year they spend outside the focal areas. A quick review of the literature and request for infor-mation among group members showed that surprisingly little information is availa-ble, and that for many species it is unknown whether they are exposed to significant threats when outside the focal areas. A systematic review thus proved intractable. Instead, we here describe a number of case studies of specific anthropogenic threats that are important for one or more seabird species occurring in the OSPAR/HELCOM areas. Some of these are new and require urgent attention.
4.2 Deliberate capture of seabirds for export for human consumption off West Africa
In recent years, several incidents have been reported where authorities in West Afri-can countries have intercepted shipments of seabirds, apparently intended for human consumption (see http://seabirds.net/posts/2013/02/13/evidence-for-massive-bycatch-in-chinese-fisheries-/ and http://seabirds.net/posts/2016/02/16/evidence-for-massive-bycatch-in-chinese-fisherie-1/). Photographic evidence showed that large numbers of birds were involved, and that the birds were individually packaged and apparently prepared for consumption (i.e. skin, fat, head, wings and feet removed) (pers. comm. C.J. Camphuysen, Royal Netherlands Institute for Sea Research). Examination of the photos shows that the birds involved were mainly northern gannets (pers. comm. C.J Camphuysen), which winter in large numbers off West Africa in the Canary Current ecosystem (Fort et al., 2012, Gremillet et al., 2015). Other species such as Cory’s and Scopoli’s shearwater were probably also involved. The sheer number of birds in-volved (probably thousands) makes it unlikely that this was the result of unintended bycatch; more likely, the birds were deliberately targeted.
JWGBIRD REPORT 2016 | 103
This is an extremely worrying recent development. The Canary Current system is a very important hotspot for seabirds throughout the year (Camphuysen and van der Meer, 2005; Ramos et al., 2013; Gremillet et al., 2015; Paiva et al., 2015), and the poten-tial for large negative effects on seabirds breeding both in and outside the OSPAR area is clearly present. Reports indicate that Chinese vessels were involved in the ap-parently deliberate capture of seabirds in the area (pers. comm. C.J. Camphuysen), and with the recent expansion of Chinese overseas fisheries (Pauly et al., 2014), the perspectives for seabird conservation are alarming. In addition to targeted or inci-dental capture, seabirds in the Canary Current system may also be affected by human overfishing of their primary prey, the sardinella (Sardinella spp.) (Gremillet et al., 2015), particularly as the area has the highest estimated level of illegal, unregulated and unreported (IUU) fishing in the world (Agnew et al., 2009; Daniels et al., 2016).
4.3 Trapping of terns in West Africa
The trapping of European terns for sport, food or income while wintering along West African shores has been suggested as a major mortality factor for several species, no-tably roseate tern, Sandwich tern and common tern and marsh terns Chlidonias spp. (Dunn and Mead, 1981; Meininger, 1988; Ntiamoa-Baidu, 1992; Stienen et al., 1998; which see for other references). Various methods are used, including snares (nooses) and other sorts of traps baited with small pelagic fish, and ‘fishing’ for terns using baited hooks on nylon lines (the terns dive for the fish bait and become caught on the hooks). Probably more first-year birds than adults are taken, possibly because they are naïve or more attracted to what appears to be an easy source of food. Trapping is carried out mainly by boys and young men, but fishermen are also known to catch and kill seabirds offshore.
Trapping is known to occur throughout West Africa, from Mauretania to the Gulf of Guinea, but there have been no systematic assessments since the 1990s and even then the scale of the problem could only be guessed at. Ringing returns suggested that the major problem for roseate terns lies in Ghana where most of the Western Palearctic population winters. In 1991–1992 a survey was undertaken along the coast of Ghana, to try to quantify the scale of the problem. Six species of terns were involved, with roseate and common terns appearing to be more susceptible to snaring on the beach-es than other species. Interviews with the boys involved in setting snares suggested that on some days each boy could catch 12–15 terns, but few other quantitative data were obtained (Ntiamoa-Baidu, 1992).
In Senegal, searches of the coast between November 1995 and December 1997 discov-ered large numbers of rings from terns and other seabirds (often being used as jewel-lery), most of which were from Sandwich terns ringed in 1994–1997 at breeding colonies in the British Isles, Belgium and the Netherlands (Stienen et al., 1998). Only four rings (3%) were from roseate terns, 123 (81%) came from Sandwich terns and 22 (15%) from common terns. It is certain that the rings which were found represented only a small proportion of the terns which were caught, and Stienen et al. (1998) judged that almost 10 000 terns may have been trapped annually during the 1990s, mostly Sandwich terns but including perhaps 500 terns of other species. Similarly, Meininger (1988) estimated that 5000–20 000 terns were caught per year in Senegal in the late 1980s, notably Caspian tern, royal tern, Sandwich tern, common tern, black tern and white-winged black tern.
As part of a LIFE project, the RSPB (Royal Society for the Protection of Birds) is cur-rently working with CAW (Centre for African Wetlands) to undertake an ‘Assess-
104 | JWGBIRD REPORT 2016
ment of the wintering population conservation requirements and priority actions for roseate terns in Ghana’. This includes an assessment of the spatial and temporal dis-tribution of tern trapping. Known hotspots along the coast are being surveyed and local communities engaged to determine methods used, species and number of terns involved and any conditions facilitating trapping, e.g. concurrent landings by beach seine of small shoaling fish that may supply fish for baiting traps and lines or attract terns to catch fish escaping from hauled nets. The purpose of trapping is also being explored to determine if it is, e.g. recreational or has any economic value, and if so to whom. This two-year survey will be completed in the winter 2017–2018.
Similar studies should be conducted in other West African countries with a history of tern trapping to determine the status of trapping. It is possible that, with the recent socio-economic improvement (e.g. more children may attend school) in at least some of the countries concerned, trapping may have declined, but this needs to be deter-mined, especially as the population status of some of the species at risk has worsened since the problem was last given attention.
4.4 Spring hunting in Arctic Russia
Spring hunting of ducks and geese is known to be common and widespread in Russia (Molotchaev and Glazov, 2005), but little is known about which species are affected and to what extent. It is likely that spring hunting is a significant threat for e.g. long-tailed duck, but quantitative information is sorely lacking.
4.5 Winter hunting in Greenland
A few seabird species breeding in the northeast Atlantic migrate more or less west-wards and spend the winter off Newfoundland and southwest Greenland, areas where seabird hunting historically has been widespread and important. The most prominent example concerns Brünnich’s guillemot, which is the most popular quarry species for seabird hunters in both areas. Recent tracking studies have shown that birds wintering off southwest Greenland primarily originate from OSPAR popula-tions in Iceland and Svalbard, whereas those wintering off Newfoundland primarily come from non-OSPAR populations in Canada and Greenland (Frederiksen et al., 2016). The reported number of guillemots shot in Greenland has declined considera-bly since 2000 (Frederiksen et al., 2016), and political initiatives to further decrease hunting pressure are currently being considered. However, breeding populations throughout the Northeast Atlantic are declining, and a model study is planned to ex-plore the importance of the current hunting pressure as a driver of the population decline.
4.6 Bycatch in fisheries
Bycatch in longline fisheries is well known to be a serious threat to many seabirds, particularly albatrosses and petrels (e.g. Gales et al., 1998). However, the North Atlan-tic breeding species migrating to areas with extensive longline fisheries in the South Atlantic (e.g. Manx and Cory’s shearwater) appear to be relatively rare victims of by-catch in their wintering areas (e.g. off southern Brazil, Bugoni et al., 2008). On the oth-er hand, Balearic shearwaters are often caught in longline and purse-seine fisheries in the Mediterranean during the breeding season, and this is considered an important threat for this red-listed species (Genovart et al., 2016), which breeds in the Mediter-ranean and spends the non-breeding season in the OSPAR area off the west coast of Iberia and France.
JWGBIRD REPORT 2016 | 105
4.7 Other threats
Many other anthropogenic threats are likely to occur in various breeding areas, but their importance for specific seabird populations seems to be poorly known. Exam-ples include marine litter, persistent organic pollutants, heavy metals, habitat de-struction in breeding areas, etc. In addition, climate-linked changes in food availability in e.g. wintering areas are likely to be important drivers of seabird de-mography (e.g. Ramos et al., 2012; Reiertsen et al., 2014), but a full review of this sub-ject is outside the scope of this ToR.
4.8 References Agnew DJ, Pearce J, Pramod G, Peatman T, Watson R, Beddington JR, Pitcher TJ. 2009. Estimat-
ing the worldwide extent of illegal fishing. PLoS ONE 4: e4570.
Bugoni L, Mancini PL, Monteiro DS, Nascimento L, Neves TS. 2008. Seabird bycatch in the Bra-zilian pelagic longline fishery and a review of capture rates in the Southwestern Atlantic Ocean. Endangered Species Research 5: 137–147.
Camphuysen CJ, van der Meer J. 2005. Wintering seabirds in West Africa: foraging hotspots off Western Sahara and Mauritania driven by upwelling and fisheries. African Journal of Ma-rine Science 27: 427–437.
Daniels A, Gutiérrez M, Fanjul G, Guereña A, Matheson I, Watkins K. 2016. Western Africa’s missing fish: The impacts of illegal, unreported and unregulated fishing and under-reporting catches by foreign fleets. Overseas Development Institute. London. 45 pp.
Dunn EK, Mead CJ. 1981. Relationship between sardine fisheries and recovery rates of ringed terns in West Africa. Seabird 6: 98–104.
Fort J, Pettex E, Tremblay Y, Lorentsen SH, Garthe S, Votier S, Pons JB, Siorat F, Furness RW, Grecian WJ, Bearhop S, Montevecchi WA, Grémillet D. 2012. Meta-population evidence of oriented chain migration in northern gannets (Morus bassanus). Frontiers in Ecology and the Environment 10: 237–242.
Frederiksen M, Descamps S, Erikstad KE, Gaston AJ, Gilchrist HG, Grémillet D, Johansen KL, Kolbeinsson Y, Linnebjerg JF, Mallory ML, McFarlane Tranquilla LA, Merkel FR, Monte-vecchi WA, Mosbech A, Reiertsen TK, Robertson GJ, Steen H, Strøm H, and Thórarinsson TL. 2016. Migration and wintering of a declining seabird, the thick-billed murre Uria lomvia, on an ocean basin scale: conservation implications. Biological Conservation 200: 26–35.
Gales R, Brothers N, Reid T. 1998. Seabird mortality in the Japanese tuna longline fishery around Australia, 1988–1995. Biological Conservation 86: 37–56.
Genovart M, Arcos JM, Álvarez D, McMinn M, Meier R, Wynn RB, Guilford T, Oro D. 2016. Demography of the critically endangered Balearic shearwater: the impact of fisheries and time to extinction. Journal of Applied Ecology 53: 1158–1168.
Gremillet D, Peron C, Provost P, Lescroel A. 2015. Adult and juvenile European seabirds at risk from marine plundering off West Africa. Biological Conservation 182: 143–147.
Meininger P.L. 1988. A preliminary investigation of them catching in Senegal, winter 1987/1988. International Council for Bird Preservation. Cambridge. ICPB study report 35, pp.
Molotchaev AV, Glazov P.M. 2005. Waterfowl bags in Russia (extended abstract). In: Pohlmey-er K (ed) XXVIIth Congress of the International Union of Game Biologists, Hannover, Germany, 28 August to 3 September 20005. German Union of Game and Wildlife Biolo-gists, Hannover, pp. 211–212.
Ntiamoa-Baidu Y. 1992. Preliminary report on tern trapping in coastal Ghana. In: For Roseate Tern Conservation - Carentac (France)- Proceedings. SEPNB.
106 | JWGBIRD REPORT 2016
Paiva VH, Geraldes P, Rodrigues I, Melo T, Melo J, Ramos J.A. 2015. The foraging ecology of the endangered Cape Verde shearwater, a sentinel species for marine conservation off West Africa. PloS ONE 10: e0139390.
Pauly D, Belhabib D, Blomeyer R, Cheung WWWL, Cisneros-Montemayor AM, Copeland D, Harper S, Lam VWY, Mai Y, Le Manach F, Österblom H, Mok KM, van der Meer L, Sanz A, Shon S, Sumaila UR, Swartz W, Watson R, Zhai Y, Zeller D. 2014. China's distant-water fisheries in the 21st century. Fish and Fisheries 15: 474–488.
Ramos R, Granadeiro JP, Nevoux M, Mougin J-L, Dias MP, Catry P. 2012. Combined spatio-temporal impacts of climate and longline fisheries on the survival of a trans-equatorial marine migrant. PLoS ONE 7: e40822.
Ramos R, Granadeiro JP, Rodríguez B, Navarro J, Paiva VH, Bécares J, Reyes-González JM, Fagundes I, Ruiz A, Arcos P, González-Solís J, Catry P. 2013. Meta-population feeding grounds of Cory's shearwater in the subtropical Atlantic Ocean: implications for the defi-nition of Marine Protected Areas based on tracking studies. Diversity and Distributions 19: 1284–1298.
Reiertsen TK, Erikstad KE, Anker-Nilssen T, Barrett RT, Boulinier T, Frederiksen M, González-Solís J, Grémillet D, Johns D, Moe B, Ponchon A, Skern-Mauritzen M, Sandvik H, Yoccoz N.G. 2014. Prey density in non-breeding areas affects adult survival of black-legged kitti-wakes Rissa tridactyla. Marine Ecology Progress Series 509: 289–302.
Stienen EWM, Jonard A, Brenninkmeijer A. 1998. Tern trapping along the Senegalese coast. Sula 12: 19–26.
JWGBIRD REPORT 2016 | 107
5 Review the process of data collation for the new OSPAR Marine Bird Database and the HELCOM bird abundance indicators and recommend how this might be improved
5.1 OSPAR
5.1.1 Background
In 2016, the ICES DataCentre, under contract to the OSPAR Commission, developed and built the marine bird database as part of the OSPAR Biodiversity Data Portal. The aim of the database is to collate and store data on abundance and breeding success that will be used to construct regional indicators, baselines and assessment values (i.e. quantitative thresholds). The data have been used to conduct assessments of two OSPAR Common Indicators for the Intermediate Assessment 2017 (IA2017): B1 – Marine bird abundance and B3 – Marine bird breeding success/failure. The development of the database was welcomed by JWGBird who had previously recommended that a central data collation mechanism was needed {insert refs to JWGBird reports}.
A data call was issued by the OSPAR Secretariat to Heads of Delegation on 2nd June 2016, with a deadline of 30th June. Data were received from the following contracting parties: UK (including data from Ireland, Isle of Man, Jersey and Guernsey), Belgium, Netherlands, Germany, Denmark, Sweden and Norway. The last data were received on 21st July 2016.
Data were entered by data providers into a standard set of excel worksheets. When the data sheets were completed, a macro in the Excel file, exported the data into an xml data file. Export was only possible if the correct field codes and data types had been entered. Incorrect codes and data types were fed back to the provider and the data could not be exported until the errors were corrected.
The xml files should then have been uploaded by the provider to the ICES website (https://biodiversity.ices.dk/managebirds). Further quality control was applied during the upload process to check that data standards had been met. A report of control issues was generated and made available to the submitter online. Data not complying with the correct format were not accepted by the uploading utility and had to be e-mailed to the ICES DataCentre. Additional assistance was provided by ICES to help data providers correct the issues in the formatting of their data, so that they could be uploaded. Most datasets could not be uploaded by the provider. The process of uploading usefully identified errors in the data, which then had to be checked back with the data providers, who then corrected the errors and then their entire dataset had to be uploaded again. This led to delays, particularly because the timing of the data call meant that providers were away on summer holiday or on fieldwork.
Once all data were uploaded, ICES ran a routine to produce a data product for JNCC (UK) to analyse and begin construction and assessment of the indicators. When producing the data product, ICES used GIS to check that sites had been assigned to the correct spatial assessments units. This highlighted further errors in the spatial data provided by some Contracting Parties. Entire datasets from contracting parties had to be removed, then corrected by the data providers and uploaded again. This led to further delays. Once the data product was produced, further errors were spotted by JNCC, which then had to be corrected in the database by ICES, and the data providers
108 | JWGBIRD REPORT 2016
informed to correct their originating data accordingly. The final dataset was produced on 24 August, just six days before the OSPAR BDC assessment delivery deadline of 30 August. The assessments of B1 and B3 were then delivered by JNCC to OSPAR on 1st and 7th September, respectively. There was no opportunity for JWGBird to review the new results, although some members were asked by their BDC HoDs to review the assessments prior to BDC on 21st September.
This chapter looks at why the delays occurred and suggests ways in which the data entry format and the process of uploading data can be modified, so that we can avoid such delays in the future.
5.1.2 Data entry format
The format was on the whole easy to understand and most providers were able to complete the data forms without experiencing major problems, with the following exceptions.
1 ) In the data format guidance it was not made clear if a mean count for an entire season running from July to June (e.g. 2014–2015) had to be defined as the first calendar year of the period (e.g. 2014), or the second (e.g. 2015).
Proposed solution: Change to guidance document with following text:
For mean counts of non-breeding birds that were conducted during the whole year from July in year a to June in year b (i.e. <Time_period> = 2), the guidance should clearly state in Table 2 that year a (the start of the reporting period) should be provided in the field <year>. So it is the first year in the season that indicates year.
2 ) Some contracting parties had to make considerable extra effort to deliver a full dataset of observed counts because they needed to manually input zero counts. This occurs when a site has been surveyed and only certain species are present; those species that were recorded present at the site in previous years need to be entered as absent, with a zero count. In years, when a site was not surveyed, a value of -1 needs to be entered in <count> field for all the species that have occurred at the site. Manually entering zeros and -1 in the count field is very time consuming.
Proposed solution: If possible, ICES could develop some script that automatically enters zeros and -1 for certain sites and years where this is required, before data are uploaded. The provider would enter into the table <B1_abundance_data> all the positive counts (>0) for each species counted at each site in each year of each dataset. The script would then enter the following:
‘count’ = 0; for all species included in a survey that were not present at site in a year when it was visited (i.e. when positive counts were observed for other species);
‘count’ = -1; for all species at a site during years in which the site was not visited by the appropriate survey (i.e. when no counts were observed at the site).
JWGBIRD REPORT 2016 | 109
For the script to work, there would need to be two optional additional table in the data entry format that lists for each survey, which species were included and in which years the survey was conducted. The tables would need to be updated for each submission and will include the existing fields:
SURVEYID SPECIES_NAME
SURVEYID YEAR
If the above optional tables are not completed by the provider, then the imputation of zeros and ‘-1’ cannot be run.
There would also need to be the additional fields added to existing tables:
EXISTING TABLE ADDITIONAL FIELD
Birds_site_description SurveyID
5.1.3 Data submission
The data entry format assumed that one organisation would provide data on behalf of each country. This was not actually the case because in most countries, different organisations collate different types of survey data. For instance, data on breeding abundance are usually collected by monitoring schemes that are different from those that collect data on non-breeding abundance. Therefore, there were more than one submission of data from each country. This created two problems:
a ) Different organisations used the same code for completely different sites. This meant that some count data were attributed to the wrong sites in the database.
Proposed solution: This has been addressed by ICES by making a unique key based on NationalColonyID and EDMO code (which uniquely defines each organization). Thus each organisation within a country has governance over its own sites.
b ) The providers who submitted (B1 record) abundance data only, could not upload their data because the mandatory fields for (B3 record) breeding success data could not be completed. In this instance, ICES needed to manually upload the data, however this was solved immediately by making the B3 record optional.
Proposed solution: Solution already implemented. There is no requirement to submit B1 and B3 separately.
c ) Submitters delivered non-breeding (B1) and breeding (B1 and B3) data in 2 separate files. ICES did not anticipate this and new submissions were treated as updates to existing submissions (resubmissions).
Proposed solution: If a submitter does provide separate files then these should be clearly labelled as i.e. Breeding and Non-Breeding respectively.
5.1.4 Other recommendations
1 ) In response to each future data call, Contracting Parties should provide an updated full dataset that includes data for all previous years, which will
110 | JWGBIRD REPORT 2016
completely replace all existing data for that country within the database. This applies both to the site description data and to the abundance count data, as well as to the breeding success data. The reasons for this are that sites included in surveys might be merged or new sites may be added, new data from previous years may be added, or existing data from previous years may be amended. Data of annual counts that are produced by interpolation models, will certainly need to be overwritten, because imputed values for previous years will change as new observed counts are used to adapt the model.
2 ) Contracting parties should make clear in the datasheet if data have public access or restricted access. The data providers in JWGBird would like more information on the OSPAR data policy, so they can judge how their data eventually might be used by third parties.
3 ) Given the timing of the last data call (30th June) and the problems encountered to reach it, it is proposed that future data calls are issued in late winter, e.g. February or March, when data providers are more available to address any problems associated with uploading the data to the database.
4 ) Regarding the frequency of future data calls, JWGBird considers there to be value in issuing an annual data call with which to update assessments of indicators B1- marine bird abundance and B3- breeding success. This will enable the group to track changes in marine bird populations and to develop appropriate advice on how to address a decline in abundance and breeding success, with management action or further research. However, we recognize that some Contracting Parties may not be able to respond to all annual data calls because of financial constraints where significant resources are required to collate data.
5.1.5 Other issues
The data providers in JWGBird would appreciate some immediate feedback from the database when they upload data. ICES are currently developing a summary record that data providers will receive immediately after submission and will enable them to check if all data were uploaded correctly. The summary record could include a list of species for each data type (i.e. non-breeding abundance, breeding abundance, breeding success), time-span of dataseries, number of sites, etc. Furthermore, it may be useful to compare the latest update with the summary records from the previous updates.
ICES have also developed a map showing the location of sites included in the data, which helps to immediately identify errors in e.g. spatial references. This map is available by logging on at http://biodiversity.ices.dk/managebirds/browseFiles.aspx.
Some providers felt that the submission of data on wintering bird abundance to the OSPAR Biodiversity Data Portal required a supplication of effort, because the same data are already submitted to Wetlands International’s International Waterbird Census (IWC) database. The feasibility of querying the IWC database could be investigated, which could reduce effort by some countries.
5.2 HELCOM
HELCOM sent a data call to its contracting parties, requesting for data in order to calculate the core indicators “Abundance of waterbirds in the breeding season” (HELCOM, 2015a) and “Abundance of waterbirds in the wintering season” (HELCOM, 2015b) due 30th April 2016. The response to the data call was generally good, though
JWGBIRD REPORT 2016 | 111
a number of problems occurred during the processes of data delivery and the early stage of analysis.
There was a considerable delay in data delivery, meaning that no data arrived in the HELCOM data centre in time, it was necessary to send reminders and last deliveries were obtained by end of August. Whereas wintering bird data (from land-based IWC midwinter counts) finally achieved completeness, geographical gaps regarding breeding bird data endured until the final stage of the analysis. In addition, part of the data were not delivered via the official channels (i.e. directly from data holders to the analyst rather than from the CP to HELCOM) and not in the required standard format, the latter causing extra work and further delay. In future, all parties involved in the process of indicator assessments are therefore asked to stick more tightly to the procedures along bird abundance data calls.
Despite these problems, for the first time ever, the breeding bird indicator could be calculated and resulted in Baltic-wide trends (1991–2015) for a total of 29 species. In addition, there was a good coverage of all functional groups, with nine surface feeders, seven water columns (pelagic) feeders, four benthic feeders, six wading feeders and three grazing feeders. The wintering bird indicator was first calculated with data of 12 species up to 2010 (HELCOM, 2015b). Now, in the second analysis with data from 1991–2015, trends could be calculated for 28 species. While wading feeders are absent from most parts of the Baltic in winter and thus not considered, the other functional groups achieved good coverage (six surface feeders, nine water column (pelagic) feeders, eight benthic feeders, five grazing feeders). Therefore, the two bird abundance indicators are ready for supporting the forthcoming holistic assessment of the Baltic (HOLAS II).
5.2.1 References
HELCOM. 2015a. Abundance of waterbirds in the breeding season. HELCOM core indicator report. http://helcom.fi/baltic-sea-trends/indicators/abundance-of-waterbirds-in-the-breeding-season/
HELCOM. 2015b. Abundance of waterbirds in the wintering season. HELCOM core indicator report. http://helcom.fi/baltic-sea-trends/indicators/abundance-of-waterbirds-in-the-wintering-season/
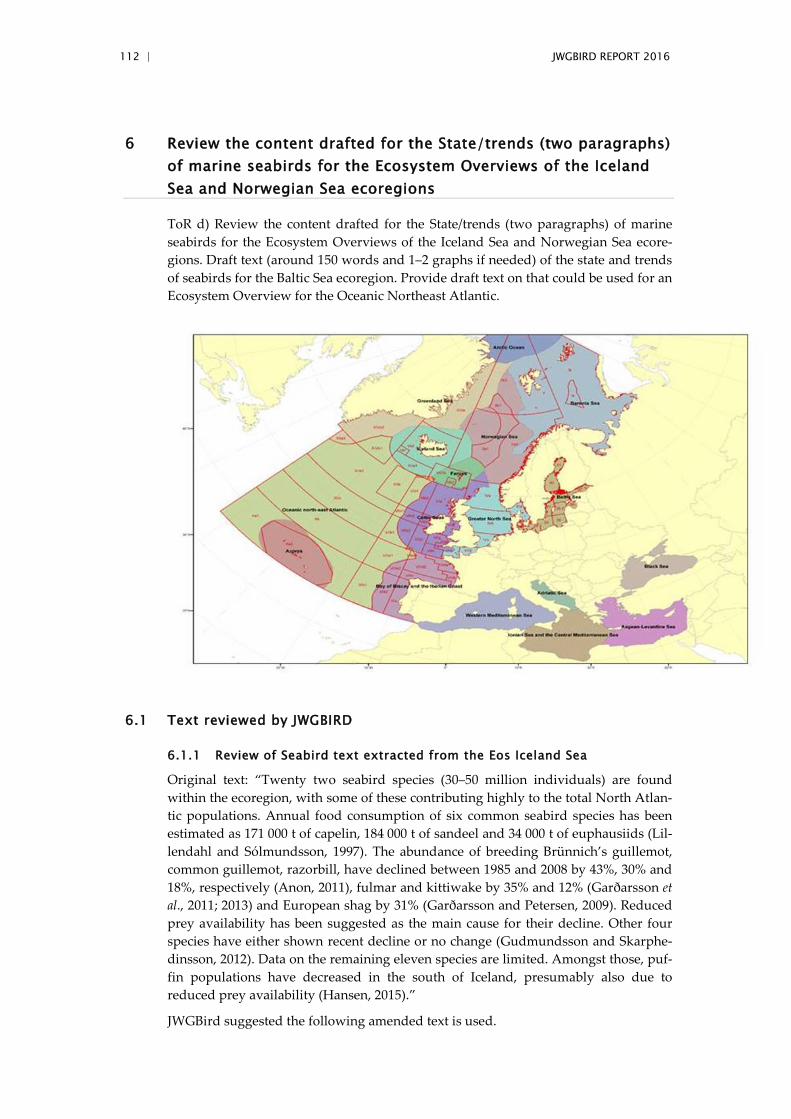
112 | JWGBIRD REPORT 2016
6 Review the content drafted for the State/trends (two paragraphs) of marine seabirds for the Ecosystem Overviews of the Iceland Sea and Norwegian Sea ecoregions
ToR d) Review the content drafted for the State/trends (two paragraphs) of marine seabirds for the Ecosystem Overviews of the Iceland Sea and Norwegian Sea ecore-gions. Draft text (around 150 words and 1–2 graphs if needed) of the state and trends of seabirds for the Baltic Sea ecoregion. Provide draft text on that could be used for an Ecosystem Overview for the Oceanic Northeast Atlantic.
6.1 Text reviewed by JWGBIRD
6.1.1 Review of Seabird text extracted from the Eos Iceland Sea
Original text: “Twenty two seabird species (30–50 million individuals) are found within the ecoregion, with some of these contributing highly to the total North Atlan-tic populations. Annual food consumption of six common seabird species has been estimated as 171 000 t of capelin, 184 000 t of sandeel and 34 000 t of euphausiids (Lil-lendahl and Sólmundsson, 1997). The abundance of breeding Brünnich’s guillemot, common guillemot, razorbill, have declined between 1985 and 2008 by 43%, 30% and 18%, respectively (Anon, 2011), fulmar and kittiwake by 35% and 12% (Garðarsson et al., 2011; 2013) and European shag by 31% (Garðarsson and Petersen, 2009). Reduced prey availability has been suggested as the main cause for their decline. Other four species have either shown recent decline or no change (Gudmundsson and Skarphe-dinsson, 2012). Data on the remaining eleven species are limited. Amongst those, puf-fin populations have decreased in the south of Iceland, presumably also due to reduced prey availability (Hansen, 2015).”
JWGBird suggested the following amended text is used.
JWGBIRD REPORT 2016 | 113
Around 30–50 million seabirds, consisting of 22 species are found within the ecore-gion. Substantial proportions of the total North Atlantic populations of some species are found there (Barrett et al., 2006). Annual food consumption of six common seabird species has been estimated at 171 000 t of capelin, 184 000 t of sandeel and 34 000 t of euphausiids (Lilliendahl and Sólmundsson, 1997).The abundance of breeding Brünnich’s guillemot, common guillemot, razorbill, northern fulmar and black-legged kittiwake have declined between 1985 and 2008 by 43%, 30%, 18%, 35% and 12% re-spectively (Anon, 2011; Garðarsson et al., 2011; 2013; In press). The number of black-legged kittiwakes and European shags breeding in western Iceland declined by 44% and 31%, respectively between 1993 and 2007, with an annual rate of decline in kitti-wakes of -5.7% (Petersen, 2010; Garðarsson and Petersen, 2009). Reduced prey availa-bility has been suggested as the main cause for their decline. Four other species have either shown recent declines or no change (Guðmundsson and Skarphedinsson, 2012). Data on the remaining eleven species are limited. Amongst those, Atlantic puf-fin populations have decreased in the south and west of Iceland over the last decade, presumably also due to reduced availability of prey, especially sandeel (Hansen, 2015).
6.1.1.1 References
Barrett, R.T., Chapdelaine, G., Anker-Nilssen, T., Mosbech, A., Montevecchi, W.A., Reid, J.R. and Veit, R.R. 2006. Seabird numbers and prey consumption in the North Atlantic. ICES Journal of Marine Science 63: 1145–1158.
Garðarsson, A. and Petersen P. 2009. The Icelandic population of European Shag. Bliki 30: 9–26.
Garðarsson, A., Gudmundsson G.A. and Lilliendahl, K. 2011. Numbers of Northern Fulmar Fulmarus glacialis in Iceland: notes on early records, and changes between 1983–1986 and 2005–2009. – Bliki 31: 1–10.
Garðarsson, A., Gudmundsson G.A. and Lilliendahl, K. 2013. Numbers of Kittiwakes in Ice-land in 2005–2009 and recent changes. – Bliki 32: 1–10.
Garðarsson, A., Guðmundsson, G.A. and Lilliendahl, K. In press. The numbers of large auks on the cliffs of Iceland in 2006–2008. Bliki, 33, xx-yy.
Gudmundsson, G.A. and Skarphedinsson, K.H. 2012. Vöktun íslenskra fuglastofna: For-gangsröðun tegunda og tillögur að vöktun.
Hansen, E.S. 2015. Lundarannsóknir 2014. Vöktun viðkomu, fæðu,líftala og könnun vetrarstöðva. Lokaskýrsla til umhverfisráðherra. Náttúrustofa Suðurlands.
Lillendahl, K. and Solmundsson, J. 1997. An estimate of summer food consumption of six sea-bird species in Iceland. ICES Journal of marine Science, 54:624–630.
Petersen, A. 2010. The Kittiwake Rissa tridactyla in Breiðafjörður (NW-Iceland): Colony distri-bution, population changes, historical perspectives, and census techniques. Náttúru-fraedingurinn (2910) 79(1–4): 45–56.
6.1.2 Review of Seabird text extracted from the EOs_Norwegian Sea
Original Text: “The black-legged kittiwake Rissa tridactyla had again a consistently bad year in 2014, with almost total breeding failures in most of the Norwegian colo-nies. Similar to 2013, common guillemots Uria aalge had a moderate to good year in all colonies. On Røst (northern Norway) Atlantic puffins Fratercula arctica failed to produce fledglings for the eighth year in a row, while production was moderate or good in the other colonies monitored. More detailed information is presented in Bar-rett et al. (2015).”
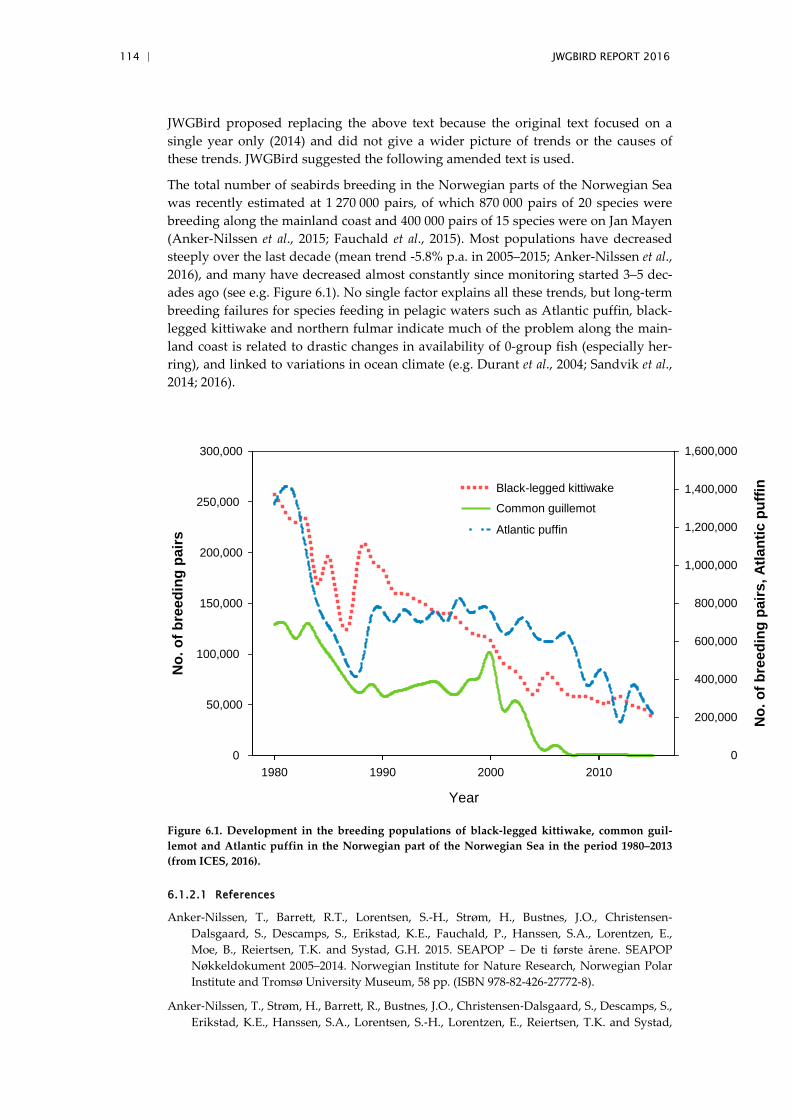
114 | JWGBIRD REPORT 2016
JWGBird proposed replacing the above text because the original text focused on a single year only (2014) and did not give a wider picture of trends or the causes of these trends. JWGBird suggested the following amended text is used.
The total number of seabirds breeding in the Norwegian parts of the Norwegian Sea was recently estimated at 1 270 000 pairs, of which 870 000 pairs of 20 species were breeding along the mainland coast and 400 000 pairs of 15 species were on Jan Mayen (Anker-Nilssen et al., 2015; Fauchald et al., 2015). Most populations have decreased steeply over the last decade (mean trend -5.8% p.a. in 2005–2015; Anker-Nilssen et al., 2016), and many have decreased almost constantly since monitoring started 3–5 dec-ades ago (see e.g. Figure 6.1). No single factor explains all these trends, but long-term breeding failures for species feeding in pelagic waters such as Atlantic puffin, black-legged kittiwake and northern fulmar indicate much of the problem along the main-land coast is related to drastic changes in availability of 0-group fish (especially her-ring), and linked to variations in ocean climate (e.g. Durant et al., 2004; Sandvik et al., 2014; 2016).
Year
1980 1990 2000 2010
No.
of b
reed
ing
pairs
0
50,000
100,000
150,000
200,000
250,000
300,000
No.
of b
reed
ing
pairs
, Atla
ntic
puf
fin0
200,000
400,000
600,000
800,000
1,000,000
1,200,000
1,400,000
1,600,000
Atlantic puffin
Black-legged kittiwake Common guillemot
Figure 6.1. Development in the breeding populations of black-legged kittiwake, common guil-lemot and Atlantic puffin in the Norwegian part of the Norwegian Sea in the period 1980–2013 (from ICES, 2016).
6.1.2.1 References
Anker-Nilssen, T., Barrett, R.T., Lorentsen, S.-H., Strøm, H., Bustnes, J.O., Christensen-Dalsgaard, S., Descamps, S., Erikstad, K.E., Fauchald, P., Hanssen, S.A., Lorentzen, E., Moe, B., Reiertsen, T.K. and Systad, G.H. 2015. SEAPOP – De ti første årene. SEAPOP Nøkkeldokument 2005–2014. Norwegian Institute for Nature Research, Norwegian Polar Institute and Tromsø University Museum, 58 pp. (ISBN 978-82-426-27772-8).
Anker‐Nilssen, T., Strøm, H., Barrett, R., Bustnes, J.O., Christensen‐Dalsgaard, S., Descamps, S., Erikstad, K.E., Hanssen, S.A., Lorentsen, S.‐H., Lorentzen, E., Reiertsen, T.K. and Systad,
JWGBIRD REPORT 2016 | 115
G.H. 2016. Key‐site monitoring in Norway 2015, including Svalbard and Jan Mayen. SEA-POP Short Report 1‐2016, 14 pp.
Durant, J.M., Anker-Nilssen, T. and Stenseth, N.C. 2003. Trophic interactions under climate fluctuations: the Atlantic puffin as an example. Proceedings of the Royal Society, London, Series B 270: 1461–1466.
Fauchald, P., Anker-Nilssen, T., Barrett, R.T., Bustnes, J.O., Bårdsen, B.J., Christensen-Dalsgaard, S., Descamps, S., Engen, S., Erikstad, K.E., Hanssen, S.A., Lorentsen, S.-H., Moe, B., Reiertsen, T.K., Strøm, H., Systad, G.H. 2015a. The status and trends of seabirds breeding in Norway and Svalbard. NINA Report 1151, 84 pp.
ICES. 2016. ICES WGINOR report 2015. Final report of the Working Group on Integrated As-sessments of the Norwegian Sea (WGINOR) 7–11 December 2015, Reykjavik, Iceland. ICES CM 2014/SSGIEA:10, REF. SCICOM, Copenhagen, 147 pp.
Sandvik, H., Reiertsen, T.K., Erikstad, K.E., Anker-Nilssen, T., Barrett, R.T., Lorentsen, S.-H., Systad, G.H. and Myksvoll, M.S. 2014. The decline of Norwegian kittiwake populations: modelling the role of ocean warming. Climate Research 60: 91–102.
Sandvik, H., Barrett, R.T., Erikstad, K.E., Myksvoll, M.S., Vikebø, F., Yoccoz, N.G., Anker-Nilssen, T., Lorentsen, S.-H., Reiertsen, T.K., Skarðhamar, J., Skern-Mauritzen, M., and Systad, G.H. 2016. Modelled drift patterns of fish larvae link coastal morphology to sea-bird colony distribution. Nature Communications 7:11599.
6.2 New Text Drafted by JWGBIRD
6.2.1 Seabird text for the EO Baltic Sea
At least 16 species of seabird breed on the coasts of the Baltic Sea, including large numbers of Razorbill Alca torda, Herring Gull Larus argentatus, Common Gull Larus canus and Cormorants Phalacrocorax carbo. Different species have shown different trends in breeding numbers: six were declining, five were increasing, three were sta-ble and the trend was uncertain in two species. The greatest declines in breeding numbers were observed in Common Eider Somateria molllissima and Great Black-backed Gull Larus marinus.
At least 17 species of seabirds spend the winter in the Baltic sea and it is an important wintering area for the globally threatened Long-tailed Duck Clangula hyemalis, Velvet Scoter Melanitta fusca and Steller’s Eider Polysticta stelleri. All three species have been declining in number during the last 25 years and so have many other benthic-feeding species. Numbers fish-eating species increased during the 1990s and since then, have declined back to the previous levels.
6.2.2 Seabird text for the EO Oceanic Northeast Atlantic
Due the paucity of information for this area, JWGBird were unable to propose any text.
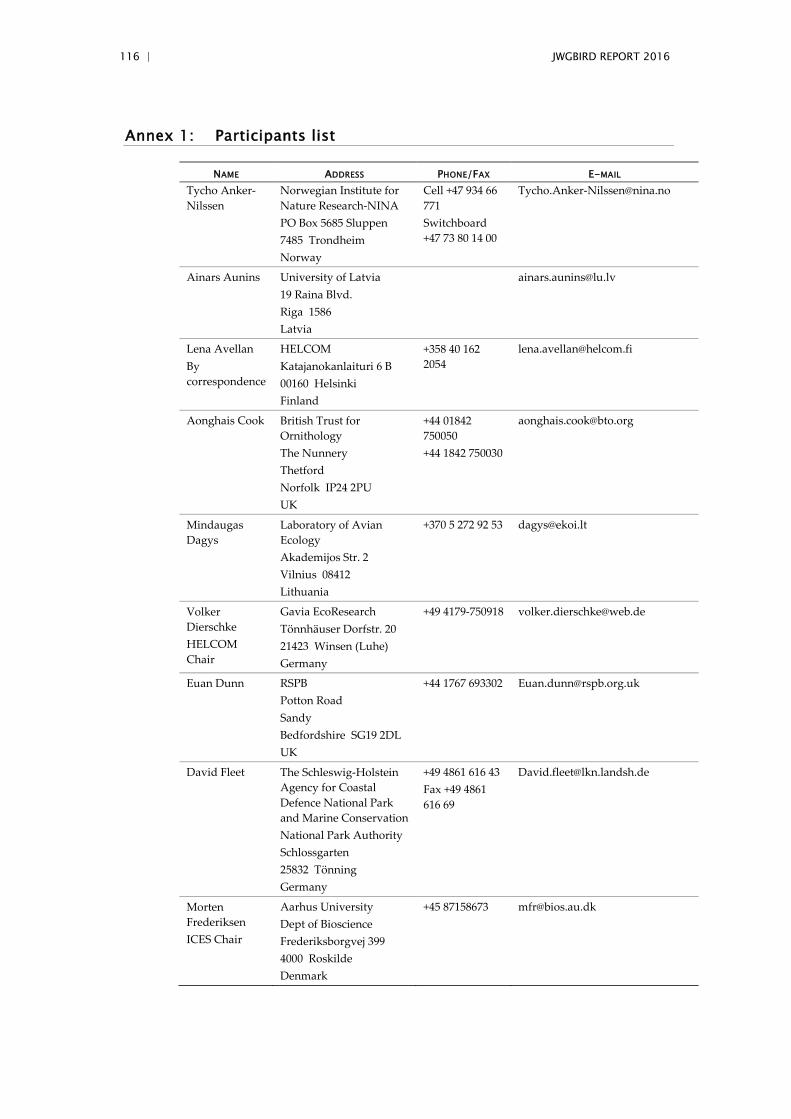
116 | JWGBIRD REPORT 2016
Annex 1: Participants list
NAME ADDRESS PHONE/FAX E-MAIL Tycho Anker-Nilssen
Norwegian Institute for Nature Research-NINA PO Box 5685 Sluppen 7485 Trondheim Norway
Cell +47 934 66 771 Switchboard +47 73 80 14 00
Ainars Aunins University of Latvia 19 Raina Blvd. Riga 1586 Latvia
Lena Avellan By correspondence
HELCOM Katajanokanlaituri 6 B 00160 Helsinki Finland
+358 40 162 2054
Aonghais Cook British Trust for Ornithology The Nunnery Thetford Norfolk IP24 2PU UK
+44 01842 750050 +44 1842 750030
Mindaugas Dagys
Laboratory of Avian Ecology Akademijos Str. 2 Vilnius 08412 Lithuania
+370 5 272 92 53 [email protected]
Volker Dierschke HELCOM Chair
Gavia EcoResearch Tönnhäuser Dorfstr. 20 21423 Winsen (Luhe) Germany
+49 4179-750918 [email protected]
Euan Dunn RSPB Potton Road Sandy Bedfordshire SG19 2DL UK
+44 1767 693302 [email protected]
David Fleet The Schleswig-Holstein Agency for Coastal Defence National Park and Marine Conservation National Park Authority Schlossgarten 25832 Tönning Germany
+49 4861 616 43 Fax +49 4861 616 69
Morten Frederiksen ICES Chair
Aarhus University Dept of Bioscience Frederiksborgvej 399 4000 Roskilde Denmark
+45 87158673 [email protected]
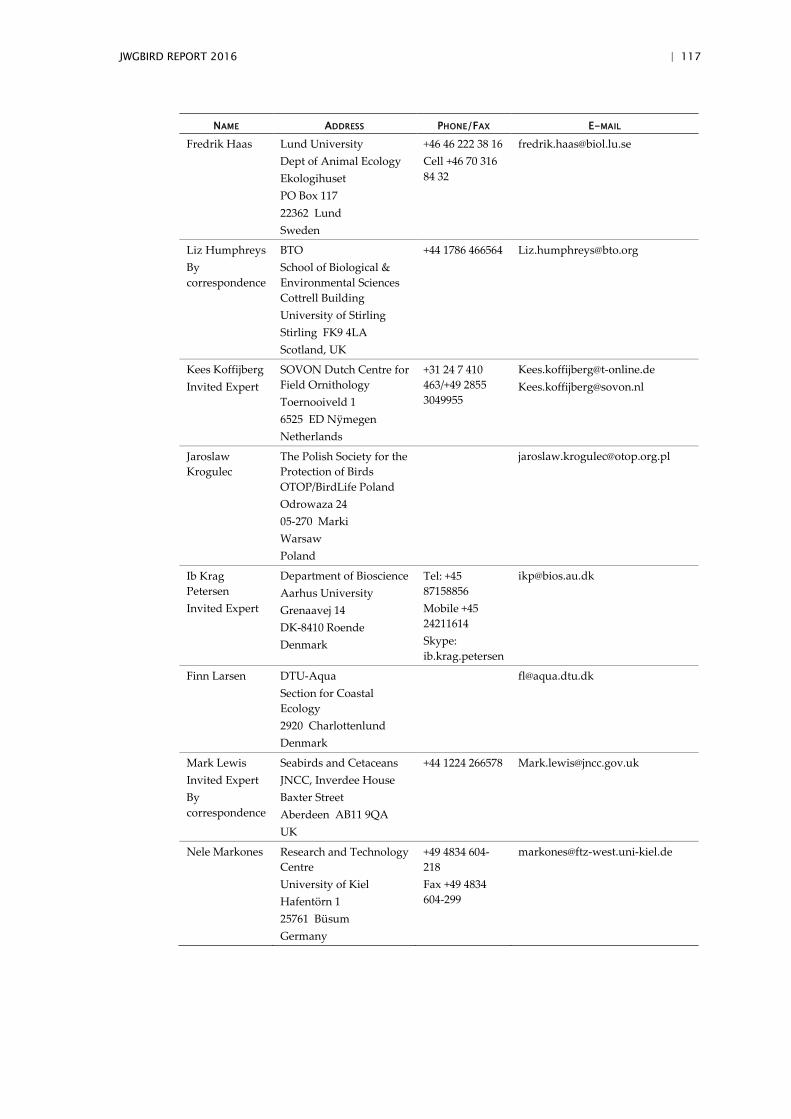
JWGBIRD REPORT 2016 | 117
NAME ADDRESS PHONE/FAX E-MAIL
Fredrik Haas Lund University Dept of Animal Ecology Ekologihuset PO Box 117 22362 Lund Sweden
+46 46 222 38 16 Cell +46 70 316 84 32
Liz Humphreys By correspondence
BTO School of Biological & Environmental Sciences Cottrell Building University of Stirling Stirling FK9 4LA Scotland, UK
+44 1786 466564 [email protected]
Kees Koffijberg Invited Expert
SOVON Dutch Centre for Field Ornithology Toernooiveld 1 6525 ED Nÿmegen Netherlands
+31 24 7 410 463/+49 2855 3049955
[email protected] [email protected]
Jaroslaw Krogulec
The Polish Society for the Protection of Birds OTOP/BirdLife Poland Odrowaza 24 05-270 Marki Warsaw Poland
Ib Krag Petersen Invited Expert
Department of Bioscience Aarhus University Grenaavej 14 DK-8410 Roende Denmark
Tel: +45 87158856 Mobile +45 24211614 Skype: ib.krag.petersen
Finn Larsen DTU-Aqua Section for Coastal Ecology 2920 Charlottenlund Denmark
Mark Lewis Invited Expert By correspondence
Seabirds and Cetaceans JNCC, Inverdee House Baxter Street Aberdeen AB11 9QA UK
+44 1224 266578 [email protected]
Nele Markones Research and Technology Centre University of Kiel Hafentörn 1 25761 Büsum Germany
+49 4834 604-218 Fax +49 4834 604-299
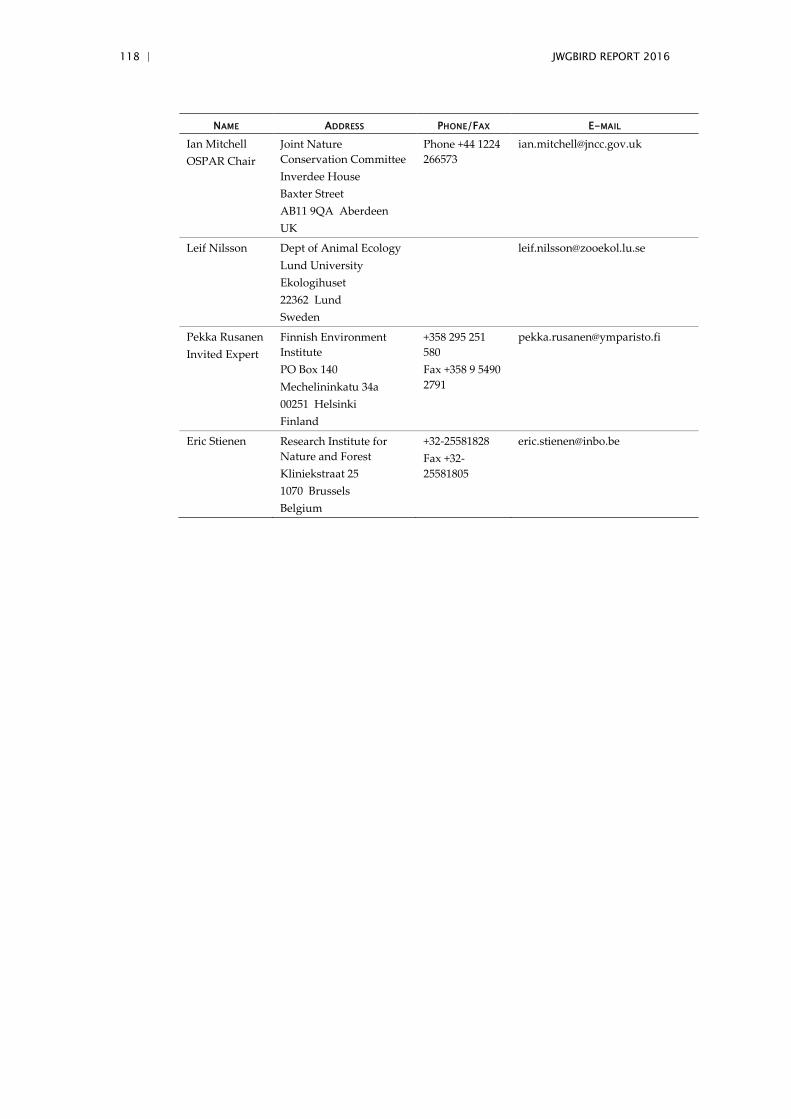
118 | JWGBIRD REPORT 2016
NAME ADDRESS PHONE/FAX E-MAIL
Ian Mitchell OSPAR Chair
Joint Nature Conservation Committee Inverdee House Baxter Street AB11 9QA Aberdeen UK
Phone +44 1224 266573
Leif Nilsson Dept of Animal Ecology Lund University Ekologihuset 22362 Lund Sweden
Pekka Rusanen Invited Expert
Finnish Environment Institute PO Box 140 Mechelininkatu 34a 00251 Helsinki Finland
+358 295 251 580 Fax +358 9 5490 2791
Eric Stienen Research Institute for Nature and Forest Kliniekstraat 25 1070 Brussels Belgium
+32-25581828 Fax +32-25581805
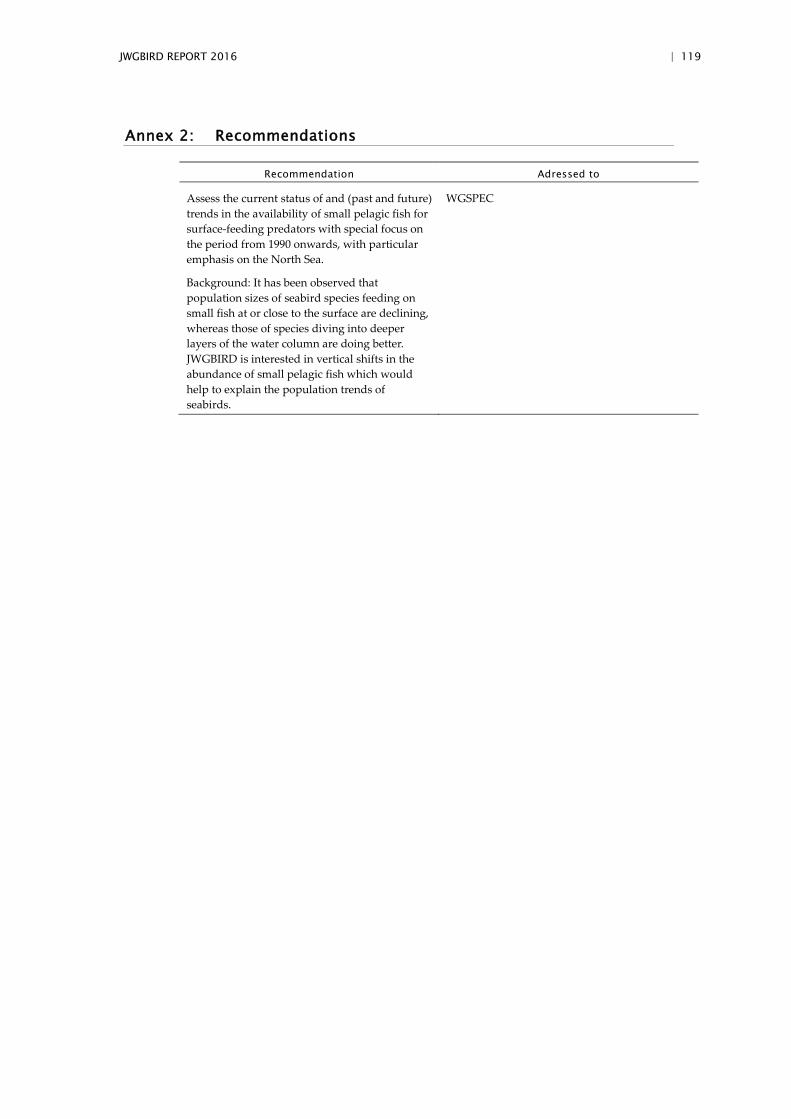
JWGBIRD REPORT 2016 | 119
Annex 2: Recommendations
Recommendation Adressed to
Assess the current status of and (past and future) trends in the availability of small pelagic fish for surface-feeding predators with special focus on the period from 1990 onwards, with particular emphasis on the North Sea.
Background: It has been observed that population sizes of seabird species feeding on small fish at or close to the surface are declining, whereas those of species diving into deeper layers of the water column are doing better. JWGBIRD is interested in vertical shifts in the abundance of small pelagic fish which would help to explain the population trends of seabirds.
WGSPEC
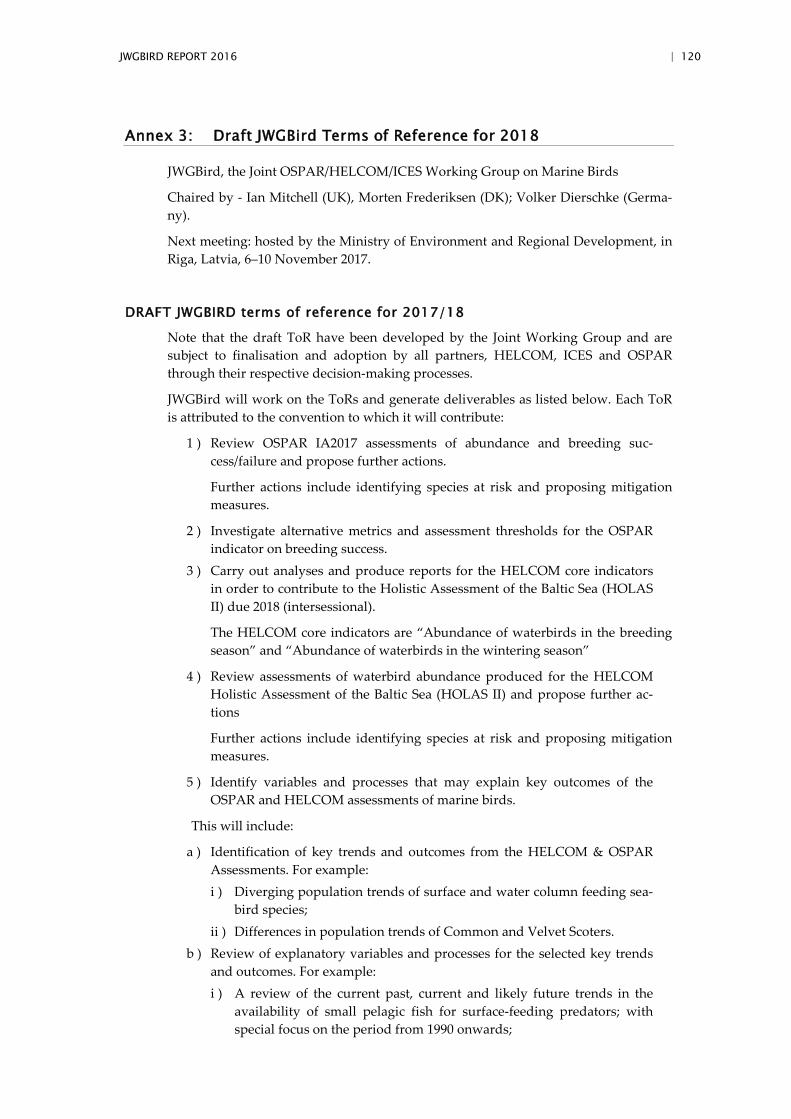
JWGBIRD REPORT 2016 | 120
Annex 3: Draft JWGBird Terms of Reference for 2018
JWGBird, the Joint OSPAR/HELCOM/ICES Working Group on Marine Birds
Chaired by - Ian Mitchell (UK), Morten Frederiksen (DK); Volker Dierschke (Germa-ny).
Next meeting: hosted by the Ministry of Environment and Regional Development, in Riga, Latvia, 6–10 November 2017.
DRAFT JWGBIRD terms of reference for 2017/18
Note that the draft ToR have been developed by the Joint Working Group and are subject to finalisation and adoption by all partners, HELCOM, ICES and OSPAR through their respective decision-making processes.
JWGBird will work on the ToRs and generate deliverables as listed below. Each ToR is attributed to the convention to which it will contribute:
1 ) Review OSPAR IA2017 assessments of abundance and breeding suc-cess/failure and propose further actions.
Further actions include identifying species at risk and proposing mitigation measures.
2 ) Investigate alternative metrics and assessment thresholds for the OSPAR indicator on breeding success.
3 ) Carry out analyses and produce reports for the HELCOM core indicators in order to contribute to the Holistic Assessment of the Baltic Sea (HOLAS II) due 2018 (intersessional).
The HELCOM core indicators are “Abundance of waterbirds in the breeding season” and “Abundance of waterbirds in the wintering season”
4 ) Review assessments of waterbird abundance produced for the HELCOM Holistic Assessment of the Baltic Sea (HOLAS II) and propose further ac-tions
Further actions include identifying species at risk and proposing mitigation measures.
5 ) Identify variables and processes that may explain key outcomes of the OSPAR and HELCOM assessments of marine birds.
This will include:
a ) Identification of key trends and outcomes from the HELCOM & OSPAR Assessments. For example: i ) Diverging population trends of surface and water column feeding sea-
bird species; ii ) Differences in population trends of Common and Velvet Scoters.
b ) Review of explanatory variables and processes for the selected key trends and outcomes. For example: i ) A review of the current past, current and likely future trends in the
availability of small pelagic fish for surface-feeding predators; with special focus on the period from 1990 onwards;
121 | JWGBIRD REPORT 2016
ii ) A review of differing life history traits of Common and Velvet Scoters.
6 ) Provide seabird information for the ICES Ecosystem Overviews (recurring when required).
7 ) Can we use Citizen Science more extensively in the study of seabird ecolo-gy?
This ToR will include a review of past and present studies and an exchange of experience (e.g. from the Norwegian experiences of the 2016 City gulls project - Tycho Anker-Nilsen). The aim of the ToR will be to propose the following:
a ) How can methods be standardised? b ) How do we build capacity (i.e. increase appropriate skills in volunteers)? c ) How do we make better use of those highly skilled individuals?
Justification for the ToRs
ToR 1
The OSPAR Intermediate Assessment will be published in July 2017. It will conclude the following for marine birds, based on assessments carried out by JWGBird of indi-cators of abundance and of breeding success/failure:
Within Marine birds the Seabird species have experienced frequent and widespread breeding failure over the period assessed (2010 to 2015 inclusive) in Norwegian parts of Arctic Waters, the Greater North Sea and in Celtic Seas. The surface feeding birds in the Greater North Sea and Celtic Seas frequently failed to raise young.
In Norwegian parts of Arctic Waters, the Celtic Seas and the Greater North Sea, less than 75% of marine birds have met assessment values for annual relative abundance, indicating that bird populations are not healthy. Since mid-2000, abundance has been below baselines set in 1992. Abundance estimates are based on seabirds breeding on the coast and waterbirds in coastal areas during migration and over-winter.
JWGBird will review these outcomes and identify priorities for further action. In par-ticular, it will propose actions that are relevant to OSPAR’s to Joint Assessment and Monitoring Programme and to the implementation of OSPAR’s Recommendations for bird species listed as ‘Threatened and Declining’.
JWGBird will provide advice to OSPAR’s ICG-COBAM to help it develop the steps needed to regionally coordinate monitoring of each of the bird common indicators, and to integrate bird monitoring with other marine biodiversity monitoring at a (sub)regional scale (cf. ICG-COBAM ToRs 2017/2018).
JWGBird will also focus on how the outcomes of the IA2017 indicator assessments can inform the implementation of recommendations for the list of Threatened and Declining bird species: lesser black-backed gull (L. f. fuscus subspecies only), ivory gull, little shearwater, Balearic shearwater, black-legged kittiwake, Roseate tern, thick-billed murre, Steller’s eider, Iberian guillemot (the population of Uria aalge albionis subspecies of the com-mon guillemot, which breeds on the northern coast of the Iberian peninsula). In particular, it will highlight where the current and future assessments of OSPAR bird indicators can be used to monitor status and threats and inform further research and data collection (cf. ICG-POSH’s draft plan for the implementation of collective actions within the Rec-
JWGBIRD REPORT 2016 | 122
ommendations for the protection and conservation of OSPAR listed Species and Hab-itats.)
ToR 2
Justification for this ToR is provided in the IA2017 assessment of marine bird breed-ing success/failure and is based on previous recommendations by JWGBird:
“The ICES/OSPAR/HELCOM Joint Working Group on Marine Birds (JWGBird) de-veloped this indicator assessment but has acknowledged some limitations (ICES, 2015). The assessment methods for the marine bird breeding success / failure indica-tor currently focus on the extreme events of almost no chicks being produced by a colony, on average, per year. In doing so, they fail to identify other years where poor breeding success could still have significant negative impacts on the population in the longer term.
However, it is not straightforward to categorise annual breeding success as ‘good’ or ‘poor’. The reason breeding has not been directly assessed as ‘good’ or ‘poor’ in this indicator is because the number of chicks that need to be produced each year to sus-tain a population or cause it to grow, varies substantially as other demographic pa-rameters (e.g. survival rates) also vary in space and time. Information on demographics such as survival rate, age at first breeding and immature survival rates are more resource demanding to measure owing to the need to monitor individual birds from year to year. For well-studied species and at a few intensively studied sites these data do exist.
A possible step forward towards setting accurate and objective targets for annual breeding success rates would be to collate an inventory of ongoing monitoring of survival rates in the North-East Atlantic and conduct a review of published estimates. Once survival estimates and other demographics have been collated, some simple population modelling could be undertaken to produce some preliminary estimates of the levels of breeding success required to sustain or increase the population.”
ToR 3
In order to assess and improve the status of their marine areas, EU has implemented a Marine Strategy Framework Direction (MSFD), in which indicators are used for as-sessments. Indicators were developed in the RSCs OSPAR and HELCOM and are also used for region-specific assessments. In the HELCOM area, two indicators meas-uring abundances of breeding and wintering waterbirds were developed in projects (HELCOM CORESET I and II). In continuation of that work JWGBIRD is carrying out the development and analyses for the two indicators, which will contribute to the 2018 Holistic Assessment of the Baltic (HELCOM HOLAS II). The analyses currently build on data called for from national databases of breeding birds and coastal mid-winter counts (International Waterbird Census), respectively. Intersessional work of JWGBIRD needs to update results and reports with data until including 2016, allow-ing assessments for the entire Baltic (breeding birds) or on the level of seven sub-regions (merged sub-basins of the Baltic, wintering birds). Depending on decisions about the structure of MSFD by the European Commission, part of the intersessional work may be to adjust the indicator concepts according to the respective require-ments.
123 | JWGBIRD REPORT 2016
ToR 4
As contribution to assessments of the Baltic Sea in the frame of MSFD and HELCOM HOLAS II (see ToR 4), two indicators covering the abundance of waterbirds are dealt with in JWGBIRD. The indicator results show species-specific trends of breeding and wintering waterbirds. Based on its expert knowledge JWGBIRD will discuss the meaning of the results in the frame of general environmental conditions of the Baltic. Apart from the assessment of marine areas (entire Baltic for breeding birds, subre-gions of the Baltic for wintering birds) the indicator results allow to identify species at risk, i.e. species strongly declining since the start of Baltic-wide data collection (1991). The abundance of many breeding and wintering waterbird species influenced by human action, and declines are often connected to specific anthropogenic impact. In order to improve the status of declining species it appears appropriate to develop and propose mitigation measures, which form an essential part of MSFD. Thus, this ToR aims to find solutions on the impact side of the medal, whereas the “sister ToR 5” deals with the more biological components involved in population trends.
ToR 5
ICES has played a key role in supporting the development of regional indicators of bird population status in the Greater North Sea since the inception of EcoQOs in 2001. The joint OSPAR/ICES working group was formed in 2014 in order to e.g. take forward the further development and testing of these indicators. It was joined in 2015 by HELCOM to further enhance coherence of environmental status assessments be-tween the two RSCs.
Both RSCs adopted a first set of common or core indicators to support the implemen-tation of the EU MSFD each including two common/core indicators for marine birds. First assessments of the abundance indicators have shown strong differences in trend results between different species and functional groups in the OSPAR and HELCOM regions.
Potential example: Population sizes of seabird species feeding on small fish at or close to the surface show strong declines, whereas those of species that forage in deeper layers of the water column rather are stable or increasing. Vertical shifts in the abun-dance of small pelagic fish might play the major role in driving the population trends of seabirds. Work under ToR (5) will aim at collating available data and information sources on trends in the availability of small pelagic fish for surface-feeding predators with special focus on the period covered by OSPAR/HELCOM indicator work (1990 onwards). Collaboration with ICES WGSPEC is envisaged for this purpose.
Potential example: Velvet Scoters showed strong large-scale population declines over the last two decades. No such declines have been observed for the closely related Common Scoters. A review of the differing life-history traits might explain the ob-served differences and could at the same time deliver relevant knowledge for conser-vation and management schemes.
Work will also aim at identifying further variables and processes that might drive selected striking observed population trends.
ToR 6
To be added.

JWGBIRD REPORT 2016 | 124
ToR 7
To be added.