Embed Size (px)
Citation preview
Focal points:
Mr A. Abdulla
Deputy Executive Director
tel.: 066513-2401
Mr A. Marianelli
Director
Supply Chain Operations Division
tel.: 066513-3750
World Food Programme, Via Cesare Giulio Viola, 68/70, 00148 Rome, Italy
Executive Board
Annual session
Rome, 21–25 June 2021
Distribution: General
Date: 28 May 2021
Original: English
Agenda item 10
WFP/EB.A/2021/10-E
Administrative and managerial matters
For information
Executive Board documents are available on WFP’s website (https://executiveboard.wfp.org).
Report on global losses for the period from 1 January to
31 December 2020
Executive summary
In 2020, WFP handled 5.6 million mt of food. Despite unprecedented challenges posed by seven
Level 3 and ten Level 2 emergencies, including the coronavirus disease (COVID-19) pandemic,
which dramatically increased operational complexity, WFP provided high-quality food assistance
to more than 115 million people globally while minimizing losses.
This was enabled by an efficient, agile, end-to-end supply chain, robust risk mitigation systems and
strong management processes. However, events beyond WFP’s control resulted in relatively high
levels of global food losses.
In 2020, pre-delivery losses were 17,898 mt, with a total value of USD 8.9 million – the third highest
in terms of both volume and value since 2011. Inadequate transport accounted for 47 percent of
pre-delivery losses, valued at USD 4.4 million.
Post-delivery losses amounted to 21,875 mt for a total value of USD 13.5 million – the fourth highest
loss in terms of volume and the sixth highest in terms of value since 2011. Eighty-six percent or
18,901 mt of post-delivery losses were attributable to reconstitution, rebagging or repacking,
improper or overlong storage, deterioration due to problems at origin, inadequate transport, and
pilferage or theft.
Ten country operations accounted for 18,728 mt or 86 percent of post-delivery losses in 2020, of
which 68 percent or 12,664 mt were attributable to the Level 3 emergency operations in Yemen,
South Sudan and the Democratic Republic of the Congo.

WFP/EB.A/2021/10-E 2
Introduction
1. This report provides an overview of global losses – pre-delivery and post-delivery – in 2020
and describes recent measures for preventing or minimizing them. The annexes detail
country-specific losses and identify countries where losses were above
WFP’s reporting thresholds.1
2. Pre-delivery losses are those that occur up to the point where legal title to the food passes
to the government of the recipient country, usually at the first delivery point in the country.
3. Post-delivery losses are those that occur after food arrives in the recipient country and
before it is distributed to people in need.
4. Within the legal framework in which WFP operates, legal title of food commodities normally
passes to the government of the recipient country at the commodities’ point of first entry
into the country where they are to be distributed. However, although legal title to food
commodities held in WFP warehouses in a recipient country may have passed to the
government concerned, WFP generally retains possession well beyond the point at which
title is transferred.
5. The report does not cover unintended uses of food after distribution to beneficiaries.
Unintended uses such as sharing, theft or sale are captured through monitoring and
addressed accordingly.
6. Following its approval by the Executive Board, the WFP self-insurance scheme was extended
to cover post-delivery losses. All WFP losses are therefore covered by insurance from the
time when WFP takes possession up to the time of physical handover of commodities to a
cooperating partner, the people WFP serves or the government of a recipient country.2
Characteristics of global losses in 2020
7. Global losses in 2020 are presented in terms of volume (tonnage) and value
(United States dollars) and are compared with losses in previous years.
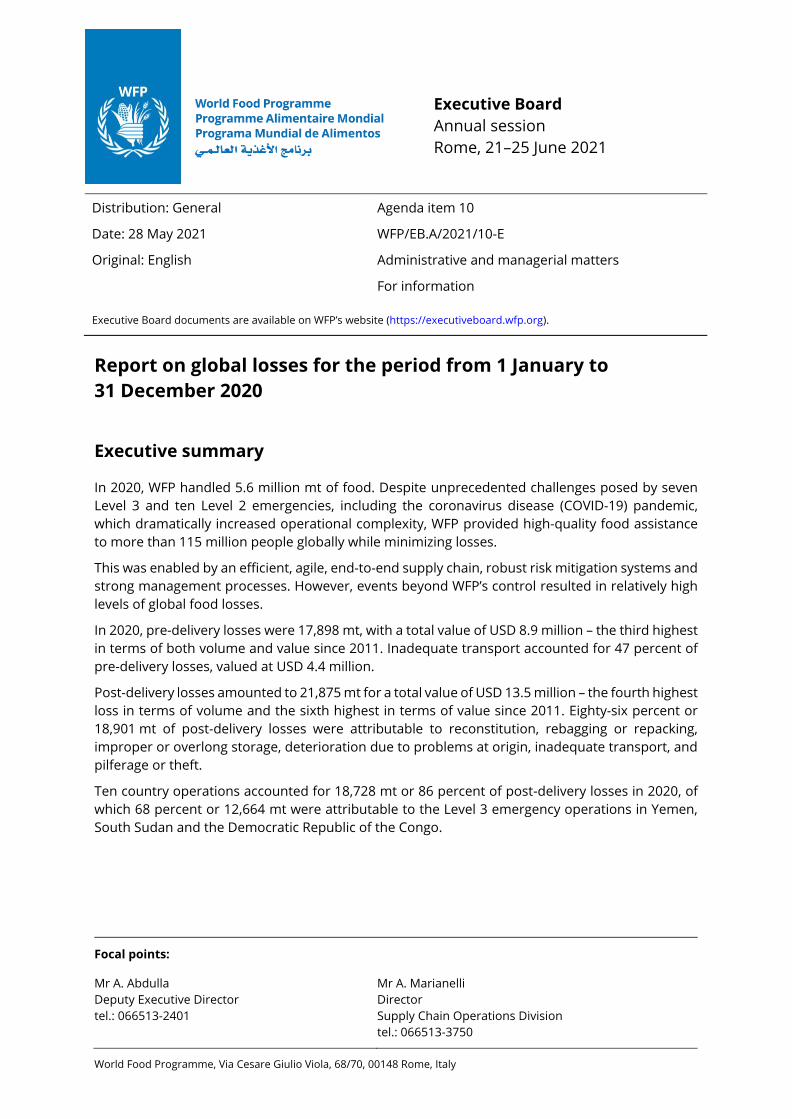
8. Significant losses beyond the control of WFP meant that the volume of global losses
in 2020 amounted to 39,773 mt, a slight decrease from 2019 but the third highest level since
2011 (see figure 1 and annex I).
1 These are countries where losses of a single food type amount to at least 2 percent of the tonnage handled and have
an absolute value of at least USD 20,000 and countries where losses of a single food type have an absolute value of more
than USD 100,000.
2 WFP Management Plan (2018–2020) (WFP/EB.2/2017/5-A/1/Rev.1).
WFP/EB.A/2021/10-E 3
Figure 1: Global food losses by volume, 2011–2020
9. The value of global losses in 2020 amounted to USD 22.4 million, compared to
USD 24.6 million in 2019.
10. Losses of sorghum, wheat flour, corn-soya blend, maize and rice amounted to 27,214 mt,
valued at USD 12.6 million and accounting for 68 percent of global losses by volume and
56 percent by value (see details in table 1).
Characteristics of pre-delivery losses in 2020
11. Pre-delivery losses in 2020 are presented in terms of volume (tonnage) and value
(United States dollars) and are compared with losses in previous years in terms of volume,
value and causes.
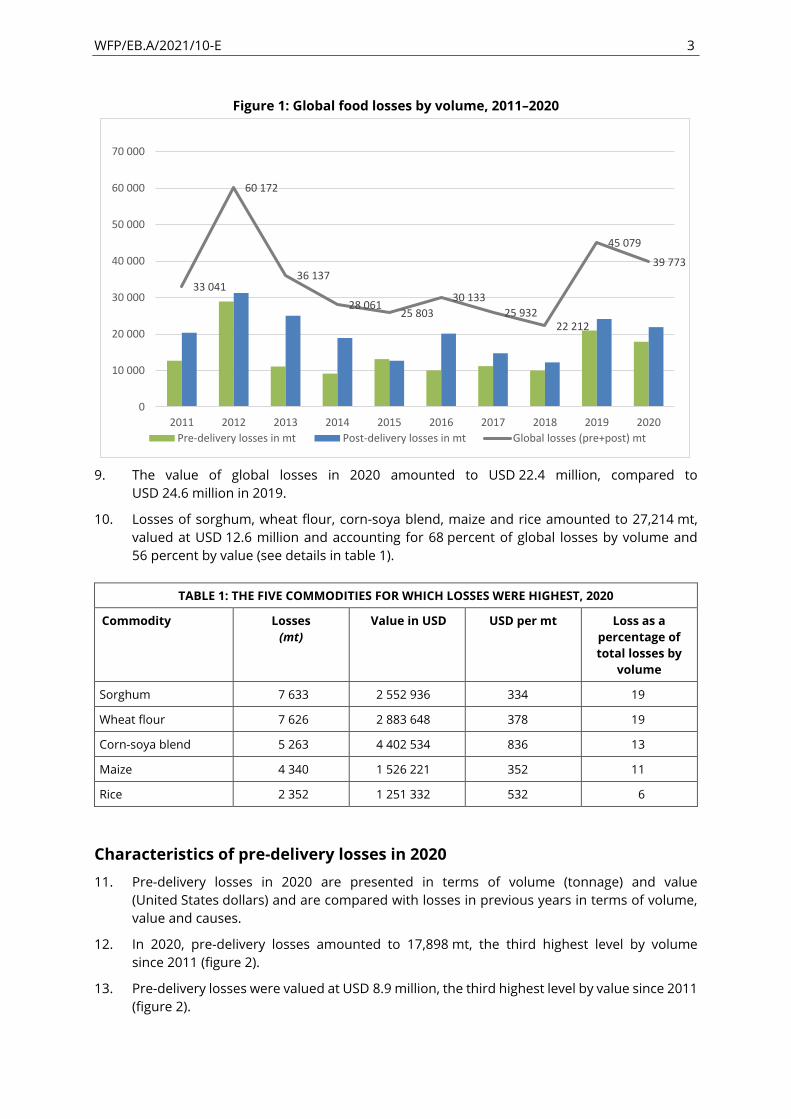
12. In 2020, pre-delivery losses amounted to 17,898 mt, the third highest level by volume
since 2011 (figure 2).
13. Pre-delivery losses were valued at USD 8.9 million, the third highest level by value since 2011
(figure 2).
33 041
60 172
36 137
28 06125 803
30 133
25 93222 212
45 079
39 773
0
10 000
20 000
30 000
40 000
50 000
60 000
70 000
2011 2012 2013 2014 2015 2016 2017 2018 2019 2020
Pre-delivery losses in mt Post-delivery losses in mt Global losses (pre+post) mt
TABLE 1: THE FIVE COMMODITIES FOR WHICH LOSSES WERE HIGHEST, 2020
Commodity Losses
(mt)
Value in USD USD per mt Loss as a
percentage of
total losses by
volume
Sorghum 7 633 2 552 936 334 19
Wheat flour 7 626 2 883 648 378 19
Corn-soya blend 5 263 4 402 534 836 13
Maize 4 340 1 526 221 352 11
Rice 2 352 1 251 332 532 6
WFP/EB.A/2021/10-E 4
Figure 2: Pre-delivery losses by volume and value, 2011–2020
14. Losses of sorghum amounting to 4,559 mt at an average value of USD 310/mt accounted for
25 percent of all pre-delivery losses.
15. Losses of 2,951 mt of corn-soya blend at an average value of USD 759/mt accounted for
16 percent of pre-delivery losses.
16. Losses of 2,149 mt of maize at an average value of USD 328/mt accounted for 12 percent of
pre-delivery losses.
Main reasons for pre-delivery losses
17. In 2020, 47 percent or 8,462 mt of pre-delivery losses, worth USD 4.4 million, were
attributable, primarily, to inadequate transport.
18. Rebagging or repacking resulted in pre-delivery losses of 4,051 mt, worth USD 1.3 million.
This accounted for 23 percent of all pre-delivery losses.
Characteristics of post-delivery losses in 2020
19. Post-delivery losses in 2020 are presented in terms of volume and value and are compared
with losses in previous years in terms of volume, value and causes.
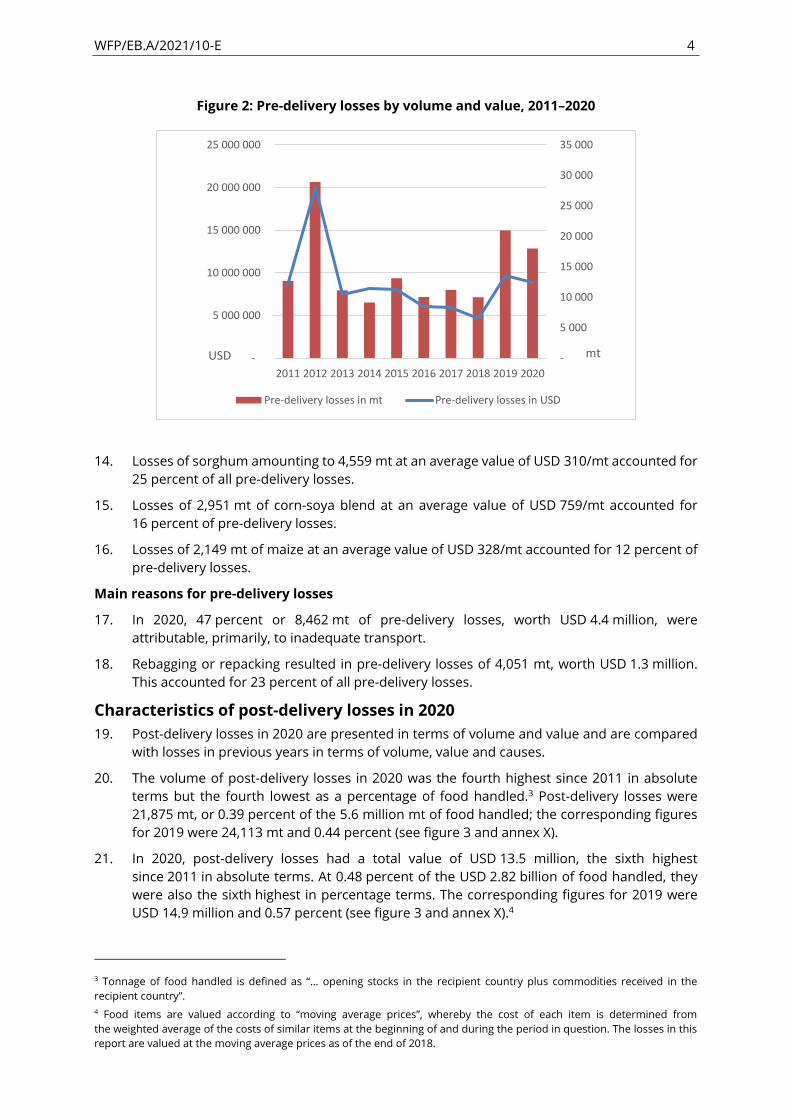
20. The volume of post-delivery losses in 2020 was the fourth highest since 2011 in absolute
terms but the fourth lowest as a percentage of food handled.3 Post-delivery losses were
21,875 mt, or 0.39 percent of the 5.6 million mt of food handled; the corresponding figures
for 2019 were 24,113 mt and 0.44 percent (see figure 3 and annex X).
21. In 2020, post-delivery losses had a total value of USD 13.5 million, the sixth highest
since 2011 in absolute terms. At 0.48 percent of the USD 2.82 billion of food handled, they
were also the sixth highest in percentage terms. The corresponding figures for 2019 were
USD 14.9 million and 0.57 percent (see figure 3 and annex X).4
3 Tonnage of food handled is defined as “… opening stocks in the recipient country plus commodities received in the
recipient country”.
4 Food items are valued according to “moving average prices”, whereby the cost of each item is determined from
the weighted average of the costs of similar items at the beginning of and during the period in question. The losses in this
report are valued at the moving average prices as of the end of 2018.
-
5 000
10 000
15 000
20 000
25 000
30 000
35 000
2011 2012 2013 2014 2015 2016 2017 2018 2019 2020
-
5 000 000
10 000 000
15 000 000
20 000 000
25 000 000
mtUSD
Pre-delivery losses in mt Pre-delivery losses in USD
WFP/EB.A/2021/10-E 5
Figure 3: Post-delivery losses by volume, 2011–2020
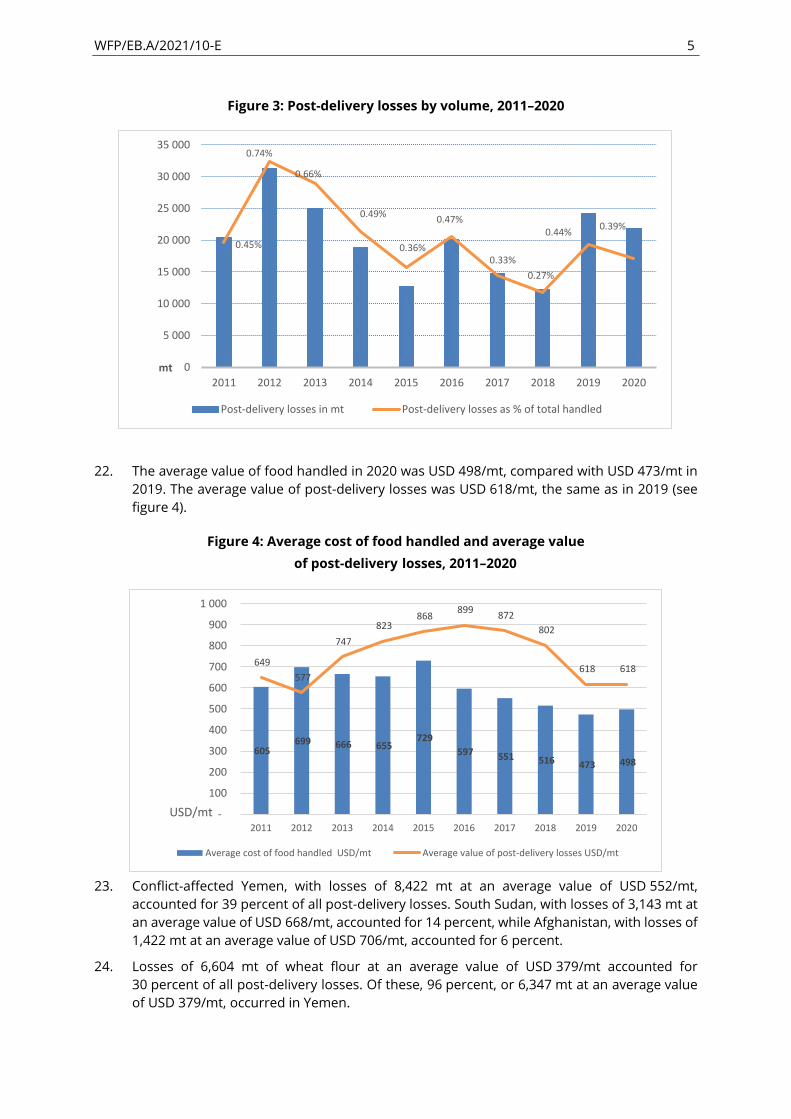
22. The average value of food handled in 2020 was USD 498/mt, compared with USD 473/mt in
2019. The average value of post-delivery losses was USD 618/mt, the same as in 2019 (see
figure 4).
Figure 4: Average cost of food handled and average value
of post-delivery losses, 2011–2020
23. Conflict-affected Yemen, with losses of 8,422 mt at an average value of USD 552/mt,
accounted for 39 percent of all post-delivery losses. South Sudan, with losses of 3,143 mt at
an average value of USD 668/mt, accounted for 14 percent, while Afghanistan, with losses of
1,422 mt at an average value of USD 706/mt, accounted for 6 percent.
24. Losses of 6,604 mt of wheat flour at an average value of USD 379/mt accounted for
30 percent of all post-delivery losses. Of these, 96 percent, or 6,347 mt at an average value
of USD 379/mt, occurred in Yemen.
0.45%
0.74%
0.66%
0.49%
0.36%
0.47%
0.33%
0.27%
0.44%0.39%
0
5 000
10 000
15 000
20 000
25 000
30 000
35 000
2011 2012 2013 2014 2015 2016 2017 2018 2019 2020mt
Post-delivery losses in mt Post-delivery losses as % of total handled
605 699 666 655
729
597 551 516 473 498
649
577
747
823 868
899 872
802
618 618
-
100
200
300
400
500
600
700
800
900
1 000
2011 2012 2013 2014 2015 2016 2017 2018 2019 2020
USD/mt
Average cost of food handled USD/mt Average value of post-delivery losses USD/mt
WFP/EB.A/2021/10-E 6
25. Losses of 3,074 mt of sorghum at an average value of USD 370/mt accounted for 14 percent
of all post-delivery losses. Of these, 55 percent, or 1,705 mt at an average value of
USD 412/mt occurred in South Sudan.
26. Losses of 2,312 mt of corn-soya blend at an average value of USD 935/mt accounted for
11 percent of all post-delivery losses. Some of these losses occurred as a result of an incident
that took place in 2019, in which substandard Super Cereal was delivered by a particular
supplier. Of all corn-soya blend post-delivery losses, 25 percent, or 568 mt at an average
value of USD 846/mt, occurred in the Democratic Republic of the Congo. A further
25 percent, or 571 mt at an average value of USD 1,159/mt, occurred in South Sudan.
Main reasons for post-delivery losses
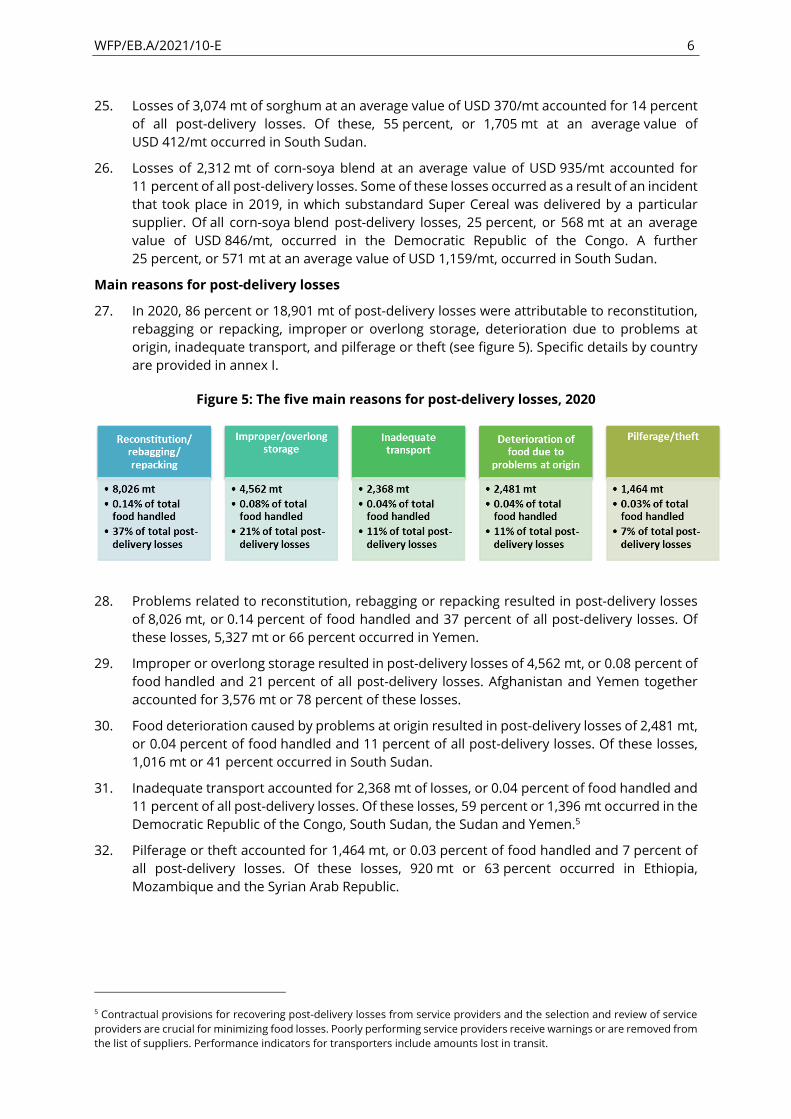
27. In 2020, 86 percent or 18,901 mt of post-delivery losses were attributable to reconstitution,
rebagging or repacking, improper or overlong storage, deterioration due to problems at
origin, inadequate transport, and pilferage or theft (see figure 5). Specific details by country
are provided in annex I.
Figure 5: The five main reasons for post-delivery losses, 2020
28. Problems related to reconstitution, rebagging or repacking resulted in post-delivery losses
of 8,026 mt, or 0.14 percent of food handled and 37 percent of all post-delivery losses. Of
these losses, 5,327 mt or 66 percent occurred in Yemen.
29. Improper or overlong storage resulted in post-delivery losses of 4,562 mt, or 0.08 percent of
food handled and 21 percent of all post-delivery losses. Afghanistan and Yemen together
accounted for 3,576 mt or 78 percent of these losses.
30. Food deterioration caused by problems at origin resulted in post-delivery losses of 2,481 mt,
or 0.04 percent of food handled and 11 percent of all post-delivery losses. Of these losses,
1,016 mt or 41 percent occurred in South Sudan.
31. Inadequate transport accounted for 2,368 mt of losses, or 0.04 percent of food handled and
11 percent of all post-delivery losses. Of these losses, 59 percent or 1,396 mt occurred in the
Democratic Republic of the Congo, South Sudan, the Sudan and Yemen.5
32. Pilferage or theft accounted for 1,464 mt, or 0.03 percent of food handled and 7 percent of
all post-delivery losses. Of these losses, 920 mt or 63 percent occurred in Ethiopia,
Mozambique and the Syrian Arab Republic.
5 Contractual provisions for recovering post-delivery losses from service providers and the selection and review of service
providers are crucial for minimizing food losses. Poorly performing service providers receive warnings or are removed from
the list of suppliers. Performance indicators for transporters include amounts lost in transit.
WFP/EB.A/2021/10-E 7
Post-delivery losses by country
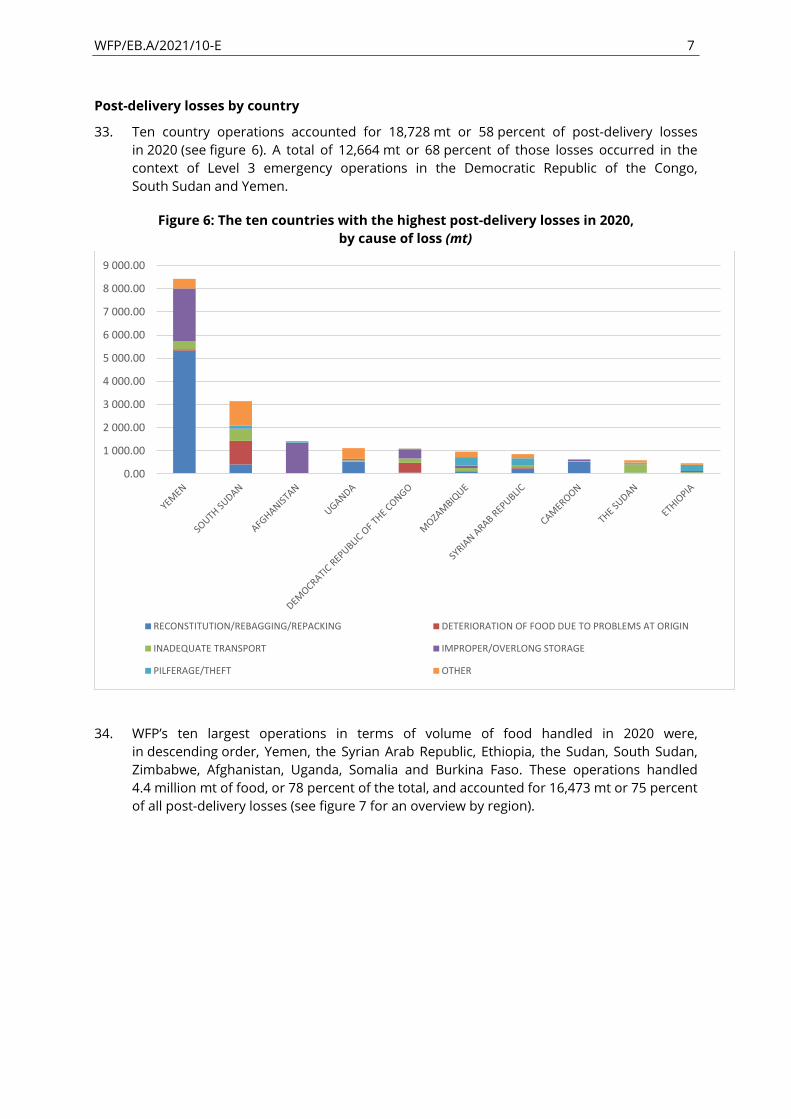
33. Ten country operations accounted for 18,728 mt or 58 percent of post-delivery losses
in 2020 (see figure 6). A total of 12,664 mt or 68 percent of those losses occurred in the
context of Level 3 emergency operations in the Democratic Republic of the Congo,
South Sudan and Yemen.
Figure 6: The ten countries with the highest post-delivery losses in 2020,
by cause of loss (mt)
34. WFP’s ten largest operations in terms of volume of food handled in 2020 were,
in descending order, Yemen, the Syrian Arab Republic, Ethiopia, the Sudan, South Sudan,
Zimbabwe, Afghanistan, Uganda, Somalia and Burkina Faso. These operations handled
4.4 million mt of food, or 78 percent of the total, and accounted for 16,473 mt or 75 percent
of all post-delivery losses (see figure 7 for an overview by region).
0.00
1 000.00
2 000.00
3 000.00
4 000.00
5 000.00
6 000.00
7 000.00
8 000.00
9 000.00
RECONSTITUTION/REBAGGING/REPACKING DETERIORATION OF FOOD DUE TO PROBLEMS AT ORIGIN
INADEQUATE TRANSPORT IMPROPER/OVERLONG STORAGE
PILFERAGE/THEFT OTHER
WFP/EB.A/2021/10-E 8
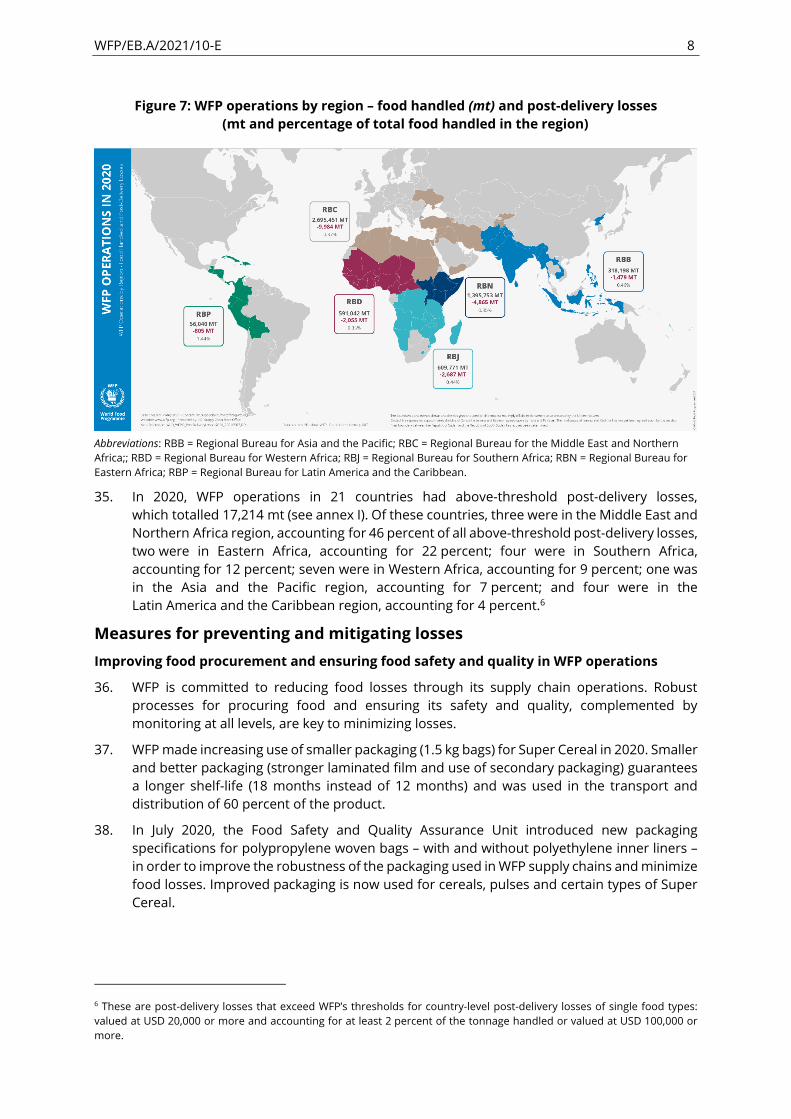
Figure 7: WFP operations by region – food handled (mt) and post-delivery losses
(mt and percentage of total food handled in the region)
Abbreviations: RBB = Regional Bureau for Asia and the Pacific; RBC = Regional Bureau for the Middle East and Northern
Africa;; RBD = Regional Bureau for Western Africa; RBJ = Regional Bureau for Southern Africa; RBN = Regional Bureau for
Eastern Africa; RBP = Regional Bureau for Latin America and the Caribbean.
35. In 2020, WFP operations in 21 countries had above-threshold post-delivery losses,
which totalled 17,214 mt (see annex I). Of these countries, three were in the Middle East and
Northern Africa region, accounting for 46 percent of all above-threshold post-delivery losses,
two were in Eastern Africa, accounting for 22 percent; four were in Southern Africa,
accounting for 12 percent; seven were in Western Africa, accounting for 9 percent; one was
in the Asia and the Pacific region, accounting for 7 percent; and four were in the
Latin America and the Caribbean region, accounting for 4 percent.6
Measures for preventing and mitigating losses
Improving food procurement and ensuring food safety and quality in WFP operations
36. WFP is committed to reducing food losses through its supply chain operations. Robust
processes for procuring food and ensuring its safety and quality, complemented by
monitoring at all levels, are key to minimizing losses.
37. WFP made increasing use of smaller packaging (1.5 kg bags) for Super Cereal in 2020. Smaller
and better packaging (stronger laminated film and use of secondary packaging) guarantees
a longer shelf-life (18 months instead of 12 months) and was used in the transport and
distribution of 60 percent of the product.
38. In July 2020, the Food Safety and Quality Assurance Unit introduced new packaging
specifications for polypropylene woven bags – with and without polyethylene inner liners –
in order to improve the robustness of the packaging used in WFP supply chains and minimize
food losses. Improved packaging is now used for cereals, pulses and certain types of Super
Cereal.
6 These are post-delivery losses that exceed WFP’s thresholds for country-level post-delivery losses of single food types:
valued at USD 20,000 or more and accounting for at least 2 percent of the tonnage handled or valued at USD 100,000 or
more.
WFP/EB.A/2021/10-E 9
39. As part of a project to reduce plastic waste, WFP is working in partnership with the
International Committee of the Red Cross and the Office of the United Nations
High Commissioner for Refugees to identify packaging that could be used as an alternative
to regular polypropylene bags. The project includes a research and development phase to
help identify new environmentally friendly materials with enhanced loss mitigation
properties.
40. New packaging specifications for vegetable oil were adopted in February 2020. To be eligible
to bid for international tenders, suppliers must now ensure that vegetable oil is supplied in
bottles, jerrycans and cartons that meet more stringent standards. As a result, there have
been few reports of leakage or loss of vegetable oil from destination countries. WFP
continues to monitor the effectiveness of its enhanced packaging specifications.
41. The Kenya country office received and bagged the first ever bulk shipment of sorghum,
totalling approximately 4,000 mt, in Mombasa. By tipping the containers and feeding the
sorghum directly into a hopper, the cargo is transported directly by conveyor belt to
bagging stations. This innovative approach reduced overall handling through stuffing,
transport, de-stuffing and shunting into trucks and warehouses and significantly reduced
spillage.
42. To transport shipments from Turkey to the Syrian Arab Republic, WFP continued to use
pallets and to cross stack sunflower oil containers, which significantly improves load stability
during transport and handling. As a result, reported losses in 2020 were minimal.
43. For cross-border operations into the Syrian Arab Republic, the Food Procurement Unit
sourced 36,442 mt of wheat flour in 15 kg bags, in addition to 19,455 mt in standard 50 kg
bags. Using bags of various sizes facilitated the conservation of wheat flour, a commodity
that is particularly prone to infestation when apportioned or incorrectly handled.
Tracking and monitoring of food
44. The Food Procurement Unit, in coordination with the Food Safety and Quality Assurance
Unit, has adopted stringent quality control measures for the sourcing of sorghum, including
enhanced cleaning and sieving requirements and an inspection statement of work. This has
reduced the percentage of defective grains and impurities, reducing potential quality issues
and the risk that commodities will be rejected at destination. It has also facilitated access to
new markets, including Australia and India, and the implementation of WFP’s pre-
positioning plan.
45. Supply chain units and country offices conducted weekly reviews of specific requirements
for high-volume wheat and wheat flour shipments. By monitoring the specific documentary
requirements in recipient countries, including Ethiopia, the Sudan and Yemen, such as
import permits and phytosanitary certificates, the risk of rejection has been reduced.
The standardization of food quality specifications has increased flexibility and facilitated
commodity rotation in the case of rejection or country funding shortages and has therefore
facilitated the purchase of Global Commodity Management Facility stocks. Marking
requirements and clearing processes have also been strengthened to reduce the risk of
rejection by local authorities.
46. WFP closely monitored quality management records, documents and trends, in accordance
with guidelines established by the Food Safety and Quality Assurance Unit for suppliers of
Super Cereal, with a view to understanding production trends, assessing performance and
proactively addressing potential quality issues.
47. Alert systems for best-before use dates have been developed by the Logistics Data, Budgets
and Systems Execution Unit to support efforts by country offices to dispatch commodities
prior to expiry dates. The Logistics Data, Budgets and Systems Execution Unit has also
WFP/EB.A/2021/10-E 10
provided training, conducted oversight missions and provided support with a view to
clearing backlogs and compiling data in the Western Africa, Southern Africa and the Latin
America and the Caribbean regions.
48. Enhanced guidance on stock counting and reconciliation strengthened the capacity of
country offices to ensure that stocks are counted on a monthly, quarterly and end-of-year
basis.
49. Quarterly exercises were, moreover, conducted to monitor physical inventories and losses
in order to provide the Risk and Insurance Unit with data on the types of losses occurring
and further strengthen loss mitigation efforts.
Regional bureau initiatives for minimizing losses
50. In 2020, regional bureaux supported country offices in their efforts to minimize losses.
This support took many forms, including oversight and compliance missions and training,
technical assessments and audits of suppliers and guidance on the mitigation of food safety
and quality risks and the management of incidents. These measures aimed to ensure that
WFP best practices in food management and logistics were applied consistently in all
operations.
51. The Regional Bureau for Eastern Africa conducted oversight missions that focused on
warehouse management, transport modalities, packaging and training. Through those
missions, the regional bureau, inter alia, supported efforts by country offices to ensure that
expiry dates for cargo received at warehouses were checked and that any discrepancies
were reported immediately. The missions also supported efforts by country offices to
implement best practices in commodity accounting, contracting and
warehouse management.
52. To minimize transport-related losses, the Regional Bureau for Eastern Africa assessed the
performance of transporters in order to ensure that only transporters that complied with
best practices were contracted. In collaboration with the Food Safety and Quality Assurance
Unit, the regional bureau also trained staff in the handling of specialized nutritious foods.
53. The regional bureau supported refresher training courses on food safety and quality for
warehouse staff and on integrated pest management and food handling, including loading,
receiving, dispatch and quality inspection, for support staff.
54. The Regional Bureau for Asia and the Pacific
conducted regular inspections to ensure that country
offices used best practice warehouse management
procedures. These procedures included the monitoring
of warehouse conditions on a regular basis, especially
just before the rainy season, daily checks of stacked
commodities, stock rotation or restacking for overlong
stored food, the use of optimal stacking methods and
pallets to prevent damage to stocks and the use of cold
stores for cold chain commodities.
55. Standard operating procedures for food planning,
programming, purchase, storage and distribution were
introduced in 2020 by the Regional Bureau for Asia and the Pacific. These include procedures
for local food procurement that reduce storage periods for wheat flour by splitting total
contracted tonnage into lots, with the volume of each lot determined in accordance with the
project implementation forecast. Wheat flour suppliers thus deliver only the volumes
required for immediate distribution. This reduces the likelihood that large volumes of
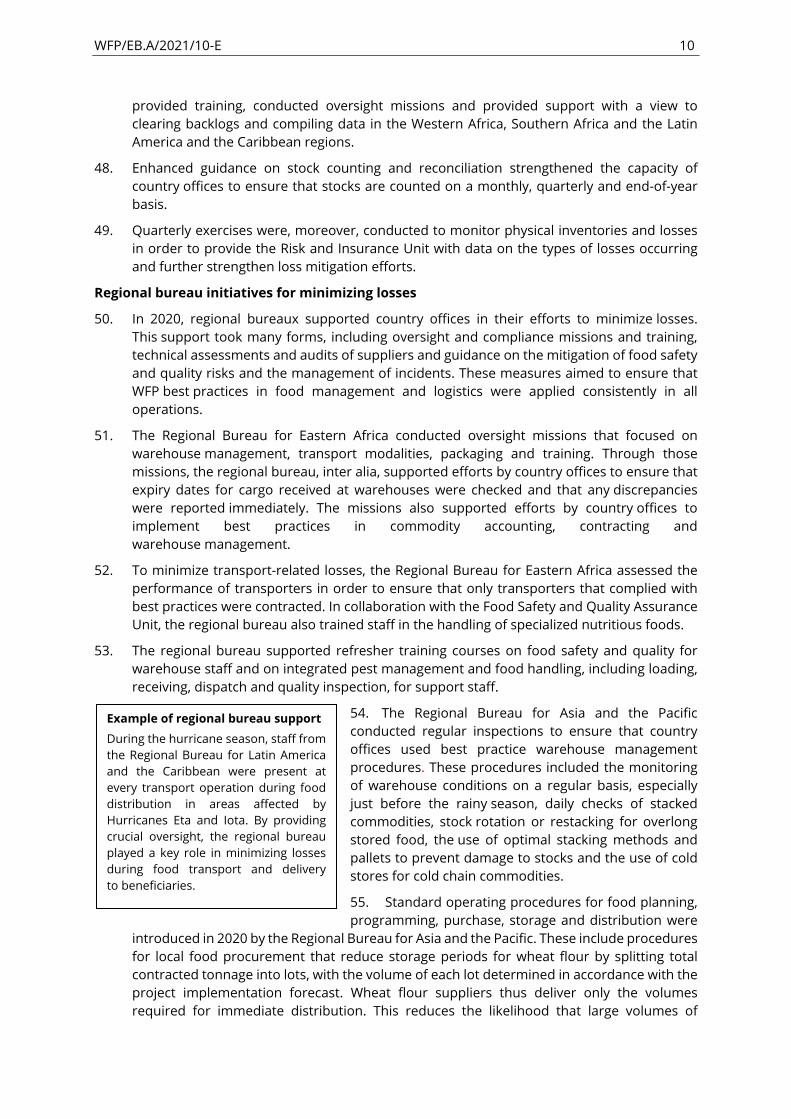
Example of regional bureau support
During the hurricane season, staff from
the Regional Bureau for Latin America
and the Caribbean were present at
every transport operation during food
distribution in areas affected by
Hurricanes Eta and Iota. By providing
crucial oversight, the regional bureau
played a key role in minimizing losses
during food transport and delivery
to beneficiaries.
WFP/EB.A/2021/10-E 11
commodities will need to be stored in warehouses, where they may expire if not distributed
in a timely fashion.
56. The Regional Bureau for the Middle East and Northern Africa monitored best-before dates
of stocks through the Logistics Execution Support System (LESS) in order to minimize food
losses resulting from the overlong storage and expiration of food commodities. The regional
bureau also reduced transportation-related losses by supporting country offices in tracking
the movement of food and improving the percentage of transactions captured in real time
in LESS.
57. In 2020, the use of the logistics key performance indicator dashboard, which encompasses
asset management efficiency and data reliability indicators, contributed to improving the
performance of country offices and the reliability of commodity reports.
58. The Regional Bureau for Southern Africa provided training for third-party stevedoring and
for warehouse managers on commodity handling and accounting, warehouse best practices
related to cleanliness and hygiene and timely rebagging and reconstitution. Monthly
inspections of third-party warehouses were conducted and action was taken to strengthen
transporter oversight to ensure that commodities were handled appropriately and
maximum axle loads were not exceeded. Regular monitoring helped to reduce
transportation-related losses at the country office level.
59. As was the case in previous years, the Regional Bureau for Latin America and the Caribbean
provided training in 2020 for a wide range of stakeholders including transporters,
non-governmental organizations, suppliers and government ministry staff involved in food
distribution and handling. Due to COVID-19-related movement restrictions, oversight and
training was conducted online, with actions focused specifically on internal control
mechanisms and commodity quality control.
60. Furthermore, the regional bureau implemented a new local purchasing mechanism
providing for the delivery of commodities directly to partner facilities. The aim of the new
mechanism was to reduce costs related to storage, transport, and pest control in
warehouses. Warehouse management and pest control training, provided in coordination
with pest control companies, was successful in reducing losses due to rodent damage and
weevil infestation in Honduras.
WFP/EB.A/2021/10-E 12
ANNEX I
Above-threshold losses, by country
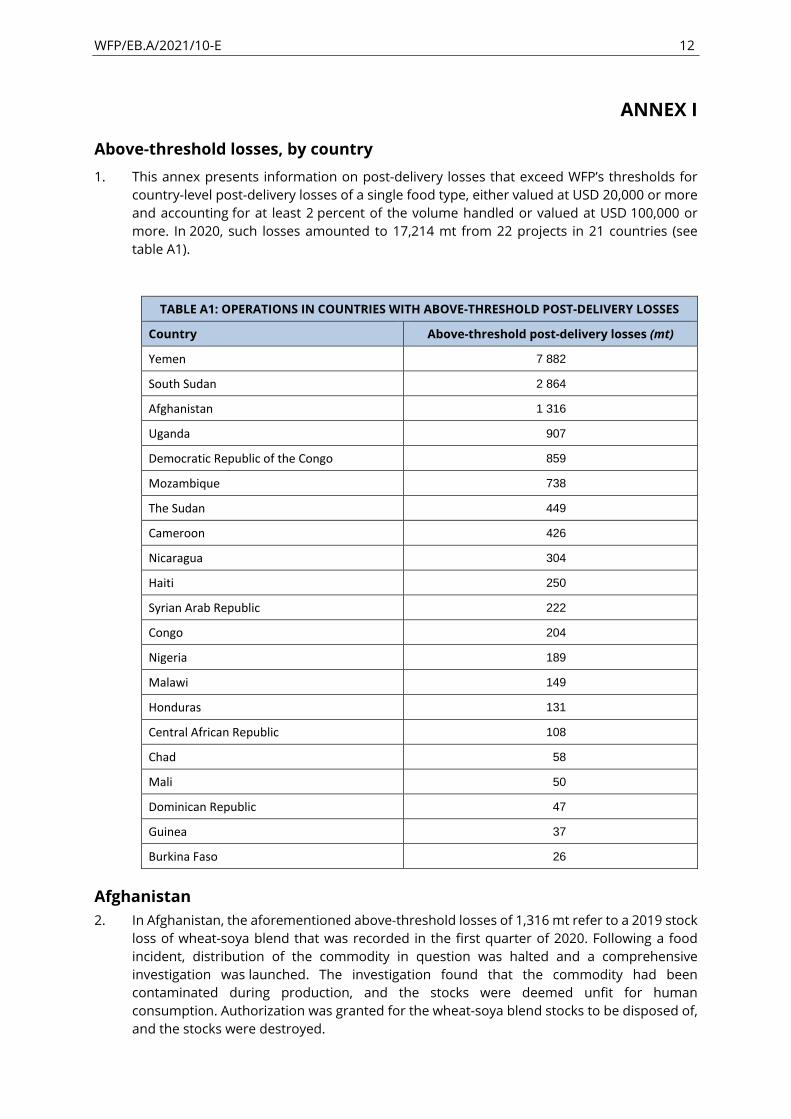
1. This annex presents information on post-delivery losses that exceed WFP’s thresholds for
country-level post-delivery losses of a single food type, either valued at USD 20,000 or more
and accounting for at least 2 percent of the volume handled or valued at USD 100,000 or
more. In 2020, such losses amounted to 17,214 mt from 22 projects in 21 countries (see
table A1).
TABLE A1: OPERATIONS IN COUNTRIES WITH ABOVE-THRESHOLD POST-DELIVERY LOSSES
Country Above-threshold post-delivery losses (mt)
Yemen 7 882
South Sudan 2 864
Afghanistan 1 316
Uganda 907
Democratic Republic of the Congo 859
Mozambique 738
The Sudan 449
Cameroon 426
Nicaragua 304
Haiti 250
Syrian Arab Republic 222
Congo 204
Nigeria 189
Malawi 149
Honduras 131
Central African Republic 108
Chad 58
Mali 50
Dominican Republic 47
Guinea 37
Burkina Faso 26
Afghanistan
2. In Afghanistan, the aforementioned above-threshold losses of 1,316 mt refer to a 2019 stock
loss of wheat-soya blend that was recorded in the first quarter of 2020. Following a food
incident, distribution of the commodity in question was halted and a comprehensive
investigation was launched. The investigation found that the commodity had been
contaminated during production, and the stocks were deemed unfit for human
consumption. Authorization was granted for the wheat-soya blend stocks to be disposed of,
and the stocks were destroyed.
WFP/EB.A/2021/10-E 13
Burkina Faso
3. Burkina Faso registered above-threshold losses of vegetable oil amounting to 26 mt. In 2019,
the country received a vegetable oil shipment but after receiving the stock, it was noted that
some cartons had already reached their expiry dates.
4. To mitigate that post-delivery loss, the country office liaised with Société Nouvelle Huilerie
et Savonnerie (SN Citec), an agro-industry firm, which agreed to exchange the expired
vegetable oil for vegetable oil in good condition. The exchange process required
considerable time to complete as WFP had to ensure that the vegetable oil supplied met
established quality standards. The process was concluded in early 2020. The outstanding
above-threshold loss of 26 mt was shared between two project activities.
5. To minimize such losses in the future, warehouse staff have been advised to be more vigilant
when receiving cargo and to ensure that the best-before date is checked on each and
every package, particularly for Super Cereal and vegetable oil, before it is stored.
Cameroon
6. The aforementioned above-threshold losses of 426 mt in Cameroon refer to part of a
donation of sorghum received in May 2019 that had been contaminated with genetically
modified organism (GMO) corn. The cargo was sieved to remove the corn and other
impurities, resulting in the aforementioned loss. Following discussions with the Minister of
Agriculture and Rural Development, approval for the distribution of the sorghum was
granted on the condition that all GMO corn was first removed from the stock. In 2020, it was
decided to dispose of the GMO corn.
Central African Republic
7. The Central African Republic country office incurred above-threshold post-delivery losses of
108 mt of Super Cereal and BP-5 emergency ration biscuits in 2020.
8. Losses of Super Cereal were due to overlong and otherwise improper storage in the
warehouse of a partner that has now ceased operations in the country. The BP-5 emergency
ration biscuits were found to have already passed their expiry dates and were identified
during the inspection of a shipment of emergency ration biscuits upon its arrival.
9. In order to reduce such losses in the future, the country office intends to establish an alert
report for best before dates, which will facilitate the timely distribution of commodities
before they expire. To limit losses at cooperating partners’ warehouses, regular physical
inventories of stocks will be carried out.
Chad
10. The country office in Chad incurred above-threshold losses of 58 mt of beans in 2020. Of
these, 30 mt were declared unfit for human consumption after they were discovered to be
infested with pests and subsequently fumigated. In general, beans are prone to rapid
infestation in countries with high temperatures. General food distributions in some areas in
Chad do not take place on a regular basis, and commodities sometimes reach certain areas
of the country only after the completion of distribution cycles. Once the stock in question
reached the warehouse for distribution, it tested unfit for human consumption.
11. The remaining post-delivery losses were predominantly due to underweight 100 kg bags of
beans being received and distributed. The bags were locally purchased, received, dispatched
and distributed without strict supervision of unit weight. The weight issue was detected only
at the end of the distribution cycle.
WFP/EB.A/2021/10-E 14
12. The country office has taken measures to prevent such losses in the future. Quality and
quantity inspections will be reinforced and checks made to ensure that weighing machines
used by suppliers are calibrated correctly. The purchase of commodities in 100 kg bags will
be avoided and care taken to avoid the overlong storage of beans. Furthermore, beans will,
in future, be lent for other activities if there is a risk that they could deteriorate prior to
distribution. In addition, a food technologist has been hired by the country office. The
process to recover the total amount stemming from post-delivery losses from insurance is
ongoing.
Congo
13. An above-threshold post-delivery loss of 204 mt of rice was reported in Congo in July 2020.
The loss occurred during transportation when a road accident led to a large quantity of rice
becoming wet and therefore unusable. The value of the loss was deducted from the
carrier's invoice.
14. Transporting commodities over long distances and over bad roads that deteriorate further
during the rainy season poses constant challenges to WFP operations.
Democratic Republic of the Congo
15. The Democratic Republic of the Congo country office registered a total of 859 mt
above-threshold post-delivery losses in 2020. Of these, a batch of 296 mt of locally procured
rice was deemed unfit for human consumption. The specific batch was delivered to WFP’s
Butembo warehouse in December 2019, but did not pass an additional quality test carried
out by the Office Congolais de Contrôle (OCC). OCC identified the presence of mesophilic
bacteria and coliforms, which, as they do not survive the cooking process, are not specified
for action in the Codex Alimentarius for rice and are thus rarely tested for by WFP.
16. The remaining losses were related to two lots of Super Cereal totalling 563 mt. These were
dispatched in the country but not distributed. It was found that they contained high levels of
fumonisin mycotoxins and were therefore deemed unfit for human consumption. In
accordance with established procedures, WFP headquarters was informed and approved the
disposal of the contaminated commodities. The value of the loss will be recovered through
insurance.
17. For losses caused by suppliers, the country office works systematically with the Supply Chain
Risk and Insurance Unit at WFP headquarters to recover amounts lost through insurance.
For transport losses, the value of the lost commodity is recovered directly from transporters.
In order to minimize those losses, regular meetings are held with transporters, strict
performance evaluations are conducted and poorly performing transporters are removed
from the list of approved transporters.
18. For warehouse losses, country office staff systematically inspect shipments upon unloading
and throughout the period in which stock remains in storage. Handlers are trained in the
proper handling of cartons and bags. Standard operating procedures are shared with all
staff, while mitigation measures such as fumigation, ventilation and the transfer of stacked
goods from one location in warehouses to another are recommended. In addition, a
memorandum on food incident management will be shared with all logistics staff and
appropriate action will be taken to follow up on recommendations made. A food technologist
will be hired in 2021 to strengthen efforts to reduce food losses and train staff.

WFP/EB.A/2021/10-E 15
Dominican Republic
19. Above-threshold losses in the Dominican Republic were related to an incident in 2019,
whereby 47 mt of Super Cereal were deemed unfit for human consumption. While WFP
instructions to destroy substandard stocks of Super Cereal were received by most regions in
2019, the Latin America and the Caribbean region received authorization for the destruction
of those stocks only in 2020. In the meantime, to prevent any contamination of other stocks
by the substandard Super Cereal, it was kept securely isolated from other stocks in WFP
warehouses.
Guinea
20. Above-threshold losses in Guinea concerned rice totalling 37 mt. That rice was to be
distributed to vulnerable households as part of the Government's economic response to the
COVID-19 health crisis, which is being coordinated by L’Agence Nationale d’Inclusion
Economique et Sociale (ANIES) (National Agency for Economic and Social Inclusion). The stock
was declared unfit for human consumption and returned by the supplier for replacement.
Replacement has yet to occur, however, and the gap between the theoretical stock and the
stock that is actually present remains outstanding in the inventory.
21. As the loss was due to the actions of a supplier, WFP has advised its partners to conduct a
quality control exercise with suppliers when purchasing food. In addition, WFP has
recommended laboratory analysis of all shipments provided by partners for distribution by
WFP.
Haiti
22. Above-threshold losses of 250 mt of maize occurred in the country when the maize in
question was erroneously milled into flour instead of into maize grits by a contracted milling
company. The maize was therefore rejected by the country office. The milling company
agreed to replace the maize flour in-kind, and the flour was sold by the miller as animal feed.
23. Due to the local unavailability of maize, the miller reimbursed WFP for the total value of the
250 mt of maize lost, at a value of USD 120,296. The matter was resolved with the support
of the Supply Chain Risk and Insurance Unit at WFP headquarters.
Honduras
24. Above-threshold post-delivery losses in Honduras were related to an incident with a supplier
in 2019, when 131 mt of Super Cereal stock were deemed unfit for human consumption.
Authorization for the disposal of that stock was only granted in 2020, however, in accordance
with instructions from WFP headquarters.
25. A number of measures have been taken to minimize such losses in the future. These include
providing training to country office staff on pest identification and control,
inventory management, food handling and warehouse oversight.
Malawi
26. In Malawi, above-threshold losses of 149 mt of maize were recorded in 2020. These included
134 mt of maize used as collateral to borrow from the National Food Reserve Agency (NFRA)
to fill pipeline breaks during the 2019 flood emergency. The stock was significantly damaged,
and the Director of the Supply Chain Risk and Insurance Unit at WFP headquarters approved
its disposal in December 2020.
27. Furthermore, three waybills for 15 mt of maize were captured in the system as dispatched
during backlog recovery, following offline commodity movements during the flood response
in April 2019. It was later ascertained that, in the context of post-loading operations, the
WFP/EB.A/2021/10-E 16
three waybills had been withdrawn and the transporter had offloaded at the WFP warehouse
on the same day. However, the reversal had not been registered in LESS and the maize was
therefore registered as missing. After a thorough investigation and the country director’s
approval in March 2020, 15 mt of maize were registered as a loss. The remaining post-
delivery losses were caused by inadequate transport and poor handling.
28. All losses incurred during transportation are deducted from transporters’ invoices, and the
loss percentage is used as a performance criterion that may be taken into consideration
when drawing up the list of approved WFP transport service providers.
29. For quality issues related to stocks provided by suppliers, staff are encouraged to reject
low-quality stocks and communicate any relevant issues to procurement staff prior to
offloading stock into warehouses, regardless of any agreed delivery terms.
30. To minimize warehouse losses, staff are urged to comply with best practice warehouse
management procedures. These relate to the maintenance of warehouses, the use of
optimal stacking methods and pallets to prevent damage to stocks, proper ventilation,
regular fumigation, pest control and daily inventory checks. In addition, the real-time use of
LESS has been emphasized to ensure stock visibility. This facilitates the early detection of
any anomalies in stock figures, which may not be possible when there are backlogs to be
cleared.
31. Finally, the country office is making use of the “Last Mile” application, which is being piloted
in a refugee camp prior to its roll-out in other contexts. The application facilitates efforts to
monitor stock in transit to cooperating partners and the early detection of delayed deliveries
so that timely follow-up can be undertaken with transporters. This reduces the risk of
transport losses and stock diversion.
Mali
32. A total of 50 mt of above-threshold losses of rice were recorded in Mali in 2020, equivalent
to 38 percent of all rice handled in that year. Most of those losses stemmed from an attack
by armed groups carried out while the stock was being transferred from Mopti to Gao along
the Douentza–Timbuktu axis, where over 80 percent of losses in Central Mali occur. In
accordance with established procedures, the transporters will reimburse WFP for the losses
incurred, with the total value of the losses to be deducted from their invoices. In order to
mitigate such risks in the future, commodity transfers from Mopti to Gao will be avoided
while some commodities will be transferred directly from Lomé Port to the Gao suboffice.
Furthermore, the country office has drawn up procedures whereby local purchases of
commodities will be made in Gao, rather than in Mopti (with the commodities then being
transported on to Gao).
Mozambique
33. In Mozambique, above-threshold losses in 2020 amounted to 738 mt. Theft by armed attack
and fires in partner warehouses were the main causes for the losses of maize in 2020, which
amounted to 543 mt. Some losses were due to overlong storage of food in warehouses and
inadequate transport.
34. Post-delivery above-threshold losses also included 195 mt of Super Cereal that was
determined to contain high levels of fumonisin mycotoxins and was therefore deemed unfit
for human consumption. In the light of that loss, a fumonisin specification test has been
added to the mandatory list of laboratory commodity quality checks.
35. To minimize future losses, third-party warehouses managing WFP stocks are reminded on
a regular basis to respect WFP’s warehouse management standards and procedures. To
promote compliance, WFP now maintains a regular staff presence at these warehouses.
WFP/EB.A/2021/10-E 17
36. Security assessments for all warehouses were conducted in collaboration with the United
Nations Department of Safety and Security and country office security focal points.
Recommendations regarding improvements to infrastructure are being followed up on.
Those recommendations included changing all door locks, installing security cameras,
carrying out a review of entry and exit procedures at warehouse facilities and hiring more
warehouse security guards.
37. To reduce losses resulting from infestation and spoilage, the country office has signed
a fumigation and pest control contract with a fumigation company, which carries out
spraying and fogging exercises on the first day of every month in all warehouses. The
company also undertakes weekly warehouse stock inspections.
38. The country office is monitoring the movement, storage and best-before dates of stocks in
LESS in order to minimize food losses resulting from overlong storage and the expiration of
best-before dates. Commodity age monitoring alerts and stock position reports are shared
with warehouses on a weekly basis.
Nicaragua
39. In Nicaragua, above-threshold losses of 304 mt of Super Cereal are attributable to an
incident in 2019 that resulted in stock being put on hold and deemed unfit for human and
animal consumption. Authorization for the disposal of the stock was received in 2020, and it
was subsequently destroyed.
Nigeria
40. Above-threshold losses for 2020 in Nigeria amounted to 189 mt of vegetable oil, of which
180 mt were confiscated by the Nigeria Customs Service in two separate incidents and held
until the vegetable oil expired. The first incident occurred in February 2020, when five trucks
transporting 150 mt of vegetable oil from the port were seized by customs authorities in
Owerri while they were on their way to Maiduguri. The second incident took place in April
2020, when another truck carrying 30 mt of vegetable oil was seized by customs authorities
in Owerri.
41. In March 2020, WFP contacted the Deputy Comptroller-General of the Nigeria Customs
Service in Abuja to inform the Customs Service of the first incident. WFP provided the Service
with a copy of the import duty exemption certificate that had been issued by the Federal
Ministry of Finance and a copy of the waiver issued by the Office of the President of Nigeria.
WFP subsequently met with the Comptroller-General of the Nigeria Customs Service, who
informed WFP that the vegetable oil constituted “contraband” and that the Customs Service
did not intend to release the detained trucks or the vegetable oil they had been transporting.
42. In May 2020, WFP sent a note verbale to the Minister of Humanitarian Affairs,
Disaster Management and Social Development, in which the ministry’s intervention to
resolve the two incidents was requested with a view to facilitating WFP's ongoing efforts to
provide necessary food assistance in Nigeria. However, despite WFP’s repeated attempts to
resolve the matter with Customs Service Headquarters, the customs authorities in Owerri
and the Ministry of Humanitarian Affairs, Disaster Management and Social Development,
neither the vegetable oil nor the trucks were returned to WFP.
43. In August 2020 WFP sent a note verbale to the Chief of Staff to the President of Nigeria,
requesting the Chief of Staff’s assistance in facilitating the return of WFP commodities so that
they could be immediately distributed to those requiring humanitarian assistance. The Chief
of Staff to the President then sent a note verbale to the Comptroller-General of the Nigeria
Customs Service in which he urged the service to review WFP’s request and provide
an update.
WFP/EB.A/2021/10-E 18
44. WFP has followed up on this matter with the Customs Service multiple times. To date,
however, no satisfactory response has been received. The only information so far provided
by the Customs Service relates to a court order – which was not transmitted to WFP directly
and whose origins and grounds remain unclear – advising that the 180 mt of vegetable oil
belonging to WFP was distributed to other humanitarian agencies.
South Sudan
45. In 2020, the South Sudan country office incurred above-threshold losses of 114 mt of rice,
1,636 mt of sorghum, 313 mt of split peas, 534 mt of Super Cereal, 207 mt of vegetable oil
and 60 mt of nutrient supplements, amounting to total losses of 2,864 mt.
46. Many factors contributed to those losses in the context of the complex L3 emergency
operation in the country. These included looting, theft, flooding, road blockages,
commodities that were deemed to be of poor quality, transport challenges and limited
capacity of cooperating partners.
47. Sorghum losses in the country were primarily caused by looting and quality issues at origin
that were attributable to the supplier. Losses of Super Cereal related to stock that arrived in
the country in July 2020 and was subsequently deemed unfit for human consumption. With
regard to the other commodities, the main causes were theft, inadequate transport, poor
handling, spillage, poor packaging quality and floods.
48. In the case of transport losses, the value is deducted from transporters’ invoices. In the case
of mishandling by cooperating partners, costs are recovered from those partners. To
minimize future flood-related losses, cocoon storage is now being used. Regular refresher
training courses, which have been moved online because of COVID-19-related restrictions,
are conducted to strengthen the capacity of cooperating partners.
49. To prevent losses due to looting, the country office has launched an online warehouse risk
mitigation tool. A weekly warehouse inspection report is also issued so that timely corrective
measures can be taken at WFP warehouses.
50. Food safety and quality assurance teams at WFP headquarters and in South Sudan are
strengthening the inspection of commodities throughout the entire delivery process,
from suppliers to ports of transit to food distribution.
51. Where insecurity is the main challenge to WFP operations, WFP takes appropriate action in
coordination with security and access units, which in turn work with local actors on the
ground. No movement of stocks is allowed unless authorization is granted or an escort
provided.
Sudan
52. Above-threshold losses in the Sudan amounted to 415 mt of sorghum and 34 mt of Super
Cereal. Those losses were due, primarily, to water contamination during transport,
particularly during the rainy season, which occurred because transporters did not use
adequate waterproof tarpaulins to cover their cargos. In accordance with established
procedures, transport losses were recovered from transporters’ invoices.
53. In general, inspections to determine the quantity and quality of commodities are carried out
upon delivery. If anomalies are observed they are reported or flagged in the waybills and are
subsequently captured in LESS.
54. The remaining post-delivery losses were caused by spillage during the handling of
commodities because of poor stitching or rough surfaces in lorries that caused tears in the
bags used in transit.
WFP/EB.A/2021/10-E 19
55. In order to reduce such losses, the Sudan country office compiles daily, weekly and
monthly inspection reports, carries out regular morning meetings with contractors and has
enhanced its supervision of bagging contractors.
Syrian Arab Republic
56. In the Syrian Arab Republic, post-delivery losses of rice amounted to 222 mt. Most of those
losses resulted from warehouse activities such as inappropriate repacking, rebagging and
reconstitution and from weight variances of the commodity itself. Commodity transportation
between WFP warehouses and the warehouses operated by cooperating partners
contributed to further losses. In that regard, it should be noted that rice is initially transferred
to WFP warehouses from a point of origin, such as the port, and, after kitting (where multiple
items are combined into one package), is transferred to cooperating partner warehouses.
57. Losses occurring during production and transport are the responsibility, respectively, of
service providers and transporters; the value of any lost commodities is therefore deducted
from their invoices. WFP warehouse staff supervise the production process and they
perform random checks on produced commodities and during inventory counts. WFP
ensures that all commodities to be transported are loaded onto trucks and that each truck
is sealed before leaving the warehouse.
58. Furthermore, innovative and automated modalities for repacking and rebagging are under
consideration, with the aim of reducing human error.
59. Approximately 117 mt of the aforementioned losses occurred while the commodities were
in the custody of cooperating partners, with theft accounting for 89 percent of those losses.
The remaining losses were due to fire and other minor incidents of pilfering.
60. In order to avoid and mitigate such losses warehouse management training is generally
conducted on a yearly basis for all cooperating partner warehouse staff. As a result of
COVID-19-related restrictions, however, no training sessions could be conducted in 2020. As
an alternative, oversight visits to the premises and warehouses of cooperating partners were
conducted. In addition, manuals in Arabic on warehouse management were distributed to
cooperating partners.
Uganda
61. In 2020, the Uganda country office incurred above-threshold losses of 907 mt of maize. Of
these, 301 mt were part of a loss that occurred in 2018/2019 but was only recorded in LESS
in January 2020. The total affected quantity that was entered in LESS was 683 mt, of which
around 382 mt was reported in 2019. In late 2018 and early 2019, during the South Sudan
pre-positioning activity, a large quantity of food was stacked outdoors due to a shortage of
indoor storage space. The commodity was subsequently damaged by rainwater and, despite
attempts to dry it out, suffered significant discoloration and was hence deemed unfit for
human consumption.
62. A loss of 312 mt of maize was recorded in a consignment of 8,900 mt of locally purchased
maize that was delivered to the Kampala warehouse in early 2020: in June 2020, warehouse
staff noticed that bags containing maize were heating up and called in inspectors. The maize
was found to be significantly discoloured and contained mouldy and rotten grains. The
inspectors concluded that most of the loss was due to a warehouse roof leak resulting from
inadequate maintenance on the part of the lessor. The remaining losses were caused by
problems at origin attributable to a supplier and weight discrepancies stemming from
moisture content loss during storage.
WFP/EB.A/2021/10-E 20
63. Transport- and cooperating-partner-related losses have been recovered from transporters
and partners, respectively. Training sessions on commodity management, accountability and
quality control have been held for warehouse staff and cooperating partners. Moreover,
standard operating procedures have been enforced through regular compliance checks.
Storage capacity has been increased so that it is no longer necessary to store commodities
outdoors. In addition, discussions are taking place with a view to recovering the value of the
losses resulting from the warehouse roof leakage from the warehouse landlord.
64. A new food safety and quality post has been created in the country office. The creation of
the post will help ensure that food procured meets WFP standards and enhance the
guidance provided to suppliers, staff and cooperating partners on all matters related to food
safety and quality.
Yemen
65. In 2020, total above-threshold post-delivery losses in Yemen amounted to 7,882 mt.
Some 80 percent of those losses were of wheat flour.
66. When WFP changed its cooperating partner in Hajjah, the local authorities subsequently
prevented the distribution by the new cooperating partner of 1,972 m of wheat flour, 10 mt
of lentils and 65 mt of ready-to-use supplementary food. After two months the commodities
were returned by the cooperating partner, but were found to be heavily infested with pests.
Although WFP fumigated the commodities, the local authorities insisted on their destruction.
67. WFP is taking steps to strengthen its coordination with local authorities and the Secretary-
General of the Supreme Council for the Management and Coordination of Humanitarian
Affairs and International Cooperation before selecting a new cooperating partner; back-up
cooperating partners will be selected for emergency deployment. When a new
cooperating partner is selected, WFP will make every effort to ensure that the handover and
transition proceed smoothly.
68. WFP had traditionally provided white wheat flour to beneficiaries. However, due to a change
in the extraction ratio, the colour of the wheat flour provided by WFP changed from white to
light brown. The light brown flour was not accepted by beneficiaries and local authorities. As
a result, most cooperating partners rejected the commodity and it was returned to
WFP’s warehouses in Aden. Although WFP shared the clearance certificate issued by the
Yemen Standardization, Metrology and Quality Control Organization with cooperating
partners and local authorities, they refused to accept the wheat flour, and trucks
transporting it had no alternative but to return to the warehouses in Aden. Some trucks were
detained at checkpoints for long periods on their return journey to Aden. As a result some
of the flour became infested with pests while other stocks expired. Subsequently, the
commodity was rejected in its total amount of 2,774 mt.
69. To avoid such losses in the future, the milling process extraction rate was reduced from
90 percent to 80–85 percent.
70. Damaged or discoloured vegetable oil, split peas and bean stocks that were deemed unfit
for human consumption also resulted in losses. Wherever possible, WFP minimized food
losses by segregating and inspecting damaged or infested commodities. With regard to
nutrient supplements that were found to be discoloured and caked, the country office,
working with the Operational Risk Mitigation Service and the Food Safety and
Quality Assurance Unit, sent samples for confirmatory laboratory analysis in France and
Italy. The results will help assess the likely cause of the discoloration and caking and prevent
a recurrence of the same issues.
WFP/EB.A/2021/10-E 21
71. WFP implements nutrition activities in partnership with the Ministry of Public Health
and Population, which regulates all nutrition interventions, and with non-governmental
organizations. Between January and March 2019, during the initial stages of activity scale-up,
WFP encountered delays in concluding field-level agreements. This in turn delayed
implementation. Even once those agreements were signed a number of operational
challenges arose. Those challenges stemmed primarily from a lack of transport capacity,
which delayed the dispatch of commodities from warehouses. The problems encountered
were further aggravated by cooperating partners’ limited capacity to accept commodities,
which resulted in some being returned to WFP warehouses in Aden. In June 2019, the
Secretary-General of the Supreme Council for the Management and Coordination of
Humanitarian Affairs and International Cooperation issued a directive requiring customs
clearance for cargo moving from areas controlled by the internationally recognized
government to areas controlled by the de facto authorities. The directive had the effect of
doubling customs clearance procedures for WFP commodities, as shipments of those
commodities were already cleared at their points of entry into the country at Aden and
Shahen. In August 2019, the Ministry of Public Health and Population issued a directive to all
international and national organizations prohibiting them from distributing food for
malnutrition prevention and treatment with a shelf-life of less than four and six months,
respectively. The directive carried out by the Supreme Council for the Management and
Coordination of Humanitarian Affairs (SCMCHA) and the Yemen Ministry of Public Health
(MOPHP) Aden meant that a large quantity of nutritional commodities could neither be
distributed in the south of the country in the context of WFP nutrition programmes nor
moved to the north because of the new customs procedures. This resulted in a total loss of
840 mt of nutrient supplements and vegetable oil.
72. To minimize such losses in the future, the country office has increased absorption capacity
for nutritional commodities by allocating some as general food assistance for immediate
distribution. The country office has, moreover, adopted a two-pipeline strategy for the north
and the south of the country to prevent any further accumulation in Aden of stocks that
cannot be consumed prior to their expiry dates. Lastly, commodity requirements have been
more closely aligned with the ability of cooperating partners to accept stocks.
73. The remaining above-threshold post-delivery losses occurred as a result of the ongoing
armed conflict, fire, transport challenges and water damage to commodities stored
in warehouses.

WFP/EB.A/2021/10-E 22
ANNEX II
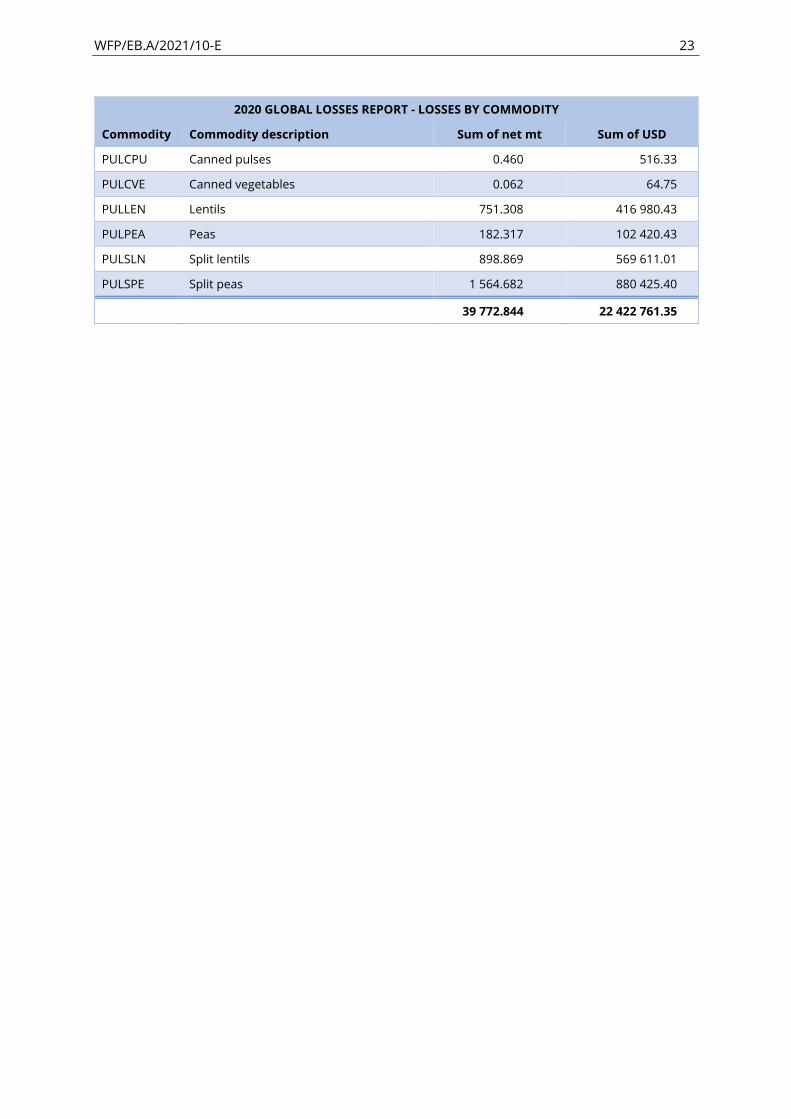
Global losses
2020 GLOBAL LOSSES REPORT - LOSSES BY COMMODITY
Commodity Commodity description Sum of net mt Sum of USD
CERBAR Barley 7.550 2 034.26
CERMAZ Maize 4 340.000 1 526 221.40
CERMML Maize meal 584.087 370 830.00
CERPAS Pasta 281.393 150 986.27
CERRIC Rice 2 352.424 1 251 332.34
CERSOR Sorghum/millet 7 633.455 2 552 936.04
CERWBG Bulgur wheat 44.521 22 106.21
CERWHE Wheat 1 836.832 514 101.79
CERWHF Wheat flour 7 625.585 2 883 648.01
DAIDSP Plain dried skimmed milk 3.992 12 611.72
DAIUHT UHT milk 0.684 746.52
FRUDFR Dried fruits 27.746 41 343.15
FSHCFI Canned fish 1.478 7 431.01
MEACHK Canned chicken 0.171 306.44
MIXBP5 BP5 emergency rations 10.892 39 954.69
MIXCSB Corn soya blend 5 263.263 4 402 533.74
MIXHEB High energy biscuits 57.869 88 425.88
MIXLNS Lipid-based nutrition supplement (LNS) 493.654 1 212 875.49
MIXRSF Ready-to-use supplementary food 207.443 551 934.97
MIXRTF Ready-to-use therapeutic food 0.069 203.86
MIXWSB Wheat soya blend 1 888.881 1 377 045.35
MSCHAL Halawa 0.610 1 618.89
MSCMNP Micronutrient powder 0.886 12 076.51
MSCSAL Iodised salt 46.936 10 151.36
MSCSPC Spices 0.053 70.09
MSCSUG Sugar 530.652 239 991.94
MSCTOM Processed tomato 0.106 -
MSCYEA Yeast 1.247 2 712.77
OILOLV Olive oil 0.029 76.67
OILVEG Vegetable oil 1 657.645 2 090 009.00
PPFRTN Rations 191.455 141 221.02
PULBEA Beans 764.432 619 968.20
PULCKP Chickpeas 519.106 325 237.44
WFP/EB.A/2021/10-E 23
2020 GLOBAL LOSSES REPORT - LOSSES BY COMMODITY
Commodity Commodity description Sum of net mt Sum of USD
PULCPU Canned pulses 0.460 516.33
PULCVE Canned vegetables 0.062 64.75
PULLEN Lentils 751.308 416 980.43
PULPEA Peas 182.317 102 420.43
PULSLN Split lentils 898.869 569 611.01
PULSPE Split peas 1 564.682 880 425.40
39 772.844 22 422 761.35
WFP/EB.A/2021/10-E 24
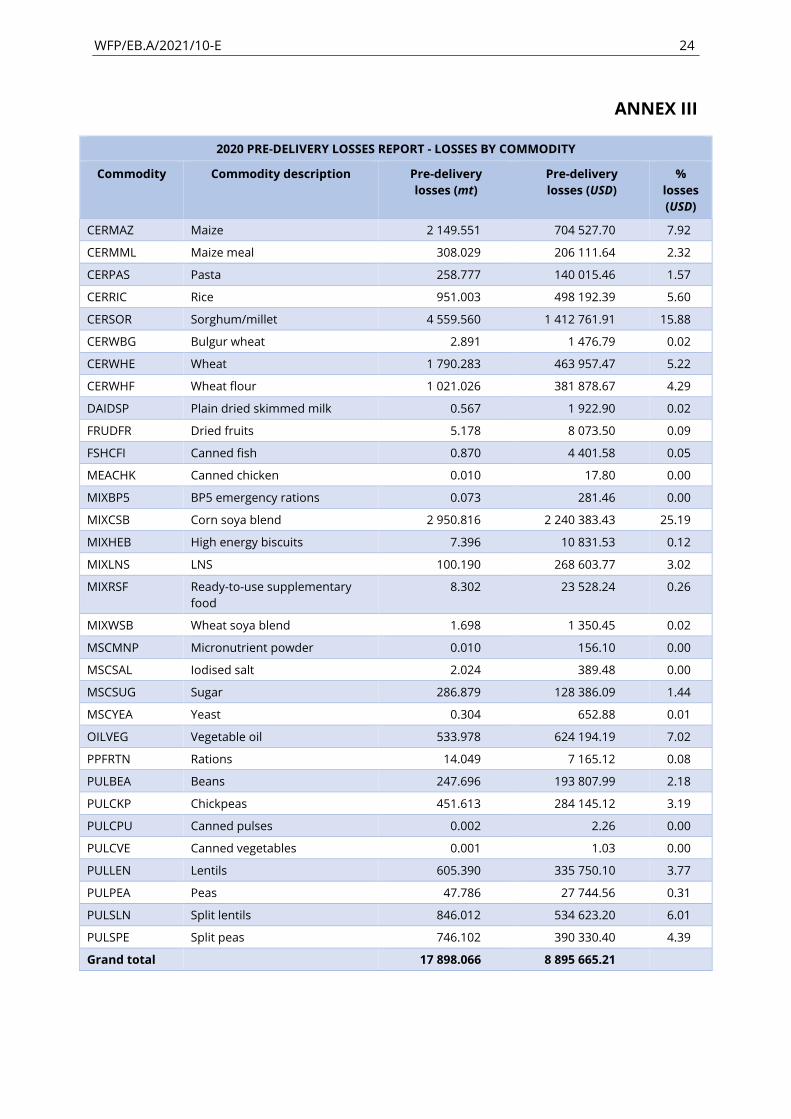
ANNEX III
2020 PRE-DELIVERY LOSSES REPORT - LOSSES BY COMMODITY
Commodity Commodity description Pre-delivery
losses (mt)
Pre-delivery
losses (USD)
%
losses
(USD)
CERMAZ Maize 2 149.551 704 527.70 7.92
CERMML Maize meal 308.029 206 111.64 2.32
CERPAS Pasta 258.777 140 015.46 1.57
CERRIC Rice 951.003 498 192.39 5.60
CERSOR Sorghum/millet 4 559.560 1 412 761.91 15.88
CERWBG Bulgur wheat 2.891 1 476.79 0.02
CERWHE Wheat 1 790.283 463 957.47 5.22
CERWHF Wheat flour 1 021.026 381 878.67 4.29
DAIDSP Plain dried skimmed milk 0.567 1 922.90 0.02
FRUDFR Dried fruits 5.178 8 073.50 0.09
FSHCFI Canned fish 0.870 4 401.58 0.05
MEACHK Canned chicken 0.010 17.80 0.00
MIXBP5 BP5 emergency rations 0.073 281.46 0.00
MIXCSB Corn soya blend 2 950.816 2 240 383.43 25.19
MIXHEB High energy biscuits 7.396 10 831.53 0.12
MIXLNS LNS 100.190 268 603.77 3.02
MIXRSF Ready-to-use supplementary
food
8.302 23 528.24 0.26
MIXWSB Wheat soya blend 1.698 1 350.45 0.02
MSCMNP Micronutrient powder 0.010 156.10 0.00
MSCSAL Iodised salt 2.024 389.48 0.00
MSCSUG Sugar 286.879 128 386.09 1.44
MSCYEA Yeast 0.304 652.88 0.01
OILVEG Vegetable oil 533.978 624 194.19 7.02
PPFRTN Rations 14.049 7 165.12 0.08
PULBEA Beans 247.696 193 807.99 2.18
PULCKP Chickpeas 451.613 284 145.12 3.19
PULCPU Canned pulses 0.002 2.26 0.00
PULCVE Canned vegetables 0.001 1.03 0.00
PULLEN Lentils 605.390 335 750.10 3.77
PULPEA Peas 47.786 27 744.56 0.31
PULSLN Split lentils 846.012 534 623.20 6.01
PULSPE Split peas 746.102 390 330.40 4.39
Grand total
17 898.066 8 895 665.21
WFP/EB.A/2021/10-E 25
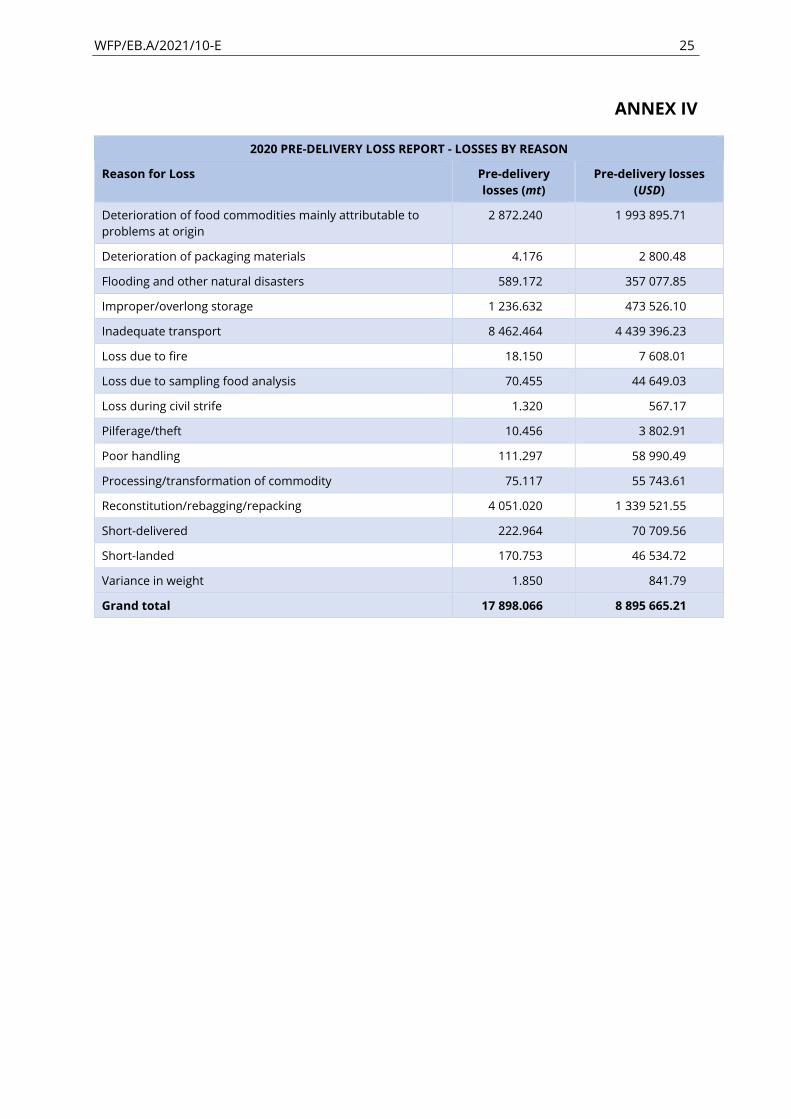
ANNEX IV
2020 PRE-DELIVERY LOSS REPORT - LOSSES BY REASON
Reason for Loss Pre-delivery
losses (mt)
Pre-delivery losses
(USD)
Deterioration of food commodities mainly attributable to
problems at origin
2 872.240 1 993 895.71
Deterioration of packaging materials 4.176 2 800.48
Flooding and other natural disasters 589.172 357 077.85
Improper/overlong storage 1 236.632 473 526.10
Inadequate transport 8 462.464 4 439 396.23
Loss due to fire 18.150 7 608.01
Loss due to sampling food analysis 70.455 44 649.03
Loss during civil strife 1.320 567.17
Pilferage/theft 10.456 3 802.91
Poor handling 111.297 58 990.49
Processing/transformation of commodity 75.117 55 743.61
Reconstitution/rebagging/repacking 4 051.020 1 339 521.55
Short-delivered 222.964 70 709.56
Short-landed 170.753 46 534.72
Variance in weight 1.850 841.79
Grand total 17 898.066 8 895 665.21

WFP/EB.A/2021/10-E 26
ANNEX V
2020 POST-DELIVERY LOSS REPORT - LOSSES BY REASON
Reason for Loss Post-delivery losses
(USD)
% of total
loss
Attack by termites 12 610.29 0.09
Broken during loading 6 925.45 0.05
Deterioration of food commodities mainly attributable to
problems at origin
1 490 349.54 11.02
Deterioration of packaging materials 24 381.80 0.18
Flooding and other natural disasters 167 883.86 1.24
Improper/overlong storage 2 588 929.71 19.14
Inadequate transport 1 554 214.46 11.49
Infestation 109 651.21 0.81
Loss due to fire 250 810.97 1.85
Loss due to over-scooping 20 649.50 0.15
Loss due to sampling food analysis 73 699.35 0.54
Loss during civil strife 499 027.13 3.69
Pilferage/theft 918 409.22 6.79
Poor handling 517 437.37 3.83
Processing / transformation of commodity 4 381.40 0.03
Reconstitution/rebagging/repacking 5 072 621.01 37.50
Short-delivered 32 005.08 0.24
Unauthorized distribution 121 959.09 0.90
Variance in weight 38 996.45 0.29
Wet bags 1 812.73 0.01
Wet by gasoil 1 142.53 0.01
Wet by oil 2.97 0.00
Wet by water 19 195.00 0.14
Grand total 13 527 096.14
WFP/EB.A/2021/10-E 27
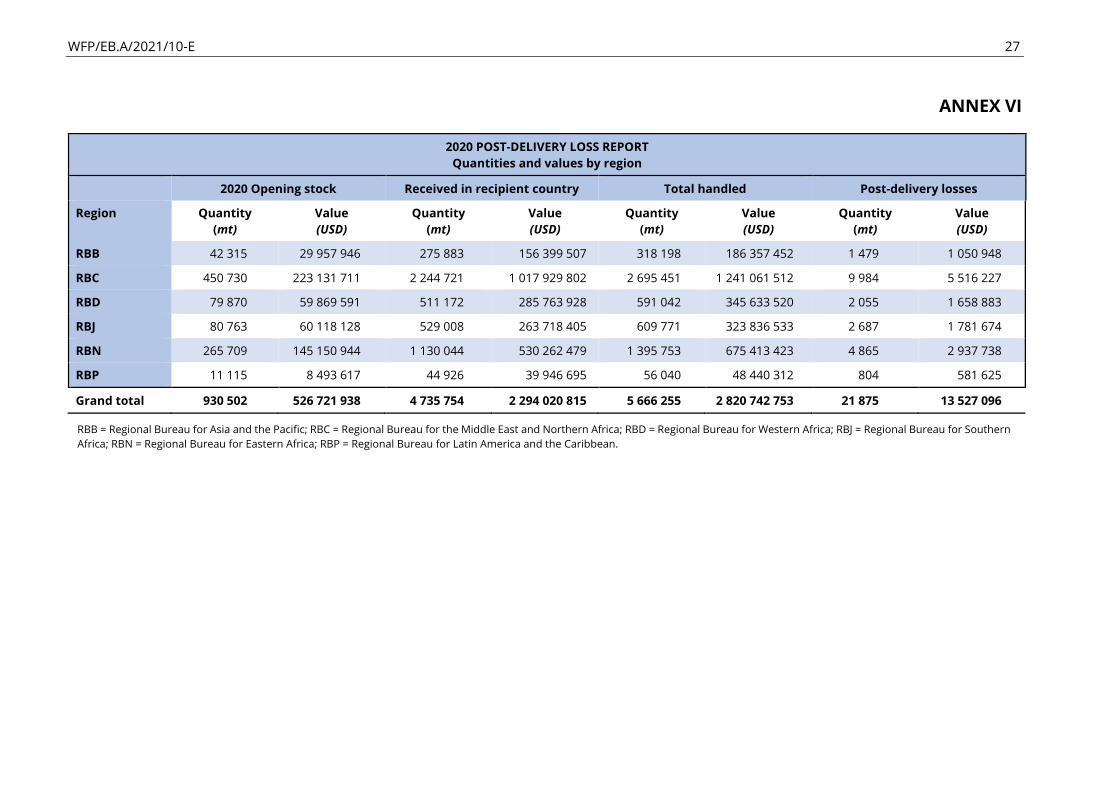
ANNEX VI
2020 POST-DELIVERY LOSS REPORT
Quantities and values by region
2020 Opening stock Received in recipient country Total handled Post-delivery losses
Region Quantity
(mt)
Value
(USD)
Quantity
(mt)
Value
(USD)
Quantity
(mt)
Value
(USD)
Quantity
(mt)
Value
(USD)
RBB 42 315 29 957 946 275 883 156 399 507 318 198 186 357 452 1 479 1 050 948
RBC 450 730 223 131 711 2 244 721 1 017 929 802 2 695 451 1 241 061 512 9 984 5 516 227
RBD 79 870 59 869 591 511 172 285 763 928 591 042 345 633 520 2 055 1 658 883
RBJ 80 763 60 118 128 529 008 263 718 405 609 771 323 836 533 2 687 1 781 674
RBN 265 709 145 150 944 1 130 044 530 262 479 1 395 753 675 413 423 4 865 2 937 738
RBP 11 115 8 493 617 44 926 39 946 695 56 040 48 440 312 804 581 625
Grand total 930 502 526 721 938 4 735 754 2 294 020 815 5 666 255 2 820 742 753 21 875 13 527 096
RBB = Regional Bureau for Asia and the Pacific; RBC = Regional Bureau for the Middle East and Northern Africa; RBD = Regional Bureau for Western Africa; RBJ = Regional Bureau for Southern
Africa; RBN = Regional Bureau for Eastern Africa; RBP = Regional Bureau for Latin America and the Caribbean.
WFP/EB.A/2021/10-E 28
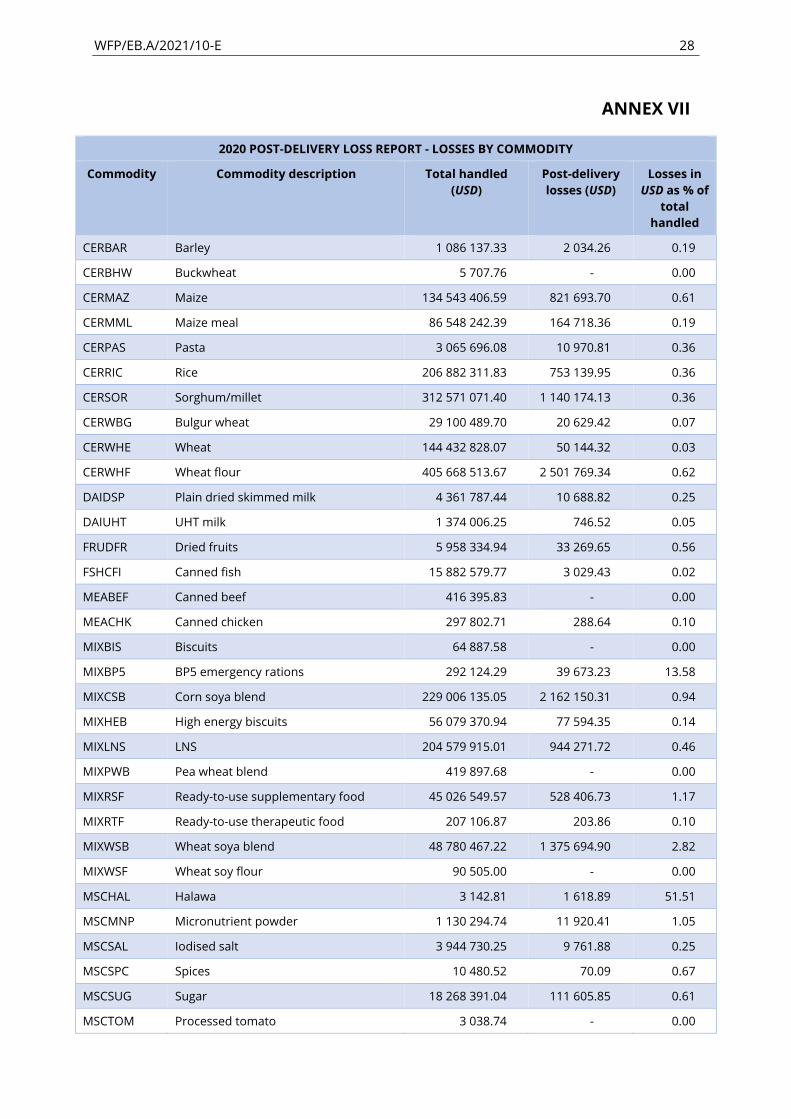
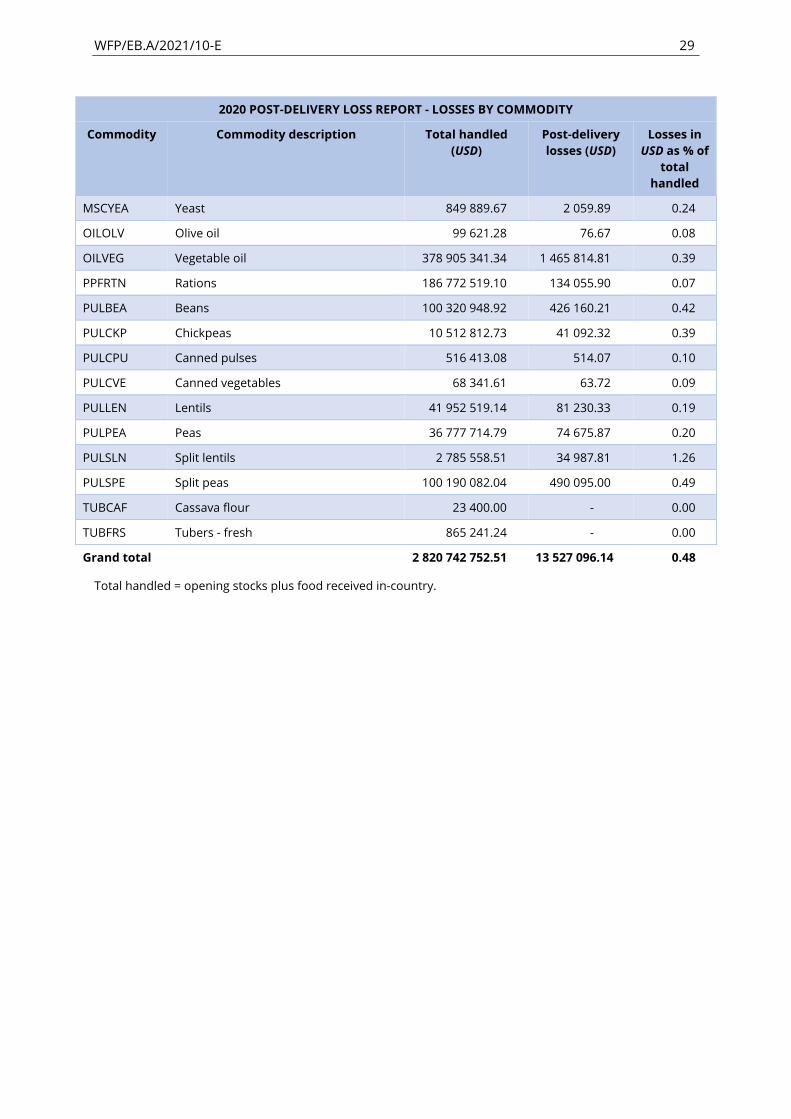
ANNEX VII
2020 POST-DELIVERY LOSS REPORT - LOSSES BY COMMODITY
Commodity Commodity description Total handled
(USD)
Post-delivery
losses (USD)
Losses in
USD as % of
total
handled
CERBAR Barley 1 086 137.33 2 034.26 0.19
CERBHW Buckwheat 5 707.76 - 0.00
CERMAZ Maize 134 543 406.59 821 693.70 0.61
CERMML Maize meal 86 548 242.39 164 718.36 0.19
CERPAS Pasta 3 065 696.08 10 970.81 0.36
CERRIC Rice 206 882 311.83 753 139.95 0.36
CERSOR Sorghum/millet 312 571 071.40 1 140 174.13 0.36
CERWBG Bulgur wheat 29 100 489.70 20 629.42 0.07
CERWHE Wheat 144 432 828.07 50 144.32 0.03
CERWHF Wheat flour 405 668 513.67 2 501 769.34 0.62
DAIDSP Plain dried skimmed milk 4 361 787.44 10 688.82 0.25
DAIUHT UHT milk 1 374 006.25 746.52 0.05
FRUDFR Dried fruits 5 958 334.94 33 269.65 0.56
FSHCFI Canned fish 15 882 579.77 3 029.43 0.02
MEABEF Canned beef 416 395.83 - 0.00
MEACHK Canned chicken 297 802.71 288.64 0.10
MIXBIS Biscuits 64 887.58 - 0.00
MIXBP5 BP5 emergency rations 292 124.29 39 673.23 13.58
MIXCSB Corn soya blend 229 006 135.05 2 162 150.31 0.94
MIXHEB High energy biscuits 56 079 370.94 77 594.35 0.14
MIXLNS LNS 204 579 915.01 944 271.72 0.46
MIXPWB Pea wheat blend 419 897.68 - 0.00
MIXRSF Ready-to-use supplementary food 45 026 549.57 528 406.73 1.17
MIXRTF Ready-to-use therapeutic food 207 106.87 203.86 0.10
MIXWSB Wheat soya blend 48 780 467.22 1 375 694.90 2.82
MIXWSF Wheat soy flour 90 505.00 - 0.00
MSCHAL Halawa 3 142.81 1 618.89 51.51
MSCMNP Micronutrient powder 1 130 294.74 11 920.41 1.05
MSCSAL Iodised salt 3 944 730.25 9 761.88 0.25
MSCSPC Spices 10 480.52 70.09 0.67
MSCSUG Sugar 18 268 391.04 111 605.85 0.61
MSCTOM Processed tomato 3 038.74 - 0.00
WFP/EB.A/2021/10-E 29
2020 POST-DELIVERY LOSS REPORT - LOSSES BY COMMODITY
Commodity Commodity description Total handled
(USD)
Post-delivery
losses (USD)
Losses in
USD as % of
total
handled
MSCYEA Yeast 849 889.67 2 059.89 0.24
OILOLV Olive oil 99 621.28 76.67 0.08
OILVEG Vegetable oil 378 905 341.34 1 465 814.81 0.39
PPFRTN Rations 186 772 519.10 134 055.90 0.07
PULBEA Beans 100 320 948.92 426 160.21 0.42
PULCKP Chickpeas 10 512 812.73 41 092.32 0.39
PULCPU Canned pulses 516 413.08 514.07 0.10
PULCVE Canned vegetables 68 341.61 63.72 0.09
PULLEN Lentils 41 952 519.14 81 230.33 0.19
PULPEA Peas 36 777 714.79 74 675.87 0.20
PULSLN Split lentils 2 785 558.51 34 987.81 1.26
PULSPE Split peas 100 190 082.04 490 095.00 0.49
TUBCAF Cassava flour 23 400.00 - 0.00
TUBFRS Tubers - fresh 865 241.24 - 0.00
Grand total
2 820 742 752.51 13 527 096.14 0.48
Total handled = opening stocks plus food received in-country.
WFP/EB.A/2021/10-E 30
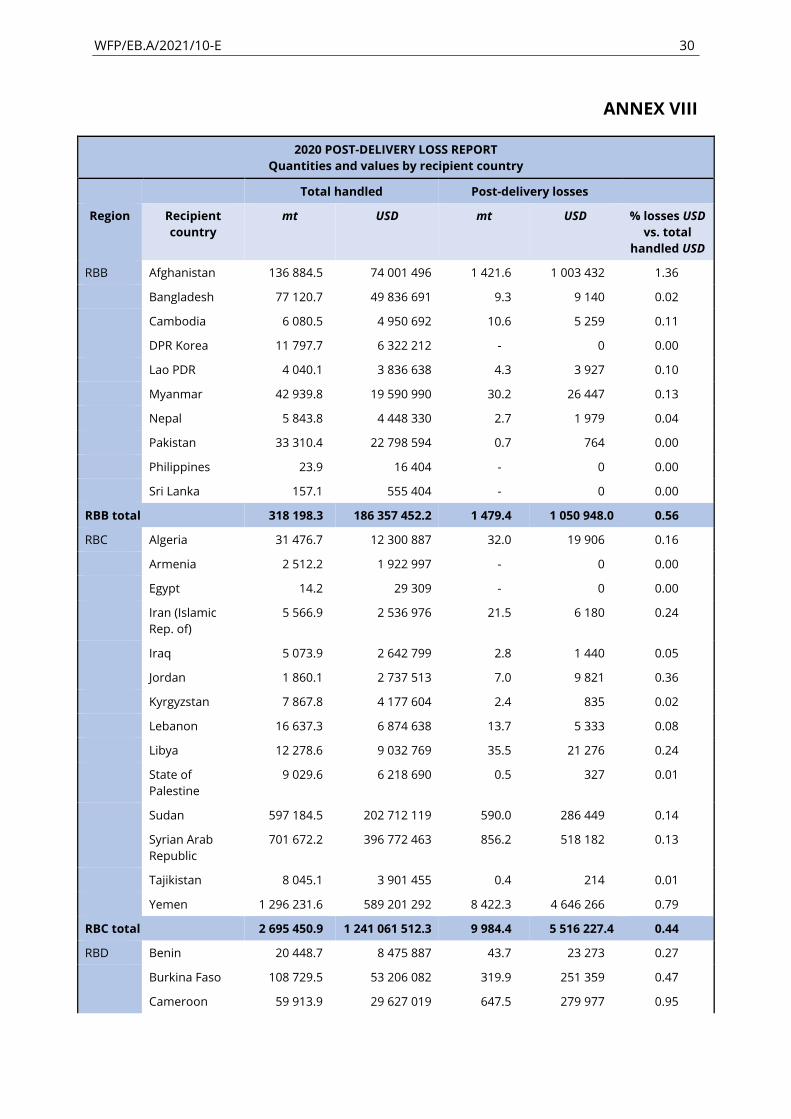
ANNEX VIII
2020 POST-DELIVERY LOSS REPORT
Quantities and values by recipient country
Total handled Post-delivery losses
Region Recipient
country
mt USD mt USD % losses USD
vs. total
handled USD
RBB Afghanistan 136 884.5 74 001 496 1 421.6 1 003 432 1.36
Bangladesh 77 120.7 49 836 691 9.3 9 140 0.02
Cambodia 6 080.5 4 950 692 10.6 5 259 0.11
DPR Korea 11 797.7 6 322 212 - 0 0.00
Lao PDR 4 040.1 3 836 638 4.3 3 927 0.10
Myanmar 42 939.8 19 590 990 30.2 26 447 0.13
Nepal 5 843.8 4 448 330 2.7 1 979 0.04
Pakistan 33 310.4 22 798 594 0.7 764 0.00
Philippines 23.9 16 404 - 0 0.00
Sri Lanka 157.1 555 404 - 0 0.00
RBB total 318 198.3 186 357 452.2 1 479.4 1 050 948.0 0.56
RBC Algeria 31 476.7 12 300 887 32.0 19 906 0.16
Armenia 2 512.2 1 922 997 - 0 0.00
Egypt 14.2 29 309 - 0 0.00
Iran (Islamic
Rep. of)
5 566.9 2 536 976 21.5 6 180 0.24
Iraq 5 073.9 2 642 799 2.8 1 440 0.05
Jordan 1 860.1 2 737 513 7.0 9 821 0.36
Kyrgyzstan 7 867.8 4 177 604 2.4 835 0.02
Lebanon 16 637.3 6 874 638 13.7 5 333 0.08
Libya 12 278.6 9 032 769 35.5 21 276 0.24
State of
Palestine
9 029.6 6 218 690 0.5 327 0.01
Sudan 597 184.5 202 712 119 590.0 286 449 0.14
Syrian Arab
Republic
701 672.2 396 772 463 856.2 518 182 0.13
Tajikistan 8 045.1 3 901 455 0.4 214 0.01
Yemen 1 296 231.6 589 201 292 8 422.3 4 646 266 0.79
RBC total 2 695 450.9 1 241 061 512.3 9 984.4 5 516 227.4 0.44
RBD Benin 20 448.7 8 475 887 43.7 23 273 0.27
Burkina Faso 108 729.5 53 206 082 319.9 251 359 0.47
Cameroon 59 913.9 29 627 019 647.5 279 977 0.95
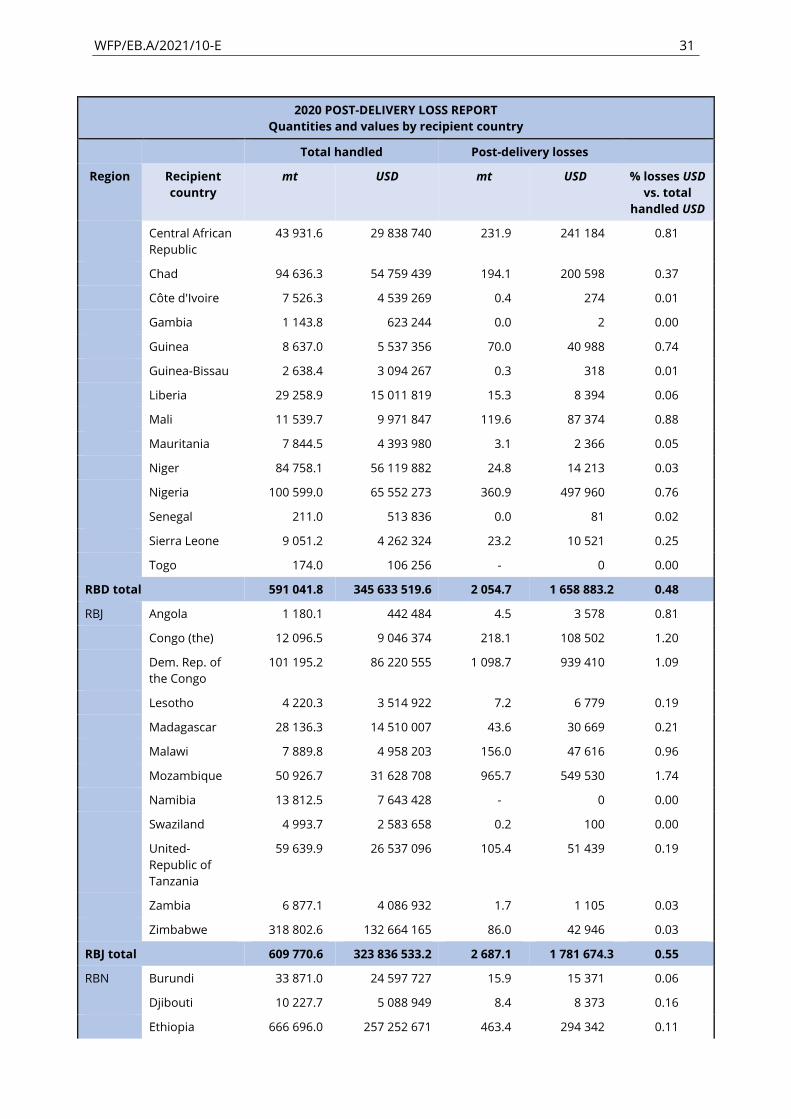
WFP/EB.A/2021/10-E 31
2020 POST-DELIVERY LOSS REPORT
Quantities and values by recipient country
Total handled Post-delivery losses
Region Recipient
country
mt USD mt USD % losses USD
vs. total
handled USD
Central African
Republic
43 931.6 29 838 740 231.9 241 184 0.81
Chad 94 636.3 54 759 439 194.1 200 598 0.37
Côte d'Ivoire 7 526.3 4 539 269 0.4 274 0.01
Gambia 1 143.8 623 244 0.0 2 0.00
Guinea 8 637.0 5 537 356 70.0 40 988 0.74
Guinea-Bissau 2 638.4 3 094 267 0.3 318 0.01
Liberia 29 258.9 15 011 819 15.3 8 394 0.06
Mali 11 539.7 9 971 847 119.6 87 374 0.88
Mauritania 7 844.5 4 393 980 3.1 2 366 0.05
Niger 84 758.1 56 119 882 24.8 14 213 0.03
Nigeria 100 599.0 65 552 273 360.9 497 960 0.76
Senegal 211.0 513 836 0.0 81 0.02
Sierra Leone 9 051.2 4 262 324 23.2 10 521 0.25
Togo 174.0 106 256 - 0 0.00
RBD total 591 041.8 345 633 519.6 2 054.7 1 658 883.2 0.48
RBJ Angola 1 180.1 442 484 4.5 3 578 0.81
Congo (the) 12 096.5 9 046 374 218.1 108 502 1.20
Dem. Rep. of
the Congo
101 195.2 86 220 555 1 098.7 939 410 1.09
Lesotho 4 220.3 3 514 922 7.2 6 779 0.19
Madagascar 28 136.3 14 510 007 43.6 30 669 0.21
Malawi 7 889.8 4 958 203 156.0 47 616 0.96
Mozambique 50 926.7 31 628 708 965.7 549 530 1.74
Namibia 13 812.5 7 643 428 - 0 0.00
Swaziland 4 993.7 2 583 658 0.2 100 0.00
United-
Republic of
Tanzania
59 639.9 26 537 096 105.4 51 439 0.19
Zambia 6 877.1 4 086 932 1.7 1 105 0.03
Zimbabwe 318 802.6 132 664 165 86.0 42 946 0.03
RBJ total 609 770.6 323 836 533.2 2 687.1 1 781 674.3 0.55
RBN Burundi 33 871.0 24 597 727 15.9 15 371 0.06
Djibouti 10 227.7 5 088 949 8.4 8 373 0.16
Ethiopia 666 696.0 257 252 671 463.4 294 342 0.11
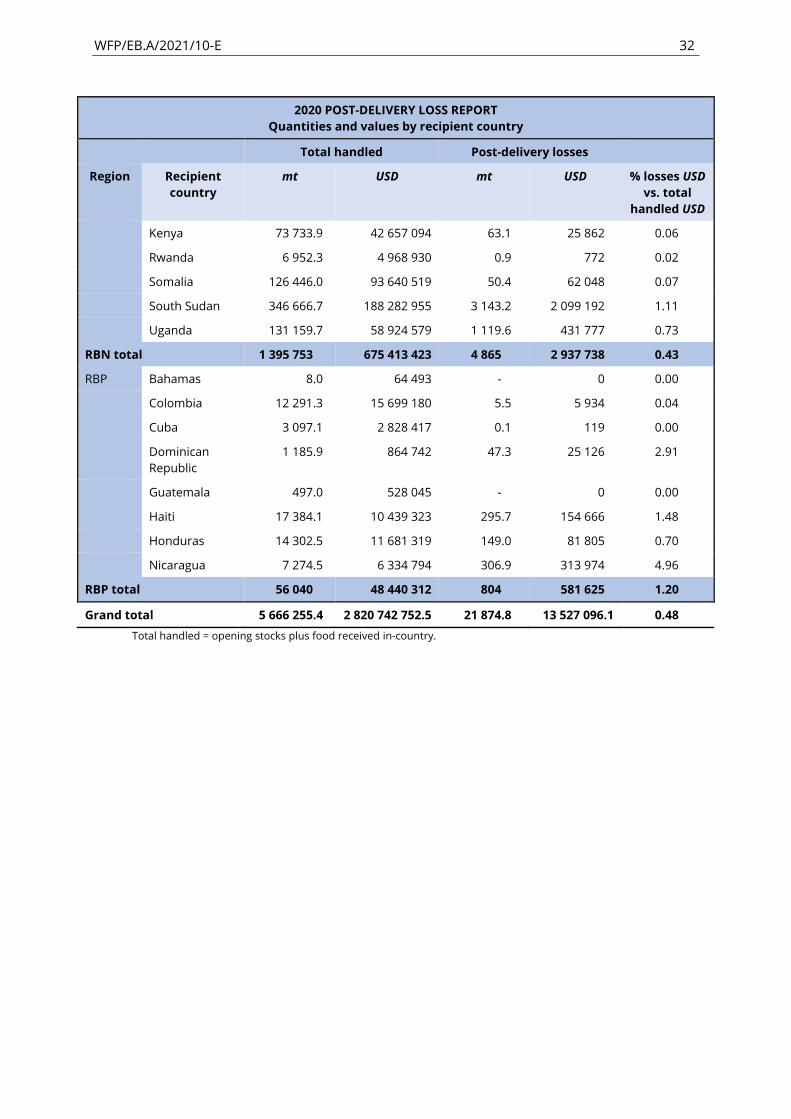
WFP/EB.A/2021/10-E 32
2020 POST-DELIVERY LOSS REPORT
Quantities and values by recipient country
Total handled Post-delivery losses
Region Recipient
country
mt USD mt USD % losses USD
vs. total
handled USD
Kenya 73 733.9 42 657 094 63.1 25 862 0.06
Rwanda 6 952.3 4 968 930 0.9 772 0.02
Somalia 126 446.0 93 640 519 50.4 62 048 0.07
South Sudan 346 666.7 188 282 955 3 143.2 2 099 192 1.11
Uganda 131 159.7 58 924 579 1 119.6 431 777 0.73
RBN total 1 395 753 675 413 423 4 865 2 937 738 0.43
RBP Bahamas 8.0 64 493 - 0 0.00
Colombia 12 291.3 15 699 180 5.5 5 934 0.04
Cuba 3 097.1 2 828 417 0.1 119 0.00
Dominican
Republic
1 185.9 864 742 47.3 25 126 2.91
Guatemala 497.0 528 045 - 0 0.00
Haiti 17 384.1 10 439 323 295.7 154 666 1.48
Honduras 14 302.5 11 681 319 149.0 81 805 0.70
Nicaragua 7 274.5 6 334 794 306.9 313 974 4.96
RBP total 56 040 48 440 312 804 581 625 1.20
Grand total 5 666 255.4 2 820 742 752.5 21 874.8 13 527 096.1 0.48
Total handled = opening stocks plus food received in-country.
WFP/EB.A/2021/10-E 33
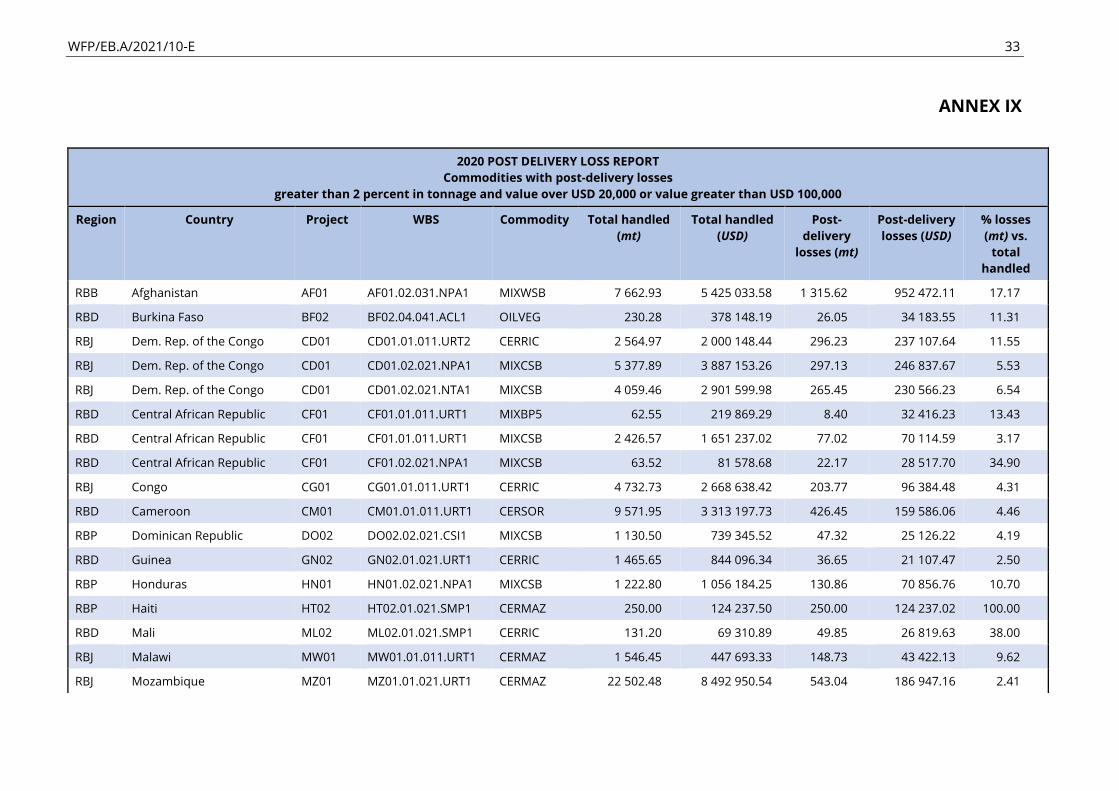
ANNEX IX
2020 POST DELIVERY LOSS REPORT
Commodities with post-delivery losses
greater than 2 percent in tonnage and value over USD 20,000 or value greater than USD 100,000
Region Country Project WBS Commodity Total handled
(mt)
Total handled
(USD)
Post-
delivery
losses (mt)
Post-delivery
losses (USD)
% losses
(mt) vs.
total
handled
RBB Afghanistan AF01 AF01.02.031.NPA1 MIXWSB 7 662.93 5 425 033.58 1 315.62 952 472.11 17.17
RBD Burkina Faso BF02 BF02.04.041.ACL1 OILVEG 230.28 378 148.19 26.05 34 183.55 11.31
RBJ Dem. Rep. of the Congo CD01 CD01.01.011.URT2 CERRIC 2 564.97 2 000 148.44 296.23 237 107.64 11.55
RBJ Dem. Rep. of the Congo CD01 CD01.02.021.NPA1 MIXCSB 5 377.89 3 887 153.26 297.13 246 837.67 5.53
RBJ Dem. Rep. of the Congo CD01 CD01.02.021.NTA1 MIXCSB 4 059.46 2 901 599.98 265.45 230 566.23 6.54
RBD Central African Republic CF01 CF01.01.011.URT1 MIXBP5 62.55 219 869.29 8.40 32 416.23 13.43
RBD Central African Republic CF01 CF01.01.011.URT1 MIXCSB 2 426.57 1 651 237.02 77.02 70 114.59 3.17
RBD Central African Republic CF01 CF01.02.021.NPA1 MIXCSB 63.52 81 578.68 22.17 28 517.70 34.90
RBJ Congo CG01 CG01.01.011.URT1 CERRIC 4 732.73 2 668 638.42 203.77 96 384.48 4.31
RBD Cameroon CM01 CM01.01.011.URT1 CERSOR 9 571.95 3 313 197.73 426.45 159 586.06 4.46
RBP Dominican Republic DO02 DO02.02.021.CSI1 MIXCSB 1 130.50 739 345.52 47.32 25 126.22 4.19
RBD Guinea GN02 GN02.01.021.URT1 CERRIC 1 465.65 844 096.34 36.65 21 107.47 2.50
RBP Honduras HN01 HN01.02.021.NPA1 MIXCSB 1 222.80 1 056 184.25 130.86 70 856.76 10.70
RBP Haiti HT02 HT02.01.021.SMP1 CERMAZ 250.00 124 237.50 250.00 124 237.02 100.00
RBD Mali ML02 ML02.01.021.SMP1 CERRIC 131.20 69 310.89 49.85 26 819.63 38.00
RBJ Malawi MW01 MW01.01.011.URT1 CERMAZ 1 546.45 447 693.33 148.73 43 422.13 9.62
RBJ Mozambique MZ01 MZ01.01.021.URT1 CERMAZ 22 502.48 8 492 950.54 543.04 186 947.16 2.41
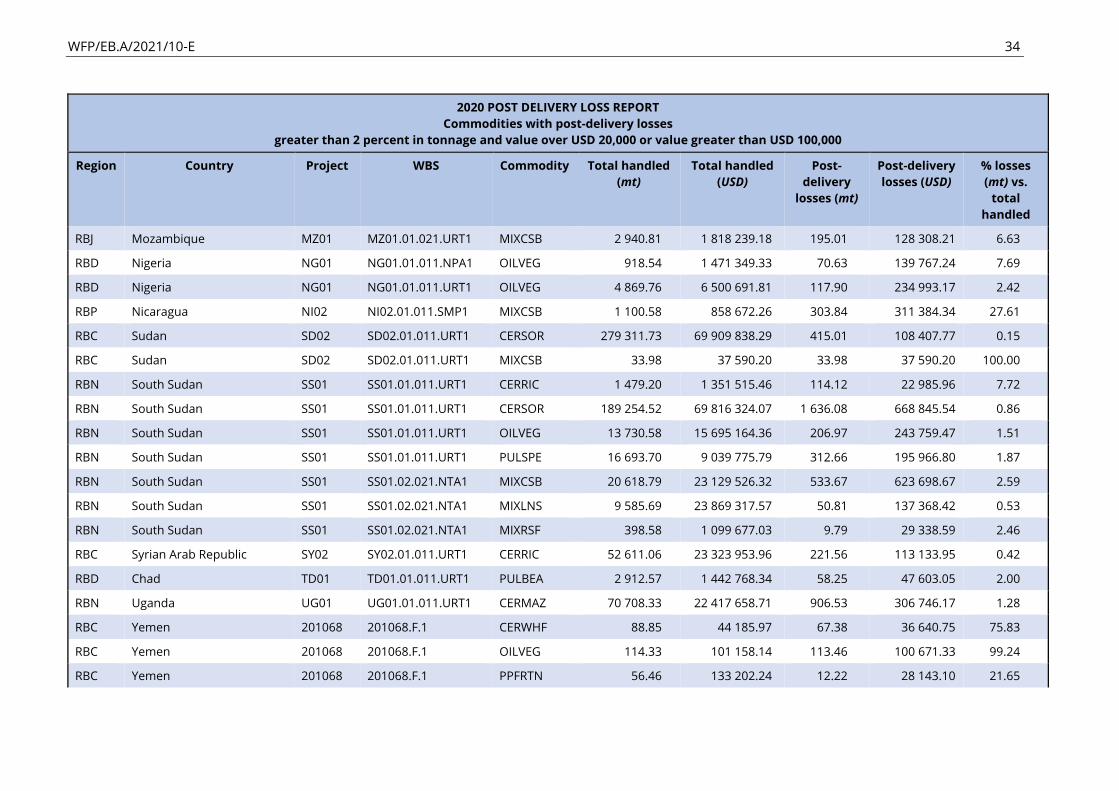
WFP/EB.A/2021/10-E 34
2020 POST DELIVERY LOSS REPORT
Commodities with post-delivery losses
greater than 2 percent in tonnage and value over USD 20,000 or value greater than USD 100,000
Region Country Project WBS Commodity Total handled
(mt)
Total handled
(USD)
Post-
delivery
losses (mt)
Post-delivery
losses (USD)
% losses
(mt) vs.
total
handled
RBJ Mozambique MZ01 MZ01.01.021.URT1 MIXCSB 2 940.81 1 818 239.18 195.01 128 308.21 6.63
RBD Nigeria NG01 NG01.01.011.NPA1 OILVEG 918.54 1 471 349.33 70.63 139 767.24 7.69
RBD Nigeria NG01 NG01.01.011.URT1 OILVEG 4 869.76 6 500 691.81 117.90 234 993.17 2.42
RBP Nicaragua NI02 NI02.01.011.SMP1 MIXCSB 1 100.58 858 672.26 303.84 311 384.34 27.61
RBC Sudan SD02 SD02.01.011.URT1 CERSOR 279 311.73 69 909 838.29 415.01 108 407.77 0.15
RBC Sudan SD02 SD02.01.011.URT1 MIXCSB 33.98 37 590.20 33.98 37 590.20 100.00
RBN South Sudan SS01 SS01.01.011.URT1 CERRIC 1 479.20 1 351 515.46 114.12 22 985.96 7.72
RBN South Sudan SS01 SS01.01.011.URT1 CERSOR 189 254.52 69 816 324.07 1 636.08 668 845.54 0.86
RBN South Sudan SS01 SS01.01.011.URT1 OILVEG 13 730.58 15 695 164.36 206.97 243 759.47 1.51
RBN South Sudan SS01 SS01.01.011.URT1 PULSPE 16 693.70 9 039 775.79 312.66 195 966.80 1.87
RBN South Sudan SS01 SS01.02.021.NTA1 MIXCSB 20 618.79 23 129 526.32 533.67 623 698.67 2.59
RBN South Sudan SS01 SS01.02.021.NTA1 MIXLNS 9 585.69 23 869 317.57 50.81 137 368.42 0.53
RBN South Sudan SS01 SS01.02.021.NTA1 MIXRSF 398.58 1 099 677.03 9.79 29 338.59 2.46
RBC Syrian Arab Republic SY02 SY02.01.011.URT1 CERRIC 52 611.06 23 323 953.96 221.56 113 133.95 0.42
RBD Chad TD01 TD01.01.011.URT1 PULBEA 2 912.57 1 442 768.34 58.25 47 603.05 2.00
RBN Uganda UG01 UG01.01.011.URT1 CERMAZ 70 708.33 22 417 658.71 906.53 306 746.17 1.28
RBC Yemen 201068 201068.F.1 CERWHF 88.85 44 185.97 67.38 36 640.75 75.83
RBC Yemen 201068 201068.F.1 OILVEG 114.33 101 158.14 113.46 100 671.33 99.24
RBC Yemen 201068 201068.F.1 PPFRTN 56.46 133 202.24 12.22 28 143.10 21.65
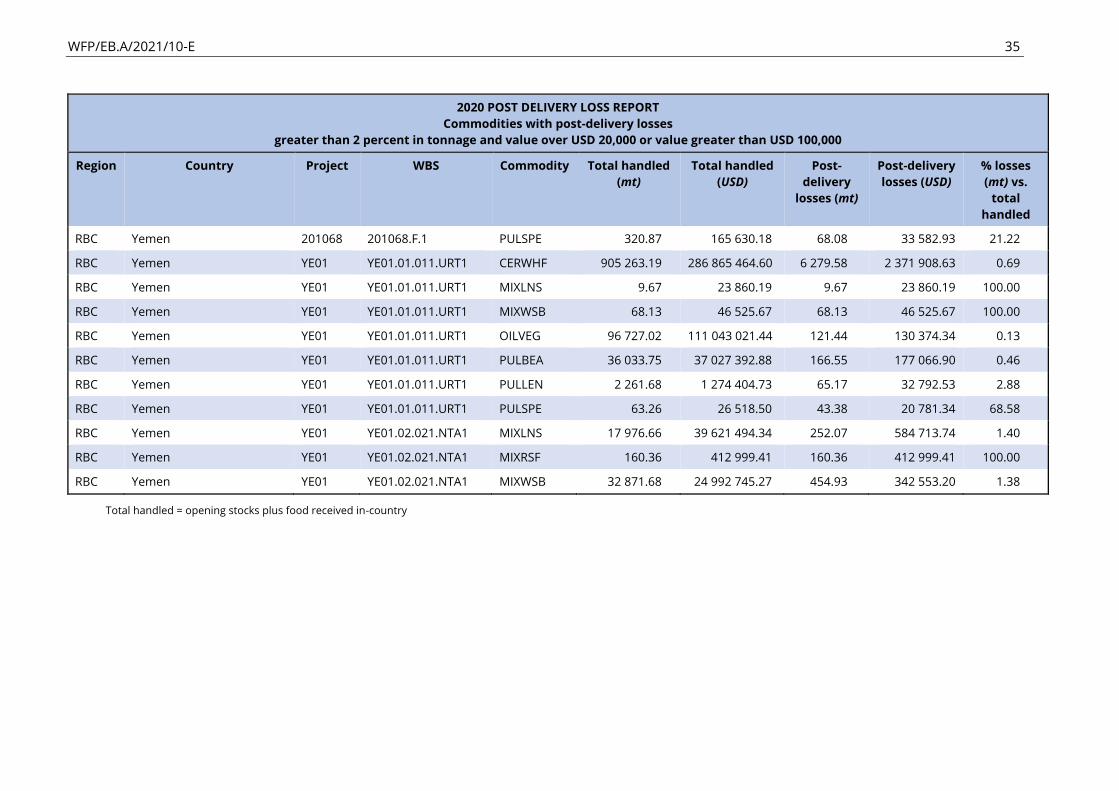
WFP/EB.A/2021/10-E 35
2020 POST DELIVERY LOSS REPORT
Commodities with post-delivery losses
greater than 2 percent in tonnage and value over USD 20,000 or value greater than USD 100,000
Region Country Project WBS Commodity Total handled
(mt)
Total handled
(USD)
Post-
delivery
losses (mt)
Post-delivery
losses (USD)
% losses
(mt) vs.
total
handled
RBC Yemen 201068 201068.F.1 PULSPE 320.87 165 630.18 68.08 33 582.93 21.22
RBC Yemen YE01 YE01.01.011.URT1 CERWHF 905 263.19 286 865 464.60 6 279.58 2 371 908.63 0.69
RBC Yemen YE01 YE01.01.011.URT1 MIXLNS 9.67 23 860.19 9.67 23 860.19 100.00
RBC Yemen YE01 YE01.01.011.URT1 MIXWSB 68.13 46 525.67 68.13 46 525.67 100.00
RBC Yemen YE01 YE01.01.011.URT1 OILVEG 96 727.02 111 043 021.44 121.44 130 374.34 0.13
RBC Yemen YE01 YE01.01.011.URT1 PULBEA 36 033.75 37 027 392.88 166.55 177 066.90 0.46
RBC Yemen YE01 YE01.01.011.URT1 PULLEN 2 261.68 1 274 404.73 65.17 32 792.53 2.88
RBC Yemen YE01 YE01.01.011.URT1 PULSPE 63.26 26 518.50 43.38 20 781.34 68.58
RBC Yemen YE01 YE01.02.021.NTA1 MIXLNS 17 976.66 39 621 494.34 252.07 584 713.74 1.40
RBC Yemen YE01 YE01.02.021.NTA1 MIXRSF 160.36 412 999.41 160.36 412 999.41 100.00
RBC Yemen YE01 YE01.02.021.NTA1 MIXWSB 32 871.68 24 992 745.27 454.93 342 553.20 1.38
Total handled = opening stocks plus food received in-country
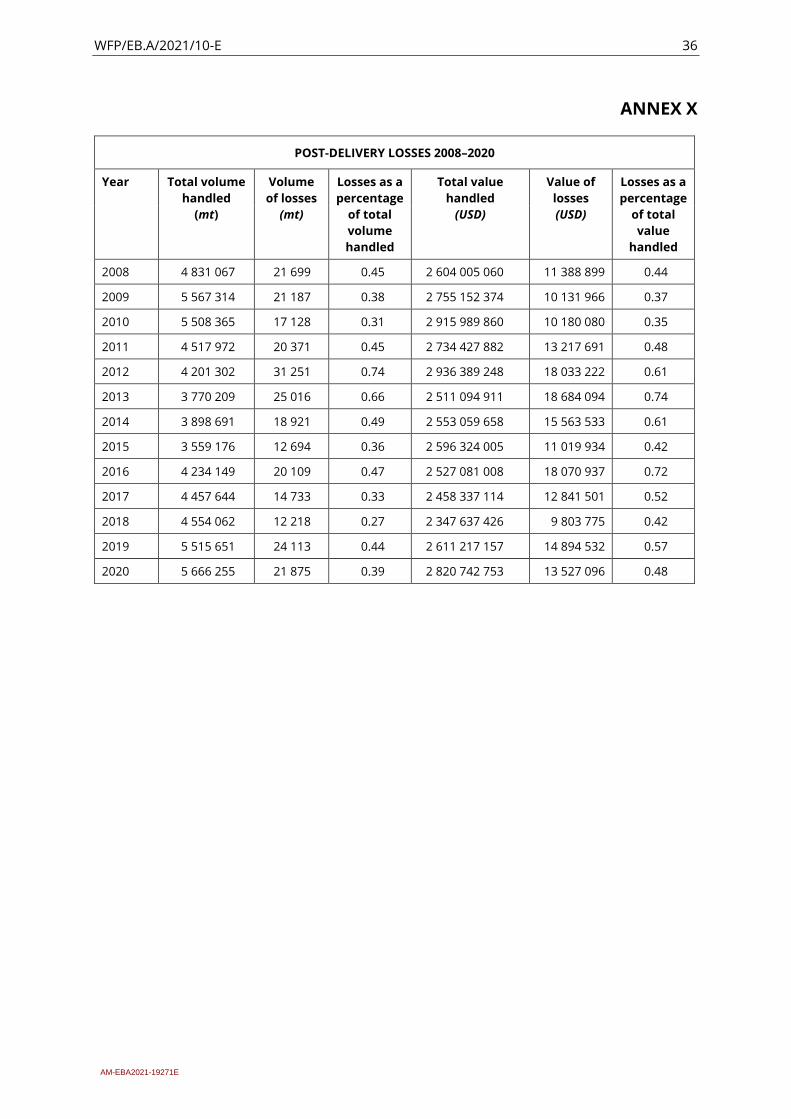
WFP/EB.A/2021/10-E 36
ANNEX X
POST-DELIVERY LOSSES 2008–2020
Year Total volume
handled
(mt)
Volume
of losses
(mt)
Losses as a
percentage
of total
volume
handled
Total value
handled
(USD)
Value of
losses
(USD)
Losses as a
percentage
of total
value
handled
2008 4 831 067 21 699 0.45 2 604 005 060 11 388 899 0.44
2009 5 567 314 21 187 0.38 2 755 152 374 10 131 966 0.37
2010 5 508 365 17 128 0.31 2 915 989 860 10 180 080 0.35
2011 4 517 972 20 371 0.45 2 734 427 882 13 217 691 0.48
2012 4 201 302 31 251 0.74 2 936 389 248 18 033 222 0.61
2013 3 770 209 25 016 0.66 2 511 094 911 18 684 094 0.74
2014 3 898 691 18 921 0.49 2 553 059 658 15 563 533 0.61
2015 3 559 176 12 694 0.36 2 596 324 005 11 019 934 0.42
2016 4 234 149 20 109 0.47 2 527 081 008 18 070 937 0.72
2017 4 457 644 14 733 0.33 2 458 337 114 12 841 501 0.52
2018 4 554 062 12 218 0.27 2 347 637 426 9 803 775 0.42
2019 5 515 651 24 113 0.44 2 611 217 157 14 894 532 0.57
2020 5 666 255 21 875 0.39 2 820 742 753 13 527 096 0.48
AM-EBA2021-19271E