Embed Size (px)
Citation preview
REPORT ON
MOLYHIL PROJECT
TAILINGS STORAGE FACILITY
DEFINITIVE FEASIBILITY STUDY
Submitted to:
Thor Mining PLC Level 1, 282 Rokeby Road
SUBIACO WA 6008 DISTRIBUTION: 1 Electronic Copy - Thor Mining PLC 1 Copy - Golder Associates Pty Ltd November 2006 06642358-R01

November 2006 - i - 06642358-R01
Golder Associates
EXECUTIVE SUMMARY
Thor Mining PLC is proposing to advance the Molyhil Project in the Northern Territory towards production and has commissioned Golder Associates Pty Ltd to develop design proposals and undertake a feasibility study for management of the tailings that will be generated by the processing of the Molyhil ore.
The project is currently expected to generate approximately 1.2 Mt of tailings over a four year period at an annual output of approximately 300,000 t using a combination of magnetic spearation, flotation and gravity separation processes to recover magnetite, molybdenite and scheelite respectively. Tailings will be produced as three separate tailings streams, pyrite concentrate (7.6%), magnetite concentrate (25.2%) and general plant tailings (67.3%).
Approximately 90,000 t of magnetite will be produced during the design life of the project. The concentrate, which is understood to be inert, will be dewatered at the plant and transported by truck or conveyor to the point of temporary disposal where the material will be placed into stockpiles for subsequent removal from the site.
Geotechnical and geochemical characterisation testwork has yet to be undertaken on samples of the tailings solids and liquor to provide an understanding of the mechanical properties and behaviour of the tailings and the potential environmental considerations that may need to be taken into account. In the absence of this data, a conventional and well-tried approach has been adopted for the design of the tailings storage facility (TSF), which is conservative in design and will tolerate variability in the character and behaviour of the tailings.
The pyrite concentrate tailings and the general plant tailings will be combined at the plant and pumped to a nearby tailings storage facility (TSF) as slurry at a design solids content of 55% by mass. The combined tailings will be deposited into a conventional, rectangular shaped paddock-type TSF, with a footprint area of approximately 12.76 ha and functional storage area of approximately 9.9 ha. The perimeter starter embankment will be raised periodically to provide a life of mine storage for approximately 890,000 t of pyrite and general plant tailings. There will be potential for increasing the storage capacity of the TSF by further embankment raises in the event that the mineral resource is increased. Assuming an average tailings dry density of 1.6 t/m3 and beach slope of 1.3%, the maximum height of the perimeter embankment required to store the estimated 0.89 Mt of combined tailings will be approximately 11 m and final crest elevation will be at approximately RL422 m.
The magnetite concentrate disposal area will be located adjacent to the combined pyrite and general plant tailings TSF. The extent of embankment construction proposed for the magnetite concentrate storage will be limited to that necessary to protect the stockpiles from surface runoff.
The civil construction for the Molyhil combined pyrite and general plant TSF will involve the clearing and stripping of the TSF footprint and excavation of a cut-off keyway, construction

November 2006 - ii - 06642358-R01
Golder Associates
of a zoned perimeter embankemnt and decant access causeway, construction of a central pump-out decant and installation slurry delivery and distribution pipework and return water pipework.
Provision has been made in the cost estimates for the installation of a basal geosynthetic liner and an underdrainage collection system should testwork on the tailings solids and liquor indicate that these measures will be required to minimise the potential impacts of seepage.
Over the life of the operation, the perimeter embankment and decant causeway will be raised by three increments of 1.5 m to a final estimated elevation of RL422 m. It is envisaged that regulatory approval will be sought for the proposed construction of the TSF starter embankment and incremental raises to this design elevation.
The proposed closure design provides for the shaping of the outer slopes to an average outer slope of 1V:4H, shaping of the central area of the TSF to minimise concentration of run-off, armouring the embankment crest rim and placing a waste rock cover of varying thickness over the tailings beach, placement of a 300 mm soil layer over the central area of the TSF beach as a store release cover; and working topsoil onto the outer embankment slopes.
The estimated capital cost for the initial civil engineering works is $2.9 million, excluding electrical, mechanical and pipework costs, but including the provision of $1.4 million for a clay and geosynthetic liner system and underdrainage system.
The annual costs for constructing the embankment raises is estimated to be $0.5 million. This does not include personnel costs which are deemed to be included in the plant operator costs.
The cost for closure is estimated to be $1.15 million for shaping and rock and soil cover placement.
November 2006 - iii - 06642358-R01
Golder Associates
TABLE OF CONTENTS
SECTION PAGE 1.0 INTRODUCTION......................................................................................... 1
1.1 General Project Overview ......................................................................1 1.2 Project Location .....................................................................................1 1.3 Ownership and Tenements ....................................................................1
2.0 TAILINGS STORAGE ................................................................................. 1 3.0 TAILINGS CHARACTERISTICS ................................................................ 4
3.1 Physical Properties ................................................................................4 3.1.1 General.......................................................................................4 3.1.2 Particle Size Distribution.............................................................5 3.1.3 Tailings Particle Density .............................................................6 3.1.4 Implications and Assumptions for Tailings Behaviour .................6
3.2 Geochemistry of Tailings and Tailings Liquor .........................................8 4.0 DESIGN CONSIDERATIONS..................................................................... 8
4.1 Site Characteristics ................................................................................8 4.2 Geology .................................................................................................9 4.3 Soil Profile............................................................................................10 4.4 Rainfall and Evaporation ......................................................................10 4.5 Hydrological Site Characteristics..........................................................11
4.5.1 Surface Water...........................................................................11 4.5.2 Groundwater.............................................................................12
4.6 Geotechnical Site Characteristics.........................................................13 4.6.1 Fieldwork ..................................................................................13 4.6.2 Laboratory Testwork.................................................................17
5.0 COMBINED PYRITE AND GENERAL PLANT TSF DESIGN.................. 18 5.1 General Description .............................................................................18 5.2 Starter Cell Design Details ...................................................................19
5.2.1 Starter Embankment Design.....................................................19 5.2.2 Foundation Preparation ............................................................20 5.2.3 Decant System .........................................................................20 5.2.4 Tailings Delivery and Distribution System.................................21 5.2.5 Internal Seepage Interception System (Provisional) .................21
5.3 Future Upstream Embankment Raise Construction..............................22 5.4 Construction Considerations ................................................................23 5.5 Environmental Design Considerations..................................................23 5.6 Decommissioning and Rehabilitation....................................................24
6.0 DESIGN ANALYSES ................................................................................ 24 6.1 Geotechnical Stability Evaluation .........................................................24
6.1.1 General Approach ....................................................................24 6.1.2 Modelled Sections ....................................................................25 6.1.3 Material Strength Parameters ...................................................26
November 2006 - iv - 06642358-R01
Golder Associates
6.1.4 Results of the Stability Modelling ..............................................27 6.2 Seepage Analysis ................................................................................27
6.2.1 Objectives.................................................................................27 6.2.2 Hydrogeology ...........................................................................27 6.2.3 Conceptual Model.....................................................................28 6.2.4 Modelling Results .....................................................................30 6.2.5 Conclusions..............................................................................31
6.3 Flood Assessment................................................................................31 6.3.1 Basis for Flood Estimation ........................................................31 6.3.2 Flood Estimation.......................................................................32
6.4 Water Balance .....................................................................................33 6.5 Dam Break Assessment.......................................................................35
7.0 OPERATING PROCEDURES .................................................................. 36 7.1 Tailings Deposition and Staged Construction .......................................36 7.2 Water Management..............................................................................37 7.3 Monitoring and Auditing........................................................................38
8.0 COST ESTIMATES................................................................................... 38 8.1 Capital Costs........................................................................................38
8.1.1 Basis of Estimate......................................................................38 8.1.2 Pre-Production Capital Expenditure Forecast Schedule ...........39 8.1.3 Contingency and Estimate Accuracy ........................................40 8.1.4 Qualifications............................................................................40
8.2 Operating Cost Estimate ......................................................................40 8.2.1 General.....................................................................................40 8.2.2 Maintenance Personnel ............................................................41
8.3 Closure ................................................................................................41 8.3.1 Summary ..................................................................................42
9.0 IMPORTANT INFORMATION................................................................... 42 LIST OF TABLES Table 1 Tailings Production Summary Table 2 Predicted Grading of Combined Pyrite and General Plant Tailings Table 3 Molyhil TSF Investigations – Test Pit Locations Table 4 Molyhil TSF Borrow Investigation - Test Pit Locations Table 5 Molyhil TSF Borehole and Monitoring Bore Locations Table 6 Range of Calculated Permeability Coefficients Table 7 Laboratory Test Result on Soils – Index Properties Table 8 Laboratory Test Result on Soils – Engineering Properties Table 9 Material Parameters for TSF Slope Stability Analyses Table 10 Constant Head Boundary Function Table 11 Adopted Permeability Coefficients Table 12 Model Predicted Seepage

November 2006 - v - 06642358-R01
Golder Associates
Table 13 Recommended Runoff Coefficients Table 14 Flood Estimates for Molyhil, Central Australia Table 15 Combined TSF Water Balance Estimate Table 16 Assigned Risks to Dam Break Study Table 17 Summary of Estimated Capital Costs Table 18 Summary of Estimated Operating Costs Table 19 Summary of Estimated Closure Costs Table 20 TSF Cost Summary LIST OF FIGURES Figure 1 Molyhil Site Locality Plan Figure 2 General Site layout Figure 3 Geotechnical Testing Locations Figure 4 TSF Stage Capacity Curves Figure 5 Proposed Tailings Storage Facility – General Arrangement and
Setout Plan Figure 6 Proposed Tailings Storage Facility – Typical Sections and Details Figure 7 Schematic of Proposed Pipeline and Spigot Layout Figure 8 Provisional Underdrainage Layout and Outfall Sump Figure 9 Proposed TSF Staged Construction Figure 10 Decommissioning Proposal – Plan and Section Figure 11 Seepage and Stability Modelled Section Location Plan Figure 12 Stability Analyses under MCE and Static Loading Figure 13 Cross-Section SEEP/W Model Setup Figure 14 Model-Predicted Phreatic Surface within TSF at end of Deposition Figure 15 Schematic Tailings Circuit Annual Water Balance LIST OF APPENDICES Appendix A Summary Test Pit Logs Appendix B Borehole Logs Appendix C Falling Head Test Analyses Appendix D TSF Foundation Soils – Laboratory Test Certificates Appendix E Capital Cost Estimate Appendix F Operating Cost Estimate Appendix G Closure Cost Estimate Appendix H Important Information about your Geotechnical Engineering Report

November 2006 - 1 - 06642358-R01
Golder Associates
1.0 INTRODUCTION
1.1 General Project Overview
Thor Mining PLC (Thor) is undertaking a feasibility study with the objective of recommencing mining of the Molyhil tungsten-molybdenum skarn deposit, which is located approximately 240 km to the east north east of Alice Springs in the Northern Territory of Australia.
Golder Associates Pty Ltd (Golder) has been commissioned by Thor to address the requirements in the feasibility study for the storage of the tailings generated by the mineral processing operation. Proteus Engineers, who are project managing the feasibility study, will integrate the tailings study into the overall feasibility study. The tailings will be generated as three separate streams, with a combined output of approximately 300,000 t of dry solids annually over a four year period.
The study is being undertaken prior to geotechnical and geochemical characterisation of the tailings solids or liquor. The approach to design has, therefore, been to adopt a conventional and well-tried method to tailings storage and management that is in common use within the mining industry of Western Australia. This approach is tolerant of variations in the material characteristics and deposition behaviour of the tailings product.
1.2 Project Location
The Project is located approximately 240 km east north east of Alice Springs in the Northern Territory and is accessed via the Stuart and Plenty Highways going north of Alice Springs. The site is located approximately 23 km to the North of the Plenty Highway from a point approximately 223 km east of the Plenty Highway turn-off from the Stuart Highway. The Plenty Highway is sealed for the initial 94 km from the Stuart Highway turn-off. The regional location of the project site is shown on Figure 1.
1.3 Ownership and Tenements
Two exploration licences, EL22349 and EL24392, cover the project area. These are shown on Figure 2. These exploration leases are held by Sunsphere, a wholey owned subsidiary of Thor. Two mineral lease applications, MLA23825 and MLA24429, cover the area around the Molyhil deposit and have been applied for by Imperial Granite and Minerals Pty Ltd and Tennant Creek Gold Northern Territory Pty Ltd respectively. Sunsphere is the beneficial holder of these mining lease applications. The Molyhil deposit lies on MLA23825 which lies within EL22349.
2.0 TAILINGS STORAGE
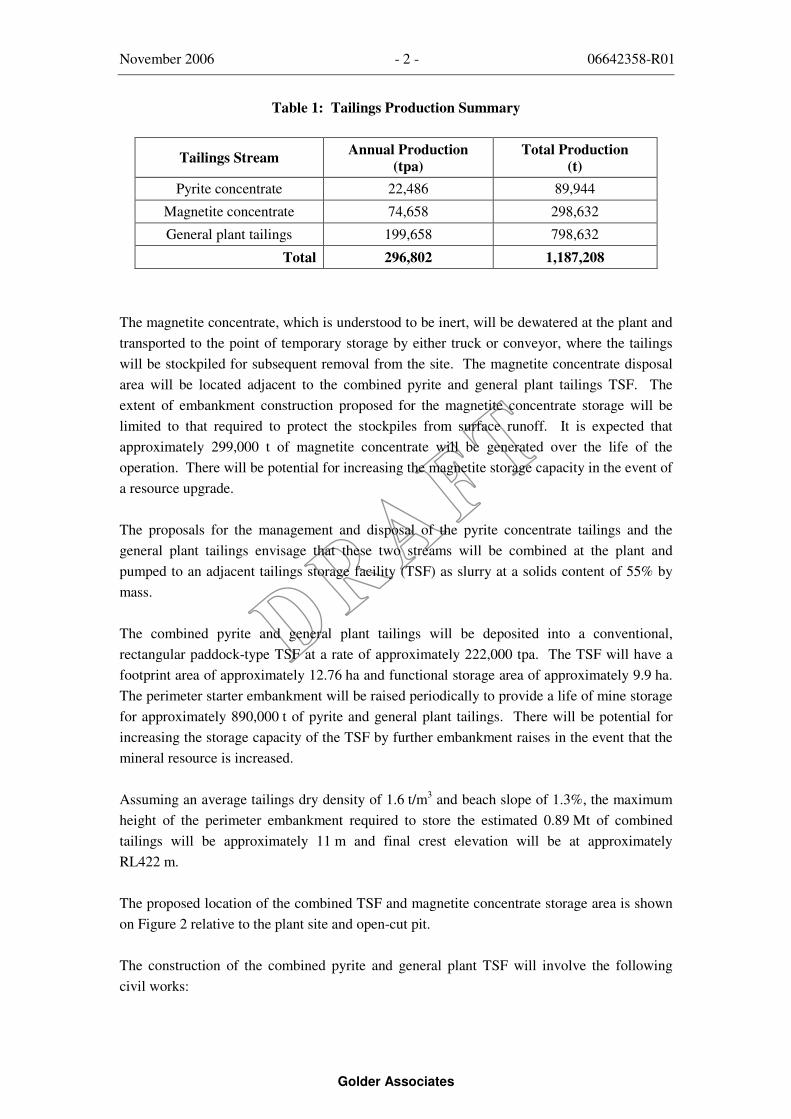
The project is currently expected to generate approximately 1.2 Mt of tailings over a four year period at an annual output of approximately 300,000 t. Tailings will be produced as three separate streams as indicated in Table 1.
November 2006 - 2 - 06642358-R01
Golder Associates
Table 1: Tailings Production Summary
Tailings Stream Annual Production (tpa)
Total Production (t)
Pyrite concentrate 22,486 89,944
Magnetite concentrate 74,658 298,632
General plant tailings 199,658 798,632
Total 296,802 1,187,208
The magnetite concentrate, which is understood to be inert, will be dewatered at the plant and transported to the point of temporary storage by either truck or conveyor, where the tailings will be stockpiled for subsequent removal from the site. The magnetite concentrate disposal area will be located adjacent to the combined pyrite and general plant tailings TSF. The extent of embankment construction proposed for the magnetite concentrate storage will be limited to that required to protect the stockpiles from surface runoff. It is expected that approximately 299,000 t of magnetite concentrate will be generated over the life of the operation. There will be potential for increasing the magnetite storage capacity in the event of a resource upgrade.
The proposals for the management and disposal of the pyrite concentrate tailings and the general plant tailings envisage that these two streams will be combined at the plant and pumped to an adjacent tailings storage facility (TSF) as slurry at a solids content of 55% by mass.
The combined pyrite and general plant tailings will be deposited into a conventional, rectangular paddock-type TSF at a rate of approximately 222,000 tpa. The TSF will have a footprint area of approximately 12.76 ha and functional storage area of approximately 9.9 ha. The perimeter starter embankment will be raised periodically to provide a life of mine storage for approximately 890,000 t of pyrite and general plant tailings. There will be potential for increasing the storage capacity of the TSF by further embankment raises in the event that the mineral resource is increased.
Assuming an average tailings dry density of 1.6 t/m3 and beach slope of 1.3%, the maximum height of the perimeter embankment required to store the estimated 0.89 Mt of combined tailings will be approximately 11 m and final crest elevation will be at approximately RL422 m.
The proposed location of the combined TSF and magnetite concentrate storage area is shown on Figure 2 relative to the plant site and open-cut pit.
The construction of the combined pyrite and general plant TSF will involve the following civil works:
November 2006 - 3 - 06642358-R01
Golder Associates
• clearing of vegetation and stripping of topsoil across the entire footprint area, excavation of cut-off keyway beneath the perimeter embankment;
• construction of the perimeter starter embankment and decant access causeway together with associated ramps, safety bunds and perimeter sediment trenches;
• construction of a centrally located pumped decant tower within the TSF; and
• installation of tailings distribution and return water pipework between the plant and the TSF.
Provision has been made for the installation of a basal geosynthetic liner and an underdrainage collection system in the event that testwork on the tailings solids and tailings liquor indicates that these measures will be required to minimise the potential impacts of seepage. The underdrainage system would outfall to a small external sump located at the western corner of the TSF and seepage water would be pumped over the perimeter embankment and back into the TSF.
It is envisaged that three incremental raises will be constructed to the perimeter embankment and decant causeway, each of 1.5 m nominal height. It is estimated that the final embankment crest elevation will be at approximately RL422 m. Regulatory approval will be sought for the proposed construction of the TSF starter embankment and incremental raises to this design elevation.
The proposed closure design provides for the following:
• shaping the outer slopes to an S-shaped profile and average outer slope of 1V:4H;
• shaping the central area of the TSF to increase the area over which run-off will collect thereby increasing the rate of water loss through evaporation;
• armouring the embankment crest rim with selected waste rock, placement of a nominal 0.5 m waste rock cover over the outer 50 m zone of the tailings beach and a 1 m thick layer over the remaining central area of the TSF beach;
• placing a nominal 300 mm soil layer over the central area of the TSF beach as a store and release cover; and
• spreading a nominal 150 mm layer of topsoil onto the outer embankment slopes to provide a medium for plant growth.
It is anticipated that the decommissioning and closure of the TSF will form part of the general site closure works.
November 2006 - 4 - 06642358-R01
Golder Associates
3.0 TAILINGS CHARACTERISTICS
3.1 Physical Properties
3.1.1 General
A programme of physical testing of the pyrite and general plant tailings is scheduled to be carried out once representative samples of tailings become available for this work. It is anticipated that this testwork will commence by the end of November 2006 with results expected in January 2006. The schedule of testwork will include the following:
• particle size distribution analysis over the range of particle sizes to 2 microns for each individual tailings stream and for the combined stream;
• particle density (SG);
• flask settling tests to provide information on settled density, rate of settlement and liquor release;
• drying tests to simulate drying under natural conditions to provide information on the settled dry density / time / moisture relationship;
• standard compaction tests to evaluate the characteristics of the material as embankment fill;
• direct shear test to provide shear strength parameters for the tailings for input to stability modelling and embankment raise construction; and
• permeameter tests to derive the indicative permeability coefficient of the deposited material as input to the seepage model.
The need to carry out consolidation testing on the tailings will be assessed once the initial results of the testwork programme become available.
In the absence of available tailings characterisation data, the TSF design has adopted realistic and generally conservative parameters for modelling purposes based on experience. The adopted parameters have included the following:
• average beach slope of 1.3% (1 in 75) to account for the comparatively coarse particle size distribution;
• average dry density of 1.6 t/m3 for the deposited tailings;
• tailings frictional angle of 25° for deposited tailings, discounted for the purpose of assessing the stability of the perimeter embankment, and 37° for compacted tailings in the
November 2006 - 5 - 06642358-R01
Golder Associates
embankment. The value of 37° was calculated from the predicted particle size distribution for combined tailings provided by Proteus Engineers, which was based on metallurgical testwork carried out for the project;
• average permeability of the tailings within the range of 10-6 to 10-9 m/s; and
• an assumed average moisture content of the deposited tailings of approximately 30% by mass.
The design has also been based on a starter embankment height that would provide two years of storage at the assumed average dry density and beach slope. This will provide a large margin for error in the assumed values, without necessarily impacting on the operation of the TSF.
The modelling studies will be re-run once laboratory test data becomes available and any necessary adjustments to the design will be carried out prior to final design.
3.1.2 Particle Size Distribution
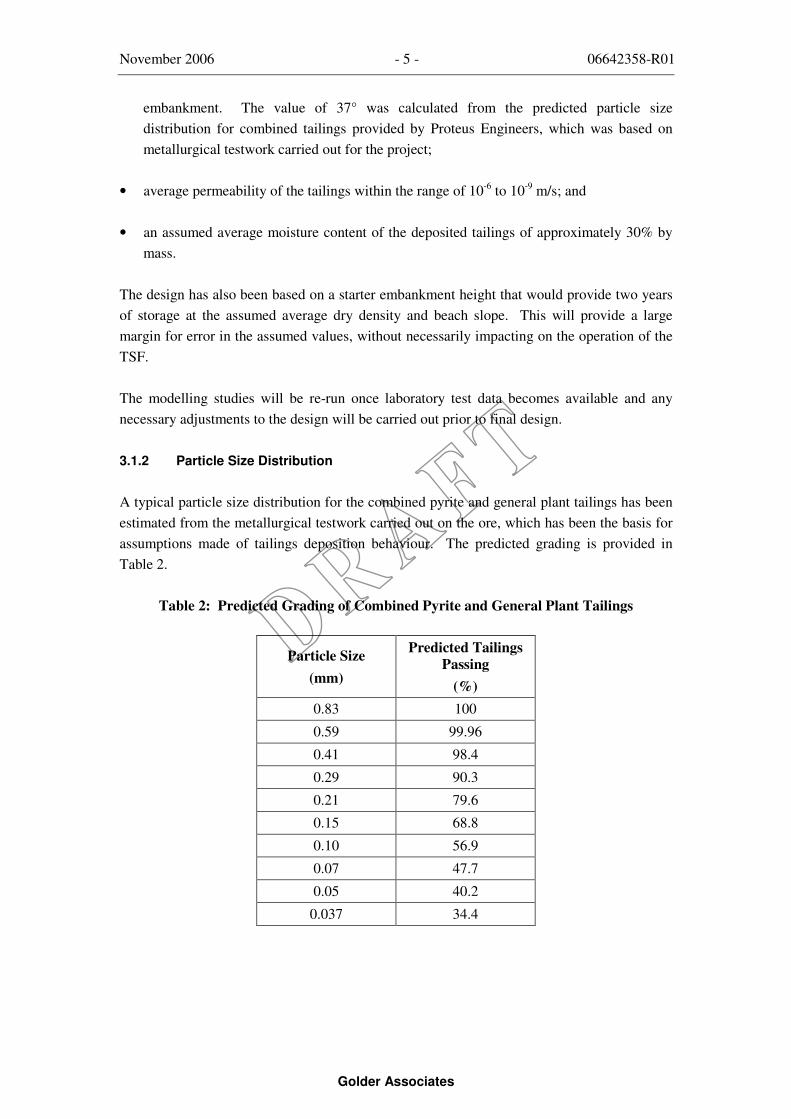
A typical particle size distribution for the combined pyrite and general plant tailings has been estimated from the metallurgical testwork carried out on the ore, which has been the basis for assumptions made of tailings deposition behaviour. The predicted grading is provided in Table 2.
Table 2: Predicted Grading of Combined Pyrite and General Plant Tailings
Particle Size (mm)
Predicted Tailings Passing
(%) 0.83 100
0.59 99.96
0.41 98.4
0.29 90.3
0.21 79.6
0.15 68.8
0.10 56.9
0.07 47.7
0.05 40.2
0.037 34.4
November 2006 - 6 - 06642358-R01
Golder Associates
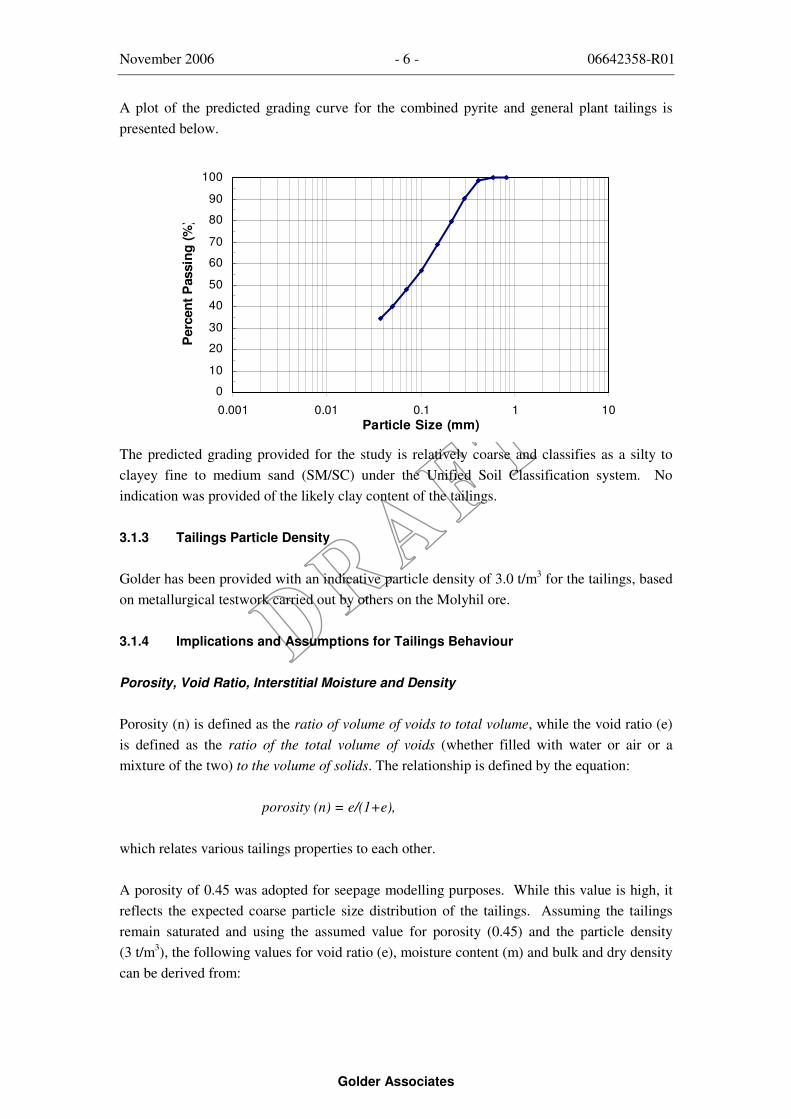
A plot of the predicted grading curve for the combined pyrite and general plant tailings is presented below.
The predicted grading provided for the study is relatively coarse and classifies as a silty to clayey fine to medium sand (SM/SC) under the Unified Soil Classification system. No indication was provided of the likely clay content of the tailings.
3.1.3 Tailings Particle Density
Golder has been provided with an indicative particle density of 3.0 t/m3 for the tailings, based on metallurgical testwork carried out by others on the Molyhil ore.
3.1.4 Implications and Assumptions for Tailings Behaviour
Porosity, Void Ratio, Interstitial Moisture and Density
Porosity (n) is defined as the ratio of volume of voids to total volume, while the void ratio (e) is defined as the ratio of the total volume of voids (whether filled with water or air or a mixture of the two) to the volume of solids. The relationship is defined by the equation:
porosity (n) = e/(1+e),
which relates various tailings properties to each other.
A porosity of 0.45 was adopted for seepage modelling purposes. While this value is high, it reflects the expected coarse particle size distribution of the tailings. Assuming the tailings remain saturated and using the assumed value for porosity (0.45) and the particle density (3 t/m3), the following values for void ratio (e), moisture content (m) and bulk and dry density can be derived from:
0
10
20
30
40
50
60
70
80
90
100
0.001 0.01 0.1 1 10Particle Size (mm)
Per
cent
Pas
sing
(%)
November 2006 - 7 - 06642358-R01
Golder Associates
void ratio (e) = 0.82;
moisture content of tailings (m) = 27.3%;
dry density (γd) = 1.65 t/m3; and
bulk density (γd) =2.1 t/m3.
These values have generally been assumed for modelling purposes, although a value of 1.6 t/m3 has been used for storage capacity estimates as a precaution against variability in the tailings product.
Beaching Characteristics
The relatively coarse particle size distribution for the tailings provided for the study (50% < 75 �m size) and the high particle density (3.0 t/m3) strongly suggest that there will be sorting of coarse material from the finer particles occurring as the deposited tailings flow down the tailings beach, with the coarser particles being deposited close to the perimeter embankment and the settled tailings grading finer towards the decant location. While it is expected that the beach profile will be relatively steep, it is not possible to predict with confidence what the average beach slope would be. However, an assumed average beach slope of 1.3% has been adopted, compared to average beach slopes of around 1% generally obtained on tailings with a P80 of 75 �m and particle density of around 2.7 t/m3.
As a further contingency against steeper beaches, the starter embankment has been designed with a crest elevation at RL417.5 m, which would provide estimated storage capacity for the initial two years of combined tailings output at 222,000 tpa and a minimum remaining freeboard of 300 mm. In the event that beaches are steeper than the 1.3% slope assumed, the starter embankment would still provide in excess of 1-year’s storage capacity. In addition, the development of steep beaches adjacent to the perimeter embankment can be overcome to a large extent by advancing the point of discharge onto the beach.
Shear Strength
An upper limit angle of internal friction for the tailings has been estimated from the particle size distribution provided, using formulae derived by Dhawan with corrections proposed by Brinch Hansen1. The upper limit effective angle of internal friction (φ') obtained by this method was 34.7°. A value of 34° has been assigned as the shear strength of the compacted tailings in the embankment raises. A conservative discounted value of 25° has been used for the for the friction angle of the deposited tailings to emphasise the stability of the perimeter embankment.
1 Abschatzung des Reibungswinkels, by Dhawan with corrections by Brinch Hansem, pp 26 und 27.
November 2006 - 8 - 06642358-R01
Golder Associates
Permeability
Values for the permeability coefficient of the tailings within the range of 10-6 to 10-9 m/s were used in the seepage modelling to determine the upper and lower bounds of seepage that might occur from an unlined pond. It would be expected that a median value within the range adopted for the modelling would be obtained on a sample of tailings tested in the laboratory. However, the particle sorting that could occur on deposition may result in a greater degree of anisotropy in the tailings between vertical and horizontal permeability coefficients.
3.2 Geochemistry of Tailings and Tailings Liquor
While geochemical testwork on the tailings is scheduled to be carried out to assess the acid base characteristics of the tailings and tailings liquor, this work has not yet been undertaken.
It is understood that the general plant tailings is likely to be relatively benign, however, the pyrite tailings will contain sulphides, as the name suggests, and therefore, may be prone to oxidation and acid generation. While there are carbonates present in the ore, it is uncertain to what extent these carbonates will be consumed in the ore processing or what acid neutralisation capacity may remain in the tailings. There is also no indication of what environmentally sensitive analytes may be released into solution and, therefore, the potential impact that seepage may have on the groundwater or local environment.
The design put forward in this feasibility study has attempted to address these issues by making provision for the installation of both a liner system and underdrainage recovery system into the TSF. In the event that geochemical analyses of the tailings indicate that the impacts of seepage may be significant then these systems would be incorporated into the construction of the TSF to attempt to maintain a closed system. Water recovered from the underdrainage will be returned to the TSF for return to the plant water circuit.
4.0 DESIGN CONSIDERATIONS
4.1 Site Characteristics
The proposed site for the combined TSF and the magnetite concentrate stockpile area lies approximately 0.4 km east south east of the existing open-cut pit and approximately 0.2 km to the south south west of the proposed plant site. A small southerly flowing tributary creek lies approximately 30 to 40 m to the west of the proposed western embankment ote of the TSF.
The ground on which the TSF will be located has been heavily grazed and at the time of the field investigations had sparse ground cover with some thin stands of medium shrub and the occasional tree. A few stunted trees grow along the margins of the creek. Within the footprint of the TSF, the ground surface falls gently westwards towards the creek line at a gradient of between 1.1% and 1.3%. This gradient will give rise to a height differential of 3.5 m between the eastern and western TSF perimeter embankment.
November 2006 - 9 - 06642358-R01
Golder Associates
The creek line to the west of the TSF has a well defined channel profile and flows to the south west joining Molyhil Creek approximately 0.5 km to the south west of the TSF.
4.2 Geology
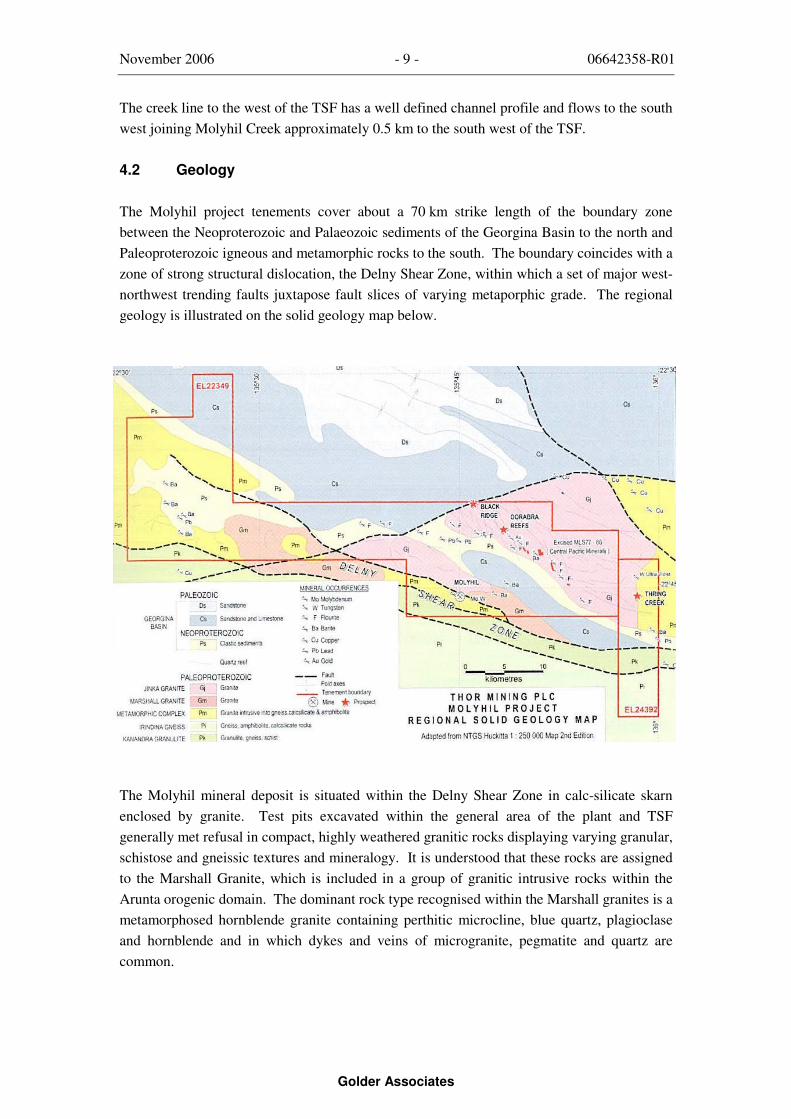
The Molyhil project tenements cover about a 70 km strike length of the boundary zone between the Neoproterozoic and Palaeozoic sediments of the Georgina Basin to the north and Paleoproterozoic igneous and metamorphic rocks to the south. The boundary coincides with a zone of strong structural dislocation, the Delny Shear Zone, within which a set of major west-northwest trending faults juxtapose fault slices of varying metaporphic grade. The regional geology is illustrated on the solid geology map below.
The Molyhil mineral deposit is situated within the Delny Shear Zone in calc-silicate skarn enclosed by granite. Test pits excavated within the general area of the plant and TSF generally met refusal in compact, highly weathered granitic rocks displaying varying granular, schistose and gneissic textures and mineralogy. It is understood that these rocks are assigned to the Marshall Granite, which is included in a group of granitic intrusive rocks within the Arunta orogenic domain. The dominant rock type recognised within the Marshall granites is a metamorphosed hornblende granite containing perthitic microcline, blue quartz, plagioclase and hornblende and in which dykes and veins of microgranite, pegmatite and quartz are common.
November 2006 - 10 - 06642358-R01
Golder Associates
4.3 Soil Profile
The soil profile across the proposed site of the TSF generally extends to depths within the range of 0.25 m to 1.0 m before intersecting decomposed or extremely weathered granitic bedrock and backhoe refusal at depths between 0.65 m and 1.1 m. The average depth of soil profile is approximately 0.65 m thick and comprises an upper zone of red brown fine silty sand grading into a low to medium plasticity clayey sand. Depths of soil cover generally increase towards the location of the creek to the west of the TSF.
4.4 Rainfall and Evaporation
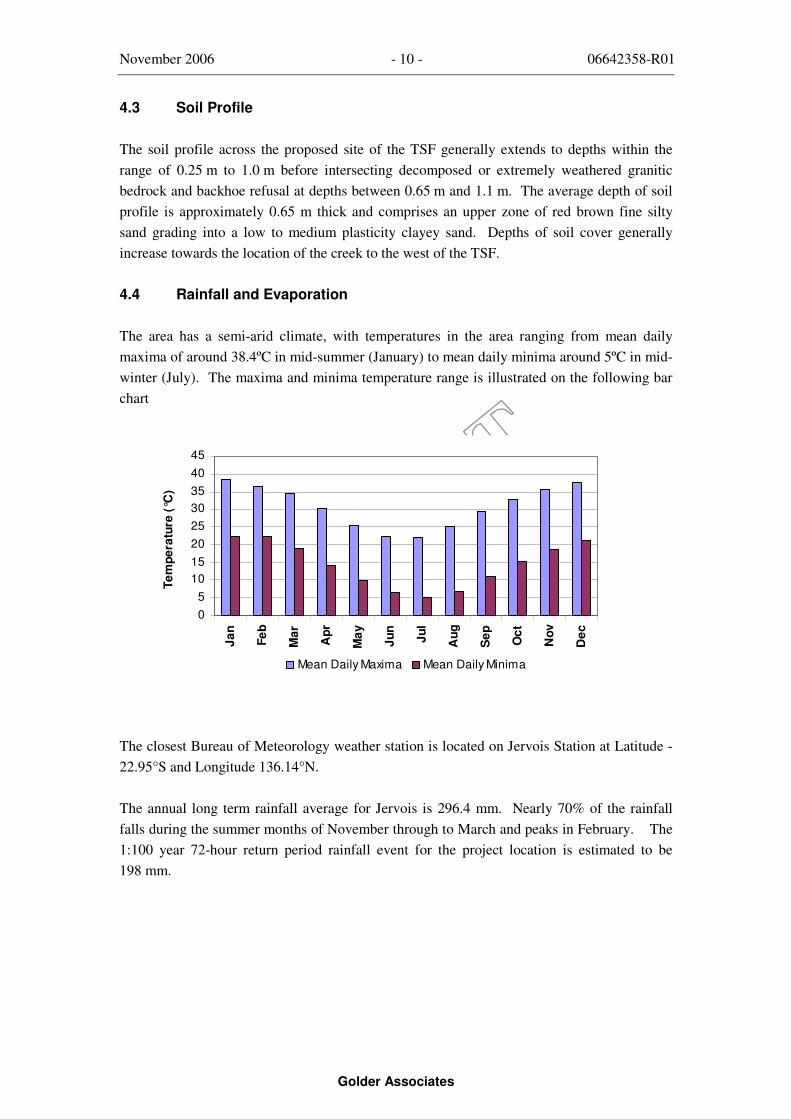
The area has a semi-arid climate, with temperatures in the area ranging from mean daily maxima of around 38.4ºC in mid-summer (January) to mean daily minima around 5ºC in mid-winter (July). The maxima and minima temperature range is illustrated on the following bar chart
The closest Bureau of Meteorology weather station is located on Jervois Station at Latitude -22.95°S and Longitude 136.14°N.
The annual long term rainfall average for Jervois is 296.4 mm. Nearly 70% of the rainfall falls during the summer months of November through to March and peaks in February. The 1:100 year 72-hour return period rainfall event for the project location is estimated to be 198 mm.
05
1015202530354045
Jan
Feb
Mar
Apr
May
Jun
Jul
Aug
Sep Oct
Nov
Dec
Mean Daily Maxima Mean Daily Minima
Tem
pera
ture
(°C
)
November 2006 - 11 - 06642358-R01
Golder Associates
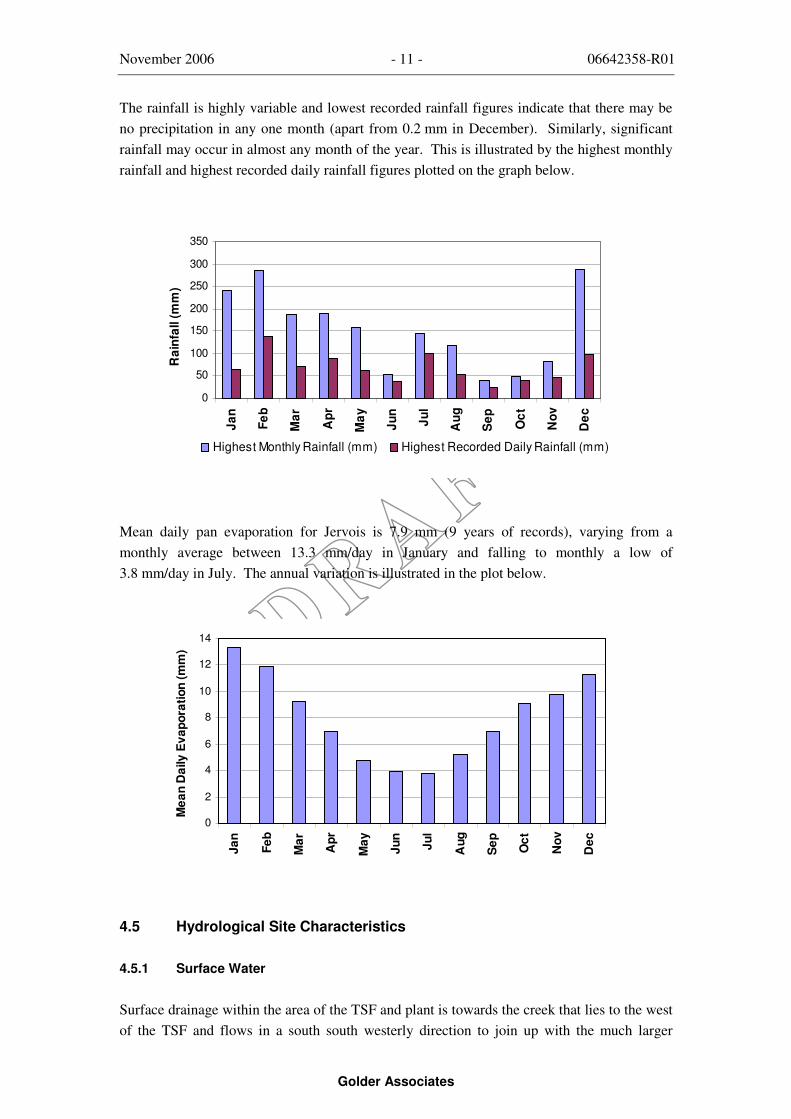
The rainfall is highly variable and lowest recorded rainfall figures indicate that there may be no precipitation in any one month (apart from 0.2 mm in December). Similarly, significant rainfall may occur in almost any month of the year. This is illustrated by the highest monthly rainfall and highest recorded daily rainfall figures plotted on the graph below.
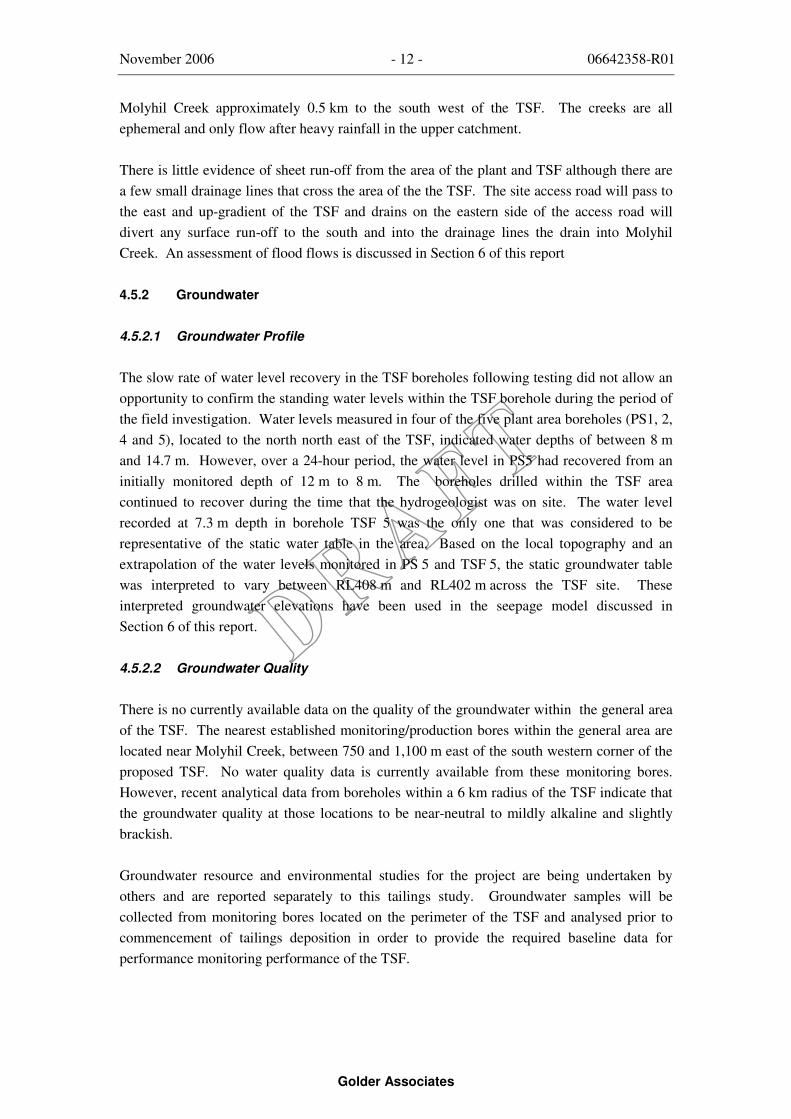
Mean daily pan evaporation for Jervois is 7.9 mm (9 years of records), varying from a monthly average between 13.3 mm/day in January and falling to monthly a low of 3.8 mm/day in July. The annual variation is illustrated in the plot below.
4.5 Hydrological Site Characteristics
4.5.1 Surface Water
Surface drainage within the area of the TSF and plant is towards the creek that lies to the west of the TSF and flows in a south south westerly direction to join up with the much larger
0
50
100
150
200
250
300
350Ja
n
Feb
Mar
Apr
May
Jun
Jul
Aug
Sep Oct
Nov
Dec
Rai
nfal
l (m
m)
Highest Monthly Rainfall (mm) Highest Recorded Daily Rainfall (mm)
0
2
4
6
8
10
12
14
Jan
Feb
Mar
Apr
May
Jun
Jul
Aug
Sep Oct
Nov
Dec
Mea
n D
aily
Eva
pora
tion
(mm
)
November 2006 - 12 - 06642358-R01
Golder Associates
Molyhil Creek approximately 0.5 km to the south west of the TSF. The creeks are all ephemeral and only flow after heavy rainfall in the upper catchment.
There is little evidence of sheet run-off from the area of the plant and TSF although there are a few small drainage lines that cross the area of the the TSF. The site access road will pass to the east and up-gradient of the TSF and drains on the eastern side of the access road will divert any surface run-off to the south and into the drainage lines the drain into Molyhil Creek. An assessment of flood flows is discussed in Section 6 of this report
4.5.2 Groundwater
4.5.2.1 Groundwater Profile
The slow rate of water level recovery in the TSF boreholes following testing did not allow an opportunity to confirm the standing water levels within the TSF borehole during the period of the field investigation. Water levels measured in four of the five plant area boreholes (PS1, 2, 4 and 5), located to the north north east of the TSF, indicated water depths of between 8 m and 14.7 m. However, over a 24-hour period, the water level in PS5 had recovered from an initially monitored depth of 12 m to 8 m. The boreholes drilled within the TSF area continued to recover during the time that the hydrogeologist was on site. The water level recorded at 7.3 m depth in borehole TSF 5 was the only one that was considered to be representative of the static water table in the area. Based on the local topography and an extrapolation of the water levels monitored in PS 5 and TSF 5, the static groundwater table was interpreted to vary between RL408 m and RL402 m across the TSF site. These interpreted groundwater elevations have been used in the seepage model discussed in Section 6 of this report.
4.5.2.2 Groundwater Quality
There is no currently available data on the quality of the groundwater within the general area of the TSF. The nearest established monitoring/production bores within the general area are located near Molyhil Creek, between 750 and 1,100 m east of the south western corner of the proposed TSF. No water quality data is currently available from these monitoring bores. However, recent analytical data from boreholes within a 6 km radius of the TSF indicate that the groundwater quality at those locations to be near-neutral to mildly alkaline and slightly brackish.
Groundwater resource and environmental studies for the project are being undertaken by others and are reported separately to this tailings study. Groundwater samples will be collected from monitoring bores located on the perimeter of the TSF and analysed prior to commencement of tailings deposition in order to provide the required baseline data for performance monitoring performance of the TSF.
November 2006 - 13 - 06642358-R01
Golder Associates
4.6 Geotechnical Site Characteristics
4.6.1 Fieldwork
Geotechnical investigations of the site were carried out preliminary to selecting the location for the TSF and developing and sizing the proposed TSF. The investigations were carried out in two parts. An initial programme of test pitting was undertaken to assess the sub-surface conditions across the area of the proposed plant and TSF sites, along the access route, the airstrip and at the proposed village location. The fieldwork was carried out during the period between 23 and 28 August 2006. Following an assessment of the pitting programme and selecting the sites for the plant and TSF, a drilling programme was undertaken during the period from 25 to 29 September 2006 to assess plant and TSF foundation conditions and to carry out in situ permeability tests in the boreholes drilled within the area of the TSF. The locations of the test pits and drill holes are shown on Figure 3.
This section provides a summary of the relevant information obtained from the recent fieldwork..
4.6.1.1 Test Pits
Fifty test pits were excavated across the proposed area of the plant site and TSF, of which test pits TP27 to TP29 and TP32 to TP50 lie within or immediately adjacent to the proposed TSF.
In general, the profile encountered within the test pits comprised:
• Red brown fine sandy silt to silty sand (ML-SM) giving way to clayey sand (CL). Average depth of the horizon encountered across the site was 0.6 m with a standard deviation of 0.24 m and depth range of 0.2 to 1.2 m; giving way to
• Extremely weathered to highly weathered granitic to gneissic bedrock. Backhoe excavation depth within the bedrock was variable, averaging approximately 0.4 m.
The soil profiles encountered in the test pits were generally consistent. Soils on the eastern side of the TSF, the higher ground, tended to be marginally coarser and were less plastic. The soil profiles also tended to be marginally shallower on the eastern side of the TSF.
Backhoe refusal in the test pits occurred at an average depth of 1.0 m and within a range of 0.45 m to 1.65 m.
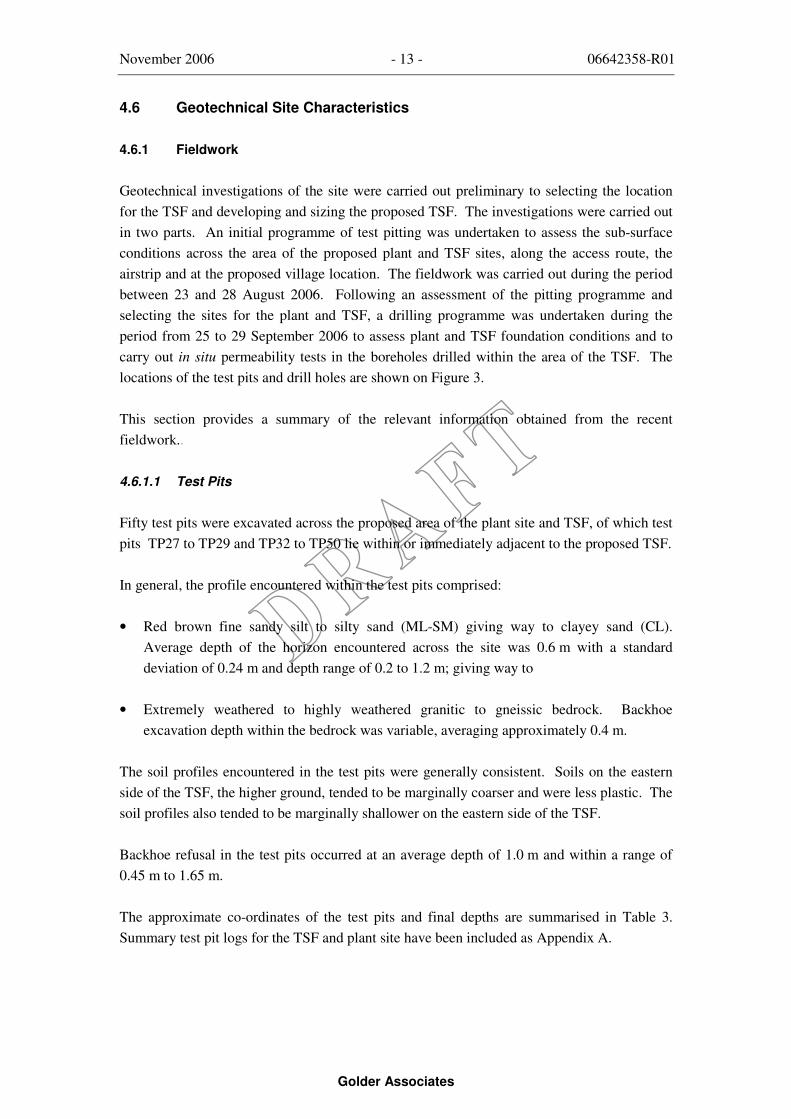
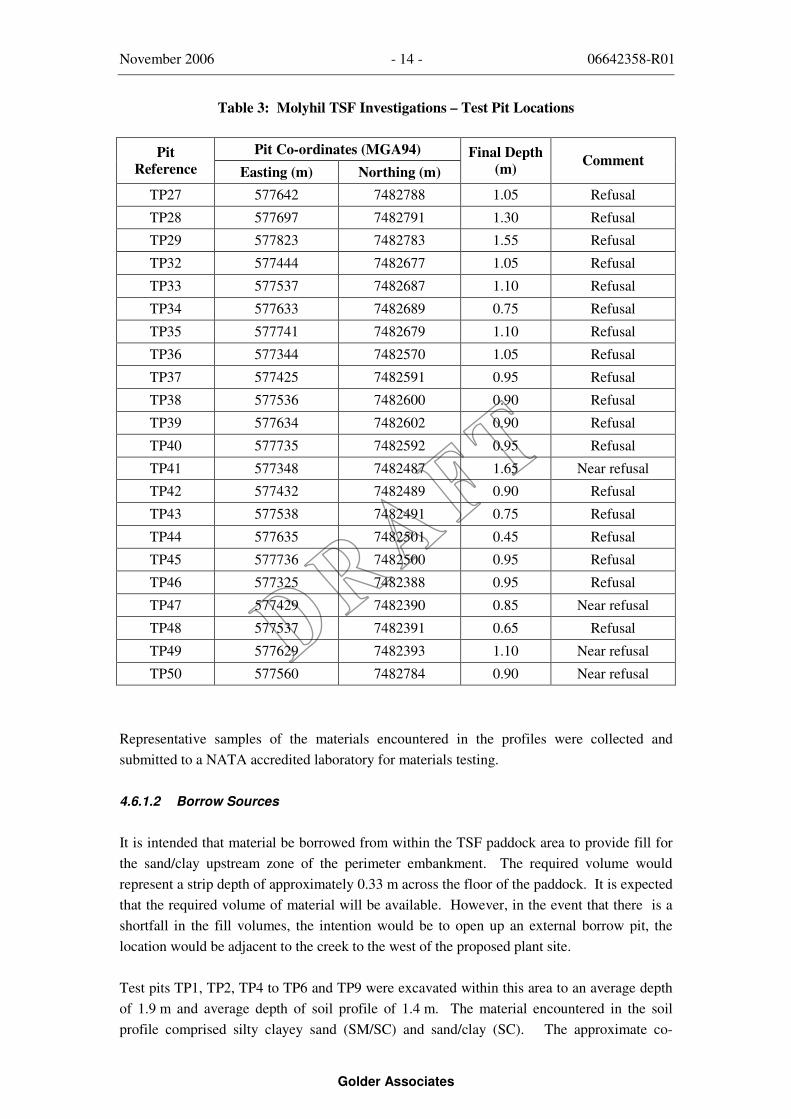
The approximate co-ordinates of the test pits and final depths are summarised in Table 3. Summary test pit logs for the TSF and plant site have been included as Appendix A.
November 2006 - 14 - 06642358-R01
Golder Associates
Table 3: Molyhil TSF Investigations – Test Pit Locations
Pit Co-ordinates (MGA94) Pit Reference Easting (m) Northing (m)
Final Depth (m) Comment
TP27 577642 7482788 1.05 Refusal
TP28 577697 7482791 1.30 Refusal
TP29 577823 7482783 1.55 Refusal
TP32 577444 7482677 1.05 Refusal
TP33 577537 7482687 1.10 Refusal
TP34 577633 7482689 0.75 Refusal
TP35 577741 7482679 1.10 Refusal
TP36 577344 7482570 1.05 Refusal
TP37 577425 7482591 0.95 Refusal
TP38 577536 7482600 0.90 Refusal
TP39 577634 7482602 0.90 Refusal
TP40 577735 7482592 0.95 Refusal
TP41 577348 7482487 1.65 Near refusal
TP42 577432 7482489 0.90 Refusal
TP43 577538 7482491 0.75 Refusal
TP44 577635 7482501 0.45 Refusal
TP45 577736 7482500 0.95 Refusal
TP46 577325 7482388 0.95 Refusal
TP47 577429 7482390 0.85 Near refusal
TP48 577537 7482391 0.65 Refusal
TP49 577629 7482393 1.10 Near refusal
TP50 577560 7482784 0.90 Near refusal
Representative samples of the materials encountered in the profiles were collected and submitted to a NATA accredited laboratory for materials testing.
4.6.1.2 Borrow Sources
It is intended that material be borrowed from within the TSF paddock area to provide fill for the sand/clay upstream zone of the perimeter embankment. The required volume would represent a strip depth of approximately 0.33 m across the floor of the paddock. It is expected that the required volume of material will be available. However, in the event that there is a shortfall in the fill volumes, the intention would be to open up an external borrow pit, the location would be adjacent to the creek to the west of the proposed plant site.
Test pits TP1, TP2, TP4 to TP6 and TP9 were excavated within this area to an average depth of 1.9 m and average depth of soil profile of 1.4 m. The material encountered in the soil profile comprised silty clayey sand (SM/SC) and sand/clay (SC). The approximate co-
November 2006 - 15 - 06642358-R01
Golder Associates
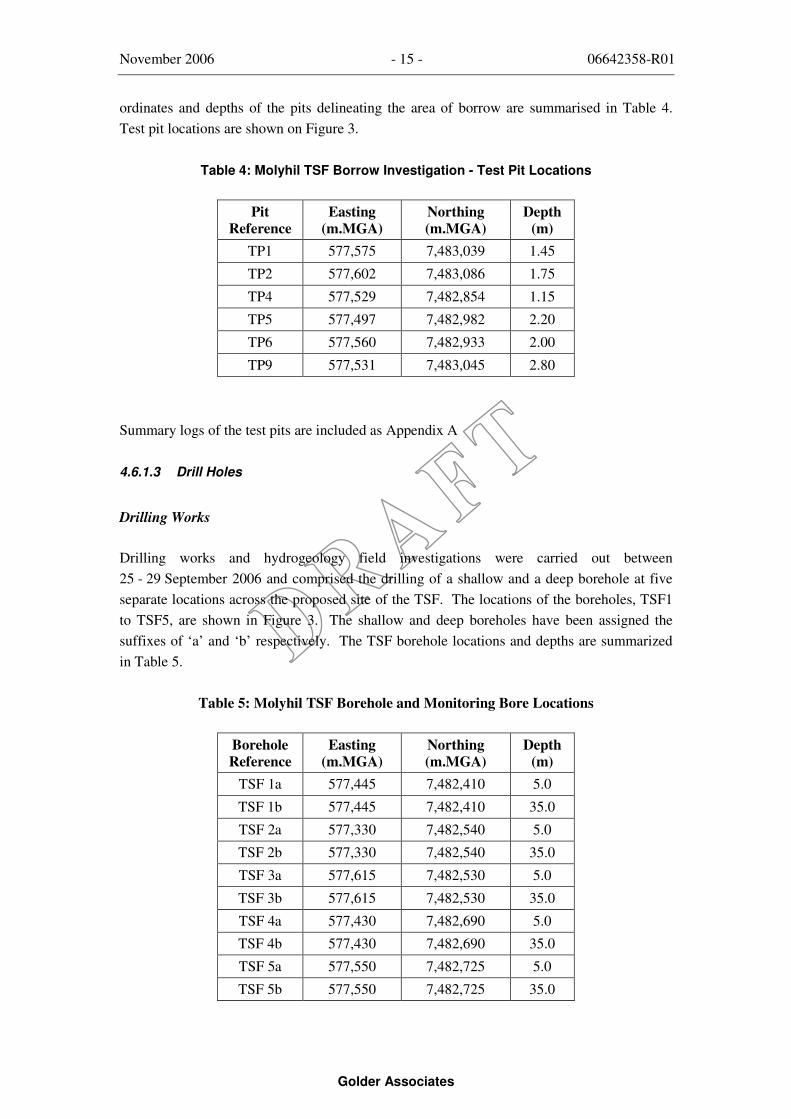
ordinates and depths of the pits delineating the area of borrow are summarised in Table 4. Test pit locations are shown on Figure 3.
Table 4: Molyhil TSF Borrow Investigation - Test Pit Locations
Pit Reference
Easting (m.MGA)
Northing (m.MGA)
Depth (m)
TP1 577,575 7,483,039 1.45
TP2 577,602 7,483,086 1.75
TP4 577,529 7,482,854 1.15
TP5 577,497 7,482,982 2.20
TP6 577,560 7,482,933 2.00
TP9 577,531 7,483,045 2.80
Summary logs of the test pits are included as Appendix A
4.6.1.3 Drill Holes
Drilling Works
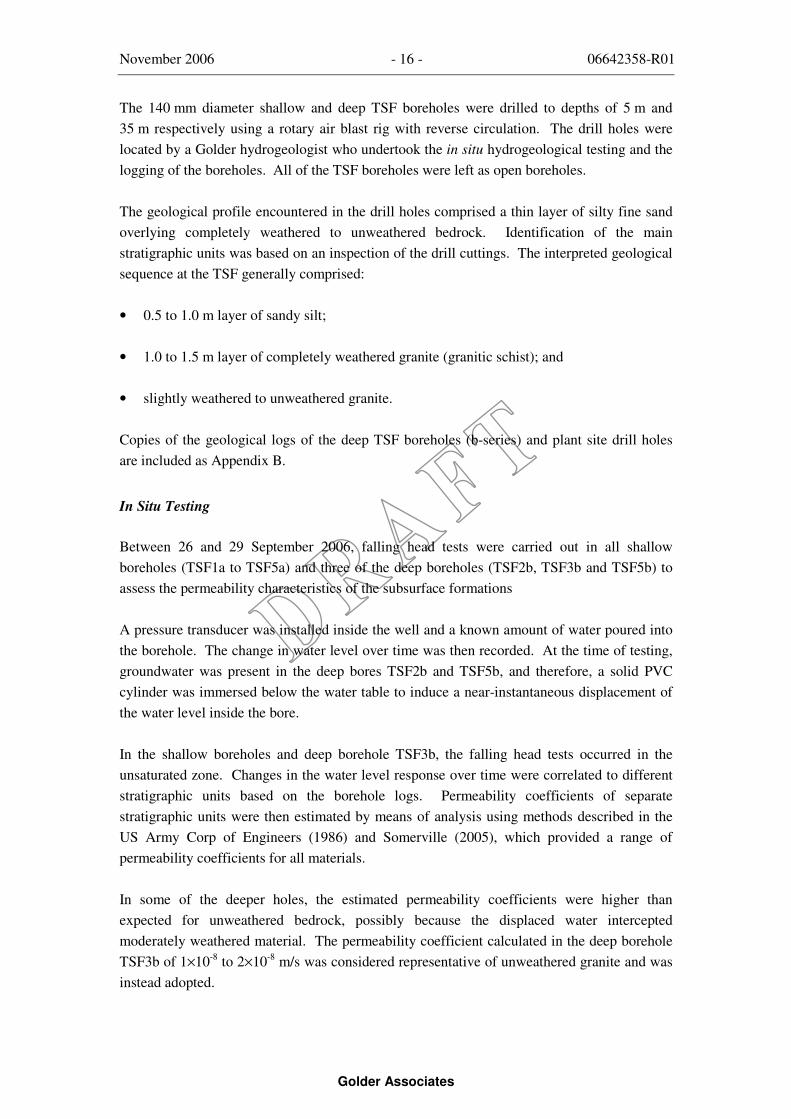
Drilling works and hydrogeology field investigations were carried out between 25 - 29 September 2006 and comprised the drilling of a shallow and a deep borehole at five separate locations across the proposed site of the TSF. The locations of the boreholes, TSF1 to TSF5, are shown in Figure 3. The shallow and deep boreholes have been assigned the suffixes of ‘a’ and ‘b’ respectively. The TSF borehole locations and depths are summarized in Table 5.
Table 5: Molyhil TSF Borehole and Monitoring Bore Locations
Borehole Reference
Easting (m.MGA)
Northing (m.MGA)
Depth (m)
TSF 1a 577,445 7,482,410 5.0
TSF 1b 577,445 7,482,410 35.0
TSF 2a 577,330 7,482,540 5.0
TSF 2b 577,330 7,482,540 35.0
TSF 3a 577,615 7,482,530 5.0
TSF 3b 577,615 7,482,530 35.0
TSF 4a 577,430 7,482,690 5.0
TSF 4b 577,430 7,482,690 35.0
TSF 5a 577,550 7,482,725 5.0
TSF 5b 577,550 7,482,725 35.0
November 2006 - 16 - 06642358-R01
Golder Associates
The 140 mm diameter shallow and deep TSF boreholes were drilled to depths of 5 m and 35 m respectively using a rotary air blast rig with reverse circulation. The drill holes were located by a Golder hydrogeologist who undertook the in situ hydrogeological testing and the logging of the boreholes. All of the TSF boreholes were left as open boreholes.
The geological profile encountered in the drill holes comprised a thin layer of silty fine sand overlying completely weathered to unweathered bedrock. Identification of the main stratigraphic units was based on an inspection of the drill cuttings. The interpreted geological sequence at the TSF generally comprised:
• 0.5 to 1.0 m layer of sandy silt;
• 1.0 to 1.5 m layer of completely weathered granite (granitic schist); and
• slightly weathered to unweathered granite.
Copies of the geological logs of the deep TSF boreholes (b-series) and plant site drill holes are included as Appendix B.
In Situ Testing
Between 26 and 29 September 2006, falling head tests were carried out in all shallow boreholes (TSF1a to TSF5a) and three of the deep boreholes (TSF2b, TSF3b and TSF5b) to assess the permeability characteristics of the subsurface formations
A pressure transducer was installed inside the well and a known amount of water poured into the borehole. The change in water level over time was then recorded. At the time of testing, groundwater was present in the deep bores TSF2b and TSF5b, and therefore, a solid PVC cylinder was immersed below the water table to induce a near-instantaneous displacement of the water level inside the bore.
In the shallow boreholes and deep borehole TSF3b, the falling head tests occurred in the unsaturated zone. Changes in the water level response over time were correlated to different stratigraphic units based on the borehole logs. Permeability coefficients of separate stratigraphic units were then estimated by means of analysis using methods described in the US Army Corp of Engineers (1986) and Somerville (2005), which provided a range of permeability coefficients for all materials.
In some of the deeper holes, the estimated permeability coefficients were higher than expected for unweathered bedrock, possibly because the displaced water intercepted moderately weathered material. The permeability coefficient calculated in the deep borehole TSF3b of 1×10⁻⁸ to 2×10⁻⁸ m/s was considered representative of unweathered granite and was instead adopted.
November 2006 - 17 - 06642358-R01
Golder Associates
The data from the slug tests conducted near the water table in deep borehole TSF5b were analysed using the Aqtesolv software package (Version 2.50.002). The solution methods adopted were Bouwer-Rice and Hvorslev, which are suitable for tests conducted in partially penetrating wells in an unconfined aquifer. A permeability coefficient of 1×10⁻⁸ to 2×10⁻⁸ m/s was calculated for TSF5b, which is similar to that calculated for the deep borehole TSF3b. Data from another deep borehole, TSF2b, could not be analysed because of inadequate water available to fill the holes.
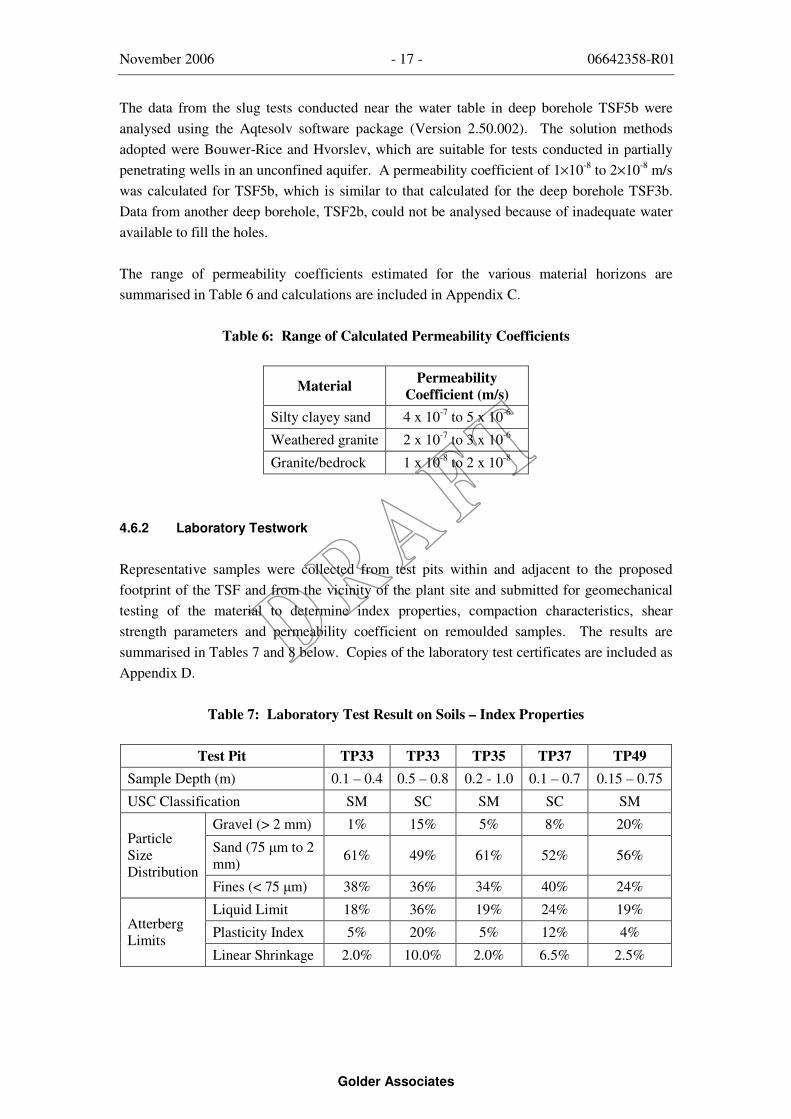
The range of permeability coefficients estimated for the various material horizons are summarised in Table 6 and calculations are included in Appendix C.
Table 6: Range of Calculated Permeability Coefficients
Material Permeability Coefficient (m/s)
Silty clayey sand 4 x 10⁻⁷ to 5 x 10⁻⁶
Weathered granite 2 x 10⁻⁷ to 3 x 10⁻⁶
Granite/bedrock 1 x 10⁻⁸ to 2 x 10⁻⁸
4.6.2 Laboratory Testwork
Representative samples were collected from test pits within and adjacent to the proposed footprint of the TSF and from the vicinity of the plant site and submitted for geomechanical testing of the material to determine index properties, compaction characteristics, shear strength parameters and permeability coefficient on remoulded samples. The results are summarised in Tables 7 and 8 below. Copies of the laboratory test certificates are included as Appendix D.
Table 7: Laboratory Test Result on Soils – Index Properties
Test Pit TP33 TP33 TP35 TP37 TP49 Sample Depth (m) 0.1 – 0.4 0.5 – 0.8 0.2 - 1.0 0.1 – 0.7 0.15 – 0.75
USC Classification SM SC SM SC SM
Gravel (> 2 mm) 1% 15% 5% 8% 20%
Sand (75 �m to 2 mm) 61% 49% 61% 52% 56%
Particle Size Distribution
Fines (< 75 �m) 38% 36% 34% 40% 24%
Liquid Limit 18% 36% 19% 24% 19%
Plasticity Index 5% 20% 5% 12% 4% Atterberg Limits
Linear Shrinkage 2.0% 10.0% 2.0% 6.5% 2.5%
November 2006 - 18 - 06642358-R01
Golder Associates
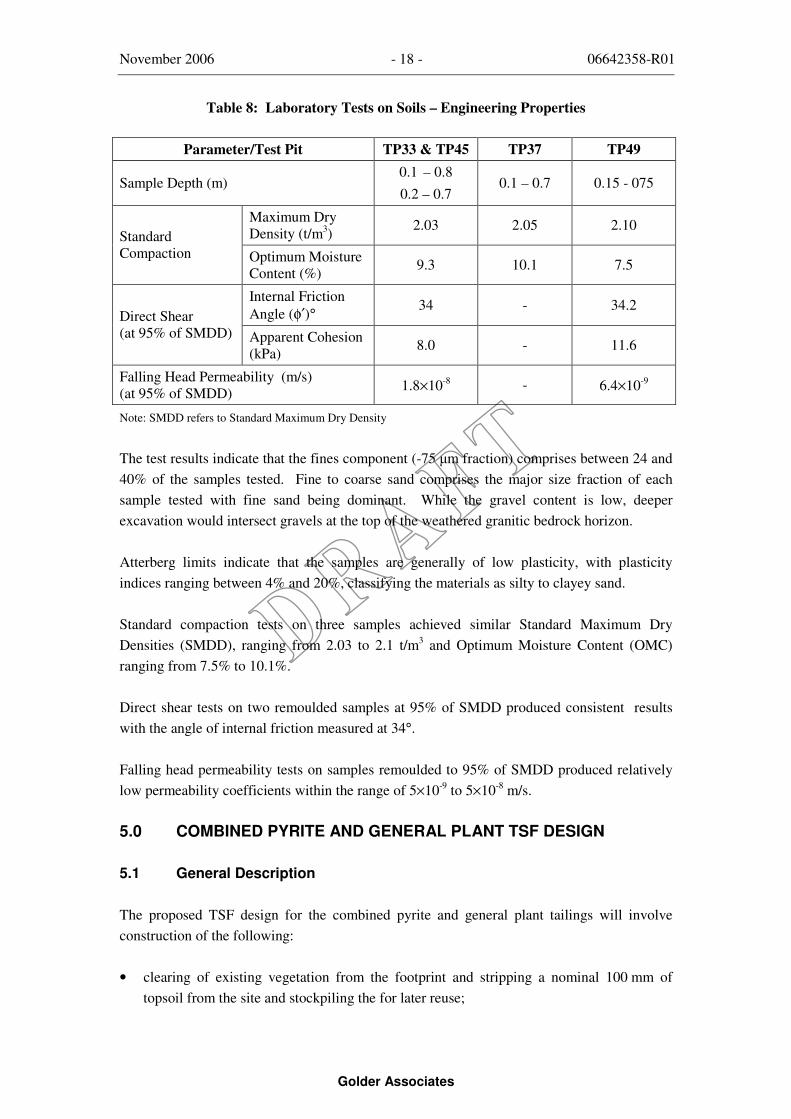
Table 8: Laboratory Tests on Soils – Engineering Properties
Parameter/Test Pit TP33 & TP45 TP37 TP49
Sample Depth (m) 0.1 – 0.8 0.2 – 0.7
0.1 – 0.7 0.15 - 075
Maximum Dry Density (t/m3) 2.03 2.05 2.10
Standard Compaction Optimum Moisture
Content (%) 9.3 10.1 7.5
Internal Friction Angle (φ′)°
34 - 34.2 Direct Shear (at 95% of SMDD) Apparent Cohesion
(kPa) 8.0 - 11.6
Falling Head Permeability (m/s) (at 95% of SMDD) 1.8×10⁻⁸ - 6.4×10⁻⁹
Note: SMDD refers to Standard Maximum Dry Density
The test results indicate that the fines component (-75 �m fraction) comprises between 24 and 40% of the samples tested. Fine to coarse sand comprises the major size fraction of each sample tested with fine sand being dominant. While the gravel content is low, deeper excavation would intersect gravels at the top of the weathered granitic bedrock horizon.
Atterberg limits indicate that the samples are generally of low plasticity, with plasticity indices ranging between 4% and 20%, classifying the materials as silty to clayey sand.
Standard compaction tests on three samples achieved similar Standard Maximum Dry Densities (SMDD), ranging from 2.03 to 2.1 t/m3 and Optimum Moisture Content (OMC) ranging from 7.5% to 10.1%.
Direct shear tests on two remoulded samples at 95% of SMDD produced consistent results with the angle of internal friction measured at 34°.
Falling head permeability tests on samples remoulded to 95% of SMDD produced relatively low permeability coefficients within the range of 5×10⁻⁹ to 5×10⁻⁸ m/s.
5.0 COMBINED PYRITE AND GENERAL PLANT TSF DESIGN
5.1 General Description
The proposed TSF design for the combined pyrite and general plant tailings will involve construction of the following:
• clearing of existing vegetation from the footprint and stripping a nominal 100 mm of topsoil from the site and stockpiling the for later reuse;

November 2006 - 19 - 06642358-R01
Golder Associates
• excavating a keyway beneath the upstream zone of the perimeter embankment and backfilling with selected sand/clay material to form a low permeability barrier to seepage;
• constructing a starter perimeter embankment to RL417.5 m comprising an outer zone of waste rock and inner zone of selected sand/clay material;
• constructing a new decant tower in the centre of the storage cell and a decant access causeway from the perimeter embankment to the central decant tower;
• excavating a sediment catch trench around the outer toe of the perimeter embankment to arrest sediment wash off from the slopes; and
• installation of tailings delivery and distribution pipework at the upstream crest of the perimeter embankment, with spigot off-takes at intervals along the distribution pipework.
Provision has been made in the design for the installation of a liner and underdrainage system if geochemical testing of the tailings and tailings liquor indicate that the installation would be required.
During the life of the operation, the perimeter embankment, decant tower and decant causeway will need to be raised in increments to an estimated final elevation at RL422 m, equivalent to three raises each of 1.5 m height.
The design includes proposals for closure of the TSF at the end of the operating life of the project
5.2 Starter Cell Design Details
5.2.1 Starter Embankment Design
The design of the TSF starter embankment is based on an initial tailings storage area of 9.8 ha (328 m × 298 m at embankment crest). Storage capacity estimates have been based on an assumed beach slope of 1.3% (1V:75H), an average tailings dry density of 1.6 t/m3 and a combined pyrite and general plant tailings output of 222,144 tpa. Stage capacity curves, of crest elevation versus storage capacity (Mt) and Elevation versus Storage Volume (m3) are included as Figure 4. A general layout of the TSF is provided on Figure 5, with typical sections and details shown on Figure 6.
Based on the storage capacity estimates, the design has adopted a TSF starter embankment crest elevation at RL417.5 m, requiring the construction of embankments to heights varying from a minimum of approximately 1.5 m at the north eastern corner to a maximum height of approximately 6.2 m at the south western corner of the TSF.
The perimeter embankment design provides for internal batter slopes of 1V:2H, external batter slopes of 1V:3H and a nominal crest width of 10 m, comprising a 6 m width of waste
November 2006 - 20 - 06642358-R01
Golder Associates
rock and 4 m width of sand/clay. The design includes an access causeway that extends from the centre of the eastern embankment to the central decant tower. The causeway will have batter slopes of 1V:1.5H and a crest width of 6 m.
The perimeter embankment will comprise a substantial outer zone of waste rock with a crest width of 6 m. A 4 m wide upstream zone will be constructed against the upstream batter of the waste rock zone and will consist of sand/clay, sourced from within the TSF and supplemented, if necessary, from an identified source of sand/clay fill located adjacent to the creek line to the west of the proposed plant site.
Safety windrows will be constructed on the outer crest margin of the perimeter embankment and on both crest margins of the decant access causeway. The latter will have breaks in the safety windrow to allow incidental rainwater to drain off the embankment crest into the TSF. Perimeter embankment crests will have a nominal cross-fall towards the interior of the TSF so that rain water drains into the TSF. The crest of the upstream sand/clay zone will be surfaced with a nominal 100 mm thick layer of compacted granular sheeting material to provide a running surface for service vehicles accessing the embankment rest.
Access to the TSF embankment crest will be provided by a ramp that accesses the crest of the eastern embankment from the northern side of the storage. The ramp will also provide run-off protection for the magnetite concentrate stockpiles that will be located adjacent to the northern embankment of the TSF.
5.2.2 Foundation Preparation
The footprint of the TSF will be cleared of vegetation. A nominal 100 mm depth of topsoil will be stripped from the footprint of the TSF and placed into stockpiles for later re-use in rehabilitation works. A nominal 3.5 m wide keyway will be excavated into the underlying weathered granitic bedrock. Material from keyway excavation will be placed into the outer embankment zone, conditioned and compacted. The keyway excavation will be such that clayey fill can be placed, conditioned and rolled into the keyway to form a tight bond with the underlying bedrock horizon. The keyway excavation will then be backfilled in 250 mm layers with selected sand/clay, with each layer moisture conditioned and compacted to the required compaction density.
A sediment collection trench, nominally 300 mm deep, will be excavated around the outer toe of the perimeter embankment to contain any .aterial washed off the outer embankment slope. After allowing the water to pass through a sump to settle out most of the suspended solids, the water will be released into natural flow paths to the south and west of the TSF.
5.2.3 Decant System
A pumped decant tower will be constructed at the centre of the TSF and will comprise a reinforced concrete base cast onto the underlying bedrock and a superimposed tower constructed of slotted reinforced concrete sections. The tower will be surrounded by an
November 2006 - 21 - 06642358-R01
Golder Associates
annulus of selected coarse and competent watse rock to retard the inflow of tailings fines into the tower. The tower will be equipped with a submersible pump, power, lighting and essential safety equipment including safety grill to the tower and buoyancy aid. A return water pipeline will be laid from the return water pump to the plant process water pond. A typical cross-section of the proposed decant tower is shown on Figure 6.
The design has made provision for excavation of a decant entry trench to facilitate early recovery of water at the decant.
In the event that a synthetic liner system and underdrainage system need to be incorporated into the TSF, it may be appropriate to revert to a floating decant to avoid the difficulties inherent in constructing over liner systems without compromising the system integrity.
5.2.4 Tailings Delivery and Distribution System
The tailings delivery pipeline from the plant will access the embankment crest via the ramp at the north eastern corner of the cell. A valve station at the north eastern corner will direct the tailings slurry into either of two distribution pipelines each of which will encompass half the perimeter of the TSF and be located at the upstream crest margin. The envisaged layout is shown on Figure 7. The distribution pipelines will have isolation valves at the northern and southern corners of the TSF to allow flexibility in managing tailings deposition during those periods when embankments are being raised.
The design provides for spigot off-takes in the distribution pipeline at nominal 25 m intervals. Each spigot off-take would be equipped with a valve and section of hose, which would discharge into the slotted uPVC conductor pipes that would be fitted to the starter embankments to minimise batter erosion. In the event that a synthetic liner is installed in the TSF, the conductor pipes would not be required, although it would be necessary to protect the underdrainage recovery system against erosion.
5.2.5 Internal Seepage Interception System (Provisional)
In the absence of detailed geochemical data on the tailings soldis and liquor, it has been considered prudent to include provision for the installation of a liner system and underdrainage recovery system. The provisional design allows for the placement of an initial 300 mm layer of sand/clay as a bedding layer for the synthetic liner, installation of a 1.5 mm HDPE liner over the base and on upstream batter of the perimeter embankment, which would be anchored at the embankment crest, and a conventional underdrainage recovery system on the liner consisting of sleaved draincoil buried in a graded filter sand. Water collected in the underdrainage system would be discharged to a small sump located at the south western corner of the TSF from where the water would be pumped back into the TSF.
A schematical layout of the underdrainage pipework is shown on Figure 8.
November 2006 - 22 - 06642358-R01
Golder Associates
5.3 Future Upstream Embankment Raise Construction
The design provides for the construction of three upstream raises to the perimeter embankments, each of 1.5 m height. The foundation footprint of each raise will be stepped inwards, extending onto the tailings beach. The upstream raise will consist of an upstream embankment zone constructed of tailings with a substantial outer zone of selected inert mine waste rock to stabilise the outer slope face and provide protection against erosion. Depending on the acid forming potential of the tailings, it may be necessary to face the outer batter of the upstream tailings zone with a fine grained inert clayey fill before placement of the waste rock.
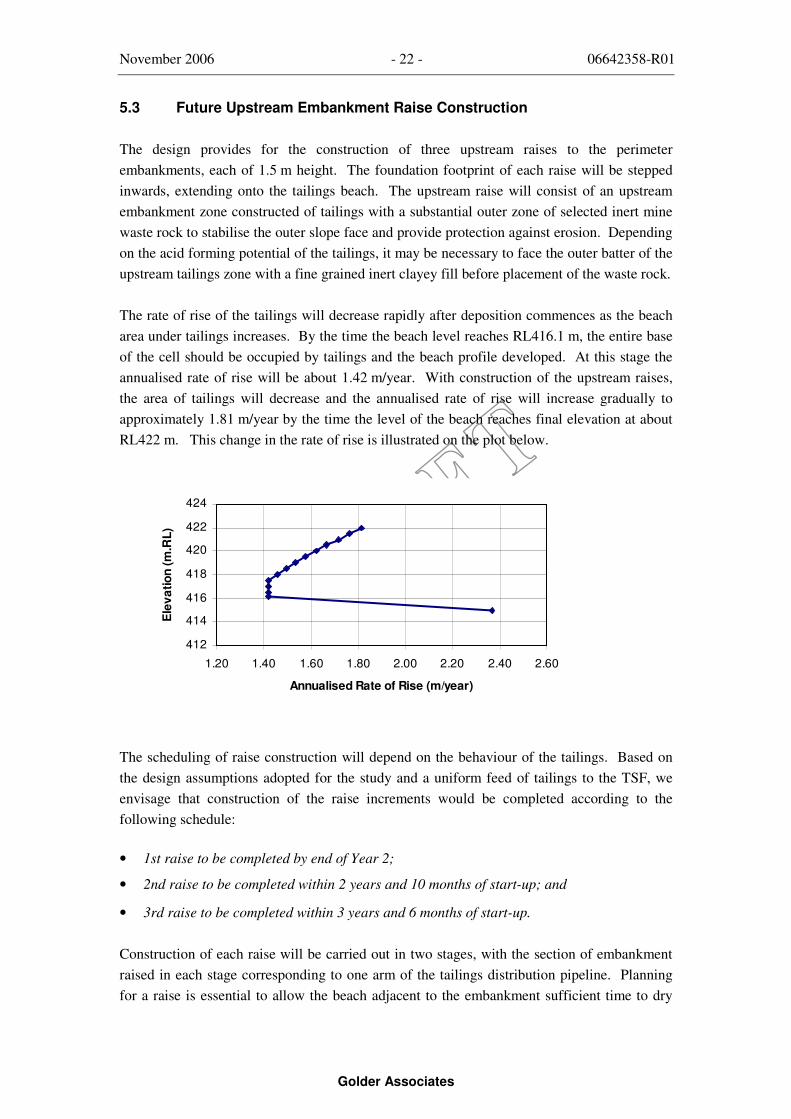
The rate of rise of the tailings will decrease rapidly after deposition commences as the beach area under tailings increases. By the time the beach level reaches RL416.1 m, the entire base of the cell should be occupied by tailings and the beach profile developed. At this stage the annualised rate of rise will be about 1.42 m/year. With construction of the upstream raises, the area of tailings will decrease and the annualised rate of rise will increase gradually to approximately 1.81 m/year by the time the level of the beach reaches final elevation at about RL422 m. This change in the rate of rise is illustrated on the plot below.
The scheduling of raise construction will depend on the behaviour of the tailings. Based on the design assumptions adopted for the study and a uniform feed of tailings to the TSF, we envisage that construction of the raise increments would be completed according to the following schedule:
• 1st raise to be completed by end of Year 2;
• 2nd raise to be completed within 2 years and 10 months of start-up; and
• 3rd raise to be completed within 3 years and 6 months of start-up.
Construction of each raise will be carried out in two stages, with the section of embankment raised in each stage corresponding to one arm of the tailings distribution pipeline. Planning for a raise is essential to allow the beach adjacent to the embankment sufficient time to dry
412
414
416
418
420
422
424
1.20 1.40 1.60 1.80 2.00 2.20 2.40 2.60
Annualised Rate of Rise (m/year)
Ele
vatio
n (m
.RL)

November 2006 - 23 - 06642358-R01
Golder Associates
and consolidate so that the beach will support the raise construction and provide a source of fill for the upstream embankment zone.
5.4 Construction Considerations
Prior to commencing clearing and stripping, all drill holes within the footprint of the proposed TSF will be backfilled and sealed to close off the potential hydraulic conductivity between the geological units in the sub-surface profile.
The upstream sand/clay zone of the starter embankment and upstream tailings zone of the embankment raises will be placed in 250 to 300 mm loose layer thickness. The fill will generally be conditioned to within 2% of the Optimum Moisture Content obtained from the Standard Compaction test and will be compacted to a minimum density of 95% relative to the Standard Maximum Dry Density.
Waste rock placed into the outer zone of the starter embankment will be placed in lifts of approximately 600 mm nominal thickness and will be wheel compacted. Oversize boulders that cannot be incorporated into the fill in a stable configuration will be removed from the placed fill.
Material testing of the placed fine grained fill will be carried out in accordance with Australian Standards AS 1285.
5.5 Environmental Design Considerations
The following environmental considerations have been taken into account in the proposed design of the TSF:
• Vegetation will be stripped from the proposed combined TSF and magnetite concentrate footprint area and topsoil will be stripped and placed into stockpiles beyond the outer embankment toe for later re-use.
• A keyway will be excavated down into the compact weathered bedrock zone beneath the perimeter embankment of the TSF and will be backfilled with compacted low permeability material to reduce the potential for seepage movement at the base of the embankment.
• The TSF design includes provision for the installation of a synthetic liner system and underdrainage system in the event that geochemical analyses of the tailings and tailings water determine that the inclusion of these items will be necessary to limit significant environmental impact;
• The outer batters of the starter embankments will be constructed at a maximum slope of 1V:3H to RL417.5 m to provide a stable embankment configuration and will be profiled to an average slope of 1V:4H on decommissioning of the TSF.

November 2006 - 24 - 06642358-R01
Golder Associates
• A sediment collection trench will be excavated at the toe to retain material washed off the outer embankment slopes.
• Monitoring bores will be installed at strategic locations beyond the perimeter of the TSF to enable monitoring of the water quality and groundwater levels.
5.6 Decommissioning and Rehabilitation
The decommissioning proposals that have been costed into the feasibility study include the following:
• shaping the outer embankment slopes to form a shallow “S” profile, ploughing across the face at a shallow gradient towards controlled run-off locations where rock armoured run-off channels will be formed to receive the accumulated run-off from the slopes.
• constructing a rim of competent rock around the perimeter of the TSF crest to act as a run-off energy dissipater and to control erosion at the rim;
• shaping the central area of the TSF to maximise the area of rainwater ponding and thereby increasing the rate of water loss through evaporation;
• placing a nominal 0.5 m thick waste rock cover on the steeper section of the beach, nominally a 50 m wide zone adjacent to the perimeter embankment to contain dust;
• placing a nominal 1 m thick waste rock cover over the remaining area of beach to act as a capillary break and a further 300 mm of soil cover over this zone to serve as a store release cover; and
• spreading and working topsoil into the waste rock on the outer embankment slope to provide a medium for plant growth.
A conceptual layout of the decommissioned TSF is shown on Figure 10.
6.0 DESIGN ANALYSES
6.1 Geotechnical Stability Evaluation
6.1.1 General Approach
The geometry adopted for the modelling of the TSF stability is based on the current design proposals and models the stability at the expected maximum height of the perimeter embankment. The engineering strength parameters adopted for the in situ foundation materials and the natural borrow materials are based on the results of recent field studies and laboratory testwork. The shear strength parameters adopted for the tailings are realistic
November 2006 - 25 - 06642358-R01
Golder Associates
parameters based on experience and on a broad assessment of testwork carried out on tailings generated from a variety of ore types under varying conditions of weathering.
The evaluation of embankment stability uses the commercially available software code, SLIDE, which adopts a limit equilibrium approach to stability analyses.
The following minimum factors of safety (FoS), which are based on the requirements set down by ANCOLD (ANCOLD, 1999), have been adopted for this study:
• Steady state static loading conditions (no seismic), FoS = 1.5.
• Operating Base Earthquake (OBE) under pseudo-static conditions, FoS = 1.1.
These minimum values are consistent with other published values for earth dams.
In accordance with ANCOLD (1999) the OBE for the TSF, which is conservatively categorised as a “significant hazard” facility, should have an annual exceedance probability (AEP) of at least 1:100. No specific site data exists and therefore the Earthquake Hazard Map of Northern Territory, as presented in AS 1170.4-1993 has been referenced. This indicates that an acceleration coefficient of 0.08g would represent a 10% chance of exceedance in 50 years. Our experience with seismic data from elsewhere in the WA Goldfields suggests that the 1:100 AEP is unlikely to differ significantly from the acceleration coefficients presented in AS 1170 for a 10% chance of exceedance in 50 years, approximately equivalent to an Annual Exceedance Probability (AEP) of 1:475. Therefore, the OBE coefficient selected for pseudo-static analysis of the TSF is 0.08.
In accordance with ANCOLD (1999), it is also necessary to consider the effect of the appropriate Maximum Design Earthquake (MDE). While it is acceptable that the embankment may be badly damaged under the MDE event, the integrity of the facility should be maintained and neither tailings nor tailings liquor should spill. According to ANCOLD (1999) it is appropriate to use a MDE equivalent to about 50% of the Maximum Credible Earthquake (MCE)2. Where inadequate data is available from which to estimate the seismic coefficient for the MCE event, the coefficient is typically assumed to be 2.5 times the seismic coefficient used for the OBE event. Therefore a coefficient of 0.1g (0.08 × 2.5 × 0.5=0.1) has been selected for pseudo-static analysis under MDE loading.
6.1.2 Modelled Sections
The proposed cross-sectional geometry of the TSF perimeter embankment is uniform along its length and, therefore, a single cross-section of the geometry at maximum embankment height was considered to be representative of the TSF as a whole and analyses have therefore been confined to the single cross-section, which is located on Figure 11. The model geometry corresponds to the TSF design proposals. Analyses were carried out for significant circular
2 The MCE is defined as the hypothetical earthquake that could be expected from the regional and local
potential sources of seismic events that would produce the severest vibratory ground motion.
November 2006 - 26 - 06642358-R01
Golder Associates
failure surfaces and minor superficial slips were ignored. The model geometry and critical failure surfaces are illustrated on Figure 12.
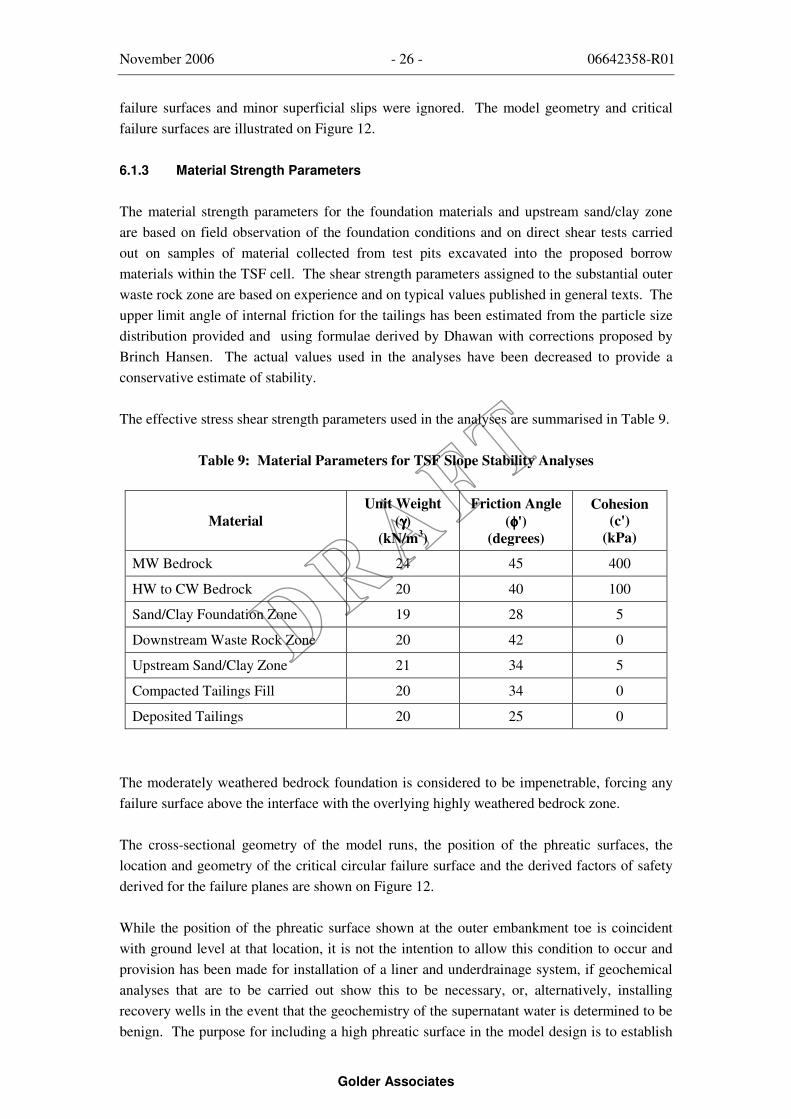
6.1.3 Material Strength Parameters
The material strength parameters for the foundation materials and upstream sand/clay zone are based on field observation of the foundation conditions and on direct shear tests carried out on samples of material collected from test pits excavated into the proposed borrow materials within the TSF cell. The shear strength parameters assigned to the substantial outer waste rock zone are based on experience and on typical values published in general texts. The upper limit angle of internal friction for the tailings has been estimated from the particle size distribution provided and using formulae derived by Dhawan with corrections proposed by Brinch Hansen. The actual values used in the analyses have been decreased to provide a conservative estimate of stability.
The effective stress shear strength parameters used in the analyses are summarised in Table 9.
Table 9: Material Parameters for TSF Slope Stability Analyses
Material Unit Weight
(γγγγ) (kN/m3)
Friction Angle (φφφφ')
(degrees)
Cohesion (c')
(kPa)
MW Bedrock 24 45 400
HW to CW Bedrock 20 40 100
Sand/Clay Foundation Zone 19 28 5
Downstream Waste Rock Zone 20 42 0
Upstream Sand/Clay Zone 21 34 5
Compacted Tailings Fill 20 34 0
Deposited Tailings 20 25 0
The moderately weathered bedrock foundation is considered to be impenetrable, forcing any failure surface above the interface with the overlying highly weathered bedrock zone.
The cross-sectional geometry of the model runs, the position of the phreatic surfaces, the location and geometry of the critical circular failure surface and the derived factors of safety derived for the failure planes are shown on Figure 12.
While the position of the phreatic surface shown at the outer embankment toe is coincident with ground level at that location, it is not the intention to allow this condition to occur and provision has been made for installation of a liner and underdrainage system, if geochemical analyses that are to be carried out show this to be necessary, or, alternatively, installing recovery wells in the event that the geochemistry of the supernatant water is determined to be benign. The purpose for including a high phreatic surface in the model design is to establish
November 2006 - 27 - 06642358-R01
Golder Associates
whether such a condition would have a relevant impact on the overall stability of the embankment. The model results indicate that such a condition would have little material impact on overall stability
6.1.4 Results of the Stability Modelling
Model runs were carried out to check the stability of the typical embankment cross-section under both static and MCE (0.1g) loading conditions. The factors of safety for the static and MCE conditions are 2.5 and 1.8 respectively (refer Figure 12). These factors of safety derived from the modelling runs exceed the minimum design criteria, established through reference to ANCOLD (1999), by a substantial margin. The results indicate that deep seated failure is unlikely to occur within the proposed TSF perimeter embankment at maximum elevation, due in large measure to the 1V:3H outer batter slope and substantial outer waste rock embankment zone. A high phreatic surface has little significant impact on the overall stability of the embankment.
6.2 Seepage Analysis
6.2.1 Objectives
The objectives of the seepage analysis for the proposed Molyhil TSF are to:
• estimate the rise of groundwater level around the facility;
• estimate the position of the phreatic surface in the proposed TSF; and
• estimate seepage rates from the proposed facility.
The hydrogeology, model construction and conclusions are discussed below.
6.2.2 Hydrogeology
Observations of water levels in the test bores indicated that groundwater levels were still recovering several days after drilling and had yet to stabilise. Based on water levels measured in the drill holes, the elevation of the groundwater table is estimated to vary between about RL408 m to about RL402 m. There is an inferred groundwater gradient falling gently towards the topographically low area to the west of the TSF. The creek, located approximately 40 m to the west of the TSF, is likely to be discharging to the groundwater during intermittent flow.
The proposed deposition of tailings into an unlined TSF may be expected to result in seepage to the underlying groundwater from the tailings and a local increase in groundwater levels. Following the cessation of tailings deposition, local groundwater levels are expected to gradually recover to pre-mining groundwater levels.
November 2006 - 28 - 06642358-R01
Golder Associates
6.2.3 Conceptual Model
Model Construction
The modelling software SEEP/W version 6.20 (GEO-SLOPE 2004) was used to simulate seepage through the TSF. SEEP/W is a two-dimensional finite element model that is widely used for seepage analysis. Modelling was conducted along a representative, two-dimensional section of the TSF in an east-west direction. The location of the section is shown in Figure 11.
A finite element mesh was developed, consisting of 4,835 elements, with the elements ranging in size from 0.4 m × 1.1 m near the starter embankment to 5 m × 6 m at the other regions in the model area.
The ground elevation for the site of the TSF was based on surveyed surface elevations. The model geometry for the proposed embankment was based on design prepared by Golder. The inferred hydrostratigraphic units were based on the geological logs and falling head tests described in Section 4.6.1.3. The modelled cross-section is shown in Figure 13.
The modelling comprises the following three stages:
• Stage 1 - Pre-mining;
• Stage 2 - tailings deposition into TSF; and
• Stage 3 - Post-closure.
The permeability characteristics of the tailings had not been confirmed at the time of modelling. As the permeability coefficients of tailings may vary from 10-6 to 10-9 m/s, a low permeability case and a high permeability case were both simulated.
Boundary Conditions
Constant head boundaries were placed along the largest expected extent of the decant pond (i.e. pond extending to approximately 10% of the TSF surface area). A boundary function was used to model the increase in pond elevation over time, reflecting the increase in the tailings elevation for the various stages. A beach slope of 1V:75H was assumed between the proposed embankment height and the location of the decant pond. The proposed deposition schedule was developed as part of the TSF design study carried out by Golder.
November 2006 - 29 - 06642358-R01
Golder Associates
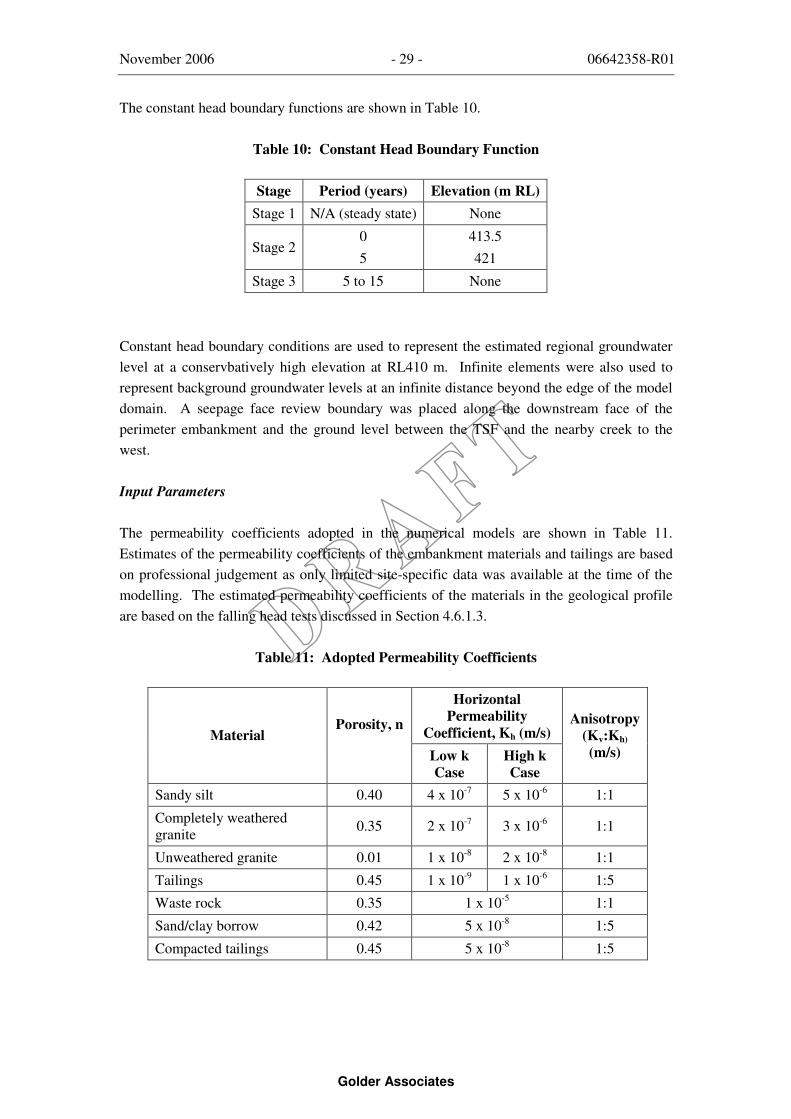
The constant head boundary functions are shown in Table 10.
Table 10: Constant Head Boundary Function
Stage Period (years) Elevation (m RL) Stage 1 N/A (steady state) None
Stage 2 0 5
413.5 421
Stage 3 5 to 15 None
Constant head boundary conditions are used to represent the estimated regional groundwater level at a conservbatively high elevation at RL410 m. Infinite elements were also used to represent background groundwater levels at an infinite distance beyond the edge of the model domain. A seepage face review boundary was placed along the downstream face of the perimeter embankment and the ground level between the TSF and the nearby creek to the west.
Input Parameters
The permeability coefficients adopted in the numerical models are shown in Table 11. Estimates of the permeability coefficients of the embankment materials and tailings are based on professional judgement as only limited site-specific data was available at the time of the modelling. The estimated permeability coefficients of the materials in the geological profile are based on the falling head tests discussed in Section 4.6.1.3.
Table 11: Adopted Permeability Coefficients
Horizontal Permeability
Coefficient, Kh (m/s) Material Porosity, n
Low k Case
High k Case
Anisotropy (Kv:Kh) (m/s)
Sandy silt 0.40 4 x 10⁻⁷ 5 x 10⁻⁶ 1:1
Completely weathered granite 0.35 2 x 10⁻⁷ 3 x 10⁻⁶ 1:1
Unweathered granite 0.01 1 x 10⁻⁸ 2 x 10⁻⁸ 1:1
Tailings 0.45 1 x 10⁻⁹ 1 x 10⁻⁶ 1:5
Waste rock 0.35 1 x 10⁻⁵ 1:1
Sand/clay borrow 0.42 5 x 10⁻⁸ 1:5
Compacted tailings 0.45 5 x 10⁻⁸ 1:5
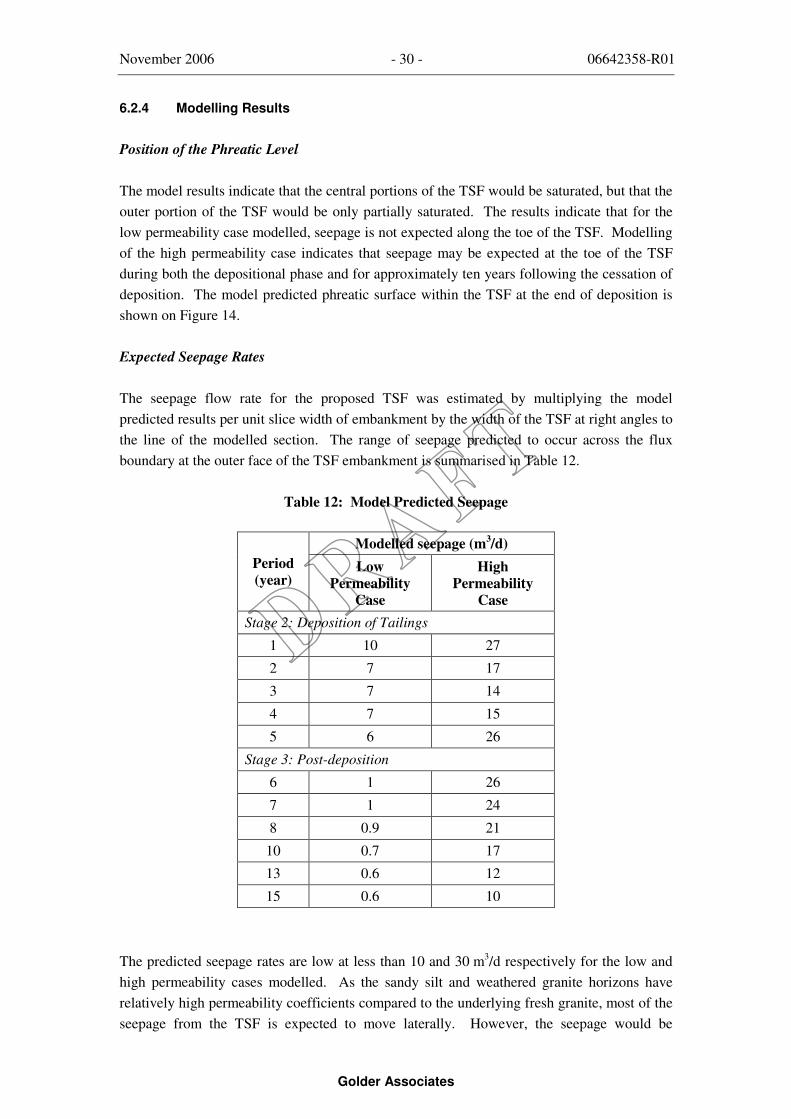
November 2006 - 30 - 06642358-R01
Golder Associates
6.2.4 Modelling Results
Position of the Phreatic Level
The model results indicate that the central portions of the TSF would be saturated, but that the outer portion of the TSF would be only partially saturated. The results indicate that for the low permeability case modelled, seepage is not expected along the toe of the TSF. Modelling of the high permeability case indicates that seepage may be expected at the toe of the TSF during both the depositional phase and for approximately ten years following the cessation of deposition. The model predicted phreatic surface within the TSF at the end of deposition is shown on Figure 14.
Expected Seepage Rates
The seepage flow rate for the proposed TSF was estimated by multiplying the model predicted results per unit slice width of embankment by the width of the TSF at right angles to the line of the modelled section. The range of seepage predicted to occur across the flux boundary at the outer face of the TSF embankment is summarised in Table 12.
Table 12: Model Predicted Seepage
Modelled seepage (m3/d) Period (year)
Low Permeability
Case
High Permeability
Case Stage 2: Deposition of Tailings
1 10 27
2 7 17
3 7 14
4 7 15
5 6 26
Stage 3: Post-deposition
6 1 26
7 1 24
8 0.9 21
10 0.7 17
13 0.6 12
15 0.6 10
The predicted seepage rates are low at less than 10 and 30 m3/d respectively for the low and high permeability cases modelled. As the sandy silt and weathered granite horizons have relatively high permeability coefficients compared to the underlying fresh granite, most of the seepage from the TSF is expected to move laterally. However, the seepage would be
November 2006 - 31 - 06642358-R01
Golder Associates
restricted by the shallow depth of the superficial layers and the presence of a low permeability cut-off beneath the perimeter embankment of the TSF.
In the high permeability case, increased seepage rates are predicted in years 4 and 5 of deposition, with seepage from the TSF being constrained by the ‘cut-off’ keyway beneath the starter embankment in the earlier years. After the initial 4 years of deposition, a sufficient hydraulic head is expected to develop on the upstream side of the starter embankment to cause the phreatic surface to rise to the base of the outer waste rock zone of the embankment, giving rise the increased rates of seepage indicated in Table 12.
6.2.5 Conclusions
The seepage rates estimated from the modelling could range from a maximum of 27 m3/d to less than 1 m3/d, depending on the permeability of the tailings material and to a lesser extent the permeability of the weathered bedrock zone. A more accurate assessment of seepage rates can only be made once there is more certainty regarding the tailings permeability. The value of 27 m3/day is considered to be conservatively high, based on the assumed upper range of permeability of the tailings and a more likely seepage rate may probably be in the order of 10 m3/day.
There is inherent uncertainty with the model predicted location of the phreatic surface and seepage rates within the TSF. Processes that influence the position of the phreatic surface, such as consolidation and particle segregation, have not been taken into account in the modeling process. Seepage rates may be higher due to the presence of preferential pathways, such as fracture zones within the bedrock.
The installation of seepage interception drains or abstraction wells around the perimeter of the TSF would assist in lowering an elevated phreatic surface near the starter embankment toe and maintaining groundwater levels below the ground surface. Regular monitoring of the monitoring bores located on the perimeter of the TSF would provide timely indication of a rise in ground water levels and provide the opportunity to install a seepage intereption drain or install and equip abstraction bores.
Permeability testing on the tailings material is required to more accurately estimate the seepage rates and phreatic surface within the proposed TSF. In addition, once groundwater levels in the drilled investigation holes have fully recovered, further measurement of groundwater levels should be undertaken and input into the seepage model.
6.3 Flood Assessment
6.3.1 Basis for Flood Estimation
An assessment was carried out of the likely magnitude of flood flows that might occur within the creek immediately to the west of the TSF for storm events of varying intensity and
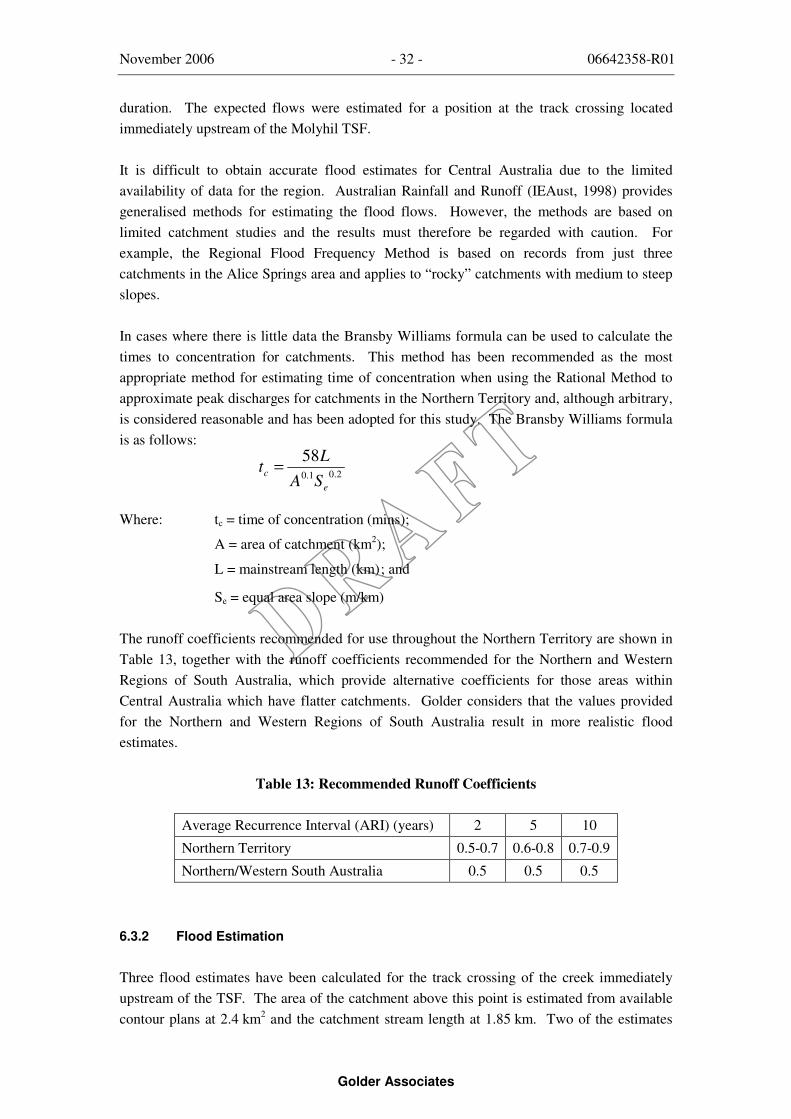
November 2006 - 32 - 06642358-R01
Golder Associates
duration. The expected flows were estimated for a position at the track crossing located immediately upstream of the Molyhil TSF.
It is difficult to obtain accurate flood estimates for Central Australia due to the limited availability of data for the region. Australian Rainfall and Runoff (IEAust, 1998) provides generalised methods for estimating the flood flows. However, the methods are based on limited catchment studies and the results must therefore be regarded with caution. For example, the Regional Flood Frequency Method is based on records from just three catchments in the Alice Springs area and applies to “rocky” catchments with medium to steep slopes.
In cases where there is little data the Bransby Williams formula can be used to calculate the times to concentration for catchments. This method has been recommended as the most appropriate method for estimating time of concentration when using the Rational Method to approximate peak discharges for catchments in the Northern Territory and, although arbitrary, is considered reasonable and has been adopted for this study. The Bransby Williams formula is as follows:
Where: tc = time of concentration (mins);
A = area of catchment (km2);
L = mainstream length (km) ; and
Se = equal area slope (m/km)
The runoff coefficients recommended for use throughout the Northern Territory are shown in Table 13, together with the runoff coefficients recommended for the Northern and Western Regions of South Australia, which provide alternative coefficients for those areas within Central Australia which have flatter catchments. Golder considers that the values provided for the Northern and Western Regions of South Australia result in more realistic flood estimates.
Table 13: Recommended Runoff Coefficients
Average Recurrence Interval (ARI) (years) 2 5 10
Northern Territory 0.5-0.7 0.6-0.8 0.7-0.9
Northern/Western South Australia 0.5 0.5 0.5
6.3.2 Flood Estimation
Three flood estimates have been calculated for the track crossing of the creek immediately upstream of the TSF. The area of the catchment above this point is estimated from available contour plans at 2.4 km2 and the catchment stream length at 1.85 km. Two of the estimates
2.01.0
58
ec SA
Lt =

November 2006 - 33 - 06642358-R01
Golder Associates
have utilised the Rational Method, one using a mid-value in the range of runoff coefficients recommended for the Northern Territory and the other using the runoff coefficients recommended for Northern and Western Regions of South Australia as shown in Table 13. The third estimate is based on the Regional Flood Frequency Method.
The results for varying Average Recurrence Intervals (ARIs) are shown in Table 14.
Table 14: Flood Estimates for Molyhil, Central Australia
ARI 2-year (m3/s)
5-year (m3/s)
10-year (m3/s)
20-year (m3/s)
50-year (m3/s)
100-year (m3/s)
Rational Method for Northern Territory 15 25 34 40 50 57
Rational Method for Northern and Western South Australia
13 18 21 25 31 36
Regional Flood Frequency 6 12 17 21 27 32
An estimate of the channel dimensions required to pass the 1:100 year flood event without over-spilling would be approximately 3 m wide at the base by 1.5 m deep, with side slopes of 1H:2V. Velocities in the channel would be very high (~3.8 m3/s), requiring erosion protection measures.
If the channel were designed to overflow during flood events then it is likely that any overbank flow would be of low velocity due to the increased flow area and there would be little risk of erosion. The design of the TSF perimeter embankment provides for a coarse waste rock outer zone to the embankment that would provide protection against erosion of the embankment toe.
6.4 Water Balance
An annual water balance estimate has been prepared, based on the inflows and outflows that would be expected at the mid-point in the operational life of the combined TSF. The estimates of inflows and outflows to the TSF are summarised in Table 15. The water cycle is illustrated on Figure 15.
The assessment assumes that the TSF is unlined and there is no seepage recovery. In the lined case with underdrainage, the volume of water returned to plant would be expected to be slightly higher.
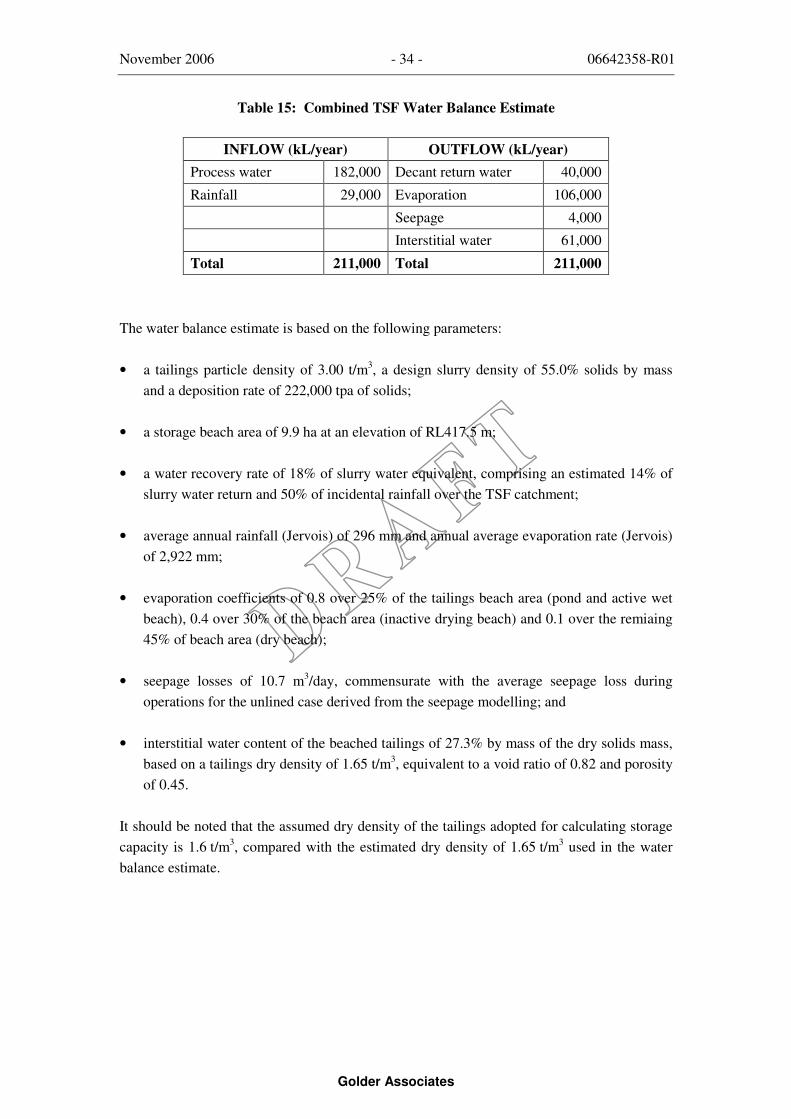
November 2006 - 34 - 06642358-R01
Golder Associates
Table 15: Combined TSF Water Balance Estimate
INFLOW (kL/year) OUTFLOW (kL/year) Process water 182,000 Decant return water 40,000
Rainfall 29,000 Evaporation 106,000
Seepage 4,000
Interstitial water 61,000
Total 211,000 Total 211,000
The water balance estimate is based on the following parameters:
• a tailings particle density of 3.00 t/m3, a design slurry density of 55.0% solids by mass and a deposition rate of 222,000 tpa of solids;
• a storage beach area of 9.9 ha at an elevation of RL417.5 m;
• a water recovery rate of 18% of slurry water equivalent, comprising an estimated 14% of slurry water return and 50% of incidental rainfall over the TSF catchment;
• average annual rainfall (Jervois) of 296 mm and annual average evaporation rate (Jervois) of 2,922 mm;
• evaporation coefficients of 0.8 over 25% of the tailings beach area (pond and active wet beach), 0.4 over 30% of the beach area (inactive drying beach) and 0.1 over the remiaing 45% of beach area (dry beach);
• seepage losses of 10.7 m3/day, commensurate with the average seepage loss during operations for the unlined case derived from the seepage modelling; and
• interstitial water content of the beached tailings of 27.3% by mass of the dry solids mass, based on a tailings dry density of 1.65 t/m3, equivalent to a void ratio of 0.82 and porosity of 0.45.
It should be noted that the assumed dry density of the tailings adopted for calculating storage capacity is 1.6 t/m3, compared with the estimated dry density of 1.65 t/m3 used in the water balance estimate.
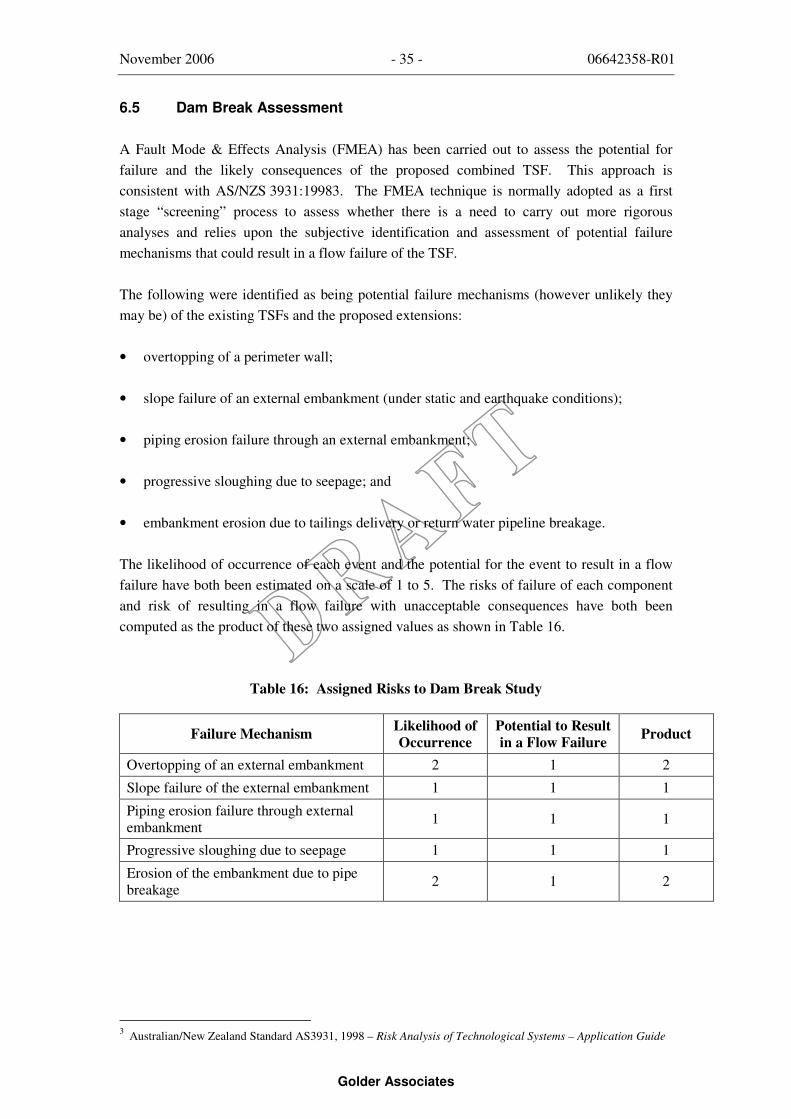
November 2006 - 35 - 06642358-R01
Golder Associates
6.5 Dam Break Assessment
A Fault Mode & Effects Analysis (FMEA) has been carried out to assess the potential for failure and the likely consequences of the proposed combined TSF. This approach is consistent with AS/NZS 3931:19983. The FMEA technique is normally adopted as a first stage “screening” process to assess whether there is a need to carry out more rigorous analyses and relies upon the subjective identification and assessment of potential failure mechanisms that could result in a flow failure of the TSF.
The following were identified as being potential failure mechanisms (however unlikely they may be) of the existing TSFs and the proposed extensions:
• overtopping of a perimeter wall;
• slope failure of an external embankment (under static and earthquake conditions);
• piping erosion failure through an external embankment;
• progressive sloughing due to seepage; and
• embankment erosion due to tailings delivery or return water pipeline breakage.
The likelihood of occurrence of each event and the potential for the event to result in a flow failure have both been estimated on a scale of 1 to 5. The risks of failure of each component and risk of resulting in a flow failure with unacceptable consequences have both been computed as the product of these two assigned values as shown in Table 16.
Table 16: Assigned Risks to Dam Break Study
Failure Mechanism Likelihood of Occurrence
Potential to Result in a Flow Failure Product
Overtopping of an external embankment 2 1 2
Slope failure of the external embankment 1 1 1
Piping erosion failure through external embankment 1 1 1
Progressive sloughing due to seepage 1 1 1
Erosion of the embankment due to pipe breakage 2 1 2
3 Australian/New Zealand Standard AS3931, 1998 – Risk Analysis of Technological Systems – Application Guide

November 2006 - 36 - 06642358-R01
Golder Associates
These values have then been entered into the risk-rating matrix presented below.
Potential to result in a flow failure
Likelihood of occurrence
Low (1)
Low to Moderate
(2) Moderate
(3)
Moderate to High
(4) High (5)
Rare (1) ××××××××××××
Low Likelihood (2) ××××××××
Moderate Likelihood (3)
High Likelihood (4)
Almost Certain (5)
= Low Risk (score between 1 & 4 inclusive)
= Moderate Risk (score between 5 & 12) = High Risk (score above 12)
×××× = Identified failure mechanism from Table 16
It is evident from the risk matrix and Table 16 presented above that:
• there is no entry in the “moderate” or “high” risk zone of the matrix;
• the average risk rating is approximately 1.4.
The risk of a dam break and subsequent release of tailings is therefore considered to be low and more detailed assessment of the potential for a flow failure is not considered to be required.
7.0 OPERATING PROCEDURES
7.1 Tailings Deposition and Staged Construction
On completion of construction of the combined pyrite and general plant TSF, deposition pipework will be assembled on the crest of the perimeter embankment and connected up to the main slurry delivery pipeline. The pipework will access the embankment at the north eastern corner of the TSF, where the flow will be split into two distribution pipelines. One of the distribution pipelines will carry tailings along the south eastern and south western perimeter embankments, while the other distribution pipeline will deliver tailings to the north western and south western embankments. Isolation valves will be installed in the pipelines at the take-off from the main delivery pipeline from the plant and at the northern and southern
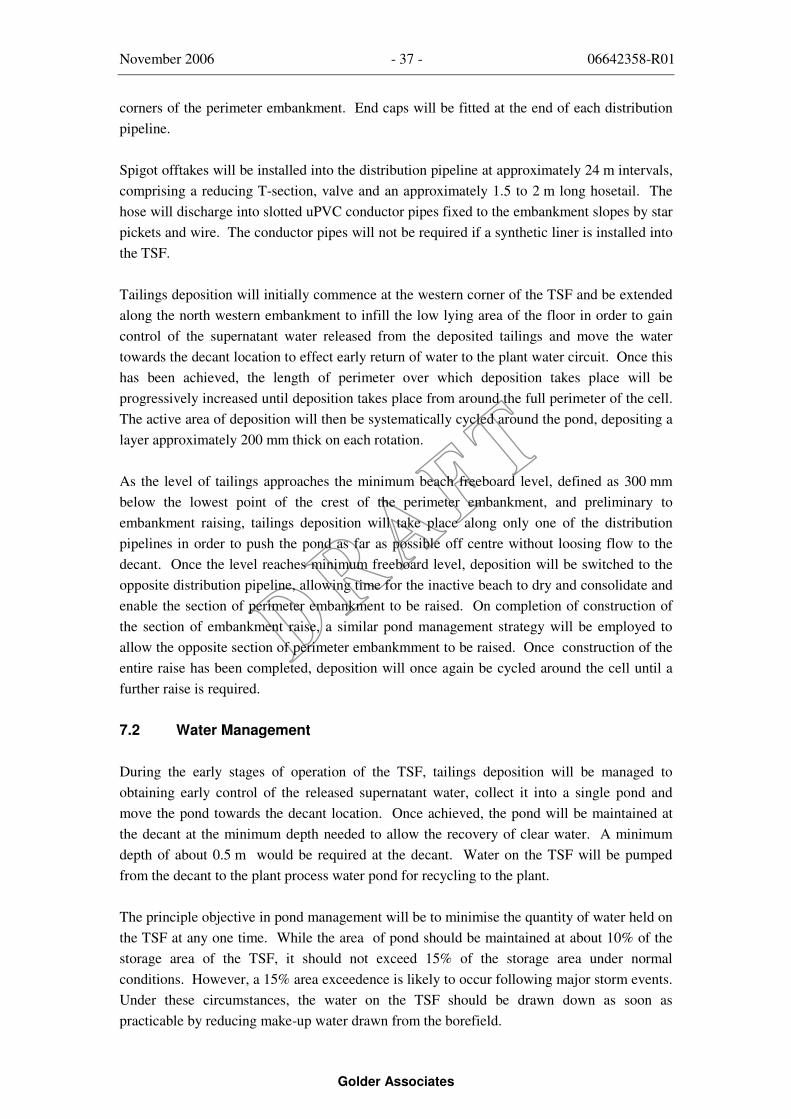
November 2006 - 37 - 06642358-R01
Golder Associates
corners of the perimeter embankment. End caps will be fitted at the end of each distribution pipeline.
Spigot offtakes will be installed into the distribution pipeline at approximately 24 m intervals, comprising a reducing T-section, valve and an approximately 1.5 to 2 m long hosetail. The hose will discharge into slotted uPVC conductor pipes fixed to the embankment slopes by star pickets and wire. The conductor pipes will not be required if a synthetic liner is installed into the TSF.
Tailings deposition will initially commence at the western corner of the TSF and be extended along the north western embankment to infill the low lying area of the floor in order to gain control of the supernatant water released from the deposited tailings and move the water towards the decant location to effect early return of water to the plant water circuit. Once this has been achieved, the length of perimeter over which deposition takes place will be progressively increased until deposition takes place from around the full perimeter of the cell. The active area of deposition will then be systematically cycled around the pond, depositing a layer approximately 200 mm thick on each rotation.
As the level of tailings approaches the minimum beach freeboard level, defined as 300 mm below the lowest point of the crest of the perimeter embankment, and preliminary to embankment raising, tailings deposition will take place along only one of the distribution pipelines in order to push the pond as far as possible off centre without loosing flow to the decant. Once the level reaches minimum freeboard level, deposition will be switched to the opposite distribution pipeline, allowing time for the inactive beach to dry and consolidate and enable the section of perimeter embankment to be raised. On completion of construction of the section of embankment raise, a similar pond management strategy will be employed to allow the opposite section of perimeter embankmment to be raised. Once construction of the entire raise has been completed, deposition will once again be cycled around the cell until a further raise is required.
7.2 Water Management
During the early stages of operation of the TSF, tailings deposition will be managed to obtaining early control of the released supernatant water, collect it into a single pond and move the pond towards the decant location. Once achieved, the pond will be maintained at the decant at the minimum depth needed to allow the recovery of clear water. A minimum depth of about 0.5 m would be required at the decant. Water on the TSF will be pumped from the decant to the plant process water pond for recycling to the plant.
The principle objective in pond management will be to minimise the quantity of water held on the TSF at any one time. While the area of pond should be maintained at about 10% of the storage area of the TSF, it should not exceed 15% of the storage area under normal conditions. However, a 15% area exceedence is likely to occur following major storm events. Under these circumstances, the water on the TSF should be drawn down as soon as practicable by reducing make-up water drawn from the borefield.
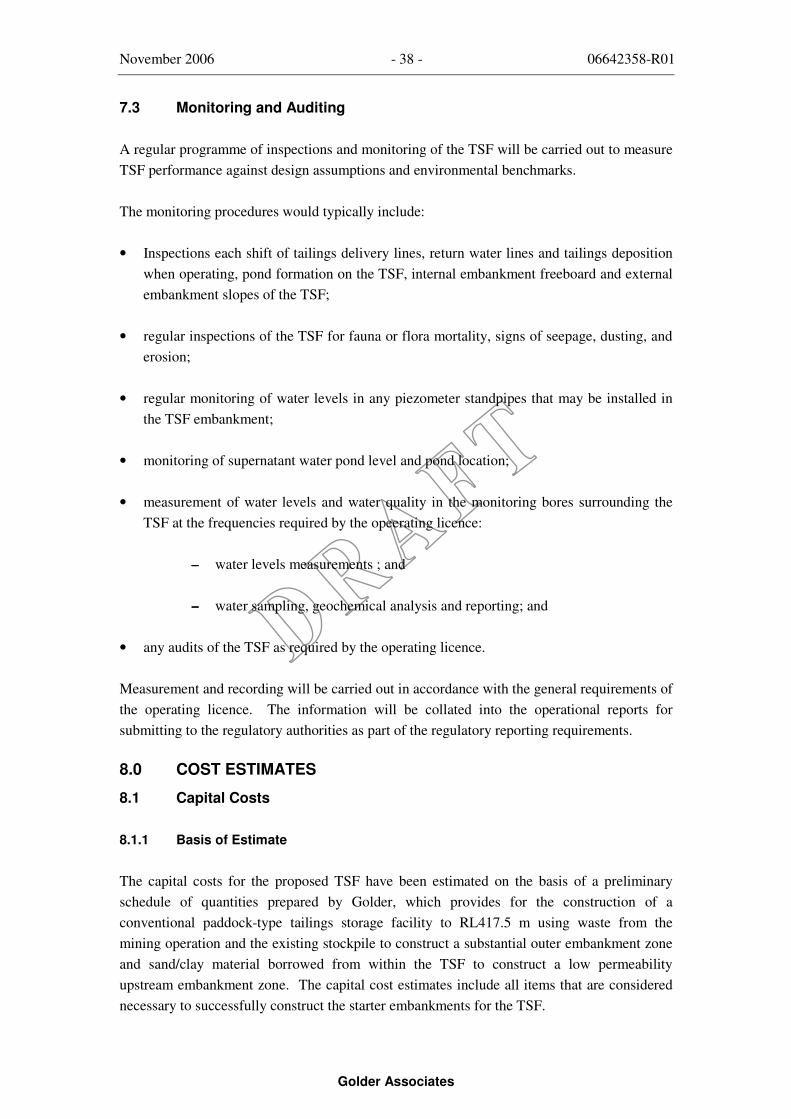
November 2006 - 38 - 06642358-R01
Golder Associates
7.3 Monitoring and Auditing
A regular programme of inspections and monitoring of the TSF will be carried out to measure TSF performance against design assumptions and environmental benchmarks.
The monitoring procedures would typically include:
• Inspections each shift of tailings delivery lines, return water lines and tailings deposition when operating, pond formation on the TSF, internal embankment freeboard and external embankment slopes of the TSF;
• regular inspections of the TSF for fauna or flora mortality, signs of seepage, dusting, and erosion;
• regular monitoring of water levels in any piezometer standpipes that may be installed in the TSF embankment;
• monitoring of supernatant water pond level and pond location;
• measurement of water levels and water quality in the monitoring bores surrounding the TSF at the frequencies required by the opeerating licence:
−−−− water levels measurements ; and
−−−− water sampling, geochemical analysis and reporting; and
• any audits of the TSF as required by the operating licence.
Measurement and recording will be carried out in accordance with the general requirements of the operating licence. The information will be collated into the operational reports for submitting to the regulatory authorities as part of the regulatory reporting requirements.
8.0 COST ESTIMATES
8.1 Capital Costs
8.1.1 Basis of Estimate
The capital costs for the proposed TSF have been estimated on the basis of a preliminary schedule of quantities prepared by Golder, which provides for the construction of a conventional paddock-type tailings storage facility to RL417.5 m using waste from the mining operation and the existing stockpile to construct a substantial outer embankment zone and sand/clay material borrowed from within the TSF to construct a low permeability upstream embankment zone. The capital cost estimates include all items that are considered necessary to successfully construct the starter embankments for the TSF.
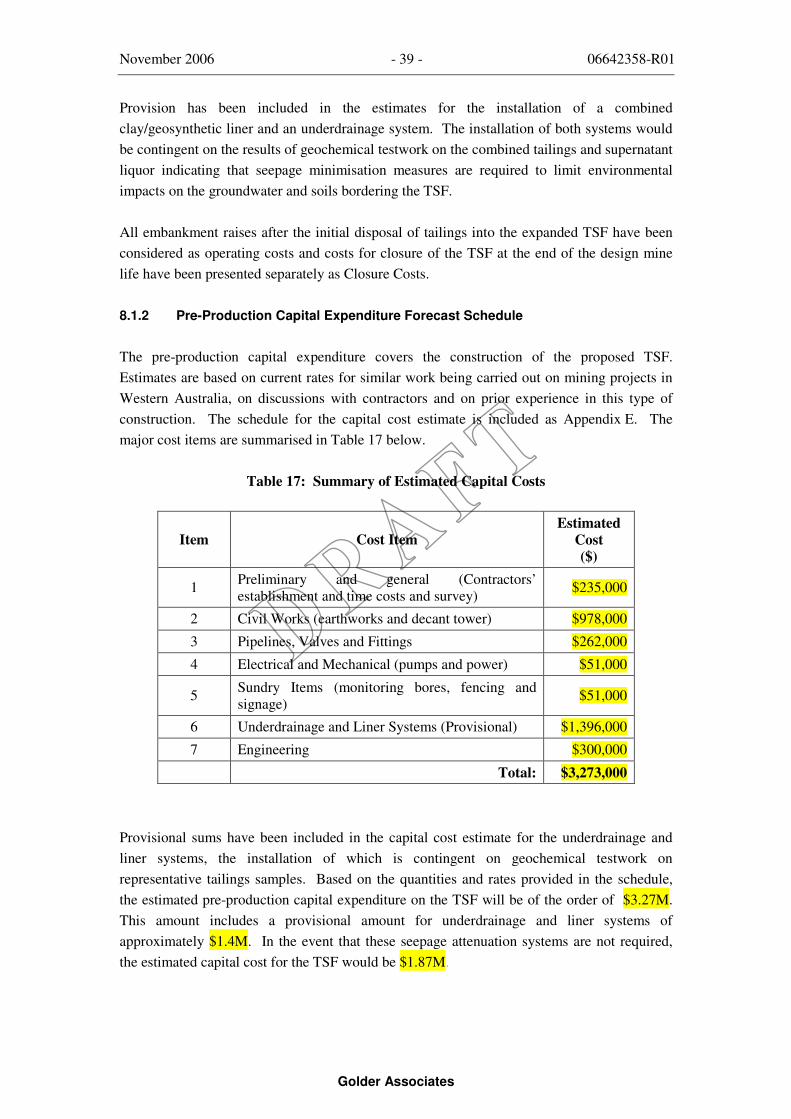
November 2006 - 39 - 06642358-R01
Golder Associates
Provision has been included in the estimates for the installation of a combined clay/geosynthetic liner and an underdrainage system. The installation of both systems would be contingent on the results of geochemical testwork on the combined tailings and supernatant liquor indicating that seepage minimisation measures are required to limit environmental impacts on the groundwater and soils bordering the TSF.
All embankment raises after the initial disposal of tailings into the expanded TSF have been considered as operating costs and costs for closure of the TSF at the end of the design mine life have been presented separately as Closure Costs.
8.1.2 Pre-Production Capital Expenditure Forecast Schedule
The pre-production capital expenditure covers the construction of the proposed TSF. Estimates are based on current rates for similar work being carried out on mining projects in Western Australia, on discussions with contractors and on prior experience in this type of construction. The schedule for the capital cost estimate is included as Appendix E. The major cost items are summarised in Table 17 below.
Table 17: Summary of Estimated Capital Costs
Item Cost Item Estimated
Cost ($)
1 Preliminary and general (Contractors’ establishment and time costs and survey) $235,000
2 Civil Works (earthworks and decant tower) $978,000
3 Pipelines, Valves and Fittings $262,000
4 Electrical and Mechanical (pumps and power) $51,000
5 Sundry Items (monitoring bores, fencing and signage) $51,000
6 Underdrainage and Liner Systems (Provisional) $1,396,000
7 Engineering $300,000
Total: $3,273,000
Provisional sums have been included in the capital cost estimate for the underdrainage and liner systems, the installation of which is contingent on geochemical testwork on representative tailings samples. Based on the quantities and rates provided in the schedule, the estimated pre-production capital expenditure on the TSF will be of the order of $3.27M. This amount includes a provisional amount for underdrainage and liner systems of approximately $1.4M. In the event that these seepage attenuation systems are not required, the estimated capital cost for the TSF would be $1.87M.

November 2006 - 40 - 06642358-R01
Golder Associates
8.1.3 Contingency and Estimate Accuracy
No contingency has been included in the estimates on the assumptions that a contingency will be applied to the estimates when the estimates are incorporated into the cost analysis in the parent document.
There is generally significant variation in the unit rates and cost estimates received from contractors at tender for civil works and it is not unusual for the spread of prices to exceed the purported accuracy of the pre-tender estimates. Nevertheless, while the accuracy of the estimate may be difficult to determine, we are satisfied that the cost estimate provided will fall within ±30% of the mean price likely to be obtained from an open tender.
8.1.4 Qualifications
The cost estimates presented include the following assumptions:
• diesel fuel would be made available to the Contractor on site and the Government’s fuel rebate would apply;
• monitoring bores would be installed by a drilling rig already established on site; and
• construction would take approximately twelve to fourteen weeks.
It is not certain to what extent the isolation of the site will impact on the individual tender prices.
8.2 Operating Cost Estimate
8.2.1 General
The operating cost for tailings disposal is based on five major items: power consumption, wall raise construction, decant and causeway raising and maintenance personnel. It has been assumed that the power costs for operating the TSF and manpower costs lie outside the scope of this estimate, but within the ambit of the plant operating costs.
The operating costs included in this report are based on the construction of three embankment raises, each of 1.5 m in height to a final embankment crest elevation of RL422 m. The costs include the excavation and placement of tailings into each embankment raise and the loading hauling and placement of waste rock into the causeway and the outer zone of the perimeter embankment. The costs also include the raising of the decant tower and all tasks associated with execution of the raise tasks including dismantling of pipelines, power supply and reconnecting or assembling on completion of raise construction.
The cost schedule included as Appendix F is for each embankment raise. The total operating cost for the three raises is therefore three times the costs shown on the Schedule in

November 2006 - 41 - 06642358-R01
Golder Associates
Appendix F. The operating costs for all three envisaged embankment raises are summarised in Table 18.
Table 18: Summary of Estimated Operating Costs
Item Cost Item Estimated
Cost ($)
1 Preliminary and general (Contractors’ establishment and time costs and survey) $540,000
2 Civil Works (earthworks and decant tower) $714,000
3 Pipelines, Valves and Fittings $30,000
4 Electrical and Mechanical (pumps and power) $15,000
5 Engineering $180,000
Total: $1,479,000 Note: the operating costs in Table 18 are for three embankment raises of 1.5 m each.
8.2.2 Maintenance Personnel
As the day to day tailings management would, under normal circumstances consume a couple of hours work at the TSF site each day, manpower costs for managing the TSF are deemed to have been included in the plant operating costs.
8.3 Closure
The estimated cost for closure of the TSF have been prepared separately from the initial capital cost and operating cost. While it is assumed for the purpose of the cost estimates that closure works will commence after cessation of deposition, it is possible that decommissioning of the outer embankments may commence during the operating phase of the TSF. The schedule for the closure cost estimate is included as Appendix G. The major cost items are summarised in Table 19 below.
Table 19: Summary of Estimated Closure Costs
Item Cost Item Estimated
Cost ($)
1 Preliminary and general (Contractors’ establishment and time costs and survey) $180,000
2 Civil Works (earthworks and decant tower) $839,000
3 Engineering $130,000
Total: $1,149,000
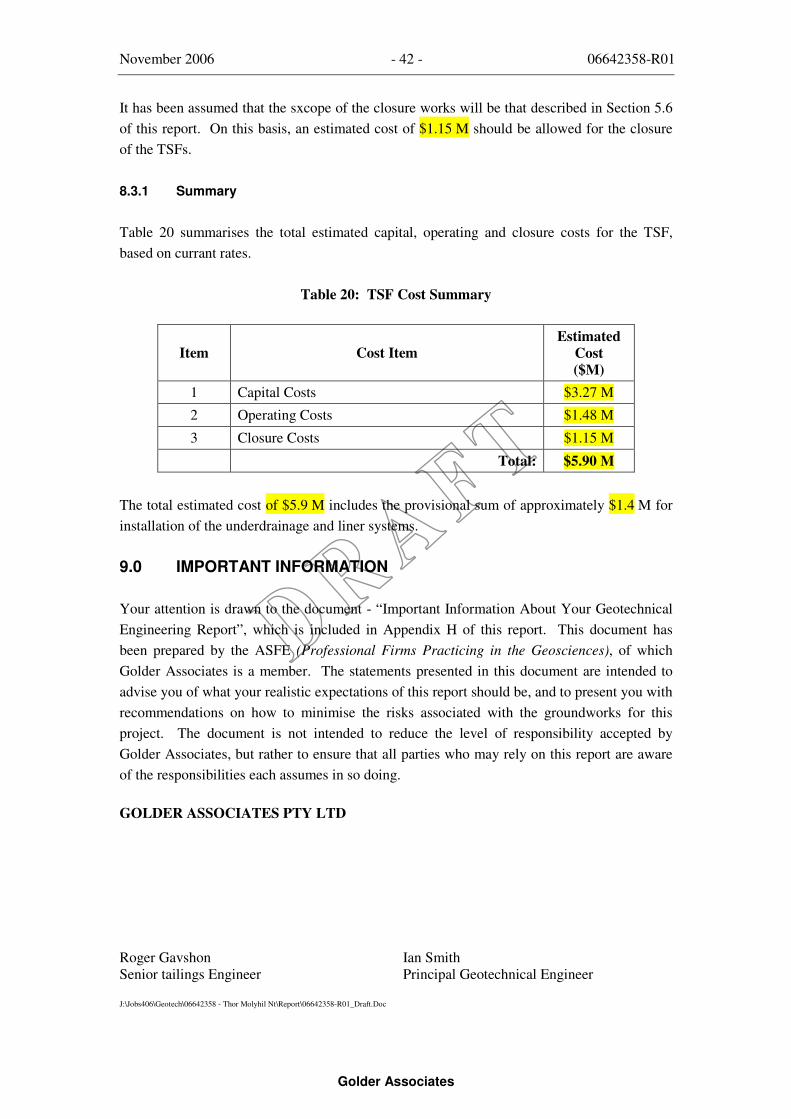
November 2006 - 42 - 06642358-R01
Golder Associates
It has been assumed that the sxcope of the closure works will be that described in Section 5.6 of this report. On this basis, an estimated cost of $1.15 M should be allowed for the closure of the TSFs.
8.3.1 Summary
Table 20 summarises the total estimated capital, operating and closure costs for the TSF, based on currant rates.
Table 20: TSF Cost Summary
Item Cost Item Estimated
Cost ($M)
1 Capital Costs $3.27 M
2 Operating Costs $1.48 M
3 Closure Costs $1.15 M
Total: $5.90 M
The total estimated cost of $5.9 M includes the provisional sum of approximately $1.4 M for installation of the underdrainage and liner systems.
9.0 IMPORTANT INFORMATION
Your attention is drawn to the document - “Important Information About Your Geotechnical Engineering Report”, which is included in Appendix H of this report. This document has been prepared by the ASFE (Professional Firms Practicing in the Geosciences), of which Golder Associates is a member. The statements presented in this document are intended to advise you of what your realistic expectations of this report should be, and to present you with recommendations on how to minimise the risks associated with the groundworks for this project. The document is not intended to reduce the level of responsibility accepted by Golder Associates, but rather to ensure that all parties who may rely on this report are aware of the responsibilities each assumes in so doing.
GOLDER ASSOCIATES PTY LTD
Roger Gavshon Ian Smith Senior tailings Engineer Principal Geotechnical Engineer J:\Jobs406\Geotech\06642358 - Thor Molyhil Nt\Report\06642358-R01_Draft.Doc

November 2006 - 06642358-R01
Golder Associates
- 43
REFERENCES
Australian National Committee on Large Dams (ANCOLD), 1999, Guidelines on Tailings Dam Design, Construction and Operation, October 1999.
Australian National Committee on Large Dams (ANCOLD), 2003, Guidelines on Dam Safety Management, August 2003.
Australian Standard AS1170.4-1993, Minimum Design Loads on Structures, Part 4: Earthquake Loads, Published by Standards Australia, 1993
Department of Minerals and Energy, Western Australia, 1998, Guidelines on the Development of an Operating Manual for Tailings Storage, October 1998.
Department of Minerals and Energy, Western Australia, 1999, Guidelines on the Safe Design and Operating Standards for Tailings Storage, May 1999.
Nachtrag zur Autographie “Grundbegriffe zu Spannungen im Boden und Scherfestigheit; Abschatzung des Reibungswinkels, nach Dhawan mit Korrekturen nach Brinch Hansen, pp 26 und 27.
Geo-Slope International Ltd, 2004. Seepage Modelling with SEEP/W. Version 6.20.
Somerville, S.H. 2005, Control of Groundwater for Temporary Works, CIRIA Report 113.
US Army Corp of Engineers 1986, Seepage Analysis and Control for Dams, Engineer Manual No. 1110-2-1901.

Golder Associates
APPENDIX A
SUMMARY TEST PIT LOGS

Golder Associates
APPENDIX B
BOREHOLE LOGS

Golder Associates
APPENDIX C
FALLING HEAD TEST ANALYSES

Golder Associates
APPENDIX D
TSF FOUNDATION SOILS LABORATORY TEST CERTIFICATES

Golder Associates
APPENDIX E
CAPITAL COST ESTIMATE
Golder Associates
APPENDIX F
OPERATING COST ESTIMATE
Golder Associates
APPENDIX G
CLOSURE COST ESTIMATE

Golder Associates
APPENDIX H
IMPORTANT INFORMATION ABOUT YOUR GEOTECHNICAL ENGINEERING REPORT