Embed Size (px)
Citation preview
EN EN
EUROPEAN COMMISSION
Brussels, 28.1.2016
COM(2016) 29 final
REPORT FROM THE COMMISSION TO THE EUROPEAN PARLIAMENT AND
THE COUNCIL
Report on the Generalised Scheme of Preferences covering the period 2014-2015
{SWD(2016) 8 final}
2
REPORT FROM THE COMMISSION TO THE EUROPEAN PARLIAMENT
AND THE COUNCIL
Report on the Generalised Scheme of Preferences covering the period 2014-2015
1. INTRODUCTION
1.1. The Generalised Scheme of Preferences (GSP)
Since 1971, the EU Generalised Scheme of Preferences ('GSP') has assisted developing
countries in their efforts to reduce poverty, promote good governance and sustainable
development. By providing preferential access to the EU market, the GSP helps
developing countries generate additional revenue through international trade. Regulation
(EU) No 978/2012 of the European Parliament and the Council of 25 October 2012 on
applying a scheme of generalised tariff preferences1 ('the GSP Regulation') is the legal
framework for the GSP. The scheme is in line with WTO law, having been introduced
under the so-called 'Enabling Clause', which allows an exception to the WTO 'Most-
Favoured Nation' principle.
1.2. Three arrangements within GSP
The GSP Regulation reformed the GSP in order to better focus GSP preferences on those
countries most in need, in particular, least developed countries ('LDCs') and other low
and lower-middle income developing countries. The reforms to the GSP significantly
reduced the number of beneficiaries from 178 to 922. Countries which are classified as
upper-middle income and above by the World Bank are excluded from GSP preferences.
Also excluded are countries that benefit from a preferential market access arrangement
with the EU that grants at least the same level of tariff preferences for substantially all
trade.
To accommodate developing countries' trade, development and financial needs
effectively, the GSP provides three different preference arrangements: a general GSP
arrangement and two special arrangements.
− The general arrangement ('Standard GSP') grants duty reductions for ca. 66% of all
EU tariff lines to countries of low or lower-middle income, which do not benefit from
other preferential trade access to the EU market. There are currently 30 Standard GSP
beneficiaries.
− The Special Incentive Arrangement for Sustainable Development and Good
Governance, ('GSP+') grants complete duty suspension for essentially the same
66% tariff lines, as the Standard GSP, for countries especially vulnerable in terms of
their economies' diversification and import volumes. In return, beneficiary countries
must ratify and effectively implement 27 core international conventions, as listed in
1 OJ L 303, 31.10.2012, p. 1
2 Unless stated otherwise, this report reflects the situation on 1 December 2015. Moreover, data included in
this report concerns only GSP beneficiaries as of 1 December 2015.
3
Annex VIII of the GSP Regulation. These conventions cover human and labour
rights, environmental protection, and good governance. There are currently 13 GSP+
beneficiaries.
− The special arrangement Everything But Arms ('EBA') grants full duty-free, quota-
free access for all products except arms and ammunition, for countries classified by
the UN as LDCs. There are currently 49 EBA beneficiaries.
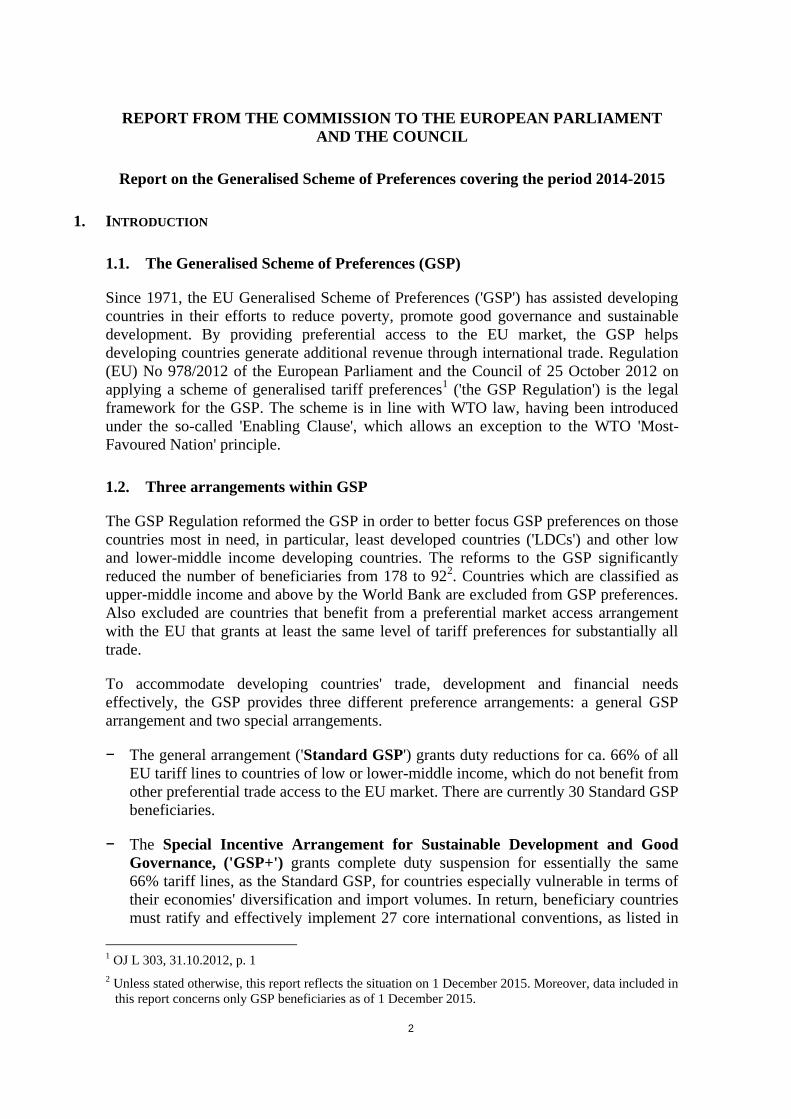
In 2014, almost EUR 50.83
billion of imports received GSP preferences as follows: EUR
27.3 billion of imports from countries under the Standard GSP, around EUR 6.5 billion
of imports from GSP+ beneficiaries and EUR 17 billion of imports from EBA countries.
Full details are given in Tables 1-4 of this Report.
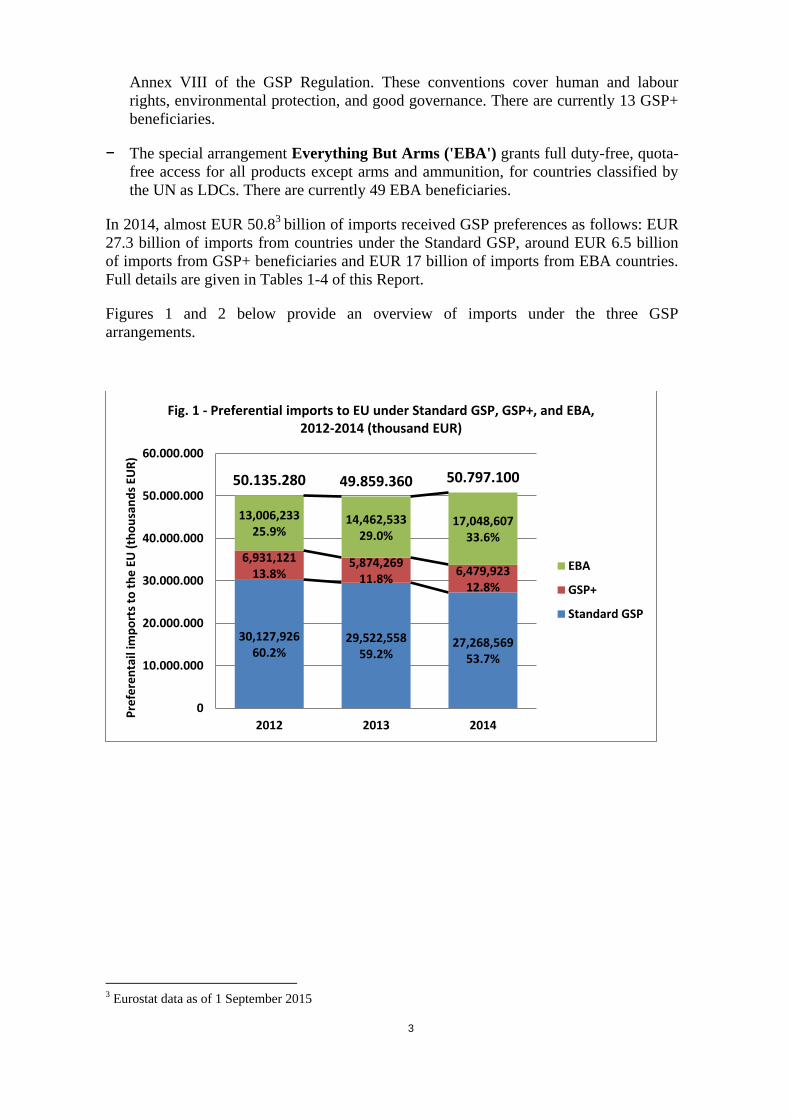
Figures 1 and 2 below provide an overview of imports under the three GSP
arrangements.
3 Eurostat data as of 1 September 2015
30,127,926 60.2%
29,522,558 59.2%
27,268,569 53.7%
6,931,121 13.8%
5,874,269 11.8%
6,479,923 12.8%
13,006,233 25.9%
14,462,533 29.0%
17,048,607 33.6%
50.135.280 49.859.360 50.797.100
0
10.000.000
20.000.000
30.000.000
40.000.000
50.000.000
60.000.000
2012 2013 2014
Pre
fere
nta
il im
po
rts
to t
he
EU
(th
ou
san
ds
EUR
)
Fig. 1 - Preferential imports to EU under Standard GSP, GSP+, and EBA, 2012-2014 (thousand EUR)
EBA
GSP+
Standard GSP
4
1.3. The objective of this Report
The GSP Regulation requires the Commission to submit a report to the European
Parliament and the Council on the functioning of the GSP scheme, once every two years,
beginning from 1 January 2016.
The report is required to cover the effects of all three preferential arrangements of the
GSP over the previous two years4. However, the GSP Regulation requires that the report
take a particular focus on the GSP+. The report should detail beneficiary countries'
ratification, reporting, and effective implementation of the relevant conventions5.
Thus, this report covers all three elements of the GSP: the Standard GSP scheme, the
EBA scheme, with a particular focus on the GSP+ scheme.6
2. THE STANDARD GSP ARRANGEMENT
The list of GSP beneficiaries has been modified a number of times to reflect the exit of
countries from the GSP, in accordance with the criteria of Article 4 of the GSP
Regulation (i.e. countries which have been classified by the World Bank as upper-middle
income countries for three consecutive years, or have started benefitting from EU
preferential market access arrangements providing the same, or better, tariff preferences).
The list of beneficiaries has also been modified to include countries newly meeting the
eligibility conditions for the GSP. In particular:
4 Article 40 of the GSP Regulation. Unless stated otherwise, this report reflects the situation on 1
December 2015
5 Article 14 of the GSP Regulation
6 A full report on the application of the whole GSP Regulation will be submitted to the European
Parliament and to the Council five years after the entry into force of the GSP regulation (i.e. by
November 2017)
Standard GSP 27.268.569
53,7%
GSP+ 6.479.923
12,8%
EBA 17.048.607
33,6%
Fig. 2- Preferential imports to the EU under the Standard GSP, GSP+ and EBA, 2014 (thousand EUR)
5
− Iran and Azerbaijan exited on 23 February 20147
− Croatia ceased to be an eligible country and so also a beneficiary upon its EU
accession8
− South Sudan and Myanmar were included on 1 January 20149
− China, Ecuador, Thailand and Maldives graduated out on 1 January 201510
− Botswana, Cameroon, Cote d'Ivoire, Fiji, Ghana, Kenya, Namibia and Swaziland
were included on 1 October 201411
.
The following 30 countries benefit from the Standard GSP12
:
− Africa: Botswana*, Cameroon, Cote d'Ivoire, Republic of Congo, Kenya, Ghana,
Namibia, Nauru, Nigeria, Swaziland
− Asia: Kyrgyzstan, India, Indonesia, Sri Lanka, Vietnam, Tajikistan,
Turkmenistan**, Uzbekistan
− Australia and Pacific: Cook Islands, Fiji, Marshall Islands, Micronesia (Federate
States of), Niue, Tonga
− Europe: Ukraine
− Middle East: Iraq, Syria
− South America: Colombia**, Honduras**, Nicaragua**
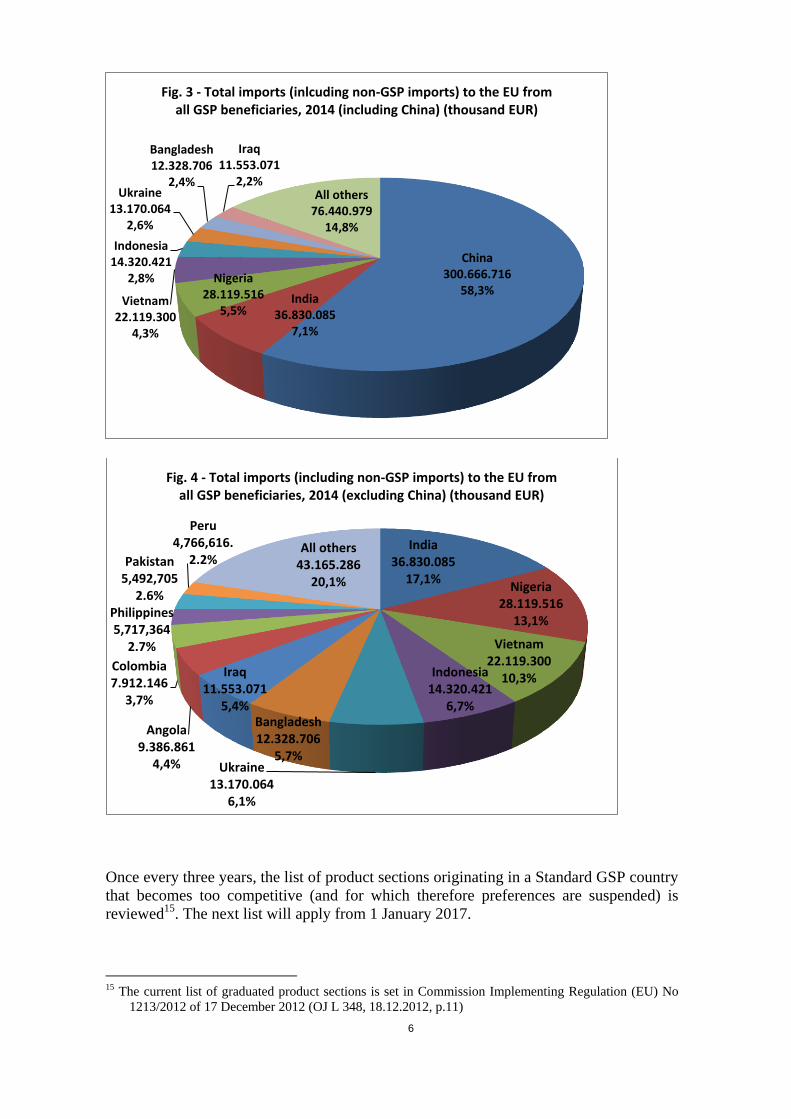
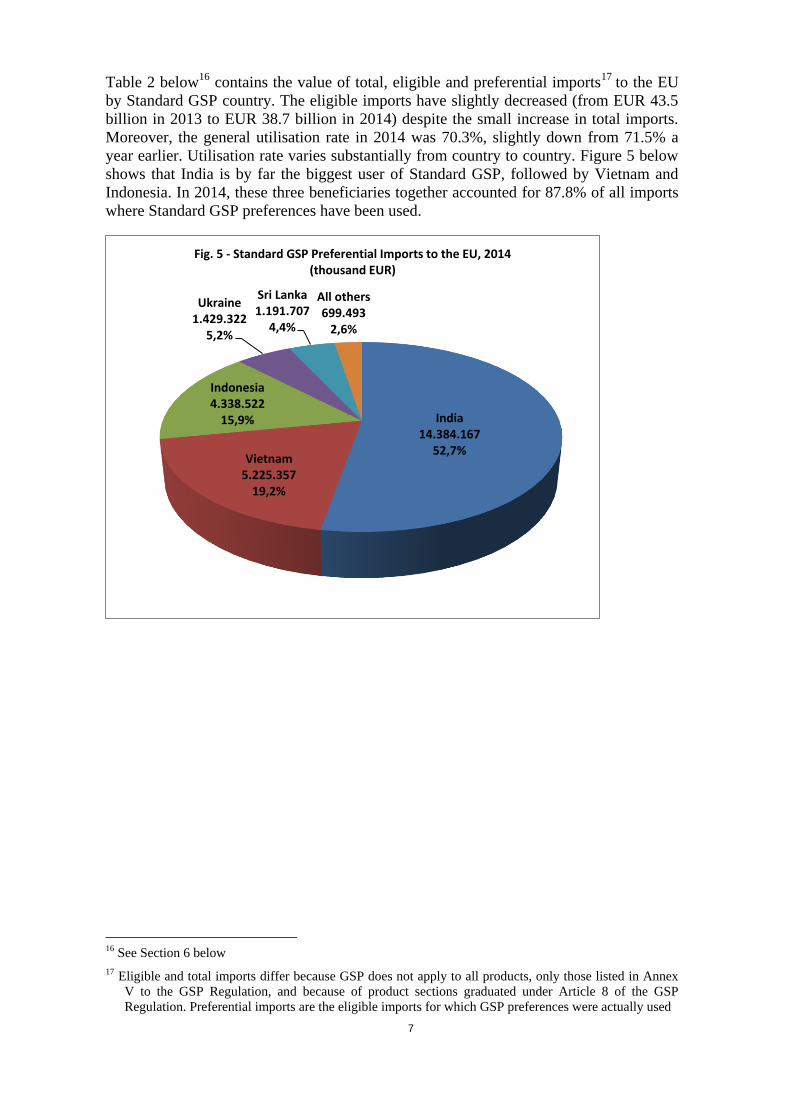
As Figures 3 and 4 below show, the exit of China had a major impact on the scope of the
scheme. Both the product graduation thresholds in Annex VI13
and the vulnerability
threshold in Annex VII14
were changed as a result.
7 Commission Delegated Regulation (EU) No 154/2013 of 18 December 2012 (OJ L 48 21.2.2013, p.1)
8 Commission Delegated Regulation (EU) No 1421/2013 of 30 October 2013 (OJ L 355, 31.12.2013, p. 1)
9 Idem as 8
10 Commission Delegated Regulation (EU) No 1015/2014 of 22 July 2014 (OJ L 283, 27.9.2014, p.20)
11 Commission Delegated Regulation (EU) No 1016/2014 of 22 July 2014 (OJ L 283, 27.9.2014, p.23)
12 *until 31 December 2015, Commission Delegated Regulation (EU) No 1015/2014; ** until 31 December
2016, Commission Delegated Regulation (EU) 2015/1979 (OJ L 289/3, 5.11.2015, p.3)
13 The product graduation thresholds in Annex VI to the GSP Regulation were changed by Commission
Delegated Regulation (EU) 2015/1978 of 28 August 2015 (OJ L 289/1, 5.11.2015, p.1)
14 The vulnerability threshold in Annex VII to the GSP Regulation used to assess the integration of
applicant countries was increased from 2% to 6.5% by Commission Delegated Regulation (EU)
2015/602 of 9 February 2015 (OJ L 100/8, 17.4.2015, p.8)
6
Once every three years, the list of product sections originating in a Standard GSP country
that becomes too competitive (and for which therefore preferences are suspended) is
reviewed15
. The next list will apply from 1 January 2017.
15 The current list of graduated product sections is set in Commission Implementing Regulation (EU) No
1213/2012 of 17 December 2012 (OJ L 348, 18.12.2012, p.11)
China 300.666.716
58,3% India
36.830.085 7,1%
Nigeria 28.119.516
5,5% Vietnam
22.119.300 4,3%
Indonesia 14.320.421
2,8%
Ukraine 13.170.064
2,6%
Bangladesh 12.328.706
2,4%
Iraq 11.553.071
2,2% All others
76.440.979 14,8%
Fig. 3 - Total imports (inlcuding non-GSP imports) to the EU from all GSP beneficiaries, 2014 (including China) (thousand EUR)
India 36.830.085
17,1% Nigeria
28.119.516 13,1%
Vietnam 22.119.300
10,3% Indonesia 14.320.421
6,7%
Ukraine 13.170.064
6,1%
Bangladesh 12.328.706
5,7%
Iraq 11.553.071
5,4%
Angola 9.386.861
4,4%
Colombia 7.912.146
3,7%
Philippines 5,717,364
2.7%
Pakistan 5,492,705
2.6%
Peru 4,766,616.
2.2% All others
43.165.286 20,1%
Fig. 4 - Total imports (including non-GSP imports) to the EU from all GSP beneficiaries, 2014 (excluding China) (thousand EUR)
7
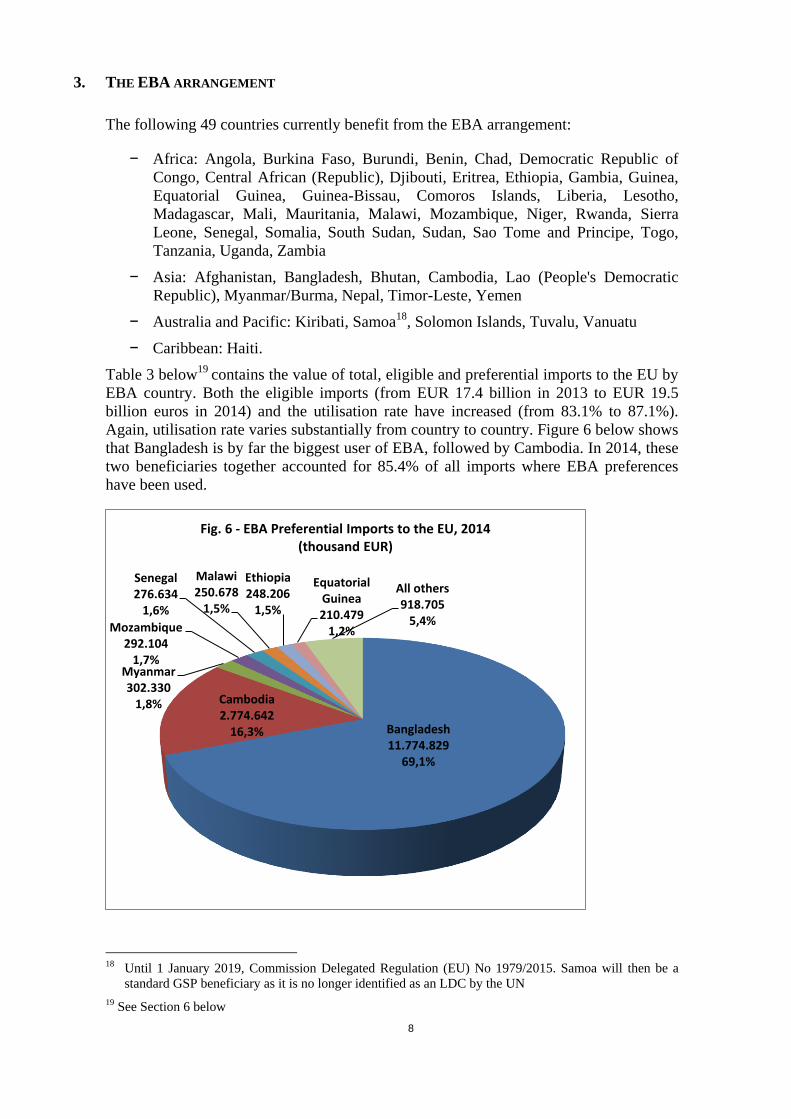
Table 2 below16
contains the value of total, eligible and preferential imports17
to the EU
by Standard GSP country. The eligible imports have slightly decreased (from EUR 43.5
billion in 2013 to EUR 38.7 billion in 2014) despite the small increase in total imports.
Moreover, the general utilisation rate in 2014 was 70.3%, slightly down from 71.5% a
year earlier. Utilisation rate varies substantially from country to country. Figure 5 below
shows that India is by far the biggest user of Standard GSP, followed by Vietnam and
Indonesia. In 2014, these three beneficiaries together accounted for 87.8% of all imports
where Standard GSP preferences have been used.
16 See Section 6 below
17 Eligible and total imports differ because GSP does not apply to all products, only those listed in Annex
V to the GSP Regulation, and because of product sections graduated under Article 8 of the GSP
Regulation. Preferential imports are the eligible imports for which GSP preferences were actually used
India 14.384.167
52,7% Vietnam
5.225.357 19,2%
Indonesia 4.338.522
15,9%
Ukraine 1.429.322
5,2%
Sri Lanka 1.191.707
4,4%
All others 699.493
2,6%
Fig. 5 - Standard GSP Preferential Imports to the EU, 2014 (thousand EUR)
8
3. THE EBA ARRANGEMENT
The following 49 countries currently benefit from the EBA arrangement:
− Africa: Angola, Burkina Faso, Burundi, Benin, Chad, Democratic Republic of
Congo, Central African (Republic), Djibouti, Eritrea, Ethiopia, Gambia, Guinea,
Equatorial Guinea, Guinea-Bissau, Comoros Islands, Liberia, Lesotho,
Madagascar, Mali, Mauritania, Malawi, Mozambique, Niger, Rwanda, Sierra
Leone, Senegal, Somalia, South Sudan, Sudan, Sao Tome and Principe, Togo,
Tanzania, Uganda, Zambia
− Asia: Afghanistan, Bangladesh, Bhutan, Cambodia, Lao (People's Democratic
Republic), Myanmar/Burma, Nepal, Timor-Leste, Yemen
− Australia and Pacific: Kiribati, Samoa18
, Solomon Islands, Tuvalu, Vanuatu
− Caribbean: Haiti.
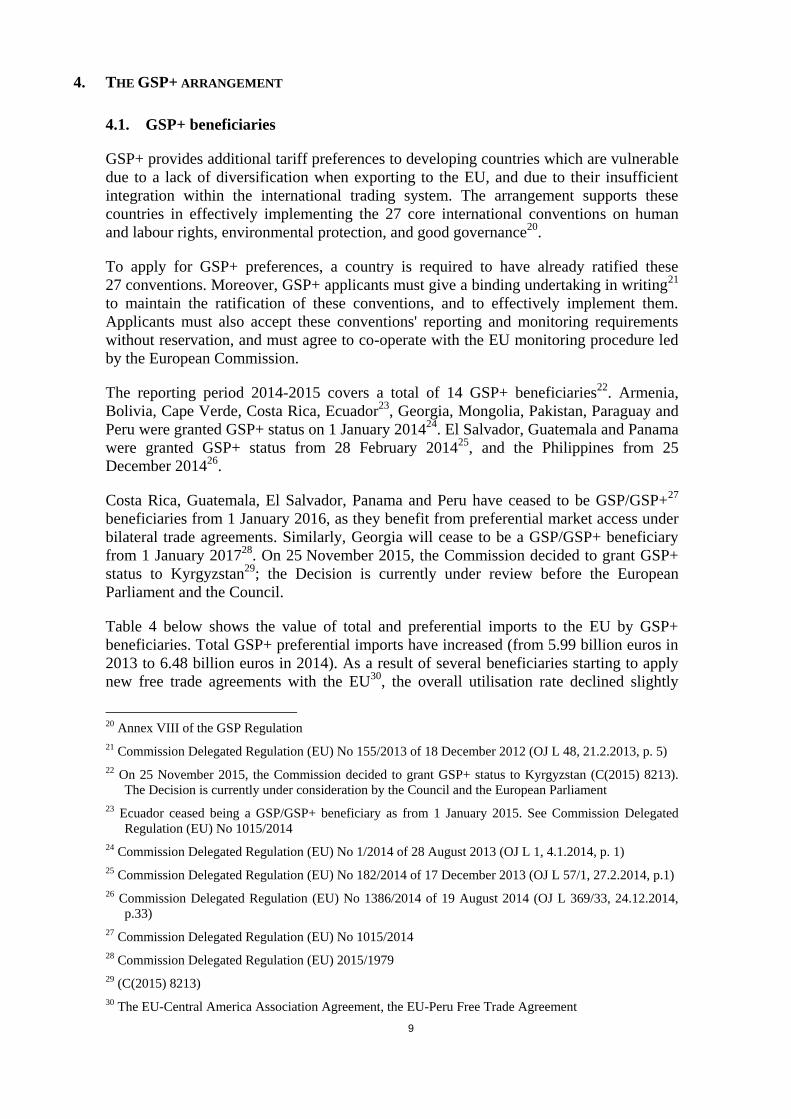
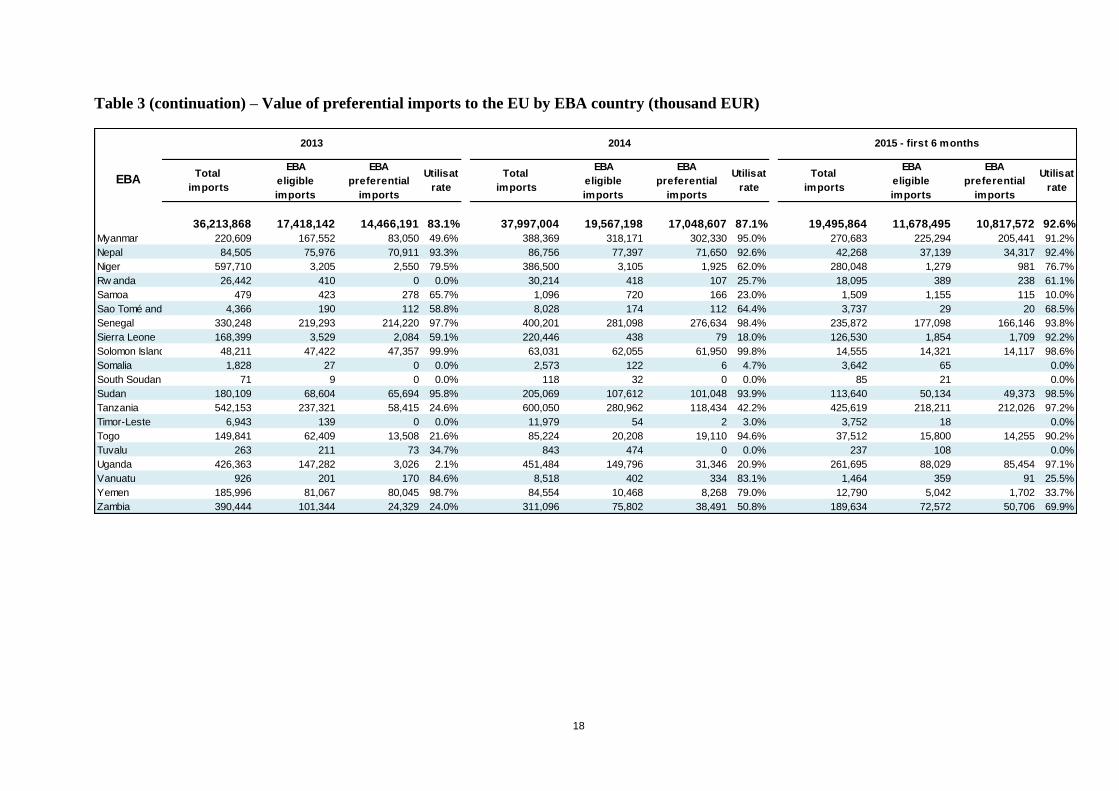
Table 3 below19
contains the value of total, eligible and preferential imports to the EU by
EBA country. Both the eligible imports (from EUR 17.4 billion in 2013 to EUR 19.5
billion euros in 2014) and the utilisation rate have increased (from 83.1% to 87.1%).
Again, utilisation rate varies substantially from country to country. Figure 6 below shows
that Bangladesh is by far the biggest user of EBA, followed by Cambodia. In 2014, these
two beneficiaries together accounted for 85.4% of all imports where EBA preferences
have been used.
18 Until 1 January 2019, Commission Delegated Regulation (EU) No 1979/2015. Samoa will then be a
standard GSP beneficiary as it is no longer identified as an LDC by the UN
19 See Section 6 below
Bangladesh 11.774.829
69,1%
Cambodia 2.774.642
16,3%
Myanmar 302.330
1,8%
Mozambique 292.104
1,7%
Senegal 276.634
1,6%
Malawi 250.678
1,5%
Ethiopia 248.206
1,5%
Equatorial Guinea 210.479
1,2%
All others 918.705
5,4%
Fig. 6 - EBA Preferential Imports to the EU, 2014 (thousand EUR)
9
4. THE GSP+ ARRANGEMENT
4.1. GSP+ beneficiaries
GSP+ provides additional tariff preferences to developing countries which are vulnerable
due to a lack of diversification when exporting to the EU, and due to their insufficient
integration within the international trading system. The arrangement supports these
countries in effectively implementing the 27 core international conventions on human
and labour rights, environmental protection, and good governance20
.
To apply for GSP+ preferences, a country is required to have already ratified these
27 conventions. Moreover, GSP+ applicants must give a binding undertaking in writing21
to maintain the ratification of these conventions, and to effectively implement them.
Applicants must also accept these conventions' reporting and monitoring requirements
without reservation, and must agree to co-operate with the EU monitoring procedure led
by the European Commission.
The reporting period 2014-2015 covers a total of 14 GSP+ beneficiaries22
. Armenia,
Bolivia, Cape Verde, Costa Rica, Ecuador23
, Georgia, Mongolia, Pakistan, Paraguay and
Peru were granted GSP+ status on 1 January 201424
. El Salvador, Guatemala and Panama
were granted GSP+ status from 28 February 201425
, and the Philippines from 25
December 201426
.
Costa Rica, Guatemala, El Salvador, Panama and Peru have ceased to be GSP/GSP+27
beneficiaries from 1 January 2016, as they benefit from preferential market access under
bilateral trade agreements. Similarly, Georgia will cease to be a GSP/GSP+ beneficiary
from 1 January 201728
. On 25 November 2015, the Commission decided to grant GSP+
status to Kyrgyzstan29
; the Decision is currently under review before the European
Parliament and the Council.
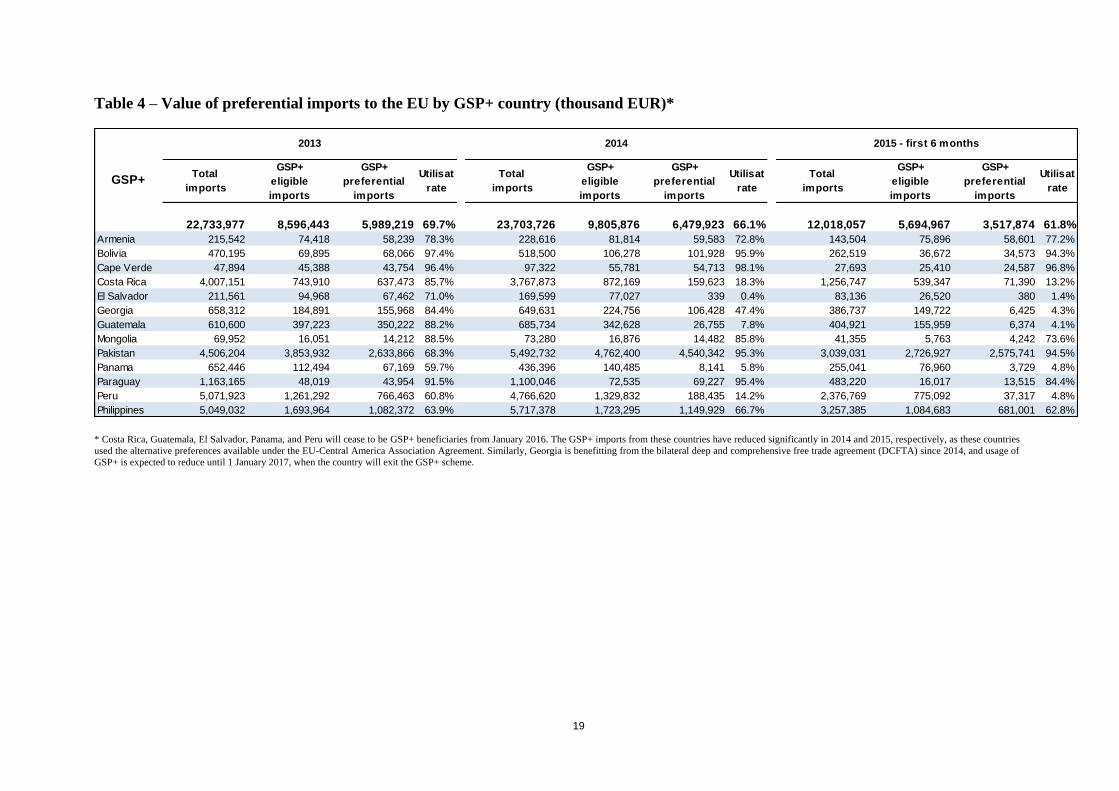
Table 4 below shows the value of total and preferential imports to the EU by GSP+
beneficiaries. Total GSP+ preferential imports have increased (from 5.99 billion euros in
2013 to 6.48 billion euros in 2014). As a result of several beneficiaries starting to apply
new free trade agreements with the EU30
, the overall utilisation rate declined slightly
20 Annex VIII of the GSP Regulation
21 Commission Delegated Regulation (EU) No 155/2013 of 18 December 2012 (OJ L 48, 21.2.2013, p. 5)
22 On 25 November 2015, the Commission decided to grant GSP+ status to Kyrgyzstan (C(2015) 8213).
The Decision is currently under consideration by the Council and the European Parliament
23 Ecuador ceased being a GSP/GSP+ beneficiary as from 1 January 2015. See Commission Delegated
Regulation (EU) No 1015/2014
24 Commission Delegated Regulation (EU) No 1/2014 of 28 August 2013 (OJ L 1, 4.1.2014, p. 1)
25 Commission Delegated Regulation (EU) No 182/2014 of 17 December 2013 (OJ L 57/1, 27.2.2014, p.1)
26 Commission Delegated Regulation (EU) No 1386/2014 of 19 August 2014 (OJ L 369/33, 24.12.2014,
p.33)
27 Commission Delegated Regulation (EU) No 1015/2014
28 Commission Delegated Regulation (EU) 2015/1979
29 (C(2015) 8213)
30 The EU-Central America Association Agreement, the EU-Peru Free Trade Agreement
10
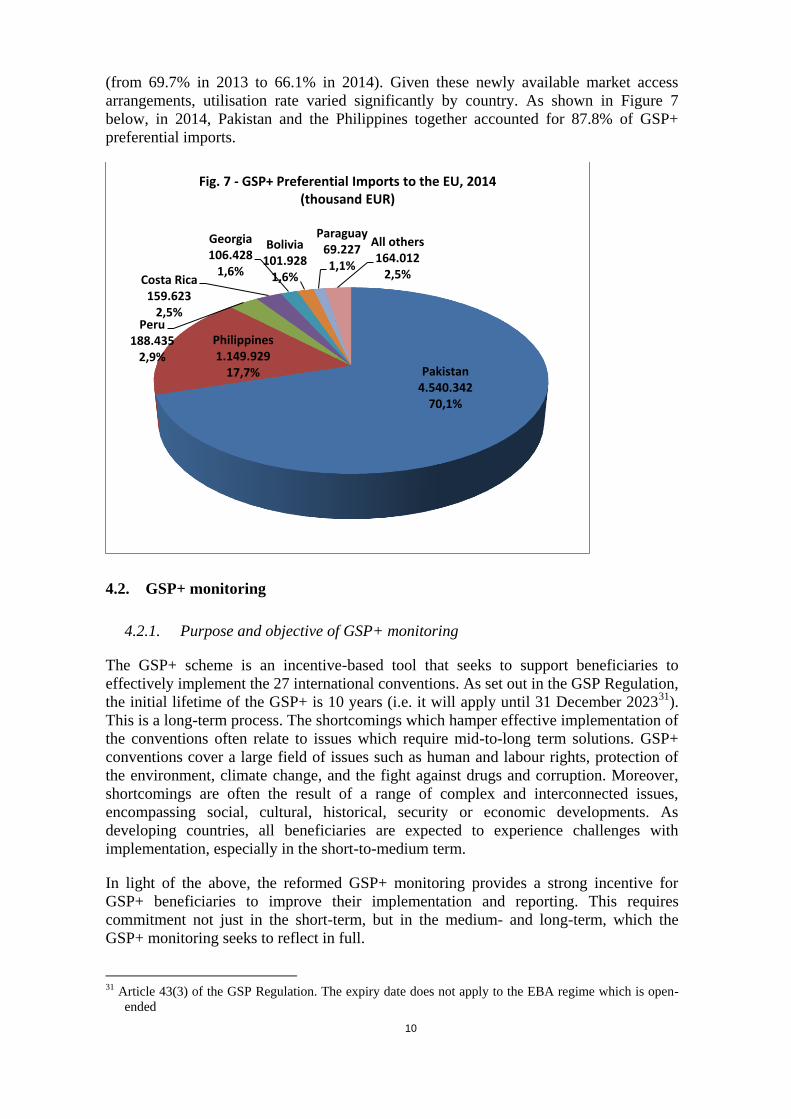
(from 69.7% in 2013 to 66.1% in 2014). Given these newly available market access
arrangements, utilisation rate varied significantly by country. As shown in Figure 7
below, in 2014, Pakistan and the Philippines together accounted for 87.8% of GSP+
preferential imports.
4.2. GSP+ monitoring
4.2.1. Purpose and objective of GSP+ monitoring
The GSP+ scheme is an incentive-based tool that seeks to support beneficiaries to
effectively implement the 27 international conventions. As set out in the GSP Regulation,
the initial lifetime of the GSP+ is 10 years (i.e. it will apply until 31 December 202331
).
This is a long-term process. The shortcomings which hamper effective implementation of
the conventions often relate to issues which require mid-to-long term solutions. GSP+
conventions cover a large field of issues such as human and labour rights, protection of
the environment, climate change, and the fight against drugs and corruption. Moreover,
shortcomings are often the result of a range of complex and interconnected issues,
encompassing social, cultural, historical, security or economic developments. As
developing countries, all beneficiaries are expected to experience challenges with
implementation, especially in the short-to-medium term.
In light of the above, the reformed GSP+ monitoring provides a strong incentive for
GSP+ beneficiaries to improve their implementation and reporting. This requires
commitment not just in the short-term, but in the medium- and long-term, which the
GSP+ monitoring seeks to reflect in full.
31 Article 43(3) of the GSP Regulation. The expiry date does not apply to the EBA regime which is open-
ended
Pakistan 4.540.342
70,1%
Philippines 1.149.929
17,7%
Peru 188.435
2,9%
Costa Rica 159.623
2,5%
Georgia 106.428
1,6%
Bolivia 101.928
1,6%
Paraguay 69.227 1,1%
All others 164.012
2,5%
Fig. 7 - GSP+ Preferential Imports to the EU, 2014 (thousand EUR)
11
4.2.2. Promoting international standards
GSP+ fits the EU's commitment to upholding and strengthening the implementation of
international law, as enshrined in the Treaty on European Union. It seeks to ensure that
beneficiaries fulfil their commitments arising from their ratification of international
conventions. The GSP+ scheme does not require beneficiaries to adopt or implement EU
standards – rather, beneficiaries are required to meet obligations they have already agreed
to under these international conventions.
The Commission therefore aims to increasingly engage with the relevant international
organisations (e.g. International Labour Organisation ('ILO') and the United Nations
('UN')) to ensure that GSP+ monitoring and evaluation by the EU continuously takes into
account their views and experiences. Close contact with international organisations' local
offices in the beneficiary countries is important.
This engagement is especially important given the long reporting cycle of many of the
conventions listed in Annex VIII of the GSP+ Regulation. For example, UN reports are
issued every 4-5 years, which is a longer interval than the two-year GSP+ reporting
cycle. Active engagement with the relevant international organisations is therefore
particularly beneficial between reporting cycles.
Furthermore, the expertise of these organisations can be very useful for cooperation
projects in beneficiary countries. The Commission and the ILO are currently launching a
GSP+ pilot project on capacity-building in Pakistan, Mongolia, Guatemala and El
Salvador. The Commission will continue to work closely with international organisations
over the lifetime of the GSP+, including through specific projects.
Lastly, the GSP+ enables the EU to constructively discuss beneficiaries' commitments to
these conventions within the relevant international organisations, such as the ILO
Tripartite Committee on the Application of Standards or the ILO Governing Body.
4.2.3. The GSP+ monitoring process
The GSP Regulation requires enhanced EU monitoring of GSP+ beneficiaries'
compliance with their commitments. Together with the European External Action
Service ('EEAS'), the Commission services have therefore set up a structured monitoring
process: an ongoing 'GSP+ dialogue' with the beneficiary authorities, formalised through
annual lists of issues ('scorecards').
As a beneficiary enters the GSP+, the Commission compiles an initial assessment of the
beneficiary's compliance with its GSP+ commitments (the first formal scorecard). This
formal scorecard notes the salient shortcomings identified by the international
conventions' monitoring bodies. This begins the ongoing GSP+ dialogue, during which
the Commission draws the beneficiary's attention to the areas listed in the scorecard.
Whenever possible, the dialogue makes use of existing political and institutional links
between the EU and beneficiaries32
. The list of issues is updated annually, and
32 Due to the differing goals pursued under each of the 27 conventions, GSP+ cuts across a number of areas
which traditionally fall outside trade policy such as human rights, development, labour, environment etc.
These policy areas fall within the competence of different Commission services and the EEAS. As a
result, GSP+ issues have been raised in existing bilateral dialogues with beneficiaries under different
formats such as, for example, trade dialogues, human rights dialogues, Joint Commissions etc.
12
beneficiaries are expected to demonstrate serious efforts towards tackling the identified
problems.
In line with the GSP Regulation, the GSP+ monitoring process takes into account the
views from a wide range of sources beyond the international conventions' monitoring
bodies, including civil society, social partners, the European Parliament and the Council.
A wide range of stakeholders are also involved in the beneficiary countries – not just the
central government, but local or regional authorities, civil society (e.g. social partners,
non-governmental organisations), business associations, and local offices of international
organisations.
As part of its monitoring, the Commission may participate in local workshops, or field
visits to industries. Reaching out to local stakeholders, particularly during GSP+
monitoring visits, is important not only to gather first-hand information, but also to
improve understanding of how the GSP+ works, and of the EU's expectations of
beneficiaries. This helps local stakeholders to play a constructive role in assisting local,
regional and central authorities to meet their commitments under the conventions. In
particular, as direct beneficiaries of tariff preferences, economic operators are expected to
play a key role in supporting implementation of the conventions.
During this first reporting period, interaction with civil society in beneficiary countries
has been very positive. Civil society has generally expressed strong support for the
participation of their country in the GSP+ scheme. On several occasions, it has
specifically welcomed GSP+ monitoring, and the enhanced possibility it offers to raise
key human and labour rights issues with authorities. The Commission will therefore
continue engagement with local stakeholders during monitoring, and seek to expand it
where possible.
4.2.4. Assistance and development projects
International monitoring body reports – the key source for the scorecards – identify not
only shortcomings and elements of progress, but also the constraints which may impede
or prevent a beneficiary from implementing a convention. This is important, as a number
of these constraints may not be within the control or direct sphere of influence of public
authorities, which may explain some of the shortcomings. While it is clear that a state has
the responsibility to fully meet its international commitments, Commission monitoring
should take into account factors such as lack of resources, poverty, natural disasters, or
lack of control over certain areas in situations of armed conflict. In 2015, the
Commission has launched joint projects with the ILO to support GSP+ countries
administrative capacity to effectively implement and report on the fundamental ILO
conventions. Over the next reporting period, the Commission will continue to consider
ways of supporting beneficiaries to address such constraints through expertise, technical
assistance and specific projects on capacity-building.
4.2.5. Beneficiaries' internal organisation on GSP+
The way beneficiaries organised themselves to address the issues covered by the GSP+
conventions provided a first indication of political commitment to the GSP+ process. The
conventions often span the competences of different government departments and
agencies, which may have varying levels of resources and leverage.
13
Beneficiaries must therefore coordinate at both the central and local government level.
Some beneficiaries opted to set up specific GSP+ task forces led by high-level officials
(e.g. Pakistan), while others preferred to coordinate on an ad hoc basis under the
Ministry of Trade or Foreign Affairs (e.g. Philippines, Guatemala). It is anticipated that
over time this coordination will become more efficient. GSP+ monitoring visits by the
Commission, with the help of EU Delegations, have proven to be beneficial in this
respect33
. Beneficiaries' coordination efforts on the GSP+ and the relevant conventions
are an important and necessary tool for improving implementation on the ground. The
Commission will therefore continue to pay close attention to coordination.
4.2.6. Conclusions on first GSP+ monitoring period (2014-2015)
As outlined above, monitoring begins upon each beneficiary's entry to the GSP+ scheme.
An overview of shortcomings for each of the GSP+ conventions, as presented by the
international monitoring bodies, sets the baseline for the on-going monitoring of each
beneficiary. Beneficiaries are expected to demonstrate serious efforts in improving
implementation of the 27 core conventions and in addressing those shortcomings.
Monitoring covers all aspects of the implementation of the 27 conventions, including
discussions on capacity constraints or on progress. Furthermore, GSP+ monitoring takes
into account the pre-existing legal and administrative framework in beneficiary countries,
as part of the baseline.
The first monitoring period was a learning process for all beneficiaries, and for the
Commission. Nevertheless, all beneficiaries have shown strong commitment to the GSP+
process, both in terms of political will and in introducing institutional and legislative
reforms. In particular, beneficiaries have demonstrated a genuine level of engagement
with the Commission by responding in time to the annual scorecard documents, by
allowing specific GSP+ monitoring visits, and by setting up specific GSP+ governance
structures. Moreover, all beneficiaries have taken steps – albeit sometimes incremental –
towards improving implementation of their commitments under the GSP+ conventions
on the ground, including by submitting several overdue country reports.
The attached Staff Working Document provides a comprehensive assessment of
individual beneficiaries including positive developments and domestic constraints, which
may limit beneficiaries' ability to achieve effective implementation. An assessment is
made for each convention individually, with an overall assessment per convention cluster
(human rights, labour rights, environment, good governance). At this stage, given the
diverse nature of the 27 GSP+ core conventions and the short timeframe of the first
reporting period (18 months), it was not considered appropriate or realistic to quantify
progress beyond obvious benchmarks (e.g. timely submission of national reports). Trying
to attach a standardised, quantifiable value to beneficiaries’ performance could be
misleading and, to some extent, arbitrary.
Monitoring tools will, however, continue to be refined. In particular, over the next
reporting period it will be important that beneficiaries take ownership of the process and
are more proactive in addressing the issues in the scorecards. The Commission will pay
more attention to beneficiaries' own priorities for action, their timelines for addressing
shortcomings, and to the resources made available for implementation. In this respect,
33 It can also contribute to strengthen involvement and position of line ministries and agencies, such as
labour and environment
14
the Commission will enhance its engagement with beneficiaries, with a view to
identifying priorities for action.
Indeed, here lies the main rationale of the reformed GSP+. After ensuring full
compliance with the entry criteria, the GSP+ accompanies beneficiaries with trade
incentives, through a progressive improvement of their implementation of the relevant
conventions. GSP+ beneficiaries are, therefore, expected to continuously improve their
track record. Nonetheless the individual circumstances and constraints of beneficiaries
will be taken into account. In this respect, the GSP Regulation provides that if a
beneficiary does not respect its binding undertaking, preferences may be temporarily
withdrawn34
.
Over the next reporting period (2016-2017), the Commission will continue to monitor
beneficiaries in a structured way. By the next review, it will consider response actions, if
required, including the possibility to open an investigation should a beneficiary fail to
comply with its GSP+ undertaking.
4.2.7. Accompanying this Report: Staff Working Document on the GSP+
The GSP Regulation requires that this report takes a particular focus on the functioning
of the GSP+. This report is therefore accompanied by a Staff Working Document
('SWD') on The EU Special Incentive Arrangement for Sustainable Development and
Good Governance ('GSP+') covering the period 2014 – 2015, which has been jointly
prepared by the Commission services and the European External Action Service
('EEAS').
The SWD provides greater detail on the functioning of the GSP+ since the GSP
Regulation 978/2012 came into force on 1 January 2014. The SWD also includes a
detailed assessment of individual GSP+ beneficiaries under the GSP+ conventions and
reports on the utilisation of the GSP+ among the beneficiary countries.
5. FUTURE COMMISSION REPORTS
The GSP Regulation requires the Commission to submit a report to the European
Parliament and to the Council on the application of the GSP Regulation five years after
the entry into force of the GSP Regulation, i.e. by November 2017. This will reflect on
the whole GSP scheme over the five-year period, from 2012 to 2017. It will take into
account the implications of the scheme for the development, trade and financial needs of
its beneficiaries. The Commission will also assess the need to review the scheme,
including the GSP+ and temporary withdrawal provisions of tariff preferences, where
appropriate accompanied by a legislative proposal. Furthermore, the report will also
include a detailed analysis of the impact of the GSP Regulation on trade and on the EU’s
tariff income, with particular attention to the effects on beneficiary countries. Lastly, this
report, published by November 2017, will also cover specific developments during the
second GSP+ reporting cycle (2016-2017).
34 Article 15 of the GSP Regulation
15
6. TABLES WITH STATISTICAL INFORMATION COVERING COUNTRIES BENEFITING FROM GSP ON 1 DECEMBER 2015
Table 1 – Value of preferential imports for all GSP countries (thousand EUR)
Total
imports
GSP
eligible
imports
GSP
preferential
imports
Utilisat
rate
Total
imports
GSP
eligible
imports
GSP
preferential
imports
Utilisat
rate
Total
imports
GSP
eligible
imports
GSP
preferential
imports
Utilisat
rate
Standard GSP 152,702,551 43,496,032 31,084,841 71.5% 153,181,034 38,776,162 27,268,569 70.3% 75,696,892 23,706,789 15,537,599 65.5%
GSP+ 22,733,977 8,596,443 5,989,219 69.7% 23,703,726 9,805,876 6,479,923 66.1% 12,018,057 5,694,967 3,517,874 61.8%
EBA 36,213,868 17,418,142 14,466,191 83.1% 37,997,004 19,567,198 17,048,607 87.1% 19,495,864 11,678,495 10,817,572 92.6%
All GSP 211,650,396 69,510,618 51,540,251 74.1% 214,881,764 68,149,235 50,797,100 74.5% 107,210,814 41,080,251 29,873,045 72.7%
2013 2014 2015 - first 6 months
16
Table 2 – Value of preferential imports to the EU by Standard GSP country (thousand EUR)
Total
imports
GSP
eligible
imports
GSP
preferential
imports
Utilisat
rate
Total
imports
GSP
eligible
imports
GSP
preferential
imports
Utilisat
rate
Total
imports
GSP
eligible
imports
GSP
preferential
imports
Utilisat
rate
152,702,551 43,496,032 31,084,841 71.5% 153,181,034 38,776,162 27,268,569 70.3% 75,696,892 23,706,789 15,537,599 65.5%Botsw ana 3,441,195 162 0 0.0% 1,822,600 29 0 0.0% 902,849 92 0.0%
Cameroon 2,368,669 137,803 774 0.6% 2,148,930 32,279 39 0.1% 786,640 73,434 14,174 19.3%
Colombia 7,387,566 573,453 514,911 89.8% 7,912,148 637,555 87,818 13.8% 3,458,487 291,255 7,390 2.5%
Congo 1,373,839 67,974 48,158 70.8% 1,530,574 83,210 67,257 80.8% 881,509 25,702 22,719 88.4%
Cook Islands 2,290 146 0 0.0% 1,497 94 61 64.6% 2,801 25 0.0%
Côte d'Ivoire 3,285,353 994,163 3,340 0.3% 3,243,973 319,442 366 0.1% 1,787,465 504,408 1,694 0.3%
Fiji 82,501 3,488 213 6.1% 97,810 1,302 3 0.2% 33,093 2,592 336 13.0%
Ghana 3,336,336 488,885 3,573 0.7% 2,846,769 149,717 127 0.1% 1,028,990 245,089 398 0.2%
Honduras 726,892 233,986 176,470 75.4% 839,946 328,012 28,704 8.8% 637,493 167,225 123 0.1%
India 36,436,340 22,298,124 18,589,577 83.4% 36,830,322 16,138,352 14,384,167 89.1% 20,274,674 9,822,973 8,536,404 86.9%
Indonesia 14,180,212 6,585,035 4,823,287 73.2% 14,320,389 6,085,385 4,338,522 71.3% 7,546,272 3,534,020 2,391,814 67.7%
Iraq 10,618,992 3,621 48 1.3% 11,553,071 6,005 146 2.4% 5,441,869 2,965 453 15.3%
Kenya 1,132,251 727,248 7,083 1.0% 1,164,317 190,850 129,187 67.7% 671,933 433,650 12,005 2.8%
Kyrgyzstan 77,344 4,100 1,098 26.8% 78,103 11,942 8,233 68.9% 26,831 4,467 2,225 49.8%
Marshall Ils 92,501 837 0 0.0% 310,368 389 0 0.0% 116,384 294 0.0%
Micronesia 230 224 204 90.9% 351 141 127 89.9% 299 288 52 17.9%
Namibia 940,257 326,416 60 0.0% 961,846 62,903 1 0.0% 545,632 163,725 143 0.1%
Nauru 238 152 0 0.0% 464 28 0 0.0% 422 155 0.0%
Nicaragua 280,704 122,356 56,806 46.4% 282,693 139,610 1,133 0.8% 141,273 46,592 598 1.3%
Nigeria 28,595,038 493,253 407,795 82.7% 28,119,517 206,224 135,312 65.6% 9,608,384 49,635 29,244 58.9%
Niue 6 0 0 n/a 127 108 0 0.0% 25 3 0.0%
Sri Lanka 2,314,528 1,846,658 1,096,511 59.4% 2,481,090 2,026,297 1,191,707 58.8% 1,294,586 1,084,020 580,766 53.6%
Sw aziland 224,479 17,017 852 5.0% 150,754 4,845 46 1.0% 68,729 7,486 98 1.3%
Syria 124,505 46,055 8,309 18.0% 86,696 24,618 3,436 14.0% 45,203 6,970 1,020 14.6%
Tajikistan 83,054 14,748 11,709 79.4% 60,862 14,893 10,571 71.0% 31,081 7,276 6,129 84.2%
Tonga 174 33 15 45.6% 906 71 54 75.7% 243 37 23 61.7%
Turkmenistan 863,617 163,361 156,397 95.7% 813,797 241,678 167,123 69.2% 182,236 28,433 23,221 81.7%
Ukraine 13,295,383 2,972,454 2,159,286 72.6% 13,169,401 2,970,122 1,429,322 48.1% 5,931,364 1,697,150 686,931 40.5%
Uzbekistan 245,779 86,441 73,476 85.0% 232,590 74,959 59,748 79.7% 111,423 35,871 26,688 74.4%
Vietnam 21,192,278 5,287,839 2,944,889 55.7% 22,119,122 9,025,100 5,225,357 57.9% 14,138,701 5,470,952 3,192,950 58.4%
2013 2014 2015 - first 6 months
Standard
GSP
17
Table 3 – Value of preferential imports to the EU by EBA country (thousand EUR)*
* 'Total imports' covers all imports, including products which automatically benefit from most-favoured nation ('MFN') zero tariffs. 'EBA eligible imports' only references the products under the EBA scheme, which do not otherwise
benefit from MFN zero duty.
Total
imports
EBA
eligible
imports
EBA
preferential
imports
Utilisat
rate
Total
imports
EBA
eligible
imports
EBA
preferential
imports
Utilisat
rate
Total
imports
EBA
eligible
imports
EBA
preferential
imports
Utilisat
rate
36,213,868 17,418,142 14,466,191 83.1% 37,997,004 19,567,198 17,048,607 87.1% 19,495,864 11,678,495 10,817,572 92.6%
Afghanistan 47,675 7,423 3,083 41.5% 36,954 16,914 6,948 41.1% 12,599 2,777 1,902 68.5%
Angola 9,306,195 71,225 26,452 37.1% 9,386,862 47,967 20,937 43.6% 3,728,691 12,994 4,016 30.9%
Bangladesh 10,862,338 10,778,862 10,313,716 95.7% 12,328,757 12,224,848 11,774,829 96.3% 7,553,343 7,501,189 7,201,608 96.0%
Benin 16,669 3,245 2,584 79.6% 31,104 11,862 10,962 92.4% 13,212 4,432 1,981 44.7%
Bhutan 10,267 9,368 9,278 99.0% 14,940 14,660 14,331 97.7% 8,517 8,079 7,699 95.3%
Burkina Faso 45,020 8,092 6,911 85.4% 107,451 10,932 9,853 90.1% 26,413 5,674 4,750 83.7%
Burundi 31,633 685 0 0.0% 21,420 415 86 20.6% 20,704 232 200 86.3%
Cambodia 2,514,407 2,492,059 2,301,708 92.4% 3,026,422 2,996,898 2,774,642 92.6% 1,849,714 1,788,841 1,644,442 91.9%
Central African Republic 26,061 357 290 81.2% 6,302 180 157 87.5% 6,056 25 1 2.7%
Chad 50,388 230 54 23.5% 14,882 277 0 0.0% 32,992 229 0.0%
Comoros 13,444 8,686 226 2.6% 10,808 6,770 1,283 19.0% 5,101 2,759 2,617 94.9%
Congo Democratic Republic of1,095,287 14,524 12,929 89.0% 1,002,992 7,904 6,116 77.4% 295,899 4,870 2,770 56.9%
Djibouti 9,152 2,317 0 0.0% 10,221 3,767 62 1.6% 8,099 1,452 157 10.8%
Equatorial Guinea 4,029,109 375,025 335,590 89.5% 3,650,206 224,738 210,479 93.7% 1,029,831 21,250 16,199 76.2%
Eritrea 3,148 2,383 2,258 94.8% 9,732 2,506 2,337 93.2% 21,251 1,201 953 79.3%
Ethiopia 541,853 229,259 223,596 97.5% 571,312 252,473 248,206 98.3% 335,209 135,981 129,865 95.5%
Gambia 8,483 5,064 4,999 98.7% 17,707 9,253 8,556 92.5% 10,005 6,756 6,583 97.4%
Guinea 438,665 2,272 267 11.7% 454,330 1,613 654 40.5% 361,338 1,119 427 38.1%
Guinea-Bissau 1,473 121 8 6.6% 3,346 8 0 0.0% 880 284 0.0%
Haiti 28,033 15,964 432 2.7% 31,451 17,622 3,320 18.8% 19,281 10,173 8,965 88.1%
Kiribati 59 42 6 14.0% 53 32 25 76.8% 101 30 0.0%
Lao People's Democratic Republic252,500 193,309 190,010 98.3% 223,233 194,615 190,033 97.6% 117,033 89,649 85,488 95.4%
Lesotho 186,467 1,401 322 23.0% 247,383 1,471 484 32.9% 123,879 731 465 63.7%
Liberia 530,382 2,570 663 25.8% 366,390 3,829 423 11.1% 228,995 224 0.0%
Madagascar 736,262 554,975 19,412 3.5% 834,933 539,803 21,197 3.9% 416,318 240,712 1,711 0.7%
Malaw i 220,267 188,851 181,415 96.1% 296,049 266,569 250,678 94.0% 176,838 160,553 150,495 93.7%
Mali 41,591 3,891 2,357 60.6% 35,905 4,289 3,596 83.9% 24,496 2,050 1,513 73.8%
Mauritania 486,001 113,290 110,755 97.8% 548,518 172,242 164,319 95.4% 264,214 116,913 109,065 93.3%
Mozambique 1,315,133 1,116,038 51,048 4.6% 1,361,190 1,143,230 292,104 25.6% 761,489 648,403 597,013 92.1%
2013 2014 2015 - first 6 months
EBA
18
Table 3 (continuation) – Value of preferential imports to the EU by EBA country (thousand EUR)
Total
imports
EBA
eligible
imports
EBA
preferential
imports
Utilisat
rate
Total
imports
EBA
eligible
imports
EBA
preferential
imports
Utilisat
rate
Total
imports
EBA
eligible
imports
EBA
preferential
imports
Utilisat
rate
36,213,868 17,418,142 14,466,191 83.1% 37,997,004 19,567,198 17,048,607 87.1% 19,495,864 11,678,495 10,817,572 92.6%
Myanmar 220,609 167,552 83,050 49.6% 388,369 318,171 302,330 95.0% 270,683 225,294 205,441 91.2%
Nepal 84,505 75,976 70,911 93.3% 86,756 77,397 71,650 92.6% 42,268 37,139 34,317 92.4%
Niger 597,710 3,205 2,550 79.5% 386,500 3,105 1,925 62.0% 280,048 1,279 981 76.7%
Rw anda 26,442 410 0 0.0% 30,214 418 107 25.7% 18,095 389 238 61.1%
Samoa 479 423 278 65.7% 1,096 720 166 23.0% 1,509 1,155 115 10.0%
Sao Tomé and Principe 4,366 190 112 58.8% 8,028 174 112 64.4% 3,737 29 20 68.5%
Senegal 330,248 219,293 214,220 97.7% 400,201 281,098 276,634 98.4% 235,872 177,098 166,146 93.8%
Sierra Leone 168,399 3,529 2,084 59.1% 220,446 438 79 18.0% 126,530 1,854 1,709 92.2%
Solomon Islands 48,211 47,422 47,357 99.9% 63,031 62,055 61,950 99.8% 14,555 14,321 14,117 98.6%
Somalia 1,828 27 0 0.0% 2,573 122 6 4.7% 3,642 65 0.0%
South Soudan 71 9 0 0.0% 118 32 0 0.0% 85 21 0.0%
Sudan 180,109 68,604 65,694 95.8% 205,069 107,612 101,048 93.9% 113,640 50,134 49,373 98.5%
Tanzania 542,153 237,321 58,415 24.6% 600,050 280,962 118,434 42.2% 425,619 218,211 212,026 97.2%
Timor-Leste 6,943 139 0 0.0% 11,979 54 2 3.0% 3,752 18 0.0%
Togo 149,841 62,409 13,508 21.6% 85,224 20,208 19,110 94.6% 37,512 15,800 14,255 90.2%
Tuvalu 263 211 73 34.7% 843 474 0 0.0% 237 108 0.0%
Uganda 426,363 147,282 3,026 2.1% 451,484 149,796 31,346 20.9% 261,695 88,029 85,454 97.1%
Vanuatu 926 201 170 84.6% 8,518 402 334 83.1% 1,464 359 91 25.5%
Yemen 185,996 81,067 80,045 98.7% 84,554 10,468 8,268 79.0% 12,790 5,042 1,702 33.7%
Zambia 390,444 101,344 24,329 24.0% 311,096 75,802 38,491 50.8% 189,634 72,572 50,706 69.9%
2013 2014 2015 - first 6 months
EBA
19
Table 4 – Value of preferential imports to the EU by GSP+ country (thousand EUR)*
* Costa Rica, Guatemala, El Salvador, Panama, and Peru will cease to be GSP+ beneficiaries from January 2016. The GSP+ imports from these countries have reduced significantly in 2014 and 2015, respectively, as these countries
used the alternative preferences available under the EU-Central America Association Agreement. Similarly, Georgia is benefitting from the bilateral deep and comprehensive free trade agreement (DCFTA) since 2014, and usage of
GSP+ is expected to reduce until 1 January 2017, when the country will exit the GSP+ scheme.
Total
imports
GSP+
eligible
imports
GSP+
preferential
imports
Utilisat
rate
Total
imports
GSP+
eligible
imports
GSP+
preferential
imports
Utilisat
rate
Total
imports
GSP+
eligible
imports
GSP+
preferential
imports
Utilisat
rate
22,733,977 8,596,443 5,989,219 69.7% 23,703,726 9,805,876 6,479,923 66.1% 12,018,057 5,694,967 3,517,874 61.8%
Armenia 215,542 74,418 58,239 78.3% 228,616 81,814 59,583 72.8% 143,504 75,896 58,601 77.2%
Bolivia 470,195 69,895 68,066 97.4% 518,500 106,278 101,928 95.9% 262,519 36,672 34,573 94.3%
Cape Verde 47,894 45,388 43,754 96.4% 97,322 55,781 54,713 98.1% 27,693 25,410 24,587 96.8%
Costa Rica 4,007,151 743,910 637,473 85.7% 3,767,873 872,169 159,623 18.3% 1,256,747 539,347 71,390 13.2%
El Salvador 211,561 94,968 67,462 71.0% 169,599 77,027 339 0.4% 83,136 26,520 380 1.4%
Georgia 658,312 184,891 155,968 84.4% 649,631 224,756 106,428 47.4% 386,737 149,722 6,425 4.3%
Guatemala 610,600 397,223 350,222 88.2% 685,734 342,628 26,755 7.8% 404,921 155,959 6,374 4.1%
Mongolia 69,952 16,051 14,212 88.5% 73,280 16,876 14,482 85.8% 41,355 5,763 4,242 73.6%
Pakistan 4,506,204 3,853,932 2,633,866 68.3% 5,492,732 4,762,400 4,540,342 95.3% 3,039,031 2,726,927 2,575,741 94.5%
Panama 652,446 112,494 67,169 59.7% 436,396 140,485 8,141 5.8% 255,041 76,960 3,729 4.8%
Paraguay 1,163,165 48,019 43,954 91.5% 1,100,046 72,535 69,227 95.4% 483,220 16,017 13,515 84.4%
Peru 5,071,923 1,261,292 766,463 60.8% 4,766,620 1,329,832 188,435 14.2% 2,376,769 775,092 37,317 4.8%
Philippines 5,049,032 1,693,964 1,082,372 63.9% 5,717,378 1,723,295 1,149,929 66.7% 3,257,385 1,084,683 681,001 62.8%
2013 2014 2015 - first 6 months
GSP+