Embed Size (px)
Citation preview
Report on the
State of Financial Inclusion
in the Philippines
Inclusive Finance Advocacy Staff
Supervision and Examination Sector
State of Financial Inclusion in the Philippines | 2013 Data Updates
2
Background
As the Bangko Sentral ng Pilipinas (BSP) brings its financial inclusion agenda to new
heights, an increasing number of questions are being asked about the inclusiveness of the
Philippine financial system – from the most fundamental: “How many Filipinos have access
to formal financial services?”, “Is financial access translating into actual usage?” to the more
complex: “Are existing financial products relevant, of good quality and responsive to the
needs of financial consumers?”, “Does financial inclusion make a positive difference on the
lives of the Filipino people?”
There is indeed a need for data and evidence to effectively answer these questions.
This is the reason why the BSP continues to advance its initiative of building a
comprehensive and robust data framework that will allow it to monitor progress, identify
gaps, establish priorities and craft evidence-based financial inclusion policies.
The 2013 Report on the State of Financial Inclusion in the Philippines, the third since
the maiden release in 2011, forms part of the stocktaking process under this data initiative.
It builds on the data elements presented in the previous status reports and serves as an
inventory of the progress made from 2012 to 2013. While it cannot answer all the questions
raised above, it hopes to provide a broader understanding of where the Philippines is in
terms of expanding access and use of formal financial products and services. The scope of
this report is confined to supply-side information gathered from regulatory reports provided
by supervised institutions to the BSP. Work is underway for a national baseline survey that
will measure financial inclusion from the demand side and provide first-hand information on
the quality and welfare dimensions of financial inclusion.
The 2013 status report highlights the results so far in the BSP’s pioneering measures
to promote greater financial inclusion in the country. These include the expansion of the
physical reach of banks through the so-called micro-banking offices (MBOs), extended
virtual reach through electronic money (e-money) and wider range of affordable financial
products through microfinance. The report also features the financial inclusion indicators for
the Philippines, using the tools developed by the Alliance for Financial Inclusion (AFI) and
the G20 through its Global Partnership for Financial Inclusion (GPFI).
This report is structured as follows: Section I describes the financial access situation
by discussing the reach of banks and other access points. Section II tackles the use of
financial products and services, using available information on deposits, loans, microfinance
and e-money. Section III presents the key indicators of financial inclusion and analysis of the
link between access and usage. The last section concludes by summarizing the main
takeaways from the report.
State of Financial Inclusion in the Philippines | 2013 Data Updates
3
Highlights
Access
The Philippine banking system’s overall physical network continues to
expand. In 2013, there were 9,884 banking offices and 14,528
automated teller machines (ATMs) in the country. These numbers
translate to a year-on-year growth rate of 5% in the number of banking
offices and 19% in ATM count.
From 611 unbanked local government units or LGUs (i.e., cities and municipalities) in
2012, 8 more LGUs lost banking presence in 2013 but this was offset by 15 LGUs that
gained banking presence, resulting to a net count of 604 unbanked LGUs in 2013. In
11 out of 15 LGUs that became banked in 2013, the establishment of other banking
offices (OBOs) and micro-banking offices (MBOs) was the reason for the banking
presence.1
The number of operating MBOs went up by 26% to 465 in 2013 from
370 in 2012. MBOs are effectively serving the banking needs of poor
and low income clients, especially those who are living in the
countryside. The number of LGUs that do not have a regular bank
branch but are being served by MBOs increased to 56 LGUs in 2013
from 50 LGUs in 2012.
Other financial service providers (FSPs)2 remain important access points of financial
services especially in areas where banking presence is either lost or not yet
established. Data showed that other FSPs are present in LGUs that lost banking
presence in 2013. Also, 398 out of 604 unbanked LGUs have access to other FSPs.
This means that only 206 LGUs (equivalent to 13% of 1,634 LGUs and 4% of the total
Philippine population) are left unserved.
The number of e-money issuers (EMIs) continues to increase. A year
after the issuance of e-money rules and regulations in 2009, there
were 21 registered EMIs. Three years later, the number of EMIs
increased by 52% to 32 EMIs in 2013. The number of e-money agents
has experienced remarkable growth as well, with 10,620 active agents
in the span of 4 years.
1 BSP Circular 694 dated October 2010 set the provisions in the establishment of OBOs and MBOs. 2 Other FSPs include non-stock savings and loans associations (NSSLAs), credit cooperatives, pawnshops and
other nonbank financial institutions (NBFIs), remittance agents, money changers/ foreign exchange dealers
and electronic money (e-money) agents.
State of Financial Inclusion in the Philippines | 2013 Data Updates
4
Microfinance remains an integral component of increasing access to finance among
poor and low income households. While the number of banks with microfinance
operations slightly decreased to 182 banks in 2013 from 187 banks in 2012, it is
interesting to note that there is an increasing number of institutions that are offering
micro-deposit accounts (69 banks in 2013 from 58 banks in 2012) and with no
objection notice from the BSP to issue microinsurance (81 banks in 2013 from 72
banks in 2012).
Usage
The total number of deposit accounts in banks went up by 9%
to 45.4 million accounts in 2013 from 41.8 million accounts in
2012. In terms of amount, the total peso value of bank deposits
rose by 32% to P7.6 trillion in 2013 from P5.7 trillion in 2012.
While growth is driven by an increase in the higher brackets of deposit amounts, it is
worth mentioning that deposits from small savers also piled up. The number of
deposit accounts below P15,000 increased by 8% to 34.1 million in 2013 from 31.6
million in 2012, and these accounts comprised 75% of all deposit accounts in banks.
Deposits in non-bank financial institutions also increased, although at a slower pace.
The deposit liabilities of non-stock savings and loans associations or NSSLAs grew by
2% to P23.3 billion in 2013 from P22.9 billion in 2012.
The total loan portfolio of the banking system expanded by 27% to
P4.25 trillion in 2013 from P3.34 trillion in 2012. The microfinance loan
portfolio of banks with microfinance activities, on the other hand,
grew by 3% to P8.7 billion in 2013 from P8.4 billion in 2012.
The number of registered e-money accounts increased by 34% to
26.7 million accounts in 2013 from 19.9 million accounts in 2010. The
e-money accounts in 2013 was composed of 8 million mobile wallets
and 18.7 million cash cards. The number of e-money transactions has
also significantly grown over the years. From 138 million transactions
in 2010, the number of transactions that passed through e-money
jumped by 57% to 217 million transactions in 2013. In terms of
amount, the total value of e-money transactions rose by 58% to P348
billion3 in 2013 from P220.5 billion in 2010.
3 Average of P350 billion e-money inflows and P346 billion outflows.
State of Financial Inclusion in the Philippines | 2013 Data Updates
5
ACCESS
Number and Physical Reach of Banking Offices and ATMs
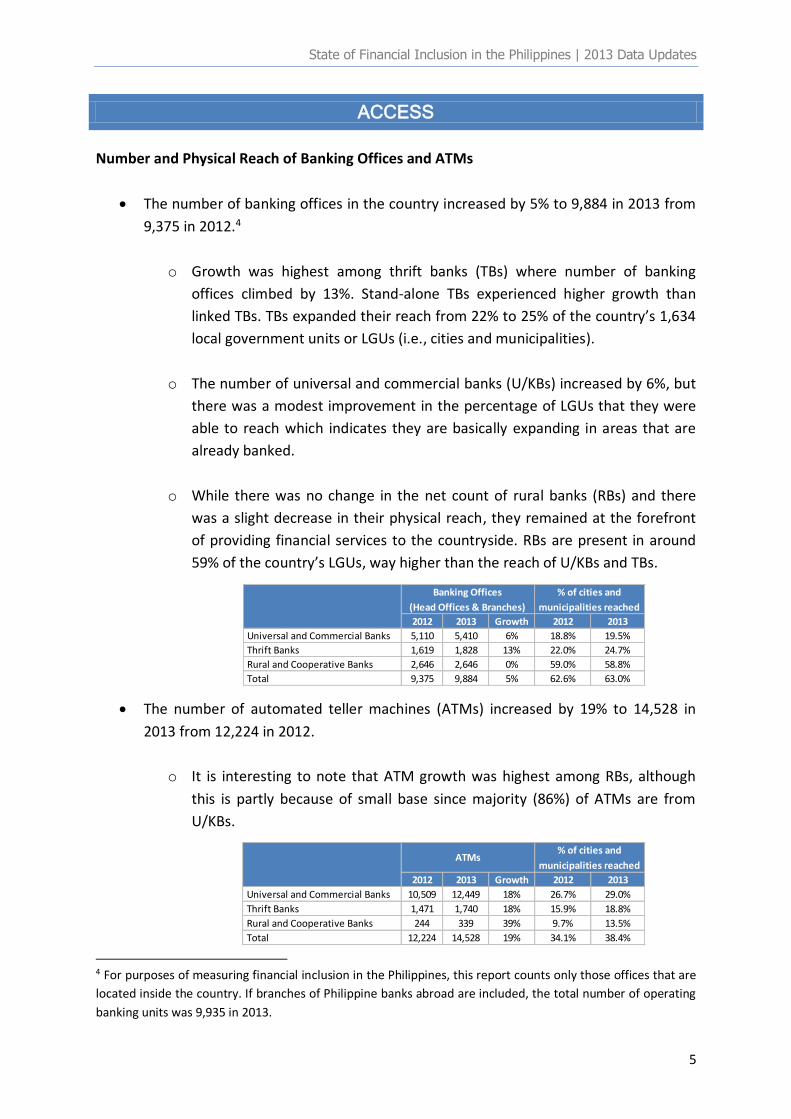
The number of banking offices in the country increased by 5% to 9,884 in 2013 from
9,375 in 2012.4
o Growth was highest among thrift banks (TBs) where number of banking
offices climbed by 13%. Stand-alone TBs experienced higher growth than
linked TBs. TBs expanded their reach from 22% to 25% of the country’s 1,634
local government units or LGUs (i.e., cities and municipalities).
o The number of universal and commercial banks (U/KBs) increased by 6%, but
there was a modest improvement in the percentage of LGUs that they were
able to reach which indicates they are basically expanding in areas that are
already banked.
o While there was no change in the net count of rural banks (RBs) and there
was a slight decrease in their physical reach, they remained at the forefront
of providing financial services to the countryside. RBs are present in around
59% of the country’s LGUs, way higher than the reach of U/KBs and TBs.
2012 2013 Growth 2012 2013
Universal and Commercial Banks 5,110 5,410 6% 18.8% 19.5%
Thrift Banks 1,619 1,828 13% 22.0% 24.7%
Rural and Cooperative Banks 2,646 2,646 0% 59.0% 58.8%
Total 9,375 9,884 5% 62.6% 63.0%
Banking Offices
(Head Offices & Branches)
% of cities and
municipalities reached
The number of automated teller machines (ATMs) increased by 19% to 14,528 in
2013 from 12,224 in 2012.
o It is interesting to note that ATM growth was highest among RBs, although
this is partly because of small base since majority (86%) of ATMs are from
U/KBs.
2012 2013 Growth 2012 2013
Universal and Commercial Banks 10,509 12,449 18% 26.7% 29.0%
Thrift Banks 1,471 1,740 18% 15.9% 18.8%
Rural and Cooperative Banks 244 339 39% 9.7% 13.5%
Total 12,224 14,528 19% 34.1% 38.4%
ATMs% of cities and
municipalities reached
4 For purposes of measuring financial inclusion in the Philippines, this report counts only those offices that are
located inside the country. If branches of Philippine banks abroad are included, the total number of operating
banking units was 9,935 in 2013.
State of Financial Inclusion in the Philippines | 2013 Data Updates
6
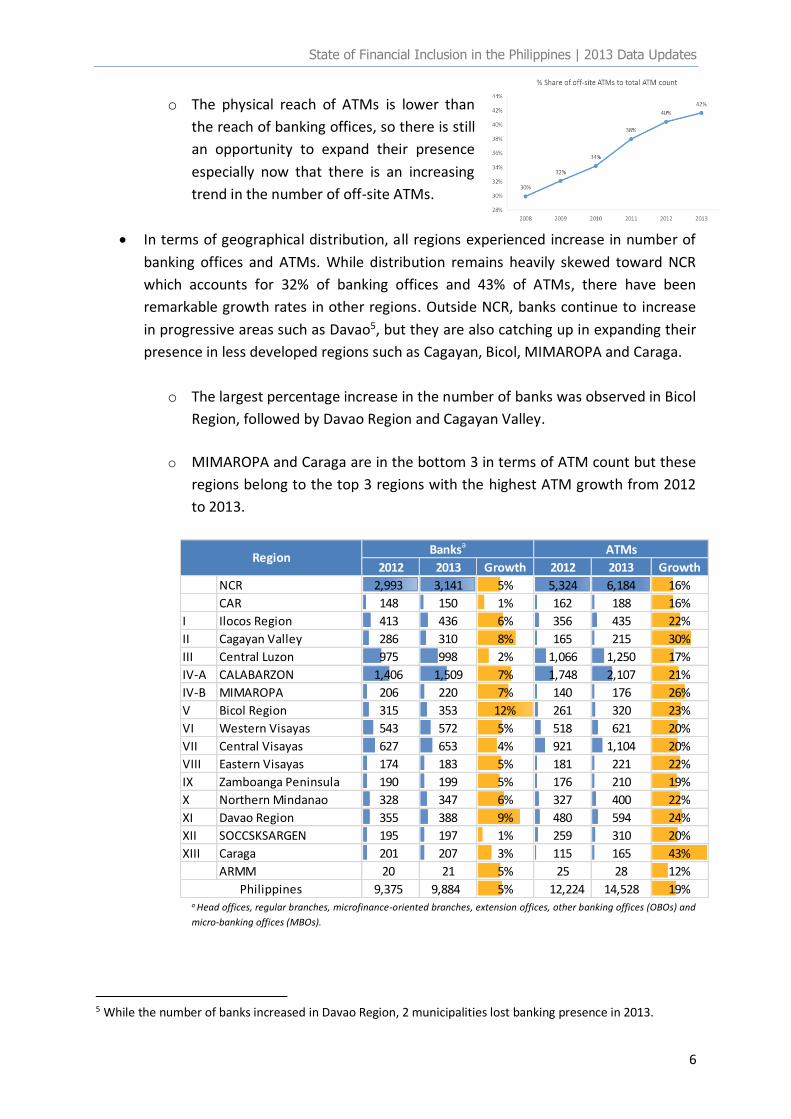
o The physical reach of ATMs is lower than
the reach of banking offices, so there is still
an opportunity to expand their presence
especially now that there is an increasing
trend in the number of off-site ATMs.
In terms of geographical distribution, all regions experienced increase in number of
banking offices and ATMs. While distribution remains heavily skewed toward NCR
which accounts for 32% of banking offices and 43% of ATMs, there have been
remarkable growth rates in other regions. Outside NCR, banks continue to increase
in progressive areas such as Davao5, but they are also catching up in expanding their
presence in less developed regions such as Cagayan, Bicol, MIMAROPA and Caraga.
o The largest percentage increase in the number of banks was observed in Bicol
Region, followed by Davao Region and Cagayan Valley.
o MIMAROPA and Caraga are in the bottom 3 in terms of ATM count but these
regions belong to the top 3 regions with the highest ATM growth from 2012
to 2013.
2012 2013 Growth 2012 2013 Growth
NCR 2,993 3,141 5% 5,324 6,184 16%
CAR 148 150 1% 162 188 16%
I Ilocos Region 413 436 6% 356 435 22%
II Cagayan Valley 286 310 8% 165 215 30%
III Central Luzon 975 998 2% 1,066 1,250 17%
IV-A CALABARZON 1,406 1,509 7% 1,748 2,107 21%
IV-B MIMAROPA 206 220 7% 140 176 26%
V Bicol Region 315 353 12% 261 320 23%
VI Western Visayas 543 572 5% 518 621 20%
VII Central Visayas 627 653 4% 921 1,104 20%
VIII Eastern Visayas 174 183 5% 181 221 22%
IX Zamboanga Peninsula 190 199 5% 176 210 19%
X Northern Mindanao 328 347 6% 327 400 22%
XI Davao Region 355 388 9% 480 594 24%
XII SOCCSKSARGEN 195 197 1% 259 310 20%
XIII Caraga 201 207 3% 115 165 43%
ARMM 20 21 5% 25 28 12%
9,375 9,884 5% 12,224 14,528 19%Philippines
RegionBanksa ATMs
a Head offices, regular branches, microfinance-oriented branches, extension offices, other banking offices (OBOs) and
micro-banking offices (MBOs).
5 While the number of banks increased in Davao Region, 2 municipalities lost banking presence in 2013.
State of Financial Inclusion in the Philippines | 2013 Data Updates
7
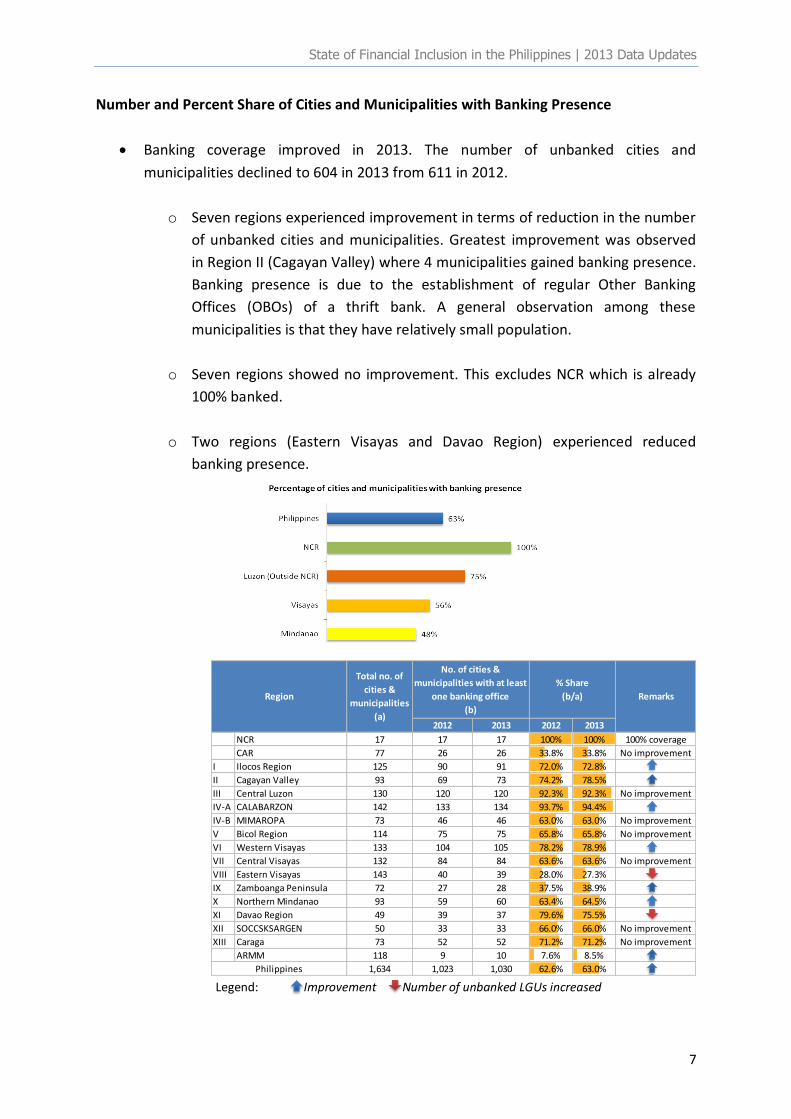
Number and Percent Share of Cities and Municipalities with Banking Presence
Banking coverage improved in 2013. The number of unbanked cities and
municipalities declined to 604 in 2013 from 611 in 2012.
o Seven regions experienced improvement in terms of reduction in the number
of unbanked cities and municipalities. Greatest improvement was observed
in Region II (Cagayan Valley) where 4 municipalities gained banking presence.
Banking presence is due to the establishment of regular Other Banking
Offices (OBOs) of a thrift bank. A general observation among these
municipalities is that they have relatively small population.
o Seven regions showed no improvement. This excludes NCR which is already
100% banked.
o Two regions (Eastern Visayas and Davao Region) experienced reduced
banking presence.
2012 2013 2012 2013
NCR 17 17 17 100% 100% 100% coverage
CAR 77 26 26 33.8% 33.8% No improvement
I Ilocos Region 125 90 91 72.0% 72.8%
II Cagayan Valley 93 69 73 74.2% 78.5%
III Central Luzon 130 120 120 92.3% 92.3% No improvement
IV-A CALABARZON 142 133 134 93.7% 94.4%
IV-B MIMAROPA 73 46 46 63.0% 63.0% No improvement
V Bicol Region 114 75 75 65.8% 65.8% No improvement
VI Western Visayas 133 104 105 78.2% 78.9%
VII Central Visayas 132 84 84 63.6% 63.6% No improvement
VIII Eastern Visayas 143 40 39 28.0% 27.3%
IX Zamboanga Peninsula 72 27 28 37.5% 38.9%
X Northern Mindanao 93 59 60 63.4% 64.5%
XI Davao Region 49 39 37 79.6% 75.5%
XII SOCCSKSARGEN 50 33 33 66.0% 66.0% No improvement
XIII Caraga 73 52 52 71.2% 71.2% No improvement
ARMM 118 9 10 7.6% 8.5%
1,634 1,023 1,030 62.6% 63.0%
Remarks
Philippines
Region
Total no. of
cities &
municipalities
(a)
No. of cities &
municipalities with at least
one banking office
(b)
% Share
(b/a)
Legend: Improvement Number of unbanked LGUs increased
State of Financial Inclusion in the Philippines | 2013 Data Updates
8
With Bank in 2012, Unbanked in 2013
Eight municipalities lost banking presence in 2013 due to closure of 4 head offices
and 4 branches that were operating in these municipalities.6 These closed banking
offices did not seem to pose a considerable threat to financial access because in 7
out of 8 municipalities that went unbanked, there are alternative providers of
financial services.
NSSLAsCredit
Coops
MF
NGOsPawnshops
Other
NBFIs
Remittance
Agents,
Money
Changers/
FX Dealers
E-money
agentsATMs
Bicol Region Catanduanes Bato 0 3 2 0 0 0 0 0 5
Bicol Region Camarines Sur Gainza 0 0 0 0 0 0 0 0 0
Bicol Region Masbate Mandaon 0 0 0 3 0 1 5 0 9
Eastern Visayas Northern Samar Catubig 0 1 1 3 0 0 3 0 8
Northern Mindanao Misamis Oriental Kinogitan 0 1 0 0 0 0 0 0 1
Davao Region Davao Del Norte Braulio Dujali 0 0 0 0 0 0 2 0 2
Davao Region Davao Del Sur Hagonoy 0 1 1 0 0 0 0 2 4
Caraga Surigao Del Norte Malimono 0 1 0 0 0 0 1 0 2
Payments and Remittance
Total
Other Financial Service Providers (FSPs)
Region Province Municipality
Savings & CreditCredit & Other
Services
Unbanked in 2012, With Bank in 2013
Banking presence was established in 15 municipalities that used to be unbanked. 7 In
6 of these municipalities, the establishment of MBO is the reason for the banking
presence. In 5 municipalities, OBOs were established. Since these municipalities
were previously unbanked, this may suggest that banks are testing these markets by
offering non-transactional banking related services through OBOs or by setting up
simple banking offices through MBOs.
Region Province MunicipalityReason for banking
presence
Ilocos Region La Union San Juan Regular branch
Cagayan Valley Cagayan Baggao Regular OBO
Cagayan Valley Isabela Divilican Regular OBO
Cagayan Valley Isabela Maconacon Regular OBO
Cagayan Valley Isabela Palanan Regular OBO
CALABARZON Quezon General Nakar MBO
Bicol Region Camarines Sur Balatan MBO
Bicol Region Camarines Sur Bula MBO
Bicol Region Camarines Sur Caramoan Regular branch
Western Visayas Antique Caluya Extension office
Zamboanga Peninsula Zamboanga del Norte Siayan MBO
Northern Mindanao Misamis Occidental Sinacaban Extension office
Northern Mindanao Misamis Oriental Claveria MBO
Caraga Agusan del Norte Remedios T. Romualdez Regular OBO
ARMM Maguindanao Upi MBO
6 These municipalities have small population (average is 26,000) although poverty incidence is relatively high
(average is 42.5%). In the Philippines, the average population per LGU is around 56,500 (based from 2010 NSO
census) while national poverty incidence is 24.9% (based from June 2013 data from NSCB). 7 These 15 municipalities that gained banking presence in 2013 have an average population of 33,000 and
poverty incidence of 38.8%.
State of Financial Inclusion in the Philippines | 2013 Data Updates
9
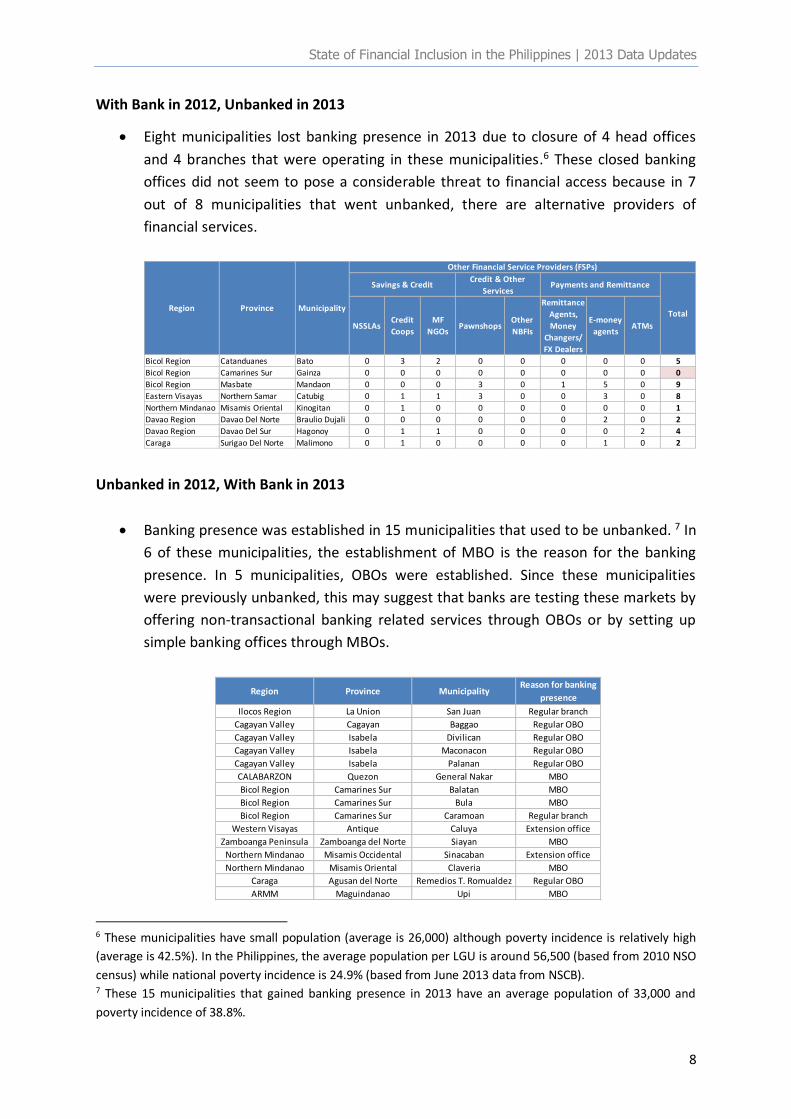
Expanded Physical Reach of Banks
Through Micro-Banking Offices (MBOs)
MBOs continue to increase in number and outreach. The number of operating MBOs
went up by 26% to 465 in 2013 from 370 in 2012. The number of LGUs that do not
have a regular bank branch but are being served by MBOs increased to 56 LGUs in
2013 from 50 LGUs in 2012.
An analysis of LGUs that are served by MBOs alone showed that all of them are
classified as municipalities with majority belonging to the lower tier in terms of
income. A particular microfinance-oriented bank dominates the rollout of MBOs in
the areas that are situated in Luzon and Visayas while rural banks with strong
fundamentals are the ones that set up MBOs in the southern region.
For LGUs that already have regular bank branches but also have MBOs, it was
observed that most of them do not have U/KBs and TBs but have at least 2 RBs.
BSP Circular 694 (dated 14 October 2010)
enables banks to establish presence in areas
where it may not be immediately
economically feasible to set up a full blown
bank branch by allowing a simple branch
called a micro-banking office (MBO). With
MBOs, areas that are unserved or
underserved will have access to a wide range
of financial services ranging from credit,
savings, remittances, foreign exchange, e-
money conversion, bills payment and
government pay-out benefits.
Masbate
Agusan
del Sur
Provinces such as Masbate and
Agusan del Sur are benefitting
from increased access to
banking services through MBOs.
State of Financial Inclusion in the Philippines | 2013 Data Updates
10
Other Financial Service Providers (FSPs)
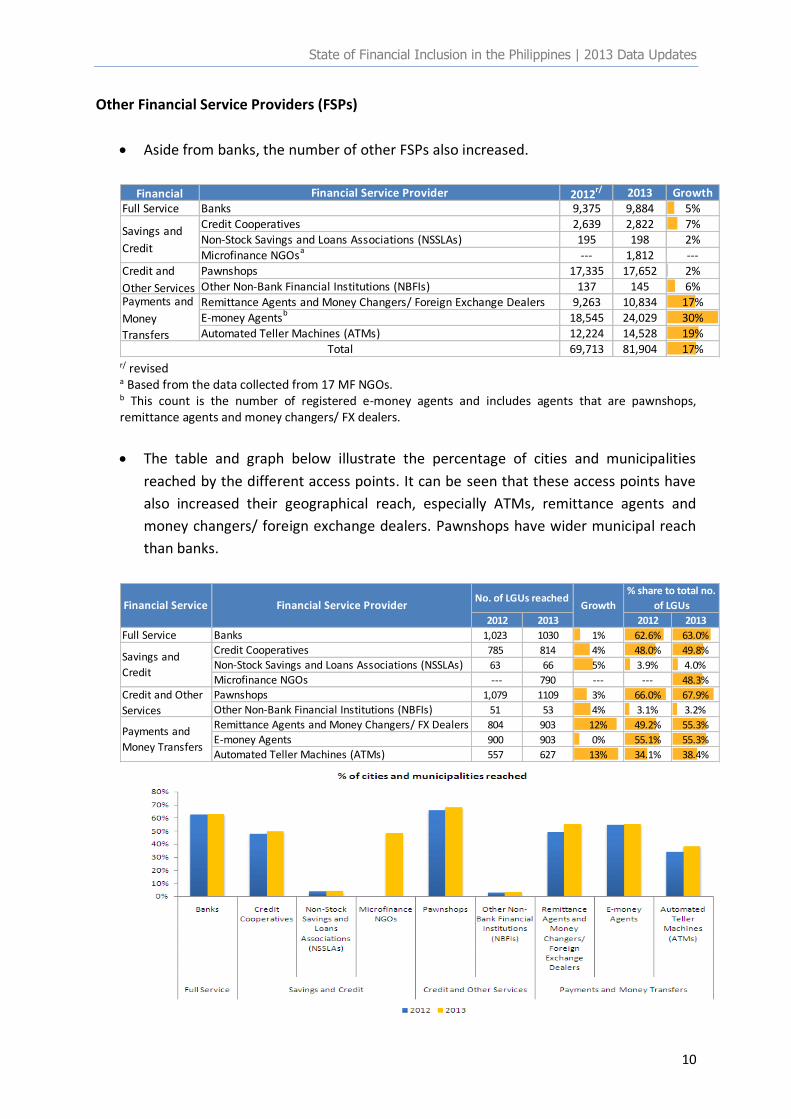
Aside from banks, the number of other FSPs also increased.
Financial Financial Service Provider 2012r/ 2013 Growth
Full Service Banks 9,375 9,884 5%
Credit Cooperatives 2,639 2,822 7%Non-Stock Savings and Loans Associations (NSSLAs) 195 198 2%
Microfinance NGOsa --- 1,812 ---
Pawnshops 17,335 17,652 2%
Other Non-Bank Financial Institutions (NBFIs) 137 145 6%Remittance Agents and Money Changers/ Foreign Exchange Dealers 9,263 10,834 17%
E-money Agentsb 18,545 24,029 30%
Automated Teller Machines (ATMs) 12,224 14,528 19%
69,713 81,904 17%
Credit and
Other ServicesPayments and
Money
TransfersTotal
Savings and
Credit
r/ revised a Based from the data collected from 17 MF NGOs. b This count is the number of registered e-money agents and includes agents that are pawnshops, remittance agents and money changers/ FX dealers.
The table and graph below illustrate the percentage of cities and municipalities
reached by the different access points. It can be seen that these access points have
also increased their geographical reach, especially ATMs, remittance agents and
money changers/ foreign exchange dealers. Pawnshops have wider municipal reach
than banks.
2012 2013 2012 2013
Full Service Banks 1,023 1030 1% 62.6% 63.0%
Credit Cooperatives 785 814 4% 48.0% 49.8%
Non-Stock Savings and Loans Associations (NSSLAs) 63 66 5% 3.9% 4.0%
Microfinance NGOs --- 790 --- --- 48.3%
Pawnshops 1,079 1109 3% 66.0% 67.9%
Other Non-Bank Financial Institutions (NBFIs) 51 53 4% 3.1% 3.2%
Remittance Agents and Money Changers/ FX Dealers 804 903 12% 49.2% 55.3%
E-money Agents 900 903 0% 55.1% 55.3%
Automated Teller Machines (ATMs) 557 627 13% 34.1% 38.4%
Credit and Other
Services
Payments and
Money Transfers
Savings and
Credit
No. of LGUs reachedFinancial Service ProviderFinancial Service
% share to total no.
of LGUsGrowth
State of Financial Inclusion in the Philippines | 2013 Data Updates
11
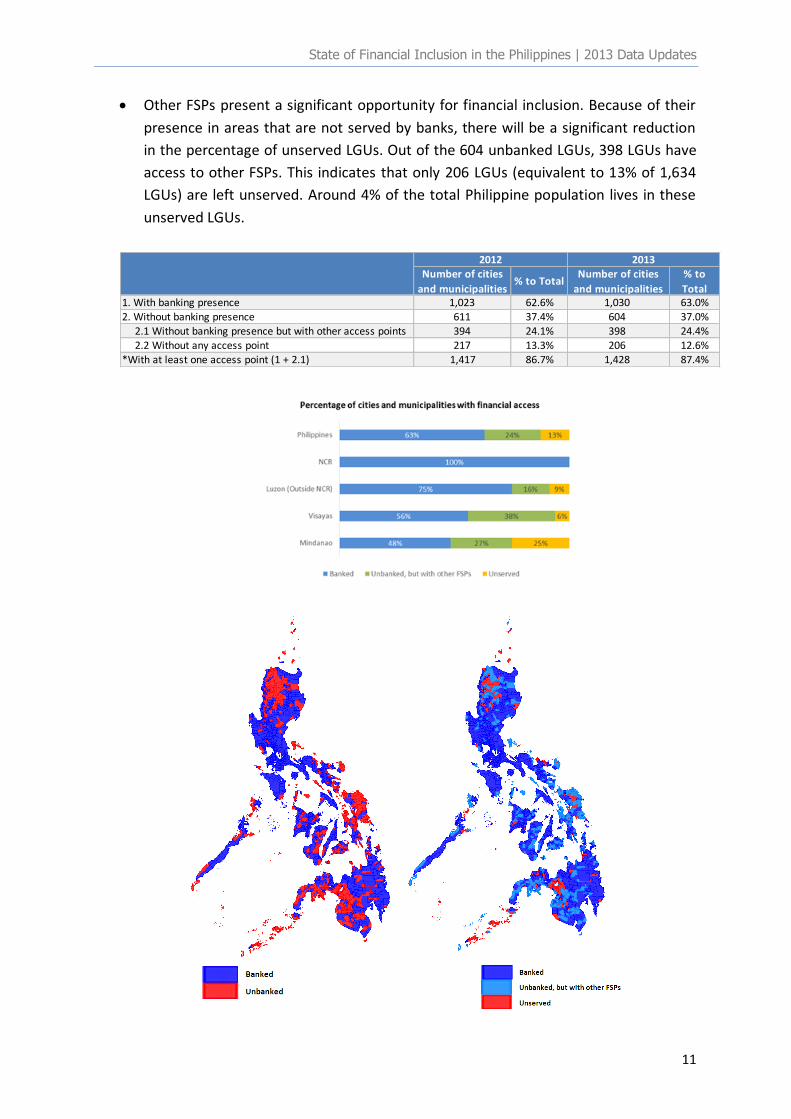
Other FSPs present a significant opportunity for financial inclusion. Because of their
presence in areas that are not served by banks, there will be a significant reduction
in the percentage of unserved LGUs. Out of the 604 unbanked LGUs, 398 LGUs have
access to other FSPs. This indicates that only 206 LGUs (equivalent to 13% of 1,634
LGUs) are left unserved. Around 4% of the total Philippine population lives in these
unserved LGUs.
1. With banking presence 1,023 62.6% 1,030 63.0%
2. Without banking presence 611 37.4% 604 37.0%
2.1 Without banking presence but with other access points 394 24.1% 398 24.4%2.2 Without any access point 217 13.3% 206 12.6%
*With at least one access point (1 + 2.1) 1,417 86.7% 1,428 87.4%
2012 2013
Number of cities
and municipalities% to Total
% to
Total
Number of cities
and municipalities
State of Financial Inclusion in the Philippines | 2013 Data Updates
12
With e-money agents
Without e-money agents
Extended Virtual Reach of Financial Services
Through E-Money and Mobile Banking
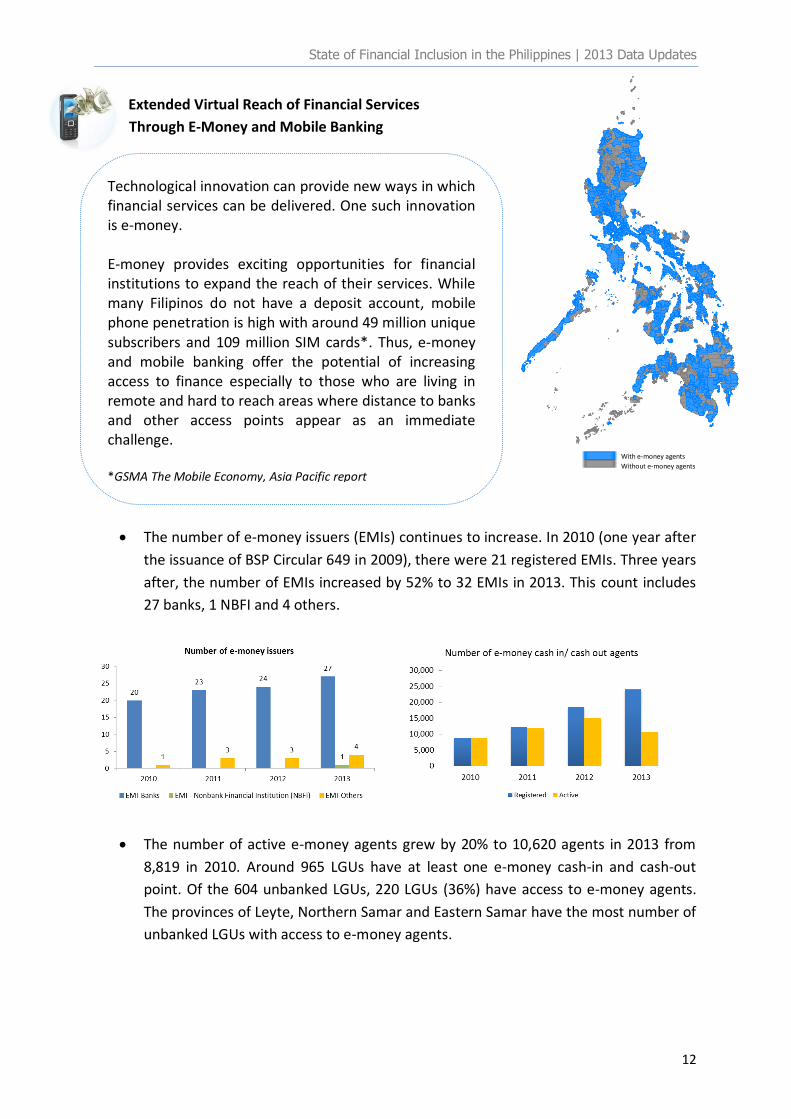
The number of e-money issuers (EMIs) continues to increase. In 2010 (one year after
the issuance of BSP Circular 649 in 2009), there were 21 registered EMIs. Three years
after, the number of EMIs increased by 52% to 32 EMIs in 2013. This count includes
27 banks, 1 NBFI and 4 others.
The number of active e-money agents grew by 20% to 10,620 agents in 2013 from
8,819 in 2010. Around 965 LGUs have at least one e-money cash-in and cash-out
point. Of the 604 unbanked LGUs, 220 LGUs (36%) have access to e-money agents.
The provinces of Leyte, Northern Samar and Eastern Samar have the most number of
unbanked LGUs with access to e-money agents.
Technological innovation can provide new ways in which financial services can be delivered. One such innovation is e-money. E-money provides exciting opportunities for financial institutions to expand the reach of their services. While many Filipinos do not have a deposit account, mobile phone penetration is high with around 49 million unique subscribers and 109 million SIM cards*. Thus, e-money and mobile banking offer the potential of increasing access to finance especially to those who are living in remote and hard to reach areas where distance to banks and other access points appear as an immediate challenge. *GSMA The Mobile Economy, Asia Pacific report
State of Financial Inclusion in the Philippines | 2013 Data Updates
13
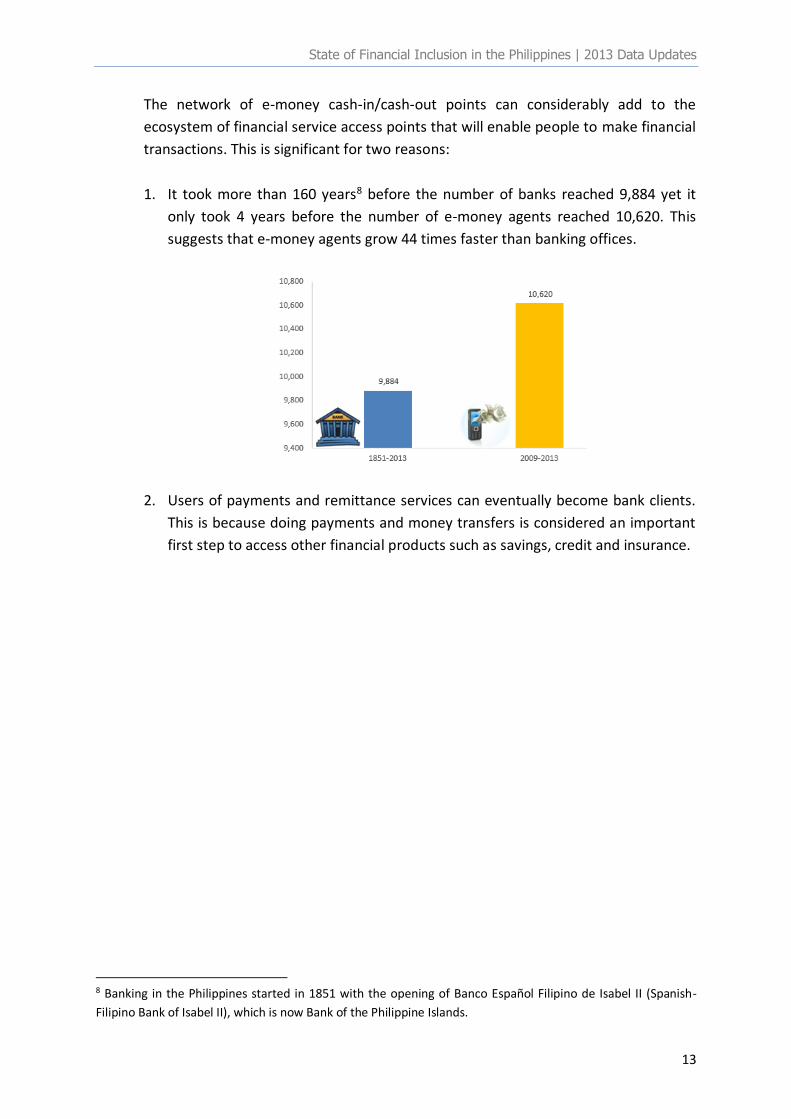
The network of e-money cash-in/cash-out points can considerably add to the
ecosystem of financial service access points that will enable people to make financial
transactions. This is significant for two reasons:
1. It took more than 160 years8 before the number of banks reached 9,884 yet it
only took 4 years before the number of e-money agents reached 10,620. This
suggests that e-money agents grow 44 times faster than banking offices.
2. Users of payments and remittance services can eventually become bank clients.
This is because doing payments and money transfers is considered an important
first step to access other financial products such as savings, credit and insurance.
8 Banking in the Philippines started in 1851 with the opening of Banco Español Filipino de Isabel II (Spanish-
Filipino Bank of Isabel II), which is now Bank of the Philippine Islands.
State of Financial Inclusion in the Philippines | 2013 Data Updates
14
USAGE
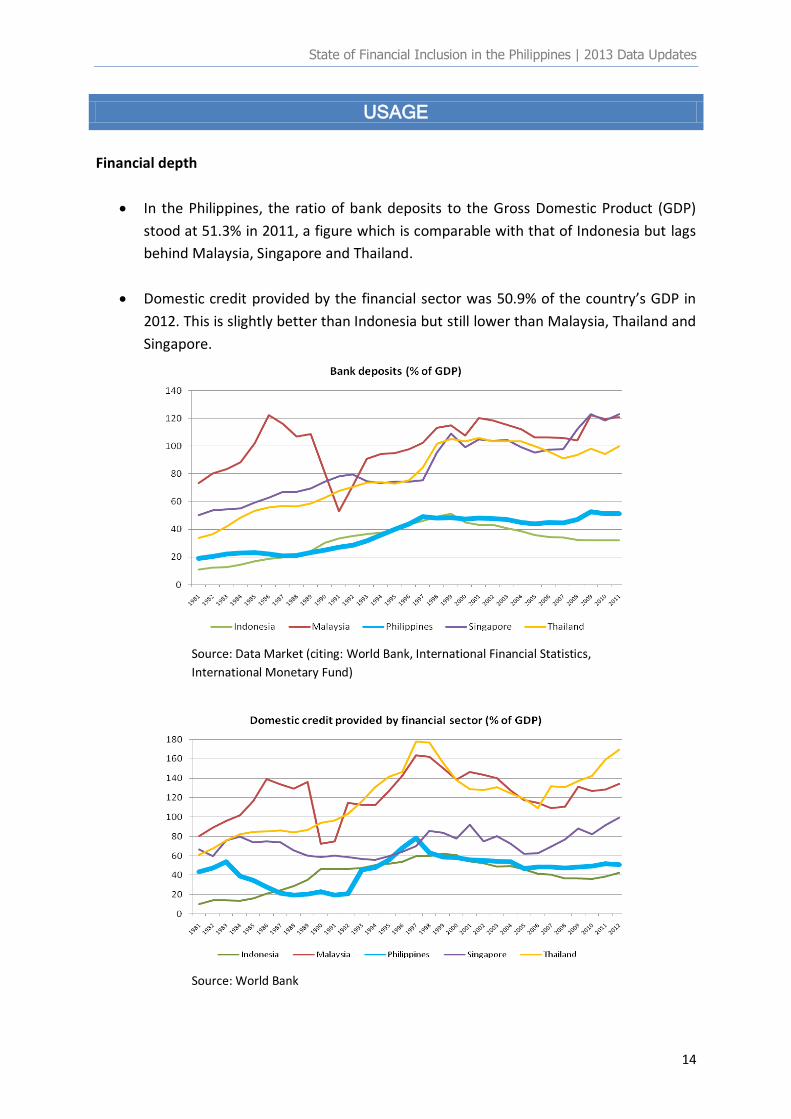
Financial depth
In the Philippines, the ratio of bank deposits to the Gross Domestic Product (GDP)
stood at 51.3% in 2011, a figure which is comparable with that of Indonesia but lags
behind Malaysia, Singapore and Thailand.
Domestic credit provided by the financial sector was 50.9% of the country’s GDP in
2012. This is slightly better than Indonesia but still lower than Malaysia, Thailand and
Singapore.
Source: Data Market (citing: World Bank, International Financial Statistics,
International Monetary Fund)
Source: World Bank
State of Financial Inclusion in the Philippines | 2013 Data Updates
15
Deposits
Number of deposit accounts in banks
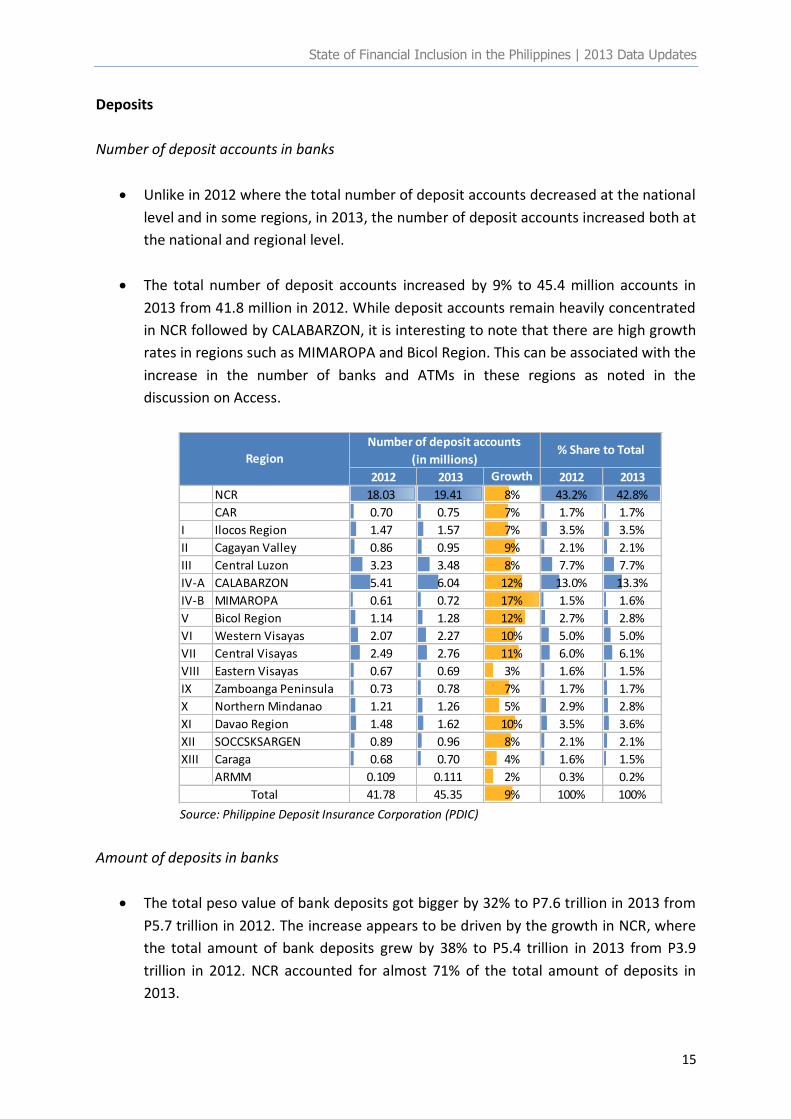
Unlike in 2012 where the total number of deposit accounts decreased at the national
level and in some regions, in 2013, the number of deposit accounts increased both at
the national and regional level.
The total number of deposit accounts increased by 9% to 45.4 million accounts in
2013 from 41.8 million in 2012. While deposit accounts remain heavily concentrated
in NCR followed by CALABARZON, it is interesting to note that there are high growth
rates in regions such as MIMAROPA and Bicol Region. This can be associated with the
increase in the number of banks and ATMs in these regions as noted in the
discussion on Access.
2012 2013 2012 2013
NCR 18.03 19.41 8% 43.2% 42.8%
CAR 0.70 0.75 7% 1.7% 1.7%
I Ilocos Region 1.47 1.57 7% 3.5% 3.5%
II Cagayan Valley 0.86 0.95 9% 2.1% 2.1%
III Central Luzon 3.23 3.48 8% 7.7% 7.7%
IV-A CALABARZON 5.41 6.04 12% 13.0% 13.3%
IV-B MIMAROPA 0.61 0.72 17% 1.5% 1.6%
V Bicol Region 1.14 1.28 12% 2.7% 2.8%
VI Western Visayas 2.07 2.27 10% 5.0% 5.0%
VII Central Visayas 2.49 2.76 11% 6.0% 6.1%
VIII Eastern Visayas 0.67 0.69 3% 1.6% 1.5%
IX Zamboanga Peninsula 0.73 0.78 7% 1.7% 1.7%
X Northern Mindanao 1.21 1.26 5% 2.9% 2.8%
XI Davao Region 1.48 1.62 10% 3.5% 3.6%
XII SOCCSKSARGEN 0.89 0.96 8% 2.1% 2.1%
XIII Caraga 0.68 0.70 4% 1.6% 1.5%
ARMM 0.109 0.111 2% 0.3% 0.2%
41.78 45.35 9% 100% 100%
Number of deposit accounts
(in millions)% Share to Total
Growth
Region
Total Source: Philippine Deposit Insurance Corporation (PDIC)
Amount of deposits in banks
The total peso value of bank deposits got bigger by 32% to P7.6 trillion in 2013 from
P5.7 trillion in 2012. The increase appears to be driven by the growth in NCR, where
the total amount of bank deposits grew by 38% to P5.4 trillion in 2013 from P3.9
trillion in 2012. NCR accounted for almost 71% of the total amount of deposits in
2013.
State of Financial Inclusion in the Philippines | 2013 Data Updates
16
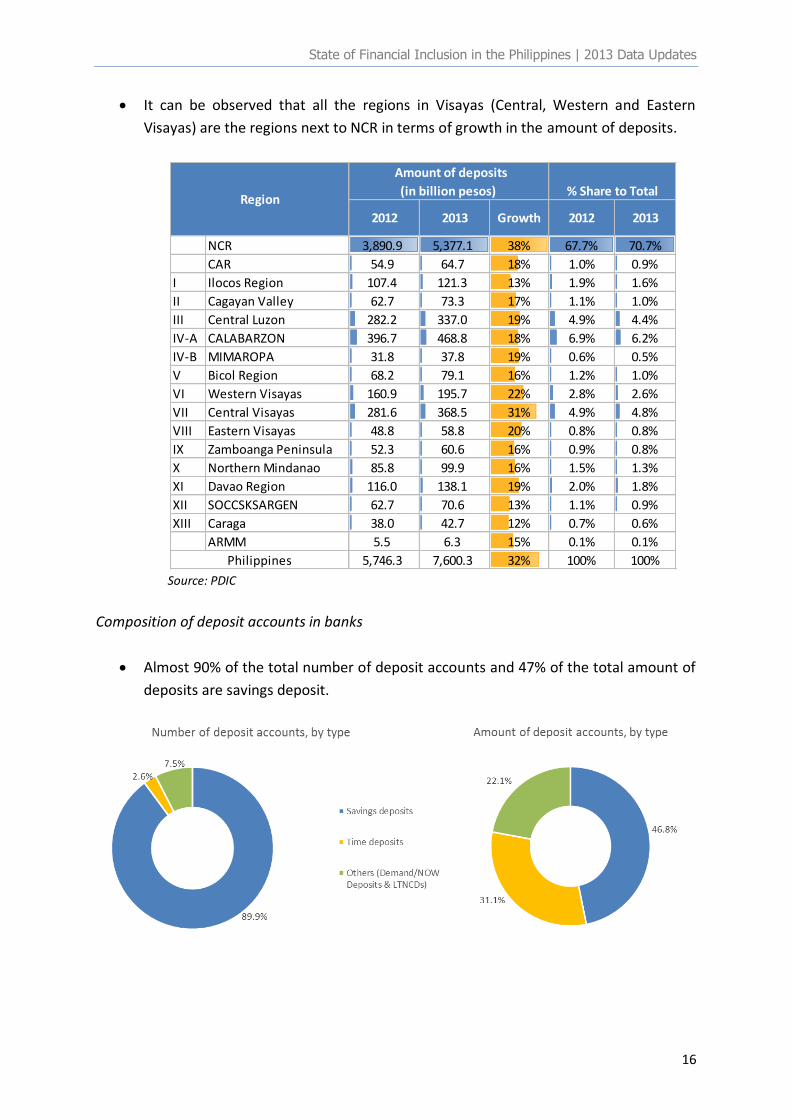
It can be observed that all the regions in Visayas (Central, Western and Eastern
Visayas) are the regions next to NCR in terms of growth in the amount of deposits.
2012 2013 2012 2013
NCR 3,890.9 5,377.1 38% 67.7% 70.7%
CAR 54.9 64.7 18% 1.0% 0.9%
I Ilocos Region 107.4 121.3 13% 1.9% 1.6%
II Cagayan Valley 62.7 73.3 17% 1.1% 1.0%
III Central Luzon 282.2 337.0 19% 4.9% 4.4%
IV-A CALABARZON 396.7 468.8 18% 6.9% 6.2%
IV-B MIMAROPA 31.8 37.8 19% 0.6% 0.5%
V Bicol Region 68.2 79.1 16% 1.2% 1.0%
VI Western Visayas 160.9 195.7 22% 2.8% 2.6%
VII Central Visayas 281.6 368.5 31% 4.9% 4.8%
VIII Eastern Visayas 48.8 58.8 20% 0.8% 0.8%
IX Zamboanga Peninsula 52.3 60.6 16% 0.9% 0.8%
X Northern Mindanao 85.8 99.9 16% 1.5% 1.3%
XI Davao Region 116.0 138.1 19% 2.0% 1.8%
XII SOCCSKSARGEN 62.7 70.6 13% 1.1% 0.9%
XIII Caraga 38.0 42.7 12% 0.7% 0.6%
ARMM 5.5 6.3 15% 0.1% 0.1%
5,746.3 7,600.3 32% 100% 100%
Amount of deposits
(in billion pesos) % Share to Total
Growth
Philippines
Region
Source: PDIC
Composition of deposit accounts in banks
Almost 90% of the total number of deposit accounts and 47% of the total amount of
deposits are savings deposit.
State of Financial Inclusion in the Philippines | 2013 Data Updates
17
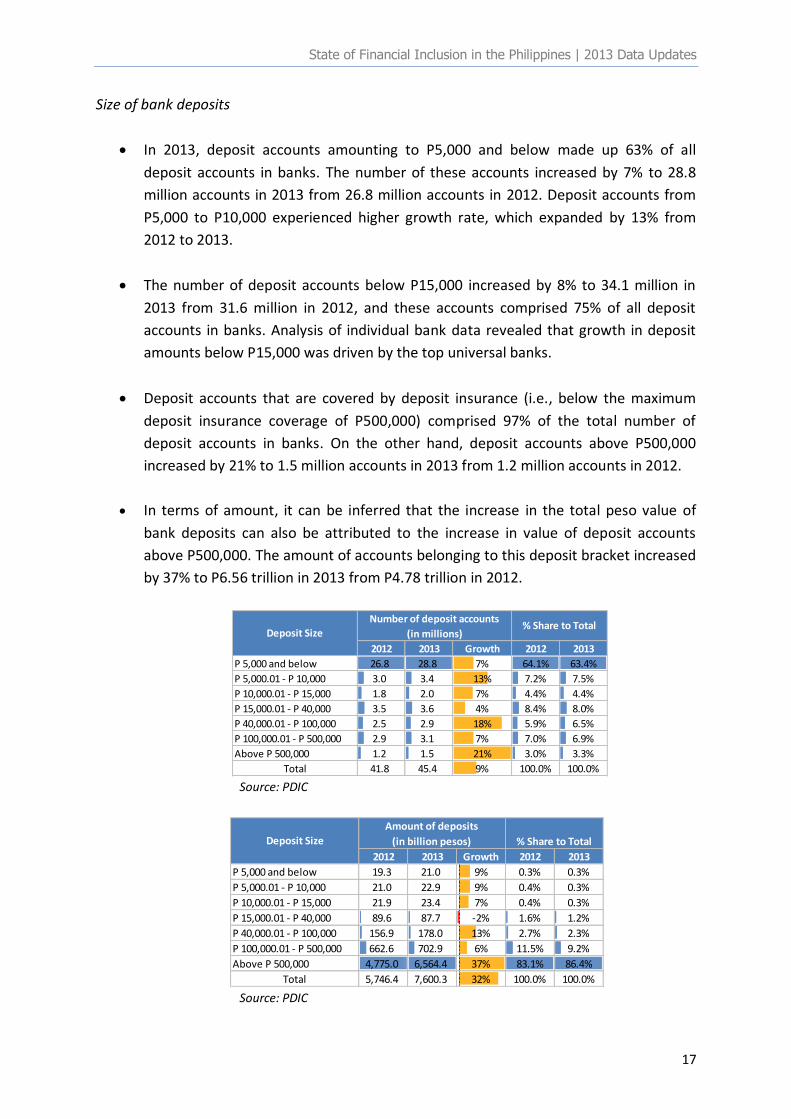
Size of bank deposits
In 2013, deposit accounts amounting to P5,000 and below made up 63% of all
deposit accounts in banks. The number of these accounts increased by 7% to 28.8
million accounts in 2013 from 26.8 million accounts in 2012. Deposit accounts from
P5,000 to P10,000 experienced higher growth rate, which expanded by 13% from
2012 to 2013.
The number of deposit accounts below P15,000 increased by 8% to 34.1 million in
2013 from 31.6 million in 2012, and these accounts comprised 75% of all deposit
accounts in banks. Analysis of individual bank data revealed that growth in deposit
amounts below P15,000 was driven by the top universal banks.
Deposit accounts that are covered by deposit insurance (i.e., below the maximum
deposit insurance coverage of P500,000) comprised 97% of the total number of
deposit accounts in banks. On the other hand, deposit accounts above P500,000
increased by 21% to 1.5 million accounts in 2013 from 1.2 million accounts in 2012.
In terms of amount, it can be inferred that the increase in the total peso value of
bank deposits can also be attributed to the increase in value of deposit accounts
above P500,000. The amount of accounts belonging to this deposit bracket increased
by 37% to P6.56 trillion in 2013 from P4.78 trillion in 2012.
2012 2013 Growth 2012 2013
P 5,000 and below 26.8 28.8 7% 64.1% 63.4%
P 5,000.01 - P 10,000 3.0 3.4 13% 7.2% 7.5%
P 10,000.01 - P 15,000 1.8 2.0 7% 4.4% 4.4%
P 15,000.01 - P 40,000 3.5 3.6 4% 8.4% 8.0%
P 40,000.01 - P 100,000 2.5 2.9 18% 5.9% 6.5%
P 100,000.01 - P 500,000 2.9 3.1 7% 7.0% 6.9%
Above P 500,000 1.2 1.5 21% 3.0% 3.3%
Total 41.8 45.4 9% 100.0% 100.0%
Number of deposit accounts
(in millions)% Share to Total
Deposit Size
Source: PDIC
2012 2013 Growth 2012 2013
P 5,000 and below 19.3 21.0 9% 0.3% 0.3%
P 5,000.01 - P 10,000 21.0 22.9 9% 0.4% 0.3%
P 10,000.01 - P 15,000 21.9 23.4 7% 0.4% 0.3%
P 15,000.01 - P 40,000 89.6 87.7 -2% 1.6% 1.2%
P 40,000.01 - P 100,000 156.9 178.0 13% 2.7% 2.3%
P 100,000.01 - P 500,000 662.6 702.9 6% 11.5% 9.2%
Above P 500,000 4,775.0 6,564.4 37% 83.1% 86.4%
Total 5,746.4 7,600.3 32% 100.0% 100.0%
Deposit Size
Amount of deposits
(in billion pesos) % Share to Total
Source: PDIC
State of Financial Inclusion in the Philippines | 2013 Data Updates
18
Deposits in non-banks
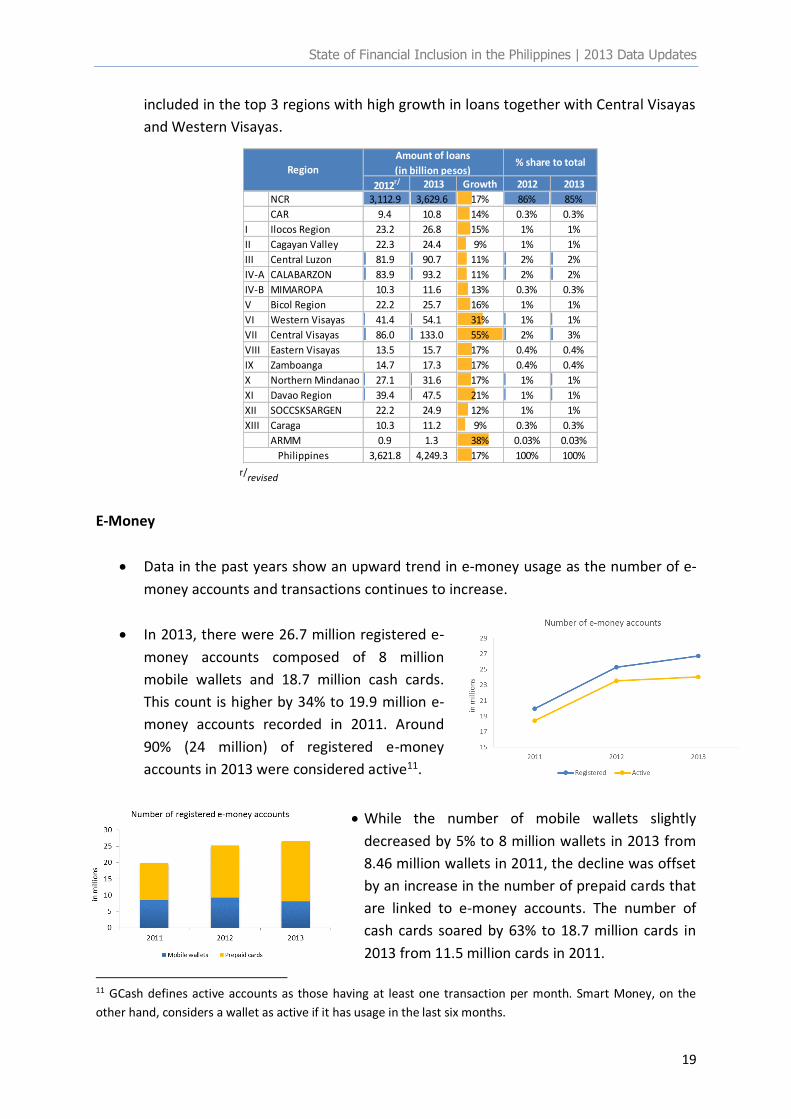
Deposits in non-bank financial institutions
authorized to have deposit-taking activities
(i.e., Non-Stock Savings and Loans
Associations or NSSLAs) increased by 2% to
P 23.3 billion in 2013 from P 22.9 billion in
2012. In terms of composition, 67% of
deposits in NSSLAs are savings deposits
while the remaining 33% are time deposits.
Credit
Amount of loans in banks9
The total amount of bank loans increased by 17% to P4.25 trillion in 2013 from P3.62
trillion in 2012. Compared to the regional distribution of bank deposits, the
distribution of banking system loans is more heavily skewed to NCR. In 2013, NCR
accounted for 85% of the total amount of loans outstanding in the banking sector.
The good news is that loan growth has been remarkable in regions outside NCR.
Highest loan growth was observed in Central Visayas at 55%.10 Surprisingly, ARMM is
9 Exclusive of interbank loans and RRP with BSP and other banks. Existing data on the amount of loans include
all loans granted by banks, except to the BSP and other banks and NBFIs with quasi-banking authority. 10 The Province of Cebu accounted for 91% of the total amount of loans outstanding in Central Visayas. The
loan portfolio of U/KBs in Cebu expanded by 71% from 2012 to 2013. Loan growth was highest in Cebu City,
Mandaue City and Talisay City. This may be reflective of the good investment climate and business
environment in the province.
What are micro-deposits? In 2010, the BSP issued Circular 694 which expanded microfinance products to include micro-deposits (also known as microfinance savings deposits). Micro-deposits are savings accounts that cater to the needs of the basic sectors and low income individuals. These savings accounts remove the usual barriers faced in opening a bank account such as high maintaining balance and dormancy charges. In 2013, the BSP issued Circular 796 which amends the general features of micro-deposits by increasing the average daily balance (ADB) from P15,000 to P 40,000. This responsive measure enhances the features of micro-deposits to further encourage the microfinance clients to build up their savings.
State of Financial Inclusion in the Philippines | 2013 Data Updates
19
included in the top 3 regions with high growth in loans together with Central Visayas
and Western Visayas.
2012r/ 2013 Growth 2012 2013
NCR 3,112.9 3,629.6 17% 86% 85%
CAR 9.4 10.8 14% 0.3% 0.3%
I Ilocos Region 23.2 26.8 15% 1% 1%
II Cagayan Valley 22.3 24.4 9% 1% 1%
III Central Luzon 81.9 90.7 11% 2% 2%
IV-A CALABARZON 83.9 93.2 11% 2% 2%
IV-B MIMAROPA 10.3 11.6 13% 0.3% 0.3%
V Bicol Region 22.2 25.7 16% 1% 1%
VI Western Visayas 41.4 54.1 31% 1% 1%
VII Central Visayas 86.0 133.0 55% 2% 3%
VIII Eastern Visayas 13.5 15.7 17% 0.4% 0.4%
IX Zamboanga 14.7 17.3 17% 0.4% 0.4%
X Northern Mindanao 27.1 31.6 17% 1% 1%
XI Davao Region 39.4 47.5 21% 1% 1%
XII SOCCSKSARGEN 22.2 24.9 12% 1% 1%
XIII Caraga 10.3 11.2 9% 0.3% 0.3%
ARMM 0.9 1.3 38% 0.03% 0.03%
3,621.8 4,249.3 17% 100% 100%Philippines
Amount of loans
(in billion pesos)% share to total
Region
r/
revised
E-Money
Data in the past years show an upward trend in e-money usage as the number of e-
money accounts and transactions continues to increase.
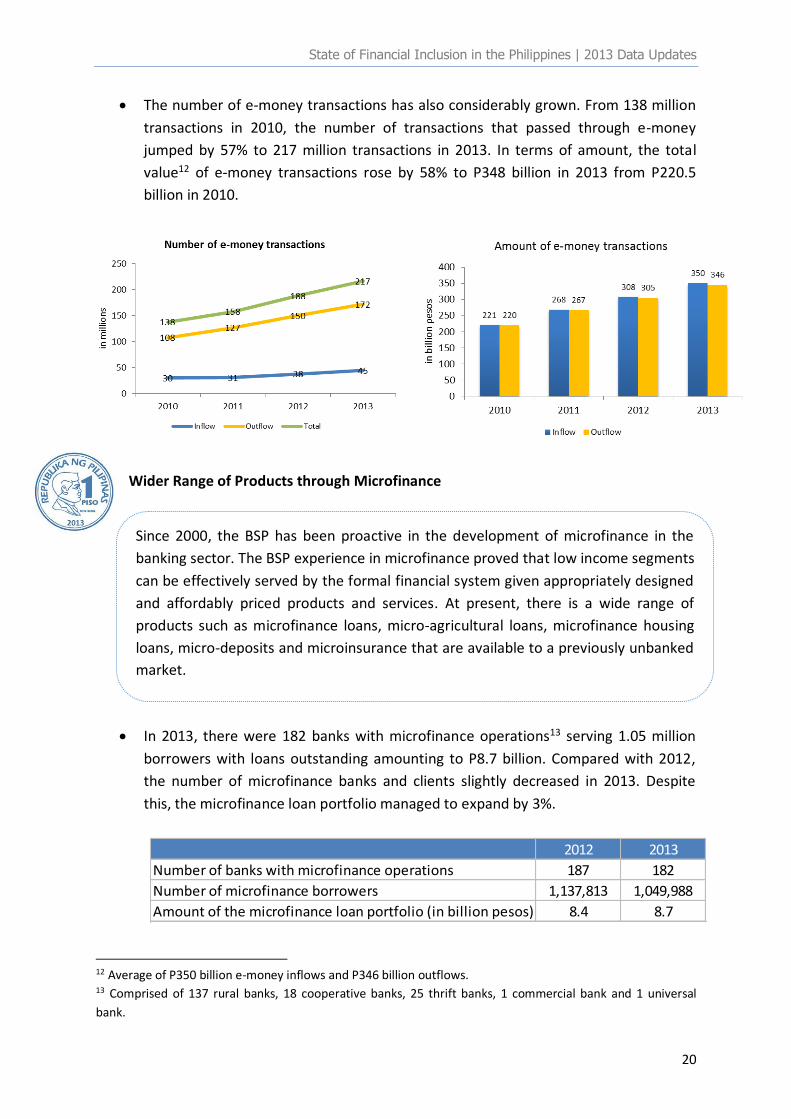
In 2013, there were 26.7 million registered e-
money accounts composed of 8 million
mobile wallets and 18.7 million cash cards.
This count is higher by 34% to 19.9 million e-
money accounts recorded in 2011. Around
90% (24 million) of registered e-money
accounts in 2013 were considered active11.
While the number of mobile wallets slightly
decreased by 5% to 8 million wallets in 2013 from
8.46 million wallets in 2011, the decline was offset
by an increase in the number of prepaid cards that
are linked to e-money accounts. The number of
cash cards soared by 63% to 18.7 million cards in
2013 from 11.5 million cards in 2011.
11 GCash defines active accounts as those having at least one transaction per month. Smart Money, on the
other hand, considers a wallet as active if it has usage in the last six months.
State of Financial Inclusion in the Philippines | 2013 Data Updates
20
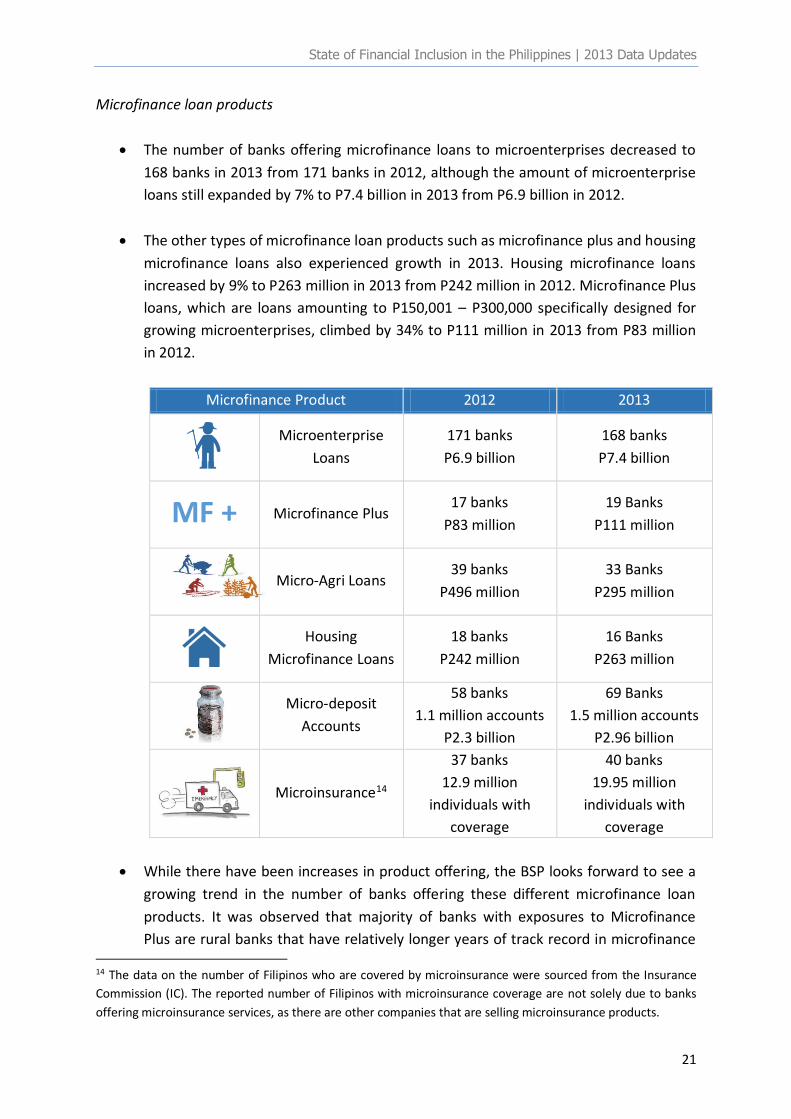
The number of e-money transactions has also considerably grown. From 138 million
transactions in 2010, the number of transactions that passed through e-money
jumped by 57% to 217 million transactions in 2013. In terms of amount, the total
value12 of e-money transactions rose by 58% to P348 billion in 2013 from P220.5
billion in 2010.
Wider Range of Products through Microfinance
In 2013, there were 182 banks with microfinance operations13 serving 1.05 million
borrowers with loans outstanding amounting to P8.7 billion. Compared with 2012,
the number of microfinance banks and clients slightly decreased in 2013. Despite
this, the microfinance loan portfolio managed to expand by 3%.
2012 2013
Number of banks with microfinance operations 187 182
Number of microfinance borrowers 1,137,813 1,049,988
Amount of the microfinance loan portfolio (in billion pesos) 8.4 8.7
12 Average of P350 billion e-money inflows and P346 billion outflows. 13 Comprised of 137 rural banks, 18 cooperative banks, 25 thrift banks, 1 commercial bank and 1 universal
bank.
Since 2000, the BSP has been proactive in the development of microfinance in the
banking sector. The BSP experience in microfinance proved that low income segments
can be effectively served by the formal financial system given appropriately designed
and affordably priced products and services. At present, there is a wide range of
products such as microfinance loans, micro-agricultural loans, microfinance housing
loans, micro-deposits and microinsurance that are available to a previously unbanked
market.
State of Financial Inclusion in the Philippines | 2013 Data Updates
21
Microfinance loan products
The number of banks offering microfinance loans to microenterprises decreased to
168 banks in 2013 from 171 banks in 2012, although the amount of microenterprise
loans still expanded by 7% to P7.4 billion in 2013 from P6.9 billion in 2012.
The other types of microfinance loan products such as microfinance plus and housing
microfinance loans also experienced growth in 2013. Housing microfinance loans
increased by 9% to P263 million in 2013 from P242 million in 2012. Microfinance Plus
loans, which are loans amounting to P150,001 – P300,000 specifically designed for
growing microenterprises, climbed by 34% to P111 million in 2013 from P83 million
in 2012.
Microfinance Product 2012 2013
Microenterprise
Loans
171 banks
P6.9 billion
168 banks
P7.4 billion
MF + Microfinance Plus 17 banks
P83 million
19 Banks
P111 million
Micro-Agri Loans 39 banks
P496 million
33 Banks
P295 million
Housing
Microfinance Loans
18 banks
P242 million
16 Banks
P263 million
Micro-deposit
Accounts
58 banks
1.1 million accounts
P2.3 billion
69 Banks
1.5 million accounts
P2.96 billion
Microinsurance14
37 banks
12.9 million
individuals with
coverage
40 banks
19.95 million
individuals with
coverage
While there have been increases in product offering, the BSP looks forward to see a
growing trend in the number of banks offering these different microfinance loan
products. It was observed that majority of banks with exposures to Microfinance
Plus are rural banks that have relatively longer years of track record in microfinance 14 The data on the number of Filipinos who are covered by microinsurance were sourced from the Insurance
Commission (IC). The reported number of Filipinos with microinsurance coverage are not solely due to banks
offering microinsurance services, as there are other companies that are selling microinsurance products.
State of Financial Inclusion in the Philippines | 2013 Data Updates
22
(they have been in existence for an average of 32 years). On the other hand, bulk of
the housing microfinance loans are coming from a large microfinance-oriented rural
bank.
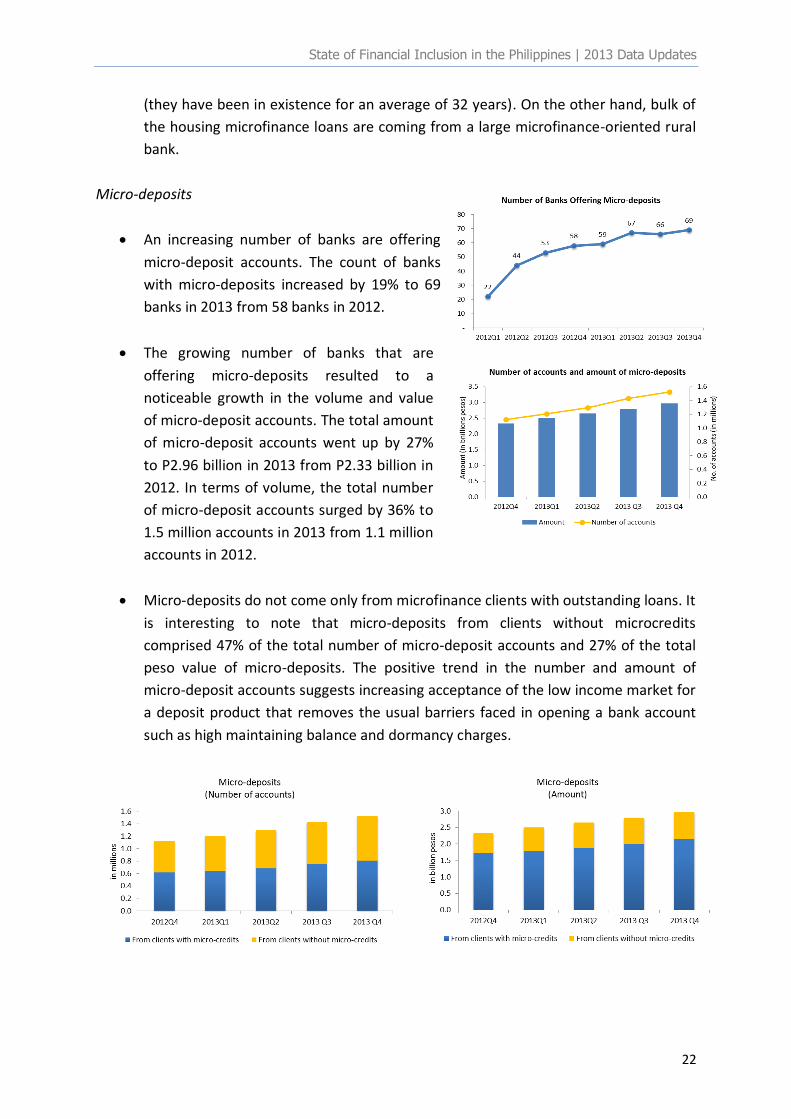
Micro-deposits
An increasing number of banks are offering
micro-deposit accounts. The count of banks
with micro-deposits increased by 19% to 69
banks in 2013 from 58 banks in 2012.
The growing number of banks that are
offering micro-deposits resulted to a
noticeable growth in the volume and value
of micro-deposit accounts. The total amount
of micro-deposit accounts went up by 27%
to P2.96 billion in 2013 from P2.33 billion in
2012. In terms of volume, the total number
of micro-deposit accounts surged by 36% to
1.5 million accounts in 2013 from 1.1 million
accounts in 2012.
Micro-deposits do not come only from microfinance clients with outstanding loans. It
is interesting to note that micro-deposits from clients without microcredits
comprised 47% of the total number of micro-deposit accounts and 27% of the total
peso value of micro-deposits. The positive trend in the number and amount of
micro-deposit accounts suggests increasing acceptance of the low income market for
a deposit product that removes the usual barriers faced in opening a bank account
such as high maintaining balance and dormancy charges.
State of Financial Inclusion in the Philippines | 2013 Data Updates
23
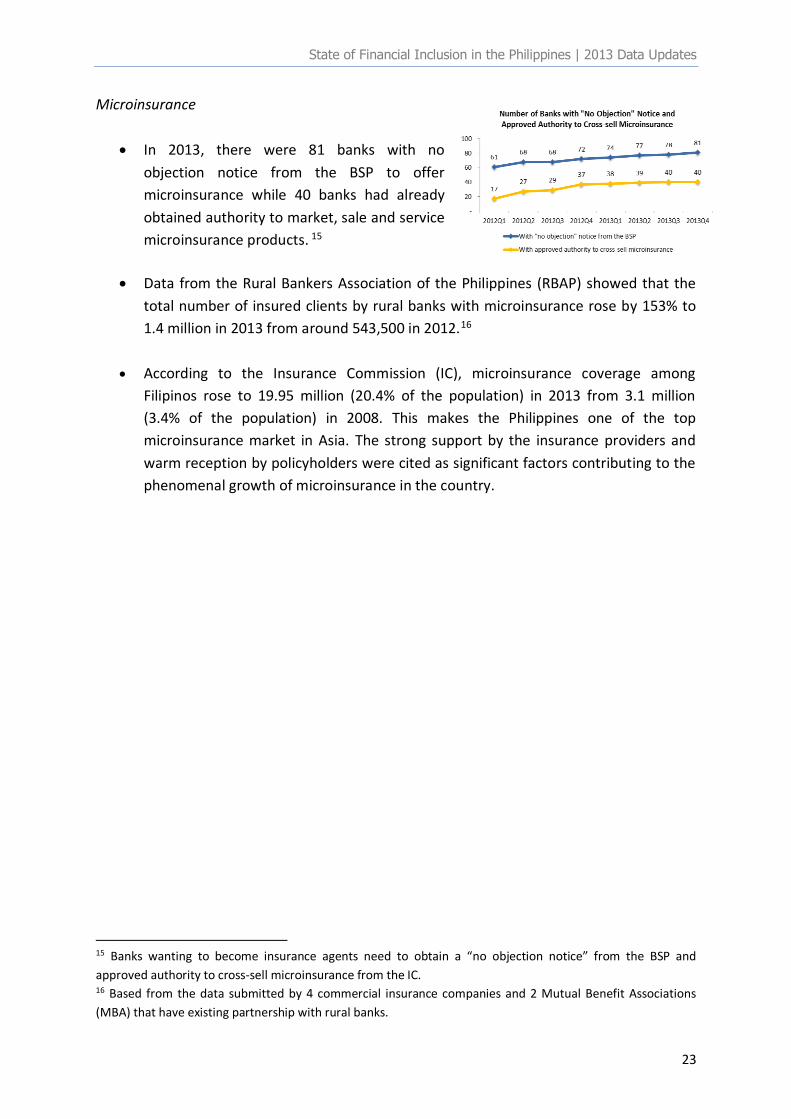
Microinsurance
In 2013, there were 81 banks with no
objection notice from the BSP to offer
microinsurance while 40 banks had already
obtained authority to market, sale and service
microinsurance products. 15
Data from the Rural Bankers Association of the Philippines (RBAP) showed that the
total number of insured clients by rural banks with microinsurance rose by 153% to
1.4 million in 2013 from around 543,500 in 2012.16
According to the Insurance Commission (IC), microinsurance coverage among
Filipinos rose to 19.95 million (20.4% of the population) in 2013 from 3.1 million
(3.4% of the population) in 2008. This makes the Philippines one of the top
microinsurance market in Asia. The strong support by the insurance providers and
warm reception by policyholders were cited as significant factors contributing to the
phenomenal growth of microinsurance in the country.
15 Banks wanting to become insurance agents need to obtain a “no objection notice” from the BSP and
approved authority to cross-sell microinsurance from the IC. 16 Based from the data submitted by 4 commercial insurance companies and 2 Mutual Benefit Associations
(MBA) that have existing partnership with rural banks.
State of Financial Inclusion in the Philippines | 2013 Data Updates
24
2012 2013 Growth
NCR 176.06 184.76 5%
CAR 1.92 1.95 1%
I Ilocos Region 3.30 3.49 6%
II Cagayan Valley 3.08 3.33 8%
III Central Luzon 7.50 7.68 2%
IV-A CALABARZON 9.90 10.63 7%
IV-B MIMAROPA 2.82 3.01 7%
V Bicol Region 2.76 3.10 12%
VI Western Visayas 4.08 4.30 5%
VII Central Visayas 4.75 4.95 4%
VIII Eastern Visayas 1.22 1.28 5%
IX Zamboanga Peninsula 2.64 2.76 5%
X Northern Mindanao 3.53 3.73 6%
XI Davao Region 7.24 7.92 9%
XII SOCCSKSARGEN 3.90 3.94 1%
XIII Caraga 2.75 2.84 3%
ARMM 0.17 0.18 5%
5.74 6.05 5%Philippines
Region
FINANCIAL INCLUSION INDICATORS
Measures of financial inclusion can be further enhanced by factoring in other
important variables such as size of the population and percentage share of habitable land
area. In the maiden report on the state of financial inclusion, it was stated that some regions
are not as underserved as they appear to be if we consider the population count and size of
inhabitable land in the region. The use of demographic and geographic factors therefore
allows us to assess if the level of financial access and usage in a particular location is just
proportionate to the size of its adult population17 and habitable land area.
Access Indicators
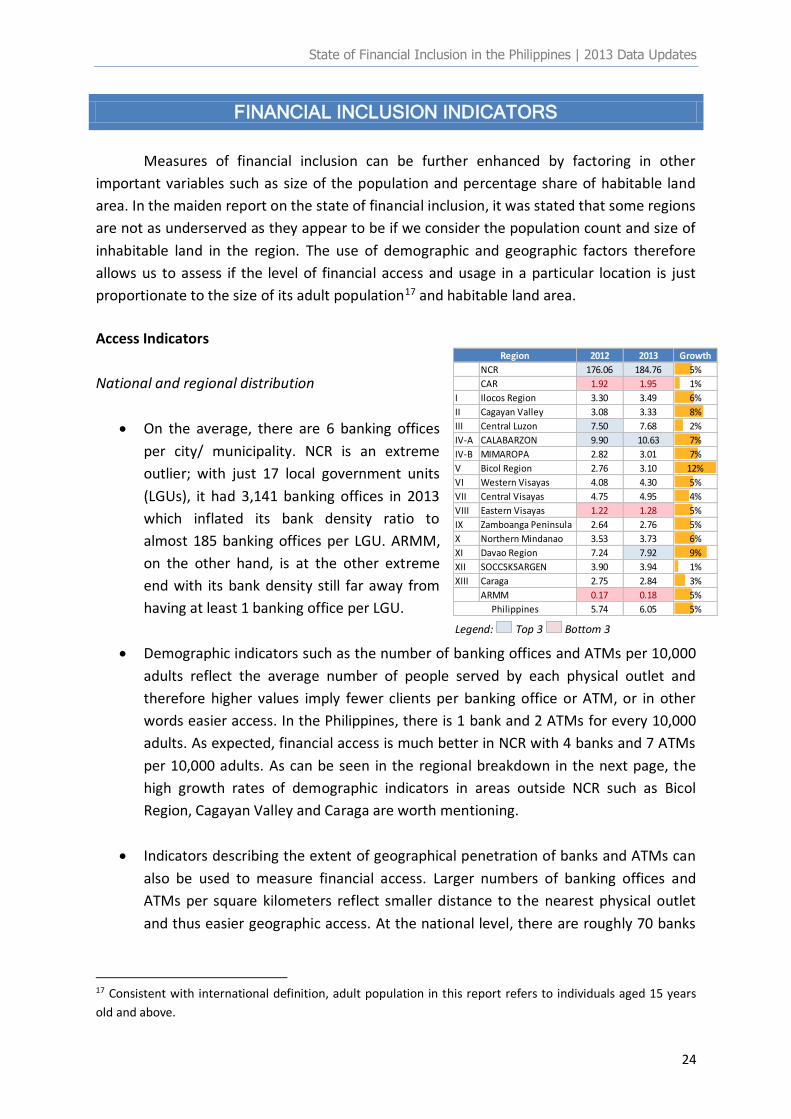
National and regional distribution
On the average, there are 6 banking offices
per city/ municipality. NCR is an extreme
outlier; with just 17 local government units
(LGUs), it had 3,141 banking offices in 2013
which inflated its bank density ratio to
almost 185 banking offices per LGU. ARMM,
on the other hand, is at the other extreme
end with its bank density still far away from
having at least 1 banking office per LGU.
Legend: Top 3 Bottom 3
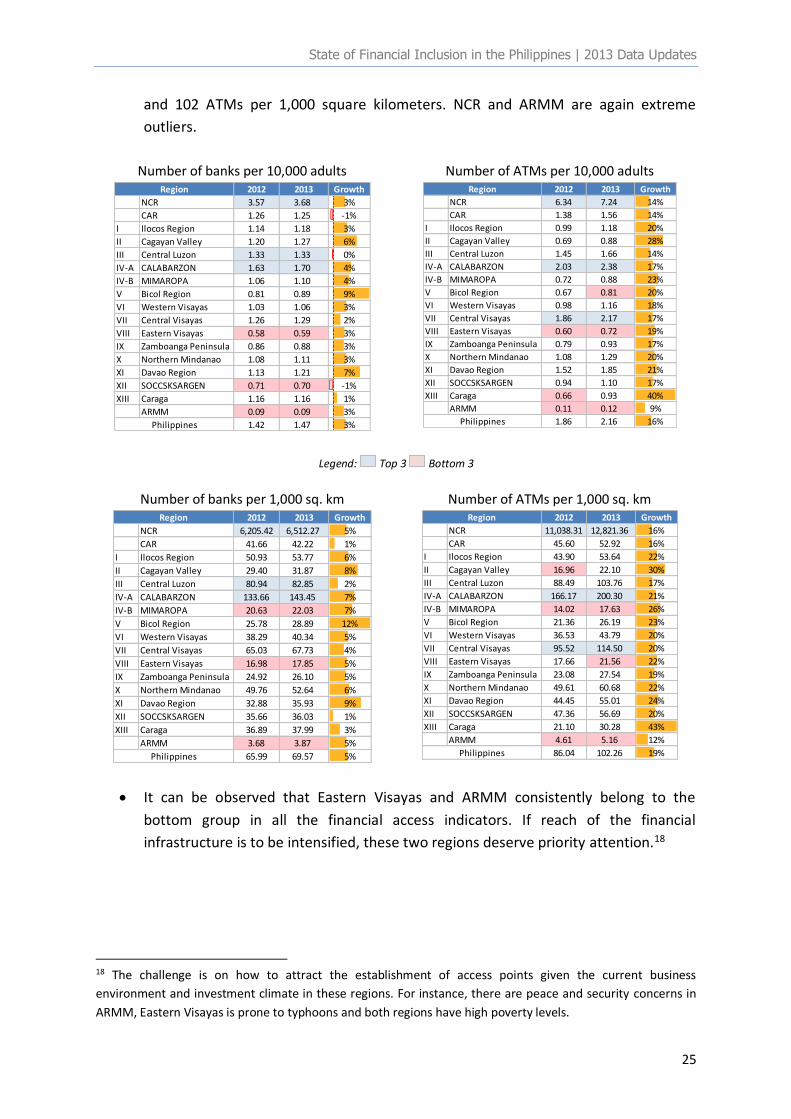
Demographic indicators such as the number of banking offices and ATMs per 10,000
adults reflect the average number of people served by each physical outlet and
therefore higher values imply fewer clients per banking office or ATM, or in other
words easier access. In the Philippines, there is 1 bank and 2 ATMs for every 10,000
adults. As expected, financial access is much better in NCR with 4 banks and 7 ATMs
per 10,000 adults. As can be seen in the regional breakdown in the next page, the
high growth rates of demographic indicators in areas outside NCR such as Bicol
Region, Cagayan Valley and Caraga are worth mentioning.
Indicators describing the extent of geographical penetration of banks and ATMs can
also be used to measure financial access. Larger numbers of banking offices and
ATMs per square kilometers reflect smaller distance to the nearest physical outlet
and thus easier geographic access. At the national level, there are roughly 70 banks
17 Consistent with international definition, adult population in this report refers to individuals aged 15 years
old and above.
State of Financial Inclusion in the Philippines | 2013 Data Updates
25
and 102 ATMs per 1,000 square kilometers. NCR and ARMM are again extreme
outliers.
Number of banks per 10,000 adults Number of ATMs per 10,000 adults 2012 2013 Growth
NCR 3.57 3.68 3%
CAR 1.26 1.25 -1%
I Ilocos Region 1.14 1.18 3%
II Cagayan Valley 1.20 1.27 6%
III Central Luzon 1.33 1.33 0%
IV-A CALABARZON 1.63 1.70 4%
IV-B MIMAROPA 1.06 1.10 4%
V Bicol Region 0.81 0.89 9%
VI Western Visayas 1.03 1.06 3%
VII Central Visayas 1.26 1.29 2%
VIII Eastern Visayas 0.58 0.59 3%
IX Zamboanga Peninsula 0.86 0.88 3%
X Northern Mindanao 1.08 1.11 3%
XI Davao Region 1.13 1.21 7%
XII SOCCSKSARGEN 0.71 0.70 -1%
XIII Caraga 1.16 1.16 1%
ARMM 0.09 0.09 3%
1.42 1.47 3%
Region
Philippines
2012 2013 Growth
NCR 6.34 7.24 14%
CAR 1.38 1.56 14%
I Ilocos Region 0.99 1.18 20%
II Cagayan Valley 0.69 0.88 28%
III Central Luzon 1.45 1.66 14%
IV-A CALABARZON 2.03 2.38 17%
IV-B MIMAROPA 0.72 0.88 23%
V Bicol Region 0.67 0.81 20%
VI Western Visayas 0.98 1.16 18%
VII Central Visayas 1.86 2.17 17%
VIII Eastern Visayas 0.60 0.72 19%
IX Zamboanga Peninsula 0.79 0.93 17%
X Northern Mindanao 1.08 1.29 20%
XI Davao Region 1.52 1.85 21%
XII SOCCSKSARGEN 0.94 1.10 17%
XIII Caraga 0.66 0.93 40%
ARMM 0.11 0.12 9%
1.86 2.16 16%
Region
Philippines
Legend: Top 3 Bottom 3
Number of banks per 1,000 sq. km Number of ATMs per 1,000 sq. km 2012 2013 Growth
NCR 6,205.42 6,512.27 5%
CAR 41.66 42.22 1%
I Ilocos Region 50.93 53.77 6%
II Cagayan Valley 29.40 31.87 8%
III Central Luzon 80.94 82.85 2%
IV-A CALABARZON 133.66 143.45 7%
IV-B MIMAROPA 20.63 22.03 7%
V Bicol Region 25.78 28.89 12%
VI Western Visayas 38.29 40.34 5%
VII Central Visayas 65.03 67.73 4%
VIII Eastern Visayas 16.98 17.85 5%
IX Zamboanga Peninsula 24.92 26.10 5%
X Northern Mindanao 49.76 52.64 6%
XI Davao Region 32.88 35.93 9%
XII SOCCSKSARGEN 35.66 36.03 1%
XIII Caraga 36.89 37.99 3%
ARMM 3.68 3.87 5%
65.99 69.57 5%
Region
Philippines
2012 2013 Growth
NCR 11,038.31 12,821.36 16%
CAR 45.60 52.92 16%
I Ilocos Region 43.90 53.64 22%
II Cagayan Valley 16.96 22.10 30%
III Central Luzon 88.49 103.76 17%
IV-A CALABARZON 166.17 200.30 21%
IV-B MIMAROPA 14.02 17.63 26%
V Bicol Region 21.36 26.19 23%
VI Western Visayas 36.53 43.79 20%
VII Central Visayas 95.52 114.50 20%
VIII Eastern Visayas 17.66 21.56 22%
IX Zamboanga Peninsula 23.08 27.54 19%
X Northern Mindanao 49.61 60.68 22%
XI Davao Region 44.45 55.01 24%
XII SOCCSKSARGEN 47.36 56.69 20%
XIII Caraga 21.10 30.28 43%
ARMM 4.61 5.16 12%
86.04 102.26 19%Philippines
Region
It can be observed that Eastern Visayas and ARMM consistently belong to the
bottom group in all the financial access indicators. If reach of the financial
infrastructure is to be intensified, these two regions deserve priority attention.18
18 The challenge is on how to attract the establishment of access points given the current business
environment and investment climate in these regions. For instance, there are peace and security concerns in
ARMM, Eastern Visayas is prone to typhoons and both regions have high poverty levels.
State of Financial Inclusion in the Philippines | 2013 Data Updates
26
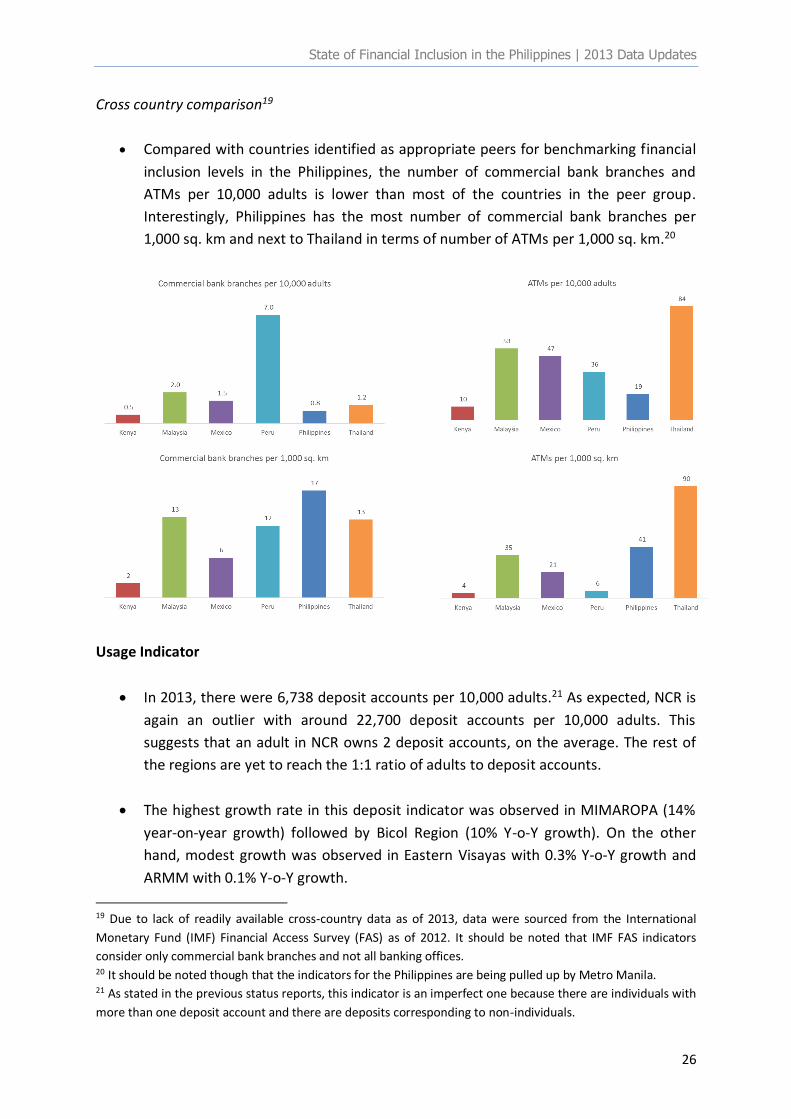
Cross country comparison19
Compared with countries identified as appropriate peers for benchmarking financial
inclusion levels in the Philippines, the number of commercial bank branches and
ATMs per 10,000 adults is lower than most of the countries in the peer group.
Interestingly, Philippines has the most number of commercial bank branches per
1,000 sq. km and next to Thailand in terms of number of ATMs per 1,000 sq. km.20
Usage Indicator
In 2013, there were 6,738 deposit accounts per 10,000 adults.21 As expected, NCR is
again an outlier with around 22,700 deposit accounts per 10,000 adults. This
suggests that an adult in NCR owns 2 deposit accounts, on the average. The rest of
the regions are yet to reach the 1:1 ratio of adults to deposit accounts.
The highest growth rate in this deposit indicator was observed in MIMAROPA (14%
year-on-year growth) followed by Bicol Region (10% Y-o-Y growth). On the other
hand, modest growth was observed in Eastern Visayas with 0.3% Y-o-Y growth and
ARMM with 0.1% Y-o-Y growth.
19 Due to lack of readily available cross-country data as of 2013, data were sourced from the International
Monetary Fund (IMF) Financial Access Survey (FAS) as of 2012. It should be noted that IMF FAS indicators
consider only commercial bank branches and not all banking offices. 20 It should be noted though that the indicators for the Philippines are being pulled up by Metro Manila. 21 As stated in the previous status reports, this indicator is an imperfect one because there are individuals with
more than one deposit account and there are deposits corresponding to non-individuals.
State of Financial Inclusion in the Philippines | 2013 Data Updates
27
2012 2013 Growth
NCR 21,491 22,716 6%
CAR 5,969 6,263 5%
I Ilocos Region 4,060 4,267 5%
II Cagayan Valley 3,613 3,871 7%
III Central Luzon 4,394 4,631 5%
IV-A CALABARZON 6,269 6,813 9%
IV-B MIMAROPA 3,140 3,580 14%
V Bicol Region 2,936 3,223 10%
VI Western Visayas 3,927 4,219 7%
VII Central Visayas 5,018 5,426 8%
VIII Eastern Visayas 2,238 2,245 0.3%
IX Zamboanga Peninsula 3,288 3,462 5%
X Northern Mindanao 3,969 4,052 2%
XI Davao Region 4,686 5,027 7%
XII SOCCSKSARGEN 3,247 3,433 6%
XIII Caraga 3,895 3,948 1%
ARMM 467 468 0.1%
6,346 6,738 6%
Region
Philippines
To establish a clearer picture of usage of formal deposit products, there is a need to
capture the number of deposit accounts in non-banks such as savings and loans
associations and cooperatives. However, these data elements are not part of existing
supply-side information. A demand-side survey among Filipino adults that will ask
whether they have a deposit account at a formal financial institution and probe the
frequency and regularity of usage is therefore critical in adequately measuring usage
of deposit accounts.
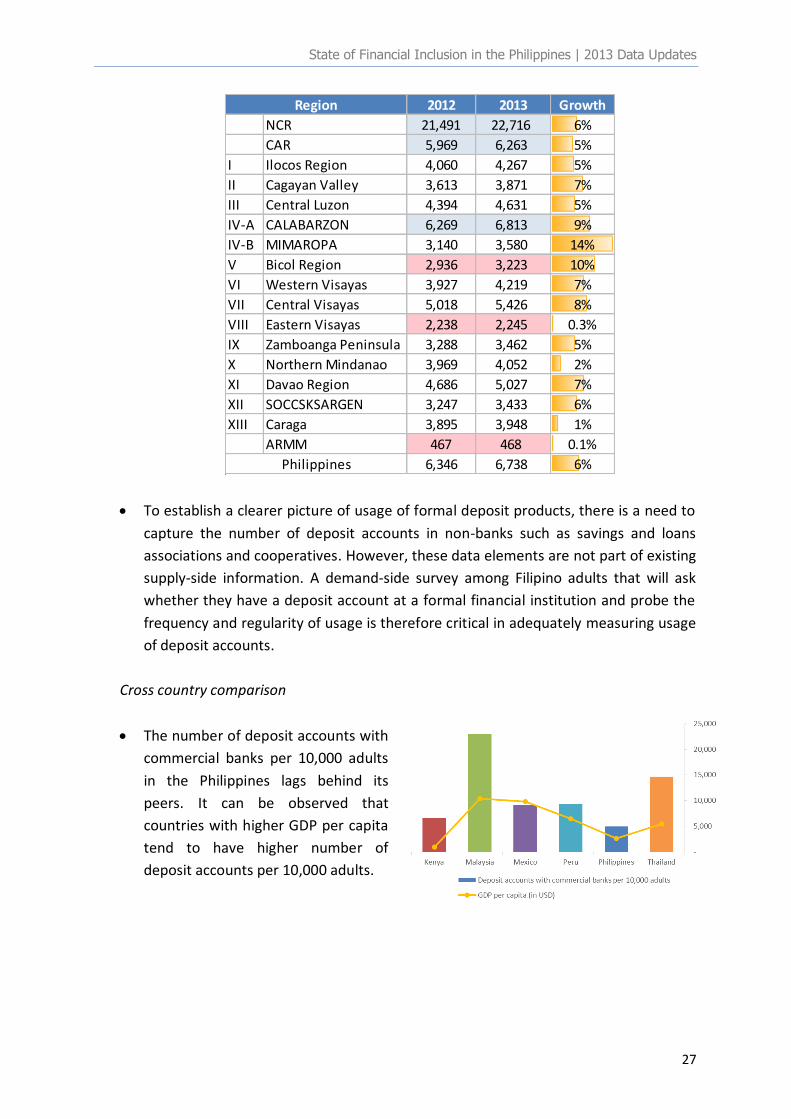
Cross country comparison
The number of deposit accounts with
commercial banks per 10,000 adults
in the Philippines lags behind its
peers. It can be observed that
countries with higher GDP per capita
tend to have higher number of
deposit accounts per 10,000 adults.
State of Financial Inclusion in the Philippines | 2013 Data Updates
28
The AFI Core Set of Financial Inclusion Indicators
In 2011, the Alliance for Financial Inclusion (AFI)22, through its Financial Inclusion
Data Working Group (FIDWG)23, published the Core Set of Financial Inclusion
Indicators (“the Core Set”). The Core Set is a set of quantitative indicators that are
meant to measure the most basic and fundamental aspects of financial inclusion in a
country. It is a tool for guiding data collection and measurement that is intended to
help policymakers develop appropriate financial inclusion policies and monitor
progress over time. The Core Set also paves the way for greater consistency and
comparability in measuring financial inclusion across countries.24
With the adoption of the Sasana Accord25, AFI member countries agreed to measure
their progress in financial inclusion based on common indicators as identified and
quantified in the Core Set and to publicly release this information annually. As a
testament of the BSP’s commitment to promote evidence-based financial inclusion
policymaking and tracking of progress, this report presents the Philippines’ Core Set
of Financial Inclusion Indicators:
2011 2012 2013
Adult population (in millions)a/ 64.3 65.8 67.3
Total number of relevant administrative unitsb/ 1,634
Access Dimension:
Total number of bank branches 9,015 9,375 9,884
Total number of cash-in & cash-out agents 12,190 18,545 24,029
Total number of cash-in & cash-out ATMsc/ n.a.
Total number of other cash-in & cash-out access pointsd/ 25,097 29,569 31,651
Number of access points per 10,000 adults 7.2 8.7 9.7
% of administrative units with at least one access point 76.2% 86.7% 87.4%
% population living in administrative units with at least one access point
92.4% 96.2% 96.4%
22 AFI is a global network of central banks and other financial inclusion policy making bodies in developing
countries that provides its members with the tools and resources to share, develop and implement their
knowledge of financial inclusion policies. 23 FIDWG was created to explore the topic of financial inclusion data and share expertise aimed at building
capacity within the AFI network in data methodologies and approaches. 24 The concept note about the Core Set can be downloaded at:
http://www.afi-global.org/sites/default/files/afi%20fidwg%20report.pdf 25 During the 2013 AFI Global Policy Forum (GPF), AFI members agreed on the Sasana Accord which aims to
strengthen the effectiveness of their Maya Declaration Commitments. Through the Sasana Accord, financial
inclusion policymaking and strategies will focus on evidence and data-based results to accelerate progress and
clearly measure the impact of financial inclusion policies.
State of Financial Inclusion in the Philippines | 2013 Data Updates
29
Usage Dimension:
% of adults with at least one type of regulated deposit accounte/ 26.6%
Number of deposit accounts per 10,000 adults 6,787 6,346 6,738
% of adults with at least one type of regulated credit accountf/ 10.5%
Number of credit accounts per 10,000 adults n.a. Notes
a/ Derived from the NSO census based population projection b/ Cities and municipalities c/ Data on the number of ATMs that allow both cash-in/out transactions are not available. d/ Other cash-in & cash-out access points include non-stock savings and loans associations (NSSLAs), non-bank
financial institutions (NBFIs), pawnshops, remittance agents, money changers/foreign exchange dealers and credit cooperatives.
e/ The indicator was sourced from the World Bank Findex which indicated that 26.6% of Filipino adults have an account at a formal financial institution.
f/ The indicator was sourced from the World Bank Findex which indicated that 10.5% of Filipino adults had a loan at a formal financial institution in the past 12 months.
The G20 Basic Set of Financial Inclusion Indicators
In 2012, G20 leaders endorsed the Basic Set of Financial Inclusion indicators (“the
Basic Set”). Brought forward by the Data and Measurement Sub-Group of the Global
Partnership for Financial Inclusion (GPFI), the Basic Set builds on the AFI’s Core Set.
Aside from measuring access and usage, the Basic Set also includes indicators on
small and medium enterprise (SME) access to finance.26
Categories Indicators 2011 2012 2013
Formally banked adults
% of adults with an account at a formal
financial institution 26.6%
Number of deposit accounts per 1,000 adults 679 635 674
Adults with credit by
regulated institutions
% of adults with at least one loan outstanding
from a regulated financial institution 10.5%
Formally banked
enterprises
% SMEs with deposit account at a formal
financial institution g/ 97.9%
Enterprises with
outstanding loan or line
of credit by regulated
institutions
% SMEs with an outstanding loan or line of
credit g/ 30.5%
Points of service Number of branches per 100,000 adults 14.0 14.2 14.7 g/ Source: World Bank Enterprise Surveys. These surveys are administered to a sample of non-agricultural
formal private firms and covered small, medium and large companies. The percentage reported is the average
for small and medium enterprises.
26 The concept note about the Basic Set can be accessed at:
http://www.gpfi.org/sites/default/files/G20%20Basic%20Set%20of%20Financial%20Inclusion%20Indicators.pdf
State of Financial Inclusion in the Philippines | 2013 Data Updates
30
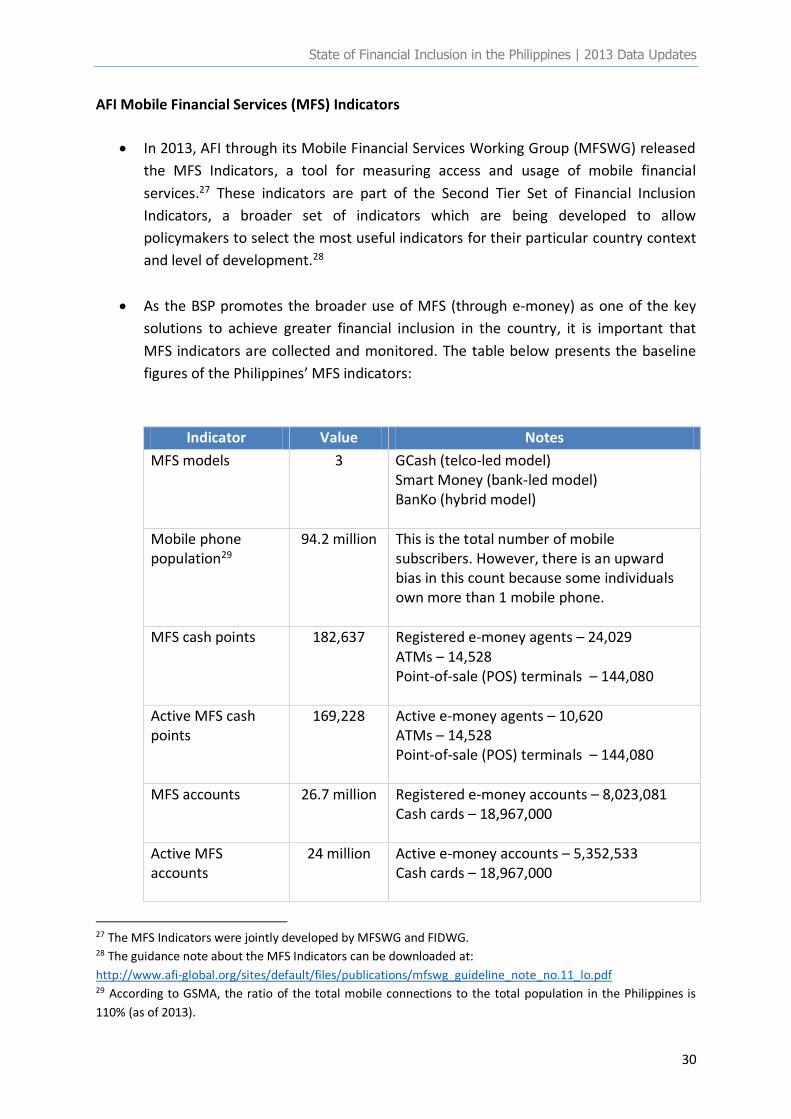
AFI Mobile Financial Services (MFS) Indicators
In 2013, AFI through its Mobile Financial Services Working Group (MFSWG) released
the MFS Indicators, a tool for measuring access and usage of mobile financial
services.27 These indicators are part of the Second Tier Set of Financial Inclusion
Indicators, a broader set of indicators which are being developed to allow
policymakers to select the most useful indicators for their particular country context
and level of development.28
As the BSP promotes the broader use of MFS (through e-money) as one of the key
solutions to achieve greater financial inclusion in the country, it is important that
MFS indicators are collected and monitored. The table below presents the baseline
figures of the Philippines’ MFS indicators:
Indicator Value Notes
MFS models 3 GCash (telco-led model) Smart Money (bank-led model) BanKo (hybrid model)
Mobile phone population29
94.2 million This is the total number of mobile subscribers. However, there is an upward bias in this count because some individuals own more than 1 mobile phone.
MFS cash points 182,637 Registered e-money agents – 24,029 ATMs – 14,528 Point-of-sale (POS) terminals – 144,080
Active MFS cash points
169,228 Active e-money agents – 10,620 ATMs – 14,528 Point-of-sale (POS) terminals – 144,080
MFS accounts 26.7 million Registered e-money accounts – 8,023,081 Cash cards – 18,967,000
Active MFS accounts
24 million Active e-money accounts – 5,352,533 Cash cards – 18,967,000
27 The MFS Indicators were jointly developed by MFSWG and FIDWG. 28 The guidance note about the MFS Indicators can be downloaded at:
http://www.afi-global.org/sites/default/files/publications/mfswg_guideline_note_no.11_lo.pdf 29 According to GSMA, the ratio of the total mobile connections to the total population in the Philippines is
110% (as of 2013).
State of Financial Inclusion in the Philippines | 2013 Data Updates
31
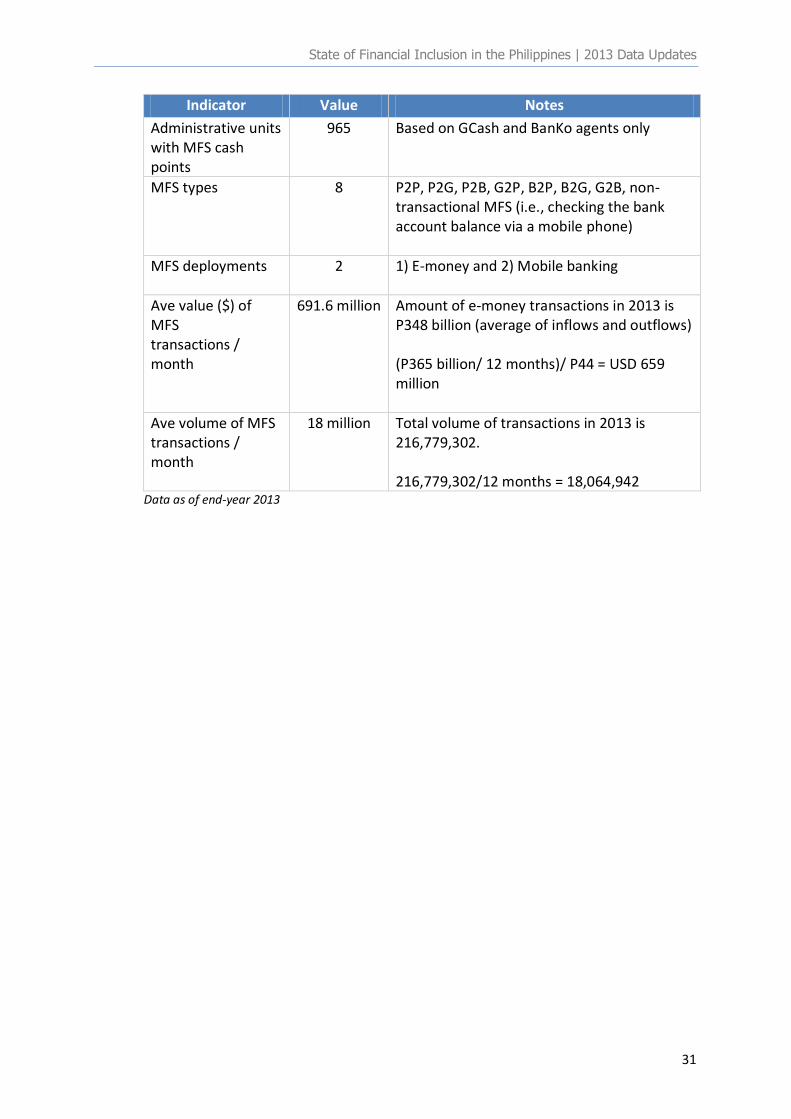
Indicator Value Notes
Administrative units with MFS cash points
965 Based on GCash and BanKo agents only
MFS types 8 P2P, P2G, P2B, G2P, B2P, B2G, G2B, non-transactional MFS (i.e., checking the bank account balance via a mobile phone)
MFS deployments 2 1) E-money and 2) Mobile banking
Ave value ($) of MFS transactions / month
691.6 million Amount of e-money transactions in 2013 is P348 billion (average of inflows and outflows) (P365 billion/ 12 months)/ P44 = USD 659 million
Ave volume of MFS transactions / month
18 million
Total volume of transactions in 2013 is 216,779,302. 216,779,302/12 months = 18,064,942
Data as of end-year 2013
State of Financial Inclusion in the Philippines | 2013 Data Updates
32
Box 1 Spatial Dimension of Financial Inclusion
Spatial data analysis has greatly improved the way financial inclusion is measured. It
provides answers to important questions like “How many people are within a kilometer
radius of a bank?” and “What is the spatial distribution of mobile phone users?” It addresses
the limitations of standard but crude access measures (i.e., number and reach of banks,
ATMs and other access points). These measures do not consider the clustering of access
points and the population within city boundaries, among others. In addition, developments
in spatial data analysis include transaction layers that will provide level of activities of access
points and poverty density estimation. Spatial data analysis can therefore easily identify
those geographies that are underserved or unserved due to distance.
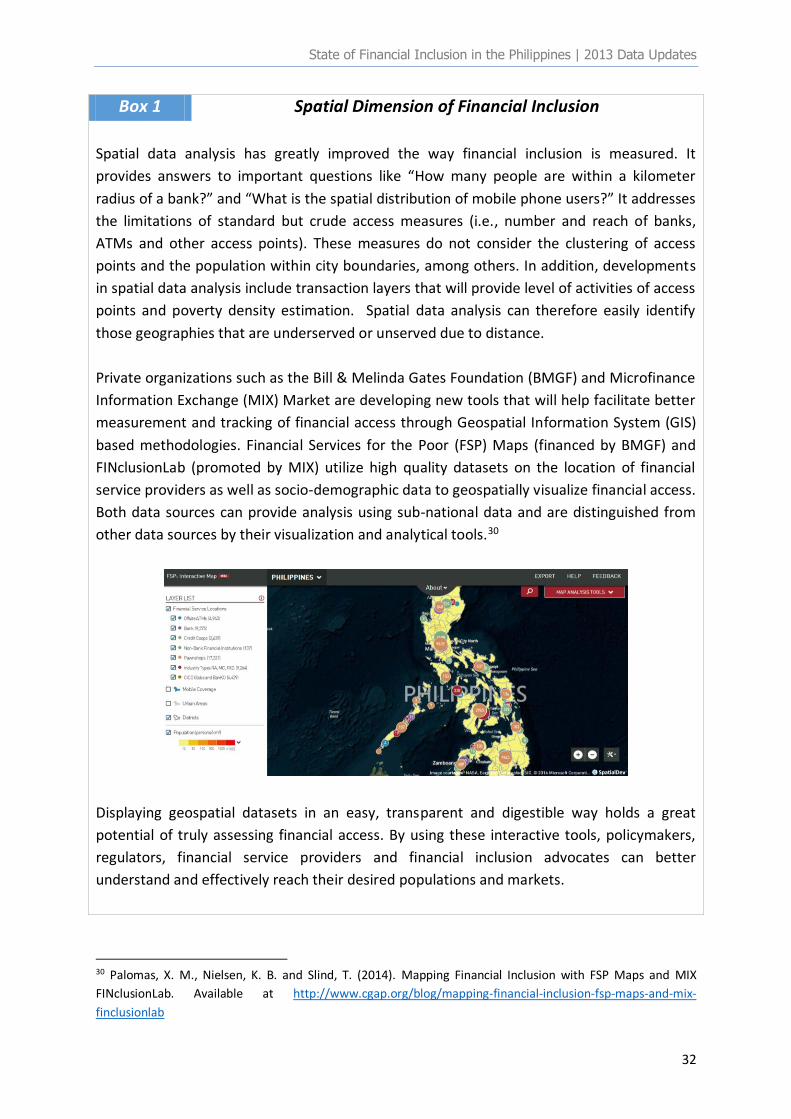
Private organizations such as the Bill & Melinda Gates Foundation (BMGF) and Microfinance
Information Exchange (MIX) Market are developing new tools that will help facilitate better
measurement and tracking of financial access through Geospatial Information System (GIS)
based methodologies. Financial Services for the Poor (FSP) Maps (financed by BMGF) and
FINclusionLab (promoted by MIX) utilize high quality datasets on the location of financial
service providers as well as socio-demographic data to geospatially visualize financial access.
Both data sources can provide analysis using sub-national data and are distinguished from
other data sources by their visualization and analytical tools.30
Displaying geospatial datasets in an easy, transparent and digestible way holds a great
potential of truly assessing financial access. By using these interactive tools, policymakers,
regulators, financial service providers and financial inclusion advocates can better
understand and effectively reach their desired populations and markets.
30 Palomas, X. M., Nielsen, K. B. and Slind, T. (2014). Mapping Financial Inclusion with FSP Maps and MIX
FINclusionLab. Available at http://www.cgap.org/blog/mapping-financial-inclusion-fsp-maps-and-mix-
finclusionlab
State of Financial Inclusion in the Philippines | 2013 Data Updates
33
Box 2 Relationship between Access and Usage
The number and reach of banks and other access points have certainly expanded, but has
this resulted to more usage of financial products and services? To answer this question,
regression analysis was performed. The number of banks per 10,000 adults was used as a
measure of access while the number of deposit accounts per 10,000 adults served as a
proxy for usage. To control for other factors that may have an effect on usage, several
economic variables were incorporated in the regression model. Provinces were used as units
of analysis since analyzing at the city/ municipal level would limit the number of variables
that could be utilized in statistical modeling31. The variables in the econometric model were
listed in the following table:
Provincial data Variable Name Source and Date
Number of deposit accounts per 10,000 adults dep_acct_per10k BSP (2013)
Number of banking offices per 10,000 adults banks_per10k BSP (2013)
Number of ATMs per 10,000 adults atms_per10k BSP (2013)
Income class income_class NSCB (2013)
Number of cities cities NSCB (2013)
Poverty incidence poverty NSO (2012)
Number of businesses businesses NSO (2011)
Percentage of employed individuals employment NSO (2011)
Total local resources (tax and non-tax revenue) resources BLGF (2012)
Annual average family income family_income NSO (2009)
Number of new residential building constructions residential NSO (2012)
Note: NSO – National Statistics Office; NSCB – National Statistical Coordination Board; BLGF – Bureau of Local
Government Finance
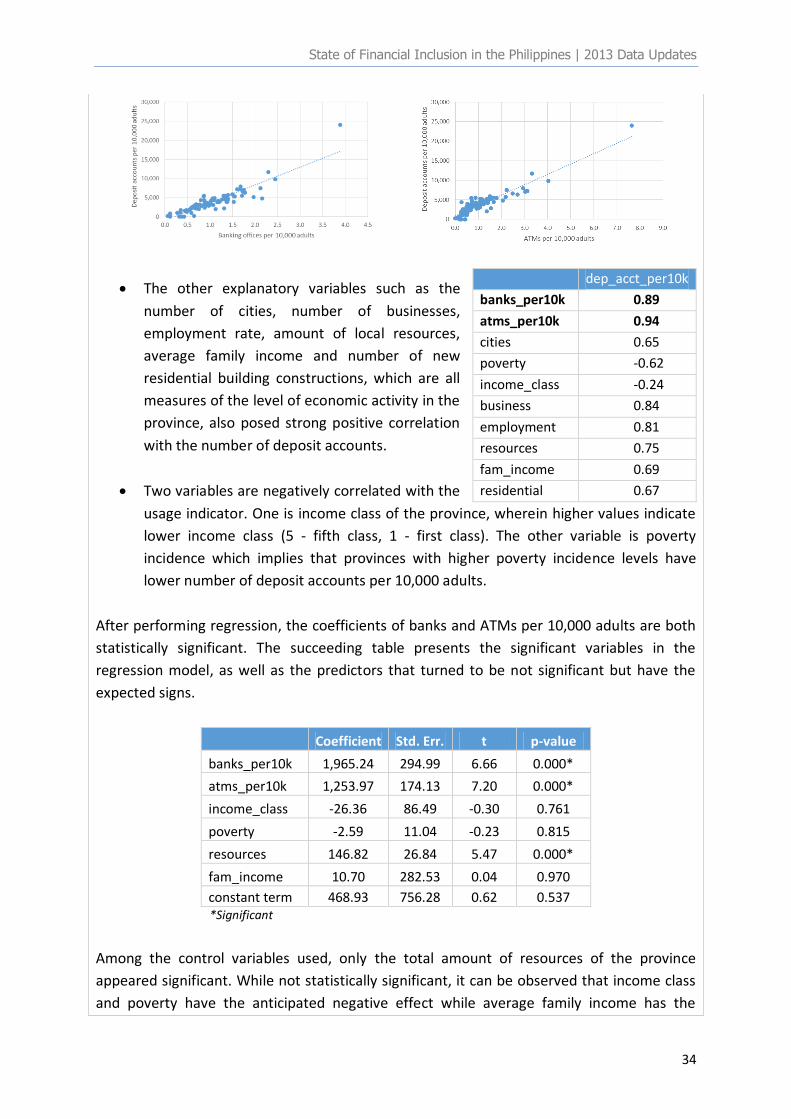
Looking at the correlations, it was observed that the explanatory variables have the
expected signs and are highly correlated with the usage indicator.
A clear correlation exists between number of banks and number of deposit accounts
per 10,000 adults: the two variables present a strong positive correlation of 89%.
Accounting for the outlier (which is NCR), the adjusted correlation between the two
variables is still high at 88.6%. Similarly, the number of ATMs and the number of
deposit accounts have a high correlation of 94% (including NCR) and 87.7% (without
NCR).
31 There were limited data available at the city/ municipality level.
State of Financial Inclusion in the Philippines | 2013 Data Updates
34
The other explanatory variables such as the
number of cities, number of businesses,
employment rate, amount of local resources,
average family income and number of new
residential building constructions, which are all
measures of the level of economic activity in the
province, also posed strong positive correlation
with the number of deposit accounts.
Two variables are negatively correlated with the
usage indicator. One is income class of the province, wherein higher values indicate
lower income class (5 - fifth class, 1 - first class). The other variable is poverty
incidence which implies that provinces with higher poverty incidence levels have
lower number of deposit accounts per 10,000 adults.
After performing regression, the coefficients of banks and ATMs per 10,000 adults are both
statistically significant. The succeeding table presents the significant variables in the
regression model, as well as the predictors that turned to be not significant but have the
expected signs.
Coefficient Std. Err. t p-value
banks_per10k 1,965.24 294.99 6.66 0.000*
atms_per10k 1,253.97 174.13 7.20 0.000*
income_class -26.36 86.49 -0.30 0.761
poverty -2.59 11.04 -0.23 0.815
resources 146.82 26.84 5.47 0.000*
fam_income 10.70 282.53 0.04 0.970
constant term 468.93 756.28 0.62 0.537 *Significant
Among the control variables used, only the total amount of resources of the province
appeared significant. While not statistically significant, it can be observed that income class
and poverty have the anticipated negative effect while average family income has the
dep_acct_per10k
banks_per10k 0.89
atms_per10k 0.94
cities 0.65
poverty -0.62
income_class -0.24
business 0.84
employment 0.81
resources 0.75
fam_income 0.69
residential 0.67
State of Financial Inclusion in the Philippines | 2013 Data Updates
35
expected positive effect. The observation that financial access indicators are highly
significant while the control variables are not contributing much to the variation in deposit
accounts may suggest that usage is generally reinforced by access.
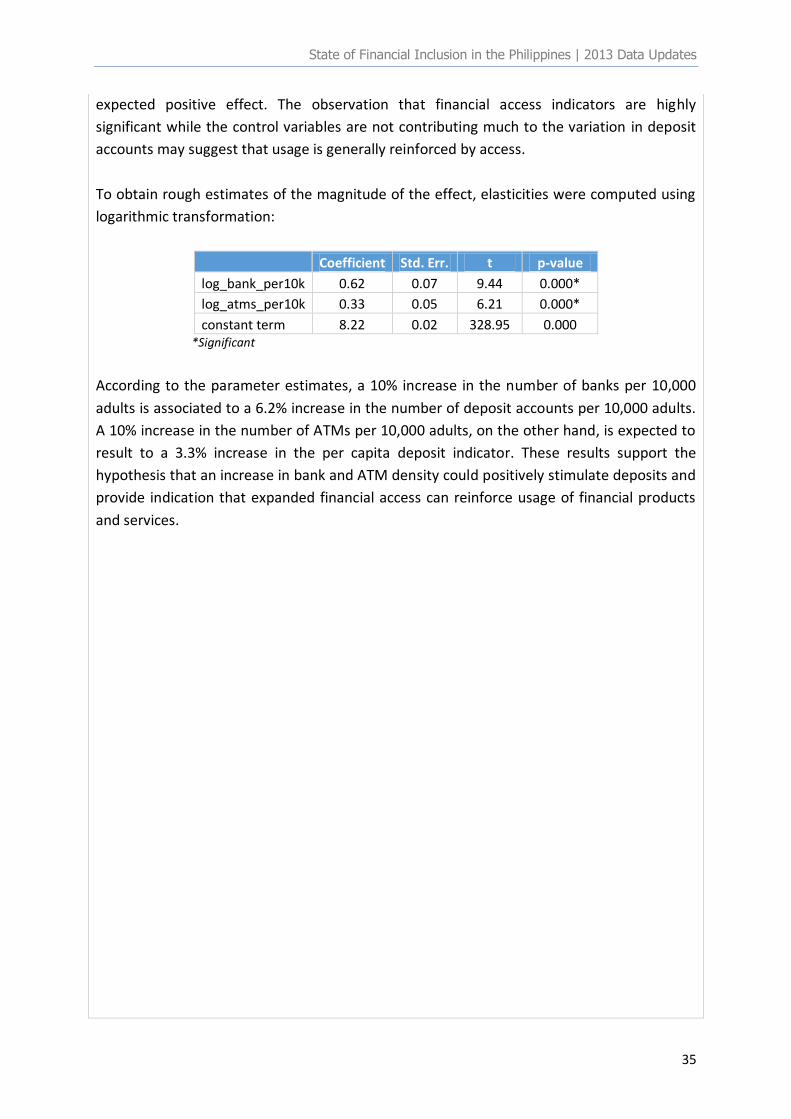
To obtain rough estimates of the magnitude of the effect, elasticities were computed using
logarithmic transformation:
Coefficient Std. Err. t p-value
log_bank_per10k 0.62 0.07 9.44 0.000*
log_atms_per10k 0.33 0.05 6.21 0.000*
constant term 8.22 0.02 328.95 0.000 *Significant
According to the parameter estimates, a 10% increase in the number of banks per 10,000
adults is associated to a 6.2% increase in the number of deposit accounts per 10,000 adults.
A 10% increase in the number of ATMs per 10,000 adults, on the other hand, is expected to
result to a 3.3% increase in the per capita deposit indicator. These results support the
hypothesis that an increase in bank and ATM density could positively stimulate deposits and
provide indication that expanded financial access can reinforce usage of financial products
and services.
State of Financial Inclusion in the Philippines | 2013 Data Updates
36
CONCLUDING NOTES
In summary, it can be stated that the reach of the Philippine financial system
continues to improve. There are sustained increases in the number and reach of banks,
ATMs and other financial service providers. The archipelagic nature of the Philippines poses
a serious challenge to financial access, but the BSP’s ground-breaking measures through
micro-banking offices and e-money have contributed in addressing the physical barriers that
hinder people from being included in the formal financial system.
While access to finance has improved, the BSP believes that effective access does
not only mean that financial service touch points are available. Aside from physical access to
financial services, these services must be affordable, of good quality and relevant to lead to
actual usage that can benefit the person accessing the said service. Using available supply-
side information on deposits, loans, microfinance and e-money, this report showed that
there is increased usage of financial products and services. There is also indication that the
increase in financial access contributed to more usage of financial products and services.
In the past, financial inclusion policies were informed mainly by anecdotal evidence
and stories. While this approach has been helpful, the BSP recognizes the importance of
having a reliable and robust financial inclusion data framework that would inform decision
making and policy formulation. While significant progress has been made in financial
inclusion measurement, there is still much work that needs to be done to create a clearer
picture of financial inclusion in the Philippines.
As stated in the introduction of this report, there are more complex questions on
consumer experience and consumer impact that existing supply-side information cannot
capture. Moving forward, the BSP is committed to continuously improve its financial
inclusion data framework by implementing demand-driven data gathering exercises so that
later on there will be solid evidence to assess progress and measure impact of regulations
on financial inclusion. With the continuous initiatives to improve the collection of both
supply-side and demand-side information on financial inclusion, the BSP envisions that data
and deeper measurement will play greater role in its financial inclusion policymaking.


![Financial Inclusion: General Overview, Central Banks …...Financial Inclusion [General Overview] •Financial inclusion or inclusive financing is the delivery of financial services](https://img.pdfslide.net/doc/110x75/5e95eef43708446e852354fe/financial-inclusion-general-overview-central-banks-financial-inclusion-general.jpg)