Embed Size (px)
Citation preview
Report on the Sudbury NVD-Aided Aerial Forest Fire DetectionTrials held during the Summer of 2010
Tomkins, L., Andriychuk, T, Zacher, J. E., Ballagh, M., McAlpine, R.,Doig, T., Craig, G., Filliter, D., Milner, A. and Allison, R.S.
Technical Report CSE-2011-02
February 14 2011
Department of Computer Science and Engineering4700 Keele Street, Toronto, Ontario M3J 1P3 Canada
1
Report on the Sudbury NVD-‐Aided Aerial Forest Fire Detection Trials held during the Summer of 2010
Ontario Centres of Excellence Contract
OCE YO RE R50694-‐08: Advanced Sensors and Mapping for Forest Fire Suppression
First Release February, 14, 2011
Tomkins, L., Andriychuk, T., Zacher, J.E., Ballagh, M., McAlpine, R., Doig, T.,
Craig, G., Filliter, D., Milner, A., Allison, R.S.
York University 4700 Keele Street
Toronto ON

2
M3J 1P3 Revision History
Feb. 14, 2011 – Initial release.
3
Table of Contents
Executive Summary ............................................................................................................................................ 4
Summary ................................................................................................................................................................ 5
Rationale ................................................................................................................................................................ 6
Objectives............................................................................................................................................................... 6
Methods .................................................................................................................................................................. 6 Materials .........................................................................................................................................................................................7 Flight Crew Roles.........................................................................................................................................................................7 Tasks .................................................................................................................................................................................................7
Results..................................................................................................................................................................... 8 Flights...............................................................................................................................................................................................8 Debrief........................................................................................................................................................................................... 31
Strategies, Observations & Anecdotes........................................................................................................32
Quantitative Data Analysis.............................................................................................................................34 Mean distances.......................................................................................................................................................................... 34 Signal detection ........................................................................................................................................................................ 34 Size Estimates ............................................................................................................................................................................ 37
Discussion and Conclusions...........................................................................................................................37 Flight Parameters .................................................................................................................................................................... 37 NVD Detection Feasibility .................................................................................................................................................... 37 Fire Size and Distance Estimates ...................................................................................................................................... 38 NVD Discrimination of Light Sources as Fires............................................................................................................. 39 Fire Monitoring......................................................................................................................................................................... 40
Recommendations ............................................................................................................................................41
References ...........................................................................................................................................................43
4
Executive Summary Early detection of forest fires, while still in their emergent stages, could greatly improve
suppression effectiveness and reduce overall costs. When used for aerial detection patrols, night vision devices (NVD) have potential to improve response times to potential starts and to improve sensitivity. The flight trials described in this report were designed to explore the potential for NVD-‐aided wildfire detection in a real operational context.
A total of 14 detection flights in EC130 helicopters took place across eight nights between May and August 2010 in the vicinity of Sudbury, Ontario. Flights were planned over regions where a dense pattern of recent lightning strikes were recorded. Initial parameters for flights, including speed, altitude and length of flight were determined in a previous study over the Pembroke IR detection grid. The Ontario Ministry of Natural Resources (OMNR) was responsible for monitoring various weather patterns, fuel indices and predictive models, in order to predict an increase in the number of lightning initiated forest fires. All members of the flight crew were responsible for detecting and discriminating fires.
The results demonstrate that small fires can be detected and reliably discriminated using NVDs at night even when used by novice observers in populated areas. Discrimination proved to be the most difficult part of the task. However, knowledge of the geographical area and experience in NVD fire detection is vital to improve efficiency. NVD detection patrols are a valuable tool for early fire detection if used in a manner that maximizes efficiency, including reliance on user experience, fire intelligence and effective flight path planning.
5
Summary Wildland fires are a continual threat to people, communities and natural resources across
Canada. Early detection of forest fires, while still in their emergent stages, could greatly improve suppression effectiveness and reduce overall costs. In Ontario, approximately half of all fires are ignited by lightning strikes. An extensive lightning locator sensor system combined with modern predictive modelling can indicate areas with a high probability of new starts. Early detection also relies on the ability to fly detection patrols sooner to detect fires while they are small. NVDs are head-‐mounted electro-‐optical devices that amplify available light in the scene, greatly improving visibility. When used for aerial detection patrols, NVDs have the potential to improve response times to nascent fires and to improve sensitivity. The ability to fly safely at night increases operational windows and allows for IR detection of hot spots and fires in darker, cooler conditions when contrast of the fire to the background is improved. We envision that it would be advantageous to fly fire-‐intelligence guided night-‐time detection patrols following thunderstorm activity thereby identifying fires early and permitting suppression with minimal delay. The flight trials described in this report were designed to explore the potential for NVD aided detection in a real operational context.
A total of 14 detection flights took place across eight nights between May and August 2010 in the vicinity of Sudbury, Ontario. The aircraft and experimenters were based out of the local airport and flew an average of two detection patrols per night in an EC130 helicopter. All crew wore Generation III, ANVIS 4949 binocular NVDs mounted to their flight helmets. The pilots have NVD certification and extensive detection experience. All crew members were responsible for detecting and discriminating fires. During the flights, the following events and associated geographical locations were logged by the observer and/or experimenter using custom software: the detection of a suspected fire, the discrimination of a detected event as a true fire or not, as well as the actual location of the fire. If the target was confirmed as a fire it was approached so that its exact location and characteristics, such as intensity, size and fuel source, could be recorded.
Isolated light sources could be seen at distances of many kilometres but observers needed to be nearer to identify a light as a potential source worthy of further investigation (an event referred to in this report as detection). The average detection distance across all nights was 6,678 m (95%CI: 3,215 m to 10,140 m). The average discrimination distance, where a source could be definitively confirmed as a fire or not, was 1,618 m (95%CI: 1,057 m to 2,179 m). Events were classified as hits, correct rejections, misses or false alarms. Misses occurred when the flight crew failed to detect or discriminate a fire. The average percentage hit rate (number of fires found divided by number of actual fires) was 62.5 per cent at 10 km visibility and 51 per cent at 20 km visibility. It is important to note that some events were pursued even though the crew were aware that they were not fires. This was done so that the novice members of the flight crew could learn and so that common distractions could be documented. As such, in an operational context, particularly with experienced observers who have knowledge of the terrain, the hit rate would be higher. There were a total of 70 targets investigated, of which 35 (50%) were fires (20 were forest fires and 15 were campfires). Of the forest fires, 5 (7%) were previously unknown to the OMNR. It is important to note that the crew was not informed of the existence or location of existing fires and thus detected fires were truly (new) hits for the detection patrol, even if previously known to OMNR. Similarly, although one would not normally expect detection patrols to waste time investigating known fires, since the detection patrol crew was not provided information on existing fires, they were attempting to detect all fires along their patrol route and any fires missed were thus true misses. The most common distractions were houses. Flickering lights from houses beneath the canopy were most
6
likely to be detected and subsequently correctly discriminated from fires. Correct rejections also declined with time, perhaps as observers became more discriminating in which targets they chose to investigate.
The pilots were the most effective observers, however, the novice observers who flew most frequently performed at a similar level as the pilots. In addition, the pilots were the most familiar with the geographical area. Knowledge of the area and experience in both fire spotting and NVD use is critical for improving performance. If detection had of been left up to the pilots alone, the number of distractions would have been reduced and the hit rate would have likely been higher.
Rationale Forest fires are a continual threat to people, communities and natural resources across Canada.
Although forest fires are a natural ecological process, unwanted fires can threaten valuable timber resources or the limited old-‐growth forest remaining. Furthermore, with concerns about global warming and carbon emissions, there is incentive to prevent, control and extinguish fires—even those that do not threaten commercial or natural heritage forests. Early detection of forest fires, while the fires are still in their emergent stages, would greatly improve suppression success and reduce overall costs. This experiment sought to examine the efficacy of NVDs in the aerial detection of forest fires in a operational context. Parameters and protocols for this experiment were fine tuned during controlled fire detection trials in Pembroke, Ontario (Andriychuk et al, 2010).
Objectives Specific objectives included:
1. Determine the feasibility of detecting wildland fires at night
a. Can small fires be detected at night?
b. Can wildland fires be discriminated from other light sources?
c. Are NVDs efficient in early wildland fire detection?
2. Provide an opportunity to evaluate and develop software for night vision aided detection. A tablet computer running a prototype of the OMNR developed FireHawk reporting software was tested
Methods From May through August 2010, 14 flights took place in the vicinity of Sudbury, Ontario. The
OMNR continually monitors real-‐time weather information, forest fuel indices, historical trends and other indices. When the weather and fuel indices were conducive to lighting strike fires, a small team of researchers began night flights for data collection.
7
On the first night there was a safety briefing regarding the EC130 and a briefing about experimental goals and procedures. Every night before take off the York University staff and OMNR personnel assembled for a pre-‐flight briefing and equipment check. Prior to take off, each member of the flight crew calibrated their NVDs and setup the experimental equipment. In addition, the observer filled out a brief questionnaire to indicate the number of hours they had slept and their current level of fatigue. Flights typically began at 22:30 each night and continued until approximately 04:00 the following morning. For example, flights on May 27th refer to the group of flights that took off on the evening of May 27th and ended the morning of May 28th.
Materials
Generation III ANVIS 4949 binocular night vision goggles were used while mounted to flight helmets. Data recording was done using a custom form in Microsoft OneNote 2007 on a Toshiba Portégé tablet computer. A custom sized Korry Nightshield NSX General Purpose IR Absorbing Film (PN 38421-‐001) NVD compatible filter was placed over the display screen of the tablet in order to minimize the amount of ambient light from the screen that may wash out the NVDs. A custom mount was fabricated to hold a pair of NVDs in front of the lens of a Canon FS200 or a Canon HD Vixia HF20 digital camcorder in order to record image intensified video. Audio from the cockpit intercom loop was fed directly into the camera. A Garmin GPS 96C was used to mark the aircraft location in flight. The Firehawk system consisted of custom software on a Panasonic U1 Toughbook. Most flights took place in an EC130 helicopter; during one sortie it was necessary to fly in an AS350. Infrared (IR) still images were taken using a FLIR ThermaCAM P25.
Flight Crew Roles
Flight crew consisted of five or six people; two pilots, one observer, one experimenter, one audio/video technician and occasionally one Firehawk technician. All crew members were responsible for detecting fires. Occasionally events were pursued even though some crew members were aware that they were not fires. This was done so that the novice members of the flight crew could learn and so that common distractions could be documented. All data about pursued targets were recorded by the observer using the tablet computer. This same information was recorded by the experimenter on a paper form identical to the one on the tablet computer. This was a redundancy in the event the tablet computer stopped working. The experimenter or the observer operated the Garmin GPS, which they used to mark waypoints and the time. An audio/video technician continually recorded audio and video during most flights. A Firehawk technician recorded fire location and characteristics on the Toughbook. Occasionally it was necessary to fly without an audio/video technician or a Firehawk technician. During three flights there was one pilot instead of two.
Tasks
Each night the Aircraft Management Officer planned two detection routes which brought the aircraft over an area that had recently been subject to a large number of lightning strikes. Before take-‐off the York University staff and OMNR personnel assembled for a pre-‐flight briefing and equipment check. Prior to take-‐off, each member of the flight crew calibrated their night vision goggles and setup the experimental equipment. In addition, the primary observer filled out a brief questionnaire to indicate the number of hours they had slept and their current level of fatigue.
8
Detection patrols typically flew at an altitude between 3,000 feet (ft) to 4,000 ft above ground level (AGL) and at a speed between 60 and 90 knots. In flight, crew members scanned their visible area for potential fires (MacFayden et al, 2008). Once a crew member spotted a target of interest they notified the rest of the crew. As a group, the crew then conferred and decided whether the target was a potential fire. If they decided to pursue the target the GPS was used to provide a waypoint and time, which marked the aircraft location for target detection. Note that typically the light source was visible for some distance before this detection distance (i.e., detection refers to identification of a possible fire not detection of the light source). The pilots deviated from the planned flight path towards the target. Upon closer inspection the crew either confirmed or rejected the target as a fire. Once again, a waypoint and time was recorded in order to mark the aircraft location for target discrimination. If the target was confirmed as a fire, it was circled so that its exact location and fire characteristics, such as intensity, size and fuel source, could be recorded. A final waypoint and time was recorded to mark the approximate fire location. Once all the required data was recorded the pilots returned to the flight path. If a target was identified as something other than a fire, the flight crew attempted to identify the target and returned to the flight path.
Results
Flights
The amount of light reflected by the moon has a significant effect on NVD use, too little or too much light can reduce image quality from optimal. Between groups of flights the moon phase varied a great deal; during one set of flights it was full while during another set it was absent. Although this resulted in a significant difference in ambient illumination, NVDs greatly improve visibility compared to unaided viewing. Thus effective night-‐time detection patrols and detection of active fires were feasible across this range of illumination. Total flight time was approximately 27 hours and 56 minutes. Below is a description of the weather and flight paths taken each night. Fire descriptions and any special circumstances are also noted here.
Edited video footage, images and the Pembroke Report can be found at http://www.cse.yorku.ca/percept/NVG/Sudbury%20Report/
May 27th – 30th
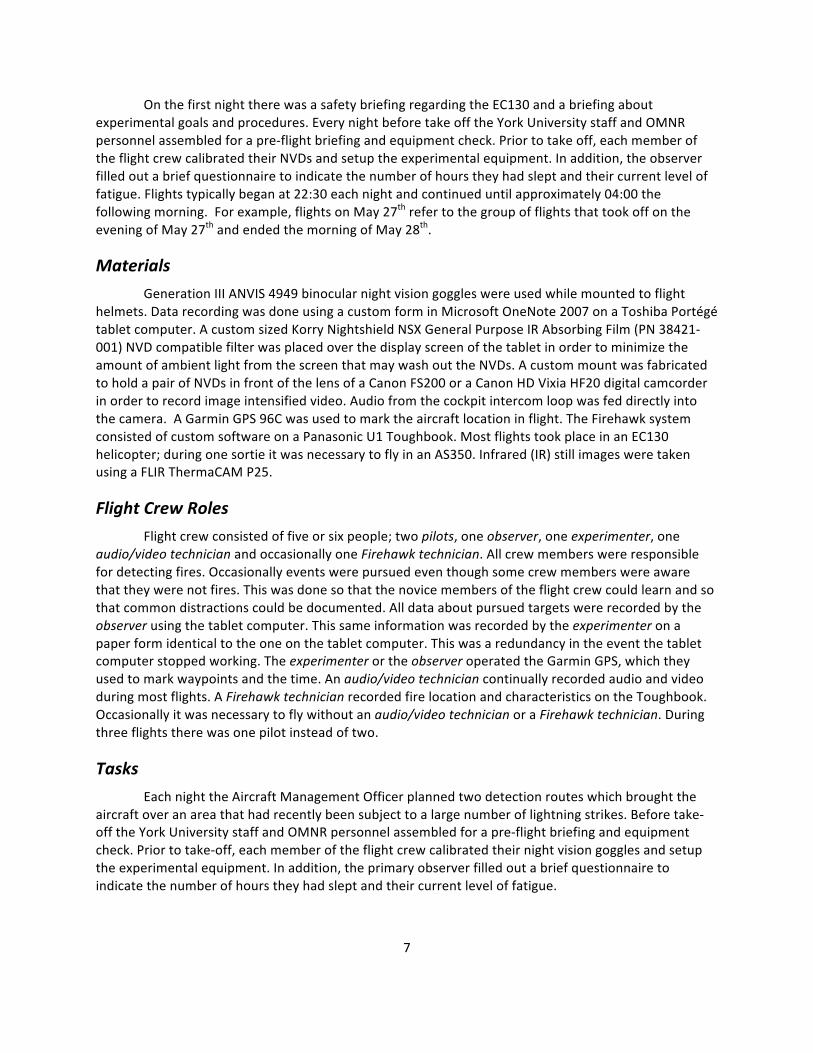
Across these four nights there were seven sorties flown and fourteen fires found. Visibility was reported at 15 statute miles for each evening. The moon was full. Cloud ceiling varied between unlimited or broken at 8,000 ft. The air temperature was 14-‐20 °C with a dew point of 10-‐12 °C. Wind speed varied between 3-‐10 knots. All flight paths for May are shown in Figure 1.
9
Figure 1: Flight paths during May flights. White is May 27th, purple is May 28th, yellow is May 29th and blue is May 30th. Two sorties were flown on each night except for May 27th when one sortie was flown. Note this shows actual flight paths rather than planned routes. For each patrol a detection flight path was planned through lightning corridors. Deviations from the planned route are due to targets being identified and subsequently investigated.
May 27th
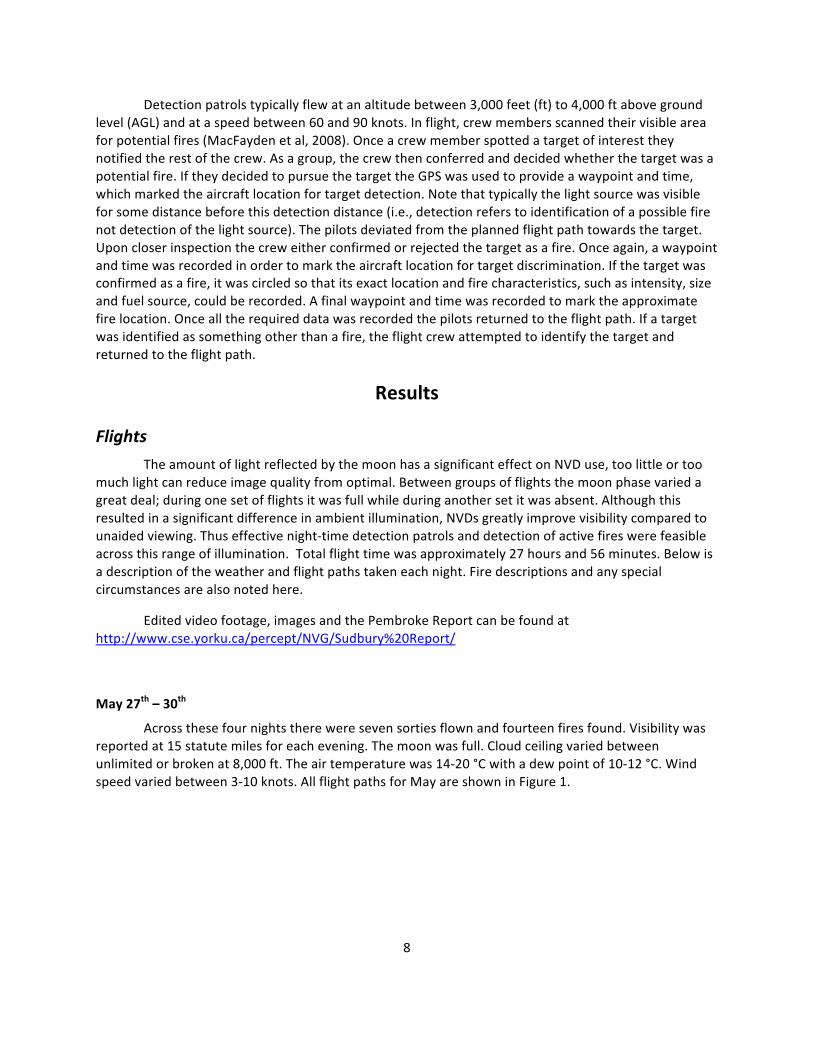
There was one sortie on this night. No experimenter or audio/video technician was on board, therefore only audio (no video) was recorded. Figure 2 shows the flight path with all active fires in the vicinity. Three fires were found during this flight, two of which were new to the OMNR.
10
Figure 2: Google Earth image of flight path and active fires on May 27th. Found forest fires are yellow and missed forest fires are red. Gaps in the flight path resulted from GPS signal loss.
The first fire found was North Bay 29 (NOR29). This was the fire previously known to the OMNR. The day patrol confirmed NOR29 as a fire on May 27th at 0.8 hectares (ha) in size. The night patrol recorded fire intensity rank 2 and 0.4 ha. Distance and size estimates using NVDs can be problematic (discussed later on page 38). It was confirmed as out on May 30th with a final fire size of 0.8 ha.
The second fire was NOR31 found south of Lady Evelyn Provincial Park. This was a new fire and was confirmed as such the following day with a rank of 1. The night patrol recorded fire intensity rank 2 and a size of 0.1 ha. The fire remained at 0.1 ha and was confirmed as out on May 29th.
The final fire was also a new fire, NOR30. It was located just over half a kilometre (km) from NOR31. Similar to NOR31 it was confirmed as a fire the following day with a rank of 1. The night patrol ranked this fire as 2 and 0.1 ha. It was confirmed as out on May 28th.
All information about misses was taken from the OMNR fire database, current fire reports in the OMNR’s daily strategic operating plans or, if necessary, from their active fire map website1. Fires listed as OUT or under control (UCO, after discussions with fire managers it was learned that this typically refers to fires that have had extensive suppression work and would be extinguished or close to being extinguished and thus very difficult to detect) were considered extinguished and not included as misses. Three fires were missed during this evening. At a visibility of 10-‐15 km the night patrol missed one fire, NOR27. NOR27 was confirmed as a fire on May 27th at 0.3 ha. On May 29th it was declared out (UCO on May 28) with a final fire size of 0.5 ha.
1 http://forest.lrc.gov.on.ca/AFFM/fire/interactivemap/firemap_English.htm
11
At a visibility of 20-‐24 km one additional fire was missed, SUD42. It was confirmed on May 27th at 0.2 ha. It was extinguished on May 29th.
May 28th
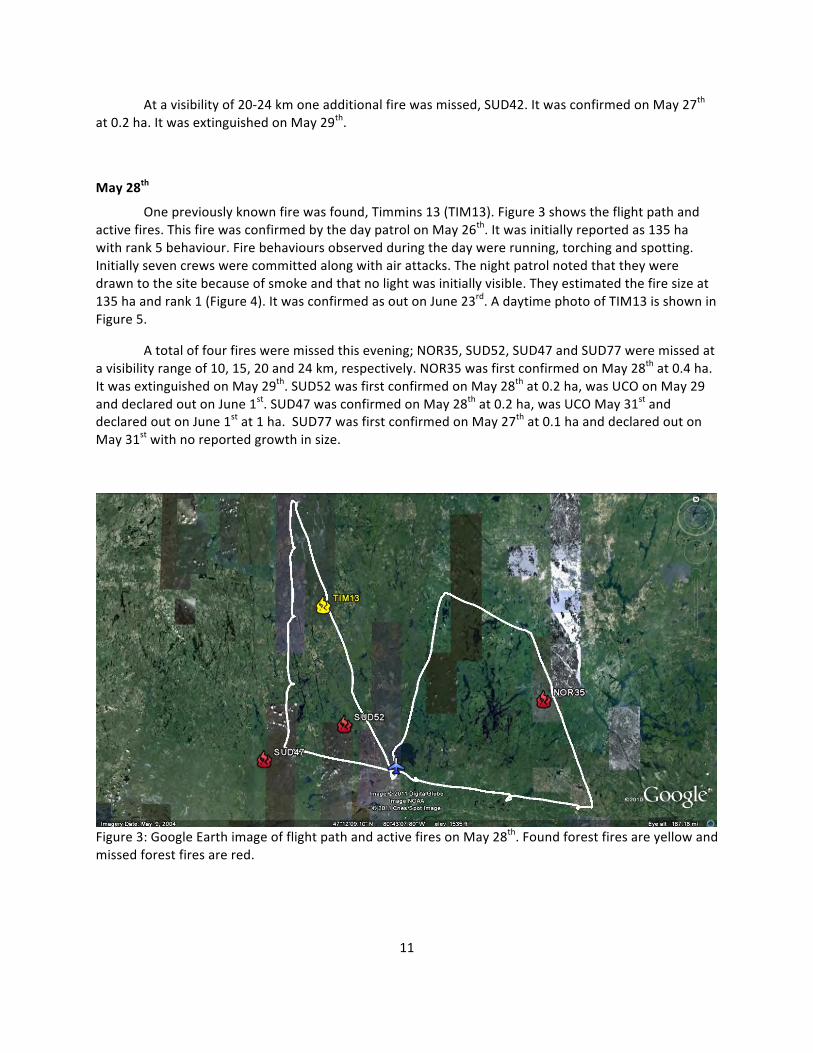
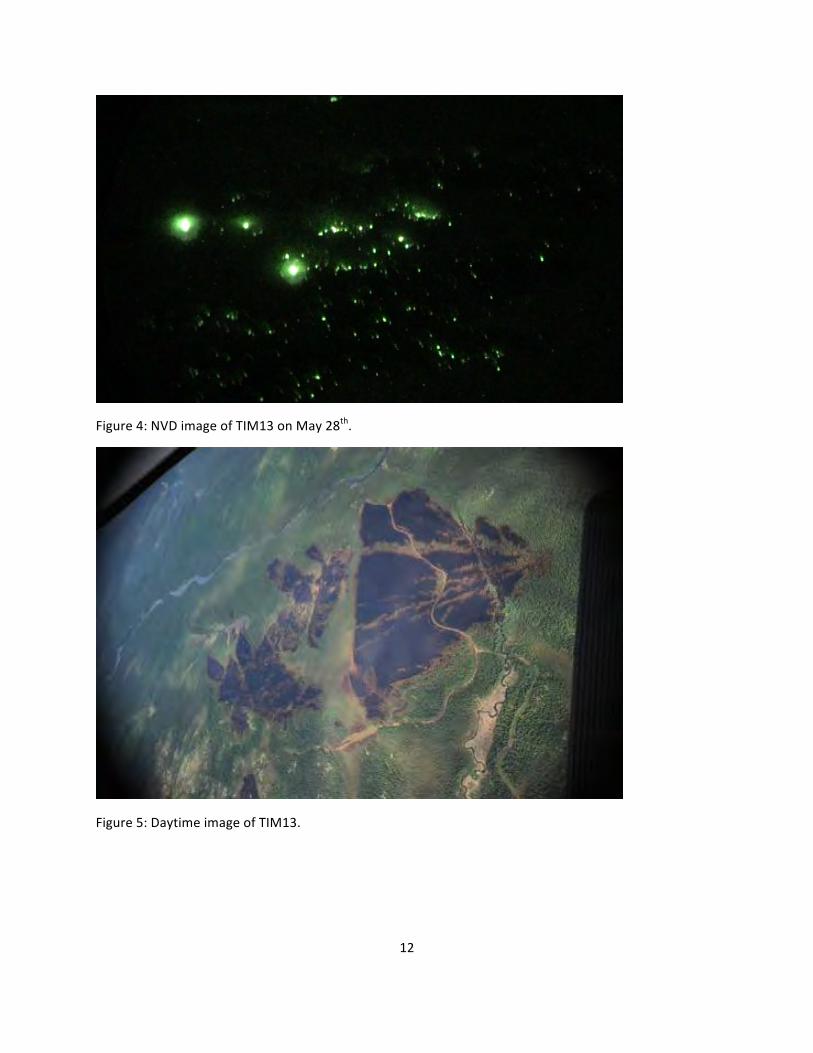
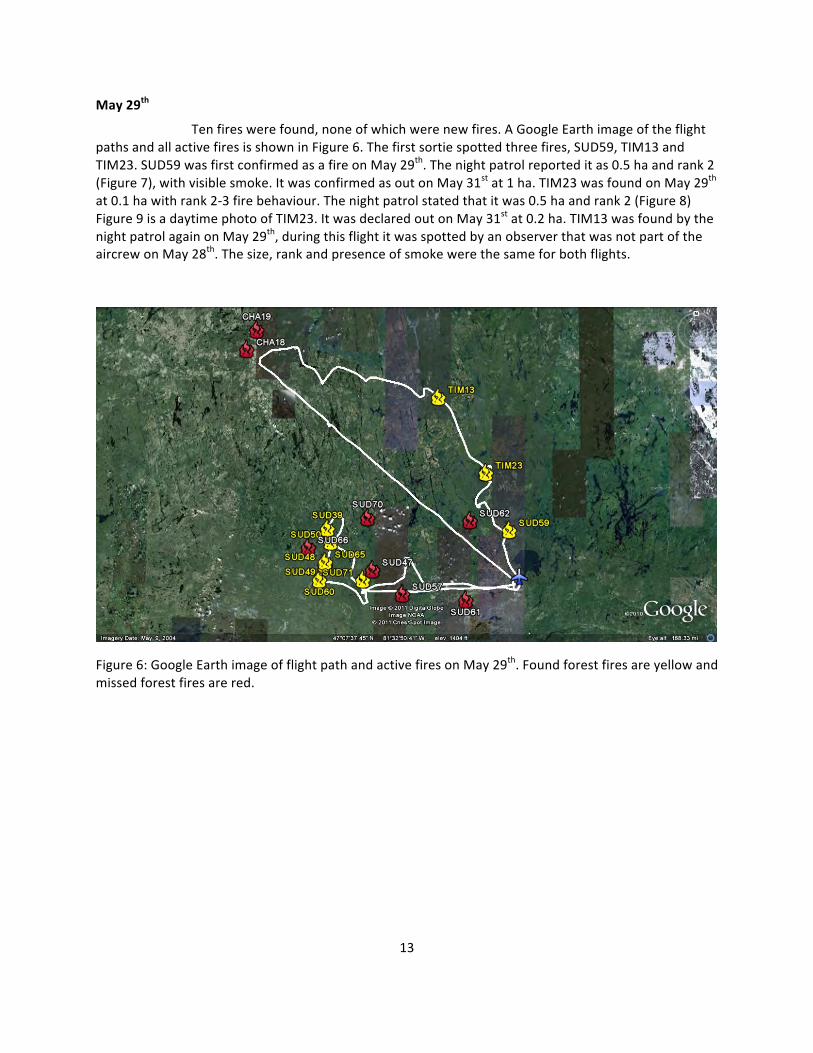
One previously known fire was found, Timmins 13 (TIM13). Figure 3 shows the flight path and active fires. This fire was confirmed by the day patrol on May 26th. It was initially reported as 135 ha with rank 5 behaviour. Fire behaviours observed during the day were running, torching and spotting. Initially seven crews were committed along with air attacks. The night patrol noted that they were drawn to the site because of smoke and that no light was initially visible. They estimated the fire size at 135 ha and rank 1 (Figure 4). It was confirmed as out on June 23rd. A daytime photo of TIM13 is shown in Figure 5.
A total of four fires were missed this evening; NOR35, SUD52, SUD47 and SUD77 were missed at a visibility range of 10, 15, 20 and 24 km, respectively. NOR35 was first confirmed on May 28th at 0.4 ha. It was extinguished on May 29th. SUD52 was first confirmed on May 28th at 0.2 ha, was UCO on May 29 and declared out on June 1st. SUD47 was confirmed on May 28th at 0.2 ha, was UCO May 31st and declared out on June 1st at 1 ha. SUD77 was first confirmed on May 27th at 0.1 ha and declared out on May 31st with no reported growth in size.
Figure 3: Google Earth image of flight path and active fires on May 28th. Found forest fires are yellow and missed forest fires are red.
12
Figure 4: NVD image of TIM13 on May 28th.
Figure 5: Daytime image of TIM13.
13
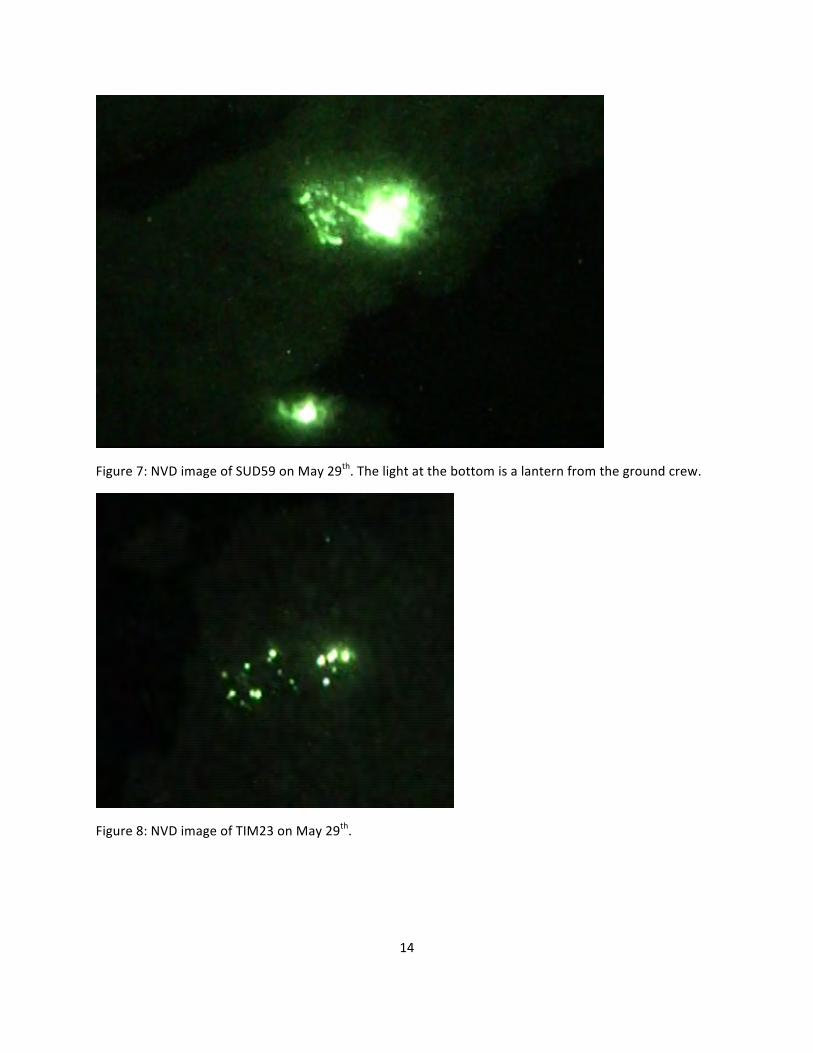
May 29th
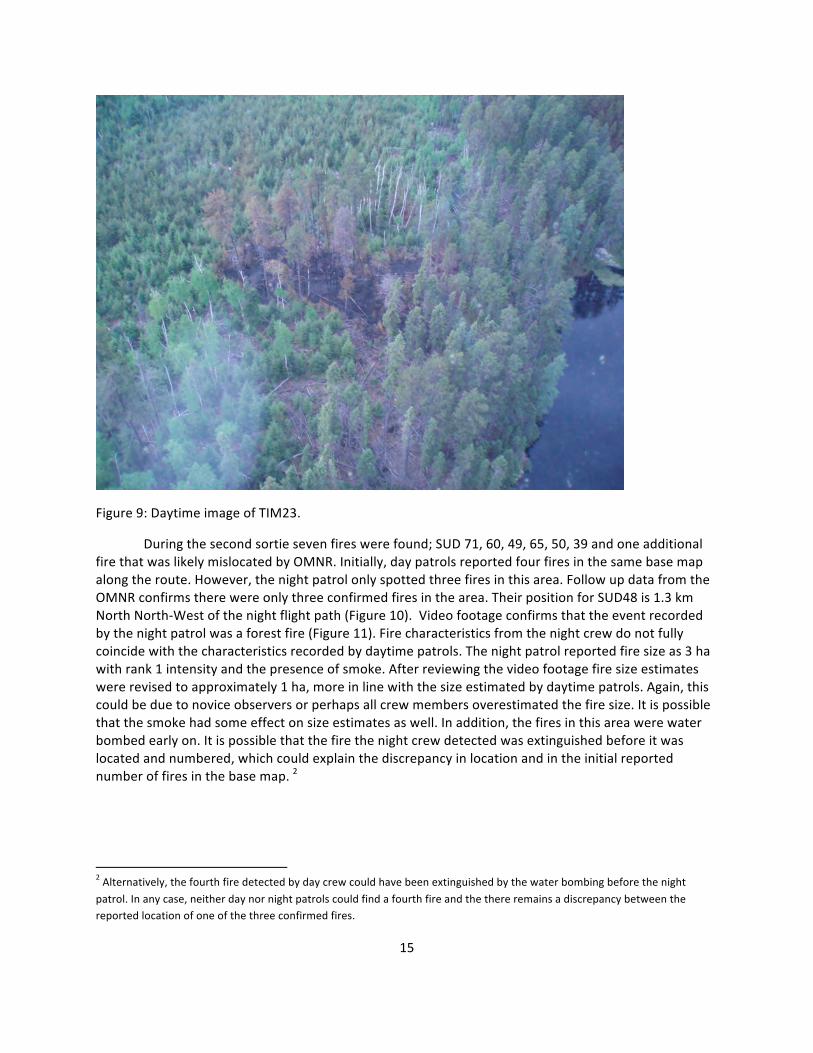
Ten fires were found, none of which were new fires. A Google Earth image of the flight paths and all active fires is shown in Figure 6. The first sortie spotted three fires, SUD59, TIM13 and TIM23. SUD59 was first confirmed as a fire on May 29th. The night patrol reported it as 0.5 ha and rank 2 (Figure 7), with visible smoke. It was confirmed as out on May 31st at 1 ha. TIM23 was found on May 29th at 0.1 ha with rank 2-‐3 fire behaviour. The night patrol stated that it was 0.5 ha and rank 2 (Figure 8) Figure 9 is a daytime photo of TIM23. It was declared out on May 31st at 0.2 ha. TIM13 was found by the night patrol again on May 29th, during this flight it was spotted by an observer that was not part of the aircrew on May 28th. The size, rank and presence of smoke were the same for both flights.
Figure 6: Google Earth image of flight path and active fires on May 29th. Found forest fires are yellow and missed forest fires are red.
14
Figure 7: NVD image of SUD59 on May 29th. The light at the bottom is a lantern from the ground crew.
Figure 8: NVD image of TIM23 on May 29th.
15
Figure 9: Daytime image of TIM23.
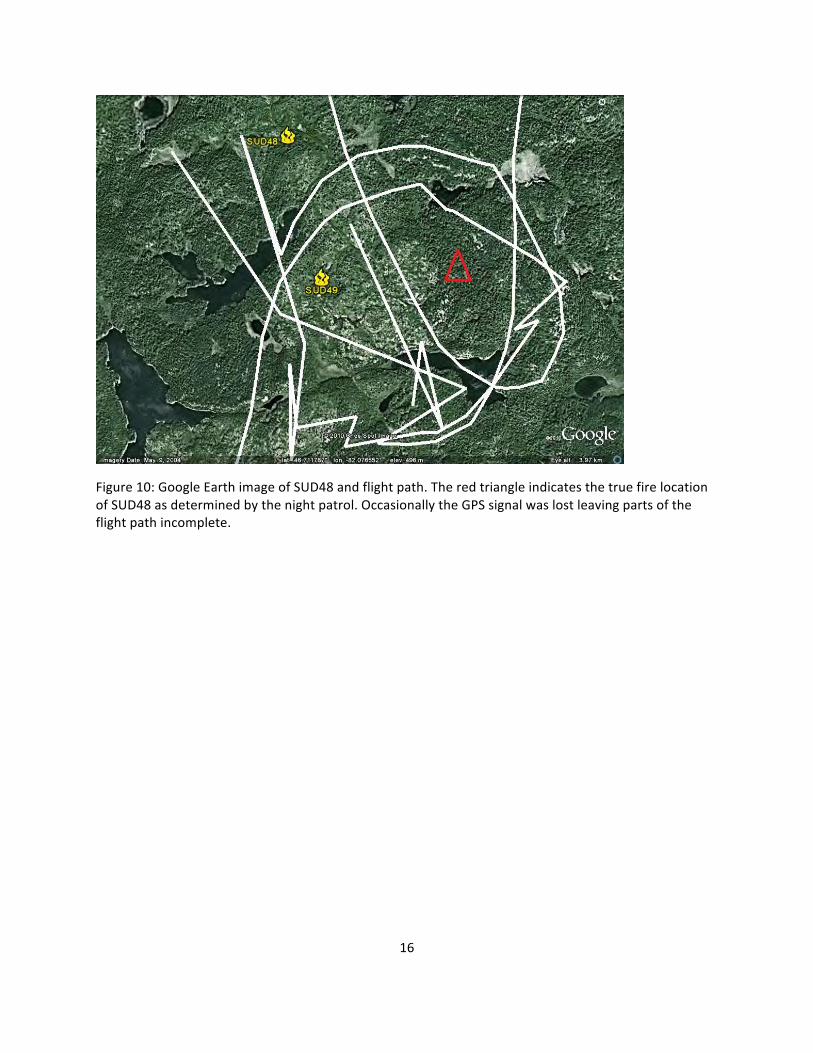
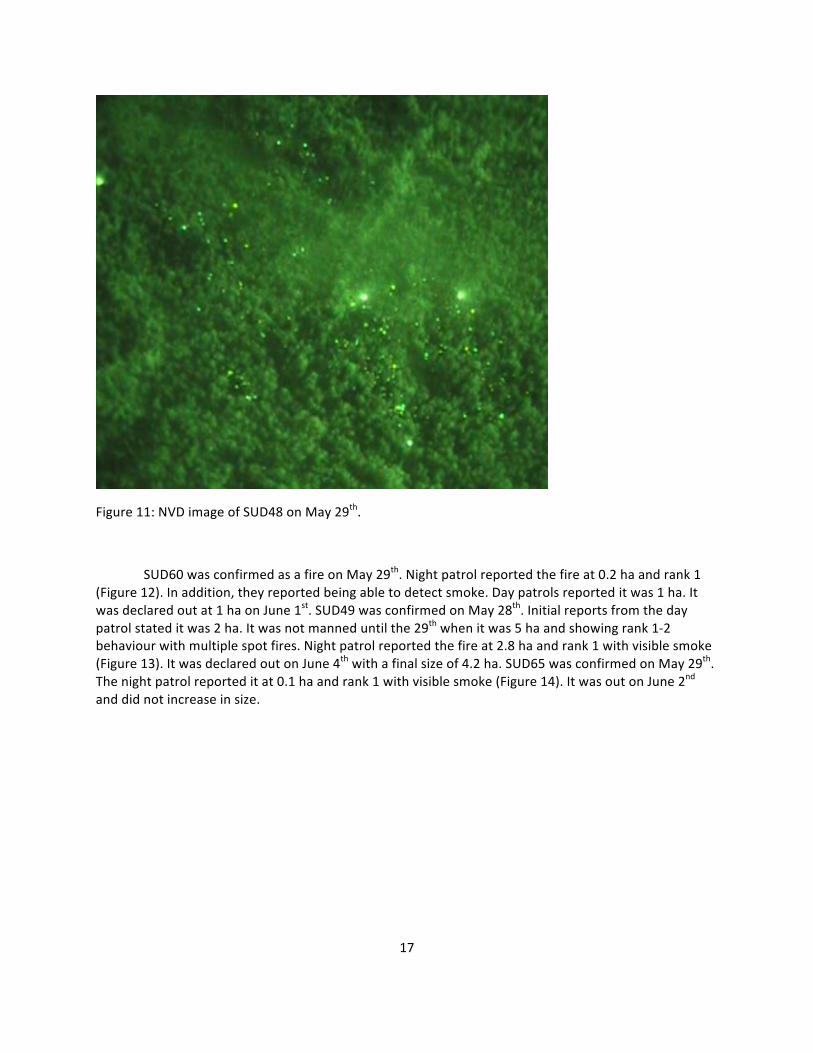
During the second sortie seven fires were found; SUD 71, 60, 49, 65, 50, 39 and one additional fire that was likely mislocated by OMNR. Initially, day patrols reported four fires in the same base map along the route. However, the night patrol only spotted three fires in this area. Follow up data from the OMNR confirms there were only three confirmed fires in the area. Their position for SUD48 is 1.3 km North North-‐West of the night flight path (Figure 10). Video footage confirms that the event recorded by the night patrol was a forest fire (Figure 11). Fire characteristics from the night crew do not fully coincide with the characteristics recorded by daytime patrols. The night patrol reported fire size as 3 ha with rank 1 intensity and the presence of smoke. After reviewing the video footage fire size estimates were revised to approximately 1 ha, more in line with the size estimated by daytime patrols. Again, this could be due to novice observers or perhaps all crew members overestimated the fire size. It is possible that the smoke had some effect on size estimates as well. In addition, the fires in this area were water bombed early on. It is possible that the fire the night crew detected was extinguished before it was located and numbered, which could explain the discrepancy in location and in the initial reported number of fires in the base map. 2
2 Alternatively, the fourth fire detected by day crew could have been extinguished by the water bombing before the night patrol. In any case, neither day nor night patrols could find a fourth fire and the there remains a discrepancy between the reported location of one of the three confirmed fires.
16
Figure 10: Google Earth image of SUD48 and flight path. The red triangle indicates the true fire location of SUD48 as determined by the night patrol. Occasionally the GPS signal was lost leaving parts of the flight path incomplete.
17
Figure 11: NVD image of SUD48 on May 29th.
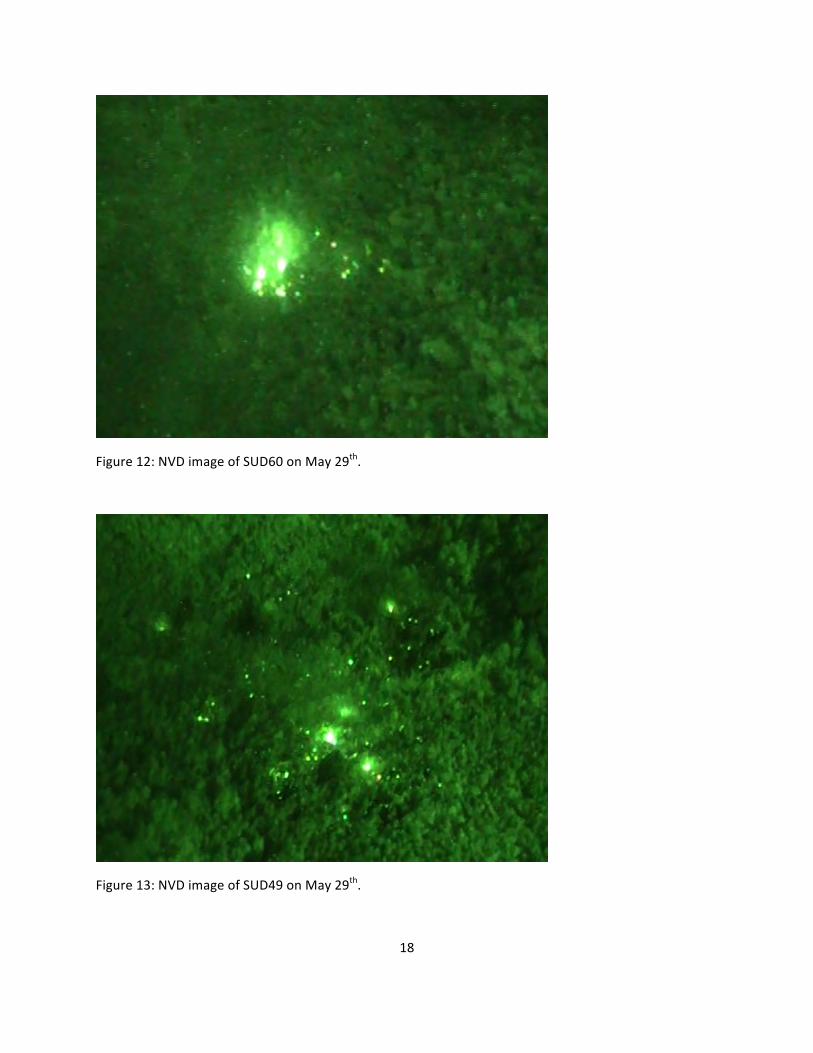
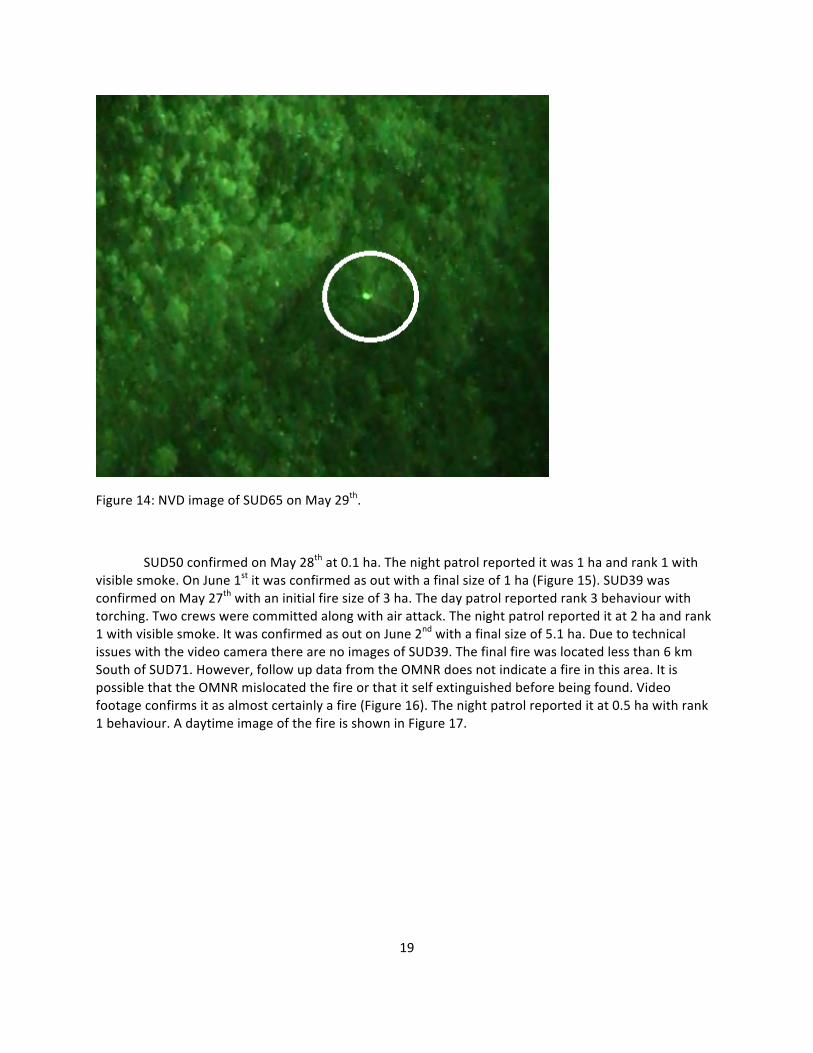
SUD60 was confirmed as a fire on May 29th. Night patrol reported the fire at 0.2 ha and rank 1 (Figure 12). In addition, they reported being able to detect smoke. Day patrols reported it was 1 ha. It was declared out at 1 ha on June 1st. SUD49 was confirmed on May 28th. Initial reports from the day patrol stated it was 2 ha. It was not manned until the 29th when it was 5 ha and showing rank 1-‐2 behaviour with multiple spot fires. Night patrol reported the fire at 2.8 ha and rank 1 with visible smoke (Figure 13). It was declared out on June 4th with a final size of 4.2 ha. SUD65 was confirmed on May 29th. The night patrol reported it at 0.1 ha and rank 1 with visible smoke (Figure 14). It was out on June 2nd and did not increase in size.
18
Figure 12: NVD image of SUD60 on May 29th.
Figure 13: NVD image of SUD49 on May 29th.
19
Figure 14: NVD image of SUD65 on May 29th.
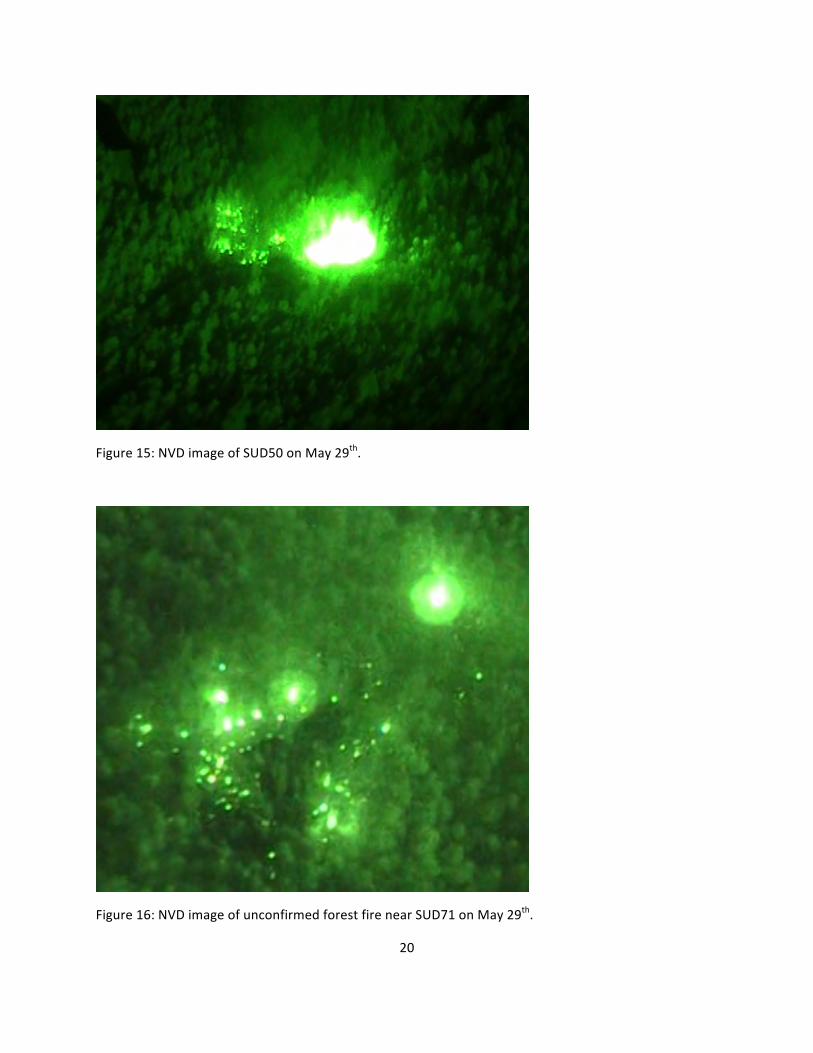
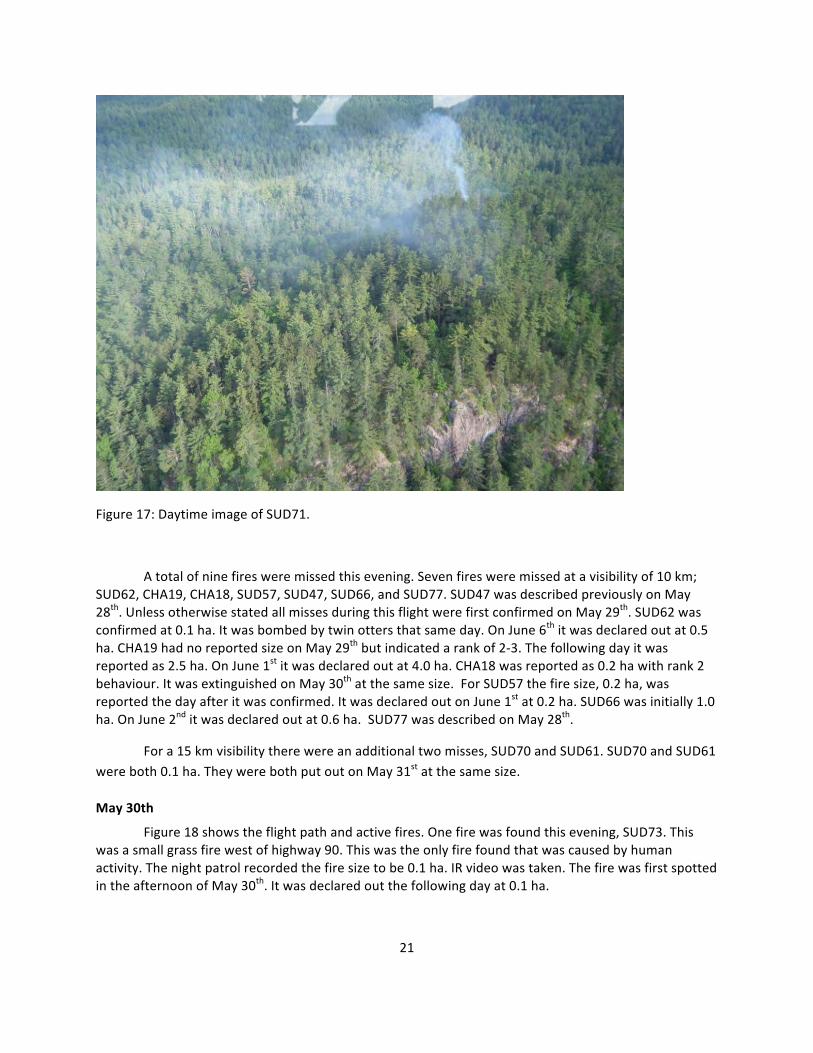
SUD50 confirmed on May 28th at 0.1 ha. The night patrol reported it was 1 ha and rank 1 with visible smoke. On June 1st it was confirmed as out with a final size of 1 ha (Figure 15). SUD39 was confirmed on May 27th with an initial fire size of 3 ha. The day patrol reported rank 3 behaviour with torching. Two crews were committed along with air attack. The night patrol reported it at 2 ha and rank 1 with visible smoke. It was confirmed as out on June 2nd with a final size of 5.1 ha. Due to technical issues with the video camera there are no images of SUD39. The final fire was located less than 6 km South of SUD71. However, follow up data from the OMNR does not indicate a fire in this area. It is possible that the OMNR mislocated the fire or that it self extinguished before being found. Video footage confirms it as almost certainly a fire (Figure 16). The night patrol reported it at 0.5 ha with rank 1 behaviour. A daytime image of the fire is shown in Figure 17.
20
Figure 15: NVD image of SUD50 on May 29th.
Figure 16: NVD image of unconfirmed forest fire near SUD71 on May 29th.
21
Figure 17: Daytime image of SUD71.
A total of nine fires were missed this evening. Seven fires were missed at a visibility of 10 km; SUD62, CHA19, CHA18, SUD57, SUD47, SUD66, and SUD77. SUD47 was described previously on May 28th. Unless otherwise stated all misses during this flight were first confirmed on May 29th. SUD62 was confirmed at 0.1 ha. It was bombed by twin otters that same day. On June 6th it was declared out at 0.5 ha. CHA19 had no reported size on May 29th but indicated a rank of 2-‐3. The following day it was reported as 2.5 ha. On June 1st it was declared out at 4.0 ha. CHA18 was reported as 0.2 ha with rank 2 behaviour. It was extinguished on May 30th at the same size. For SUD57 the fire size, 0.2 ha, was reported the day after it was confirmed. It was declared out on June 1st at 0.2 ha. SUD66 was initially 1.0 ha. On June 2nd it was declared out at 0.6 ha. SUD77 was described on May 28th.
For a 15 km visibility there were an additional two misses, SUD70 and SUD61. SUD70 and SUD61 were both 0.1 ha. They were both put out on May 31st at the same size.
May 30th
Figure 18 shows the flight path and active fires. One fire was found this evening, SUD73. This was a small grass fire west of highway 90. This was the only fire found that was caused by human activity. The night patrol recorded the fire size to be 0.1 ha. IR video was taken. The fire was first spotted in the afternoon of May 30th. It was declared out the following day at 0.1 ha.
22
A total of four fires were missed this evening. For 10 km visibility there were two misses, SUD77 and SUD71. SUD77 was described on May 28th. SUD71 was confirmed as a fire on May 29th at 1.3 ha. It is
important to note that this fire was found by the night patrol on May 29th but was not detected on this night.
At a visibility range of 20 km SUD62 and NOR34 were missed. SUD62 was described on May 29th. NOR34 was confirmed on May 28th at 1.6ha. It was put out on June 4th at the same size.
Figure 18: Google Earth image of flight path and active fires on May 30th. Found forest fires are yellow and missed forest fires are red.
July 13th – 14th
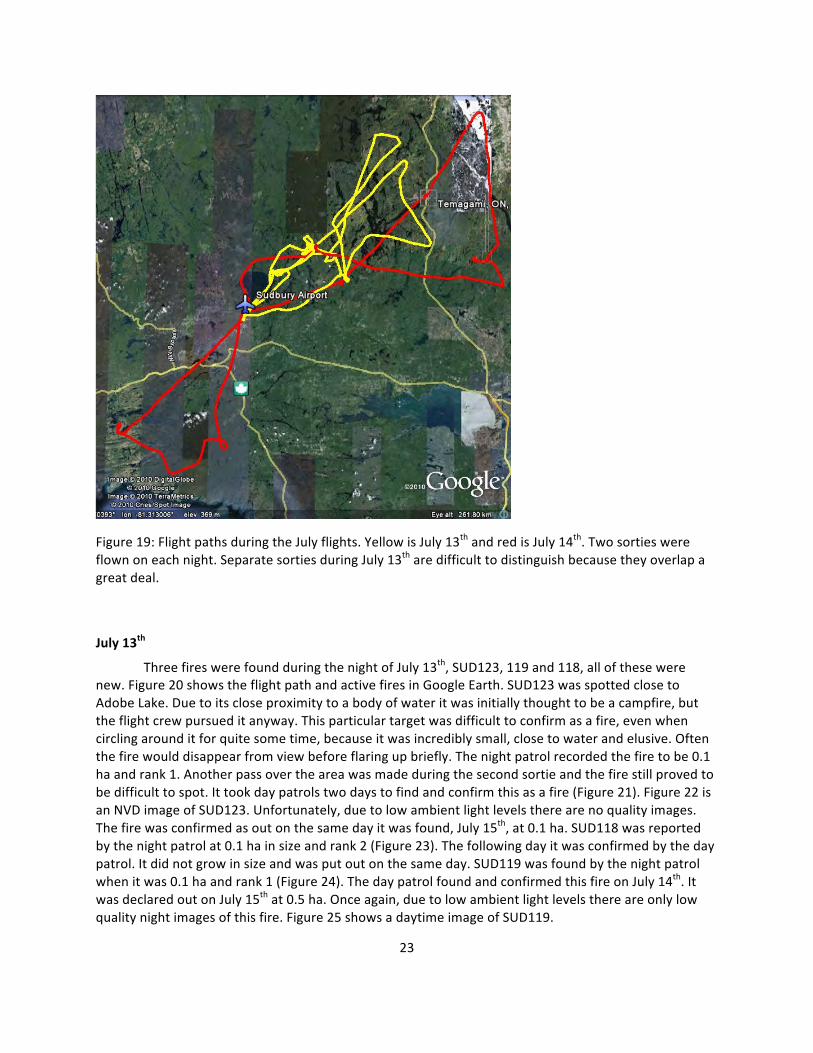
Two sorties were flown each evening and three fires were found. Visibility was reported at 15 statute miles for each evening. The moon was a waxing crescent and rose after the flights were finished; therefore, there was no moon during this group of flights. Cloud ceiling was unlimited. The air temperature varied between 18-‐25 °C with a dew point of 11-‐14 °C. Wind speed varied between 3-‐6 knots. Due to poor visibility there are few NVD images of the fires. Figure 19 shows a Google Earth image of the flight paths.
23
Figure 19: Flight paths during the July flights. Yellow is July 13th and red is July 14th. Two sorties were flown on each night. Separate sorties during July 13th are difficult to distinguish because they overlap a great deal.
July 13th
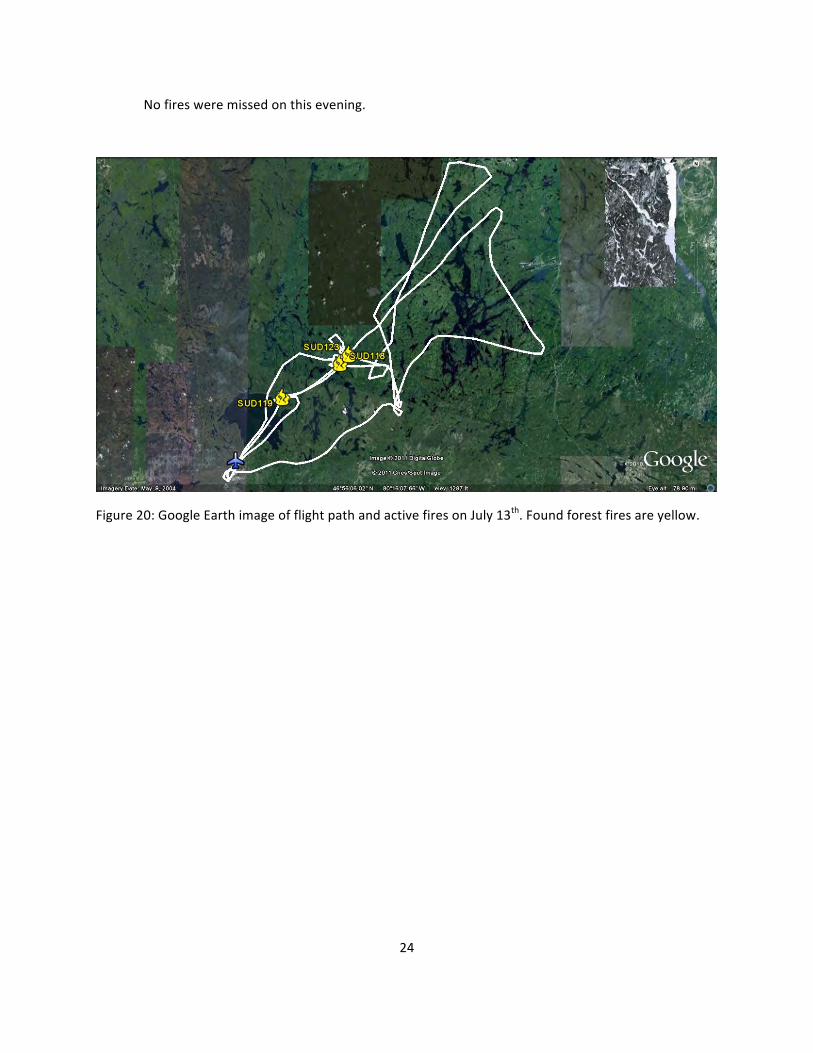
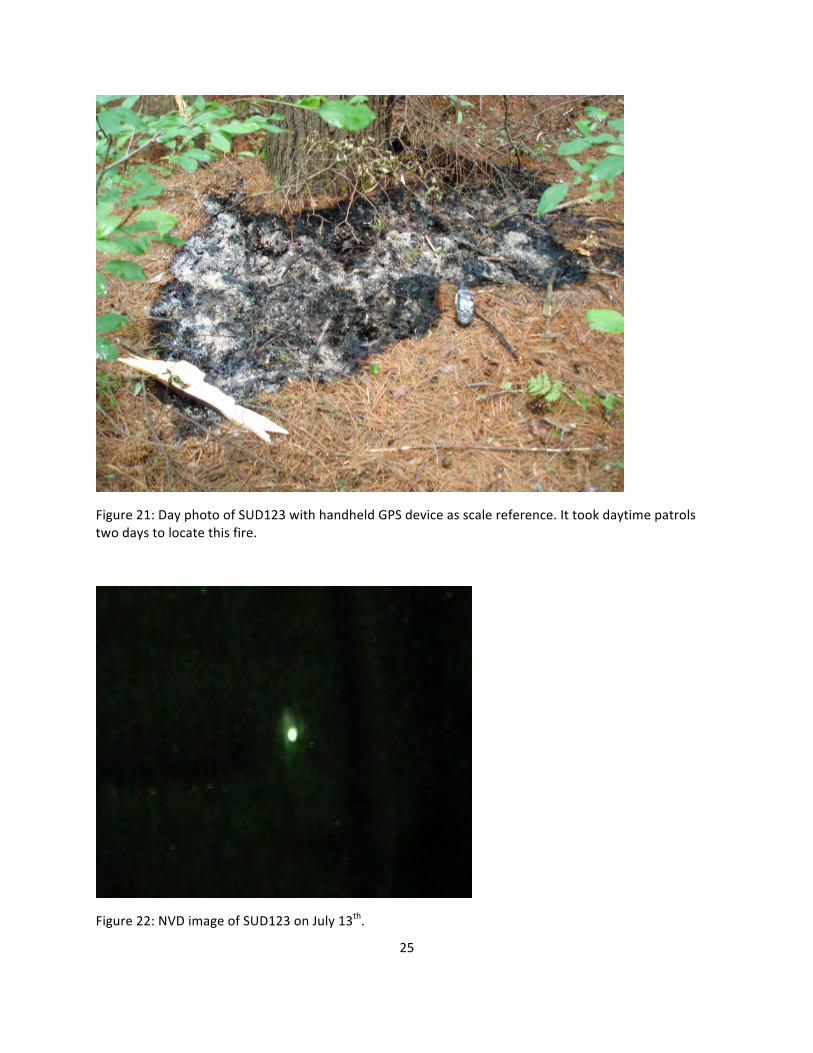
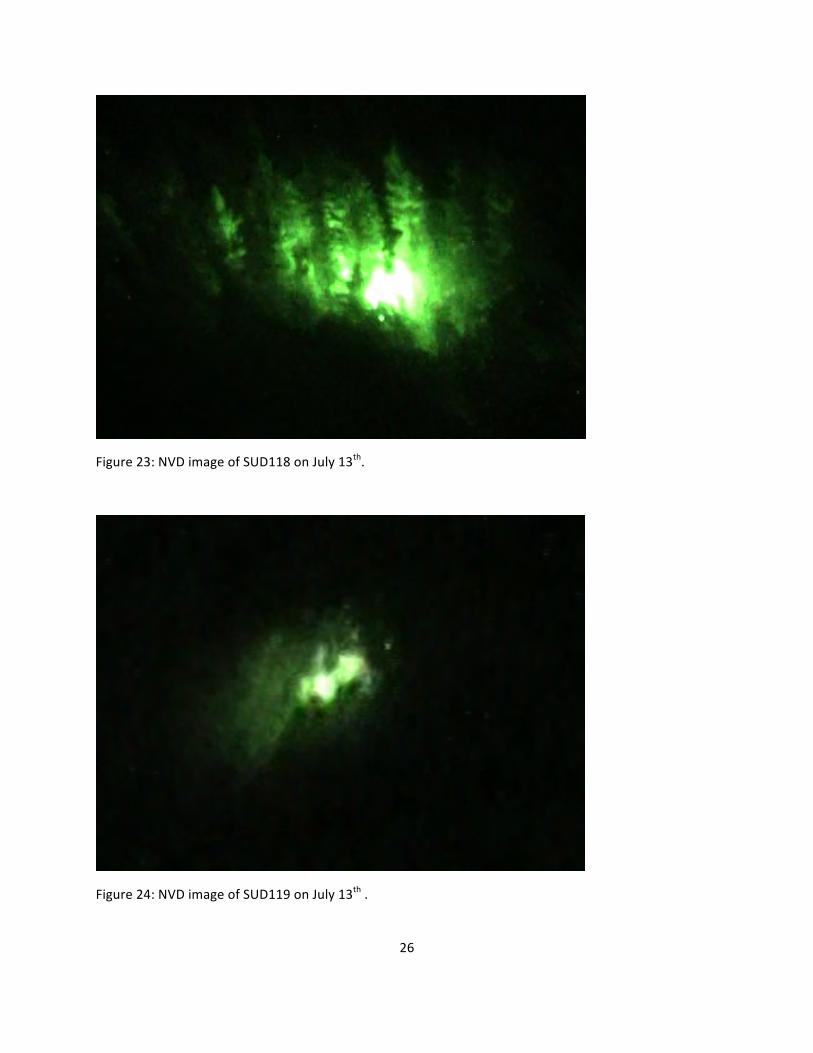
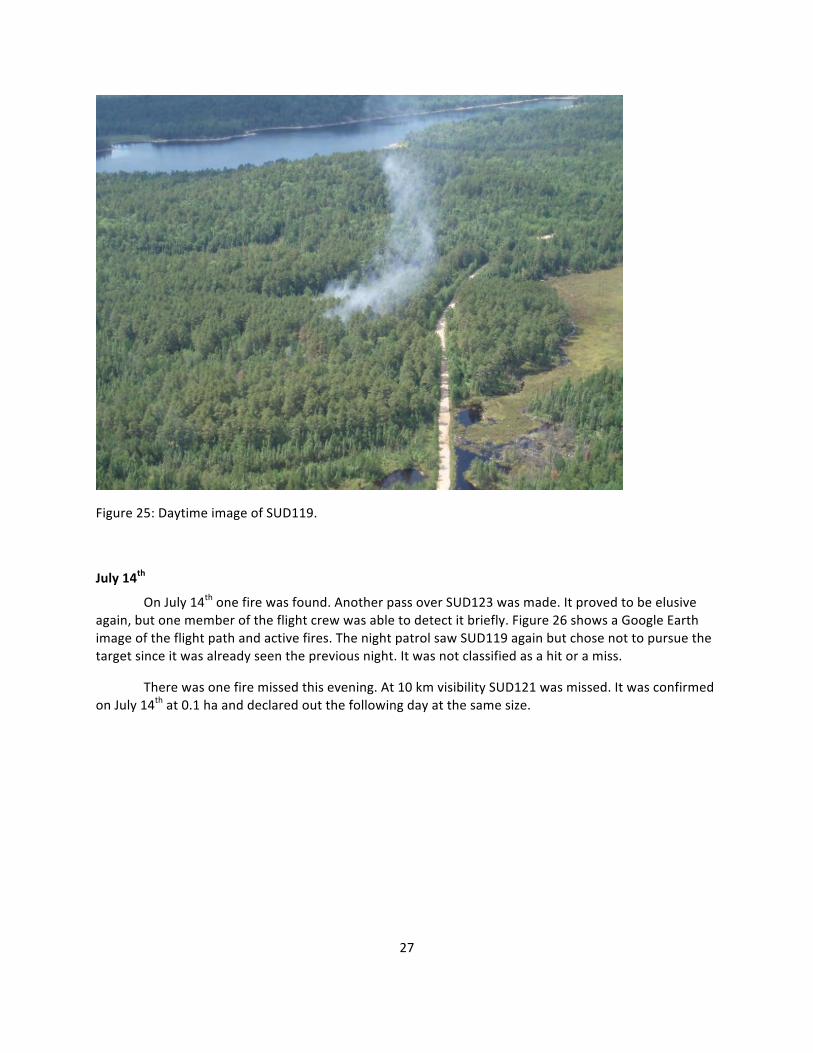
Three fires were found during the night of July 13th, SUD123, 119 and 118, all of these were new. Figure 20 shows the flight path and active fires in Google Earth. SUD123 was spotted close to Adobe Lake. Due to its close proximity to a body of water it was initially thought to be a campfire, but the flight crew pursued it anyway. This particular target was difficult to confirm as a fire, even when circling around it for quite some time, because it was incredibly small, close to water and elusive. Often the fire would disappear from view before flaring up briefly. The night patrol recorded the fire to be 0.1 ha and rank 1. Another pass over the area was made during the second sortie and the fire still proved to be difficult to spot. It took day patrols two days to find and confirm this as a fire (Figure 21). Figure 22 is an NVD image of SUD123. Unfortunately, due to low ambient light levels there are no quality images. The fire was confirmed as out on the same day it was found, July 15th, at 0.1 ha. SUD118 was reported by the night patrol at 0.1 ha in size and rank 2 (Figure 23). The following day it was confirmed by the day patrol. It did not grow in size and was put out on the same day. SUD119 was found by the night patrol when it was 0.1 ha and rank 1 (Figure 24). The day patrol found and confirmed this fire on July 14th. It was declared out on July 15th at 0.5 ha. Once again, due to low ambient light levels there are only low quality night images of this fire. Figure 25 shows a daytime image of SUD119.
24
No fires were missed on this evening.
Figure 20: Google Earth image of flight path and active fires on July 13th. Found forest fires are yellow.
25
Figure 21: Day photo of SUD123 with handheld GPS device as scale reference. It took daytime patrols two days to locate this fire.
Figure 22: NVD image of SUD123 on July 13th.
26
Figure 23: NVD image of SUD118 on July 13th.
Figure 24: NVD image of SUD119 on July 13th .
27
Figure 25: Daytime image of SUD119.
July 14th
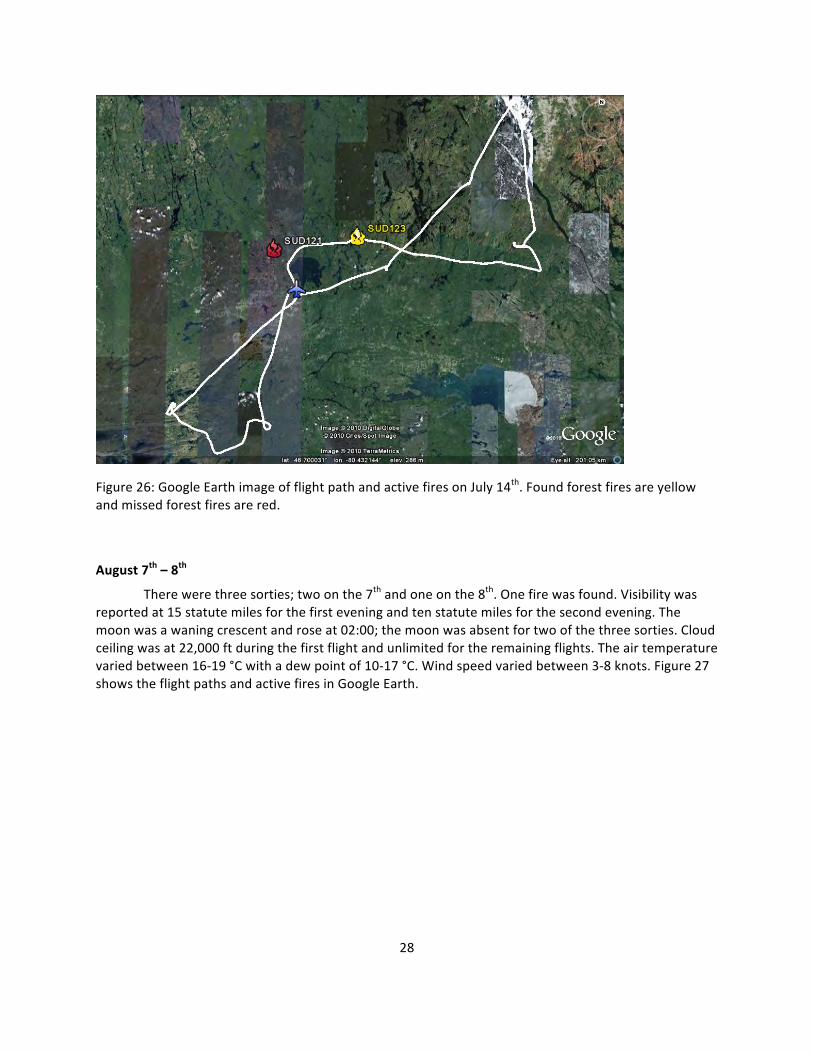
On July 14th one fire was found. Another pass over SUD123 was made. It proved to be elusive again, but one member of the flight crew was able to detect it briefly. Figure 26 shows a Google Earth image of the flight path and active fires. The night patrol saw SUD119 again but chose not to pursue the target since it was already seen the previous night. It was not classified as a hit or a miss.
There was one fire missed this evening. At 10 km visibility SUD121 was missed. It was confirmed on July 14th at 0.1 ha and declared out the following day at the same size.
28
Figure 26: Google Earth image of flight path and active fires on July 14th. Found forest fires are yellow and missed forest fires are red.
August 7th – 8th
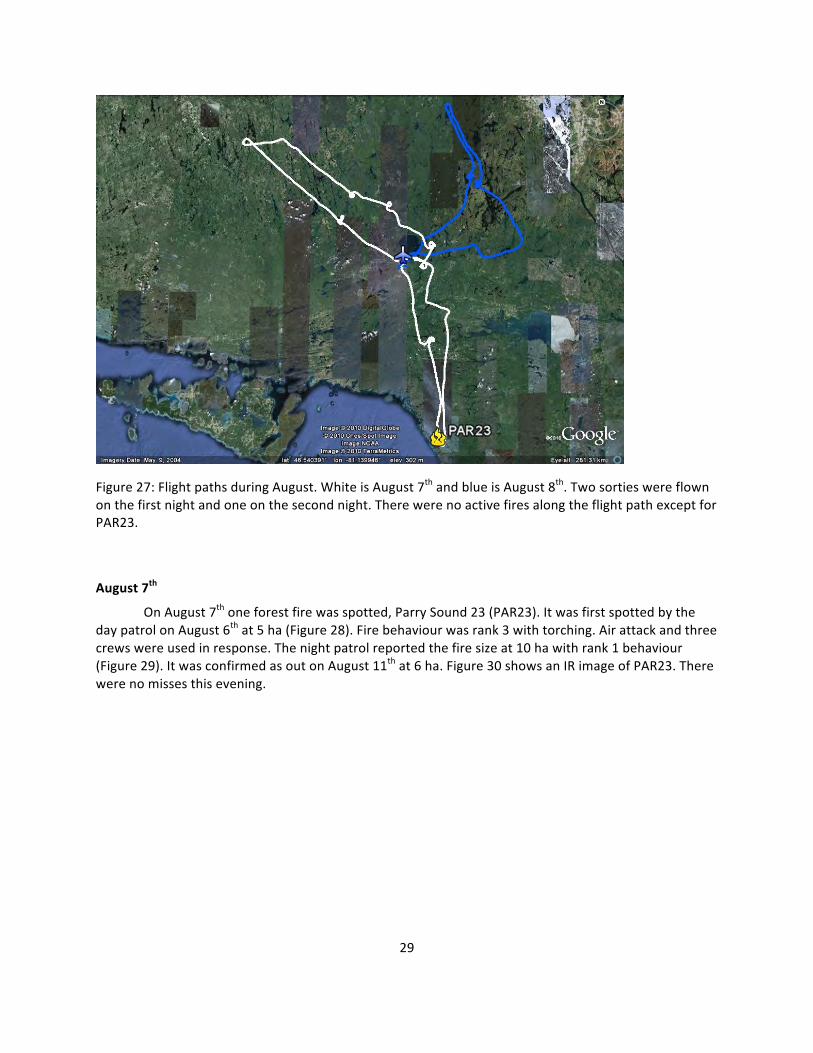
There were three sorties; two on the 7th and one on the 8th. One fire was found. Visibility was reported at 15 statute miles for the first evening and ten statute miles for the second evening. The moon was a waning crescent and rose at 02:00; the moon was absent for two of the three sorties. Cloud ceiling was at 22,000 ft during the first flight and unlimited for the remaining flights. The air temperature varied between 16-‐19 °C with a dew point of 10-‐17 °C. Wind speed varied between 3-‐8 knots. Figure 27 shows the flight paths and active fires in Google Earth.
29
Figure 27: Flight paths during August. White is August 7th and blue is August 8th. Two sorties were flown on the first night and one on the second night. There were no active fires along the flight path except for PAR23.
August 7th
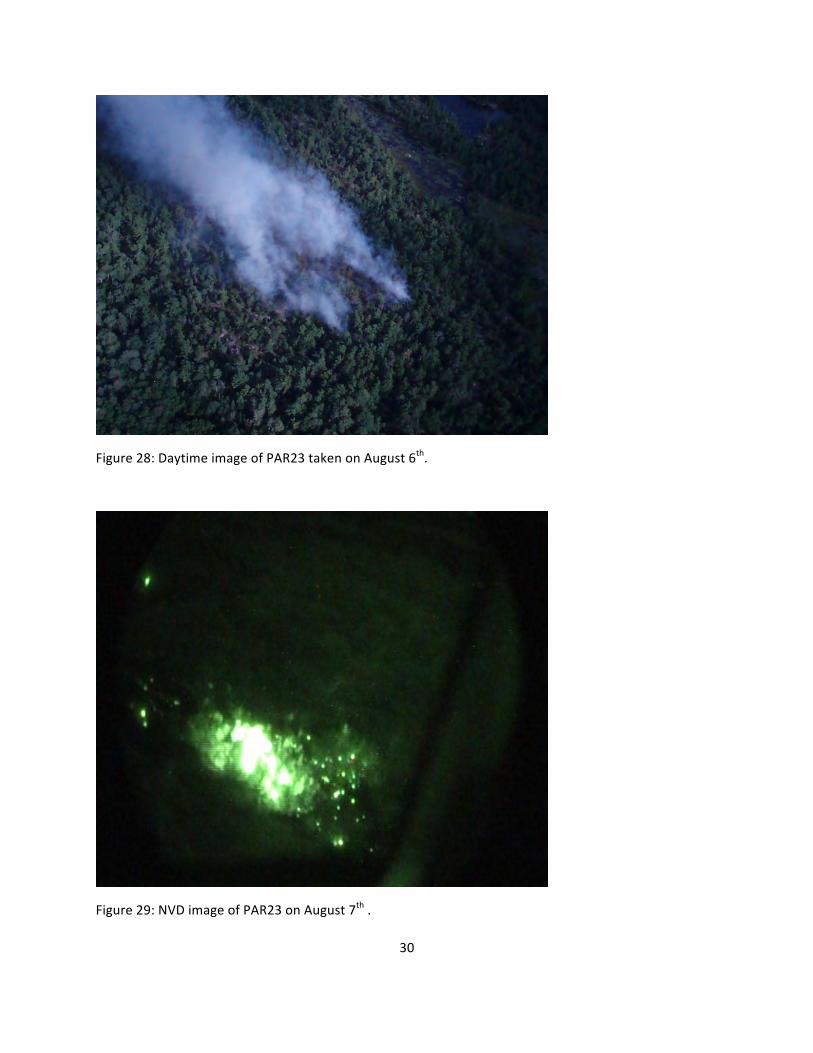
On August 7th one forest fire was spotted, Parry Sound 23 (PAR23). It was first spotted by the day patrol on August 6th at 5 ha (Figure 28). Fire behaviour was rank 3 with torching. Air attack and three crews were used in response. The night patrol reported the fire size at 10 ha with rank 1 behaviour (Figure 29). It was confirmed as out on August 11th at 6 ha. Figure 30 shows an IR image of PAR23. There were no misses this evening.
30
Figure 28: Daytime image of PAR23 taken on August 6th.
Figure 29: NVD image of PAR23 on August 7th .
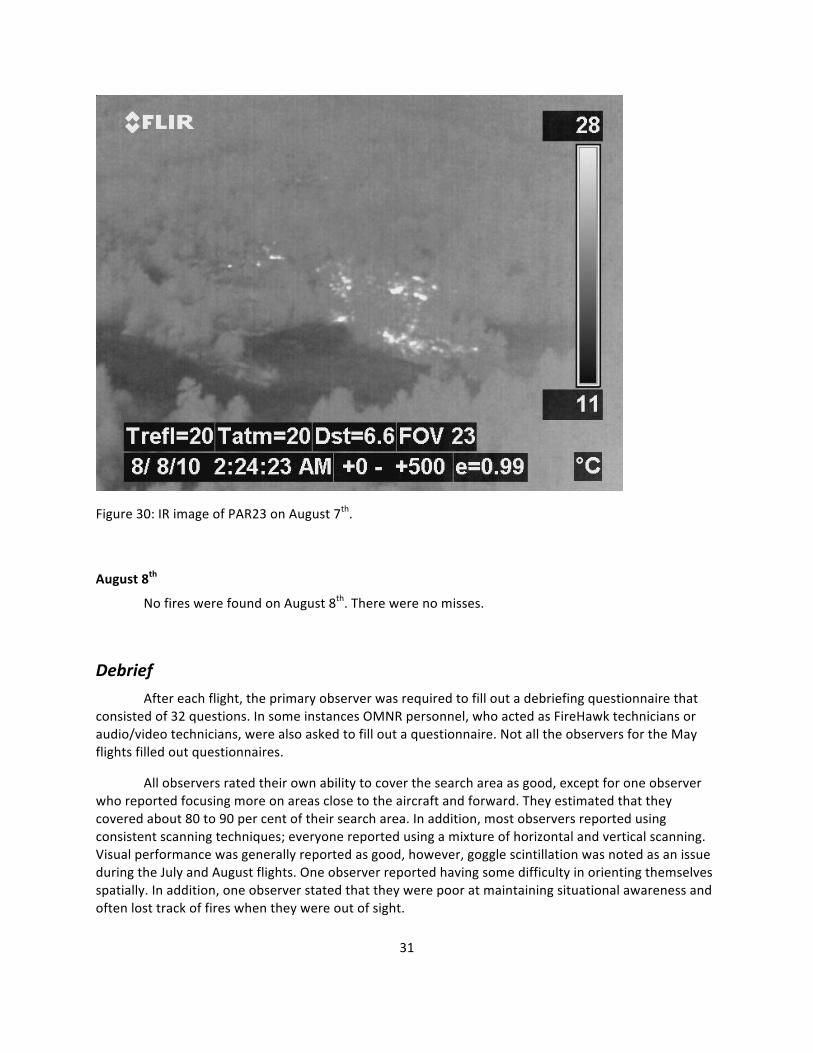
31
Figure 30: IR image of PAR23 on August 7th.
August 8th
No fires were found on August 8th. There were no misses.
Debrief
After each flight, the primary observer was required to fill out a debriefing questionnaire that consisted of 32 questions. In some instances OMNR personnel, who acted as FireHawk technicians or audio/video technicians, were also asked to fill out a questionnaire. Not all the observers for the May flights filled out questionnaires.
All observers rated their own ability to cover the search area as good, except for one observer who reported focusing more on areas close to the aircraft and forward. They estimated that they covered about 80 to 90 per cent of their search area. In addition, most observers reported using consistent scanning techniques; everyone reported using a mixture of horizontal and vertical scanning. Visual performance was generally reported as good, however, goggle scintillation was noted as an issue during the July and August flights. One observer reported having some difficulty in orienting themselves spatially. In addition, one observer stated that they were poor at maintaining situational awareness and often lost track of fires when they were out of sight.
32
When asked to rate their confidence in fire detection on a scale of one (not confident) to five (confident) two observers reported four and two reported three. All observers stated that their skills and confidence at detecting fires increased both during and across flights. The exception to this was during the August flights where both observers stated that they were less confident. This may have been because they found no fires; however, follow-‐up data shows that there were no fires to find. Alertness levels pre and post flight were rated on a scale of one (not alert) to five (fully alert). Before the flight all observers reported an alertness level of four. After the flight, most observers reported a slightly lower alertness level of three, while one observer remained the same. All observers except for one stated that they did not feel well rested. The most common symptoms experienced were eye strain, headaches and sore necks. Two observers reported degraded visual imagery due to goggle scintillation as a result of the low ambient light levels. One observer felt motion sickness at times during the flight.
Most observers did not feel overloaded; however, one observer stated that on previous sorties looking down at the tablet caused him to lose track of the fire. An observer who used the IR camera reported having difficulty getting the target fire (in this particular case a campfire) in the viewfinder. However, this was improved by switching between NVDs and IR in order to use the NVDs as a reference for the IR shot.
Two observers stated no issues with their ability to discern fires among the forest canopy, whereas two others reported having difficulties with canopy. One stated that their performance was largely dependent on the angle of approach; if a fire is approached at a shallow angle there was more interference with forest canopy, tree density and topography. In contrast to the counter-‐intuitive findings from the Pembroke study (Andriychuk et al, 2010), observers reported that a dense canopy made fires more difficult to detect and discriminate as we originally expected. Consistent with observer reports from Andriychuk et al, 2010, higher altitudes allowed for more effective detection but lower altitudes were required for discriminating fires.
Internal lighting was an issue for only one observer who stated that the tablet computer screen was too bright. Two audio/video technicians reported that the video camera screen hindered goggle performance even when the display brightness was reduced to minimum. External lighting was occasionally an issue and one observer recommended planning detection patrols so that whenever possible, urban centers and the sunset are not within the observer’s field of view. During the May flights observers reported a visibility of 15-‐20 km. In July visibility was estimated at 5-‐10 km and in August it was 10-‐20 km. In all cases fuel stands and open flame were reported as visible from the air.
Strategies, Observations & Anecdotes Fire sources are visible from long distances at night through NVDs; the greatest challenge of
NVD-‐aided detection is discriminating fires from other light sources, which are also amplified and highly visible. There are no definitive signs for differentiating fires from other sources of light. Ideally, one should use a combination of approaches based on previous fire spotting experience and knowledge of the geographical area. Many light sources appear to flicker from a distance. However, fires usually flicker erratically instead of regularly, as a tower light might. It is important to note that non fire light sources may at first appear to flicker erratically when in fact they are constant. This often happens with rural residential lighting where the tree canopy may occasionally occlude the light, creating the illusion of flicker. Watching a potential light source for a few minutes to see if the flicker becomes steady is one
33
way to avoid false alarms of this nature. GIS data or experience with the area searched can be useful in discriminating man-‐made light sources from possible fire sources.
Viewing a light source without the NVDs can also yield important information. Yellow, white or red lights are often signs of artificial lights; whereas fires are often either not visible with the naked eye or are orange in colour. These characteristics are dependent on how far one is from the fire as well as fire size. Nearer the fire, flame and smoke are often visible but smoke is a less reliable cue than during daytime ocular detection patrols.
Anecdotally, viewing without the NVDs (i.e. by raising them momentarily or looking beneath them) can also be useful for judging intensity and rank of fires. With bright sources the devices can be saturated and halos form around the image of the source; lifting the goggles can be useful in these situations to help establish rank. Conversely low rank and smouldering fires cannot typically be seen without the goggles; viewing without the goggles provides a confirmation of low rank estimates. It is important to note that, due to the weather and fire behaviour conditions at the time of these flights, most of the fires found were of low rank.
Light sources that appear to move and/or are emitting a concentrated beam of light are usually vehicles. Vehicles along logging roads can be especially problematic because they travel so slowly it may be difficult to see movement. In addition, logging roads are often narrow, bumpy and lined with trees, increasing the likelihood that the light will appear to flicker erratically.
Trains confused the entire flight crew twice over the course of the study. The target was pursued out of curiosity but it was not suspected of being a forest fire. The main feature that led the crew to pursue a train was the intensity of the front end light. It was the brightest light on the horizon, it was not moving and it appeared to flicker because of the tree canopy passing across the front of the light as the aircraft moved. In addition, the light gave off a haze which created the illusion of smoke.
Once a target has been confirmed as a fire it may be difficult to determine if it is a nascent forest fire or a campfire. If houses, tents, people, vehicles or boats are in the surrounding area it is probably a campfire. If a target is located on the shore of a body of water it is most likely a campfire. However, it may still be worth pursuing, since forest fires can occur on shore lines and islands. Another way to distinguish between a campfire and forest fire is in the number of ember beds. Forest fires will, depending on size, have multiple ember beds or smouldering light sources; whereas campfires will have only one ember bed. Symmetrically organized light sources of the same size and with halos of the same diameter are probably not forest fires; look for an asymmetrical organization of lights of varying sizes and brightness. Since night-‐time conditions are usually cooler then daytime conditions, forest fires will often appear as smouldering ember beds. This makes them much more difficult to detect. In addition, smoke columns, which are useful for fire detection during the day, can be absent, invisible or very faint with NVDs; they also often ‘lay down’ closer to ground at night. This means that nascent fires at night are often smaller and less immediately visible than nascent fires during the day. On the other hand, new fires started by lightning strikes need time to develop. Further investigation is required to identify the best time of night for NVD aerial detection patrols taking into account visibility, operational constraints, weather, fire indices and fire behaviour. NVD-‐aided IR detection patrols (which are not currently used by OMNR but similar concerns apply to fire perimeter mapping and spot fire detection) also must consider the trade-‐off between IR contrast, which typically increases as ambient temperature drops overnight, and changing fire behaviour, which typically declines overnight.
34
Limitations to visual performance using NVDs must also be considered. For example, the image is monochromatic, contaminated by image noise at low light levels, the unusual spectral sensitivity can result in contrast inversions and field of view is limited in most devices. These limitations and artefacts presumably underlie the reported deficits in perception of space, depth and motion (for example Bradley & Kaiser, 1994; Braithwaite et al, 1998; DeLucia & Task, 1995; Hughes, Zalevski & Gibbs, 2000; Macuda et al., 2005; Sheehy & Wilkinson, 1989; Task, 2001). Perceptual issues in NVDs have counted as a causal factor in military helicopter incidents and accidents in a number of countries (see Braithwaite et al, 1998). Similarly these effects influence the ability of detection observers to orient themselves and may impact visibility or discriminability of fire sources in some scenarios. Training should take these limitations into account to ensure safe and effective detection patrols.
The image quality of NVDs can be compromised when searching areas that are highly saturated with sources of light. When possible, keep urban centers and bright light sources, such as trains or the moon, behind the aircraft, otherwise it may wash out the image or cause halo (Allison et al, 2010). Conversely overcast or moonless conditions can reduce ambient illumination enough that detector noise becomes an issue in the NVD image (Macuda et al, 2005). Under very low light conditions, automatic gain control in the devices causes scintillating noise (i.e. a ‘grainy’ appearance similar to a detuned television) that may influence depth, motion, resolution, form, size and distance perception.
It is important to continually scan the area and take frequent breaks to avoid neck and eye strain (Harrison et al, 2007). Scanning the area directly down the side of the aircraft is also valuable because one can see directly down into the tree canopy, decreasing the number of trees occluding a target.
Quantitative Data Analysis
Mean distances
The average detection distance across all nights was 6,678 m (95%CI: 3,215 m to 10,140 m). Recall this was the distance at which a decision was made to pursue a light source as a possible fire; the source itself was almost always visible at much greater distances. The average discrimination distance was 1,618 m (95%CI: 1,057 m to 2,179 m). There was no significant correlation between detection distance and discrimination distance. Analyses revealed a correlation between the overall discrimination distance and fire size (r(19) = 0.558, p = 0.013). However, there was no correlation between detection distance and fire size (r(19) = 0.254 , p > 0.05). Campfires were not included in these calculations.
Signal detection
The number of hits, correct rejections and misses, both across all nights and divided by night, are shown in Table 1 and 2 (for targets within a range of +/-‐ 10 km from the actual track, labelled ‘visibility of 10 km’) and Table 3 and 4 (visibility of 20 km). Rates were calculated by adding up the number of events that fell into those categories. Correct rejections were defined as any target that was investigated and correctly identified as something other than a fire. When a fire was correctly identified and confirmed it counted as a hit. There were no false alarms, which occur when an observer falsely confirms a target as a fire. The hit rate was calculated by dividing the number of forest fires spotted with the total number of forest fires (based on day patrols and fire reports) within the range of visibility.
35
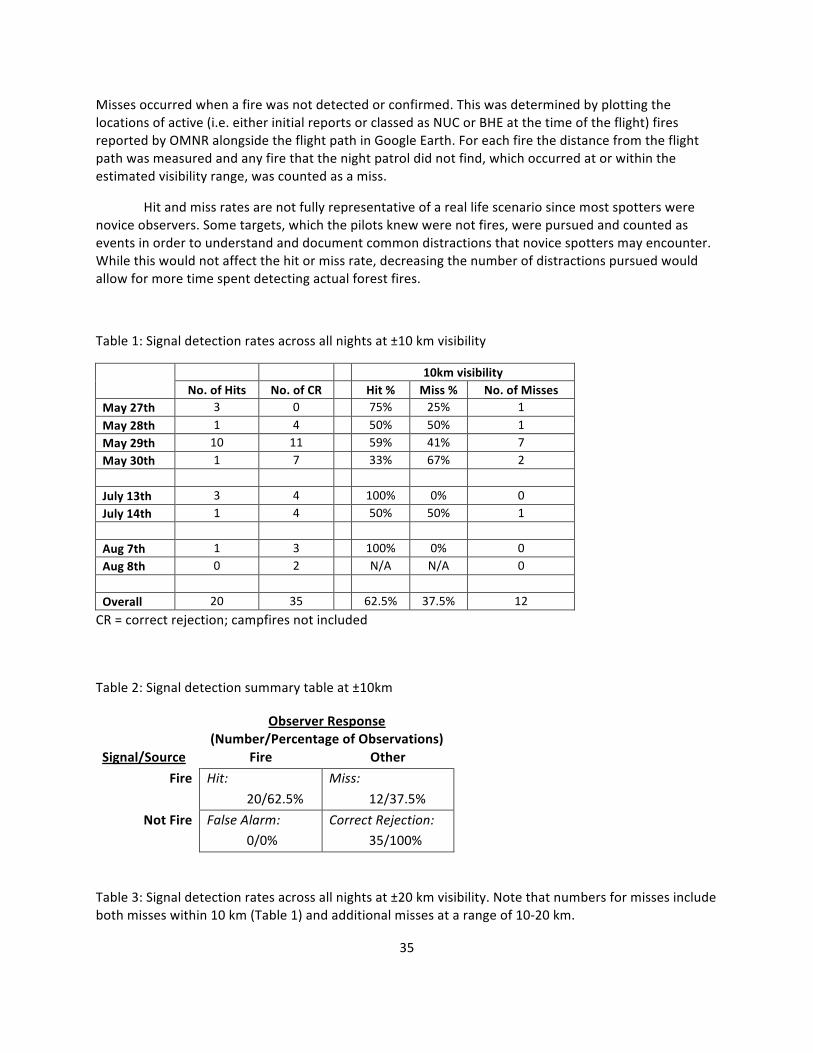
Misses occurred when a fire was not detected or confirmed. This was determined by plotting the locations of active (i.e. either initial reports or classed as NUC or BHE at the time of the flight) fires reported by OMNR alongside the flight path in Google Earth. For each fire the distance from the flight path was measured and any fire that the night patrol did not find, which occurred at or within the estimated visibility range, was counted as a miss.
Hit and miss rates are not fully representative of a real life scenario since most spotters were novice observers. Some targets, which the pilots knew were not fires, were pursued and counted as events in order to understand and document common distractions that novice spotters may encounter. While this would not affect the hit or miss rate, decreasing the number of distractions pursued would allow for more time spent detecting actual forest fires.
Table 1: Signal detection rates across all nights at ±10 km visibility
10km visibility No. of Hits No. of CR Hit % Miss % No. of Misses May 27th 3 0 75% 25% 1 May 28th 1 4 50% 50% 1 May 29th 10 11 59% 41% 7 May 30th 1 7 33% 67% 2 July 13th 3 4 100% 0% 0 July 14th 1 4 50% 50% 1 Aug 7th 1 3 100% 0% 0 Aug 8th 0 2 N/A N/A 0 Overall 20 35 62.5% 37.5% 12
CR = correct rejection; campfires not included
Table 2: Signal detection summary table at ±10km
Observer Response (Number/Percentage of Observations)
Signal/Source Fire Other
Fire Hit:
20/62.5%
Miss:
12/37.5%
Not Fire False Alarm: 0/0%
Correct Rejection: 35/100%
Table 3: Signal detection rates across all nights at ±20 km visibility. Note that numbers for misses include both misses within 10 km (Table 1) and additional misses at a range of 10-‐20 km.

36
20km visibility No. of Hits No. of CR Hit % Miss % No. of Misses May 27th 3 0 60% 40% 2 May 28th 1 4 25% 75% 3 May 29th 10 11 53% 47% 9 May 30th 1 7 20% 80% 4 July 13th 3 4 100% 0% 0 July 14th 1 4 50% 50% 1 Aug 7th 1 3 100% 0% 0 Aug 8th 0 2 N/A N/A 0 Overall 20 35 51% 49% 19
CR = correct rejection; campfires not included
Table 4: Signal detection summary table at ±20km.
Observer Response (Number/Percentage of Observations)
Signal/Source Fire Other
Fire Hit: 20/51%
Miss: 19/49%
Not Fire False Alarm: 0/0%
Correct Rejection: 35/100%
When considering the occurrence of all fire events (both forest fires and campfires) in relation to the total number of events, the overall rate is 50 per cent (Table 5). In other words, of all the events spotted across sorties 50 per cent were actual fires, whereas the other 50 per cent were distractions. For these calculations any event that was not a fire was collapsed into one category. Across all nights there were 70 events in total. Of these 70 events, 35 were fires; 20 forest fires (5 new/unreported) and 15 campfires. The other 35 were correct rejections, most of which were houses. There were no false alarms (i.e. no fire reports were made for events that were not actual fires).
Table 5: Percentage of fire events to all other events
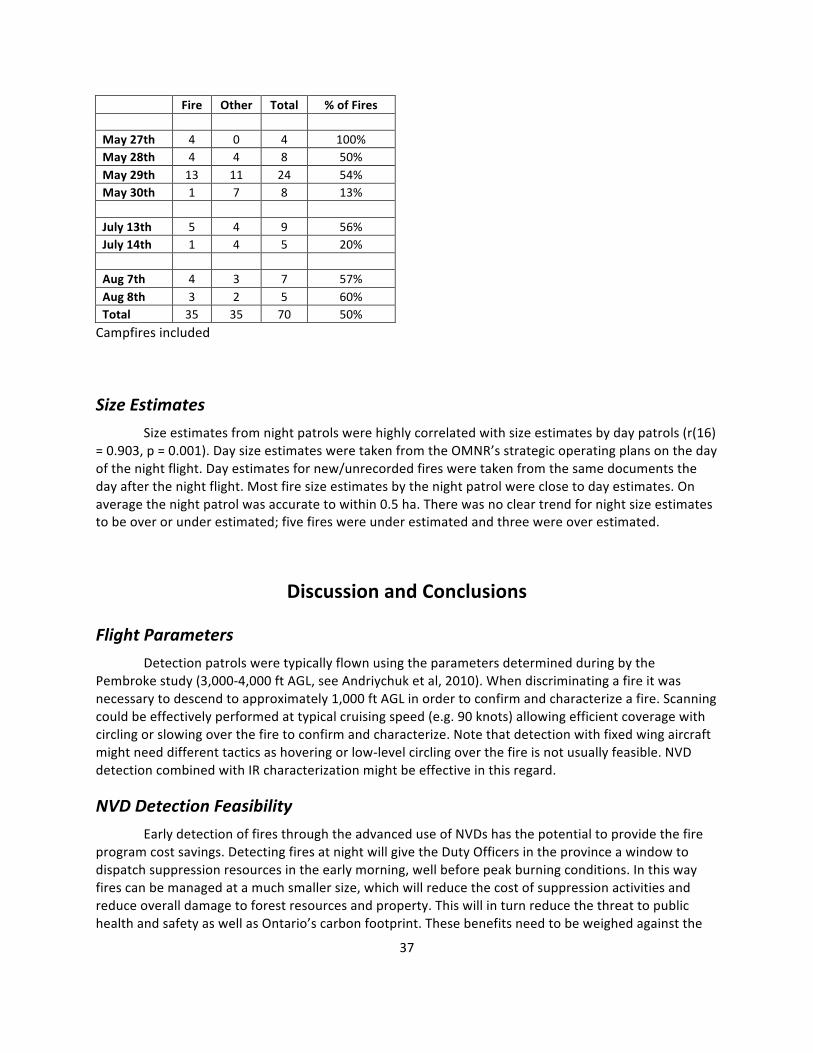
37
Fire Other Total % of Fires May 27th 4 0 4 100% May 28th 4 4 8 50% May 29th 13 11 24 54% May 30th 1 7 8 13% July 13th 5 4 9 56% July 14th 1 4 5 20% Aug 7th 4 3 7 57% Aug 8th 3 2 5 60% Total 35 35 70 50% Campfires included
Size Estimates
Size estimates from night patrols were highly correlated with size estimates by day patrols (r(16) = 0.903, p = 0.001). Day size estimates were taken from the OMNR’s strategic operating plans on the day of the night flight. Day estimates for new/unrecorded fires were taken from the same documents the day after the night flight. Most fire size estimates by the night patrol were close to day estimates. On average the night patrol was accurate to within 0.5 ha. There was no clear trend for night size estimates to be over or under estimated; five fires were under estimated and three were over estimated.
Discussion and Conclusions
Flight Parameters
Detection patrols were typically flown using the parameters determined during by the Pembroke study (3,000-‐4,000 ft AGL, see Andriychuk et al, 2010). When discriminating a fire it was necessary to descend to approximately 1,000 ft AGL in order to confirm and characterize a fire. Scanning could be effectively performed at typical cruising speed (e.g. 90 knots) allowing efficient coverage with circling or slowing over the fire to confirm and characterize. Note that detection with fixed wing aircraft might need different tactics as hovering or low-‐level circling over the fire is not usually feasible. NVD detection combined with IR characterization might be effective in this regard.
NVD Detection Feasibility
Early detection of fires through the advanced use of NVDs has the potential to provide the fire program cost savings. Detecting fires at night will give the Duty Officers in the province a window to dispatch suppression resources in the early morning, well before peak burning conditions. In this way fires can be managed at a much smaller size, which will reduce the cost of suppression activities and reduce overall damage to forest resources and property. This will in turn reduce the threat to public health and safety as well as Ontario’s carbon footprint. These benefits need to be weighed against the
38
increased cost and operational overhead of conducting helicopter based night flights. We propose that NVD-‐aided detection will be most effective following lightning activity in receptive fuel conditions. A drought moisture code (DMC) value of 35 was used to plan NVD detection patrols. However, other indices could be taken into consideration when the DMC is in the moderate to low range. In these cases the efficiency of NVD-‐aided detection will be maximized and the patrols can support rapid informed decision making with minimal delay between fire start and response decision. This should aid in optimizing the deployment of suppression resources given the potential for spread of the new fires and the demands of fighting existing fires.
Misses are difficult to estimate accurately for a number of reasons. Firstly, true visibility is hard to determine since weather information is not a measure of visibility at elevation during the night. While all visibilities were approximately ten statue miles, it is likely that there was much variation across groups of flights and even throughout the flight due to local variations in cloud and haze. In addition, moon phase affects visibility. Many evenings there was little or no moon, which is reflected in the poor image quality of the figures throughout this document. This was further complicated during several flights that were flown in areas with a high degree of light pollution. Secondly, visibility of a fire depends on numerous factors that could not be controlled in a real operational setting, for example topography, angle of approach, point source ignition versus line ignition source and canopy density. Thirdly, fire behaviour decreases during the night due to lower temperatures, an increase in relative humidity and reduced wind, among other factors. This means that characteristics such as torching, open flame and smoke, which are reliable spotting cues during the day, are rarely seen from a distance at night. During the NVD flights there were no periods of poor relative humidity recover, making it difficult for any fire behaviour to be maintained during the night. Fourthly, it is difficult to determine when a fire was active. Although OMNR’s database reports the day a fire was first spotted, it is possible that fires were smouldering for days before they were found by patrols. In addition, it is not possible to know for certain if fires found the following day (after a night patrol) were active for the night patrol. The former uncertainty would result in miss rates being underestimated and the latter would result in the miss rates being overestimated.
The fire season this year was poor for data collection. Ideally, there would have been more opportunities to record data. However, it is still possible to make some conclusions about the feasibility of NVD use. All the new (i.e. previously unreported) fires detected by the night patrol were less than 0.1 ha in size. As in the Pembroke study, these targets were much smaller than what day patrols are normally expected to find. This was illustrated well when SUD123 proved difficult to detect during the day, showing that NVDs are a valuable tool for detecting nascent fires.
Fire Size and Distance Estimates
As previously stated night patrol size estimates were accurate when compared to day estimates. However, it is important to note that size estimations at night with NVDs can be problematic. This is especially true under low light conditions when scintillation noise and poor image definition is more likely to occur. These conditions can cause problems with depth and distance perception as well. In addition, large burn areas visible during the day may not be visible at night if there are no ember beds or open flame. In particular, areas that were burnt but no longer burning will be difficult to see in the NVD compared to the active edge of the fire. This would likely lead to an under estimation of fire size at night. Furthermore, poor visibility of size references may also cause errors. In order to maintain accurate size and distance estimates it is important to train night patrol personnel accordingly. Studies have
39
shown that NVD distance estimates become more accurate with practice and performance feedback (Niall et al 1999).
NVD Discrimination of Light Sources as Fires Detection of fires from the air is relatively easy as even small fires have a strong signal allowing
them to be detected. Identifying them as possible fires and then confirming them as such requires approaching to distances of several kilometres. The main issue with discrimination is the variety of competing light sources that must be filtered and eliminated by the observer. Man-‐made sources are the most problematic especially building/landscape lighting. During the Pembroke study vehicles were also a common distraction but this did not seem to be the case during the Sudbury flights, perhaps because observers spent more time studying a light source before deciding to pursue it or because they had learned to recognize and disregard vehicle lights. Discriminating targets can be particularly difficult when the light source is partly occluded by canopy, so that it appears to flicker from the moving helicopter. Camp fires were also regularly detected and, while a true fire event, they are obviously distractions. Such interference from non-‐fire environmental sources may limit NVD aided detection patrols near more heavily populated activities or when human activity is expected to be high (which may require later operational windows).
It is important to note that daytime patrols also often investigate potential targets, or ‘smokes’, that turn out to be false alarms (or hopefully correct rejections upon close observation). Such events include camp fires, smoke or dust from industrial operations, and even dust thrown up in the air by vehicles on dirt roads or tracks. As far as we know there are no estimates of false alarm, miss or correct rejection (i.e. a distraction that was correctly identified as a non-‐fire event). This makes it difficult to make absolute efficiency comparisons between NVD-‐aided and conventional daytime operations. Such data could be valuable. Some estimate of hit rate could be arrived at by analysis of fires found on detection patrols compared with fires found by all means. Similarly correct rejections could be estimated by analyzing flight following records and radio reports for deviations from planned path not associated with an eventual fire report. However, acquiring more accurate hit and miss data would require significant time and effort to ensure coverage of the detection patrol routes. The main challenge is determining the ‘ground truth’ data on what fires were actually active at the time of the flight. This requires extensive coverage of the route to ensure completeness, and even in this case, temporal uncertainty about when the fires actually started remains3
OMNR aviation planners and duty officers consulted suggested that the hit rate was roughly comparable to that of daytime patrols, but they also commented on the fact that the NVD patrols were detecting very small fires. This ability to detect small fires is beneficial given OMNR’s mandate to detect and make a decision (which can include simple monitoring) all new fires. Restricting attention to only more substantial fires would likely reduce the number of distraction events and improve efficiency for detecting larger fires, but at the expense of missing the smallest fires. As many of these may self-‐extinguish such a strategy may be viable for efficient detection of significant fires even if it reduces overall hit rate.
Knowledge of the area is critical for determining which targets are worth pursuing. Although this study showed that novice observers, unfamiliar with the geographical area, were still able to
3 Indeed, even a historical analysis of the detection records would be expensive and time-‐consuming.
40
discriminate fires from other light sources, having knowledge of the area will further decrease the number of distractions pursued. As previously stated, some events were pursued even though the crew were aware that they were not fires. This was done so that the novice members of the flight crew could learn and so that common distractions could be documented. The pilots were the most experienced observers. Encouragingly, the observers with the most NVD flight time performed as well as the pilots, suggesting that proper training and practice can increase observer performance.
Fire Monitoring
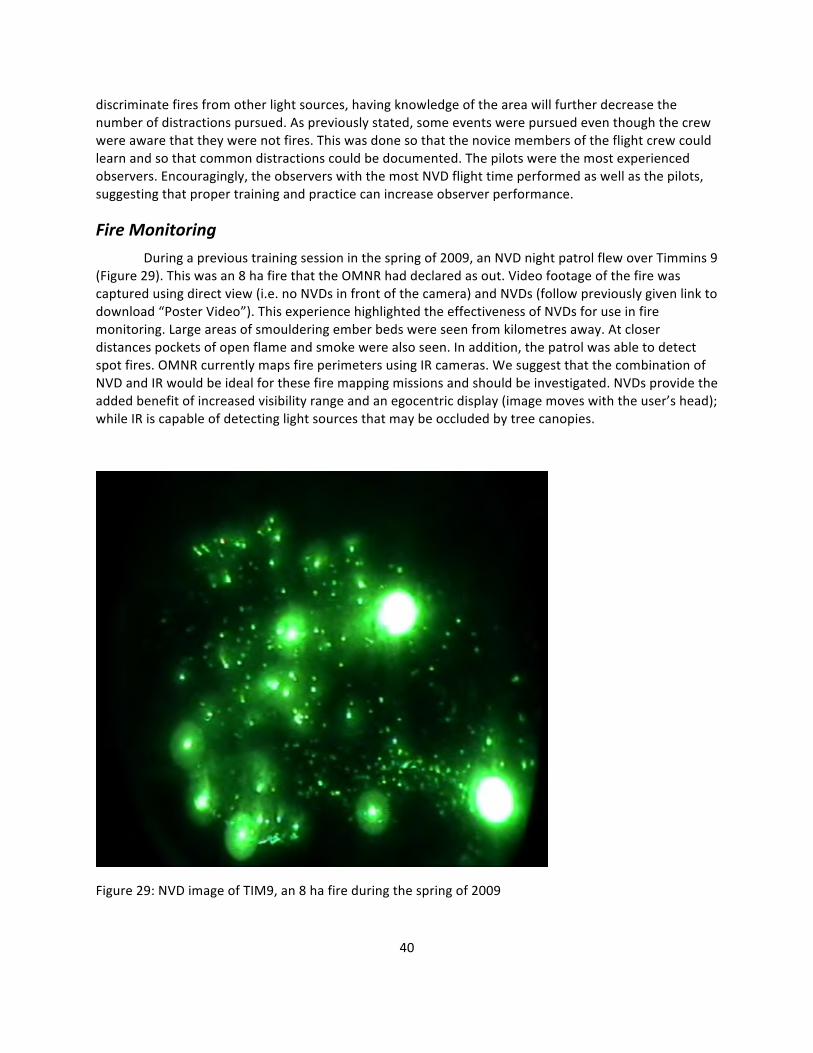
During a previous training session in the spring of 2009, an NVD night patrol flew over Timmins 9 (Figure 29). This was an 8 ha fire that the OMNR had declared as out. Video footage of the fire was captured using direct view (i.e. no NVDs in front of the camera) and NVDs (follow previously given link to download “Poster Video”). This experience highlighted the effectiveness of NVDs for use in fire monitoring. Large areas of smouldering ember beds were seen from kilometres away. At closer distances pockets of open flame and smoke were also seen. In addition, the patrol was able to detect spot fires. OMNR currently maps fire perimeters using IR cameras. We suggest that the combination of NVD and IR would be ideal for these fire mapping missions and should be investigated. NVDs provide the added benefit of increased visibility range and an egocentric display (image moves with the user’s head); while IR is capable of detecting light sources that may be occluded by tree canopies.
Figure 29: NVD image of TIM9, an 8 ha fire during the spring of 2009
41
Recommendations Specific recommendations include:
1. NVDs be implemented into fire detection protocols. The implementation should be phased in—initially through small-‐scale operational trials, to further investigate the opportunities and challenges related to integration of NVD’s in fire detection operations. In order to effectively use NVDs it is imperative that they be used by crew members with knowledge of the geographical area (or GIS aids) and experience in both NVD use and fire detection. In addition, NVD fire detection flight paths should be planned by an experienced Aircraft Management Officer who is sensitive to the requirements of NVD use. Flight paths concentrated over areas with a high density of lighting strikes will maximize the likelihood of detecting nascent fires.
2. Investigate IR/NVD detection scenarios, particularly aircraft mounted FLIR systems. While IR detection patrols are not carried out by OMNR, IR perimeter mapping and spot fire detection is. Most of the benefits of NVD-‐aided detection also apply to spot fire detection (although glare from the main fire is a potential issue and needs further investigation). NVDs also enable safer night flight and thus allow for night time IR operations when IR contrast is enhanced and false positives from sun warmed rocks and other features less likely. We had limited experience recording handheld IR imagery for comparison so this should be addressed in future trials. Many studies have espoused the benefits of multispectral approaches and the combination of IR and NVD detection has potential for reducing false alarms and better characterizing the fire. NVDs allow for natural egocentric scanning but IR is more tolerant of occlusion and provides a thermal signature. The integration of these tools needs to be explored.
3. Determine the best time of day for NVD detection patrols. Rising humidity and falling temperatures cause the fires to ‘lay down’ possibly making them more difficult to spot. It is probable that low relative humidity recovery throughout the night will yield greater detection success and improve visibility. An increase in relative humidity inhibits the growth of a fire and often reduces fire behaviour. Conversely, contrast may be enhanced and human activities less distracting with later flight. Finally, moonlight and cloud cover can vary over the night and impact image quality in the NVD. An analysis of the factors involved in timing of NVD patrols is warranted. It is possible, perhaps probable, that no single best time of day exists and the patrol will need to be planned in light of current conditions, weather predictions, fire behaviour models and operational constraints such as availability of aircraft and crew workload and readiness.
4. Knowledge or information about non-‐fire environmental light sources is a great aid to efficiency in NVD detection and so is experience and training in NVD fire detection. Modifications and enhancements to detection patrol training curricula specific for NVD patrols will be necessary. This could either be an (optional) addition of material to the standard curriculum or a dedicated NVD detection course. Provision of accurate GIS data could be used to compensate for lack of knowledge of the local geography (or to augment the observer’s knowledge). Preliminary experience with a nighttime variant of the FireHawk interface (McFayden et al, 2010) suggests that such information can be

42
very useful for identifying environmental distractions although more study is required to fully assess the potential of such information.
43
References Andriychuk, T., Tomkins, L., Zacher, J. E., Ballagh, M., McAlpine, R., Doig, T., Jennings, S. Milner,
A. & Allison, R.S. (2010). Report on the Pembroke NVD-‐aided aerial forest fire detection
trials held April 22-‐25, 2010. York University, Technical Report CSE-‐2010-‐09.
Bradley, A. & Kaiser, M. K. (1994). Evaluation of visual acuity with Gen III night vision goggles.
NASA, Ames Research Center, Moffet Field, CA.
Braithwaite, M. G., Douglass, P. K., Durnford, S. J. & Lucas, G. (1998). The hazard of spatial
disorientation during helicopter flight using night vision devices. Aviation Space and
Environmental Medicine, 69(11), 1038-‐1044.
DeLucia, P. R. & Task, H. L. (1995). Depth and collision judgment using night vision goggles.
International Journal of Aviation Psychology, 5(4), 371-‐386.
Harrison, M. F., Neary, J. P., Albert, W. J., Veillette, D. W., McKenzie, N. P. & Croll, J. C. (2007).
Physiological effects of night vision goggle counterweights on neck musculature of military
helicopter pilots. Military Medicine, 172(8), 864-‐870.
Hughes, P. K, Zalevski, & Gibbs, P. (2000). Visual acuity, contrast sensitivity, and stereopsis
when viewing with night vision goggles. Technical Report No. DSTO-‐TR-‐1012.
Macuda, T., Craig, G., Allison, R. S., Guterman, P., Thomas, P. & Jennings, S. (2005). Detection of
motion-‐defined form using night vision goggles. Paper presented at the Helmet-‐ and
Head-‐Mounted Displays X: Technologies and Applications, Proceedings of the SPIE -‐ The
International Society for Optical Engineering, 5800, 1-‐8, Orlando, FL, USA.
44
McFayden, C., Kellar, L. & Tarrant, D. (2008). How aircraft find wildfires. Ontario Ministry of
Natural Resources.
Niall, K. K., Reising, J. D. & Martin, E. L. (1999). Distance estimates with night vision goggles: A
little feedback goes a long way. Human Factoris, 41(3), 495-‐506.
Sheehy, J. B. & Wilkinson, M. (1989). Depth-‐perception after prolonged usage of night-‐vision
goggles. Aviation Space and Environmental Medicine, 60(6), 573-‐579.
Task, H. L. (2001). Night vision goggle visual acuity assessment: Results of an interagency test.
Helmet-‐ and Head-‐Mounted Displays VI, 4361, 130-‐137.


![High-performance milling cutter NX-NVD - FRAISA SA milling cutter NX-NVD [ 2 ] The NX-NVD high-performance milling cutter with patented double groove ... 20 4 120 0.110 30.0 8.0 1910](https://img.pdfslide.net/doc/110x75/5aab05447f8b9aa06a8b6ee0/high-performance-milling-cutter-nx-nvd-fraisa-sa-milling-cutter-nx-nvd-2-the.jpg)