Embed Size (px)
Citation preview
INTRODUCTION
GENERAL UNDERWRITING TRENDS
OCTOBER 2001 THROUGH MARCH 2002
HIGHLIGHTS
O ( 8 -8 a W W W w
W W ( 8 -6
Proportion of FDIC-Supervised Banks with “Medium”or “High” Risk Associated with Loan Administration
OCTOBER 2001 THROUGH MARCH 2002€
HIGHLIGHTS For the six months ending March 31, 2002, compared with the six months ending September 30, 2001, examiners noted the following changes in underwriting practices at FDIC-supervised banks:
� • Increases in risks associated with current underwriting practices and with purchased loan participations. �� Increases in risks associated with loan administration and in the potential credit risk in institutions’ loan
portfolios. �� A substantial increase in the occurrence of institutions that funded, or deferred, interest payments dur-
ing the term of the commercial construction loans. �� A substantial increase in the occurrence of institutions that made short-term commercial real estate
loans with minimal amortization terms and large “balloon” payments at maturity.
INTRODUCTION At the end of each FDIC-supervised bank examina-
tion, the examiner in charge responds to a question-naire on the bank’s underwriting practices. This Report on Underwriting Practices covers the respons-es submitted during the six months beginning October 1, 2001, and ending March 31, 2002. The number of responses received during this six months was 1,149—which represents approximately 21 percent of the number and 21 percent of the assets of all FDIC-supervised banks. The results reported here refer to weighted responses and are estimates of the under-writing practices of all FDIC-supervised banks. An explanation of the use of weights appears in “Purpose and Design of the Report,” and all weighted respons-es appear in the table at the end of this document. For ease of exposition, the response rates throughout have been rounded to the nearest 1 percent.
GENERAL UNDERWRITING TRENDS During the six months ending March 31, 2002, com-
pared with the six months ending September 30, 2001, risks associated with general underwriting practices increased. For example, the proportion of banks with high risk associated with current underwriting practices rose from 5 percent to 6 percent, and the proportion with medium risk rose from 32 percent to 34 percent. The proportion of banks with medium risk associated with underwriting practices for purchased loan partici-
pations increased from 22 percent to 26 percent. And the risk associated with loan growth and/or significant changes in lending activities since the previous exami-nation also increased: the proportion of banks with high risk rose from 4 percent to 5 percent.
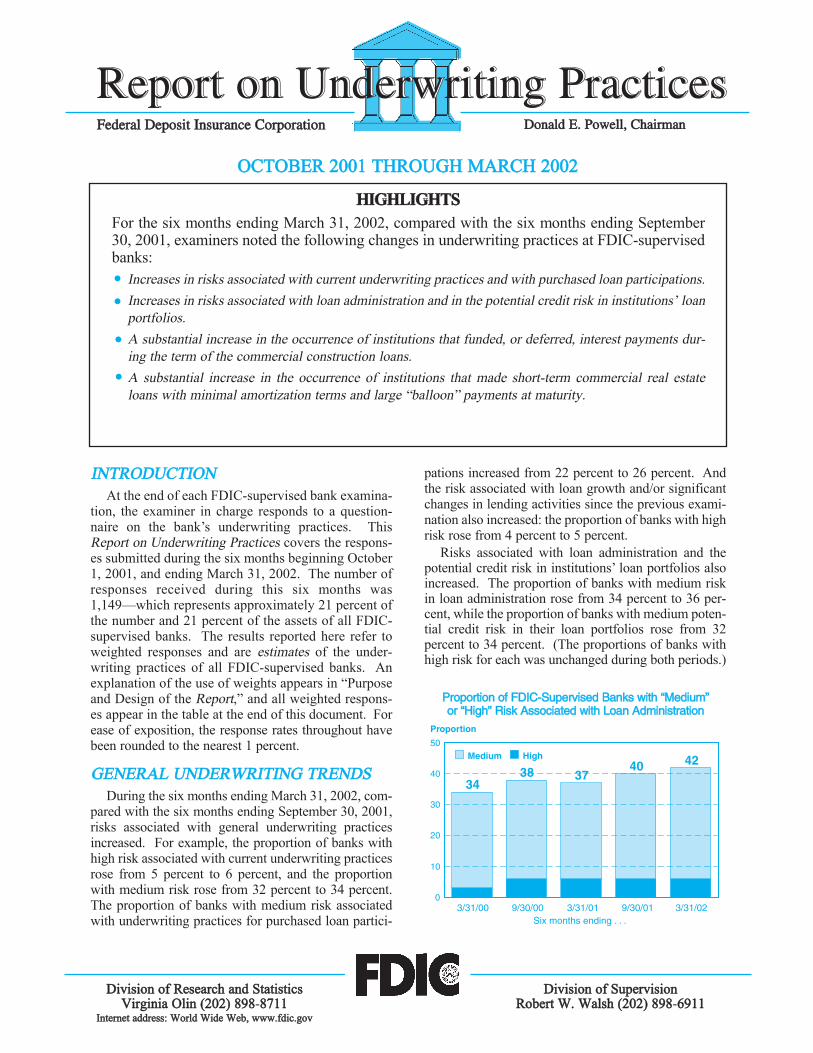
Risks associated with loan administration and the potential credit risk in institutions’ loan portfolios also increased. The proportion of banks with medium risk in loan administration rose from 34 percent to 36 per-cent, while the proportion of banks with medium poten-tial credit risk in their loan portfolios rose from 32 percent to 34 percent. (The proportions of banks with high risk for each was unchanged during both periods.)
Proportion of FDIC-Supervised Banks with “Medium” or “High” Risk Associated with Loan Administration
Proportion
50
40
30
20
10
0
34 40
37 38 High 42Medium
3/31/00 9/30/00 3/31/01 9/30/01 3/31/02 Six months ending . . .
Division oof RResearch aand SStatistics Division oof SSupervision Virginia Olin (202) 898 8711
Internet address: World Wide Web, www.fdic.gov Robert W. Walsh (202) 898 6911
FFeeddeerraall DDeeppoossiitt IInnssuurraannccee CCoorrppoorraattiioonn DDoonnaalldd EE.. PPoowweellll,, CChhaaiirrmmaann
RReeppoorrtt oonn UUnnddeerrwwrriittiinngg PPrraaccttiicceessReport on Underwriting Practices
� •
� •
� •
INDIVIDUAL LOAN CATEGORIES
Number of FDIC-Supervised Banks ActivelyMaking Loans, by Loan Type
Proportion of FDIC-Supervised Banks ThatMaterially Changed Underwriting Practices since the
Previous Examination, by Direction of Change
Proportion of FDIC-Supervised Banks with “Medium” or
2 2
Proportion of FDIC-Supervised Banks with “Medium” or
Medium High
38
Six months ending . . .
During the six months ending March 31, 2002, examiners commented about the increases in banks’ loan portfolios of adverse loan classifications, past due and non-accrual status, technical exceptions, and other troubled loans. They were also concerned with consis-tently inadequate underwriting standards in some banks and loans made to borrowers without adequate cash flow, proper financial and/or credit analyses, and with-out a clear and reasonably predictable repayment source.
These concerns reflected the uptick in some occur-rences of risky underwriting practices, both in general and by loan type. For example, the proportion of banks that either “frequently enough to warrant notice” (here-inafter, “frequently”) or “commonly or as standard pro-cedure” (hereinafter, “commonly”) made loans in which the institution failed to adjust loan pricing on dif-ferent-quality loans to reflect differences in risk increased from 10 percent to 13 percent; and the pro-portion of banks that either “frequently” or “common-ly” made loans that failed to require a material principal reduction before renewing term loans rose from 24 per-cent to 25 percent.
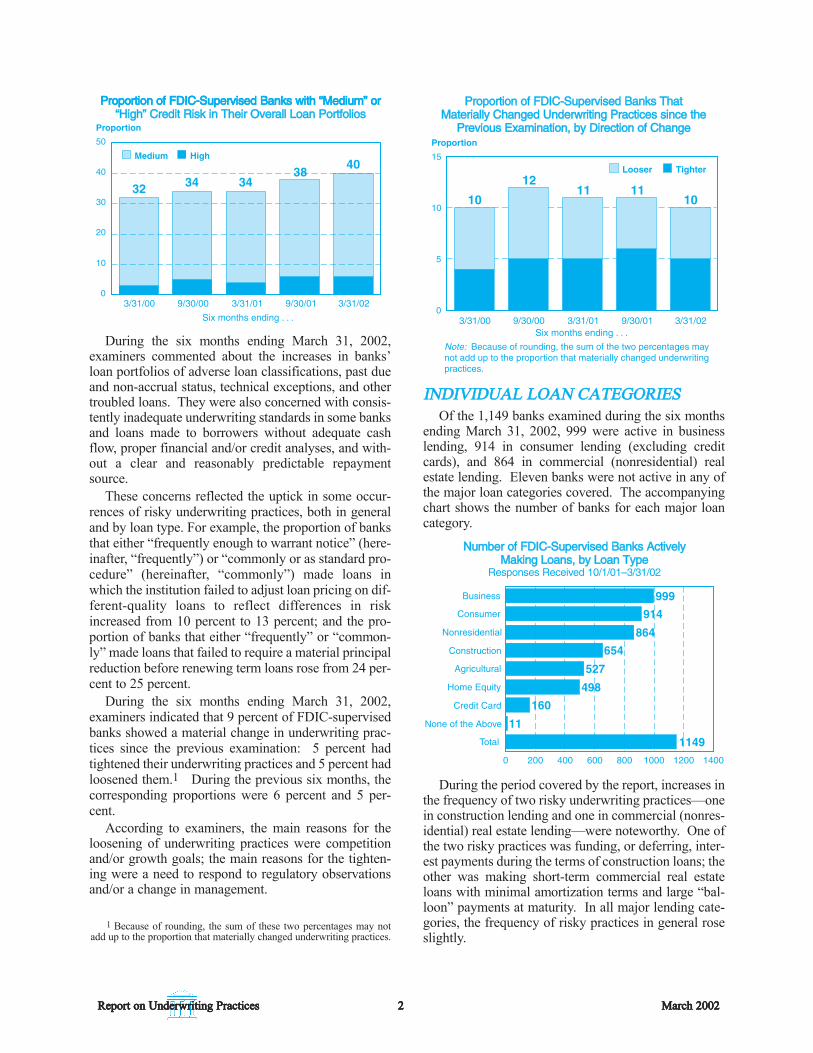
During the six months ending March 31, 2002, examiners indicated that 9 percent of FDIC-supervised banks showed a material change in underwriting prac-tices since the previous examination: 5 percent had tightened their underwriting practices and 5 percent had loosened them.1 During the previous six months, the corresponding proportions were 6 percent and 5 per-cent.
According to examiners, the main reasons for the loosening of underwriting practices were competition and/or growth goals; the main reasons for the tighten-ing were a need to respond to regulatory observations and/or a change in management.
1 Because of rounding, the sum of these two percentages may notadd up to the proportion that materially changed underwriting practices.
Proportion of FDIC-Supervised Banks That Materially Changed Underwriting Practices since the
Previous Examination, by Direction of Change Proportion
15
10
5
0 3/31/00 9/30/00 3/31/01 9/30/01 3/31/02
Six months ending . . .
10
12 11 11
10
Looser Tighter
Note: Because of rounding, the sum of the two percentages may not add up to the proportion that materially changed underwriting practices.
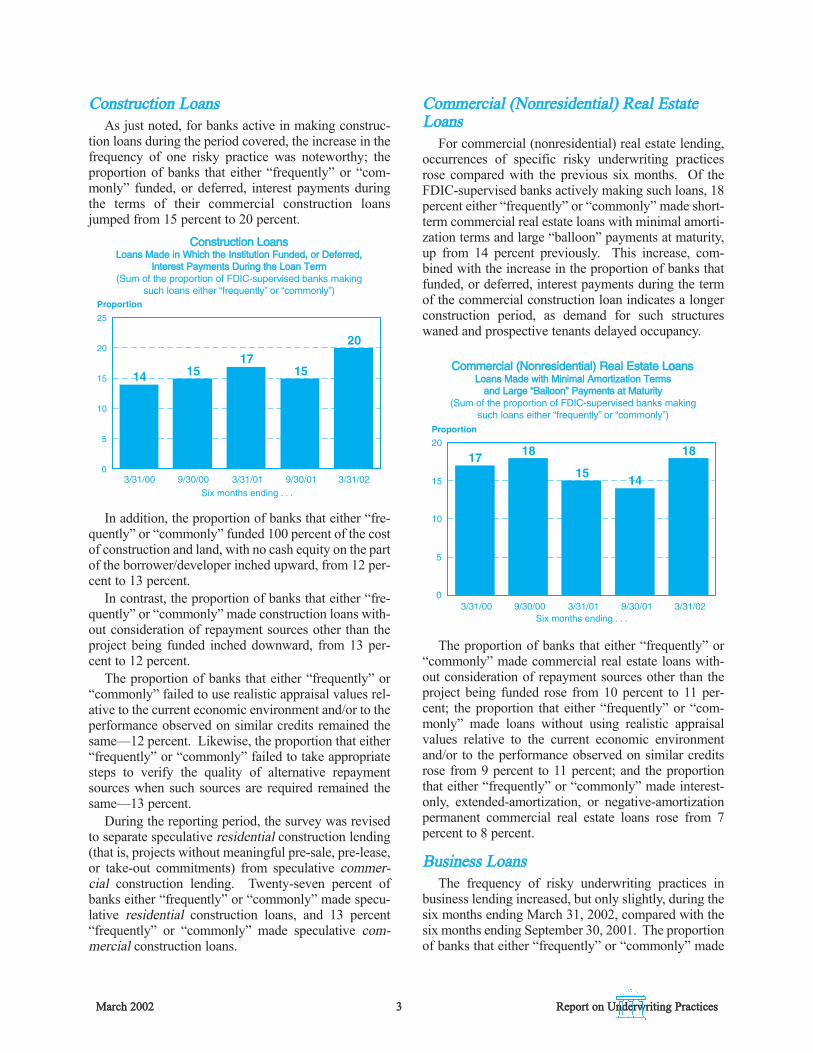
INDIVIDUAL LOAN CATEGORIES Of the 1,149 banks examined during the six months
ending March 31, 2002, 999 were active in business lending, 914 in consumer lending (excluding credit cards), and 864 in commercial (nonresidential) real estate lending. Eleven banks were not active in any of the major loan categories covered. The accompanying chart shows the number of banks for each major loan category.
Number of FDIC-Supervised Banks Actively€Making Loans, by Loan Type€
Responses Received 10/1/01–3/31/02€
Business
Consumer
Nonresidential
Construction
Agricultural
Home Equity
Credit Card
None of the Above
Total
999
654
11
914
864
527
498
160
1149 0 200 400 600 800 1000 1200 1400
During the period covered by the report, increases in the frequency of two risky underwriting practices—one in construction lending and one in commercial (nonres-idential) real estate lending—were noteworthy. One of the two risky practices was funding, or deferring, inter-est payments during the terms of construction loans; the other was making short-term commercial real estate loans with minimal amortization terms and large “bal-loon” payments at maturity. In all major lending cate-gories, the frequency of risky practices in general rose slightly.
Report oon UUnderwriting PPractices 2 March 2002
PPrrooppoorrttiioonn ooff FFDDIICC--SSuuppeerrvviisseedd BBaannkkss wwiitthh ““MMeeddiiuumm”” oorr““HHiigghh”” CCrreeddiitt RRiisskk iinn TThheeiirr OOvveerraallll LLooaann PPoorrttffoolliiooss
Report oon UUnderwriting PPractices 22 March 22002
32 34 3440
3/31/00 9/30/00 3/31/01 9/30/01 3/31/020
10
20
30
40
50
Proportion
Construction Loans Commercial (Nonresidential) Real EstateLoans
Business Loans
2
Loans Made with Minimal Amortization Termsand Large “Balloon” Payments at Maturity
Construction LoansLoans Made in Which the Institution Funded, or Deferred,
Interest Payments During the Loan Term
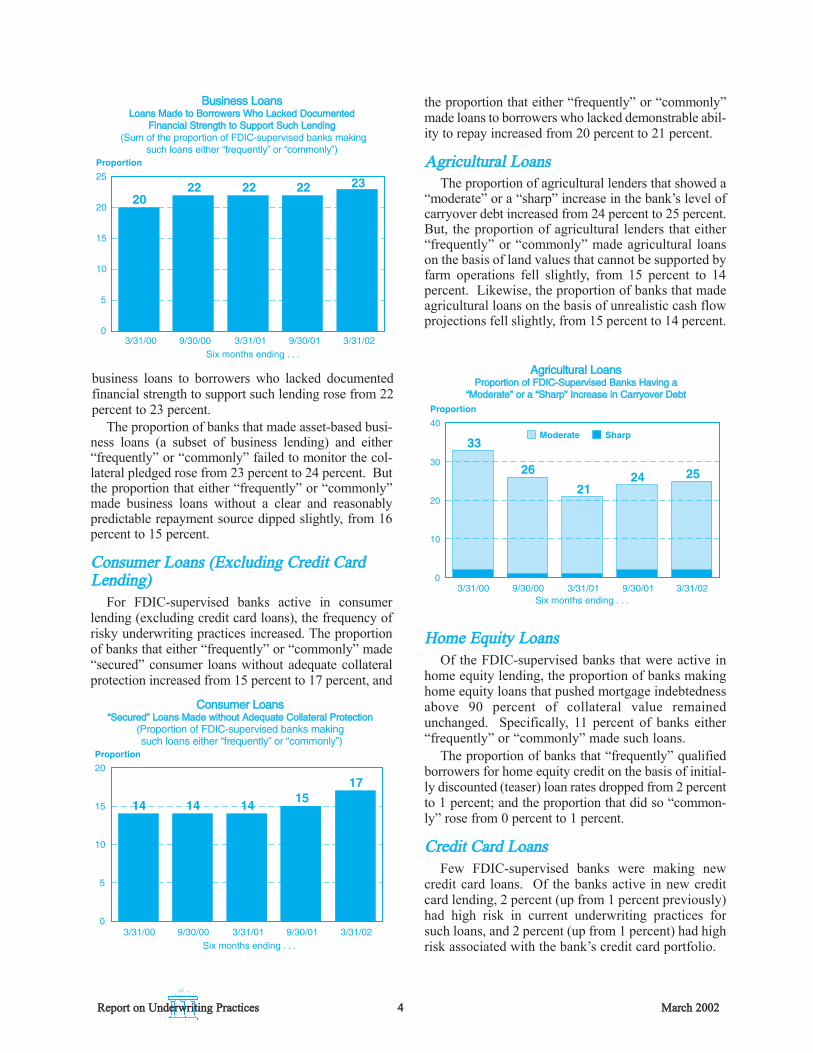
Construction Loans As just noted, for banks active in making construc-
tion loans during the period covered, the increase in the frequency of one risky practice was noteworthy; the proportion of banks that either “frequently” or “com-monly” funded, or deferred, interest payments during the terms of their commercial construction loans jumped from 15 percent to 20 percent.
Construction Loans Loans Made in Which the Institution Funded, or Deferred,
Interest Payments During the Loan Term (Sum of the proportion of FDIC-supervised banks making
such loans either “frequently” or “commonly”) Proportion
25
20
15
10
5
0 3/31/00 9/30/00 3/31/01 9/30/01 3/31/02
15 17
15
20
14
Six months ending . . .
In addition, the proportion of banks that either “fre-quently” or “commonly” funded 100 percent of the cost of construction and land, with no cash equity on the part of the borrower/developer inched upward, from 12 per-cent to 13 percent.
In contrast, the proportion of banks that either “fre-quently” or “commonly” made construction loans with-out consideration of repayment sources other than the project being funded inched downward, from 13 per-cent to 12 percent.
The proportion of banks that either “frequently” or “commonly” failed to use realistic appraisal values rel-ative to the current economic environment and/or to the performance observed on similar credits remained the same—12 percent. Likewise, the proportion that either “frequently” or “commonly” failed to take appropriate steps to verify the quality of alternative repayment sources when such sources are required remained the same—13 percent.
During the reporting period, the survey was revised to separate speculative residential construction lending (that is, projects without meaningful pre-sale, pre-lease, or take-out commitments) from speculative commer-cial construction lending. Twenty-seven percent of banks either “frequently” or “commonly” made specu-lative residential construction loans, and 13 percent “frequently” or “commonly” made speculative com-mercial construction loans.
Commercial (Nonresidential) Real Estate Loans
For commercial (nonresidential) real estate lending, occurrences of specific risky underwriting practices rose compared with the previous six months. Of the FDIC-supervised banks actively making such loans, 18 percent either “frequently” or “commonly” made short-term commercial real estate loans with minimal amorti-zation terms and large “balloon” payments at maturity, up from 14 percent previously. This increase, com-bined with the increase in the proportion of banks that funded, or deferred, interest payments during the term of the commercial construction loan indicates a longer construction period, as demand for such structures waned and prospective tenants delayed occupancy.
Loans Made with Minimal Amortization Terms and Large “Balloon” Payments at Maturity
(Sum of the proportion of FDIC-supervised banks making such loans either “frequently” or “commonly”)
Proportion
20
15
10
5
0 3/31/00 9/30/00 3/31/01 9/30/01 3/31/02
Six months ending . . .
17 18
15
18
14
The proportion of banks that either “frequently” or “commonly” made commercial real estate loans with-out consideration of repayment sources other than the project being funded rose from 10 percent to 11 per-cent; the proportion that either “frequently” or “com-monly” made loans without using realistic appraisal values relative to the current economic environment and/or to the performance observed on similar credits rose from 9 percent to 11 percent; and the proportion that either “frequently” or “commonly” made interest-only, extended-amortization, or negative-amortization permanent commercial real estate loans rose from 7 percent to 8 percent.
Business Loans The frequency of risky underwriting practices in
business lending increased, but only slightly, during the six months ending March 31, 2002, compared with the six months ending September 30, 2001. The proportion of banks that either “frequently” or “commonly” made
March 2002 3 Report oon UUnderwriting PPractices
CCoommmmeerrcciiaall ((NNoonnrreessiiddeennttiiaall)) RReeaall EEssttaattee LLoooaannss
Consumer Loans (Excluding Credit CardLending)
Agricultural Loans
Home Equity Loans
Credit Card Loans
Agricultural LoansProportion of FDIC-Supervised Banks Having a
“Moderate” or a “Sharp” Increase in Carryover Debt
4 2
Business LoansLoans Made to Borrowers Who Lacked Documented
Financial Strength to Support Such Lending
Consumer Loans“Secured” Loans Made without Adequate Collateral Protection
Business Loans Loans Made to Borrowers Who Lacked Documented
Financial Strength to Support Such Lending (Sum of the proportion of FDIC-supervised banks making
such loans either “frequently” or “commonly”) Proportion
25
20
15
10
5
0 3/31/00 9/30/00 3/31/01 9/30/01 3/31/02
20 22 22 22 23
Six months ending . . .
business loans to borrowers who lacked documented financial strength to support such lending rose from 22 percent to 23 percent.
The proportion of banks that made asset-based busi-ness loans (a subset of business lending) and either “frequently” or “commonly” failed to monitor the col-lateral pledged rose from 23 percent to 24 percent. But the proportion that either “frequently” or “commonly” made business loans without a clear and reasonably predictable repayment source dipped slightly, from 16 percent to 15 percent.
Consumer Loans (Excluding Credit Card Lending)
For FDIC-supervised banks active in consumer lending (excluding credit card loans), the frequency of risky underwriting practices increased. The proportion of banks that either “frequently” or “commonly” made “secured” consumer loans without adequate collateral protection increased from 15 percent to 17 percent, and
Consumer Loans “Secured” Loans Made without Adequate Collateral Protection
(Proportion of FDIC-supervised banks making such loans either “frequently” or “commonly”)
Proportion
20
15
10
5
0 3/31/00 9/30/00 3/31/01 9/30/01 3/31/02
15 17
14 14 14
Six months ending . . .
the proportion that either “frequently” or “commonly” made loans to borrowers who lacked demonstrable abil-ity to repay increased from 20 percent to 21 percent.
Agricultural Loans The proportion of agricultural lenders that showed a
“moderate” or a “sharp” increase in the bank’s level of carryover debt increased from 24 percent to 25 percent. But, the proportion of agricultural lenders that either “frequently” or “commonly” made agricultural loans on the basis of land values that cannot be supported by farm operations fell slightly, from 15 percent to 14 percent. Likewise, the proportion of banks that made agricultural loans on the basis of unrealistic cash flow projections fell slightly, from 15 percent to 14 percent.
Agricultural Loans Proportion of FDIC-Supervised Banks Having a
“Moderate” or a “Sharp” Increase in Carryover Debt Proportion
40
30
20
10
0 3/31/00 9/30/00 3/31/01 9/30/01 3/31/02
Six months ending . . .
33
26
21 24 25
Moderate Sharp
Home Equity Loans Of the FDIC-supervised banks that were active in
home equity lending, the proportion of banks making home equity loans that pushed mortgage indebtedness above 90 percent of collateral value remained unchanged. Specifically, 11 percent of banks either “frequently” or “commonly” made such loans.
The proportion of banks that “frequently” qualified borrowers for home equity credit on the basis of initial-ly discounted (teaser) loan rates dropped from 2 percent to 1 percent; and the proportion that did so “common-ly” rose from 0 percent to 1 percent.
Credit Card Loans Few FDIC-supervised banks were making new
credit card loans. Of the banks active in new credit card lending, 2 percent (up from 1 percent previously) had high risk in current underwriting practices for such loans, and 2 percent (up from 1 percent) had high risk associated with the bank’s credit card portfolio.
Report oon UUnderwriting PPractices 4 March 2002
2
Purpose and Design of the Report
O 1 1
1 1
n
t r t p p t t w r a a m
u p o l -s i t n
o i
e t w n
o a s p
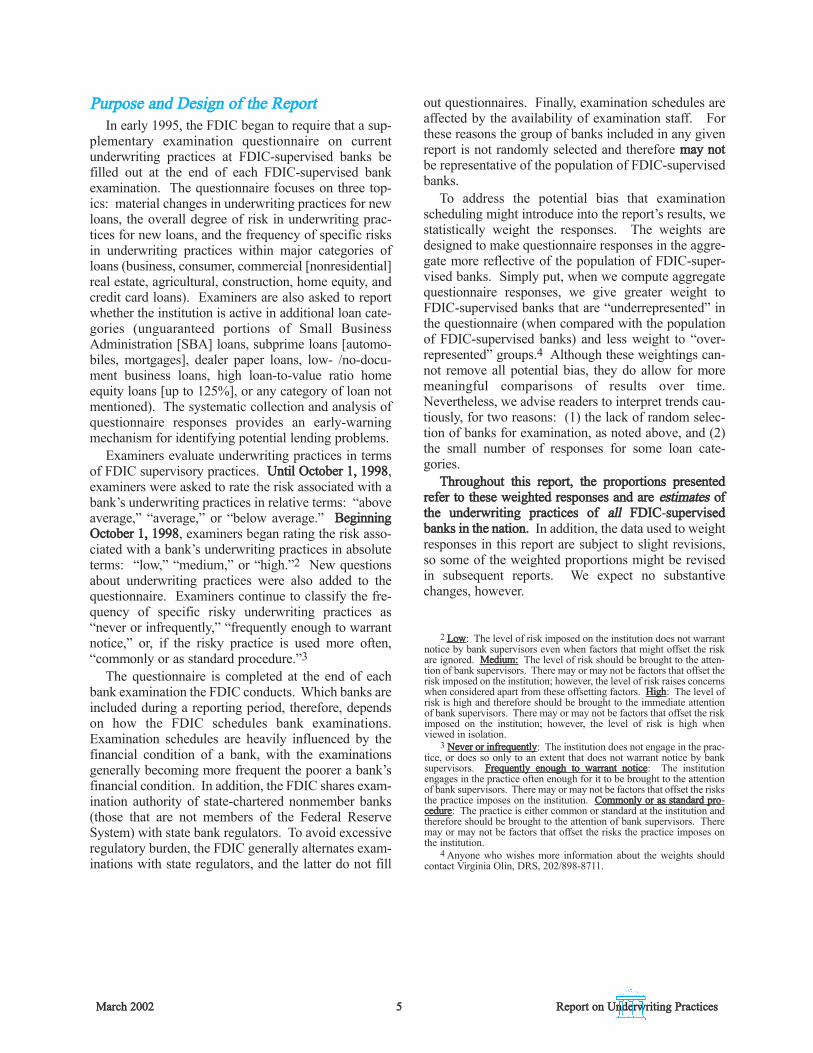
Purpose and Design of the Report In early 1995, the FDIC began to require that a sup-
plementary examination questionnaire on current underwriting practices at FDIC-supervised banks be filled out at the end of each FDIC-supervised bank examination. The questionnaire focuses on three top-ics: material changes in underwriting practices for new loans, the overall degree of risk in underwriting prac-tices for new loans, and the frequency of specific risks in underwriting practices within major categories of loans (business, consumer, commercial [nonresidential] real estate, agricultural, construction, home equity, and credit card loans). Examiners are also asked to report whether the institution is active in additional loan cate-gories (unguaranteed portions of Small Business Administration [SBA] loans, subprime loans [automo-biles, mortgages], dealer paper loans, low- /no-docu-ment business loans, high loan-to-value ratio home equity loans [up to 125%], or any category of loan not mentioned). The systematic collection and analysis of questionnaire responses provides an early-warning mechanism for identifying potential lending problems.
Examiners evaluate underwriting practices in terms of FDIC supervisory practices. Until October 1, 1998, examiners were asked to rate the risk associated with a bank’s underwriting practices in relative terms: “above average,” “average,” or “below average.” Beginning October 1, 1998, examiners began rating the risk asso-ciated with a bank’s underwriting practices in absolute terms: “low,” “medium,” or “high.”2 New questions about underwriting practices were also added to the questionnaire. Examiners continue to classify the fre-quency of specific risky underwriting practices as “never or infrequently,” “frequently enough to warrant notice,” or, if the risky practice is used more often, “commonly or as standard procedure.”3
The questionnaire is completed at the end of each bank examination the FDIC conducts. Which banks are included during a reporting period, therefore, depends on how the FDIC schedules bank examinations. Examination schedules are heavily influenced by the financial condition of a bank, with the examinations generally becoming more frequent the poorer a bank’s financial condition. In addition, the FDIC shares exam-ination authority of state-chartered nonmember banks (those that are not members of the Federal Reserve System) with state bank regulators. To avoid excessive regulatory burden, the FDIC generally alternates exam-inations with state regulators, and the latter do not fill
out questionnaires. Finally, examination schedules are affected by the availability of examination staff. For these reasons the group of banks included in any given report is not randomly selected and therefore may not be representative of the population of FDIC-supervised banks.
To address the potential bias that examination scheduling might introduce into the report’s results, we statistically weight the responses. The weights are designed to make questionnaire responses in the aggre-gate more reflective of the population of FDIC-super-vised banks. Simply put, when we compute aggregate questionnaire responses, we give greater weight to FDIC-supervised banks that are “underrepresented” in the questionnaire (when compared with the population of FDIC-supervised banks) and less weight to “over-represented” groups.4 Although these weightings can-not remove all potential bias, they do allow for more meaningful comparisons of results over time. Nevertheless, we advise readers to interpret trends cau-tiously, for two reasons: (1) the lack of random selec-tion of banks for examination, as noted above, and (2) the small number of responses for some loan cate-gories.
Throughout this report, the proportions presented refer to these weighted responses and are estimates of the underwriting practices of a l FDIC supervised banks in the nation. In addition, the data used to weight responses in this report are subject to slight revisions, so some of the weighted proportions might be revised in subsequent reports. We expect no substantive changes, however.
2 Low: The level of risk imposed on the institution does not warrantnotice by bank supervisors even when factors that might offset the risk are ignored. Medium: The level of risk should be brought to the atten-tion of bank supervisors. There may or may not be factors that offset the risk imposed on the institution; however, the level of risk raises concerns when considered apart from these offsetting factors. High: The level of risk is high and therefore should be brought to the immediate attentionof bank supervisors. There may or may not be factors that offset the risk imposed on the institution; however, the level of risk is high whenviewed in isolation.
3 Never or infrequently: The institution does not engage in the prac-tice, or does so only to an extent that does not warrant notice by banksupervisors. Frequently enough to warrant notice: The institution engages in the practice often enough for it to be brought to the attentionof bank supervisors. There may or may not be factors that offset the risks the practice imposes on the institution. Commonly or as standard pro-cedure: The practice is either common or standard at the institution and therefore should be brought to the attention of bank supervisors. There may or may not be factors that offset the risks the practice imposes onthe institution.
4 Anyone who wishes more information about the weights should contact Virginia Olin, DRS, 202/898-8711.
March 2002 5 Report oon UUnderwriting PPractices
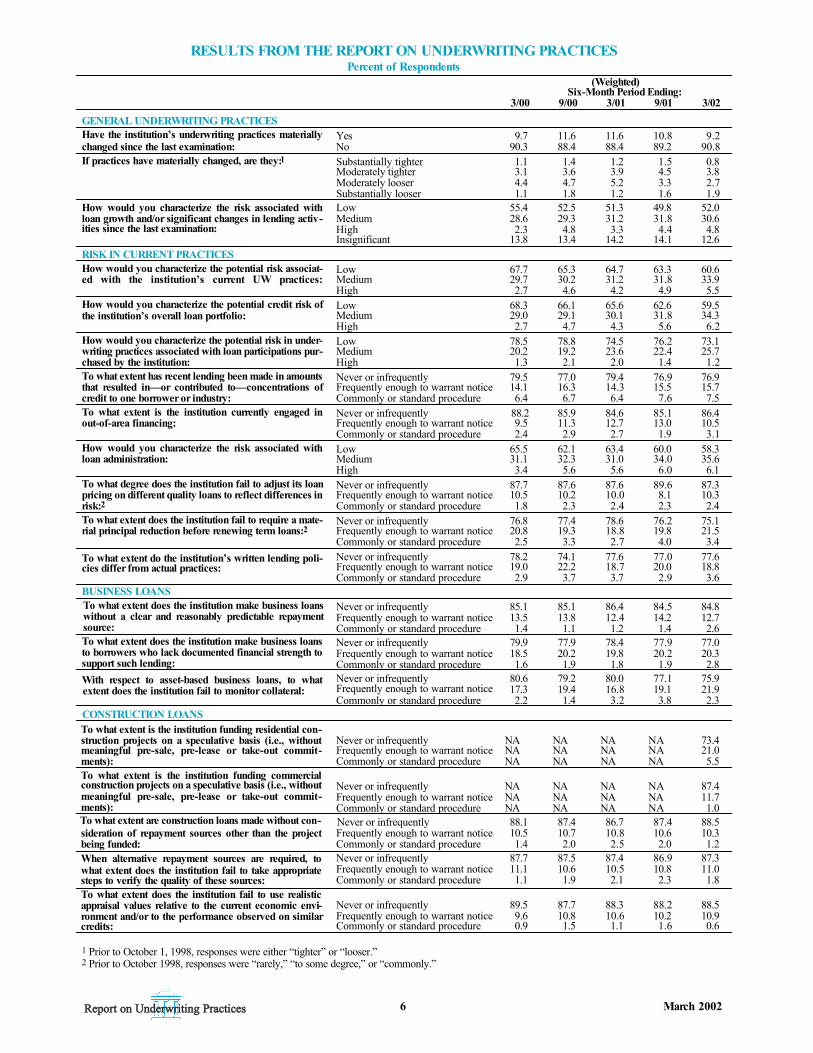
RESULTS FROM THE REPORT ON UNDERWRITING PRACTICES Percent of Respondents
(Weighted)Six-Month Period Ending:
3/00 9/00 3/01 9/01 3/02 GENERAL UNDERWRITING PRACTICES Have the institution’s underwriting practices materially Yes 9.7 11.6 11.6 10.8 9.2 changed since the last examination: No 90.3 88.4 88.4 89.2 90.8 If practices have materially changed, are they:1 Substantially tighter
Moderately tighter 1.1 3.1
1.4 3.6
1.2 3.9
1.5 4.5
0.8 3.8
Moderately looser 4.4 4.7 5.2 3.3 2.7 Substantially looser 1.1 1.8 1.2 1.6 1.9
How would you characterize the risk associated with Low 55.4 52.5 51.3 49.8 52.0 loan growth and/or significant changes in lending activ -ities since the last examination:
Medium HighInsignificant
28.6 2.3
13.8
29.3 4.8
13.4
31.2 3.3
14.2
31.8 4.4
14.1
30.6 4.8
12.6 RISK IN CURRENT PRACTICES How would you characterize the potential risk associat- Low 67.7 65.3 64.7 63.3 60.6 ed with the institution’s current UW practices: Medium 29.7 30.2 31.2 31.8 33.9
High 2.7 4.6 4.2 4.9 How would you characterize the potential credit risk of Low 68.3 66.1 65.6 62.6 59.5 the institution’s overall loan portfolio: Medium 29.0 29.1 30.1 31.8 34.3
High 2.7 4.7 4.3 5.6 How would you characterize the potential risk in under- Low 78.5 78.8 74.5 76.2 73.1 writing practices associated with loan participations pur - Medium 20.2 19.2 23.6 22.4 25.7 chased by the institution: High 1.3 2.1 2.0 1.4 To what extent has recent lending been made in amounts that resulted in—or contributed to—concentrations of credit to one borrower or industry:
Never or infrequently 79.5 77.0 79.4 76.9 76.9 Frequently enough to warrant notice 14.1 16.3 14.3 15.5 15.7 Commonly or standard procedure 6.4 6.7 6.4 7.6
To what extent is the institution currently engaged in out-of-area financing:
Never or infrequentlyFrequently enough to warrant notice
88.2 9.5
85.9 11.3
84.6 12.7
85.1 13.0
86.4 10.5
Commonly or standard procedure 2.4 2.9 2.7 1.9 How would you characterize the risk associated with Low 65.5 62.1 63.4 60.0 58.3 loan administration: Medium 31.1 32.3 31.0 34.0 35.6
High 3.4 5.6 5.6 6.0 To what degree does the institution fail to adjust its loan pricing on different quality loans to reflect differences in risk:2
Never or infrequentlyFrequently enough to warrant notice Commonly or standard procedure
87.7 10.5 1.8
87.6 10.2 2.3
87.6 10.0 2.4
89.6 8.1 2.3
87.3 10.3
To what extent does the institution fail to require a mate-rial principal reduction before renewing term loans:2
To what extent do the institution’s written lending policies differ from actual practices:
Never or infrequentlyFrequently enough to warrant notice
76.8 20.8
77.4 19.3
78.6 18.8
76.2 19.8
75.1 21.5
Commonly or standard procedure 2.5 3.3 2.7 4.0 Never or infrequentlyFrequently enough to warrant notice
78.2 19.0
74.1 22.2
77.6 18.7
77.0 20.0
77.6 18.8
Commonly or standard procedure 2.9 3.7 3.7 2.9 3.6
Never or infrequently 85.1 85.1 86.4 84.5 84.8 Frequently enough to warrant notice 13.5 13.8 12.4 14.2 12.7 Commonly or standard procedure 1.4 1.1 1.2 1.4 2.6
BUSINESS LOANS To what extent does the institution make business loans without a clear and reasonably predictable repayment source: To what extent does the institution make business loans to borrowers who lack documented financial strength to support such lending: With respect to asset-based business loans, to what extent does the institution fail to monitor collateral:
Never or infrequently 79.9 77.9 78.4 77.9 77.0 Frequently enough to warrant notice 18.5 20.2 19.8 20.2 20.3 Commonly or standard procedure 1.6 1.9 1.8 1.9 Never or infrequently 80.6 79.2 80.0 77.1 75.9 Frequently enough to warrant notice 17.3 19.4 16.8 19.1 21.9 Commonly or standard procedure 2.2 1.4 3.2 3.8 2.3
Never or infrequentlyFrequently enough to warrant notice
NA NA
NA NA
NA NA
NA NA
73.4 21.0
Commonly or standard procedure NA NA NA NA 5.5
CONSTRUCTION LOANS To what extent is the institution funding residential construction projects on a speculative basis (i.e., withoutmeaningful pre-sale, pre-lease or take-out commitments): To what extent is the institution funding commercialconstruction projects on a speculative basis (i.e., without meaningful pre-sale, pre-lease or take-out commitments): To what extent are construction loans made without con-
Never or infrequently NA NA NA NA 87.4 Frequently enough to warrant notice NA NA NA NA 11.7 Commonly or standard procedure NA NA NA NA 1.0
sideration of repayment sources other than the project being funded: When alternative repayment sources are required, to what extent does the institution fail to take appropriate
Never or infrequently 88.1 87.4 86.7 87.4 88.5 Frequently enough to warrant notice 10.5 10.7 10.8 10.6 10.3 Commonly or standard procedure 1.4 2.0 2.5 2.0 1.2 Never or infrequently 87.7 87.5 87.4 86.9 87.3 Frequently enough to warrant notice 11.1 10.6 10.5 10.8 11.0 Commonly or standard procedure 1.1 1.9 2.1 2.3 1.8 steps to verify the quality of these sources:
To what extent does the institution fail to use realistic appraisal values relative to the current economic environment and/or to the performance observed on similarcredits:
Never or infrequently 89.5 87.7 88.3 88.2 88.5 Frequently enough to warrant notice 9.6 10.8 10.6 10.2 10.9 Commonly or standard procedure 0.9 1.5 1.1 1.6 0.6
1 Prior to October 1, 1998, responses were either “tighter” or “looser.”€2 Prior to October 1998, responses were “rarely,” “to some degree,” or “commonly.” €
6 March 2002
5.5
6.2
1.2
7.5
3.1
6.1
2.4
3.4
2.8
Report oon UUnderwriting PPractices
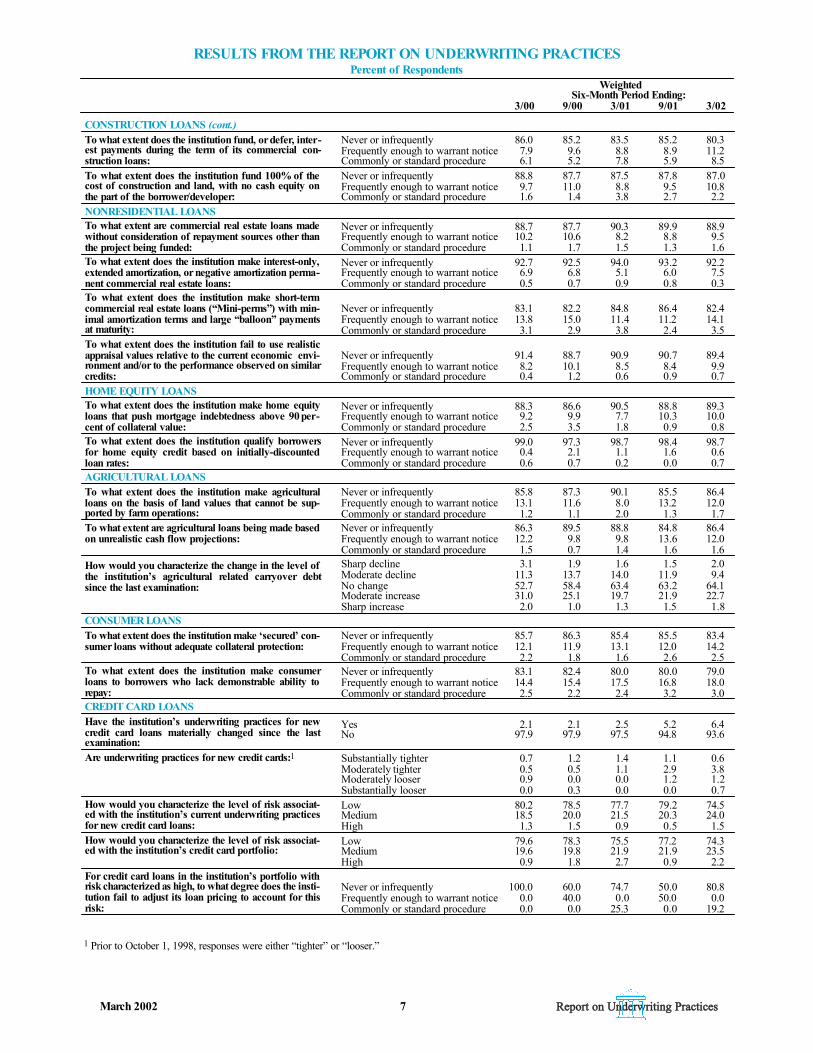
RESULTS FROM THE REPORT ON UNDERWRITING PRACTICES Percent of Respondents
WeightedSix-Month Period Ending:
3/00 9/00 3/01 9/01 3/02
CONSTRUCTION LOANS (cont.) To what extent does the institution fund, or defer, inter -est payments during the term of its commercial con-struction loans:
Never or infrequently Frequently enough to warrant noticeCommonly or standard procedure
86.0 7.9 6.1
85.2 9.6 5.2
83.5 8.8 7.8
85.2 8.9 5.9
80.3 11.2 8.5
To what extent does the institution fund 100% of the cost of construction and land, with no cash equity on the part of the borrower/developer:
Never or infrequently Frequently enough to warrant noticeCommonly or standard procedure
88.8 9.7 1.6
87.7 11.0 1.4
87.5 8.8 3.8
87.8 9.5 2.7
87.0 10.8 2.2
NONRESIDENTIAL LOANS To what extent are commercial real estate loans made without consideration of repayment sources other than
Never or infrequentlyFrequently enough to warrant notice
88.7 10.2
87.7 10.6
90.3 8.2
89.9 8.8
88.9 9.5
the project being funded: Commonly or standard procedure 1.1 1.7 1.5 1.3 1.6 To what extent does the institution make interest-only, extended amortization, or negative amortization perma -
Never or infrequentlyFrequently enough to warrant notice
92.7 6.9
92.5 6.8
94.0 5.1
93.2 6.0
92.2 7.5
nent commercial real estate loans: Commonly or standard procedure 0.5 0.7 0.9 0.8 0.3 To what extent does the institution make short-term commercial real estate loans (“Mini-perms”) with min- Never or infrequently 83.1 82.2 84.8 86.4 82.4 imal amortization terms and large “balloon” paymentsat maturity:
Frequently enough to warrant notice Commonly or standard procedure
13.8 3.1
15.0 2.9
11.4 3.8
11.2 2.4
14.1 3.5
To what extent does the institution fail to use realistic appraisal values relative to the current economic envi-ronment and/or to the performance observed on similar credits:
Never or infrequently Frequently enough to warrant noticeCommonly or standard procedure
91.4 8.2 0.4
88.7 10.1 1.2
90.9 8.5 0.6
90.7 8.4 0.9
89.4 9.9 0.7
HOME EQUITY LOANS To what extent does the institution make home equity loans that push mortgage indebtedness above 90 per -
Never or infrequentlyFrequently enough to warrant notice
88.3 9.2
86.6 9.9
90.5 7.7
88.8 10.3
89.3 10.0
cent of collateral value: Commonly or standard procedure 2.5 3.5 1.8 0.9 To what extent does the institution qualify borrowers for home equity credit based on initially-discounted
Never or infrequentlyFrequently enough to warrant notice
99.0 0.4
97.3 2.1
98.7 1.1
98.4 1.6
98.7 0.6
loan rates: Commonly or standard procedure 0.6 0.7 0.2 0.0 0.7 AGRICULTURAL LOANS To what extent does the institution make agricultural Never or infrequently 85.8 87.3 90.1 85.5 86.4 loans on the basis of land values that cannot be sup-ported by farm operations:
Frequently enough to warrant notice Commonly or standard procedure
13.1 1.2
11.6 1.1
8.0 2.0
13.2 1.3
12.0 1.7
To what extent are agricultural loans being made based Never or infrequently 86.3 89.5 88.8 84.8 86.4 on unrealistic cash flow projections: Frequently enough to warrant notice 12.2 9.8 9.8 13.6 12.0
Commonly or standard procedure 1.5 0.7 1.4 1.6 1.6 Sharp decline 3.1 1.9 1.6 1.5 2.0 Moderate decline 11.3 13.7 14.0 11.9 9.4
How would you characterize the change in the level of the institution’s agricultural related carryover debt
No changeModerate increase
52.7 31.0
58.4 25.1
63.4 19.7
63.2 21.9
64.1 22.7
since the last examination:
Sharp increase 2.0 1.0 1.3 1.5 1.8 CONSUMER LOANS To what extent does the institution make ‘secured’ con- Never or infrequently 85.7 86.3 85.4 85.5 83.4 sumer loans without adequate collateral protection: Frequently enough to warrant notice 12.1 11.9 13.1 12.0 14.2
To what extent does the institution make consumer Commonly or standard procedure 2.2 1.8 1.6 2.6 2.5
loans to borrowers who lack demonstrable ability to Never or infrequently 83.1 82.4 80.0 80.0 79.0
repay: Frequently enough to warrant notice 14.4 15.4 17.5 16.8 18.0
CREDIT CARD LOANS Commonly or standard procedure 2.5 2.2 2.4 3.2 3.0
Have the institution’s underwriting practices for new credit card loans materially changed since the lastexamination:
Yes 2.1 2.1 2.5 5.2 6.4
Are underwriting practices for new credit cards:1
No 97.9 97.9 97.5 94.8 93.6
Substantially tighter 0.7 1.2 1.4 1.1 0.6 Moderately tighterModerately looser
0.5 0.9
0.5 0.0
1.1 0.0
2.9 1.2
3.8 1.2
How would you characterize the level of risk associat-ed with the institution’s current underwriting practices
Substantially looser Low
0.0 80.2
0.3 78.5
0.0 77.7
0.0 79.2
0.7 74.5
for new credit card loans: Medium 18.5 20.0 21.5 20.3 24.0
How would you characterize the level of risk associat-ed with the institution’s credit card portfolio:
High Low
1.3 79.6
1.5 78.3
0.9 75.5
0.5 77.2
1.5 74.3
Medium 19.6 19.8 21.9 21.9 23.5
For credit card loans in the institution’s portfolio withrisk characterized as high, to what degree does the insti-
High 0.9 1.8 2.7 0.9 2.2
tution fail to adjust its loan pricing to account for this Never or infrequently 100.0 60.0 74.7 50.0 80.8
risk: Frequently enough to warrant notice 0.0 40.0 0.0 50.0 0.0 Commonly or standard procedure 0.0 0.0 25.3 0.0 19.2
March 2002 7
1 Prior to October 1, 1998, responses were either “tighter” or “looser.”
0.8
Report oon UUnderwriting PPractices
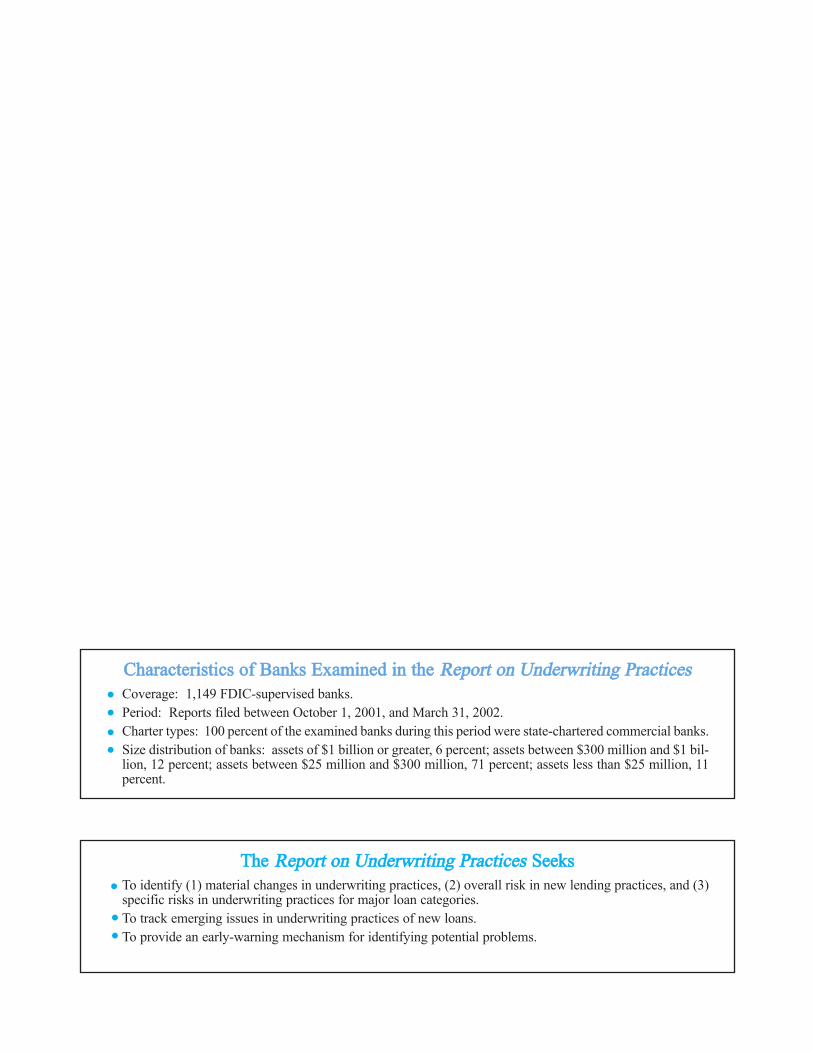
The Report on Underwriting Practices Seeks
Characteristics of Banks Examined in the Report on Underwriting Practices � Coverage: 1,149 FDIC-supervised banks. � Period: Reports filed between October 1, 2001, and March 31, 2002. � Charter types: 100 percent of the examined banks during this period were state-chartered commercial banks. �� Size distribution of banks: assets of $1 billion or greater, 6 percent; assets between $300 million and $1 bil-
lion, 12 percent; assets between $25 million and $300 million, 71 percent; assets less than $25 million, 11 percent.
The Report on Underwriting Practices Seeks �� To identify (1) material changes in underwriting practices, (2) overall risk in new lending practices, and (3)
specific risks in underwriting practices for major loan categories. � To track emerging issues in underwriting practices of new loans. � To provide an early-warning mechanism for identifying potential problems.
� •� •� •� •
� •� •� •