Embed Size (px)
Citation preview
Page 1 of 103
Report on variability of Risk Weighted Assets for Market Risk Portfolios
EBA BS 2012 037
17 December 2013
Page 2 of 103
Report on variability of Risk Weighted Assets for Market Risk Portfolios. Table of contents
List of Figures 4
Abbreviations 5
1. Executive summary 6
2. Introduction 10
2.1 TCOR interaction with previous work conducted by the BCBS 10
3. Main features of the 2013 Hypothetical Portfolio Exercise 11
3.1 Participating banks 11
3.2 Available data 12
3.2.1 Portfolios not provided by banks 12
3.2.2 Portfolios excluded by the EBA 12
3.2.3 Portfolios included in data analysis 13
3.3 Potential sources of variability in market capital charges. 14
3.3.1 Variability stemming from banks’ modelling choices. 14
3.3.2 Variability stemming from supervisory actions. 15
3.4 Limitations of the exercise 16
3.5 P& L data cleaning 17
3.6 Use of the P&L data to assess variability drivers. 18
3.7 Overview of the results obtained. 19
3.7.1 VaR 19
3.7.2 IRC 21
3.7.3 SVaR 22
3.7.4 Internal Model for correlation activities 22
3.7.5 Results for aggregated portfolios: Diversification Benefit 22
3.7.6 Dispersion in capital outcome: 23
3.8 Equity portfolios 24
3.8.1 Individual portfolio analysis. 26
Equity Portfolios: Number 1 – equity index futures 26
Equity Portfolios: Number 2 – bullish leverage trade 27
Equity Portfolios: Number 3 – Volatility trade number 1 28
Equity Portfolios: Number 4 – Volatility trade number 2 (smile effect) 29
Equity Portfolios: Number 5 – Equity Variance Swap 30
Equity Portfolios: Number 6 – Barrier option 31
Page 3 of 103
Equity Portfolios: Number 7 – Quanto index call 32
3.9 Interest Rate portfolios 33
3.9.1 Individual portfolio analysis 36
Interest Rate Portfolios: Number 8 – Curve Flattener Trade 36
Interest Rate Portfolios: Number 9 – Interest rate Swap 37
Interest Rate Portfolios: Number 10 – 2 year Swaption 38
Interest Rate Portfolios: Number 11 – Libor Range Accrual 39
Interest Rate Portfolios: Number 12 – Inflation Zero Coupon Swap 40
3.10 Foreign Exchange (FX) portfolios 41
3.10.1 Individual portfolio analysis 43
F/X Portfolios: Number 13 – Short EUR/USD and short put EUR call USD option 43
F/X Portfolios: Number 14 – Mark-to-market Cross-Currency Basis Swap 44
F/X Portfolios: Number 15 – Knock-out option 45
F/X Portfolios: Number 16 – Double no touch option 46
3.11 Commodity portfolios 47
3.11.1 Individual portfolio analysis 49
Commodity Portfolios: Number 17 – Curve Play from Contango to Backwardation 49
Commodity Portfolios: Number 18 – Short oil put options 50
3.12 Credit portfolios 51
3.12.1 Individual portfolio analysis 55
Credit Spread Portfolios: Number 19 – Sovereign CDS Portfolio 55
Credit Spread Portfolios: Number 20 – Sovereign Bond/CDS Portfolio 56
Credit Spread Portfolios: Number 21 – Sector Concentration Portfolio 57
Credit Spread Portfolios: Number 22 – Diversified Index Portfolio 58
Credit Spread Portfolios: Number 23 – Diversified Index Portfolio (higher concentration) 59
Credit Spread Portfolios: Number 24 – Diversified Corporate Portfolio 60
Credit Spread Portfolios: Number 25 – Index Basis 61
Credit Spread Portfolios: Number 26 – CDS bond Basis 62
Credit Spread Portfolios: Number 27 – Short Index put on ITraxx Europe Crossover series 19 63
Credit Spread Portfolios: Number 28 – Quanto CDS on Spain with delta hedge 64
3.13 Aggregated portfolios 65
3.14 Correlation Trading Models 71
Annex - Portfolio specification 74
Page 4 of 103
List of Figures
Table 1: Participating banks in 2012/2013 HPE
Table 2: Portfolios included in the exercise
Table 3: VaR / VaR Alt / VaR Comp aggregated results
Table 4: Dispersion results – Portfolios 1 to 7
Table 5: Dispersion results – Portfolios 8 to 12
Table 6: Dispersion results – Portfolios 13 to 16
Table 7: Dispersion results – Portfolios 17 to 18
Table 8: Dispersion results – Portfolios 19 to 28
Table 9: Dispersion results – Portfolios 29 to 31
Table 10: Dispersion results – Portfolios 32 to 35
Table 11: Average dispersion results
Table 12: Dispersion results – APR Portfolios 1 to 7
Chart 1: VaR normalised dispersion – Portfolios 1 to 7
Chart 2: VaR Alt normalised dispersion – Portfolios 1 to 7
Chart 3: SVaR normalised dispersion – Portfolios 1 to 7
Chart 4: VaR normalised dispersion – Portfolios 8 to 12
Chart 5: VaR Alt normalised dispersion – Portfolios 8 to 12
Chart 6: IRC normalised dispersion – Portfolio 8
Chart 7: SVaR normalised dispersion – Portfolios 8 to 12
Chart 8: VaR normalised dispersion – Portfolios 13 to 16
Chart 9: VaR Alt normalised dispersion – Portfolios 13 to 16
Chart 10: SVaR normalised dispersion – Portfolios 13 to 16
Chart 11: VaR normalised dispersion – Portfolios 17 & 18
Chart 12: VaR Alt normalised dispersion – Portfolios 17 & 18
Chart 13: SVaR normalised dispersion – Portfolios 17 & 18
Chart 14: VaR normalised dispersion – Portfolios 19 to 28
Chart 15: VaR Alt normalised dispersion – Portfolios 19 to 28
Chart 16: IRC normalised dispersion – Portfolios 19 to 28
Chart 17: SVaR normalised dispersion – Portfolios 19 to 28
Chart 18: VaR normalised dispersion – Portfolios 29 to 35
Chart 19: VaR Alt normalised dispersion – Portfolios 29 to 35
Chart 20: SVaR normalised dispersion – Portfolios 29 to 35
Chart 21: IRC normalised dispersion – Portfolios 29 to 35
Chart 22: Capital normalised dispersion (reg. multipliers) – Portfolios 29 & 30
Chart 23: Capital normalised dispersion (3 multipliers) – Portfolios 29 & 30
Page 5 of 103
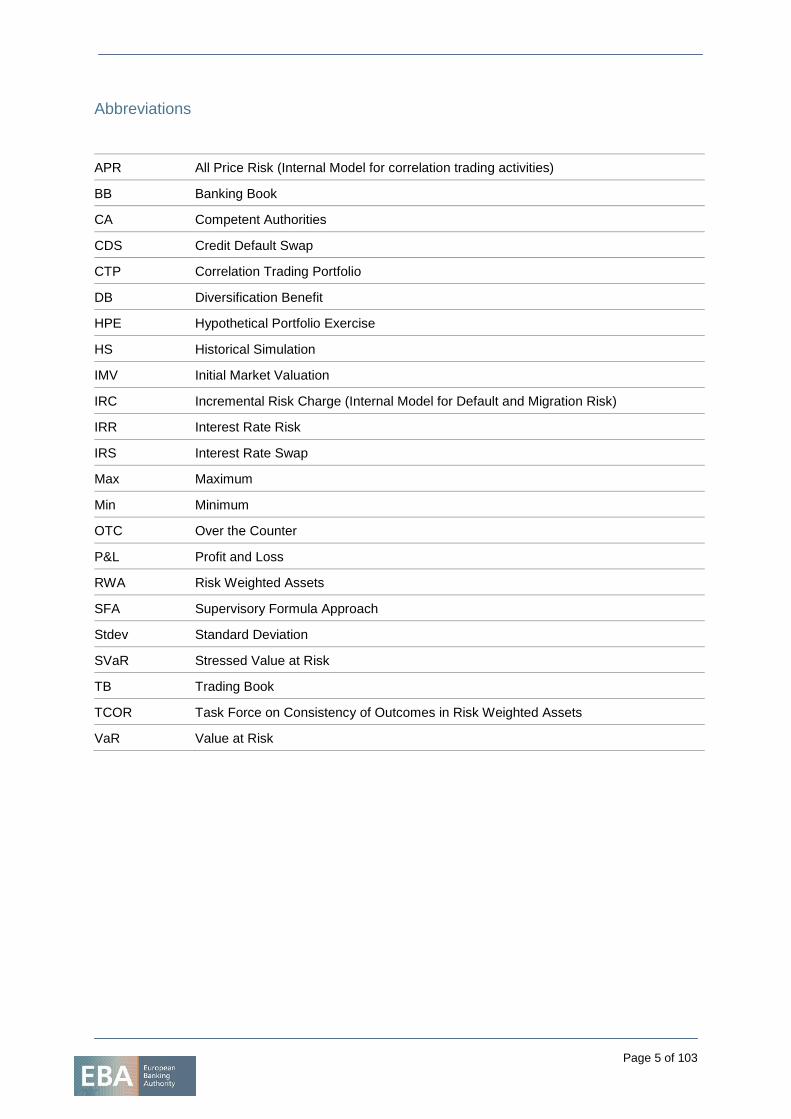
Abbreviations
APR All Price Risk (Internal Model for correlation trading activities)
BB Banking Book
CA Competent Authorities
CDS Credit Default Swap
CTP Correlation Trading Portfolio
DB Diversification Benefit
HPE Hypothetical Portfolio Exercise
HS Historical Simulation
IMV Initial Market Valuation
IRC Incremental Risk Charge (Internal Model for Default and Migration Risk)
IRR Interest Rate Risk
IRS Interest Rate Swap
Max Maximum
Min Minimum
OTC Over the Counter
P&L Profit and Loss
RWA Risk Weighted Assets
SFA Supervisory Formula Approach
Stdev Standard Deviation
SVaR Stressed Value at Risk
TB Trading Book
TCOR Task Force on Consistency of Outcomes in Risk Weighted Assets
VaR Value at Risk
Page 6 of 103
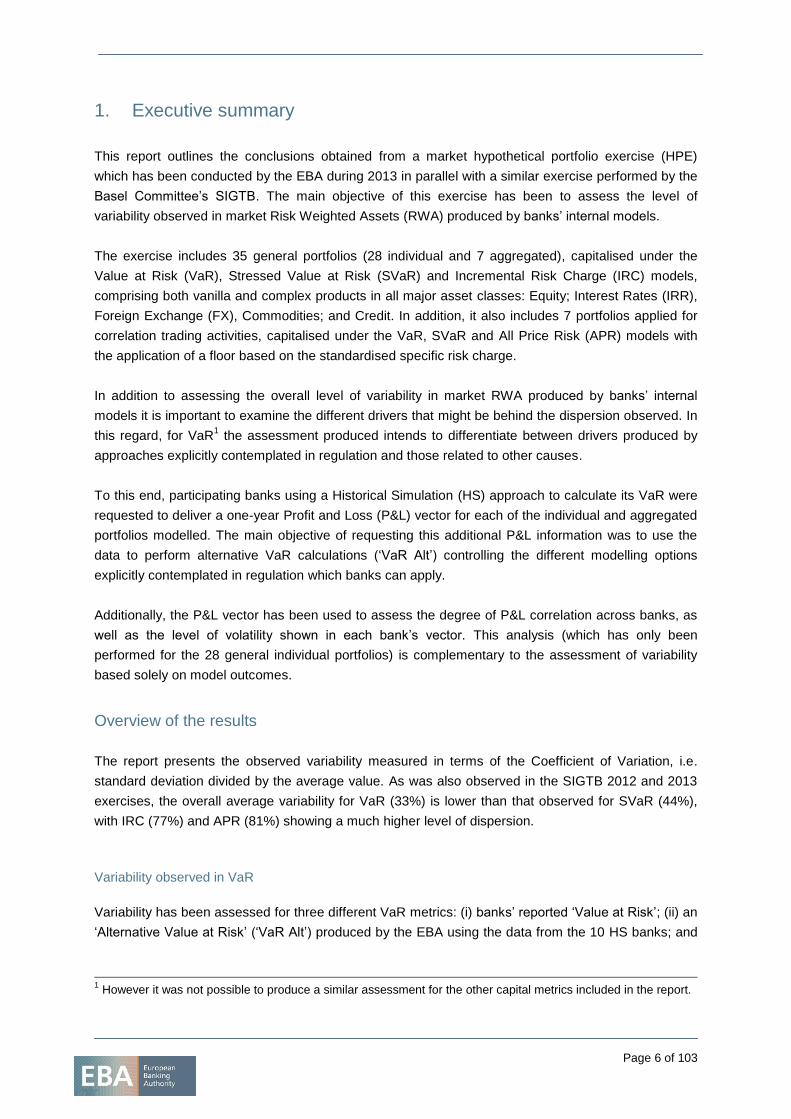
1. Executive summary
This report outlines the conclusions obtained from a market hypothetical portfolio exercise (HPE)
which has been conducted by the EBA during 2013 in parallel with a similar exercise performed by the
Basel Committee’s SIGTB. The main objective of this exercise has been to assess the level of
variability observed in market Risk Weighted Assets (RWA) produced by banks’ internal models.
The exercise includes 35 general portfolios (28 individual and 7 aggregated), capitalised under the
Value at Risk (VaR), Stressed Value at Risk (SVaR) and Incremental Risk Charge (IRC) models,
comprising both vanilla and complex products in all major asset classes: Equity; Interest Rates (IRR),
Foreign Exchange (FX), Commodities; and Credit. In addition, it also includes 7 portfolios applied for
correlation trading activities, capitalised under the VaR, SVaR and All Price Risk (APR) models with
the application of a floor based on the standardised specific risk charge.
In addition to assessing the overall level of variability in market RWA produced by banks’ internal
models it is important to examine the different drivers that might be behind the dispersion observed. In
this regard, for VaR1 the assessment produced intends to differentiate between drivers produced by
approaches explicitly contemplated in regulation and those related to other causes.
To this end, participating banks using a Historical Simulation (HS) approach to calculate its VaR were
requested to deliver a one-year Profit and Loss (P&L) vector for each of the individual and aggregated
portfolios modelled. The main objective of requesting this additional P&L information was to use the
data to perform alternative VaR calculations (‘VaR Alt’) controlling the different modelling options
explicitly contemplated in regulation which banks can apply.
Additionally, the P&L vector has been used to assess the degree of P&L correlation across banks, as
well as the level of volatility shown in each bank’s vector. This analysis (which has only been
performed for the 28 general individual portfolios) is complementary to the assessment of variability
based solely on model outcomes.
Overview of the results
The report presents the observed variability measured in terms of the Coefficient of Variation, i.e.
standard deviation divided by the average value. As was also observed in the SIGTB 2012 and 2013
exercises, the overall average variability for VaR (33%) is lower than that observed for SVaR (44%),
with IRC (77%) and APR (81%) showing a much higher level of dispersion.
Variability observed in VaR
Variability has been assessed for three different VaR metrics: (i) banks’ reported ‘Value at Risk’; (ii) an
‘Alternative Value at Risk’ (‘VaR Alt’) produced by the EBA using the data from the 10 HS banks; and
1 However it was not possible to produce a similar assessment for the other capital metrics included in the report.
Page 7 of 103
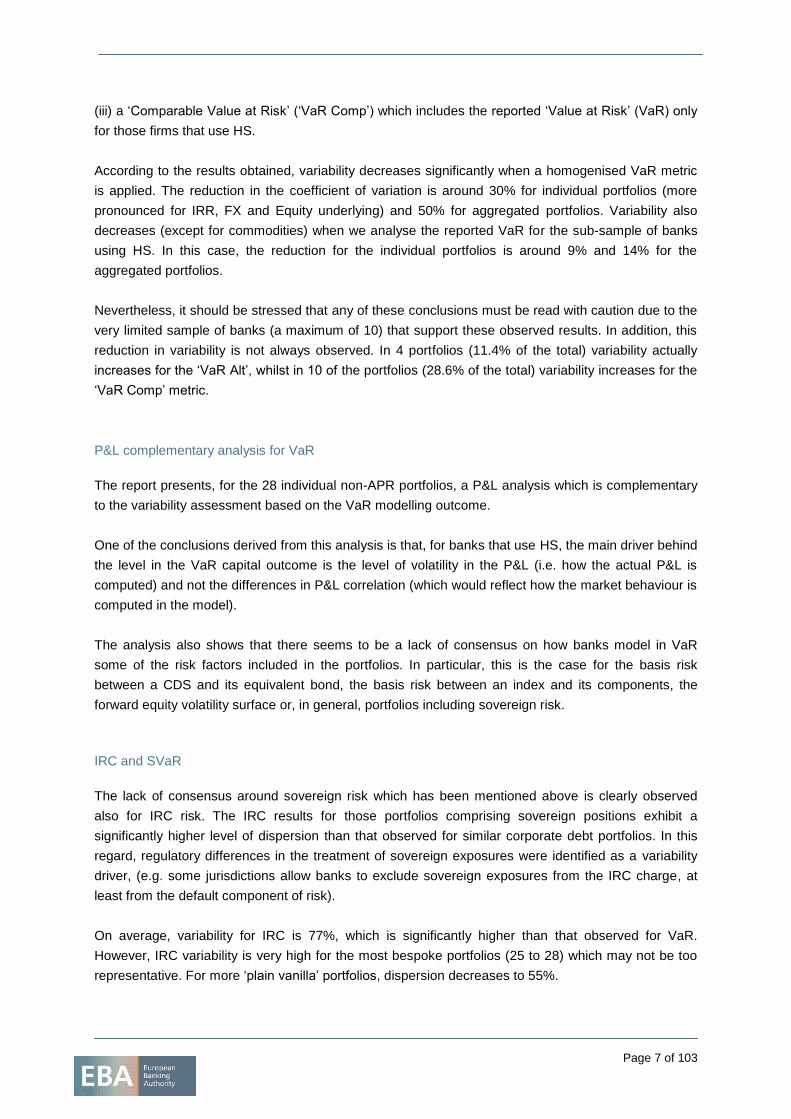
(iii) a ‘Comparable Value at Risk’ (‘VaR Comp’) which includes the reported ‘Value at Risk’ (VaR) only
for those firms that use HS.
According to the results obtained, variability decreases significantly when a homogenised VaR metric
is applied. The reduction in the coefficient of variation is around 30% for individual portfolios (more
pronounced for IRR, FX and Equity underlying) and 50% for aggregated portfolios. Variability also
decreases (except for commodities) when we analyse the reported VaR for the sub-sample of banks
using HS. In this case, the reduction for the individual portfolios is around 9% and 14% for the
aggregated portfolios.
Nevertheless, it should be stressed that any of these conclusions must be read with caution due to the
very limited sample of banks (a maximum of 10) that support these observed results. In addition, this
reduction in variability is not always observed. In 4 portfolios (11.4% of the total) variability actually
increases for the ‘VaR Alt’, whilst in 10 of the portfolios (28.6% of the total) variability increases for the
‘VaR Comp’ metric.
P&L complementary analysis for VaR
The report presents, for the 28 individual non-APR portfolios, a P&L analysis which is complementary
to the variability assessment based on the VaR modelling outcome.
One of the conclusions derived from this analysis is that, for banks that use HS, the main driver behind
the level in the VaR capital outcome is the level of volatility in the P&L (i.e. how the actual P&L is
computed) and not the differences in P&L correlation (which would reflect how the market behaviour is
computed in the model).
The analysis also shows that there seems to be a lack of consensus on how banks model in VaR
some of the risk factors included in the portfolios. In particular, this is the case for the basis risk
between a CDS and its equivalent bond, the basis risk between an index and its components, the
forward equity volatility surface or, in general, portfolios including sovereign risk.
IRC and SVaR
The lack of consensus around sovereign risk which has been mentioned above is clearly observed
also for IRC risk. The IRC results for those portfolios comprising sovereign positions exhibit a
significantly higher level of dispersion than that observed for similar corporate debt portfolios. In this
regard, regulatory differences in the treatment of sovereign exposures were identified as a variability
driver, (e.g. some jurisdictions allow banks to exclude sovereign exposures from the IRC charge, at
least from the default component of risk).
On average, variability for IRC is 77%, which is significantly higher than that observed for VaR.
However, IRC variability is very high for the most bespoke portfolios (25 to 28) which may not be too
representative. For more ‘plain vanilla’ portfolios, dispersion decreases to 55%.
Page 8 of 103
Finally, if we consider only the variability observed in the corporate risk portfolios, it decreases further
to 38%. This level of variability would be quite comparable to the dispersion observed in regulatory
VaR (33% for individual portfolios) and smaller than the average variation for SVaR (44%).
Variability for SVaR is generally higher than that observed for regulatory VaR (on average 44% vs
33%); however this is not consistently observed across all portfolios. In any case, the fact that the
stressed period has not been normalised hinders any meaningful variability analysis for SVaR. It is
clear that any variability observed could be produced either by differences in modelling or in the data
period used for SVaR computation.
Internal model for correlation activities
Average variability for the APR charge (81%) is higher than that observed for IRC and significantly
higher than any of the other metrics considered in this report, with the remarkable exception of the
standardised APR calculation, which shows an average level of dispersion of 133%.2 Most banks are
generally reducing their exposure to the Correlation Trading Portfolio (CTP) so these portfolios
typically are in run-down mode.
Results for aggregated portfolios: Diversification Benefit
The report analyses the Diversification Benefit observed for VaR SVaR and IRC in the 7 aggregated
portfolios (i.e. portfolios 29 to 35). In general, larger aggregated portfolios exhibit greater VaR
Diversification Benefit (DB) than smaller ones. Dispersion observed in the DB for the Alt VaR metric is
generally lower than for the VaR regulatory metric. As regards Stressed VaR, there is generally more
dispersion observed in the DB than for the regulatory VaR.
The SVaR metric for the aggregated portfolios exhibit generally a higher level of variability than for
VaR, though for some of the portfolios is the same or lower. Differences in variability for the SVaR
capital outcome are not large in any case and dispersion is quite comparable to that observed in VaR.
The average SVaR dispersion for the aggregated portfolios is only slightly higher than for VaR (33%
vs 32%).
Regarding IRC, the median level of DB (41-42%) is significantly lower than for VaR / SVaR (where it is
around 70-80% for the ‘all in’ portfolios); however, the level of dispersion in the DB is significantly
higher than for regulatory VaR (30% vs 5% for the ‘all in’ portfolio). The resulting IRC variability
observed for the aggregated portfolios (41%) is much higher than that obtained for VaR and SVaR,
but is clearly less than that observed for correlation trading models
2 This extreme variability is due to the use of internal PDs and LGDs in the Supervisory Formula approach
generally used under the standardised approach for correlation trading activities.
Page 9 of 103
Dispersion in capital outcome:
Variability for the capital outcome for the most ‘inclusive’ portfolios (i.e. 29 and 30) is in the range of
28-26% which is clearly lower than the average dispersion observed for VaR, SVaR and IRC both on
an individual and aggregated basis.
On an aggregated basis variability does not seem to be driven by complexity, since it is lower for
portfolio 30 than for portfolio 29 (which excludes bespoke positions). In fact, the lowest variability is
observed for portfolio 35 which encompass most of the portfolios with higher VaR/SVaR dispersion.
Accordingly, it may be deducted that the idiosyncratic factors which drive variability on an individual
portfolio do not compound when they are aggregated; on the contrary they tend to compensate when
market risk metrics are summed.
Finally, variability was not influenced in this particular exercise by regulatory add-ons. The max-min
range of capital values dispersion for portfolios 29 and 30 remains exactly the same when 3 multipliers
are applied instead of the regulatory ones, but the variation coefficient actually increases due to the
lower average capital obtained.
Page 10 of 103
2. Introduction
The Task Force on Consistency of Outcomes in Risk Weighted Assets (TCOR) mandate is to evaluate
the sources of material differences in RWAs across banks both in the banking and the trading book in
order to separate between intended and unintended variability drivers. TCOR work has focused
initially in the assessment of Banking Book (BB) RWA. In this regard, on 26 February 2013 and 5
August 2013 the EBA already published two interim reports on the review of consistency of RWA in
the BB http://www.eba.europa.eu/risk-analysis-and-data/review-of-consistency-of-risk-weighted-
assets.
As regards Trading Book (TB) the Task Force decided initially to monitor the work on comparability of
market RWA conducted by the Trading Book subgroup of the BCBS’ Standards Implementation Group
(SIG TB). However, during 2013 the EBA conducted a hypothetical portfolio exercise (HPE) for market
risk capital charges, in parallel with a similar exercise conducted by the SIGTB. This report outlines
the conclusions obtained in this exercise.
2.1 TCOR interaction with previous work conducted by the BCBS
As part of its so-called ‘level 3’ assessments, the BCBS conducted a Hypothetical Portfolio Exercise
(HPE) during 2012 to assess variability in Market Risk Weighted Assets. The exercise comprised a set
of 26 test portfolios designed to represent, in simplified form, bank portfolios and to allow a
comparison of RWAs generated by VaR, SVaR and IRC models. The conclusions from the 2012
exercise were published in February 2013 http://www.bis.org/press/p130131.htm.
The EBA participated as an observer in the 2012 exercise and benefited from the experience and
know how acquired in the process. The EBA collected and analysed the data from the 7 (out of 15) EU
banks participating in the Basel exercise. The conclusions from this analysis were reported to the
EBA’s Board of Supervisors in December 2012.
During 2013 the BCBS conducted a second HPE exercise. Compared to the previous one, the 2013
exercise comprises portfolios which are significantly more comprehensive in scope and include more
complex instruments, in particular for correlation trading activities, and a re-run of a number of the
vanilla portfolios included in 2012. The report with the conclusions derived from this exercise has been
published by the BCBS in a coordinated way with the EBA.
The EBA decided to ‘piggyback’ on the work of the SIGTB when outlining how the 2013 HPE exercise
for Marker Risk capital charges would be conducted. In order to minimise the burden, both on banks
and Competent Authorities, and fully benefit from the SIGTB expertise, the EBA decided to apply
exactly the same portfolios, definitions and timeline as that provided by the SIGTB. This has facilitated
the whole process, avoiding any additional burden for SIGTB banks. It has also allowed the EBA to
rely extensively on the Q&A process and data quality checks established for the SIGTB exercise. The
EBA is grateful for the SIGTB collaboration throughout the whole exercise.
Page 11 of 103
3. Main features of the 2013 Hypothetical Portfolio Exercise
As previously mentioned, the main change introduced by the SIGTB in 2013 was the inclusion of
seven correlation trading portfolios (capitalised under the VaR, SVaR and APR models with the
application of a floor based on the standardised specific risk charge). Of course the exercise also
included 35 ‘other’ portfolios (28 individual and 7 aggregated capitalised under the VaR, SVaR and
IRC models) comprising both vanilla and complex products in all major asset classes: Equity; Interest
Rates, Foreign Exchange (FX), Commodities; and Credit.
In addition, banks using an HS approach for VaR have been requested to deliver a one-year P&L
vector for each of the individual and aggregated portfolios modelled. The objective of requesting this
additional P&L information was to use the data to perform alternative calculations for VaR controlling
the different options which banks can apply within regulation.
3.1 Participating banks
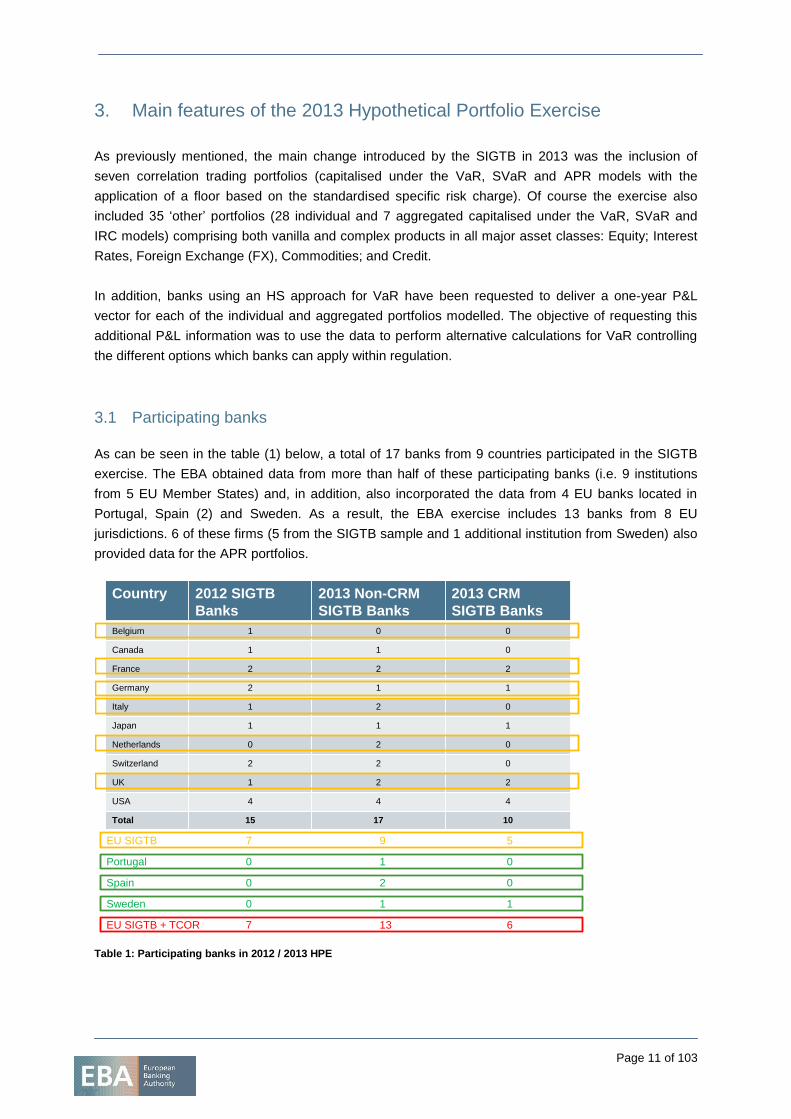
As can be seen in the table (1) below, a total of 17 banks from 9 countries participated in the SIGTB
exercise. The EBA obtained data from more than half of these participating banks (i.e. 9 institutions
from 5 EU Member States) and, in addition, also incorporated the data from 4 EU banks located in
Portugal, Spain (2) and Sweden. As a result, the EBA exercise includes 13 banks from 8 EU
jurisdictions. 6 of these firms (5 from the SIGTB sample and 1 additional institution from Sweden) also
provided data for the APR portfolios.
Table 1: Participating banks in 2012 / 2013 HPE
Country 2012 SIGTB
Banks
2013 Non-CRM
SIGTB Banks
2013 CRM
SIGTB Banks
Belgium 1 0 0
Canada 1 1 0
France 2 2 2
Germany 2 1 1
Italy 1 2 0
Japan 1 1 1
Netherlands 0 2 0
Switzerland 2 2 0
UK 1 2 2
USA 4 4 4
Total 15 17 10
EU SIGTB 7 9 5
Portugal 0 1 0
Spain 0 2 0
Sweden 0 1 1
EU SIGTB + TCOR 7 13 6
Page 12 of 103
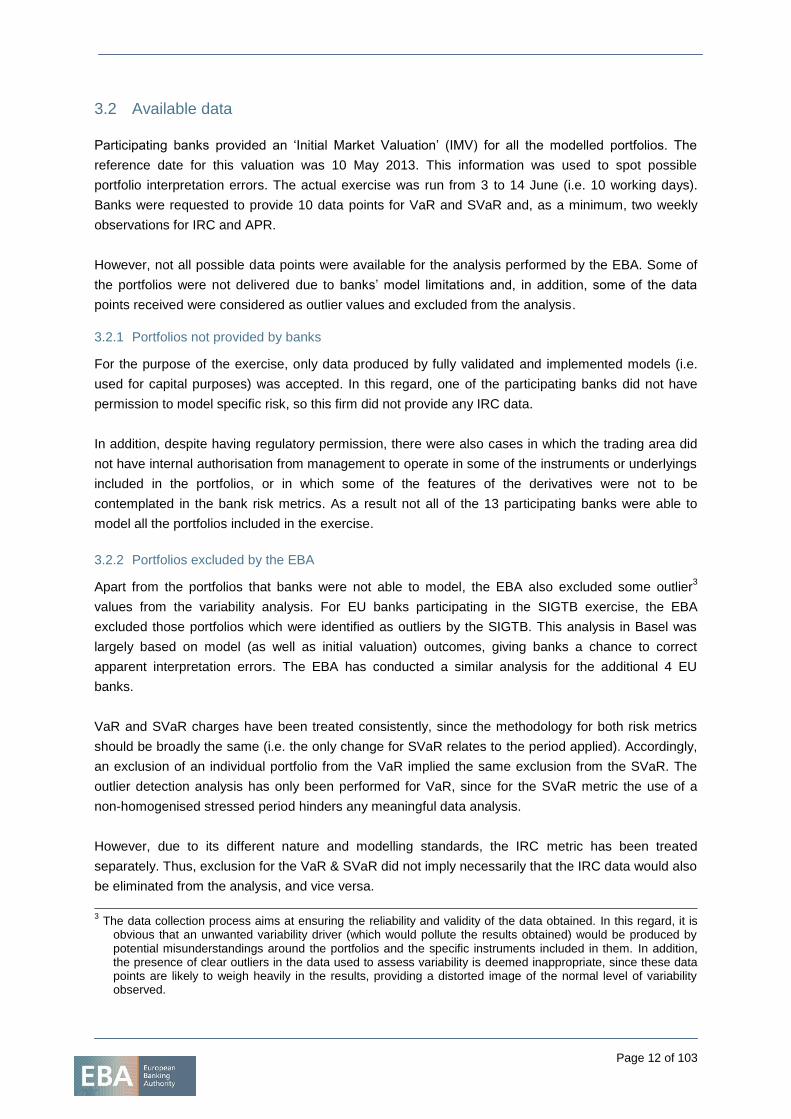
3.2 Available data
Participating banks provided an ‘Initial Market Valuation’ (IMV) for all the modelled portfolios. The
reference date for this valuation was 10 May 2013. This information was used to spot possible
portfolio interpretation errors. The actual exercise was run from 3 to 14 June (i.e. 10 working days).
Banks were requested to provide 10 data points for VaR and SVaR and, as a minimum, two weekly
observations for IRC and APR.
However, not all possible data points were available for the analysis performed by the EBA. Some of
the portfolios were not delivered due to banks’ model limitations and, in addition, some of the data
points received were considered as outlier values and excluded from the analysis.
3.2.1 Portfolios not provided by banks
For the purpose of the exercise, only data produced by fully validated and implemented models (i.e.
used for capital purposes) was accepted. In this regard, one of the participating banks did not have
permission to model specific risk, so this firm did not provide any IRC data.
In addition, despite having regulatory permission, there were also cases in which the trading area did
not have internal authorisation from management to operate in some of the instruments or underlyings
included in the portfolios, or in which some of the features of the derivatives were not to be
contemplated in the bank risk metrics. As a result not all of the 13 participating banks were able to
model all the portfolios included in the exercise.
3.2.2 Portfolios excluded by the EBA
Apart from the portfolios that banks were not able to model, the EBA also excluded some outlier3
values from the variability analysis. For EU banks participating in the SIGTB exercise, the EBA
excluded those portfolios which were identified as outliers by the SIGTB. This analysis in Basel was
largely based on model (as well as initial valuation) outcomes, giving banks a chance to correct
apparent interpretation errors. The EBA has conducted a similar analysis for the additional 4 EU
banks.
VaR and SVaR charges have been treated consistently, since the methodology for both risk metrics
should be broadly the same (i.e. the only change for SVaR relates to the period applied). Accordingly,
an exclusion of an individual portfolio from the VaR implied the same exclusion from the SVaR. The
outlier detection analysis has only been performed for VaR, since for the SVaR metric the use of a
non-homogenised stressed period hinders any meaningful data analysis.
However, due to its different nature and modelling standards, the IRC metric has been treated
separately. Thus, exclusion for the VaR & SVaR did not imply necessarily that the IRC data would also
be eliminated from the analysis, and vice versa.
3 The data collection process aims at ensuring the reliability and validity of the data obtained. In this regard, it is
obvious that an unwanted variability driver (which would pollute the results obtained) would be produced by potential misunderstandings around the portfolios and the specific instruments included in them. In addition, the presence of clear outliers in the data used to assess variability is deemed inappropriate, since these data points are likely to weigh heavily in the results, providing a distorted image of the normal level of variability observed.
Page 13 of 103
In all cases, suspected errors were followed up with the banks through written procedure or, for those
banks included in the SIGTB sample, on-site visits, and banks were offered the opportunity to
resubmit the results. Where banks provided valid explanations for outlier results, the original data was
also retained in the analysis.
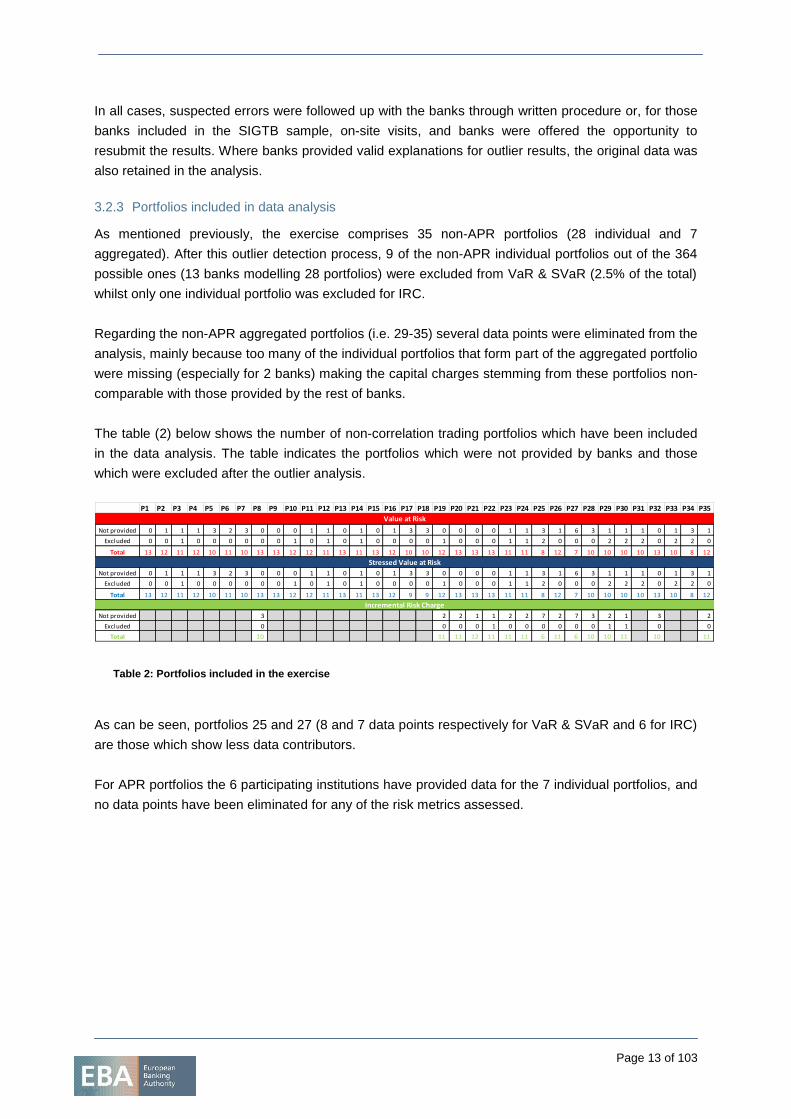
3.2.3 Portfolios included in data analysis
As mentioned previously, the exercise comprises 35 non-APR portfolios (28 individual and 7
aggregated). After this outlier detection process, 9 of the non-APR individual portfolios out of the 364
possible ones (13 banks modelling 28 portfolios) were excluded from VaR & SVaR (2.5% of the total)
whilst only one individual portfolio was excluded for IRC.
Regarding the non-APR aggregated portfolios (i.e. 29-35) several data points were eliminated from the
analysis, mainly because too many of the individual portfolios that form part of the aggregated portfolio
were missing (especially for 2 banks) making the capital charges stemming from these portfolios non-
comparable with those provided by the rest of banks.
The table (2) below shows the number of non-correlation trading portfolios which have been included
in the data analysis. The table indicates the portfolios which were not provided by banks and those
which were excluded after the outlier analysis.
Table 2: Portfolios included in the exercise
As can be seen, portfolios 25 and 27 (8 and 7 data points respectively for VaR & SVaR and 6 for IRC)
are those which show less data contributors.
For APR portfolios the 6 participating institutions have provided data for the 7 individual portfolios, and
no data points have been eliminated for any of the risk metrics assessed.
P1 P2 P3 P4 P5 P6 P7 P8 P9 P10 P11 P12 P13 P14 P15 P16 P17 P18 P19 P20 P21 P22 P23 P24 P25 P26 P27 P28 P29 P30 P31 P32 P33 P34 P35
Not provided 0 1 1 1 3 2 3 0 0 0 1 1 0 1 0 1 3 3 0 0 0 0 1 1 3 1 6 3 1 1 1 0 1 3 1
Excluded 0 0 1 0 0 0 0 0 0 1 0 1 0 1 0 0 0 0 1 0 0 0 1 1 2 0 0 0 2 2 2 0 2 2 0
Total 13 12 11 12 10 11 10 13 13 12 12 11 13 11 13 12 10 10 12 13 13 13 11 11 8 12 7 10 10 10 10 13 10 8 12
Not provided 0 1 1 1 3 2 3 0 0 0 1 1 0 1 0 1 3 3 0 0 0 0 1 1 3 1 6 3 1 1 1 0 1 3 1
Excluded 0 0 1 0 0 0 0 0 0 1 0 1 0 1 0 0 0 0 1 0 0 0 1 1 2 0 0 0 2 2 2 0 2 2 0
Total 13 12 11 12 10 11 10 13 13 12 12 11 13 11 13 12 9 9 12 13 13 13 11 11 8 12 7 10 10 10 10 13 10 8 12
Not provided 3 2 2 1 1 2 2 7 2 7 3 2 1 3 2
Excluded 0 0 0 0 1 0 0 0 0 0 0 1 1 0 0
Total 10 11 11 12 11 11 11 6 11 6 10 10 11 10 11
Value at Risk
Stressed Value at Risk
Incremental Risk Charge
Page 14 of 103
3.3 Potential sources of variability in market capital charges
The main objective of the exercise is to assess the level of variability in market risk RWA produced by
banks’ internal models. Of course, RWA is a regulatory concept that is obtained as a combination of
banks’ modelling choices (some of which are explicitly contemplated in regulation) and ‘supervisory
actions’.
3.3.1 Variability stemming from banks’ modelling choices.
The Market Risk Internal Model Framework allows firms a relevant degree of freedom on many of the
methodological elements incorporated in the Internal Models. For example, when modelling VaR,
institutions can choose to use a look-back period longer than the minimum (i.e. the immediate
previous year), use a weighting scheme for the data series, calculate the 10 day VaR directly or,
alternatively, obtain a 1 day VaR and re-scale it using the square root of 10, etc.
Likewise, when modelling IRC firms can decide between several sources of PDs and LGDs, resort to
different approaches to model the co-movement among obligors in their portfolios, and have many
degrees of freedom when choosing the transition matrices applied or when deciding on the liquidity
horizons assigned to a particular instrument.
It should be highlighted that all these possibilities are, in principle, acceptable under the current
regulatory framework and it is up to banks and competent authorities to agree during the validation
process on the most appropriate ones to be applied by each bank. Thus, given the wide range of
approaches which institutions using an internal model can choose to implement, some degree of
variability among the resulting capital requirements is granted.
At the same time, these differences in implementation are clearly not the only factors behind
variability. There are other modelling choices which are not explicitly contemplated in regulation, such
as differences in simulation engines and data sources, differences in the methods used to compute
risk factors when data is not directly observable (such as with volatilities and/or correlations), the
absence of some of the risk factors considered, differences in approximations when re-pricing
positions etc.
In this regard, the report tries to distinguish between those variability drivers caused by approaches
explicitly contemplated in regulation and those related to other causes. This distinction between both
types of drivers is relevant not only for analysis purposes, but also to inform any policy
recommendations or guidance that the EBA might decide to issue going forward.
As explained in section 3.6 of this report, the data contained in the P&L vector submitted by banks
using HS has been used to assess the relative importance of both types of variability drivers. Of
course, as stated in section 3.4, any tentative conclusions should be read with great caution due to the
very limited set of banks participating in this exercise.
Page 15 of 103
3.3.2 Variability stemming from supervisory actions.
Another source of potential variability is originated by supervisory actions taken by competent
authorities. In particular, the use of regulatory add-ons, both on VaR/SVaR multipliers as well as in the
form of additional capital charges, and the application of limits to the diversification benefits applied by
banks are likely to increase the observed variability in capital.
In most cases, these supervisory actions have been established to address known flaws, model
limitations, or to add an additional layer of prudence; thus, they typically result in higher capital
requirements than would otherwise be the case, but, in addition, they can also increase the variation in
market RWAs between banks, particularly across jurisdictions. The application of regulatory add-ons
on the multipliers applied in VaR and SVaR has been included as part of the analysis, but none of the
other supervisory actions was contemplated in this report.
It is worth noting that, though the effect in capital levels of these supervisory actions can be
substantial, a portfolio exercise is not suited to reflect such differences, in particular for diversification
benefits and direct capital add-ons, since these effects are entirely-portfolio dependant. To assess
such an effect it would be necessary to have a much more realistic portfolio, comprising thousands of
instruments and including partial-model approval. Accordingly, these regulatory drivers cannot be
properly assessed through a limited portfolio exercise.
Page 16 of 103
3.4 Limitations of the exercise
Apart from the impossibility of assessing the effect of most supervisory actions in a meaningful way,
there are data limitations that should be carefully considered as caveats when reading any of the
preliminary conclusions presented in this report.
Given the limited number of banks included in the exercise, it is not possible to robustly (from a
statistical perspective) infer the relative importance of drivers of variability, and these will in any case
vary across asset classes. As acknowledged in the BCBS report, lack of data is an issue for the
SIGTB exercise, however it is even more significant in the case of the EBA, since the data sample
available contains just 13 banks (against 18 in Basel). Of course, data issues are especially significant
for correlation trading portfolios, where only 6 banks have provided information.
Regarding the alternative VaR calculations produced with the P&L vectors, this type of analysis is only
possible for institutions applying HS. Accordingly, firms using Montecarlo or Parametric VaR are not
subject to the same level of assessment. This also raises data availability issues, in particular for this
exercise only 9 banks have provided 1-day P&L vectors. An additional firm provided 10-day P&L
which was used to calculate alternative VaR metric, but could not be used to assess P&L correlation
and volatility.
The SVaR metric could not be assessed since the P&L vector was not requested. In any case banks
calculated their SVaR using the Stressed period they were currently using for capital purposes, which
reflects the specificity of their actual trading portfolio. Accordingly the P&L would have been useless
for data analysis purposes. Of course, the fact that the stressed period has not been normalised also
hinders any meaningful variability analysis. It is clear that any variability observed could be produced
either by differences in modelling or in the different data periods used for SVaR computation.
It is possible to perform this kind of analysis for SVaR in any future exercise, but of course it is
necessary to request that banks perform their calculations using a common one-year stressed period
(such as 2008). This might involve some additional burden; however, unless a common stressed
period is established, it is not possible to assess modelling performance for SVaR across institutions
in a meaningful way.
Nevertheless, this type of P&L analysis is not possible for IRC and internal models used for correlation
trading activities; this is due to the higher level of confidence (99,9% vs 99%) and longer capital
horizon (1 year vs 10-days) applied in these metrics.
Page 17 of 103
3.5 P& L data cleaning
Apart from the outlier detection process for the risk metrics, described in section 3.2.2 of this report,
the EBA has also introduced minor changes in some of the P&L vectors provided by banks applying
HS.
This ‘data cleaning’ was produced as a result of the joint analysis of all the available P&L vectors. In
particular, this analysis showed that certain banks were reporting gains as losses or vice versa (i.e.
movements in their P&L daily values showed a nearly perfect negative correlation with the other
banks) or had filled the template without leaving empty cells for local bank holidays (i.e. their P&L
graphical representations would show a similar pattern to the others but would consistently begin to
lag one or two days behind the rest consistently at the same point in time).
In particular, the following changes were introduced:
Bank 2 provided for all portfolios the 1 day P&L data scaled-up using the square root of 10
and then divided by a thousand, accordingly the vector was divided by the square root of 10
and multiplied by a thousand before factoring the data in the analysis.
Bank 4: at the same point in time their P&L vector began to lag behind other bank’s vectors;
accordingly, the P&L series has been consistently shifted 2 days around data point 117 for all
portfolios.
Portfolio 9: bank 6 – the reported losses are gains and vice versa (they have been swapped
accordingly).
Portfolio 10: 4 out of 9 banks (2, 4, 5 & 7) reported losses as gains and vice versa (they have
been swapped accordingly).
Portfolio 18: bank 1 – the reported losses are gains and vice versa (they have been swapped
accordingly). Around data point 129 the P&L vector for bank 5 began to lag behind other
bank’s vectors, it has been shifted 1 day.
Regarding the aggregated portfolios, instead of using directly the P&L provided by banks, the P&L
vector has been recalculated, summing the corresponding P&L vectors from their constituent
individual portfolios after conducting the described data cleaning.
In addition, portfolio 14 (which seems to have been interpreted in two different ways, producing large
variability not related to differences in modelling) has not been aggregated to portfolios 29 (non-
exotic), 30 (all-in) and 33 (FX).
Finally, instead of 1-day P&L data, bank 10 reported a 10-day overlapped P&L vector. This data was
used to calculate the ‘alternative VaR’; however this data could not be used to assess correlation and
variability in the 1 day P&L vector.
Page 18 of 103
3.6 Use of the P&L data to assess variability drivers.
As mentioned previously, banks using an HS approach for VaR computation were requested to deliver
a one-year P&L vector for each one of the individual portfolios modelled. Out of the 13 participating
banks 10 use HS, whilst 2 apply Montecarlo and 1 calculates VaR using a parametric approach.
Accordingly, the EBA has used this data from the 10 banks using HS to calculate a 1-day VaR, re-
scaled to 10 days applying the square root of time, using the same one-year period and without
applying any data weighing scheme.
It is important to highlight that this homogeneous VaR has only been calculated in order to eliminate
some of the potential drivers of variability4, but this alternative calculation produced by the EBA should
not be seen in any way as showing any preference for these particular modelling choices.
In addition, the P&L vector has also been used to assess the degree of P&L correlation across banks,
as well as the level of volatility shown in each bank’s vector. However 1 of the 10 banks using HS
provided 10-day P&L data, instead of 1-day, so this data could not be incorporated into the analysis.
This detailed information for each of the 28 non-correlation trading individual portfolios is presented in
the report. Since each individual portfolio is modelling a particular set of risk factors the analysis
provides useful insight about the degree of market consensus around those specific risk factors, in
terms of market dynamics (i.e. graphical representation of P&L vectors and correlation across
institutions) and, also importantly, volatility levels.
This analysis was not produced for the 7 aggregated portfolios. In this regard it should be noted that in
many cases the aggregated P&L includes only part of the portfolios modelled (i.e. since banks were
not able to model all the individual portfolios) so, considering the relatively low number of portfolios
considered, differences in P&L vectors may be biased by the absence of some of these individual
portfolios. Additionally, since the P&L incorporates all the different risk factors included in the
individual portfolios, the analysis would not be that relevant.
Finally, the analysis was not performed for the 7 correlation trading portfolios due to the lack of
participating institutions (6 in total, out of which only 4 apply HS) and the low relevance of the VaR
metric for this kind of activity.
4 One of the clear limitations of this approach is that it is only suitable for banks using Historical Simulation. 10 out
of the 13 banks included in the EBA sample applied this methodology.
Page 19 of 103
3.7 Overview of the results obtained.
3.7.1 VaR
Analyses conducted by the EBA for VaR
With the information available, the EBA has performed two types of analyses:
1. An assessment of the variability in the risk metrics outcomes provided by banks (VaR, SVaR,
IRC and APR) as well as two additional VaR metrics produced by the EBA:
i. An ‘Alternative Value at Risk’ (VaR Alt) produced by the EBA using the data from the
10 HS banks to calculate a homogeneous 1-day VaR, re-scaled to 10 days applying
the square root of time, using the same one-year period and without applying any data
weighing scheme; and
ii. A ‘Comparable Value at Risk’ (VaR Comp) which includes banks’ reported ‘Value at
Risk’ (VaR), but only for the set of portfolios provided by banks applying HS.
2. An analysis of correlation and dispersion in the P&L vectors provided by banks applying HS to
calculate VaR.
Analysis of variability for VaR
As has been mentioned the report presents the observed variability for banks’ reported ‘Value at Risk’
(VaR), the ‘Alternative Value at Risk’ (VaR Alt) produced by the EBA using the data from the 10 HS
banks and the ‘Comparable Value at Risk’ (VaR Comp) which includes HS banks’ reported ‘Value at
Risk’ (VaR).
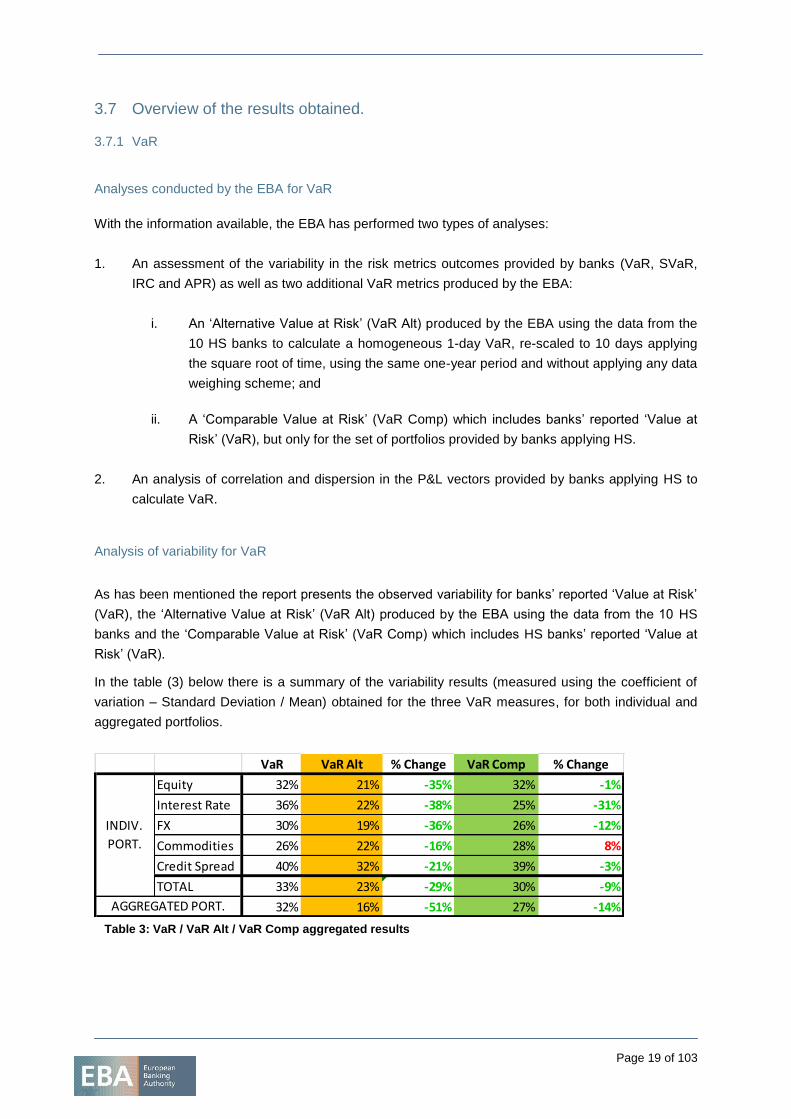
In the table (3) below there is a summary of the variability results (measured using the coefficient of
variation – Standard Deviation / Mean) obtained for the three VaR measures, for both individual and
aggregated portfolios.
Table 3: VaR / VaR Alt / VaR Comp aggregated results
VaR VaR Alt % Change VaR Comp % Change
Equity 32% 21% -35% 32% -1%
Interest Rate 36% 22% -38% 25% -31%
FX 30% 19% -36% 26% -12%
Commodities 26% 22% -16% 28% 8%
Credit Spread 40% 32% -21% 39% -3%
TOTAL 33% 23% -29% 30% -9%
32% 16% -51% 27% -14%
INDIV.
PORT.
AGGREGATED PORT.
Page 20 of 103
As can be seen, variability decreases significantly when a homogenised VaR metric (VaR Alt) is
applied. The reduction in the coefficient of variation is around 30% for individual portfolios (more
pronounced for IRR, FX and Equity underlying) and 50% for the aggregated portfolios5.
It is worth noting that variability also decreases (except for commodities) when we analyse the
reported VaR for the sub-sample of banks using HS (i.e. VaR Comp); in this case, the reduction for
the individual portfolios is around 9% and 14% for the aggregated portfolios. Of course, the choice
between applying Montecarlo, Parametric or HS is one of the possibilities which are contemplated in
regulation.
In any case, the results obtained support the conclusion that variability (i) decreases when a common
calculation methodology is applied (i.e. HS in this case) and (ii) decreases significantly more when the
rest of variables contemplated in regulation are controlled.
Of course it is worth highlighting the limited sample of banks (a maximum of 10) that support these
observed results. In addition, this reduction in variability is not always observed. In 4 portfolios (4, 25,
27 & 28 – 11.4% of the total) variability actually increases for the ‘VaR Alt’, whilst in 10 of the portfolios
(number 4, 10, 11, 16, 17, 18, 25, 27, 30 & 35 – 28.6% of the total) variability increases for the ‘VaR
Comp’ metric.
P&L complementary analysis
The P&L analysis is complementary to that produced to assess variability based on the VaR modelling
outcome. Results based solely on the regulatory VaR metric might overestimate (or underestimate)
the degree of consensus amongst banks for some of the portfolios and risk factors modelled.
For each individual portfolio, the P&L vectors provided by banks using HS are compared. The report
provides a graphical representation of the vector as well as a measure of the correlation coefficient
across all banks. Finally, a measure of the level of volatility observed in the P&L is also provided.
The P&L analysis provides more in depth information for assessing how banks are really modelling
each one of the portfolios, and also helps to spot outlier institutions and show that, on occasions,
banks may be modelling a particular portfolio in two different ways. For example, in portfolios 13 and
15 all firms but two are highly correlated in their P&L vectors, however these two firms are highly
correlated between themselves6.
One of the conclusions derived from this analysis is that, for banks that use HS, the main driver behind
the level of the VaR capital outcome is the level of volatility in the P&L (i.e. how the actual P&L is
5 The results observed for ‘VaR Alt’ in the aggregated portfolios may be biased by the exclusion of portfolio 14
from the aggregated P&L analysis. 6 Of course, in order to derive any additional conclusions it is necessary to follow up these developments with the
individual banks.
Page 21 of 103
computed) and not the differences in P&L correlation7 (which would reflect how the market behaviour
is computed in the model).
This produces some non-intuitive results; for example portfolio 3, whose main underlying risk factor is
the S&P volatility surface which is not directly observable (i.e. so called ‘level 3’) in the market, shows
(as it would be expected for a non-observable risk factor) a very low level of correlation in their P&L,
but also a relatively common level of volatility. As a consequence, this portfolio shows less dispersion
in ‘Alt VaR’ than portfolio 4, which is characterised by a very high level of correlation together with
rather dispersed volatilities.
The analysis also shows that there seems to be a lack of consensus on how banks model in VaR
some of the risk factors included in the portfolios, in particular:
- Basis risk between a CDS and its equivalent Bond (portfolio 26)
- Basis between an Index and its components (portfolio 25)
- Forward volatility surface (portfolio 4)
- Sovereign risk portfolios (portfolios 8, 19 & 20).
There seems to be greater market consensus around the behaviour of corporate risk than for
sovereign risk (portfolios 8, 19 & 20 vs 21, 22, 23 & 24). This is rather surprising considering that the
level of liquidity is generally much greater for sovereign than for sorporate positions.
Finally, it has also been observed that dispersion for certain OTC portfolios (not necessarily ‘plain
vanilla’) is quite low compared with others based on ‘level 1’ liquid assets (again, such as sovereign
bonds).
3.7.2 IRC
The lack of consensus around sovereign risk is also verified for IRC risk, which shows a significantly
higher level of dispersion when we compare the level of variability observed in similar portfolios that
differ in the type of underlying credit risk (i.e. sovereign vs corporate). In this regard, regulatory
differences in the treatment of sovereign exposures were also identified as a driver, e.g. some
jurisdictions allow banks to exclude sovereign exposures from the IRC charge (at least from the
default component of risk).
The IRC average variability is 77%, which is significantly higher than that observed for VaR. However,
for more ‘plain vanilla’ portfolios (19-24) it decreases to 55%, and if we take only the corporate risk
portfolios (21-24) it decreases further to 38%, which would be quite comparable to the dispersion
observed in regulatory VaR (33% for individual portfolios) and smaller than the average variation for
SVaR (44%).
7 For a VaR metric calculated using a 1-day P&L over a one-year look-back period, what determines the capital
figure is the size of the second and third largest losses in the P&L vector, regardless of the exact dates in which those losses actually occurred.
Page 22 of 103
3.7.3 SVaR
Variability for SVaR is generally higher than that observed for regulatory VaR (on average 44% vs
33%), however this is not consistently observed across all portfolios. In any case, the fact that the
stressed period has not been normalised hinders any meaningful variability analysis for the SVaR
metric.
In this regard, it is clear that any variability observed could be produced either by differences in
modelling or in the data period used for SVaR computation.
3.7.4 Internal model for correlation activities
Average variability for the APR charge (81%) is higher than for IRC, and significantly higher than any
of the other metrics considered in this report, with the remarkable exception of the standardised APR
calculation, which shows an average level of dispersion of 133%. This extreme variability is due to the
use of internal PDs and LGDs in the Supervisory Formula Approach (SFA) generally used under the
standardised approach for correlation trading activities.
These results should be read in the context where most banks are generally reducing their exposure
to the CTP, as these portfolios typically are in run-down mode.
3.7.5 Results for aggregated portfolios: Diversification Benefit
The report analyses the Diversification Benefit observed for VaR SVaR and IRC in the 7 aggregated
portfolios (i.e. portfolios 29 to 35). In general, larger aggregated portfolios exhibit greater VaR
Diversification Benefit (DB) than smaller ones. Dispersion observed in the DB for the Alt VaR metric is
generally lower than for the VaR regulatory metric.
As regards Stressed VaR, the level of dispersion is generally higher than for VaR, though for some of
the portfolios is the same or lower. There is also generally more dispersion in the DB observed.
Differences in variability for the SVaR capital are not large in any case and dispersion is quite
comparable to that observed in VaR, the average SVaR dispersion for the aggregated portfolios being
only slightly higher than for VaR (33% vs 32%).
Regarding IRC, the median level of DB (41-42%) is significantly lower than for VaR / SVaR (where it is
around 70-80% for the ‘all in’ portfolios) however the level of dispersion in the DB is significantly higher
than for regulatory VaR (30% vs 5% for the ‘all in’ portfolio). The resulting variability observed in the
aggregated portfolios (41%) is much higher than that obtained for VaR and SVaR, but is clearly less
than that observed for correlation trading models
Page 23 of 103
3.7.6 Dispersion in capital outcome:
Variability for the capital outcome for the most ‘inclusive’ portfolios (i.e. 29 and 30) is in the range of
28-26%, which is clearly lower than the average dispersion observed for VaR, SVaR and IRC both on
an individual and aggregated basis.
On an aggregated basis variability does not seem to be driven by complexity, since it is lower for
portfolio 30 than for portfolio 29 (which excludes bespoke positions). In fact, the lowest variability is
observed for portfolio 35 which encompass most of the portfolios with higher VaR/SVaR dispersion.
Accordingly, it may be deducted that the idiosyncratic factors which drive variability on an individual
portfolio do not compound when they are aggregated; on the contrary, they tend to compensate when
market risk metrics are summed.
Finally, variability was not influenced in this particular exercise by regulatory add-ons. The max-min
range of capital values dispersion for portfolios 29 and 30 remains exactly the same when 3 multipliers
are applied instead of the regulatory ones, but the variation coefficient actually increases due to the
lower capital average obtained.
A detailed breakdown of the results is provided in the following sections. Portfolios have been grouped
by type of underlying: 3.8 Equity, 3.9 Interest Rate, 3.10 FX, 3.11 Commodity, 3.12 Credit, 3.13
Aggregated, 3.14 Correlation Trading.
Page 24 of 103
Dispersion
P1 P2 P3 P4 P5 P6 P7 2013
Min 76.62 61.85 68.99 94.30 95.12 123.50 171.10
Max 228.81 187.81 230.03 201.34 326.39 309.94 346.81
Median 141.61 106.30 130.71 143.02 173.60 187.09 316.97
Mean 158.58 119.85 133.26 140.02 195.45 203.99 287.25
Stdev 48.92 43.65 47.75 35.94 80.23 67.52 62.29
Stdev/Mean 31% 36% 36% 26% 41% 33% 22%
Min 107.00 67.26 59.41 78.42 107.08 123.98 169.42
Max 147.86 129.59 99.64 191.25 227.71 261.76 265.56
Median 121.67 79.78 76.90 95.87 158.93 178.72 229.15
Mean 122.18 86.38 76.76 108.81 156.43 181.73 223.75
Stdev 10.89 18.27 12.92 34.45 41.97 48.41 30.61
Stdev/Mean 9% 21% 17% 32% 27% 27% 14%
Min 76.62 76.37 82.62 94.30 106.09 123.50 258.91
Max 228.81 187.81 230.03 365.73 326.39 309.94 346.81
Median 190.73 113.58 151.39 164.83 224.75 223.94 321.03
Mean 168.41 130.25 144.56 170.67 212.99 221.30 313.79
Stdev 51.50 44.68 44.89 81.87 79.11 70.71 30.61
Stdev/Mean 31% 34% 31% 48% 37% 32% 10%
Min 216.02 111.37 132.29 145.42 141.60 142.67 249.94
Max 625.92 399.19 833.56 600.63 1,165.33 1,269.14 662.17
Median 416.12 170.91 535.00 284.92 214.26 262.64 508.81
Mean 395.40 199.03 496.12 292.69 307.53 374.51 489.90
Stdev 110.57 99.23 207.45 118.24 304.99 335.83 156.59
Stdev/Mean 28% 50% 42% 40% 99% 90% 32%
VaR Comp 32%
SVaR 54%
Equity Portfolios
VaR Alt 21%
VaR 32%
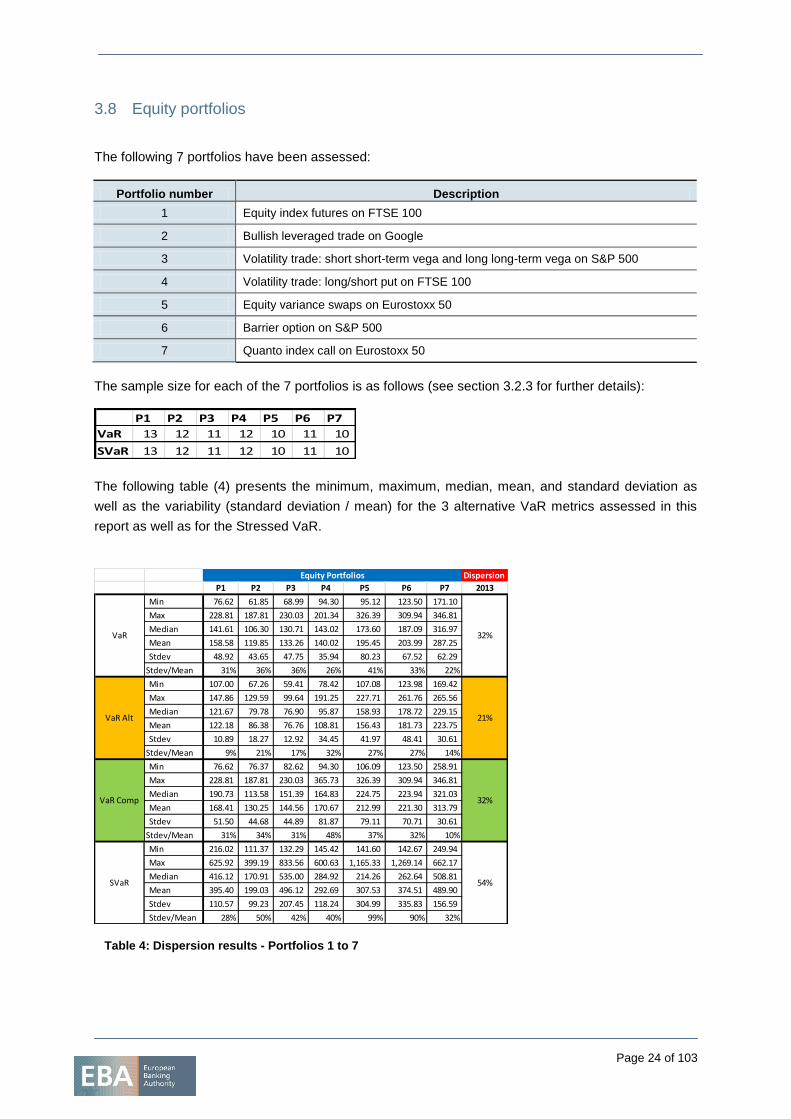
3.8 Equity portfolios
The following 7 portfolios have been assessed:
Portfolio number Description
1 Equity index futures on FTSE 100
2 Bullish leveraged trade on Google
3 Volatility trade: short short-term vega and long long-term vega on S&P 500
4 Volatility trade: long/short put on FTSE 100
5 Equity variance swaps on Eurostoxx 50
6 Barrier option on S&P 500
7 Quanto index call on Eurostoxx 50
The sample size for each of the 7 portfolios is as follows (see section 3.2.3 for further details):
The following table (4) presents the minimum, maximum, median, mean, and standard deviation as
well as the variability (standard deviation / mean) for the 3 alternative VaR metrics assessed in this
report as well as for the Stressed VaR.
Table 4: Dispersion results - Portfolios 1 to 7
P1 P2 P3 P4 P5 P6 P7
VaR 13 12 11 12 10 11 10
SVaR 13 12 11 12 10 11 10
Page 25 of 103
With the sole exception of Portfolio 4, variability for the homogenised VaR (i.e. VaR Alt) is significantly
less than that observed for the regulatory VaR metric, and overall variability decreases by one third
(i.e. from 32% to 21%) for the VaR Alt. In general, variability also decreases for banks using HS, again
with the sole exception of Portfolio 4. A more detailed analysis of the differences observed in these
three risk metrics by individual portfolio is provided in section 3.1.1.
There is evidence that more bespoke portfolios (such as 5 and 6) have greater variability in the three
VaR metrics considered than plain vanilla ones. This is not the case for portfolio 7; however the fact
that an option is ‘quanto’ (i.e. payment is done in a different currency than the underlying) does not
add much complexity to the instrument.
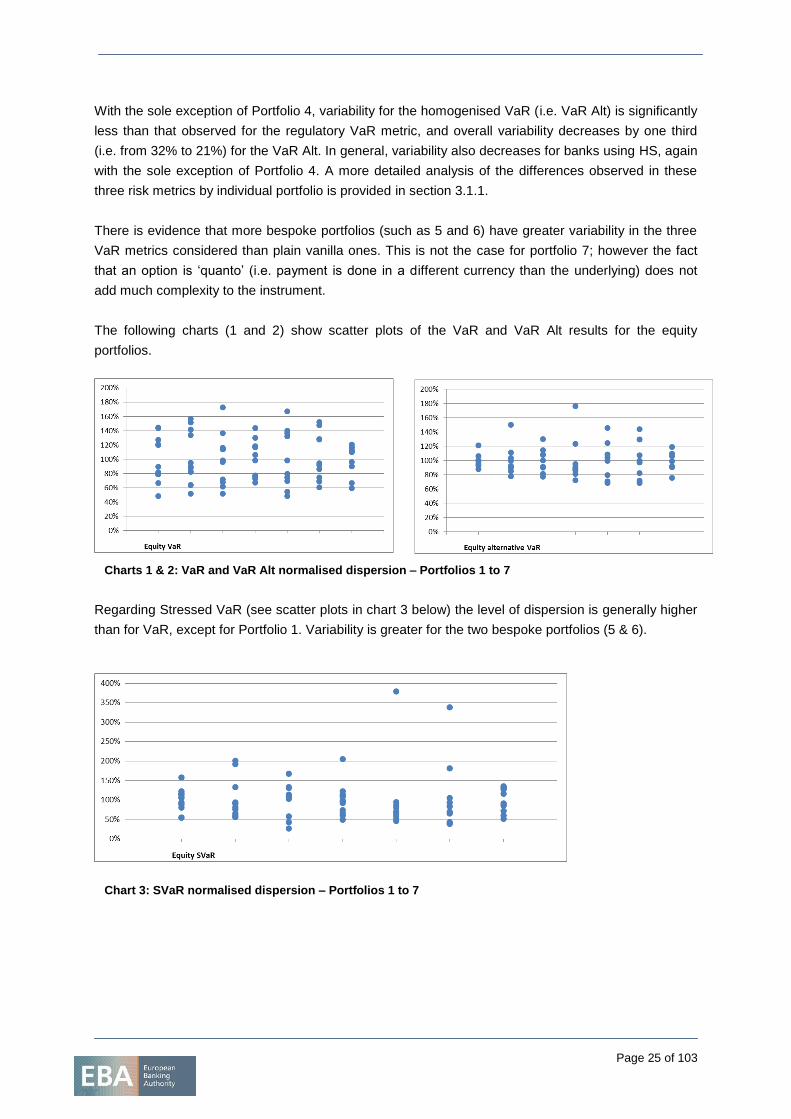
The following charts (1 and 2) show scatter plots of the VaR and VaR Alt results for the equity
portfolios.
Charts 1 & 2: VaR and VaR Alt normalised dispersion – Portfolios 1 to 7
Regarding Stressed VaR (see scatter plots in chart 3 below) the level of dispersion is generally higher
than for VaR, except for Portfolio 1. Variability is greater for the two bespoke portfolios (5 & 6).
Chart 3: SVaR normalised dispersion – Portfolios 1 to 7
Page 26 of 103
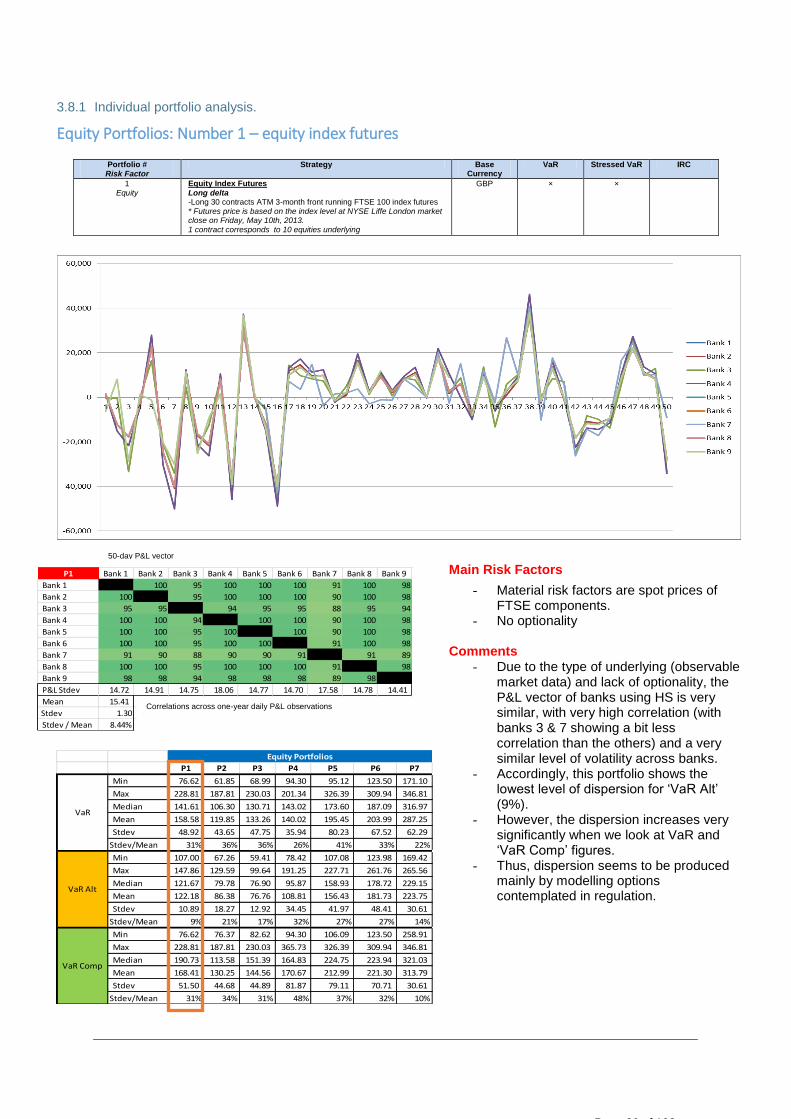
3.8.1 Individual portfolio analysis.
Equity Portfolios: Number 1 – equity index futures
Portfolio # Risk Factor
Strategy Base Currency
VaR Stressed VaR IRC
1 Equity
Equity Index Futures
Long delta -Long 30 contracts ATM 3-month front running FTSE 100 index futures * Futures price is based on the index level at NYSE Liffe London market close on Friday, May 10th, 2013. 1 contract corresponds to 10 equities underlying
GBP × ×
P1 P2 P3 P4 P5 P6 P7
Min 76.62 61.85 68.99 94.30 95.12 123.50 171.10
Max 228.81 187.81 230.03 201.34 326.39 309.94 346.81
Median 141.61 106.30 130.71 143.02 173.60 187.09 316.97
Mean 158.58 119.85 133.26 140.02 195.45 203.99 287.25
Stdev 48.92 43.65 47.75 35.94 80.23 67.52 62.29
Stdev/Mean 31% 36% 36% 26% 41% 33% 22%
Min 107.00 67.26 59.41 78.42 107.08 123.98 169.42
Max 147.86 129.59 99.64 191.25 227.71 261.76 265.56
Median 121.67 79.78 76.90 95.87 158.93 178.72 229.15
Mean 122.18 86.38 76.76 108.81 156.43 181.73 223.75
Stdev 10.89 18.27 12.92 34.45 41.97 48.41 30.61
Stdev/Mean 9% 21% 17% 32% 27% 27% 14%
Min 76.62 76.37 82.62 94.30 106.09 123.50 258.91
Max 228.81 187.81 230.03 365.73 326.39 309.94 346.81
Median 190.73 113.58 151.39 164.83 224.75 223.94 321.03
Mean 168.41 130.25 144.56 170.67 212.99 221.30 313.79
Stdev 51.50 44.68 44.89 81.87 79.11 70.71 30.61
Stdev/Mean 31% 34% 31% 48% 37% 32% 10%
Equity Portfolios
VaR Alt
VaR
VaR Comp
Main Risk Factors
- Material risk factors are spot prices of FTSE components.
- No optionality Comments
- Due to the type of underlying (observable market data) and lack of optionality, the P&L vector of banks using HS is very similar, with very high correlation (with banks 3 & 7 showing a bit less correlation than the others) and a very similar level of volatility across banks.
- Accordingly, this portfolio shows the lowest level of dispersion for ‘VaR Alt’ (9%).
- However, the dispersion increases very significantly when we look at VaR and ‘VaR Comp’ figures.
- Thus, dispersion seems to be produced mainly by modelling options contemplated in regulation.
50-day P&L vector
P1 Bank 1 Bank 2 Bank 3 Bank 4 Bank 5 Bank 6 Bank 7 Bank 8 Bank 9
Bank 1 100 95 100 100 100 91 100 98
Bank 2 100 95 100 100 100 90 100 98
Bank 3 95 95 94 95 95 88 95 94
Bank 4 100 100 94 100 100 90 100 98
Bank 5 100 100 95 100 100 90 100 98
Bank 6 100 100 95 100 100 91 100 98
Bank 7 91 90 88 90 90 91 91 89
Bank 8 100 100 95 100 100 100 91 98
Bank 9 98 98 94 98 98 98 89 98
P&L Stdev 14.72 14.91 14.75 18.06 14.77 14.70 17.58 14.78 14.41
Mean 15.41
Stdev 1.30
Stdev / Mean 8.44%
Correlations across one-year daily P&L observations
Page 27 of 103
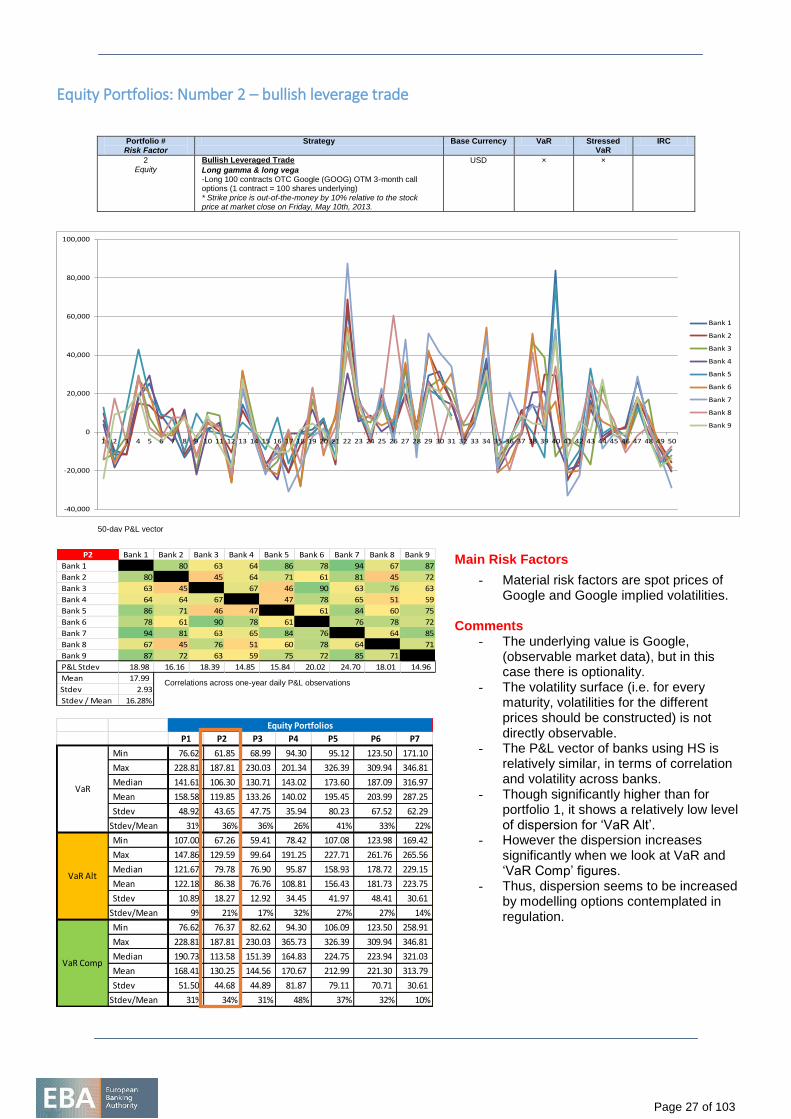
Equity Portfolios: Number 2 – bullish leverage trade
Portfolio # Risk Factor
Strategy Base Currency VaR Stressed VaR
IRC
2 Equity
Bullish Leveraged Trade
Long gamma & long vega -Long 100 contracts OTC Google (GOOG) OTM 3-month call options (1 contract = 100 shares underlying) * Strike price is out-of-the-money by 10% relative to the stock price at market close on Friday, May 10th, 2013.
USD × ×
-40,000
-20,000
0
20,000
40,000
60,000
80,000
100,000
1 2 3 4 5 6 7 8 9 10 11 12 13 14 15 16 17 18 19 20 21 22 23 24 25 26 27 28 29 30 31 32 33 34 35 36 37 38 39 40 41 42 43 44 45 46 47 48 49 50
Bank 1
Bank 2
Bank 3
Bank 4
Bank 5
Bank 6
Bank 7
Bank 8
Bank 9
P2 Bank 1 Bank 2 Bank 3 Bank 4 Bank 5 Bank 6 Bank 7 Bank 8 Bank 9
Bank 1 80 63 64 86 78 94 67 87
Bank 2 80 45 64 71 61 81 45 72
Bank 3 63 45 67 46 90 63 76 63
Bank 4 64 64 67 47 78 65 51 59
Bank 5 86 71 46 47 61 84 60 75
Bank 6 78 61 90 78 61 76 78 72
Bank 7 94 81 63 65 84 76 64 85
Bank 8 67 45 76 51 60 78 64 71
Bank 9 87 72 63 59 75 72 85 71
P&L Stdev 18.98 16.16 18.39 14.85 15.84 20.02 24.70 18.01 14.96
Mean 17.99
Stdev 2.93
Stdev / Mean 16.28%
P1 P2 P3 P4 P5 P6 P7
Min 76.62 61.85 68.99 94.30 95.12 123.50 171.10
Max 228.81 187.81 230.03 201.34 326.39 309.94 346.81
Median 141.61 106.30 130.71 143.02 173.60 187.09 316.97
Mean 158.58 119.85 133.26 140.02 195.45 203.99 287.25
Stdev 48.92 43.65 47.75 35.94 80.23 67.52 62.29
Stdev/Mean 31% 36% 36% 26% 41% 33% 22%
Min 107.00 67.26 59.41 78.42 107.08 123.98 169.42
Max 147.86 129.59 99.64 191.25 227.71 261.76 265.56
Median 121.67 79.78 76.90 95.87 158.93 178.72 229.15
Mean 122.18 86.38 76.76 108.81 156.43 181.73 223.75
Stdev 10.89 18.27 12.92 34.45 41.97 48.41 30.61
Stdev/Mean 9% 21% 17% 32% 27% 27% 14%
Min 76.62 76.37 82.62 94.30 106.09 123.50 258.91
Max 228.81 187.81 230.03 365.73 326.39 309.94 346.81
Median 190.73 113.58 151.39 164.83 224.75 223.94 321.03
Mean 168.41 130.25 144.56 170.67 212.99 221.30 313.79
Stdev 51.50 44.68 44.89 81.87 79.11 70.71 30.61
Stdev/Mean 31% 34% 31% 48% 37% 32% 10%
Equity Portfolios
VaR Alt
VaR
VaR Comp
Main Risk Factors
- Material risk factors are spot prices of Google and Google implied volatilities.
Comments - The underlying value is Google,
(observable market data), but in this case there is optionality.
- The volatility surface (i.e. for every maturity, volatilities for the different prices should be constructed) is not directly observable.
- The P&L vector of banks using HS is relatively similar, in terms of correlation and volatility across banks.
- Though significantly higher than for portfolio 1, it shows a relatively low level of dispersion for ‘VaR Alt’.
- However the dispersion increases significantly when we look at VaR and ‘VaR Comp’ figures.
- Thus, dispersion seems to be increased by modelling options contemplated in regulation.
50-day P&L vector
Correlations across one-year daily P&L observations
Page 28 of 103
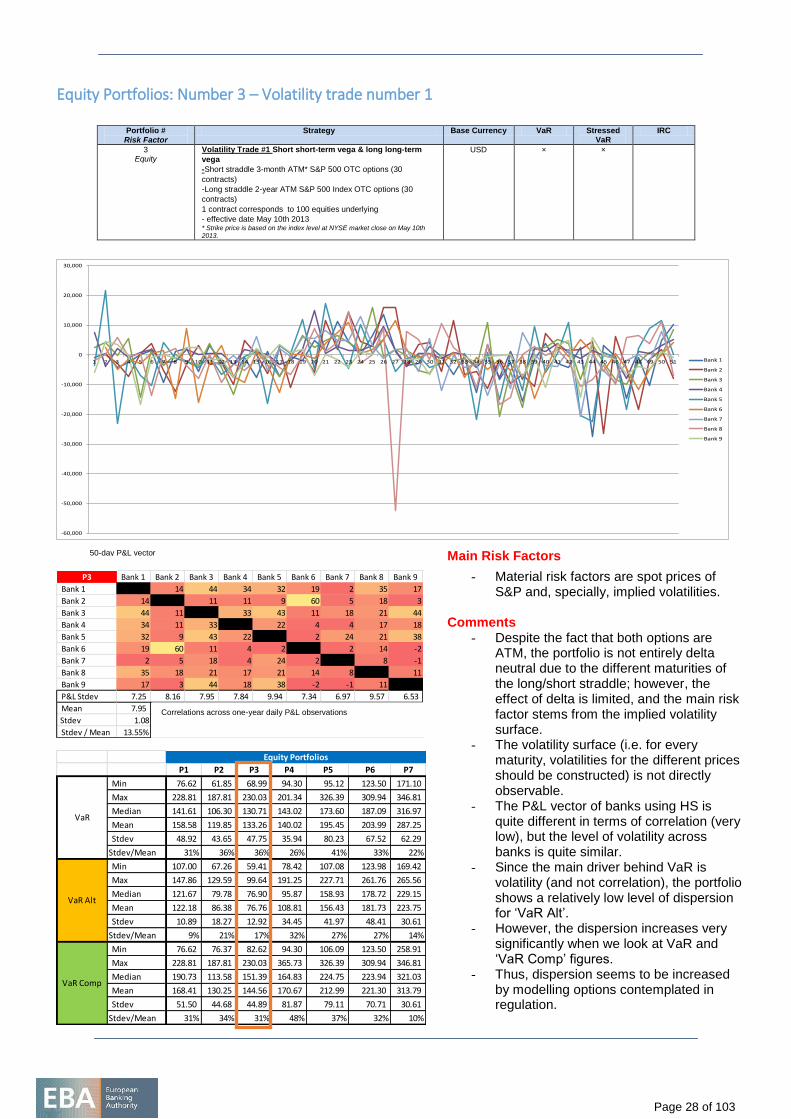
Equity Portfolios: Number 3 – Volatility trade number 1
Portfolio #
Risk Factor
Strategy Base Currency VaR Stressed VaR
IRC
3 Equity
Volatility Trade #1 Short short-term vega & long long-term
vega
-Short straddle 3-month ATM* S&P 500 OTC options (30
contracts)
-Long straddle 2-year ATM S&P 500 Index OTC options (30
contracts)
1 contract corresponds to 100 equities underlying
- effective date May 10th 2013 * Strike price is based on the index level at NYSE market close on May 10th 2013.
USD × ×
-60,000
-50,000
-40,000
-30,000
-20,000
-10,000
0
10,000
20,000
30,000
1 2 3 4 5 6 7 8 9 10 11 12 13 14 15 16 17 18 19 20 21 22 23 24 25 26 27 28 29 30 31 32 33 34 35 36 37 38 39 40 41 42 43 44 45 46 47 48 49 50 51 Bank 1
Bank 2
Bank 3
Bank 4
Bank 5
Bank 6
Bank 7
Bank 8
Bank 9
P3 Bank 1 Bank 2 Bank 3 Bank 4 Bank 5 Bank 6 Bank 7 Bank 8 Bank 9
Bank 1 14 44 34 32 19 2 35 17
Bank 2 14 11 11 9 60 5 18 3
Bank 3 44 11 33 43 11 18 21 44
Bank 4 34 11 33 22 4 4 17 18
Bank 5 32 9 43 22 2 24 21 38
Bank 6 19 60 11 4 2 2 14 -2
Bank 7 2 5 18 4 24 2 8 -1
Bank 8 35 18 21 17 21 14 8 11
Bank 9 17 3 44 18 38 -2 -1 11
P&L Stdev 7.25 8.16 7.95 7.84 9.94 7.34 6.97 9.57 6.53
Mean 7.95
Stdev 1.08
Stdev / Mean 13.55%
P1 P2 P3 P4 P5 P6 P7
Min 76.62 61.85 68.99 94.30 95.12 123.50 171.10
Max 228.81 187.81 230.03 201.34 326.39 309.94 346.81
Median 141.61 106.30 130.71 143.02 173.60 187.09 316.97
Mean 158.58 119.85 133.26 140.02 195.45 203.99 287.25
Stdev 48.92 43.65 47.75 35.94 80.23 67.52 62.29
Stdev/Mean 31% 36% 36% 26% 41% 33% 22%
Min 107.00 67.26 59.41 78.42 107.08 123.98 169.42
Max 147.86 129.59 99.64 191.25 227.71 261.76 265.56
Median 121.67 79.78 76.90 95.87 158.93 178.72 229.15
Mean 122.18 86.38 76.76 108.81 156.43 181.73 223.75
Stdev 10.89 18.27 12.92 34.45 41.97 48.41 30.61
Stdev/Mean 9% 21% 17% 32% 27% 27% 14%
Min 76.62 76.37 82.62 94.30 106.09 123.50 258.91
Max 228.81 187.81 230.03 365.73 326.39 309.94 346.81
Median 190.73 113.58 151.39 164.83 224.75 223.94 321.03
Mean 168.41 130.25 144.56 170.67 212.99 221.30 313.79
Stdev 51.50 44.68 44.89 81.87 79.11 70.71 30.61
Stdev/Mean 31% 34% 31% 48% 37% 32% 10%
Equity Portfolios
VaR Alt
VaR
VaR Comp
Main Risk Factors
- Material risk factors are spot prices of S&P and, specially, implied volatilities.
Comments - Despite the fact that both options are
ATM, the portfolio is not entirely delta neutral due to the different maturities of the long/short straddle; however, the effect of delta is limited, and the main risk factor stems from the implied volatility surface.
- The volatility surface (i.e. for every maturity, volatilities for the different prices should be constructed) is not directly observable.
- The P&L vector of banks using HS is quite different in terms of correlation (very low), but the level of volatility across banks is quite similar.
- Since the main driver behind VaR is volatility (and not correlation), the portfolio shows a relatively low level of dispersion for ‘VaR Alt’.
- However, the dispersion increases very significantly when we look at VaR and ‘VaR Comp’ figures.
- Thus, dispersion seems to be increased by modelling options contemplated in regulation.
50-day P&L vector
Correlations across one-year daily P&L observations
Page 29 of 103
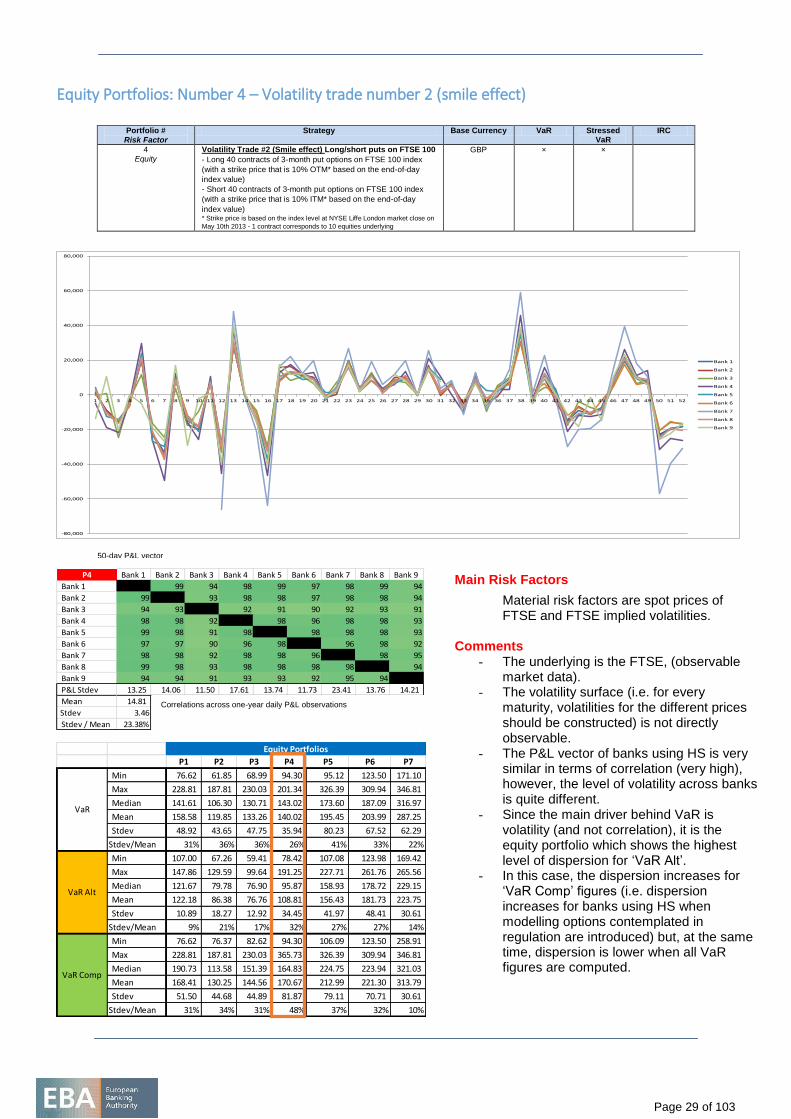
Equity Portfolios: Number 4 – Volatility trade number 2 (smile effect)
Portfolio #
Risk Factor
Strategy Base Currency VaR Stressed VaR
IRC
4 Equity
Volatility Trade #2 (Smile effect) Long/short puts on FTSE 100
- Long 40 contracts of 3-month put options on FTSE 100 index
(with a strike price that is 10% OTM* based on the end-of-day
index value)
- Short 40 contracts of 3-month put options on FTSE 100 index
(with a strike price that is 10% ITM* based on the end-of-day
index value) * Strike price is based on the index level at NYSE Liffe London market close on
May 10th 2013 - 1 contract corresponds to 10 equities underlying
GBP × ×
-80,000
-60,000
-40,000
-20,000
0
20,000
40,000
60,000
80,000
1 2 3 4 5 6 7 8 9 10 11 12 13 14 15 16 17 18 19 20 21 22 23 24 25 26 27 28 29 30 31 32 33 34 35 36 37 38 39 40 41 42 43 44 45 46 47 48 49 50 51 52
Bank 1
Bank 2
Bank 3
Bank 4
Bank 5
Bank 6
Bank 7
Bank 8
Bank 9
P4 Bank 1 Bank 2 Bank 3 Bank 4 Bank 5 Bank 6 Bank 7 Bank 8 Bank 9
Bank 1 99 94 98 99 97 98 99 94
Bank 2 99 93 98 98 97 98 98 94
Bank 3 94 93 92 91 90 92 93 91
Bank 4 98 98 92 98 96 98 98 93
Bank 5 99 98 91 98 98 98 98 93
Bank 6 97 97 90 96 98 96 98 92
Bank 7 98 98 92 98 98 96 98 95
Bank 8 99 98 93 98 98 98 98 94
Bank 9 94 94 91 93 93 92 95 94
P&L Stdev 13.25 14.06 11.50 17.61 13.74 11.73 23.41 13.76 14.21
Mean 14.81
Stdev 3.46
Stdev / Mean 23.38%
P1 P2 P3 P4 P5 P6 P7
Min 76.62 61.85 68.99 94.30 95.12 123.50 171.10
Max 228.81 187.81 230.03 201.34 326.39 309.94 346.81
Median 141.61 106.30 130.71 143.02 173.60 187.09 316.97
Mean 158.58 119.85 133.26 140.02 195.45 203.99 287.25
Stdev 48.92 43.65 47.75 35.94 80.23 67.52 62.29
Stdev/Mean 31% 36% 36% 26% 41% 33% 22%
Min 107.00 67.26 59.41 78.42 107.08 123.98 169.42
Max 147.86 129.59 99.64 191.25 227.71 261.76 265.56
Median 121.67 79.78 76.90 95.87 158.93 178.72 229.15
Mean 122.18 86.38 76.76 108.81 156.43 181.73 223.75
Stdev 10.89 18.27 12.92 34.45 41.97 48.41 30.61
Stdev/Mean 9% 21% 17% 32% 27% 27% 14%
Min 76.62 76.37 82.62 94.30 106.09 123.50 258.91
Max 228.81 187.81 230.03 365.73 326.39 309.94 346.81
Median 190.73 113.58 151.39 164.83 224.75 223.94 321.03
Mean 168.41 130.25 144.56 170.67 212.99 221.30 313.79
Stdev 51.50 44.68 44.89 81.87 79.11 70.71 30.61
Stdev/Mean 31% 34% 31% 48% 37% 32% 10%
Equity Portfolios
VaR Alt
VaR
VaR Comp
Main Risk Factors
Material risk factors are spot prices of FTSE and FTSE implied volatilities.
Comments - The underlying is the FTSE, (observable
market data). - The volatility surface (i.e. for every
maturity, volatilities for the different prices should be constructed) is not directly observable.
- The P&L vector of banks using HS is very similar in terms of correlation (very high), however, the level of volatility across banks is quite different.
- Since the main driver behind VaR is volatility (and not correlation), it is the equity portfolio which shows the highest level of dispersion for ‘VaR Alt’.
- In this case, the dispersion increases for ‘VaR Comp’ figures (i.e. dispersion increases for banks using HS when modelling options contemplated in regulation are introduced) but, at the same time, dispersion is lower when all VaR figures are computed.
50-day P&L vector
Correlations across one-year daily P&L observations
Page 30 of 103
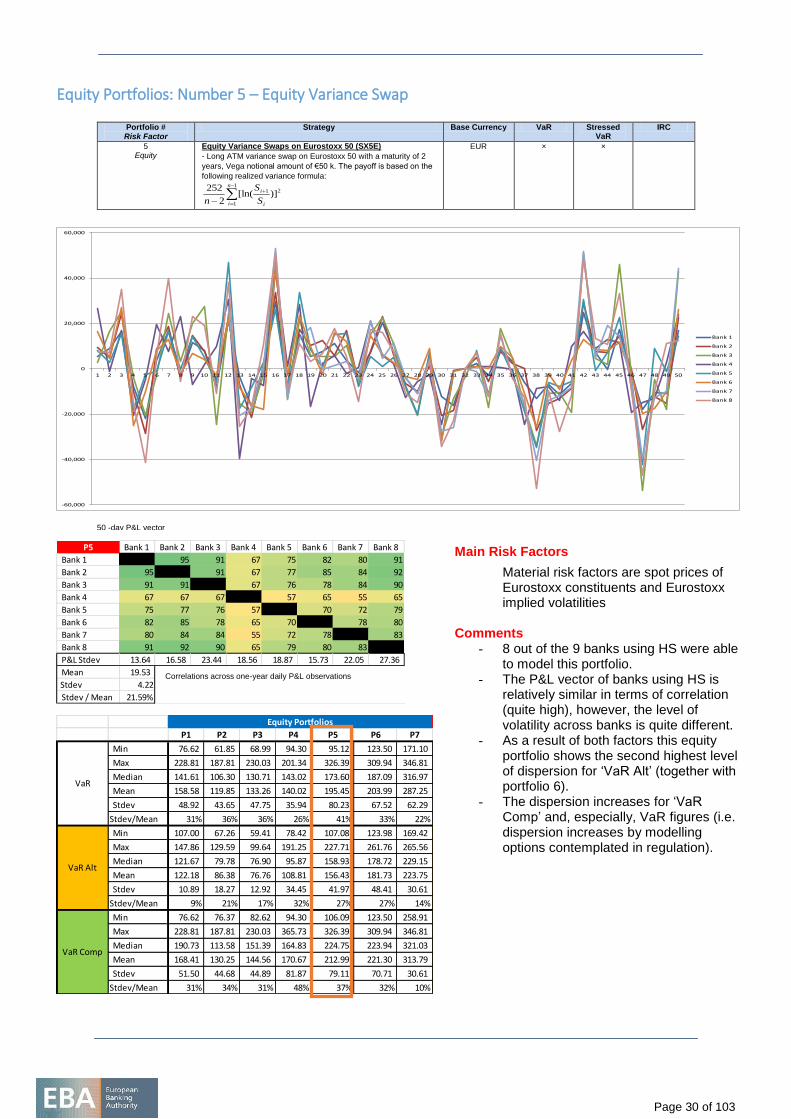
Equity Portfolios: Number 5 – Equity Variance Swap
Portfolio # Risk Factor
Strategy Base Currency VaR Stressed VaR
IRC
5 Equity
Equity Variance Swaps on Eurostoxx 50 (SX5E)
- Long ATM variance swap on Eurostoxx 50 with a maturity of 2
years, Vega notional amount of €50 k. The payoff is based on the
following realized variance formula:
1
1
21 )][ln(2
252 n
i i
i
S
S
n
EUR × ×
-60,000
-40,000
-20,000
0
20,000
40,000
60,000
1 2 3 4 5 6 7 8 9 10 11 12 13 14 15 16 17 18 19 20 21 22 23 24 25 26 27 28 29 30 31 32 33 34 35 36 37 38 39 40 41 42 43 44 45 46 47 48 49 50
Bank 1
Bank 2
Bank 3
Bank 4
Bank 5
Bank 6
Bank 7
Bank 8
P5 Bank 1 Bank 2 Bank 3 Bank 4 Bank 5 Bank 6 Bank 7 Bank 8
Bank 1 95 91 67 75 82 80 91
Bank 2 95 91 67 77 85 84 92
Bank 3 91 91 67 76 78 84 90
Bank 4 67 67 67 57 65 55 65
Bank 5 75 77 76 57 70 72 79
Bank 6 82 85 78 65 70 78 80
Bank 7 80 84 84 55 72 78 83
Bank 8 91 92 90 65 79 80 83
P&L Stdev 13.64 16.58 23.44 18.56 18.87 15.73 22.05 27.36
Mean 19.53
Stdev 4.22
Stdev / Mean 21.59%
P1 P2 P3 P4 P5 P6 P7
Min 76.62 61.85 68.99 94.30 95.12 123.50 171.10
Max 228.81 187.81 230.03 201.34 326.39 309.94 346.81
Median 141.61 106.30 130.71 143.02 173.60 187.09 316.97
Mean 158.58 119.85 133.26 140.02 195.45 203.99 287.25
Stdev 48.92 43.65 47.75 35.94 80.23 67.52 62.29
Stdev/Mean 31% 36% 36% 26% 41% 33% 22%
Min 107.00 67.26 59.41 78.42 107.08 123.98 169.42
Max 147.86 129.59 99.64 191.25 227.71 261.76 265.56
Median 121.67 79.78 76.90 95.87 158.93 178.72 229.15
Mean 122.18 86.38 76.76 108.81 156.43 181.73 223.75
Stdev 10.89 18.27 12.92 34.45 41.97 48.41 30.61
Stdev/Mean 9% 21% 17% 32% 27% 27% 14%
Min 76.62 76.37 82.62 94.30 106.09 123.50 258.91
Max 228.81 187.81 230.03 365.73 326.39 309.94 346.81
Median 190.73 113.58 151.39 164.83 224.75 223.94 321.03
Mean 168.41 130.25 144.56 170.67 212.99 221.30 313.79
Stdev 51.50 44.68 44.89 81.87 79.11 70.71 30.61
Stdev/Mean 31% 34% 31% 48% 37% 32% 10%
Equity Portfolios
VaR Alt
VaR
VaR Comp
Main Risk Factors
Material risk factors are spot prices of Eurostoxx constituents and Eurostoxx implied volatilities
Comments - 8 out of the 9 banks using HS were able
to model this portfolio. - The P&L vector of banks using HS is
relatively similar in terms of correlation (quite high), however, the level of volatility across banks is quite different.
- As a result of both factors this equity portfolio shows the second highest level of dispersion for ‘VaR Alt’ (together with portfolio 6).
- The dispersion increases for ‘VaR Comp’ and, especially, VaR figures (i.e. dispersion increases by modelling options contemplated in regulation).
50 -day P&L vector
Correlations across one-year daily P&L observations
Page 31 of 103
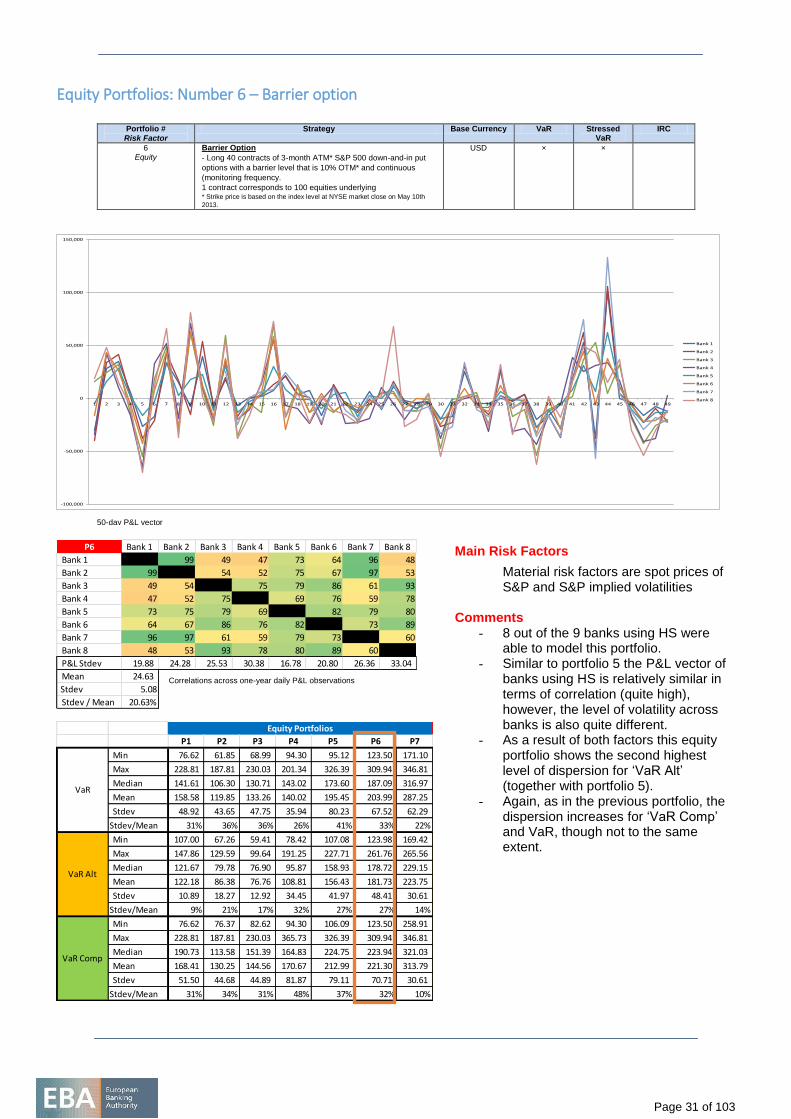
Equity Portfolios: Number 6 – Barrier option
Portfolio #
Risk Factor
Strategy Base Currency VaR Stressed VaR
IRC
6 Equity
Barrier Option
- Long 40 contracts of 3-month ATM* S&P 500 down-and-in put
options with a barrier level that is 10% OTM* and continuous
(monitoring frequency.
1 contract corresponds to 100 equities underlying * Strike price is based on the index level at NYSE market close on May 10th
2013.
USD × ×
-100,000
-50,000
0
50,000
100,000
150,000
1 2 3 4 5 6 7 8 9 10 11 12 13 14 15 16 17 18 19 20 21 22 23 24 25 26 27 28 29 30 31 32 33 34 35 36 37 38 39 40 41 42 43 44 45 46 47 48 49
Bank 1
Bank 2
Bank 3
Bank 4
Bank 5
Bank 6
Bank 7
Bank 8
P6 Bank 1 Bank 2 Bank 3 Bank 4 Bank 5 Bank 6 Bank 7 Bank 8
Bank 1 99 49 47 73 64 96 48
Bank 2 99 54 52 75 67 97 53
Bank 3 49 54 75 79 86 61 93
Bank 4 47 52 75 69 76 59 78
Bank 5 73 75 79 69 82 79 80
Bank 6 64 67 86 76 82 73 89
Bank 7 96 97 61 59 79 73 60
Bank 8 48 53 93 78 80 89 60
P&L Stdev 19.88 24.28 25.53 30.38 16.78 20.80 26.36 33.04
Mean 24.63
Stdev 5.08
Stdev / Mean 20.63%
P1 P2 P3 P4 P5 P6 P7
Min 76.62 61.85 68.99 94.30 95.12 123.50 171.10
Max 228.81 187.81 230.03 201.34 326.39 309.94 346.81
Median 141.61 106.30 130.71 143.02 173.60 187.09 316.97
Mean 158.58 119.85 133.26 140.02 195.45 203.99 287.25
Stdev 48.92 43.65 47.75 35.94 80.23 67.52 62.29
Stdev/Mean 31% 36% 36% 26% 41% 33% 22%
Min 107.00 67.26 59.41 78.42 107.08 123.98 169.42
Max 147.86 129.59 99.64 191.25 227.71 261.76 265.56
Median 121.67 79.78 76.90 95.87 158.93 178.72 229.15
Mean 122.18 86.38 76.76 108.81 156.43 181.73 223.75
Stdev 10.89 18.27 12.92 34.45 41.97 48.41 30.61
Stdev/Mean 9% 21% 17% 32% 27% 27% 14%
Min 76.62 76.37 82.62 94.30 106.09 123.50 258.91
Max 228.81 187.81 230.03 365.73 326.39 309.94 346.81
Median 190.73 113.58 151.39 164.83 224.75 223.94 321.03
Mean 168.41 130.25 144.56 170.67 212.99 221.30 313.79
Stdev 51.50 44.68 44.89 81.87 79.11 70.71 30.61
Stdev/Mean 31% 34% 31% 48% 37% 32% 10%
Equity Portfolios
VaR Alt
VaR
VaR Comp
Main Risk Factors
Material risk factors are spot prices of S&P and S&P implied volatilities
Comments - 8 out of the 9 banks using HS were
able to model this portfolio. - Similar to portfolio 5 the P&L vector of
banks using HS is relatively similar in terms of correlation (quite high), however, the level of volatility across banks is also quite different.
- As a result of both factors this equity portfolio shows the second highest level of dispersion for ‘VaR Alt’ (together with portfolio 5).
- Again, as in the previous portfolio, the dispersion increases for ‘VaR Comp’ and VaR, though not to the same extent.
50-day P&L vector
Correlations across one-year daily P&L observations
Page 32 of 103
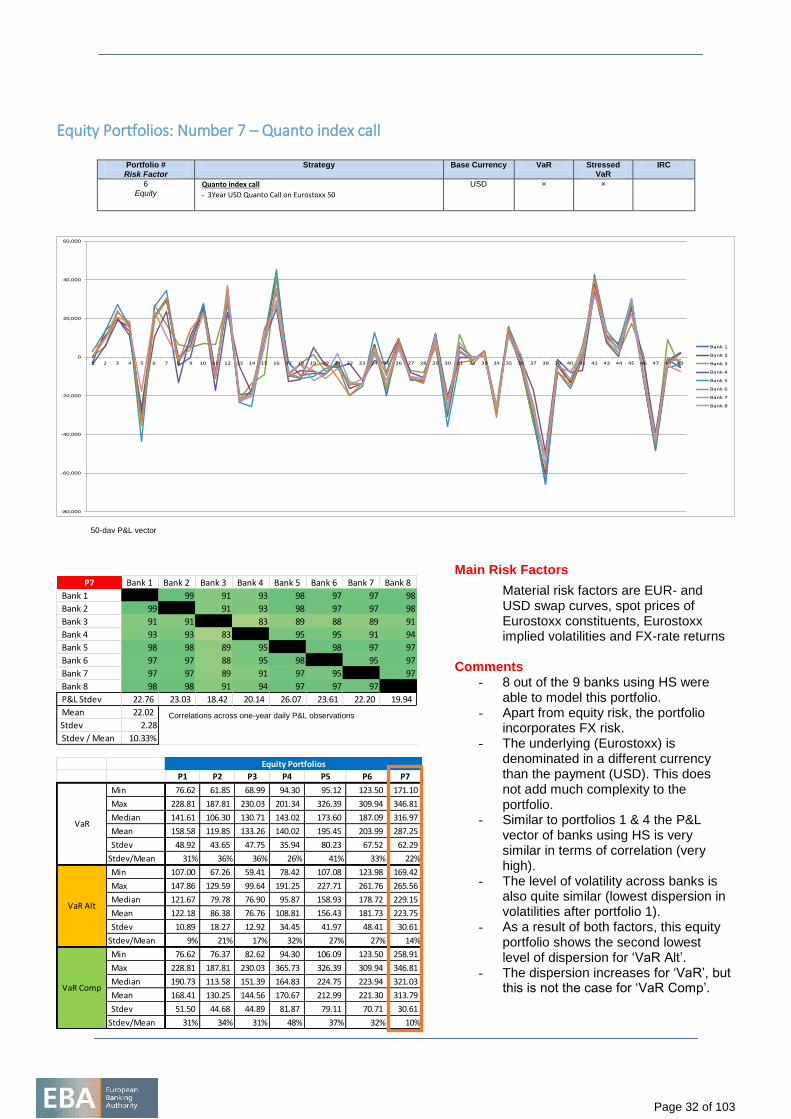
Equity Portfolios: Number 7 – Quanto index call
Portfolio #
Risk Factor
Strategy Base Currency VaR Stressed VaR
IRC
6 Equity
Quanto index call
- 3Year USD Quanto Call on Eurostoxx 50
USD × ×
-80,000
-60,000
-40,000
-20,000
0
20,000
40,000
60,000
1 2 3 4 5 6 7 8 9 10 11 12 13 14 15 16 17 18 19 20 21 22 23 24 25 26 27 28 29 30 31 32 33 34 35 36 37 38 39 40 41 42 43 44 45 46 47 48 49
Bank 1
Bank 2
Bank 3
Bank 4
Bank 5
Bank 6
Bank 7
Bank 8
P7 Bank 1 Bank 2 Bank 3 Bank 4 Bank 5 Bank 6 Bank 7 Bank 8
Bank 1 99 91 93 98 97 97 98
Bank 2 99 91 93 98 97 97 98
Bank 3 91 91 83 89 88 89 91
Bank 4 93 93 83 95 95 91 94
Bank 5 98 98 89 95 98 97 97
Bank 6 97 97 88 95 98 95 97
Bank 7 97 97 89 91 97 95 97
Bank 8 98 98 91 94 97 97 97
P&L Stdev 22.76 23.03 18.42 20.14 26.07 23.61 22.20 19.94
Mean 22.02
Stdev 2.28
Stdev / Mean 10.33%
P1 P2 P3 P4 P5 P6 P7
Min 76.62 61.85 68.99 94.30 95.12 123.50 171.10
Max 228.81 187.81 230.03 201.34 326.39 309.94 346.81
Median 141.61 106.30 130.71 143.02 173.60 187.09 316.97
Mean 158.58 119.85 133.26 140.02 195.45 203.99 287.25
Stdev 48.92 43.65 47.75 35.94 80.23 67.52 62.29
Stdev/Mean 31% 36% 36% 26% 41% 33% 22%
Min 107.00 67.26 59.41 78.42 107.08 123.98 169.42
Max 147.86 129.59 99.64 191.25 227.71 261.76 265.56
Median 121.67 79.78 76.90 95.87 158.93 178.72 229.15
Mean 122.18 86.38 76.76 108.81 156.43 181.73 223.75
Stdev 10.89 18.27 12.92 34.45 41.97 48.41 30.61
Stdev/Mean 9% 21% 17% 32% 27% 27% 14%
Min 76.62 76.37 82.62 94.30 106.09 123.50 258.91
Max 228.81 187.81 230.03 365.73 326.39 309.94 346.81
Median 190.73 113.58 151.39 164.83 224.75 223.94 321.03
Mean 168.41 130.25 144.56 170.67 212.99 221.30 313.79
Stdev 51.50 44.68 44.89 81.87 79.11 70.71 30.61
Stdev/Mean 31% 34% 31% 48% 37% 32% 10%
Equity Portfolios
VaR Alt
VaR
VaR Comp
Main Risk Factors
Material risk factors are EUR- and USD swap curves, spot prices of Eurostoxx constituents, Eurostoxx implied volatilities and FX-rate returns
Comments - 8 out of the 9 banks using HS were
able to model this portfolio. - Apart from equity risk, the portfolio
incorporates FX risk. - The underlying (Eurostoxx) is
denominated in a different currency than the payment (USD). This does not add much complexity to the portfolio.
- Similar to portfolios 1 & 4 the P&L vector of banks using HS is very similar in terms of correlation (very high).
- The level of volatility across banks is also quite similar (lowest dispersion in volatilities after portfolio 1).
- As a result of both factors, this equity portfolio shows the second lowest level of dispersion for ‘VaR Alt’.
- The dispersion increases for ‘VaR’, but this is not the case for ‘VaR Comp’.
50-day P&L vector
Correlations across one-year daily P&L observations
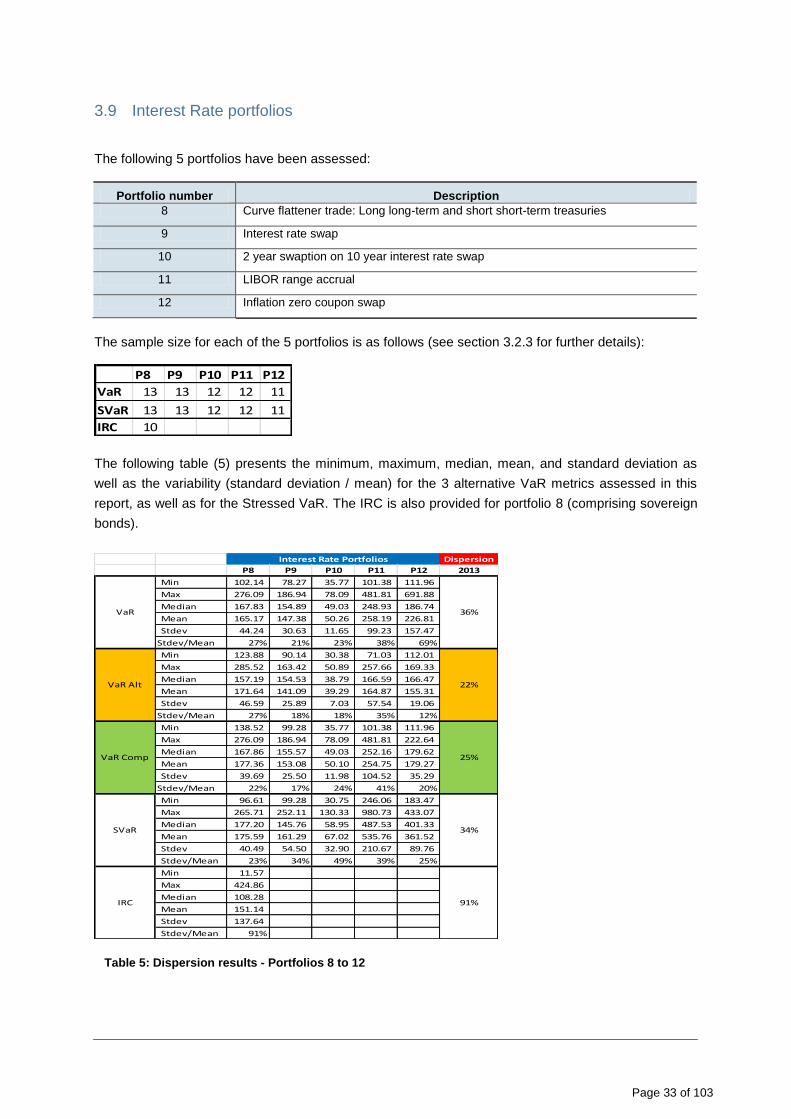
Page 33 of 103
3.9 Interest Rate portfolios
The following 5 portfolios have been assessed:
Portfolio number Description
8 Curve flattener trade: Long long-term and short short-term treasuries
9 Interest rate swap
10 2 year swaption on 10 year interest rate swap
11 LIBOR range accrual
12 Inflation zero coupon swap
The sample size for each of the 5 portfolios is as follows (see section 3.2.3 for further details):
The following table (5) presents the minimum, maximum, median, mean, and standard deviation as
well as the variability (standard deviation / mean) for the 3 alternative VaR metrics assessed in this
report, as well as for the Stressed VaR. The IRC is also provided for portfolio 8 (comprising sovereign
bonds).
Table 5: Dispersion results - Portfolios 8 to 12
P8 P9 P10 P11 P12
VaR 13 13 12 12 11
SVaR 13 13 12 12 11
IRC 10
Dispersion
P8 P9 P10 P11 P12 2013
Min 102.14 78.27 35.77 101.38 111.96
Max 276.09 186.94 78.09 481.81 691.88
Median 167.83 154.89 49.03 248.93 186.74
Mean 165.17 147.38 50.26 258.19 226.81
Stdev 44.24 30.63 11.65 99.23 157.47
Stdev/Mean 27% 21% 23% 38% 69%
Min 123.88 90.14 30.38 71.03 112.01
Max 285.52 163.42 50.89 257.66 169.33
Median 157.19 154.53 38.79 166.59 166.47
Mean 171.64 141.09 39.29 164.87 155.31
Stdev 46.59 25.89 7.03 57.54 19.06
Stdev/Mean 27% 18% 18% 35% 12%
Min 138.52 99.28 35.77 101.38 111.96
Max 276.09 186.94 78.09 481.81 222.64
Median 167.86 155.57 49.03 252.16 179.62
Mean 177.36 153.08 50.10 254.75 179.27
Stdev 39.69 25.50 11.98 104.52 35.29
Stdev/Mean 22% 17% 24% 41% 20%
Min 96.61 99.28 30.75 246.06 183.47
Max 265.71 252.11 130.33 980.73 433.07
Median 177.20 145.76 58.95 487.53 401.33
Mean 175.59 161.29 67.02 535.76 361.52
Stdev 40.49 54.50 32.90 210.67 89.76
Stdev/Mean 23% 34% 49% 39% 25%
Min 11.57
Max 424.86
Median 108.28
Mean 151.14
Stdev 137.64
Stdev/Mean 91%
IRC 91%
VaR Alt 22%
VaR Comp 25%
SVaR 34%
Interest Rate Portfolios
VaR 36%
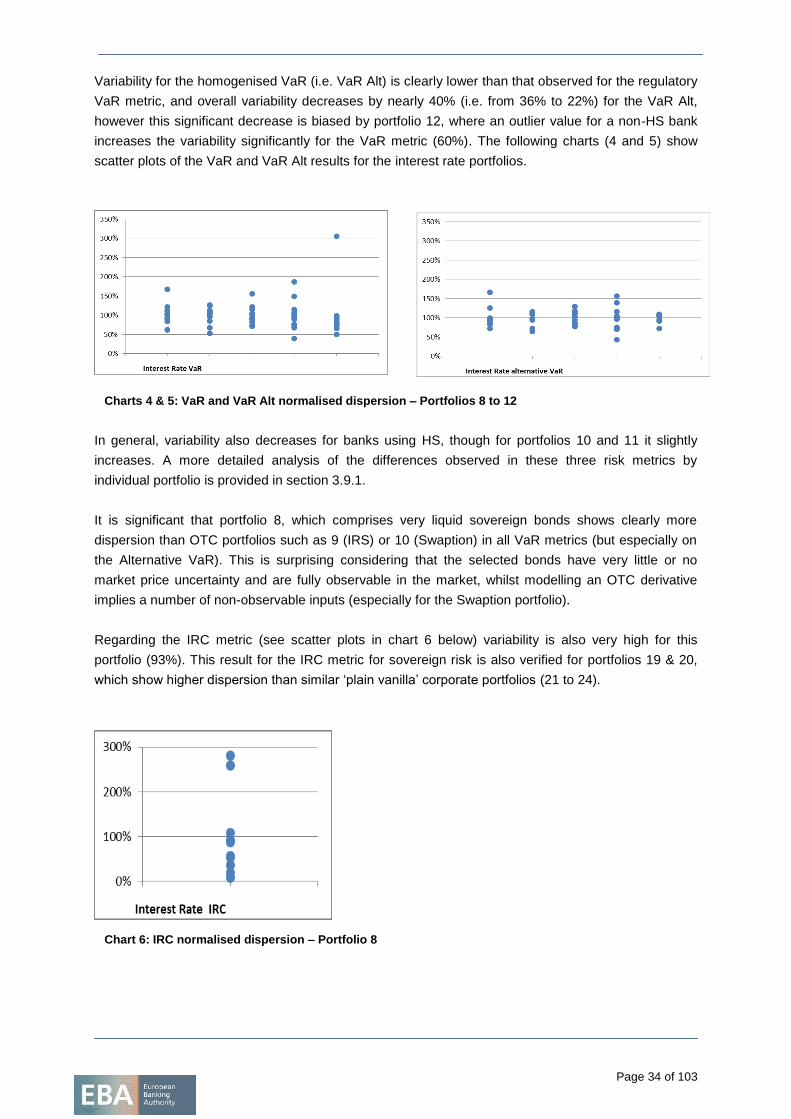
Page 34 of 103
Variability for the homogenised VaR (i.e. VaR Alt) is clearly lower than that observed for the regulatory
VaR metric, and overall variability decreases by nearly 40% (i.e. from 36% to 22%) for the VaR Alt,
however this significant decrease is biased by portfolio 12, where an outlier value for a non-HS bank
increases the variability significantly for the VaR metric (60%). The following charts (4 and 5) show
scatter plots of the VaR and VaR Alt results for the interest rate portfolios.
Charts 4 & 5: VaR and VaR Alt normalised dispersion – Portfolios 8 to 12
In general, variability also decreases for banks using HS, though for portfolios 10 and 11 it slightly
increases. A more detailed analysis of the differences observed in these three risk metrics by
individual portfolio is provided in section 3.9.1.
It is significant that portfolio 8, which comprises very liquid sovereign bonds shows clearly more
dispersion than OTC portfolios such as 9 (IRS) or 10 (Swaption) in all VaR metrics (but especially on
the Alternative VaR). This is surprising considering that the selected bonds have very little or no
market price uncertainty and are fully observable in the market, whilst modelling an OTC derivative
implies a number of non-observable inputs (especially for the Swaption portfolio).
Regarding the IRC metric (see scatter plots in chart 6 below) variability is also very high for this
portfolio (93%). This result for the IRC metric for sovereign risk is also verified for portfolios 19 & 20,
which show higher dispersion than similar ‘plain vanilla’ corporate portfolios (21 to 24).
Chart 6: IRC normalised dispersion – Portfolio 8
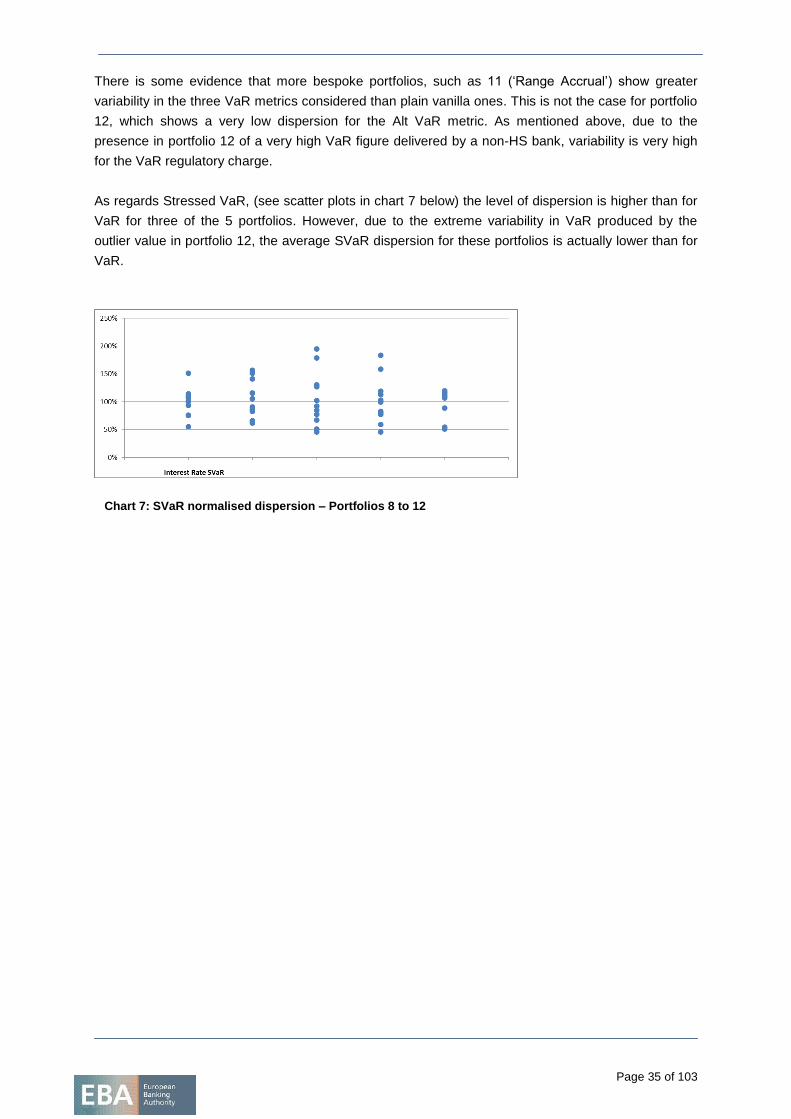
Page 35 of 103
There is some evidence that more bespoke portfolios, such as 11 (‘Range Accrual’) show greater
variability in the three VaR metrics considered than plain vanilla ones. This is not the case for portfolio
12, which shows a very low dispersion for the Alt VaR metric. As mentioned above, due to the
presence in portfolio 12 of a very high VaR figure delivered by a non-HS bank, variability is very high
for the VaR regulatory charge.
As regards Stressed VaR, (see scatter plots in chart 7 below) the level of dispersion is higher than for
VaR for three of the 5 portfolios. However, due to the extreme variability in VaR produced by the
outlier value in portfolio 12, the average SVaR dispersion for these portfolios is actually lower than for
VaR.
Chart 7: SVaR normalised dispersion – Portfolios 8 to 12
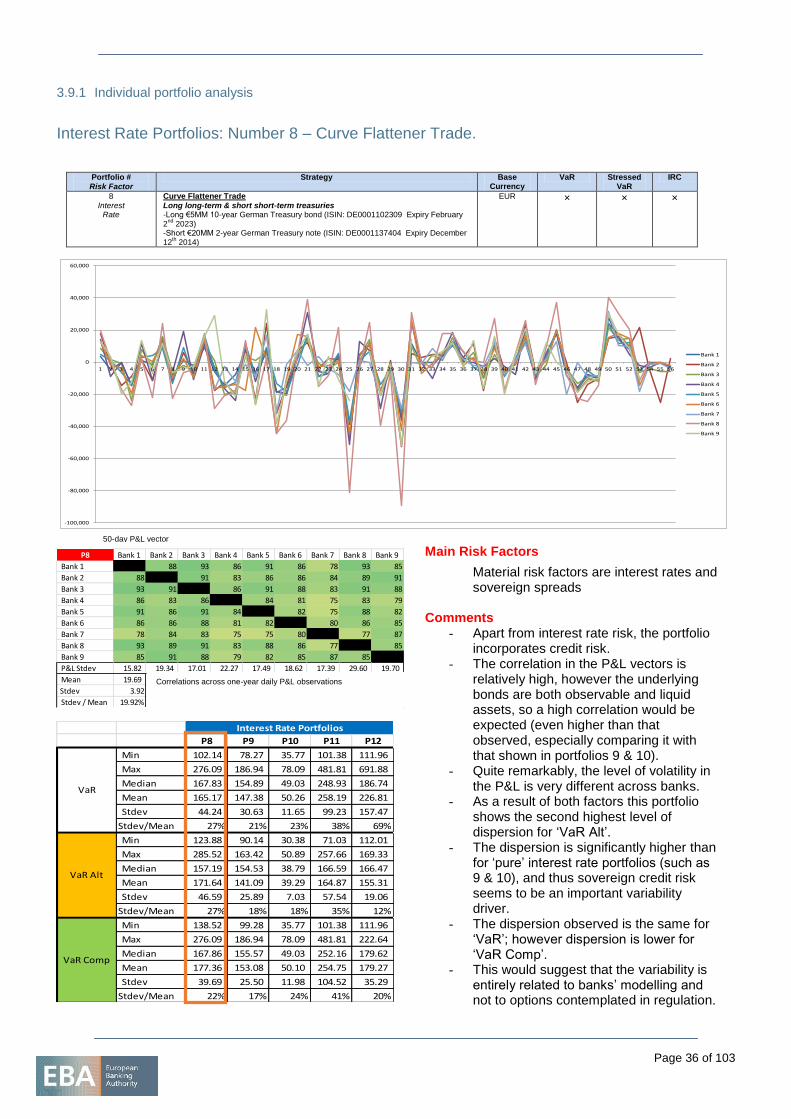
Page 36 of 103
3.9.1 Individual portfolio analysis
Interest Rate Portfolios: Number 8 – Curve Flattener Trade.
Portfolio #
Risk Factor
Strategy Base Currency
VaR Stressed VaR
IRC
8 Interest
Rate
Curve Flattener Trade
Long long-term & short short-term treasuries -Long €5MM 10-year German Treasury bond (ISIN: DE0001102309 Expiry February 2
nd 2023)
-Short €20MM 2-year German Treasury note (ISIN: DE0001137404 Expiry December 12
th 2014)
EUR × × ×
-100,000
-80,000
-60,000
-40,000
-20,000
0
20,000
40,000
60,000
1 2 3 4 5 6 7 8 9 10 11 12 13 14 15 16 17 18 19 20 21 22 23 24 25 26 27 28 29 30 31 32 33 34 35 36 37 38 39 40 41 42 43 44 45 46 47 48 49 50 51 52 53 54 55 56
Bank 1
Bank 2
Bank 3
Bank 4
Bank 5
Bank 6
Bank 7
Bank 8
Bank 9
P8 Bank 1 Bank 2 Bank 3 Bank 4 Bank 5 Bank 6 Bank 7 Bank 8 Bank 9
Bank 1 88 93 86 91 86 78 93 85
Bank 2 88 91 83 86 86 84 89 91
Bank 3 93 91 86 91 88 83 91 88
Bank 4 86 83 86 84 81 75 83 79
Bank 5 91 86 91 84 82 75 88 82
Bank 6 86 86 88 81 82 80 86 85
Bank 7 78 84 83 75 75 80 77 87
Bank 8 93 89 91 83 88 86 77 85
Bank 9 85 91 88 79 82 85 87 85
P&L Stdev 15.82 19.34 17.01 22.27 17.49 18.62 17.39 29.60 19.70
Mean 19.69
Stdev 3.92
Stdev / Mean 19.92%
P8 P9 P10 P11 P12
Min 102.14 78.27 35.77 101.38 111.96
Max 276.09 186.94 78.09 481.81 691.88
Median 167.83 154.89 49.03 248.93 186.74
Mean 165.17 147.38 50.26 258.19 226.81
Stdev 44.24 30.63 11.65 99.23 157.47
Stdev/Mean 27% 21% 23% 38% 69%
Min 123.88 90.14 30.38 71.03 112.01
Max 285.52 163.42 50.89 257.66 169.33
Median 157.19 154.53 38.79 166.59 166.47
Mean 171.64 141.09 39.29 164.87 155.31
Stdev 46.59 25.89 7.03 57.54 19.06
Stdev/Mean 27% 18% 18% 35% 12%
Min 138.52 99.28 35.77 101.38 111.96
Max 276.09 186.94 78.09 481.81 222.64
Median 167.86 155.57 49.03 252.16 179.62
Mean 177.36 153.08 50.10 254.75 179.27
Stdev 39.69 25.50 11.98 104.52 35.29
Stdev/Mean 22% 17% 24% 41% 20%
VaR Alt
VaR Comp
Interest Rate Portfolios
VaR
Main Risk Factors
Material risk factors are interest rates and sovereign spreads
Comments - Apart from interest rate risk, the portfolio
incorporates credit risk. - The correlation in the P&L vectors is
relatively high, however the underlying bonds are both observable and liquid assets, so a high correlation would be expected (even higher than that observed, especially comparing it with that shown in portfolios 9 & 10).
- Quite remarkably, the level of volatility in the P&L is very different across banks.
- As a result of both factors this portfolio shows the second highest level of dispersion for ‘VaR Alt’.
- The dispersion is significantly higher than for ‘pure’ interest rate portfolios (such as 9 & 10), and thus sovereign credit risk seems to be an important variability driver.
- The dispersion observed is the same for ‘VaR’; however dispersion is lower for ‘VaR Comp’.
- This would suggest that the variability is entirely related to banks’ modelling and not to options contemplated in regulation.
50-day P&L vector
Correlations across one-year daily P&L observations
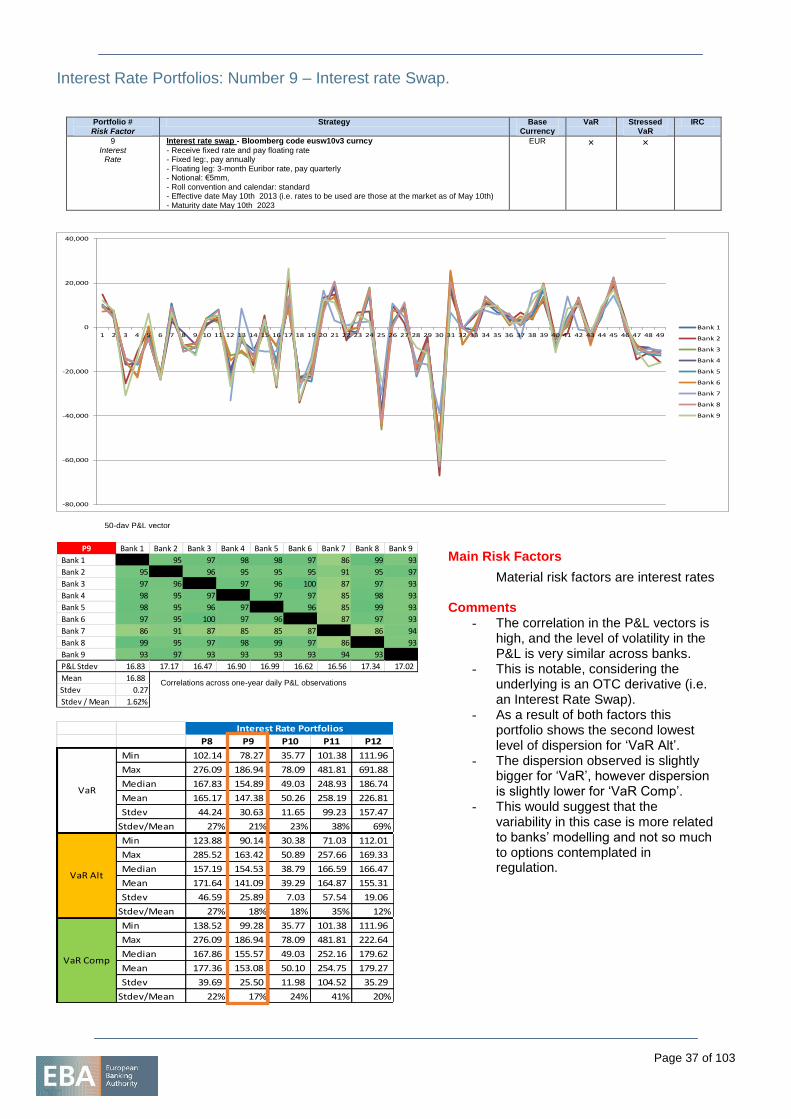
Page 37 of 103
Interest Rate Portfolios: Number 9 – Interest rate Swap.
Portfolio #
Risk Factor
Strategy Base Currency
VaR Stressed VaR
IRC
9 Interest
Rate
Interest rate swap - Bloomberg code eusw10v3 curncy
- Receive fixed rate and pay floating rate - Fixed leg:, pay annually - Floating leg: 3-month Euribor rate, pay quarterly - Notional: €5mm, - Roll convention and calendar: standard - Effective date May 10th 2013 (i.e. rates to be used are those at the market as of May 10th) - Maturity date May 10th 2023
EUR × ×
-80,000
-60,000
-40,000
-20,000
0
20,000
40,000
1 2 3 4 5 6 7 8 9 10 11 12 13 14 15 16 17 18 19 20 21 22 23 24 25 26 27 28 29 30 31 32 33 34 35 36 37 38 39 40 41 42 43 44 45 46 47 48 49
Bank 1
Bank 2
Bank 3
Bank 4
Bank 5
Bank 6
Bank 7
Bank 8
Bank 9
P9 Bank 1 Bank 2 Bank 3 Bank 4 Bank 5 Bank 6 Bank 7 Bank 8 Bank 9
Bank 1 95 97 98 98 97 86 99 93
Bank 2 95 96 95 95 95 91 95 97
Bank 3 97 96 97 96 100 87 97 93
Bank 4 98 95 97 97 97 85 98 93
Bank 5 98 95 96 97 96 85 99 93
Bank 6 97 95 100 97 96 87 97 93
Bank 7 86 91 87 85 85 87 86 94
Bank 8 99 95 97 98 99 97 86 93
Bank 9 93 97 93 93 93 93 94 93
P&L Stdev 16.83 17.17 16.47 16.90 16.99 16.62 16.56 17.34 17.02
Mean 16.88
Stdev 0.27
Stdev / Mean 1.62%
P8 P9 P10 P11 P12
Min 102.14 78.27 35.77 101.38 111.96
Max 276.09 186.94 78.09 481.81 691.88
Median 167.83 154.89 49.03 248.93 186.74
Mean 165.17 147.38 50.26 258.19 226.81
Stdev 44.24 30.63 11.65 99.23 157.47
Stdev/Mean 27% 21% 23% 38% 69%
Min 123.88 90.14 30.38 71.03 112.01
Max 285.52 163.42 50.89 257.66 169.33
Median 157.19 154.53 38.79 166.59 166.47
Mean 171.64 141.09 39.29 164.87 155.31
Stdev 46.59 25.89 7.03 57.54 19.06
Stdev/Mean 27% 18% 18% 35% 12%
Min 138.52 99.28 35.77 101.38 111.96
Max 276.09 186.94 78.09 481.81 222.64
Median 167.86 155.57 49.03 252.16 179.62
Mean 177.36 153.08 50.10 254.75 179.27
Stdev 39.69 25.50 11.98 104.52 35.29
Stdev/Mean 22% 17% 24% 41% 20%
VaR Alt
VaR Comp
Interest Rate Portfolios
VaR
Main Risk Factors
Material risk factors are interest rates
Comments - The correlation in the P&L vectors is
high, and the level of volatility in the P&L is very similar across banks.
- This is notable, considering the underlying is an OTC derivative (i.e. an Interest Rate Swap).
- As a result of both factors this portfolio shows the second lowest level of dispersion for ‘VaR Alt’.
- The dispersion observed is slightly bigger for ‘VaR’, however dispersion is slightly lower for ‘VaR Comp’.
- This would suggest that the variability in this case is more related to banks’ modelling and not so much to options contemplated in regulation.
50-day P&L vector
Correlations across one-year daily P&L observations
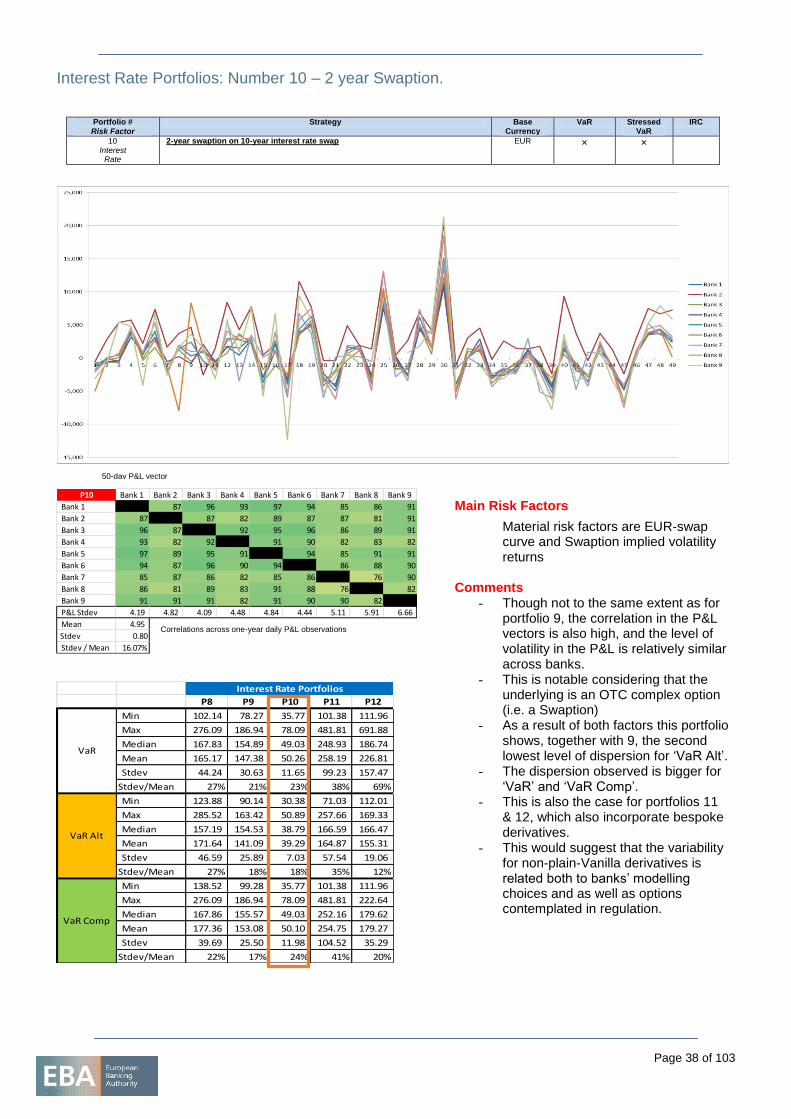
Page 38 of 103
Interest Rate Portfolios: Number 10 – 2 year Swaption.
Portfolio #
Risk Factor
Strategy Base Currency
VaR Stressed VaR
IRC
10 Interest
Rate
2-year swaption on 10-year interest rate swap
EUR × ×
P10 Bank 1 Bank 2 Bank 3 Bank 4 Bank 5 Bank 6 Bank 7 Bank 8 Bank 9
Bank 1 87 96 93 97 94 85 86 91
Bank 2 87 87 82 89 87 87 81 91
Bank 3 96 87 92 95 96 86 89 91
Bank 4 93 82 92 91 90 82 83 82
Bank 5 97 89 95 91 94 85 91 91
Bank 6 94 87 96 90 94 86 88 90
Bank 7 85 87 86 82 85 86 76 90
Bank 8 86 81 89 83 91 88 76 82
Bank 9 91 91 91 82 91 90 90 82
P&L Stdev 4.19 4.82 4.09 4.48 4.84 4.44 5.11 5.91 6.66
Mean 4.95
Stdev 0.80
Stdev / Mean 16.07%
P8 P9 P10 P11 P12
Min 102.14 78.27 35.77 101.38 111.96
Max 276.09 186.94 78.09 481.81 691.88
Median 167.83 154.89 49.03 248.93 186.74
Mean 165.17 147.38 50.26 258.19 226.81
Stdev 44.24 30.63 11.65 99.23 157.47
Stdev/Mean 27% 21% 23% 38% 69%
Min 123.88 90.14 30.38 71.03 112.01
Max 285.52 163.42 50.89 257.66 169.33
Median 157.19 154.53 38.79 166.59 166.47
Mean 171.64 141.09 39.29 164.87 155.31
Stdev 46.59 25.89 7.03 57.54 19.06
Stdev/Mean 27% 18% 18% 35% 12%
Min 138.52 99.28 35.77 101.38 111.96
Max 276.09 186.94 78.09 481.81 222.64
Median 167.86 155.57 49.03 252.16 179.62
Mean 177.36 153.08 50.10 254.75 179.27
Stdev 39.69 25.50 11.98 104.52 35.29
Stdev/Mean 22% 17% 24% 41% 20%
VaR Alt
VaR Comp
Interest Rate Portfolios
VaR
Main Risk Factors
Material risk factors are EUR-swap curve and Swaption implied volatility returns
Comments - Though not to the same extent as for
portfolio 9, the correlation in the P&L vectors is also high, and the level of volatility in the P&L is relatively similar across banks.
- This is notable considering that the underlying is an OTC complex option (i.e. a Swaption)
- As a result of both factors this portfolio shows, together with 9, the second lowest level of dispersion for ‘VaR Alt’.
- The dispersion observed is bigger for ‘VaR’ and ‘VaR Comp’.
- This is also the case for portfolios 11 & 12, which also incorporate bespoke derivatives.
- This would suggest that the variability for non-plain-Vanilla derivatives is related both to banks’ modelling choices and as well as options contemplated in regulation.
50-day P&L vector
Correlations across one-year daily P&L observations
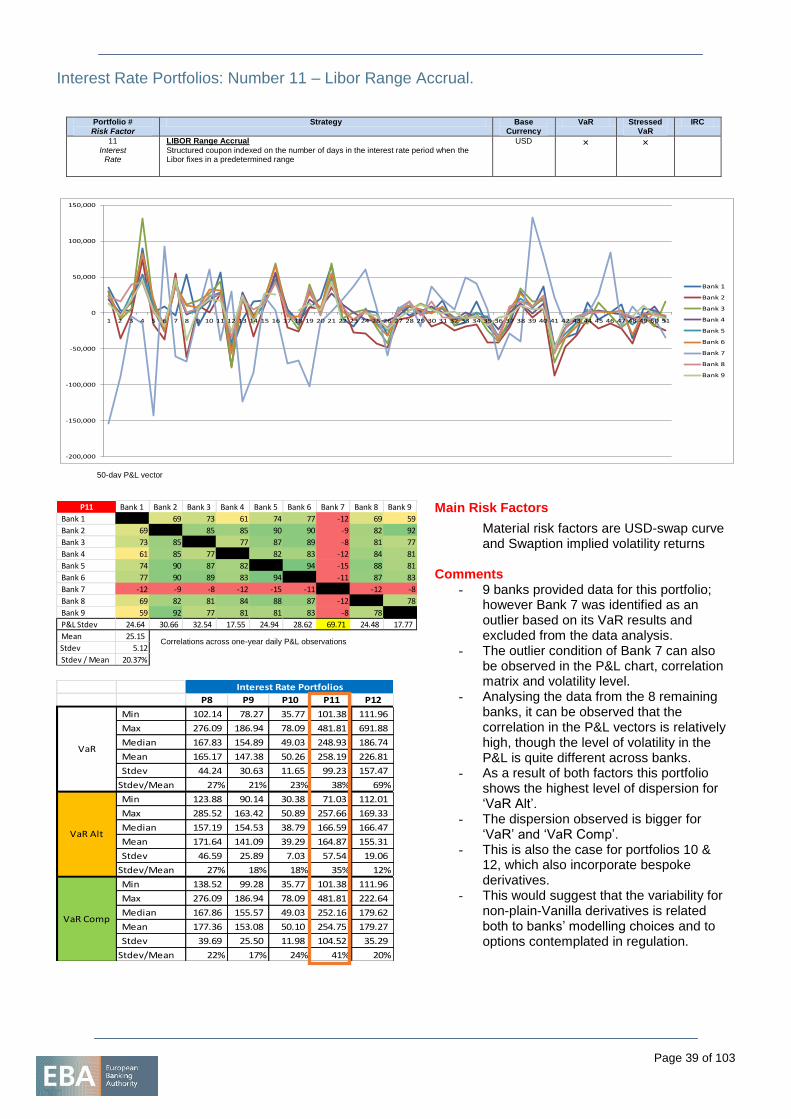
Page 39 of 103
Interest Rate Portfolios: Number 11 – Libor Range Accrual.
Portfolio #
Risk Factor
Strategy Base Currency
VaR Stressed VaR
IRC
11 Interest
Rate
LIBOR Range Accrual
Structured coupon indexed on the number of days in the interest rate period when the Libor fixes in a predetermined range
USD × ×
-200,000
-150,000
-100,000
-50,000
0
50,000
100,000
150,000
1 2 3 4 5 6 7 8 9 10 11 12 13 14 15 16 17 18 19 20 21 22 23 24 25 26 27 28 29 30 31 32 33 34 35 36 37 38 39 40 41 42 43 44 45 46 47 48 49 50 51
Bank 1
Bank 2
Bank 3
Bank 4
Bank 5
Bank 6
Bank 7
Bank 8
Bank 9
P11 Bank 1 Bank 2 Bank 3 Bank 4 Bank 5 Bank 6 Bank 7 Bank 8 Bank 9
Bank 1 69 73 61 74 77 -12 69 59
Bank 2 69 85 85 90 90 -9 82 92
Bank 3 73 85 77 87 89 -8 81 77
Bank 4 61 85 77 82 83 -12 84 81
Bank 5 74 90 87 82 94 -15 88 81
Bank 6 77 90 89 83 94 -11 87 83
Bank 7 -12 -9 -8 -12 -15 -11 -12 -8
Bank 8 69 82 81 84 88 87 -12 78
Bank 9 59 92 77 81 81 83 -8 78
P&L Stdev 24.64 30.66 32.54 17.55 24.94 28.62 69.71 24.48 17.77
Mean 25.15
Stdev 5.12
Stdev / Mean 20.37%
P8 P9 P10 P11 P12
Min 102.14 78.27 35.77 101.38 111.96
Max 276.09 186.94 78.09 481.81 691.88
Median 167.83 154.89 49.03 248.93 186.74
Mean 165.17 147.38 50.26 258.19 226.81
Stdev 44.24 30.63 11.65 99.23 157.47
Stdev/Mean 27% 21% 23% 38% 69%
Min 123.88 90.14 30.38 71.03 112.01
Max 285.52 163.42 50.89 257.66 169.33
Median 157.19 154.53 38.79 166.59 166.47
Mean 171.64 141.09 39.29 164.87 155.31
Stdev 46.59 25.89 7.03 57.54 19.06
Stdev/Mean 27% 18% 18% 35% 12%
Min 138.52 99.28 35.77 101.38 111.96
Max 276.09 186.94 78.09 481.81 222.64
Median 167.86 155.57 49.03 252.16 179.62
Mean 177.36 153.08 50.10 254.75 179.27
Stdev 39.69 25.50 11.98 104.52 35.29
Stdev/Mean 22% 17% 24% 41% 20%
VaR Alt
VaR Comp
Interest Rate Portfolios
VaR
Main Risk Factors
Material risk factors are USD-swap curve and Swaption implied volatility returns
Comments - 9 banks provided data for this portfolio;
however Bank 7 was identified as an outlier based on its VaR results and excluded from the data analysis.
- The outlier condition of Bank 7 can also be observed in the P&L chart, correlation matrix and volatility level.
- Analysing the data from the 8 remaining banks, it can be observed that the correlation in the P&L vectors is relatively high, though the level of volatility in the P&L is quite different across banks.
- As a result of both factors this portfolio shows the highest level of dispersion for ‘VaR Alt’.
- The dispersion observed is bigger for ‘VaR’ and ‘VaR Comp’.
- This is also the case for portfolios 10 & 12, which also incorporate bespoke derivatives.
- This would suggest that the variability for non-plain-Vanilla derivatives is related both to banks’ modelling choices and to options contemplated in regulation.
50-day P&L vector
Correlations across one-year daily P&L observations
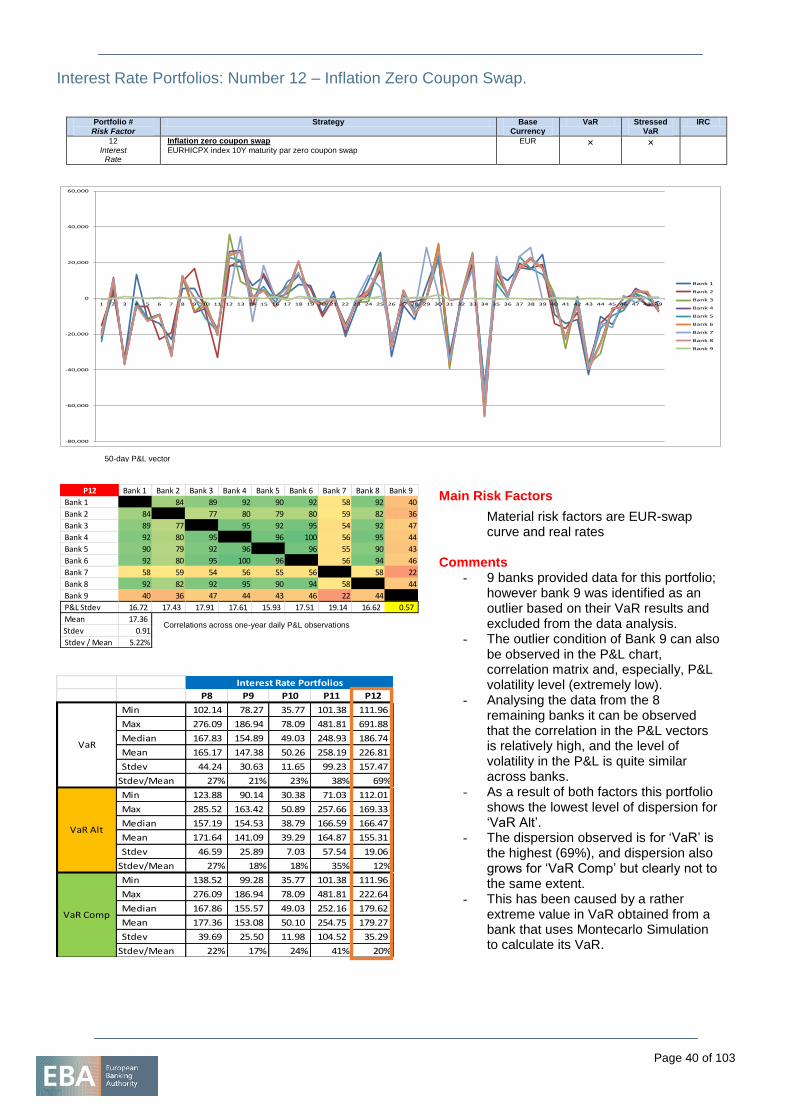
Page 40 of 103
Interest Rate Portfolios: Number 12 – Inflation Zero Coupon Swap.
Portfolio #
Risk Factor
Strategy Base Currency
VaR Stressed VaR
IRC
12 Interest
Rate
Inflation zero coupon swap
EURHICPX index 10Y maturity par zero coupon swap EUR × ×
-80,000
-60,000
-40,000
-20,000
0
20,000
40,000
60,000
1 2 3 4 5 6 7 8 9 10 11 12 13 14 15 16 17 18 19 20 21 22 23 24 25 26 27 28 29 30 31 32 33 34 35 36 37 38 39 40 41 42 43 44 45 46 47 48 49
Bank 1
Bank 2
Bank 3
Bank 4
Bank 5
Bank 6
Bank 7
Bank 8
Bank 9
P12 Bank 1 Bank 2 Bank 3 Bank 4 Bank 5 Bank 6 Bank 7 Bank 8 Bank 9
Bank 1 84 89 92 90 92 58 92 40
Bank 2 84 77 80 79 80 59 82 36
Bank 3 89 77 95 92 95 54 92 47
Bank 4 92 80 95 96 100 56 95 44
Bank 5 90 79 92 96 96 55 90 43
Bank 6 92 80 95 100 96 56 94 46
Bank 7 58 59 54 56 55 56 58 22
Bank 8 92 82 92 95 90 94 58 44
Bank 9 40 36 47 44 43 46 22 44
P&L Stdev 16.72 17.43 17.91 17.61 15.93 17.51 19.14 16.62 0.57
Mean 17.36
Stdev 0.91
Stdev / Mean 5.22%
P8 P9 P10 P11 P12
Min 102.14 78.27 35.77 101.38 111.96
Max 276.09 186.94 78.09 481.81 691.88
Median 167.83 154.89 49.03 248.93 186.74
Mean 165.17 147.38 50.26 258.19 226.81
Stdev 44.24 30.63 11.65 99.23 157.47
Stdev/Mean 27% 21% 23% 38% 69%
Min 123.88 90.14 30.38 71.03 112.01
Max 285.52 163.42 50.89 257.66 169.33
Median 157.19 154.53 38.79 166.59 166.47
Mean 171.64 141.09 39.29 164.87 155.31
Stdev 46.59 25.89 7.03 57.54 19.06
Stdev/Mean 27% 18% 18% 35% 12%
Min 138.52 99.28 35.77 101.38 111.96
Max 276.09 186.94 78.09 481.81 222.64
Median 167.86 155.57 49.03 252.16 179.62
Mean 177.36 153.08 50.10 254.75 179.27
Stdev 39.69 25.50 11.98 104.52 35.29
Stdev/Mean 22% 17% 24% 41% 20%
VaR Alt
VaR Comp
Interest Rate Portfolios
VaR
Main Risk Factors
Material risk factors are EUR-swap curve and real rates
Comments - 9 banks provided data for this portfolio;
however bank 9 was identified as an outlier based on their VaR results and excluded from the data analysis.
- The outlier condition of Bank 9 can also be observed in the P&L chart, correlation matrix and, especially, P&L volatility level (extremely low).
- Analysing the data from the 8 remaining banks it can be observed that the correlation in the P&L vectors is relatively high, and the level of volatility in the P&L is quite similar across banks.
- As a result of both factors this portfolio shows the lowest level of dispersion for ‘VaR Alt’.
- The dispersion observed is for ‘VaR’ is the highest (69%), and dispersion also grows for ‘VaR Comp’ but clearly not to the same extent.
- This has been caused by a rather extreme value in VaR obtained from a bank that uses Montecarlo Simulation to calculate its VaR.
50-day P&L vector
Correlations across one-year daily P&L observations
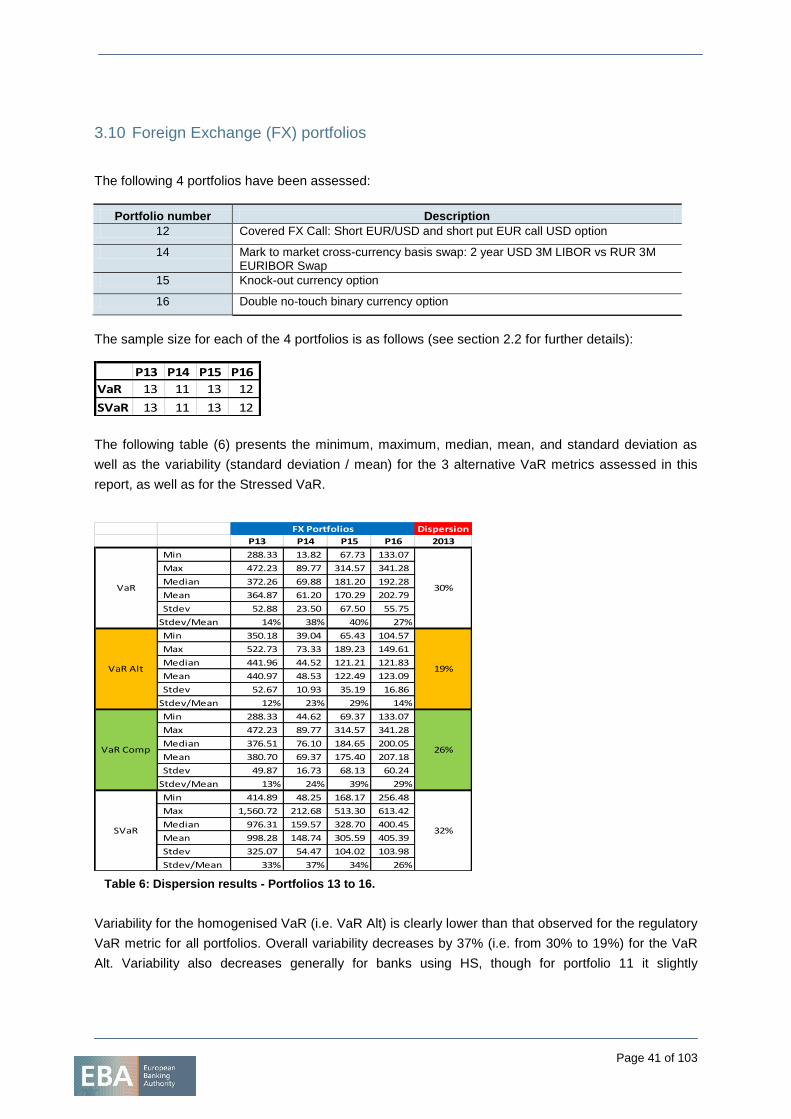
Page 41 of 103
3.10 Foreign Exchange (FX) portfolios
The following 4 portfolios have been assessed:
Portfolio number Description
12 Covered FX Call: Short EUR/USD and short put EUR call USD option
14 Mark to market cross-currency basis swap: 2 year USD 3M LIBOR vs RUR 3M EURIBOR Swap
15 Knock-out currency option
16 Double no-touch binary currency option
The sample size for each of the 4 portfolios is as follows (see section 2.2 for further details):
The following table (6) presents the minimum, maximum, median, mean, and standard deviation as
well as the variability (standard deviation / mean) for the 3 alternative VaR metrics assessed in this
report, as well as for the Stressed VaR.
Table 6: Dispersion results - Portfolios 13 to 16.
Variability for the homogenised VaR (i.e. VaR Alt) is clearly lower than that observed for the regulatory
VaR metric for all portfolios. Overall variability decreases by 37% (i.e. from 30% to 19%) for the VaR
Alt. Variability also decreases generally for banks using HS, though for portfolio 11 it slightly
P13 P14 P15 P16
VaR 13 11 13 12
SVaR 13 11 13 12
Dispersion
P13 P14 P15 P16 2013
Min 288.33 13.82 67.73 133.07
Max 472.23 89.77 314.57 341.28
Median 372.26 69.88 181.20 192.28
Mean 364.87 61.20 170.29 202.79
Stdev 52.88 23.50 67.50 55.75
Stdev/Mean 14% 38% 40% 27%
Min 350.18 39.04 65.43 104.57
Max 522.73 73.33 189.23 149.61
Median 441.96 44.52 121.21 121.83
Mean 440.97 48.53 122.49 123.09
Stdev 52.67 10.93 35.19 16.86
Stdev/Mean 12% 23% 29% 14%
Min 288.33 44.62 69.37 133.07
Max 472.23 89.77 314.57 341.28
Median 376.51 76.10 184.65 200.05
Mean 380.70 69.37 175.40 207.18
Stdev 49.87 16.73 68.13 60.24
Stdev/Mean 13% 24% 39% 29%
Min 414.89 48.25 168.17 256.48
Max 1,560.72 212.68 513.30 613.42
Median 976.31 159.57 328.70 400.45
Mean 998.28 148.74 305.59 405.39
Stdev 325.07 54.47 104.02 103.98
Stdev/Mean 33% 37% 34% 26%
32%
VaR Alt
VaR Comp 26%
19%
SVaR
FX Portfolios
VaR 30%
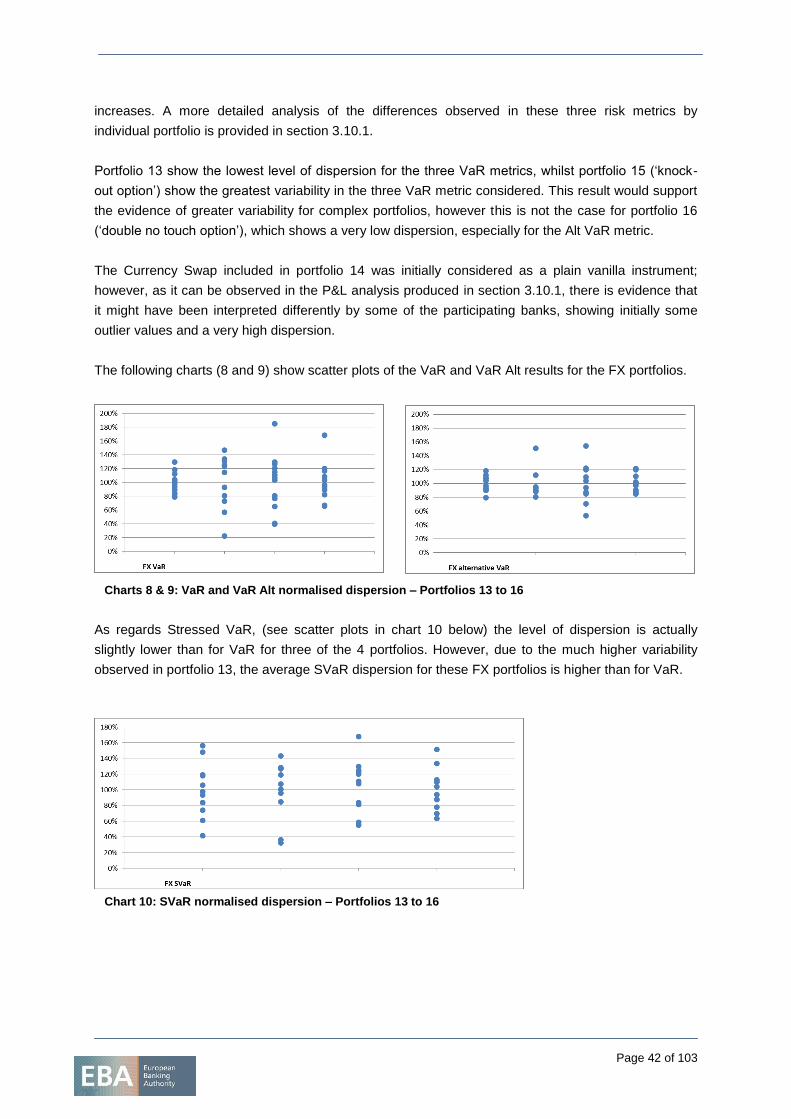
Page 42 of 103
increases. A more detailed analysis of the differences observed in these three risk metrics by
individual portfolio is provided in section 3.10.1.
Portfolio 13 show the lowest level of dispersion for the three VaR metrics, whilst portfolio 15 (‘knock-
out option’) show the greatest variability in the three VaR metric considered. This result would support
the evidence of greater variability for complex portfolios, however this is not the case for portfolio 16
(‘double no touch option’), which shows a very low dispersion, especially for the Alt VaR metric.
The Currency Swap included in portfolio 14 was initially considered as a plain vanilla instrument;
however, as it can be observed in the P&L analysis produced in section 3.10.1, there is evidence that
it might have been interpreted differently by some of the participating banks, showing initially some
outlier values and a very high dispersion.
The following charts (8 and 9) show scatter plots of the VaR and VaR Alt results for the FX portfolios.
Charts 8 & 9: VaR and VaR Alt normalised dispersion – Portfolios 13 to 16
As regards Stressed VaR, (see scatter plots in chart 10 below) the level of dispersion is actually
slightly lower than for VaR for three of the 4 portfolios. However, due to the much higher variability
observed in portfolio 13, the average SVaR dispersion for these FX portfolios is higher than for VaR.
Chart 10: SVaR normalised dispersion – Portfolios 13 to 16
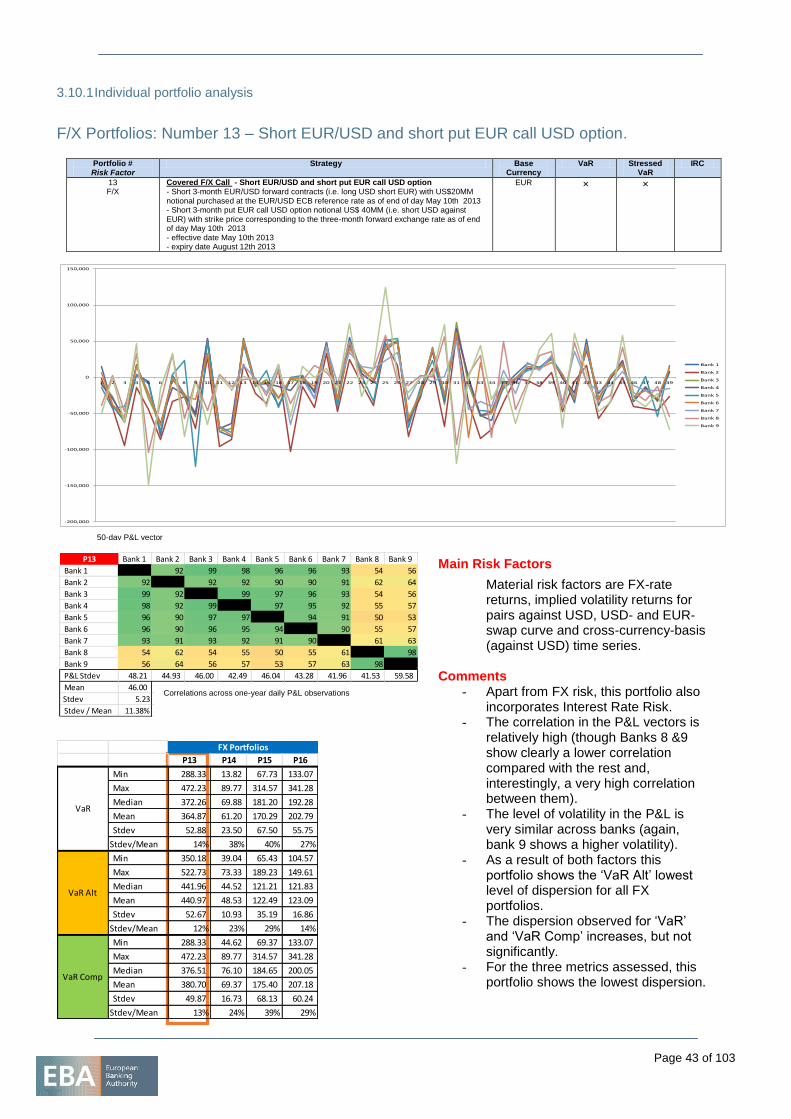
Page 43 of 103
3.10.1 Individual portfolio analysis
F/X Portfolios: Number 13 – Short EUR/USD and short put EUR call USD option.
Portfolio # Risk Factor
Strategy Base Currency
VaR Stressed VaR
IRC
13 F/X
Covered F/X Call - Short EUR/USD and short put EUR call USD option - Short 3-month EUR/USD forward contracts (i.e. long USD short EUR) with US$20MM notional purchased at the EUR/USD ECB reference rate as of end of day May 10th 2013 - Short 3-month put EUR call USD option notional US$ 40MM (i.e. short USD against EUR) with strike price corresponding to the three-month forward exchange rate as of end of day May 10th 2013 - effective date May 10th 2013 - expiry date August 12th 2013
EUR × ×
-200,000
-150,000
-100,000
-50,000
0
50,000
100,000
150,000
1 2 3 4 5 6 7 8 9 10 11 12 13 14 15 16 17 18 19 20 21 22 23 24 25 26 27 28 29 30 31 32 33 34 35 36 37 38 39 40 41 42 43 44 45 46 47 48 49
Bank 1
Bank 2
Bank 3
Bank 4
Bank 5
Bank 6
Bank 7
Bank 8
Bank 9
Main Risk Factors
Material risk factors are FX-rate returns, implied volatility returns for pairs against USD, USD- and EUR-swap curve and cross-currency-basis (against USD) time series.
Comments - Apart from FX risk, this portfolio also
incorporates Interest Rate Risk. - The correlation in the P&L vectors is
relatively high (though Banks 8 &9 show clearly a lower correlation compared with the rest and, interestingly, a very high correlation between them).
- The level of volatility in the P&L is very similar across banks (again, bank 9 shows a higher volatility).
- As a result of both factors this portfolio shows the ‘VaR Alt’ lowest level of dispersion for all FX portfolios.
- The dispersion observed for ‘VaR’ and ‘VaR Comp’ increases, but not significantly.
- For the three metrics assessed, this portfolio shows the lowest dispersion.
50-day P&L vector
P13 P14 P15 P16
Min 288.33 13.82 67.73 133.07
Max 472.23 89.77 314.57 341.28
Median 372.26 69.88 181.20 192.28
Mean 364.87 61.20 170.29 202.79
Stdev 52.88 23.50 67.50 55.75
Stdev/Mean 14% 38% 40% 27%
Min 350.18 39.04 65.43 104.57
Max 522.73 73.33 189.23 149.61
Median 441.96 44.52 121.21 121.83
Mean 440.97 48.53 122.49 123.09
Stdev 52.67 10.93 35.19 16.86
Stdev/Mean 12% 23% 29% 14%
Min 288.33 44.62 69.37 133.07
Max 472.23 89.77 314.57 341.28
Median 376.51 76.10 184.65 200.05
Mean 380.70 69.37 175.40 207.18
Stdev 49.87 16.73 68.13 60.24
Stdev/Mean 13% 24% 39% 29%
VaR Alt
VaR Comp
FX Portfolios
VaR
P13 Bank 1 Bank 2 Bank 3 Bank 4 Bank 5 Bank 6 Bank 7 Bank 8 Bank 9
Bank 1 92 99 98 96 96 93 54 56
Bank 2 92 92 92 90 90 91 62 64
Bank 3 99 92 99 97 96 93 54 56
Bank 4 98 92 99 97 95 92 55 57
Bank 5 96 90 97 97 94 91 50 53
Bank 6 96 90 96 95 94 90 55 57
Bank 7 93 91 93 92 91 90 61 63
Bank 8 54 62 54 55 50 55 61 98
Bank 9 56 64 56 57 53 57 63 98
P&L Stdev 48.21 44.93 46.00 42.49 46.04 43.28 41.96 41.53 59.58
Mean 46.00
Stdev 5.23
Stdev / Mean 11.38%
Correlations across one-year daily P&L observations
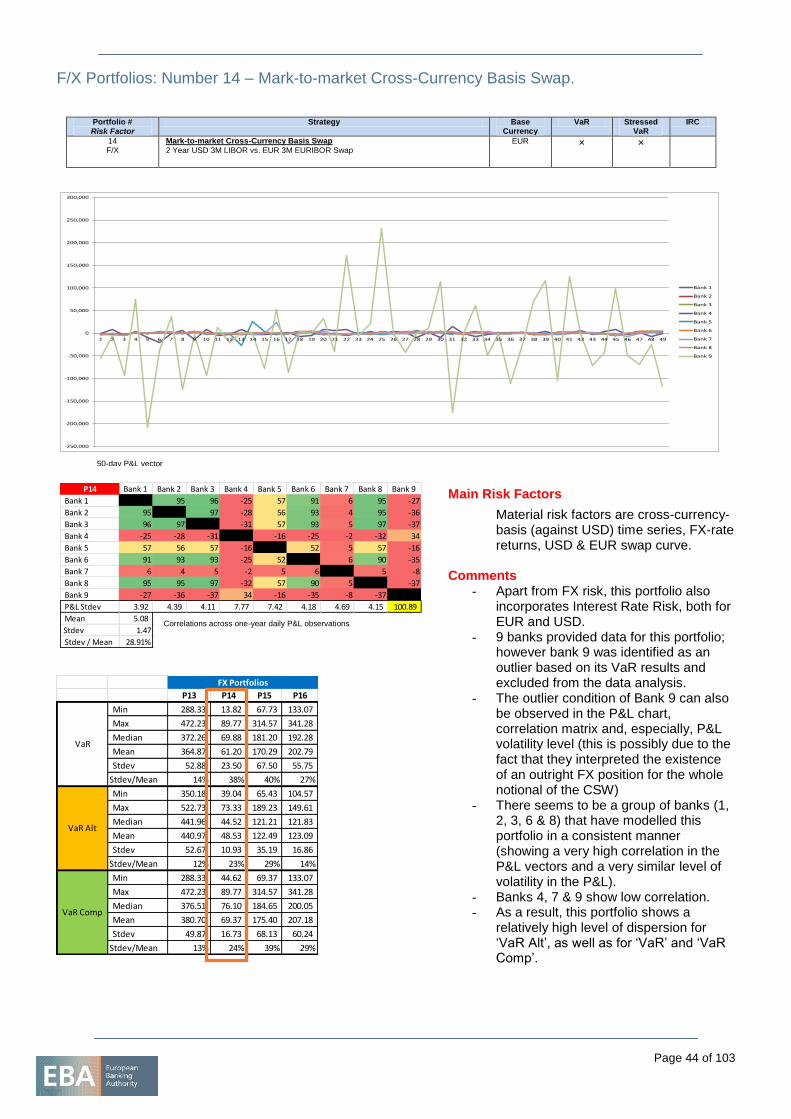
Page 44 of 103
F/X Portfolios: Number 14 – Mark-to-market Cross-Currency Basis Swap.
Portfolio #
Risk Factor
Strategy Base Currency
VaR Stressed VaR
IRC
14 F/X
Mark-to-market Cross-Currency Basis Swap
2 Year USD 3M LIBOR vs. EUR 3M EURIBOR Swap
EUR × ×
-250,000
-200,000
-150,000
-100,000
-50,000
0
50,000
100,000
150,000
200,000
250,000
300,000
1 2 3 4 5 6 7 8 9 10 11 12 13 14 15 16 17 18 19 20 21 22 23 24 25 26 27 28 29 30 31 32 33 34 35 36 37 38 39 40 41 42 43 44 45 46 47 48 49
Bank 1
Bank 2
Bank 3
Bank 4
Bank 5
Bank 6
Bank 7
Bank 8
Bank 9
P14 Bank 1 Bank 2 Bank 3 Bank 4 Bank 5 Bank 6 Bank 7 Bank 8 Bank 9
Bank 1 95 96 -25 57 91 6 95 -27
Bank 2 95 97 -28 56 93 4 95 -36
Bank 3 96 97 -31 57 93 5 97 -37
Bank 4 -25 -28 -31 -16 -25 -2 -32 34
Bank 5 57 56 57 -16 52 5 57 -16
Bank 6 91 93 93 -25 52 6 90 -35
Bank 7 6 4 5 -2 5 6 5 -8
Bank 8 95 95 97 -32 57 90 5 -37
Bank 9 -27 -36 -37 34 -16 -35 -8 -37
P&L Stdev 3.92 4.39 4.11 7.77 7.42 4.18 4.69 4.15 100.89
Mean 5.08
Stdev 1.47
Stdev / Mean 28.91%
P13 P14 P15 P16
Min 288.33 13.82 67.73 133.07
Max 472.23 89.77 314.57 341.28
Median 372.26 69.88 181.20 192.28
Mean 364.87 61.20 170.29 202.79
Stdev 52.88 23.50 67.50 55.75
Stdev/Mean 14% 38% 40% 27%
Min 350.18 39.04 65.43 104.57
Max 522.73 73.33 189.23 149.61
Median 441.96 44.52 121.21 121.83
Mean 440.97 48.53 122.49 123.09
Stdev 52.67 10.93 35.19 16.86
Stdev/Mean 12% 23% 29% 14%
Min 288.33 44.62 69.37 133.07
Max 472.23 89.77 314.57 341.28
Median 376.51 76.10 184.65 200.05
Mean 380.70 69.37 175.40 207.18
Stdev 49.87 16.73 68.13 60.24
Stdev/Mean 13% 24% 39% 29%
VaR Alt
VaR Comp
FX Portfolios
VaR
Main Risk Factors
Material risk factors are cross-currency-basis (against USD) time series, FX-rate returns, USD & EUR swap curve.
Comments - Apart from FX risk, this portfolio also
incorporates Interest Rate Risk, both for EUR and USD.
- 9 banks provided data for this portfolio; however bank 9 was identified as an outlier based on its VaR results and excluded from the data analysis.
- The outlier condition of Bank 9 can also be observed in the P&L chart, correlation matrix and, especially, P&L volatility level (this is possibly due to the fact that they interpreted the existence of an outright FX position for the whole notional of the CSW)
- There seems to be a group of banks (1, 2, 3, 6 & 8) that have modelled this portfolio in a consistent manner (showing a very high correlation in the P&L vectors and a very similar level of volatility in the P&L).
- Banks 4, 7 & 9 show low correlation. - As a result, this portfolio shows a
relatively high level of dispersion for ‘VaR Alt’, as well as for ‘VaR’ and ‘VaR Comp’.
50-day P&L vector
Correlations across one-year daily P&L observations
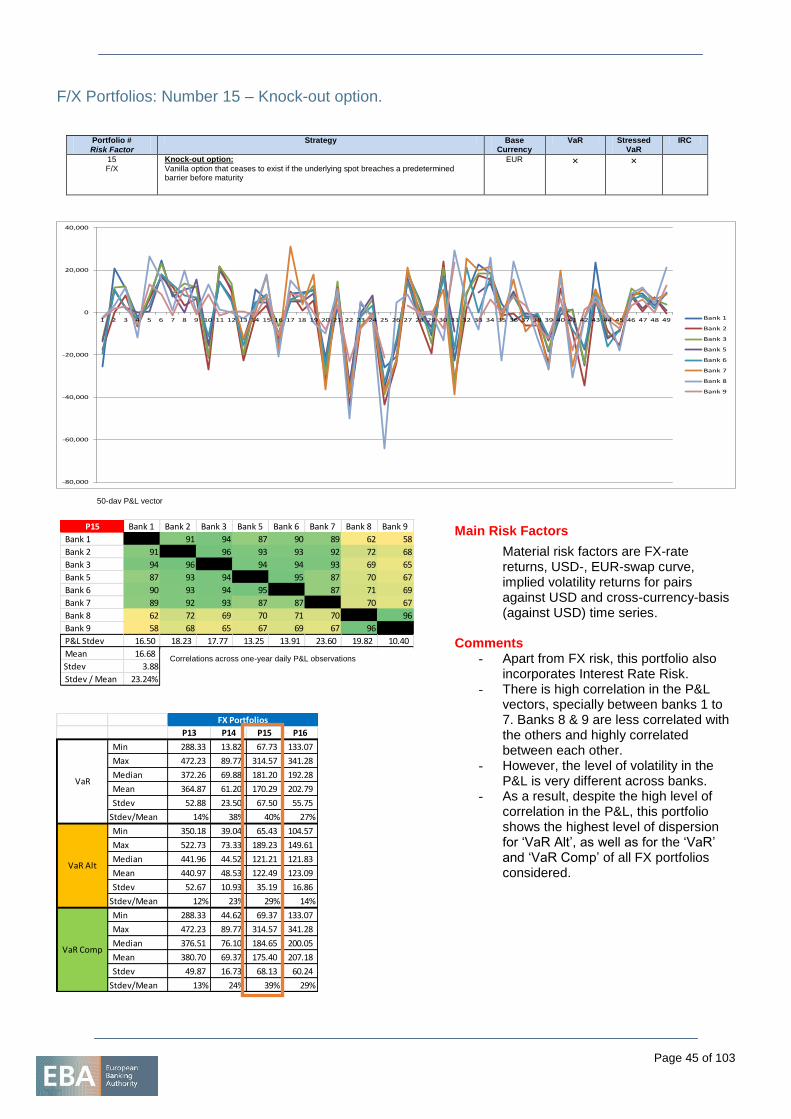
Page 45 of 103
F/X Portfolios: Number 15 – Knock-out option.
Portfolio #
Risk Factor
Strategy Base Currency
VaR Stressed VaR
IRC
15 F/X
Knock-out option:
Vanilla option that ceases to exist if the underlying spot breaches a predetermined barrier before maturity
EUR × ×
-80,000
-60,000
-40,000
-20,000
0
20,000
40,000
1 2 3 4 5 6 7 8 9 10 11 12 13 14 15 16 17 18 19 20 21 22 23 24 25 26 27 28 29 30 31 32 33 34 35 36 37 38 39 40 41 42 43 44 45 46 47 48 49 Bank 1
Bank 2
Bank 3
Bank 5
Bank 6
Bank 7
Bank 8
Bank 9
P15 Bank 1 Bank 2 Bank 3 Bank 5 Bank 6 Bank 7 Bank 8 Bank 9
Bank 1 91 94 87 90 89 62 58
Bank 2 91 96 93 93 92 72 68
Bank 3 94 96 94 94 93 69 65
Bank 5 87 93 94 95 87 70 67
Bank 6 90 93 94 95 87 71 69
Bank 7 89 92 93 87 87 70 67
Bank 8 62 72 69 70 71 70 96
Bank 9 58 68 65 67 69 67 96
P&L Stdev 16.50 18.23 17.77 13.25 13.91 23.60 19.82 10.40
Mean 16.68
Stdev 3.88
Stdev / Mean 23.24%
P13 P14 P15 P16
Min 288.33 13.82 67.73 133.07
Max 472.23 89.77 314.57 341.28
Median 372.26 69.88 181.20 192.28
Mean 364.87 61.20 170.29 202.79
Stdev 52.88 23.50 67.50 55.75
Stdev/Mean 14% 38% 40% 27%
Min 350.18 39.04 65.43 104.57
Max 522.73 73.33 189.23 149.61
Median 441.96 44.52 121.21 121.83
Mean 440.97 48.53 122.49 123.09
Stdev 52.67 10.93 35.19 16.86
Stdev/Mean 12% 23% 29% 14%
Min 288.33 44.62 69.37 133.07
Max 472.23 89.77 314.57 341.28
Median 376.51 76.10 184.65 200.05
Mean 380.70 69.37 175.40 207.18
Stdev 49.87 16.73 68.13 60.24
Stdev/Mean 13% 24% 39% 29%
VaR Alt
VaR Comp
FX Portfolios
VaR
Main Risk Factors
Material risk factors are FX-rate returns, USD-, EUR-swap curve, implied volatility returns for pairs against USD and cross-currency-basis (against USD) time series.
Comments - Apart from FX risk, this portfolio also
incorporates Interest Rate Risk. - There is high correlation in the P&L
vectors, specially between banks 1 to 7. Banks 8 & 9 are less correlated with the others and highly correlated between each other.
- However, the level of volatility in the P&L is very different across banks.
- As a result, despite the high level of correlation in the P&L, this portfolio shows the highest level of dispersion for ‘VaR Alt’, as well as for the ‘VaR’ and ‘VaR Comp’ of all FX portfolios considered.
50-day P&L vector
Correlations across one-year daily P&L observations
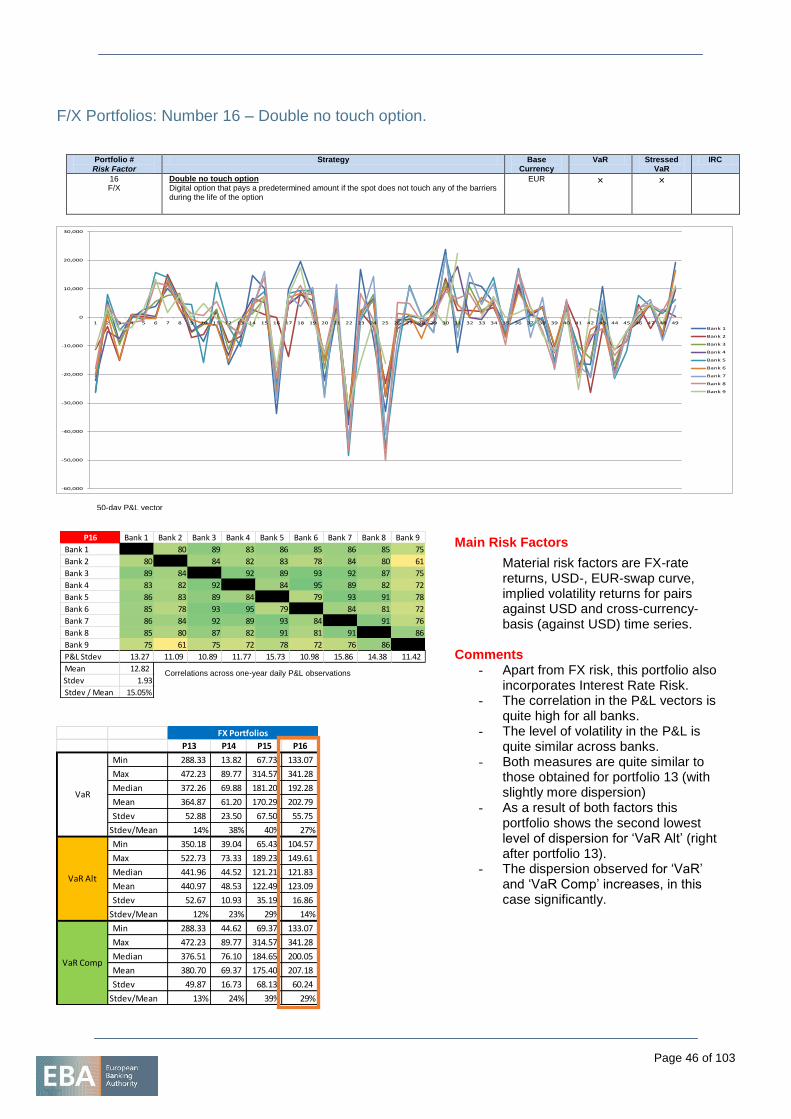
Page 46 of 103
F/X Portfolios: Number 16 – Double no touch option.
Portfolio #
Risk Factor
Strategy Base Currency
VaR Stressed VaR
IRC
16 F/X
Double no touch option Digital option that pays a predetermined amount if the spot does not touch any of the barriers during the life of the option
EUR × ×
-60,000
-50,000
-40,000
-30,000
-20,000
-10,000
0
10,000
20,000
30,000
1 2 3 4 5 6 7 8 9 10 11 12 13 14 15 16 17 18 19 20 21 22 23 24 25 26 27 28 29 30 31 32 33 34 35 36 37 38 39 40 41 42 43 44 45 46 47 48 49
Bank 1
Bank 2
Bank 3
Bank 4
Bank 5
Bank 6
Bank 7
Bank 8
Bank 9
P16 Bank 1 Bank 2 Bank 3 Bank 4 Bank 5 Bank 6 Bank 7 Bank 8 Bank 9
Bank 1 80 89 83 86 85 86 85 75
Bank 2 80 84 82 83 78 84 80 61
Bank 3 89 84 92 89 93 92 87 75
Bank 4 83 82 92 84 95 89 82 72
Bank 5 86 83 89 84 79 93 91 78
Bank 6 85 78 93 95 79 84 81 72
Bank 7 86 84 92 89 93 84 91 76
Bank 8 85 80 87 82 91 81 91 86
Bank 9 75 61 75 72 78 72 76 86
P&L Stdev 13.27 11.09 10.89 11.77 15.73 10.98 15.86 14.38 11.42
Mean 12.82
Stdev 1.93
Stdev / Mean 15.05%
P13 P14 P15 P16
Min 288.33 13.82 67.73 133.07
Max 472.23 89.77 314.57 341.28
Median 372.26 69.88 181.20 192.28
Mean 364.87 61.20 170.29 202.79
Stdev 52.88 23.50 67.50 55.75
Stdev/Mean 14% 38% 40% 27%
Min 350.18 39.04 65.43 104.57
Max 522.73 73.33 189.23 149.61
Median 441.96 44.52 121.21 121.83
Mean 440.97 48.53 122.49 123.09
Stdev 52.67 10.93 35.19 16.86
Stdev/Mean 12% 23% 29% 14%
Min 288.33 44.62 69.37 133.07
Max 472.23 89.77 314.57 341.28
Median 376.51 76.10 184.65 200.05
Mean 380.70 69.37 175.40 207.18
Stdev 49.87 16.73 68.13 60.24
Stdev/Mean 13% 24% 39% 29%
VaR Alt
VaR Comp
FX Portfolios
VaR
Main Risk Factors
Material risk factors are FX-rate returns, USD-, EUR-swap curve, implied volatility returns for pairs against USD and cross-currency-basis (against USD) time series.
Comments - Apart from FX risk, this portfolio also
incorporates Interest Rate Risk. - The correlation in the P&L vectors is
quite high for all banks. - The level of volatility in the P&L is
quite similar across banks. - Both measures are quite similar to
those obtained for portfolio 13 (with slightly more dispersion)
- As a result of both factors this portfolio shows the second lowest level of dispersion for ‘VaR Alt’ (right after portfolio 13).
- The dispersion observed for ‘VaR’ and ‘VaR Comp’ increases, in this case significantly.
50-day P&L vector
Correlations across one-year daily P&L observations
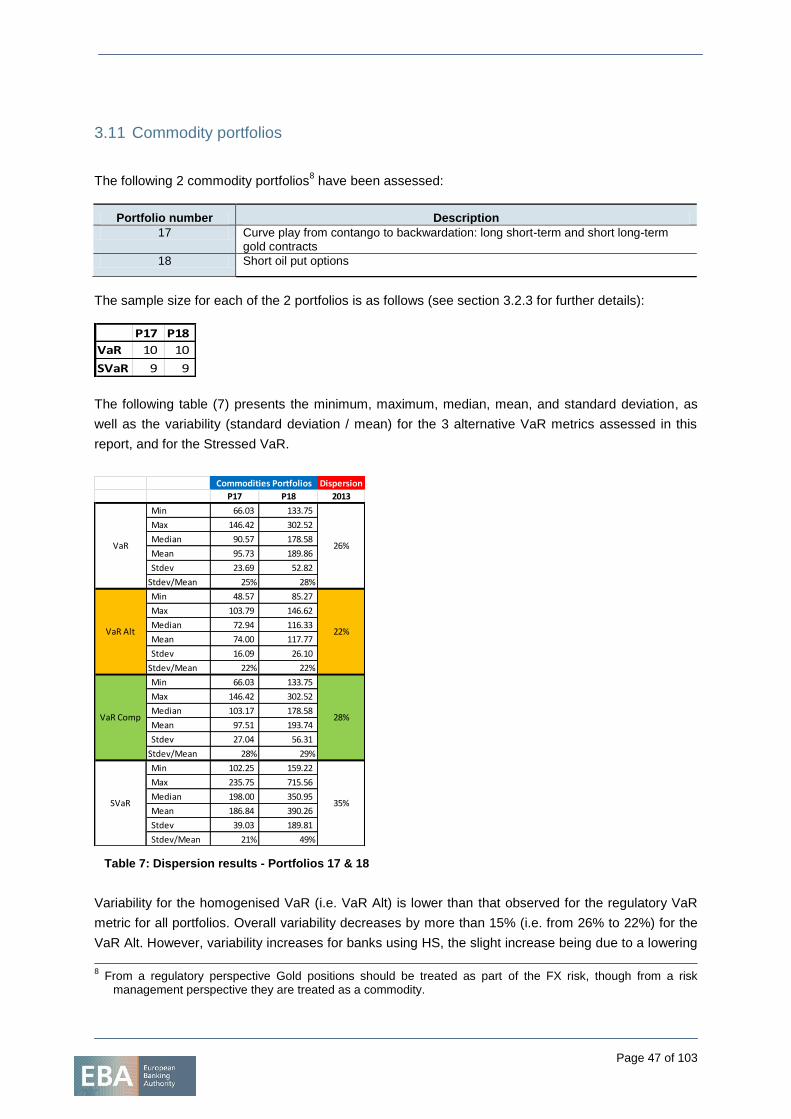
Page 47 of 103
Dispersion
P17 P18 2013
Min 66.03 133.75
Max 146.42 302.52
Median 90.57 178.58
Mean 95.73 189.86
Stdev 23.69 52.82
Stdev/Mean 25% 28%
Min 48.57 85.27
Max 103.79 146.62
Median 72.94 116.33
Mean 74.00 117.77
Stdev 16.09 26.10
Stdev/Mean 22% 22%
Min 66.03 133.75
Max 146.42 302.52
Median 103.17 178.58
Mean 97.51 193.74
Stdev 27.04 56.31
Stdev/Mean 28% 29%
Min 102.25 159.22
Max 235.75 715.56
Median 198.00 350.95
Mean 186.84 390.26
Stdev 39.03 189.81
Stdev/Mean 21% 49%
Commodities Portfolios
26%
22%
35%
28%VaR Comp
SVaR
VaR Alt
VaR
3.11 Commodity portfolios
The following 2 commodity portfolios
8 have been assessed:
Portfolio number Description
17 Curve play from contango to backwardation: long short-term and short long-term gold contracts
18 Short oil put options
The sample size for each of the 2 portfolios is as follows (see section 3.2.3 for further details):
The following table (7) presents the minimum, maximum, median, mean, and standard deviation, as
well as the variability (standard deviation / mean) for the 3 alternative VaR metrics assessed in this
report, and for the Stressed VaR.
Table 7: Dispersion results - Portfolios 17 & 18
Variability for the homogenised VaR (i.e. VaR Alt) is lower than that observed for the regulatory VaR
metric for all portfolios. Overall variability decreases by more than 15% (i.e. from 26% to 22%) for the
VaR Alt. However, variability increases for banks using HS, the slight increase being due to a lowering
8 From a regulatory perspective Gold positions should be treated as part of the FX risk, though from a risk
management perspective they are treated as a commodity.
P17 P18
VaR 10 10
SVaR 9 9
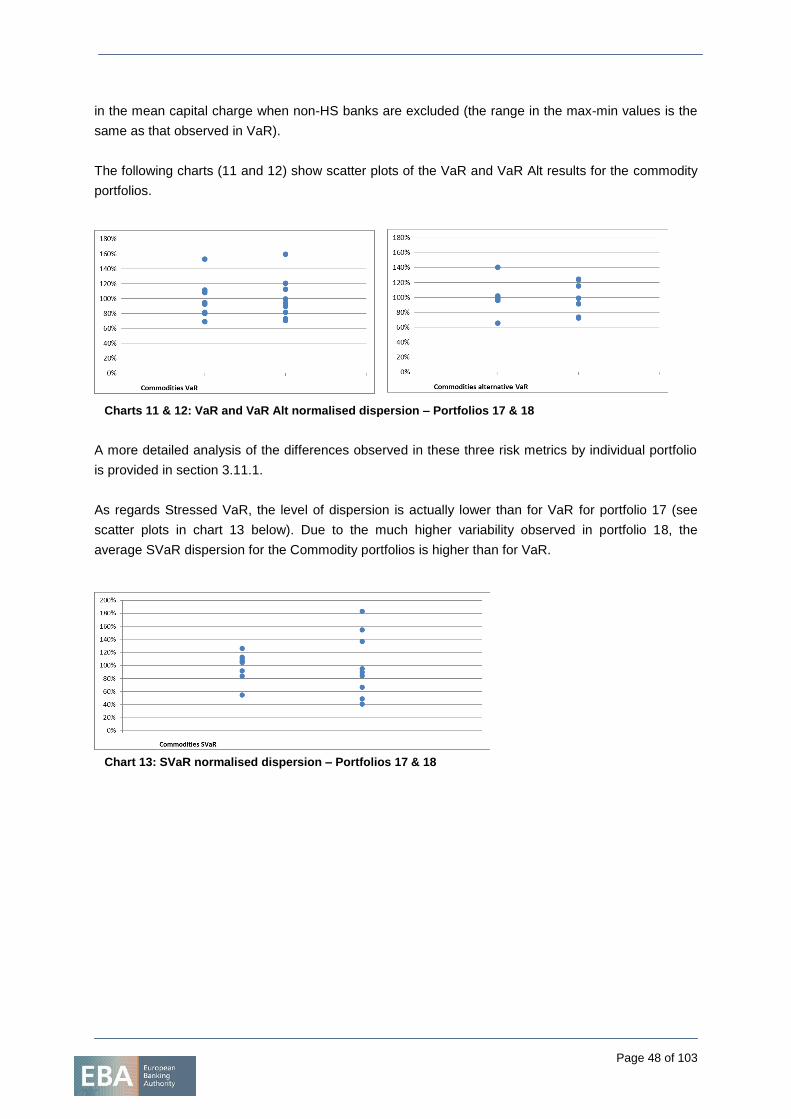
Page 48 of 103
in the mean capital charge when non-HS banks are excluded (the range in the max-min values is the
same as that observed in VaR).
The following charts (11 and 12) show scatter plots of the VaR and VaR Alt results for the commodity
portfolios.
Charts 11 & 12: VaR and VaR Alt normalised dispersion – Portfolios 17 & 18
A more detailed analysis of the differences observed in these three risk metrics by individual portfolio
is provided in section 3.11.1.
As regards Stressed VaR, the level of dispersion is actually lower than for VaR for portfolio 17 (see
scatter plots in chart 13 below). Due to the much higher variability observed in portfolio 18, the
average SVaR dispersion for the Commodity portfolios is higher than for VaR.
Chart 13: SVaR normalised dispersion – Portfolios 17 & 18
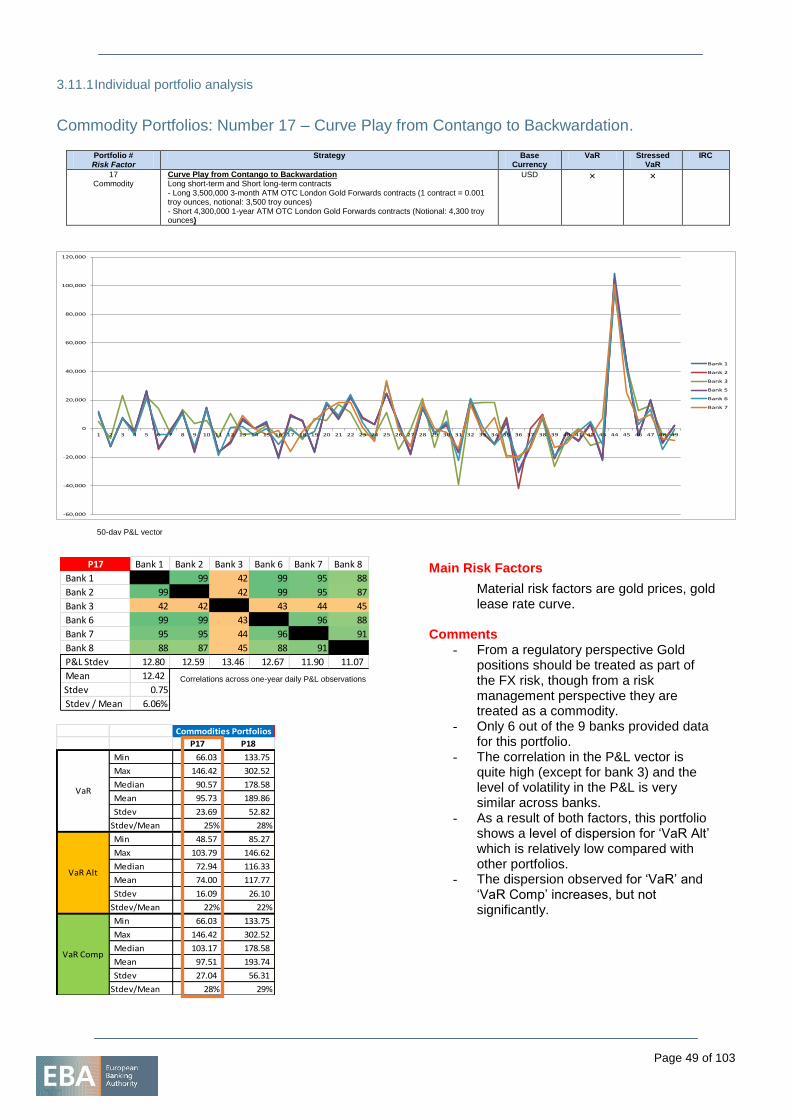
Page 49 of 103
3.11.1 Individual portfolio analysis
Commodity Portfolios: Number 17 – Curve Play from Contango to Backwardation.
Portfolio # Risk Factor
Strategy Base Currency
VaR Stressed VaR
IRC
17 Commodity
Curve Play from Contango to Backwardation Long short-term and Short long-term contracts - Long 3,500,000 3-month ATM OTC London Gold Forwards contracts (1 contract = 0.001 troy ounces, notional: 3,500 troy ounces) - Short 4,300,000 1-year ATM OTC London Gold Forwards contracts (Notional: 4,300 troy ounces)
USD × ×
-60,000
-40,000
-20,000
0
20,000
40,000
60,000
80,000
100,000
120,000
1 2 3 4 5 6 7 8 9 10 11 12 13 14 15 16 17 18 19 20 21 22 23 24 25 26 27 28 29 30 31 32 33 34 35 36 37 38 39 40 41 42 43 44 45 46 47 48 49
Bank 1
Bank 2
Bank 3
Bank 5
Bank 6
Bank 7
P17 Bank 1 Bank 2 Bank 3 Bank 6 Bank 7 Bank 8
Bank 1 99 42 99 95 88
Bank 2 99 42 99 95 87
Bank 3 42 42 43 44 45
Bank 6 99 99 43 96 88
Bank 7 95 95 44 96 91
Bank 8 88 87 45 88 91
P&L Stdev 12.80 12.59 13.46 12.67 11.90 11.07
Mean 12.42
Stdev 0.75
Stdev / Mean 6.06%
P17 P18
Min 66.03 133.75
Max 146.42 302.52
Median 90.57 178.58
Mean 95.73 189.86
Stdev 23.69 52.82
Stdev/Mean 25% 28%
Min 48.57 85.27
Max 103.79 146.62
Median 72.94 116.33
Mean 74.00 117.77
Stdev 16.09 26.10
Stdev/Mean 22% 22%
Min 66.03 133.75
Max 146.42 302.52
Median 103.17 178.58
Mean 97.51 193.74
Stdev 27.04 56.31
Stdev/Mean 28% 29%
Commodities Portfolios
VaR Comp
VaR Alt
VaR
Main Risk Factors
Material risk factors are gold prices, gold lease rate curve.
Comments - From a regulatory perspective Gold
positions should be treated as part of the FX risk, though from a risk management perspective they are treated as a commodity.
- Only 6 out of the 9 banks provided data for this portfolio.
- The correlation in the P&L vector is quite high (except for bank 3) and the level of volatility in the P&L is very similar across banks.
- As a result of both factors, this portfolio shows a level of dispersion for ‘VaR Alt’ which is relatively low compared with other portfolios.
- The dispersion observed for ‘VaR’ and ‘VaR Comp’ increases, but not significantly.
50-day P&L vector
Correlations across one-year daily P&L observations
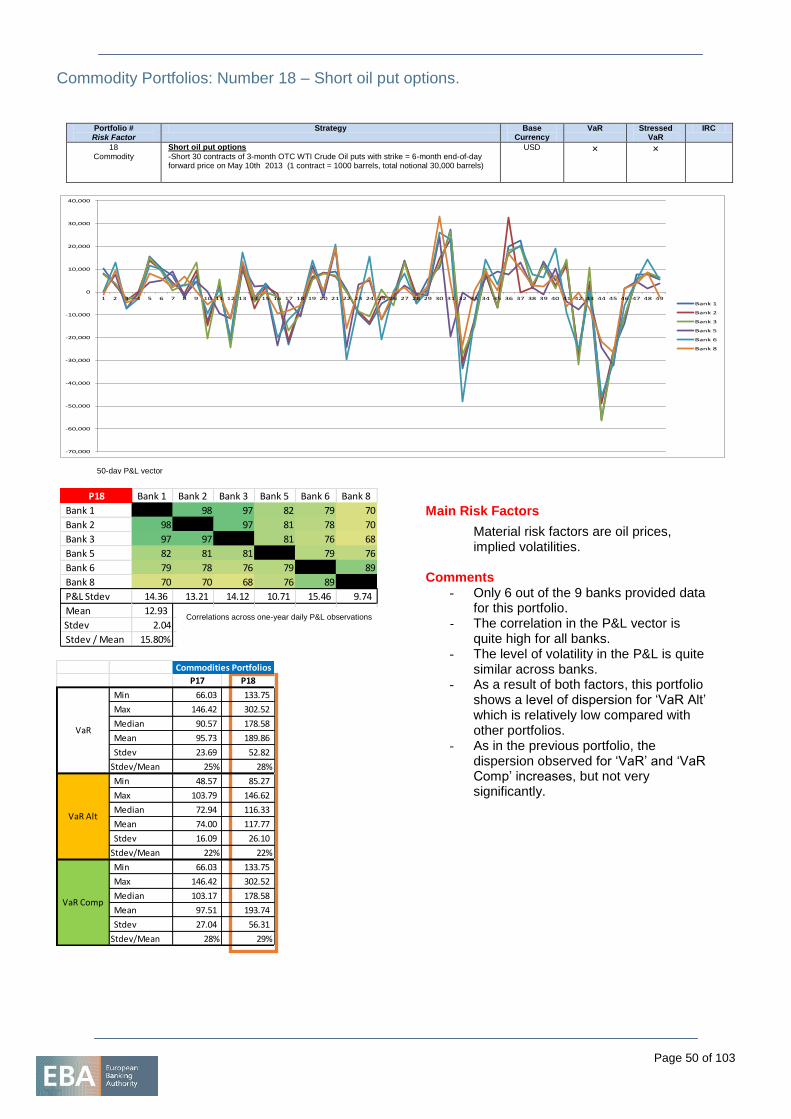
Page 50 of 103
Commodity Portfolios: Number 18 – Short oil put options.
Portfolio # Risk Factor
Strategy Base Currency
VaR Stressed VaR
IRC
18 Commodity
Short oil put options
-Short 30 contracts of 3-month OTC WTI Crude Oil puts with strike = 6-month end-of-day forward price on May 10th 2013 (1 contract = 1000 barrels, total notional 30,000 barrels)
USD × ×
-70,000
-60,000
-50,000
-40,000
-30,000
-20,000
-10,000
0
10,000
20,000
30,000
40,000
1 2 3 4 5 6 7 8 9 10 11 12 13 14 15 16 17 18 19 20 21 22 23 24 25 26 27 28 29 30 31 32 33 34 35 36 37 38 39 40 41 42 43 44 45 46 47 48 49Bank 1
Bank 2
Bank 3
Bank 5
Bank 6
Bank 8
P18 Bank 1 Bank 2 Bank 3 Bank 5 Bank 6 Bank 8
Bank 1 98 97 82 79 70
Bank 2 98 97 81 78 70
Bank 3 97 97 81 76 68
Bank 5 82 81 81 79 76
Bank 6 79 78 76 79 89
Bank 8 70 70 68 76 89
P&L Stdev 14.36 13.21 14.12 10.71 15.46 9.74
Mean 12.93
Stdev 2.04
Stdev / Mean 15.80%
Main Risk Factors
Material risk factors are oil prices, implied volatilities.
Comments - Only 6 out of the 9 banks provided data
for this portfolio. - The correlation in the P&L vector is
quite high for all banks. - The level of volatility in the P&L is quite
similar across banks. - As a result of both factors, this portfolio
shows a level of dispersion for ‘VaR Alt’ which is relatively low compared with other portfolios.
- As in the previous portfolio, the dispersion observed for ‘VaR’ and ‘VaR Comp’ increases, but not very significantly.
50-day P&L vector
Correlations across one-year daily P&L observations
P17 P18
Min 66.03 133.75
Max 146.42 302.52
Median 90.57 178.58
Mean 95.73 189.86
Stdev 23.69 52.82
Stdev/Mean 25% 28%
Min 48.57 85.27
Max 103.79 146.62
Median 72.94 116.33
Mean 74.00 117.77
Stdev 16.09 26.10
Stdev/Mean 22% 22%
Min 66.03 133.75
Max 146.42 302.52
Median 103.17 178.58
Mean 97.51 193.74
Stdev 27.04 56.31
Stdev/Mean 28% 29%
Commodities Portfolios
VaR Comp
VaR Alt
VaR
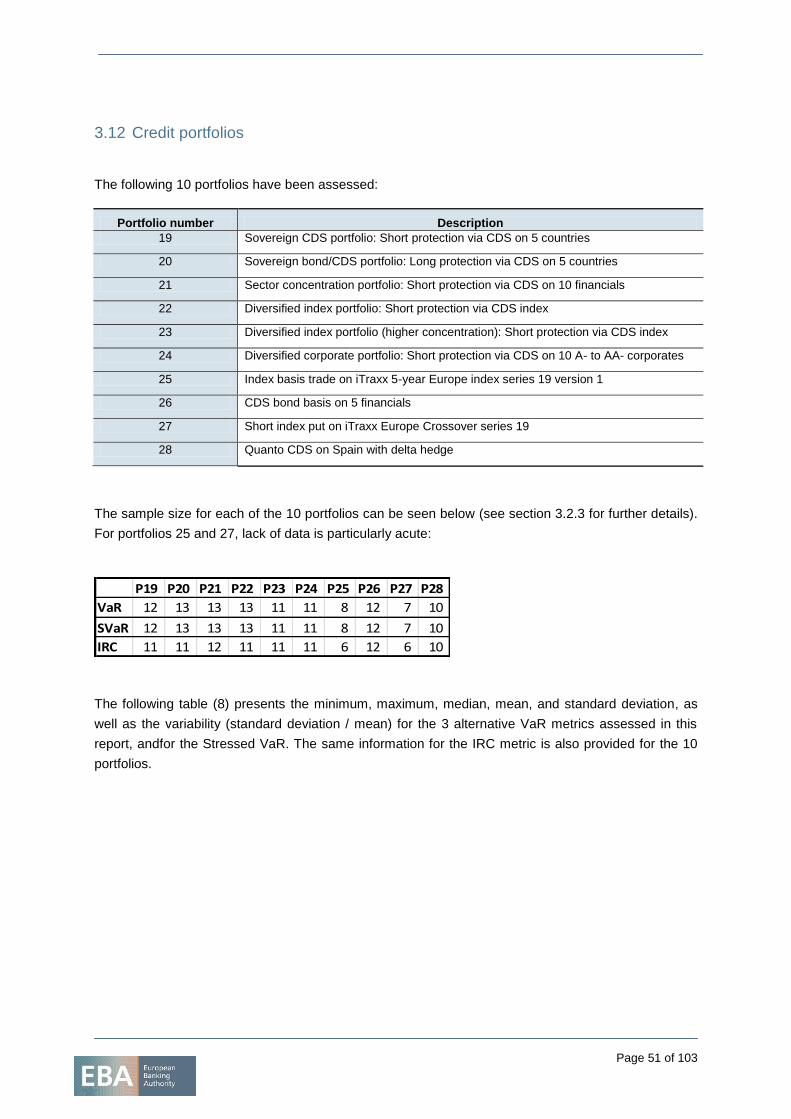
Page 51 of 103
3.12 Credit portfolios
The following 10 portfolios have been assessed:
Portfolio number Description
19 Sovereign CDS portfolio: Short protection via CDS on 5 countries
20 Sovereign bond/CDS portfolio: Long protection via CDS on 5 countries
21 Sector concentration portfolio: Short protection via CDS on 10 financials
22 Diversified index portfolio: Short protection via CDS index
23 Diversified index portfolio (higher concentration): Short protection via CDS index
24 Diversified corporate portfolio: Short protection via CDS on 10 A- to AA- corporates
25 Index basis trade on iTraxx 5-year Europe index series 19 version 1
26 CDS bond basis on 5 financials
27 Short index put on iTraxx Europe Crossover series 19
28 Quanto CDS on Spain with delta hedge
The sample size for each of the 10 portfolios can be seen below (see section 3.2.3 for further details).
For portfolios 25 and 27, lack of data is particularly acute:
The following table (8) presents the minimum, maximum, median, mean, and standard deviation, as
well as the variability (standard deviation / mean) for the 3 alternative VaR metrics assessed in this
report, andfor the Stressed VaR. The same information for the IRC metric is also provided for the 10
portfolios.
P19 P20 P21 P22 P23 P24 P25 P26 P27 P28
VaR 12 13 13 13 11 11 8 12 7 10
SVaR 12 13 13 13 11 11 8 12 7 10
IRC 11 11 12 11 11 11 6 12 6 10
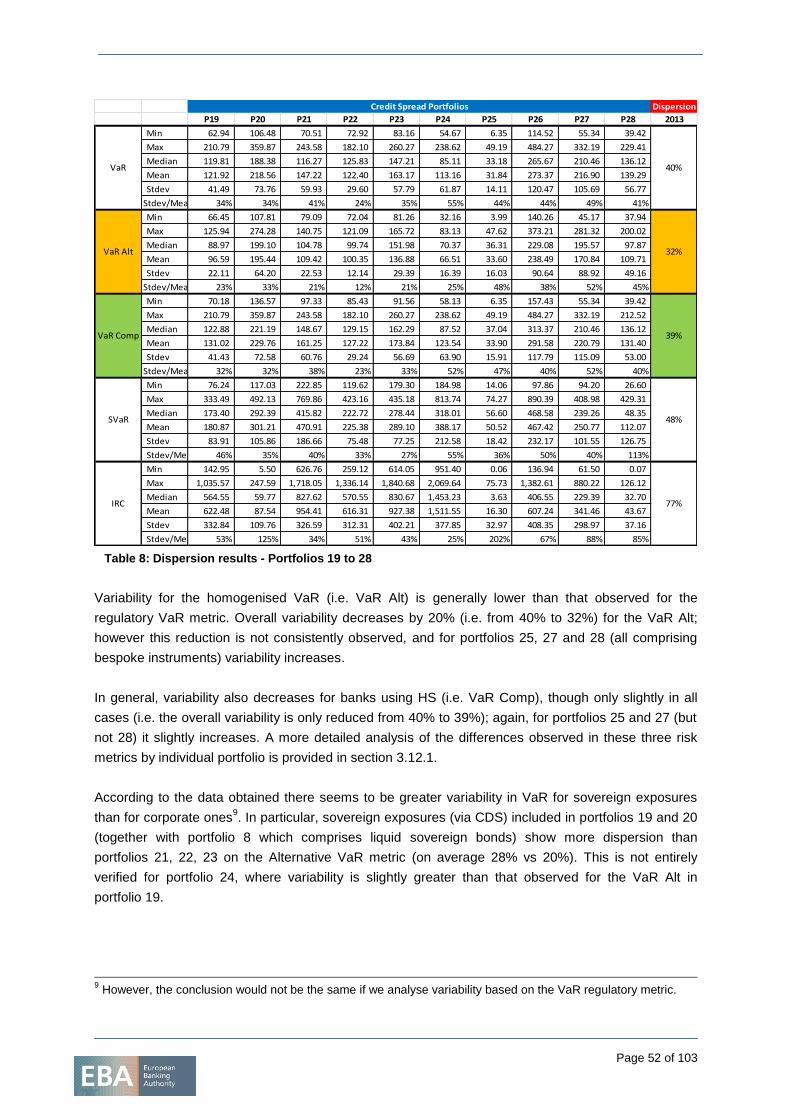
Page 52 of 103
Table 8: Dispersion results - Portfolios 19 to 28
Variability for the homogenised VaR (i.e. VaR Alt) is generally lower than that observed for the
regulatory VaR metric. Overall variability decreases by 20% (i.e. from 40% to 32%) for the VaR Alt;
however this reduction is not consistently observed, and for portfolios 25, 27 and 28 (all comprising
bespoke instruments) variability increases.
In general, variability also decreases for banks using HS (i.e. VaR Comp), though only slightly in all
cases (i.e. the overall variability is only reduced from 40% to 39%); again, for portfolios 25 and 27 (but
not 28) it slightly increases. A more detailed analysis of the differences observed in these three risk
metrics by individual portfolio is provided in section 3.12.1.
According to the data obtained there seems to be greater variability in VaR for sovereign exposures
than for corporate ones9. In particular, sovereign exposures (via CDS) included in portfolios 19 and 20
(together with portfolio 8 which comprises liquid sovereign bonds) show more dispersion than
portfolios 21, 22, 23 on the Alternative VaR metric (on average 28% vs 20%). This is not entirely
verified for portfolio 24, where variability is slightly greater than that observed for the VaR Alt in
portfolio 19.
9 However, the conclusion would not be the same if we analyse variability based on the VaR regulatory metric.
Dispersion
P19 P20 P21 P22 P23 P24 P25 P26 P27 P28 2013
Min 62.94 106.48 70.51 72.92 83.16 54.67 6.35 114.52 55.34 39.42
Max 210.79 359.87 243.58 182.10 260.27 238.62 49.19 484.27 332.19 229.41
Median 119.81 188.38 116.27 125.83 147.21 85.11 33.18 265.67 210.46 136.12
Mean 121.92 218.56 147.22 122.40 163.17 113.16 31.84 273.37 216.90 139.29
Stdev 41.49 73.76 59.93 29.60 57.79 61.87 14.11 120.47 105.69 56.77
Stdev/Mean 34% 34% 41% 24% 35% 55% 44% 44% 49% 41%
Min 66.45 107.81 79.09 72.04 81.26 32.16 3.99 140.26 45.17 37.94
Max 125.94 274.28 140.75 121.09 165.72 83.13 47.62 373.21 281.32 200.02
Median 88.97 199.10 104.78 99.74 151.98 70.37 36.31 229.08 195.57 97.87
Mean 96.59 195.44 109.42 100.35 136.88 66.51 33.60 238.49 170.84 109.71
Stdev 22.11 64.20 22.53 12.14 29.39 16.39 16.03 90.64 88.92 49.16
Stdev/Mean 23% 33% 21% 12% 21% 25% 48% 38% 52% 45%
Min 70.18 136.57 97.33 85.43 91.56 58.13 6.35 157.43 55.34 39.42
Max 210.79 359.87 243.58 182.10 260.27 238.62 49.19 484.27 332.19 212.52
Median 122.88 221.19 148.67 129.15 162.29 87.52 37.04 313.37 210.46 136.12
Mean 131.02 229.76 161.25 127.22 173.84 123.54 33.90 291.58 220.79 131.40
Stdev 41.43 72.58 60.76 29.24 56.69 63.90 15.91 117.79 115.09 53.00
Stdev/Mean 32% 32% 38% 23% 33% 52% 47% 40% 52% 40%
Min 76.24 117.03 222.85 119.62 179.30 184.98 14.06 97.86 94.20 26.60
Max 333.49 492.13 769.86 423.16 435.18 813.74 74.27 890.39 408.98 429.31
Median 173.40 292.39 415.82 222.72 278.44 318.01 56.60 468.58 239.26 48.35
Mean 180.87 301.21 470.91 225.38 289.10 388.17 50.52 467.42 250.77 112.07
Stdev 83.91 105.86 186.66 75.48 77.25 212.58 18.42 232.17 101.55 126.75
Stdev/Mean 46% 35% 40% 33% 27% 55% 36% 50% 40% 113%
Min 142.95 5.50 626.76 259.12 614.05 951.40 0.06 136.94 61.50 0.07
Max 1,035.57 247.59 1,718.05 1,336.14 1,840.68 2,069.64 75.73 1,382.61 880.22 126.12
Median 564.55 59.77 827.62 570.55 830.67 1,453.23 3.63 406.55 229.39 32.70
Mean 622.48 87.54 954.41 616.31 927.38 1,511.55 16.30 607.24 341.46 43.67
Stdev 332.84 109.76 326.59 312.31 402.21 377.85 32.97 408.35 298.97 37.16
Stdev/Mean 53% 125% 34% 51% 43% 25% 202% 67% 88% 85%
IRC 77%
Credit Spread Portfolios
40%
32%
VaR Comp 39%
48%SVaR
VaR Alt
VaR
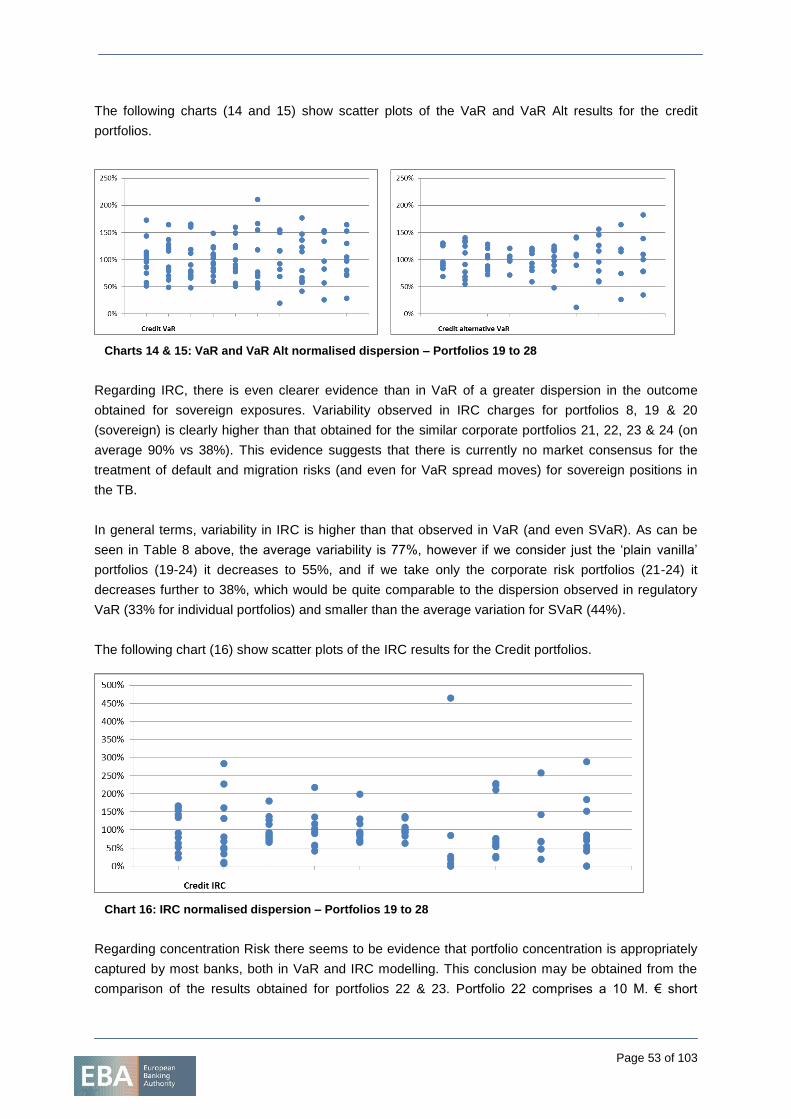
Page 53 of 103
The following charts (14 and 15) show scatter plots of the VaR and VaR Alt results for the credit
portfolios.
Charts 14 & 15: VaR and VaR Alt normalised dispersion – Portfolios 19 to 28
Regarding IRC, there is even clearer evidence than in VaR of a greater dispersion in the outcome
obtained for sovereign exposures. Variability observed in IRC charges for portfolios 8, 19 & 20
(sovereign) is clearly higher than that obtained for the similar corporate portfolios 21, 22, 23 & 24 (on
average 90% vs 38%). This evidence suggests that there is currently no market consensus for the
treatment of default and migration risks (and even for VaR spread moves) for sovereign positions in
the TB.
In general terms, variability in IRC is higher than that observed in VaR (and even SVaR). As can be
seen in Table 8 above, the average variability is 77%, however if we consider just the ‘plain vanilla’
portfolios (19-24) it decreases to 55%, and if we take only the corporate risk portfolios (21-24) it
decreases further to 38%, which would be quite comparable to the dispersion observed in regulatory
VaR (33% for individual portfolios) and smaller than the average variation for SVaR (44%).
The following chart (16) show scatter plots of the IRC results for the Credit portfolios.
Chart 16: IRC normalised dispersion – Portfolios 19 to 28
Regarding concentration Risk there seems to be evidence that portfolio concentration is appropriately
captured by most banks, both in VaR and IRC modelling. This conclusion may be obtained from the
comparison of the results obtained for portfolios 22 & 23. Portfolio 22 comprises a 10 M. € short
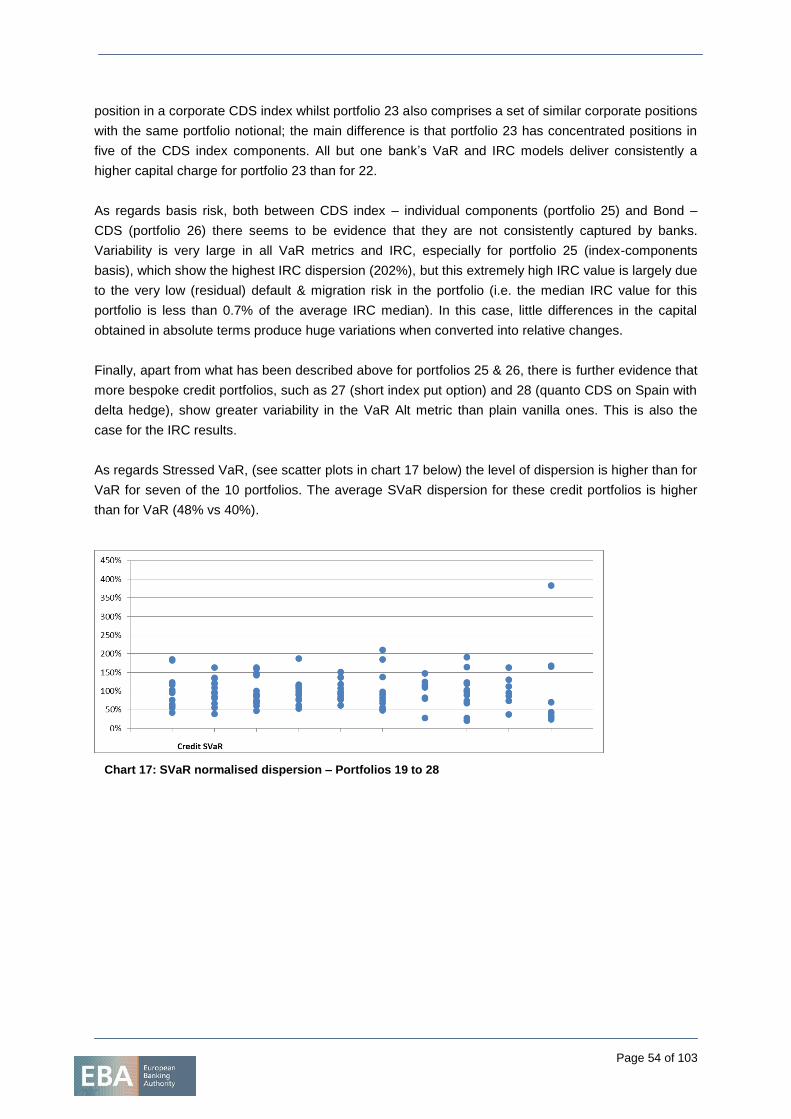
Page 54 of 103
position in a corporate CDS index whilst portfolio 23 also comprises a set of similar corporate positions
with the same portfolio notional; the main difference is that portfolio 23 has concentrated positions in
five of the CDS index components. All but one bank’s VaR and IRC models deliver consistently a
higher capital charge for portfolio 23 than for 22.
As regards basis risk, both between CDS index – individual components (portfolio 25) and Bond –
CDS (portfolio 26) there seems to be evidence that they are not consistently captured by banks.
Variability is very large in all VaR metrics and IRC, especially for portfolio 25 (index-components
basis), which show the highest IRC dispersion (202%), but this extremely high IRC value is largely due
to the very low (residual) default & migration risk in the portfolio (i.e. the median IRC value for this
portfolio is less than 0.7% of the average IRC median). In this case, little differences in the capital
obtained in absolute terms produce huge variations when converted into relative changes.
Finally, apart from what has been described above for portfolios 25 & 26, there is further evidence that
more bespoke credit portfolios, such as 27 (short index put option) and 28 (quanto CDS on Spain with
delta hedge), show greater variability in the VaR Alt metric than plain vanilla ones. This is also the
case for the IRC results.
As regards Stressed VaR, (see scatter plots in chart 17 below) the level of dispersion is higher than for
VaR for seven of the 10 portfolios. The average SVaR dispersion for these credit portfolios is higher
than for VaR (48% vs 40%).
Chart 17: SVaR normalised dispersion – Portfolios 19 to 28
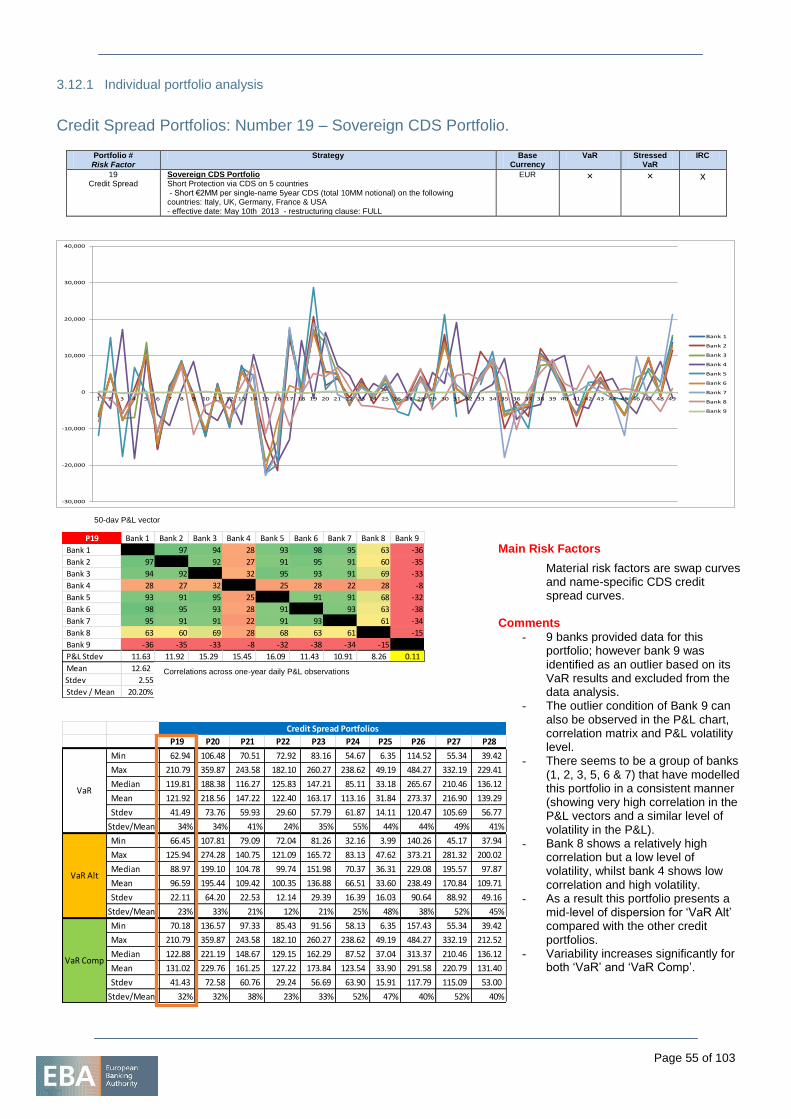
Page 55 of 103
3.12.1 Individual portfolio analysis
Credit Spread Portfolios: Number 19 – Sovereign CDS Portfolio.
Portfolio # Risk Factor
Strategy Base Currency
VaR Stressed VaR
IRC
19 Credit Spread
Sovereign CDS Portfolio Short Protection via CDS on 5 countries - Short €2MM per single-name 5year CDS (total 10MM notional) on the following countries: Italy, UK, Germany, France & USA - effective date: May 10th 2013 - restructuring clause: FULL
EUR × × x
-30,000
-20,000
-10,000
0
10,000
20,000
30,000
40,000
1 2 3 4 5 6 7 8 9 10 11 12 13 14 15 16 17 18 19 20 21 22 23 24 25 26 27 28 29 30 31 32 33 34 35 36 37 38 39 40 41 42 43 44 45 46 47 48 49
Bank 1
Bank 2
Bank 3
Bank 4
Bank 5
Bank 6
Bank 7
Bank 8
Bank 9
P19 Bank 1 Bank 2 Bank 3 Bank 4 Bank 5 Bank 6 Bank 7 Bank 8 Bank 9
Bank 1 97 94 28 93 98 95 63 -36
Bank 2 97 92 27 91 95 91 60 -35
Bank 3 94 92 32 95 93 91 69 -33
Bank 4 28 27 32 25 28 22 28 -8
Bank 5 93 91 95 25 91 91 68 -32
Bank 6 98 95 93 28 91 93 63 -38
Bank 7 95 91 91 22 91 93 61 -34
Bank 8 63 60 69 28 68 63 61 -15
Bank 9 -36 -35 -33 -8 -32 -38 -34 -15
P&L Stdev 11.63 11.92 15.29 15.45 16.09 11.43 10.91 8.26 0.11
Mean 12.62
Stdev 2.55
Stdev / Mean 20.20%
P19 P20 P21 P22 P23 P24 P25 P26 P27 P28
Min 62.94 106.48 70.51 72.92 83.16 54.67 6.35 114.52 55.34 39.42
Max 210.79 359.87 243.58 182.10 260.27 238.62 49.19 484.27 332.19 229.41
Median 119.81 188.38 116.27 125.83 147.21 85.11 33.18 265.67 210.46 136.12
Mean 121.92 218.56 147.22 122.40 163.17 113.16 31.84 273.37 216.90 139.29
Stdev 41.49 73.76 59.93 29.60 57.79 61.87 14.11 120.47 105.69 56.77
Stdev/Mean 34% 34% 41% 24% 35% 55% 44% 44% 49% 41%
Min 66.45 107.81 79.09 72.04 81.26 32.16 3.99 140.26 45.17 37.94
Max 125.94 274.28 140.75 121.09 165.72 83.13 47.62 373.21 281.32 200.02
Median 88.97 199.10 104.78 99.74 151.98 70.37 36.31 229.08 195.57 97.87
Mean 96.59 195.44 109.42 100.35 136.88 66.51 33.60 238.49 170.84 109.71
Stdev 22.11 64.20 22.53 12.14 29.39 16.39 16.03 90.64 88.92 49.16
Stdev/Mean 23% 33% 21% 12% 21% 25% 48% 38% 52% 45%
Min 70.18 136.57 97.33 85.43 91.56 58.13 6.35 157.43 55.34 39.42
Max 210.79 359.87 243.58 182.10 260.27 238.62 49.19 484.27 332.19 212.52
Median 122.88 221.19 148.67 129.15 162.29 87.52 37.04 313.37 210.46 136.12
Mean 131.02 229.76 161.25 127.22 173.84 123.54 33.90 291.58 220.79 131.40
Stdev 41.43 72.58 60.76 29.24 56.69 63.90 15.91 117.79 115.09 53.00
Stdev/Mean 32% 32% 38% 23% 33% 52% 47% 40% 52% 40%
Credit Spread Portfolios
VaR Comp
VaR Alt
VaR
Main Risk Factors
Material risk factors are swap curves and name-specific CDS credit spread curves.
Comments
- 9 banks provided data for this portfolio; however bank 9 was identified as an outlier based on its VaR results and excluded from the data analysis.
- The outlier condition of Bank 9 can also be observed in the P&L chart, correlation matrix and P&L volatility level.
- There seems to be a group of banks (1, 2, 3, 5, 6 & 7) that have modelled this portfolio in a consistent manner (showing very high correlation in the P&L vectors and a similar level of volatility in the P&L).
- Bank 8 shows a relatively high correlation but a low level of volatility, whilst bank 4 shows low correlation and high volatility.
- As a result this portfolio presents a mid-level of dispersion for ‘VaR Alt’ compared with the other credit portfolios.
- Variability increases significantly for both ‘VaR’ and ‘VaR Comp’.
50-day P&L vector
Correlations across one-year daily P&L observations
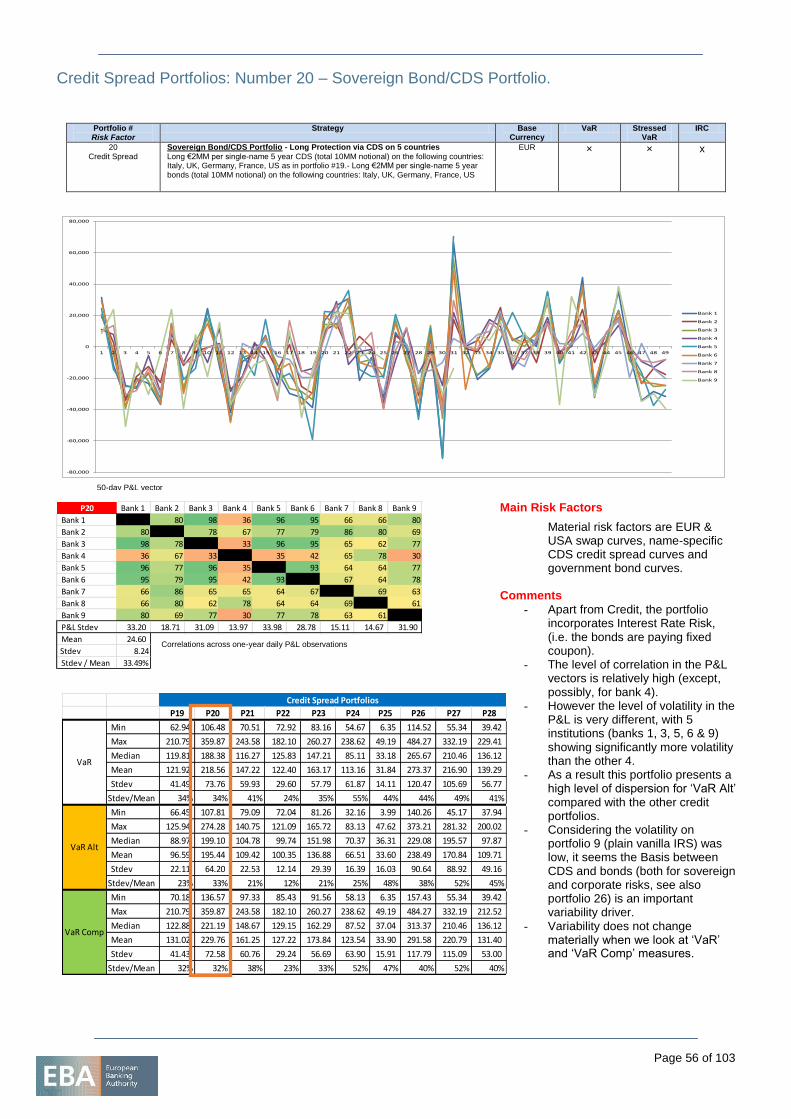
Page 56 of 103
Credit Spread Portfolios: Number 20 – Sovereign Bond/CDS Portfolio.
Portfolio # Risk Factor
Strategy Base Currency
VaR Stressed VaR
IRC
20 Credit Spread
Sovereign Bond/CDS Portfolio - Long Protection via CDS on 5 countries
Long €2MM per single-name 5 year CDS (total 10MM notional) on the following countries: Italy, UK, Germany, France, US as in portfolio #19.- Long €2MM per single-name 5 year bonds (total 10MM notional) on the following countries: Italy, UK, Germany, France, US
EUR × × x
-80,000
-60,000
-40,000
-20,000
0
20,000
40,000
60,000
80,000
1 2 3 4 5 6 7 8 9 10 11 12 13 14 15 16 17 18 19 20 21 22 23 24 25 26 27 28 29 30 31 32 33 34 35 36 37 38 39 40 41 42 43 44 45 46 47 48 49
Bank 1
Bank 2
Bank 3
Bank 4
Bank 5
Bank 6
Bank 7
Bank 8
Bank 9
P20 Bank 1 Bank 2 Bank 3 Bank 4 Bank 5 Bank 6 Bank 7 Bank 8 Bank 9
Bank 1 80 98 36 96 95 66 66 80
Bank 2 80 78 67 77 79 86 80 69
Bank 3 98 78 33 96 95 65 62 77
Bank 4 36 67 33 35 42 65 78 30
Bank 5 96 77 96 35 93 64 64 77
Bank 6 95 79 95 42 93 67 64 78
Bank 7 66 86 65 65 64 67 69 63
Bank 8 66 80 62 78 64 64 69 61
Bank 9 80 69 77 30 77 78 63 61
P&L Stdev 33.20 18.71 31.09 13.97 33.98 28.78 15.11 14.67 31.90
Mean 24.60
Stdev 8.24
Stdev / Mean 33.49%
P19 P20 P21 P22 P23 P24 P25 P26 P27 P28
Min 62.94 106.48 70.51 72.92 83.16 54.67 6.35 114.52 55.34 39.42
Max 210.79 359.87 243.58 182.10 260.27 238.62 49.19 484.27 332.19 229.41
Median 119.81 188.38 116.27 125.83 147.21 85.11 33.18 265.67 210.46 136.12
Mean 121.92 218.56 147.22 122.40 163.17 113.16 31.84 273.37 216.90 139.29
Stdev 41.49 73.76 59.93 29.60 57.79 61.87 14.11 120.47 105.69 56.77
Stdev/Mean 34% 34% 41% 24% 35% 55% 44% 44% 49% 41%
Min 66.45 107.81 79.09 72.04 81.26 32.16 3.99 140.26 45.17 37.94
Max 125.94 274.28 140.75 121.09 165.72 83.13 47.62 373.21 281.32 200.02
Median 88.97 199.10 104.78 99.74 151.98 70.37 36.31 229.08 195.57 97.87
Mean 96.59 195.44 109.42 100.35 136.88 66.51 33.60 238.49 170.84 109.71
Stdev 22.11 64.20 22.53 12.14 29.39 16.39 16.03 90.64 88.92 49.16
Stdev/Mean 23% 33% 21% 12% 21% 25% 48% 38% 52% 45%
Min 70.18 136.57 97.33 85.43 91.56 58.13 6.35 157.43 55.34 39.42
Max 210.79 359.87 243.58 182.10 260.27 238.62 49.19 484.27 332.19 212.52
Median 122.88 221.19 148.67 129.15 162.29 87.52 37.04 313.37 210.46 136.12
Mean 131.02 229.76 161.25 127.22 173.84 123.54 33.90 291.58 220.79 131.40
Stdev 41.43 72.58 60.76 29.24 56.69 63.90 15.91 117.79 115.09 53.00
Stdev/Mean 32% 32% 38% 23% 33% 52% 47% 40% 52% 40%
Credit Spread Portfolios
VaR Comp
VaR Alt
VaR
Main Risk Factors
Material risk factors are EUR & USA swap curves, name-specific CDS credit spread curves and government bond curves.
Comments
- Apart from Credit, the portfolio incorporates Interest Rate Risk, (i.e. the bonds are paying fixed coupon).
- The level of correlation in the P&L vectors is relatively high (except, possibly, for bank 4).
- However the level of volatility in the P&L is very different, with 5 institutions (banks 1, 3, 5, 6 & 9) showing significantly more volatility than the other 4.
- As a result this portfolio presents a high level of dispersion for ‘VaR Alt’ compared with the other credit portfolios.
- Considering the volatility on portfolio 9 (plain vanilla IRS) was low, it seems the Basis between CDS and bonds (both for sovereign and corporate risks, see also portfolio 26) is an important variability driver.
- Variability does not change materially when we look at ‘VaR’ and ‘VaR Comp’ measures.
50-day P&L vector
Correlations across one-year daily P&L observations
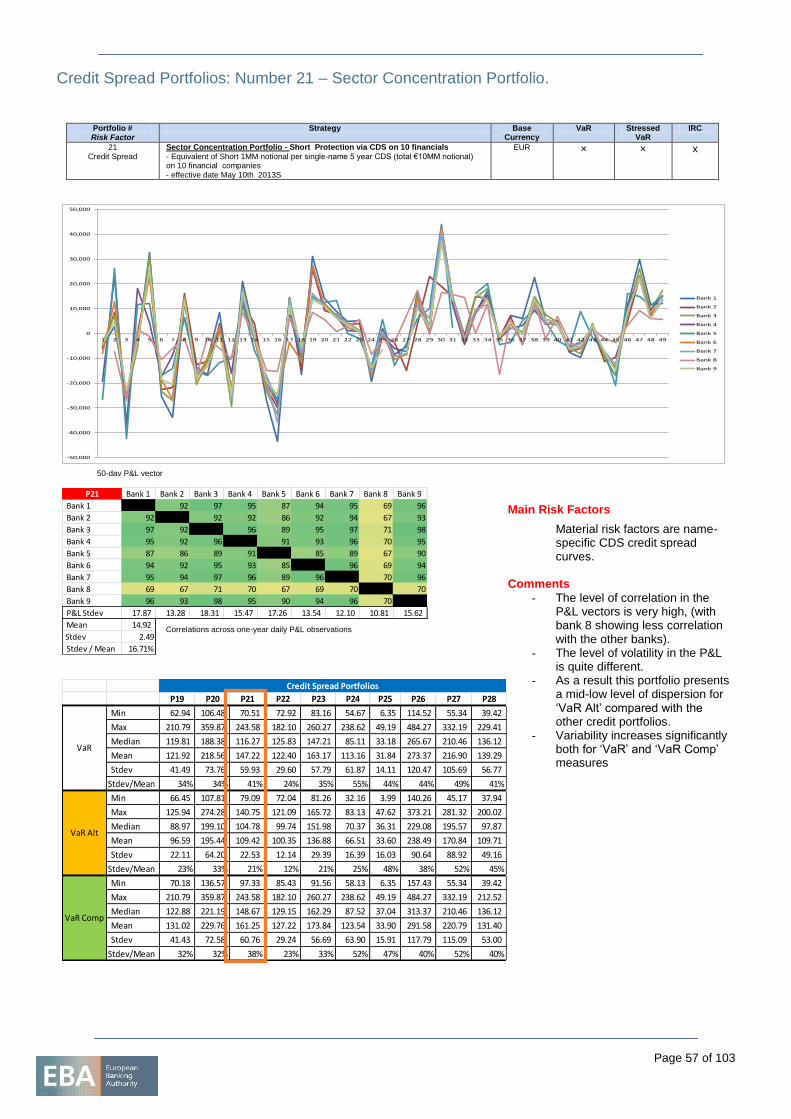
Page 57 of 103
Credit Spread Portfolios: Number 21 – Sector Concentration Portfolio.
Portfolio # Risk Factor
Strategy Base Currency
VaR Stressed VaR
IRC
21 Credit Spread
Sector Concentration Portfolio - Short Protection via CDS on 10 financials
- Equivalent of Short 1MM notional per single-name 5 year CDS (total €10MM notional) on 10 financial companies - effective date May 10th 2013S
EUR × × x
-50,000
-40,000
-30,000
-20,000
-10,000
0
10,000
20,000
30,000
40,000
50,000
1 2 3 4 5 6 7 8 9 10 11 12 13 14 15 16 17 18 19 20 21 22 23 24 25 26 27 28 29 30 31 32 33 34 35 36 37 38 39 40 41 42 43 44 45 46 47 48 49
Bank 1
Bank 2
Bank 3
Bank 4
Bank 5
Bank 6
Bank 7
Bank 8
Bank 9
P21 Bank 1 Bank 2 Bank 3 Bank 4 Bank 5 Bank 6 Bank 7 Bank 8 Bank 9
Bank 1 92 97 95 87 94 95 69 96
Bank 2 92 92 92 86 92 94 67 93
Bank 3 97 92 96 89 95 97 71 98
Bank 4 95 92 96 91 93 96 70 95
Bank 5 87 86 89 91 85 89 67 90
Bank 6 94 92 95 93 85 96 69 94
Bank 7 95 94 97 96 89 96 70 96
Bank 8 69 67 71 70 67 69 70 70
Bank 9 96 93 98 95 90 94 96 70
P&L Stdev 17.87 13.28 18.31 15.47 17.26 13.54 12.10 10.81 15.62
Mean 14.92
Stdev 2.49
Stdev / Mean 16.71%
P19 P20 P21 P22 P23 P24 P25 P26 P27 P28
Min 62.94 106.48 70.51 72.92 83.16 54.67 6.35 114.52 55.34 39.42
Max 210.79 359.87 243.58 182.10 260.27 238.62 49.19 484.27 332.19 229.41
Median 119.81 188.38 116.27 125.83 147.21 85.11 33.18 265.67 210.46 136.12
Mean 121.92 218.56 147.22 122.40 163.17 113.16 31.84 273.37 216.90 139.29
Stdev 41.49 73.76 59.93 29.60 57.79 61.87 14.11 120.47 105.69 56.77
Stdev/Mean 34% 34% 41% 24% 35% 55% 44% 44% 49% 41%
Min 66.45 107.81 79.09 72.04 81.26 32.16 3.99 140.26 45.17 37.94
Max 125.94 274.28 140.75 121.09 165.72 83.13 47.62 373.21 281.32 200.02
Median 88.97 199.10 104.78 99.74 151.98 70.37 36.31 229.08 195.57 97.87
Mean 96.59 195.44 109.42 100.35 136.88 66.51 33.60 238.49 170.84 109.71
Stdev 22.11 64.20 22.53 12.14 29.39 16.39 16.03 90.64 88.92 49.16
Stdev/Mean 23% 33% 21% 12% 21% 25% 48% 38% 52% 45%
Min 70.18 136.57 97.33 85.43 91.56 58.13 6.35 157.43 55.34 39.42
Max 210.79 359.87 243.58 182.10 260.27 238.62 49.19 484.27 332.19 212.52
Median 122.88 221.19 148.67 129.15 162.29 87.52 37.04 313.37 210.46 136.12
Mean 131.02 229.76 161.25 127.22 173.84 123.54 33.90 291.58 220.79 131.40
Stdev 41.43 72.58 60.76 29.24 56.69 63.90 15.91 117.79 115.09 53.00
Stdev/Mean 32% 32% 38% 23% 33% 52% 47% 40% 52% 40%
Credit Spread Portfolios
VaR Comp
VaR Alt
VaR
Main Risk Factors
Material risk factors are name-specific CDS credit spread curves.
Comments
- The level of correlation in the P&L vectors is very high, (with bank 8 showing less correlation with the other banks).
- The level of volatility in the P&L is quite different.
- As a result this portfolio presents a mid-low level of dispersion for ‘VaR Alt’ compared with the other credit portfolios.
- Variability increases significantly both for ‘VaR’ and ‘VaR Comp’ measures
50-day P&L vector
Correlations across one-year daily P&L observations
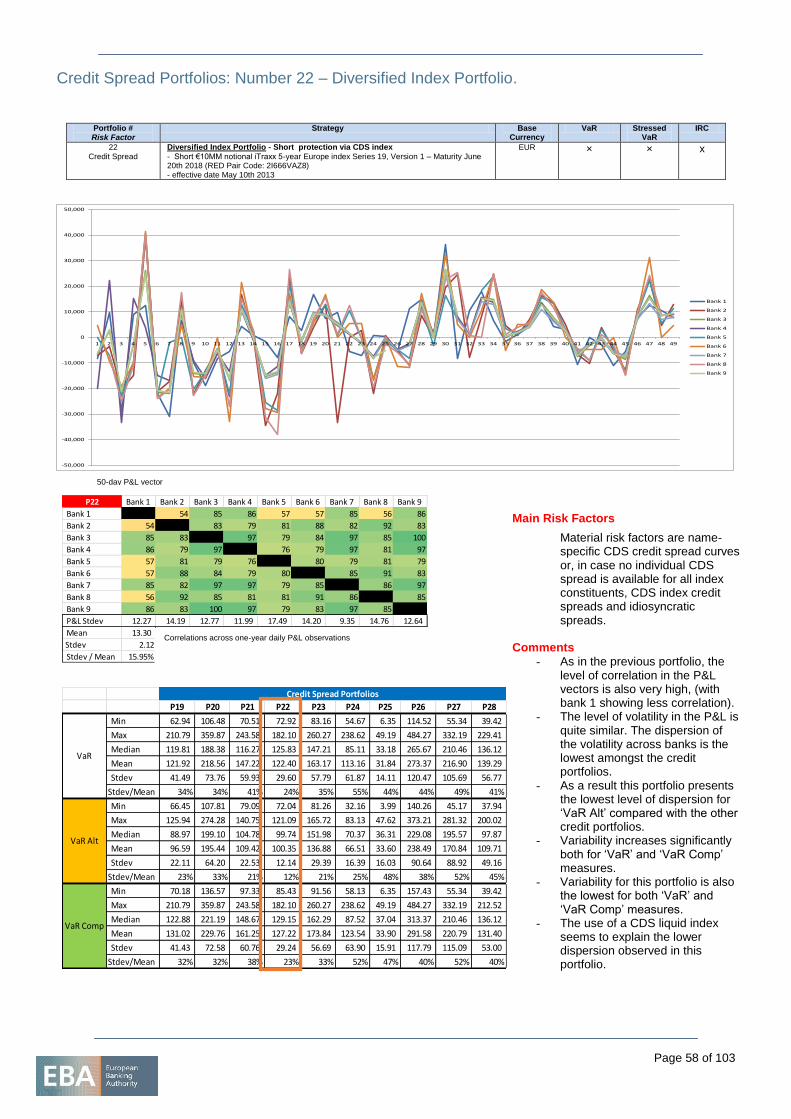
Page 58 of 103
Credit Spread Portfolios: Number 22 – Diversified Index Portfolio.
Portfolio # Risk Factor
Strategy Base Currency
VaR Stressed VaR
IRC
22 Credit Spread
Diversified Index Portfolio - Short protection via CDS index
- Short €10MM notional iTraxx 5-year Europe index Series 19, Version 1 – Maturity June 20th 2018 (RED Pair Code: 2I666VAZ8) - effective date May 10th 2013
EUR × × x
-50,000
-40,000
-30,000
-20,000
-10,000
0
10,000
20,000
30,000
40,000
50,000
1 2 3 4 5 6 7 8 9 10 11 12 13 14 15 16 17 18 19 20 21 22 23 24 25 26 27 28 29 30 31 32 33 34 35 36 37 38 39 40 41 42 43 44 45 46 47 48 49
Bank 1
Bank 2
Bank 3
Bank 4
Bank 5
Bank 6
Bank 7
Bank 8
Bank 9
P22 Bank 1 Bank 2 Bank 3 Bank 4 Bank 5 Bank 6 Bank 7 Bank 8 Bank 9
Bank 1 54 85 86 57 57 85 56 86
Bank 2 54 83 79 81 88 82 92 83
Bank 3 85 83 97 79 84 97 85 100
Bank 4 86 79 97 76 79 97 81 97
Bank 5 57 81 79 76 80 79 81 79
Bank 6 57 88 84 79 80 85 91 83
Bank 7 85 82 97 97 79 85 86 97
Bank 8 56 92 85 81 81 91 86 85
Bank 9 86 83 100 97 79 83 97 85
P&L Stdev 12.27 14.19 12.77 11.99 17.49 14.20 9.35 14.76 12.64
Mean 13.30
Stdev 2.12
Stdev / Mean 15.95%
P19 P20 P21 P22 P23 P24 P25 P26 P27 P28
Min 62.94 106.48 70.51 72.92 83.16 54.67 6.35 114.52 55.34 39.42
Max 210.79 359.87 243.58 182.10 260.27 238.62 49.19 484.27 332.19 229.41
Median 119.81 188.38 116.27 125.83 147.21 85.11 33.18 265.67 210.46 136.12
Mean 121.92 218.56 147.22 122.40 163.17 113.16 31.84 273.37 216.90 139.29
Stdev 41.49 73.76 59.93 29.60 57.79 61.87 14.11 120.47 105.69 56.77
Stdev/Mean 34% 34% 41% 24% 35% 55% 44% 44% 49% 41%
Min 66.45 107.81 79.09 72.04 81.26 32.16 3.99 140.26 45.17 37.94
Max 125.94 274.28 140.75 121.09 165.72 83.13 47.62 373.21 281.32 200.02
Median 88.97 199.10 104.78 99.74 151.98 70.37 36.31 229.08 195.57 97.87
Mean 96.59 195.44 109.42 100.35 136.88 66.51 33.60 238.49 170.84 109.71
Stdev 22.11 64.20 22.53 12.14 29.39 16.39 16.03 90.64 88.92 49.16
Stdev/Mean 23% 33% 21% 12% 21% 25% 48% 38% 52% 45%
Min 70.18 136.57 97.33 85.43 91.56 58.13 6.35 157.43 55.34 39.42
Max 210.79 359.87 243.58 182.10 260.27 238.62 49.19 484.27 332.19 212.52
Median 122.88 221.19 148.67 129.15 162.29 87.52 37.04 313.37 210.46 136.12
Mean 131.02 229.76 161.25 127.22 173.84 123.54 33.90 291.58 220.79 131.40
Stdev 41.43 72.58 60.76 29.24 56.69 63.90 15.91 117.79 115.09 53.00
Stdev/Mean 32% 32% 38% 23% 33% 52% 47% 40% 52% 40%
Credit Spread Portfolios
VaR Comp
VaR Alt
VaR
Main Risk Factors
Material risk factors are name-specific CDS credit spread curves or, in case no individual CDS spread is available for all index constituents, CDS index credit spreads and idiosyncratic spreads.
Comments
- As in the previous portfolio, the level of correlation in the P&L vectors is also very high, (with bank 1 showing less correlation).
- The level of volatility in the P&L is quite similar. The dispersion of the volatility across banks is the lowest amongst the credit portfolios.
- As a result this portfolio presents the lowest level of dispersion for ‘VaR Alt’ compared with the other credit portfolios.
- Variability increases significantly both for ‘VaR’ and ‘VaR Comp’ measures.
- Variability for this portfolio is also the lowest for both ‘VaR’ and ‘VaR Comp’ measures.
- The use of a CDS liquid index seems to explain the lower dispersion observed in this portfolio.
50-day P&L vector
Correlations across one-year daily P&L observations
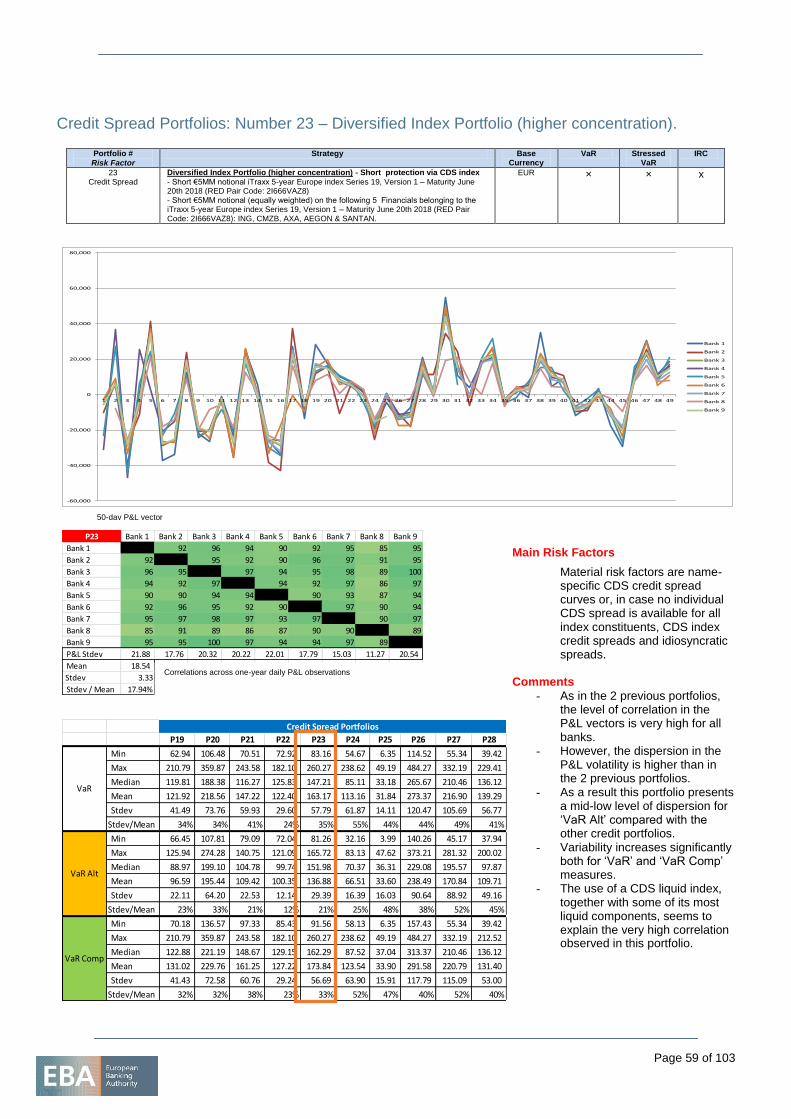
Page 59 of 103
Credit Spread Portfolios: Number 23 – Diversified Index Portfolio (higher concentration).
Portfolio #
Risk Factor
Strategy Base Currency
VaR Stressed VaR
IRC
23 Credit Spread
Diversified Index Portfolio (higher concentration) - Short protection via CDS index
- Short €5MM notional iTraxx 5-year Europe index Series 19, Version 1 – Maturity June 20th 2018 (RED Pair Code: 2I666VAZ8) - Short €5MM notional (equally weighted) on the following 5 Financials belonging to the iTraxx 5-year Europe index Series 19, Version 1 – Maturity June 20th 2018 (RED Pair Code: 2I666VAZ8): ING, CMZB, AXA, AEGON & SANTAN.
EUR × × x
-60,000
-40,000
-20,000
0
20,000
40,000
60,000
80,000
1 2 3 4 5 6 7 8 9 10 11 12 13 14 15 16 17 18 19 20 21 22 23 24 25 26 27 28 29 30 31 32 33 34 35 36 37 38 39 40 41 42 43 44 45 46 47 48 49
Bank 1
Bank 2
Bank 3
Bank 4
Bank 5
Bank 6
Bank 7
Bank 8
Bank 9
P23 Bank 1 Bank 2 Bank 3 Bank 4 Bank 5 Bank 6 Bank 7 Bank 8 Bank 9
Bank 1 92 96 94 90 92 95 85 95
Bank 2 92 95 92 90 96 97 91 95
Bank 3 96 95 97 94 95 98 89 100
Bank 4 94 92 97 94 92 97 86 97
Bank 5 90 90 94 94 90 93 87 94
Bank 6 92 96 95 92 90 97 90 94
Bank 7 95 97 98 97 93 97 90 97
Bank 8 85 91 89 86 87 90 90 89
Bank 9 95 95 100 97 94 94 97 89
P&L Stdev 21.88 17.76 20.32 20.22 22.01 17.79 15.03 11.27 20.54
Mean 18.54
Stdev 3.33
Stdev / Mean 17.94%
P19 P20 P21 P22 P23 P24 P25 P26 P27 P28
Min 62.94 106.48 70.51 72.92 83.16 54.67 6.35 114.52 55.34 39.42
Max 210.79 359.87 243.58 182.10 260.27 238.62 49.19 484.27 332.19 229.41
Median 119.81 188.38 116.27 125.83 147.21 85.11 33.18 265.67 210.46 136.12
Mean 121.92 218.56 147.22 122.40 163.17 113.16 31.84 273.37 216.90 139.29
Stdev 41.49 73.76 59.93 29.60 57.79 61.87 14.11 120.47 105.69 56.77
Stdev/Mean 34% 34% 41% 24% 35% 55% 44% 44% 49% 41%
Min 66.45 107.81 79.09 72.04 81.26 32.16 3.99 140.26 45.17 37.94
Max 125.94 274.28 140.75 121.09 165.72 83.13 47.62 373.21 281.32 200.02
Median 88.97 199.10 104.78 99.74 151.98 70.37 36.31 229.08 195.57 97.87
Mean 96.59 195.44 109.42 100.35 136.88 66.51 33.60 238.49 170.84 109.71
Stdev 22.11 64.20 22.53 12.14 29.39 16.39 16.03 90.64 88.92 49.16
Stdev/Mean 23% 33% 21% 12% 21% 25% 48% 38% 52% 45%
Min 70.18 136.57 97.33 85.43 91.56 58.13 6.35 157.43 55.34 39.42
Max 210.79 359.87 243.58 182.10 260.27 238.62 49.19 484.27 332.19 212.52
Median 122.88 221.19 148.67 129.15 162.29 87.52 37.04 313.37 210.46 136.12
Mean 131.02 229.76 161.25 127.22 173.84 123.54 33.90 291.58 220.79 131.40
Stdev 41.43 72.58 60.76 29.24 56.69 63.90 15.91 117.79 115.09 53.00
Stdev/Mean 32% 32% 38% 23% 33% 52% 47% 40% 52% 40%
Credit Spread Portfolios
VaR Comp
VaR Alt
VaR
Main Risk Factors
Material risk factors are name-specific CDS credit spread curves or, in case no individual CDS spread is available for all index constituents, CDS index credit spreads and idiosyncratic spreads.
Comments
- As in the 2 previous portfolios, the level of correlation in the P&L vectors is very high for all banks.
- However, the dispersion in the P&L volatility is higher than in the 2 previous portfolios.
- As a result this portfolio presents a mid-low level of dispersion for ‘VaR Alt’ compared with the other credit portfolios.
- Variability increases significantly both for ‘VaR’ and ‘VaR Comp’ measures.
- The use of a CDS liquid index, together with some of its most liquid components, seems to explain the very high correlation observed in this portfolio.
50-day P&L vector
Correlations across one-year daily P&L observations
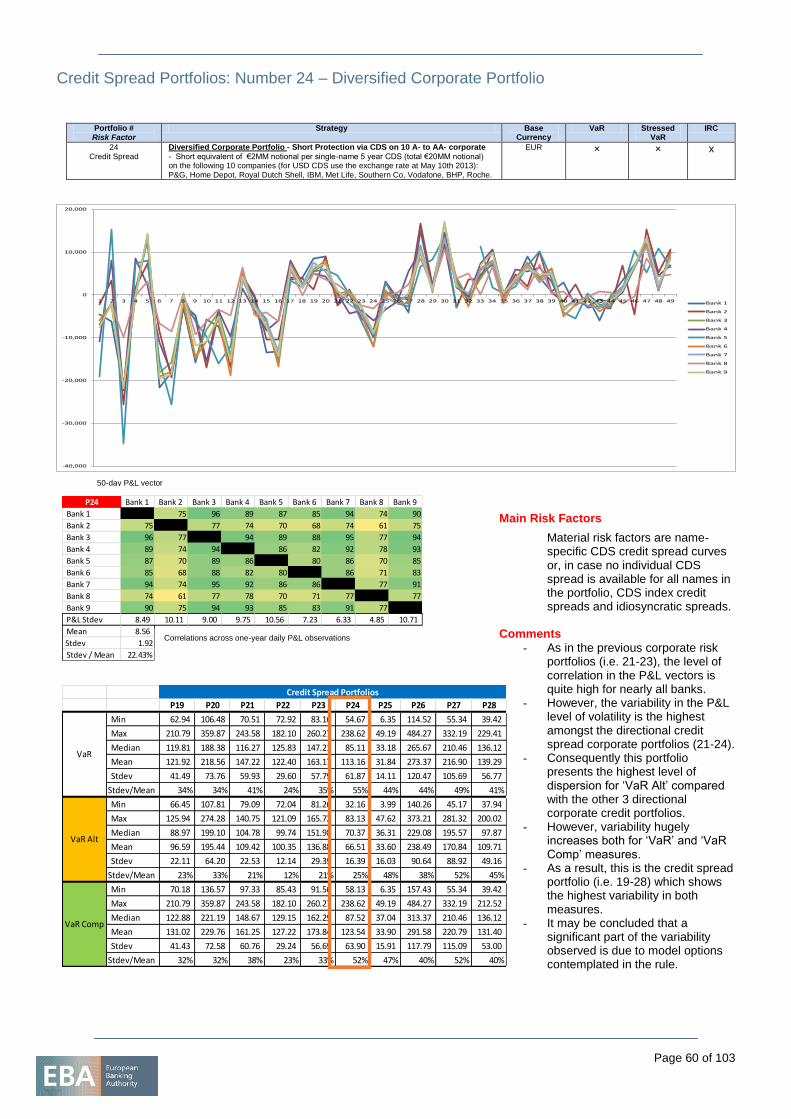
Page 60 of 103
Credit Spread Portfolios: Number 24 – Diversified Corporate Portfolio
Portfolio # Risk Factor
Strategy Base Currency
VaR Stressed VaR
IRC
24 Credit Spread
Diversified Corporate Portfolio - Short Protection via CDS on 10 A- to AA- corporate
- Short equivalent of €2MM notional per single-name 5 year CDS (total €20MM notional) on the following 10 companies (for USD CDS use the exchange rate at May 10th 2013): P&G, Home Depot, Royal Dutch Shell, IBM, Met Life, Southern Co, Vodafone, BHP, Roche.
EUR × × x
-40,000
-30,000
-20,000
-10,000
0
10,000
20,000
1 2 3 4 5 6 7 8 9 10 11 12 13 14 15 16 17 18 19 20 21 22 23 24 25 26 27 28 29 30 31 32 33 34 35 36 37 38 39 40 41 42 43 44 45 46 47 48 49 Bank 1
Bank 2
Bank 3
Bank 4
Bank 5
Bank 6
Bank 7
Bank 8
Bank 9
P24 Bank 1 Bank 2 Bank 3 Bank 4 Bank 5 Bank 6 Bank 7 Bank 8 Bank 9
Bank 1 75 96 89 87 85 94 74 90
Bank 2 75 77 74 70 68 74 61 75
Bank 3 96 77 94 89 88 95 77 94
Bank 4 89 74 94 86 82 92 78 93
Bank 5 87 70 89 86 80 86 70 85
Bank 6 85 68 88 82 80 86 71 83
Bank 7 94 74 95 92 86 86 77 91
Bank 8 74 61 77 78 70 71 77 77
Bank 9 90 75 94 93 85 83 91 77
P&L Stdev 8.49 10.11 9.00 9.75 10.56 7.23 6.33 4.85 10.71
Mean 8.56
Stdev 1.92
Stdev / Mean 22.43%
P19 P20 P21 P22 P23 P24 P25 P26 P27 P28
Min 62.94 106.48 70.51 72.92 83.16 54.67 6.35 114.52 55.34 39.42
Max 210.79 359.87 243.58 182.10 260.27 238.62 49.19 484.27 332.19 229.41
Median 119.81 188.38 116.27 125.83 147.21 85.11 33.18 265.67 210.46 136.12
Mean 121.92 218.56 147.22 122.40 163.17 113.16 31.84 273.37 216.90 139.29
Stdev 41.49 73.76 59.93 29.60 57.79 61.87 14.11 120.47 105.69 56.77
Stdev/Mean 34% 34% 41% 24% 35% 55% 44% 44% 49% 41%
Min 66.45 107.81 79.09 72.04 81.26 32.16 3.99 140.26 45.17 37.94
Max 125.94 274.28 140.75 121.09 165.72 83.13 47.62 373.21 281.32 200.02
Median 88.97 199.10 104.78 99.74 151.98 70.37 36.31 229.08 195.57 97.87
Mean 96.59 195.44 109.42 100.35 136.88 66.51 33.60 238.49 170.84 109.71
Stdev 22.11 64.20 22.53 12.14 29.39 16.39 16.03 90.64 88.92 49.16
Stdev/Mean 23% 33% 21% 12% 21% 25% 48% 38% 52% 45%
Min 70.18 136.57 97.33 85.43 91.56 58.13 6.35 157.43 55.34 39.42
Max 210.79 359.87 243.58 182.10 260.27 238.62 49.19 484.27 332.19 212.52
Median 122.88 221.19 148.67 129.15 162.29 87.52 37.04 313.37 210.46 136.12
Mean 131.02 229.76 161.25 127.22 173.84 123.54 33.90 291.58 220.79 131.40
Stdev 41.43 72.58 60.76 29.24 56.69 63.90 15.91 117.79 115.09 53.00
Stdev/Mean 32% 32% 38% 23% 33% 52% 47% 40% 52% 40%
Credit Spread Portfolios
VaR Comp
VaR Alt
VaR
Main Risk Factors
Material risk factors are name-specific CDS credit spread curves or, in case no individual CDS spread is available for all names in the portfolio, CDS index credit spreads and idiosyncratic spreads.
Comments
- As in the previous corporate risk portfolios (i.e. 21-23), the level of correlation in the P&L vectors is quite high for nearly all banks.
- However, the variability in the P&L level of volatility is the highest amongst the directional credit spread corporate portfolios (21-24).
- Consequently this portfolio presents the highest level of dispersion for ‘VaR Alt’ compared with the other 3 directional corporate credit portfolios.
- However, variability hugely increases both for ‘VaR’ and ‘VaR Comp’ measures.
- As a result, this is the credit spread portfolio (i.e. 19-28) which shows the highest variability in both measures.
- It may be concluded that a significant part of the variability observed is due to model options contemplated in the rule.
50-day P&L vector
Correlations across one-year daily P&L observations
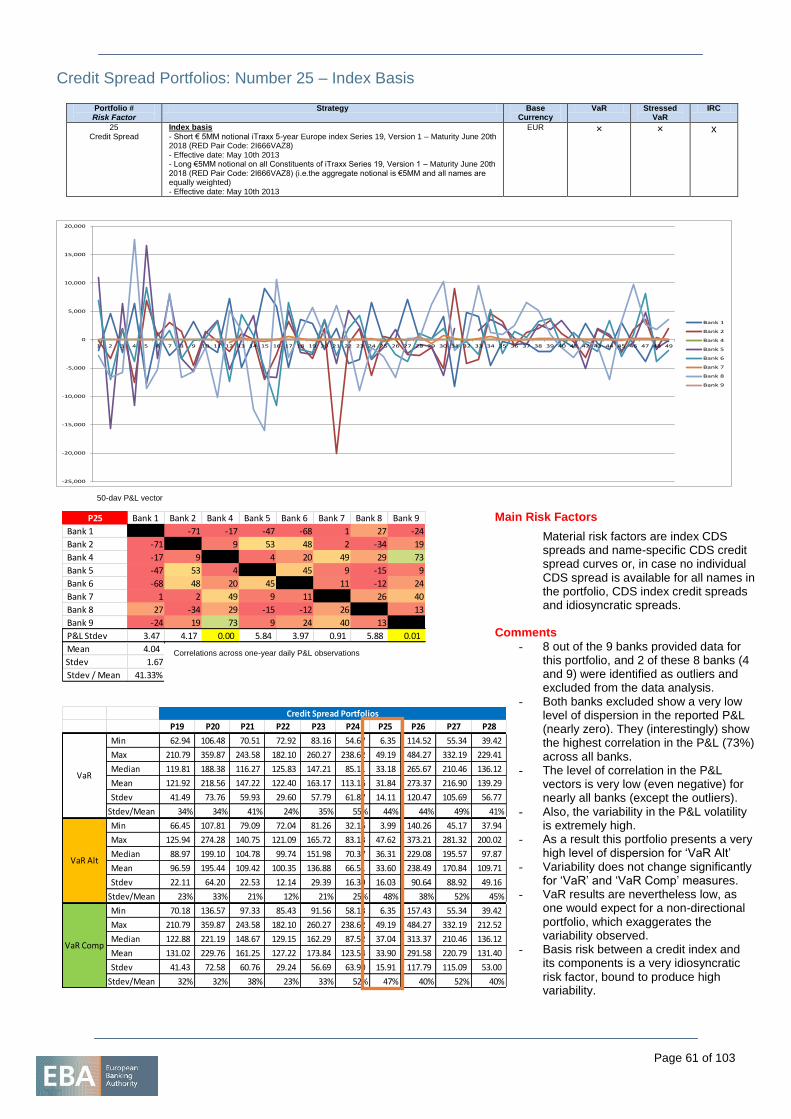
Page 61 of 103
Credit Spread Portfolios: Number 25 – Index Basis
Portfolio # Risk Factor
Strategy Base Currency
VaR Stressed VaR
IRC
25 Credit Spread
Index basis
- Short € 5MM notional iTraxx 5-year Europe index Series 19, Version 1 – Maturity June 20th 2018 (RED Pair Code: 2I666VAZ8) - Effective date: May 10th 2013 - Long €5MM notional on all Constituents of iTraxx Series 19, Version 1 – Maturity June 20th 2018 (RED Pair Code: 2I666VAZ8) (i.e.the aggregate notional is €5MM and all names are equally weighted) - Effective date: May 10th 2013
EUR × × x
-25,000
-20,000
-15,000
-10,000
-5,000
0
5,000
10,000
15,000
20,000
1 2 3 4 5 6 7 8 9 10 11 12 13 14 15 16 17 18 19 20 21 22 23 24 25 26 27 28 29 30 31 32 33 34 35 36 37 38 39 40 41 42 43 44 45 46 47 48 49
Bank 1
Bank 2
Bank 4
Bank 5
Bank 6
Bank 7
Bank 8
Bank 9
P25 Bank 1 Bank 2 Bank 4 Bank 5 Bank 6 Bank 7 Bank 8 Bank 9
Bank 1 -71 -17 -47 -68 1 27 -24
Bank 2 -71 9 53 48 2 -34 19
Bank 4 -17 9 4 20 49 29 73
Bank 5 -47 53 4 45 9 -15 9
Bank 6 -68 48 20 45 11 -12 24
Bank 7 1 2 49 9 11 26 40
Bank 8 27 -34 29 -15 -12 26 13
Bank 9 -24 19 73 9 24 40 13
P&L Stdev 3.47 4.17 0.00 5.84 3.97 0.91 5.88 0.01
Mean 4.04
Stdev 1.67
Stdev / Mean 41.33%
P19 P20 P21 P22 P23 P24 P25 P26 P27 P28
Min 62.94 106.48 70.51 72.92 83.16 54.67 6.35 114.52 55.34 39.42
Max 210.79 359.87 243.58 182.10 260.27 238.62 49.19 484.27 332.19 229.41
Median 119.81 188.38 116.27 125.83 147.21 85.11 33.18 265.67 210.46 136.12
Mean 121.92 218.56 147.22 122.40 163.17 113.16 31.84 273.37 216.90 139.29
Stdev 41.49 73.76 59.93 29.60 57.79 61.87 14.11 120.47 105.69 56.77
Stdev/Mean 34% 34% 41% 24% 35% 55% 44% 44% 49% 41%
Min 66.45 107.81 79.09 72.04 81.26 32.16 3.99 140.26 45.17 37.94
Max 125.94 274.28 140.75 121.09 165.72 83.13 47.62 373.21 281.32 200.02
Median 88.97 199.10 104.78 99.74 151.98 70.37 36.31 229.08 195.57 97.87
Mean 96.59 195.44 109.42 100.35 136.88 66.51 33.60 238.49 170.84 109.71
Stdev 22.11 64.20 22.53 12.14 29.39 16.39 16.03 90.64 88.92 49.16
Stdev/Mean 23% 33% 21% 12% 21% 25% 48% 38% 52% 45%
Min 70.18 136.57 97.33 85.43 91.56 58.13 6.35 157.43 55.34 39.42
Max 210.79 359.87 243.58 182.10 260.27 238.62 49.19 484.27 332.19 212.52
Median 122.88 221.19 148.67 129.15 162.29 87.52 37.04 313.37 210.46 136.12
Mean 131.02 229.76 161.25 127.22 173.84 123.54 33.90 291.58 220.79 131.40
Stdev 41.43 72.58 60.76 29.24 56.69 63.90 15.91 117.79 115.09 53.00
Stdev/Mean 32% 32% 38% 23% 33% 52% 47% 40% 52% 40%
Credit Spread Portfolios
VaR Comp
VaR Alt
VaR
Main Risk Factors
Material risk factors are index CDS spreads and name-specific CDS credit spread curves or, in case no individual CDS spread is available for all names in the portfolio, CDS index credit spreads and idiosyncratic spreads.
Comments
- 8 out of the 9 banks provided data for this portfolio, and 2 of these 8 banks (4 and 9) were identified as outliers and excluded from the data analysis.
- Both banks excluded show a very low level of dispersion in the reported P&L (nearly zero). They (interestingly) show the highest correlation in the P&L (73%) across all banks.
- The level of correlation in the P&L vectors is very low (even negative) for nearly all banks (except the outliers).
- Also, the variability in the P&L volatility is extremely high.
- As a result this portfolio presents a very high level of dispersion for ‘VaR Alt’
- Variability does not change significantly for ‘VaR’ and ‘VaR Comp’ measures.
- VaR results are nevertheless low, as one would expect for a non-directional portfolio, which exaggerates the variability observed.
- Basis risk between a credit index and its components is a very idiosyncratic risk factor, bound to produce high variability.
50-day P&L vector
Correlations across one-year daily P&L observations
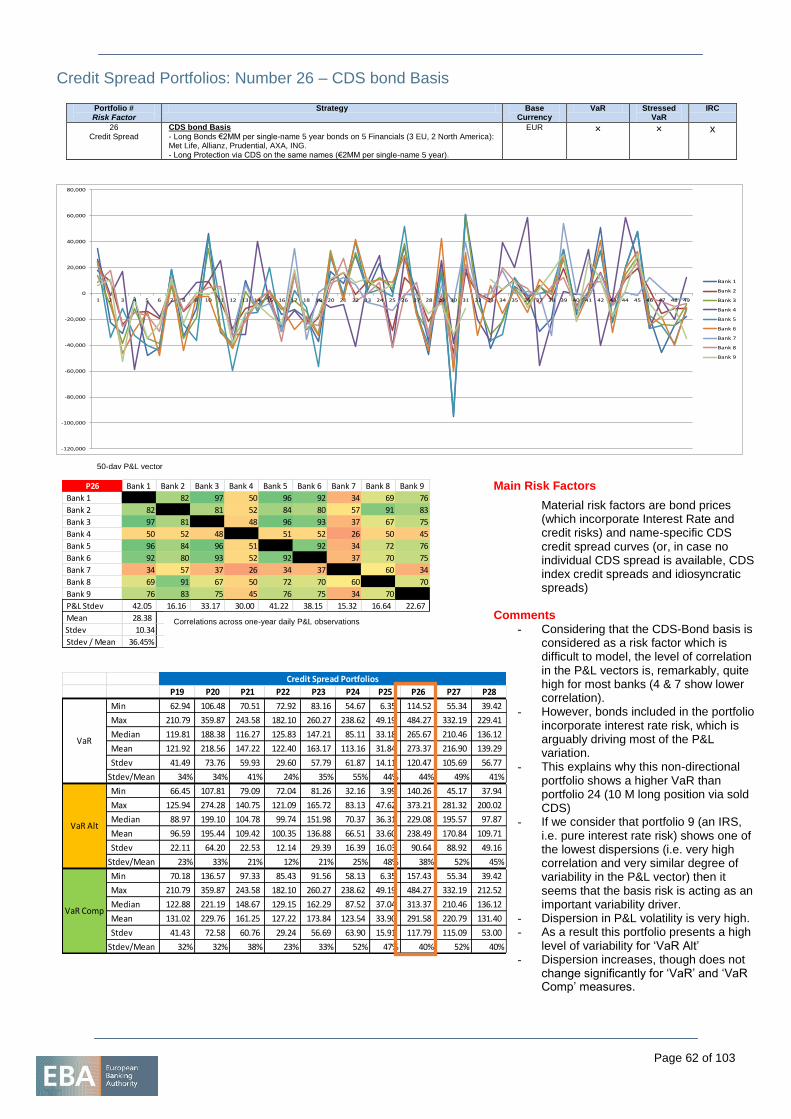
Page 62 of 103
Credit Spread Portfolios: Number 26 – CDS bond Basis
Portfolio # Risk Factor
Strategy Base Currency
VaR Stressed VaR
IRC
26 Credit Spread
CDS bond Basis
- Long Bonds €2MM per single-name 5 year bonds on 5 Financials (3 EU, 2 North America): Met Life, Allianz, Prudential, AXA, ING. - Long Protection via CDS on the same names (€2MM per single-name 5 year).
EUR × × x
-120,000
-100,000
-80,000
-60,000
-40,000
-20,000
0
20,000
40,000
60,000
80,000
1 2 3 4 5 6 7 8 9 10 11 12 13 14 15 16 17 18 19 20 21 22 23 24 25 26 27 28 29 30 31 32 33 34 35 36 37 38 39 40 41 42 43 44 45 46 47 48 49
Bank 1
Bank 2
Bank 3
Bank 4
Bank 5
Bank 6
Bank 7
Bank 8
Bank 9
P26 Bank 1 Bank 2 Bank 3 Bank 4 Bank 5 Bank 6 Bank 7 Bank 8 Bank 9
Bank 1 82 97 50 96 92 34 69 76
Bank 2 82 81 52 84 80 57 91 83
Bank 3 97 81 48 96 93 37 67 75
Bank 4 50 52 48 51 52 26 50 45
Bank 5 96 84 96 51 92 34 72 76
Bank 6 92 80 93 52 92 37 70 75
Bank 7 34 57 37 26 34 37 60 34
Bank 8 69 91 67 50 72 70 60 70
Bank 9 76 83 75 45 76 75 34 70
P&L Stdev 42.05 16.16 33.17 30.00 41.22 38.15 15.32 16.64 22.67
Mean 28.38
Stdev 10.34
Stdev / Mean 36.45%
P19 P20 P21 P22 P23 P24 P25 P26 P27 P28
Min 62.94 106.48 70.51 72.92 83.16 54.67 6.35 114.52 55.34 39.42
Max 210.79 359.87 243.58 182.10 260.27 238.62 49.19 484.27 332.19 229.41
Median 119.81 188.38 116.27 125.83 147.21 85.11 33.18 265.67 210.46 136.12
Mean 121.92 218.56 147.22 122.40 163.17 113.16 31.84 273.37 216.90 139.29
Stdev 41.49 73.76 59.93 29.60 57.79 61.87 14.11 120.47 105.69 56.77
Stdev/Mean 34% 34% 41% 24% 35% 55% 44% 44% 49% 41%
Min 66.45 107.81 79.09 72.04 81.26 32.16 3.99 140.26 45.17 37.94
Max 125.94 274.28 140.75 121.09 165.72 83.13 47.62 373.21 281.32 200.02
Median 88.97 199.10 104.78 99.74 151.98 70.37 36.31 229.08 195.57 97.87
Mean 96.59 195.44 109.42 100.35 136.88 66.51 33.60 238.49 170.84 109.71
Stdev 22.11 64.20 22.53 12.14 29.39 16.39 16.03 90.64 88.92 49.16
Stdev/Mean 23% 33% 21% 12% 21% 25% 48% 38% 52% 45%
Min 70.18 136.57 97.33 85.43 91.56 58.13 6.35 157.43 55.34 39.42
Max 210.79 359.87 243.58 182.10 260.27 238.62 49.19 484.27 332.19 212.52
Median 122.88 221.19 148.67 129.15 162.29 87.52 37.04 313.37 210.46 136.12
Mean 131.02 229.76 161.25 127.22 173.84 123.54 33.90 291.58 220.79 131.40
Stdev 41.43 72.58 60.76 29.24 56.69 63.90 15.91 117.79 115.09 53.00
Stdev/Mean 32% 32% 38% 23% 33% 52% 47% 40% 52% 40%
Credit Spread Portfolios
VaR Comp
VaR Alt
VaR
Main Risk Factors
Material risk factors are bond prices (which incorporate Interest Rate and credit risks) and name-specific CDS credit spread curves (or, in case no individual CDS spread is available, CDS index credit spreads and idiosyncratic spreads)
Comments
- Considering that the CDS-Bond basis is considered as a risk factor which is difficult to model, the level of correlation in the P&L vectors is, remarkably, quite high for most banks (4 & 7 show lower correlation).
- However, bonds included in the portfolio incorporate interest rate risk, which is arguably driving most of the P&L variation.
- This explains why this non-directional portfolio shows a higher VaR than portfolio 24 (10 M long position via sold CDS)
- If we consider that portfolio 9 (an IRS, i.e. pure interest rate risk) shows one of the lowest dispersions (i.e. very high correlation and very similar degree of variability in the P&L vector) then it seems that the basis risk is acting as an important variability driver.
- Dispersion in P&L volatility is very high. - As a result this portfolio presents a high
level of variability for ‘VaR Alt’ - Dispersion increases, though does not
change significantly for ‘VaR’ and ‘VaR Comp’ measures.
50-day P&L vector
Correlations across one-year daily P&L observations
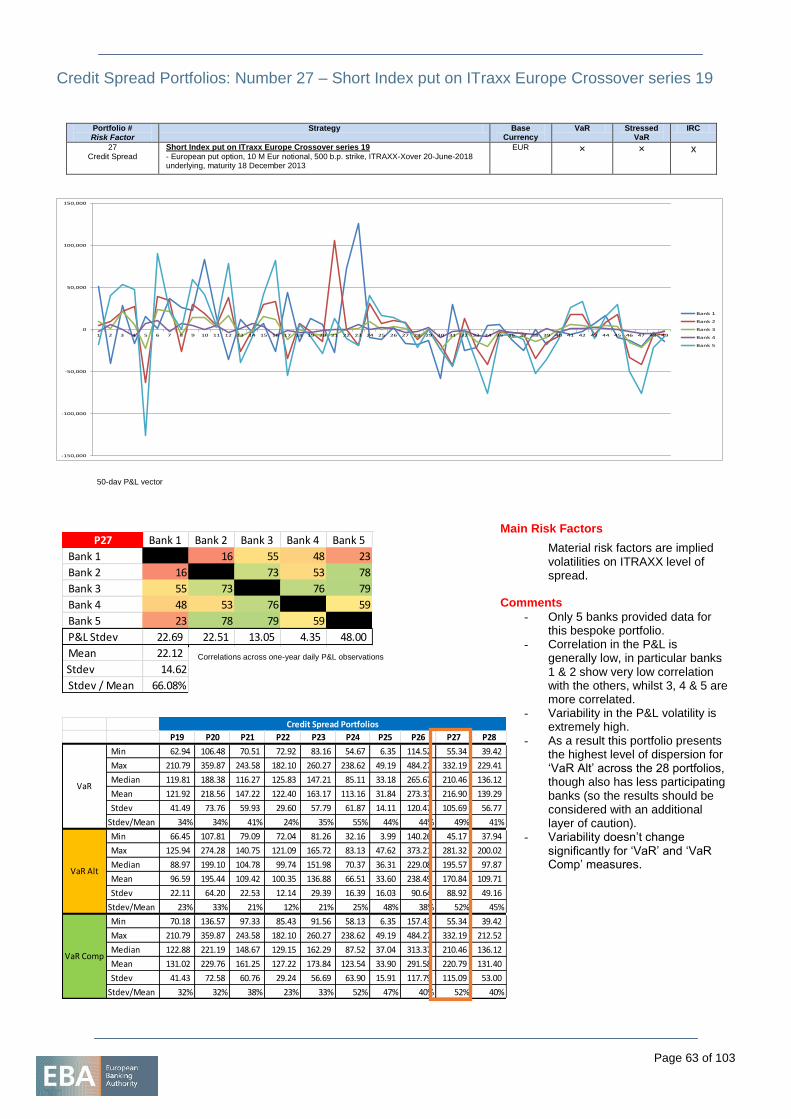
Page 63 of 103
Credit Spread Portfolios: Number 27 – Short Index put on ITraxx Europe Crossover series 19
Portfolio # Risk Factor
Strategy Base Currency
VaR Stressed VaR
IRC
27 Credit Spread
Short Index put on ITraxx Europe Crossover series 19
- European put option, 10 M Eur notional, 500 b.p. strike, ITRAXX-Xover 20-June-2018 underlying, maturity 18 December 2013
EUR × × x
-150,000
-100,000
-50,000
0
50,000
100,000
150,000
1 2 3 4 5 6 7 8 9 10 11 12 13 14 15 16 17 18 19 20 21 22 23 24 25 26 27 28 29 30 31 32 33 34 35 36 37 38 39 40 41 42 43 44 45 46 47 48 49
Bank 1
Bank 2
Bank 3
Bank 4
Bank 5
P27 Bank 1 Bank 2 Bank 3 Bank 4 Bank 5
Bank 1 16 55 48 23
Bank 2 16 73 53 78
Bank 3 55 73 76 79
Bank 4 48 53 76 59
Bank 5 23 78 79 59
P&L Stdev 22.69 22.51 13.05 4.35 48.00
Mean 22.12
Stdev 14.62
Stdev / Mean 66.08%
P19 P20 P21 P22 P23 P24 P25 P26 P27 P28
Min 62.94 106.48 70.51 72.92 83.16 54.67 6.35 114.52 55.34 39.42
Max 210.79 359.87 243.58 182.10 260.27 238.62 49.19 484.27 332.19 229.41
Median 119.81 188.38 116.27 125.83 147.21 85.11 33.18 265.67 210.46 136.12
Mean 121.92 218.56 147.22 122.40 163.17 113.16 31.84 273.37 216.90 139.29
Stdev 41.49 73.76 59.93 29.60 57.79 61.87 14.11 120.47 105.69 56.77
Stdev/Mean 34% 34% 41% 24% 35% 55% 44% 44% 49% 41%
Min 66.45 107.81 79.09 72.04 81.26 32.16 3.99 140.26 45.17 37.94
Max 125.94 274.28 140.75 121.09 165.72 83.13 47.62 373.21 281.32 200.02
Median 88.97 199.10 104.78 99.74 151.98 70.37 36.31 229.08 195.57 97.87
Mean 96.59 195.44 109.42 100.35 136.88 66.51 33.60 238.49 170.84 109.71
Stdev 22.11 64.20 22.53 12.14 29.39 16.39 16.03 90.64 88.92 49.16
Stdev/Mean 23% 33% 21% 12% 21% 25% 48% 38% 52% 45%
Min 70.18 136.57 97.33 85.43 91.56 58.13 6.35 157.43 55.34 39.42
Max 210.79 359.87 243.58 182.10 260.27 238.62 49.19 484.27 332.19 212.52
Median 122.88 221.19 148.67 129.15 162.29 87.52 37.04 313.37 210.46 136.12
Mean 131.02 229.76 161.25 127.22 173.84 123.54 33.90 291.58 220.79 131.40
Stdev 41.43 72.58 60.76 29.24 56.69 63.90 15.91 117.79 115.09 53.00
Stdev/Mean 32% 32% 38% 23% 33% 52% 47% 40% 52% 40%
Credit Spread Portfolios
VaR Comp
VaR Alt
VaR
Main Risk Factors
Material risk factors are implied volatilities on ITRAXX level of spread.
Comments
- Only 5 banks provided data for this bespoke portfolio.
- Correlation in the P&L is generally low, in particular banks 1 & 2 show very low correlation with the others, whilst 3, 4 & 5 are more correlated.
- Variability in the P&L volatility is extremely high.
- As a result this portfolio presents the highest level of dispersion for ‘VaR Alt’ across the 28 portfolios, though also has less participating banks (so the results should be considered with an additional layer of caution).
- Variability doesn’t change significantly for ‘VaR’ and ‘VaR Comp’ measures.
50-day P&L vector
Correlations across one-year daily P&L observations
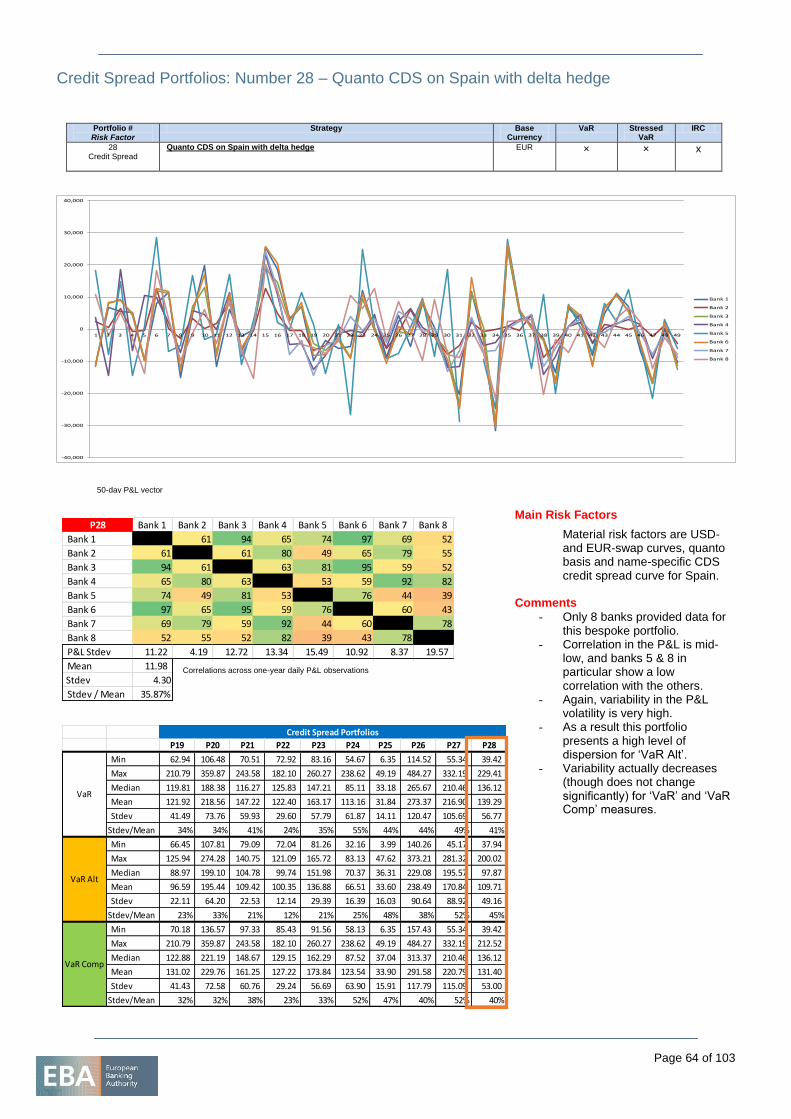
Page 64 of 103
Credit Spread Portfolios: Number 28 – Quanto CDS on Spain with delta hedge
Portfolio # Risk Factor
Strategy Base Currency
VaR Stressed VaR
IRC
28 Credit Spread
Quanto CDS on Spain with delta hedge EUR × × x
-40,000
-30,000
-20,000
-10,000
0
10,000
20,000
30,000
40,000
1 2 3 4 5 6 7 8 9 10 11 12 13 14 15 16 17 18 19 20 21 22 23 24 25 26 27 28 29 30 31 32 33 34 35 36 37 38 39 40 41 42 43 44 45 46 47 48 49
Bank 1
Bank 2
Bank 3
Bank 4
Bank 5
Bank 6
Bank 7
Bank 8
P28 Bank 1 Bank 2 Bank 3 Bank 4 Bank 5 Bank 6 Bank 7 Bank 8
Bank 1 61 94 65 74 97 69 52
Bank 2 61 61 80 49 65 79 55
Bank 3 94 61 63 81 95 59 52
Bank 4 65 80 63 53 59 92 82
Bank 5 74 49 81 53 76 44 39
Bank 6 97 65 95 59 76 60 43
Bank 7 69 79 59 92 44 60 78
Bank 8 52 55 52 82 39 43 78
P&L Stdev 11.22 4.19 12.72 13.34 15.49 10.92 8.37 19.57
Mean 11.98
Stdev 4.30
Stdev / Mean 35.87%
P19 P20 P21 P22 P23 P24 P25 P26 P27 P28
Min 62.94 106.48 70.51 72.92 83.16 54.67 6.35 114.52 55.34 39.42
Max 210.79 359.87 243.58 182.10 260.27 238.62 49.19 484.27 332.19 229.41
Median 119.81 188.38 116.27 125.83 147.21 85.11 33.18 265.67 210.46 136.12
Mean 121.92 218.56 147.22 122.40 163.17 113.16 31.84 273.37 216.90 139.29
Stdev 41.49 73.76 59.93 29.60 57.79 61.87 14.11 120.47 105.69 56.77
Stdev/Mean 34% 34% 41% 24% 35% 55% 44% 44% 49% 41%
Min 66.45 107.81 79.09 72.04 81.26 32.16 3.99 140.26 45.17 37.94
Max 125.94 274.28 140.75 121.09 165.72 83.13 47.62 373.21 281.32 200.02
Median 88.97 199.10 104.78 99.74 151.98 70.37 36.31 229.08 195.57 97.87
Mean 96.59 195.44 109.42 100.35 136.88 66.51 33.60 238.49 170.84 109.71
Stdev 22.11 64.20 22.53 12.14 29.39 16.39 16.03 90.64 88.92 49.16
Stdev/Mean 23% 33% 21% 12% 21% 25% 48% 38% 52% 45%
Min 70.18 136.57 97.33 85.43 91.56 58.13 6.35 157.43 55.34 39.42
Max 210.79 359.87 243.58 182.10 260.27 238.62 49.19 484.27 332.19 212.52
Median 122.88 221.19 148.67 129.15 162.29 87.52 37.04 313.37 210.46 136.12
Mean 131.02 229.76 161.25 127.22 173.84 123.54 33.90 291.58 220.79 131.40
Stdev 41.43 72.58 60.76 29.24 56.69 63.90 15.91 117.79 115.09 53.00
Stdev/Mean 32% 32% 38% 23% 33% 52% 47% 40% 52% 40%
Credit Spread Portfolios
VaR Comp
VaR Alt
VaR
Main Risk Factors
Material risk factors are USD- and EUR-swap curves, quanto basis and name-specific CDS credit spread curve for Spain.
Comments
- Only 8 banks provided data for this bespoke portfolio.
- Correlation in the P&L is mid-low, and banks 5 & 8 in particular show a low correlation with the others.
- Again, variability in the P&L volatility is very high.
- As a result this portfolio presents a high level of dispersion for ‘VaR Alt’.
- Variability actually decreases (though does not change significantly) for ‘VaR’ and ‘VaR Comp’ measures.
50-day P&L vector
Correlations across one-year daily P&L observations
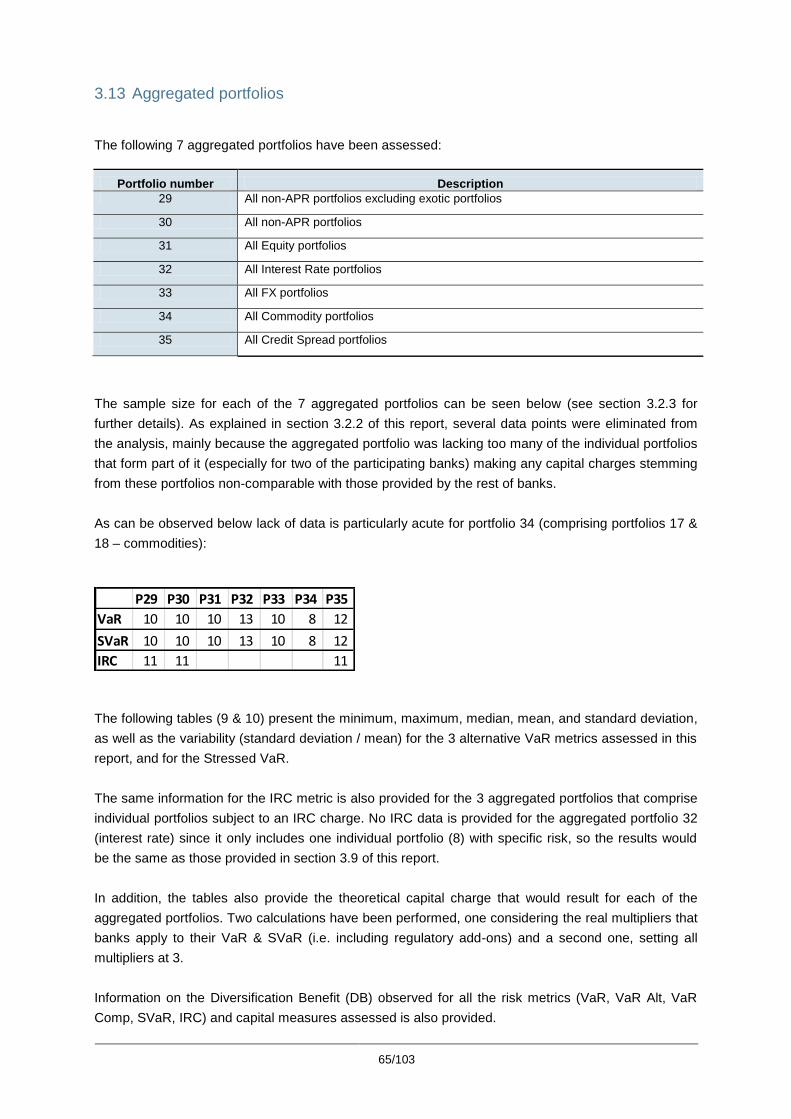
65/103
3.13 Aggregated portfolios
The following 7 aggregated portfolios have been assessed:
Portfolio number Description
29 All non-APR portfolios excluding exotic portfolios
30 All non-APR portfolios
31 All Equity portfolios
32 All Interest Rate portfolios
33 All FX portfolios
34 All Commodity portfolios
35 All Credit Spread portfolios
The sample size for each of the 7 aggregated portfolios can be seen below (see section 3.2.3 for
further details). As explained in section 3.2.2 of this report, several data points were eliminated from
the analysis, mainly because the aggregated portfolio was lacking too many of the individual portfolios
that form part of it (especially for two of the participating banks) making any capital charges stemming
from these portfolios non-comparable with those provided by the rest of banks.
As can be observed below lack of data is particularly acute for portfolio 34 (comprising portfolios 17 &
18 – commodities):
The following tables (9 & 10) present the minimum, maximum, median, mean, and standard deviation,
as well as the variability (standard deviation / mean) for the 3 alternative VaR metrics assessed in this
report, and for the Stressed VaR.
The same information for the IRC metric is also provided for the 3 aggregated portfolios that comprise
individual portfolios subject to an IRC charge. No IRC data is provided for the aggregated portfolio 32
(interest rate) since it only includes one individual portfolio (8) with specific risk, so the results would
be the same as those provided in section 3.9 of this report.
In addition, the tables also provide the theoretical capital charge that would result for each of the
aggregated portfolios. Two calculations have been performed, one considering the real multipliers that
banks apply to their VaR & SVaR (i.e. including regulatory add-ons) and a second one, setting all
multipliers at 3.
Information on the Diversification Benefit (DB) observed for all the risk metrics (VaR, VaR Alt, VaR
Comp, SVaR, IRC) and capital measures assessed is also provided.
P29 P30 P31 P32 P33 P34 P35
VaR 10 10 10 13 10 8 12
SVaR 10 10 10 13 10 8 12
IRC 11 11 11
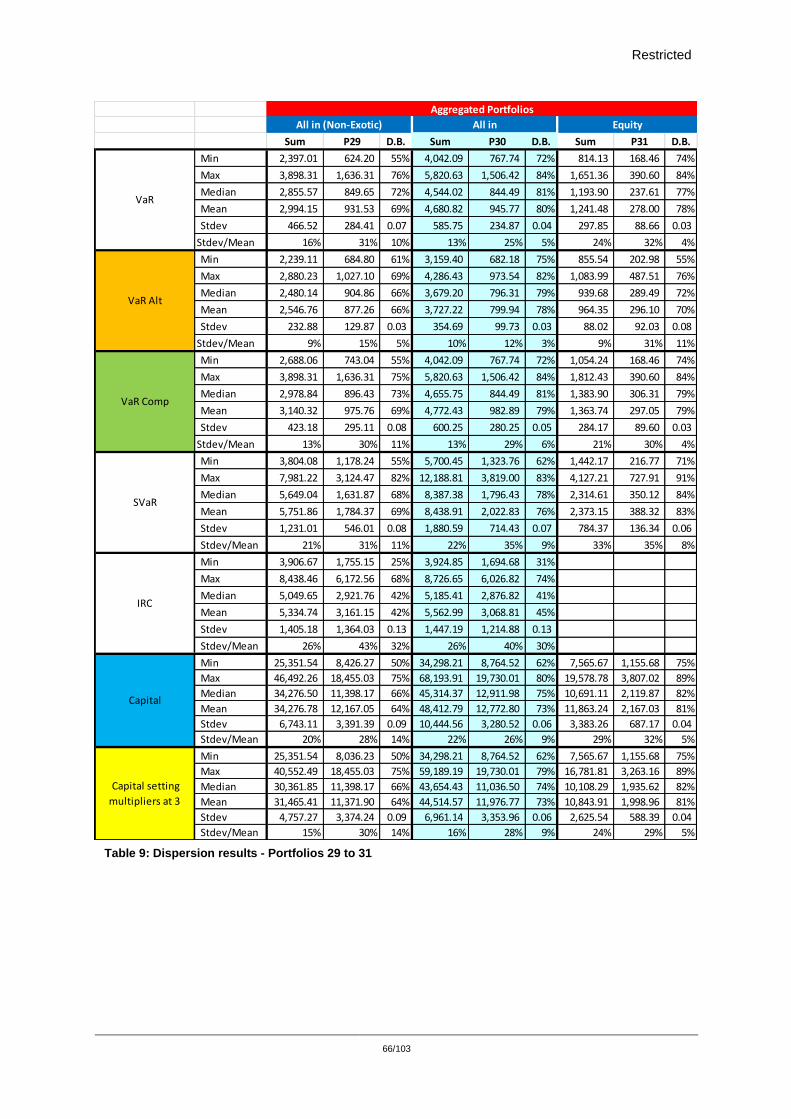
Restricted
66/103
Table 9: Dispersion results - Portfolios 29 to 31
Sum P29 D.B. Sum P30 D.B. Sum P31 D.B.
Min 2,397.01 624.20 55% 4,042.09 767.74 72% 814.13 168.46 74%
Max 3,898.31 1,636.31 76% 5,820.63 1,506.42 84% 1,651.36 390.60 84%
Median 2,855.57 849.65 72% 4,544.02 844.49 81% 1,193.90 237.61 77%
Mean 2,994.15 931.53 69% 4,680.82 945.77 80% 1,241.48 278.00 78%
Stdev 466.52 284.41 0.07 585.75 234.87 0.04 297.85 88.66 0.03
Stdev/Mean 16% 31% 10% 13% 25% 5% 24% 32% 4%
Min 2,239.11 684.80 61% 3,159.40 682.18 75% 855.54 202.98 55%
Max 2,880.23 1,027.10 69% 4,286.43 973.54 82% 1,083.99 487.51 76%
Median 2,480.14 904.86 66% 3,679.20 796.31 79% 939.68 289.49 72%
Mean 2,546.76 877.26 66% 3,727.22 799.94 78% 964.35 296.10 70%
Stdev 232.88 129.87 0.03 354.69 99.73 0.03 88.02 92.03 0.08
Stdev/Mean 9% 15% 5% 10% 12% 3% 9% 31% 11%
Min 2,688.06 743.04 55% 4,042.09 767.74 72% 1,054.24 168.46 74%
Max 3,898.31 1,636.31 75% 5,820.63 1,506.42 84% 1,812.43 390.60 84%
Median 2,978.84 896.43 73% 4,655.75 844.49 81% 1,383.90 306.31 79%
Mean 3,140.32 975.76 69% 4,772.43 982.89 79% 1,363.74 297.05 79%
Stdev 423.18 295.11 0.08 600.25 280.25 0.05 284.17 89.60 0.03
Stdev/Mean 13% 30% 11% 13% 29% 6% 21% 30% 4%
Min 3,804.08 1,178.24 55% 5,700.45 1,323.76 62% 1,442.17 216.77 71%
Max 7,981.22 3,124.47 82% 12,188.81 3,819.00 83% 4,127.21 727.91 91%
Median 5,649.04 1,631.87 68% 8,387.38 1,796.43 78% 2,314.61 350.12 84%
Mean 5,751.86 1,784.37 69% 8,438.91 2,022.83 76% 2,373.15 388.32 83%
Stdev 1,231.01 546.01 0.08 1,880.59 714.43 0.07 784.37 136.34 0.06
Stdev/Mean 21% 31% 11% 22% 35% 9% 33% 35% 8%
Min 3,906.67 1,755.15 25% 3,924.85 1,694.68 31%
Max 8,438.46 6,172.56 68% 8,726.65 6,026.82 74%
Median 5,049.65 2,921.76 42% 5,185.41 2,876.82 41%
Mean 5,334.74 3,161.15 42% 5,562.99 3,068.81 45%
Stdev 1,405.18 1,364.03 0.13 1,447.19 1,214.88 0.13
Stdev/Mean 26% 43% 32% 26% 40% 30%
Min 25,351.54 8,426.27 50% 34,298.21 8,764.52 62% 7,565.67 1,155.68 75%
Max 46,492.26 18,455.03 75% 68,193.91 19,730.01 80% 19,578.78 3,807.02 89%
Median 34,276.50 11,398.17 66% 45,314.37 12,911.98 75% 10,691.11 2,119.87 82%
Mean 34,276.78 12,167.05 64% 48,412.79 12,772.80 73% 11,863.24 2,167.03 81%
Stdev 6,743.11 3,391.39 0.09 10,444.56 3,280.52 0.06 3,383.26 687.17 0.04
Stdev/Mean 20% 28% 14% 22% 26% 9% 29% 32% 5%
Min 25,351.54 8,036.23 50% 34,298.21 8,764.52 62% 7,565.67 1,155.68 75%
Max 40,552.49 18,455.03 75% 59,189.19 19,730.01 79% 16,781.81 3,263.16 89%
Median 30,361.85 11,398.17 66% 43,654.43 11,036.50 74% 10,108.29 1,935.62 82%
Mean 31,465.41 11,371.90 64% 44,514.57 11,976.77 73% 10,843.91 1,998.96 81%
Stdev 4,757.27 3,374.24 0.09 6,961.14 3,353.96 0.06 2,625.54 588.39 0.04
Stdev/Mean 15% 30% 14% 16% 28% 9% 24% 29% 5%
Aggregated Portfolios
All in (Non-Exotic) All in Equity
VaR
IRC
Capital
Capital setting
multipliers at 3
VaR Alt
VaR Comp
SVaR
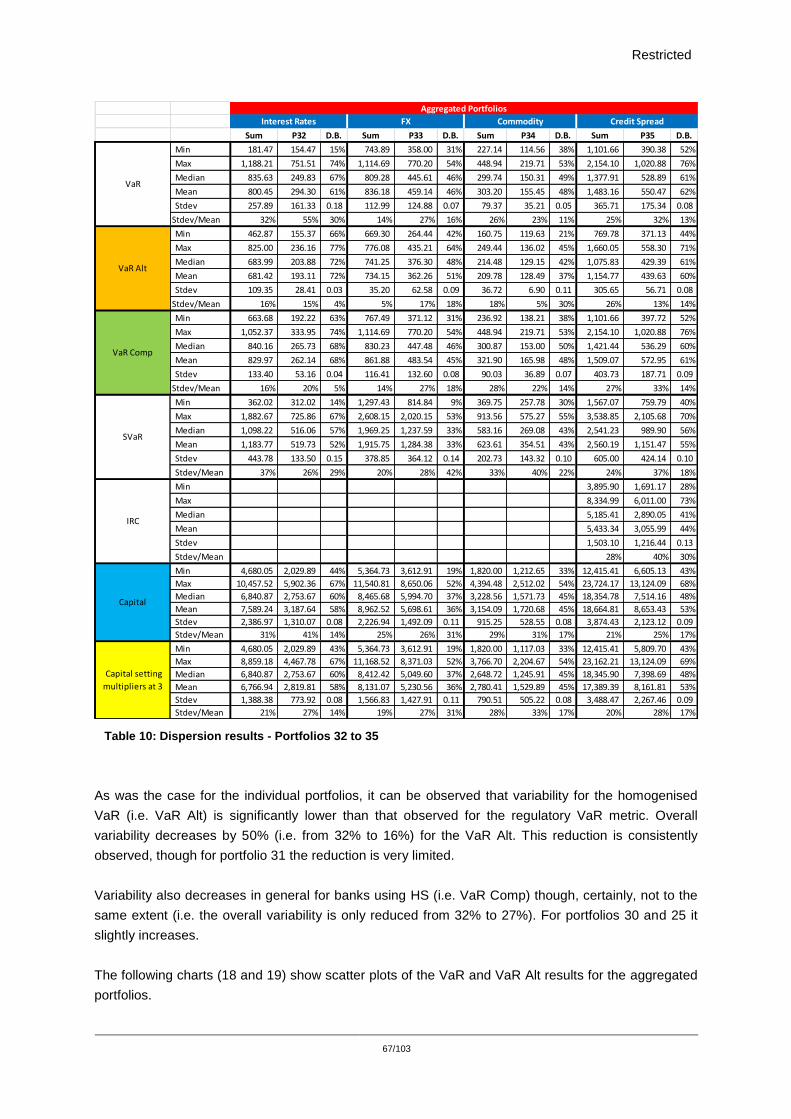
Restricted
67/103
Table 10: Dispersion results - Portfolios 32 to 35
As was the case for the individual portfolios, it can be observed that variability for the homogenised
VaR (i.e. VaR Alt) is significantly lower than that observed for the regulatory VaR metric. Overall
variability decreases by 50% (i.e. from 32% to 16%) for the VaR Alt. This reduction is consistently
observed, though for portfolio 31 the reduction is very limited.
Variability also decreases in general for banks using HS (i.e. VaR Comp) though, certainly, not to the
same extent (i.e. the overall variability is only reduced from 32% to 27%). For portfolios 30 and 25 it
slightly increases.
The following charts (18 and 19) show scatter plots of the VaR and VaR Alt results for the aggregated
portfolios.
Sum P32 D.B. Sum P33 D.B. Sum P34 D.B. Sum P35 D.B.
Min 181.47 154.47 15% 743.89 358.00 31% 227.14 114.56 38% 1,101.66 390.38 52%
Max 1,188.21 751.51 74% 1,114.69 770.20 54% 448.94 219.71 53% 2,154.10 1,020.88 76%
Median 835.63 249.83 67% 809.28 445.61 46% 299.74 150.31 49% 1,377.91 528.89 61%
Mean 800.45 294.30 61% 836.18 459.14 46% 303.20 155.45 48% 1,483.16 550.47 62%
Stdev 257.89 161.33 0.18 112.99 124.88 0.07 79.37 35.21 0.05 365.71 175.34 0.08
Stdev/Mean 32% 55% 30% 14% 27% 16% 26% 23% 11% 25% 32% 13%
Min 462.87 155.37 66% 669.30 264.44 42% 160.75 119.63 21% 769.78 371.13 44%
Max 825.00 236.16 77% 776.08 435.21 64% 249.44 136.02 45% 1,660.05 558.30 71%
Median 683.99 203.88 72% 741.25 376.30 48% 214.48 129.15 42% 1,075.83 429.39 61%
Mean 681.42 193.11 72% 734.15 362.26 51% 209.78 128.49 37% 1,154.77 439.63 60%
Stdev 109.35 28.41 0.03 35.20 62.58 0.09 36.72 6.90 0.11 305.65 56.71 0.08
Stdev/Mean 16% 15% 4% 5% 17% 18% 18% 5% 30% 26% 13% 14%
Min 663.68 192.22 63% 767.49 371.12 31% 236.92 138.21 38% 1,101.66 397.72 52%
Max 1,052.37 333.95 74% 1,114.69 770.20 54% 448.94 219.71 53% 2,154.10 1,020.88 76%
Median 840.16 265.73 68% 830.23 447.48 46% 300.87 153.00 50% 1,421.44 536.29 60%
Mean 829.97 262.14 68% 861.88 483.54 45% 321.90 165.98 48% 1,509.07 572.95 61%
Stdev 133.40 53.16 0.04 116.41 132.60 0.08 90.03 36.89 0.07 403.73 187.71 0.09
Stdev/Mean 16% 20% 5% 14% 27% 18% 28% 22% 14% 27% 33% 14%
Min 362.02 312.02 14% 1,297.43 814.84 9% 369.75 257.78 30% 1,567.07 759.79 40%
Max 1,882.67 725.86 67% 2,608.15 2,020.15 53% 913.56 575.27 55% 3,538.85 2,105.68 70%
Median 1,098.22 516.06 57% 1,969.25 1,237.59 33% 583.16 269.08 43% 2,541.23 989.90 56%
Mean 1,183.77 519.73 52% 1,915.75 1,284.38 33% 623.61 354.51 43% 2,560.19 1,151.47 55%
Stdev 443.78 133.50 0.15 378.85 364.12 0.14 202.73 143.32 0.10 605.00 424.14 0.10
Stdev/Mean 37% 26% 29% 20% 28% 42% 33% 40% 22% 24% 37% 18%
Min 3,895.90 1,691.17 28%
Max 8,334.99 6,011.00 73%
Median 5,185.41 2,890.05 41%
Mean 5,433.34 3,055.99 44%
Stdev 1,503.10 1,216.44 0.13
Stdev/Mean 28% 40% 30%
Min 4,680.05 2,029.89 44% 5,364.73 3,612.91 19% 1,820.00 1,212.65 33% 12,415.41 6,605.13 43%
Max 10,457.52 5,902.36 67% 11,540.81 8,650.06 52% 4,394.48 2,512.02 54% 23,724.17 13,124.09 68%
Median 6,840.87 2,753.67 60% 8,465.68 5,994.70 37% 3,228.56 1,571.73 45% 18,354.78 7,514.16 48%
Mean 7,589.24 3,187.64 58% 8,962.52 5,698.61 36% 3,154.09 1,720.68 45% 18,664.81 8,653.43 53%
Stdev 2,386.97 1,310.07 0.08 2,226.94 1,492.09 0.11 915.25 528.55 0.08 3,874.43 2,123.12 0.09
Stdev/Mean 31% 41% 14% 25% 26% 31% 29% 31% 17% 21% 25% 17%
Min 4,680.05 2,029.89 43% 5,364.73 3,612.91 19% 1,820.00 1,117.03 33% 12,415.41 5,809.70 43%
Max 8,859.18 4,467.78 67% 11,168.52 8,371.03 52% 3,766.70 2,204.67 54% 23,162.21 13,124.09 69%
Median 6,840.87 2,753.67 60% 8,412.42 5,049.60 37% 2,648.72 1,245.91 45% 18,345.90 7,398.69 48%
Mean 6,766.94 2,819.81 58% 8,131.07 5,230.56 36% 2,780.41 1,529.89 45% 17,389.39 8,161.81 53%
Stdev 1,388.38 773.92 0.08 1,566.83 1,427.91 0.11 790.51 505.22 0.08 3,488.47 2,267.46 0.09
Stdev/Mean 21% 27% 14% 19% 27% 31% 28% 33% 17% 20% 28% 17%
Aggregated Portfolios
Interest Rates FX Commodity Credit Spread
VaR
VaR Alt
VaR Comp
SVaR
IRC
Capital setting
multipliers at 3
Capital
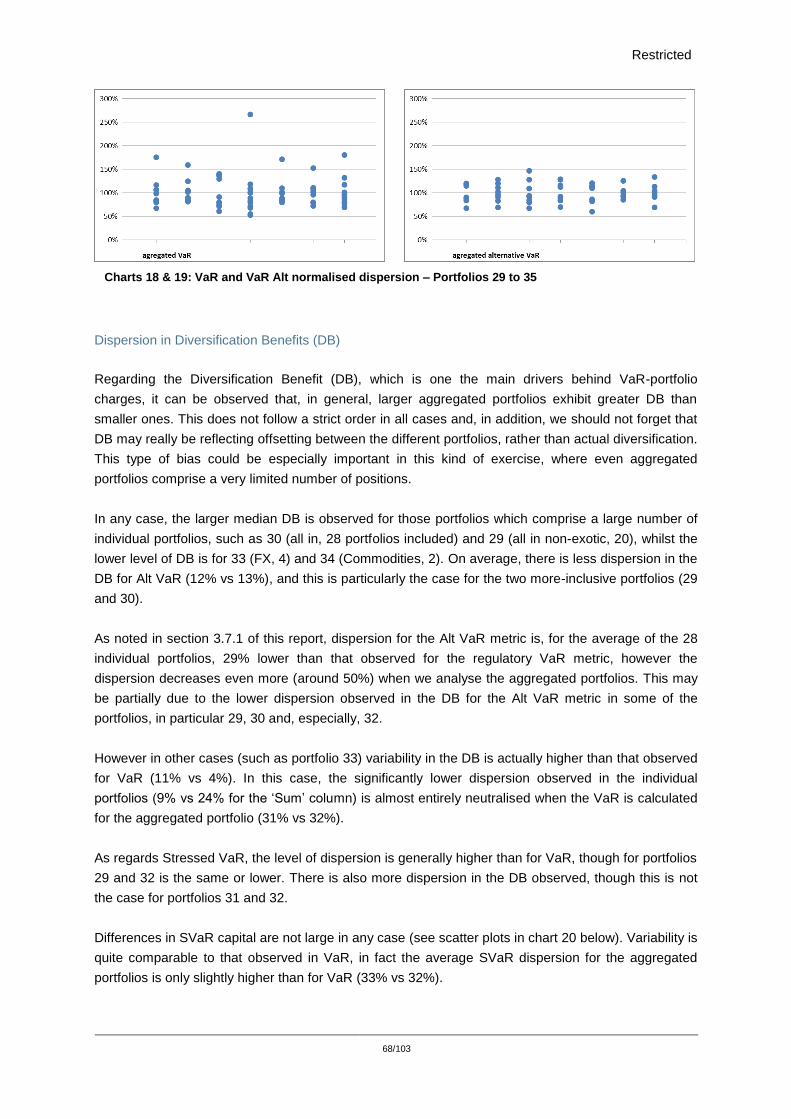
Restricted
68/103
Charts 18 & 19: VaR and VaR Alt normalised dispersion – Portfolios 29 to 35
Dispersion in Diversification Benefits (DB)
Regarding the Diversification Benefit (DB), which is one the main drivers behind VaR-portfolio
charges, it can be observed that, in general, larger aggregated portfolios exhibit greater DB than
smaller ones. This does not follow a strict order in all cases and, in addition, we should not forget that
DB may really be reflecting offsetting between the different portfolios, rather than actual diversification.
This type of bias could be especially important in this kind of exercise, where even aggregated
portfolios comprise a very limited number of positions.
In any case, the larger median DB is observed for those portfolios which comprise a large number of
individual portfolios, such as 30 (all in, 28 portfolios included) and 29 (all in non-exotic, 20), whilst the
lower level of DB is for 33 (FX, 4) and 34 (Commodities, 2). On average, there is less dispersion in the
DB for Alt VaR (12% vs 13%), and this is particularly the case for the two more-inclusive portfolios (29
and 30).
As noted in section 3.7.1 of this report, dispersion for the Alt VaR metric is, for the average of the 28
individual portfolios, 29% lower than that observed for the regulatory VaR metric, however the
dispersion decreases even more (around 50%) when we analyse the aggregated portfolios. This may
be partially due to the lower dispersion observed in the DB for the Alt VaR metric in some of the
portfolios, in particular 29, 30 and, especially, 32.
However in other cases (such as portfolio 33) variability in the DB is actually higher than that observed
for VaR (11% vs 4%). In this case, the significantly lower dispersion observed in the individual
portfolios (9% vs 24% for the ‘Sum’ column) is almost entirely neutralised when the VaR is calculated
for the aggregated portfolio (31% vs 32%).
As regards Stressed VaR, the level of dispersion is generally higher than for VaR, though for portfolios
29 and 32 is the same or lower. There is also more dispersion in the DB observed, though this is not
the case for portfolios 31 and 32.
Differences in SVaR capital are not large in any case (see scatter plots in chart 20 below). Variability is
quite comparable to that observed in VaR, in fact the average SVaR dispersion for the aggregated
portfolios is only slightly higher than for VaR (33% vs 32%).
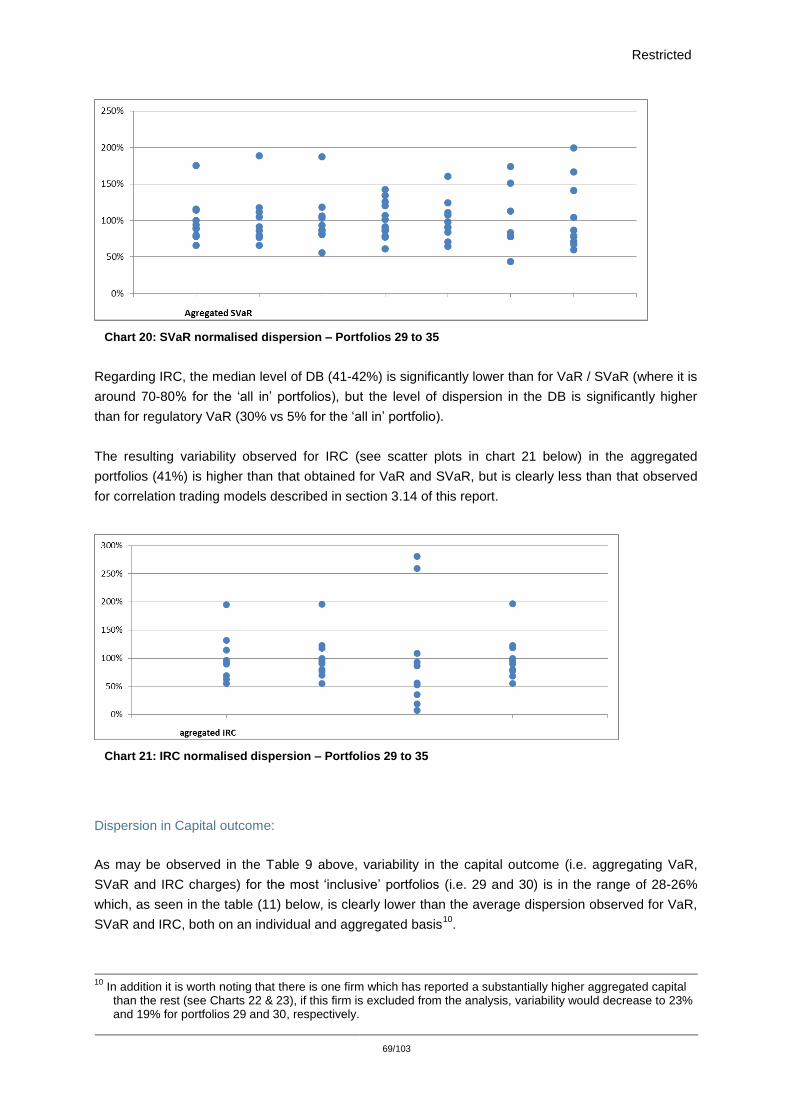
Restricted
69/103
Chart 20: SVaR normalised dispersion – Portfolios 29 to 35
Regarding IRC, the median level of DB (41-42%) is significantly lower than for VaR / SVaR (where it is
around 70-80% for the ‘all in’ portfolios), but the level of dispersion in the DB is significantly higher
than for regulatory VaR (30% vs 5% for the ‘all in’ portfolio).
The resulting variability observed for IRC (see scatter plots in chart 21 below) in the aggregated
portfolios (41%) is higher than that obtained for VaR and SVaR, but is clearly less than that observed
for correlation trading models described in section 3.14 of this report.
Chart 21: IRC normalised dispersion – Portfolios 29 to 35
Dispersion in Capital outcome:
As may be observed in the Table 9 above, variability in the capital outcome (i.e. aggregating VaR,
SVaR and IRC charges) for the most ‘inclusive’ portfolios (i.e. 29 and 30) is in the range of 28-26%
which, as seen in the table (11) below, is clearly lower than the average dispersion observed for VaR,
SVaR and IRC, both on an individual and aggregated basis10
.
10
In addition it is worth noting that there is one firm which has reported a substantially higher aggregated capital than the rest (see Charts 22 & 23), if this firm is excluded from the analysis, variability would decrease to 23% and 19% for portfolios 29 and 30, respectively.
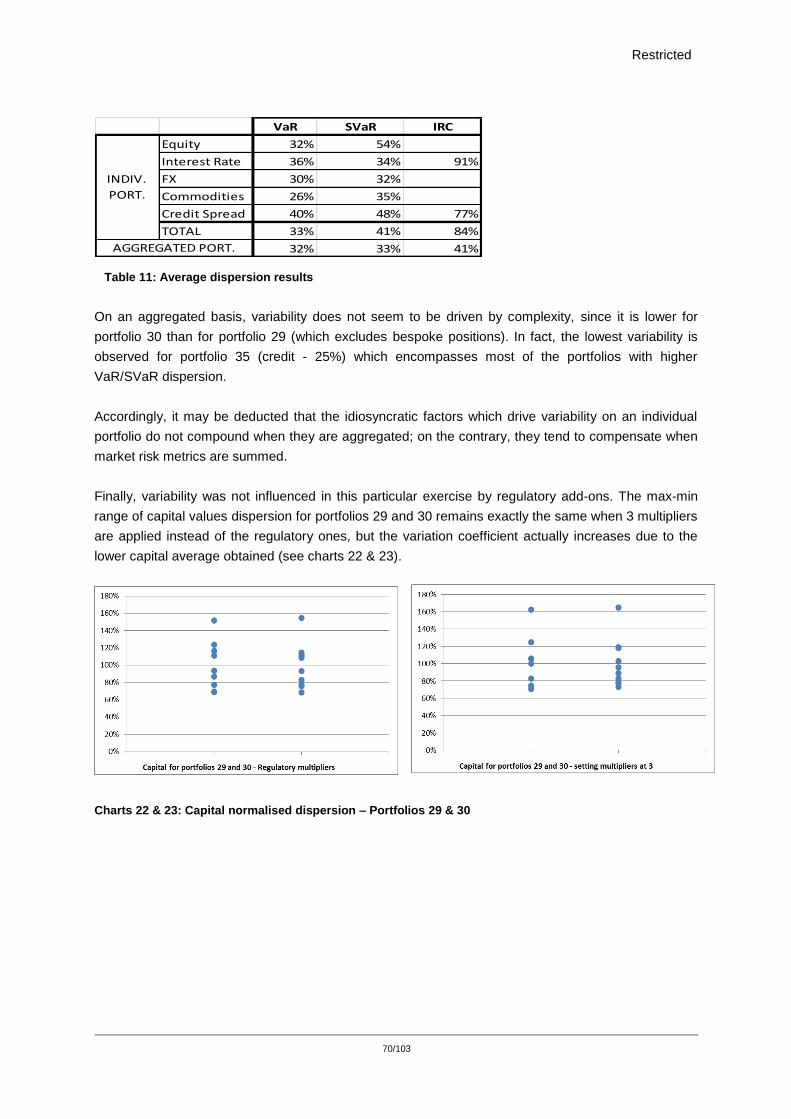
Restricted
70/103
Table 11: Average dispersion results
On an aggregated basis, variability does not seem to be driven by complexity, since it is lower for
portfolio 30 than for portfolio 29 (which excludes bespoke positions). In fact, the lowest variability is
observed for portfolio 35 (credit - 25%) which encompasses most of the portfolios with higher
VaR/SVaR dispersion.
Accordingly, it may be deducted that the idiosyncratic factors which drive variability on an individual
portfolio do not compound when they are aggregated; on the contrary, they tend to compensate when
market risk metrics are summed.
Finally, variability was not influenced in this particular exercise by regulatory add-ons. The max-min
range of capital values dispersion for portfolios 29 and 30 remains exactly the same when 3 multipliers
are applied instead of the regulatory ones, but the variation coefficient actually increases due to the
lower capital average obtained (see charts 22 & 23).
Charts 22 & 23: Capital normalised dispersion – Portfolios 29 & 30
VaR SVaR IRC
Equity 32% 54%
Interest Rate 36% 34% 91%
FX 30% 32%
Commodities 26% 35%
Credit Spread 40% 48% 77%
TOTAL 33% 41% 84%
32% 33% 41%
INDIV.
PORT.
AGGREGATED PORT.
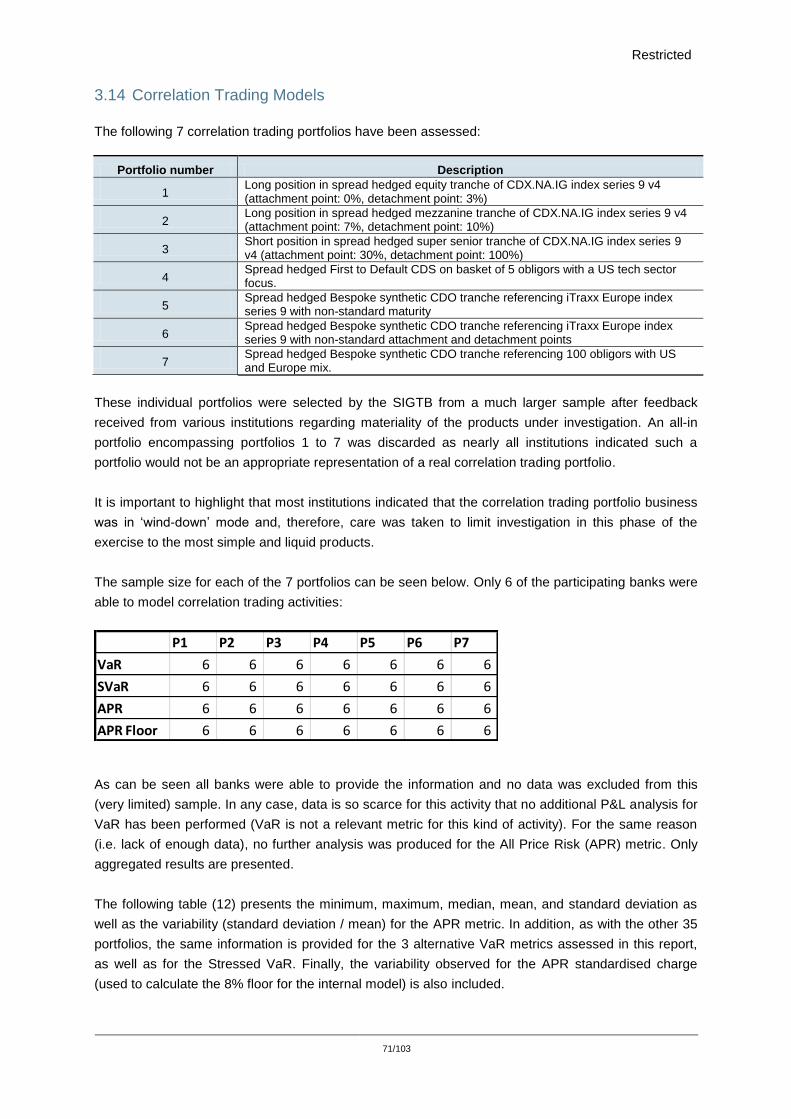
Restricted
71/103
3.14 Correlation Trading Models
The following 7 correlation trading portfolios have been assessed:
Portfolio number Description
1 Long position in spread hedged equity tranche of CDX.NA.IG index series 9 v4 (attachment point: 0%, detachment point: 3%)
2 Long position in spread hedged mezzanine tranche of CDX.NA.IG index series 9 v4 (attachment point: 7%, detachment point: 10%)
3 Short position in spread hedged super senior tranche of CDX.NA.IG index series 9 v4 (attachment point: 30%, detachment point: 100%)
4 Spread hedged First to Default CDS on basket of 5 obligors with a US tech sector focus.
5 Spread hedged Bespoke synthetic CDO tranche referencing iTraxx Europe index series 9 with non-standard maturity
6 Spread hedged Bespoke synthetic CDO tranche referencing iTraxx Europe index series 9 with non-standard attachment and detachment points
7 Spread hedged Bespoke synthetic CDO tranche referencing 100 obligors with US and Europe mix.
These individual portfolios were selected by the SIGTB from a much larger sample after feedback
received from various institutions regarding materiality of the products under investigation. An all-in
portfolio encompassing portfolios 1 to 7 was discarded as nearly all institutions indicated such a
portfolio would not be an appropriate representation of a real correlation trading portfolio.
It is important to highlight that most institutions indicated that the correlation trading portfolio business
was in ‘wind-down’ mode and, therefore, care was taken to limit investigation in this phase of the
exercise to the most simple and liquid products.
The sample size for each of the 7 portfolios can be seen below. Only 6 of the participating banks were
able to model correlation trading activities:
As can be seen all banks were able to provide the information and no data was excluded from this
(very limited) sample. In any case, data is so scarce for this activity that no additional P&L analysis for
VaR has been performed (VaR is not a relevant metric for this kind of activity). For the same reason
(i.e. lack of enough data), no further analysis was produced for the All Price Risk (APR) metric. Only
aggregated results are presented.
The following table (12) presents the minimum, maximum, median, mean, and standard deviation as
well as the variability (standard deviation / mean) for the APR metric. In addition, as with the other 35
portfolios, the same information is provided for the 3 alternative VaR metrics assessed in this report,
as well as for the Stressed VaR. Finally, the variability observed for the APR standardised charge
(used to calculate the 8% floor for the internal model) is also included.
P1 P2 P3 P4 P5 P6 P7
VaR 6 6 6 6 6 6 6
SVaR 6 6 6 6 6 6 6
APR 6 6 6 6 6 6 6
APR Floor 6 6 6 6 6 6 6
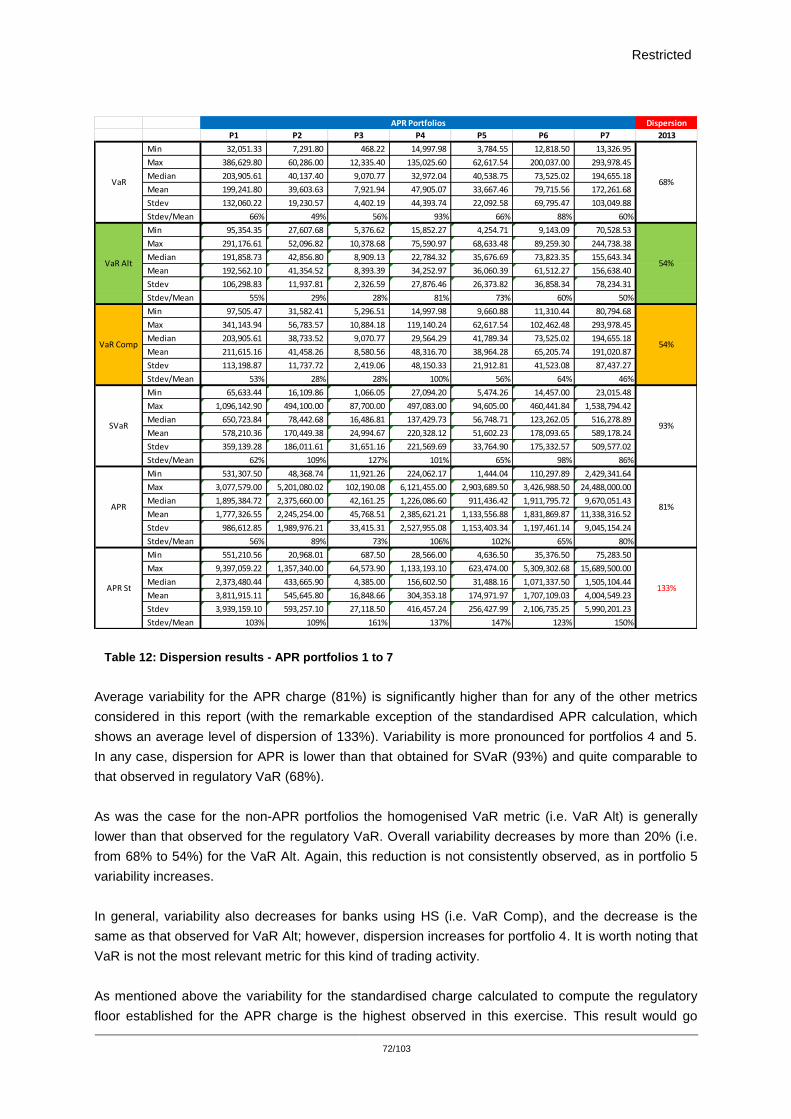
Restricted
72/103
Table 12: Dispersion results - APR portfolios 1 to 7
Average variability for the APR charge (81%) is significantly higher than for any of the other metrics
considered in this report (with the remarkable exception of the standardised APR calculation, which
shows an average level of dispersion of 133%). Variability is more pronounced for portfolios 4 and 5.
In any case, dispersion for APR is lower than that obtained for SVaR (93%) and quite comparable to
that observed in regulatory VaR (68%).
As was the case for the non-APR portfolios the homogenised VaR metric (i.e. VaR Alt) is generally
lower than that observed for the regulatory VaR. Overall variability decreases by more than 20% (i.e.
from 68% to 54%) for the VaR Alt. Again, this reduction is not consistently observed, as in portfolio 5
variability increases.
In general, variability also decreases for banks using HS (i.e. VaR Comp), and the decrease is the
same as that observed for VaR Alt; however, dispersion increases for portfolio 4. It is worth noting that
VaR is not the most relevant metric for this kind of trading activity.
As mentioned above the variability for the standardised charge calculated to compute the regulatory
floor established for the APR charge is the highest observed in this exercise. This result would go
Dispersion
P1 P2 P3 P4 P5 P6 P7 2013
Min 32,051.33 7,291.80 468.22 14,997.98 3,784.55 12,818.50 13,326.95
Max 386,629.80 60,286.00 12,335.40 135,025.60 62,617.54 200,037.00 293,978.45
Median 203,905.61 40,137.40 9,070.77 32,972.04 40,538.75 73,525.02 194,655.18
Mean 199,241.80 39,603.63 7,921.94 47,905.07 33,667.46 79,715.56 172,261.68
Stdev 132,060.22 19,230.57 4,402.19 44,393.74 22,092.58 69,795.47 103,049.88
Stdev/Mean 66% 49% 56% 93% 66% 88% 60%
Min 95,354.35 27,607.68 5,376.62 15,852.27 4,254.71 9,143.09 70,528.53
Max 291,176.61 52,096.82 10,378.68 75,590.97 68,633.48 89,259.30 244,738.38
Median 191,858.73 42,856.80 8,909.13 22,784.32 35,676.69 73,823.35 155,643.34
Mean 192,562.10 41,354.52 8,393.39 34,252.97 36,060.39 61,512.27 156,638.40
Stdev 106,298.83 11,937.81 2,326.59 27,876.46 26,373.82 36,858.34 78,234.31
Stdev/Mean 55% 29% 28% 81% 73% 60% 50%
Min 97,505.47 31,582.41 5,296.51 14,997.98 9,660.88 11,310.44 80,794.68
Max 341,143.94 56,783.57 10,884.18 119,140.24 62,617.54 102,462.48 293,978.45
Median 203,905.61 38,733.52 9,070.77 29,564.29 41,789.34 73,525.02 194,655.18
Mean 211,615.16 41,458.26 8,580.56 48,316.70 38,964.28 65,205.74 191,020.87
Stdev 113,198.87 11,737.72 2,419.06 48,150.33 21,912.81 41,523.08 87,437.27
Stdev/Mean 53% 28% 28% 100% 56% 64% 46%
Min 65,633.44 16,109.86 1,066.05 27,094.20 5,474.26 14,457.00 23,015.48
Max 1,096,142.90 494,100.00 87,700.00 497,083.00 94,605.00 460,441.84 1,538,794.42
Median 650,723.84 78,442.68 16,486.81 137,429.73 56,748.71 123,262.05 516,278.89
Mean 578,210.36 170,449.38 24,994.67 220,328.12 51,602.23 178,093.65 589,178.24
Stdev 359,139.28 186,011.61 31,651.16 221,569.69 33,764.90 175,332.57 509,577.02
Stdev/Mean 62% 109% 127% 101% 65% 98% 86%
Min 531,307.50 48,368.74 11,921.26 224,062.17 1,444.04 110,297.89 2,429,341.64
Max 3,077,579.00 5,201,080.02 102,190.08 6,121,455.00 2,903,689.50 3,426,988.50 24,488,000.00
Median 1,895,384.72 2,375,660.00 42,161.25 1,226,086.60 911,436.42 1,911,795.72 9,670,051.43
Mean 1,777,326.55 2,245,254.00 45,768.51 2,385,621.21 1,133,556.88 1,831,869.87 11,338,316.52
Stdev 986,612.85 1,989,976.21 33,415.31 2,527,955.08 1,153,403.34 1,197,461.14 9,045,154.24
Stdev/Mean 56% 89% 73% 106% 102% 65% 80%
Min 551,210.56 20,968.01 687.50 28,566.00 4,636.50 35,376.50 75,283.50
Max 9,397,059.22 1,357,340.00 64,573.90 1,133,193.10 623,474.00 5,309,302.68 15,689,500.00
Median 2,373,480.44 433,665.90 4,385.00 156,602.50 31,488.16 1,071,337.50 1,505,104.44
Mean 3,811,915.11 545,645.80 16,848.66 304,353.18 174,971.97 1,707,109.03 4,004,549.23
Stdev 3,939,159.10 593,257.10 27,118.50 416,457.24 256,427.99 2,106,735.25 5,990,201.23
Stdev/Mean 103% 109% 161% 137% 147% 123% 150%
VaR
SVaR
APR
APR St
VaR Alt
VaR Comp
93%
81%
133%
APR Portfolios
68%
54%
54%
Restricted
73/103
against the notion that the standardised charges should be used in all cases to dampen variability, as
this is not the case at least for correlation trading activities.
On average, variability is 133% (ranging from 103% to 161%). This may seem surprising, but it is
worth remembering that the standardised approach for correlation trading activities is based on the
Supervisory Formula Approach (SFA) that use bank’s estimates for PDs and LGDs as inputs.
In this regard, the dispersion observed is quite in-line with the SIGBB finding on variability of PDs and
LGDs used in the supervisory formula approach for specific risk of securitisation positions (see
www.bis.org/publ/bcbs256.pdf for further details). This suggests that standardised approaches that
rely to some extent on banks’ internal estimation of parameters may be subject to similar levels of
variability as internal model approaches.
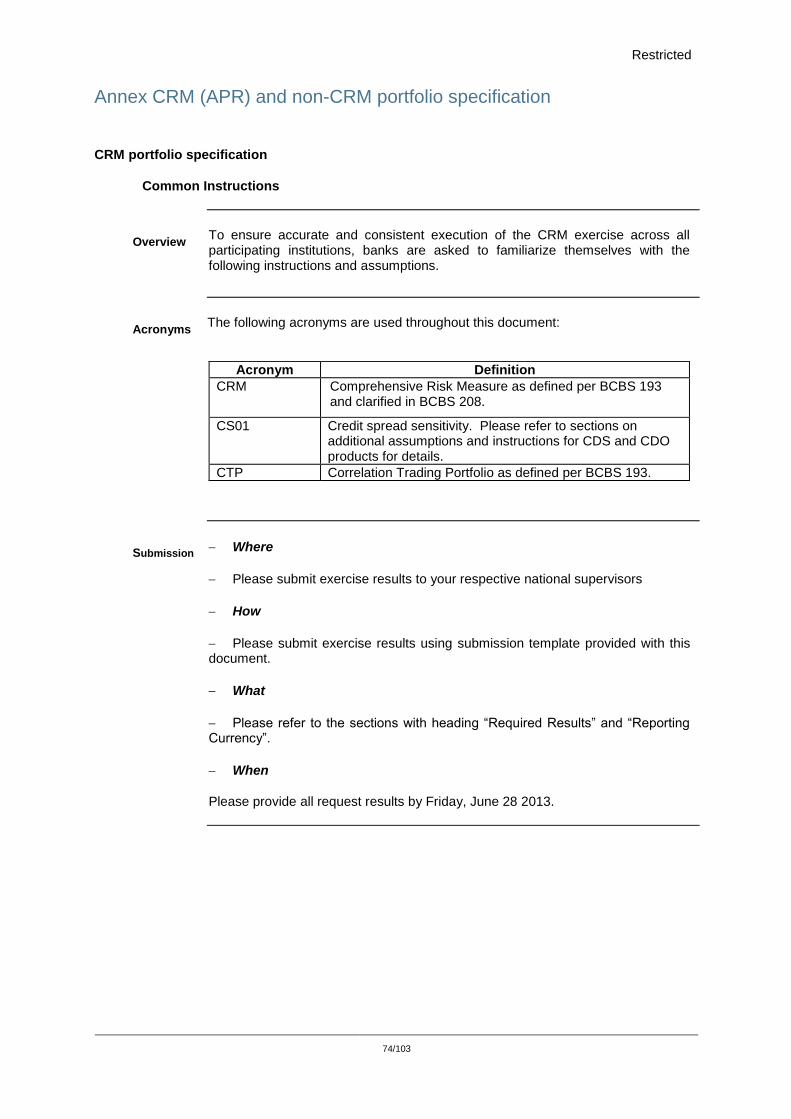
Restricted
74/103
Annex CRM (APR) and non-CRM portfolio specification
CRM portfolio specification
Common Instructions
Overview To ensure accurate and consistent execution of the CRM exercise across all participating institutions, banks are asked to familiarize themselves with the following instructions and assumptions.
Acronyms The following acronyms are used throughout this document:
Acronym Definition
CRM Comprehensive Risk Measure as defined per BCBS 193 and clarified in BCBS 208.
CS01 Credit spread sensitivity. Please refer to sections on additional assumptions and instructions for CDS and CDO products for details.
CTP Correlation Trading Portfolio as defined per BCBS 193.
Submission Where
Please submit exercise results to your respective national supervisors
How
Please submit exercise results using submission template provided with this document.
What
Please refer to the sections with heading “Required Results” and “Reporting Currency”.
When
Please provide all request results by Friday, June 28 2013.
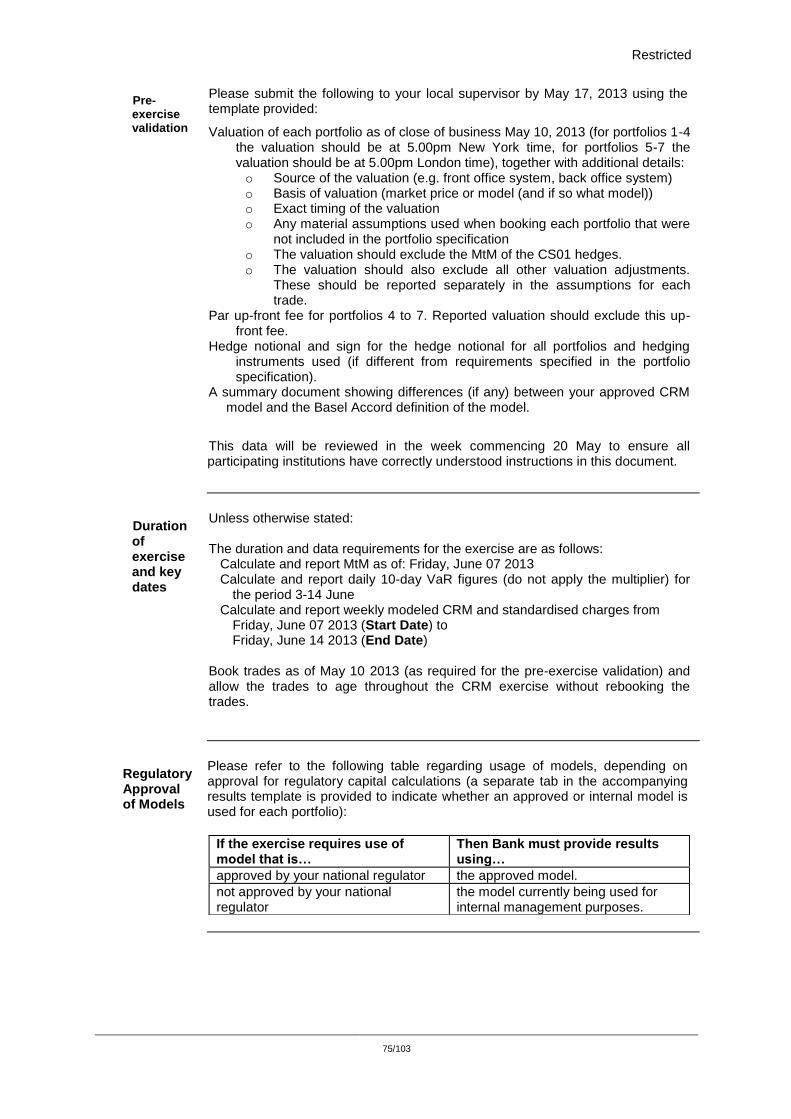
Restricted
75/103
Pre-exercise validation
Please submit the following to your local supervisor by May 17, 2013 using the template provided:
Valuation of each portfolio as of close of business May 10, 2013 (for portfolios 1-4 the valuation should be at 5.00pm New York time, for portfolios 5-7 the valuation should be at 5.00pm London time), together with additional details: o Source of the valuation (e.g. front office system, back office system) o Basis of valuation (market price or model (and if so what model)) o Exact timing of the valuation o Any material assumptions used when booking each portfolio that were
not included in the portfolio specification o The valuation should exclude the MtM of the CS01 hedges. o The valuation should also exclude all other valuation adjustments.
These should be reported separately in the assumptions for each trade.
Par up-front fee for portfolios 4 to 7. Reported valuation should exclude this up-front fee.
Hedge notional and sign for the hedge notional for all portfolios and hedging instruments used (if different from requirements specified in the portfolio specification).
A summary document showing differences (if any) between your approved CRM model and the Basel Accord definition of the model.
This data will be reviewed in the week commencing 20 May to ensure all participating institutions have correctly understood instructions in this document.
Duration of exercise and key dates
Unless otherwise stated: The duration and data requirements for the exercise are as follows:
Calculate and report MtM as of: Friday, June 07 2013 Calculate and report daily 10-day VaR figures (do not apply the multiplier) for
the period 3-14 June Calculate and report weekly modeled CRM and standardised charges from
Friday, June 07 2013 (Start Date) to Friday, June 14 2013 (End Date)
Book trades as of May 10 2013 (as required for the pre-exercise validation) and allow the trades to age throughout the CRM exercise without rebooking the trades.
Regulatory Approval of Models
Please refer to the following table regarding usage of models, depending on approval for regulatory capital calculations (a separate tab in the accompanying results template is provided to indicate whether an approved or internal model is used for each portfolio):
If the exercise requires use of model that is…
Then Bank must provide results using…
approved by your national regulator the approved model.
not approved by your national regulator
the model currently being used for internal management purposes.
Restricted
76/103
Required Results
Please document the following results, as applicable for each portfolio, in the results submission template accompanying this document.
o Market Value (MTM) as at 7 June. This follows the same inclusions/exclusions per the instructions in the Pre-exercise validation section of this document.
o VaR (general market and specific risk) o Stressed VaR (general market and specific risk) o CRM Modeled Charge o CRM Standardised Charge o Hedge notional for all portfolios.
The modeled CRM charge for the purposes of this exercise is defined as the sum of:
a price risk component covering credit spread and index-single name basis, implied correlations and index-bespoke tranche basis and recovery rate volatility
and a rating migration and default component
If attribution for the CRM modeled charge is available, then please provide additional breakdown of the following results for each portfolio:
Price Risk CRM Default and Migration CRM
Up-front fees, valuation adjustments, and CS01 hedges should be included for all portfolios when calculation VaR, Stressed VaR, and CRM.
Reporting Currency
For each portfolio, banks are asked to provide the results for each portfolio in two currencies:
The Bank’s home currency and The base currency of each exercise as specified in the Portfolio Definition
section. Two separate tabs in the accompanying results submission template are provided to facilitate the submission of both home and base currency results.
Collateral Unless otherwise stated, assume that there is neither any margining agreements nor collateralization of positions associated with the trades entered in the exercise.
Active Management
Assume all hedge positions are static. No rebalancing is allowed on subsequent CRM reporting dates after initial valuation date (i.e. May 10
th 2013) in order to
minimize subsequent influences to the result that are external to the model.
Restricted
77/103
CDS contract specific assumptions and instructions
Unless otherwise stated, the following assumptions are applicable for all CDS and index CDS positions:
Assume any up-front fee is paid/received to enter the position as per the market conventions.
The maturity date follows conventional quarterly termination dates, often referred to as “IMM dates”.
CS01 is defined as the change in CDS price due to a 1bp widening across all tenors of the single name or index spread.
Additional specifications required in order to compute pricing calculations should be done in a way that is consistent with market standards. Refer to section titled “Additional Required Assumptions” for further instructions.
CDO Tranche assumptions and instructions
Unless otherwise stated, the following assumptions are applicable for all CDO tranche positions:
For standard index tranches, assume any up-front fee is paid/received to enter the position as per the market conventions
Notional specified in each portfolio represents the original tranche notional, unadjusted for any defaults.
CS01 is defined as the change in tranche price due to a 1bp widening across all tenors of the single name or index spread.
Spread Delta is defined as the ratio of CS01 for the tranche over CS01 of the underlying credit (CDS, index CDS, or bond). In the case of non-index tranches, for the same tranche there will be one spread delta per underlying credit.
Additional specifications required in order to compute pricing calculations should be done in a way that is consistent with market standards. Refer to section titled “Additional Required Assumptions” for further instructions.
Additional Required Assumptions
If additional assumptions beyond those specified above are relevant to the interpretation of exercise results submitted, for example:
o coupon rolls, o mapping against indices, o weighting of contributions from different indices to a
bespoke correlation surface, etc
then please submit a separate document containing these assumptions in addition to the results template spreadsheet.
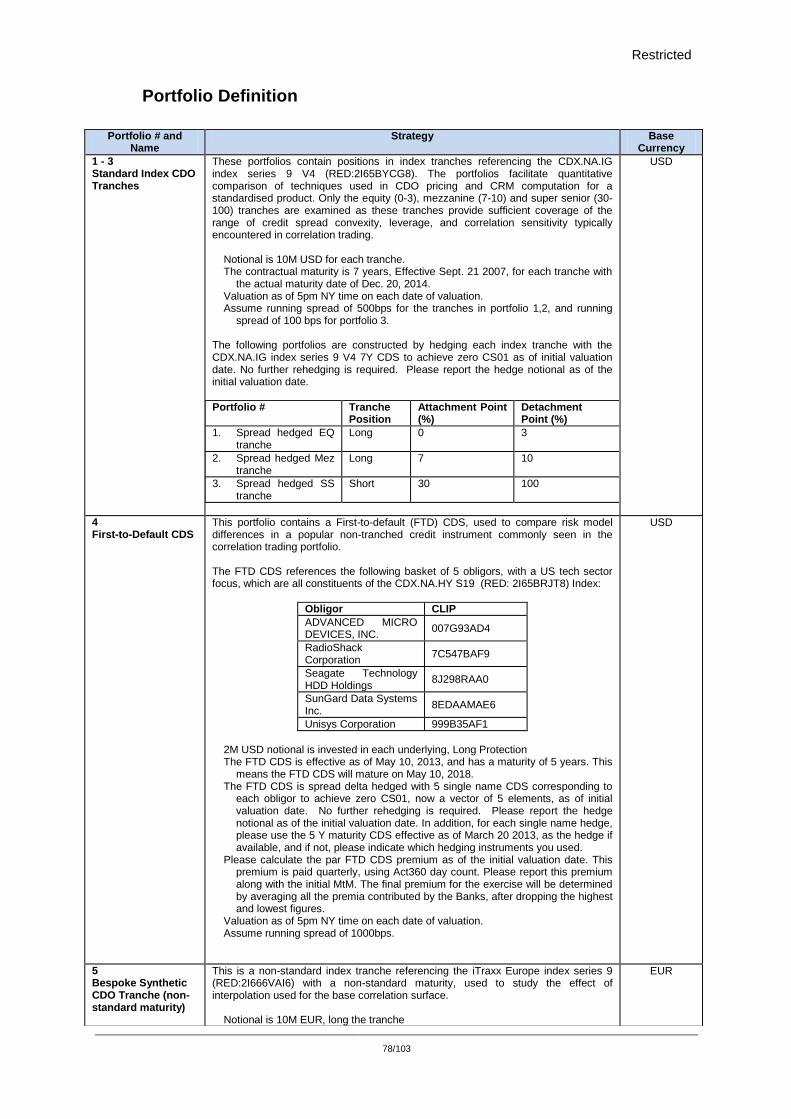
Restricted
78/103
Portfolio Definition
Portfolio # and
Name Strategy Base
Currency
1 - 3 Standard Index CDO Tranches
These portfolios contain positions in index tranches referencing the CDX.NA.IG index series 9 V4 (RED:2I65BYCG8). The portfolios facilitate quantitative comparison of techniques used in CDO pricing and CRM computation for a standardised product. Only the equity (0-3), mezzanine (7-10) and super senior (30-100) tranches are examined as these tranches provide sufficient coverage of the range of credit spread convexity, leverage, and correlation sensitivity typically encountered in correlation trading.
Notional is 10M USD for each tranche. The contractual maturity is 7 years, Effective Sept. 21 2007, for each tranche with
the actual maturity date of Dec. 20, 2014. Valuation as of 5pm NY time on each date of valuation. Assume running spread of 500bps for the tranches in portfolio 1,2, and running
spread of 100 bps for portfolio 3.
The following portfolios are constructed by hedging each index tranche with the CDX.NA.IG index series 9 V4 7Y CDS to achieve zero CS01 as of initial valuation date. No further rehedging is required. Please report the hedge notional as of the initial valuation date.
Portfolio # Tranche Position
Attachment Point (%)
Detachment Point (%)
1. Spread hedged EQ tranche
Long 0 3
2. Spread hedged Mez tranche
Long 7 10
3. Spread hedged SS tranche
Short 30 100
USD
4 First-to-Default CDS
This portfolio contains a First-to-default (FTD) CDS, used to compare risk model differences in a popular non-tranched credit instrument commonly seen in the correlation trading portfolio. The FTD CDS references the following basket of 5 obligors, with a US tech sector focus, which are all constituents of the CDX.NA.HY S19 (RED: 2I65BRJT8) Index:
Obligor CLIP
ADVANCED MICRO DEVICES, INC.
007G93AD4
RadioShack Corporation
7C547BAF9
Seagate Technology HDD Holdings
8J298RAA0
SunGard Data Systems Inc.
8EDAAMAE6
Unisys Corporation 999B35AF1
2M USD notional is invested in each underlying, Long Protection The FTD CDS is effective as of May 10, 2013, and has a maturity of 5 years. This
means the FTD CDS will mature on May 10, 2018. The FTD CDS is spread delta hedged with 5 single name CDS corresponding to
each obligor to achieve zero CS01, now a vector of 5 elements, as of initial valuation date. No further rehedging is required. Please report the hedge notional as of the initial valuation date. In addition, for each single name hedge, please use the 5 Y maturity CDS effective as of March 20 2013, as the hedge if available, and if not, please indicate which hedging instruments you used.
Please calculate the par FTD CDS premium as of the initial valuation date. This premium is paid quarterly, using Act360 day count. Please report this premium along with the initial MtM. The final premium for the exercise will be determined by averaging all the premia contributed by the Banks, after dropping the highest and lowest figures.
Valuation as of 5pm NY time on each date of valuation. Assume running spread of 1000bps.
USD
5 Bespoke Synthetic CDO Tranche (non-standard maturity)
This is a non-standard index tranche referencing the iTraxx Europe index series 9 (RED:2I666VAI6) with a non-standard maturity, used to study the effect of interpolation used for the base correlation surface.
Notional is 10M EUR, long the tranche
EUR
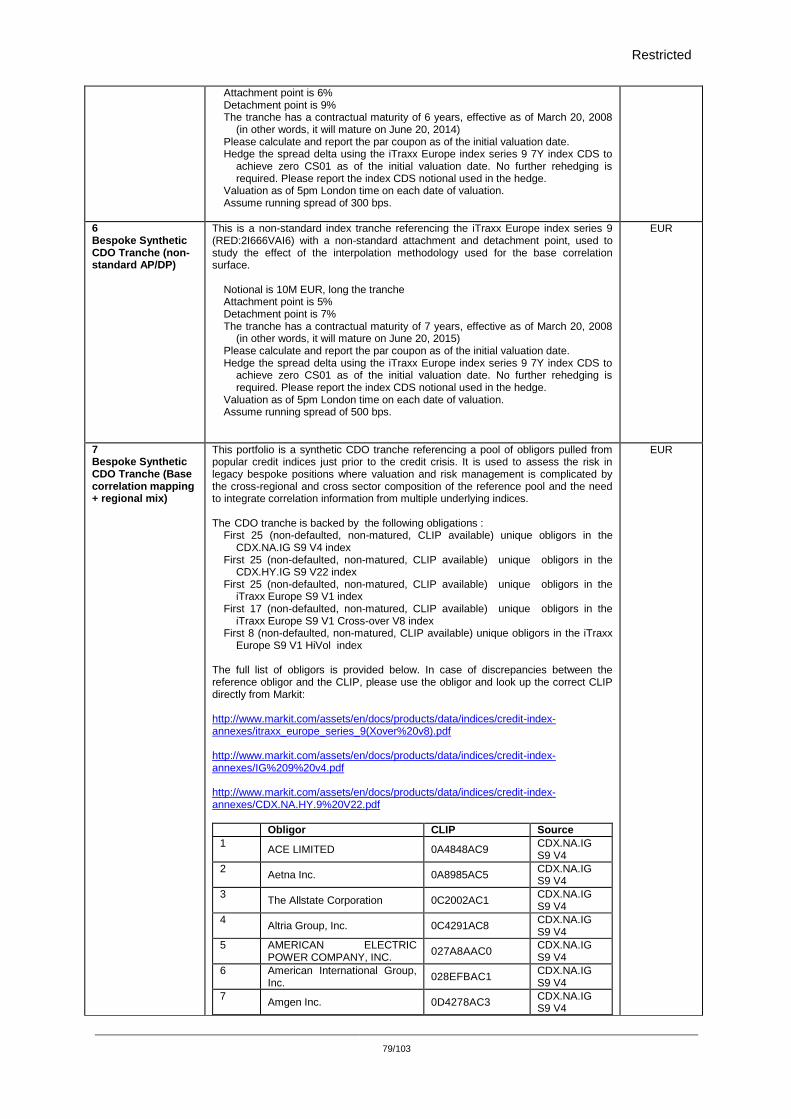
Restricted
79/103
Attachment point is 6% Detachment point is 9% The tranche has a contractual maturity of 6 years, effective as of March 20, 2008
(in other words, it will mature on June 20, 2014) Please calculate and report the par coupon as of the initial valuation date. Hedge the spread delta using the iTraxx Europe index series 9 7Y index CDS to
achieve zero CS01 as of the initial valuation date. No further rehedging is required. Please report the index CDS notional used in the hedge.
Valuation as of 5pm London time on each date of valuation. Assume running spread of 300 bps.
6 Bespoke Synthetic CDO Tranche (non-standard AP/DP)
This is a non-standard index tranche referencing the iTraxx Europe index series 9 (RED:2I666VAI6) with a non-standard attachment and detachment point, used to study the effect of the interpolation methodology used for the base correlation surface.
Notional is 10M EUR, long the tranche Attachment point is 5% Detachment point is 7% The tranche has a contractual maturity of 7 years, effective as of March 20, 2008
(in other words, it will mature on June 20, 2015) Please calculate and report the par coupon as of the initial valuation date. Hedge the spread delta using the iTraxx Europe index series 9 7Y index CDS to
achieve zero CS01 as of the initial valuation date. No further rehedging is required. Please report the index CDS notional used in the hedge.
Valuation as of 5pm London time on each date of valuation. Assume running spread of 500 bps.
EUR
7 Bespoke Synthetic CDO Tranche (Base correlation mapping + regional mix)
This portfolio is a synthetic CDO tranche referencing a pool of obligors pulled from popular credit indices just prior to the credit crisis. It is used to assess the risk in legacy bespoke positions where valuation and risk management is complicated by the cross-regional and cross sector composition of the reference pool and the need to integrate correlation information from multiple underlying indices. The CDO tranche is backed by the following obligations :
First 25 (non-defaulted, non-matured, CLIP available) unique obligors in the CDX.NA.IG S9 V4 index
First 25 (non-defaulted, non-matured, CLIP available) unique obligors in the CDX.HY.IG S9 V22 index
First 25 (non-defaulted, non-matured, CLIP available) unique obligors in the iTraxx Europe S9 V1 index
First 17 (non-defaulted, non-matured, CLIP available) unique obligors in the iTraxx Europe S9 V1 Cross-over V8 index
First 8 (non-defaulted, non-matured, CLIP available) unique obligors in the iTraxx Europe S9 V1 HiVol index
The full list of obligors is provided below. In case of discrepancies between the reference obligor and the CLIP, please use the obligor and look up the correct CLIP directly from Markit: http://www.markit.com/assets/en/docs/products/data/indices/credit-index-annexes/itraxx_europe_series_9(Xover%20v8).pdf http://www.markit.com/assets/en/docs/products/data/indices/credit-index-annexes/IG%209%20v4.pdf http://www.markit.com/assets/en/docs/products/data/indices/credit-index-annexes/CDX.NA.HY.9%20V22.pdf
Obligor CLIP Source
1 ACE LIMITED 0A4848AC9
CDX.NA.IG S9 V4
2 Aetna Inc. 0A8985AC5
CDX.NA.IG S9 V4
3 The Allstate Corporation 0C2002AC1
CDX.NA.IG S9 V4
4 Altria Group, Inc. 0C4291AC8
CDX.NA.IG S9 V4
5 AMERICAN ELECTRIC POWER COMPANY, INC.
027A8AAC0 CDX.NA.IG S9 V4
6 American International Group, Inc.
028EFBAC1 CDX.NA.IG S9 V4
7 Amgen Inc. 0D4278AC3
CDX.NA.IG S9 V4
EUR
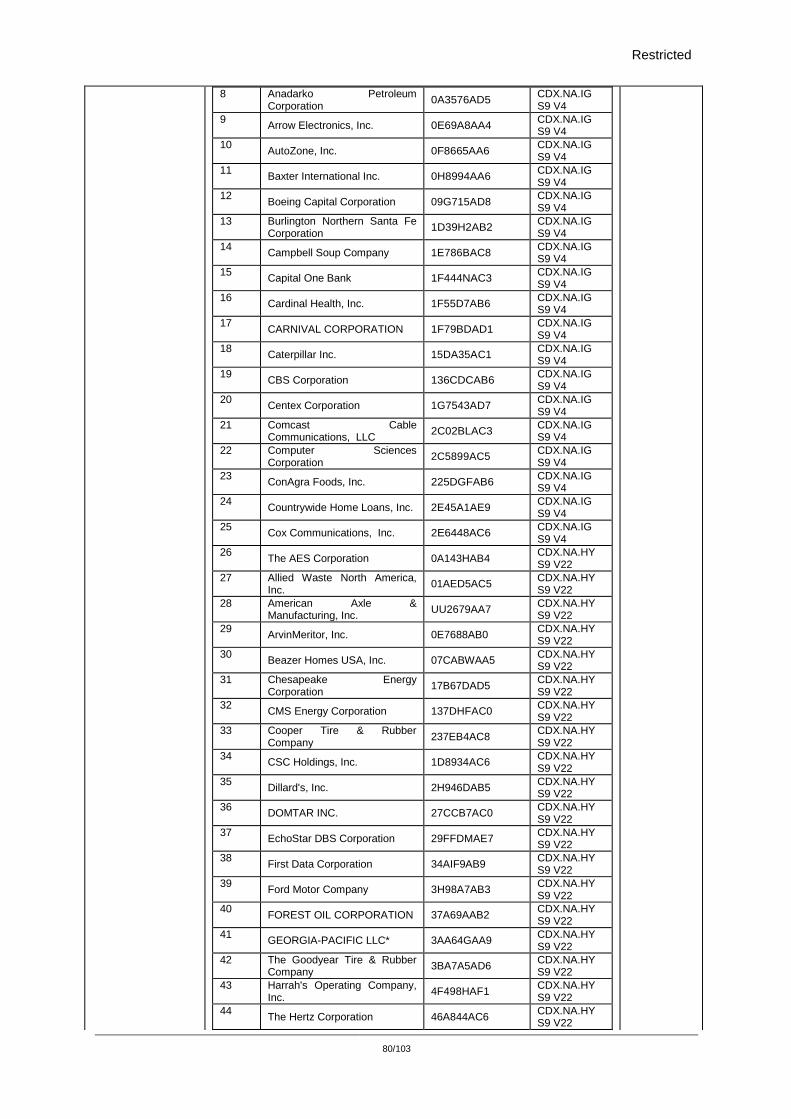
Restricted
80/103
8 Anadarko Petroleum Corporation
0A3576AD5 CDX.NA.IG S9 V4
9 Arrow Electronics, Inc. 0E69A8AA4
CDX.NA.IG S9 V4
10 AutoZone, Inc. 0F8665AA6
CDX.NA.IG S9 V4
11 Baxter International Inc. 0H8994AA6
CDX.NA.IG S9 V4
12 Boeing Capital Corporation 09G715AD8
CDX.NA.IG S9 V4
13 Burlington Northern Santa Fe Corporation
1D39H2AB2 CDX.NA.IG S9 V4
14 Campbell Soup Company 1E786BAC8
CDX.NA.IG S9 V4
15 Capital One Bank 1F444NAC3
CDX.NA.IG S9 V4
16 Cardinal Health, Inc. 1F55D7AB6
CDX.NA.IG S9 V4
17 CARNIVAL CORPORATION 1F79BDAD1
CDX.NA.IG S9 V4
18 Caterpillar Inc. 15DA35AC1
CDX.NA.IG S9 V4
19 CBS Corporation 136CDCAB6
CDX.NA.IG S9 V4
20 Centex Corporation 1G7543AD7
CDX.NA.IG S9 V4
21 Comcast Cable Communications, LLC
2C02BLAC3 CDX.NA.IG S9 V4
22 Computer Sciences Corporation
2C5899AC5 CDX.NA.IG S9 V4
23 ConAgra Foods, Inc. 225DGFAB6
CDX.NA.IG S9 V4
24 Countrywide Home Loans, Inc. 2E45A1AE9
CDX.NA.IG S9 V4
25 Cox Communications, Inc. 2E6448AC6
CDX.NA.IG S9 V4
26 The AES Corporation 0A143HAB4
CDX.NA.HY S9 V22
27 Allied Waste North America, Inc.
01AED5AC5 CDX.NA.HY S9 V22
28 American Axle & Manufacturing, Inc.
UU2679AA7 CDX.NA.HY S9 V22
29 ArvinMeritor, Inc. 0E7688AB0
CDX.NA.HY S9 V22
30 Beazer Homes USA, Inc. 07CABWAA5
CDX.NA.HY S9 V22
31 Chesapeake Energy Corporation
17B67DAD5 CDX.NA.HY S9 V22
32 CMS Energy Corporation 137DHFAC0
CDX.NA.HY S9 V22
33 Cooper Tire & Rubber Company
237EB4AC8 CDX.NA.HY S9 V22
34 CSC Holdings, Inc. 1D8934AC6
CDX.NA.HY S9 V22
35 Dillard's, Inc. 2H946DAB5
CDX.NA.HY S9 V22
36 DOMTAR INC. 27CCB7AC0
CDX.NA.HY S9 V22
37 EchoStar DBS Corporation 29FFDMAE7
CDX.NA.HY S9 V22
38 First Data Corporation 34AIF9AB9
CDX.NA.HY S9 V22
39 Ford Motor Company 3H98A7AB3
CDX.NA.HY S9 V22
40 FOREST OIL CORPORATION 37A69AAB2
CDX.NA.HY S9 V22
41 GEORGIA-PACIFIC LLC* 3AA64GAA9
CDX.NA.HY S9 V22
42 The Goodyear Tire & Rubber Company
3BA7A5AD6 CDX.NA.HY S9 V22
43 Harrah's Operating Company, Inc.
4F498HAF1 CDX.NA.HY S9 V22
44 The Hertz Corporation 46A844AC6
CDX.NA.HY S9 V22
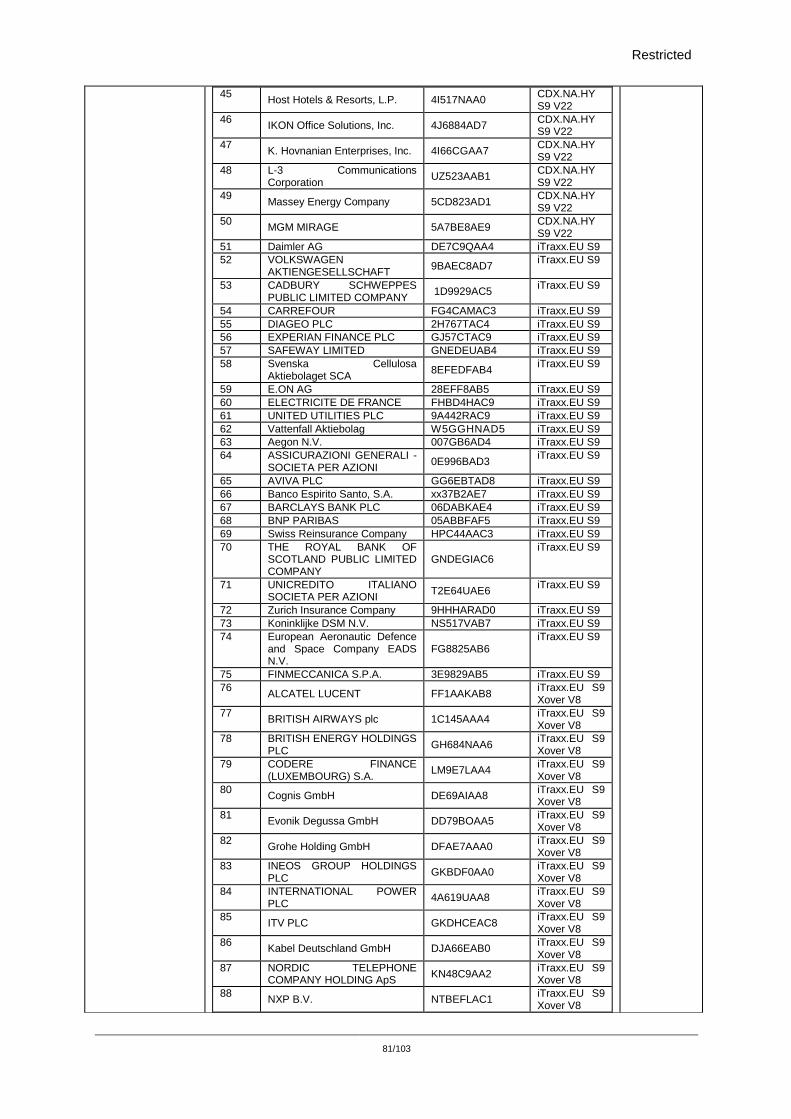
Restricted
81/103
45 Host Hotels & Resorts, L.P. 4I517NAA0
CDX.NA.HY S9 V22
46 IKON Office Solutions, Inc. 4J6884AD7
CDX.NA.HY S9 V22
47 K. Hovnanian Enterprises, Inc. 4I66CGAA7
CDX.NA.HY S9 V22
48 L-3 Communications Corporation
UZ523AAB1 CDX.NA.HY S9 V22
49 Massey Energy Company 5CD823AD1
CDX.NA.HY S9 V22
50 MGM MIRAGE 5A7BE8AE9
CDX.NA.HY S9 V22
51 Daimler AG DE7C9QAA4 iTraxx.EU S9
52 VOLKSWAGEN AKTIENGESELLSCHAFT
9BAEC8AD7 iTraxx.EU S9
53 CADBURY SCHWEPPES PUBLIC LIMITED COMPANY
1D9929AC5 iTraxx.EU S9
54 CARREFOUR FG4CAMAC3 iTraxx.EU S9
55 DIAGEO PLC 2H767TAC4 iTraxx.EU S9
56 EXPERIAN FINANCE PLC GJ57CTAC9 iTraxx.EU S9
57 SAFEWAY LIMITED GNEDEUAB4 iTraxx.EU S9
58 Svenska Cellulosa Aktiebolaget SCA
8EFEDFAB4 iTraxx.EU S9
59 E.ON AG 28EFF8AB5 iTraxx.EU S9
60 ELECTRICITE DE FRANCE FHBD4HAC9 iTraxx.EU S9
61 UNITED UTILITIES PLC 9A442RAC9 iTraxx.EU S9
62 Vattenfall Aktiebolag W5GGHNAD5 iTraxx.EU S9
63 Aegon N.V. 007GB6AD4 iTraxx.EU S9
64 ASSICURAZIONI GENERALI - SOCIETA PER AZIONI
0E996BAD3 iTraxx.EU S9
65 AVIVA PLC GG6EBTAD8 iTraxx.EU S9
66 Banco Espirito Santo, S.A. xx37B2AE7 iTraxx.EU S9
67 BARCLAYS BANK PLC 06DABKAE4 iTraxx.EU S9
68 BNP PARIBAS 05ABBFAF5 iTraxx.EU S9
69 Swiss Reinsurance Company HPC44AAC3 iTraxx.EU S9
70 THE ROYAL BANK OF SCOTLAND PUBLIC LIMITED COMPANY
GNDEGIAC6 iTraxx.EU S9
71 UNICREDITO ITALIANO SOCIETA PER AZIONI
T2E64UAE6 iTraxx.EU S9
72 Zurich Insurance Company 9HHHARAD0 iTraxx.EU S9
73 Koninklijke DSM N.V. NS517VAB7 iTraxx.EU S9
74 European Aeronautic Defence and Space Company EADS N.V.
FG8825AB6 iTraxx.EU S9
75 FINMECCANICA S.P.A. 3E9829AB5 iTraxx.EU S9
76 ALCATEL LUCENT FF1AAKAB8
iTraxx.EU S9 Xover V8
77 BRITISH AIRWAYS plc 1C145AAA4
iTraxx.EU S9 Xover V8
78 BRITISH ENERGY HOLDINGS PLC
GH684NAA6 iTraxx.EU S9 Xover V8
79 CODERE FINANCE (LUXEMBOURG) S.A.
LM9E7LAA4 iTraxx.EU S9 Xover V8
80 Cognis GmbH DE69AIAA8
iTraxx.EU S9 Xover V8
81 Evonik Degussa GmbH DD79BOAA5
iTraxx.EU S9 Xover V8
82 Grohe Holding GmbH DFAE7AAA0
iTraxx.EU S9 Xover V8
83 INEOS GROUP HOLDINGS PLC
GKBDF0AA0 iTraxx.EU S9 Xover V8
84 INTERNATIONAL POWER PLC
4A619UAA8 iTraxx.EU S9 Xover V8
85 ITV PLC GKDHCEAC8
iTraxx.EU S9 Xover V8
86 Kabel Deutschland GmbH DJA66EAB0
iTraxx.EU S9 Xover V8
87 NORDIC TELEPHONE COMPANY HOLDING ApS
KN48C9AA2 iTraxx.EU S9 Xover V8
88 NXP B.V. NTBEFLAC1
iTraxx.EU S9 Xover V8
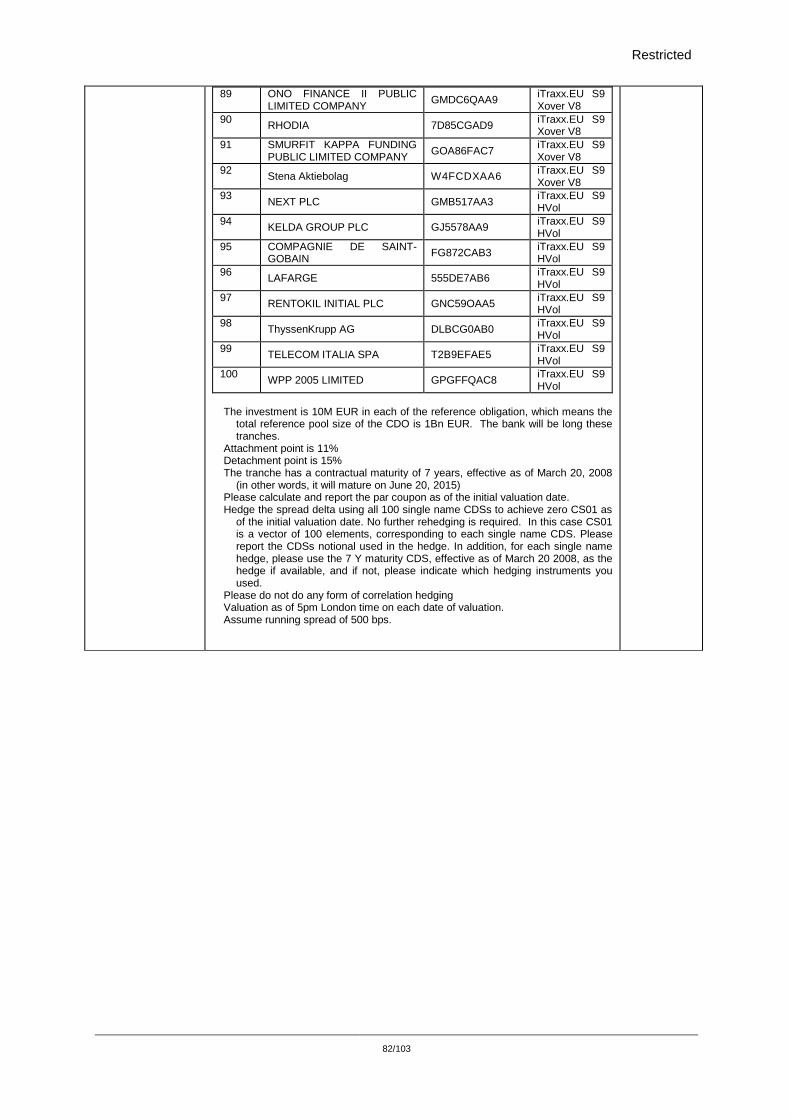
Restricted
82/103
89 ONO FINANCE II PUBLIC LIMITED COMPANY
GMDC6QAA9 iTraxx.EU S9 Xover V8
90 RHODIA 7D85CGAD9
iTraxx.EU S9 Xover V8
91 SMURFIT KAPPA FUNDING PUBLIC LIMITED COMPANY
GOA86FAC7 iTraxx.EU S9 Xover V8
92 Stena Aktiebolag W4FCDXAA6
iTraxx.EU S9 Xover V8
93 NEXT PLC GMB517AA3
iTraxx.EU S9 HVol
94 KELDA GROUP PLC GJ5578AA9
iTraxx.EU S9 HVol
95 COMPAGNIE DE SAINT-GOBAIN
FG872CAB3 iTraxx.EU S9 HVol
96 LAFARGE 555DE7AB6
iTraxx.EU S9 HVol
97 RENTOKIL INITIAL PLC GNC59OAA5
iTraxx.EU S9 HVol
98 ThyssenKrupp AG DLBCG0AB0
iTraxx.EU S9 HVol
99 TELECOM ITALIA SPA T2B9EFAE5
iTraxx.EU S9 HVol
100 WPP 2005 LIMITED GPGFFQAC8
iTraxx.EU S9 HVol
The investment is 10M EUR in each of the reference obligation, which means the
total reference pool size of the CDO is 1Bn EUR. The bank will be long these tranches.
Attachment point is 11% Detachment point is 15% The tranche has a contractual maturity of 7 years, effective as of March 20, 2008
(in other words, it will mature on June 20, 2015) Please calculate and report the par coupon as of the initial valuation date. Hedge the spread delta using all 100 single name CDSs to achieve zero CS01 as
of the initial valuation date. No further rehedging is required. In this case CS01 is a vector of 100 elements, corresponding to each single name CDS. Please report the CDSs notional used in the hedge. In addition, for each single name hedge, please use the 7 Y maturity CDS, effective as of March 20 2008, as the hedge if available, and if not, please indicate which hedging instruments you used.
Please do not do any form of correlation hedging Valuation as of 5pm London time on each date of valuation. Assume running spread of 500 bps.
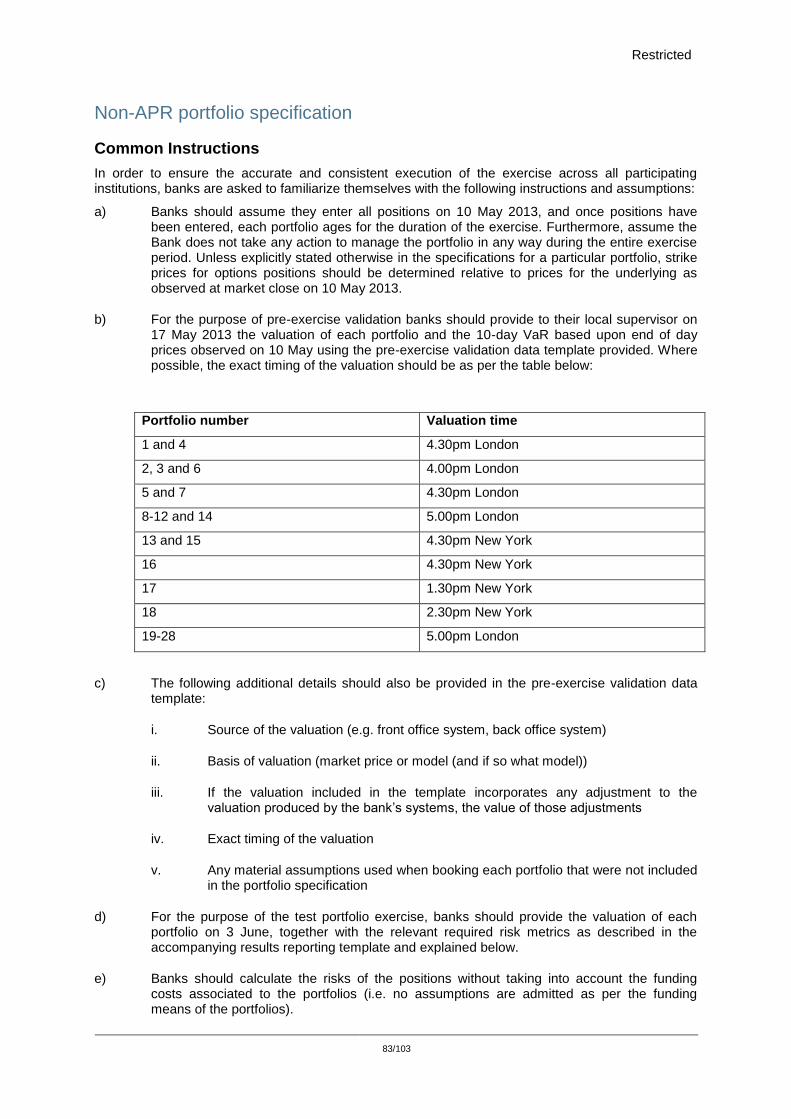
Restricted
83/103
Non-APR portfolio specification
Common Instructions
In order to ensure the accurate and consistent execution of the exercise across all participating institutions, banks are asked to familiarize themselves with the following instructions and assumptions:
a) Banks should assume they enter all positions on 10 May 2013, and once positions have been entered, each portfolio ages for the duration of the exercise. Furthermore, assume the Bank does not take any action to manage the portfolio in any way during the entire exercise period. Unless explicitly stated otherwise in the specifications for a particular portfolio, strike prices for options positions should be determined relative to prices for the underlying as observed at market close on 10 May 2013.
b) For the purpose of pre-exercise validation banks should provide to their local supervisor on 17 May 2013 the valuation of each portfolio and the 10-day VaR based upon end of day prices observed on 10 May using the pre-exercise validation data template provided. Where possible, the exact timing of the valuation should be as per the table below:
Portfolio number Valuation time
1 and 4 4.30pm London
2, 3 and 6 4.00pm London
5 and 7 4.30pm London
8-12 and 14 5.00pm London
13 and 15 4.30pm New York
16 4.30pm New York
17 1.30pm New York
18 2.30pm New York
19-28 5.00pm London
c) The following additional details should also be provided in the pre-exercise validation data template:
i. Source of the valuation (e.g. front office system, back office system)
ii. Basis of valuation (market price or model (and if so what model))
iii. If the valuation included in the template incorporates any adjustment to the valuation produced by the bank’s systems, the value of those adjustments
iv. Exact timing of the valuation
v. Any material assumptions used when booking each portfolio that were not included in the portfolio specification
d) For the purpose of the test portfolio exercise, banks should provide the valuation of each portfolio on 3 June, together with the relevant required risk metrics as described in the accompanying results reporting template and explained below.
e) Banks should calculate the risks of the positions without taking into account the funding costs associated to the portfolios (i.e. no assumptions are admitted as per the funding means of the portfolios).
Restricted
84/103
f) Banks should exclude to the extent possible counterparty credit risk when valuing the risks of the portfolios.
g) Banks should calculate 10-day 99% VaR on a daily basis. If a participating bank also calculates VaR by risk factor, it may elect to separately provide an additional breakdown of total VaR, GMR (General Market Risk) VaR, DSR (Debt Specific Risk) VaR, and ESR (Equity Specific Risk) VaR for each portfolio as applicable.
h) Stressed VaR and IRC are to be calculated on a weekly basis. We would prefer that calculate Stressed VaR and IRC based on end of day prices for each Friday in the time window for the exercise. However, flexibility will be granted to banks preferring to use results from another day of the week if required.
i) For each portfolio, banks are asked to provide results in two currencies; one in the Bank’s home currency and one in the base currency of the portfolio as provided in the table below.
j) In addition to VaR, stressed VaR and IRC risk metrics, banks should also provide the initial market value of each portfolio on day one of the exercise, and indicate the stress period used in the calculation of each portfolio. For the selection of the stress period, the following applies:
– In order to facilitate a quantitative assessment of the impact of different choices for stress periods across banks, stressed VaR for portfolios other than any “all-in” portfolios will be calculated using the top-of-the-house stressed period currently used by each bank for its actual trading portfolio.
– For the ‘all-in portfolios’, each bank is asked to use its own internal process for stress period selection to identify the appropriate stress period. Banks are not required to identify a separate stress period for each ‘all-in’ portfolio, instead the stress period for portfolio 29 should be used for all of the ‘all-in’ portfolios.
k) For transactions that include long positions in CDS, assume an immediate up-front fee is paid to enter the position as per the market conventions as indicated by Markit Partners (25, 50, 100bps for investment grade, 500bps for high yield).
l) Assume that the maturity date for all CDS in the exercise follow conventional quarterly termination dates, often referred to as “IMM dates”.
m) Additional specifications required in order to compute pricing calculations required for CDS positions should be done in a way that is consistent with commonly used market standards.
n) Use the maturity date (i.e., some options expire on third Saturday of the month, etc.) that ensures the deal is closest to the term-to-maturity specified. For any material details of the product specification that are not explicitly stated in this document, please provide the assumptions you have used along with the results (i.e., day count convention, etc.).
o) The acronyms ATM, OTM and ITM refer to an option’s moneyness: ATM stands for “at the money”, OTM stands for “out of the money”, and ITM means “in the money”.
p) Assume that all options are traded over-the-counter unless explicitly specified in the portfolios
q) Follow the standard timing conventions for OTC options (i.e. expiry dates are the business day following a holiday)
r) Assume that the timing convention for options is as follows: The time to maturity for a n-month option entered on 10 May is in n months. For example, a 3-month OTC option entered on May 10, 2013 expires on August 10, 2013. If options expire on a non-trading day, adjust the expiration date as per business day conventions consistent with common practices. Also provide explicit details on the nature of the adjustment made.
Restricted
85/103
s) Assume that the exercise style for all OTC options specified is as follows:
– American for single name equities and commodities, and,
– European for equity indices, foreign exchange and Swaptions.
t) For all options exclude the premium from the initial market value calculations (i.e. options are to be considered as “naked”).
u) In the case that a bank is required to make additional assumptions beyond those specified above that it believes are relevant to the interpretation of its exercise results (e.g. close of business timing, coupon rolls, mapping against indices, etc.), it should submit a description of those specifications in a separate document accompanying its return template.
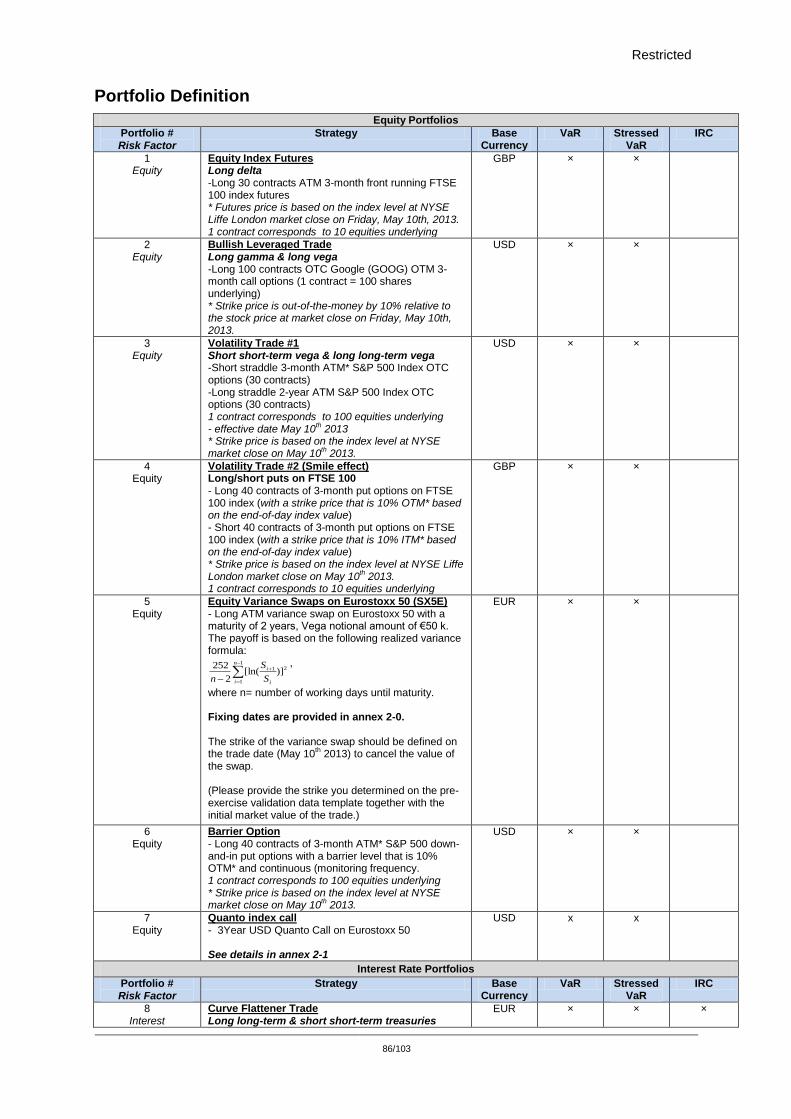
Restricted
86/103
Portfolio Definition
Equity Portfolios
Portfolio # Risk Factor
Strategy Base Currency
VaR Stressed VaR
IRC
1 Equity
Equity Index Futures Long delta -Long 30 contracts ATM 3-month front running FTSE 100 index futures * Futures price is based on the index level at NYSE Liffe London market close on Friday, May 10th, 2013. 1 contract corresponds to 10 equities underlying
GBP × ×
2 Equity
Bullish Leveraged Trade Long gamma & long vega -Long 100 contracts OTC Google (GOOG) OTM 3-month call options (1 contract = 100 shares underlying) * Strike price is out-of-the-money by 10% relative to the stock price at market close on Friday, May 10th, 2013.
USD × ×
3 Equity
Volatility Trade #1 Short short-term vega & long long-term vega -Short straddle 3-month ATM* S&P 500 Index OTC options (30 contracts) -Long straddle 2-year ATM S&P 500 Index OTC options (30 contracts) 1 contract corresponds to 100 equities underlying - effective date May 10
th 2013
* Strike price is based on the index level at NYSE market close on May 10
th 2013.
USD × ×
4 Equity
Volatility Trade #2 (Smile effect) Long/short puts on FTSE 100 - Long 40 contracts of 3-month put options on FTSE 100 index (with a strike price that is 10% OTM* based on the end-of-day index value) - Short 40 contracts of 3-month put options on FTSE 100 index (with a strike price that is 10% ITM* based on the end-of-day index value) * Strike price is based on the index level at NYSE Liffe London market close on May 10
th 2013.
1 contract corresponds to 10 equities underlying
GBP × ×
5 Equity
Equity Variance Swaps on Eurostoxx 50 (SX5E) - Long ATM variance swap on Eurostoxx 50 with a maturity of 2 years, Vega notional amount of €50 k. The payoff is based on the following realized variance formula:
1
1
21 )][ln(2
252 n
i i
i
S
S
n
,
where n= number of working days until maturity. Fixing dates are provided in annex 2-0. The strike of the variance swap should be defined on the trade date (May 10
th 2013) to cancel the value of
the swap. (Please provide the strike you determined on the pre-exercise validation data template together with the initial market value of the trade.)
See annex 2-0 for the de
EUR × ×
6 Equity
Barrier Option - Long 40 contracts of 3-month ATM* S&P 500 down-and-in put options with a barrier level that is 10% OTM* and continuous (monitoring frequency. 1 contract corresponds to 100 equities underlying * Strike price is based on the index level at NYSE market close on May 10
th 2013.
USD × ×
7 Equity
Quanto index call - 3Year USD Quanto Call on Eurostoxx 50 See details in annex 2-1
USD x x
Interest Rate Portfolios
Portfolio # Risk Factor
Strategy Base Currency
VaR Stressed VaR
IRC
8 Interest
Curve Flattener Trade Long long-term & short short-term treasuries
EUR × × ×
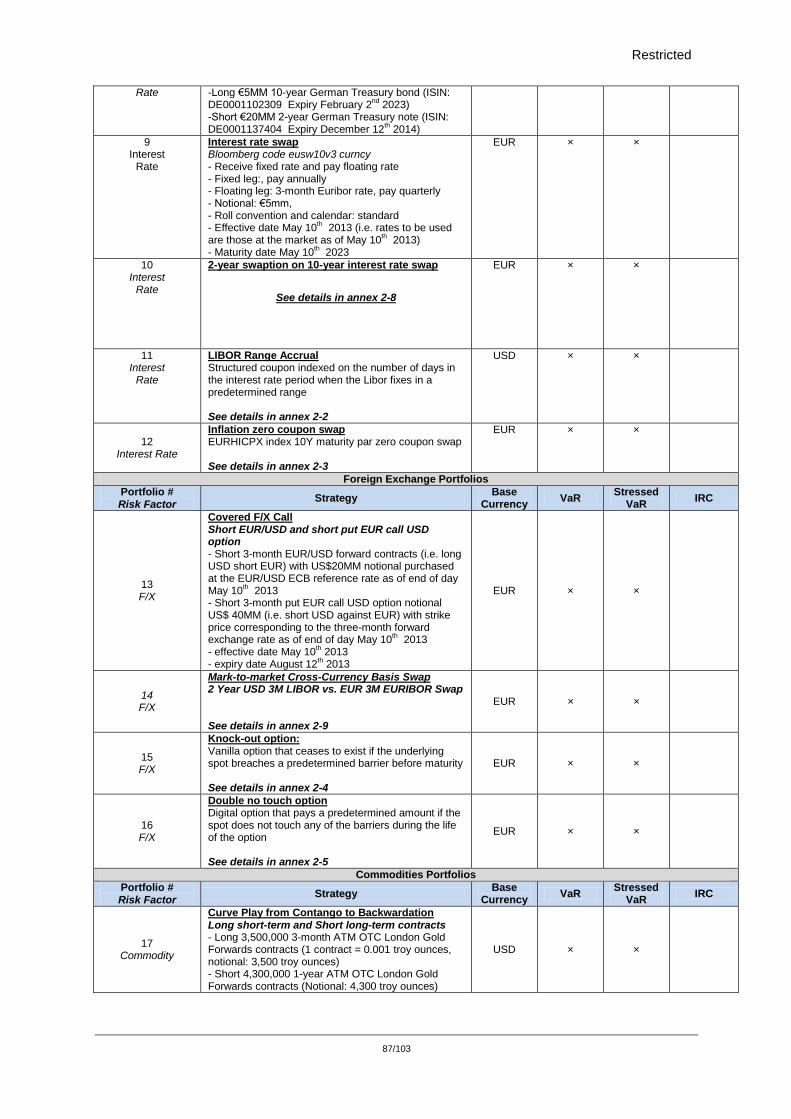
Restricted
87/103
Rate -Long €5MM 10-year German Treasury bond (ISIN: DE0001102309 Expiry February 2
nd 2023)
-Short €20MM 2-year German Treasury note (ISIN: DE0001137404 Expiry December 12
th 2014)
9 Interest
Rate
Interest rate swap Bloomberg code eusw10v3 curncy - Receive fixed rate and pay floating rate - Fixed leg:, pay annually - Floating leg: 3-month Euribor rate, pay quarterly - Notional: €5mm, - Roll convention and calendar: standard - Effective date May 10
th 2013 (i.e. rates to be used
are those at the market as of May 10th 2013)
- Maturity date May 10th 2023
EUR × ×
10 Interest
Rate
2-year swaption on 10-year interest rate swap
See details in annex 2-8
EUR × ×
11 Interest
Rate
LIBOR Range Accrual Structured coupon indexed on the number of days in the interest rate period when the Libor fixes in a predetermined range 05 June 20 See details in annex 2-2 Number of days when the Range Accrual Index fixes between the Lower Barrier and the Upper Barrier (inclusive) during the relevant Interest Period Number of days when the Range Accrual Index fixes between the Lower Barrier and the Upper Barrier (inclusive) during the relevant Interest Period
USD × ×
12
Interest Rate
Inflation zero coupon swap EURHICPX index 10Y maturity par zero coupon swap See details in annex 2-3
EUR × ×
Foreign Exchange Portfolios
Portfolio # Risk Factor
Strategy Base
Currency VaR
Stressed VaR
IRC
13 F/X
Covered F/X Call Short EUR/USD and short put EUR call USD option - Short 3-month EUR/USD forward contracts (i.e. long USD short EUR) with US$20MM notional purchased at the EUR/USD ECB reference rate as of end of day May 10
th 2013
- Short 3-month put EUR call USD option notional US$ 40MM (i.e. short USD against EUR) with strike price corresponding to the three-month forward exchange rate as of end of day May 10
th 2013
- effective date May 10th 2013
- expiry date August 12th 2013
EUR × ×
14 F/X
Mark-to-market Cross-Currency Basis Swap 2 Year USD 3M LIBOR vs. EUR 3M EURIBOR Swap See details in annex 2-9
EUR × ×
15 F/X
Knock-out option: Vanilla option that ceases to exist if the underlying spot breaches a predetermined barrier before maturity See details in annex 2-4
EUR × ×
16 F/X
Double no touch option Digital option that pays a predetermined amount if the spot does not touch any of the barriers during the life of the option See details in annex 2-5
EUR × ×
Commodities Portfolios
Portfolio # Risk Factor
Strategy Base
Currency VaR
Stressed VaR
IRC
17 Commodity
Curve Play from Contango to Backwardation Long short-term and Short long-term contracts - Long 3,500,000 3-month ATM OTC London Gold Forwards contracts (1 contract = 0.001 troy ounces, notional: 3,500 troy ounces) - Short 4,300,000 1-year ATM OTC London Gold Forwards contracts (Notional: 4,300 troy ounces)
USD × ×
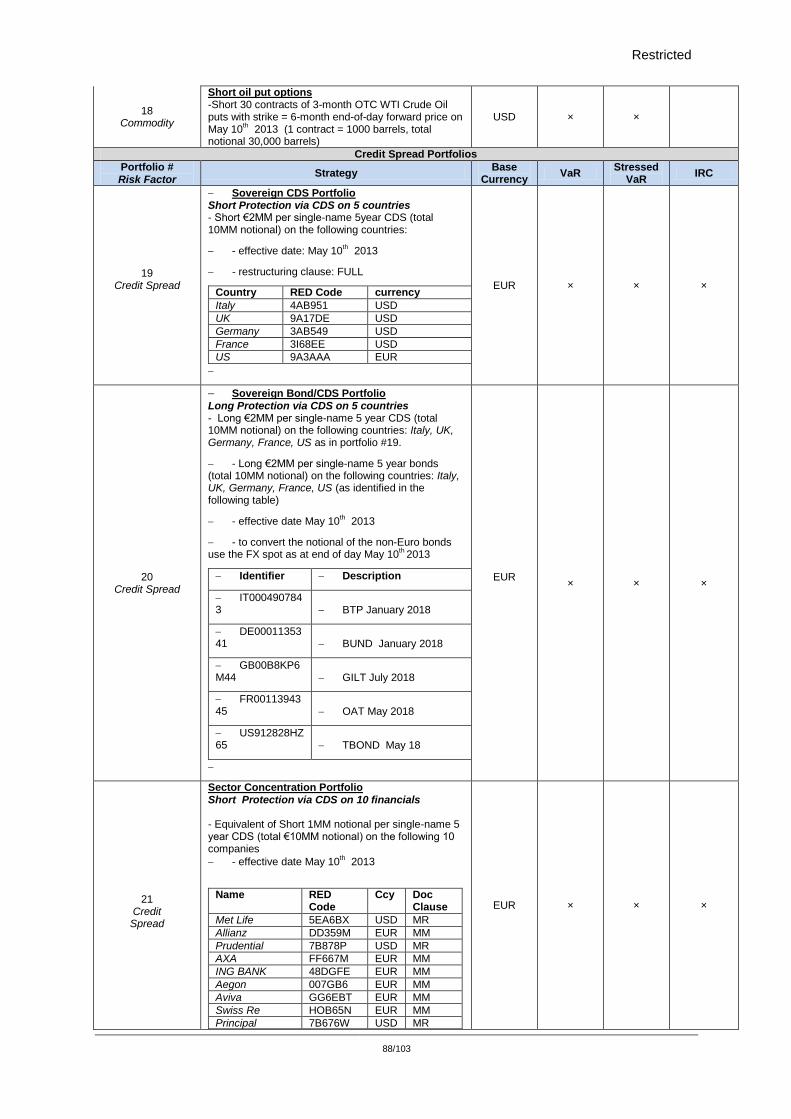
Restricted
88/103
18 Commodity
Short oil put options -Short 30 contracts of 3-month OTC WTI Crude Oil puts with strike = 6-month end-of-day forward price on May 10
th 2013 (1 contract = 1000 barrels, total
notional 30,000 barrels)
USD × ×
Credit Spread Portfolios
Portfolio # Risk Factor
Strategy Base
Currency VaR
Stressed VaR
IRC
19 Credit Spread
Sovereign CDS Portfolio Short Protection via CDS on 5 countries - Short €2MM per single-name 5year CDS (total 10MM notional) on the following countries:
- effective date: May 10th 2013
- restructuring clause: FULL
Country RED Code currency
Italy 4AB951 USD
UK 9A17DE USD
Germany 3AB549 USD
France 3I68EE USD
US 9A3AAA EUR
EUR
× × ×
20 Credit Spread
Sovereign Bond/CDS Portfolio Long Protection via CDS on 5 countries - Long €2MM per single-name 5 year CDS (total 10MM notional) on the following countries: Italy, UK, Germany, France, US as in portfolio #19.
- Long €2MM per single-name 5 year bonds (total 10MM notional) on the following countries: Italy, UK, Germany, France, US (as identified in the following table)
- effective date May 10th 2013
- to convert the notional of the non-Euro bonds use the FX spot as at end of day May 10
th 2013
Identifier Description
IT0004907843 BTP January 2018
DE0001135341 BUND January 2018
GB00B8KP6M44 GILT July 2018
FR0011394345 OAT May 2018
US912828HZ65 TBOND May 18
EUR
× × ×
21
Credit Spread
Sector Concentration Portfolio Short Protection via CDS on 10 financials - Equivalent of Short 1MM notional per single-name 5 year CDS (total €10MM notional) on the following 10 companies
- effective date May 10th 2013
Name RED Code
Ccy Doc Clause
Met Life 5EA6BX USD MR
Allianz DD359M EUR MM
Prudential 7B878P USD MR
AXA FF667M EUR MM
ING BANK 48DGFE EUR MM
Aegon 007GB6 EUR MM
Aviva GG6EBT EUR MM
Swiss Re HOB65N EUR MM
Principal 7B676W USD MR
EUR × × ×
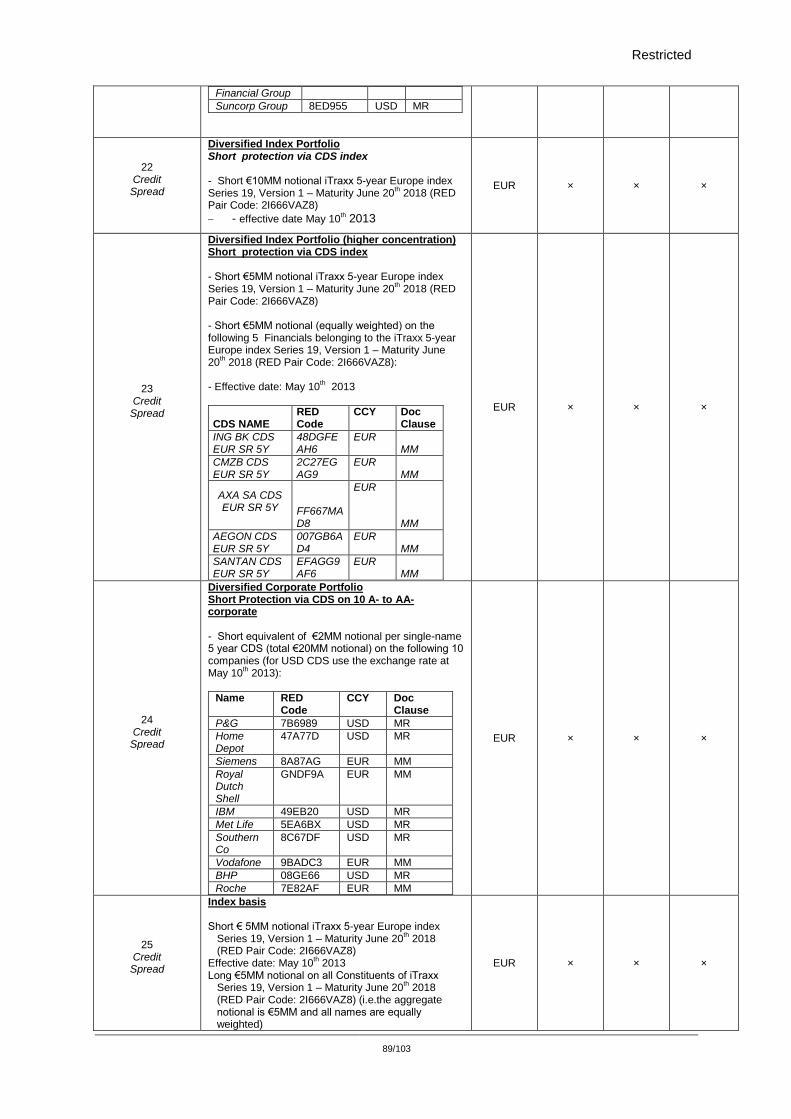
Restricted
89/103
Financial Group
Suncorp Group 8ED955 USD MR
22 Credit Spread
Diversified Index Portfolio Short protection via CDS index - Short €10MM notional iTraxx 5-year Europe index Series 19, Version 1 – Maturity June 20
th 2018 (RED
Pair Code: 2I666VAZ8)
- effective date May 10th 2013
EUR × × ×
23 Credit Spread
Diversified Index Portfolio (higher concentration) Short protection via CDS index - Short €5MM notional iTraxx 5-year Europe index Series 19, Version 1 – Maturity June 20
th 2018 (RED
Pair Code: 2I666VAZ8) - Short €5MM notional (equally weighted) on the following 5 Financials belonging to the iTraxx 5-year Europe index Series 19, Version 1 – Maturity June 20
th 2018 (RED Pair Code: 2I666VAZ8):
- Effective date: May 10th 2013
CDS NAME RED Code
CCY Doc Clause
ING BK CDS EUR SR 5Y
48DGFEAH6
EUR MM
CMZB CDS EUR SR 5Y
2C27EGAG9
EUR MM
AXA SA CDS EUR SR 5Y FF667MA
D8
EUR
MM
AEGON CDS EUR SR 5Y
007GB6AD4
EUR MM
SANTAN CDS EUR SR 5Y
EFAGG9AF6
EUR MM
EUR × × ×
24 Credit Spread
Diversified Corporate Portfolio Short Protection via CDS on 10 A- to AA- corporate - Short equivalent of €2MM notional per single-name 5 year CDS (total €20MM notional) on the following 10 companies (for USD CDS use the exchange rate at May 10
th 2013):
Name RED Code
CCY Doc Clause
P&G 7B6989 USD MR
Home Depot
47A77D USD MR
Siemens 8A87AG EUR MM
Royal Dutch Shell
GNDF9A EUR MM
IBM 49EB20 USD MR
Met Life 5EA6BX USD MR
Southern Co
8C67DF USD MR
Vodafone 9BADC3 EUR MM
BHP 08GE66 USD MR
Roche 7E82AF EUR MM
EUR × × ×
25 Credit Spread
Index basis Short € 5MM notional iTraxx 5-year Europe index
Series 19, Version 1 – Maturity June 20th 2018
(RED Pair Code: 2I666VAZ8) Effective date: May 10
th 2013
Long €5MM notional on all Constituents of iTraxx Series 19, Version 1 – Maturity June 20
th 2018
(RED Pair Code: 2I666VAZ8) (i.e.the aggregate notional is €5MM and all names are equally weighted)
EUR × × ×
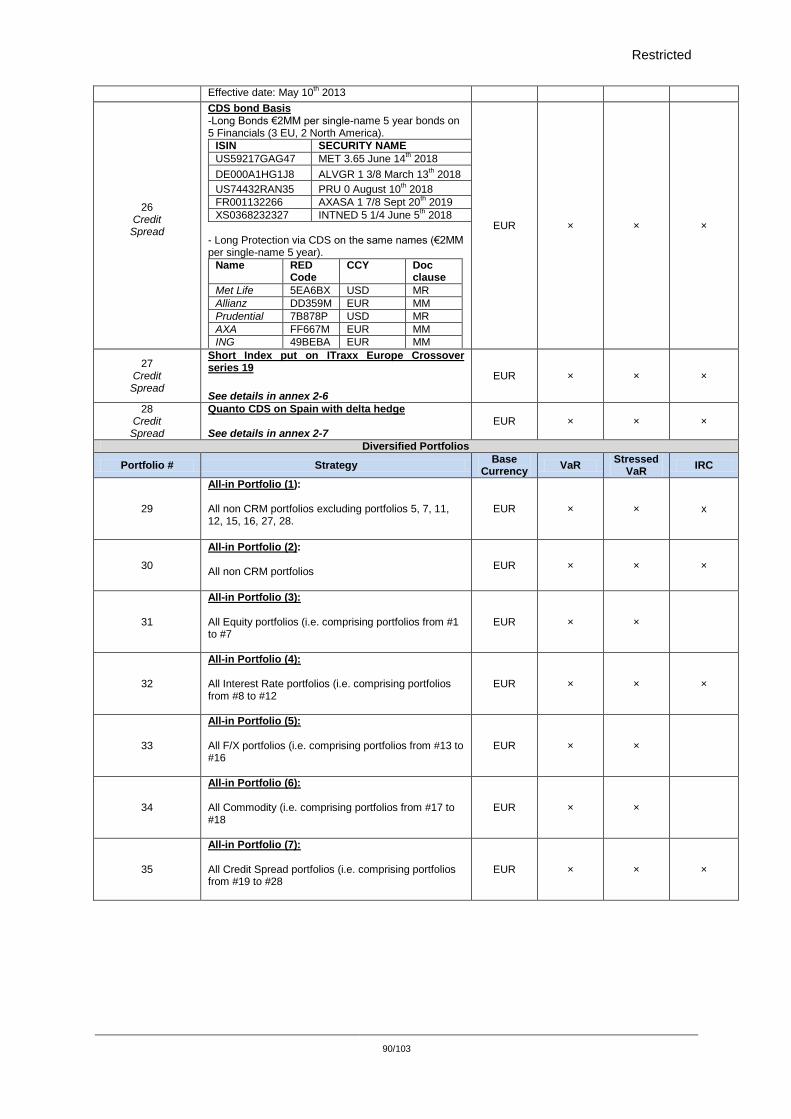
Restricted
90/103
Effective date: May 10th 2013
26 Credit Spread
CDS bond Basis -Long Bonds €2MM per single-name 5 year bonds on 5 Financials (3 EU, 2 North America).
ISIN SECURITY NAME
US59217GAG47 MET 3.65 June 14th 2018
DE000A1HG1J8 ALVGR 1 3/8 March 13th 2018
US74432RAN35 PRU 0 August 10th 2018
FR001132266 AXASA 1 7/8 Sept 20th 2019
XS0368232327 INTNED 5 1/4 June 5th 2018
- Long Protection via CDS on the same names (€2MM per single-name 5 year).
Name RED Code
CCY Doc clause
Met Life 5EA6BX USD MR
Allianz DD359M EUR MM
Prudential 7B878P USD MR
AXA FF667M EUR MM
ING 49BEBA EUR MM
EUR × × ×
27 Credit Spread
Short Index put on ITraxx Europe Crossover series 19
See details in annex 2-6
EUR × × ×
28 Credit Spread
Quanto CDS on Spain with delta hedge See details in annex 2-7
EUR × × ×
Diversified Portfolios
Portfolio # Strategy Base
Currency VaR
Stressed VaR
IRC
29
All-in Portfolio (1): All non CRM portfolios excluding portfolios 5, 7, 11, 12, 15, 16, 27, 28.
EUR × × x
30
All-in Portfolio (2): All non CRM portfolios
EUR × × ×
31
All-in Portfolio (3): All Equity portfolios (i.e. comprising portfolios from #1 to #7
EUR × ×
32
All-in Portfolio (4): All Interest Rate portfolios (i.e. comprising portfolios from #8 to #12
EUR × × ×
33
All-in Portfolio (5): All F/X portfolios (i.e. comprising portfolios from #13 to #16
EUR × ×
34
All-in Portfolio (6): All Commodity (i.e. comprising portfolios from #17 to #18
EUR × ×
35
All-in Portfolio (7): All Credit Spread portfolios (i.e. comprising portfolios from #19 to #28
EUR × × ×
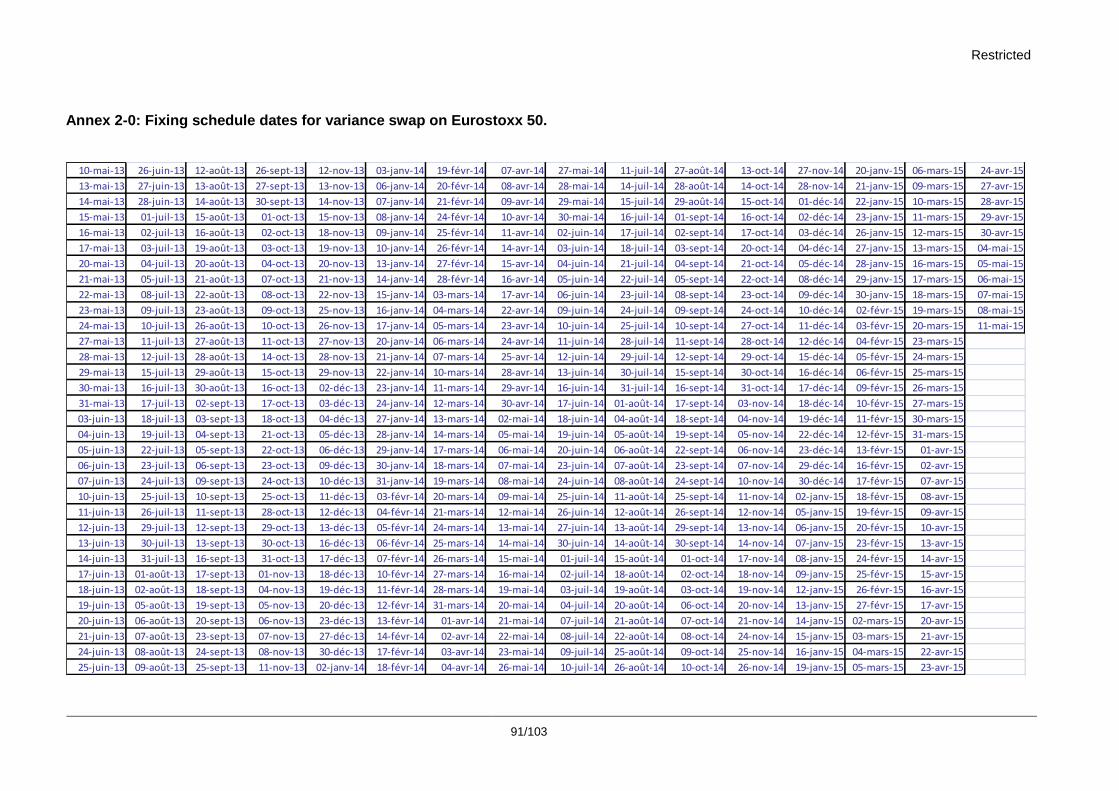
Restricted
91/103
Annex 2-0: Fixing schedule dates for variance swap on Eurostoxx 50.
10-mai-13 26-juin-13 12-août-13 26-sept-13 12-nov-13 03-janv-14 19-févr-14 07-avr-14 27-mai-14 11-juil-14 27-août-14 13-oct-14 27-nov-14 20-janv-15 06-mars-15 24-avr-15
13-mai-13 27-juin-13 13-août-13 27-sept-13 13-nov-13 06-janv-14 20-févr-14 08-avr-14 28-mai-14 14-juil-14 28-août-14 14-oct-14 28-nov-14 21-janv-15 09-mars-15 27-avr-15
14-mai-13 28-juin-13 14-août-13 30-sept-13 14-nov-13 07-janv-14 21-févr-14 09-avr-14 29-mai-14 15-juil-14 29-août-14 15-oct-14 01-déc-14 22-janv-15 10-mars-15 28-avr-15
15-mai-13 01-juil-13 15-août-13 01-oct-13 15-nov-13 08-janv-14 24-févr-14 10-avr-14 30-mai-14 16-juil-14 01-sept-14 16-oct-14 02-déc-14 23-janv-15 11-mars-15 29-avr-15
16-mai-13 02-juil-13 16-août-13 02-oct-13 18-nov-13 09-janv-14 25-févr-14 11-avr-14 02-juin-14 17-juil-14 02-sept-14 17-oct-14 03-déc-14 26-janv-15 12-mars-15 30-avr-15
17-mai-13 03-juil-13 19-août-13 03-oct-13 19-nov-13 10-janv-14 26-févr-14 14-avr-14 03-juin-14 18-juil-14 03-sept-14 20-oct-14 04-déc-14 27-janv-15 13-mars-15 04-mai-15
20-mai-13 04-juil-13 20-août-13 04-oct-13 20-nov-13 13-janv-14 27-févr-14 15-avr-14 04-juin-14 21-juil-14 04-sept-14 21-oct-14 05-déc-14 28-janv-15 16-mars-15 05-mai-15
21-mai-13 05-juil-13 21-août-13 07-oct-13 21-nov-13 14-janv-14 28-févr-14 16-avr-14 05-juin-14 22-juil-14 05-sept-14 22-oct-14 08-déc-14 29-janv-15 17-mars-15 06-mai-15
22-mai-13 08-juil-13 22-août-13 08-oct-13 22-nov-13 15-janv-14 03-mars-14 17-avr-14 06-juin-14 23-juil-14 08-sept-14 23-oct-14 09-déc-14 30-janv-15 18-mars-15 07-mai-15
23-mai-13 09-juil-13 23-août-13 09-oct-13 25-nov-13 16-janv-14 04-mars-14 22-avr-14 09-juin-14 24-juil-14 09-sept-14 24-oct-14 10-déc-14 02-févr-15 19-mars-15 08-mai-15
24-mai-13 10-juil-13 26-août-13 10-oct-13 26-nov-13 17-janv-14 05-mars-14 23-avr-14 10-juin-14 25-juil-14 10-sept-14 27-oct-14 11-déc-14 03-févr-15 20-mars-15 11-mai-15
27-mai-13 11-juil-13 27-août-13 11-oct-13 27-nov-13 20-janv-14 06-mars-14 24-avr-14 11-juin-14 28-juil-14 11-sept-14 28-oct-14 12-déc-14 04-févr-15 23-mars-15
28-mai-13 12-juil-13 28-août-13 14-oct-13 28-nov-13 21-janv-14 07-mars-14 25-avr-14 12-juin-14 29-juil-14 12-sept-14 29-oct-14 15-déc-14 05-févr-15 24-mars-15
29-mai-13 15-juil-13 29-août-13 15-oct-13 29-nov-13 22-janv-14 10-mars-14 28-avr-14 13-juin-14 30-juil-14 15-sept-14 30-oct-14 16-déc-14 06-févr-15 25-mars-15
30-mai-13 16-juil-13 30-août-13 16-oct-13 02-déc-13 23-janv-14 11-mars-14 29-avr-14 16-juin-14 31-juil-14 16-sept-14 31-oct-14 17-déc-14 09-févr-15 26-mars-15
31-mai-13 17-juil-13 02-sept-13 17-oct-13 03-déc-13 24-janv-14 12-mars-14 30-avr-14 17-juin-14 01-août-14 17-sept-14 03-nov-14 18-déc-14 10-févr-15 27-mars-15
03-juin-13 18-juil-13 03-sept-13 18-oct-13 04-déc-13 27-janv-14 13-mars-14 02-mai-14 18-juin-14 04-août-14 18-sept-14 04-nov-14 19-déc-14 11-févr-15 30-mars-15
04-juin-13 19-juil-13 04-sept-13 21-oct-13 05-déc-13 28-janv-14 14-mars-14 05-mai-14 19-juin-14 05-août-14 19-sept-14 05-nov-14 22-déc-14 12-févr-15 31-mars-15
05-juin-13 22-juil-13 05-sept-13 22-oct-13 06-déc-13 29-janv-14 17-mars-14 06-mai-14 20-juin-14 06-août-14 22-sept-14 06-nov-14 23-déc-14 13-févr-15 01-avr-15
06-juin-13 23-juil-13 06-sept-13 23-oct-13 09-déc-13 30-janv-14 18-mars-14 07-mai-14 23-juin-14 07-août-14 23-sept-14 07-nov-14 29-déc-14 16-févr-15 02-avr-15
07-juin-13 24-juil-13 09-sept-13 24-oct-13 10-déc-13 31-janv-14 19-mars-14 08-mai-14 24-juin-14 08-août-14 24-sept-14 10-nov-14 30-déc-14 17-févr-15 07-avr-15
10-juin-13 25-juil-13 10-sept-13 25-oct-13 11-déc-13 03-févr-14 20-mars-14 09-mai-14 25-juin-14 11-août-14 25-sept-14 11-nov-14 02-janv-15 18-févr-15 08-avr-15
11-juin-13 26-juil-13 11-sept-13 28-oct-13 12-déc-13 04-févr-14 21-mars-14 12-mai-14 26-juin-14 12-août-14 26-sept-14 12-nov-14 05-janv-15 19-févr-15 09-avr-15
12-juin-13 29-juil-13 12-sept-13 29-oct-13 13-déc-13 05-févr-14 24-mars-14 13-mai-14 27-juin-14 13-août-14 29-sept-14 13-nov-14 06-janv-15 20-févr-15 10-avr-15
13-juin-13 30-juil-13 13-sept-13 30-oct-13 16-déc-13 06-févr-14 25-mars-14 14-mai-14 30-juin-14 14-août-14 30-sept-14 14-nov-14 07-janv-15 23-févr-15 13-avr-15
14-juin-13 31-juil-13 16-sept-13 31-oct-13 17-déc-13 07-févr-14 26-mars-14 15-mai-14 01-juil-14 15-août-14 01-oct-14 17-nov-14 08-janv-15 24-févr-15 14-avr-15
17-juin-13 01-août-13 17-sept-13 01-nov-13 18-déc-13 10-févr-14 27-mars-14 16-mai-14 02-juil-14 18-août-14 02-oct-14 18-nov-14 09-janv-15 25-févr-15 15-avr-15
18-juin-13 02-août-13 18-sept-13 04-nov-13 19-déc-13 11-févr-14 28-mars-14 19-mai-14 03-juil-14 19-août-14 03-oct-14 19-nov-14 12-janv-15 26-févr-15 16-avr-15
19-juin-13 05-août-13 19-sept-13 05-nov-13 20-déc-13 12-févr-14 31-mars-14 20-mai-14 04-juil-14 20-août-14 06-oct-14 20-nov-14 13-janv-15 27-févr-15 17-avr-15
20-juin-13 06-août-13 20-sept-13 06-nov-13 23-déc-13 13-févr-14 01-avr-14 21-mai-14 07-juil-14 21-août-14 07-oct-14 21-nov-14 14-janv-15 02-mars-15 20-avr-15
21-juin-13 07-août-13 23-sept-13 07-nov-13 27-déc-13 14-févr-14 02-avr-14 22-mai-14 08-juil-14 22-août-14 08-oct-14 24-nov-14 15-janv-15 03-mars-15 21-avr-15
24-juin-13 08-août-13 24-sept-13 08-nov-13 30-déc-13 17-févr-14 03-avr-14 23-mai-14 09-juil-14 25-août-14 09-oct-14 25-nov-14 16-janv-15 04-mars-15 22-avr-15
25-juin-13 09-août-13 25-sept-13 11-nov-13 02-janv-14 18-févr-14 04-avr-14 26-mai-14 10-juil-14 26-août-14 10-oct-14 26-nov-14 19-janv-15 05-mars-15 23-avr-15
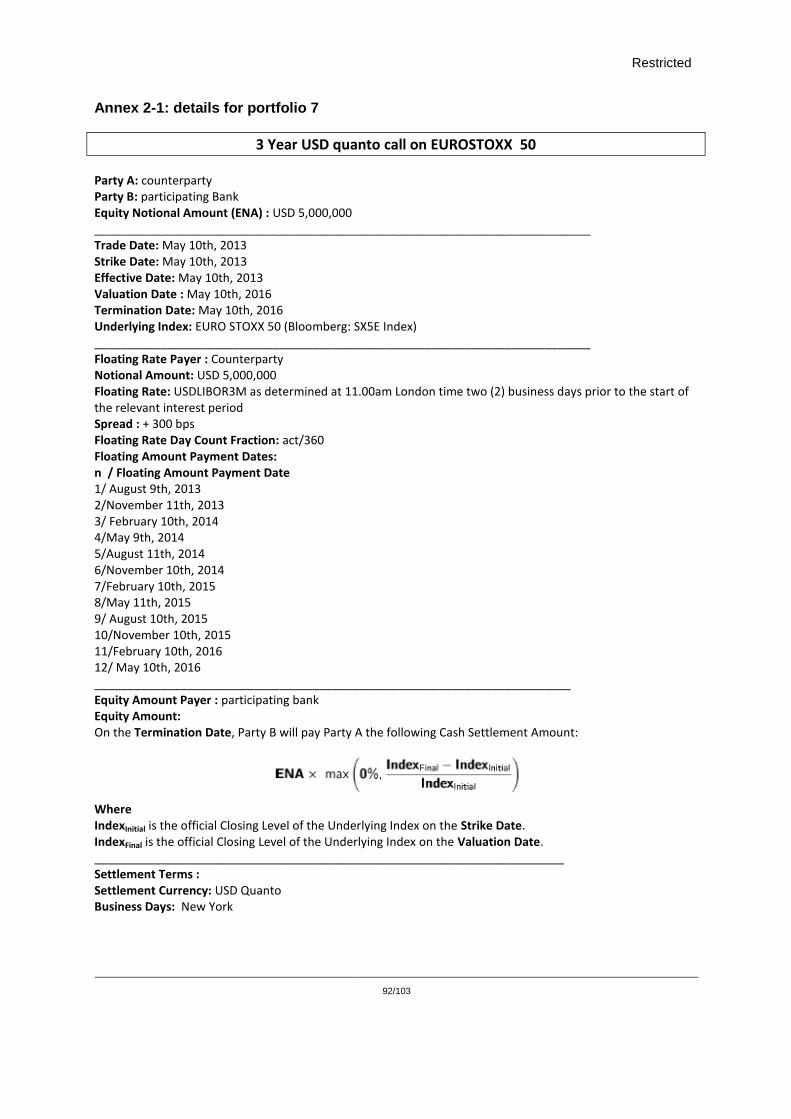
Restricted
92/103
Annex 2-1: details for portfolio 7
3 Year USD quanto call on EUROSTOXX 50 Party A: counterparty Party B: participating Bank Equity Notional Amount (ENA) : USD 5,000,000 ___________________________________________________________________________ Trade Date: May 10th, 2013 Strike Date: May 10th, 2013 Effective Date: May 10th, 2013 Valuation Date : May 10th, 2016 Termination Date: May 10th, 2016 Underlying Index: EURO STOXX 50 (Bloomberg: SX5E Index) ___________________________________________________________________________ Floating Rate Payer : Counterparty Notional Amount: USD 5,000,000 Floating Rate: USDLIBOR3M as determined at 11.00am London time two (2) business days prior to the start of the relevant interest period Spread : + 300 bps Floating Rate Day Count Fraction: act/360 Floating Amount Payment Dates: n / Floating Amount Payment Date 1/ August 9th, 2013 2/November 11th, 2013 3/ February 10th, 2014 4/May 9th, 2014 5/August 11th, 2014 6/November 10th, 2014 7/February 10th, 2015 8/May 11th, 2015 9/ August 10th, 2015 10/November 10th, 2015 11/February 10th, 2016 12/ May 10th, 2016 ________________________________________________________________________ Equity Amount Payer : participating bank Equity Amount: On the Termination Date, Party B will pay Party A the following Cash Settlement Amount:
Where IndexInitial is the official Closing Level of the Underlying Index on the Strike Date. IndexFinal is the official Closing Level of the Underlying Index on the Valuation Date. _______________________________________________________________________ Settlement Terms : Settlement Currency: USD Quanto Business Days: New York
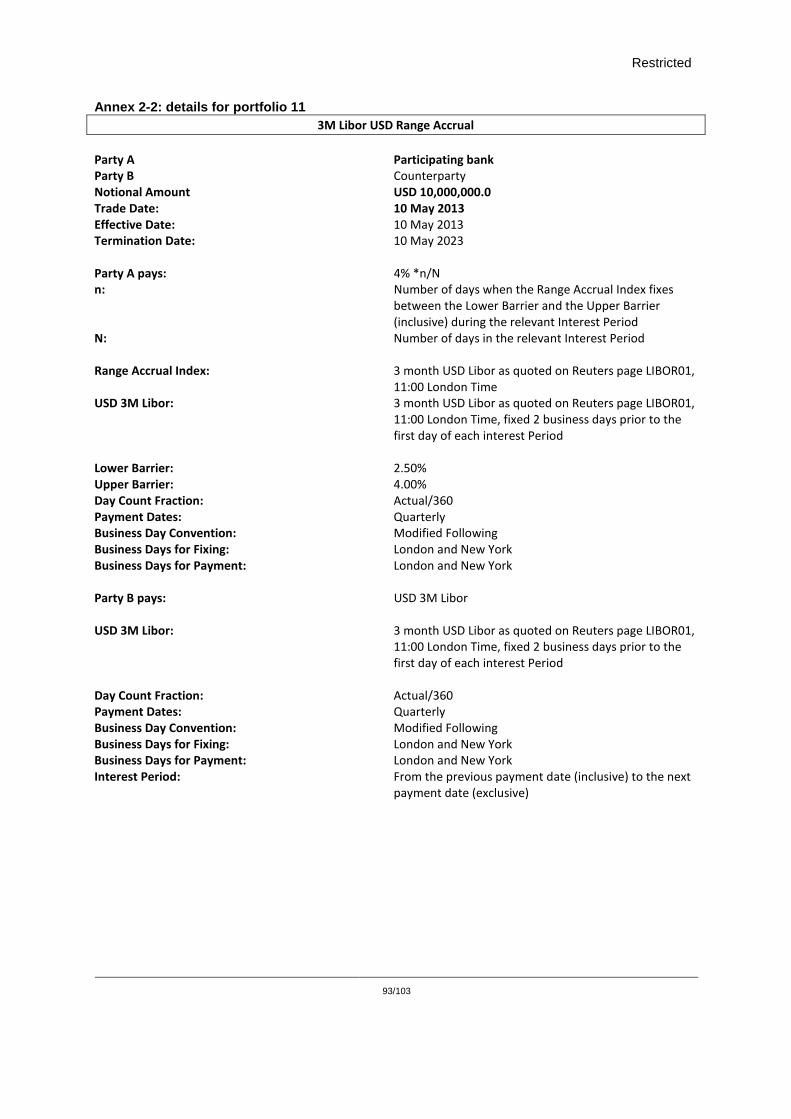
Restricted
93/103
Annex 2-2: details for portfolio 11
3M Libor USD Range Accrual
Party A Participating bank Party B Counterparty Notional Amount USD 10,000,000.0 Trade Date: 10 May 2013 Effective Date: 10 May 2013 Termination Date: 10 May 2023 Party A pays: 4% *n/N n: Number of days when the Range Accrual Index fixes
between the Lower Barrier and the Upper Barrier (inclusive) during the relevant Interest Period
N: Number of days in the relevant Interest Period Range Accrual Index: 3 month USD Libor as quoted on Reuters page LIBOR01,
11:00 London Time USD 3M Libor: 3 month USD Libor as quoted on Reuters page LIBOR01,
11:00 London Time, fixed 2 business days prior to the first day of each interest Period
Lower Barrier: 2.50% Upper Barrier: 4.00% Day Count Fraction: Actual/360 Payment Dates: Quarterly Business Day Convention: Modified Following Business Days for Fixing: London and New York Business Days for Payment: London and New York Party B pays: USD 3M Libor USD 3M Libor: 3 month USD Libor as quoted on Reuters page LIBOR01,
11:00 London Time, fixed 2 business days prior to the first day of each interest Period
Day Count Fraction: Actual/360 Payment Dates: Quarterly Business Day Convention: Modified Following Business Days for Fixing: London and New York Business Days for Payment: London and New York Interest Period: From the previous payment date (inclusive) to the next
payment date (exclusive)
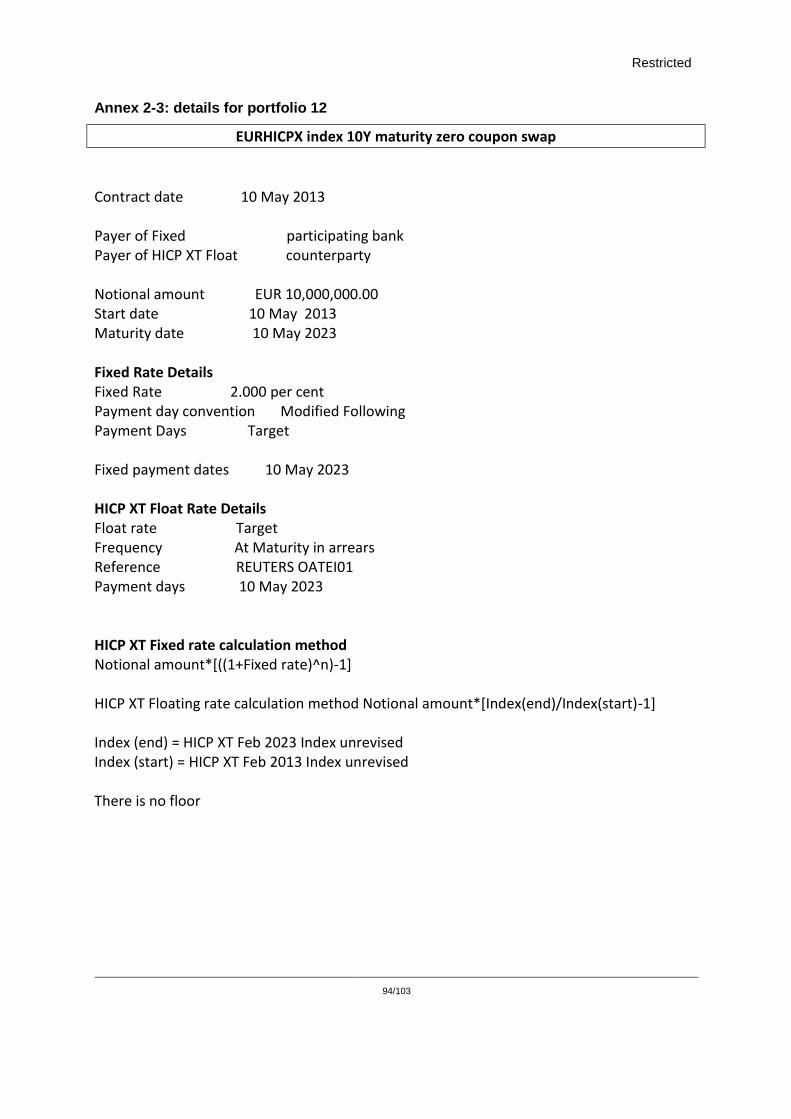
Restricted
94/103
Annex 2-3: details for portfolio 12
EURHICPX index 10Y maturity zero coupon swap
Contract date 10 May 2013 Payer of Fixed participating bank Payer of HICP XT Float counterparty Notional amount EUR 10,000,000.00 Start date 10 May 2013 Maturity date 10 May 2023 Fixed Rate Details Fixed Rate 2.000 per cent Payment day convention Modified Following Payment Days Target Fixed payment dates 10 May 2023 HICP XT Float Rate Details Float rate Target Frequency At Maturity in arrears Reference REUTERS OATEI01 Payment days 10 May 2023 HICP XT Fixed rate calculation method Notional amount*[((1+Fixed rate)^n)-1] HICP XT Floating rate calculation method Notional amount*[Index(end)/Index(start)-1] Index (end) = HICP XT Feb 2023 Index unrevised Index (start) = HICP XT Feb 2013 Index unrevised There is no floor
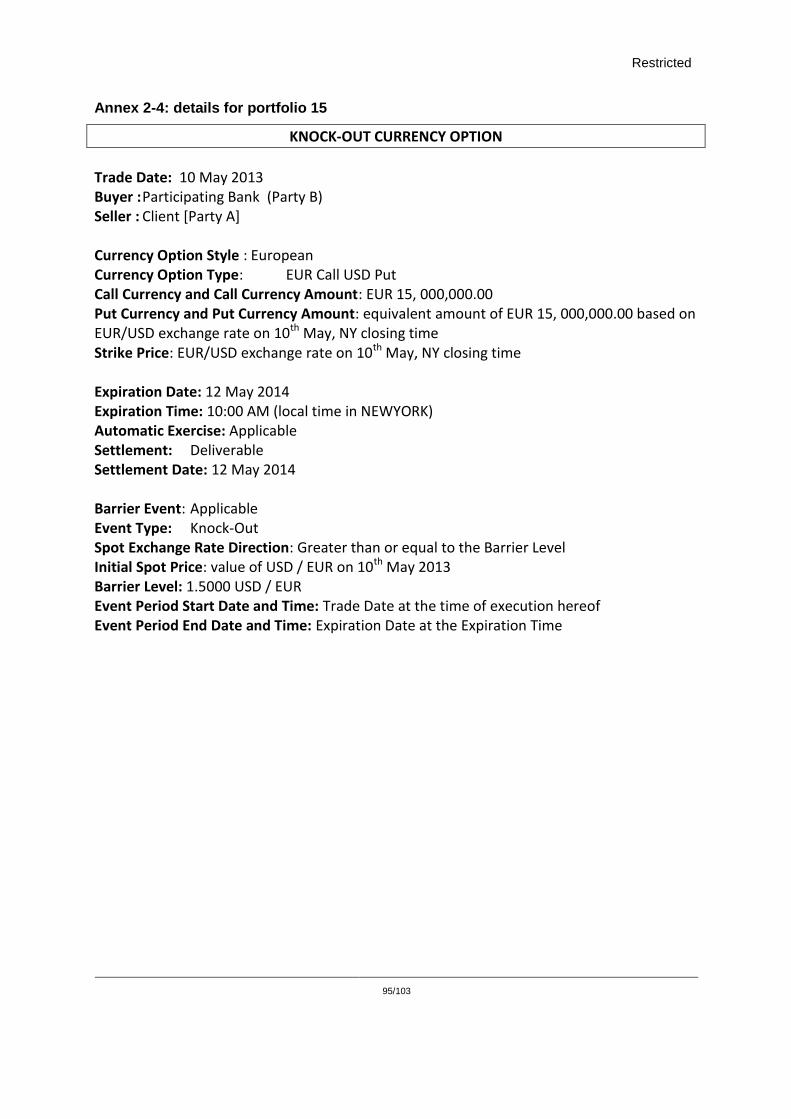
Restricted
95/103
Annex 2-4: details for portfolio 15
KNOCK-OUT CURRENCY OPTION
Trade Date: 10 May 2013 Buyer : Participating Bank (Party B) Seller : Client [Party A] Currency Option Style : European Currency Option Type: EUR Call USD Put Call Currency and Call Currency Amount: EUR 15, 000,000.00 Put Currency and Put Currency Amount: equivalent amount of EUR 15, 000,000.00 based on EUR/USD exchange rate on 10th May, NY closing time Strike Price: EUR/USD exchange rate on 10th May, NY closing time Expiration Date: 12 May 2014 Expiration Time: 10:00 AM (local time in NEWYORK) Automatic Exercise: Applicable Settlement: Deliverable Settlement Date: 12 May 2014 Barrier Event: Applicable Event Type: Knock-Out Spot Exchange Rate Direction: Greater than or equal to the Barrier Level Initial Spot Price: value of USD / EUR on 10th May 2013 Barrier Level: 1.5000 USD / EUR Event Period Start Date and Time: Trade Date at the time of execution hereof Event Period End Date and Time: Expiration Date at the Expiration Time
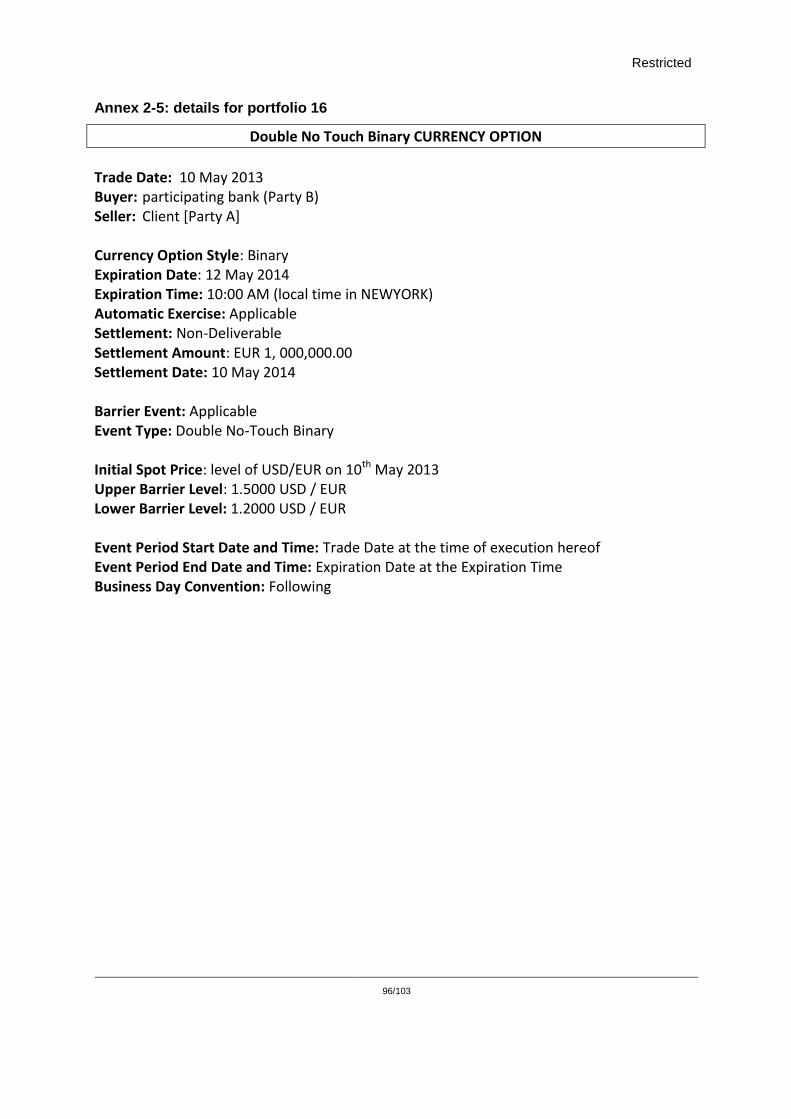
Restricted
96/103
Annex 2-5: details for portfolio 16
Double No Touch Binary CURRENCY OPTION
Trade Date: 10 May 2013 Buyer: participating bank (Party B) Seller: Client [Party A] Currency Option Style: Binary Expiration Date: 12 May 2014 Expiration Time: 10:00 AM (local time in NEWYORK) Automatic Exercise: Applicable Settlement: Non-Deliverable Settlement Amount: EUR 1, 000,000.00 Settlement Date: 10 May 2014 Barrier Event: Applicable Event Type: Double No-Touch Binary Initial Spot Price: level of USD/EUR on 10th May 2013 Upper Barrier Level: 1.5000 USD / EUR Lower Barrier Level: 1.2000 USD / EUR Event Period Start Date and Time: Trade Date at the time of execution hereof Event Period End Date and Time: Expiration Date at the Expiration Time Business Day Convention: Following
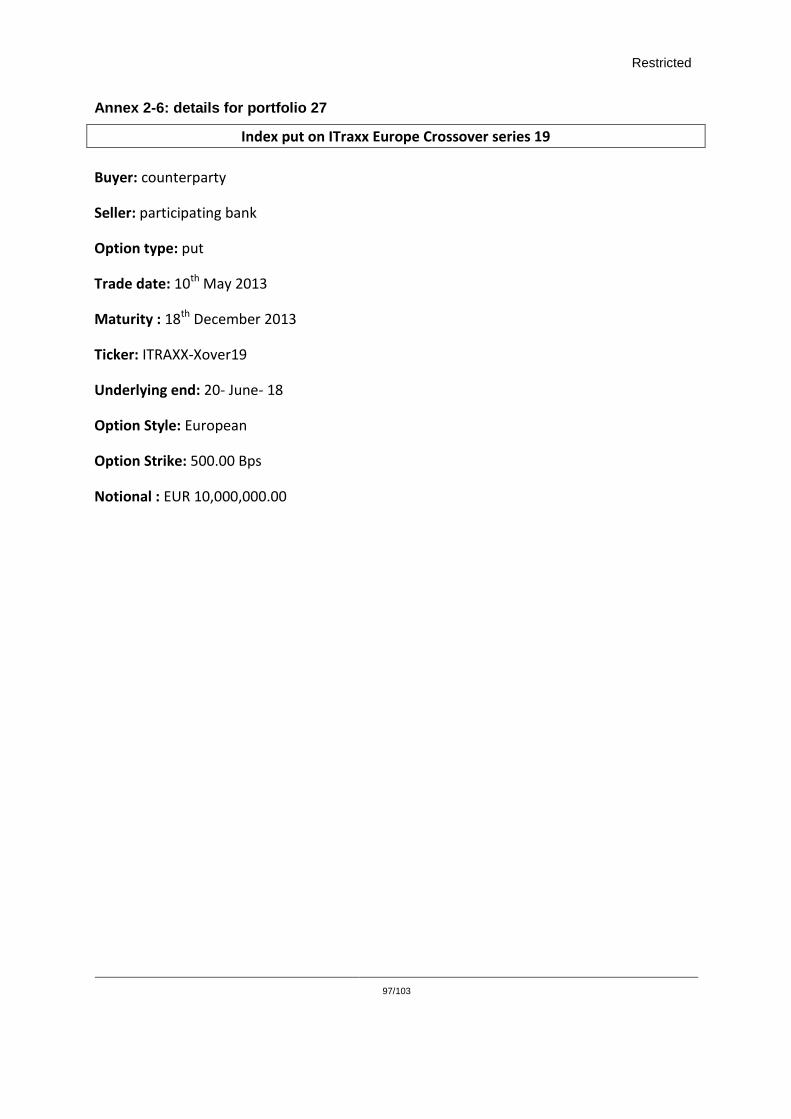
Restricted
97/103
Annex 2-6: details for portfolio 27
Index put on ITraxx Europe Crossover series 19
Buyer: counterparty
Seller: participating bank
Option type: put
Trade date: 10th May 2013
Maturity : 18th December 2013
Ticker: ITRAXX-Xover19
Underlying end: 20- June- 18
Option Style: European
Option Strike: 500.00 Bps
Notional : EUR 10,000,000.00
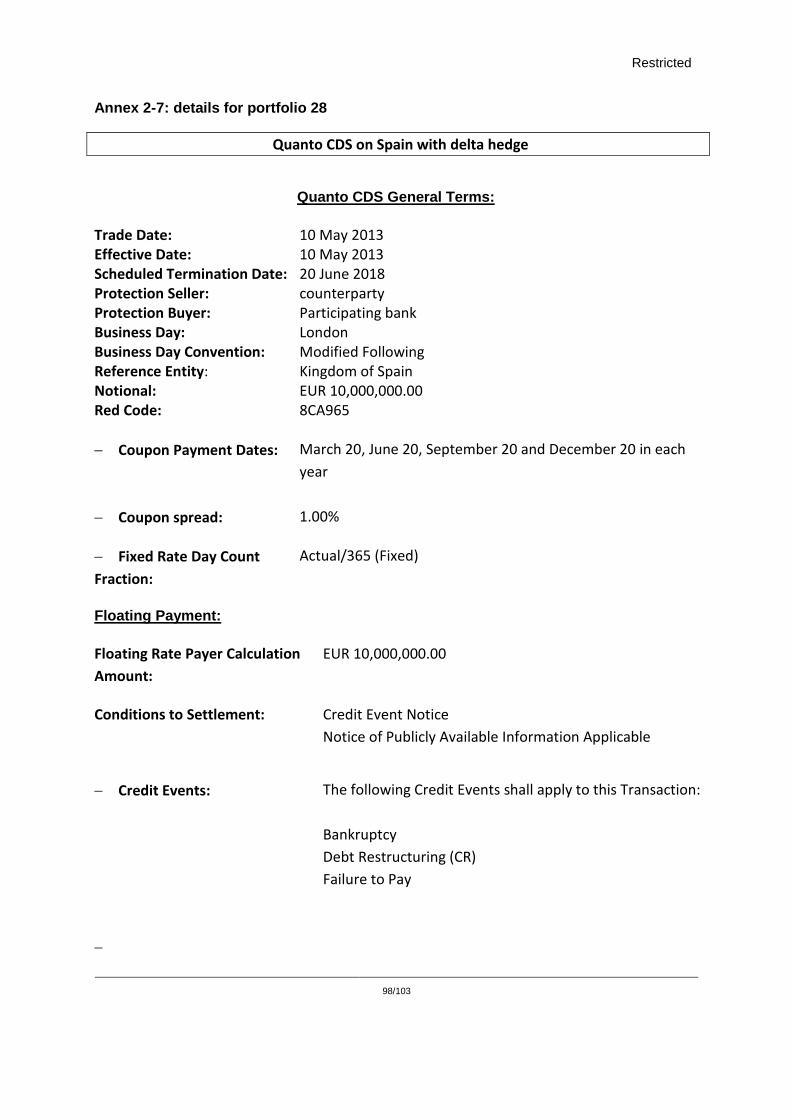
Restricted
98/103
Annex 2-7: details for portfolio 28
Quanto CDS on Spain with delta hedge
Quanto CDS General Terms:
Trade Date: 10 May 2013 Effective Date: 10 May 2013 Scheduled Termination Date: 20 June 2018 Protection Seller: counterparty Protection Buyer: Participating bank Business Day: London Business Day Convention: Modified Following Reference Entity: Kingdom of Spain Notional: EUR 10,000,000.00 Red Code: 8CA965
Coupon Payment Dates: March 20, June 20, September 20 and December 20 in each
year
Coupon spread: 1.00%
Fixed Rate Day Count
Fraction:
Actual/365 (Fixed)
Floating Payment:
Floating Rate Payer Calculation
Amount:
EUR 10,000,000.00
Conditions to Settlement: Credit Event Notice
Notice of Publicly Available Information Applicable
Credit Events: The following Credit Events shall apply to this Transaction:
Bankruptcy
Debt Restructuring (CR)
Failure to Pay
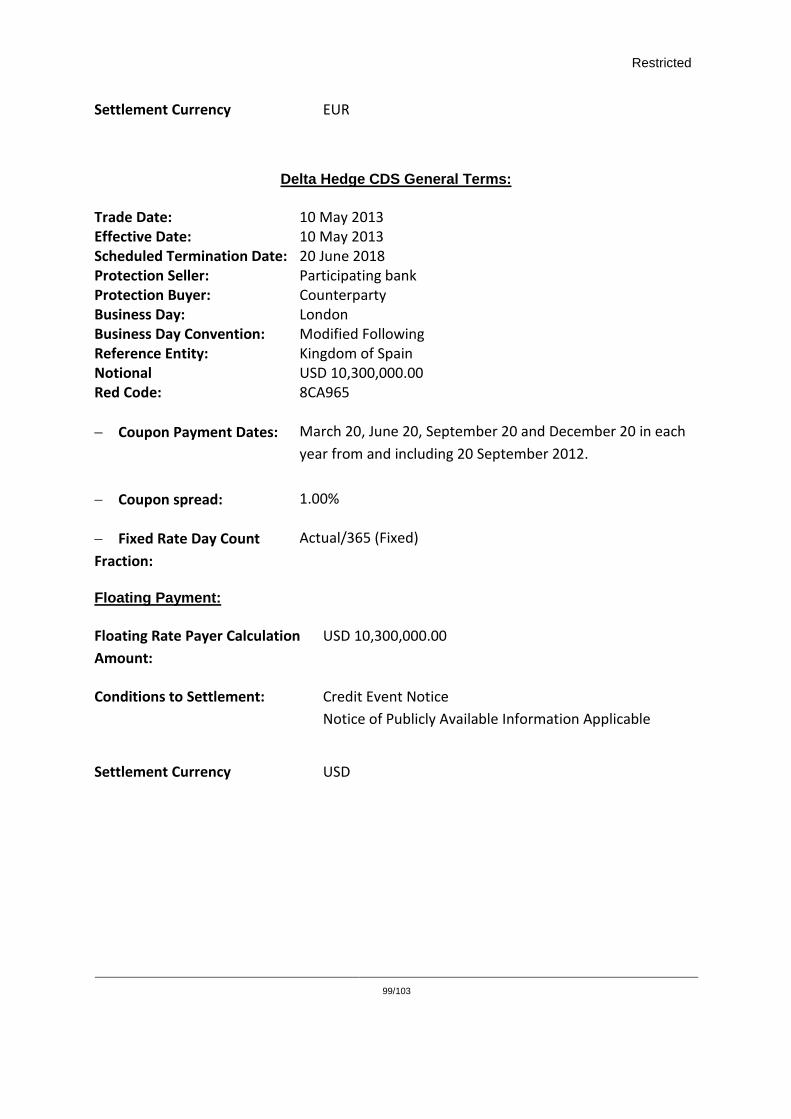
Restricted
99/103
Settlement Currency EUR
Delta Hedge CDS General Terms:
Trade Date: 10 May 2013 Effective Date: 10 May 2013 Scheduled Termination Date: 20 June 2018 Protection Seller: Participating bank Protection Buyer: Counterparty Business Day: London Business Day Convention: Modified Following Reference Entity: Kingdom of Spain Notional USD 10,300,000.00 Red Code: 8CA965
Coupon Payment Dates: March 20, June 20, September 20 and December 20 in each
year from and including 20 September 2012.
Coupon spread: 1.00%
Fixed Rate Day Count
Fraction:
Actual/365 (Fixed)
Floating Payment:
Floating Rate Payer Calculation
Amount:
USD 10,300,000.00
Conditions to Settlement: Credit Event Notice
Notice of Publicly Available Information Applicable
Settlement Currency USD
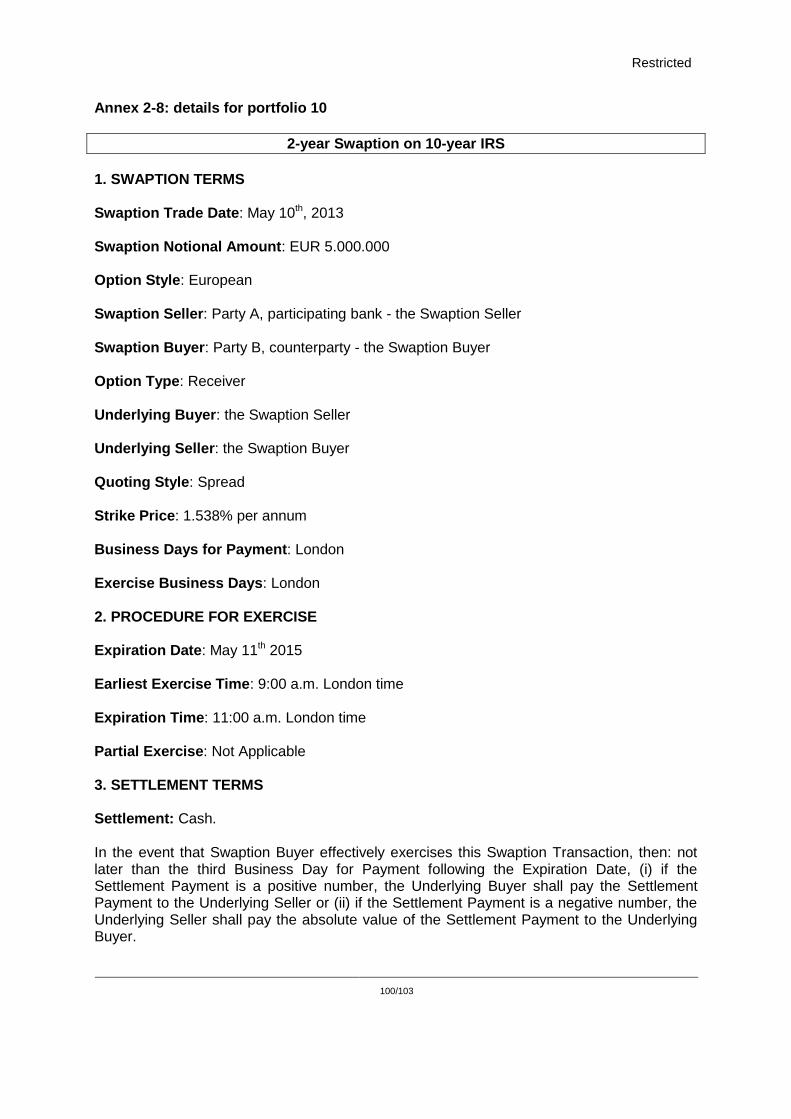
Restricted
100/103
Annex 2-8: details for portfolio 10
2-year Swaption on 10-year IRS
1. SWAPTION TERMS Swaption Trade Date: May 10th, 2013 Swaption Notional Amount: EUR 5.000.000 Option Style: European Swaption Seller: Party A, participating bank - the Swaption Seller Swaption Buyer: Party B, counterparty - the Swaption Buyer Option Type: Receiver Underlying Buyer: the Swaption Seller Underlying Seller: the Swaption Buyer Quoting Style: Spread Strike Price: 1.538% per annum Business Days for Payment: London Exercise Business Days: London 2. PROCEDURE FOR EXERCISE Expiration Date: May 11th 2015 Earliest Exercise Time: 9:00 a.m. London time Expiration Time: 11:00 a.m. London time Partial Exercise: Not Applicable 3. SETTLEMENT TERMS Settlement: Cash. In the event that Swaption Buyer effectively exercises this Swaption Transaction, then: not later than the third Business Day for Payment following the Expiration Date, (i) if the Settlement Payment is a positive number, the Underlying Buyer shall pay the Settlement Payment to the Underlying Seller or (ii) if the Settlement Payment is a negative number, the Underlying Seller shall pay the absolute value of the Settlement Payment to the Underlying Buyer.
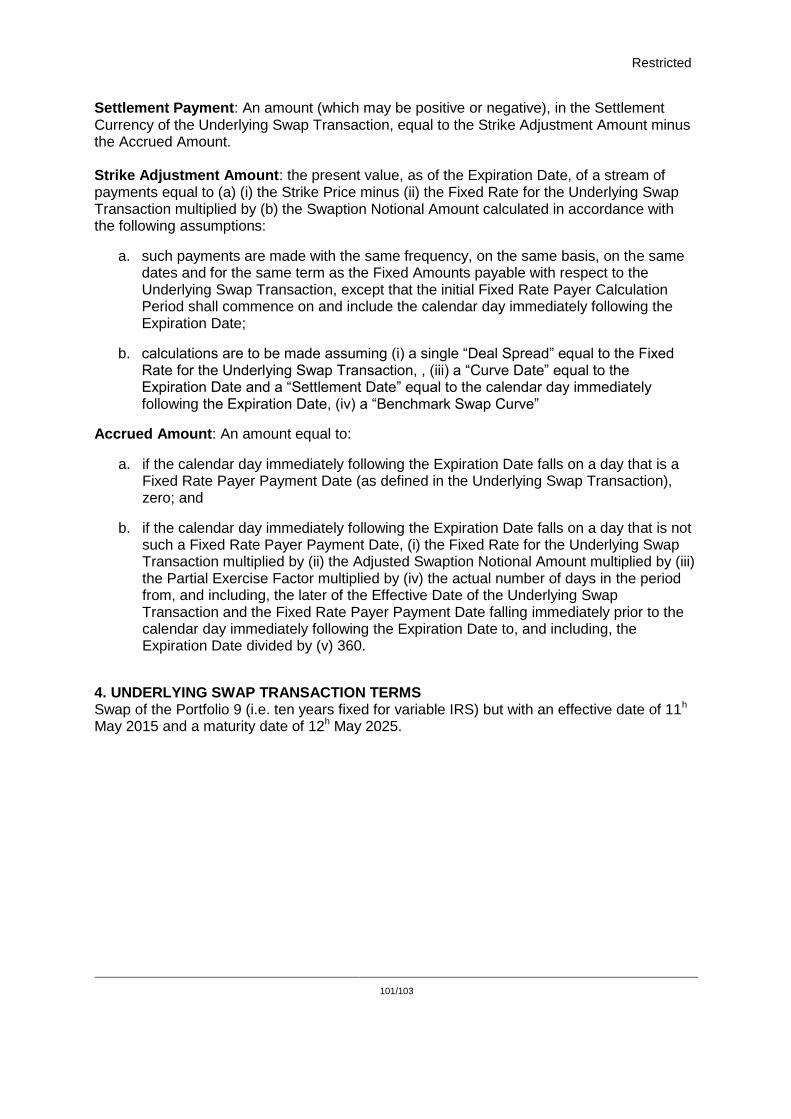
Restricted
101/103
Settlement Payment: An amount (which may be positive or negative), in the Settlement Currency of the Underlying Swap Transaction, equal to the Strike Adjustment Amount minus the Accrued Amount. Strike Adjustment Amount: the present value, as of the Expiration Date, of a stream of payments equal to (a) (i) the Strike Price minus (ii) the Fixed Rate for the Underlying Swap Transaction multiplied by (b) the Swaption Notional Amount calculated in accordance with the following assumptions:
a. such payments are made with the same frequency, on the same basis, on the same dates and for the same term as the Fixed Amounts payable with respect to the Underlying Swap Transaction, except that the initial Fixed Rate Payer Calculation Period shall commence on and include the calendar day immediately following the Expiration Date;
b. calculations are to be made assuming (i) a single “Deal Spread” equal to the Fixed Rate for the Underlying Swap Transaction, , (iii) a “Curve Date” equal to the Expiration Date and a “Settlement Date” equal to the calendar day immediately following the Expiration Date, (iv) a “Benchmark Swap Curve”
Accrued Amount: An amount equal to:
a. if the calendar day immediately following the Expiration Date falls on a day that is a Fixed Rate Payer Payment Date (as defined in the Underlying Swap Transaction), zero; and
b. if the calendar day immediately following the Expiration Date falls on a day that is not such a Fixed Rate Payer Payment Date, (i) the Fixed Rate for the Underlying Swap Transaction multiplied by (ii) the Adjusted Swaption Notional Amount multiplied by (iii) the Partial Exercise Factor multiplied by (iv) the actual number of days in the period from, and including, the later of the Effective Date of the Underlying Swap Transaction and the Fixed Rate Payer Payment Date falling immediately prior to the calendar day immediately following the Expiration Date to, and including, the Expiration Date divided by (v) 360.
4. UNDERLYING SWAP TRANSACTION TERMS Swap of the Portfolio 9 (i.e. ten years fixed for variable IRS) but with an effective date of 11h May 2015 and a maturity date of 12h May 2025.
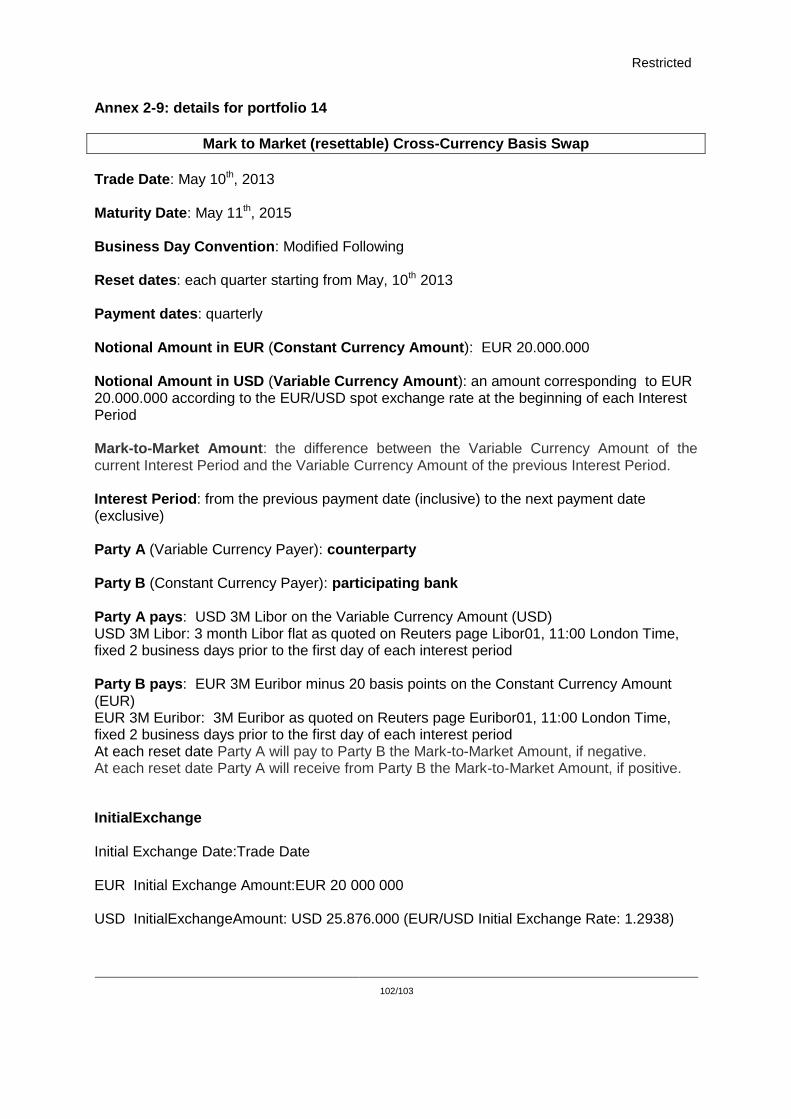
Restricted
102/103
Annex 2-9: details for portfolio 14
Mark to Market (resettable) Cross-Currency Basis Swap
Trade Date: May 10th, 2013 Maturity Date: May 11th, 2015 Business Day Convention: Modified Following Reset dates: each quarter starting from May, 10th 2013 Payment dates: quarterly Notional Amount in EUR (Constant Currency Amount): EUR 20.000.000 Notional Amount in USD (Variable Currency Amount): an amount corresponding to EUR 20.000.000 according to the EUR/USD spot exchange rate at the beginning of each Interest Period Mark-to-Market Amount: the difference between the Variable Currency Amount of the current Interest Period and the Variable Currency Amount of the previous Interest Period. Interest Period: from the previous payment date (inclusive) to the next payment date (exclusive) Party A (Variable Currency Payer): counterparty Party B (Constant Currency Payer): participating bank Party A pays: USD 3M Libor on the Variable Currency Amount (USD) USD 3M Libor: 3 month Libor flat as quoted on Reuters page Libor01, 11:00 London Time, fixed 2 business days prior to the first day of each interest period Party B pays: EUR 3M Euribor minus 20 basis points on the Constant Currency Amount (EUR) EUR 3M Euribor: 3M Euribor as quoted on Reuters page Euribor01, 11:00 London Time, fixed 2 business days prior to the first day of each interest period At each reset date Party A will pay to Party B the Mark-to-Market Amount, if negative. At each reset date Party A will receive from Party B the Mark-to-Market Amount, if positive.
InitialExchange Initial Exchange Date:Trade Date EUR Initial Exchange Amount:EUR 20 000 000 USD InitialExchangeAmount: USD 25.876.000 (EUR/USD Initial Exchange Rate: 1.2938)
Restricted
103/103
Final Exchange Final Exchange Date: Maturity Date EUR Final Exchange Amount: EUR 20,000,000.00 USD Final Exchange Amount: The Variable Currency Amount determined for the final Calculation Period