Embed Size (px)
Citation preview

TE 5092
. M8A3 no .
M~SSOURI COOPERATIVE HIGHWAY RESEARCH PRSGRAM,
REPORT 70-1
propertv of
MoDOT TRANSPORTATIO LIBRARY
.,// "STATIC AND FATIGUE BEHAVIOR OF
CONTINUOUS-COMPOSITE BEAMS WITH
I
HIGH-STRENGTH BOLTS AS SHEAR CONNECTORS" ,
MISSOURI STATE HIGHWAY DEPARTMENT
UNIVERSITY OF MISSOURI-COLUMBIA
BUREAU OF PUBLIC ROADS

"STATIC AND FATIGUE BEHAVIOR OF CONTINUOUS-COMPOSITE BEAMS WITH
TE S Ot} ~
, M<l1\3
HIGH-STRENGTH BOLTS AS SHEAR CONNECTORS"
"" 01 '''_1
.1
)r In, '\. ~' '\ "J v
. I" C '~., • ,b ' \ -- Prepared for
MISSOURI STATE HIGHWAY DEPARTMENT
by
lAWRENCE N. DAllAM and
REFIK GURAN
DEPARTMENT OF CIVil ENGINEERING
UNIVERSITY OF MISSOURI - COLUMBIA
COLUMBIA, MISSOURI
JUNE,1970
in cooperation with
U.S. DEPARTMENT OF TRANSPORATION
FEDERAL HIGHWAY ADMINISTRATION
BUREAU OF PUBLIC ROADS
The opinions, findings, and conclusions expressed in this publication are not necessarily those of the Bureau of Public Roads. -f B /43 l O S

~
ABSTRACT
This report deals with some aspects of fatigue and static
behavior of continuous composite beams using 3/4inch high-strength
bolts as shear connectors. Tested in this phase of the program were;
(a) nine pushout specimens subjected to repeated loading with varying
load ranges, (b) two full scale continuous composite members, one
with and one without shear connectors over their negative moment
reqions, loaded both dynamically and statically, (c) two companion
comnression pushout specimens, one loaded dynamically and then
subjected to a final static loading, one directly subjected to the
destructive static loading, and (d) two companion tension pushout
snecimens, both loaded statically until failure.
Load-slip and fatigue characteristics of the bolted connection
were investigated through the testing of the pushout specimens.
Load-deflection, load-slip, cycle-slip curves, strain profiles, slip
distribution and load-reaction curves were used in the investigation
of the full scale composite members. Predicted behavior was compared
with the experimental behavior and the cracking patterns were ana
lyzed in detail. Also the members with and without connectors were
compared concerning the negative moment region.
The following conclusions were made from this investigation:
1. The magnitude of the critical or yield load and the
ultimate load for pushout specimens subjected to fatigue
loadinq ( up to 10 million cycles) was essentially the
same as those for pushout specimens subjected to static
loading.

2. The magnitude of the ultimate load for pushout specimens
with two layers of reinforcement in the slabs ( Figure 18
was 50% greater than the average ultimate load for pushout
specimens with one layer of reinforcement in the slabs
( Figure 17). The critical or yield load was not affected
by the presence of the additional slab reinforcement.
3. The member with shear connectors over its negative moment
region exhibits practically no slip in this region at its
working load ( approximately 15% ) compared with the member
lacking such connectors.
4. The absence of shear connectors in the negative moment re
gion increases the slip and the connector force in the
positive moment region.
5. The elimination of the shear connectors over the negative
moment regions reduces the working and the first yielding
loads of a continuous composite member by 30% and 20%,
respectively.
6. Elementary beam theory ( assuming complete interaction )
can satisfactorily be used to predict the behavior of a
continuous composite member up to its yield load provided
sufficient connection exists and careful consideration is
given to slab cracking in the negative moment region.
7. There are fewer cracks ( but of greater width) when
connectors are placed in the negative moment region.
8. Fatigue is not a factor in the design of composite
members using high-strength bolts as shear connectors.

t
TABLE OF CONTENTS
CHAPTER
1. INTRODUCTION
1.1 GENERAL 1.1.1 Descriptive 1.1.2 Background. 1.1.3 Previous Studies
1. 2 SCOPE
1.3 NOTATION
II. TEST SPECIMENS
2.1 DESIGN OF COMPOSITE BEAMS 2.1.1 Span . 2.1.2 Steel Beam. 2.1.3 Concrete Slab 2.1.4 Shear Connectors
2.2 FABRICATION .. 2.2.1 Materials 2.2.2 Preoaration for Casting 2.2.3 Casting 2.2.4 Curing .
2.3 LOADING 2.3.1 Fatigue Loading 2.3.2 Static Loading
2.4 INSTRUMENTATION .. 2.4.1 Deflection 2.4.2 Slip. 2.4.3 Steel Strain 2.4.4 Load Cell
2.5 COMPANION SPECIMENS 2.5.1 Compression Pushouts 2.5.2 Tension Pushouts 2.5.3 Concrete Cylinders 2. 5.4 Tensile Coupons 2.5.5 Reinforcing Bar Sections
III. TEST PROCEDURES
3.1 COMPOSITE BEAMS ...... . 3.1.1 Preparation of Composite Beams
PAGE
1
1 1 1 2
5
7
9
9 9 9 9
10
11 11 11 12 12
13 13 13
14 14 14 14 15
17 17 17 18 18 19
20
20 20

CHAPTER PAGE
3.1.2 Preparation of Loading for Fatigue 21 3.1.3 Preparation of Loading for Static 21 3.1.4 Loading Procedure . . . . . . 22
3.2 COMPANION SPECIMENS ... 3.2.1 Companion Pushouts 3.2.2 Tension Pushouts . 3.2.3 Concrete Cylinders 3.2.4 Tensile Coupons 3.2.5 Reinforcing Bar Sections
IV. RESULTS AND COMPARISONS
4.1 PUSHOUT TESTS ...
4.2 COMPANION SPECIMEN RESULTS 4.2.1 Compression Pushouts . 4.2.2 Tension Pushouts .. 4.2.3 Concrete Cylinders. 4.2.4 Tensile Coupons 4.2.5 Tension Bar Sections 4.2.6 Reinforcing Bar Specimens
4.3 COMPOSITE BEAM RESULTS 4.3.1 General Observations 4.3.2 Analysis ..... 4.3.3 Deflection Results 4.3.4 Slip Results .. 4.3.5 Reaction Results 4.3.6 Strain Results ..
4.4 COMPARISONS ...... . 4.4.1 Cracking Patterns ..... 4.4.2 Beam and Companion Pushouts 4.4.3 NCB6FB1 and NCB6FB2
V. SUMMARY AND CONCLUSIONS
5.1 SUMMARY ..
5.2 CONCLUSIONS.
FIGURES
TABLES
BIBLIOGRAPHY
23 . 23
24 25 25 26
27
27
29 29 30 31 31 31 32
32 32 35 38 38 39 39
41 41 42 43
45
45
45
48
92
.100

LIST OF FIGURES
FIGURE PAGE
1 Dimensions and Instrumentation of NCB6FBI 49 2 Dimensions and Instrumentation of NCB6FB2 50 3 Dynamic Loading Apparatus 51 4 Static Loading Apparatus. 51 5 Static Load Point 52 6 Placement of Bolts 52 7 Wi red Forms 53 8 Supported Forms 53 9 Reinforcing Cage 54
10 Casting.... 54 11 MTS Control Panel 55 12 MTS Ram . . . . . 55 13 Instrumentation 56 14 Strain Gage Calibration 56 15a Load Ce 11 Core . . . . 57 15b Load Ce 11 as Support . . 57 15c Load Cell Ready to Use. 57 16 Load Cell Wiring. . . . 58 17 Fatigue Pushout Specimen 59 18 Beam-Companion Compression Pushout Specimen 60 19 Beam-Companion Tension Pushout Specimen 61 20 Reinforcing - Companion Compression Pushouts 62 21 Reinforcing - Companion Tension Pushouts 62 22 Fati gue Tests on Pushouts ..... 63 23 Tension Test on Pushouts . . . . . . . . 63 24 Load-Slip Comparison: Non-Companion and Companion 64 2~ Non-Compani on Pushout Fai 1 ures . . . . . 65 26 Companion Compression Pushout Failures. 66 27 Load-Slip Comparison: Fatigue and Non-Fatigue 67 28a Tension Failure - Cracking at Connector 68 28b Tension Failure - Splitting Slab. . . . . . 68 29 Load-Slip Tension Pushouts ........ 69 30 Typical Tension Failures. . . . . . . . . . 70 31 Load-Deflection - Deflection at Load Points 71 32 Slip Distribution at Working Load of NCB6FBI 72 33 Slip Distribution at Working Load of NCB6FB2 . 73 34 Slip Distribution at Yielding Load of NCB6FBI 74 35 Slip Distribution at Yielding Load of NCB6FB2 75 36 Slip Distribution at Final Load 76 37 Applied Load vs Center Reaction 77 38 Working Strain Profile at Section A 78 39 Yield Strain Profile at Section A 79 40 Working Strain Profile at Section B 80 41 Yield Strain Profile at Section B 81

FIGURE
42 43 44 45 46 47 48 49 50 51 52 53 54 55 56
Working Strain Profile at Section C .... . Yield Strain Profile at Section C ..... . Negative Flexural Cracking Pattern - NCB6FB1 Negative Flexural Cracking Pattern - NCB6FB2 Comparative Cracking Patterns ....... . Longitudinal Cracking Pattern - NCB6FB1 .. . Longitudinal Cracking Pattern - NCB6FB2 .. . Positive Flexural Cracking Pattern - NCB6FB1 Positive Flexural Cracking Pattern - NCB6FB2 Applied Load vs Negative Moment .... . Load-Slip at a Typical Connector ... . Yield Lines at Interior Support - NCB6FB1 Yield Lines at Interior Support - NCB6FB2 Connectors Intact After Test Separation During Testing - NCB6FB1 ...
PAGE
82 83 84 84 85 86
. 86 87
. 87 88 89 90 90 91 91

TABLE
I
II
III
IV
V
VI
VII
VII I
IX
X
XI
LIST OF TABLES
Actual Beam Dimensions .
Results of Non-Companion Pushouts
Results of Static Pushout Tests
Results of Companion Compression Pushouts
Results of Companion Tension Pushouts
Results of Cylinder Tests
Coupon Results Yield Strength
Coupon Results Static Yield Strength
Coupon Results Modulus of Elasticity
Reinforcing Bar Specimen Results
Analyses Results for Test Beams
PAGE
93
. 94
95
96
96
97
98
98
98
98
99

CHAPTER I
INTRODUCTION
1.1 GENERAL
1.1.1 Descriptive The use of shear connectors between a rein
forced concrete slab and a structural steel section creates what is
called a composite section. The shear connectors fix the two inde
pendent parts of the composite section for composite behavior and
therefore form a more efficient and a stiffer section. This type of
section can be designed with a savings of material and is commonly
used in the construction of buildings and bridges.
In general the main advantages of a section that behaves as
a composite system rather than as two independent parts can be
summarized as, 1) smaller and shallower beams may be used, 2) longer
spans are possible without deflection limitations, 3) the toughness
or the impact capacity is increased, and 4) the overload capacity
of the section is greater (1).
The types of connectors utilized in composite construction
vary. Studs, channels, or spirals welded to the steel sections
are commonly used to minimize slip between the components. The
efficiency and the economic advantages of the composite section
depend upon the ability of the connectors to resist slip. For this
reason the use of a minimum number of connectors to provide a stiff
or rigid connection is desirable for the design of composite sections.
1.1.2 Background The 1966-1967 AASHO Interim Specifications (2)
provide a method of design using the elastic theory and the fatigue

properties of welded stud or channel shear connectors; however,
these types of connectors provide a rather "flexible" connection
between the independent parts of the section.
The allowable design load per connector in the 1965 AASHO
Specifications (3) was based upon static loading and a factor of
safety of 3.0 on the critical capacity of the connector. The cur
rent specifications (2) are based upon the fatigue behavior of the
connector and the allowable design load for two million cycles is
approximately equal to or less than that of the 1965 specifications.
The application of this design criteria results in the use of a
large number of connectors in order to satisfy the requirements of
the elastic theory.
Another type of connector which has been under extensive test-
ing at the University of Missouri is the high-strength bolt. The
bolts, with a washer spot welded to the under side of the heads, are
seated in holes predrilled in the top flange of the steel section.
After the slab is cast and cured the bolts are tightened providing
a very rigid friction-type connection. The elastic design method
which assumes no slip between the steel and the concrete is satis-
fied with considerably fewer connectors of this type.
1.1.3 Previous Studies The testing program for high-strength
bolts at the University of Missouri is comprised of several phases.
The first phase of this research program was the testing of
twelve pushout specimens (4). The object of this series was to
determine some characteristics of the bolts as shear connectors
and compare them to the more commonly used connectors.
The connectors tested were 1/2, 5/8 , 3/4 inch high-strength
2

bolts. The conclusions drawn from this investigation were:
II 1. Hi gh-s trength pretens i oned bolts exhi bit practi ca lly
zero slip in the working range of the load.
2. Bolts attain a critical load or useful capacity that
is twice that of studs. The ultimate load is also
greater for bolts.
3. There is apparently no loss of prestress ( bolt pre
tension) with time in high quality concrete.
4. More research is needed regarding the spacing and
edge clearance requirements in haunch members due
to the splitting observed in the tests of the pre
stressed specimens. II
The second phase of the research program was an investigation
of the behavior of full scale beams. Six simply supported composite
beams were loaded to produce positive moment in the beams. The con
clusions reached upon completion of the investigation were (5):
II 1. The load-slip characteristics determined from the
tests of the full-scale beams using one-half and
five-eighths inch bolt shear connectors compare very
favorably with the load-slip characteristics of the
companion pushout tests.
2. The ultimate strength of three-fourth inch bolt
shear connectors is greater than that found from
pushout tests.
3. The elementary beam theory, assuming complete inter
action (no slip) between slab and stringer, accurately
predicted the deflection and stresses of the composite
3

beams at service load, even though the shear connectors
were designed with little or no factor of safety against
slip.
4. The modified ultimate strength theory accurately pre
dicted the ultimate strengths of the composite beams
when the ultimate capacities of the shear connectors
were known.
5. The high-strength bolt with little or no factor of
safety against slip provides a very rigid connection
between slab and stringers at service loads and also
provides a reserve capacity sufficient to develop
the ultimate moment capacity of the fully composite
section. II
The third phase of the investigation was done on three full
scale composite sections and their companion specimens. The
composite beams consisted of a simple span and a cantilever and
were loaded to cause negative bending or tension in the slab. The
objective of this phase was to study the behavior of the bolts in
the negative moment portions of continuous composite members. The
findings that were reported are (6):
II 1. Because of the nature of the load-slip per bolt
data for the composite members, a conclusion for the
validity of using tension pushouts to predict con
nector behavior in a member cannot be justified.
2. For those members with connectors over their negative
moment regions, there was practically no slip at
their working loads, and very little slip ( less than
4

0.01 inches) even at their yielding loads.
3. Elementary be~m theory ( assuming complete inter
action) can be used to satisfactorily predict the
behavior at the working loads in the negative moment
regions of the members with connectors over the
negative moment region.
4. Simple ultimate strength theory can be used to
satisfactorily predict the ultimate capacity in the
negative moment region of members with connectors
over the negative moment regions.
5. The ultimate moment capacity of the member without
connectors over the negative moment region exceeded
the predicted ultimate capacity of the member with
connectors over the negative moment region.
6. The elimination of connectors over the negative
moment region of the composite member reduced the
working and first yielding loads of that member by
approximately 15%. "
1.2 SCOPE
In the fourth phase of the research program nine pushout
specimens were loaded with varying intensities of repeated loading
to cause fatigue. The publications on the fatigue behavior of
welded studs had shown that fatigue was definitely a factor in the
design of these connectors (2), (7). It was therefore anticipated
that fatigue would also be a factor in the design of high-strength
bolt shear connectors. The complete test results of the nine
fatigue pushout specimens will be given in later sections of this
5

report, but the main findings in this study showed that:
1. Fatigue is not a real factor in the behavior of
pushouts with high-strength bolt shear connectors.
2. In order to be able to predict the behavior of
high-strength bolt connectors in full scale
composite sections under fatigue loading, it is
necessary to conduct further tests.
In order to further study the fatigue characteristics of
high-strength bolts as shear connectors, two full scale beams were
designed and tested. Both beams were two span continuous composite
sections, one with shear connectors over the negative moment region
and one without.
The beams were first subjected to fatigue loading ( working
load applied for two million cycles) and then loaded statically to
the capacity of the testing facilities ( 200 kips per load point ).
Also tested in this phase were companion compression and tension
pushout specimens for the beams.
The major objectives of this study were:
1. To determine the differences in the behavior of
members when shear connectors are eliminated over
the negative moment regions.
2. To determine if the results obtained from pushout
tests can be used to predict the load-slip and
cycle-slip relationships of the composite beams when
loaded to produce fatigue.
3. To study the static loading behavior of the nega
tive moment region after applying the service load
6

for two million cycles .
4. To determine if fatigue is an important factor in
the design of full scale composite beams with high
strength bolts as shear connectors.
5. To determine a range ( difference between minimum
and maximum loads) of load that will cause fatigue
failure.
6. To determine the effects of longitudinal cracking
on the behavior of the high-strength bolts as shear
connectors.
1.3 NOTATION
The composite sections tested in this phase of the investigation
were given an alpha-numeric designation in keeping with the previous
phases.
For the pushout specimens the first letter, N, indicates normal
weight concrete. The second character, 6, denotes the diameter of
the connector in eighths of an inch. The next letter, F, shows that
the specimen was tested with fatigue loading. The following three
characters, 4T8, indicate the number and type of the connector;
four high-strength tension bolts. The last numerical value denotes
the number of the specimen in the series.
For the companion pushout specimens, a lower case letter was
added to the end of the alpha-numeric designation to distinguish
the different specimens for each beam. For the companion tension
pushout specimens the letter, F, for fatigue changes to, T, for
tension.
For the beams the first letter, N, again implies normal weight
7

concrete. The next two characters, CB, denote full scale continuous
beam. The following numerical value, 6, is again the diameter of
the connector in eighths of an inch. The last letter, B, signifies
the type of connector, high-strength bolts. The final numerical
character is the number of the specimen in the series.
8

CHAPTER II
TEST SPECIMENS
2.1 DESIGN OF COMPOSITE BEAMS
2.1.1 Soan Both beams were chosen to have an overall length of
36 feet, since they were to be placed in a testing frame 40 feet in
lenqth. Each beam consisted of two 18-foot-continuous srans loaded
at center points ( Figures 1, 2 and 3). The loading geometry for
the static loading differed from that of the fatigue loading, in
order to induce transverse bending ( Figures 4 and 5 ).
2.1.2 Steel Beam The steel beams used in the composite sections
were 21 WF 55, A-36. The beams arrived in 42 foot lengths, but 4
foot sections were cut off to obtain coupons.
The cross sectional properties varied from those listed in the
AISC Manual (8). The values used in the calculations are listed in
Table I.
To prevent premature web failure, bearing stiffeners were welded
to the beam at each support and additional stiffeners were used at the
interior support.
2.1.3 Concrete Slab In keeping with the previous phases of the
research program the concrete slab used in this phase was 48 inches
wide and 6 inches deep. The length of the slab spanned the full
length of the steel section.
The longitudinal reinforcement for both composite sections was
in accordance with AASHO Specifications for H-20 loading. It con
sisted of five number 4 bars placed 11 inches center to center as the

J
I I I I
I I l I I I J
I J
1
I I
10
top layer and five number 5 bars also placed 11 inches center to
center as the bottom layer. The two layers were separated from each
other by means of short reinforcing bar sections welded approximately
every four feet to form a cage. The distance between the layers was
2.8 inches center to center. The middle bar in the lower layer was
placed only over the negative moment region and extended 42 inches
past the calculated contraflexure point at both ends. The transverse
reinforcement was also in accordance with the above mentioned speci
fications to simulate an actual bridge slab. The transverse steel
consisted of number 5 bars and was placed 6 inches center to center
on both layers of longitudinal reinforcement. For the cross sections
of the test beams and their dimensions see Figures 1 and 2.
2.1.4 Shear Connectors The shear connectors used for the test
specimens were 3/4 inch high-strength bolts. Standard 13/4 inch di
ameter mild steel washers were spot welded to the underside of the
heads of the bolts. The connectors were then seated in predrilled
holes with a clearance of 31/ 2 inches between the top of the flange
and the bottom of the washer. In this manner the thread of the bolts
was inside the top flanqe and therefore was not exposed to the concrete.
The spacing of the connectors was designed by both the elastic
and the ultimate methods. The allowable values used for the test
specimens were obtained from an average of previous pushout tests (4),
(5), (6). They were 20 kips per bolt for the elastic and 30 kips per
bolt for the ultimate approach for both compression . and tension zones
and did not include a safety factor. The controlling spacing was ob
tained from the ultimate approach and the required number of bolts
were spaced uniformly along the appropriate sections. The beam
NCB6FB1 was designed with no shear connectors over the negative
moment region. NCB6FB2 had the necessary number of connectors over
this region to resist connector failure before flexural failure
( Figures 1 and 2 ).
2.2 FABRICATION
2.2.1 Materials The rolled steel sections met the requirements
of ASTM A36-66.
11
The concrete was obtained from a local ready mix plant and con
sisted of normal weight aggregate and type I portland cement. The
fine aggregate was Missouri River sand and the course aggregate was
crushed limestone with a maximum size of 3/4 inch. The mixture was
air entrained and typical mix proportions were 1:1.85:3.4 by weight,
with a water-cement ratio of 5.0 gallons per sack. This mix was simi
lar to the class B-1 mix used by the State Highway Commission of Mis
souri for Bridge Construction.
For longitudinal and transverse reinforcement, high-strength
steel with a yield of 60,000 psi was used. All bars satisfied the
requirements of ASTM A32-62T.
The bolts used as shear connectors were A325, high-strength
bolts. The washers were standard mild steel flat head washers.
2.2.2 Preparation for Casting The procedure for casting both
beams was identical. The beam was placed on three supports and was
stabilized. The holes for the bolts were drilled with a magnetic
base drill although in practice they would be punched in the shop ).
The strain gages were then attached to the beam at predetermined
points. This procedure will be explained in later sections of this
chapter. Next, the bolts were seated against wire chairs and were

tightened to have an overall height of 4 inches, measured from the
top flange ( Figure 6 ).
Reusable forms, supported against the lower flange at approxi
mately every three feet, were wired together across the top flange
to prevent separation from the steel beam ( Figures 7 and 8 ).
12
The first layer of reinforcement cage was then welded and placed.
Since the transverse steel was not in the form of stirrups it was
possible to handle the layers separately, facilitating the placement
of the reinforcement. After both layers were in place, they were
set on premeasured seats to give them lower and middle clearances
and were welded together with steel legs. The seats were then re
moved. In this manner, it was possible to control the dimensions
of the reinforcement in the slab very accurately ( Figure 9 ).
Before casting, the forms were cleaned and oiled with a thin
coat of form oil.
2.2.3 Casting When the concrete arrived in a ready-mix truck,
it was subjected to a slump test. Upon acceptance it was transfer
red into a concrete bucket mounted on a fork-lift and taken to the
place of casting. There, the concrete was placed in the forms and
vibrated with a tube vibrator Figure 10). Finally the top of the
slab was screeded and troweled.
2.2.4 Curing Several hours after casting the concrete was cov
ered with polyethylene sheets. The next day wet burlap was placed
over the concrete and again covered. The forms were stripped off
after ten days. The slab was kept moist for a period of 28 days and
was then allowed to air dry until testing.

13
2.3 LOADING
2.3.1 Fatigue Loading In order to achieve the objective of the
experiment the composite beams were subjected to two kinds of loading:
dynamic and static. The dynamic loading was applied by 120 kip,
1100 cycles per second capacity, hydro-electric MTS ( Materials
Testing Systems ) equipment. The system consisted of a compressor,
a control panel, two accumulators ( line-tamers ), and two hydraulic
rams with sensitive load cells . The load cells were checked and
found to be within one-half percent of the original calibration at
all loads. The loads were applied by dialing precalculated settings
on the control panel and were read as outputs of the control panel
by means of an oscilloscope and two digital voltmeters. Dynamic load
was transferred to the beam as a point load at each center span
Figures 3, 11, and 12 ) .
2.3.2 Static Loading Static loading was applied by means of two
200 kip capacity hydraulic jacks. The jacks were calibrated with a
300 kip capacity hydraulic testing machine for their complete range
and the calibration was partially checked in a 100 kip capacity
mechanical testing machine. The results of the two independent
calibrations were within one percent of each other.
In testing, the jacks were connected to an electric pumping
system capable of pumping two hydraulic jacks independently. The
electric pump was attached by means of two independent lines to two
main manifolds. The pressure in the manifolds, which had lines leading
to the jacks, was measured by attached pressure cells. These cells
enclosed resistance strain gages to which strain indicators were at
tached. Loading was done by setting the strain indicators to the pre-

14
calibrated increment of the load desired and pumping until the indi
cators balanced. The loads were increased and decreased in small
increments to insure symmetrical loading. The static load was applied
by means of T-shaped distributor beams to produce transverse bending.
See Figures 4 and 5 for the static loading arrangement.
2.4 INSTRUMENTATION
2.4.1 Deflection Deflection was measured at midspans with
one-inch deflection dials graduated to .001 inches. Both dials were
attached to stands which were grouted to the test floor.
2.4.2 Slip The slip between the concrete slab and the steel
joist was measured by dials graduated to either .0001 or .001 inches.
The slip dials were bolted to brackets, which were then cemented to
the inner face of the top flange of the beam with quick drying 910
cement. A stop-angle was then cemented to the bottom of the slab.
Finally, an expoxy filler was placed around both the stop and the
bracket to further insure a solid connection.
The slip dials were attached to the beam either at the locations
of the shear connectors or in the absence of them ( NCB6FB1 negative
moment region) at the locations of the missing connectors. They
were also placed at the ends of the beam and over the center support.
At critical points the dials were put in pairs, one on each side of
the beam.
2.4.3 Steel Strain Strain in the steel joist was measured by
Baldwin-SR4, paper base, resistance strain gages. The gages were
attached to the beam in vertical profiles ( Figures 1, 2, 13 ) at
predetermined locations and were tested to insure proper operation
prior to forming.

The installation of the strain gages was done using the fol
lowing procedure. First, the beam surface was prepared according to
the Baldwin manual ( Bulletin 279-B). Then the gages were attached
with Nitrocellulose cement and dried under pressure. After twenty
four hours the gages were uncovered, checked, and wired. Finally,
they were coated with a rubber-base water proofing compound.
When the water proofing was dry the beam was placed in the
testing frame. The strain gages were then calibrated ( Figure 14
by loading the steel section to approximately one-half of the theo
retical yield stress. The measured strains were compared with those
calculated from the elastic theory to determine proper operation of
the gages.
2.4.4 Load Cell Testing was done on a two-span continuous beam,
making the structure indeterminate. In order to better analyze the
system, the center support was made into a load cell to measure the
reaction.
The load cell was designed for 320 kip capacity, and was made
out of a hollow cylinder, 3/8 inches thick, 8 inches tall and with
an outside diameter of 8 inches. It had 8 resistance strain gages,
4 longitudinal and 4 circumferential, wired into a full Wheatstone
bridge.
The procedure of building this load cell is as follows. First,
the cylinder was cut to specifications and milled to make the ends
parallel. Then a two inch circumferential strip was sanded down to
a mirror finish to facilitate the attachment of the strain gages.
The locations of the gages were marked carefully and this surface was
further improved by means of a metal conditioner and a neutralizer.
15

They were then placed using 910 cement. The strain gages were first
wired individually and were checked for proper operation under a
100 kip capacity mechanical testing machine. After the measured
strains proved linear the gages were wired with utmost care into a
full bridge. The opposing gages were wired in series, making one of
four legs of the full Wheatstone bridge. The cell was checked again
to insure proper functioning. Finally, after all connections proved
to be satisfactory, a rubber-base water proofing compound was applied
gage by gage to eliminate running and spreading.
One-eighth inch deep grooves were machined into two 9 x 9 x 11/8
inch plates to fit the top and bottom of the cylinder. A third plate
was machined to fit a three inch diameter solid cylinder which was to
act as a knife edge and was bolted to the top plate. Another plate
was machined to fit the solid cylinder to act as a bearing plate be
tween the beam and the load cell. Finally, the cylinder was enclosed
16
in 16 gage galvanized plates, loosely bolted to the top and the bottom
plates in order not to carry any load but to protect the inner core
of the load cell. The leads from the gages were wired permanently to
a jack-plug which was attached to the galvanized plates ( Figure 15a,
band c ).
The load cell was calibrated three times with a 300 kip capacity
hydraulic testing machine and this calibration was checked with a
100 kip mechanical testing machine. The results were within one per
cent of each other.
The load cell itself was used as the center support. The de-
flection of this support at maximum load was under .01 inches and was
neglected in the analysis.

For the schematic drawing of the wiring of the load cell see
Figure 16.
2.5 COMPANION SPECIMENS
17
2.5.1 Compression Pushouts Nine compression pushouts were cast
prior to the casting of the beams. These specimens were tested to de
termine the fatigue characteristics of the high-strength bolt shear
connectors. In keeping with previous studies (4), (5) and (6) all push
outs were built with 8 WF 48, A-36 sections. The drilling of the
holes and the placement of the connectors was done in the same manner
as for the composite beams. The slabs were 20 inches high by 24
inches wide by 6 inches thick. The reinforcement was again placed
identical to the previous studies (4), (5) and consisted of #5 high-
strength bars as shown in Figure 17.
Two companion compression pushouts were cast with specimen
NCB6FBI. They were identical to the previously cast pushouts except
the reinforcement was made into a cage similar to that of the beam slab
and consisted of #4 and #5 high-strength bars ( Figures 18 and 20 ).
The instrumentation of the compression pushout specimens consisted of
four .0001 inch slip dials, one at each of the four connectors.
2.5.2 Tension Pushouts Two companion tension pushouts were cast
with composite beam, NCB6FB2. These specimens were similar to the com-
pression pushouts except for their reinforcement, which was made of #4,
#5, and #7 high-strength bars ( Figures 19 and 20 ).
In the construction of the pushouts, any mill scale on the steel
joist was removed, 3/4 inch holes were drilled and the connectors
were seated similar to the main specimens. The beam stub was then
placed in reusable slab forms. The reinforcement was cut to fit the

specifications of the particular set of pushouts, welded together to
form a cage or a layer and was placed in the forms. Casting and
curing of the pushout specimens were handled similar to the main
composite members.
Instrumentation of the tension pushouts required slip dials and
strain gages. The slip dials were attached to the joist at the con
nectors similar to the compression pushouts. To determine the dis
tribution of forces in the specimen, six SR4 resistance strain gages
were installed on the three main bars of one of the two slabs. Each
bar received two gages at opposing ends of a diameter. The bars were
ground to remove all the deformations and sanded down to the required
finish. The strain gages were then attached to the bars using quick
drying 910 cement. Water proofing compound was applied after the
gages were wired and checked.
18
2.5.3 Concrete Cylinders Three 6 x 12 standard concrete cylin
ders were cast with each of the nine pushout specimens. Ten cylinders
were cast with each of the full scale composite beams which were taken
from different sections of the slab as the casting proceeded. Steel
molds were used for the cylinders and the casting was done in accord
ance with ASTM C192-66.
2.5.4 Tensile Coupons Seven tensile coupons were cut from the
four foot sections of each of the steel beams that were removed upon
their arrival. Two were taken from the top flange, three from the
web, and two from the bottom flange. The coupons were standard
rectangular coupons. Their dimensions were 18 inches long, one inch
wide and the thickness of the material.

2.5.5 Reinforcing Bar Sections Nine eighteen inch long sections
were cut from the high-strength reinforcing steel used in the test
specimens . There were three sections from each of the different
sizes used ( #4, #5, and #7 ).
19

I
t
l
3.1 COMPOSITE BEAMS
CHAPTER I II
TEST PROCEDURES
3.1.1 Preparation of Composite Beams The first step in the
preparation for testing was to place the composite beam in the
testing frame. Two steel piers 36 feet apart center to center were
grouted to the test floor. Rollers were attached to each pier. The
composite member was then moved into the frame with the aid of two
five-ton capacity palate trucks and was placed on the supports as a
simple beam.
Next the beam was adjusted so that the plane of loading would
correspond to the vertical axis of symmetry of the member. Bearing
plates were grouted between the steel joist and the rollers to keep
the composite member level.
The third step was the placement of the load cell as the center
support. The midspan dpflpction of thp mpmhpr as a simplp hpam and
the strains at six representative points were calculated using elas-
tic theory. The strains at the same points were calculated for a
continuous beam. The center of the beam was then raised using screw
type jacks until the simple beam deflection and the differences in
the strains were cancelled. When the elevation for the center support
was determined, the south end of the beam was raised using hydraulic
jacks in order to facilitate grouting of the load cell. After the
load cell was in place a final bearing plate was installed between
the load cell roller and the steel joist and the beam was carefully

I ~
lowered onto the screw type jacks which fixed the support elevation.
A final reading was taken after setting of this plate and removal of
the screw jacks to make sure that the deflection and the strains
21
were in fact within an allowable percentage ( 2-3% ) of the calculated
values.
The final step in the preparation of the composite member for
testing was the pretensioning of the bolts. The bolts were tightened
by the II turn-of-nut II method (9). The bolts were first hand tight
ened to a snug tight position using a 12 inch crescent wrench. They
were then tensioned by an additional half-turn using a larger wrench
with an extension.
3.1.2 Preparation of Loading System for Fatigue Loading The rams
of the MTS equipment were bolted to the testinq frame at the load
points prior to the placing of the composite section to facilitate the
centering of the member. The rams were leveled and two bearing plates
were grouted immediately under them on the slab of the composite mem
ber ( Figures 3, 11 and 12). These plates were marked in order to
detect any horizontal movement during the fatigue loading, which did
not occur. The rams and the attached load cells of the MTS equipment
were then linked to the master control unit in order to control and
monitor the loading.
3.1.3 Preparation of Loading System for Static Loading At the
completion of the dynamic loading sequence the MTS rams and the bear
ing plates on the slab were taken off. Columns, 20 inches in length,
were installed at each load point to fill the gap left by the absence
of the r~TS rams. To these col umns 100 ton capacity hydraul i c
jacks were attached and the load was applied through aT-shaped dis-

tributor beam at each load point to produce transverse bending ( Fig
ure 5). The distributor beams were designed to apply 24 kips at the
wings of the T and 152 kips at the tail at the maximum load of 200
kips. Bearing plates with dimensions of 12 x 2 x 6 inches were
grouted on the slab at the wings under the semi-rollers of the dis
tributor beam and a bearing plate of 8 x 2 x 8 inches was placed at
the tail.
Two load points were joined with a longitudinal I-beam ( Figure
4 ) to prevent separation of the jacks as the deflections increased.
Seated steel spheres were placed between the jacks and the longitudi
nal beam in order to transfer the load smoothly. The I-beam was suf
ficiently reinforced with stiffeners in order to prevent premature
failure.
3.1.4 Loading Procedure Prior to the initiation of the dynamic
loading, member NCB6FBI was loaded statically with the MTS equipment
symmetrically and unsymmetrically with respect to the interior sup
port up to the working load. During the unsymmetrical loading the
south ram was kept at a load which produced a positive south end
reaction and the north ram was loaded with increments of 10 kips up
to 70 kips. The south ram was then brought to 70 kips with the same
increments. During the symmetrical loading both loads were applied
simultaneously and slip, strain and deflection readings were taken
every 10 kips. The initial static loading of member NCB6FB2 was the
symmetrical type of loading only.
At the completion of the initial static testing, the composite
members were subjected to fatigue loading. During this process the
rams operated in phase with a frequency of 2.5 to 2.7 cycles per
22

..
•
-, •
23
second. For both members the load cycled between 10 and 72 kips, the
maximum being the calculated working load for member NCB6F BI. During
the dynamic loading phase the operation was stopped at certain incre
ments of cycles and slip, strain and deflection readings were taken at
o and 72 kip loads. After two million cycles the dynamic loading was
discontinued and the composite members were subjected to a final
static loading.
Final static loading for both members consisted of increasing
the load with increments of 10 kips at both load points up to 200 kips.
Readings were taken at each increment after the load was stabilized.
3.2 COMPANION SPECIMENS
3.2.1 Companion Pushouts The nine pushout specimens that were
cast prior to the full scale members were tested under dynamic loading,
each with varying ranges and a different maximum load. Before testing,
the nuts were tightened by the" turn-of-nut " method as previously
described. The pushouts were placed on specially cast piers and
leveled in a layer of high-strength gypsum plaster. The loads were
applied by MTS rams through spherical heads ( Figure 22). Prior to
the initiation of the fatigue loading, each pushout was loaded stati
cally to the maximum load for the particular specimen at least twice.
Slip readings were taken at 10 kip increments. At the completion of
the fatigue test, the specimens were moved to a 300,000 pound testing
machine and loaded statically to failure. The details and the results
of the tests on these specimens are summarized in Tables II and III.
In order to further study the effects of fatigue loading on the
bolted connections, one of the two companion pushout specimens
( N6F4TBla ) of member NCB6FBI was subjected to two million cycles of

24
dynamic loading. Preparation of the pushout for testing was iden
tical to the previous nine specimens. The range of load for N6F4TB1a
was determined from a theoretical analysis of the bolts in the slab of
NCB6FB1 under the load point at the working load.
After the completion of two million cycles, both companion push
outs were tested in a 300,000 pound hydraulic testing machine until
failure. The specimens were leveled on the machine table using a high
strength gypsum plaster and the load was applied through a spherical
head onto a distributing plate which was welded to the beam stub. The
pushouts were loaded with increments of 10 kips but finer increments
were used at critical ranges. For each increment, the load was stabi
lized while slip readings were recorded. The details and results of
these tests appear in Table III.
3.2.2 Tension Pushouts The companion pushout specimens of mem-
ber NCB6FB2 were cast as tension specimens. They were tested in a con
fining frame in order to prevent premature separation and twisting of
the specimen. The load was applied by a 100 ton hydraulic jack, through
a seated steel sphere and a distributing plate which was welded onto
the beam stub ( Figure 23 ).
The connectors were pretensioned by the" turn-of-nut " method
prior to testing and the pushout was then placed in the test frame.
The specimen was leveled and aligned with the aid of four screw jacks
and was positioned above the bottom of the test frame with the main
bars through the slots that were built into the frame ( Figure 23 ).
Steel plates with holes were slipped over the main bars and were
welded to the bars to keep the pushout specimen hanging in place from
the top of the frame. To simulate the continuity of the reinforcement

in a slab, bar sections were welded from bottom extensions of one
slab to the corresponding bars of the other slab. The screw jacks
were then removed and the specimen was checked for proper alignment
and level.
The load was applied with increments of 10 kips. Cracking and
slipping loads were recorded and finer increments were used at crit
ical ranges. At each increment the load was stabilized, while slip
and strain readings were taken.
3.2.3 Concrete Cylinders The cylinders were capped with a
sulphur compound and were tested in a 300,000 pound hydraulic testing
machine.
Of the three cylinders cast with each of the non-companion push
outs, one was loaded to find the compressive strength of the concrete
according to ASTM C39-66. The remaining two were loaded to find the
modulus of elasticity according to ASTM C469-65, and then continued
until fail ure.
Eight cylinders were cast along the beam and were numbered in
order. The odd numbered cylinders were tested at the start of the
fatigue loading and the even numbered cylinders were tested after the
final static loading. One out of each set was tested according to
ASTM C39-66 and the rest according to ASTM C469-65. One cylinder was
cast with each of the companion pushouts and was tested according to
ASTM C469-65.
25
All cylinders were tested either during the test or within 48
hours after the completion of the testing of their companion specimens.
3.2.4 Tensile Coupons The steel coupons were tested in a
50,000 pound mechanical testing machine. The exact cross sectional

26
dimensions of the coupons were determined as an average value of eight
different measurements along the length of the coupon. The extensom
eter used in the testing of the specimens had a gage length of eight
inches.
The specimen was loaded to determine its modulus of elasticity,
its yield point and its static yield point. The static yield point
was found by stopping the testing machine after the yield point had
been reached and letting the load reach a stable value (10). This
was done three times for each coupon specimen.
3.2.5 Reinforcing Bar Sections The testing of the reinforcing
bar sections was done in accordance with that of the coupons, except
the static yield was not determined.
4.1 PUSHOUT TESTS
CHAPTER IV
RESULTS AND COMPARISONS
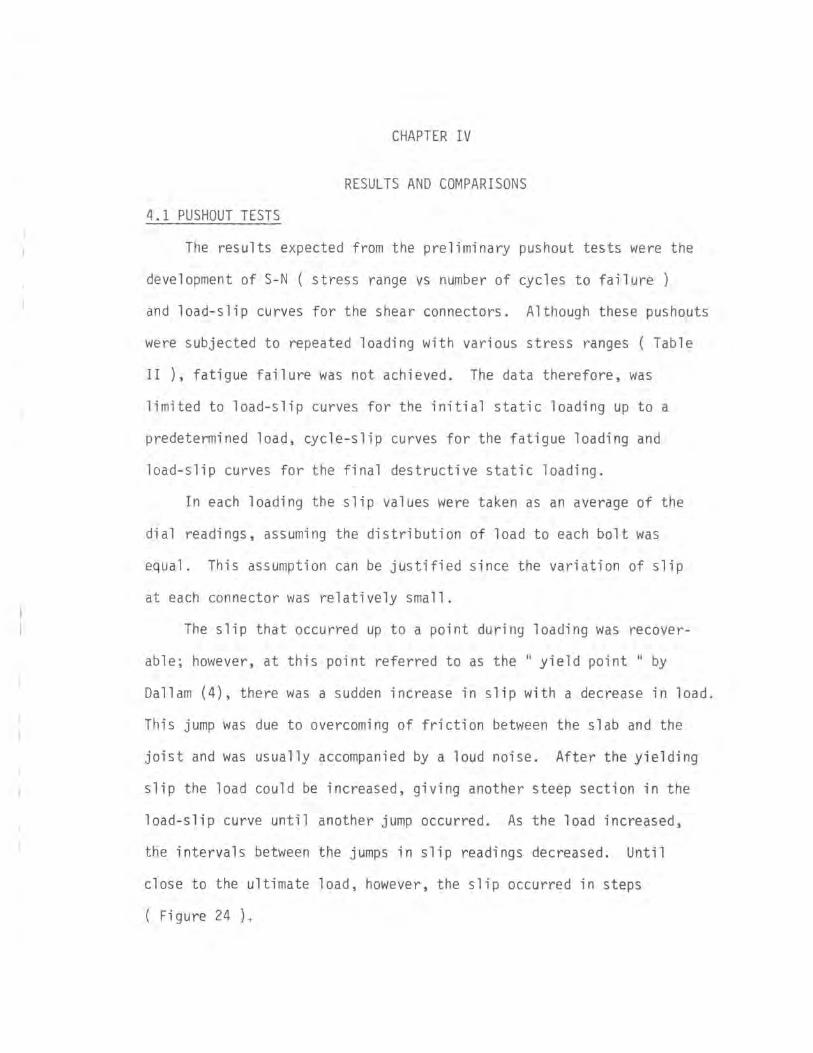
The results expected from the preliminary pushout tests were the
development of S-N ( stress range vs number of cycles to failure)
and load-slip curves for the shear connectors. Although these pushouts
were subjected to repeated loading with various stress ranges ( Table
II ), fatigue failure was not achieved. The data therefore, was
limited to load-slip curves for the initial static loading up to a
predetermined load, cycle-slip curves for the fatigue loading and
load-slip curves for the final destructive static loading.
In each loading the slip values were taken as an average of the
dial readings, assuming the distribution of load to each bolt was
equal. This assumption can be justified since the variation of slip
at each connector was relatively small.
The slip that occurred up to a point during loading was recover
able; however, at this point referred to as the II yield point II by
Dallam (4), there was a sudden increase in slip with a decrease in load.
This jump was due to overcoming of friction between the slab and the
joist and was usually accompanied by a loud noise. After the yielding
slip the load could be increased, giving another steep section in the
load-slip curve until another jump occurred. As the load increased,
the intervals between the jumps in slip readings decreased. Until
close to the ultimate load, however, the slip occurred in steps
( Fig u re 24 ).
The results of the pushout tests are shown in Tables II and III.
During the initial static testing the pushouts that were subjected to
loads of 70 kips or higher had yielding slips at an average value of
18.2 kips per bolt. The corresponding average slip was about .0030
inches.
Since the fatigue loading was done with varying ranges of load,
28
an average value for slip was not detectable; however, all pushouts
exhibited an increase in slip during this type of loading. The amount
of total slip during fatigue loading was dependent on the range of
load, the number of cycles of application and the strength of concrete.
During the final static loading, the pushouts showed similar
characteristics as in the initial static loading. That is, audible
slips occurred again at about 18 kips per bolt, but the average slip
corresponding to this load was .0040 inches. The average ultimate load
for the specimens was 34 kips per bolt. The primary failure was ap
parently caused by yielding of the connectors and excessive local crush
ing of concrete. In several cases, after the ultimate load had been
reached, load application was continued. During this process as the
value of slip increased, the applicable load slightly decreased. The
secondary failure occurred as shearing of two bolts on the same flange
in all cases. An interesting point to note is that the pushouts that
were subjected to fatigue loading with maximum load under their
cracking load, did not exhibit any cracks during the final static
loading, even when the failure occurred without shearing the connect
ors ( Figure 25 ).

4.2 COMPANION SPECIMEN RESULTS
4.2.1 Compression Pushouts In order to study the effects of
repeated loading on the bolted connection, one of the two companion
compression pushout specimens cast with NCB6FBI ( N6F4TBla ) was
subjected to fatigue loading. It was loaded for two million cycles
between 2 and 34.6 ksi per bolt. During the initial static loading
of the specimen there was no sudden yielding slip and the average
residual slip was under .0006 inches. The repeated loading caused an
average residual slip of .0012 inches. The specimen did not exhibit
any cracks or other signs of damage throughout the initial two phases
of loading.
Both specimens ( N6F4TBla and N6F4TBlb ) were then subjected to
a final destructive static loading. The fatigue specimen exhibited
29
an average slip of .0021 inches at 80 kips and had an audible yield
ing slip at 82.5 kips of total load. The average slip corresponding
to this load was .0054 inches. The non-fatigue specimen showed .0013
inches of average slip at 80 kips and did not have an audible yielding
slip until 113.5 kips. The corresponding average slip for this load
was .0061 inches. When the total load reached 140 kips the average
slip for the two specimens was .1805 and .0405 inches, respectively.
Both specimens started cracking between 180 and 190 kips, but the
failure in each case was caused by sudden shearing of connectors and
occurred at 200 and 209 kips, respectively ( Figure 26). The
results for this set of specimens are presented in Table IV and
Figure 27.
An interesting point to note is that compared to the non-compan
ion compression specimens the ultimate strength of these pushouts is

1
J
I I I I I I I I I I 1
J
j
I I I J
about 50% higher. The only real difference between the two sets is
in the arrangement and the amount of the reinforcing steel in their
respective slabs ( Figures 17 and 18). For comparative results see
Table III and Figure 24.
4.2.2 Tension Pushouts To study the characteristics of the con
nection further, two tension pushouts were cast with NCB6FB2. The
desired result from these pushout tests was to develop the load-slip
relationship of the bolted connection in tension. The results of
these tests are summarized in Table V.
30
In order to be able to detect any eccentricity during the loading
of the tension pushouts, the load was also calculated from the strain
gages on the main bars of one slab. It was then assumed that the
load in the other slab was the difference of the applied and the cal
culated loads. The load on a connector was taken to be half the
value of the load in the slab. In all cases the load-slip curves
were derived from the slab of each pushout that received the greater
component of the applied load .
The first tension pushout did not have any eccentricity during
loading, that is, the calculated load was exactly half of the applied
load. The yielding slip occurred at 90.4 kips and was due to cracking
of one of the slabs. The cracking of the other slab followed approx
imately 10 kips later. The pushout failed at 123.6 kips ( 30.9 kips
per bolt and the failure was caused by splitting of a concrete slab.
The second pushout showed slight signs of eccentricity. Although
the applied load was 85 kips when initial cracking and slip occurred,
the calculated load was only 40.5 kips for one slab. This left 22.25
kips per bolt for the cracking slab. The second slab cracked after

31
an increase of approximately 12 kips. This pushout failed by split
ting and excessive cracking of the slabs around the connectors and
reached the ultimate load at 119 kips ( Figure 28). The load that
was calculated for the failing slab, however, was 63 kips, that is
31.5 kips per bolt. For the load-slip curves for this set of pushouts
see Figure 29, and for typical tension failures see Figure 30.
4.2.3 Concrete Cylinders The results of the cylinder tests for
the compression pushouts, companion pushouts and the composite test
beams are presented in Table VI. The modulus of elasticity of the
specimens was determined from the slope of the stress-strain curves.
The compressive strengths and moduli of elasticity that appear in
this table are average values.
4.2.4 Tensile Coupons The results of the coupon tests are
presented in Tables VII, VIII, IX. All values listed for the flanges
and the web are average values of their respective coupons. The last
column is the weighted average of the results for the particular
specimen. The weighing was done with respect to the measured areas
of each section. These values were used in the analysis of the
composite test beams.
4.2.5 Tension Bar Sections In order to be able to calculate the
distribution of load to the slab of the tension pushouts, strain gages
were placed on the main tension bars. Since the placement was done
after removing the ribs and decreasing the cross sectional area slight
ly, a calibration of the stress-strain curve was necessary for accurate
results. The results, as calibration curves, were used in the calcula
tions of the load-slip relationships of the tension pushouts.

4.2.6 Reinforcing Bar Specimens The results of the reinforcing
bar specimens are presented in Table X. The yield strengths of all
the specimens were determined by 0.2% off-set on the stress-strain
curves.
4.3 COMPOSITE BEAM RESULTS
4.3.1 General Observations Before the presentation of formal
results some observations of the general behavior of the full scale
composite members during testing will be summarized.
32
During the initial static loading of NCB6FB1 the first transverse
crack was observed at 40 kips, directly over the center support ac
companied by an increase in the deflections of both of the spans and
an increase of slip of the non-composite section of the beam. The
member was then taken up to 70 kips with increments of 10 kips and
was brought back to zero. An average residual deflection of .0077
inches was observed. Residual slip in this case was confined mainly
to the negative moment region and the maximum value was .0026 inches.
Next, the composite beam was loaded unsymmetrically as described
previously. The unsymmetrical readings caused by the loading in de
flection, slip, and strain became symmetrical once the applied P loads
were brought to the same value at 70 kips.
At the completion of the initial loading sequence, the member
was subjected to fatigue loading. The overall time it took to com
plete this phase of the experiment was 10 days of continuous cyclic
loading with intervals for reading deflection, slip, and strain gages
at 0 and 72 kips. During this time it was noticed that the readings
of deflection and strain varied without an obvious pattern and with
out any corresponding change in slip. It was assumed that this be-

I 1
J
J
! i f j
J
33
havior of higher or lower readings compared with the previous ones was
mainly due to temperature and humidity changes in the laboratory from
one interval to the next.
Two more transverse cracks were observed about 6 inches on either
side of the first crack during the early phases of the fatigue loading,
at about 28,000 cycles. The slip readings increased until the count
of 400,000 cycles and stopped except for some irregular small in
creases throughout the rest of the dynamic loading. The substantial
increases ( over .0010 inches) were limited to the negative moment
region. The maximum value of residual slip during this phase was
.0018 inches. The residual deflection readings, although irregular,
had an increasing pattern. The total change in the readings at the
end of the fatigue loading was .0102 inches. Extensive branching out
of the initial cracks was observed during this phase.
At the end of the fatigue loading sequence, the loading apparatus
was changed and the member was subjected to a final static loading.
During this loading two more transverse cracks, at about 7 inches from
the previous cracks, were observed between the loads of 110 and 120
kips. The slips ( audible) corresponding to these loads were much
larger throughout the beam, with maximum values of .0100 inches for
the composite and .1020 inches for the non-composite sections. At
150 kips, longitudinal cracks due to transverse bending and the cracks
in the slab under the load points were observed. As the load was
increased there was an apparent branching out of the transverse cracks
over the negative moment region accompanied by several more indepen
dent transverse cracks. Also the cracks under the load points propa
gated higher in the slab.

34
The width of the initial crack was measured at 70, 90, 120, 150,
and 200 kips. The readings in millimeters were .20, .24, .30, .36,
and .46 .0079, .0092, .0118, .0142, and .0181 inches respectively).
The width of the initial crack at the interior support was the maximum
throughout the experiment.
Member NCB6FB2 had its initial transverse crack at 40 kips directly
over the center support. The second transverse crack was observed
about 15 inches south of the initial one at 70 kips. There was a
noticeable increase in the deflection at the occurance of each crack,
however, the accompanying slip readings did not change considerably.
The average residual deflection was .0112 inches and the maximum
residual slip observed was only .0007 inches.
The width of the initial crack was measured at 50, 60, and 70
kips during the initial static loading. The corresponding values
were .20, .27, and .32 millimeters ( .0079, .0106, and .0128 inches
respectively).
During the very early phases of the fatigue loading of NCB6FB2,
at approximately 4000 cycles, a third transverse crack about 9 inches
north of the initial one was observed. There was no branching of
cracks throughout the dynamic loading of the member. At the comple
tion of two million cycles, the member exhibited .0099 inches of av
erage residual deflection and the maximum value of the residual slip
along the beam was .0006 inches.
The fatigue loading lasted nine days and the effects of tempera
ture changes were noticeable in the behavior of NCB6FB2 strain and
deflection readings.
During the final static loading the audible slip with an increase

35
in the gage readings occurred at 130 kips. At this load longitudinal
cracks due to transverse bending were observed. Also two independent
transverse cracks were formed about 8 inches either side of the ini
tial center crack. They had propagated the full width of the slab at
about 150 kips. At this load two more transverse cracks were observed
about 40 inches from the first crack. The first transverse crack un
der the load points was observed at 170 kips. During the rest of the
final static loading there was very little branching out of the cracks.
Only very short new cracks formed in the negative moment region, inde
pendent from the existing ones.
The width of the initial crack was measured at 70, 100, 130, 150,
170, and 200 kips. The readings were .32, .40, .46, .58, .70, and
1.0 millimeters ( .0128, .0157, .0181, .0228, .0276, and .0394 inches
respectively).
There were no noticeable effects on the connectors of both of
the composite members. All the connectors were fully intact at the
end of each test.
4.3.2 Analysis In all the theoretical and experimental calcula
tions the actual beam measurements ( Table I ) and the information ob
tained from the cylinder ( Table VI ) and the coupon tests ( Tables
VII-X) were used. The properties of the steel joist varied for the
top flange, web, and bottom flange. This fact was considered in the
transformations for the calculations of the centroid depth, moment of
inertia and also in the determination of the stresses and strains.
The internal couple method was used for the calculations of the
moment capacity of the section for a given criteria, such as the work
ing or yield capacity. For member NCB6FB1 the moment of inertia cal-

36
culations were based on no interaction for 52 inches on either side
of the center support, that is up to the effective area of the first
bolt. It was also assumed that the curvature of the two components
were equal at any load (11). For sections between the contraflexure
points, the part of the slab in tension was considered cracked, and
for the sections between the contraflexure points and the first bolts,
the full slab was taken into account. For the bolted sections of the
test beam, the moment of inertia was determined for a composite sec-
tion using section transformations (12).
For the theoretical working and yield capacities of member
NCB6FBl, the strains in the bottom of the lower flange over the cen-
ter support were the controlling conditions. The moment capacity for
this critical condition was calculated by means of the internal couple
method and the assumption of identical curvature was taken care of
using E ) ( I
M . = { 1 + slab slab} M sectlon I E )( I \ beam
beam beam
The theoretical ultimate capacity of the section was determined
using ultimate strength theory (13) for the slab and the assumption
that all the steel had yielded at the failure of the critical cross
section. Curvature for the beam and the slab was therefore assumed
different and separation during testing confirmed this assumption.
For member NCB6FB2 the moment of inertia calculations were based
on full composite action and the theory of transformed sections
throughout the beam. The slab for the sections between the contra-
flexure points was assumed fully cracked.
The theoretical working, yield and ultimate moment capacities

I l l
37
for NCB6FB2 were calculated by means of the internal couple method.
The theoretical working capacity criteria was taken to be the criti
cal strain under the bottom flanqe over the center support, although
the reinforcement at the same cross section reached this strain earli
er. The difference was under 6% of the assumed moment capacity. This
was done in order to be able to compare the theoretical values with
the experimental capacity, since there were no strain gages on the
reinforcement. The theoretical yield capacity was based on the first
yield of any steel in the cross section and was controlled by the
strain under the bottom flange at the same cross section. In the
calculations of the ultimate moment capacity for NCB6FB2 the assump
tions were that all the steel had yielded and that no part of the
steel had reached strain hardening.
Using the calculated properties of the composite sections the
analysis for all loads were then carried out by means of a computer
program using the stiffness method for a variable EI along the beams.
Using theoretical symmetry the beams were analyzed as propped canti
levers, working only with the right span of the continuous sections.
For the experimental working and yield loads of both the mem
bers, the allowable strains were first calculated for the steel in the
cross sections that could possibly control the load. The controlling
cross section was then picked and the accompanying strain was compared
with the data obtained from the strain gages. In doing so the dead
load strains were also taken into consideration. Whichever strain
reached the value of the calculated working or yielding strains, the
load at which these strains occurred was denoted as the working or

1
1
1
I 1
I I I I
1
I 1
I J
1
1
J
yield loads. There was no collapse since a mechanism had not formed
although a plastic hinge formed over the center support in NCB6FB1.
The results of the theoretical and experimental analyses for
members NCB6FBl and NCB6FB2 are listed in Table XI.
38
4.3.3 Deflection Results The deflections for both members are
presented in Figure 31. The deflection points plotted are the average
of both spans directly under the load. The solid lines included in the
figure are the theoretical full interaction and no interaction deflec
tions, and were calculated using the stiffness method and variable EI.
The deflections of NCB6FB2 are slightly higher than the theo
retical full composite deflections, while member NCB6FBl obviously
developed some composite action due to the restraint of the connectors
in the positive moment region.
4.3.4 Slip Results The slip distribution along the members are
shown in Figures 32, 33, 34, 35, and 36. The distribution is plotted
for the working and yield loads of NCB6FB1, working and yield loads
of NCB6FB2 and at 200 kips in a comparative manner. The slip for a
given load is plotted against the distance from either side of the
center support for the full length of the composite members. The
arrows marking the direction of slip in the figures show the direc
tion of slip of the slab with respect to the steel joist. As seen
from the figures the slip is zero under the load points and over the
center support and the slab moves away from the load points.
It can also be seen from the figures that the lack of composite
action over the negative moment region seems to affect the bolted
sections throughout the beam. While the slip for NCB6FBl is much high-

er in the negative moment region as expected, it is also higher in
the composite positive moment regions, indicating that the connectors
carry more force than what is predicted by elementary beam theory.
4.3.5 Reaction Results The results of the reaction measured
from the load cell are plotted against the applied load for both com
posite sections ( Figure 37). In order to be able to use a larger
scale only half of the numerical value of the reaction is used, which
is actually the shear force at the center support.
For both members the measured reactions are only slightly higher
than those calculated theoretically with the maximum difference less
than 2% of the measured reaction.
4.3.6 Strain Results The strain profiles are presented next
39
Figures 38, 39, 40, 41, 42, and 43). These profiles are taken from
representative sections of the beam: Section A directly under the load;
Section B in the positive moment region 68 inches from the center sup
port; and Section C in the negative moment region 35 inches from the
center support. They are plotted against the depth of the member and
a positive strain indicates tension.
The profiles are plotted for the working and yield loads of
NCB6FB1 and working and yield loads of NCB6FB2 in a comparative man
ner, that is, each figure shows the strain profile across a given
section of both beams at two given loads. The theoretical profiles
are shown by solid lines and the experimental values are plotted using
a different symbol for each of the cases.
The theoretical strains were calculated by using the measured
reaction to reduce the system to a determinate structure and applying
elastic beam theory.

The theoretical values of strains at Section A ( under load)
generally show good agreement with the experimental strains. The
assumptions ( full composite action) used in the calculations of the
theoretical values seem to be justified. However, the theoretical
strains differ considerably from the experimental values as the pro
files approach and enter the negative bending region. This region is
also the section of the beams where the maximum slip occurs. The ef
fects of slip on the discrepancy between the experimental and the
theoretical strains is especially obvious at Section B ( 68 inches
from center support). In the calculations of the theoretical strain
values for NCB6FB1, full composite behavior is assumed since there
40
was connection between the slab and the joist on both sides of the
profile. The slip values at this section, however, are about 80% of
the maximum slip throughout the beam. Thus, the differences in the
theoretical and experimental strains could in large part be due to the
presence of slip at this section. The theoretical and experimental
values of strain for NCB6FB2 at Section B, on the other hand, show
generally good agreement. It should be noted that the slip for
NCB6FB2 in this region is approximately 30% of the slip in NCB6FB1.
The behavior of the profile 52 inches from the center support,
which is not plotted in this report, could not be accounted for. This
profile showed signs of faulty gages and did not plot in a straight
line, with deviations as high as 100%. This behavior was noticed in
the testing of both beams and is especially obvious as the contra
flexure points extend closer to this region.
The theoretical strains at Section C ( 35 inches from center

I 1
1
I 1
J
I I I I I 1
I )
J
J
1
J
I
41
support) differ from those obtained experimentally. The assumption
of fully cracked section in the calculation of the theoretical values
results in a lower neutral axis for these values. As the load in
creases the experimental neutral axis seems to approach the calculated
values due to the cracking of the slab over this region. The force in
the slab of NCB6FB1 at Section C, that causes slip, is relatively
smaller than the force at Section B, which causes the same amount of
slip since there are connectors on both sides of Section B. There
fore, although considerable slip is present in this region - as much
as at Section B - it does not seem to affect the position of the neu
tral axis as much as at Section B.
4.4 COMPARISONS
4.4.1 Cracking Patterns For both composite beams the first trans
verse crack was observed at 40 kips of applied load. NCB6FB1 did not
exhibit any additional cracks during the initial static loading, while
NCB6FB2 showed another transverse crack, as previously described, at
70 kips. This fact was attributed to the stiffer behavior of the sec
ond beam in its negative moment region.
During the fatigue loading phase, NCB6FB1 cracked readily, in
the form of independent transverse cracks and also extensive branch
ing out of the already present ones throughout the negative moment
region. On the other hand, NCB6FB2 exhibited only one additional
transverse crack, as described before, and only small extensions of
the original cracks were noted.
The cracking pattern of NCB6FB1 throughout the final static load
ing was closer to the assumption of a fully cracked section with exten
sive branching of cracks. There was no uncracked section of slab in

I I J
I I I I
42
the negative moment region, with any substantial length, at a load of
150 kips. NCB6FB2, however, exhibited only five main transverse crac ks,
with little branching until 150 kips. All transverse cracks of the
second beam, with the exception of the middle one, started in the vi
cinity of a shear connector under the slab. For the negative moment
region cracking patterns see Figures 44 and 45. Also to aid the com
parison of the behavior of the members with respect to their cracking
patterns, comparative sketches of the negative moment region are in
cluded ( Figure 46). These sketches are of the cracking patterns at
the working and yield loads of the respective members during the final
static loading and at the final load of 200 kips. It is of interest
to note that NCB6FBI ( no connectors had numerous cracks of rela
tively small width whereas NCB6FB2 had fewer and wider cracks.
The longitudinal cracking patterns under the load points were
identical for both composite members. They appeared as a single crack,
increasing in length on both sides of the load points, as the load
was increased. Figures 47 and 48 ).
The flexural cracking patterns under the load points ( positive
moment region) were also similar. The first cracks for NCB6FBI
were observed at a load of 150 kips, while NCB6FB2 did not exhibit
the same until 170 kips. At the end of the final static testing the
penetration of flexural cracks for NCB6FBI were measured to be higher
in the slab than those of the second beam. (Figures 49 and 50 ).
These facts were also attributed to the stiffer behavior of NCB6FB2 in
the negative moment region.
4.4.2 Beam and Companion Pushouts The load slip results of the
companion pushouts were to be compared with that of several connectors

43
in the full scale members. The strain observed from the vertical pro
files was integrated over the area of the beam and the result was
multiplied by the experimental modulus of elasticity giving the axial
force in the beam. The difference of forces between the profiles was
to be assumed as the shear carried by a pair of connectors.
Unsatisfactory behavior of the central profiles ( 52 inches from
center support ), however caused the calculations to be inconsistent
and unworthy of presentation. Therefore, no attempt was made to com
pare the load-slip relationships of the composite members with that of
their companion pushouts.
4.4.3 NCB6FB1 and NCB6FB2 Throughout this report the results
were presented in a comparative manner, with data for both of the com
posite sections appearing in the same figure under similar conditions.
In comparing the members for stiffness from the deflection curves,
reaction results, and the cracking patterns it can be seen that member
NCB6FB2 - with connectors over the negative moment region - was con
siderably stiffer over this section. At 200 kips of applied load, the
negative moments for NCB6FB1 and NCB6FB2, calculated from the measured
reactions, were 5687 and 6324 inch-kips respectively. It can be said,
then, that NCB6FB2 behaved 11% stiffer with respect to negative
moment over the center reaction. The moments that were calculated
from the measured reactions versus applied load are plotted in Figure
51, for a further comparison of the behavior of the two members.
The behavior of the members with respect to slip can readily be
seen from the slip distributions. The slips at the bolt 59 inches
from the center support ( first bolt for NCB6FB1 into the span) for

44
both beams are plotted to show the typical slip differences for the
beams for the full load range ( Figure 52). It is apparent that in
composite beams without shear connectors in the negative moment region,
the connectors adjacent to this region will be subjected to consider
ably more shear force than predicted by elementary beam theory.
It is of particular interest to note that the presence of bolt
holes in the tension flange over the center support of beam NCB6B2
did not in any observable way adversely affect the behavior of this
beam during either the fatigue or static loading. This was due to
the fact that friction was not overcome in the connection during the
fatigue loading.

CHAPTER V
SUMMARY AND CONCLUSIONS
5.1 SUMMARY
Nine pushout specimens were tested to determine the fatigue
characteristics of the high-strength bolted connection. The data
used in the investigation was load-slip and cycle-slip curves.
Two double span continuous composite members were tested using
dynamic and static loading, to determine the effects of fatigue
loading on the static behavior of the composite members. Both members
were designed according to AASHO specifications with only one using 3/4
inch bolted shear connectors over its negative moment region.
Load-deflection, cycle-deflection curves, strain profiles, slip
distributions for dynamic loading, slip distributions for static load
ing, and load-reaction curves for the interior support were used in the
investigation of the behavior of the full scale composite members.
Predicted loads, deflection, and reactions were compared with the actual
values obtained during testing. Using the above mentioned data, the
behavior of the two composite members and their cracking patterns were
compared.
Two compression and two tension pushouts were tested. One compres
sion pushout was subjected to fatigue loading prior to destructive stat
ic loading. Load-slip curves and ultimate strengths were investigated.
5.2 CONCLUSIONS
The following conclusions were drawn from this investigation:
1. The magnitude of the critical or yield load and the

r
I
2.
ultimate load for pushout specimens subjected to fatigue
loading ( up to 10 million cycles) was essentially the
same as those for pushout specimens subjected to static
loading.
The magnitude of the ultimate load for pushout speci
mens with two layers of reinforcement in the slabs
( Figure 18 ) was 50% greater than the average ultimate
load for pushout specimens with one layer of reinforcement
in the slabs ( Figure 17). The critical or yield load
was not affected by the presence of additional slab re
inforcement.
3. The member with shear connectors over its negative
4.
5.
moment region exhibits practically no slip in this re
gion at its working load compared with the member
lacking such connectors.
The absence of shear connectors in the negative moment
region increases the slip and connector force in the
positive moment region.
The elimination of the shear connectors over the nega
tive moment regions reduces the working and the first
yielding loads of a continuous composite member by 30%
and 20%, respectively.
6. Elementary beam theory assuming complete interaction
can satisfactorily be used to predict the behavior of a
continuous composite member up to its yield load pro
vided sufficient connection exists and careful cons;d-
46

eration is given to slab cracking in the negative moment
region.
7. There are fewer cracks ( but of greater width) when
connectors are placed in the negative moment region.
8. Fatigue is not a factor in the design of composite mem
bers using high-strength bolts as shear connectors.
There were six major objectives of this study which are listed
47
on pages 6 and 7. Objectives 1,3 and 4 were discussed at length and
conclusions regarding them have just been stated. Objective 2 was to
determine if the fatigue behavior of the bolts in the pushout tests
could be used to predict their fatigue behavior in the beam. Objective
5 was to determine the range of load that would cause fatigue failure.
Since fatigue failure was not attained for loading at or below the
critical load of the bolts, and since the design load for a connector
would be based upon a factor of safety applied to the critical load,
these objectives were accomplished in that they were not applicable
because the fatigue behavior was approximately the same as the static
behavior.
Objective 6 was to determine the effects of longitudinal slab
cracking on the connector behavior and although cracks did appear
( Figures 47 and 48 ) there was no apparent effect upon the connectors.
It could have been a factor if the static loading could have proceeded
to develop the ultimate moment capacity in the positive moment regions.


-
2"
- --
p
4@2411
10
~ 4811
I ~4-4@11"
SYM.A~
2
4011 16'~174-35"
1811r 5911
~ II: ; ,rt:1L ~5;g=.~!~-.
~ c== ==)----"---
10all
• 1 o
p
?I JV"55"
10all
LOAD CELL
DEFLECTION DIAL
0.00111
DIAL
• 0.000111
DIAL
-2 PER CROSS SECTION
STRAIN GAGE
Figure 1 Dimensions and Instrumentation of NCB6FBl ~ <.0

P
~ 21#"55
2" ,~40"
4 (i) 2 4"11613@9~la~14"~2(ci) la'.!..l9'- loa" ..j. loa"
~48" 4@ II"
-.- .. LOAD CELL 6"
----L- A DEFLECTION DIAL
0 0.001" DIAL
• 0.0001" DIAL
~-#4 ~ 8 2 PER CROSS SECTION
~JL 10.34" #5 - STRAIN GAGE
Figure 2 Dimensions and Instrumentation of NCB6FB2 (Jl C)

51
Figure 3 Dynamic Loading Apparatus
Figure 4 Static Loading Apparatus

zs
I 1

-" -.....,.. .. ,
SWJO~ paJ~M L aJn6~~
£9

a6-e]
6u~JjoJu~a~ 6 ajn6~j
17S
1
I f
I I I

99
LClU{?d
L o.,quo:)
SlW 11 ClJn6U
we~ SlW Zl ClJn6~~
I r
r
r
r
[
r [
1
[
[
I [
[
[
I I 1
1

J
J
I I f
56
Figure 13 Instrumentation
Figure 14 Strain Gage Calibration

Figure 15a Load Cell Core
Figure 15c Load Cell
Ready to Use
57

/ /
,1/ '1/ - --~ ----/1'
/1' / 1 " / ,
1
ACTUAL
SCHEMATIC
figure 16 Load Cell Wiring
58

#5 BARS (;;)6"
#5 BARS
(Q.) 10"
59
1 Varies
-00":-:=::':1:', J 1"'
20"
, ' ' ~ ., " p
b
• , . ' ; , 'I) ..,. .... . :, ___ -.Jlr
t- 6"-f SECTION A- A
Eigure 17 Fatigue Pushout Specimen

i i 3"
3"
f 7"
7" f;.'_,.._ 1::-_- - --~ , 20"
1 _~I~I----
10" 7" A
3" ____ ~L ~ t I T 7/1/17ll77777/1l77~L -- ~----?- 1 j/"'/~
#5 BARS (Ci) 7"
#4 BARS @7"
#5 BARS @IO"
#5 BARS @IO "
.. :
24"
. - '~ " , , "" , . ' ."- 2
~611~
SECTION A-A
.Figure 18 Beam Companion Compression Pushout Specimen
60

STRAIN GAGE
23"
t
d-
'"'- -
, t
t 10"
-+ 10"
, A I " II I~ iii I
#5 BARS 1':'\ I" \.QJ 5"/2
#7 BARS (;)10"
#(JARS I ..
5 ~2
",', •.. , .'1>'.
P:I · ...... '1'.-.', .•.
.. . \ .
··~ I .. ~ · .' 1:: . ~ ,: .'.'. ~
~ ~ .. :t --1" SECTION A-A
Figure 19 Companion Tension Pushout Specimen
61
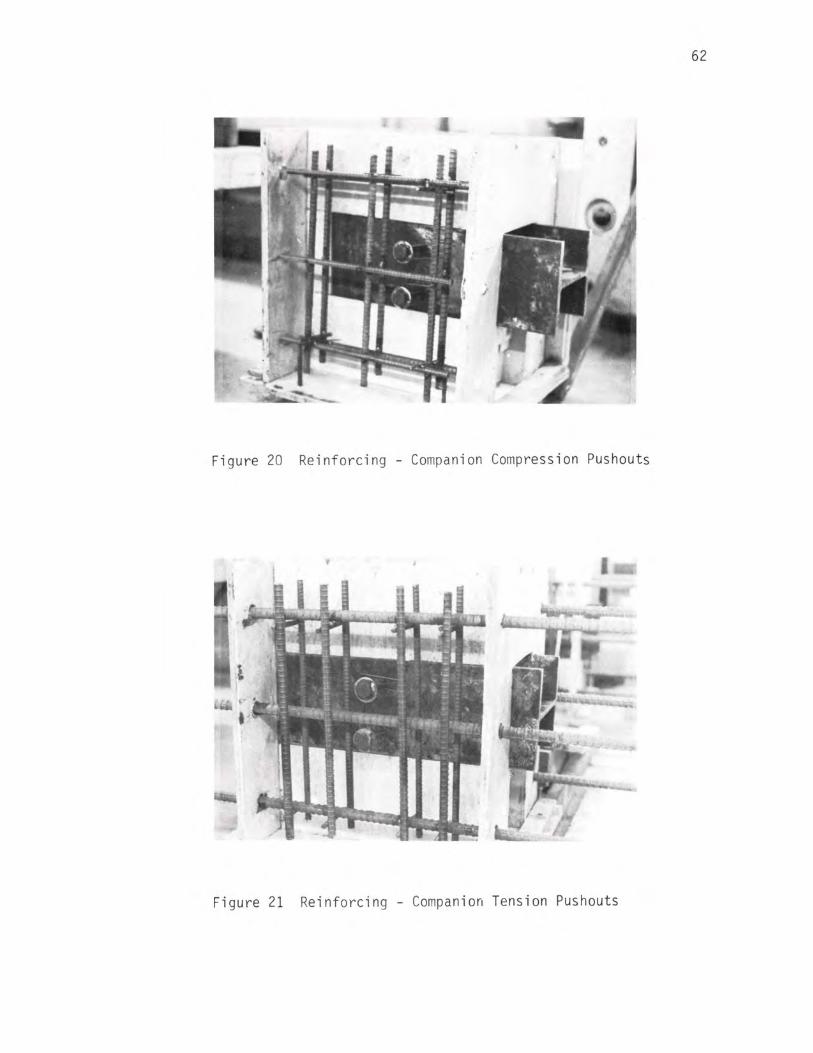
62
;
Figure 20 Reinforcing - Companion Compression Pushouts
•
Figure 21 Reinforcing - Companion Tension Pushouts

s:j.nollsnd uo
:j.sal uo~sual tZ aJn6~J
t9

en Q..
~
I ~ ...J 0 m a:: w Q..
0 « 0 ...J
40
30
~~~ 20 ~
~
10 It ~ • ~ ~
o o
• • ~
0.02
~ .It. A· • - ~
~
~ N6F4TB9 (Ult. (Ci) 33.7 K / bolt)
• N6F4TB I-a CUlt. (ci) 50.0K/ bolt)
II
0.04 0.06 0.08 0.10
SLlP- INCHES
Figure 24 Load-Slip Comparison of Non-Companion and Companion Pushouts
L
0'> +::>

S91~.:l9N
S9
r
r
r
[
r
[
r
[
I I (
1
I I

99

en a.. :::.r::
40
30
~ ~ ~
4 ~ t
~20 o
r&& m 0:: LaJ a..
o 10 <l o ...J
~
~ A. IL-lo .
~ ~ ~
o o
I ~ ~
~ &
& & &
&
& N6F4TB 1- Cl
(Ult. ((i) 50.0 K/ bolt) ~ N6FGjBI- b
CUlt. 52.3 K/bolt>
0.02 0.04 0.06 0.08
SLIP - INCHES
Figure 27 Load-Slip Comparison of Fatigue and Non-Fati gue Specimens
~
0 .10
0'> "-..J

aJn l P?.:J UO ~ sual
-JopauuoJ
+e 6u~~JeJJ e8Z aJn6~.:J
89

30
en Cl. ~
·0 • • I ~ 20 ...J
~~.o
0 m a: w Cl.
a <f 0 ...J
• 0
• 0 • 10 0
~ ~
~ o
o .005
0
0- • 0
o •
•
o N6T4TBI- a (Ult. @ 30.9 K Ibolt)
• N6T4TBI-b (Ult. (Q) 29.8 K/bolt)
.010 .015 .020 .025 .030
SL IP - INCHES
Figure 29 Load-Slip Tension Pushouts
0-
I
i I
I
I
i
I
.035
0\ \..0

OL

200 • • • • • en Cl. • • ~ 150 I •• .....
2 0 •• Cl.
o 100 <t 0 ....J
•• FULL INTERACTION
M • a: W Cl. 50 0 <t 0
_~ft NO INTERACTION •
7-....J
V' o o 0 .2 0.4 0.6
MID- SPAN DEFLECTION - INCHES
Figure 31 Deflection at Load Points
I •
NCB6FB I
N CB6FB 2
0.8 1.0
'-J ........

en w J: U 2
I a.. ...J en
.0150~.------------------------------------------------------------~
.0100
.0050
__ e-e,. o I - >~.-e ~ ---~~ • ~ _ I
-.0050
16 12 8
P = 70K
~ NCB6FBI
-e- NCB6FB2
4 t 4
DISTANCE FROM CENTER SUPPORT - FEET
8
Figure 32 Slip Distribution at Working Load of NCB6FBI
12 16
'-J N

en w :r: u z -I
Cl.
.....J en
.0150 " ---------------------------,
.0100
.0050
0 ---~ / .'.... ~ .~.'. "-. /e _ ~ / __ ._~_ -
I~ /~ P = lOOK
-<>- NCB6FBI
-0050 ~ -e- NCB6FB2
16 12 8 4 t. 4 8 12 16
DISTANCE FROM CENTER SUPPORT - FEET
Figure 33 Slip Distribution at Working Load of NCB6FB2 -.....J W
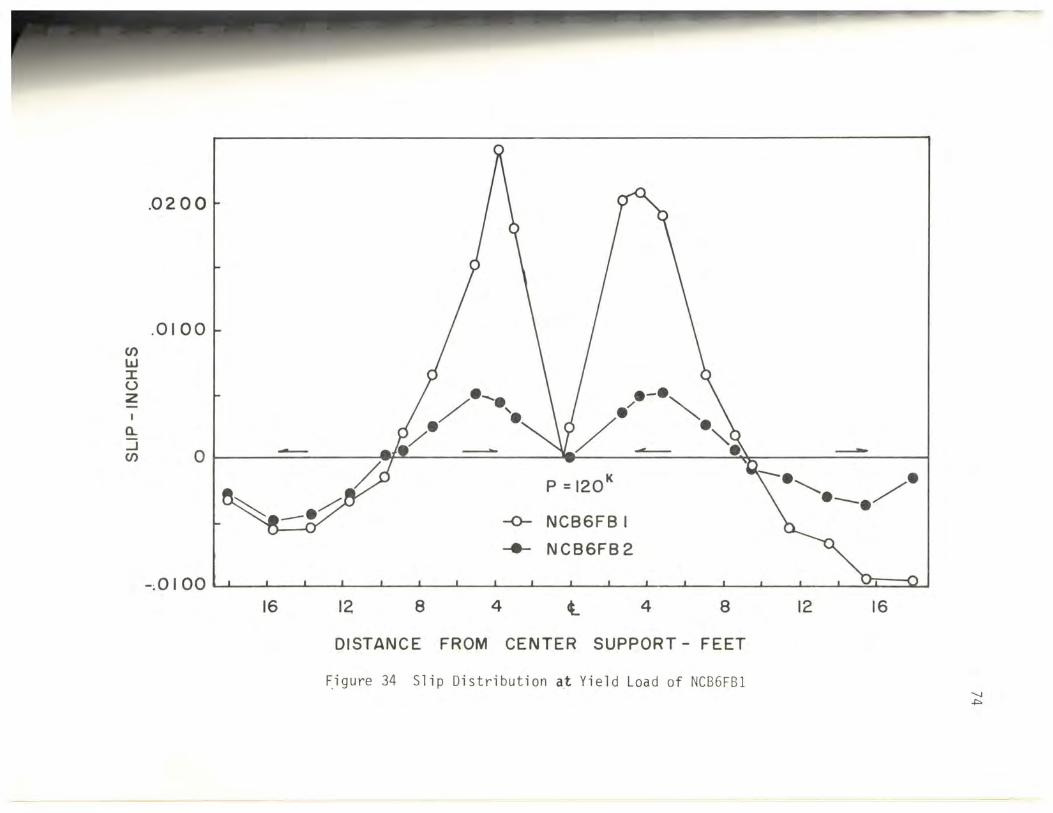
en w I U Z I
a.. ..J en
.0200
.0100
O· --/ --,/e e'e
-P = 120K
-<>- NCB6FB I
...... NCB6FB2
---" /e __ ./
-~O 100 I UT==-O I
16 12 8 4 t. 4 8 12 16
DISTANCE FROM CENTER SUPPORT - FEET
~igure 34 Slip Distribution at Yield Load of NCB6FBI '-.J +:>

- -- .....-........ ............... .----... - --
.0300
.0200
~ .0100 f I 0 ---
1-/--\ ;I __
'-\a" --- '- \ -a.. --.J en
P = 150K
-.0100 ~_ ~ -'\ " e ~e_e -0- NCB6FB I
e __ e/
-e- NCB6FB 2 I ~-
-.0200
16 12 8 4 t 4 8
DISTANCE FROM CENTER SUPPORT - FEET
F.igure 35 Slip Distribution at Yield Load of NCB6FB2
12 16
'-J (J1

-
.0800
.0600
.0400
. 0200
CJ) W I O' --u z -I
a.. -.0200 ...J en
- .0400
-.0600
16 12
/.-. ./ '. / ---
P =200K
-0- NCB6FB 1
---
-.- NCB6FB 2
8 4 t 4 8
DISTANCE FROM CENTER SUPPORT - FEET
Figure 36 Slip Distribution at Final Load
., . ............. ---.--
12 16
'-.J (J")

200
en 150 a. ~
I
J-2
o 100 a. o <t o -1
tr 50 w a.
o ~ -1 / o
o
•
I, ........ --/.r
"Y ........ ,,7-
,-: .. "Y
/ ,. •• ,,/
~. ,/ THEORETICAL EXPERIMENTAL
• /- --- NCB6FBI • • / NCB6FB 2 • I I I
25 50 75 100 125
HALF OF REACTION AT CENTER SUPPORT - KIPS
Figure 37 Applied Load vs Center Reaction '.J '.J
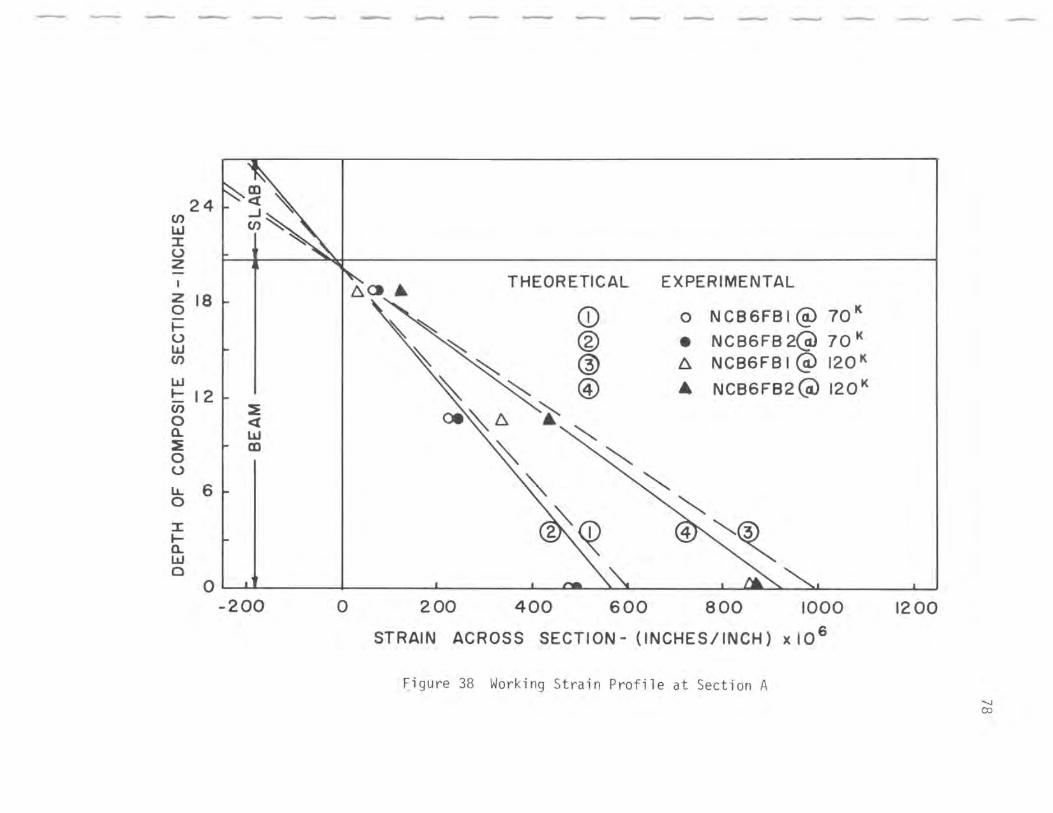
-
24 en w I U Z I
z 18 0 ~ u w en w ~ 12
~ l :IE ~ w m
0 u L1.. 6 0
I ~ a.. w 0
0 -200
- -- ----- ....-.....- ------ ~ --.... ............. -----
~<» A THEORETICAL EXPERIMENTAL
Q) 0 NCB6FBI@ 70 K
® • NCB6FB 2@ 70 K @ ~ NCB6FBI @ 120 K
GD • NCB6FB2GV 120K
o 200 400 600 800 1000
STRAIN ACROSS SECTION- (INCHES/INCH) x 10 6
~igure 38 Working Strain Profile at Section A
1200
-...J CD

24 en w I U z
I -:Z 18 0 ~ u w en
w 12 :IE ~ <t en w 0 CD Cl. ~ 0 U
LL 6 0
I ~ Cl. W 0
0 -200
- - ......... .....-....- ----... _______ _____ ...-...r ....--...
I '~ .. THEORETICAL EXPERIMENTAL
Q) o NCB6FB 1(0) lOOK
® • NCB6FB2(Q) lOOK ~ " ® 6- NCB6FB I (cO 150
K
~ ~ @ • NCB6FB2Gi>150 K
~ ... o • ~ &~
~ ~ ~ ~
'" "CD "'-
0 200 400 600 800 1000
STRAIN ACROSS SECTION- (I NCHES liNCH) x 106
Figure 39 Yield Strain Profile at Section A
1200 6-
-.....J 1..0

~ 24 ~ 2
2
18 I 0 ..... u w en w ..... en
12 ~ 0 11. :!: 0 u
sl lL. 0
~ I ..... 11. w 0
0
m <l .....J en
~ 0
~ <l W m
THEORETICAL EXPERIMENTAL
CD o NCB6FBI (Q) 70 K
® • NCB6FB2(ci) 70 K
® ~ N CB6FB I (ci) 120K @ & NCB6FB2(ci) 120K
-200 -100 a 100 200 300
STRAIN ACROSS SECTION - (INCHES/ INCH) x 10 6
Figure 40 Working Strain Profile at Section B
400
00 o

en 24 w I U 2
I
2 o ~ u w en w ~
en o Q. :E o U lL.. o I ~ Q. W a
18
12
6
In <{ .....J en
6. o •
~ <{ W In 06.
THEORETICAL EXPERIMENTAL
CD 0 NCB6FB I (Q) lOOK ® • NCB6FB2 (Q> lOOk @ 6. NCB6FB I (Q) 150K
@ • NCB6FB 2 (a) 150 K
o J e)" 0 "\" fA III
-200 -100 o 100 200 300 400
STRAIN ACROSS SECTION - (INCHES / INCH) x 106
~igure 41 Yield Strain Profile at Section B co I-'

/ m 1///
~ 24 r <X .....J U) /'1 I u
2
I THEORETICAL EXPERIMENTAL 2 18 0 CD 0 NCB6FBI(Q) 70K t-U ® • NCB6FB2 (Q) 70 K W U) ® 6. NCB6FBI «i) 120K W
12 t ® & NCB6FB2(Ci) 120K t-
~ U) <X 0 W el. :it m 0 u LL 6 0
I t-el. W 0
0 -400 -300 -200 -100 0 100 200
STRAIN ACROSS SECTION - (INCHES / INCH) x 10 6
Figure 42 Working Strain Profile at Section C
300
OJ N

en w I u Z -
I
Z 0 .... u w en w .... en 0 a. ~ 0 u l1.. 0
I .... a. w 0
......... ---- .--.. .......-... ............ --- ........... .......... ----... .......... ....--.... ............
24 ~ /
// CD <t -' en
THEORETICAL EXPERIMENTAL 10 18 CD o NCB6FBI (Q)IOO K
® • NCB6FB2(ci)100 K
@ 6 NCB6FBI(9) 150 K
12 @) A NCB6FB2(a) 150 K
~ <t W
/~ m
6 ~/
AD /
I ~. // / 0
-400 -300 -200 -100 0 100
STRAIN ACROSS SECTION - (lNCHES/ INCH) x 10 6
Figure 43 Yield Strain Profile at Section C
200 300
co w

Figure 44 Negative Flexural Cracking Pattern - NCB6FBI
,,:' ~~--"~J l-~-~_~~J I
f ( /\ :;: . . ~
0" ) "
Figure 45 Negative Flexural Cracking Pattern - NCB6FB2
84

Max. W=.20mm
N.-
PW
=70 K
Max. W = .40mm
Pw = lOOK
Max. W= .30mm
Py = 120k
NCB6FBI
Max.W =.58mm
--------. . . . --------
Py = 150K
NCB6FB2
Figure 46 Comparative Cracking Patterns
Max. W=.46mm
P =200K
Max.W= 1.0 mm
P =200k
ex> (J1

86
1
Figure 47 Longitudinal Cracking Pattern - NCB6FBI
Figure 48 Longitudinal Cracking Pattern - NCB6FB2

1
1
1
1 ]
1
1
1
J
J
J
J
J
J
j
j
j
j
87
.".-.
Figure 49 Positive Flexural Cracking Pattern - NCB6FBI
Figure 50 Positive Flexural Cracking Pattern - NCB6FB2

en Q.
~
I
~
200 I I / ,LI •
• 150 I , I ,<
•
z 100 I /, o Q.
o <l o ...J
a: W Q.
o <l o ...J
THEORETICAL EXPERIMENTAL
NCB6FBI .. 50 I -,<
NCB6FB2 •
o ~LC~ ________ ~ __________ ~ ________ ~ __________ -L __________ ~ __________ L-________ ~
o 1000 2000 3000 4000 5000 6000 7000
NEGATIVE MOMENT OVER CENTER SUPPORT - INCH- KIPS
Figure 51 Applied Load vs Negative Moment 00 00

200
en a.. 150 ~ , r-2 • 0 a.. 100 -. 0 <t 0 • • -1
a:: w 50 Q..
• • 0 •• <t 0 -1 •
0
o
• • • • • •
• • • P I
1 A i A . • f .. ..
r591~59'~
• NCB6FB I
• NCB6FB2
.01 .02 .03 .04 .05
AVERAGE SLIP AT SECTION "A"_ INCHES
Figu re 52 Load-Slip at a Typical Connector
•
P
~ )
l
.06
j
.07
-
<Xl \.0

~-•
06
r
r
r
[
r
[
[
[
[ [
[
[ [
l l
l
1

16
+5131 JaU\f
+:HquI
5Jo+JaUuoJ SS aJn5~~
I I (
I
I I I I {
I I t
I

S318'111
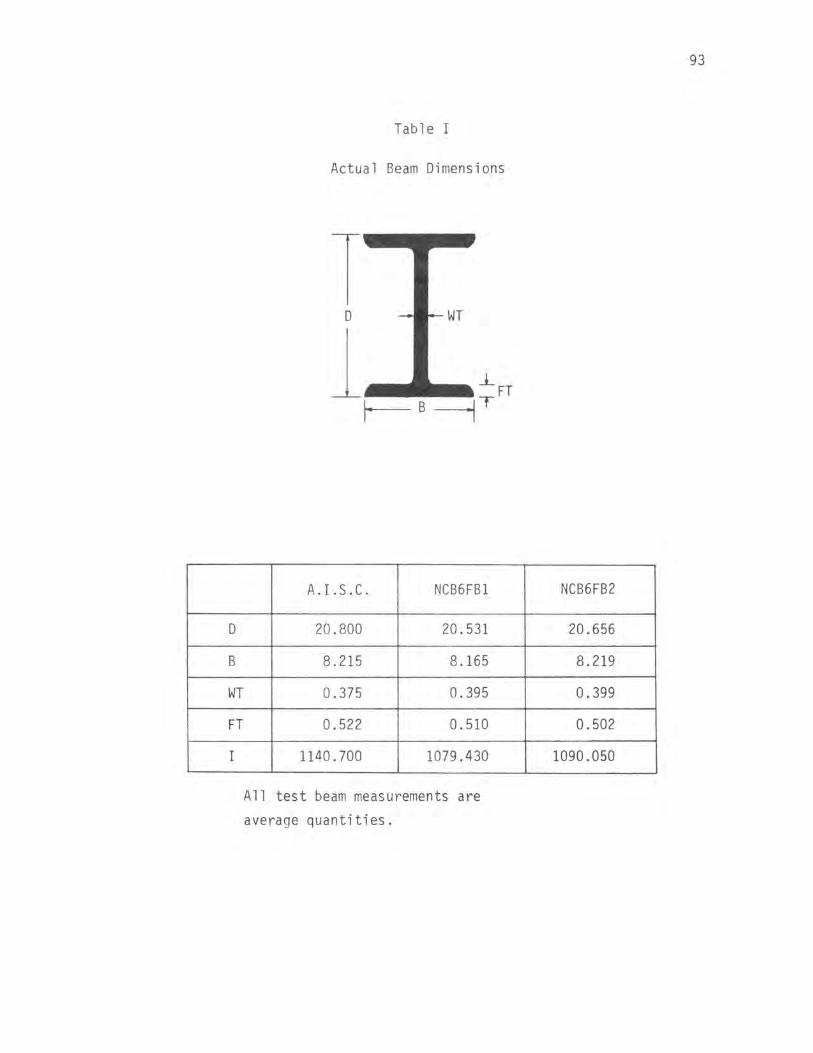
D
B
WT
FT
I
Table I
Actual Beam Dimensions
T D
11-. - ....
A.loS.C. NCB6FB1
20.800 20.531
8.215 8.165
0.375 0.395
0.522 0.510
1140.700 1079.430
All test beam measurements are
average quantities.
93
NCB6FB2
20.656 !
8.219
0.399
0.502
1090.050

--- .......... ~ ____ '-- .......... ---.... ........... """--"' ........... I"..-.,.J---.J_
Table II
Results of Non-Companion Pushouts
Load Range Ini ti a 1 Stati c Fatigue Final Static f' Loadinq Loading Loading
Specimen c Min. Max. * Yield Resid. # of Resid. Yield Ult,m. psi Load Load S Load Slip Cycles Slip Load Load
K/Bolt K/Bolt ksi K/Bolt Inches x106 Inches K/Bolt K/Bolt
N6F4TB1 4121 .885 5.30 10.0 -- .0001 5.00 .0014 8.75 32.50
N6F4TB2 4436 .885 14.14 30.0 -- .0016 0.45 -- 14.50 31. 75
.885 14.14 30.0 - .. .0036 10.00 .0233 -- --
N6F4TB3 4253 .885 18.58 40.0 -- -- 0.70 .0088 -- --.885 25.00 54.6 -- -- 0.12 -- -- --
N6F4TB4 6690 4.425 17.68 30.0 17.5 .0032 10.00 .0189 18.00 32.62
N6F4TB5 7061 .885 18.58 40.0 15.8 .0045 2.40 .0226 17 .50 34.00
N6F4TB6 6955 .885 22.98 50.0 23.0 .0098 0.20 .0077 -- --
N6F4TB7 8217 .885 22.98 50.0 21.1 .0139 2.00 .0155 20.50 35.62
N6F4TB8 8380 .885 15.30 32.6 -- .0005 2.00 .0008 19.25 34.25
N6F4TB9 8310 .885 15.30 32.6 -- .0006 2.00 .0008 18.75 33.68
* Range of stress per bolt
Fa il ure
Type
Concrete
Concrete
None
None
Bolts
Concrete
Concrete
Rammed
Concrete
Concrete
Concrete
~ +:>

Table III
Results of Static Pushout Tests
Yield Load Ultimate Load Specimen f' c Average Slip Load/Bolt Average Slip Load/Bolt Res i d. S 1 i P
N6F4TB1 4121 --- --- . 1213b 32.50 .0859
N6F4TB2 4436 --- --- .1635b 31.80 ---
N6F4TB3 4253 .0033 16.5a --- --- ---
N6F4TB4 6690 .0034 18.0a . 1338c 32.60 .0992
N6F4TB5 7061 .0039 17.5a . 1359d 34.00 .0998
N6F4TB6 6955 .0098 23.0 --- --- ---
N6F4TB7 8217 .0093 21.1 .0610e 35.60 .0569
N6F4TB8 8380 .0040 20.5a .0838f 34.20 ---
N6F4TB9 8310 .0032 19.5a .1782g 33.70 .1396
N6F4TB1a 7026 .0053 20.6a .1805e 50.00 ---
N6F4TB1b 7522 .0061 28.4 .0405e 52.25 ---
aDetermined after fatigue loading b30 .0 k/bolt
c31.5 k/bolt
d32 . 5 k/bolt
e35 .0 k/bolt
f 34 . 25 k/bolt
g33.75 k/bolt
Failure
,
Concrete
Concrete
Bolts
Concrete
Concrete
Rammed
Concrete :
Concrete ,
Concrete:
Bolts i ,
i
Bolts i
I
\.0 U1

Table IV
Results of Companion Compression Pushouts
Load Range Initial Static Fatigue f' Loadinq Loadinq Specimen c Min. Max. * Yield Resid. # of Resid.
psi Load Load S Load Slip Cyc 1 ~s Slip ksi K/Bolt K/Bolt K/Bo 1 t Inches xl0 Inches
N6F4TBla 7026 .885 15.30 32.6 -- .0006 2.0 .0012
N6F4TBlb 7522 -- -- -- -- -- -- --
* range of stress per bolt
Table V
Results of Companion Tension Pushouts
f' Yield Yield Ultim(\te Maximum Specimen c Load Slip Load Slip psi K/Bolt Inches K/Bolt Inches
N6T4TBla 6700 22.60 .00177 30.90 .0342
N6T4TBlb 7168 22.25 .00101 31.50 I
.0263
* measurable ( at approximately 80% of ultimate)
Final Static Loading
Yield Ultimo Load Load
K/Bolt K/Bolt
20.60 50.00
28.40 52.25 - - -----
* Fa il ure Type
Concrete
Concrete
Fail ure
Type
Bolts
Bolts
,
~ 0'1

97
Table VI
Results of Cylinder Tests
Specimen Compressive Modulus of Strength Elasticity
psi psix106
N6F4TB1 4121 ± 68* 3.80 ± .02*
N6F4TB2 4436 ± 67 3.96 ± .00
N6F4TB3 4253 ± 102 4.03 ± .02
N6F4TB4 6690 ± 38 4.31 ± .08
N6F4TB5 7061 ± 44 4.39 ± .00
N6F4TB6 6955 ± 176 4.15 ± .02
N6F4TB7 8217 ± 68 4.52 ± .05
N6F4TB8 8380 ± 156 4.50 ± .01
N6F4TB9 8310 ± 160 4.35 ± .08
NCB6FB1 7338 ± 157 4.37 ± .08
N6F4TB1a 7026 ± 82 3.98 ± .10
N6F4TB1b 7522 ± 91 4.51 ± .03
NCB6FB2 7654 ± 58 5.42 ± .23
N6T4TB1a 6700 ± 190 5.17 ± .07
N6T4TB1b 7168 ± 36 5.21 ± .02
* standard deviation
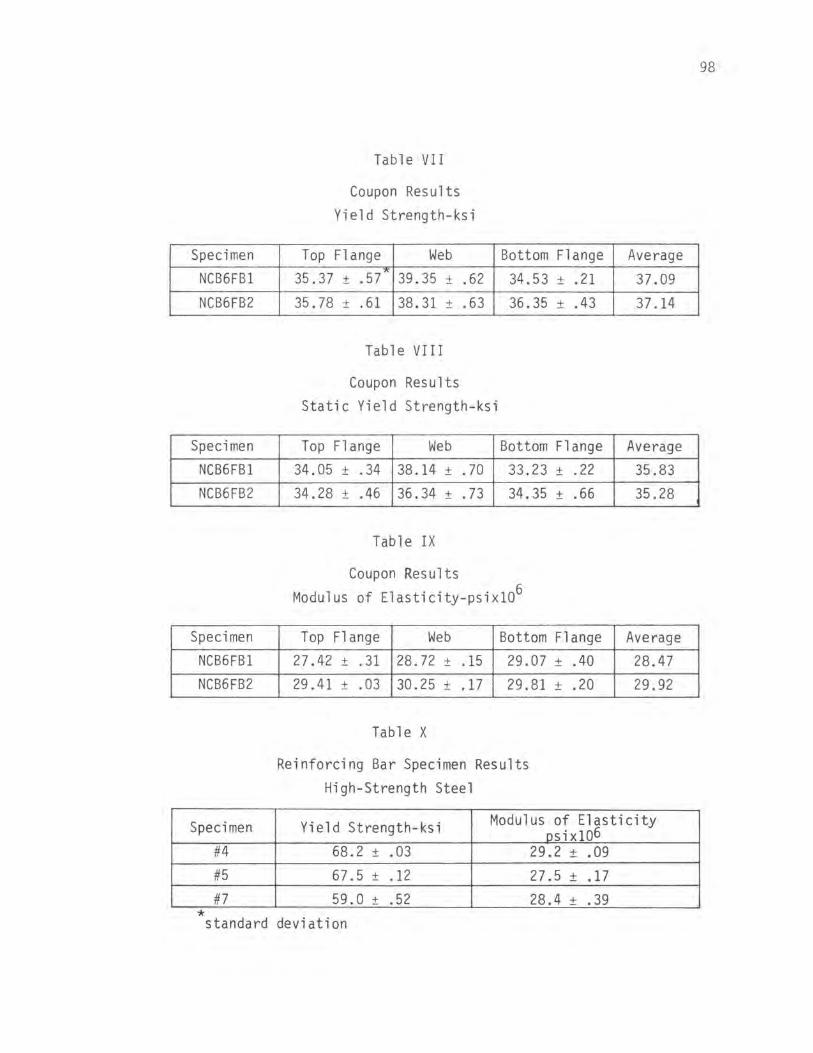
Specimen NCB6FBI
NCB6FB2
Specimen NCB6FBI
NCB6FB2
Specimen
NCB6FBI NCB6FB2
Table VII
Coupon Results Yield Strength-ksi
Top Flange Web 35.37 ± .57>< 39.35 ± .62
35.78 ± .61 38.31 ± .63
Table VIII
Coupon Results Static Yield Strength-ksi
Top Flange Web
34.05 ± .34 38.14 ± .70 34.28 ± .46 36.34 ± .73
Table IX
Coupon Results
Bottom Flange
34.53 ± .21
36.35 ± .43
Bottom Flange 33.23 ± .22
34.35 ± .66
Modulus of Elasticity-psixl06
Top Flange Web Bottom Flange 27.42 ± . 31 28.72 ± .15 29.07 ± .40 29.41 ± .03 30.25 ± .17 29.81 ± .20
Table X
Reinforcing Bar Specimen Results High-Strength Steel
Average
37.09
37.14
Average 35.83 35.28
Average
28.47 29.92
Specimen Yield Strength-ksi Modulus of Elasticity Dsixl06
#4 68.2 ± .03 29.2 + .09 #5 67.5 + .12 27.5 + .17 #7 L--------- ------ - -- ------ 59.0 ± .52 28.4 ± .39
* standard deviation
98

Working Load
Yielding Load
Ultimate Load
Working Load
Yielding Load
Ultimate Load
*
*
*
Table XI
Analyses Results
Test Beams
NCB6FB1
Theoretical
75.8
137.9
161. 7
NCB6FB2
Theoretical
78.6
151.4
209.2
Experimental
70.0
119.2
Experimental
100.4
153.3
Load at which plastic hinge over center support forms
99

BIBLIOGRAPHY
1. Wang, C. K., and Salmon, C. G., Reinforced Concrete Design, International Textbook Company, Scranton, Pennsylvania. 1965.
2. Interim Specifications for Highway Bridges. AASHO Committee on Bridges and Structures. 1966-67.
3. Standard Specifications for Highway Bridges. adopted by the American Association of State Highway Officials. 1965.
4. Dallam. L. N., II Pushout Tests with High-Strength Bolt Shear Connectors ", Missouri Cooperative Highway Research Program Report 68-7. Engineering Experiment Station. University of Missouri - Columbia, 1968.
5. Dallam, L. N., and Harpster, J. L., " Composite Beam Tests with High-Strength Bolt Shear Connectors ", Missouri Cooperative Highway Research Program Report 68-3. Engineering Experiment Station, University of Missouri - Columbia, 1968.
6. Dallam, L. N., and Gaudini, P. B., " Static Behavior of Continuous-Composite-Bolted Beams ". Missouri Cooperative Highway Research Program Report 69-3, Engineering Experiment Station. University of Missouri - Columbia, 1969.
7. Slutter, R. G., and Fisher, J. W., "Fatigue Strength of Shear Connectors ", Steel Research for Construction, American Iron and Steel Institute Bulletin #5, October, 1967.
8. Manual of Steel Construction, American Institute of Steel Construction. Inc., 1967.
9. " Specifications for Structural Joints Using ASTM A325 or A490 Bolts ", American Institute of Steel Construction. Research Council on Riveted and Bolted Structural Joints of the Engineering Foundation, New York, 1964.
10. The AASHO Road Test Report 2, Materials and Construction, HRB Special Report 61B. Appendix E.
11. Proctor, Melvin H., " Analytical and Experimental Study of Lightweight Concrete-Steel Composite Beams ", M. S. Thesis, Department of Civil Engineering, University of Missouri -Columbia, 1963.
100

12. Viest, I. M., Fountain, R. S., and Singleton, R. C., Composite Construction ~ Steel and Concrete for Bridges and Buildings, McGraw-Hill Book Company, Inc., New York, 1958.
13. Winter, George, Design of Concrete Structures, McGraw-Hill Book Company, Inc., New York, 1964.
14. Teraszkiewicz, J. S., Static and Fatigue Behaviour of Simply Supported and Continuous Composite Beams of Steel and Concrete, Engineering Structures Laboratories, Civil Engineering Department, Imperial College, London, September, 1967.
15. Michales, J., and Wilson, E. N., Structural Mechanics and Analysis, The Macmillan Company, New York, 1965.
101


![Pullback and Pushout Constructions in C*- Algebra Theorymueger/ped2.pdf · K-theory of a pullback (the Mayer Vietoris sequence), occurs in book III of Schochet’s magnum opus [45]](https://img.pdfslide.net/doc/110x75/5e81db24dbcf5e029846f939/pullback-and-pushout-constructions-in-c-algebra-muegerped2pdf-k-theory-of.jpg)