Embed Size (px)
Citation preview
REPORT
River Processes Pathway Component Baseline Assessment WesPac Tilbury Marine Jetty Project
Submitted to:
WesPac Midstream-Vancouver LLC
Submitted by:
Golder Suite 200 - 2920 Virtual Way Vancouver, BC, V5M 0C4 Canada
+1 604 296 4200
1314220049-123-R-Rev0
14 August 2018

14 August 2018 1314220049-123-R-Rev0
i
Distribution List electronic copy: WesPac Midstream-Vancouver LLC
14 August 2018 1314220049-123-R-Rev0
ii
Executive Summary
As part of the Environmental Assessment for the WesPac Tilbury Marine Jetty Project (the Project) on Tilbury Island, Golder Associates Ltd. was retained to develop a baseline characterization of River Processes. Tilbury Island is located in the Gravesend Reach of the South Arm of the lower Fraser River. The River Processes baseline assessment extends from Sand Heads at the mouth of the Fraser to Annacis Island. The baseline study includes a review of data and literature of relevant river processes including tides, winds, water levels and sea level rise, currents, salinity and fresh water mixing, sedimentation and transport.
The annual hydrograph of the Fraser River is dominated by a snow-melt driven freshet, with peak annual discharges occurring in late May to early June. Discharges during the freshet typically peak at around 8500 m3/s, although this varies significantly from year to year. Water levels at the Project site are governed by the discharge and tidal influence that propagate upstream from the Strait of Georgia. Sea level rise (SLR) over the course of the Project Life is expected to result in higher water levels at the site. 0.3 m of SLR is estimated to occur over the 30-year operation phase of the project. Currents and circulation at the site are dominated by river discharge and tidal fluctuations. Maximum surface velocities occur in the navigation channel and flow reversal is observed at the site during flood tides. Hydrodynamics at the Project site are also influenced by the formation of a salt wedge that propagates upstream from the Strait of Georgia during flood tides. During the high flows of freshet, the salt wedge does not typically reach the project site. During low winter flows, the salt wedge migrates as far upstream as Annacis Island.
Gravesend Reach is in the sand-bedded portion of the Fraser River. The surficial sediment coverage is predominantly silty-sand, however this is likely to transition to sand with the onset of freshet conditions between May and June. Freshet also corresponds to peak sediment discharges in the Fraser. The average annual sediment load in the Fraser is approximately 17 Mt/year, although this varies significantly from year to year. This consists of roughly 50% silt, 35% sand and 15% clay with most of the material, apart from the coarser sands, being transported in the suspended load. Morphological changes in the vicinity of the Project site occur on both short and long time scales. Short term morphological changes can occur in the form of bedforms that are manifestations of sediment transport. Some longer term trends in channel morphology occurred last century as a result of large extraction volumes from dredging. A comparison of bathymetry data between 1997 and 2017 showed that bathymetric changes up to 5 m are evident between various years in the dataset.
The lower Fraser River has been dredged over the last century for both navigation and construction materials. Annual dredge volumes in Gravesend Reach were in the order of 600,000 m3 per year between the late 1970’s to the early 1990’s when borrow dredging (for construction materials) peaked on the Fraser River. Current annual dredge volumes in Gravesend Reach are in the order of 25,000 m3/year. Historical over-dredging on the Fraser led to morphological and bed changes that occurred over years to decades.
Human activity including the construction of flooding and other infrastructure, diversion of portions of the watershed, armouring of river banks and the construction of jetties and ocean outfalls, has impacted the geomorphic regime of the Fraser. These activities have tended to lead towards a reduction of sediment supply, channelization, and alteration of the natural sediment transport regime of Fraser River.
Vessel induced waves and water movements are expected to occur in the vicinity of the site. Wake waves produced by existing vessel are estimated to be up to 0.26m, 50 m from the sailing line. No data was available on propeller wash effects at the site.
14 August 2018 1314220049-123-R-Rev0
iii
Study Limitations
Golder Associates Ltd. (Golder) has prepared this document in a manner consistent with that level of care and skill ordinarily exercised by members of the engineering and science professions currently practising under similar conditions in the jurisdiction in which the services are provided, subject to the time limits and physical constraints applicable to this document. No warranty, express or implied, is made.
This document, including all text, data, tables, plans, figures, drawings and other documents contained herein, has been prepared by Golder for the sole benefit of WesPac Midstream–Vancouver LLC. It represents Golder’s professional judgement based on the knowledge and information available at the time of completion. Golder is not responsible for any unauthorized use or modification of this document. All third parties relying on this document do so at their own risk.
The factual data, interpretations, suggestions, recommendations and opinions expressed in this document pertain to the specific project, site conditions, design objective, development and purpose described to Golder by WesPac Midstream–Vancouver LLC, and are not applicable to any other project or site location. In order to properly understand the factual data, interpretations, suggestions, recommendations and opinions expressed in this document, reference must be made to the entire document.
This document, including all text, data, tables, plans, figures, drawings and other documents contained herein, as well as all electronic media prepared by Golder are considered its professional work product and shall remain the copyright property of Golder. WesPac Midstream–Vancouver LLC may make copies of the document in such quantities as are reasonably necessary for those parties conducting business specifically related to the subject of this document or in support of or in response to regulatory inquiries and proceedings. Electronic media is susceptible to unauthorized modification, deterioration and incompatibility and therefore no party can rely solely on the electronic media versions of this document.

14 August 2018 1314220049-123-R-Rev0
iv
Table of Contents
1.0 INTRODUCTION ............................................................................................................................................. 1
1.1 Project Description ............................................................................................................................... 1
1.2 Scope and Objectives .......................................................................................................................... 2
2.0 METHODOLOGY ............................................................................................................................................ 5
2.1 Site Reconnaissance ........................................................................................................................... 6
3.0 GEOGRAPHICAL AND HISTORICAL CONTEXT ......................................................................................... 7
3.1 Geographic Context ............................................................................................................................. 7
3.2 Coordinate System and Datums .......................................................................................................... 9
3.3 Formation of the Fraser ........................................................................................................................ 9
3.4 Recent History of the South Arm ....................................................................................................... 10
4.0 BASELINE HYDROLOGIC CONDITIONS ................................................................................................... 11
4.1 Hydrometric Stations .......................................................................................................................... 11
4.2 River Discharge .................................................................................................................................. 12
4.3 Water Levels ...................................................................................................................................... 14
4.3.1 Present Day Water Levels ............................................................................................................ 14
4.3.2 Sea Level Rise .............................................................................................................................. 16
4.4 River Currents and Circulation ........................................................................................................... 17
4.5 Wind and Wind-Generated Waves .................................................................................................... 21
4.6 Salinity ................................................................................................................................................ 22
5.0 BASELINE SEDIMENT PROCESSES ......................................................................................................... 24
5.1 Bed Material Composition .................................................................................................................. 24
5.2 Sediment Transport ............................................................................................................................ 26
5.3 Turbidity .............................................................................................................................................. 28
6.0 BASELINE MORPHOLOGY ......................................................................................................................... 32
6.1 Bathymetry in Gravesend Reach ....................................................................................................... 32
6.2 Dredging on the Lower Fraser River .................................................................................................. 34
6.3 Geomorphology in Gravesend Reach in the 20th Century ................................................................. 37

14 August 2018 1314220049-123-R-Rev0
v
6.4 Geomorphology in Gravesend Reach in the 21st Century ................................................................. 39
7.0 OTHER ANTHROPOGENIC IMPACTS IN GRAVESEND REACH ............................................................. 41
7.1 Changes in Fluvial Morphology and Anthropogenic Land Use .......................................................... 41
7.2 Summary of Anthropogenic Impacts on Geomorphic Regime ........................................................... 49
7.3 Vessel Induced Waves and Water Movements ................................................................................. 50
8.0 SUMMARY .................................................................................................................................................... 52
8.1 Baseline Hydrologic Conditions ......................................................................................................... 52
8.2 Baseline Sediment Processes ........................................................................................................... 52
8.3 Baseline Morphology .......................................................................................................................... 53
8.4 Other Anthropogenic Impacts in Gravesend Reach .......................................................................... 53
9.0 CLOSURE ..................................................................................................................................................... 54
10.0 REFERENCES .............................................................................................................................................. 55
TABLES
Table 1: Definition of LAA and RAA for River Processes ......................................................................................... 2
Table 2: Conversion Factors between Chart Datum (CD) and Geodetic (GSC) in the RAA ................................... 9
Table 3: Summary of Water level and Discharge Stations in the lower Fraser River ............................................ 11
Table 4: Summary of discharge statistics and recurrence intervals for discharges measured at Hope (#08MHF005) (1912-2015) and at Mission (#08MH024) (1965-2014) ................................................... 13
Table 5: Summary of Tidal Water Elevations for Deas Island (Source: DFO, 2016) ............................................. 15
Table 6: Statistics on Water Levels predicted at KM 22 in 2010, 2012 and 2014 (DFO, 2018) ............................. 15
Table 7: Sea Level Rise Allowances Recommended for the Project phases; Based on SLR rates in provincial guidance .................................................................................................................................. 17
Table 8: Statistics on depth-averaged velocities in the navigational channel predicted at KM 22 in 2010, 2012, and 2014 (Avadepth, 2018) ........................................................................................................... 20
Table 9: Average Grain Size distribution at Mission (Source: McLean et al. 1999) ............................................... 27
Table 10: Summary of aerial photography interpretations at the Project site and historical hydraulic and sedimentation events in the Fraser River ................................................................................................ 42
Table 11: Existing Wake Heights Estimated in Gravesend Reach (source: Ausenco, 2015) ................................ 51
14 August 2018 1314220049-123-R-Rev0
vi
FIGURES
Figure 1: Location Plan showing LAA and RAA for River Processes PC ................................................................ 4
Figure 2: Site plan showing Key Features in Gravesend Reach .............................................................................. 8
Figure 3: Annual Hydrograph for the Fraser River at Hope, BC in 2010, 2012 and 2014 (Environment Canada, 2018) ......................................................................................................................................... 13
Figure 4: Recommended global SLR curve for planning and design in BC (BCMOE 2017) ................................. 17
Figure 5: Predicted water levels and depth-averaged velocities at KM 22; July 1-3, 2011, Average daily discharge at Hope = 9100 m3/s; Data from Avadepth (DFO, 2018) ....................................................... 18
Figure 6: Predicted water levels and depth-averaged velocities at KM 22, Jan 1-3, 2011, Average daily discharge at Hope = 789 m3/s; Data from Avadepth (DFO, 2018) ......................................................... 18
Figure 7: Scatter plot of daily discharge at Hope versus hourly predicted channel velocity at KM 22 for 2014 data (Data source: DFO 2018) ................................................................................................................ 19
Figure 8: Surface velocity Map during 3.2 m ebb tide 2014-04-27, simulated under baseline conditions (source: Tetra Tech EBA, 2018) ............................................................................................................. 21
Figure 9: South Arm meso-tidal segment of the Lower Fraser River (taken from FREMP, 2006) ......................... 22
Figure 10: Measured bed material composition for the Fraser River from Hope to Sand Heads during various flows. The dashed red lines denote (from left to right) the typical divisions between sand-mud, sand, and gravel (Venditti and Church, 2014). .............................................................................. 25
Figure 11: Bed material composition in the Lower Fraser River, including the project reach, based on sediment In samples taken between Feb. 9 and April 7, 1993 (adapted from McLaren, 1995). ............ 25
Figure 12: Median bed sediment size in the vicinity of the Project Area, Taken from: TetraTech EBA, 2018 and based on data from McLaren and Ren (1995) ................................................................................. 26
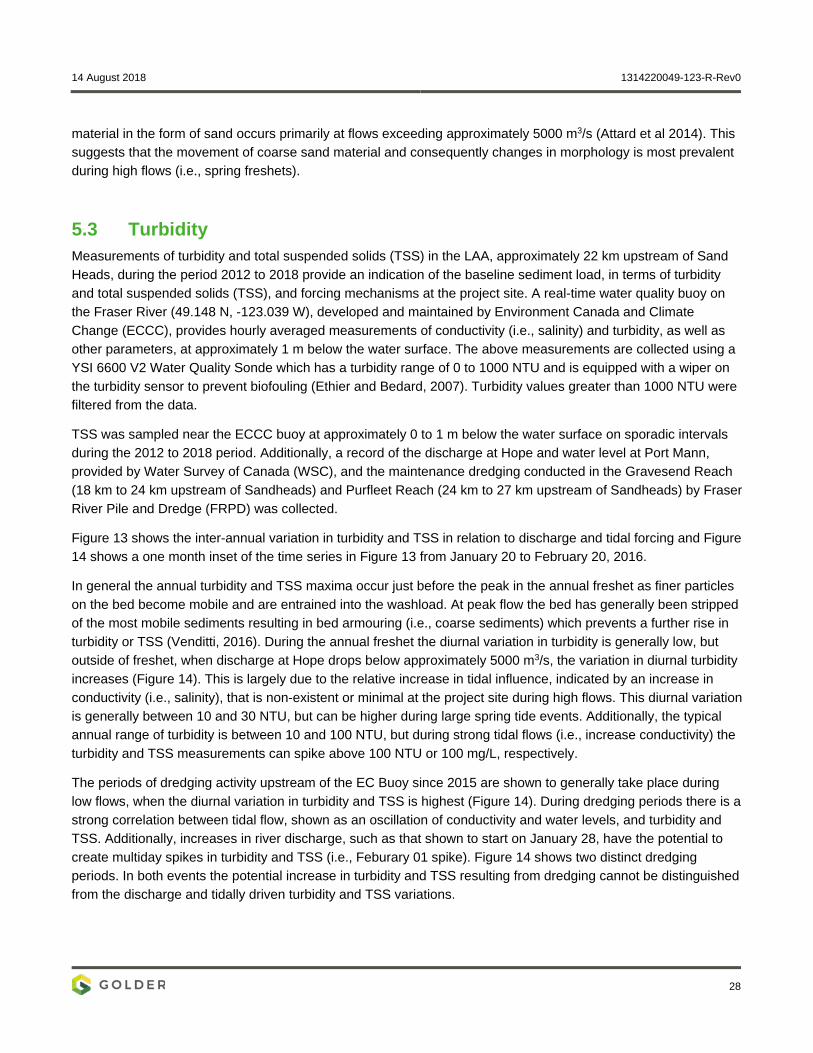
Figure 13: Turbidity and conductivity measured onboard the EC buoy, TSS measured as grab samples near the EC buoy, and river discharge measured at Hope is shown for the period 2012 to 2018. Periods of dredging in the Gravesend Reach and Purfleet Reach are shown for the period 2015 to 2018......................................................................................................................................................... 29
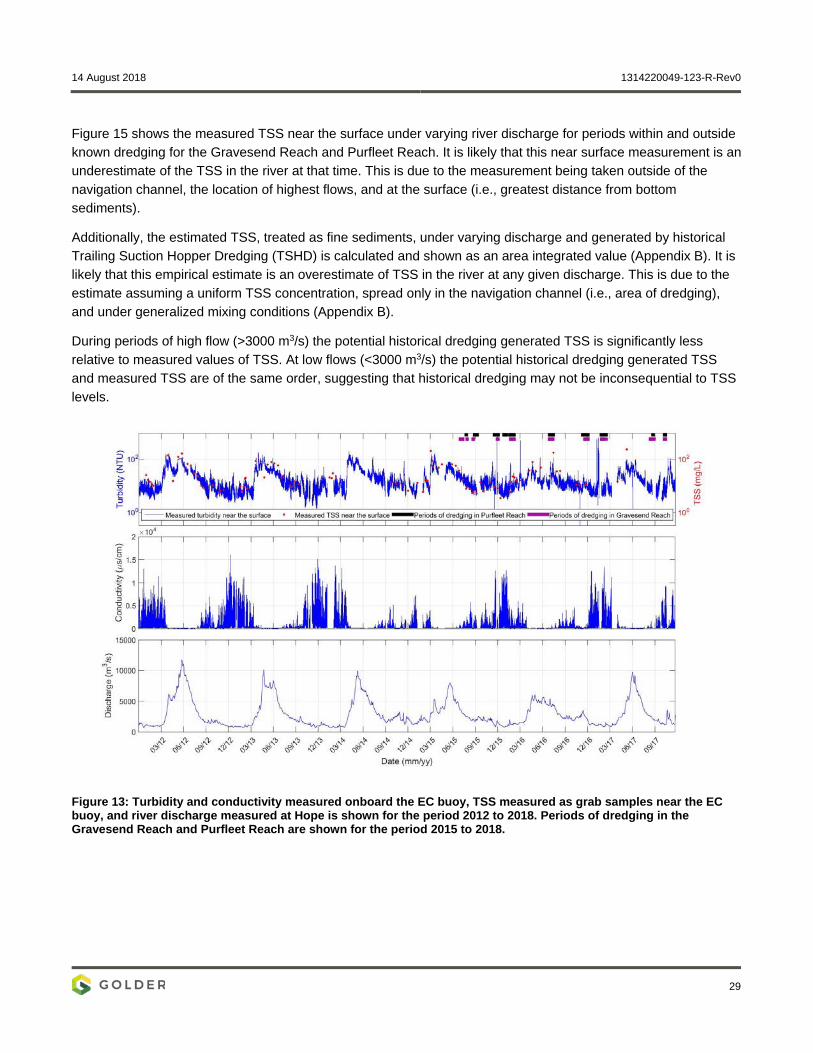
Figure 14: Turbidity and conductivity measured onboard the EC buoy, TSS measured as grab samples near the EC buoy, and river water level and discharge measured at Port Mann and Hope, respectively, is shown for the period January 20 to February 20, 2016. Periods of dredging in the Gravesend Reach and Purfleet Reach are shown for the period January 20 to February 20, 2016. ..... 30
Figure 15: TSS measured near the surface under varying river discharge for the period 2012 to 2018 within and outside periods of known dredging (2015 to 2018). Estimated TSS for historic dredging using an area integrated source term ............................................................................................................... 31
Figure 16: Bathymetry along the main thalweg through the project reach indicating an alternating pool and riffle sequence. The red line denotes the project location. ...................................................................... 33
Figure 17: Annual maintenance and borrow dredging volumes on the South Arm of Fraser River (McLean et al., 2006). ................................................................................................................................................ 34
Figure 18: Annual Dredging in the Fraser River, 1960 – 2012 (Source: NHC 2016) ............................................. 35
Figure 19: Pit propagation schematic (Source: Kondolf 1994) ............................................................................... 36
Figure 20: Cross-section at 21.75 KM showing bed variation between 1956 and 1993 (Source: Hay & Company, 1995) ...................................................................................................................................... 38
14 August 2018 1314220049-123-R-Rev0
vii
Figure 21: Cross-section at 24.5 KM showing bed variation between 1956 and 1993 (Source: Hay & Company, 1995) ...................................................................................................................................... 38
Figure 22: Change in bed elevations in the Gravesend Reach surrounding the project site between 2001 and 2017 (Data source: PSPC, 2018) ..................................................................................................... 39
Figure 24: Change in bed elevations in the Gravesend Reach surrounding the project site between 2012 and 2017 (Data source: PWPC, 2018) .................................................................................................... 40
Figure 25: Channel Bank Comparison of the Fraser River in the Vicinity of the Proposed Project: 1954, 1963, 1974, 1991, 2002 and 2018. ......................................................................................................... 48
Figure 26: Annual Sediment Budget. Note: Historic borrow dredging volumes have been included due to the time lag in sediment transport processes whereby an historic reduction in sediment would translate into observable erosion in the present day at Gravesend Reach ............................................ 50
APPENDICES
APPENDIX A TetraTech Report
APPENDIX B Dredging Source Term Calculation

14 August 2018 1314220049-123-R-Rev0
1
1.0 INTRODUCTION Golder Associates Ltd. (Golder) was engaged by WesPac Midstream–Vancouver LLC (WesPac) to undertake an Environmental Assessment (EA) of the Tilbury Island foreshore (Gravesend Reach) in support of WesPac Tilbury Marine Jetty Project (the Project) on Tilbury Island. Part of the scope of the EA is to develop a baseline characterization of River Processes for the Project site including its Offshore Facilities. The proposed project area includes a portion of the uplands (Onshore Facilities) on Tilbury Island and a section of the Fraser River channel (Offshore Facilities), approximately 21 km upstream of Sand Heads, where project works will take place.
River Processes are defined as a Pathway Component (PC) in the environmental effects assessment for the Project. The Local Assessment Area for the River Processes baseline assessment extends from Sand Heads to approximately Annacis Island (KM 0 to KM 27). The River Processes baseline characterizes existing processes including river hydraulics and currents, sediment processes, geomorphology and existing anthropogenic influences on these processes.
1.1 Project Description “WesPac Midstream-Vancouver LLC is proposing to construct the WesPac Tilbury Marine Jetty Project (Tilbury Marine Jetty) at Tilbury Island on the Fraser River in Delta, BC. Tilbury Marine Jetty includes the berthing and transferring of liquefied natural gas (LNG) to marine barges and carriers for delivery to local fuel markets and offshore export markets. Tilbury Marine Jetty will require the removal of existing abandoned marine infrastructure, the construction of a new marine jetty (access trestle, loading platform and mooring dolphins), the construction of LNG infrastructure to receive processed LNG for transfer to marine vessels and safety and process control systems. The supply of LNG for Tilbury Marine Jetty will come via a pipeline from the existing adjacent FortisBC Tilbury LNG Plant.” (BCEAO, 2018)
The Project is located at Tilbury Island in Delta, British Columbia, approximately 21 km from the mouth of the Fraser River (Sand Heads). The terminal will be located adjacent to the Fortis BC LNG peak shaving facility and approximately 300 m downstream of the SeaSpan Intermodal terminal. The new marine jetty will serve LNG bunker vessels (up to 7,500 m3) and LNG carriers (up to 90,000 m3) (Ausenco, 2018). The Project will be capable of supplying approximately 34 LNG barges and 90 LNG carriers per year (WesPac Midstream – Vancouver LLC, 2016). The Project will also include dredging of approximately 385,000 m3 of sediment for the turning and berthing basins. For the purposes of the EA, and as defined in the dAIR (WesPac Midstream – Vancouver LLC, 2016), the Project is divided into three phases:
Construction – 2018 to 2022 (36 months)
Operation – 2020 to 2050 (30 years minimum)
Decommissioning – 2051 or later (1 year)
14 August 2018 1314220049-123-R-Rev0
2
Activities and in-river structures included in the three project phases above may affect or be affected by river processes. These activities are used to guide and provide context for the baseline conditions presented in this baseline assessment. They include:
In-river ground stabilization and piling works
Construction of associated Offshore Facilities
Berthing/departure of vessels
Initial dredging of the berthing basin and maintenance dredging during the operation phase
1.2 Scope and Objectives The purpose of the River Processes baseline assessment is to summarize the current state of the inter-related river processes which may affect or may be affected by the Project. The baseline conditions summarized in this report will form the basis for evaluating the Project impacts on present river processes in the impact assessment portion of the EA. The objective of the baseline assessment is to quantify the existing typical conditions and variation of these inter-related processes. The baseline conditions assessment for the river processes pathway component includes the following:
Characterization of river hydraulics at Tilbury Reach, including tidal influence, salt wedge influence and discharge
Characterization of sediment including volume, grain size and transport as it relates to changes in hydraulics
Characterization of river geomorphology, identifying how hydraulics and sediments have formed this portion of the river
A description of the man-made influences, including effects of dredging and how dredge cuts are affected by the river over time
Description of the vessel hydrodynamic regime
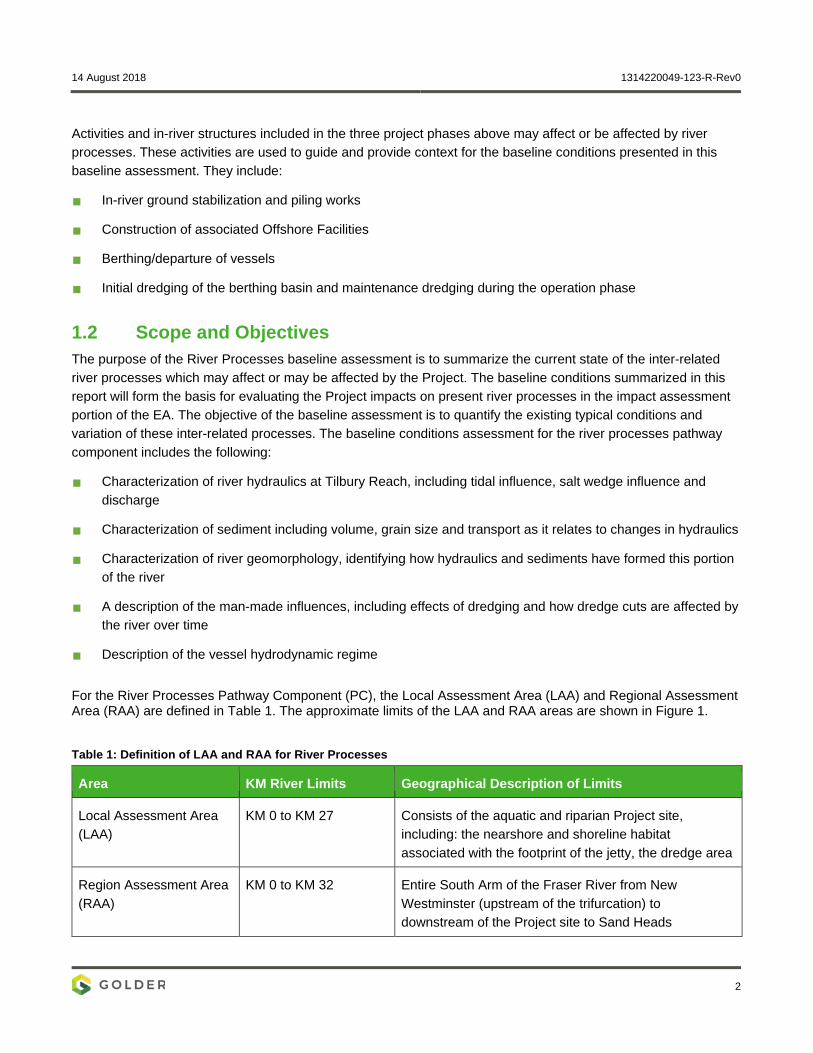
For the River Processes Pathway Component (PC), the Local Assessment Area (LAA) and Regional Assessment Area (RAA) are defined in Table 1. The approximate limits of the LAA and RAA areas are shown in Figure 1.
Table 1: Definition of LAA and RAA for River Processes
Area KM River Limits Geographical Description of Limits
Local Assessment Area (LAA)
KM 0 to KM 27 Consists of the aquatic and riparian Project site, including: the nearshore and shoreline habitat associated with the footprint of the jetty, the dredge area
Region Assessment Area (RAA)
KM 0 to KM 32 Entire South Arm of the Fraser River from New Westminster (upstream of the trifurcation) to downstream of the Project site to Sand Heads
14 August 2018 1314220049-123-R-Rev0
3
Within the LAA, this baseline assessment focuses primarily on existing conditions in Gravesend Reach. Quantifiable morphological and hydrodynamic changes associated with the Project are expected to be limited to Gravesend Reach.

!o
FRASER RIVER (SOUT H ARM)
MUSQUEAM IR 4
STRAIT OFGEORGIA
SAND HEADSLIGHTHOUSE
DELTA
RICHMOND
VANCOUVER
DEAS ISLANDREGIONAL
PARK
LADNERHARBOUR
PARK
WELLINGTONPOINT PARK
LULUISLAND
TILBURYISLAND
WESTHAMISLAND
SHADYISLAND
KIRKLANDISLAND
BARBERISLAND
GUNNISLAND
DEASISLAND
ANNACISISLAND
TSAWWASSENFIRST NATION
BOUNDARYBAY
MUSQUEAM IR 2
BURNS BOGECOLOGICAL
CONSERVATIONAREA
NEWWESTMINSTER
BURNABY
CLIENT
LEGENDPROJECT BOUNDARYRIVER PROCESSES (PC) LAARIVER PROCESSES (PC) RAAMUNICIPAL BOUNDARYINDIAN RESERVETSAWWASSEN FIRST NATION LANDSRESIDENTIAL AREAPARK / FOREST AREABURNS BOG ECOLOGICAL CONSERVATION AREAWETLANDWATERWATERCOURSEROADRAILWAY
!o SAND HEADS LIGHTHOUSE
REFERENCE
PROJECTTILBURY MARINE JETTYTITLE
13-1422-0049
Path:
Y:\bu
rnaby
\CAD
-GIS
\Clie
nt\W
esPa
c_Mi
dstre
am_L
LC\Ti
lbury\
99_P
ROJE
CTS\
1314
2200
49_M
arine
Jetty
\02_P
RODU
CTIO
N\17
000\M
XD\R
eport
\Rive
r_Proc
esse
s\TILB
URY_
01_R
iver_P
roces
ses_
LAA_
RAA.m
xd
FRASER RIVER(SOUTH ARM)
INSET MAP
IF TH
IS M
EASU
REME
NT D
OES
NOT M
ATCH
WHA
T IS
SHOW
N, TH
E SH
EET H
AS B
EEN
MODI
FIED
FROM
: ANS
I B
CONSULTANT
PROJECT NO. CONTROL Rev. FIGURE
YYYY-MM-DDPREPAREDDESIGNREVIEWAPPROVED
25mm
0
METRESSCALE
100 0 100
1:18,000METRES
SCALE:
1:100,000
3,000 0 3,000
POPOMTJP
2018-08-09
1017000
RIVER PROCESSES (PC) LAA AND RAA
1. INDIAN RESERVES, TSAWWASSEN FIRST NATION LANDS AND MUNICIPALBOUNDARIES OBTAINED BY B.C. MINISTRY OF FORESTS, LANDS AND NATURALRESOURCE OPERATIONS.2. RAILWAY, WATER, FOREST, PARKS, WATERCOURSE, WATERBODY AND RESIDENTIALAREA DATA OBTAINED FROM CANVEC © DEPARTMENT OF NATURAL RESOURCESCANADA. ALL RIGHTS RESERVED.3. IMAGERY OBTAINED FROM BING MAPS FOR ARCGIS PUBLISHED BY MICROSOFTCORPORATION, REDMOND, WA, MAY 2009. TOPO BASEMAP © ESRI AND ITSLICENSORS. ALL RIGHTS RESERVED.PROJECTION: UTM ZONE 10; DATUM: NAD 83
WESPAC MIDSTREAM - VANCOUVER LLC

14 August 2018 1314220049-123-R-Rev0
5
2.0 METHODOLOGY The River Processes baseline investigation for the Project site was based on a literature review and desk-based study of available information and data regarding the processes acting in Gravesend Reach. The review included the following tasks:
Gather and review available data and relevant scientific and engineering literature including but not limited to:
Bathymetric charts (CHS Charts 3489 and 3490 – Canadian Hydrographic Services, 1995).
Bathymetry Data provided through Avadepth (Soundings for the South Arm of the Fraser River. _FR_Overview_S.dwf.)
Bathymetry data in Gravesend Reach provided by PWPC, Various annual surveys, 1997-2016
Coulson, C. H. and W. Obedkoff. 1998. British Columbia Streamflow Inventory. Report for Province of British Columbia Ministry of Environment Lands and Parks.
Environment Canada weather station data from Sand Heads and Vancouver International Airport (Climate IDs: 1107010 and 1108447, respectively).
Fisheries and Oceans Canada. 1999. Sailing Directions, BC Coast, North Portion, Volume 1, 16th Ed.
Fisheries and Oceans Canada. 2016 Canadian Tide and Current Tables, Volume 5.
Fraser River Water Quality Buoy data provided by Environment Canada, 2012-2018
Thomson, R.E. 1981. Oceanography of the British Columbia Coast. DFO Publication 56.
Historic aerial photographs obtained from the University of British Columbia (UBC) Air Photo Library aerial photographs.
Predicted water levels and velocities in the Project Reach provided from Avadepth (DFO, 2018)
Modelled velocities and morphology in the Project Reach (TetraTech, 2018)
Hydrometric data from Water Survey Canada (WSC) stations at Hope (#08MF005) and Mission (#08MH024)
Conduct a preliminary gap analysis of available data;
Develop a conceptual model of the natural and anthropogenic physical processes affecting the tidally and fluvial dominated environment of Tilbury Island;
Review available historical air photography;
Conduct a review and evaluation of the circulation and sediment transport modelling conducted by Tetra Tech EBA Inc. (Tetra Tech EBA, 2018) for the Project area;
The development of a qualitative sediment budget for Tilbury Island; and
A geomorphic evaluation of Tilbury Island and vicinity with respect to its potential use as a site for a marine jetty under a development proposal by WesPac.
14 August 2018 1314220049-123-R-Rev0
6
2.1 Site Reconnaissance A short site inspection was completed on June 17, 2015 by Phil Osborne, senior geomorphologist with Golder. The site visit included a visual inspection of the physical conditions, including indicators of general hydraulic conditions, shoreline sediment and sediment transport, coastal / inter-tidal morphology and shoreline slope stability. Observed geomorphic indicators of sediment transport processes were documented with photographs. The site reconnaissance included foot traverses along the shoreline of the Project Area. No other field work was completed under the River Processes Pathway Component due to the well-researched nature of the Fraser River.
14 August 2018 1314220049-123-R-Rev0
7
3.0 GEOGRAPHICAL AND HISTORICAL CONTEXT 3.1 Geographic Context The Fraser River is located south of Vancouver, British Columbia, on the eastern shore of the Strait of Georgia, a semi-enclosed marine basin. The Fraser River is approximately 1,400 km long and drains a basin of over 234,000 km2 (Clague et al. 1983). The Lower Fraser extends from downstream of the Sand Heads Lighthouse to the upstream limit at the eastern end of Kanaka Creek in Maple Ridge (Bros, 2006). The River through this section is Provincial Crown property under a Head Lease to the Fraser River Port Authority (Bros, 2007).
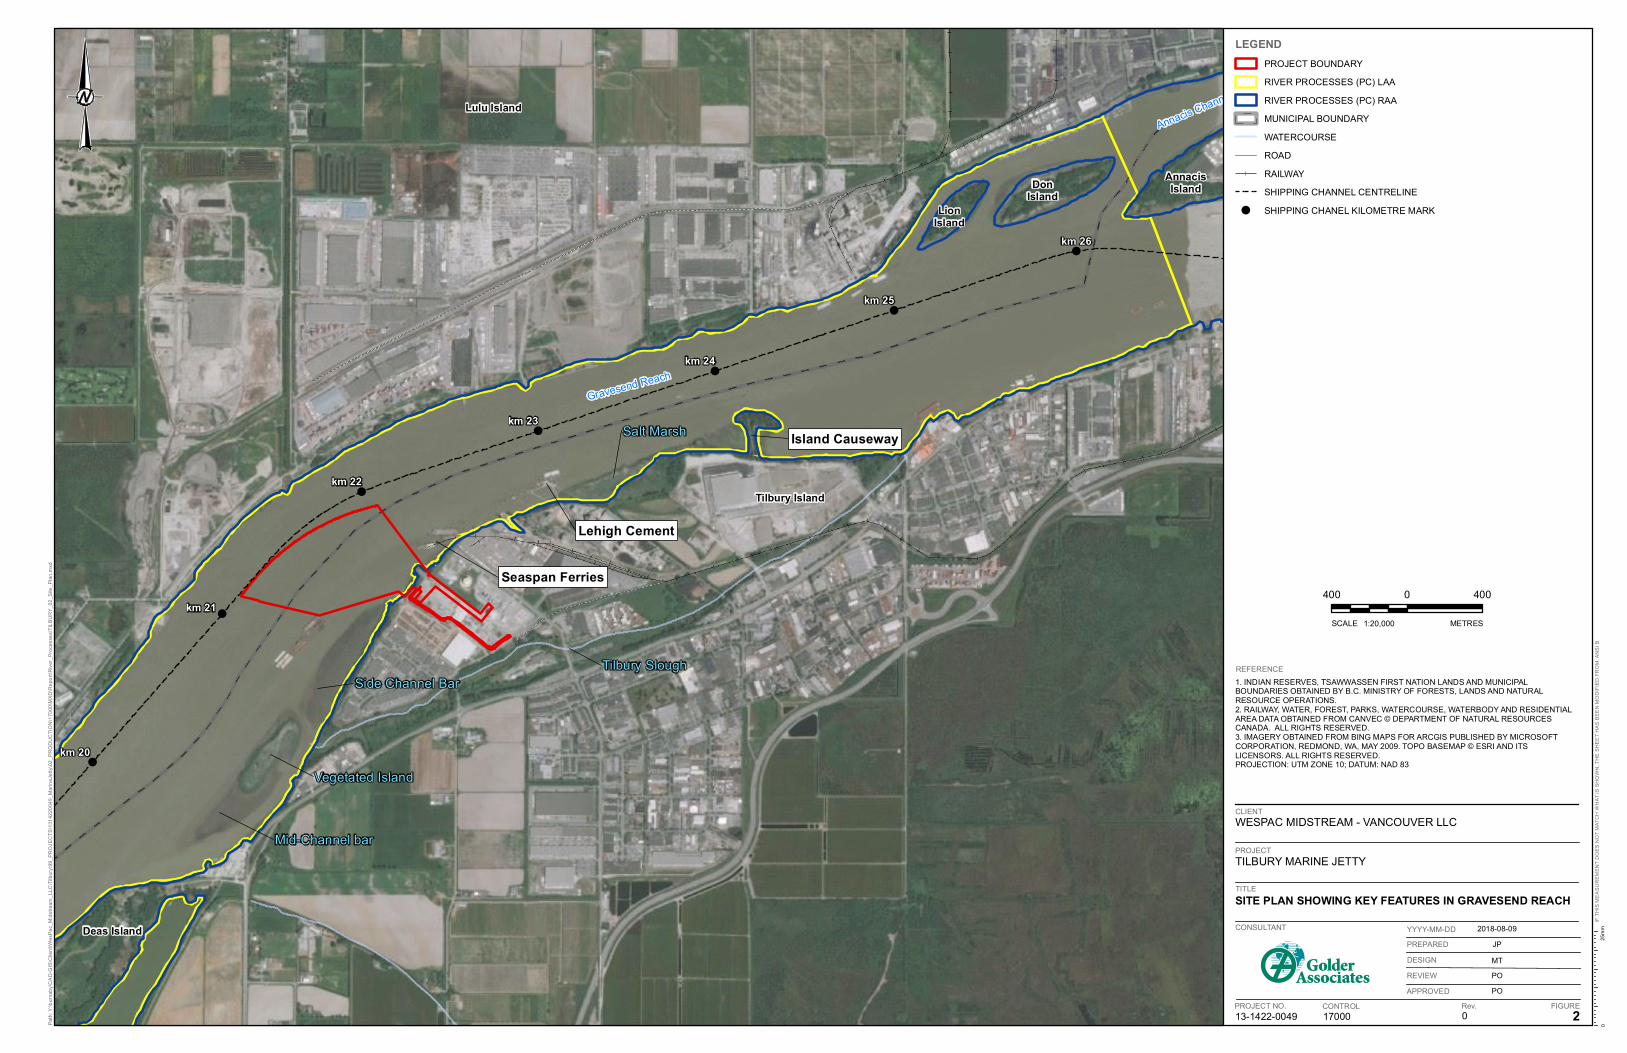
Locations on the Fraser River are often measured using a chainage (distance) upstream of Sand Heads Lighthouse. The Project is located on the South Arm of the Fraser that extends from the Sand Heads Lighthouse to Port Mann (KM 0 to KM 40) (DFO, 2018). The project area is located at the point bar and nearshore section of Tilbury Island (KM 22) on the south bank of the river. Tilbury Island is located in Gravesend Reach (KM 18 to KM 24) on the South Arm (Figure 1) of the Lower Fraser River on the Fraser River Delta. The Gravesend Reach is typically defined as the portion of the Fraser River between Deas Island and Annacis Island (DFO, 2012).
A site plan indicating key features in Gravesend Reach is provided in Figure 2.
!
!
!
!
!
!
!
Deas Island
DonIsland
LionIsland
AnnacisIsland
Tilbury Island
Lehigh Cement
Island Causeway
Seaspan Ferries
Tilbury Slough
Salt Marsh
Side Channel Bar
Vegetated Island
Mid-Channel bar
Lulu IslandAnnacis Channel
Gravesend Reach
km 20
km 21
km 22
km 23
km 24
km 25
km 26
CLIENT
LEGENDPROJECT BOUNDARYRIVER PROCESSES (PC) LAARIVER PROCESSES (PC) RAAMUNICIPAL BOUNDARYWATERCOURSEROADRAILWAYSHIPPING CHANNEL CENTRELINE
! SHIPPING CHANEL KILOMETRE MARK
REFERENCE
PROJECTTILBURY MARINE JETTYTITLE
13-1422-0049
Path:
Y:\bu
rnaby
\CAD
-GIS
\Clie
nt\W
esPa
c_Mi
dstre
am_L
LC\Ti
lbury\
99_P
ROJE
CTS\
1314
2200
49_M
arine
Jetty
\02_P
RODU
CTIO
N\17
000\M
XD\R
eport
\Rive
r_Proc
esse
s\TILB
URY_
02_S
ite_P
lan.m
xd
IF TH
IS M
EASU
REME
NT D
OES
NOT M
ATCH
WHA
T IS
SHOW
N, TH
E SH
EET H
AS B
EEN
MODI
FIED
FROM
: ANS
I B
CONSULTANT
PROJECT NO. CONTROL Rev. FIGURE
YYYY-MM-DDPREPAREDDESIGNREVIEWAPPROVED
25mm
0
400 0 400
1:20,000 METRESSCALE
POPOMTJP
2018-08-09
2017000
SITE PLAN SHOWING KEY FEATURES IN GRAVESEND REACH
1. INDIAN RESERVES, TSAWWASSEN FIRST NATION LANDS AND MUNICIPALBOUNDARIES OBTAINED BY B.C. MINISTRY OF FORESTS, LANDS AND NATURALRESOURCE OPERATIONS.2. RAILWAY, WATER, FOREST, PARKS, WATERCOURSE, WATERBODY AND RESIDENTIALAREA DATA OBTAINED FROM CANVEC © DEPARTMENT OF NATURAL RESOURCESCANADA. ALL RIGHTS RESERVED.3. IMAGERY OBTAINED FROM BING MAPS FOR ARCGIS PUBLISHED BY MICROSOFTCORPORATION, REDMOND, WA, MAY 2009. TOPO BASEMAP © ESRI AND ITSLICENSORS. ALL RIGHTS RESERVED.PROJECTION: UTM ZONE 10; DATUM: NAD 83
WESPAC MIDSTREAM - VANCOUVER LLC
14 August 2018 1314220049-123-R-Rev0
9
3.2 Coordinate System and Datums All horizontal coordinates refer to Universal Transverse Mercator Zone 10 North (UTM-10N) North American Datum 1983 (NAD83) coordinates.
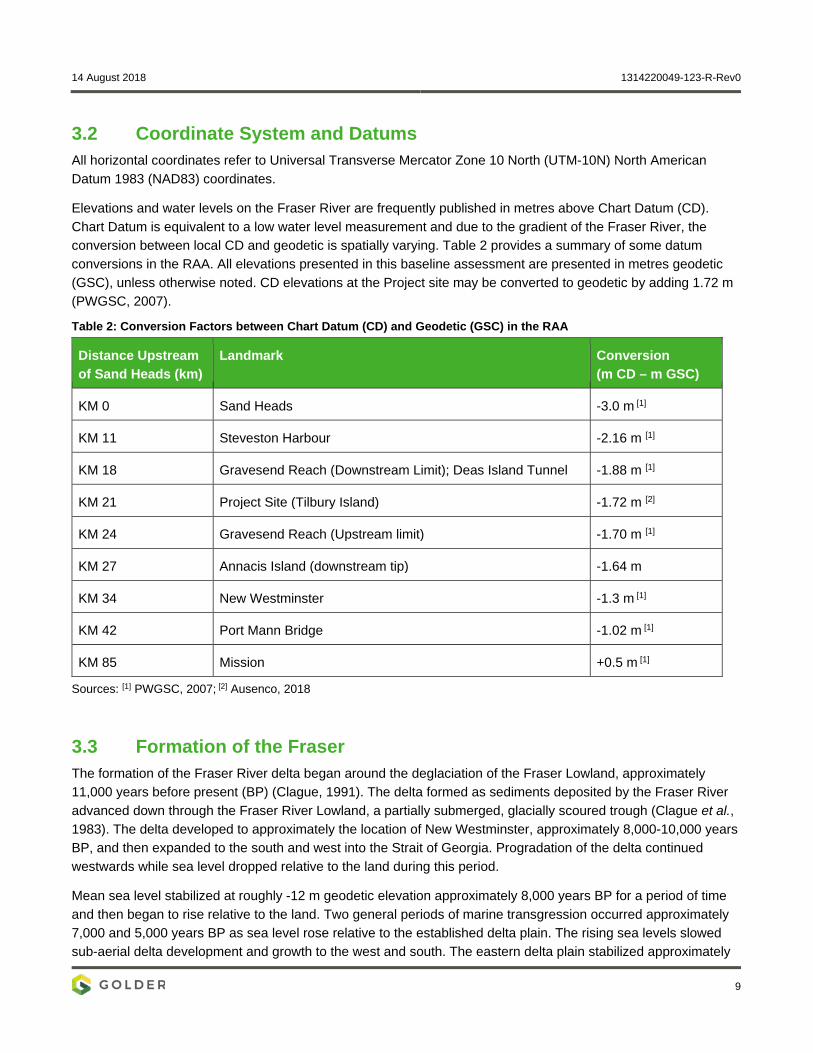
Elevations and water levels on the Fraser River are frequently published in metres above Chart Datum (CD). Chart Datum is equivalent to a low water level measurement and due to the gradient of the Fraser River, the conversion between local CD and geodetic is spatially varying. Table 2 provides a summary of some datum conversions in the RAA. All elevations presented in this baseline assessment are presented in metres geodetic (GSC), unless otherwise noted. CD elevations at the Project site may be converted to geodetic by adding 1.72 m (PWGSC, 2007).
Table 2: Conversion Factors between Chart Datum (CD) and Geodetic (GSC) in the RAA
Distance Upstream of Sand Heads (km)
Landmark Conversion (m CD – m GSC)
KM 0 Sand Heads -3.0 m [1]
KM 11 Steveston Harbour -2.16 m [1]
KM 18 Gravesend Reach (Downstream Limit); Deas Island Tunnel -1.88 m [1]
KM 21 Project Site (Tilbury Island) -1.72 m [2]
KM 24 Gravesend Reach (Upstream limit) -1.70 m [1]
KM 27 Annacis Island (downstream tip) -1.64 m
KM 34 New Westminster -1.3 m [1]
KM 42 Port Mann Bridge -1.02 m [1]
KM 85 Mission +0.5 m [1]
Sources: [1] PWGSC, 2007; [2] Ausenco, 2018
3.3 Formation of the Fraser The formation of the Fraser River delta began around the deglaciation of the Fraser Lowland, approximately 11,000 years before present (BP) (Clague, 1991). The delta formed as sediments deposited by the Fraser River advanced down through the Fraser River Lowland, a partially submerged, glacially scoured trough (Clague et al., 1983). The delta developed to approximately the location of New Westminster, approximately 8,000-10,000 years BP, and then expanded to the south and west into the Strait of Georgia. Progradation of the delta continued westwards while sea level dropped relative to the land during this period.
Mean sea level stabilized at roughly -12 m geodetic elevation approximately 8,000 years BP for a period of time and then began to rise relative to the land. Two general periods of marine transgression occurred approximately 7,000 and 5,000 years BP as sea level rose relative to the established delta plain. The rising sea levels slowed sub-aerial delta development and growth to the west and south. The eastern delta plain stabilized approximately

14 August 2018 1314220049-123-R-Rev0
10
5,000 years BP, allowing the accumulation of organic material over the eastern portion of the delta, which is now the location of several large peat bogs (Clague et al., 1983).
Approximately 5000 years BP, the Fraser River discharged westwards into the Strait of Georgia. Tidal currents and natural shifting of the channels enabled the main distributary arm to migrate to the north and south as it advanced westwards. The South Arm discharged into the Strait of Georgia near its current location approximately 200+ years BP. This means that Tilbury Island in its present location is relatively young geologic feature.
Over the last approximately 200 years, there is evidence to suggest that the lower section of the mouth of the South Arm of Fraser River has migrated northwards from a location around the modern-day Canoe Passage to the present location. River training walls have modified the navigation channel in the lower reach of the Fraser River from New Westminster to its mouth, constricting the channel and thereby increasing water velocities and reducing sedimentation (Birtwell et al, 1987). Deas Slough, located downstream of Gravesend Reach, was formerly a side-arm of the Fraser River which was dammed at its upstream end in 1948 (Birtwell et al, 1987).
The current delta is approximately 975 km2 in area with an average thickness of 110 m (Milliman, 1980) but reaching to 300 m or more in some places (Clague et al., 1998). Much of this sediment thickness is comprised of Holocene sediments overlying Pleistocene deposits and bedrock. The surface sediments at Tilbury Island are characterized as the intertidal delta (topset) which includes the point bar river and floodplain sediments overlying historical prodelta (includes the foreset and bottomsets; Clague et al., 1983).
3.4 Recent History of the South Arm Since the early 1900’s, various structures and river modifications have been constructed in support of the river-based industry. Construction of diking on the banks of the South Arm has been ongoing since 1906 (Richmond, 2000). This diking was intended to prevent the flooding of the upper delta plain and protected houses, farmland and other infrastructure. The South Arm of the Fraser River is now an active shipping route. The industrialised main navigation channel in the South Arm extends from Steveston along the northern bank to the south side of Annacis Island, and upstream through Annieville Channel and the confluence with the North Arm.
14 August 2018 1314220049-123-R-Rev0
11
4.0 BASELINE HYDROLOGIC CONDITIONS This section describes the baseline hydrologic conditions at the Project site, in the LAA and in the RAA. Existing hydrologic conditions such as river discharge and water levels will not be affected by the project. However, these processes and their temporal and spatial variation are important drivers in other river processes that may be affected by the project including river currents, sediment process and geomorphology.
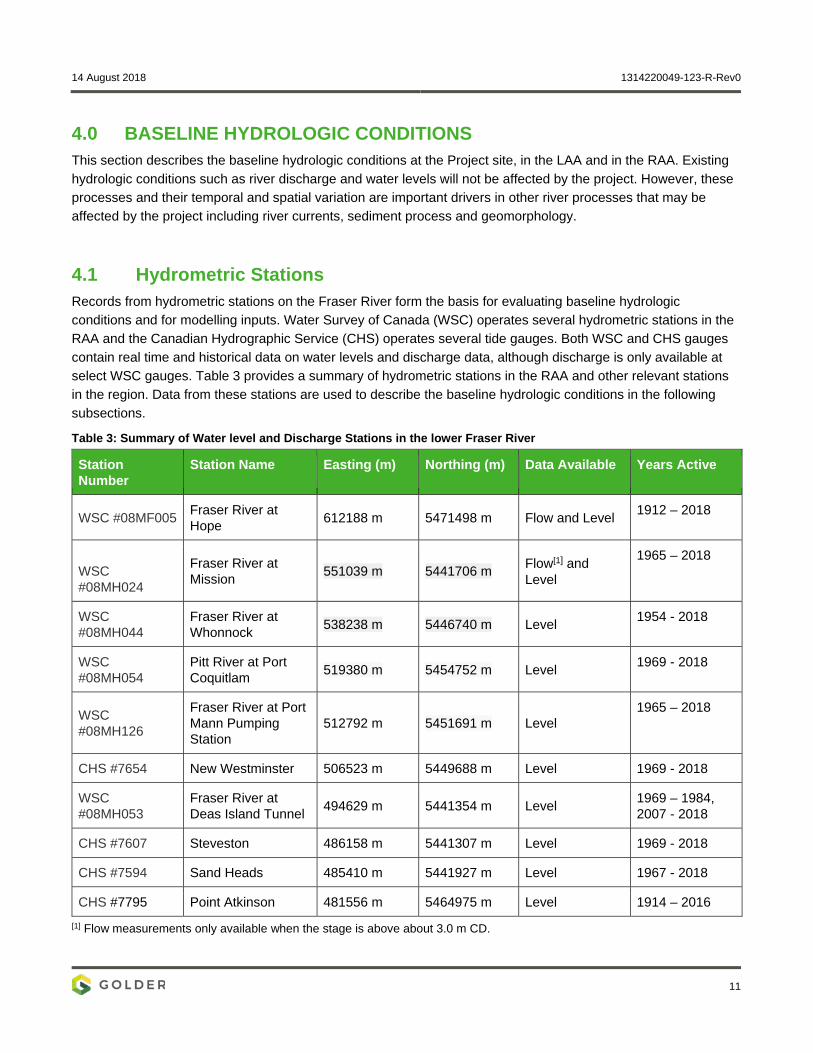
4.1 Hydrometric Stations Records from hydrometric stations on the Fraser River form the basis for evaluating baseline hydrologic conditions and for modelling inputs. Water Survey of Canada (WSC) operates several hydrometric stations in the RAA and the Canadian Hydrographic Service (CHS) operates several tide gauges. Both WSC and CHS gauges contain real time and historical data on water levels and discharge data, although discharge is only available at select WSC gauges. Table 3 provides a summary of hydrometric stations in the RAA and other relevant stations in the region. Data from these stations are used to describe the baseline hydrologic conditions in the following subsections.
Table 3: Summary of Water level and Discharge Stations in the lower Fraser River
Station Number
Station Name Easting (m) Northing (m) Data Available Years Active
WSC #08MF005 Fraser River at Hope 612188 m 5471498 m Flow and Level 1912 – 2018
WSC #08MH024
Fraser River at Mission 551039 m 5441706 m Flow[1] and
Level
1965 – 2018
WSC #08MH044
Fraser River at Whonnock 538238 m 5446740 m Level 1954 - 2018
WSC #08MH054
Pitt River at Port Coquitlam 519380 m 5454752 m Level 1969 - 2018
WSC #08MH126
Fraser River at Port Mann Pumping Station
512792 m 5451691 m Level 1965 – 2018
CHS #7654 New Westminster 506523 m 5449688 m Level 1969 - 2018
WSC #08MH053
Fraser River at Deas Island Tunnel 494629 m 5441354 m Level 1969 – 1984,
2007 - 2018
CHS #7607 Steveston 486158 m 5441307 m Level 1969 - 2018
CHS #7594 Sand Heads 485410 m 5441927 m Level 1967 - 2018
CHS #7795 Point Atkinson 481556 m 5464975 m Level 1914 – 2016 [1] Flow measurements only available when the stage is above about 3.0 m CD.
14 August 2018 1314220049-123-R-Rev0
12
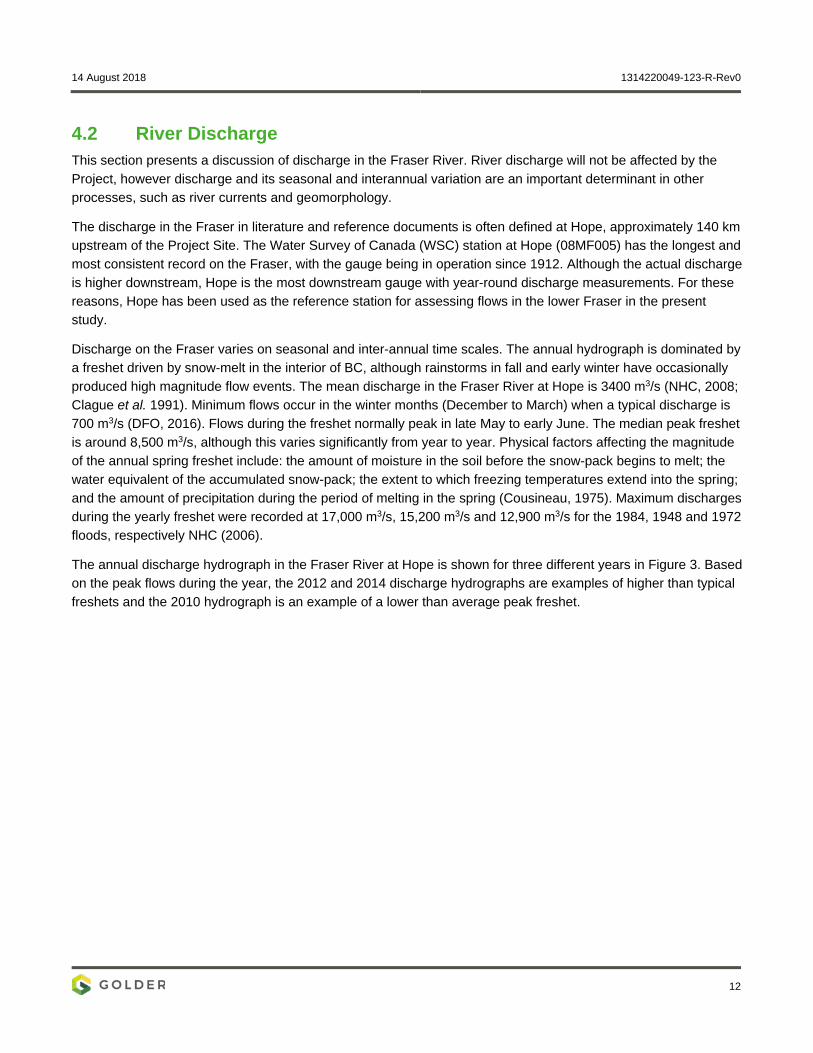
4.2 River Discharge This section presents a discussion of discharge in the Fraser River. River discharge will not be affected by the Project, however discharge and its seasonal and interannual variation are an important determinant in other processes, such as river currents and geomorphology.
The discharge in the Fraser in literature and reference documents is often defined at Hope, approximately 140 km upstream of the Project Site. The Water Survey of Canada (WSC) station at Hope (08MF005) has the longest and most consistent record on the Fraser, with the gauge being in operation since 1912. Although the actual discharge is higher downstream, Hope is the most downstream gauge with year-round discharge measurements. For these reasons, Hope has been used as the reference station for assessing flows in the lower Fraser in the present study.
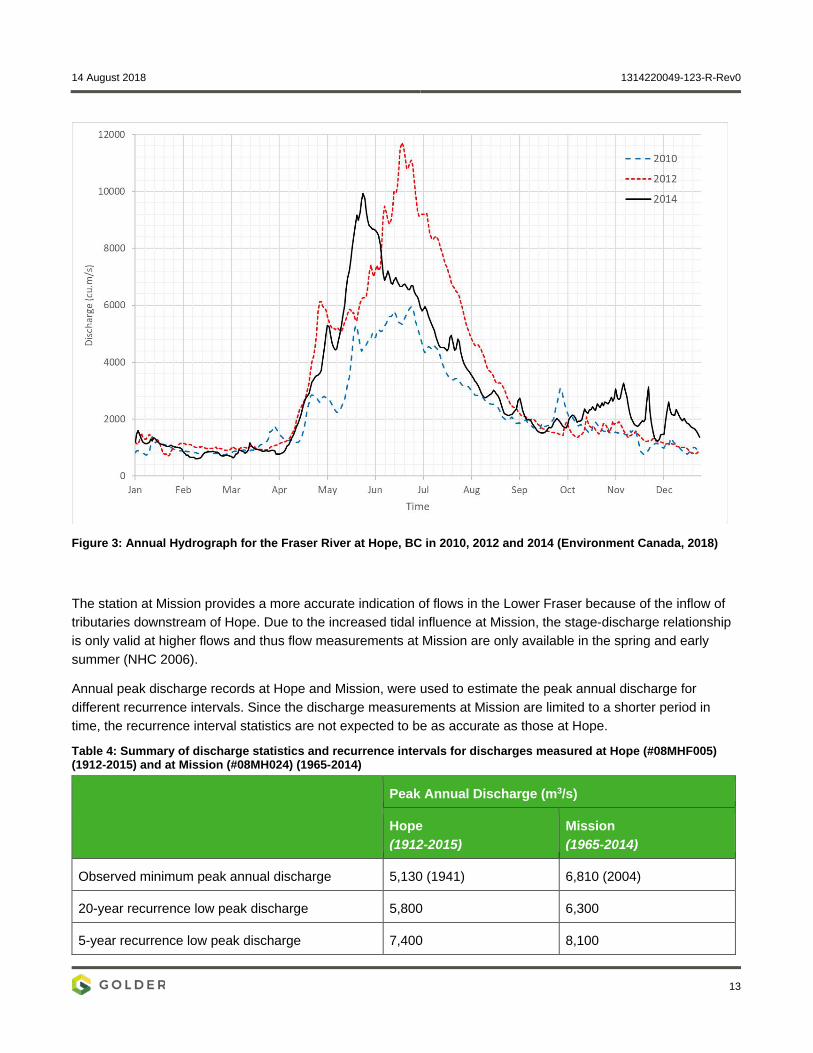
Discharge on the Fraser varies on seasonal and inter-annual time scales. The annual hydrograph is dominated by a freshet driven by snow-melt in the interior of BC, although rainstorms in fall and early winter have occasionally produced high magnitude flow events. The mean discharge in the Fraser River at Hope is 3400 m3/s (NHC, 2008; Clague et al. 1991). Minimum flows occur in the winter months (December to March) when a typical discharge is 700 m3/s (DFO, 2016). Flows during the freshet normally peak in late May to early June. The median peak freshet is around 8,500 m3/s, although this varies significantly from year to year. Physical factors affecting the magnitude of the annual spring freshet include: the amount of moisture in the soil before the snow-pack begins to melt; the water equivalent of the accumulated snow-pack; the extent to which freezing temperatures extend into the spring; and the amount of precipitation during the period of melting in the spring (Cousineau, 1975). Maximum discharges during the yearly freshet were recorded at 17,000 m3/s, 15,200 m3/s and 12,900 m3/s for the 1984, 1948 and 1972 floods, respectively NHC (2006).
The annual discharge hydrograph in the Fraser River at Hope is shown for three different years in Figure 3. Based on the peak flows during the year, the 2012 and 2014 discharge hydrographs are examples of higher than typical freshets and the 2010 hydrograph is an example of a lower than average peak freshet.
14 August 2018 1314220049-123-R-Rev0
13
Figure 3: Annual Hydrograph for the Fraser River at Hope, BC in 2010, 2012 and 2014 (Environment Canada, 2018)
The station at Mission provides a more accurate indication of flows in the Lower Fraser because of the inflow of tributaries downstream of Hope. Due to the increased tidal influence at Mission, the stage-discharge relationship is only valid at higher flows and thus flow measurements at Mission are only available in the spring and early summer (NHC 2006).
Annual peak discharge records at Hope and Mission, were used to estimate the peak annual discharge for different recurrence intervals. Since the discharge measurements at Mission are limited to a shorter period in time, the recurrence interval statistics are not expected to be as accurate as those at Hope.
Table 4: Summary of discharge statistics and recurrence intervals for discharges measured at Hope (#08MHF005) (1912-2015) and at Mission (#08MH024) (1965-2014)
Peak Annual Discharge (m3/s)
Hope (1912-2015)
Mission (1965-2014)
Observed minimum peak annual discharge 5,130 (1941) 6,810 (2004)
20-year recurrence low peak discharge 5,800 6,300
5-year recurrence low peak discharge 7,400 8,100

14 August 2018 1314220049-123-R-Rev0
14
Peak Annual Discharge (m3/s)
Hope (1912-2015)
Mission (1965-2014)
Median peak annual discharge 8,500 9,200
5-year recurrence high peak discharge 9,900 11,200
20-year recurrence high peak discharge 11,900 13,000
Observed maximum peak annual discharge 15,200 (1948) 14,400 (1972)
4.3 Water Levels Water levels in the RAA are dominated by astronomical tides in the Strait of Georgia and discharge in the Fraser River. Similar to river discharge, water levels will affect the Project but are not expected to be affected by the Project. However, water levels are an important factor in other river processes in the LAA such as river currents, erosion and sedimentation, propeller scour and the effects of wake waves. Present day water levels are discussed below followed by a discussion of sea level rise.
4.3.1 Present Day Water Levels In addition to river discharge and other short term effect such as storm surge, water levels in the LAA are influenced by astronomical tides in the Strait of Georgia. Tides in the Lower Fraser River are predominantly mixed semidiurnal which means an uneven distribution between the two highs and lows during the day. Tidal water level variation at Sand Heads, located approximately 22 km downstream of the Project Site, range from 2.6 m to over 5.4 m (Luternauer and Finn, 1983). The tidal effect diminishes moving upstream from Sand Heads. Tidal water level fluctuations are also more apparent during periods of low flow in the Fraser River. During low flow, tidal influence can be observed as far upstream as Chilliwack Mountain (Tywoniuk, 1972), approximately 100 km upstream of Sand Heads. Tides in the Fraser River area are always delayed relative to the Strait of Georgia as sea water floods upstream against the discharging river (Thomson, 1981).
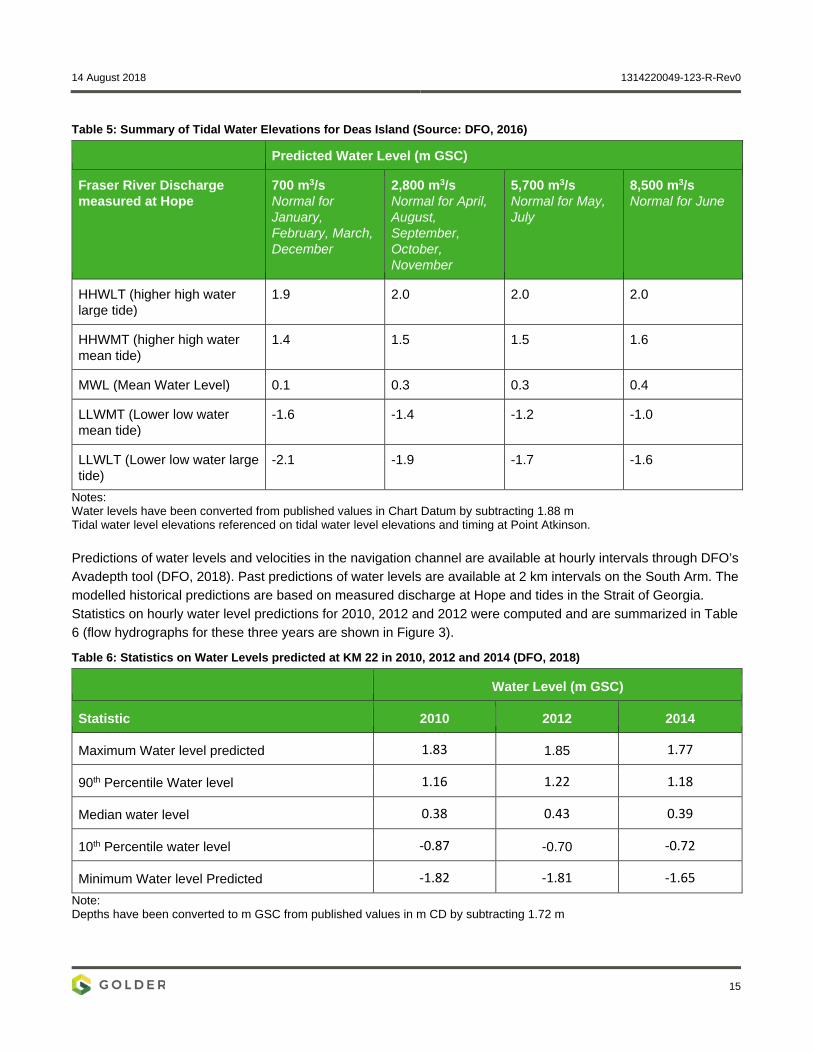
Table 5 summarizes predicted tidal water level elevations at Deas Island during typical discharges during different months of the year by DFO (2016). The water levels in Table 5 are based on predicted tide levels at the reference tidal station at Point Atkinson (Station ID#7795) and typical seasonal discharges at Hope (Station ID #08MF005). Water levels at the Project area are more sensitive to discharge during low tide; water levels can be up to 0.5 m lower during low tide during the lower flows in the winter, compared to typical freshet flows. In contrast, during periods of high tide, water level fluctuations range up to 0.1 m depending on Fraser River flow conditions.
14 August 2018 1314220049-123-R-Rev0
15
Table 5: Summary of Tidal Water Elevations for Deas Island (Source: DFO, 2016)
Predicted Water Level (m GSC)
Fraser River Discharge measured at Hope
700 m3/s Normal for January, February, March, December
2,800 m3/s Normal for April, August, September, October, November
5,700 m3/s Normal for May, July
8,500 m3/s Normal for June
HHWLT (higher high water large tide)
1.9 2.0 2.0 2.0
HHWMT (higher high water mean tide)
1.4 1.5 1.5 1.6
MWL (Mean Water Level) 0.1 0.3 0.3 0.4
LLWMT (Lower low water mean tide)
-1.6 -1.4 -1.2 -1.0
LLWLT (Lower low water large tide)
-2.1 -1.9 -1.7 -1.6
Notes: Water levels have been converted from published values in Chart Datum by subtracting 1.88 m Tidal water level elevations referenced on tidal water level elevations and timing at Point Atkinson. Predictions of water levels and velocities in the navigation channel are available at hourly intervals through DFO’s Avadepth tool (DFO, 2018). Past predictions of water levels are available at 2 km intervals on the South Arm. The modelled historical predictions are based on measured discharge at Hope and tides in the Strait of Georgia. Statistics on hourly water level predictions for 2010, 2012 and 2012 were computed and are summarized in Table 6 (flow hydrographs for these three years are shown in Figure 3).
Table 6: Statistics on Water Levels predicted at KM 22 in 2010, 2012 and 2014 (DFO, 2018)
Water Level (m GSC)
Statistic 2010 2012 2014
Maximum Water level predicted 1.83 1.85 1.77
90th Percentile Water level 1.16 1.22 1.18
Median water level 0.38 0.43 0.39
10th Percentile water level -0.87 -0.70 -0.72
Minimum Water level Predicted -1.82 -1.81 -1.65 Note: Depths have been converted to m GSC from published values in m CD by subtracting 1.72 m
14 August 2018 1314220049-123-R-Rev0
16
Extreme high water levels at the site may be caused by storm surge in the Strait of Georgia, or by extreme high discharges during freshet. Westerly winds can cause wind set-up in the Strait of Georgia which may locally increase water levels at the site. At the time of writing, no site-specific assessment of the impacts of storm surge was available. The expected magnitude of the storm surge in the Strait of Georgia is available for different return periods in provincial guidelines (BCMOE 2011). The average annual storm surge is 0.73 m and the 100-year return storm surge is expected to be 1.2 m. It is expected that storm surge in the Strait of Georgia would propagate upstream to the site.
The closest historical water level measurements are available from the WSC gauge at Deas Island (08MH053, 1969 – 1984). The maximum water level recorded during this period was 2.64 m and the minimum water level was -2.02 (NHC, 2016).
4.3.2 Sea Level Rise The Project Area will be affected by predicted sea level rise (SLR) over the life of the Project. Local sea level rise at the site reflects the combined contribution of global (eustatic) sea level rise and local (isostatic) processes. Factors contributing to eustatic sea level changes include thermal expansion of the ocean water and the addition of water from the melting of polar and mountain icecaps (Thomson et al., 2008). Isostatic processes at the Project site include the accumulation of sedimentary deposits or downwarping (dropping) of the Earth’s crust through tectonic activity. These processes often combine and therefore are difficult to separate. SLR to the year 2100 is considered in this study, consistent with recommendations in provincial guidelines (BCMOE 2011)
A recent analysis by James et al. (2014) included sea level rise modelling under four (4) scenarios previously provided to the Intergovernmental Panel on Climate Change. The study suggests median sea level rise values ranging from 0.385 m to 0.516 m for Vancouver for the year 2100. James et al. (2014) also notes that the melting of the West Antarctic ice sheet could contribute an additional 0.65 m of SLR.
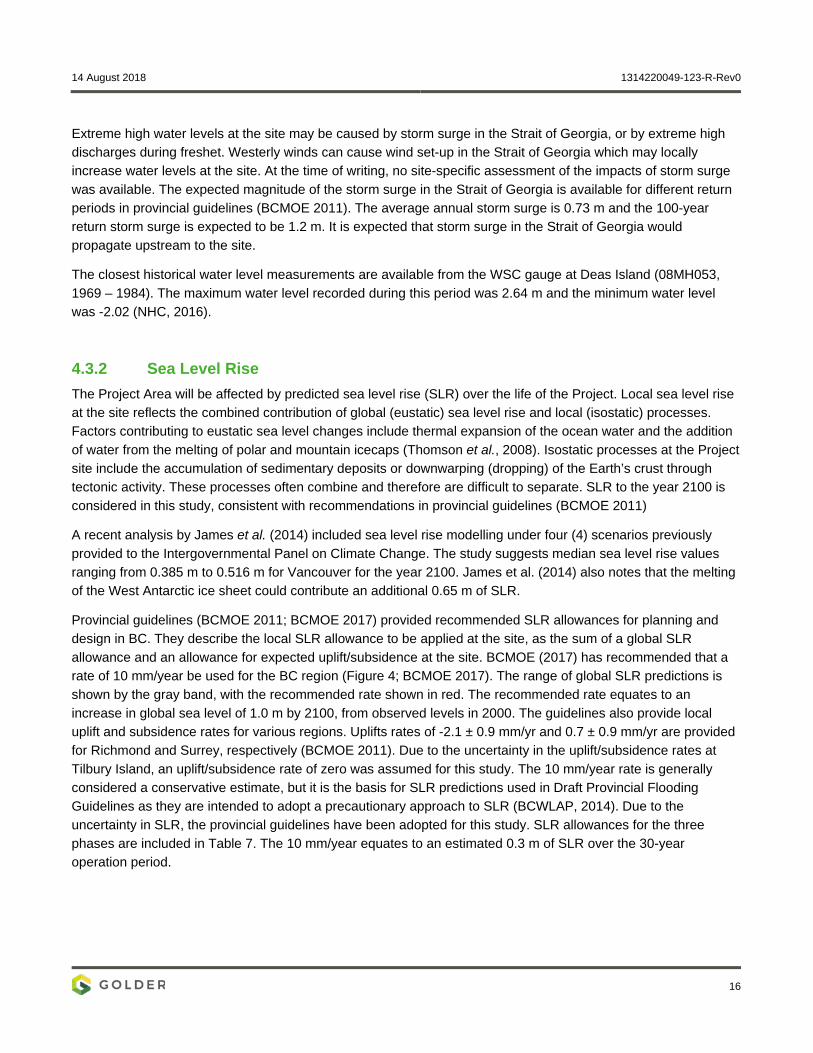
Provincial guidelines (BCMOE 2011; BCMOE 2017) provided recommended SLR allowances for planning and design in BC. They describe the local SLR allowance to be applied at the site, as the sum of a global SLR allowance and an allowance for expected uplift/subsidence at the site. BCMOE (2017) has recommended that a rate of 10 mm/year be used for the BC region (Figure 4; BCMOE 2017). The range of global SLR predictions is shown by the gray band, with the recommended rate shown in red. The recommended rate equates to an increase in global sea level of 1.0 m by 2100, from observed levels in 2000. The guidelines also provide local uplift and subsidence rates for various regions. Uplifts rates of -2.1 ± 0.9 mm/yr and 0.7 ± 0.9 mm/yr are provided for Richmond and Surrey, respectively (BCMOE 2011). Due to the uncertainty in the uplift/subsidence rates at Tilbury Island, an uplift/subsidence rate of zero was assumed for this study. The 10 mm/year rate is generally considered a conservative estimate, but it is the basis for SLR predictions used in Draft Provincial Flooding Guidelines as they are intended to adopt a precautionary approach to SLR (BCWLAP, 2014). Due to the uncertainty in SLR, the provincial guidelines have been adopted for this study. SLR allowances for the three phases are included in Table 7. The 10 mm/year equates to an estimated 0.3 m of SLR over the 30-year operation period.
14 August 2018 1314220049-123-R-Rev0
17
Figure 4: Recommended global SLR curve for planning and design in BC (BCMOE 2017)
Table 7: Sea Level Rise Allowances Recommended for the Project phases; Based on SLR rates in provincial guidance
Project Phase Years SLR Allowance (Base year 2000)
Construction 2018 – 2022 0.18 – 0.22 m
Operation 2020 – 2050 0.20 m – 0.50 m
Decommissioning 2050 0.50 m
4.4 River Currents and Circulation River currents is a subcomponent of the River Processes PC in the impact assessment for the Project. In-river structures and channel modifications are expected to modify local river currents and circulation. These changes in circulation and velocities can affect patterns sediment processes and geomorphology.
The spatial and temporal variation in river currents are complicated in the Fraser River from typical meandering river circulation combined with tidal influence and salt wedge related effects. Flood currents associated with the rising tide at the river mouth oppose the river flow to cause a net slowdown in the downstream flow and a subsequent backing-up of water that travels upstream as a high-water bulge (attributed to the presence of a salt wedge). During the winter (period of low flows), moderate to strong flood streams can reverse the river flow as far as Mission (Thomson, 1981). The strength of this reversal diminishes with distance from the river mouth, but is still apparent in the LAA (Figure 6).
The speed of currents in the channel and flow directions is influenced by discharge and water levels in the LAA. Predictions of depth-averaged velocities in the navigation channel are available at hourly intervals through DFO’s Avadepth tool (DFO, 2018). Figure 5 and Figure 6 show examples of average channel velocities predicted at KM 22, at representative high and low flows respectively. During high freshet flows, flow is downstream at all tidal stages all the way to the mouth (see Figure 5 for example). The highest velocities occur when high flows coincide with low water levels (tides) in the LAA (Tetra Tech EBA, 2108).

14 August 2018 1314220049-123-R-Rev0
18
Figure 5: Predicted water levels and depth-averaged velocities at KM 22; July 1-3, 2011, Average daily discharge at Hope = 9100 m3/s; Data from Avadepth (DFO, 2018)
Figure 6: Predicted water levels and depth-averaged velocities at KM 22, Jan 1-3, 2011, Average daily discharge at Hope = 789 m3/s; Data from Avadepth (DFO, 2018)
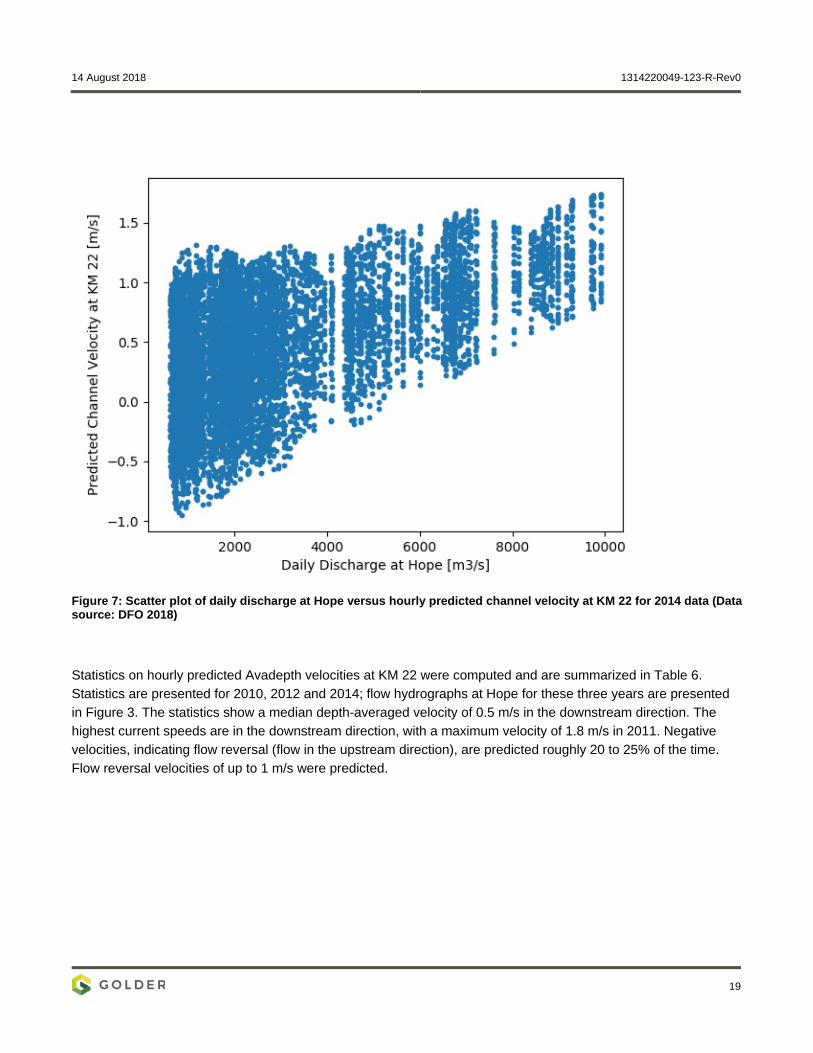
At lower flows, the variation in water levels and velocities is higher and flow reversal is observed at the Project site (see Figure 6, for example). Figure 7 presents a scatter plot of the daily discharge at Hope versus the hourly predicted velocities from Avadepth (DFO 2018). The scatter in the data in the plot shows the tidal influence at the site. Flow reversal at the site (negative velocities) are visible at discharges of less than about 5000 m3/s (measured at Hope).
14 August 2018 1314220049-123-R-Rev0
19
Figure 7: Scatter plot of daily discharge at Hope versus hourly predicted channel velocity at KM 22 for 2014 data (Data source: DFO 2018)
Statistics on hourly predicted Avadepth velocities at KM 22 were computed and are summarized in Table 6. Statistics are presented for 2010, 2012 and 2014; flow hydrographs at Hope for these three years are presented in Figure 3. The statistics show a median depth-averaged velocity of 0.5 m/s in the downstream direction. The highest current speeds are in the downstream direction, with a maximum velocity of 1.8 m/s in 2011. Negative velocities, indicating flow reversal (flow in the upstream direction), are predicted roughly 20 to 25% of the time. Flow reversal velocities of up to 1 m/s were predicted.
14 August 2018 1314220049-123-R-Rev0
20
Table 8: Statistics on depth-averaged velocities in the navigational channel predicted at KM 22 in 2010, 2012, and 2014 (Avadepth, 2018)
Depth-Averaged Velocity (m/s)
Statistic 2010 2012 2014
Maximum velocity predicted 1.52 1.84 1.74
90th Percentile velocity 1.02 1.19 1.09
Median velocity 0.41 0.54 0.52
10th Percentile velocity -0.33 -0.29 -0.26
Minimum velocity predicted -1.00 -0.88 -0.95
Percentage of Flow-Reversal 24.1% 20.6% 20.4% Note: Positive values indicate flow in the downstream direction; negative values indicate flow in the upstream direction
Tetra Tech EBA (2018) conducted morphological modelling as part of the impact assessment. In situ ADCP data was also collected as part of the project. The modelling component was carried out using H3D, Tetra Tech EBA’s in-house circulation and sediment transport model. The model is a three-dimensional time-stepping model that computes the three components of velocity (u, v, and w) on a grid in three dimensions (x, y, and z) as well as scalar fields such as temperature, oxygen and sediment concentration. The model is a nested model with a 10 m resolution in the vicinity of the Project area, 50-m resolution within the Fraser River and a 1-km resolution of the entire Strait of Georgia.
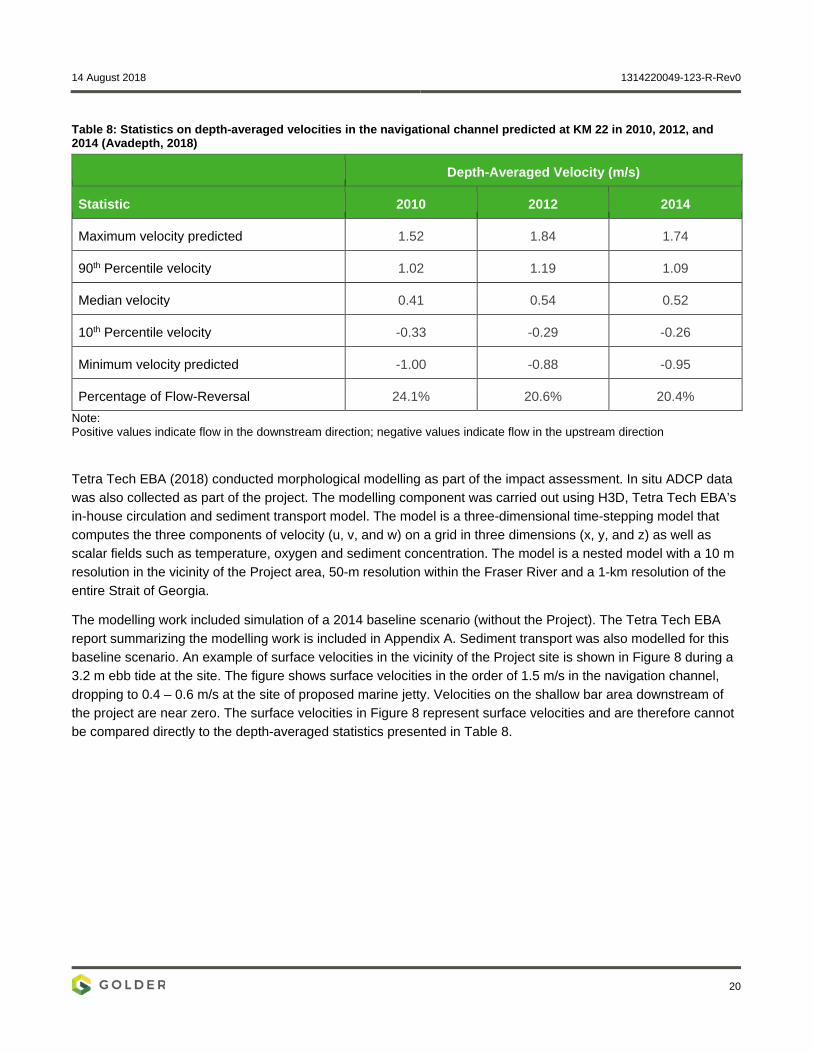
The modelling work included simulation of a 2014 baseline scenario (without the Project). The Tetra Tech EBA report summarizing the modelling work is included in Appendix A. Sediment transport was also modelled for this baseline scenario. An example of surface velocities in the vicinity of the Project site is shown in Figure 8 during a 3.2 m ebb tide at the site. The figure shows surface velocities in the order of 1.5 m/s in the navigation channel, dropping to 0.4 – 0.6 m/s at the site of proposed marine jetty. Velocities on the shallow bar area downstream of the project are near zero. The surface velocities in Figure 8 represent surface velocities and are therefore cannot be compared directly to the depth-averaged statistics presented in Table 8.
14 August 2018 1314220049-123-R-Rev0
21
Figure 8: Surface velocity Map during 3.2 m ebb tide 2014-04-27, simulated under baseline conditions (source: Tetra Tech EBA, 2018)
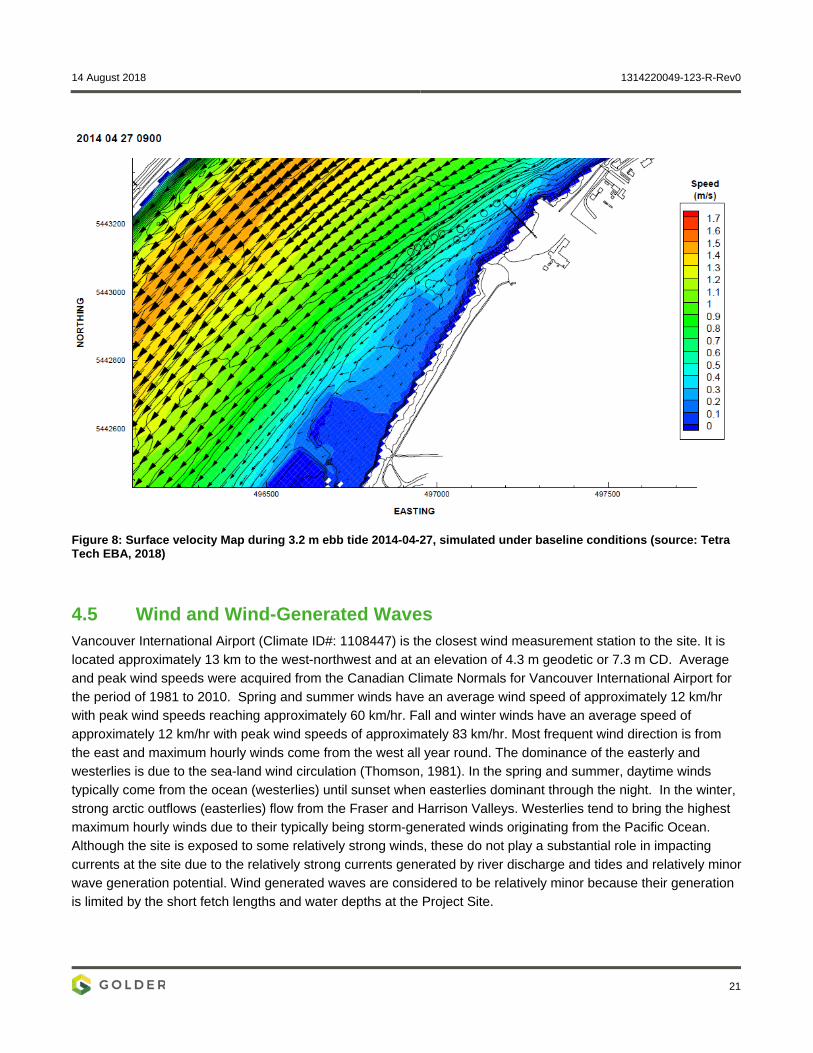
4.5 Wind and Wind-Generated Waves Vancouver International Airport (Climate ID#: 1108447) is the closest wind measurement station to the site. It is located approximately 13 km to the west-northwest and at an elevation of 4.3 m geodetic or 7.3 m CD. Average and peak wind speeds were acquired from the Canadian Climate Normals for Vancouver International Airport for the period of 1981 to 2010. Spring and summer winds have an average wind speed of approximately 12 km/hr with peak wind speeds reaching approximately 60 km/hr. Fall and winter winds have an average speed of approximately 12 km/hr with peak wind speeds of approximately 83 km/hr. Most frequent wind direction is from the east and maximum hourly winds come from the west all year round. The dominance of the easterly and westerlies is due to the sea-land wind circulation (Thomson, 1981). In the spring and summer, daytime winds typically come from the ocean (westerlies) until sunset when easterlies dominant through the night. In the winter, strong arctic outflows (easterlies) flow from the Fraser and Harrison Valleys. Westerlies tend to bring the highest maximum hourly winds due to their typically being storm-generated winds originating from the Pacific Ocean. Although the site is exposed to some relatively strong winds, these do not play a substantial role in impacting currents at the site due to the relatively strong currents generated by river discharge and tides and relatively minor wave generation potential. Wind generated waves are considered to be relatively minor because their generation is limited by the short fetch lengths and water depths at the Project Site.
14 August 2018 1314220049-123-R-Rev0
22
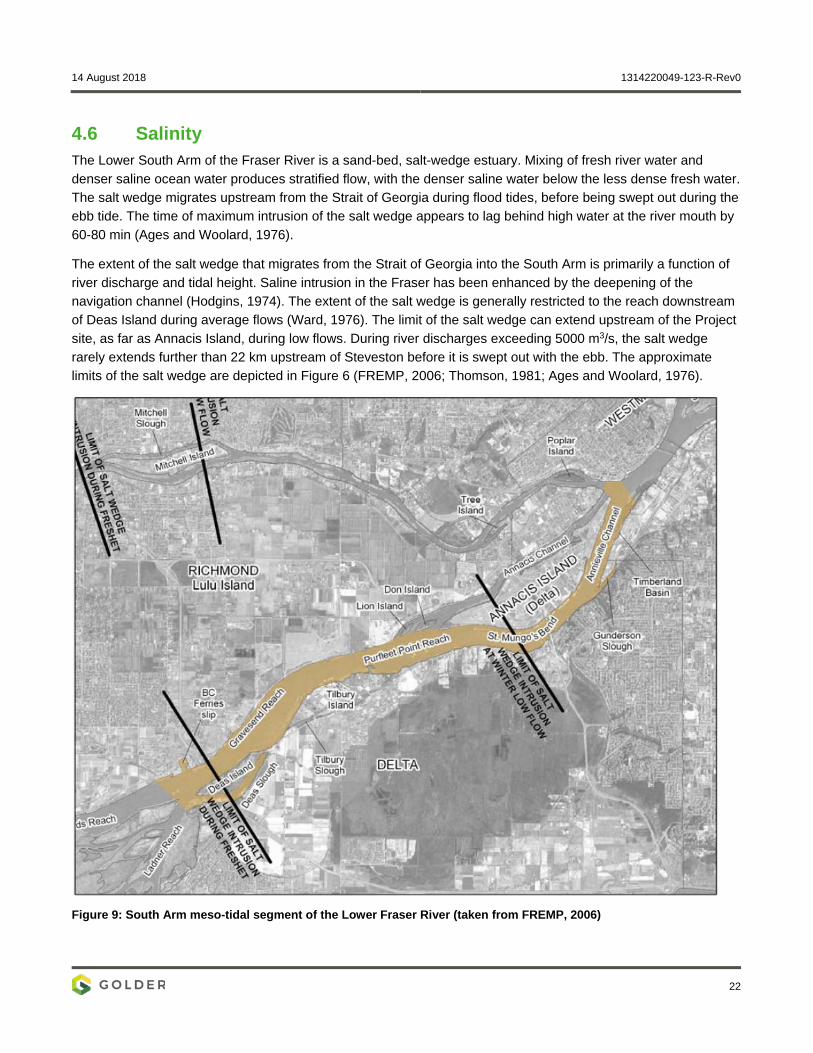
4.6 Salinity The Lower South Arm of the Fraser River is a sand-bed, salt-wedge estuary. Mixing of fresh river water and denser saline ocean water produces stratified flow, with the denser saline water below the less dense fresh water. The salt wedge migrates upstream from the Strait of Georgia during flood tides, before being swept out during the ebb tide. The time of maximum intrusion of the salt wedge appears to lag behind high water at the river mouth by 60-80 min (Ages and Woolard, 1976).
The extent of the salt wedge that migrates from the Strait of Georgia into the South Arm is primarily a function of river discharge and tidal height. Saline intrusion in the Fraser has been enhanced by the deepening of the navigation channel (Hodgins, 1974). The extent of the salt wedge is generally restricted to the reach downstream of Deas Island during average flows (Ward, 1976). The limit of the salt wedge can extend upstream of the Project site, as far as Annacis Island, during low flows. During river discharges exceeding 5000 m3/s, the salt wedge rarely extends further than 22 km upstream of Steveston before it is swept out with the ebb. The approximate limits of the salt wedge are depicted in Figure 6 (FREMP, 2006; Thomson, 1981; Ages and Woolard, 1976).
Figure 9: South Arm meso-tidal segment of the Lower Fraser River (taken from FREMP, 2006)
14 August 2018 1314220049-123-R-Rev0
23
Kostaschuk et al. (2004) examined the saltwater intrusion during high river discharge on the Fraser River estuary, concluding that the estuarine circulation behaves as a highly stratified salt-wedge with a distinct boundary between fresh and salt water. Kostaschuk and Luternauer (1998) also found that in the presence of the salt-wedge causes a weakening of currents in Fraser River. Small amounts of sand deposit at the tip of the salt-wedge with some mud settling to form a turbidity maximum. Most sediment is transported seaward in a low-energy plume. Freshet and other high discharge events, combined with low-tide, force the salt wedge out of the Lower Fraser channel. This produces strong currents and entrains large amounts of sand in suspension. On a large flood, a wedge of clear salty water will move up-river, beneath silty fresh water flowing downstream.
The salt wedge affects the mechanical deposition of suspended sediments. Its contribution to shoaling (deposition) is difficult to compare quantitatively with the tidal fluctuations in the river flow. At upstream limit of the salt wedge, the river flow is effectively stopped or reversed, thereby causing deposition of sediment (Hay & Company, 1995). It is therefore reasonable to assume that some deposition of sediment at Gravesend Reach is caused by the salt wedge.
14 August 2018 1314220049-123-R-Rev0
24
5.0 BASELINE SEDIMENT PROCESSES This section presents a summary of the baseline sediment processes in the RAA and LAA. Specifically, this section summarizes the bed material composition, mechanisms and modes of sediment transport, and baseline sediment loads based on turbidity and total suspended solids measurements in the river.
5.1 Bed Material Composition Throughout the interior plateau of British Columbia the Fraser River is classified as a bedrock river, meaning it has little to no sediment deposition. At Hope, where the floodplain widens and the slope gradient decreases, the Fraser becomes reclassified as an alluvial river, meaning it deposits sediment along its bed and banks. From Hope until its terminus in the Strait of Georgia, the Fraser can be sub-divided into three reaches based on bed material composition; a gravel-bedded reach, a sand-bedded reach, and a sand-mud delta reach (Attard et al. 2014).
Figure 10 shows the variation in bed material composition of the Fraser River, from Sand Heads to Hope (0 km to 160 km), based on the median (D50) grain diameter. Figure 10 illustrates that the transition from predominately sand-mud to sand bed occurs approximately 35 km upstream of Sand Heads, while the transition from predominately sand to gravel bed occurs approximately 100 km upstream of Sand Heads. The project is 22 km upstream where the bed material composition is a mixture of sand and silt. However, during an extensive sediment sampling campaign, conducted pre-freshet by McLaren (1995), it was shown that the bed material composition is not necessarily well defined in the project reach and fluctuates between sand and sand-mud (Figure 11). Although, with the onset of freshet the bed material composition is likely to transition to predominantly sand as the higher flows flush the small grain sized sediments downstream.
The bed material in the LAA is composed primarily of sand but can transition to sand-mud during low flows. As a result, the median sediment grain diameter changes seasonally. Numerous studies have been conducted to determine the sediment grain size distribution in the project reach and are summarized below:
Tywoniuk (1972) collected samples at Port Mann during January and June 1969 and found the median sediment grain size never exceeded 1 mm.
Tywoniuk (1972) claimed that clay and silt size particles (finer than 0.06 mm) made up only a small fraction of the bed material composition in the main channel as far downstream as Steveston.
The findings of Tywoniuk (1972) suggest that fine particles (silts and clays) are transported through the project reach and out to the Strait of Georgia.
Kostaschuk et al. (1989) undertook an extensive sampling program between Sand Heads and New Westminster in February 1988 and calculated an average median sediment grain size of 0.33 mm.
NHC (2002) found that no more than 20% of the sediment in the project reach exceeded 0.18 mm. This is in agreement with the bed material composition presented in Figure 10 as determined by Venditti and Church (2014).
NHC (2004) determined that the median sediment grain size at the Port Mann Bridge was 0.3 mm.

14 August 2018 1314220049-123-R-Rev0
25
Figure 10: Measured bed material composition for the Fraser River from Hope to Sand Heads during various flows. The dashed red lines denote (from left to right) the typical divisions between sand-mud, sand, and gravel (Venditti and Church, 2014).
Figure 11: Bed material composition in the Lower Fraser River, including the project reach, based on sediment In samples taken between Feb. 9 and April 7, 1993 (adapted from McLaren, 1995).
14 August 2018 1314220049-123-R-Rev0
26
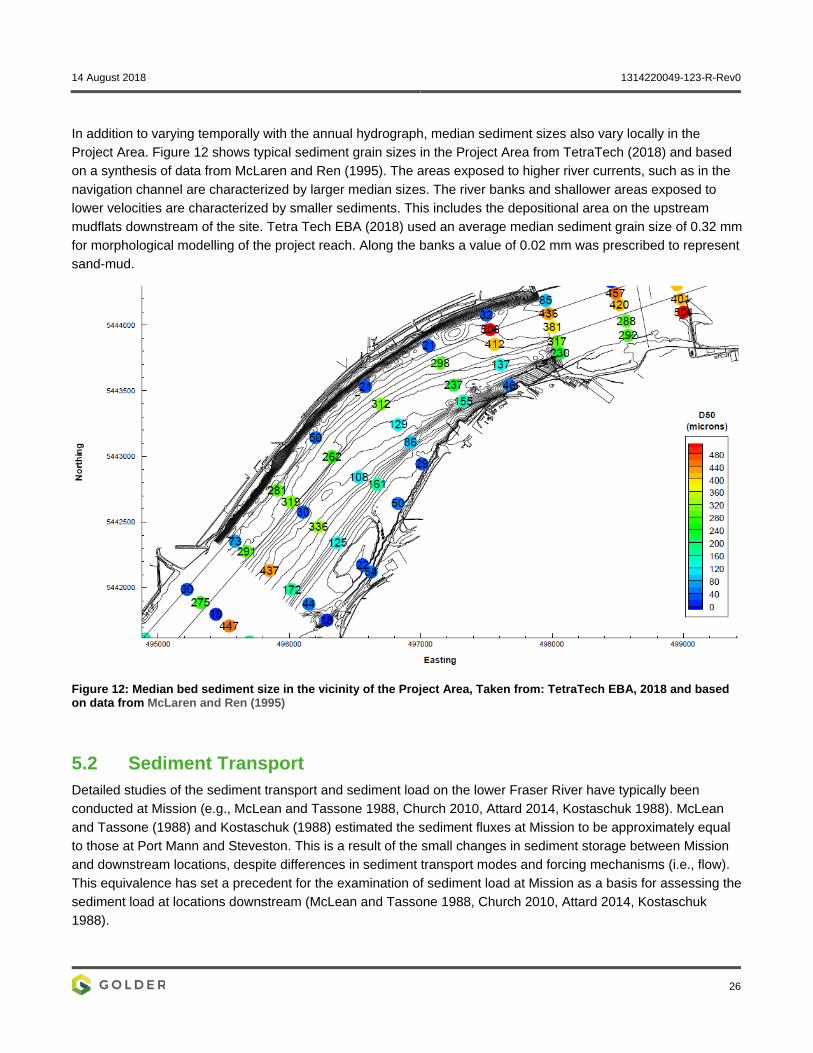
In addition to varying temporally with the annual hydrograph, median sediment sizes also vary locally in the Project Area. Figure 12 shows typical sediment grain sizes in the Project Area from TetraTech (2018) and based on a synthesis of data from McLaren and Ren (1995). The areas exposed to higher river currents, such as in the navigation channel are characterized by larger median sizes. The river banks and shallower areas exposed to lower velocities are characterized by smaller sediments. This includes the depositional area on the upstream mudflats downstream of the site. Tetra Tech EBA (2018) used an average median sediment grain size of 0.32 mm for morphological modelling of the project reach. Along the banks a value of 0.02 mm was prescribed to represent sand-mud.
Figure 12: Median bed sediment size in the vicinity of the Project Area, Taken from: TetraTech EBA, 2018 and based on data from McLaren and Ren (1995)
5.2 Sediment Transport Detailed studies of the sediment transport and sediment load on the lower Fraser River have typically been conducted at Mission (e.g., McLean and Tassone 1988, Church 2010, Attard 2014, Kostaschuk 1988). McLean and Tassone (1988) and Kostaschuk (1988) estimated the sediment fluxes at Mission to be approximately equal to those at Port Mann and Steveston. This is a result of the small changes in sediment storage between Mission and downstream locations, despite differences in sediment transport modes and forcing mechanisms (i.e., flow). This equivalence has set a precedent for the examination of sediment load at Mission as a basis for assessing the sediment load at locations downstream (McLean and Tassone 1988, Church 2010, Attard 2014, Kostaschuk 1988).
14 August 2018 1314220049-123-R-Rev0
27
Downstream of Mission, the river transports sand and finer materials only (Attard et al 2014). The annual total sediment load at Mission is estimated to be on the order of 17 Megatonnes (Mt) (McLean et al 1999), based on a 20-year data set (1966 – 1986). The total sediment load varies from year to year and seasonally. On an annual cycle the sediment transport is highest during the peak of the spring freshet and lowest during the low flow months. Although, rain events can generate sporadic spikes in the sediment transport rates during any month.
Over interannual time scales the sediment transport rate varies with the magnitude of the spring freshet. The annual total sediment load at Mission between 1966 and 1986 varied between 8.1 and 31 Mt. During the 2010 spring freshet, which had a peak discharge approximately 20% below average, the total sediment load at Mission was estimated to be 7.2 Mt (Attard et al. 2014). It is believed that during an annual cycle approximately 90% of the total sediment load passes through the South Arm of the Fraser River, and hence the project reach (Church et al. 1990).
The approximate distribution of the average total annual sediment load by grain size at Mission was estimated by McLean et al (1999) and is presented in Table 9. The load occurring in each material size class is expressed as a percentage of the total sediment load.
Table 9: Average Grain Size distribution at Mission (Source: McLean et al. 1999)
Grain Size (mm) Annual average sediment load (Mt)
Percentage of Total Sediment Load
Clay 2.7 Mt 16%
Silt 8.3 Mt 48%
Sand (< 0.177 mm) 3.0 Mt 18%
Sand (> 0.177 mm) 3.1 Mt 18%
Total 17 Mt 100%
The Fraser River transports sediment via two mechanisms: bed load and suspended load. The suspended load refers to sediment transported in suspension in the flow. Bed load refers to particles transported via rolling, sliding and intermittent resuspension near the bed. Most of the sediment load at Mission is transported as suspended load with coarser sands (> 0.177 mm) being transported as both suspended and bed load (Attard et al. 2014, McLean et al. 1999).
In the project reach, coarser sands are the primary driver of morphological changes. Sediments less than 0.177 mm (i.e., fine sands, silts, and clays) are carried mainly in suspended load throughout most of the Fraser, and thus more likely to be transported to the Fraser delta and into the Strait of Georgia. During low flow periods the bed load may be comprised of finer particles, leading to the deposition of sand-mud and mud along the banks, though the total sediment transport rate during this time frame is generally small in comparison to the freshet.
At Mission the bed material load makes up roughly 20% of the total annual sediment load, with an annual average bed material load of 3.1 Mt. The bed material load between 1966 and 1986 varied between 1.1 and 8.5 Mt (McLean et al 1999). During higher flows (>1000 m3/s), roughly 97% of the annual total sand transport occurs, and 87% of that occurs during the three months surrounding spring freshet. Additionally, resuspension of bed
14 August 2018 1314220049-123-R-Rev0
28
material in the form of sand occurs primarily at flows exceeding approximately 5000 m3/s (Attard et al 2014). This suggests that the movement of coarse sand material and consequently changes in morphology is most prevalent during high flows (i.e., spring freshets).
5.3 Turbidity Measurements of turbidity and total suspended solids (TSS) in the LAA, approximately 22 km upstream of Sand Heads, during the period 2012 to 2018 provide an indication of the baseline sediment load, in terms of turbidity and total suspended solids (TSS), and forcing mechanisms at the project site. A real-time water quality buoy on the Fraser River (49.148 N, -123.039 W), developed and maintained by Environment Canada and Climate Change (ECCC), provides hourly averaged measurements of conductivity (i.e., salinity) and turbidity, as well as other parameters, at approximately 1 m below the water surface. The above measurements are collected using a YSI 6600 V2 Water Quality Sonde which has a turbidity range of 0 to 1000 NTU and is equipped with a wiper on the turbidity sensor to prevent biofouling (Ethier and Bedard, 2007). Turbidity values greater than 1000 NTU were filtered from the data.
TSS was sampled near the ECCC buoy at approximately 0 to 1 m below the water surface on sporadic intervals during the 2012 to 2018 period. Additionally, a record of the discharge at Hope and water level at Port Mann, provided by Water Survey of Canada (WSC), and the maintenance dredging conducted in the Gravesend Reach (18 km to 24 km upstream of Sandheads) and Purfleet Reach (24 km to 27 km upstream of Sandheads) by Fraser River Pile and Dredge (FRPD) was collected.
Figure 13 shows the inter-annual variation in turbidity and TSS in relation to discharge and tidal forcing and Figure 14 shows a one month inset of the time series in Figure 13 from January 20 to February 20, 2016.
In general the annual turbidity and TSS maxima occur just before the peak in the annual freshet as finer particles on the bed become mobile and are entrained into the washload. At peak flow the bed has generally been stripped of the most mobile sediments resulting in bed armouring (i.e., coarse sediments) which prevents a further rise in turbidity or TSS (Venditti, 2016). During the annual freshet the diurnal variation in turbidity is generally low, but outside of freshet, when discharge at Hope drops below approximately 5000 m3/s, the variation in diurnal turbidity increases (Figure 14). This is largely due to the relative increase in tidal influence, indicated by an increase in conductivity (i.e., salinity), that is non-existent or minimal at the project site during high flows. This diurnal variation is generally between 10 and 30 NTU, but can be higher during large spring tide events. Additionally, the typical annual range of turbidity is between 10 and 100 NTU, but during strong tidal flows (i.e., increase conductivity) the turbidity and TSS measurements can spike above 100 NTU or 100 mg/L, respectively.
The periods of dredging activity upstream of the EC Buoy since 2015 are shown to generally take place during low flows, when the diurnal variation in turbidity and TSS is highest (Figure 14). During dredging periods there is a strong correlation between tidal flow, shown as an oscillation of conductivity and water levels, and turbidity and TSS. Additionally, increases in river discharge, such as that shown to start on January 28, have the potential to create multiday spikes in turbidity and TSS (i.e., Feburary 01 spike). Figure 14 shows two distinct dredging periods. In both events the potential increase in turbidity and TSS resulting from dredging cannot be distinguished from the discharge and tidally driven turbidity and TSS variations.
14 August 2018 1314220049-123-R-Rev0
29
Figure 15 shows the measured TSS near the surface under varying river discharge for periods within and outside known dredging for the Gravesend Reach and Purfleet Reach. It is likely that this near surface measurement is an underestimate of the TSS in the river at that time. This is due to the measurement being taken outside of the navigation channel, the location of highest flows, and at the surface (i.e., greatest distance from bottom sediments).
Additionally, the estimated TSS, treated as fine sediments, under varying discharge and generated by historical Trailing Suction Hopper Dredging (TSHD) is calculated and shown as an area integrated value (Appendix B). It is likely that this empirical estimate is an overestimate of TSS in the river at any given discharge. This is due to the estimate assuming a uniform TSS concentration, spread only in the navigation channel (i.e., area of dredging), and under generalized mixing conditions (Appendix B).
During periods of high flow (>3000 m3/s) the potential historical dredging generated TSS is significantly less relative to measured values of TSS. At low flows (<3000 m3/s) the potential historical dredging generated TSS and measured TSS are of the same order, suggesting that historical dredging may not be inconsequential to TSS levels.
Figure 13: Turbidity and conductivity measured onboard the EC buoy, TSS measured as grab samples near the EC buoy, and river discharge measured at Hope is shown for the period 2012 to 2018. Periods of dredging in the Gravesend Reach and Purfleet Reach are shown for the period 2015 to 2018.
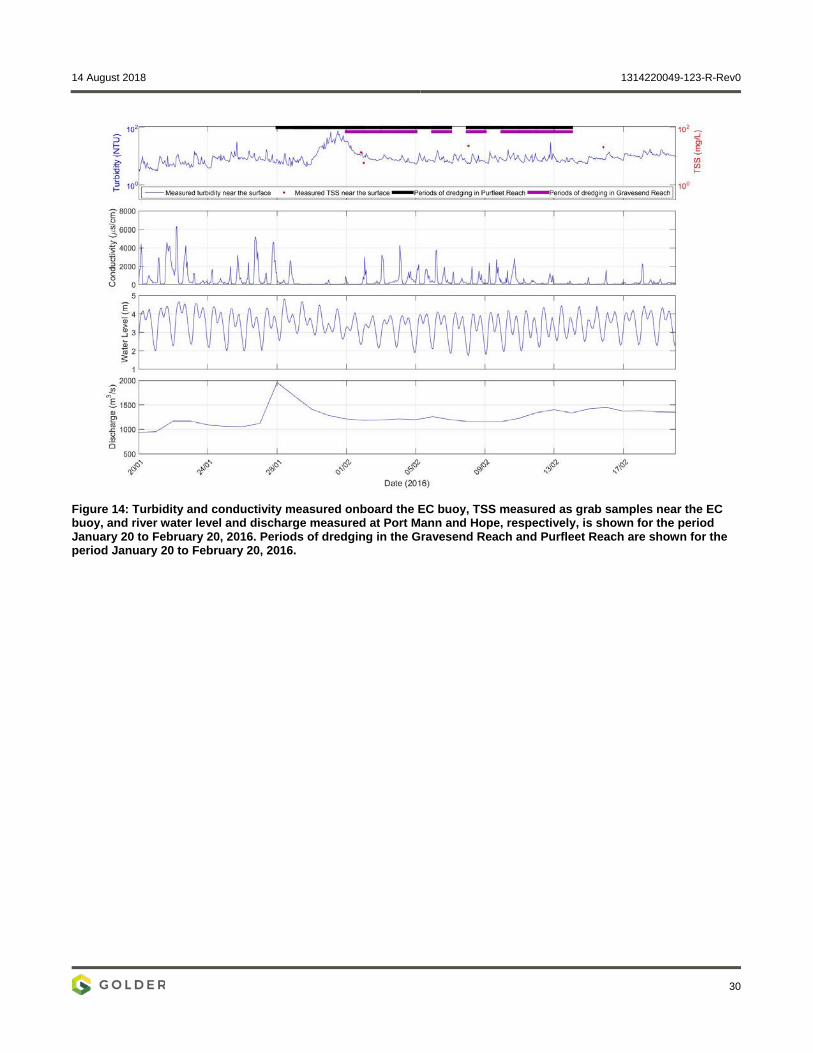
14 August 2018 1314220049-123-R-Rev0
30
Figure 14: Turbidity and conductivity measured onboard the EC buoy, TSS measured as grab samples near the EC buoy, and river water level and discharge measured at Port Mann and Hope, respectively, is shown for the period January 20 to February 20, 2016. Periods of dredging in the Gravesend Reach and Purfleet Reach are shown for the period January 20 to February 20, 2016.
14 August 2018 1314220049-123-R-Rev0
31
Figure 15: TSS measured near the surface under varying river discharge for the period 2012 to 2018 within and outside periods of known dredging (2015 to 2018). Estimated TSS for historic dredging using an area integrated source term
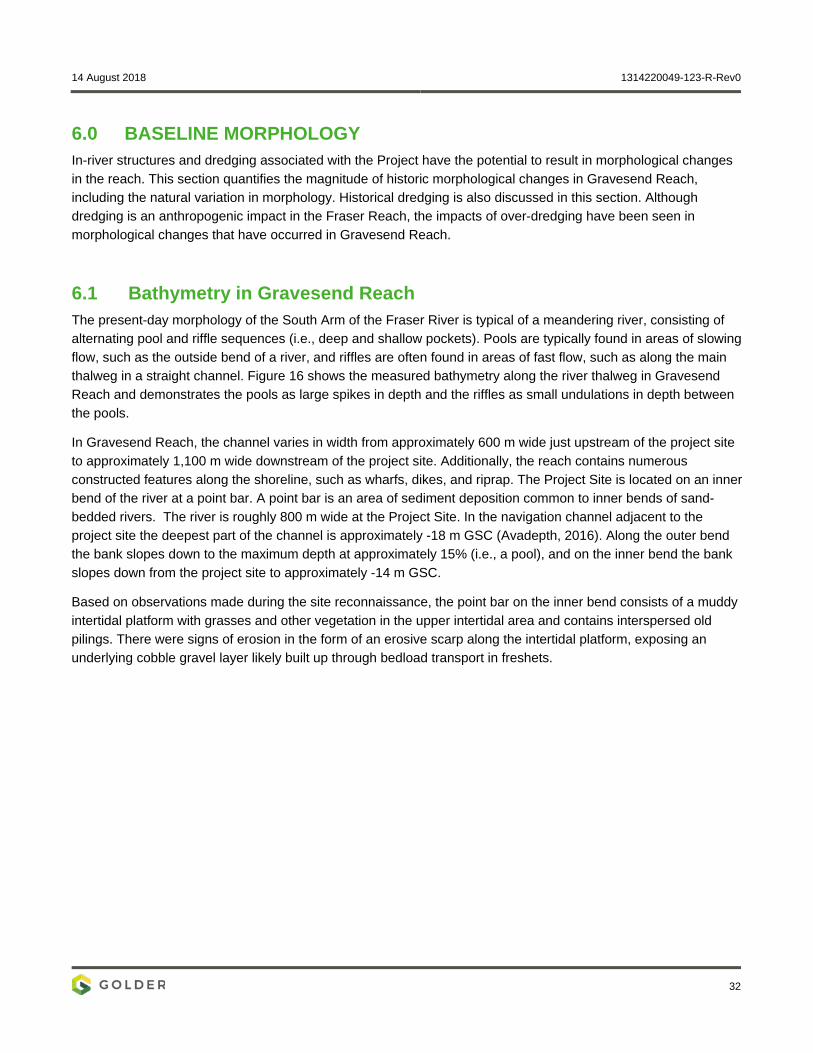
14 August 2018 1314220049-123-R-Rev0
32
6.0 BASELINE MORPHOLOGY In-river structures and dredging associated with the Project have the potential to result in morphological changes in the reach. This section quantifies the magnitude of historic morphological changes in Gravesend Reach, including the natural variation in morphology. Historical dredging is also discussed in this section. Although dredging is an anthropogenic impact in the Fraser Reach, the impacts of over-dredging have been seen in morphological changes that have occurred in Gravesend Reach.
6.1 Bathymetry in Gravesend Reach The present-day morphology of the South Arm of the Fraser River is typical of a meandering river, consisting of alternating pool and riffle sequences (i.e., deep and shallow pockets). Pools are typically found in areas of slowing flow, such as the outside bend of a river, and riffles are often found in areas of fast flow, such as along the main thalweg in a straight channel. Figure 16 shows the measured bathymetry along the river thalweg in Gravesend Reach and demonstrates the pools as large spikes in depth and the riffles as small undulations in depth between the pools.
In Gravesend Reach, the channel varies in width from approximately 600 m wide just upstream of the project site to approximately 1,100 m wide downstream of the project site. Additionally, the reach contains numerous constructed features along the shoreline, such as wharfs, dikes, and riprap. The Project Site is located on an inner bend of the river at a point bar. A point bar is an area of sediment deposition common to inner bends of sand-bedded rivers. The river is roughly 800 m wide at the Project Site. In the navigation channel adjacent to the project site the deepest part of the channel is approximately -18 m GSC (Avadepth, 2016). Along the outer bend the bank slopes down to the maximum depth at approximately 15% (i.e., a pool), and on the inner bend the bank slopes down from the project site to approximately -14 m GSC.
Based on observations made during the site reconnaissance, the point bar on the inner bend consists of a muddy intertidal platform with grasses and other vegetation in the upper intertidal area and contains interspersed old pilings. There were signs of erosion in the form of an erosive scarp along the intertidal platform, exposing an underlying cobble gravel layer likely built up through bedload transport in freshets.
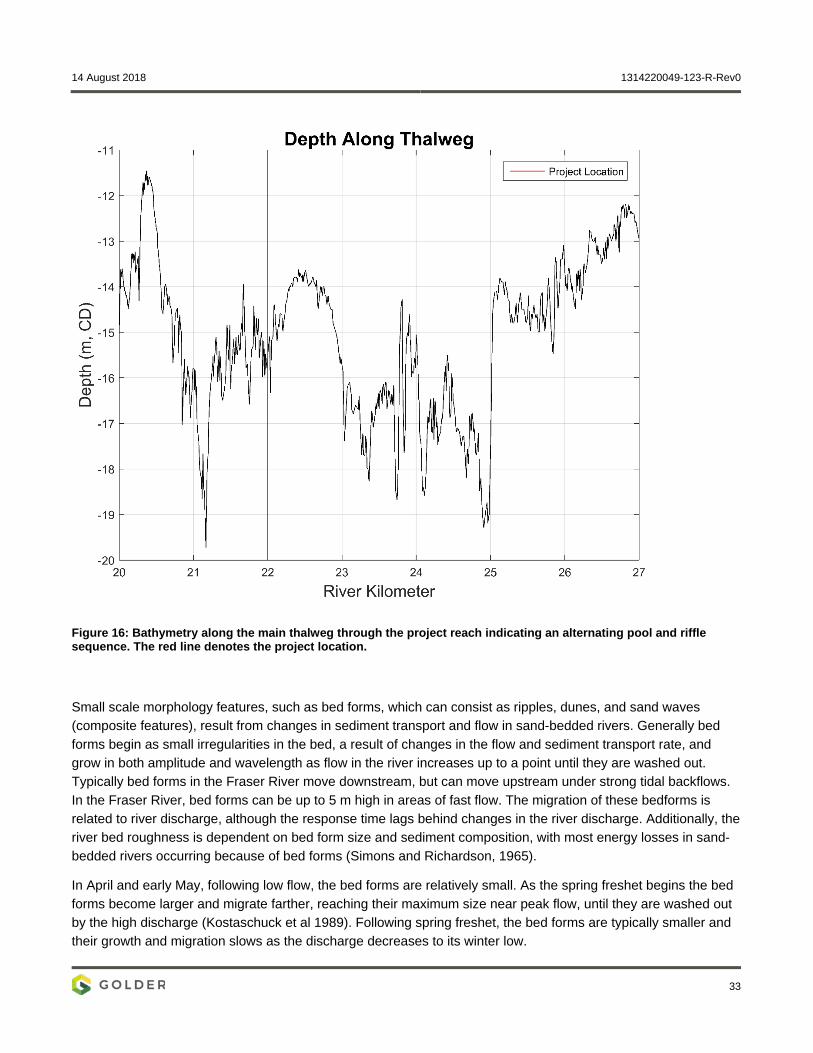
14 August 2018 1314220049-123-R-Rev0
33
Figure 16: Bathymetry along the main thalweg through the project reach indicating an alternating pool and riffle sequence. The red line denotes the project location.
Small scale morphology features, such as bed forms, which can consist as ripples, dunes, and sand waves (composite features), result from changes in sediment transport and flow in sand-bedded rivers. Generally bed forms begin as small irregularities in the bed, a result of changes in the flow and sediment transport rate, and grow in both amplitude and wavelength as flow in the river increases up to a point until they are washed out. Typically bed forms in the Fraser River move downstream, but can move upstream under strong tidal backflows. In the Fraser River, bed forms can be up to 5 m high in areas of fast flow. The migration of these bedforms is related to river discharge, although the response time lags behind changes in the river discharge. Additionally, the river bed roughness is dependent on bed form size and sediment composition, with most energy losses in sand-bedded rivers occurring because of bed forms (Simons and Richardson, 1965).
In April and early May, following low flow, the bed forms are relatively small. As the spring freshet begins the bed forms become larger and migrate farther, reaching their maximum size near peak flow, until they are washed out by the high discharge (Kostaschuck et al 1989). Following spring freshet, the bed forms are typically smaller and their growth and migration slows as the discharge decreases to its winter low.
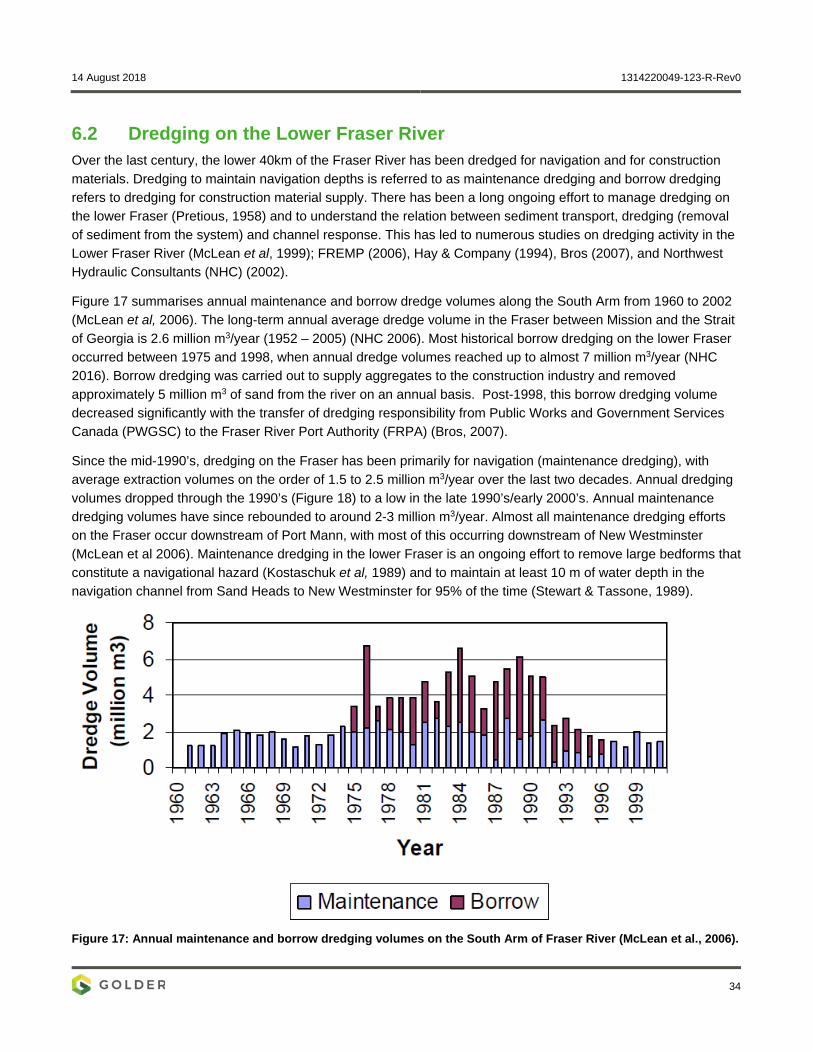
14 August 2018 1314220049-123-R-Rev0
34
6.2 Dredging on the Lower Fraser River Over the last century, the lower 40km of the Fraser River has been dredged for navigation and for construction materials. Dredging to maintain navigation depths is referred to as maintenance dredging and borrow dredging refers to dredging for construction material supply. There has been a long ongoing effort to manage dredging on the lower Fraser (Pretious, 1958) and to understand the relation between sediment transport, dredging (removal of sediment from the system) and channel response. This has led to numerous studies on dredging activity in the Lower Fraser River (McLean et al, 1999); FREMP (2006), Hay & Company (1994), Bros (2007), and Northwest Hydraulic Consultants (NHC) (2002).
Figure 17 summarises annual maintenance and borrow dredge volumes along the South Arm from 1960 to 2002 (McLean et al, 2006). The long-term annual average dredge volume in the Fraser between Mission and the Strait of Georgia is 2.6 million m3/year (1952 – 2005) (NHC 2006). Most historical borrow dredging on the lower Fraser occurred between 1975 and 1998, when annual dredge volumes reached up to almost 7 million m3/year (NHC 2016). Borrow dredging was carried out to supply aggregates to the construction industry and removed approximately 5 million m3 of sand from the river on an annual basis. Post-1998, this borrow dredging volume decreased significantly with the transfer of dredging responsibility from Public Works and Government Services Canada (PWGSC) to the Fraser River Port Authority (FRPA) (Bros, 2007).
Since the mid-1990’s, dredging on the Fraser has been primarily for navigation (maintenance dredging), with average extraction volumes on the order of 1.5 to 2.5 million m3/year over the last two decades. Annual dredging volumes dropped through the 1990’s (Figure 18) to a low in the late 1990’s/early 2000’s. Annual maintenance dredging volumes have since rebounded to around 2-3 million m3/year. Almost all maintenance dredging efforts on the Fraser occur downstream of Port Mann, with most of this occurring downstream of New Westminster (McLean et al 2006). Maintenance dredging in the lower Fraser is an ongoing effort to remove large bedforms that constitute a navigational hazard (Kostaschuk et al, 1989) and to maintain at least 10 m of water depth in the navigation channel from Sand Heads to New Westminster for 95% of the time (Stewart & Tassone, 1989).
Figure 17: Annual maintenance and borrow dredging volumes on the South Arm of Fraser River (McLean et al., 2006).
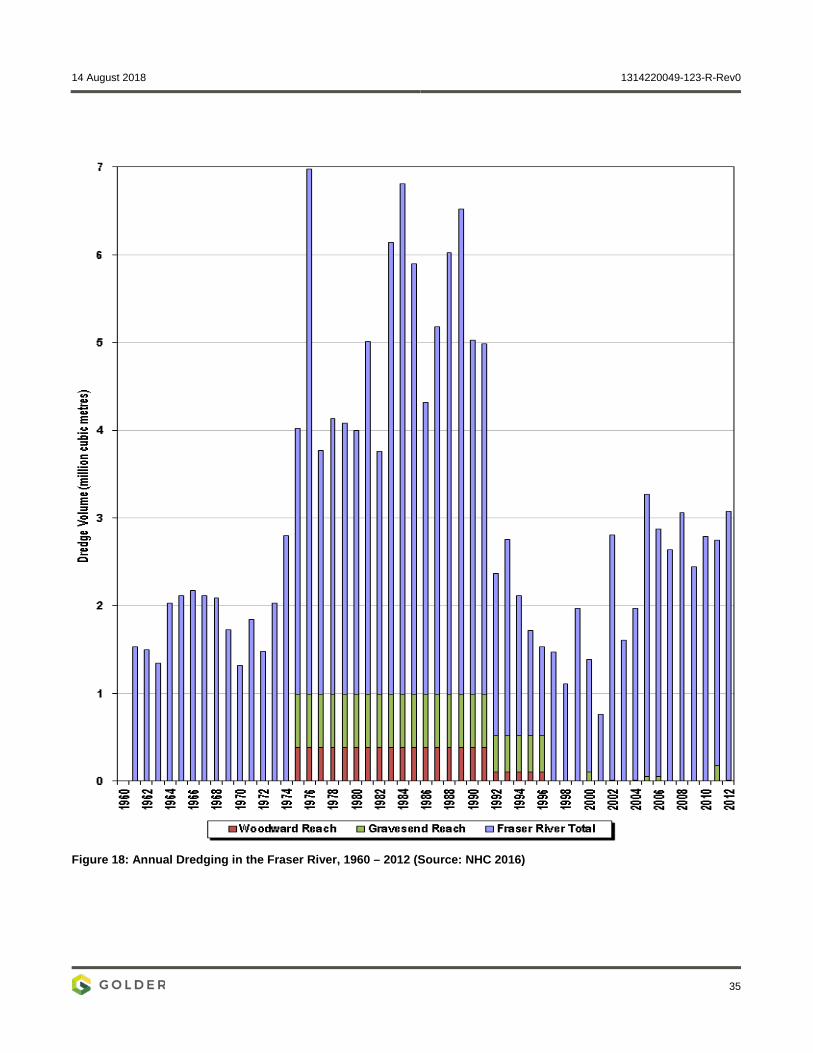
14 August 2018 1314220049-123-R-Rev0
35
Figure 18: Annual Dredging in the Fraser River, 1960 – 2012 (Source: NHC 2016)
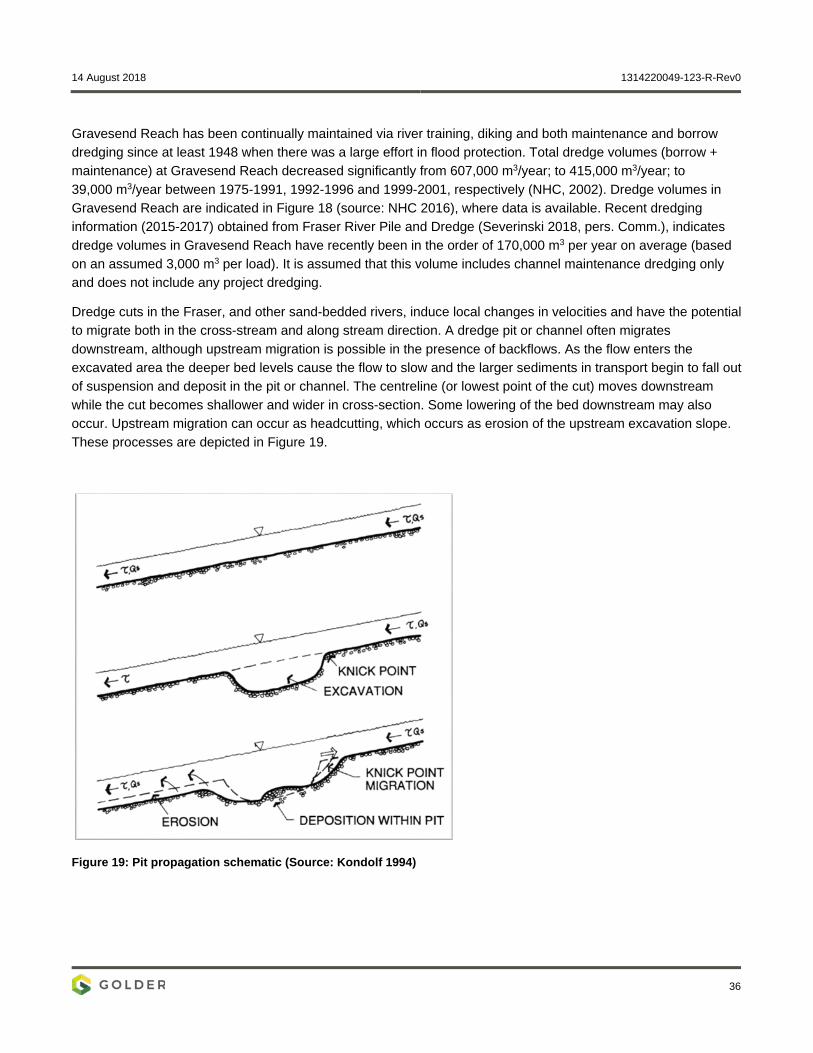
14 August 2018 1314220049-123-R-Rev0
36
Gravesend Reach has been continually maintained via river training, diking and both maintenance and borrow dredging since at least 1948 when there was a large effort in flood protection. Total dredge volumes (borrow + maintenance) at Gravesend Reach decreased significantly from 607,000 m3/year; to 415,000 m3/year; to 39,000 m3/year between 1975-1991, 1992-1996 and 1999-2001, respectively (NHC, 2002). Dredge volumes in Gravesend Reach are indicated in Figure 18 (source: NHC 2016), where data is available. Recent dredging information (2015-2017) obtained from Fraser River Pile and Dredge (Severinski 2018, pers. Comm.), indicates dredge volumes in Gravesend Reach have recently been in the order of 170,000 m3 per year on average (based on an assumed 3,000 m3 per load). It is assumed that this volume includes channel maintenance dredging only and does not include any project dredging.
Dredge cuts in the Fraser, and other sand-bedded rivers, induce local changes in velocities and have the potential to migrate both in the cross-stream and along stream direction. A dredge pit or channel often migrates downstream, although upstream migration is possible in the presence of backflows. As the flow enters the excavated area the deeper bed levels cause the flow to slow and the larger sediments in transport begin to fall out of suspension and deposit in the pit or channel. The centreline (or lowest point of the cut) moves downstream while the cut becomes shallower and wider in cross-section. Some lowering of the bed downstream may also occur. Upstream migration can occur as headcutting, which occurs as erosion of the upstream excavation slope. These processes are depicted in Figure 19.
Figure 19: Pit propagation schematic (Source: Kondolf 1994)
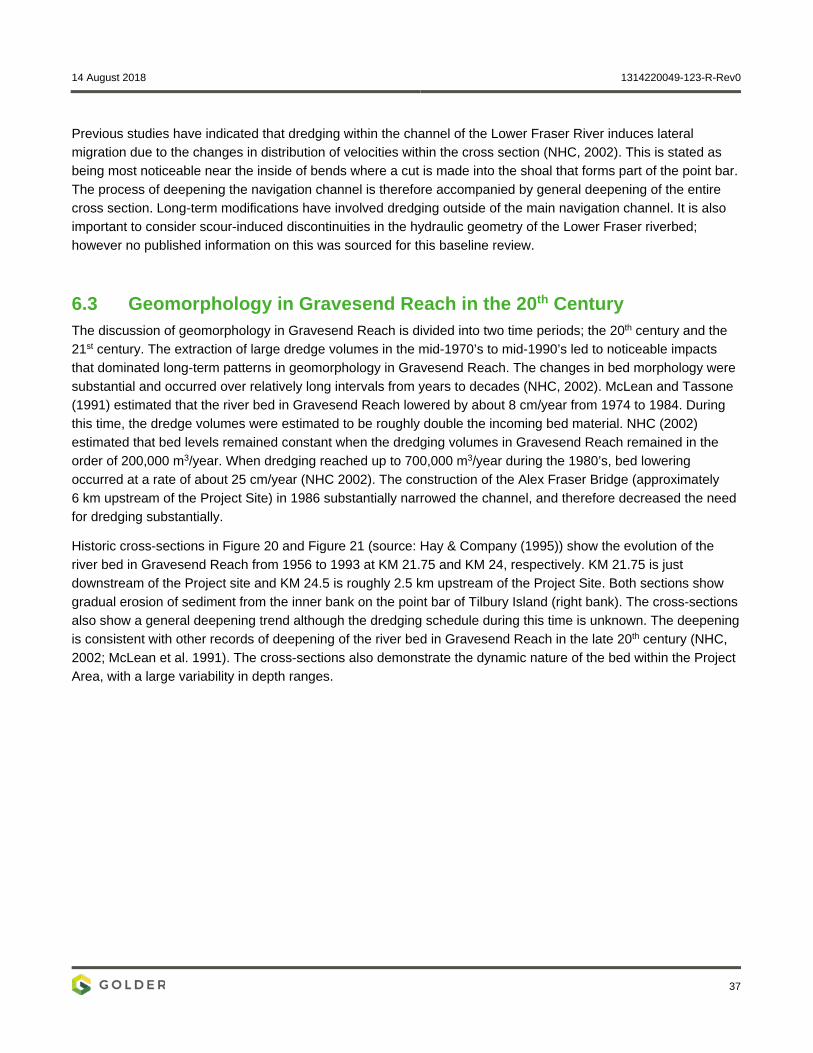
14 August 2018 1314220049-123-R-Rev0
37
Previous studies have indicated that dredging within the channel of the Lower Fraser River induces lateral migration due to the changes in distribution of velocities within the cross section (NHC, 2002). This is stated as being most noticeable near the inside of bends where a cut is made into the shoal that forms part of the point bar. The process of deepening the navigation channel is therefore accompanied by general deepening of the entire cross section. Long-term modifications have involved dredging outside of the main navigation channel. It is also important to consider scour-induced discontinuities in the hydraulic geometry of the Lower Fraser riverbed; however no published information on this was sourced for this baseline review.
6.3 Geomorphology in Gravesend Reach in the 20th Century The discussion of geomorphology in Gravesend Reach is divided into two time periods; the 20th century and the 21st century. The extraction of large dredge volumes in the mid-1970’s to mid-1990’s led to noticeable impacts that dominated long-term patterns in geomorphology in Gravesend Reach. The changes in bed morphology were substantial and occurred over relatively long intervals from years to decades (NHC, 2002). McLean and Tassone (1991) estimated that the river bed in Gravesend Reach lowered by about 8 cm/year from 1974 to 1984. During this time, the dredge volumes were estimated to be roughly double the incoming bed material. NHC (2002) estimated that bed levels remained constant when the dredging volumes in Gravesend Reach remained in the order of 200,000 m3/year. When dredging reached up to 700,000 m3/year during the 1980’s, bed lowering occurred at a rate of about 25 cm/year (NHC 2002). The construction of the Alex Fraser Bridge (approximately 6 km upstream of the Project Site) in 1986 substantially narrowed the channel, and therefore decreased the need for dredging substantially.
Historic cross-sections in Figure 20 and Figure 21 (source: Hay & Company (1995)) show the evolution of the river bed in Gravesend Reach from 1956 to 1993 at KM 21.75 and KM 24, respectively. KM 21.75 is just downstream of the Project site and KM 24.5 is roughly 2.5 km upstream of the Project Site. Both sections show gradual erosion of sediment from the inner bank on the point bar of Tilbury Island (right bank). The cross-sections also show a general deepening trend although the dredging schedule during this time is unknown. The deepening is consistent with other records of deepening of the river bed in Gravesend Reach in the late 20th century (NHC, 2002; McLean et al. 1991). The cross-sections also demonstrate the dynamic nature of the bed within the Project Area, with a large variability in depth ranges.
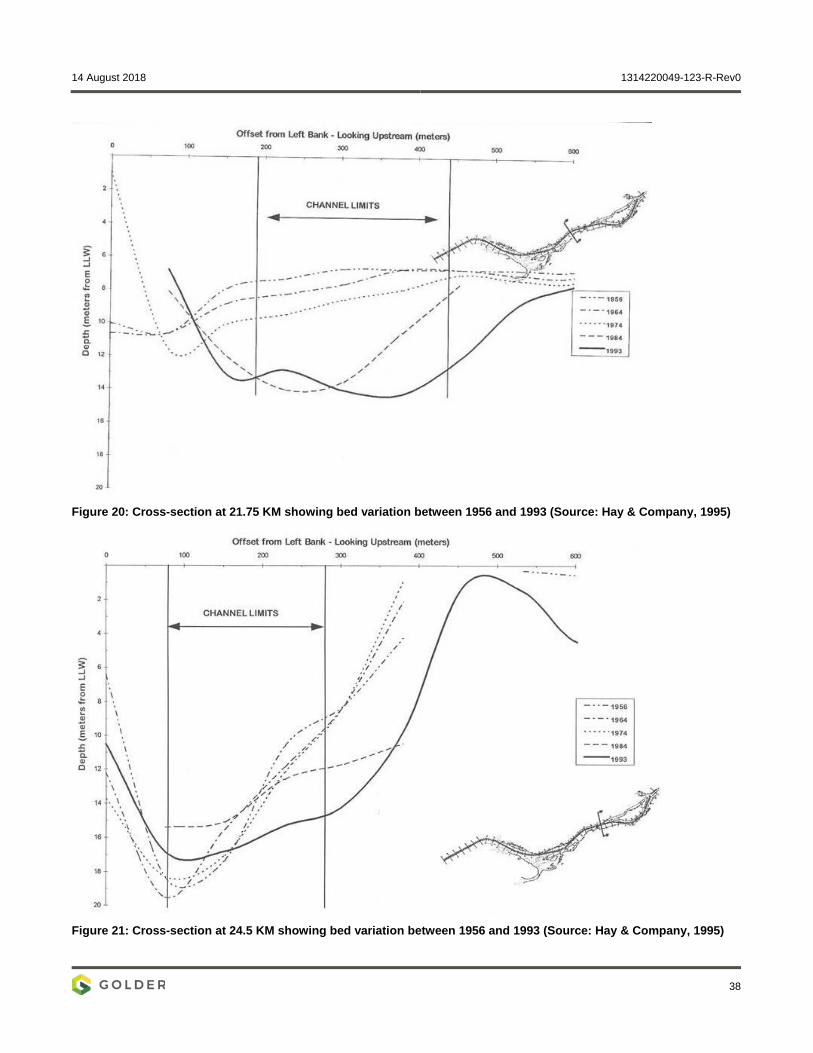
14 August 2018 1314220049-123-R-Rev0
38
Figure 20: Cross-section at 21.75 KM showing bed variation between 1956 and 1993 (Source: Hay & Company, 1995)
Figure 21: Cross-section at 24.5 KM showing bed variation between 1956 and 1993 (Source: Hay & Company, 1995)
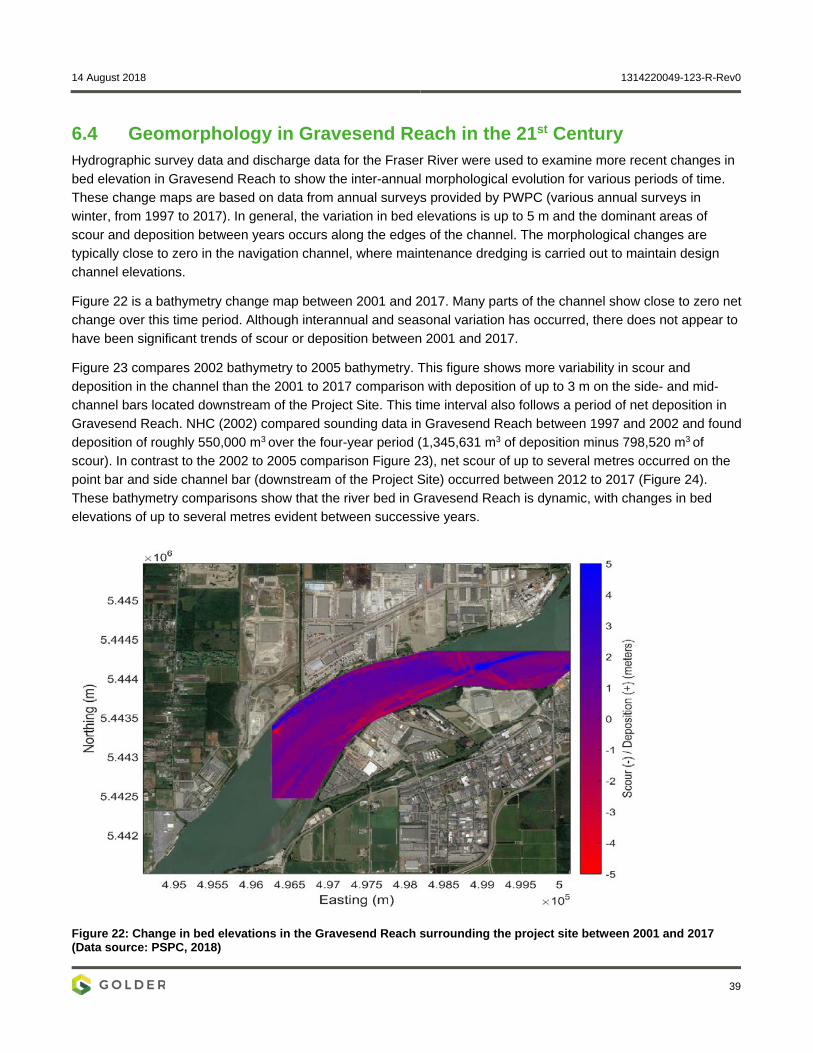
14 August 2018 1314220049-123-R-Rev0
39
6.4 Geomorphology in Gravesend Reach in the 21st Century Hydrographic survey data and discharge data for the Fraser River were used to examine more recent changes in bed elevation in Gravesend Reach to show the inter-annual morphological evolution for various periods of time. These change maps are based on data from annual surveys provided by PWPC (various annual surveys in winter, from 1997 to 2017). In general, the variation in bed elevations is up to 5 m and the dominant areas of scour and deposition between years occurs along the edges of the channel. The morphological changes are typically close to zero in the navigation channel, where maintenance dredging is carried out to maintain design channel elevations.
Figure 22 is a bathymetry change map between 2001 and 2017. Many parts of the channel show close to zero net change over this time period. Although interannual and seasonal variation has occurred, there does not appear to have been significant trends of scour or deposition between 2001 and 2017.
Figure 23 compares 2002 bathymetry to 2005 bathymetry. This figure shows more variability in scour and deposition in the channel than the 2001 to 2017 comparison with deposition of up to 3 m on the side- and mid-channel bars located downstream of the Project Site. This time interval also follows a period of net deposition in Gravesend Reach. NHC (2002) compared sounding data in Gravesend Reach between 1997 and 2002 and found deposition of roughly 550,000 m3 over the four-year period (1,345,631 m3 of deposition minus 798,520 m3 of scour). In contrast to the 2002 to 2005 comparison Figure 23), net scour of up to several metres occurred on the point bar and side channel bar (downstream of the Project Site) occurred between 2012 to 2017 (Figure 24). These bathymetry comparisons show that the river bed in Gravesend Reach is dynamic, with changes in bed elevations of up to several metres evident between successive years.
Figure 22: Change in bed elevations in the Gravesend Reach surrounding the project site between 2001 and 2017 (Data source: PSPC, 2018)
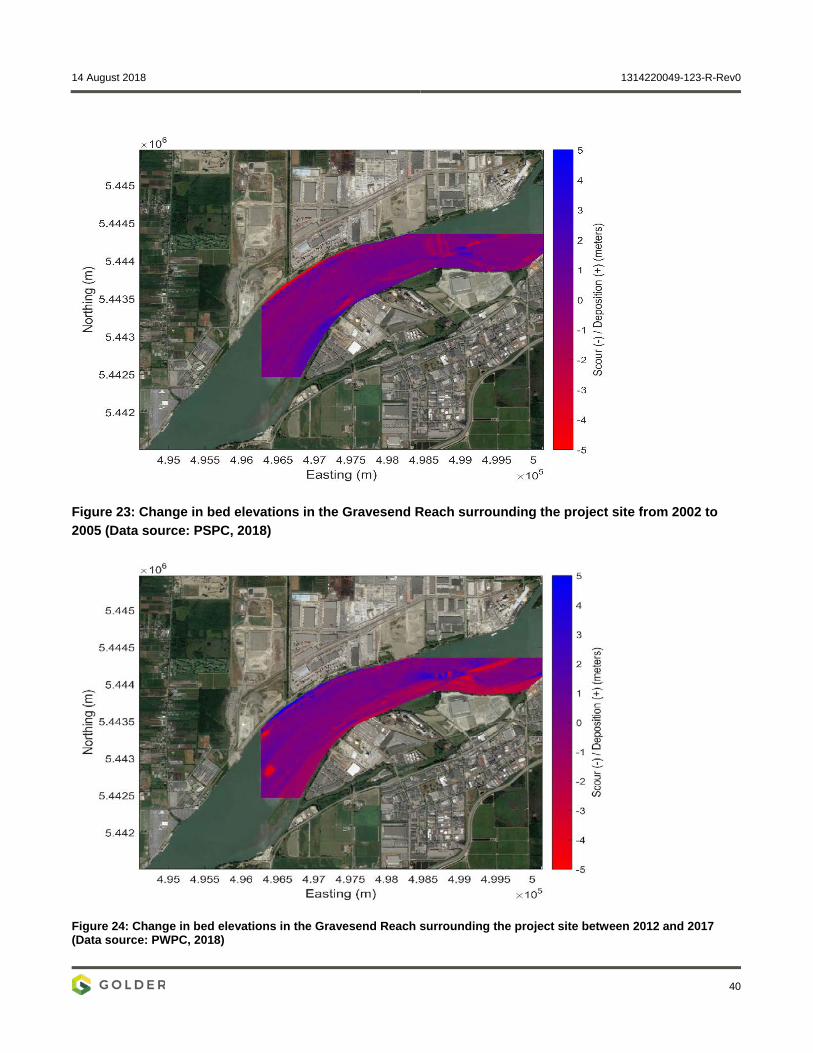
14 August 2018 1314220049-123-R-Rev0
40
Figure 23: Change in bed elevations in the Gravesend Reach surrounding the project site from 2002 to 2005 (Data source: PSPC, 2018)
Figure 24: Change in bed elevations in the Gravesend Reach surrounding the project site between 2012 and 2017 (Data source: PWPC, 2018)
14 August 2018 1314220049-123-R-Rev0
41
7.0 OTHER ANTHROPOGENIC IMPACTS IN GRAVESEND REACH This section provides an overview of the anthropogenic impacts that have resulted from human activities that have occurred in the recent history of the river. Historic and ongoing anthropogenic activities continue to influence baseline sediment processes, river currents and geomorphology in the LAA.
Dredging is also considered a key anthropogenic activity that continues to influence river processes in the LAA. Dredging was presented in Section 6.2 because historic dredging activities have been closely tied to observed geomorphological changes in Gravesend Reach.
7.1 Changes in Fluvial Morphology and Anthropogenic Land Use This section presents a summary of the significant historical hydraulic and sedimentation events in the lower Fraser River and key changes in land use at the site.
The growth of the river-based industry that has occurred since the early 1900’s led to the construction of river facilities and river modifications. Construction of diking around the South Arm has been ongoing since 1906 (Richmond, 2000). This diking was intended to prevent the flooding of the upper delta plain and protected houses, farmland and other infrastructure. The flooding regime in deltaic environments is a naturally occurring mechanism for continued sediment deposition which acts to counterbalance subsidence or settlement and can contribute to aggradation. This flooding regime on the Fraser River delta has been disturbed. For approximately the last 100 years this natural process of sediment replenishment by flooding has been interrupted by diking and channel training works therefore contributing to the measured changes in elevation being experienced on the delta.
In addition to the constructed dykes, infrastructure built in the lower Fraser River has consisted of river training infrastructure and channelization devices. The trifurcation at New Westminster was completed in approximately 1975, after which 85% of the flow and sediment load was transported in the South Arm (Milliman, 1980, Thomson 1981). 15% of the Fraser River flow is transported through the North Arm, up from 10% historically, of which 5% is diverted through the Middle Arm. This increase in flow has reduced sediment deposition within the North Arm channel and increased deposition at the North Arm mouth (FREMP, 2006).
A review of historical aerial photographs in the vicinity of the Project Site was used to document anthropogenic land use and fluvial morphology changes that have occurred at the Project site and surrounding area. Historical aerial photographs were obtained from University of British Columbia (UBC). The historical air photos were examined to identify and assess changes in fluvial geomorphology and anthropogenic land use change within the Project Area, from Deas Island to the western and downstream tip of Annacis Island. The air photos spanned 71 years (1938 to 2009) and were taken at a variety of heights, limiting the resolution of observable changes. The air photo observations and interpretations are summarized in Table 10. Features localized to the site can be found in Figure 2. Where exact dates of images are unknown, the year the photograph was taken is provided.
Table 10 also summarizes in chronological order recorded major events key hydraulic and sedimentation events in the lower Fraser River that have influenced morphology at the site. This summary, in addition to the aerial photography assessment, provides meaningful insight in assessing geomorphic change in the Fraser River in the vicinity of the Project and understanding the influences of both natural and anthropogenic changes to River Processes.

14 August 2018 1314220049-123-R-Rev0
42
Table 10: Summary of aerial photography interpretations at the Project site and historical hydraulic and sedimentation events in the Fraser River
Date Event / Site Description Reference
Site Description Surrounding Area Description
Early 1800’s Dredging in the Fraser River commences – Initial extraction of sediment from natural sediment budget reducing amount available to foreshore areas.
Ferguson, 1991
1885 Initiation of dredging activities in the South Arm – This further reduced the sediment budget.
Barrie and Currie, 2000
1906 to present
Dyke construction for flood protection begins Richmond, 2000
1938
2 small jetty structures extending from site into the Fraser. Land use is mainly agricultural. Intertidal mudflat is present on the northern tip of Tilbury Island.
Intertidal mudflat on Deas Island.
Construction of a jetty at south end of Deas Slough inferred to be providing shelter for sediment deposition downstream.
Tilbury Slough diverges into 2 separate channels which appear to be dammed.
Two mid-channel diagonal bars approximately 500 m in length are located upstream of Tilbury Island. The downstream bar has vegetative cover.
There is a mid-channel bar at the downstream tip of Annacis Island.
No visible sediment deposition upstream of Deas Island in lee of Tilbury Island.
Aerial Photographs: A5985:11-20 A5938:12-27 A5984:44-45 Inferred tide state: low
1948 Largest measured flood on record - Large influx and deposition of sediment to the Lower Fraser
NHC, 2008.
1949
Intertidal mudflat visible on the upstream shore of Tilbury Island.
Jetty construction extends from mainland to the downstream end of Deas Island.
Bridge construction from the upstream end of Deas Island to the mainland. Inferred sediment source to be from the excavation from Deas Island.
Sediment plume visible from Tilbury Slough into the Fraser River.
The upstream diagonal bar identified in 1938 photography has decreased in length to approximately 100 m and has migrated downstream.
Aerial Photographs: BC779:3-6 BC785:48-44 BC783:68-74 BC783:38-32 BC782:70-75 BC782:26-25 Inferred tide state: low
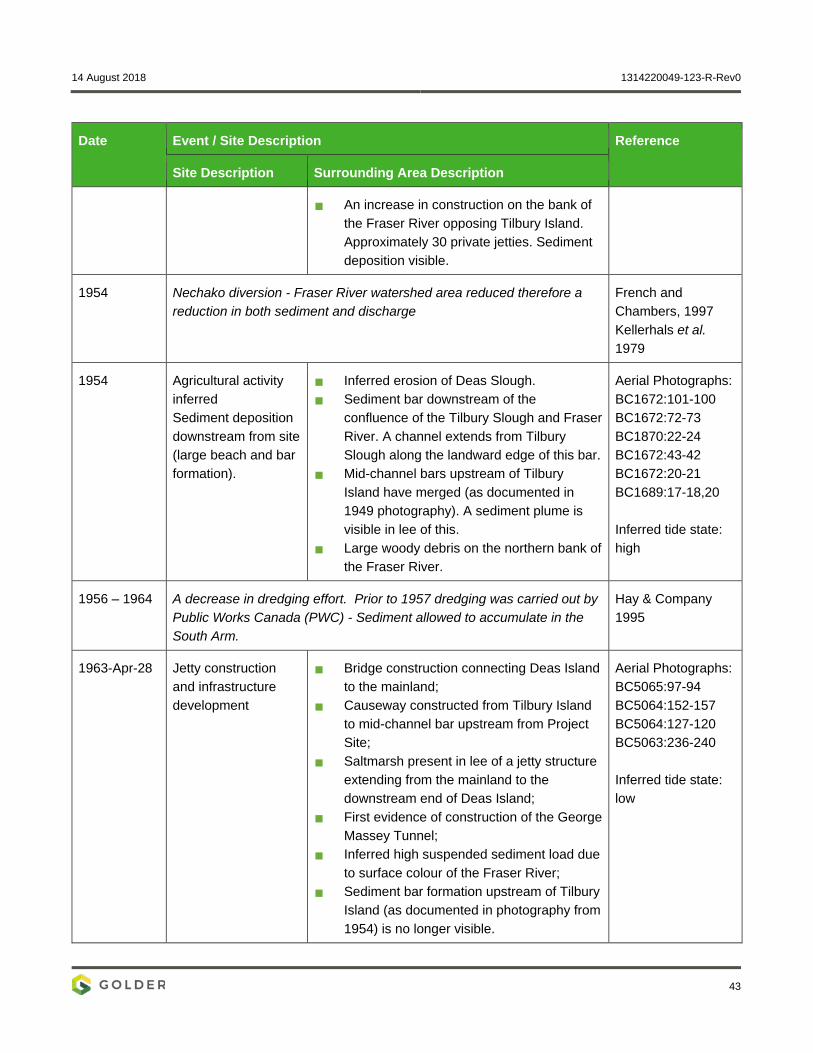
14 August 2018 1314220049-123-R-Rev0
43
Date Event / Site Description Reference
Site Description Surrounding Area Description
An increase in construction on the bank of the Fraser River opposing Tilbury Island. Approximately 30 private jetties. Sediment deposition visible.
1954 Nechako diversion - Fraser River watershed area reduced therefore a reduction in both sediment and discharge
French and Chambers, 1997 Kellerhals et al. 1979
1954
Agricultural activity inferred Sediment deposition downstream from site (large beach and bar formation).
Inferred erosion of Deas Slough.
Sediment bar downstream of the confluence of the Tilbury Slough and Fraser River. A channel extends from Tilbury Slough along the landward edge of this bar.
Mid-channel bars upstream of Tilbury Island have merged (as documented in 1949 photography). A sediment plume is visible in lee of this.
Large woody debris on the northern bank of the Fraser River.
Aerial Photographs: BC1672:101-100 BC1672:72-73 BC1870:22-24 BC1672:43-42 BC1672:20-21 BC1689:17-18,20 Inferred tide state: high
1956 – 1964 A decrease in dredging effort. Prior to 1957 dredging was carried out by Public Works Canada (PWC) - Sediment allowed to accumulate in the South Arm.
Hay & Company 1995
1963-Apr-28
Jetty construction and infrastructure development
Bridge construction connecting Deas Island to the mainland;
Causeway constructed from Tilbury Island to mid-channel bar upstream from Project Site;
Saltmarsh present in lee of a jetty structure extending from the mainland to the downstream end of Deas Island;
First evidence of construction of the George Massey Tunnel;
Inferred high suspended sediment load due to surface colour of the Fraser River;
Sediment bar formation upstream of Tilbury Island (as documented in photography from 1954) is no longer visible.
Aerial Photographs: BC5065:97-94 BC5064:152-157 BC5064:127-120 BC5063:236-240 Inferred tide state: low
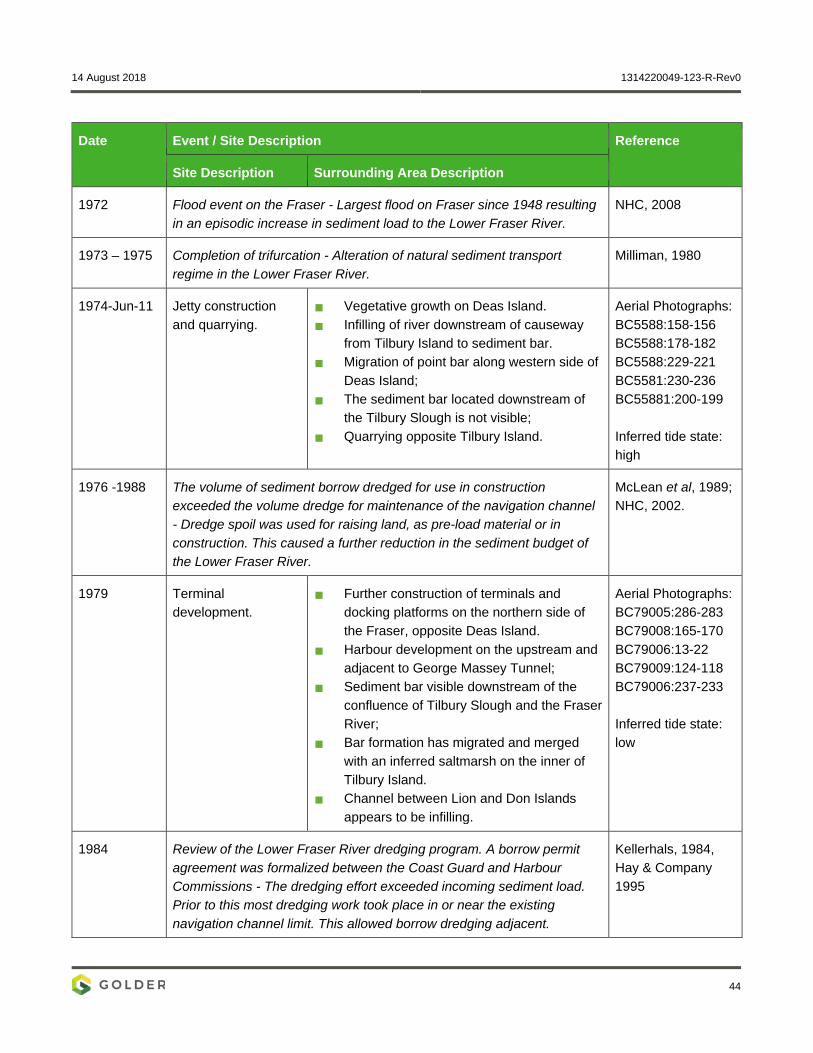
14 August 2018 1314220049-123-R-Rev0
44
Date Event / Site Description Reference
Site Description Surrounding Area Description
1972 Flood event on the Fraser - Largest flood on Fraser since 1948 resulting in an episodic increase in sediment load to the Lower Fraser River.
NHC, 2008
1973 – 1975 Completion of trifurcation - Alteration of natural sediment transport regime in the Lower Fraser River.
Milliman, 1980
1974-Jun-11
Jetty construction and quarrying.
Vegetative growth on Deas Island.
Infilling of river downstream of causeway from Tilbury Island to sediment bar.
Migration of point bar along western side of Deas Island;
The sediment bar located downstream of the Tilbury Slough is not visible;
Quarrying opposite Tilbury Island.
Aerial Photographs: BC5588:158-156 BC5588:178-182 BC5588:229-221 BC5581:230-236 BC55881:200-199 Inferred tide state: high
1976 -1988 The volume of sediment borrow dredged for use in construction exceeded the volume dredge for maintenance of the navigation channel - Dredge spoil was used for raising land, as pre-load material or in construction. This caused a further reduction in the sediment budget of the Lower Fraser River.
McLean et al, 1989; NHC, 2002.
1979
Terminal development.
Further construction of terminals and docking platforms on the northern side of the Fraser, opposite Deas Island.
Harbour development on the upstream and adjacent to George Massey Tunnel;
Sediment bar visible downstream of the confluence of Tilbury Slough and the Fraser River;
Bar formation has migrated and merged with an inferred saltmarsh on the inner of Tilbury Island.
Channel between Lion and Don Islands appears to be infilling.
Aerial Photographs: BC79005:286-283 BC79008:165-170 BC79006:13-22 BC79009:124-118 BC79006:237-233 Inferred tide state: low
1984 Review of the Lower Fraser River dredging program. A borrow permit agreement was formalized between the Coast Guard and Harbour Commissions - The dredging effort exceeded incoming sediment load. Prior to this most dredging work took place in or near the existing navigation channel limit. This allowed borrow dredging adjacent.
Kellerhals, 1984, Hay & Company 1995
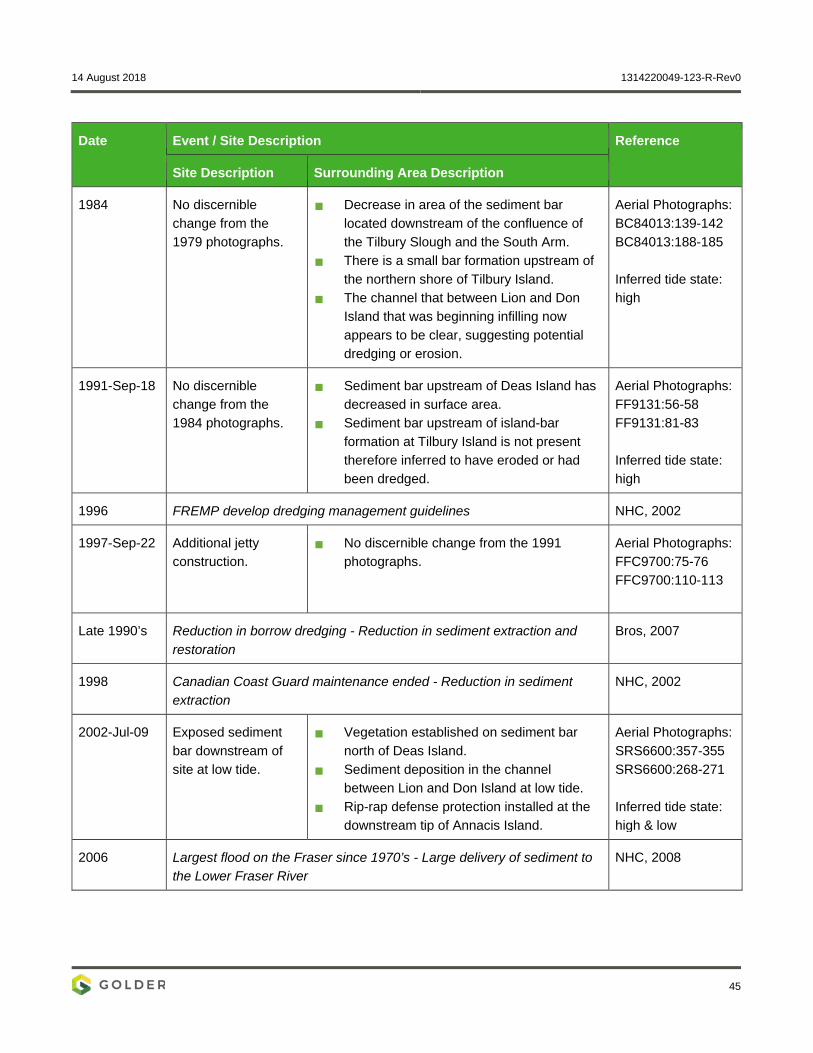
14 August 2018 1314220049-123-R-Rev0
45
Date Event / Site Description Reference
Site Description Surrounding Area Description
1984
No discernible change from the 1979 photographs.
Decrease in area of the sediment bar located downstream of the confluence of the Tilbury Slough and the South Arm.
There is a small bar formation upstream of the northern shore of Tilbury Island.
The channel that between Lion and Don Island that was beginning infilling now appears to be clear, suggesting potential dredging or erosion.
Aerial Photographs: BC84013:139-142 BC84013:188-185 Inferred tide state: high
1991-Sep-18
No discernible change from the 1984 photographs.
Sediment bar upstream of Deas Island has decreased in surface area.
Sediment bar upstream of island-bar formation at Tilbury Island is not present therefore inferred to have eroded or had been dredged.
Aerial Photographs: FF9131:56-58 FF9131:81-83 Inferred tide state: high
1996 FREMP develop dredging management guidelines NHC, 2002
1997-Sep-22
Additional jetty construction.
No discernible change from the 1991 photographs.
Aerial Photographs: FFC9700:75-76 FFC9700:110-113
Late 1990’s Reduction in borrow dredging - Reduction in sediment extraction and restoration
Bros, 2007
1998 Canadian Coast Guard maintenance ended - Reduction in sediment extraction
NHC, 2002
2002-Jul-09
Exposed sediment bar downstream of site at low tide.
Vegetation established on sediment bar north of Deas Island.
Sediment deposition in the channel between Lion and Don Island at low tide.
Rip-rap defense protection installed at the downstream tip of Annacis Island.
Aerial Photographs: SRS6600:357-355 SRS6600:268-271 Inferred tide state: high & low
2006 Largest flood on the Fraser since 1970’s - Large delivery of sediment to the Lower Fraser River
NHC, 2008

14 August 2018 1314220049-123-R-Rev0
46
Date Event / Site Description Reference
Site Description Surrounding Area Description
2009 Launch of Local Channel Dredging Contribution Program - Dredging activities for local communities beyond the limit of navigation channels. Removal of stable sediments.
http://www.portmetrovancouver.com/marine-operations/fraser-river-maintenance/
2009-Apr-04
No discernible change from the 2002 Photographs.
Sediment deposition occurring in lee of and upstream to the island-bar formation that extends and is joined by bridge to Tilbury Island.
Deeper cut channel between Lion and Don Island is visible with sediment extending to depth.
Aerial Photographs: SRS7964: 316-317 SRS7964:328-325 SRS7964:383-388 SRS7964:415-422 SRS7964:429-423 SRS7964:490-494 SRS7964:498-497 SRS7964 High-resolution Inferred tide state: high
The key transitions and changes in the geomorphic regime of the Lower Fraser River, in the vicinity of Tilbury Island, are in response to anthropogenic activity. Development of Tilbury Island is interpreted to be mostly prior to 1984, when most changes in geomorphology are evident. Key interpretations from the historical air photo interpretation are:
The jetty island-bar extending from Tilbury Island inhibits flow and enhances sediment deposition. This has been key in maintaining the saltmarsh habitat on the northern side of Tilbury Island.
Stabilization of sediment bar downstream of Deas Island – this section has been sheltered enough from flow to prevent erosion however being situated on the inner meander bend, deposition has been encouraged through time, most notably post-construction of the Deas Island bridge.
There has been no visible migration or fluctuation in shape of the South Arm of the Fraser River due to channelization.
The exposed sediment bar shown in the 2002 photography suggests that the inner meander of the Lower Fraser River at Tilbury Island is a zone of active deposition.
Dredging has played a significant role in maintaining a navigable route through the Lower Fraser evident in the active sedimentation and migration of bars along the study reach.

14 August 2018 1314220049-123-R-Rev0
47
A comparison of channel banks and bars was undertaken utilizing the aerial photographs provided by UBC for images from 1954, 1963, 1974, 1991, 2002 and 2018 as shown in Figure 25. The comparison indicates that the channel banks of the Fraser River have been predominantly stable since 1954. Significant development of the channel banks and floodplain area was discernable in the imagery. A summary of the key findings from the comparison of imagery is presented below.
The comparison confirmed that deposition was occurring on the downstream side of the jetty-island bar on the north side of Tilbury Island through the infilling and the establishment of vegetation on the salt marsh downstream of the jetty;
A side and mid-channel bar downstream of the project location have formed with the mid-channel bar stabilizing into a vegetated island over time. The presence of the in-channel structures upstream of the Project Site (at the locations of Seaspan Ferries and LeHigh Cement) may be influencing downstream river flow creating areas of deposition resulting in the formation of these bars; and
Significant lateral migration of the channel banks was not observed during the comparison and any lateral migration observed appears to be attributable to anthropogenic channel bank development.

Gravesend Reach
CLIENT
LEGENDPROJECT BOUNDARYMUNICIPAL BOUNDARYWATERCOURSEROADRAILWAY
CHANNEL BANK COMPARISON195419631974199120022018
REFERENCE
PROJECTTILBURY MARINE JETTYTITLE
13-1422-0049
Path:
Y:\bu
rnaby
\CAD
-GIS
\Clie
nt\W
esPa
c_Mi
dstre
am_L
LC\Ti
lbury\
99_P
ROJE
CTS\
1314
2200
49_M
arine
Jetty
\02_P
RODU
CTIO
N\17
000\M
XD\R
eport
\Rive
r_Proc
esse
s\TILB
URY_
25_C
hann
el_Ba
nk_C
ompa
rison
.mxd
IF TH
IS M
EASU
REME
NT D
OES
NOT M
ATCH
WHA
T IS
SHOW
N, TH
E SH
EET H
AS B
EEN
MODI
FIED
FROM
: ANS
I B
CONSULTANT
PROJECT NO. CONTROL Rev. FIGURE
YYYY-MM-DDPREPAREDDESIGNREVIEWAPPROVED
25mm
0
400 0 400
1:20,000 METRESSCALE
POPOMTJP
2018-08-09
25017000
CHANNEL BANK COMPARISON
1. INDIAN RESERVES, TSAWWASSEN FIRST NATION LANDS AND MUNICIPALBOUNDARIES OBTAINED BY B.C. MINISTRY OF FORESTS, LANDS AND NATURALRESOURCE OPERATIONS.2. RAILWAY, WATER, FOREST, PARKS, WATERCOURSE, WATERBODY AND RESIDENTIALAREA DATA OBTAINED FROM CANVEC © DEPARTMENT OF NATURAL RESOURCESCANADA. ALL RIGHTS RESERVED.3. IMAGERY OBTAINED FROM BING MAPS FOR ARCGIS PUBLISHED BY MICROSOFTCORPORATION, REDMOND, WA, MAY 2009. TOPO BASEMAP © ESRI AND ITSLICENSORS. ALL RIGHTS RESERVED.PROJECTION: UTM ZONE 10; DATUM: NAD 83
WESPAC MIDSTREAM - VANCOUVER LLC
14 August 2018 1314220049-123-R-Rev0
49
7.2 Summary of Anthropogenic Impacts on Geomorphic Regime Over the last approximately 200 years the South Arm of Fraser River has migrated northwards from a location around the modern-day Canoe Passage to the present location. Migration of the South Arm channel is now limited due to the influence of recent human activity. This activity includes:
extraction of sediment for construction purposes (borrow dredging)
dredging for shipping and navigation (maintenance dredging)
narrowing of the floodplain by the construction of dykes for flood management
construction of jetties and ocean outfalls
channelization by river training for navigation
diversion of portions of the Fraser River watershed
flood and sediment transport management
filling in of distributary channels
armouring of riverbanks
These activities have led towards a reduction of sediment supply, increased channelization, and increased alteration of the natural sediment transport regime of Fraser River.
Dredging within the channel tends to increase the cross-sectional area through which the river can flow, therefore reducing velocity and the sediment carrying capacity and enhancing deposition. . Dredging also removes sediment from the Fraser River system. Aside from episodic influxes of new sediment during floods in 1948 and 1972, the reduction in natural sediment supply over time and increase in dredging have resulted in a reduced overall sediment budget for the lower river (Isfeld et al. 1996).
The sediment budget of the Lower Fraser River is a measure of the net change in sediment stored in the river as a function of the total inflow of sediment estimated at Mission less the outflow into Georgia Strait and the volumes dredged (Isfeld et al, 1996). The annual sediment budget developed from information in this baseline review is depicted in Figure 26. In the past 200 years, anthropogenic alterations to the sediment regime have substantially reduced the volume being transported down the Lower Fraser River and therefore the volume of sediment available for deposition in the lower river. Tywoniuk (1972) compared grain size distribution between measured and dredged quantities. The results indicated that more coarse material is dredged than is transported by the river in suspension to the dredging region considered, between Steveston and Port Mann.

14 August 2018 1314220049-123-R-Rev0
50
Figure 26: Annual Sediment Budget. Note: Historic borrow dredging volumes have been included due to the time lag in sediment transport processes whereby an historic reduction in sediment would translate into observable erosion in the present day at Gravesend Reach
7.3 Vessel Induced Waves and Water Movements It is widely accepted that heavy ship traffic has the potential to cause environmental damage in narrow waterways and near sensitive areas such as wetlands or naturally low-energy coasts (Kelpsaite et al, 2009). Hydrodynamic forcing generated by vessels has the potential to cause scour at a river bed or shoreline due to propeller velocities, wake waves and pressure field (drawdown) effects. Sediment transport rates and patterns can be altered by even a small increase in hydrodynamic loads. Waves of all types can also change the nature of benthic habitats by altering factors such as sediment grain size distribution and nutrient availability (Curtiss et al. 2009).
Propeller jets induce currents behind the ship in the direction of travel that have the potential to cause scour at the river bed, particularly in shallower water depths (CIRIA 2007). Ship induced water movements are also caused by the displacement of water as the ship moves and result in drawdown effects, wakes or waves that propagate at an angle to the sailing line. These vessel induced water movements produce velocities in the water column that may cause scour and result in waves arriving at the shoreline or river bank. Factors that influence drawdown and wake wave generation include the vessel speed, hull shape and dimensions and distance of the measurement point from the sailing line (Macfarlane et al. 2012).
Ship movements on the Fraser River between July 2010 and June 2011 are provided in a tanker traffic study commissioned by Port Metro Vancouver (Det Norske Veritas, 2012). A total of 14,336 passages were estimated transiting in the upriver and downriver directions past the Project site over the year. Over 14,000 of the total
Sediment Supply 12 million m3/year
(17 Mt/year)
65 % silt and clay = 7,800,000 m3
85 % transported through South Arm
and Canoe Passage=
6,630,000 m3
15 % transported through North Arm and Middle Arm =
1,170,000 m3
35 % Sand = 4,200,000 m3
Approximately 100% transported
through South Arm due to Trifurcation
2,000,000 m3
maintenance dredging
300,000 m3
secondary channel dredging
Borrow Dredging -up to 5 million
m3/year

14 August 2018 1314220049-123-R-Rev0
51
upstream passages were attributed to four vessel types: tug boats, cargo ferries, deep water vessels, and dredgers. Most of this existing traffic is expected to transit in the deep-water navigation channel through the study area. Ausenco (2015) estimated wake wave heights for this vessel traffic in Gravesend Reach; the estimated wake wave heights as reproduced in Table 11. Wake wave heights between 0.03 and 0.26 m are estimated 50 m from the sailing line. The wake wave heights reduce in magnitude moving further away from the sailing line of the vessel.
Table 11: Existing Wake Heights Estimated in Gravesend Reach (source: Ausenco, 2015)
Vessel Type No. of Annual Transits in Gravesend Reach (2010 – 2011)
Fleet Fraction (2010 – 2011)
Wake Height (m)
50 m Away
100 m Away
200 m Away
Deep Water Vessel (Bulk Carrier)
1,076
3.6% 0.03 0.02 0.02
Deep Water Vessel (Container Ship)
2.7% 0.04 0.04 0.04
Deep Water Vessel (Auto Carrier) 1.1% 0.12 0.10 0.08
Cargo Ferry 4,576 31.4% 0.26 0.20 0.16
Dredge 1,100 7.5% 0.12 0.10 0.08
Tug 7,424 50.9% 0.20 0.16 0.13
Other 160 1.1% - - -
Total 14,336 100% - - -
In this baseline study, no information on the drawdown effects or propeller wash impacts associated with this vessel traffic was provided. The majority of this vessel traffic would occur in the navigation channel where propeller scour would be lessened due to the channel depths.
14 August 2018 1314220049-123-R-Rev0
52
8.0 SUMMARY The literature review and gap analysis consisted of an office-based analysis of available data. Data was gathered from various sources including relevant and scientific and engineering data and published literature. The data was used to summarize the baseline conditions at Tilbury Island with respect to its potential use as a site for a marine jetty under a development plan proposed by WesPac.
8.1 Baseline Hydrologic Conditions The annual hydrograph of the Fraser River is dominated by a snow-melt driven freshet, with peak annual
discharges occurring in late May to early June. Discharges during the freshet typically peak at around 8500 m3/s (measured at Hope), although this varies significantly from year to year.
Water levels at the Project site are governed by the discharge and tidal influence that propagate upstream from the Strait of Georgia. Sea level rise (SLR) over the course of the Project Life is expected to result in higher water levels at the site. The SLR rate of 10 mm/year, as recommended in the Provincial guidelines has been adopted for this assessment. This equates to 0.53 m of SLR (from base levels in 2000) by the end of the Operation phase in 2053.
Currents and circulation at the site are dominated by the river discharge and tidal fluctuations. Maximum surface velocities occur in the navigation channel and flow reversal is observed at the site during ebb tides.
Hydrodynamics at the Project site are also influenced by the formation of a salt wedge that propagates upstream from the Strait of Georgia during flood tides. During the high flows of freshet, the salt wedge does not typically reach the project site. During low winter flows, the salt wedge migrates as far as Annacis Island.
Wind wave action at the Project site is expected to be relatively minor due to the short fetches in the Project Area.
8.2 Baseline Sediment Processes Gravesend Reach is in the sand-bedded portion of the Fraser River. The surficial sediment coverage is
predominantly muddy-sand, however, this is likely to transition to sand with the onset of freshet conditions between May and June. Freshet also corresponds to peak sediment discharges in the Fraser.
The average annual sediment load in the Fraser is approximately 17 Mt/ year, although this varies significantly from year to year. This consists of roughly 50% silt, 35% sand and 15% clay with most of the material, apart from the coarser sands, being transported in the suspended load.
The changes in turbidity and total suspended solids (TSS) in the Gravesend Reach, measured at the ECCC Buoy, are largely due to changes in river discharge and tidal forcing.
The annual maximum in turbidity and TSS corresponds to the annual freshet and daily fluctuations are due to oscillations in the tides.
The potential increase in turbidity and TSS resulting from historical dredging cannot be distinguished from the discharge and tidally driven turbidity and TSS measurements at the EC Buoy.

14 August 2018 1314220049-123-R-Rev0
53
The estimated TSS from historical dredging is insignificant in comparison to measured TSS at the EC Buoy at high flows (>3000 m3/s) and on order with the measured TSS at low flows (<3000 m3/s). This suggests historical dredging at low flows could create an increase in TSS.
8.3 Baseline Morphology Morphological changes in the vicinity of the Project site occur on both short and long time scales. Short term
morphological changes can occur in the form of bedforms that are manifestations of sediment transport. Signficant longer-term trends in channel morphology have occurred as a result of anthropogenic impacts, such as dredging.
The lower Fraser River has been dredged over the last century for both navigation and construction materials. Annual dredge volumes in Gravesend Reach were in the order of 600,000 m3 per year between the late 1970’s to the early 1990’s when borrow dredging (for construction materials) peaked on the Fraser River. Current annual dredge volumes in Gravesend Reach are in the order of 170,000 m3/year. Historical over-dredging on the Fraser led to morphological and bed changes that occurred over years to decades. In Gravesend Reach this manifested in the form of bed lowering.
During the latter part of the 20th century, the bed in Gravesend Reach showed a general scour and deepening trend. Studies have attributed the deepening to the rivers response to the extraction of large volumes of material in the mid-1970’s to mid-1990’s for construction materials.
A comparison of bathymetry data from 2001 and 2017 did not show any significant patterns of net scour or net deposition over this period. However, comparisons of 3 to 5 year intervals during this time showed scour and deposition up to 5 m.
8.4 Other Anthropogenic Impacts in Gravesend Reach Human activity including the construction of flood mitigation and other infrastructure, diversion of portions of
the watershed, armouring of river banks and the construction of jetties and ocean outfalls, has impacted the geomorphic regime of the Fraser. These activities have tended to lead towards a reduction of sediment supply, increased channelization, and alteration of the natural sediment transport regime of Fraser River.
The Fraser River is an active shipping route with vessel induced waves and water movements occurring in the vicinity of the site. Vessels wake waves produced by existing vessels are estimated to be less than 0.26 m (varies with vessel type), 50 m from the sailing line. The magnitude of the vessel wakes reduces moving further away from the sailing line. No existing data was available on propeller wash at the site.
14 August 2018 1314220049-123-R-Rev0
54
9.0 CLOSURE We trust this information is sufficient for your needs at this this time. Should you have any questions or concerns, please do not hesitate to contact the undersigned.
Golder Associates Ltd.
Claire Murray, PEng David Hurley, MASc Coastal Engineer Coastal Engineering Specialist
Morgan Tidd, MSc, PGeo Phil Osborne, PhD, PGeo Geomorphologist Principal, Senior Coastal Geomorphologist
CM/MT/DH/PO/asd
Golder and the G logo are trademarks of Golder Associates Corporation
o:\final\2013\1422\13-1422-0049\1314220049-123-r-rev0\1314220049-123-r-rev0-tilbury river processes baseline report-14aug_18.docx
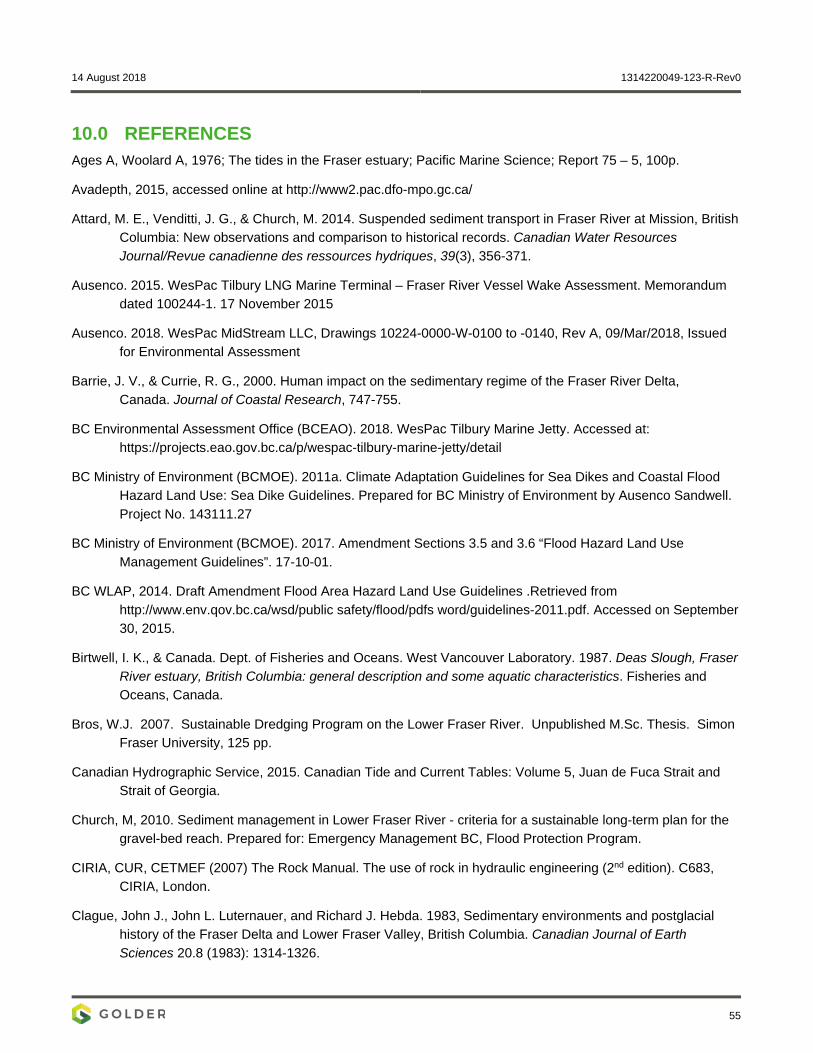
14 August 2018 1314220049-123-R-Rev0
55
10.0 REFERENCES Ages A, Woolard A, 1976; The tides in the Fraser estuary; Pacific Marine Science; Report 75 – 5, 100p.
Avadepth, 2015, accessed online at http://www2.pac.dfo-mpo.gc.ca/
Attard, M. E., Venditti, J. G., & Church, M. 2014. Suspended sediment transport in Fraser River at Mission, British Columbia: New observations and comparison to historical records. Canadian Water Resources Journal/Revue canadienne des ressources hydriques, 39(3), 356-371.
Ausenco. 2015. WesPac Tilbury LNG Marine Terminal – Fraser River Vessel Wake Assessment. Memorandum dated 100244-1. 17 November 2015
Ausenco. 2018. WesPac MidStream LLC, Drawings 10224-0000-W-0100 to -0140, Rev A, 09/Mar/2018, Issued for Environmental Assessment
Barrie, J. V., & Currie, R. G., 2000. Human impact on the sedimentary regime of the Fraser River Delta, Canada. Journal of Coastal Research, 747-755.
BC Environmental Assessment Office (BCEAO). 2018. WesPac Tilbury Marine Jetty. Accessed at: https://projects.eao.gov.bc.ca/p/wespac-tilbury-marine-jetty/detail
BC Ministry of Environment (BCMOE). 2011a. Climate Adaptation Guidelines for Sea Dikes and Coastal Flood Hazard Land Use: Sea Dike Guidelines. Prepared for BC Ministry of Environment by Ausenco Sandwell. Project No. 143111.27
BC Ministry of Environment (BCMOE). 2017. Amendment Sections 3.5 and 3.6 “Flood Hazard Land Use Management Guidelines”. 17-10-01.
BC WLAP, 2014. Draft Amendment Flood Area Hazard Land Use Guidelines .Retrieved from http://www.env.qov.bc.ca/wsd/public safety/flood/pdfs word/guidelines-2011.pdf. Accessed on September 30, 2015.
Birtwell, I. K., & Canada. Dept. of Fisheries and Oceans. West Vancouver Laboratory. 1987. Deas Slough, Fraser River estuary, British Columbia: general description and some aquatic characteristics. Fisheries and Oceans, Canada.
Bros, W.J. 2007. Sustainable Dredging Program on the Lower Fraser River. Unpublished M.Sc. Thesis. Simon Fraser University, 125 pp.
Canadian Hydrographic Service, 2015. Canadian Tide and Current Tables: Volume 5, Juan de Fuca Strait and Strait of Georgia.
Church, M, 2010. Sediment management in Lower Fraser River - criteria for a sustainable long-term plan for the gravel-bed reach. Prepared for: Emergency Management BC, Flood Protection Program.
CIRIA, CUR, CETMEF (2007) The Rock Manual. The use of rock in hydraulic engineering (2nd edition). C683, CIRIA, London.
Clague, John J., John L. Luternauer, and Richard J. Hebda. 1983, Sedimentary environments and postglacial history of the Fraser Delta and Lower Fraser Valley, British Columbia. Canadian Journal of Earth Sciences 20.8 (1983): 1314-1326.

14 August 2018 1314220049-123-R-Rev0
56
Clague, J. J., Luternauer, J. L., Pullan, S. E., & Hunter, J. A., 1991. Postglacial deltaic sediments, southern Fraser River delta, British Columbia.Canadian Journal of Earth Sciences, 28(9), 1386-1393.
Cousineau, J. G., 1975. The Fraser River Flood Control Programme: How Decisions Get Made; University of British Columbia Thesis.
Curtiss, G.M., Osborne, P.D. and A.R. Horner-Devine. 2009. Seasonal patterns of coarse sediment transport on a mixed sand and gravel beach due to vessel wakes, wind waves, and tidal currents. Marine Geology 259:73-85.
Det Norske Veritas. 2012. Fraser River Tanker Traffic Study. Version: Rev 1, 06 June 2012. Report No.: PP017719-1. Prepared for Port Metro Vancouver.
Environment Canada, 2018. Primary Water Levels and Discharge measured for the Fraser River at Hope, B.C., Station ID# 08MF005. Accessed on March 5, 2018 at http://wateroffice.ec.gc.ca/report/report_e.html?mode=Graph&type=realTime&stn=08MF005&dataType=Real-Time&startDate=2010-01-01&endDate=2010-12-31&prm1=46&y1Max=&y1Min=&prm2=47&y2Max=&y2Min=
Ferguson, Alan, Regional Consulting Ltd. 1991, Navigation, dredging and environment in the Fraser River Estuary. Fraser River Estuary Management Program, Navigation and Dredging Workgroup Report.
Fisheries and Oceans Canada, 1999, Sailing Directions, British Columbia Coast (South Portion), Volume 1, 16th Edition, Ottawa.
Fisheries and Oceans Canada (DFO), 2012, Fraser River/Fleuve Fraser: Sand Heads to Douglas Island, Nautical Chart 3490
Fisheries and Oceans Canada, 2015a, Canadian Tide and Current Tables, Juan de Fuca Strait and Strait of Georgia; Ottawa
Fisheries and Oceans Canada. 2015b Canadian Coast Guard Waterways Management Services, Fraser River, B.C South Arm Annual River Survey Dec 22, 2015, Soundings for the South Arm of the Fraser River. _FR_Overview_S.dwf.
Fisheries and Oceans Canada (DFO). 2018. Avadepth Reports: Predicted Water levels and Velocities. Accessed at: http://www2.pac.dfo-mpo.gc.ca/avdpth_srch-eng.html?page=pwl
Fraser River Estuary Management Program (FREMP), 2005, Dredge Management Guidelines accessed online at: http://www.bieapfremp.org/fremp/pdf_files/Revised%20Dredging%20Guidelines%20Sept%202005%20FINAL.pdf.
Fraser River Estuary Management Program (FREMP). 2006. Environmental Management Strategy for Dredging in the Fraser River Estuary. Burrard Inlet Environmental Action Plan
Fraser River Estuary Management Program (FREMP) (2012) Annual Report: Burrard Inlet Environmental Action Program; accessed online at: http://www.bieapfremp.org/pdf/bieap-fremp-ar-2011-12.pdf
Hart R.S., Hamilton, T.S., and Barrie, J.V., 1998, Sedimentation on the Fraser Delta slope and prodelta, Canada, based on high resolution seismic stratigraphy, lithofacies and 137Cs fallout stratigraphy, Journal of Sedimentary Research, 68, 556-568
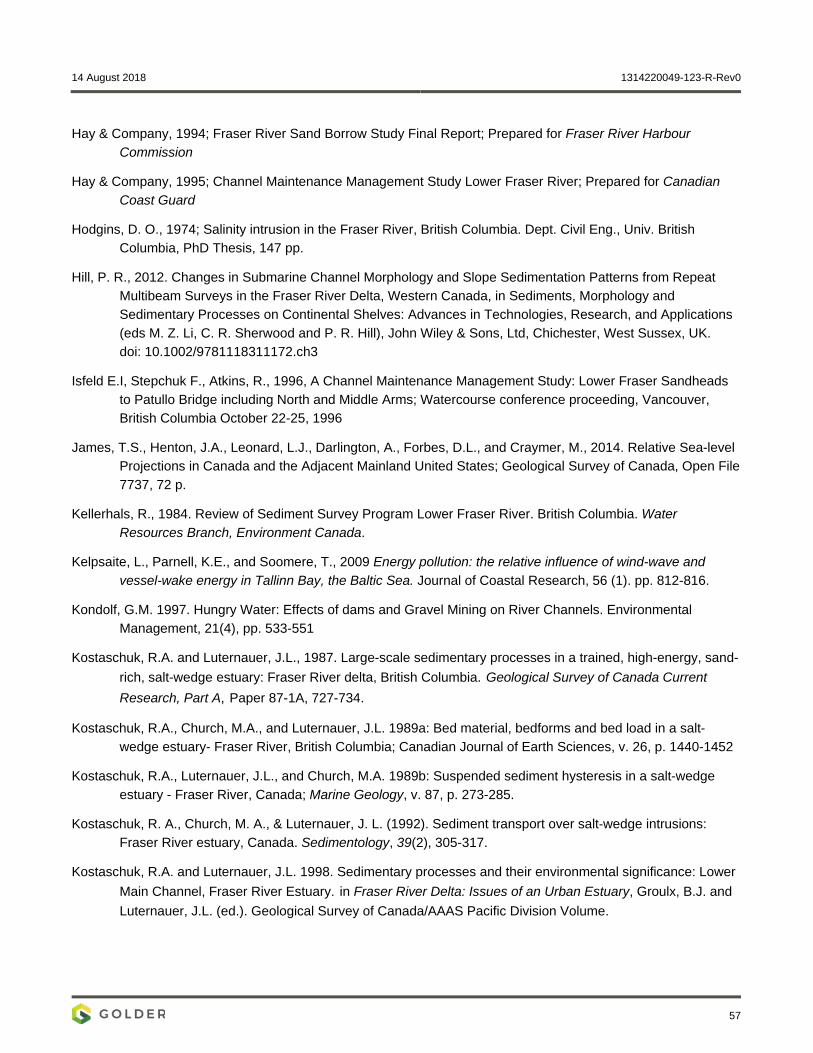
14 August 2018 1314220049-123-R-Rev0
57
Hay & Company, 1994; Fraser River Sand Borrow Study Final Report; Prepared for Fraser River Harbour Commission
Hay & Company, 1995; Channel Maintenance Management Study Lower Fraser River; Prepared for Canadian Coast Guard
Hodgins, D. O., 1974; Salinity intrusion in the Fraser River, British Columbia. Dept. Civil Eng., Univ. British Columbia, PhD Thesis, 147 pp.
Hill, P. R., 2012. Changes in Submarine Channel Morphology and Slope Sedimentation Patterns from Repeat Multibeam Surveys in the Fraser River Delta, Western Canada, in Sediments, Morphology and Sedimentary Processes on Continental Shelves: Advances in Technologies, Research, and Applications (eds M. Z. Li, C. R. Sherwood and P. R. Hill), John Wiley & Sons, Ltd, Chichester, West Sussex, UK. doi: 10.1002/9781118311172.ch3
Isfeld E.I, Stepchuk F., Atkins, R., 1996, A Channel Maintenance Management Study: Lower Fraser Sandheads to Patullo Bridge including North and Middle Arms; Watercourse conference proceeding, Vancouver, British Columbia October 22-25, 1996
James, T.S., Henton, J.A., Leonard, L.J., Darlington, A., Forbes, D.L., and Craymer, M., 2014. Relative Sea-level Projections in Canada and the Adjacent Mainland United States; Geological Survey of Canada, Open File 7737, 72 p.
Kellerhals, R., 1984. Review of Sediment Survey Program Lower Fraser River. British Columbia. Water Resources Branch, Environment Canada.
Kelpsaite, L., Parnell, K.E., and Soomere, T., 2009 Energy pollution: the relative influence of wind-wave and vessel-wake energy in Tallinn Bay, the Baltic Sea. Journal of Coastal Research, 56 (1). pp. 812-816.
Kondolf, G.M. 1997. Hungry Water: Effects of dams and Gravel Mining on River Channels. Environmental Management, 21(4), pp. 533-551
Kostaschuk, R.A. and Luternauer, J.L., 1987. Large-scale sedimentary processes in a trained, high-energy, sand-rich, salt-wedge estuary: Fraser River delta, British Columbia. Geological Survey of Canada Current Research, Part A, Paper 87-1A, 727-734.
Kostaschuk, R.A., Church, M.A., and Luternauer, J.L. 1989a: Bed material, bedforms and bed load in a salt-wedge estuary- Fraser River, British Columbia; Canadian Journal of Earth Sciences, v. 26, p. 1440-1452
Kostaschuk, R.A., Luternauer, J.L., and Church, M.A. 1989b: Suspended sediment hysteresis in a salt-wedge estuary - Fraser River, Canada; Marine Geology, v. 87, p. 273-285.
Kostaschuk, R. A., Church, M. A., & Luternauer, J. L. (1992). Sediment transport over salt‐wedge intrusions: Fraser River estuary, Canada. Sedimentology, 39(2), 305-317.
Kostaschuk, R.A. and Luternauer, J.L. 1998. Sedimentary processes and their environmental significance: Lower Main Channel, Fraser River Estuary. in Fraser River Delta: Issues of an Urban Estuary, Groulx, B.J. and Luternauer, J.L. (ed.). Geological Survey of Canada/AAAS Pacific Division Volume.
14 August 2018 1314220049-123-R-Rev0
58
Kostaschuk, R.A. and Luternauer, J.L., 2004: Sedimentary processes and their environmental significance: lower main channel, Fraser River estuary; in Fraser River Delta, British Columbia: Issues of an Urban Estuary, (ed.) B.J. Groulx, D. C. Mosher, J.L. Luternauer, and D.E. Bilderback; Geological Survey of Canada, Bulletin 567, p. 81-92.
Luternauer, J. L., & Finn, W. L. (1983). Stability of the Fraser River delta front. Canadian Geotechnical Journal, 20(4), 603-616.
Luternauer, J. L., Claque, J. J., Hunter, J. A. M., Pullan, S. E., Roberts, M. C., Woeller, D. J., ... & Hart, B. S. (1993, July). The Fraser River delta, British Columbia: architecture, geological dynamics and human impact. In Deltas of the World (pp. 99-113). ASCE.
Macfarlane, G.J., Bose, N. and Duffy, J.T. 2012. Wave Wake: Focus on vessel operations within sheltered waterways. Proceedings of the SNAME Annual Meeting, Providence, Rhode Island. 24-26th October 2012.
Mannerström, M., Leytham, M., Costa-cabral, M., & de Lima, G. Flood hazard assessment approaches for climate change.
McLaren, P., and P. Ren. 1995. Sediment Transport and Its Environmental Implications in the Lower Fraser River and Fraser Delta. Environment Canada, Vancouver, B.C. DOE FRAP 1993.03.
McLean, D. G., & Tassone, B. L. 1989. Effects of dredging on Fraser River channel regime. Unpublished report, Public Works Canada, Environment Canada, Report, (883-578).
McLean, D. G., & Tassone, B. L., 1991. A sediment budget of the Lower Fraser River. In Proceedings of the fifth federal interagency sedimentation conference (pp. 18-21). March, 1991.
McLean, D. G., Church, M., & Tassone, B., 1999. Sediment transport along Lower Fraser River: 1. Measurements and hydraulic computations. Water Resources Research, 35(8), 2533-2548.
McLean, D., Mannerström, M., & Lyle, T. 2006 Impacts of human interventions on the Lower Fraser River.
Milliman, John D. 1980, Sedimentation in the Fraser River and its estuary, southwestern British Columbia (Canada). Estuarine and Coastal Marine Science 10.6 (1980): 609-633.
Northwest Hydraulic Consultants, 2002; Review of Lower Fraser River Sediment Budget; Prepared for Dredge Management Advisory Committee Fraser River Estuary Management Program.
Northwest Hydraulic Consultants, 2006: Lower Fraser River Hydraulic Model Final Report; Prepared for Fraser Basin Council accessed online at http://www.env.gov.bc.ca/wsd/public_safety/flood/pdfs_word/2006nhc_fraser_flood_profile.pdf
Northwest Hydraulic Consultants, 2008; Fraser River Hydraulic Model Update Final Report; written for BC Ministry of Environment.
Northwest Hydraulic Consultants Ltd. 2014. Simulating the Effects of Sea Level Rise and Climate Change on Fraser River Flood Scenarios. Report for BC Ministry of Forests, Lands and Natural Resource Operations. April 2014
Northwest Hydraulic Consultants, 2016. Section 16.2: River Hydraulics and River Morphology Study, Technical Volume, George Massey Tunnel Replacement Project
14 August 2018 1314220049-123-R-Rev0
59
Parnell, K. E. and Kofoed-Hansen, H. 2001. Wakes from large high-speed ferries in confined coastal waters: Management approaches with examples from New Zealand and Denmark. Coastal Management. 29, 217–237.
Public Works and Government Services Canada (PWGSC). 2007. Fraser_Pitt River – Low Water Datum Boundaries rev.2007.dwg
Public Works and Procurement Canada (PWPC). 2018. Annual Bathymetry Surveys in Gravesend Reach, various years between 1997 and 2016, data provided by PWPC
Ritter, D. F, Kochel, C. R., Miller J. R., 1978, Process Geomorphology Third Edition, Wm. C. Brown Publishers 215 p.
Rob Severinski. Fraser River Pile and Dredge. Vancouver, BC. E-mail. April 16, 2018.
Stewart, I., & Tassone, B., 1989. The Fraser River delta: a review of historic sounding charts. Inland Waters, Pacific and Yukon Region.
Tetra Tech EBA. 2016. Hydrodynamic and Morphology Modelling of a Proposed Berth at Tilbury. Presented to Ausenco, January 22, 2016. V13203218-01
Tetra Tech EBA. 2018. Morphological Change Modelling of a Proposed Berth at Tilbury. Presented to Ausenco, June 1, 2018, Issued for Review, V13203218-01
Thomson, R.E. 1981: Oceanography of the British Columbia coast; Canadian Special Publication of Fisheries and Aquatic Sciences, no. 56,291 p.
Thomson, R.E., Bornhold, B.D. and Mazzotti, S. 2008. An Examination of the Factors Affecting Relative and Absolute Sea Level in Coastal British Columbia. Can.Tech. Rep. Hydrogr. Ocean Sci. 260, 49 p.
Tywoniuk, N., 1972. Sediment budget of the Lower Fraser River. Coastal Engineering Proceedings, 1(13).
Villard, P., & Kostaschuk, R., 1998. The relation between shear velocity and suspended sediment concentration over dunes: Fraser Estuary, Canada. Marine Geology, 148(1), 71-81.
Villard, P. V. 1995: Spatial and temporal behaviour of turbulent sand suspension over dunes: Fraser River, British Columbia; M.Sc. thesis, University of Guelph, Guelph, Ontario, 125 p.
Villard, P., Church, M., & Kostaschuk, R., 2009. Estimating Bedload in Sand‐Bed Channels Using Bottom Tracking from an Acoustic Doppler Profiler. Fluvial Sedimentology VII (Special Publication 35 of the IAS), 20, 197.
Ward, P.R.B. 1976: Seasonal salinity changes in the Fraser River estuary; Canadian Journal of Civil Engineering, v. 3, p. 342-348.
WesPac MidStream – Vancouver LLC. 2016. Application Information Requirements: WesPac Tilbury Marine Jetty Project. Proposed by: WestPac Midstream – Vancouver LLC. November 2016. Pursuant to the Environmental Assessment Act, S.B.C. 2002, c. 43
14 August 2018 1314220049-123-R-Rev0
APPENDIX A
TetraTech Report
Tilbury_DS_Morph_Report-Rev5_2018.docx
Tetra Tech EBA Inc. Suite 1000 – 10th Floor, 885 Dunsmuir Street
Vancouver, BC V6C 1N5 CANADA Tel 604.685.0275 Fax 604.684.6241
PRESENTED TO
Ausenco
Morphological Change Modelling of a Proposed Berth at
Tilbury
MAY 2018 ISSUED FOR REVIEW FILE: V13203218-01


MORPHOLOGICAL CHANGE MODELLING OF A PROPOSED BERTH AT TILBURY FILE: V13203218-01 | MAY 2018 | ISSUED FOR REVIEW
i
Tilbury_DS_Morph_Report-Rev5_2018.docx
This page intentionally left blank.
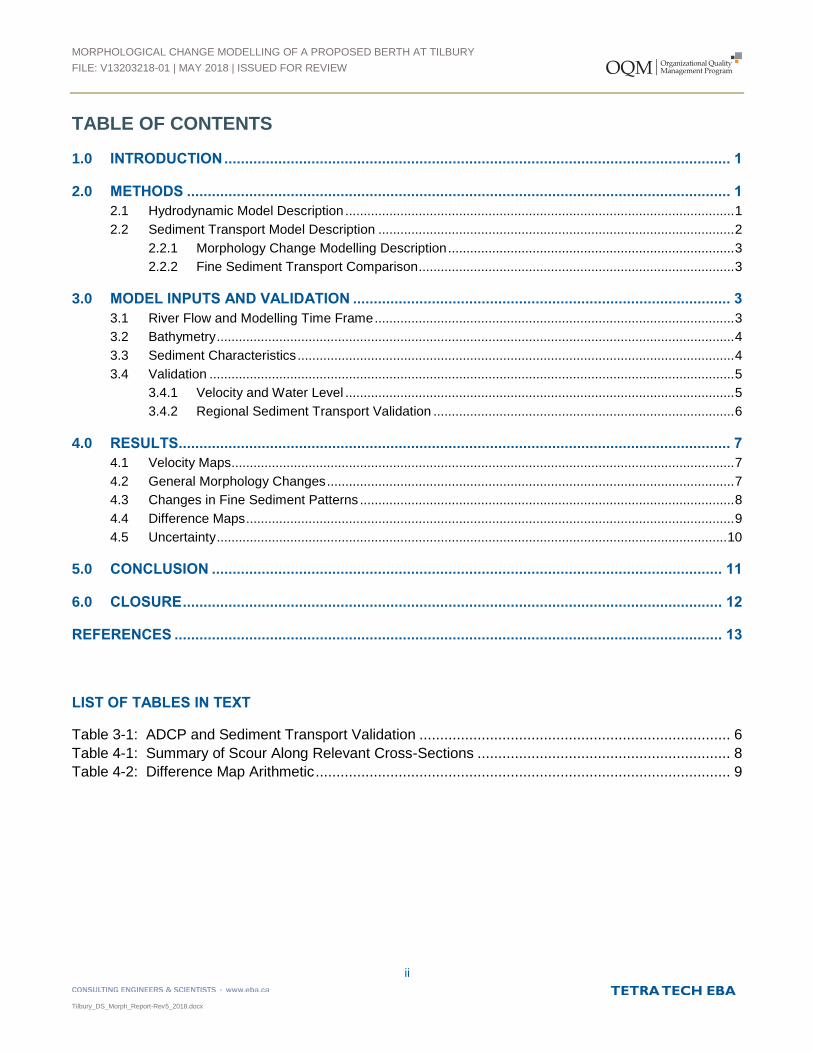
MORPHOLOGICAL CHANGE MODELLING OF A PROPOSED BERTH AT TILBURY FILE: V13203218-01 | MAY 2018 | ISSUED FOR REVIEW
ii
Tilbury_DS_Morph_Report-Rev5_2018.docx
TABLE OF CONTENTS
1.0 INTRODUCTION .......................................................................................................................... 1
2.0 METHODS ................................................................................................................................... 1
2.1 Hydrodynamic Model Description .......................................................................................................... 1
2.2 Sediment Transport Model Description ................................................................................................. 2
2.2.1 Morphology Change Modelling Description .............................................................................. 3
2.2.2 Fine Sediment Transport Comparison ...................................................................................... 3
3.0 MODEL INPUTS AND VALIDATION ........................................................................................... 3
3.1 River Flow and Modelling Time Frame .................................................................................................. 3
3.2 Bathymetry ............................................................................................................................................. 4
3.3 Sediment Characteristics ....................................................................................................................... 4
3.4 Validation ............................................................................................................................................... 5
3.4.1 Velocity and Water Level .......................................................................................................... 5
3.4.2 Regional Sediment Transport Validation .................................................................................. 6
4.0 RESULTS..................................................................................................................................... 7
4.1 Velocity Maps......................................................................................................................................... 7
4.2 General Morphology Changes ............................................................................................................... 7
4.3 Changes in Fine Sediment Patterns ...................................................................................................... 8
4.4 Difference Maps ..................................................................................................................................... 9
4.5 Uncertainty ........................................................................................................................................... 10
5.0 CONCLUSION ........................................................................................................................... 11
6.0 CLOSURE .................................................................................................................................. 12
REFERENCES .................................................................................................................................... 13
LIST OF TABLES IN TEXT
Table 3-1: ADCP and Sediment Transport Validation ........................................................................... 6
Table 4-1: Summary of Scour Along Relevant Cross-Sections ............................................................. 8
Table 4-2: Difference Map Arithmetic .................................................................................................... 9
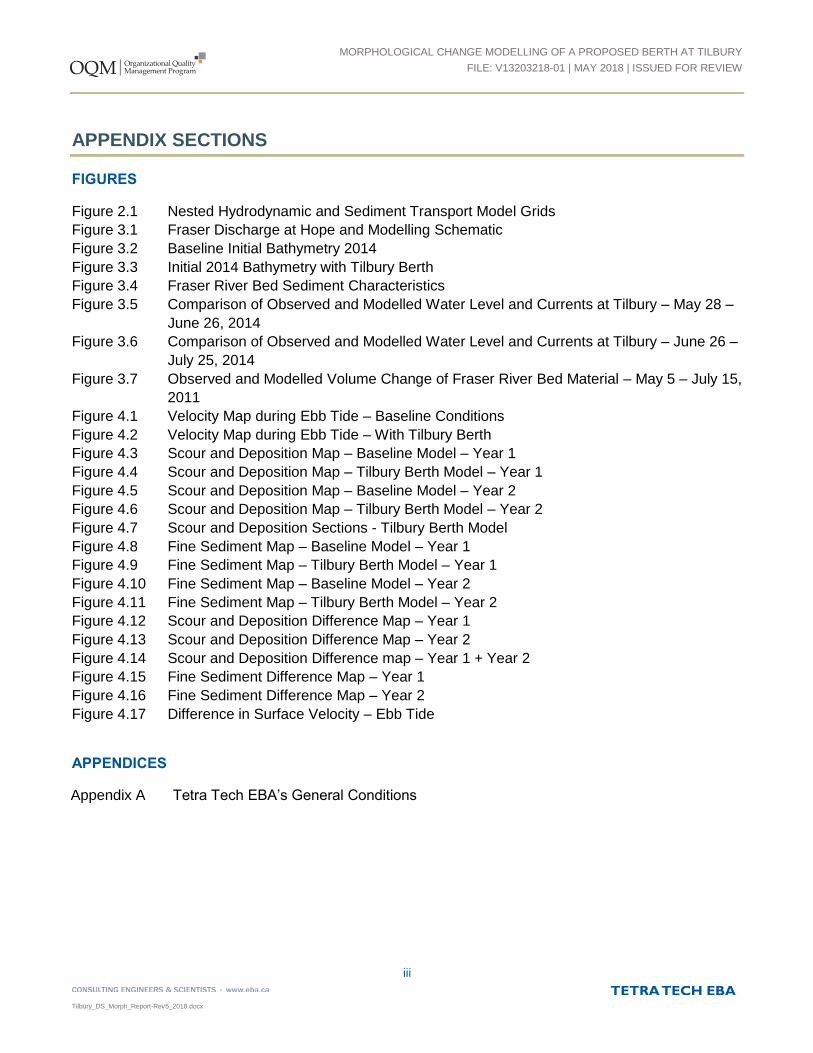
MORPHOLOGICAL CHANGE MODELLING OF A PROPOSED BERTH AT TILBURY FILE: V13203218-01 | MAY 2018 | ISSUED FOR REVIEW
iii
Tilbury_DS_Morph_Report-Rev5_2018.docx
APPENDIX SECTIONS
FIGURES
Figure 2.1 Nested Hydrodynamic and Sediment Transport Model Grids
Figure 3.1 Fraser Discharge at Hope and Modelling Schematic
Figure 3.2 Baseline Initial Bathymetry 2014
Figure 3.3 Initial 2014 Bathymetry with Tilbury Berth
Figure 3.4 Fraser River Bed Sediment Characteristics
Figure 3.5 Comparison of Observed and Modelled Water Level and Currents at Tilbury – May 28 – June 26, 2014
Figure 3.6 Comparison of Observed and Modelled Water Level and Currents at Tilbury – June 26 – July 25, 2014
Figure 3.7 Observed and Modelled Volume Change of Fraser River Bed Material – May 5 – July 15, 2011
Figure 4.1 Velocity Map during Ebb Tide – Baseline Conditions
Figure 4.2 Velocity Map during Ebb Tide – With Tilbury Berth
Figure 4.3 Scour and Deposition Map – Baseline Model – Year 1
Figure 4.4 Scour and Deposition Map – Tilbury Berth Model – Year 1
Figure 4.5 Scour and Deposition Map – Baseline Model – Year 2
Figure 4.6 Scour and Deposition Map – Tilbury Berth Model – Year 2
Figure 4.7 Scour and Deposition Sections - Tilbury Berth Model Figure 4.8 Fine Sediment Map – Baseline Model – Year 1
Figure 4.9 Fine Sediment Map – Tilbury Berth Model – Year 1
Figure 4.10 Fine Sediment Map – Baseline Model – Year 2
Figure 4.11 Fine Sediment Map – Tilbury Berth Model – Year 2
Figure 4.12 Scour and Deposition Difference Map – Year 1
Figure 4.13 Scour and Deposition Difference Map – Year 2
Figure 4.14 Scour and Deposition Difference map – Year 1 + Year 2
Figure 4.15 Fine Sediment Difference Map – Year 1
Figure 4.16 Fine Sediment Difference Map – Year 2
Figure 4.17 Difference in Surface Velocity – Ebb Tide
APPENDICES
Appendix A Tetra Tech EBA’s General Conditions
MORPHOLOGICAL CHANGE MODELLING OF A PROPOSED BERTH AT TILBURY FILE: V13203218-01 | MAY 2018 | ISSUED FOR REVIEW
iv
Tilbury_DS_Morph_Report-Rev5_2018.docx
LIMITATIONS OF REPORT This report and its contents are intended for the sole use of Ausenco and their agents. Tetra Tech EBA Inc. (Tetra Tech EBA) does not accept any responsibility for the accuracy of any of the data, the analysis, or the recommendations contained or referenced in the report when the report is used or relied upon by any Party other than Ausenco, or for any Project other than the proposed development at the subject site. Any such unauthorized use of this report is at the sole risk of the user. Use of this report is subject to the terms and conditions stated in Tetra Tech EBA’s Services Agreement. Tetra Tech EBA’s General Conditions are
provided in Appendix A of this report.
MORPHOLOGICAL CHANGE MODELLING OF A PROPOSED BERTH AT TILBURY FILE: V13203218-01 | MAY 2018 | ISSUED FOR REVIEW
1
Tilbury_DS_Morph_Report-Rev5_2018.docx
1.0 INTRODUCTION
Tetra Tech EBA Inc. (Tetra Tech EBA) has conducted morphological change modelling in the Fraser River downstream of a proposed LNG facility to define an environmental baseline with respect to river hydraulics and local geomorphology, and through the use of model comparisons define potential changes due to the construction of a vessel berth.
Tetra Tech EBA's in-house hydrodynamic and sediment transport model, H3D, was used to simulate the Fraser River in the region of the proposed development. H3D has been used in a number of similar studies on the Fraser River, most recently for evaluating land reclamation options near Steveston and determining the impacts of deepening the navigation channel to Fraser Surrey Docks. The modelling methods are described in Section 2.
The proposed LNG berth at Tilbury is located on the south bank of the Fraser River at km 22, about 3.5 km upstream of the Massey Tunnel. The berth approach channel is dredged to 9.0 m CD for navigation, and 11.5 m CD in the berth itself, and is generally parallel to the shoreline.
Environmental inputs to the model, including local bathymetry, the berth design, and observed and modelled sediment characteristics are discussed in Section 3.
The sediment model results (Section 4) include comparisons of general morphological change with and without the berth, and a comparison experiment focussed only on fine sediments. Representative velocity fields in the vicinity of the berth are presented for comparison.
2.0 METHODS
2.1 Hydrodynamic Model Description
Circulation and sediment transport were simulated using H3D, Tetra Tech EBA’s in-house circulation model. The model is derived from GF8 (Stronach, Backhaus and Murty, 1993), a three-dimensional circulation model developed for Fisheries and Oceans Canada. It is a three-dimensional time-stepping model that computes the three components of velocity (u, v, w) on a grid in three dimensions (x, y, z), as well as scalar fields such as temperature, oxygen and sediment concentration.
H3D’s spatial grid can be visualized as a number of interconnecting computational cells, which collectively represent the body of water. Velocities are determined on the faces of the cells, and scalar variables are situated in the centre of the cells. The model operates in a time-stepping mode over the period of simulation. During each time step, values of velocity, temperature, and any additional scalars are updated in each cell.
H3D includes comprehensive horizontal and vertical turbulence terms, a transport/diffusion algorithm for scalar fields such as effluents, flood/dry capability for foreshore banks, and time-varying depth in response to erosion/deposition of sediment.
The model used for this study operates in a nested configuration. The investigation of the circulation and sedimentation patterns near the Tilbury berth required a nominally 10-m resolution model of the region of interest embedded within a nominally 50-m resolution curvilinear model of the lower Fraser, from Sand Heads to Mission, which is in turn receives boundary data from a 1-km model of the entire Strait of Georgia (SOG). This nesting procedure allows high resolution in the area of interest, while at the same time, the model boundaries (the boundaries of the 1-km grid model, namely the Pacific Ocean and the Fraser at Hope, and the boundaries of the 50-m river model at Sand Heads and Port Mann Bridge) are far removed from the region of interest, so that small errors on the boundary will have negligible effects on the model results. The 1-km grid model, driven by wind and
MORPHOLOGICAL CHANGE MODELLING OF A PROPOSED BERTH AT TILBURY FILE: V13203218-01 | MAY 2018 | ISSUED FOR REVIEW
2
Tilbury_DS_Morph_Report-Rev5_2018.docx
density, as well as tidal conditions along its open boundaries bordering the northern and western entrances to the Strait of Georgia, includes a coarse representation of the Fraser River, extending upstream to km 41, with separate channels for the North Arm, the Main Arm and Sea Reach. At km 41, upstream of all salt wedge penetration, the model is dynamically coupled to a one-dimensional model of the Fraser River, extending to Hope. Tidal conditions are specified along the open boundaries of the 1-km SOG model. The 50-m lower Fraser River model is driven at its upstream end by a flow boundary condition specified by the dynamically-coupled one-dimensional model of the Fraser River, extending to Hope. At the downstream end, water levels and density profiles are obtained from the 1-km grid model, spatially interpolated from those cells of the 1-km grid model that correspond to the boundaries of the lower Fraser model. The geometry of all three grids and their nesting configuration is shown in Figure 2.1.
Turbulence modelling is important in determining the correct distribution of velocity and scalars (temperature, nutrients, and sediments) that can be both passive or active, conservative or non-conservative, and also subject to settling and re-suspension. The diffusion coefficients for momentum and scalars at each computational cell depend on the level of turbulence at that point. H3D uses a shear-dependent turbulence formulation in the horizontal direction, and a shear- and stratification- dependent formulation in the vertical direction. A similar approach is taken for diffusion of scalars.
2.2 Sediment Transport Model Description
Two sediment transport processes are important in the river environment: bed-load transport and suspended-load transport. Bed-load transport is the movement of particles by rolling, sliding and hopping. Suspended-load transport is the movement of particles which are in suspension. Combining the bed-load and suspended-load provides the total sediment load transported by the currents. The bed-load consists only of bed material for which the critical value for initiation of motion has been exceeded by the bed-shear velocity. The suspended-load consists of bed material subjected to upward turbulent forces strong enough to overcome the submerged particle weight resulting in particle suspension.
The sediment transport model used here is a three-dimensional suspended sediment model that calculates suspended sediment transport due to the force of currents on the river bottom and the ability of each computational cell to carry a specific amount of sediment. Observational studies by Langley (1971) have shown that almost all of the bed material transported in the lower Fraser River travels as suspended load, and hence the sediment transport model considers only suspended sediment transport.
For the simulations described here, the methods contained in Olsen and Kjellesvig (1999), Wu et al. (2000) and van Rijn (1993) have been implemented for the suspended sediment transport. Note that the computation of sediment transport involves several empirical formulas, determined in both laboratory flumes and in natural rivers. Examination of the experimental observations and the theoretical fits to data indicate a large variability between observed values and empirical fitted curves. This variability is the cause of considerable uncertainty in sediment transport modelling. The suspended sediment model is coupled to a morphology change model, described below.
Sand-sized sediment flux into the 50-metre Fraser River model at its upstream boundary is based on a sediment rating curve relating suspended sediment transport to discharge. The rating curve is calibrated based on observations at Mission from the 1970’s HYDAT data, and an analytical function is used to estimate vertical profiles
of sediment concentration at the upstream boundary.
MORPHOLOGICAL CHANGE MODELLING OF A PROPOSED BERTH AT TILBURY FILE: V13203218-01 | MAY 2018 | ISSUED FOR REVIEW
3
Tilbury_DS_Morph_Report-Rev5_2018.docx
2.2.1 Morphology Change Modelling Description
The morphology change module is fully coupled to the H3D hydrodynamic and suspended sediment model: time advances in small intervals, and at every time step the sediment concentration field, the spatial distribution of sediment fluxes, and the spatial distribution of erosion and accretion, are re-computed based on water currents. The bottom layer of the bottom cell, i.e., the river bed, can act as a source or a sink of sediment, depending on whether erosion or accretion is locally occurring. Sediment concentration in all cells above the bottom cell is governed by the processes of advection, diffusion, and settling. At every time step, each part of the river bed is examined to determine if transport of sediment occurs. The model geometry is continuously changing in response to the erosion/accretion processes, and the net erosion or accretion can be obtained by assessing the changes in model bathymetry, which are archived every hour over the course of the simulation. Thus, over time, one constructs a complete picture of the sediment processes and bathymetry changes, in much the same way as occurs in the real world.
The comparison of bathymetry in otherwise identical models that represent in one case baseline conditions and in the other case conditions with a dredged berth is the primary experimental method used to analyze the effect of the development. Both coarse and fine sediments are treated separately in the morphology model, such that sand could settle while fine sediment eroded. Each model cell contains a finite amount of available sediment in each size class, initialized as 2 metres of available sand, except that some cells are designated as armoured, and thus start out with no sediment available, but deposition is permitted. Armoured cells were chosen that overlap with dredge slopes, totalling 23,020 m2 of model area, essentially the same as the design 23,000 m2 of scour protection. The fine sediment initial condition is discussed below.
2.2.2 Fine Sediment Transport Comparison
Each model year was initialized with 20 micron silt, distributed uniformly throughout the model domain in a layer 5 cm thick. The purpose of this fine sediment was to focus on changes in potentially environmentally relevant sections of the river which contain materials other than the sand found in the main channel. The presence or absence of these fines after the model simulation provides an additional experiment, to supplement the one described in Section 2.2.1.
3.0 MODEL INPUTS AND VALIDATION
3.1 River Flow and Modelling Time Frame
The Fraser River flow rate fluctuates in response to the seasonal climate of its drainage basin. The freshet occurs in late-spring to early summer, driven by snow melt in the interior. Flow rate in the river is generally reported in terms of the discharge at Hope, although tributary inflows will make the actual flow at New Westminster, for instance, about 10% larger. The peak Hope discharge ranges up to 14,000 m3/s and is typically in the range of 6,000 m3/s to 8,000 m3/s. The timing of the freshet is driven by the occurrence of snow melt in the interior. The low flow period typically extends from October to April, during which time flows are typically less than 1,000 m3/s. The year 2014 was used in this study due to the availability of site-specific bathymetric and validation data. The 2014 Fraser River discharge (Figure 3.1) peaked on May 28 near 10,000 m3/s and the freshet, in terms of duration, was within one day of the median length of 63 days.
The modelling time frame is illustrated at the top of Figure 3.1. The models with baseline bathymetry and with the berth are both initialized from rest at the beginning of Year 1, April 26. The models run until mid-September, when flows drop to 2,000 m3/s. The final bathymetry in each model is then moved to a new run, and for the model with the Tilbury berth in place ‘maintenance dredging’ is carried out, returning the berth to its design dimensions. The
second year of simulation is then started, also with the calendar 2014 Fraser hydrograph.
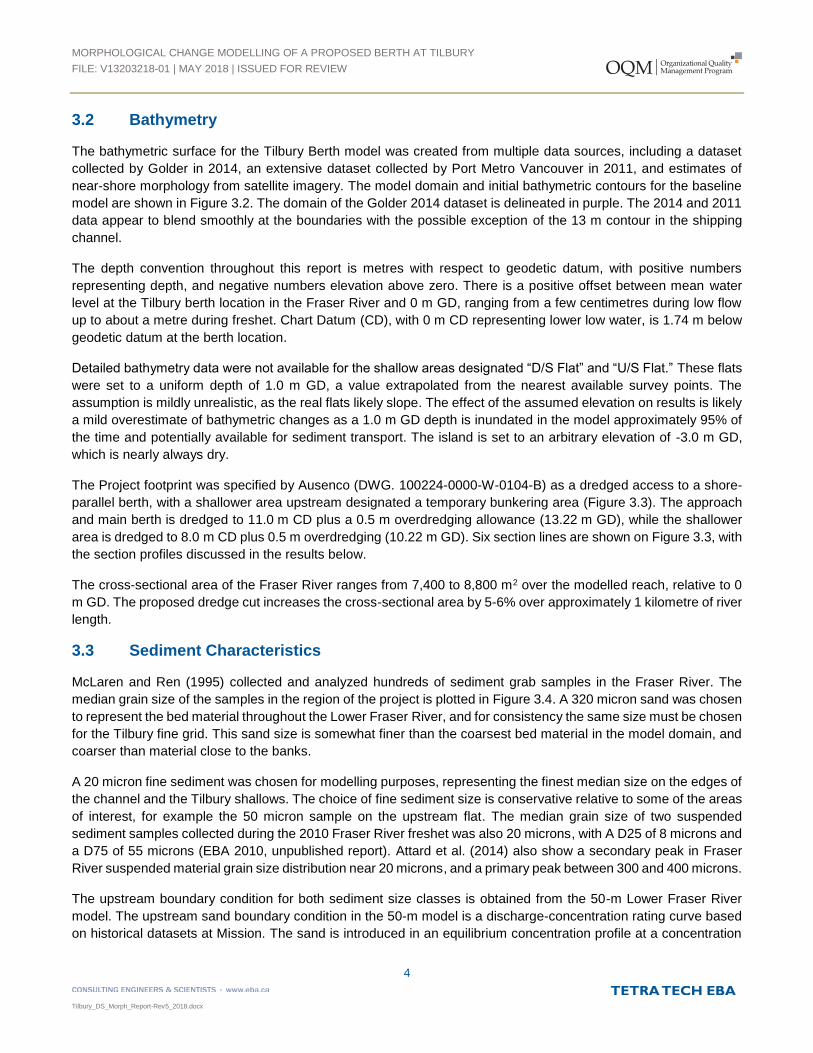
MORPHOLOGICAL CHANGE MODELLING OF A PROPOSED BERTH AT TILBURY FILE: V13203218-01 | MAY 2018 | ISSUED FOR REVIEW
4
Tilbury_DS_Morph_Report-Rev5_2018.docx
3.2 Bathymetry
The bathymetric surface for the Tilbury Berth model was created from multiple data sources, including a dataset collected by Golder in 2014, an extensive dataset collected by Port Metro Vancouver in 2011, and estimates of near-shore morphology from satellite imagery. The model domain and initial bathymetric contours for the baseline model are shown in Figure 3.2. The domain of the Golder 2014 dataset is delineated in purple. The 2014 and 2011 data appear to blend smoothly at the boundaries with the possible exception of the 13 m contour in the shipping channel.
The depth convention throughout this report is metres with respect to geodetic datum, with positive numbers representing depth, and negative numbers elevation above zero. There is a positive offset between mean water level at the Tilbury berth location in the Fraser River and 0 m GD, ranging from a few centimetres during low flow up to about a metre during freshet. Chart Datum (CD), with 0 m CD representing lower low water, is 1.74 m below geodetic datum at the berth location.
Detailed bathymetry data were not available for the shallow areas designated “D/S Flat” and “U/S Flat.” These flats were set to a uniform depth of 1.0 m GD, a value extrapolated from the nearest available survey points. The assumption is mildly unrealistic, as the real flats likely slope. The effect of the assumed elevation on results is likely a mild overestimate of bathymetric changes as a 1.0 m GD depth is inundated in the model approximately 95% of the time and potentially available for sediment transport. The island is set to an arbitrary elevation of -3.0 m GD, which is nearly always dry.
The Project footprint was specified by Ausenco (DWG. 100224-0000-W-0104-B) as a dredged access to a shore-parallel berth, with a shallower area upstream designated a temporary bunkering area (Figure 3.3). The approach and main berth is dredged to 11.0 m CD plus a 0.5 m overdredging allowance (13.22 m GD), while the shallower area is dredged to 8.0 m CD plus 0.5 m overdredging (10.22 m GD). Six section lines are shown on Figure 3.3, with the section profiles discussed in the results below.
The cross-sectional area of the Fraser River ranges from 7,400 to 8,800 m2 over the modelled reach, relative to 0 m GD. The proposed dredge cut increases the cross-sectional area by 5-6% over approximately 1 kilometre of river length.
3.3 Sediment Characteristics
McLaren and Ren (1995) collected and analyzed hundreds of sediment grab samples in the Fraser River. The median grain size of the samples in the region of the project is plotted in Figure 3.4. A 320 micron sand was chosen to represent the bed material throughout the Lower Fraser River, and for consistency the same size must be chosen for the Tilbury fine grid. This sand size is somewhat finer than the coarsest bed material in the model domain, and coarser than material close to the banks.
A 20 micron fine sediment was chosen for modelling purposes, representing the finest median size on the edges of the channel and the Tilbury shallows. The choice of fine sediment size is conservative relative to some of the areas of interest, for example the 50 micron sample on the upstream flat. The median grain size of two suspended sediment samples collected during the 2010 Fraser River freshet was also 20 microns, with A D25 of 8 microns and a D75 of 55 microns (EBA 2010, unpublished report). Attard et al. (2014) also show a secondary peak in Fraser River suspended material grain size distribution near 20 microns, and a primary peak between 300 and 400 microns.
The upstream boundary condition for both sediment size classes is obtained from the 50-m Lower Fraser River model. The upstream sand boundary condition in the 50-m model is a discharge-concentration rating curve based on historical datasets at Mission. The sand is introduced in an equilibrium concentration profile at a concentration
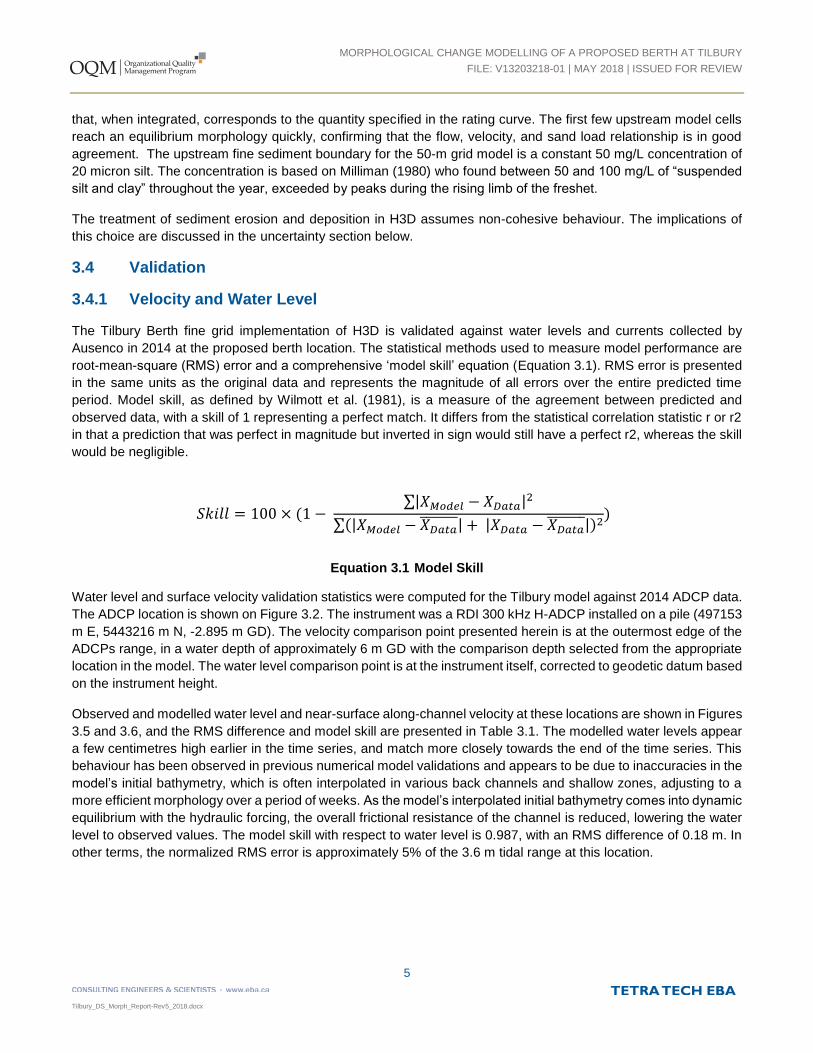
MORPHOLOGICAL CHANGE MODELLING OF A PROPOSED BERTH AT TILBURY FILE: V13203218-01 | MAY 2018 | ISSUED FOR REVIEW
5
Tilbury_DS_Morph_Report-Rev5_2018.docx
that, when integrated, corresponds to the quantity specified in the rating curve. The first few upstream model cells reach an equilibrium morphology quickly, confirming that the flow, velocity, and sand load relationship is in good agreement. The upstream fine sediment boundary for the 50-m grid model is a constant 50 mg/L concentration of 20 micron silt. The concentration is based on Milliman (1980) who found between 50 and 100 mg/L of “suspended
silt and clay” throughout the year, exceeded by peaks during the rising limb of the freshet.
The treatment of sediment erosion and deposition in H3D assumes non-cohesive behaviour. The implications of this choice are discussed in the uncertainty section below.
3.4 Validation
3.4.1 Velocity and Water Level
The Tilbury Berth fine grid implementation of H3D is validated against water levels and currents collected by Ausenco in 2014 at the proposed berth location. The statistical methods used to measure model performance are root-mean-square (RMS) error and a comprehensive ‘model skill’ equation (Equation 3.1). RMS error is presented in the same units as the original data and represents the magnitude of all errors over the entire predicted time period. Model skill, as defined by Wilmott et al. (1981), is a measure of the agreement between predicted and observed data, with a skill of 1 representing a perfect match. It differs from the statistical correlation statistic r or r2 in that a prediction that was perfect in magnitude but inverted in sign would still have a perfect r2, whereas the skill would be negligible.
𝑆𝑘𝑖𝑙𝑙 = 100 × (1 − ∑|𝑋𝑀𝑜𝑑𝑒𝑙 − 𝑋𝐷𝑎𝑡𝑎|2
∑(|𝑋𝑀𝑜𝑑𝑒𝑙 − 𝑋𝐷𝑎𝑡𝑎 | + |𝑋𝐷𝑎𝑡𝑎 − 𝑋𝐷𝑎𝑡𝑎
|)2)
Equation 3.1 Model Skill
Water level and surface velocity validation statistics were computed for the Tilbury model against 2014 ADCP data. The ADCP location is shown on Figure 3.2. The instrument was a RDI 300 kHz H-ADCP installed on a pile (497153 m E, 5443216 m N, -2.895 m GD). The velocity comparison point presented herein is at the outermost edge of the ADCPs range, in a water depth of approximately 6 m GD with the comparison depth selected from the appropriate location in the model. The water level comparison point is at the instrument itself, corrected to geodetic datum based on the instrument height.
Observed and modelled water level and near-surface along-channel velocity at these locations are shown in Figures 3.5 and 3.6, and the RMS difference and model skill are presented in Table 3.1. The modelled water levels appear a few centimetres high earlier in the time series, and match more closely towards the end of the time series. This behaviour has been observed in previous numerical model validations and appears to be due to inaccuracies in the model’s initial bathymetry, which is often interpolated in various back channels and shallow zones, adjusting to a more efficient morphology over a period of weeks. As the model’s interpolated initial bathymetry comes into dynamic
equilibrium with the hydraulic forcing, the overall frictional resistance of the channel is reduced, lowering the water level to observed values. The model skill with respect to water level is 0.987, with an RMS difference of 0.18 m. In other terms, the normalized RMS error is approximately 5% of the 3.6 m tidal range at this location.
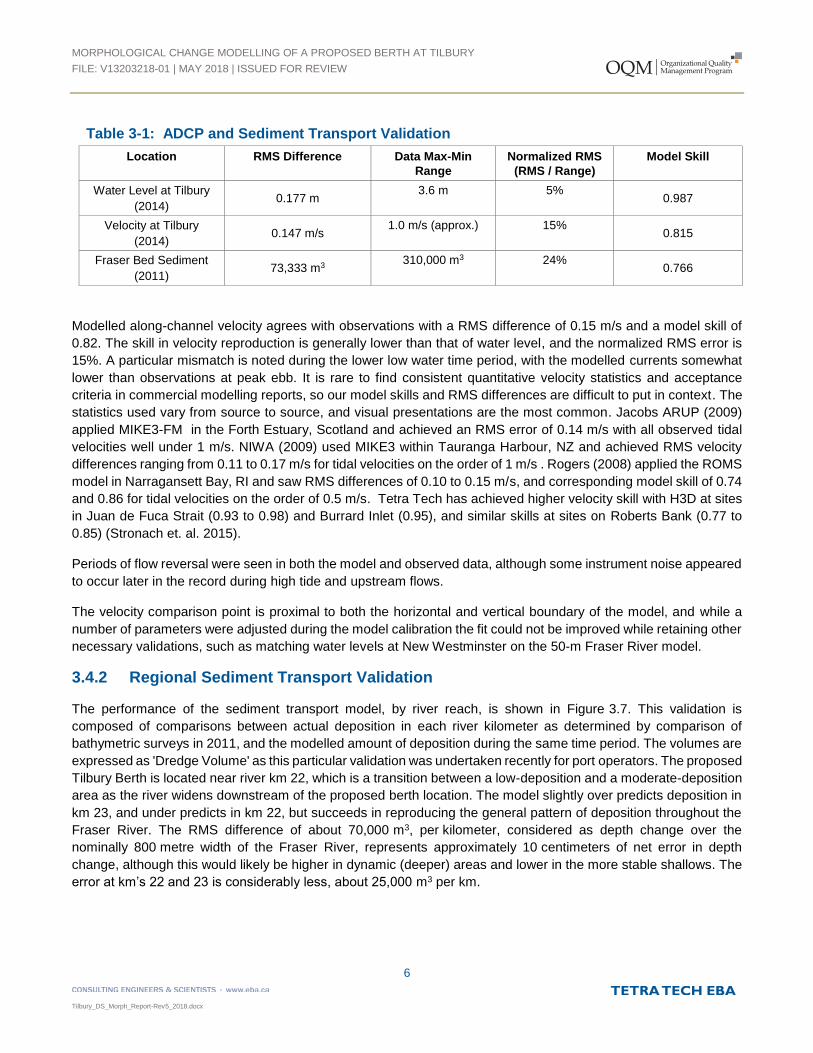
MORPHOLOGICAL CHANGE MODELLING OF A PROPOSED BERTH AT TILBURY FILE: V13203218-01 | MAY 2018 | ISSUED FOR REVIEW
6
Tilbury_DS_Morph_Report-Rev5_2018.docx
Table 3-1: ADCP and Sediment Transport Validation Location RMS Difference Data Max-Min
Range Normalized RMS
(RMS / Range) Model Skill
Water Level at Tilbury (2014)
0.177 m 3.6 m 5%
0.987
Velocity at Tilbury (2014)
0.147 m/s 1.0 m/s (approx.) 15%
0.815
Fraser Bed Sediment (2011)
73,333 m3 310,000 m3 24%
0.766
Modelled along-channel velocity agrees with observations with a RMS difference of 0.15 m/s and a model skill of 0.82. The skill in velocity reproduction is generally lower than that of water level, and the normalized RMS error is 15%. A particular mismatch is noted during the lower low water time period, with the modelled currents somewhat lower than observations at peak ebb. It is rare to find consistent quantitative velocity statistics and acceptance criteria in commercial modelling reports, so our model skills and RMS differences are difficult to put in context. The statistics used vary from source to source, and visual presentations are the most common. Jacobs ARUP (2009) applied MIKE3-FM in the Forth Estuary, Scotland and achieved an RMS error of 0.14 m/s with all observed tidal velocities well under 1 m/s. NIWA (2009) used MIKE3 within Tauranga Harbour, NZ and achieved RMS velocity differences ranging from 0.11 to 0.17 m/s for tidal velocities on the order of 1 m/s . Rogers (2008) applied the ROMS model in Narragansett Bay, RI and saw RMS differences of 0.10 to 0.15 m/s, and corresponding model skill of 0.74 and 0.86 for tidal velocities on the order of 0.5 m/s. Tetra Tech has achieved higher velocity skill with H3D at sites in Juan de Fuca Strait (0.93 to 0.98) and Burrard Inlet (0.95), and similar skills at sites on Roberts Bank (0.77 to 0.85) (Stronach et. al. 2015).
Periods of flow reversal were seen in both the model and observed data, although some instrument noise appeared to occur later in the record during high tide and upstream flows.
The velocity comparison point is proximal to both the horizontal and vertical boundary of the model, and while a number of parameters were adjusted during the model calibration the fit could not be improved while retaining other necessary validations, such as matching water levels at New Westminster on the 50-m Fraser River model.
3.4.2 Regional Sediment Transport Validation
The performance of the sediment transport model, by river reach, is shown in Figure 3.7. This validation is composed of comparisons between actual deposition in each river kilometer as determined by comparison of bathymetric surveys in 2011, and the modelled amount of deposition during the same time period. The volumes are expressed as 'Dredge Volume' as this particular validation was undertaken recently for port operators. The proposed Tilbury Berth is located near river km 22, which is a transition between a low-deposition and a moderate-deposition area as the river widens downstream of the proposed berth location. The model slightly over predicts deposition in km 23, and under predicts in km 22, but succeeds in reproducing the general pattern of deposition throughout the Fraser River. The RMS difference of about 70,000 m3, per kilometer, considered as depth change over the nominally 800 metre width of the Fraser River, represents approximately 10 centimeters of net error in depth change, although this would likely be higher in dynamic (deeper) areas and lower in the more stable shallows. The error at km’s 22 and 23 is considerably less, about 25,000 m3 per km.
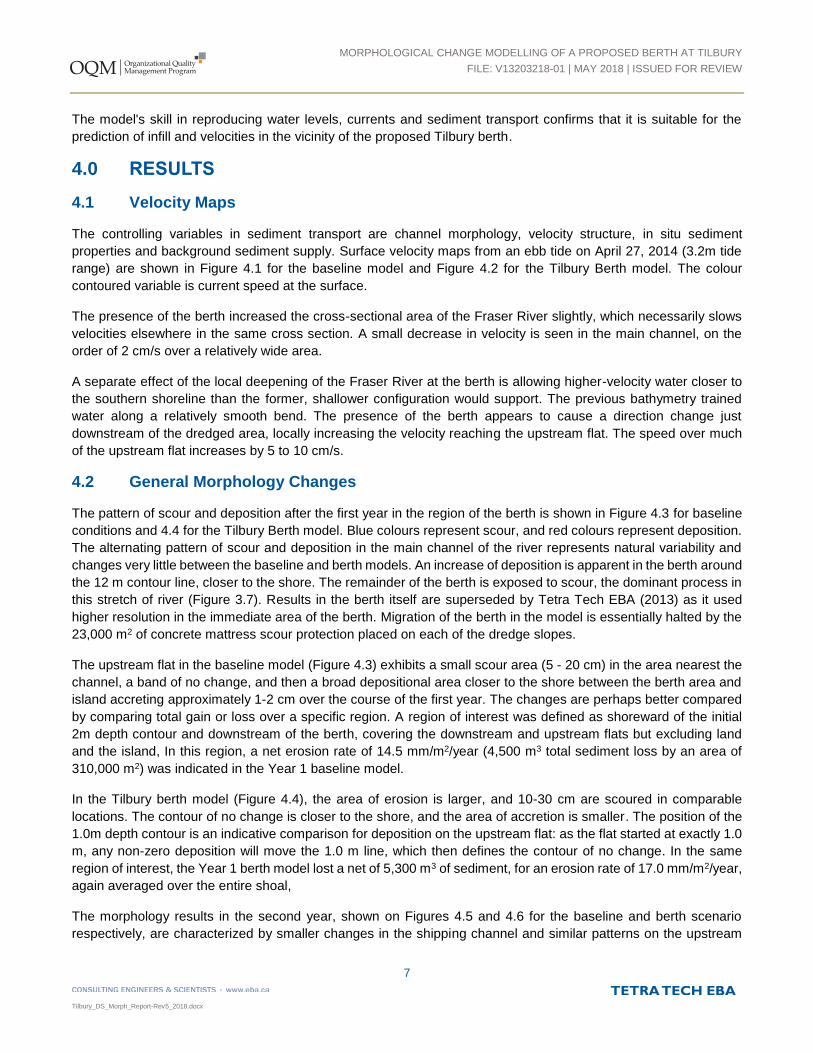
MORPHOLOGICAL CHANGE MODELLING OF A PROPOSED BERTH AT TILBURY FILE: V13203218-01 | MAY 2018 | ISSUED FOR REVIEW
7
Tilbury_DS_Morph_Report-Rev5_2018.docx
The model's skill in reproducing water levels, currents and sediment transport confirms that it is suitable for the prediction of infill and velocities in the vicinity of the proposed Tilbury berth.
4.0 RESULTS
4.1 Velocity Maps
The controlling variables in sediment transport are channel morphology, velocity structure, in situ sediment properties and background sediment supply. Surface velocity maps from an ebb tide on April 27, 2014 (3.2m tide range) are shown in Figure 4.1 for the baseline model and Figure 4.2 for the Tilbury Berth model. The colour contoured variable is current speed at the surface.
The presence of the berth increased the cross-sectional area of the Fraser River slightly, which necessarily slows velocities elsewhere in the same cross section. A small decrease in velocity is seen in the main channel, on the order of 2 cm/s over a relatively wide area.
A separate effect of the local deepening of the Fraser River at the berth is allowing higher-velocity water closer to the southern shoreline than the former, shallower configuration would support. The previous bathymetry trained water along a relatively smooth bend. The presence of the berth appears to cause a direction change just downstream of the dredged area, locally increasing the velocity reaching the upstream flat. The speed over much of the upstream flat increases by 5 to 10 cm/s.
4.2 General Morphology Changes
The pattern of scour and deposition after the first year in the region of the berth is shown in Figure 4.3 for baseline conditions and 4.4 for the Tilbury Berth model. Blue colours represent scour, and red colours represent deposition. The alternating pattern of scour and deposition in the main channel of the river represents natural variability and changes very little between the baseline and berth models. An increase of deposition is apparent in the berth around the 12 m contour line, closer to the shore. The remainder of the berth is exposed to scour, the dominant process in this stretch of river (Figure 3.7). Results in the berth itself are superseded by Tetra Tech EBA (2013) as it used higher resolution in the immediate area of the berth. Migration of the berth in the model is essentially halted by the 23,000 m2 of concrete mattress scour protection placed on each of the dredge slopes.
The upstream flat in the baseline model (Figure 4.3) exhibits a small scour area (5 - 20 cm) in the area nearest the channel, a band of no change, and then a broad depositional area closer to the shore between the berth area and island accreting approximately 1-2 cm over the course of the first year. The changes are perhaps better compared by comparing total gain or loss over a specific region. A region of interest was defined as shoreward of the initial 2m depth contour and downstream of the berth, covering the downstream and upstream flats but excluding land and the island, In this region, a net erosion rate of 14.5 mm/m2/year (4,500 m3 total sediment loss by an area of 310,000 m2) was indicated in the Year 1 baseline model.
In the Tilbury berth model (Figure 4.4), the area of erosion is larger, and 10-30 cm are scoured in comparable locations. The contour of no change is closer to the shore, and the area of accretion is smaller. The position of the 1.0m depth contour is an indicative comparison for deposition on the upstream flat: as the flat started at exactly 1.0 m, any non-zero deposition will move the 1.0 m line, which then defines the contour of no change. In the same region of interest, the Year 1 berth model lost a net of 5,300 m3 of sediment, for an erosion rate of 17.0 mm/m2/year, again averaged over the entire shoal,
The morphology results in the second year, shown on Figures 4.5 and 4.6 for the baseline and berth scenario respectively, are characterized by smaller changes in the shipping channel and similar patterns on the upstream
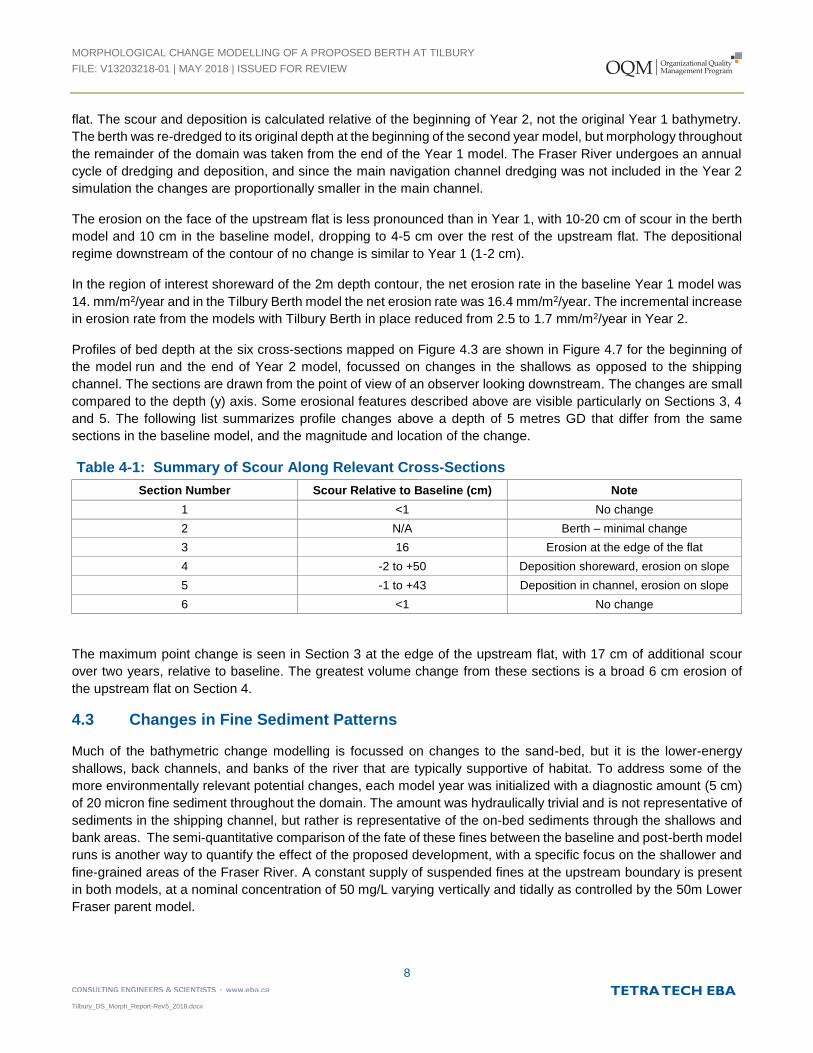
MORPHOLOGICAL CHANGE MODELLING OF A PROPOSED BERTH AT TILBURY FILE: V13203218-01 | MAY 2018 | ISSUED FOR REVIEW
8
Tilbury_DS_Morph_Report-Rev5_2018.docx
flat. The scour and deposition is calculated relative of the beginning of Year 2, not the original Year 1 bathymetry. The berth was re-dredged to its original depth at the beginning of the second year model, but morphology throughout the remainder of the domain was taken from the end of the Year 1 model. The Fraser River undergoes an annual cycle of dredging and deposition, and since the main navigation channel dredging was not included in the Year 2 simulation the changes are proportionally smaller in the main channel.
The erosion on the face of the upstream flat is less pronounced than in Year 1, with 10-20 cm of scour in the berth model and 10 cm in the baseline model, dropping to 4-5 cm over the rest of the upstream flat. The depositional regime downstream of the contour of no change is similar to Year 1 (1-2 cm).
In the region of interest shoreward of the 2m depth contour, the net erosion rate in the baseline Year 1 model was 14. mm/m2/year and in the Tilbury Berth model the net erosion rate was 16.4 mm/m2/year. The incremental increase in erosion rate from the models with Tilbury Berth in place reduced from 2.5 to 1.7 mm/m2/year in Year 2.
Profiles of bed depth at the six cross-sections mapped on Figure 4.3 are shown in Figure 4.7 for the beginning of the model run and the end of Year 2 model, focussed on changes in the shallows as opposed to the shipping channel. The sections are drawn from the point of view of an observer looking downstream. The changes are small compared to the depth (y) axis. Some erosional features described above are visible particularly on Sections 3, 4 and 5. The following list summarizes profile changes above a depth of 5 metres GD that differ from the same sections in the baseline model, and the magnitude and location of the change.
Table 4-1: Summary of Scour Along Relevant Cross-Sections Section Number Scour Relative to Baseline (cm) Note
1 <1 No change 2 N/A Berth – minimal change 3 16 Erosion at the edge of the flat 4 -2 to +50 Deposition shoreward, erosion on slope 5 -1 to +43 Deposition in channel, erosion on slope 6 <1 No change
The maximum point change is seen in Section 3 at the edge of the upstream flat, with 17 cm of additional scour over two years, relative to baseline. The greatest volume change from these sections is a broad 6 cm erosion of the upstream flat on Section 4.
4.3 Changes in Fine Sediment Patterns
Much of the bathymetric change modelling is focussed on changes to the sand-bed, but it is the lower-energy shallows, back channels, and banks of the river that are typically supportive of habitat. To address some of the more environmentally relevant potential changes, each model year was initialized with a diagnostic amount (5 cm) of 20 micron fine sediment throughout the domain. The amount was hydraulically trivial and is not representative of sediments in the shipping channel, but rather is representative of the on-bed sediments through the shallows and bank areas. The semi-quantitative comparison of the fate of these fines between the baseline and post-berth model runs is another way to quantify the effect of the proposed development, with a specific focus on the shallower and fine-grained areas of the Fraser River. A constant supply of suspended fines at the upstream boundary is present in both models, at a nominal concentration of 50 mg/L varying vertically and tidally as controlled by the 50m Lower Fraser parent model.

MORPHOLOGICAL CHANGE MODELLING OF A PROPOSED BERTH AT TILBURY FILE: V13203218-01 | MAY 2018 | ISSUED FOR REVIEW
9
Tilbury_DS_Morph_Report-Rev5_2018.docx
The presence of fine sediment at the end of the first year of the baseline model is shown in Figure 4.8. The initial amount of fines, 5 cm, is still present downstream of the island and on portions of the upstream flat. All fines in the main channel have been scoured away. Some modelling artefacts are seen near the boundary and can be ignored. An erosional and depositional cell is seen on the upstream face of the upstream flat, with partial survival of the initial fines on the face of the flat and deposition of eroded material closer to the banks.
Comparison of the baseline figure with the Tilbury Berth model (Figure 4.9) shows a wider area of fines erosion downstream of the berth area, as well as a depositional feature in the berth itself. The additional flow steered onto the upstream flat is sufficient to remove the diagnostic 20 micron silt from half of the upstream flat.
The same models were run for a second year, with a new layer of fines initialized and none of the fines from Year 1 retained. The resultant fine sediment patterns shown in Figure 4.10 and 4.11 for the baseline and Tilbury berth models respectively. The pattern in the baseline scenario is broadly similar to the first year (Figure 4.9) with the exception of a small high point blocking some flow and providing a starting point for deposition. The area of fine sediment erosion in the model with the berth in place is slightly smaller than in the first year but the face of the upstream flat is still subject to removal of fine sediment. No systematic changes are seen on the downstream flat. There is a minor increase (2 mm) in deposition in the upstream half of the channel behind the island in both modelled years.
4.4 Difference Maps
The patterns shown in Figures 4.3 – 4.6 for scour and deposition and 4.8 – 4.11 for fine sediment presence compare the final geometry of a modelled case with its initial condition to produce a change map. The change maps of the model with the berth in place can also be differenced with the change map of the baseline case to produce a map that focusses on the differences between the two models. The change maps are not a simple subtraction of the final geometry as then the dredged areas would be off of the colour scale.
Figures 4.12 and 4.13 show morphology change maps for Year 1 and Year 2 respectively. In this case, red colours indicate that there was either more deposition or less scour in the model with Tilbury Berth in place. Figure 4.14 shows the combined changes of Years 1 and 2 together.
Figures 4.15 and 4.16 show fine sediment change maps, with red indicating more fines present in the model with the berth.
Figure 4.17 and 4.18 show a difference map of surface and bottom velocity, respectively. The difference maps correspond to the date shown in Figures 4.1 and 4.2. Direction information is not retained in the differencing, only the magnitude of velocity change.
All of the scour and deposition maps and other change maps are summarized in Table 4.2, with the arithmetic used to colour each map and an interpretation of the colour scale. It is important to note that the change maps do not represent the absolute change in either model, but the difference between baseline and Project models.
Table 4-2: Difference Map Arithmetic Figure Equation Colour Interpretation:
Figure 4.3 Base[Y1final] – Base[Y1start] Red is deposition over time Figure 4.4 Berth[Y1final] – Berth[Y1start] “ Figure 4.5 Base[Y2final] – Base[Y2start] “ Figure 4.6 Berth[Y2final] – Berth[Y2start] “
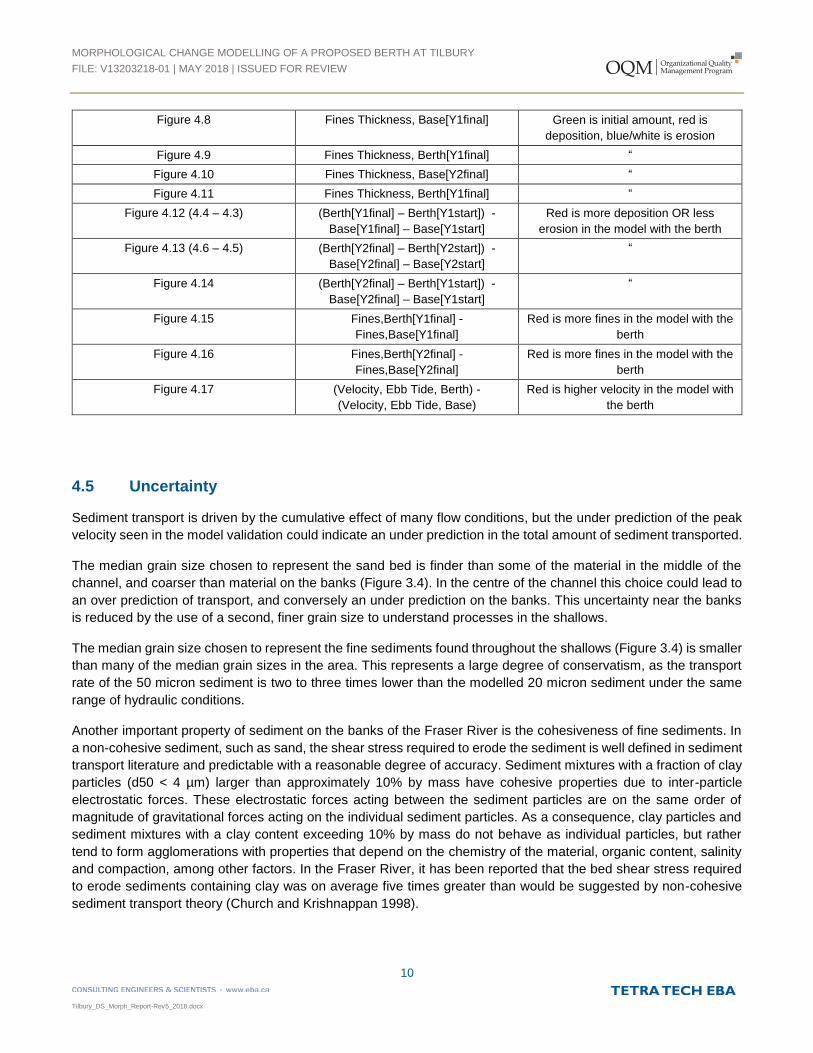
MORPHOLOGICAL CHANGE MODELLING OF A PROPOSED BERTH AT TILBURY FILE: V13203218-01 | MAY 2018 | ISSUED FOR REVIEW
10
Tilbury_DS_Morph_Report-Rev5_2018.docx
Figure 4.8 Fines Thickness, Base[Y1final] Green is initial amount, red is deposition, blue/white is erosion
Figure 4.9 Fines Thickness, Berth[Y1final] “ Figure 4.10 Fines Thickness, Base[Y2final] “ Figure 4.11 Fines Thickness, Berth[Y1final] “
Figure 4.12 (4.4 – 4.3) (Berth[Y1final] – Berth[Y1start]) - Base[Y1final] – Base[Y1start]
Red is more deposition OR less erosion in the model with the berth
Figure 4.13 (4.6 – 4.5) (Berth[Y2final] – Berth[Y2start]) - Base[Y2final] – Base[Y2start]
“
Figure 4.14 (Berth[Y2final] – Berth[Y1start]) - Base[Y2final] – Base[Y1start]
“
Figure 4.15 Fines,Berth[Y1final] - Fines,Base[Y1final]
Red is more fines in the model with the berth
Figure 4.16 Fines,Berth[Y2final] - Fines,Base[Y2final]
Red is more fines in the model with the berth
Figure 4.17 (Velocity, Ebb Tide, Berth) - (Velocity, Ebb Tide, Base)
Red is higher velocity in the model with the berth
4.5 Uncertainty
Sediment transport is driven by the cumulative effect of many flow conditions, but the under prediction of the peak velocity seen in the model validation could indicate an under prediction in the total amount of sediment transported.
The median grain size chosen to represent the sand bed is finder than some of the material in the middle of the channel, and coarser than material on the banks (Figure 3.4). In the centre of the channel this choice could lead to an over prediction of transport, and conversely an under prediction on the banks. This uncertainty near the banks is reduced by the use of a second, finer grain size to understand processes in the shallows.
The median grain size chosen to represent the fine sediments found throughout the shallows (Figure 3.4) is smaller than many of the median grain sizes in the area. This represents a large degree of conservatism, as the transport rate of the 50 micron sediment is two to three times lower than the modelled 20 micron sediment under the same range of hydraulic conditions.
Another important property of sediment on the banks of the Fraser River is the cohesiveness of fine sediments. In a non-cohesive sediment, such as sand, the shear stress required to erode the sediment is well defined in sediment transport literature and predictable with a reasonable degree of accuracy. Sediment mixtures with a fraction of clay particles (d50 < 4 µm) larger than approximately 10% by mass have cohesive properties due to inter-particle electrostatic forces. These electrostatic forces acting between the sediment particles are on the same order of magnitude of gravitational forces acting on the individual sediment particles. As a consequence, clay particles and sediment mixtures with a clay content exceeding 10% by mass do not behave as individual particles, but rather tend to form agglomerations with properties that depend on the chemistry of the material, organic content, salinity and compaction, among other factors. In the Fraser River, it has been reported that the bed shear stress required to erode sediments containing clay was on average five times greater than would be suggested by non-cohesive sediment transport theory (Church and Krishnappan 1998).
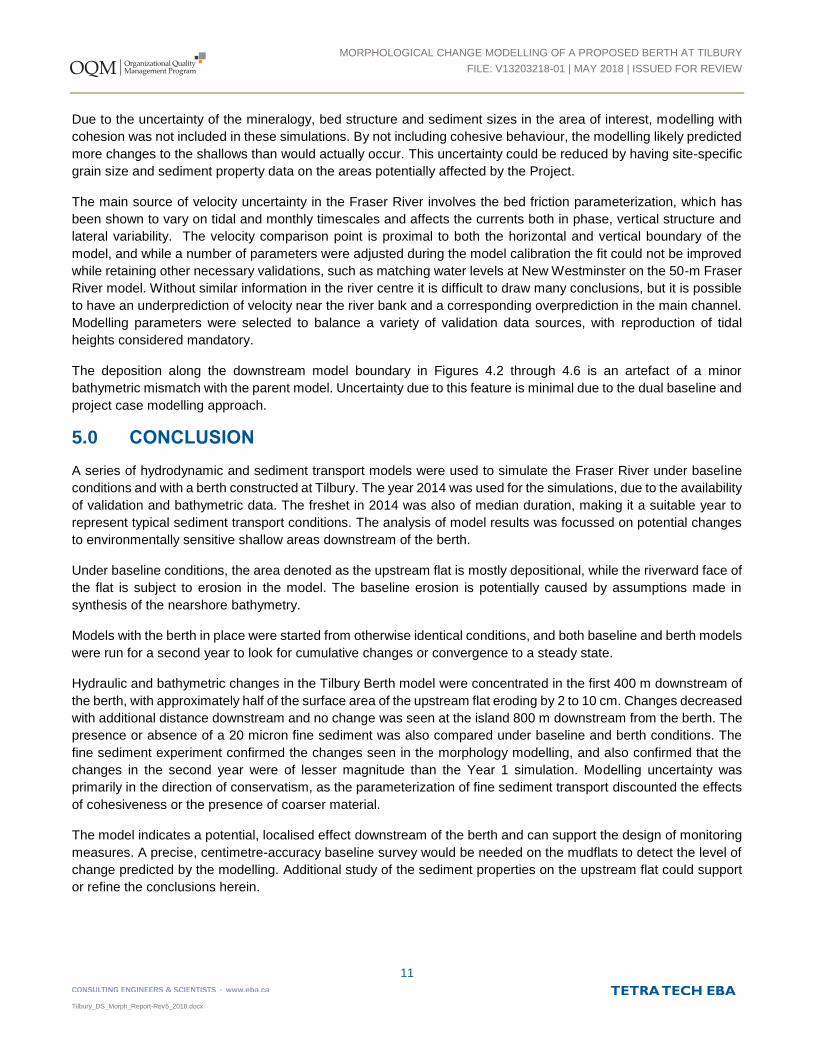
MORPHOLOGICAL CHANGE MODELLING OF A PROPOSED BERTH AT TILBURY FILE: V13203218-01 | MAY 2018 | ISSUED FOR REVIEW
11
Tilbury_DS_Morph_Report-Rev5_2018.docx
Due to the uncertainty of the mineralogy, bed structure and sediment sizes in the area of interest, modelling with cohesion was not included in these simulations. By not including cohesive behaviour, the modelling likely predicted more changes to the shallows than would actually occur. This uncertainty could be reduced by having site-specific grain size and sediment property data on the areas potentially affected by the Project.
The main source of velocity uncertainty in the Fraser River involves the bed friction parameterization, which has been shown to vary on tidal and monthly timescales and affects the currents both in phase, vertical structure and lateral variability. The velocity comparison point is proximal to both the horizontal and vertical boundary of the model, and while a number of parameters were adjusted during the model calibration the fit could not be improved while retaining other necessary validations, such as matching water levels at New Westminster on the 50-m Fraser River model. Without similar information in the river centre it is difficult to draw many conclusions, but it is possible to have an underprediction of velocity near the river bank and a corresponding overprediction in the main channel. Modelling parameters were selected to balance a variety of validation data sources, with reproduction of tidal heights considered mandatory.
The deposition along the downstream model boundary in Figures 4.2 through 4.6 is an artefact of a minor bathymetric mismatch with the parent model. Uncertainty due to this feature is minimal due to the dual baseline and project case modelling approach.
5.0 CONCLUSION
A series of hydrodynamic and sediment transport models were used to simulate the Fraser River under baseline conditions and with a berth constructed at Tilbury. The year 2014 was used for the simulations, due to the availability of validation and bathymetric data. The freshet in 2014 was also of median duration, making it a suitable year to represent typical sediment transport conditions. The analysis of model results was focussed on potential changes to environmentally sensitive shallow areas downstream of the berth.
Under baseline conditions, the area denoted as the upstream flat is mostly depositional, while the riverward face of the flat is subject to erosion in the model. The baseline erosion is potentially caused by assumptions made in synthesis of the nearshore bathymetry.
Models with the berth in place were started from otherwise identical conditions, and both baseline and berth models were run for a second year to look for cumulative changes or convergence to a steady state.
Hydraulic and bathymetric changes in the Tilbury Berth model were concentrated in the first 400 m downstream of the berth, with approximately half of the surface area of the upstream flat eroding by 2 to 10 cm. Changes decreased with additional distance downstream and no change was seen at the island 800 m downstream from the berth. The presence or absence of a 20 micron fine sediment was also compared under baseline and berth conditions. The fine sediment experiment confirmed the changes seen in the morphology modelling, and also confirmed that the changes in the second year were of lesser magnitude than the Year 1 simulation. Modelling uncertainty was primarily in the direction of conservatism, as the parameterization of fine sediment transport discounted the effects of cohesiveness or the presence of coarser material.
The model indicates a potential, localised effect downstream of the berth and can support the design of monitoring measures. A precise, centimetre-accuracy baseline survey would be needed on the mudflats to detect the level of change predicted by the modelling. Additional study of the sediment properties on the upstream flat could support or refine the conclusions herein.

MORPHOLOGICAL CHANGE MODELLING OF A PROPOSED BERTH AT TILBURY FILE: V13203218-01 | MAY 2018 | ISSUED FOR REVIEW
12
Tilbury_DS_Morph_Report-Rev5_2018.docx
6.0 CLOSURE
We trust this report meets your present requirements. If you have any questions or comments, please contact the undersigned.
Respectfully submitted, Tetra Tech EBA Inc. Prepared by: Prepared by: ISSUED FOR REVIEW ISSUED FOR REVIEW Justin Rogers, MSc. Albert Leung, M.A.Sc., P.Eng., PE. Oceanographer Hydrotechnical Engineer Direct Line: +64 3 336 5441 Direct Line: 778.945.5730 [email protected] [email protected] Reviewed by: ISSUED FOR REVIEW Jim Stronach, Ph.D., P.Eng. Principal Technical Specialist Direct Line: 778.945.5849 [email protected]
MORPHOLOGICAL CHANGE MODELLING OF A PROPOSED BERTH AT TILBURY FILE: V13203218-01 | MAY 2018 | ISSUED FOR REVIEW
13
Tilbury_DS_Morph_Report-Rev5_2018.docx
REFERENCES Church, M., Krishnappan, B.G., 1998, Sediment Sources, Transport Processes and Modelling Approaches for the
Fraser River, in C. Gray and T. Tuominen, eds., Health of the Fraser River Aquatic Ecosystem: Environment Canada, DOE FRAP 1998-11, 18pp.
Tetra Tech EBA 2016. Hydrodynamic and Sediment Transport Modelling of a Proposed Berth at Tilbury. January 2016.
Jacobs ARUP (2009) Forth Replacement Crossing DMRB Stage 3 Environmental Statement Appendix A9.1: Hydrodynamic Modelling. http://www.transport.gov.scot/sites/default/files/documents/rrd_reports/uploaded_reports/j11223/j11223-a91.pdf, accessed 2015
Langley, H.I., 1975. Bedload Sampling by Pumping. Department of Public Works, Canada, Pacific Region.
McLaren, P., and P. Ren. 1995. Sediment Transport and Its Environmental Implications in the Lower Fraser River and Fraser Delta. Environment Canada, Vancouver, B.C. DOE FRAP 199303.
Mellor, G. L., and T. Yamadad, 1982. Development of a turbulence closure model for geophysical fluid problems. Rev. Geophys. Space Phys., 20, 851-875.
Milliman, J.D. 1980. Sedimentation in the Fraser River and its Estuary, Southwestern British Columbia (Canada). Estuarine and Coastal Marine Science (1980) 10, 609-633
NIWA (2009). Tauranga Harbour Sediment Study: Hydrodynamic and Sediment Transport Modelling. http://www.boprc.govt.nz/media/32599/niwa-100225-thsshydrodynamicsedimenttransportmodel.pdf, accessed 2015.
Olsen, N.R.B. and H.M. Kjellesvig, 1999. Three-dimensional numerical modelling of bed changes in a sand trap. Journal of Hydraulic Research, 37, 189, 198.
Rogers, J. "Circulation and transport in upper Narragansett Bay."Narragansett Bay, Rhode Island: University of
Rhode Island Graduate School of Oceanography (2008).
Smagorinsky, J., 1963. General circulation experiments with the primitive equations. 1. The basic experiment, Mon. Weather Rev., 91, 99-164.
Stronach, J.A., Backhaus, J.O., and Murty T.S. 1993. An update on the numerical simulation of oceanographic processes in the waters between Vancouver island and the mainland: the GF9 model. Oceanography and marine Biology Annual Review, 31, 1-86.
Stronach J.A., J. Rogers, A. Hospital, and A. Oveisy. A Validated 3-D Hydrodynamic Model to Simulate the Fate of Dissolved Hydrocarbons, Proceedings of the CWRA-BC Conference, Richmond, BC, 2015.
Van Rijn, L.C., 1993. Principles of sediment transport in rivers, estuaries and coastal seas. Aqua Publications. Amsterdam. Vanoni, V.A., 1946.
Wu, W., W. Rodi and T. Wenka, 2000. 3D Numerical modelling of flow and sediment transport in open channels. ASCE Journal of Hydraulic Engineering, 126, 4-16.
.

MORPHOLOGICAL CHANGE MODELLING OF A PROPOSED BERTH AT TILBURY FILE: V13203218-01 | MAY 2018 | ISSUED FOR REVIEW
Tilbury_DS_Morph_Report-Rev5_2018.docx
FIGURES
Figure 2.1 Nested Hydrodynamic and Sediment Transport Model Grids
Figure 3.1 Fraser Discharge at Hope and Modelling Schematic
Figure 3.2 Baseline Initial Bathymetry 2014
Figure 3.3 Initial 2014 Bathymetry with Tilbury Berth
Figure 3.4 Fraser River Bed Sediment Characteristics
Figure 3.5 Comparison of Observed and Modelled Water Level and Currents at Tilbury – May 28 – June 26, 2014
Figure 3.6 Comparison of Observed and Modelled Water Level and Currents at Tilbury – June 26 – July 25, 2014
Figure 3.7 Observed and Modelled Volume Change of Fraser River Bed Material – May 5 – July 15, 2011
Figure 4.1 Velocity Map during Ebb Tide – Baseline Conditions
Figure 4.2 Velocity Map during Ebb Tide – With Tilbury Berth
Figure 4.3 Scour and Deposition Map – Baseline Model – Year 1
Figure 4.4 Scour and Deposition Map – Tilbury Berth Model – Year 1
Figure 4.5 Scour and Deposition Map – Baseline Model – Year 2
Figure 4.6 Scour and Deposition Map – Tilbury Berth Model – Year 2
Figure 4.7 Scour and Deposition Sections - Tilbury Berth Model
Figure 4.8 Fine Sediment Map – Baseline Model – Year 1
Figure 4.9 Fine Sediment Map – Tilbury Berth Model – Year 1
Figure 4.10 Fine Sediment Map – Baseline Model – Year 2
Figure 4.11 Fine Sediment Map – Tilbury Berth Model – Year 2
Figure 4.12 Scour and Deposition Difference Map – Year 1
Figure 4.13 Scour and Deposition Difference Map – Year 2
Figure 4.14 Scour and Deposition Difference map – Year 1 + Year 2
Figure 4.15 Fine Sediment Difference Map – Year 1
Figure 4.16 Fine Sediment Difference Map – Year 2
Figure 4.17 Difference in Surface Velocity – Ebb Tide

MORPHOLOGICAL CHANGE MODELLING OF A PROPOSED BERTH AT TILBURY FILE: V13203218-01 | MAY 2018 | ISSUED FOR REVIEW
Tilbury_DS_Morph_Report-Rev5_2018.docx
MORPHOLOGICAL CHANGE MODELLING OF A PROPOSED BERTH AT TILBURY FILE: V13203218-01 | MAY 2018 | ISSUED FOR REVIEW
Tilbury_DS_Morph_Report-Rev5_2018.docx
APPENDIX A TETRA TECH EBA’S GENERAL CONDITIONS
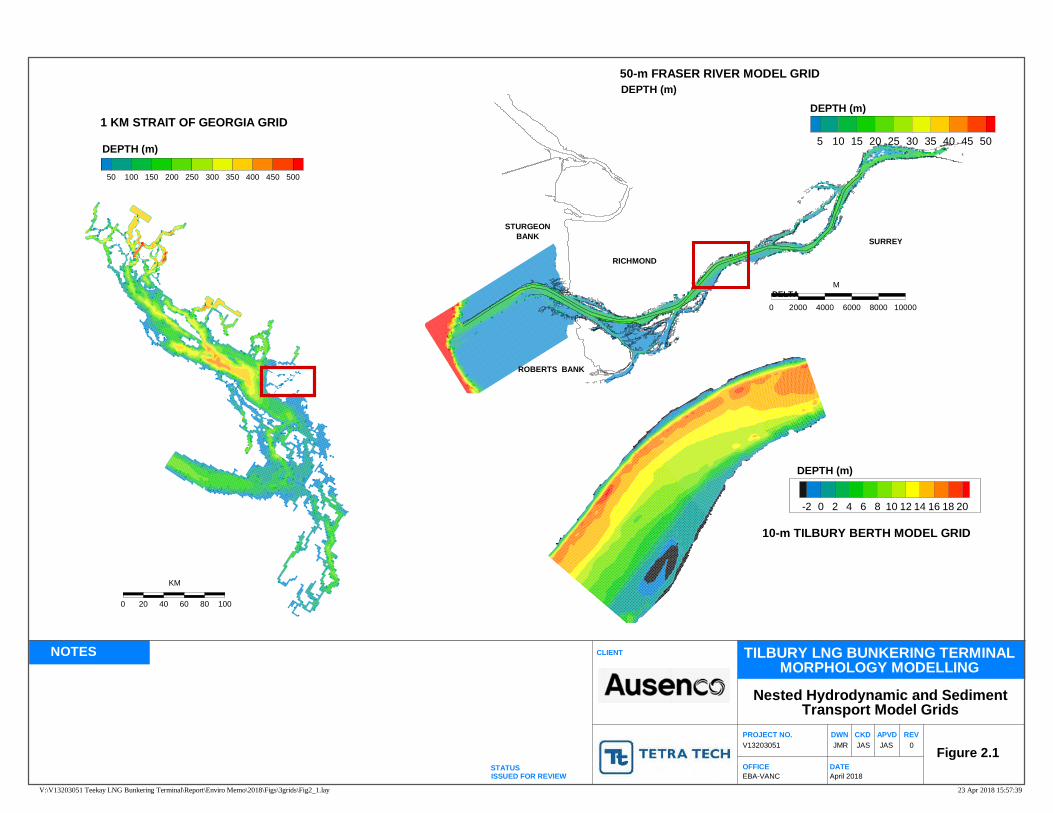
-2 0 2 4 6 8 10 12 14 16 18 20
DEPTH (m)
10-m TILBURY BERTH MODEL GRID
0 20 40 60 80 100
KM
50 100 150 200 250 300 350 400 450 500
1 KM STRAIT OF GEORGIA GRID
DEPTH (m)
0 2000 4000 6000 8000 10000
M
5 10 15 20 25 30 35 40 45 50
50-m FRASER RIVER MODEL GRID
DEPTH (m)
RICHMOND
STURGEONBANK
DELTA
SURREY
ROBERTS BANK
DEPTH (m)
NOTES
DATE
CLIENT
PROJECT NO.
V13203051
EBA-VANC
OFFICE
DWN
April 2018
JASJMR
APVD REV
0
ISSUED FOR REVIEW
Figure 2.1
TILBURY LNG BUNKERING TERMINALMORPHOLOGY MODELLING
23 Apr 2018 15:57:39V:\V13203051 Teekay LNG Bunkering Terminal\Report\Enviro Memo\2018\Figs\3grids\Fig2_1.lay
Nested Hydrodynamic and SedimentTransport Model Grids
JAS
CKD
STATUS
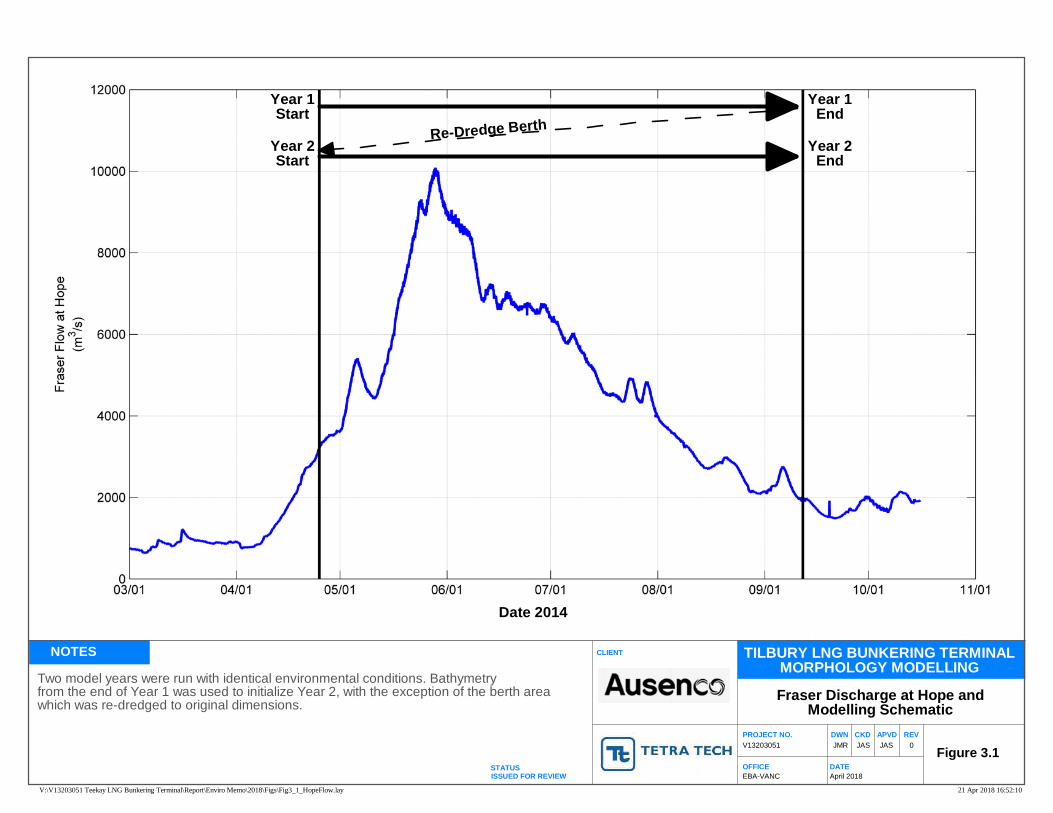
NOTES
DATE
CLIENT
PROJECT NO.
V13203051
EBA-VANC
OFFICE
DWN
April 2018
JASJMR
APVD REV
0
ISSUED FOR REVIEW
Figure 3.1
TILBURY LNG BUNKERING TERMINALMORPHOLOGY MODELLING
21 Apr 2018 16:52:10V:\V13203051 Teekay LNG Bunkering Terminal\Report\Enviro Memo\2018\Figs\Fig3_1_HopeFlow.lay
Fraser Discharge at Hope andModelling Schematic
JAS
CKD
STATUS
Two model years were run with identical environmental conditions. Bathymetryfrom the end of Year 1 was used to initialize Year 2, with the exception of the berth areawhich was re-dredged to original dimensions.
Year 1Start
Year 2Start
Year 1End
Year 2End
Re-Dredge Berth
Date 2014

NOTES
DATE
CLIENT
PROJECT NO.
V13203051
EBA-VANC
OFFICE
DWN
April 2018
JASJMR
APVD REV
0
ISSUED FOR REVIEW
Figure 3.2
TILBURY LNG BUNKERING TERMINALMORPHOLOGY MODELLING
21 Apr 2018 16:51:09V:\V13203051 Teekay LNG Bunkering Terminal\Report\Enviro Memo\2018\Figs\Fig3_2_Base_Bathy.lay
Baseline Initial Bathymetry 2014
JAS
CKD
STATUS
Model initialized from Golder (2014) bathymetric survey, where available.Bathymetry supplemented with historical pre-freshet dredging surveys, and airphotointerpretation.
Horizontal ADCP location marked by instrument mooring (o) and beam length (^)
IslandU/S Flat
D/S Flat Golder 2014 Bathymetry Extent
Depth (m GD)
ADCP

NOTES
DATE
CLIENT
PROJECT NO.
V13203051
EBA-VANC
OFFICE
DWN
April 2018
JASJMR
APVD REV
0
ISSUED FOR REVIEW
Figure 3.3
TILBURY LNG BUNKERING TERMINALMORPHOLOGY MODELLING
21 Apr 2018 16:50:30V:\V13203051 Teekay LNG Bunkering Terminal\Report\Enviro Memo\2018\Figs\Fig3_3_Project_Bathy.lay
Initial 2014 Bathymetry withTilbury Berth
JAS
CKD
STATUS
Model initialized from Golder (2014) bathymetric survey, where available.Bathymetry supplemented with historical pre-freshet dredging surveys, and airphotointerpretation.
Berth design interpreted from Ausenco design sketches and draft specifications.
Contour spacing 1 m above 10 m, 2 m below 10 m GD.
IslandU/S Flat
D/S Flat
Cross Section Locations
Depth (m GD)
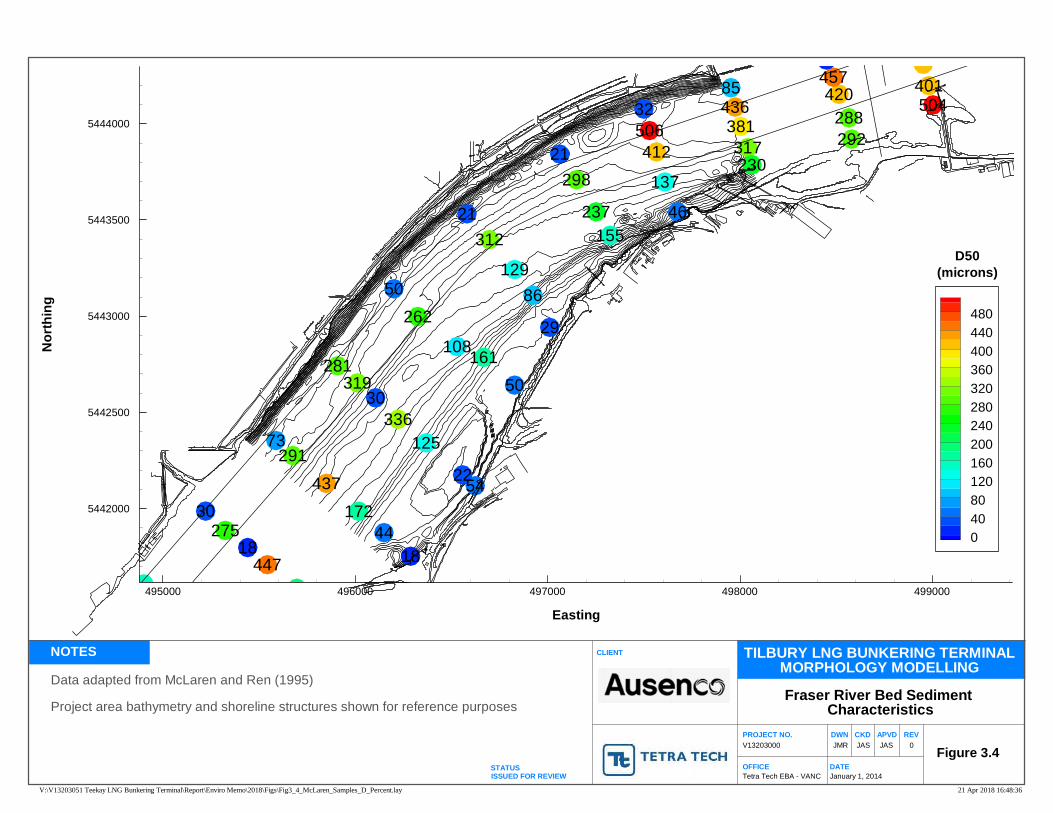
NOTES
DATE
CLIENT
PROJECT NO.
V13203000
Tetra Tech EBA - VANC
OFFICE
DWN
January 1, 2014
JASJMR
APVD REV
0
ISSUED FOR REVIEW
Figure 3.4
TILBURY LNG BUNKERING TERMINALMORPHOLOGY MODELLING
21 Apr 2018 16:48:36V:\V13203051 Teekay LNG Bunkering Terminal\Report\Enviro Memo\2018\Figs\Fig3_4_McLaren_Samples_D_Percent.lay
Fraser River Bed SedimentCharacteristics
JAS
CKD
STATUS
Data adapted from McLaren and Ren (1995)
Project area bathymetry and shoreline structures shown for reference purposes
30275
18447
18
44
172
437
29173
281319
30
336
125
5422
50
262
108161
50
29
86
129
312
21
21
298
237
155
46
137
412
506
32
85436381
317230
292
288
420457
401504
Easting
No
rth
ing
495000 496000 497000 498000 499000
5442000
5442500
5443000
5443500
5444000
480
440
400
360
320
280
240
200
160
120
80
40
0
D50
(microns)
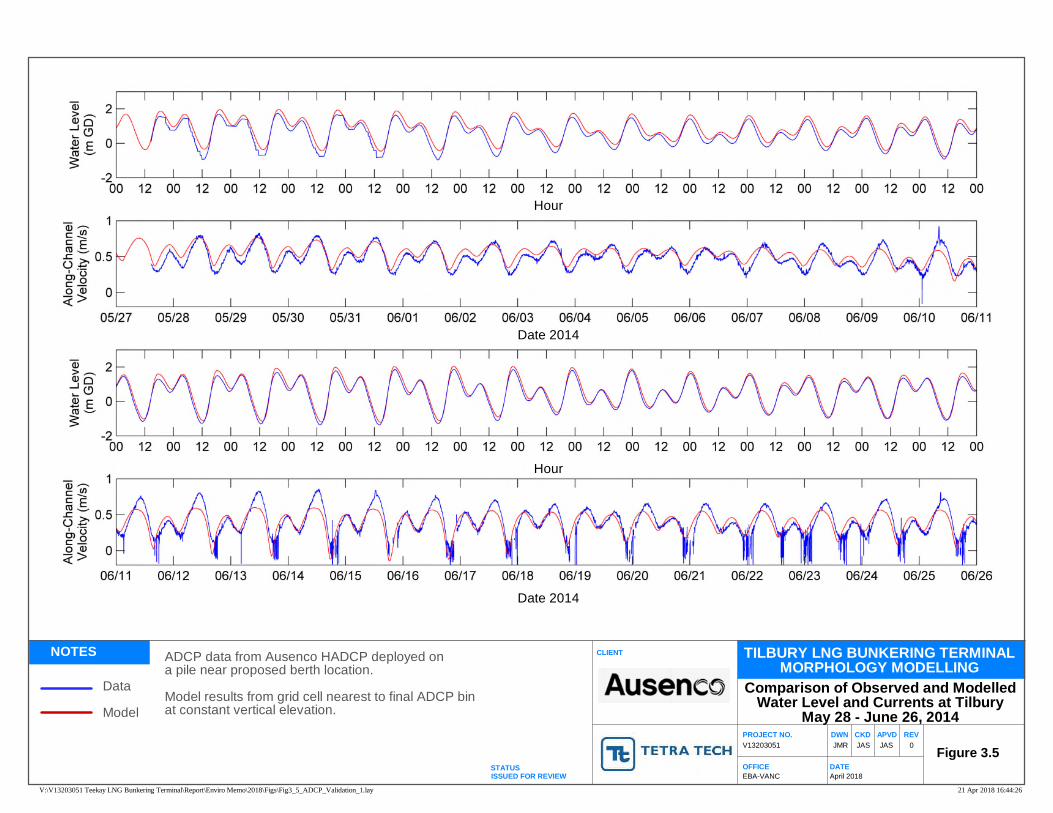
NOTES
DATE
CLIENT
PROJECT NO.
V13203051
EBA-VANC
OFFICE
DWN
April 2018
JASJMR
APVD REV
0
ISSUED FOR REVIEW
Figure 3.5
TILBURY LNG BUNKERING TERMINALMORPHOLOGY MODELLING
21 Apr 2018 16:44:26V:\V13203051 Teekay LNG Bunkering Terminal\Report\Enviro Memo\2018\Figs\Fig3_5_ADCP_Validation_1.lay
Comparison of Observed and ModelledWater Level and Currents at Tilbury
May 28 - June 26, 2014
JAS
CKD
STATUS
ADCP data from Ausenco HADCP deployed ona pile near proposed berth location.
Model results from grid cell nearest to final ADCP binat constant vertical elevation.
Data
Model
Date 2014
Hour
Hour
Date 2014
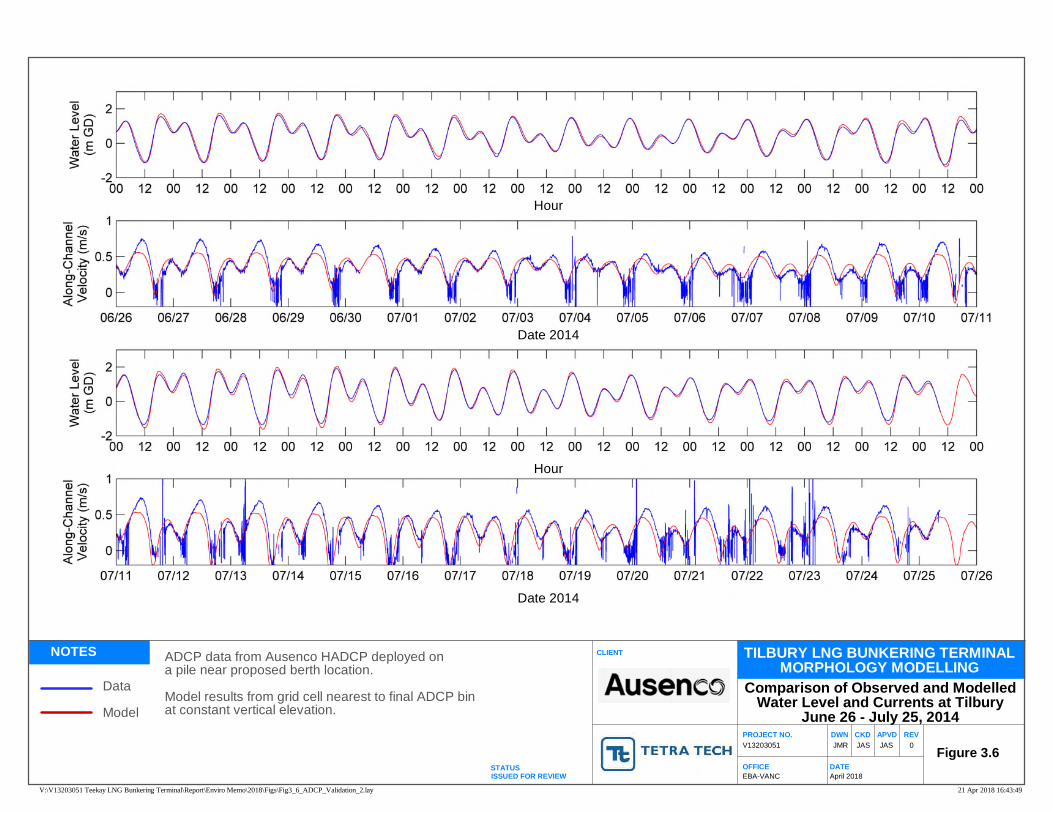
NOTES
DATE
CLIENT
PROJECT NO.
V13203051
EBA-VANC
OFFICE
DWN
April 2018
JASJMR
APVD REV
0
ISSUED FOR REVIEW
Figure 3.6
TILBURY LNG BUNKERING TERMINALMORPHOLOGY MODELLING
21 Apr 2018 16:43:49V:\V13203051 Teekay LNG Bunkering Terminal\Report\Enviro Memo\2018\Figs\Fig3_6_ADCP_Validation_2.lay
Comparison of Observed and ModelledWater Level and Currents at Tilbury
June 26 - July 25, 2014
JAS
CKD
STATUS
ADCP data from Ausenco HADCP deployed ona pile near proposed berth location.
Model results from grid cell nearest to final ADCP binat constant vertical elevation.
Data
Model
Date 2014
Hour
Hour
Date 2014
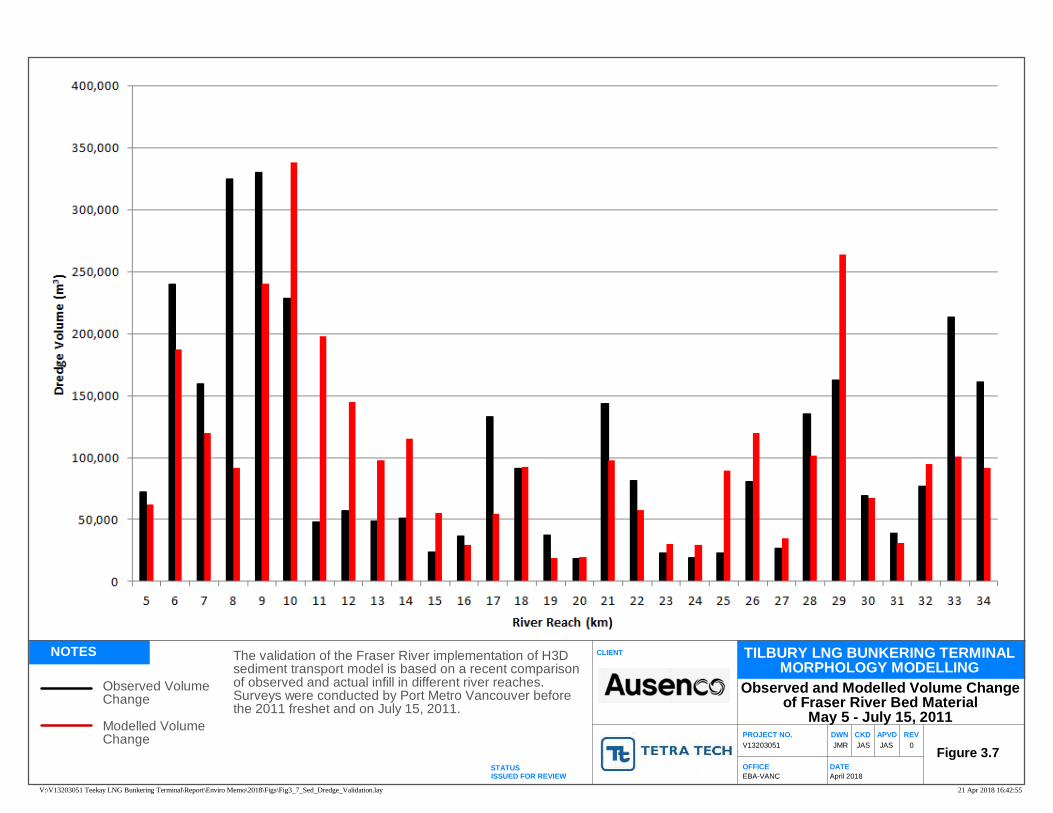
NOTES
DATE
CLIENT
PROJECT NO.
V13203051
EBA-VANC
OFFICE
DWN
April 2018
JASJMR
APVD REV
0
ISSUED FOR REVIEW
Figure 3.7
TILBURY LNG BUNKERING TERMINALMORPHOLOGY MODELLING
21 Apr 2018 16:42:55V:\V13203051 Teekay LNG Bunkering Terminal\Report\Enviro Memo\2018\Figs\Fig3_7_Sed_Dredge_Validation.lay
Observed and Modelled Volume Changeof Fraser River Bed Material
May 5 - July 15, 2011
JAS
CKD
STATUS
The validation of the Fraser River implementation of H3Dsediment transport model is based on a recent comparisonof observed and actual infill in different river reaches.Surveys were conducted by Port Metro Vancouver beforethe 2011 freshet and on July 15, 2011.
Observed VolumeChange
Modelled VolumeChange
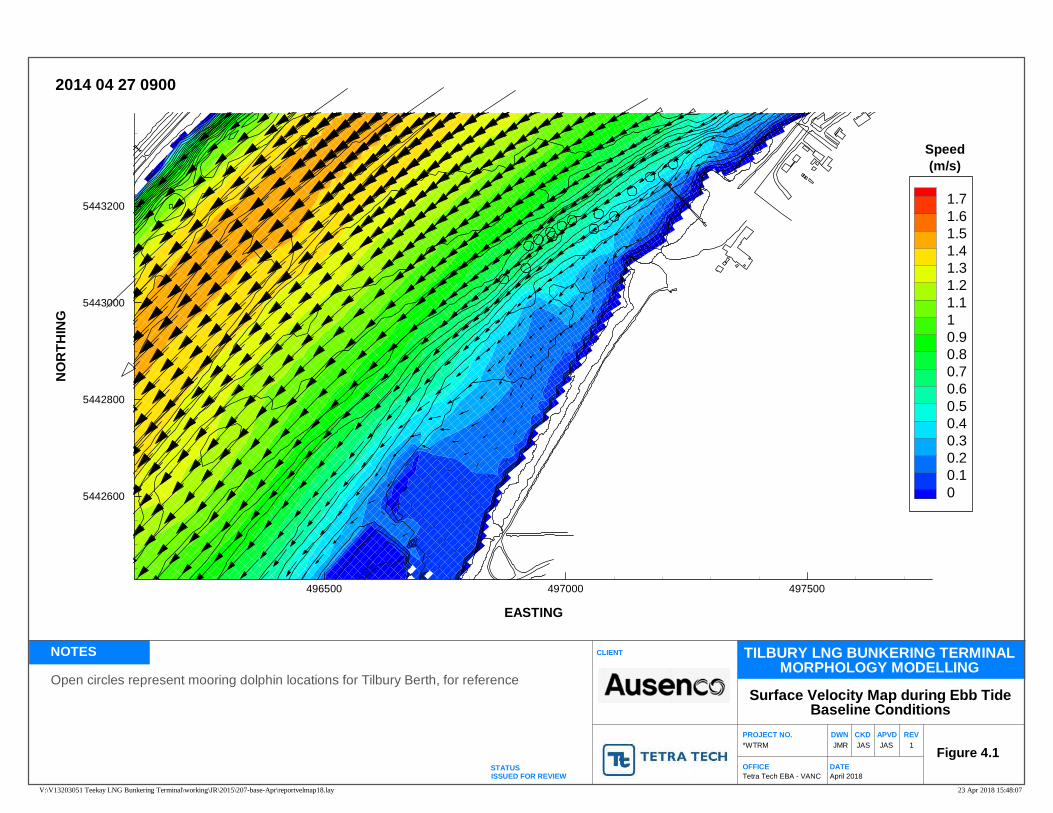
NOTES
DATE
CLIENT
PROJECT NO.
*WTRM
Tetra Tech EBA - VANC
OFFICE
DWN
April 2018
JASJMR
APVD REV
1
ISSUED FOR REVIEW
Figure 4.1
TILBURY LNG BUNKERING TERMINALMORPHOLOGY MODELLING
23 Apr 2018 15:48:07V:\V13203051 Teekay LNG Bunkering Terminal\working\JR\2015\207-base-Apr\reportvelmap18.lay
Surface Velocity Map during Ebb TideBaseline Conditions
JAS
CKD
STATUS
Open circles represent mooring dolphin locations for Tilbury Berth, for reference
EASTING
NO
RT
HIN
G
496500 497000 497500
5442600
5442800
5443000
54432001.71.61.51.41.31.21.110.90.80.70.60.50.40.30.20.10
2014 04 27 0900
Speed
(m/s)

NOTES
DATE
CLIENT
PROJECT NO.
*WTRM
Tetra Tech EBA - VANC
OFFICE
DWN
April 2018
JASJMR
APVD REV
1
ISSUED FOR REVIEW
Figure 4.2
TILBURY LNG BUNKERING TERMINALMORPHOLOGY MODELLING
23 Apr 2018 15:49:51V:\V13203051 Teekay LNG Bunkering Terminal\working\JR\2015\301-berth5-april\reportvelmap18.lay
Surface Velocity Map during Ebb TideWith Tilbury Berth
JAS
CKD
STATUS
Red circles represent mooring dolphin locations for Tilbury Berth
EASTING
NO
RT
HIN
G
496500 497000 497500
5442600
5442800
5443000
54432001.71.61.51.41.31.21.110.90.80.70.60.50.40.30.20.10
2014 04 27 0900
Speed
(m/s)
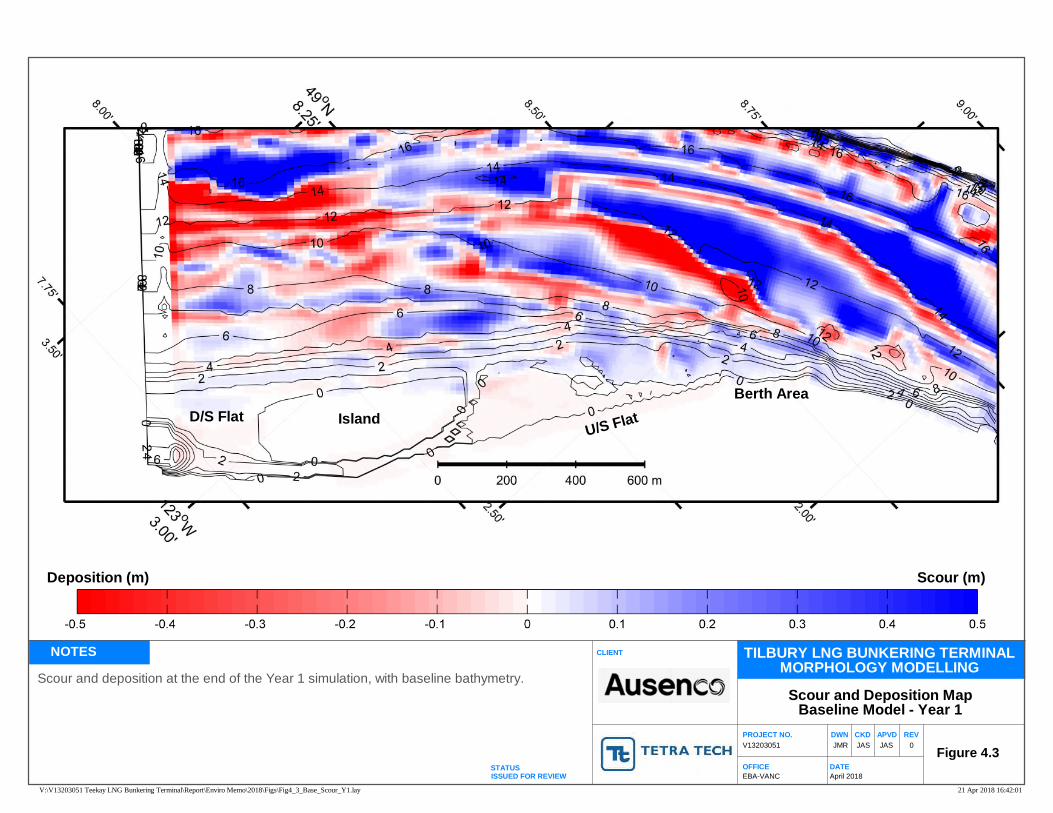
NOTES
DATE
CLIENT
PROJECT NO.
V13203051
EBA-VANC
OFFICE
DWN
April 2018
JASJMR
APVD REV
0
ISSUED FOR REVIEW
Figure 4.3
TILBURY LNG BUNKERING TERMINALMORPHOLOGY MODELLING
21 Apr 2018 16:42:01V:\V13203051 Teekay LNG Bunkering Terminal\Report\Enviro Memo\2018\Figs\Fig4_3_Base_Scour_Y1.lay
Scour and Deposition MapBaseline Model - Year 1
JAS
CKD
STATUS
Scour and deposition at the end of the Year 1 simulation, with baseline bathymetry.
IslandU/S FlatD/S Flat
Berth Area
Deposition (m) Scour (m)
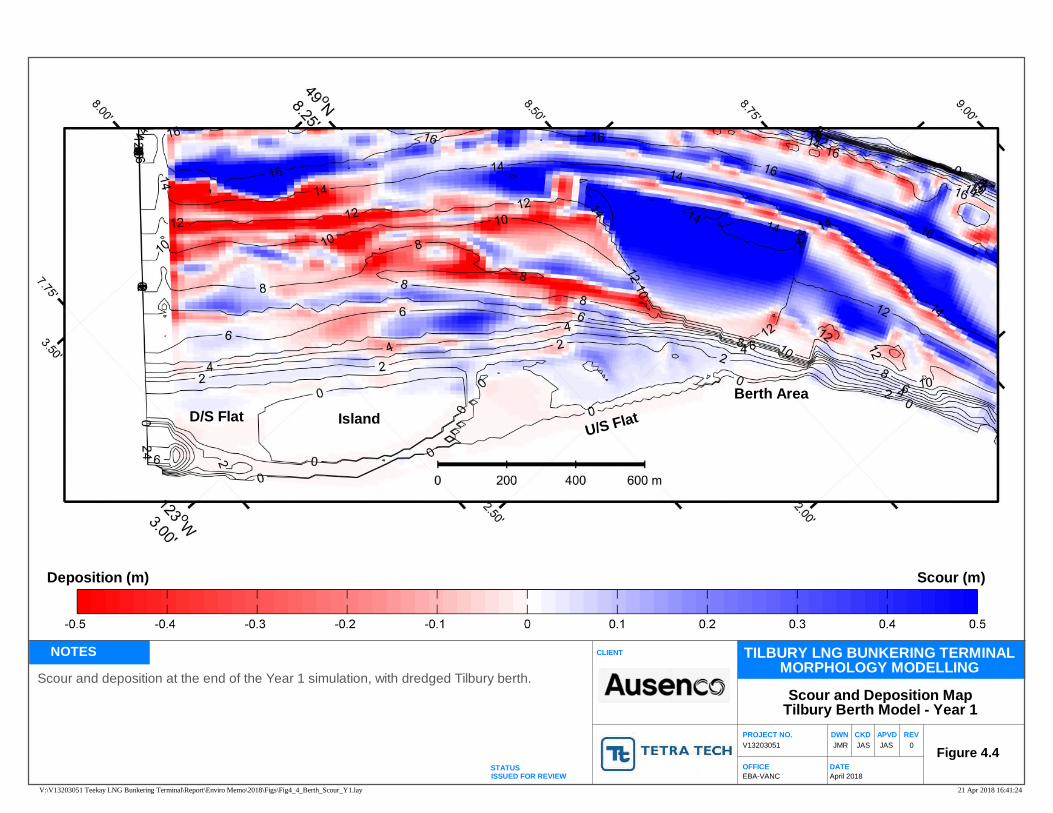
NOTES
DATE
CLIENT
PROJECT NO.
V13203051
EBA-VANC
OFFICE
DWN
April 2018
JASJMR
APVD REV
0
ISSUED FOR REVIEW
Figure 4.4
TILBURY LNG BUNKERING TERMINALMORPHOLOGY MODELLING
21 Apr 2018 16:41:24V:\V13203051 Teekay LNG Bunkering Terminal\Report\Enviro Memo\2018\Figs\Fig4_4_Berth_Scour_Y1.lay
Scour and Deposition MapTilbury Berth Model - Year 1
JAS
CKD
STATUS
Scour and deposition at the end of the Year 1 simulation, with dredged Tilbury berth.
IslandU/S FlatD/S Flat
Berth Area
Deposition (m) Scour (m)
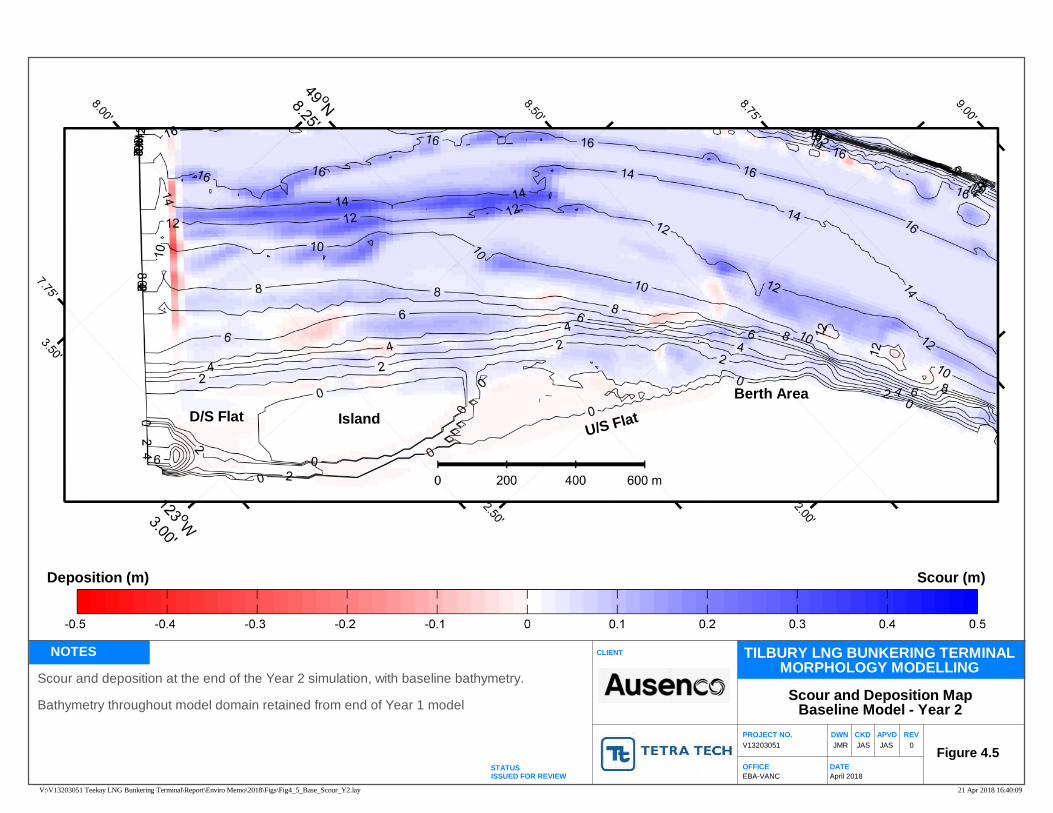
NOTES
DATE
CLIENT
PROJECT NO.
V13203051
EBA-VANC
OFFICE
DWN
April 2018
JASJMR
APVD REV
0
ISSUED FOR REVIEW
Figure 4.5
TILBURY LNG BUNKERING TERMINALMORPHOLOGY MODELLING
21 Apr 2018 16:40:09V:\V13203051 Teekay LNG Bunkering Terminal\Report\Enviro Memo\2018\Figs\Fig4_5_Base_Scour_Y2.lay
Scour and Deposition MapBaseline Model - Year 2
JAS
CKD
STATUS
Scour and deposition at the end of the Year 2 simulation, with baseline bathymetry.
Bathymetry throughout model domain retained from end of Year 1 model
IslandU/S FlatD/S Flat
Berth Area
Deposition (m) Scour (m)

NOTES
DATE
CLIENT
PROJECT NO.
V13203051
EBA-VANC
OFFICE
DWN
April 2018
JASJMR
APVD REV
0
ISSUED FOR REVIEW
Figure 4.6
TILBURY LNG BUNKERING TERMINALMORPHOLOGY MODELLING
21 Apr 2018 16:39:28V:\V13203051 Teekay LNG Bunkering Terminal\Report\Enviro Memo\2018\Figs\Fig4_6_Berth_Scour_Y2.lay
Scour and Deposition MapTilbury Berth Model - Year 2
JAS
CKD
STATUS
Scour and deposition at the end of the Year 2 simulation, with dredged Tilbury berth.
Bathymetry outside of berth area retained from end of Year 1 model
IslandU/S FlatD/S Flat
Berth Area
Deposition (m) Scour (m)
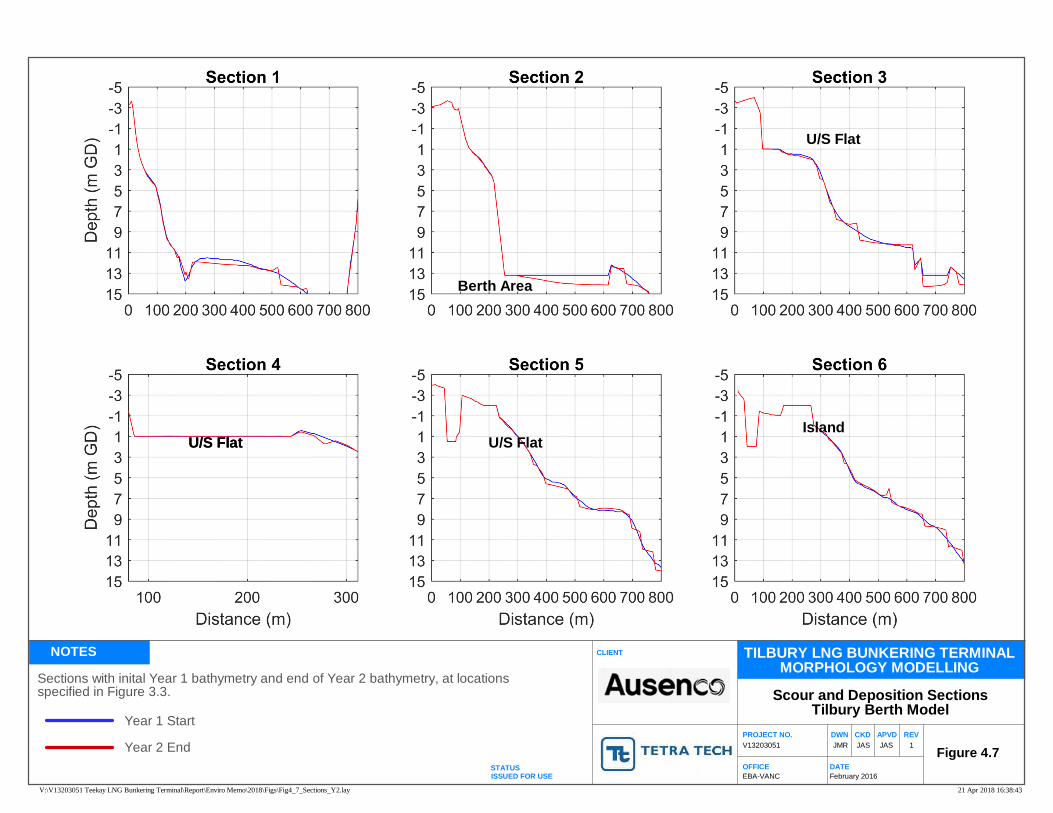
NOTES
DATE
CLIENT
PROJECT NO.
V13203051
EBA-VANC
OFFICE
DWN
February 2016
JASJMR
APVD REV
1
ISSUED FOR USE
Figure 4.7
TILBURY LNG BUNKERING TERMINALMORPHOLOGY MODELLING
21 Apr 2018 16:38:43V:\V13203051 Teekay LNG Bunkering Terminal\Report\Enviro Memo\2018\Figs\Fig4_7_Sections_Y2.lay
Scour and Deposition SectionsTilbury Berth Model
JAS
CKD
STATUS
Sections with inital Year 1 bathymetry and end of Year 2 bathymetry, at locationsspecified in Figure 3.3.
Year 1 Start
Year 2 End
IslandU/S Flat
Berth Area
U/S Flat
U/S Flat U/S Flat
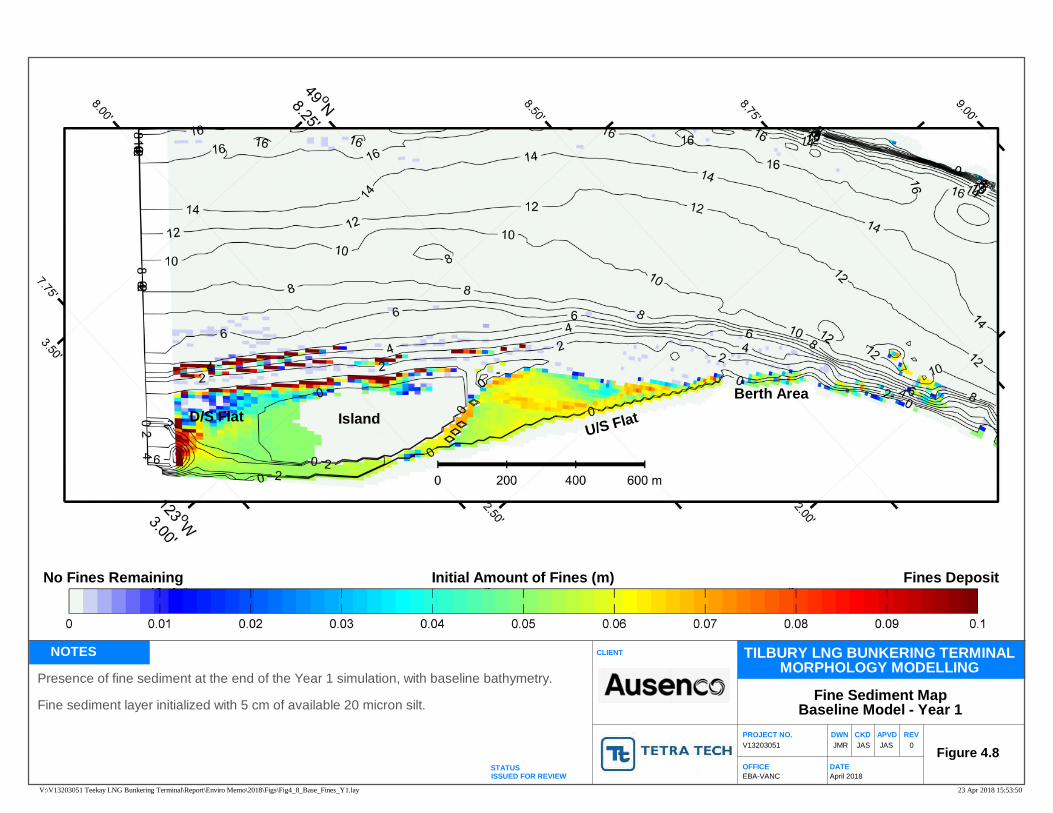
NOTES
DATE
CLIENT
PROJECT NO.
V13203051
EBA-VANC
OFFICE
DWN
April 2018
JASJMR
APVD REV
0
ISSUED FOR REVIEW
Figure 4.8
TILBURY LNG BUNKERING TERMINALMORPHOLOGY MODELLING
23 Apr 2018 15:53:50V:\V13203051 Teekay LNG Bunkering Terminal\Report\Enviro Memo\2018\Figs\Fig4_8_Base_Fines_Y1.lay
Fine Sediment MapBaseline Model - Year 1
JAS
CKD
STATUS
Presence of fine sediment at the end of the Year 1 simulation, with baseline bathymetry.
Fine sediment layer initialized with 5 cm of available 20 micron silt.
IslandU/S FlatD/S Flat
Berth Area
No Fines Remaining Fines DepositInitial Amount of Fines (m)
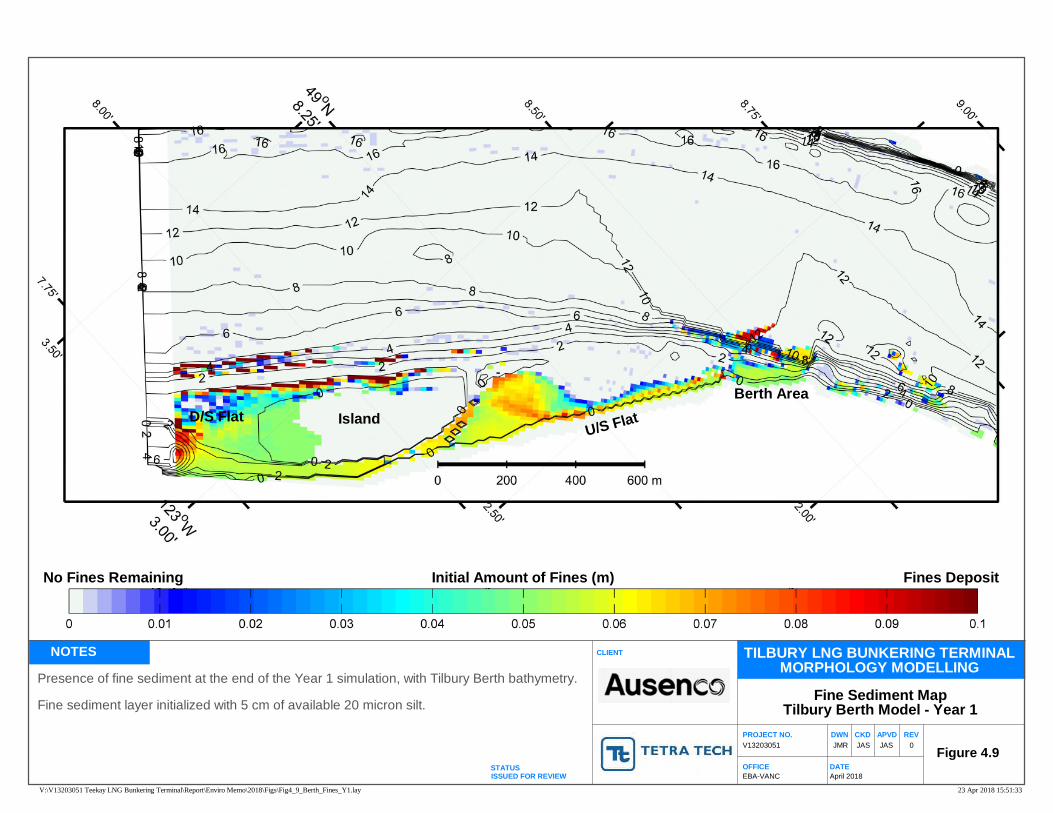
NOTES
DATE
CLIENT
PROJECT NO.
V13203051
EBA-VANC
OFFICE
DWN
April 2018
JASJMR
APVD REV
0
ISSUED FOR REVIEW
Figure 4.9
TILBURY LNG BUNKERING TERMINALMORPHOLOGY MODELLING
23 Apr 2018 15:51:33V:\V13203051 Teekay LNG Bunkering Terminal\Report\Enviro Memo\2018\Figs\Fig4_9_Berth_Fines_Y1.lay
Fine Sediment MapTilbury Berth Model - Year 1
JAS
CKD
STATUS
Presence of fine sediment at the end of the Year 1 simulation, with Tilbury Berth bathymetry.
Fine sediment layer initialized with 5 cm of available 20 micron silt.
IslandU/S FlatD/S Flat
Berth Area
No Fines Remaining Fines DepositInitial Amount of Fines (m)

NOTES
DATE
CLIENT
PROJECT NO.
V13203051
EBA-VANC
OFFICE
DWN
April 2018
JASJMR
APVD REV
0
ISSUED FOR REVIEW
Figure 4.10
TILBURY LNG BUNKERING TERMINALMORPHOLOGY MODELLING
23 Apr 2018 15:53:07V:\V13203051 Teekay LNG Bunkering Terminal\Report\Enviro Memo\2018\Figs\Fig4_10_Base_Fines_Y2.lay
Fine Sediment MapBaseline Model - Year 2
JAS
CKD
STATUS
Presence of fine sediment at the end of the Year 2 simulation, with baseline bathymetry.
Fine sediment layer initialized with 5 cm of available 20 micron silt.
No fines from Year 1 model were retained.
IslandU/S FlatD/S Flat
Berth Area
No Fines Remaining Fines DepositInitial Amount of Fines (m)
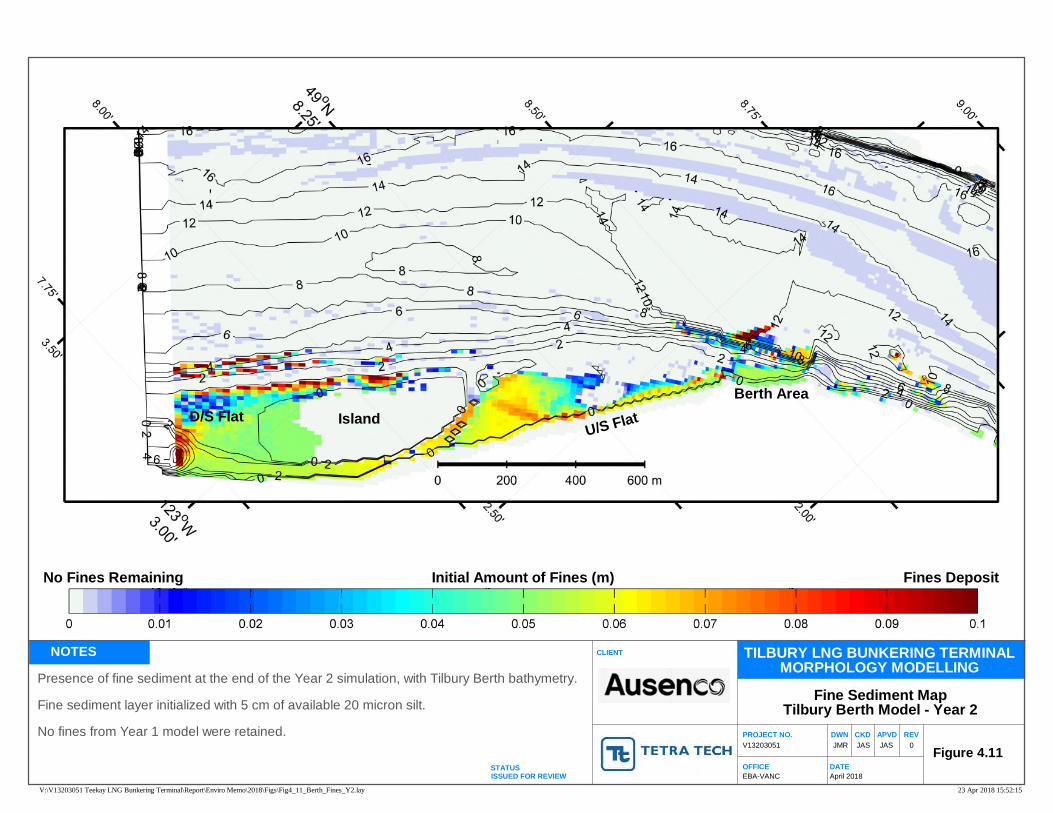
NOTES
DATE
CLIENT
PROJECT NO.
V13203051
EBA-VANC
OFFICE
DWN
April 2018
JASJMR
APVD REV
0
ISSUED FOR REVIEW
Figure 4.11
TILBURY LNG BUNKERING TERMINALMORPHOLOGY MODELLING
23 Apr 2018 15:52:15V:\V13203051 Teekay LNG Bunkering Terminal\Report\Enviro Memo\2018\Figs\Fig4_11_Berth_Fines_Y2.lay
Fine Sediment MapTilbury Berth Model - Year 2
JAS
CKD
STATUS
Presence of fine sediment at the end of the Year 2 simulation, with Tilbury Berth bathymetry.
Fine sediment layer initialized with 5 cm of available 20 micron silt.
No fines from Year 1 model were retained.
IslandU/S FlatD/S Flat
Berth Area
No Fines Remaining Fines DepositInitial Amount of Fines (m)
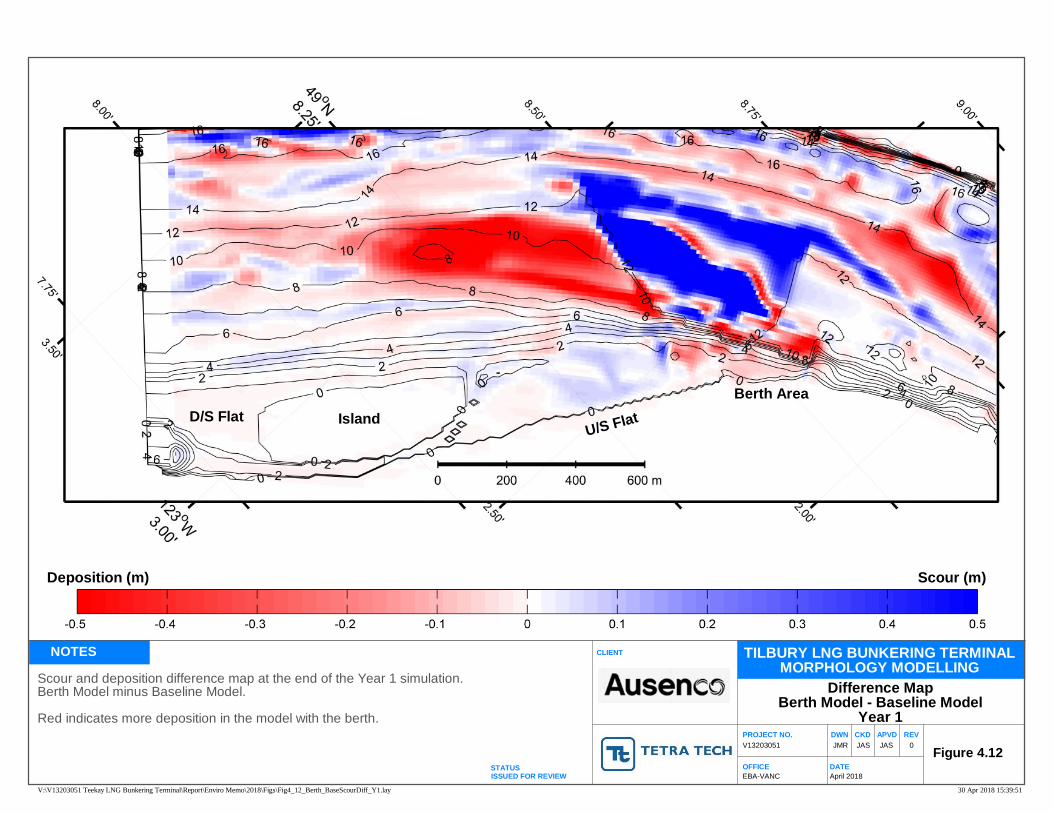
NOTES
DATE
CLIENT
PROJECT NO.V13203051
EBA-VANCOFFICE
DWN
April 2018
JASJMRAPVD REV
0
ISSUED FOR REVIEW
Figure 4.12
TILBURY LNG BUNKERING TERMINALMORPHOLOGY MODELLING
30 Apr 2018 15:39:51V:\V13203051 Teekay LNG Bunkering Terminal\Report\Enviro Memo\2018\Figs\Fig4_12_Berth_BaseScourDiff_Y1.lay
Difference MapBerth Model - Baseline Model
Year 1
JASCKD
STATUS
Scour and deposition difference map at the end of the Year 1 simulation.Berth Model minus Baseline Model.
Red indicates more deposition in the model with the berth.
IslandU/S FlatD/S Flat
Berth Area
Deposition (m) Scour (m)
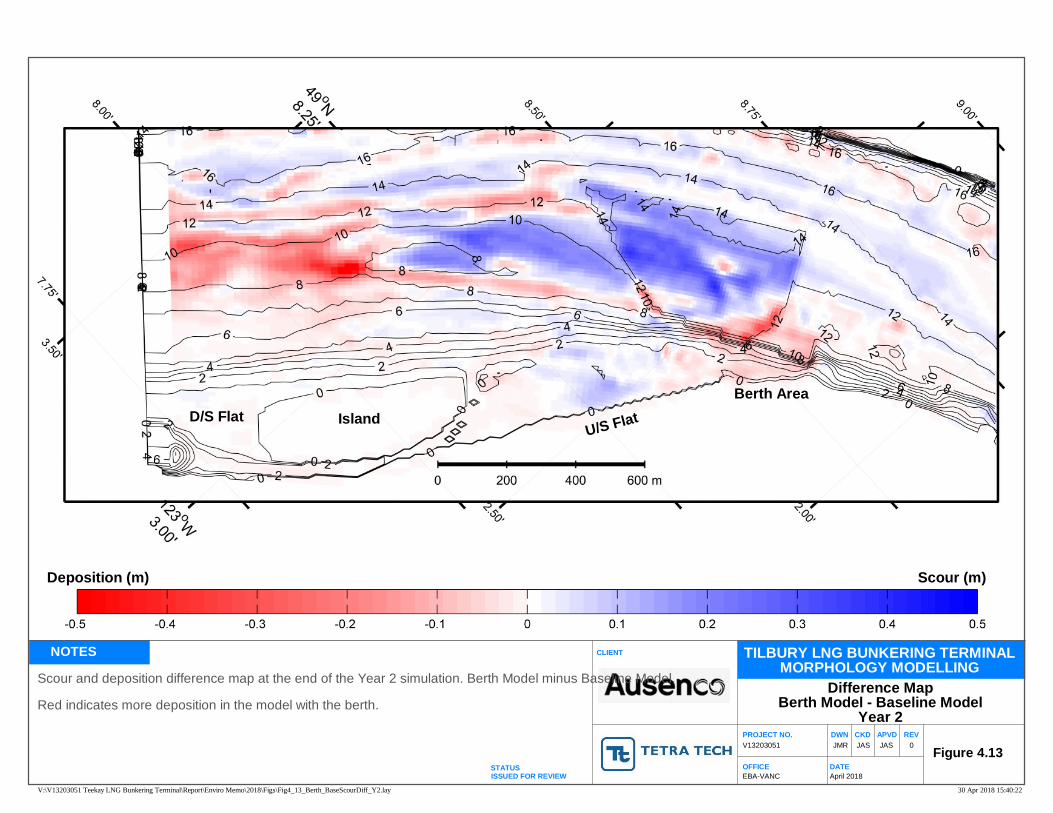
NOTES
DATE
CLIENT
PROJECT NO.V13203051
EBA-VANCOFFICE
DWN
April 2018
JASJMRAPVD REV
0
ISSUED FOR REVIEW
Figure 4.13
TILBURY LNG BUNKERING TERMINALMORPHOLOGY MODELLING
30 Apr 2018 15:40:22V:\V13203051 Teekay LNG Bunkering Terminal\Report\Enviro Memo\2018\Figs\Fig4_13_Berth_BaseScourDiff_Y2.lay
Difference MapBerth Model - Baseline Model
Year 2
JASCKD
STATUS
Scour and deposition difference map at the end of the Year 2 simulation. Berth Model minus Baseline Model.
Red indicates more deposition in the model with the berth.
IslandU/S FlatD/S Flat
Berth Area
Deposition (m) Scour (m)

NOTES
DATE
CLIENT
PROJECT NO.V13203051
EBA-VANCOFFICE
DWN
April 2018
JASJMRAPVD REV
0
ISSUED FOR REVIEW
Figure 4.14
TILBURY LNG BUNKERING TERMINALMORPHOLOGY MODELLING
30 Apr 2018 15:40:50V:\V13203051 Teekay LNG Bunkering Terminal\Report\Enviro Memo\2018\Figs\Fig4_14_Berth_BaseScourDiff_Y1Y2.lay
Difference MapBerth Model - Baseline Model
Years 1 & 2 Combined
JASCKD
STATUS
Scour and deposition difference map combining Year 1 and 2 simulations. Berth Model minus Baseline Model.
Red indicates more deposition in the model with the berth.
IslandU/S FlatD/S Flat
Berth Area
Deposition (m) Scour (m)
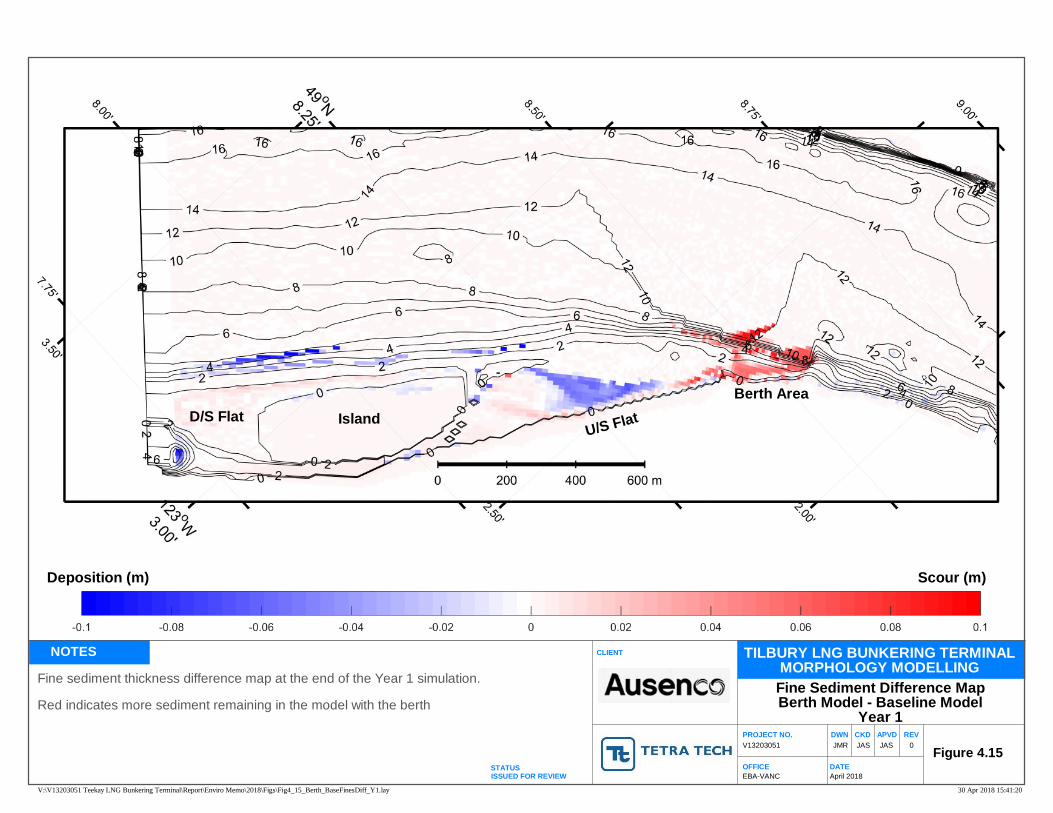
NOTES
DATE
CLIENT
PROJECT NO.V13203051
EBA-VANCOFFICE
DWN
April 2018
JASJMRAPVD REV
0
ISSUED FOR REVIEW
Figure 4.15
TILBURY LNG BUNKERING TERMINALMORPHOLOGY MODELLING
30 Apr 2018 15:41:20V:\V13203051 Teekay LNG Bunkering Terminal\Report\Enviro Memo\2018\Figs\Fig4_15_Berth_BaseFinesDiff_Y1.lay
Fine Sediment Difference MapBerth Model - Baseline Model
Year 1
JASCKD
STATUS
Fine sediment thickness difference map at the end of the Year 1 simulation.
Red indicates more sediment remaining in the model with the berth
IslandU/S FlatD/S Flat
Berth Area
Deposition (m) Scour (m)

NOTES
DATE
CLIENT
PROJECT NO.V13203051
EBA-VANCOFFICE
DWN
April 2018
JASJMRAPVD REV
0
ISSUED FOR REVIEW
Figure 4.16
TILBURY LNG BUNKERING TERMINALMORPHOLOGY MODELLING
30 Apr 2018 15:41:50V:\V13203051 Teekay LNG Bunkering Terminal\Report\Enviro Memo\2018\Figs\Fig4_16_Berth_BaseFinesDiff_Y2.lay
Fine Sediment Difference MapBerth Model - Baseline Model
Year 2
JASCKD
STATUS
Fine sediment thickness difference map at the end of the Year 1 simulation.
Red indicates more sediment remaining in the model with the berth
IslandU/S FlatD/S Flat
Berth Area
Deposition (m) Scour (m)
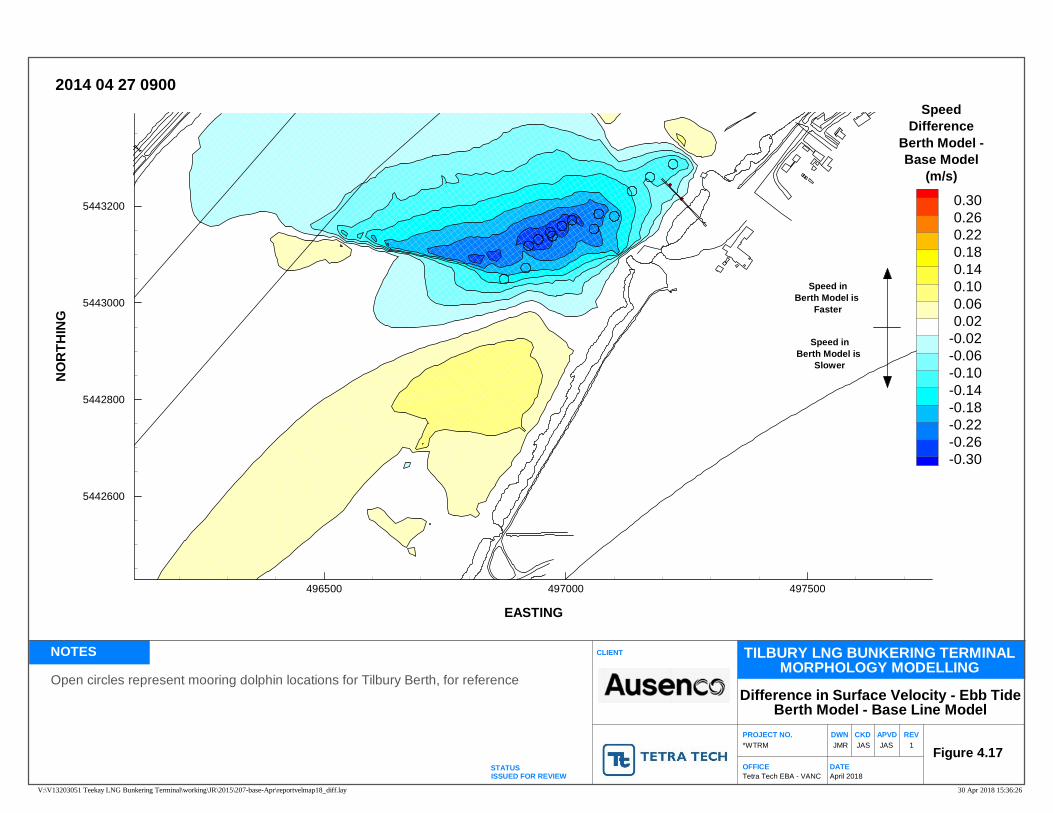
NOTES
DATE
CLIENT
PROJECT NO.*WTRM
Tetra Tech EBA - VANCOFFICE
DWN
April 2018
JASJMRAPVD REV
1
ISSUED FOR REVIEW
Figure 4.17
TILBURY LNG BUNKERING TERMINALMORPHOLOGY MODELLING
30 Apr 2018 15:36:26V:\V13203051 Teekay LNG Bunkering Terminal\working\JR\2015\207-base-Apr\reportvelmap18_diff.lay
Difference in Surface Velocity - Ebb TideBerth Model - Base Line Model
JASCKD
STATUS
Open circles represent mooring dolphin locations for Tilbury Berth, for reference
EASTING
NO
RTH
ING
496500 497000 497500
5442600
5442800
5443000
5443200 0.300.260.220.180.140.100.060.02
-0.02-0.06-0.10-0.14-0.18-0.22-0.26-0.30
2014 04 27 0900Speed
DifferenceBerth Model -Base Model
(m/s)
Speed inBerth Model is
Slower
Speed inBerth Model is
Faster
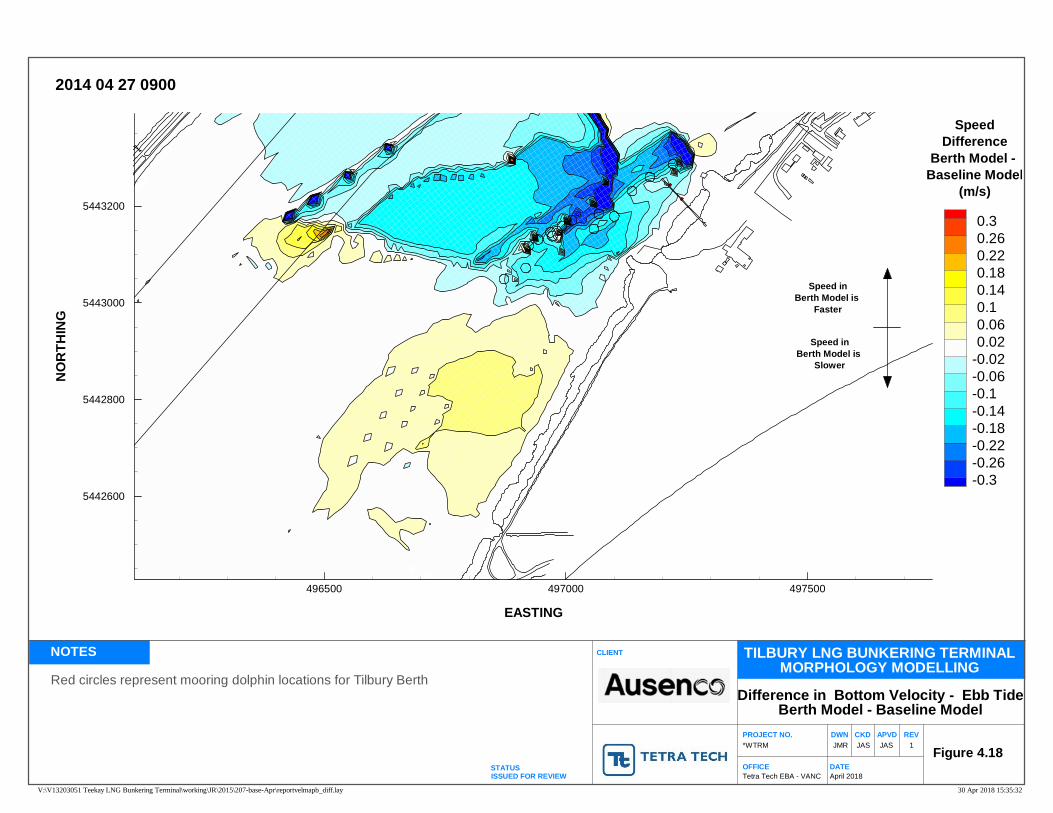
NOTES
DATE
CLIENT
PROJECT NO.*WTRM
Tetra Tech EBA - VANCOFFICE
DWN
April 2018
JASJMRAPVD REV
1
ISSUED FOR REVIEW
Figure 4.18
TILBURY LNG BUNKERING TERMINALMORPHOLOGY MODELLING
30 Apr 2018 15:35:32V:\V13203051 Teekay LNG Bunkering Terminal\working\JR\2015\207-base-Apr\reportvelmapb_diff.lay
Difference in Bottom Velocity - Ebb TideBerth Model - Baseline Model
JASCKD
STATUS
Red circles represent mooring dolphin locations for Tilbury Berth
EASTING
NO
RTH
ING
496500 497000 497500
5442600
5442800
5443000
54432000.30.260.220.180.140.10.060.02
-0.02-0.06-0.1-0.14-0.18-0.22-0.26-0.3
2014 04 27 0900
SpeedDifference
Berth Model -Baseline Model
(m/s)
Speed inBerth Model is
Faster
Speed inBerth Model is
Slower
LIMITATIONS ON USE OF THIS DOCUMENT
1
HYDROTECHNICAL 1.1 USE OF DOCUMENT AND OWNERSHIP
This document pertains to a specific site, a specific development, and a specific scope of work. The document may include plans, drawings, profiles and other supporting documents that collectively constitute the document (the “Professional Document”). The Professional Document is intended for the sole use of TETRA TECH’s Client (the “Client”) as specifically identified in the TETRA TECH Services Agreement or other Contractual Agreement entered into with the Client (either of which is termed the “Contract” herein). TETRA TECH does not accept any responsibility for the accuracy of any of the data, analyses, recommendations or other contents of the Professional Document when it is used or relied upon by any party other than the Client, unless authorized in writing by TETRA TECH. Any unauthorized use of the Professional Document is at the sole risk of the user. TETRA TECH accepts no responsibility whatsoever for any loss or damage where such loss or damage is alleged to be or, is in fact, caused by the unauthorized use of the Professional Document. Where TETRA TECH has expressly authorized the use of the Professional Document by a third party (an “Authorized Party”), consideration for such authorization is the Authorized Party’s acceptance of these Limitations on Use of this Document as well as any limitations on liability contained in the Contract with the Client (all of which is collectively termed the “Limitations on Liability”). The Authorized Party should carefully review both these Limitations on Use of this Document and the Contract prior to making any use of the Professional Document. Any use made of the Professional Document by an Authorized Party constitutes the Authorized Party’s express acceptance of, and agreement to, the Limitations on Liability. The Professional Document and any other form or type of data or documents generated by TETRA TECH during the performance of the work are TETRA TECH’s professional work product and shall remain the copyright property of TETRA TECH. The Professional Document is subject to copyright and shall not be reproduced either wholly or in part without the prior, written permission of TETRA TECH. Additional copies of the Document, if required, may be obtained upon request. 1.2 ALTERNATIVE DOCUMENT FORMAT
Where TETRA TECH submits electronic file and/or hard copy versions of the Professional Document or any drawings or other project-related documents and deliverables (collectively termed TETRA TECH’s “Instruments of Professional Service”), only the signed and/or sealed versions shall be considered final. The original signed and/or sealed electronic file and/or hard copy version archived by TETRA TECH shall be deemed to be the original. TETRA TECH will archive a protected digital copy of the original signed and/or sealed version for a period of 10 years. Both electronic file and/or hard copy versions of TETRA TECH’s Instruments of Professional Service shall not, under any circumstances, be altered by any party except TETRA TECH. TETRA TECH’s Instruments of Professional Service will be used only and exactly as submitted by TETRA TECH. Electronic files submitted by TETRA TECH have been prepared and submitted using specific software and hardware systems. TETRA TECH makes no representation about the compatibility of these files with the Client’s current or future software and hardware systems.
1.3 STANDARD OF CARE
Services performed by TETRA TECH for the Professional Document have been conducted in accordance with the Contract, in a manner consistent with the level of skill ordinarily exercised by members of the profession currently practicing under similar conditions in the jurisdiction in which the services are provided. Professional judgment has been applied in developing the conclusions and/or recommendations provided in this Professional Document. No warranty or guarantee, express or implied, is made concerning the test results, comments, recommendations, or any other portion of the Professional Document. If any error or omission is detected by the Client or an Authorized Party, the error or omission must be immediately brought to the attention of TETRA TECH. 1.4 DISCLOSURE OF INFORMATION BY CLIENT
The Client acknowledges that it has fully cooperated with TETRA TECH with respect to the provision of all available information on the past, present, and proposed conditions on the site, including historical information respecting the use of the site. The Client further acknowledges that in order for TETRA TECH to properly provide the services contracted for in the Contract, TETRA TECH has relied upon the Client with respect to both the full disclosure and accuracy of any such information. 1.5 INFORMATION PROVIDED TO TETRA TECH BY OTHERS
During the performance of the work and the preparation of this Professional Document, TETRA TECH may have relied on information provided by third parties other than the Client. While TETRA TECH endeavours to verify the accuracy of such information, TETRA TECH accepts no responsibility for the accuracy or the reliability of such information even where inaccurate or unreliable information impacts any recommendations, design or other deliverables and causes the Client or an Authorized Party loss or damage. 1.6 GENERAL LIMITATIONS OF DOCUMENT
This Professional Document is based solely on the conditions presented and the data available to TETRA TECH at the time the data were collected in the field or gathered from available databases. The Client, and any Authorized Party, acknowledges that the Professional Document is based on limited data and that the conclusions, opinions, and recommendations contained in the Professional Document are the result of the application of professional judgment to such limited data. The Professional Document is not applicable to any other sites, nor should it be relied upon for types of development other than those to which it refers. Any variation from the site conditions present, or variation in assumed conditions which might form the basis of design or recommendations as outlined in this report, at or on the development proposed as of the date of the Professional Document requires a supplementary exploration, investigation, and assessment. TETRA TECH is neither qualified to, nor is it making, any recommendations with respect to the purchase, sale, investment or development of the property, the decisions on which are the sole responsibility of the Client.
LIMITATIONS ON USE OF THIS DOCUMENT HYDROTECHNICAL
2
1.7 ENVIRONMENTAL AND REGULATORY ISSUES
Unless expressly agreed to in the Services Agreement, TETRA TECH was not retained to investigate, address or consider, and has not investigated, addressed or considered any environmental or regulatory issues associated with the project.
1.8 LEVEL OF RISK
It is incumbent upon the Client and any Authorized Party, to be knowledgeable of the level of risk that has been incorporated into the project design, in consideration of the level of the hydrotechnical information that was reasonably acquired to facilitate completion of the design.
14 August 2018 1314220049-123-R-Rev0
APPENDIX B
Dredging Source Term Calculation
Golder Associates Ltd. 2nd floor, 3795 Carey Road, Victoria, British Columbia, V8Z 6T8, Canada
T: +1 250 881 7372 F: +1 250 881 7470
Golder and the G logo are trademarks of Golder Associates Corporation golder.com
1.0 INTRODUCTION Dredging in the Fraser River has the potential to cause resuspension of fine sediment in the Fraser River that may result in plumes of suspended sediment with increased total suspended solids (TSS) relative to the ambient (background) TSS associated with river processes.
The portion of the fine sediment fraction (i.e., TSS) available for dispersion into the water column as a function of the total fine sediments dredged is inherently difficult to estimate. Fine sediment release depends on multiple physical and mechanical processes, including the method of dredging (e.g., trailing suction hopper dredge, cutter suction dredge, clamshell dredge or backhoe) and consideration of near dredge generated turbulence from vessel effects and the dredging process and their interaction with ambient river processes.
This section summarizes the method used to estimate the area integrated source term of total suspended solids (TSS) generated from dredging following work by Becker et al. (2015) along with the assumptions and limitations of the method.
2.0 HISTORICAL DREDGING Table 1 summarizes the historical dredging (Rob Severinski 2018, pers. comm.) in terms of the volumes dredged and schedule. This information is used to estimate the dredge generated TSS.
Table 1: Historical dredging information
Dredging Parameters Trailing Suction Hopper Dredge (TSHD)
Allocation for dredging 100 (%)
Dredge Capacity 3000 (m3)
Daily dredge capacity 9000 (m3)
Dredge cycles per day 3
Dredge cycle time 5 (hours)
MEMORANDUMDATE 14 August 2018 1314220049
TO
FROM EMAIL
APPENDIX XX – DREDGING SOURCE TERM CALCULATIONS

1314220049
14 August 2018
2
3.0 METHODS Plumes of suspended sediment generated by dredging may be divided into dynamic (near field plume) and passive (farfield plume) phases (Becker et al., 2015).
The nearfield plume (within 100 m of the dredging) is the region in which the plume is being generated by dredging and involves the interaction of several complex processes, including entrainment of ambient water and hopper overflow, interaction of dredge generated currents, ambient currents, and suspended fine sediments, and leakage of dredged fine sediments from dredge buckets, and is typically represented through empirical source term fractions. The farfield (> 100 m from dredging) is that point at which the dredge generated turbidity plume is controlled primarily by ambient river processes (i.e. flow) and not dredge processes.
The method following Becker et al. (2015) describes the estimation of TSS for various dredging methods at the boundary of the nearfield and farfield; nominally and somewhat arbitrarily estimated as approximately 100 m from the dredging location.
The method of Becker et al is developed for several types of dredging equipment including trailing suction hopper dredge (TSHD), cutter suction dredge (CSD), hopper clamshell dredge (HCD), and backhoe hopper dredge (BHD). We follow the method for TSHD as it is commonly used for maintaining the navigation channel.
3.1 Trailing Suction Hopper Dredge (TSHD) A Trailing Suction Hopper Dredge (TSHD) is assumed to generate suspended fine sediments primarily through stirring up of the river bottom with the suction hose and overflow of dredge water (i.e., water and fines) from the hopper. The method involves estimating the following quantities:
The total mass of fine sediments dredged in a dredge cycle, based on the prescribed fine sediment fraction (Table 2) and the total volume of dredging;
The fraction of the total mass of fine sediments released into the ambient water through hose stirring;
The total mass of fine sediments transported to the dredge hopper in a cycle; and
The fraction of the total mass of in-hopper fine sediments released through hopper overflow; a portion of this overflow is taken as the mass of fine sediments released as a plume to the nearfield and farfield boundary.
Table 2 summarizes the various empirical coefficients used in the calculations of the TSS source term for a TSHD.

1314220049
14 August 2018
3
Table 2: Empirical coefficients for a TSHD TSS source term
Parameter Value
Hose Stirring Fraction 3 (%)
Hopper Overflow Fraction 78 (%)
In-Hopper Settlement Fraction 25 (%)
In-Pore Trapping Factor 5 (%)
Fraction of Overflow Released to Passive/Dynamic Boundary
20 (%)
4.0 HISTORICAL DREDGING SEDIMENT CHARACTERISTICS Table 2 summarizes the sediment characteristics for the proposed project dredging based on typical values and values recorded in Becker et al. (2015). This is expected to be indicative of higher flow areas such as the navigation channel and outer parts of the dredge area. Since the median sediment size varies across the river cross-section at the Project Site (McLaren and Ren, 1995), sediment characteristics, including the fine sediment fraction, may vary spatially in the Project Area.
Table 3: Project sediment characteristics
Grain Density Bulk Grain Density Grain Porosity Fine Sediment Fraction
2650 (kg/m3) 1590 (kg/m3) 0.4 (-) 30 (%)
5.0 MASS FLUX AND TOTAL SUSPENDED SOLIDS CALCULATIONS A mass flux rate can be estimated based on the mass of fine sediments released to the boundary of the near field and farfield plume. The mass flux rate for TSHD is a function of the loading time prior to overflow (10 minutes) and with overflow of the hopper (35 minutes). The mass flux rate is coupled with an estimate of the river discharge in the Fraser River at Tilbury Island to predict the potential concentration and TSS generated from historical dredging. The estimated mass flux during historical dredging is summarised in Table 4.
Table 4: Mass Flux Rate estimated from TSHD and HCD
Dredging Method Mass Flux Rate
Trailing Suction Hopper Dredge (TSHD) 22 (kg/s)
1314220049
14 August 2018
4
6.0 ASSUMPTIONS AND LIMITATIONS The above method for estimating a dredge source term of TSS includes the following assumptions and limitations:
The dredge plume is assumed to be well mixed across the navigation channel at a distance of 100 m from the dredging source.
The source term estimate is an area integrated calculation and may not be representative of point measurements of TSS
The TSS source term is considered an order of magnitude estimate as a result of the numerous empirical coefficients and relatively simplification of complex mixing dynamics involved.
The empirical coefficients may vary under dredging operations. A more accurate estimate would involve an assessment of the fine sediment fractions for each piece of project equipment.
7.0 REFERENCES Becker, J., van Eekelen, E., van Wiechen, J., de Lange, W., Damsma, T, Smolders, T., van Koningsveld, M.,
2015. Estimating source terms for far field dredge plume modelling. Journal of Environmental Management. 149: 282-293.
Rob Severinski. Fraser River Pile and Dredge. Vancouver, BC. E-mail. April 16, 2018.
o:\final\2013\1422\13-1422-0049\1314220049-123-r-rev0\app\app b_appendix source term calculation baseline.docx

golder.com