Embed Size (px)
Citation preview
1
Report to the MDTA
For
A Pilot Application of Link Slab with Selected material for MDTA Steel Bridges
By Dr. Chung C. Fu, P.E., Director/Research Professor and Yifan Zhu, Research Assistant
The Bridge Engineering Software and Technology (BEST) Center
Department of Civil and Environmental Engineering, University of Maryland
I. Introduction
Many MDTA bridges are multiple simple span structures, either in steel or prestressed concrete girders. The first phase of this study found that link slab can be used to eliminate these desk joints by making the deck continuous while keeping the girders as simple spans. Applications have been found in different states, such as MI, NY and VA. In modern design, various types of material can be used for constructing the link slab, which are listed in Table 1.
Table 1 – Materials for link slab

2
Our phase I study shows the best candidates for the link slab application are ECC and UHPC. The research team has conducted an extensive study in the Phase I of this study and selected the best performed ECC mix for the link slab application.
This research team has contacted FHWA and Lafarge on the UHPC application. Due to the high cost of UHPC, it may be considered using in special cases, like grid decks. The research team has also invited UHPC representatives from Lafarge and NYSDOT to present their applications and share their experiences. The NYSDOT Office of Structures developed a link slab design utilizing Ultra High Performance Concrete (UHPC) to eliminate transverse deck joints wherever feasible. UHPC link slabs provide an excellent way to eliminate joints in existing bridges. Based on NYSDOT’s experience to date, link slabs are performing well with no visible cracks within the UHPC slab. As reported by NYSDOT, these bridges with UHPC link slabs overall are performing as designed.
The study of different boundary conditions was also evaluated in this study. Conclusion for the pilot bridge is made on varied boundary conditions for their limitation on the link slab application.
II. RESEARCH PLAN
The study involves the execution of the following tasks:
1. Task 1 – Conduct literature review from the federal and other state agencies
The focus of this phase is to locate, collect and list all the available current state‐of‐the‐practice methods for (1) FHWA’s regulations, (2) Other states’ practices, and (3) Research and testing findings. Contact and then visit were made to FHWA/TFHRC on June 7th 2017 meeting with the group of concrete experts experienced in UHPC and ECC mixes led by
Ben Graybeal, Ph.D., P.E. Team Leader ‐ Bridge Engineering Research FHWA‐TFHRC in McLean, Virginia 202‐493‐3122 or [email protected] Also contacted were made to Lafarge, UHPC producer and NYSDOT design engineers. Meeting at MDTA headquarters was made at 1:30‐3:30pm on November 29, 2017 and tele‐con with NYSDOT on their experience with UHPC.
Gregory Nault, PE, SE | Project Manager Ductal® UHPC Bridge Engineering | LafargeHolcim | 8700 W Bryn Mawr Ave, Ste 300, Chicago, IL 60631 O 773‐372‐1027 M 773‐230‐3069 E [email protected] Mathew Royce and Jim Scarlata Structures Design Bureau New York Department of Transportation
3
2. Task 2 – Perform laboratory testing
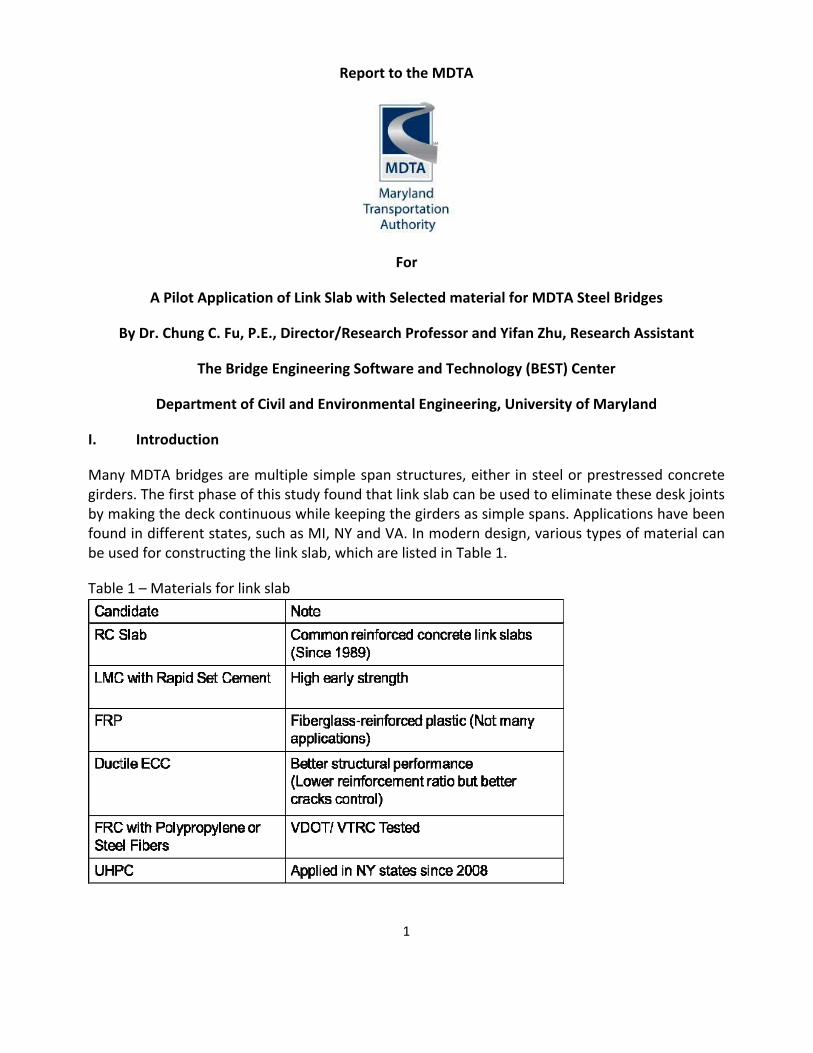
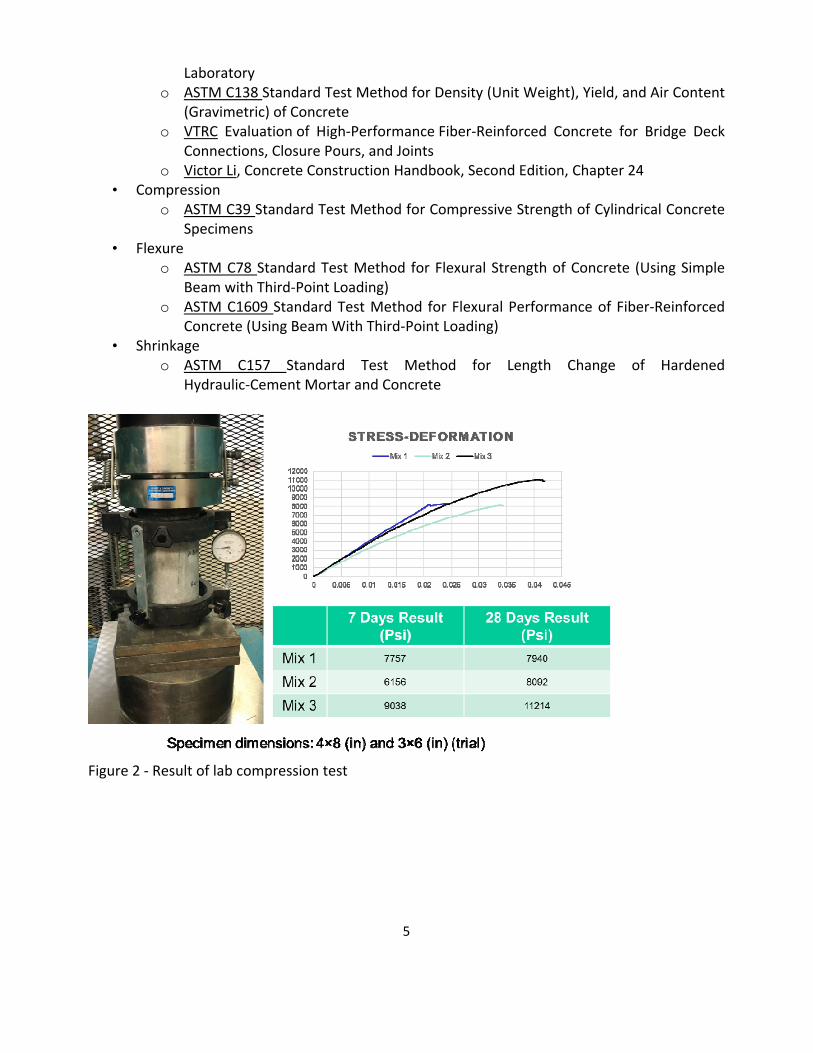
Two of the six types of materials listed above, ECC and UHPC, were selected. UHPC is produced by Lafarge and standard tests were made with published test results. Laboratory tests of ECC were performed by the research group to determine the compression strength, flexural strength, and shrinkage for these ECC mixes. Three types of ECC material were selected. Summary is made below in Table 2.
Table 2 – Three selected ECC mixes
In our selection, Mix 1 is based on VTRC/ Victor Li’ s research and similar to ECC M45, Mix 2 is based on UCLA’s lab mixture design and Mix 3 is based on Victor Li’s most recent publication that focused on ECC crack control. Originally, three (3) mixes were selected. For the test part, four (4) cylinders and four (4) prisms per mix were planned for a total of 24 specimens. However, due to variety and mixing, final summary of the test is shown below:
Total Batches: 27; total 150 specimens
Success: 23 batches; total made 134 specimens
Small Mixer : 9 batches (1 failed); 29 specimens
Large Mixer: 18 batches (3 failed); 121 specimens
Time Duration: o Mixing: June 17th. to August 2nd, 2017. o Testing: June 24th to September 5th, 2017.

4
Figure 1 – ECC lab mixes at Ready Mix Concrete Lab in Greenbelt, MD
Small and large mixers are following different sequences in the lab mix as listed below:
Small Mixer (Shear Mixer) • Charge all solid material (2 min) • Charge 80‐90% water and all HRWR • Mix for 3‐5 min so that a dough‐like consistency was reached. • Fibers were added and mixed for 8‐10 minutes. • The remaining water was added (if needed) • Mixed for 5‐10 min until material is homogeneous.
Large Mixer • Charge all sand (2 min) • Charge approximately 90‐95% Water, all HRWR, all hydration stabilizer (2 min) • Charge all fly ash (2 min) • Charge all cement (2 min) • Charge remaining mixing water • Mix for 5‐10 min until material is homogenous • Charge fibers • Mix for 5‐10 min until material is homogenous
Primary Test Standards and Reference listed below are followed: • Cast, Curing and Fresh Concrete Test
o ASTM C192/C192M Practice for Making and Curing Concrete Test Specimens in the
5
Laboratory o ASTM C138 Standard Test Method for Density (Unit Weight), Yield, and Air Content
(Gravimetric) of Concrete o VTRC Evaluation of High‐Performance Fiber‐Reinforced Concrete for Bridge Deck
Connections, Closure Pours, and Joints o Victor Li, Concrete Construction Handbook, Second Edition, Chapter 24
• Compression o ASTM C39 Standard Test Method for Compressive Strength of Cylindrical Concrete
Specimens • Flexure
o ASTM C78 Standard Test Method for Flexural Strength of Concrete (Using Simple Beam with Third‐Point Loading)
o ASTM C1609 Standard Test Method for Flexural Performance of Fiber‐Reinforced Concrete (Using Beam With Third‐Point Loading)
• Shrinkage o ASTM C157 Standard Test Method for Length Change of Hardened
Hydraulic‐Cement Mortar and Concrete
Figure 2 ‐ Result of lab compression test

6
Figure 3 ‐ Result of lab flexural test
Figure 4 ‐ Result of lab shrinkage test
Selection criteria of the optimal ECC are set as follows: • Choose average value from results • Compression strength:

7
o Small Mixer: Mix 1> Mix 2> Mix 3 o Large Mixer: Similar
• Flexure strength: o Small Mixer: Similar o Large Mixer: Mix 1> Mix 3> Mix 2
• Shrinkage variation: o Mix 3< Mix 1 <Mix 2
Based on the mixture data from the last Full‐batch mixes, selection was made and results were compared with VTRC’s results. Table 3 – Final selection compared with VTRC’s results
ECC selection Notes and Recommendations are listed below: • Mixture design will be modified by material and field environment • There will be a 25%‐30% deduction of compression and flexure in field due to the change
of curing conditions (Reference: ACI magazine Q&A: Field‐ versus Standard‐Cured Cylinders Made from High Strength Concrete)
• The result of ECC mixes has a high variation that is affected by material, procedure etc. • Construction sequence and ECC mixing procedure will be set when applied.
3. Task 3 – Select and analyze a bridge for pilot study
As mentioned, two (or three, if required) types of practices will be studied. Cost and practicality will be consulted and collaborated with designers and contractors. As such, an economical and practical design will be recommended. Flow chart of this task is shown in Figure 5. Further, Figure 6 shows collection of States’ practices on link slab.

8
Figure 5 – Flow chart of pilot bridge demonstration
Figure 6 – Collection of states’ practices on link slab We have received three sets of drawings from MDTA, which are CEXA89 (skewed and wide straight bridge), CEXA27001 (normal straight, we visited last time) and CEXA83001 (mild curved bridge). All are in a pattern of two short side spans under 50' and two middle spans over 50' with two fixed bearing at the middle pier and at the end abutments. We have modeled existing CEXA27001 bridge and alternating parameters to check different cases, such as altering bearings, adding link slab with Regular concrete/ECC/UHPC, changing length of debonded zone (only in ECC link slab)..., etc. Table A1 in the Appendix lists all candidates considered for link slab pilot demonstration. Figure A1 displays the selected MDTA Bridge CEXA27001 GPE & framing plan.

9
Trip was made with MDTA engineer, Lafarge engineer and BEST Center researchers. Photos were taken and some relevant photos are shown in Appendix A.
3.1 Approach of prototype bridge analysis
Figure 7 – Feasibility analysis of the prototype bridge
Based on previous literature reviews and meetings, link slab behaviors would be influenced mostly under Live Load and thermal movement. Results and findings are based on comparisons under these loading conditions.
In order to get a full understanding of the thermal behavior of this prototype bridge, six models were made with two types of thermal analyses: (1) Temperature Gradient (based on AASHTO, Zone 2); (2) Thermal Expansion (based on temperature increase or decrease within 110F, which for the extreme case). The results shown are longitudinal displacements for the entire bridge and stresses on the top of the slab under the extreme case.

10
3.2 Model with current multi‐simple span bridge
Figure 8 – Longitudinal thermal movement of the bridge Summary of analysis:
• Compared with temperature gradients (Figure 8(a)), the displacement due to thermal expansion/ contraction in the longitudinal direction (Figure 8(b)) is relatively large so the thermal expansion/contraction is considered in this study.
• The maximum displacement (with the 110F variation or ±55°F) in longitudinal direction due to thermal expansion/contraction between two spans in this pilot bridge is no more
than 0.9 in. i.e., if the temperature increased 55F, the two sides of the expansion joint will be 0.45 in. closer due to the expansion form the spans, and when temperature
decreased 55F, the gap of the joint will grow 0.45 in.
(a) Positive temperature gradient
(b) Thermal expansion, extreme case,
increasing 110F

11
Figure 9 – Bridge behavior under dead load (structural component only) Summary of analysis:
As expected, compared with vertical displacement (maximum 0.5132 in. at the middle of 2 and 3 spans), longitudinal displacement (maximum 0.0658 in. at the center bearing), is relatively small under dead load.
(a) Vertical displacement
(b) Stress contour at the top of the slab
12
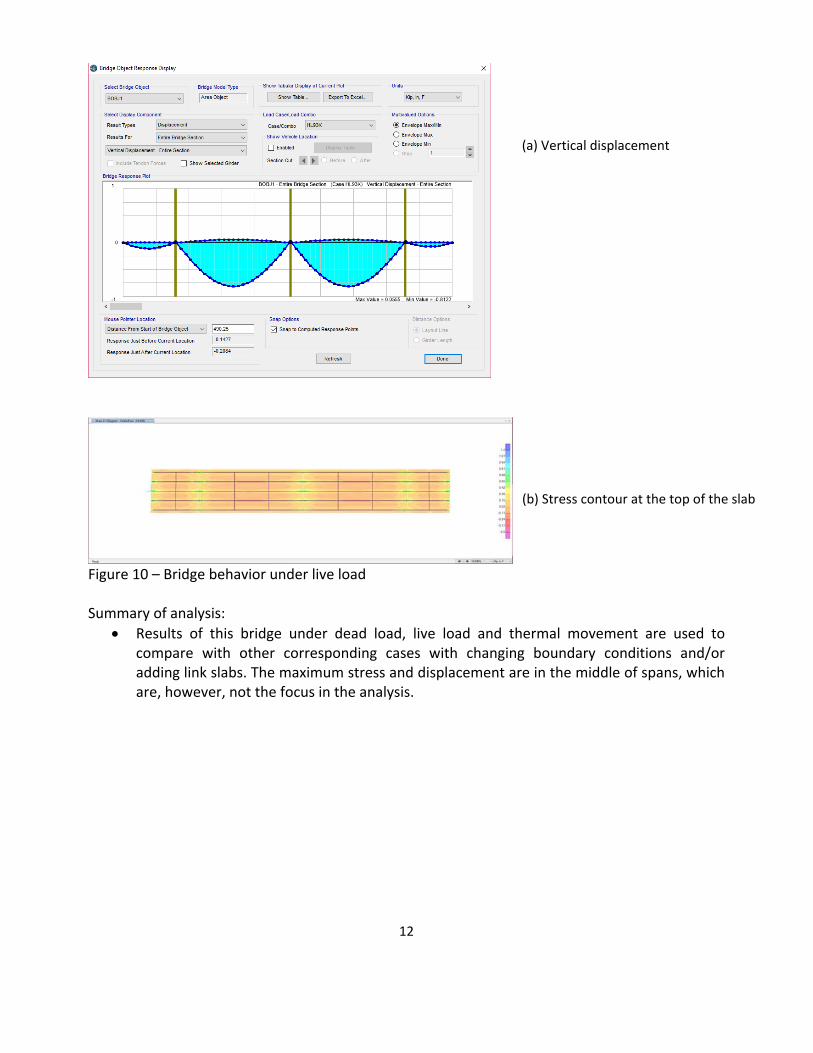
Figure 10 – Bridge behavior under live load Summary of analysis:
Results of this bridge under dead load, live load and thermal movement are used to compare with other corresponding cases with changing boundary conditions and/or adding link slabs. The maximum stress and displacement are in the middle of spans, which are, however, not the focus in the analysis.
(b) Stress contour at the top of the slab
(a) Vertical displacement

13
3.3 Model with current multi‐simple span bridge with all FIXED bearings
Figure 11 – Thermal expansions with 110F increase for bridge with all FIXED bearings
(a) Longitudinal displacement
(c) Stress contour of the all‐fixed
bearing bridge
(b) Longitudinal stress
14
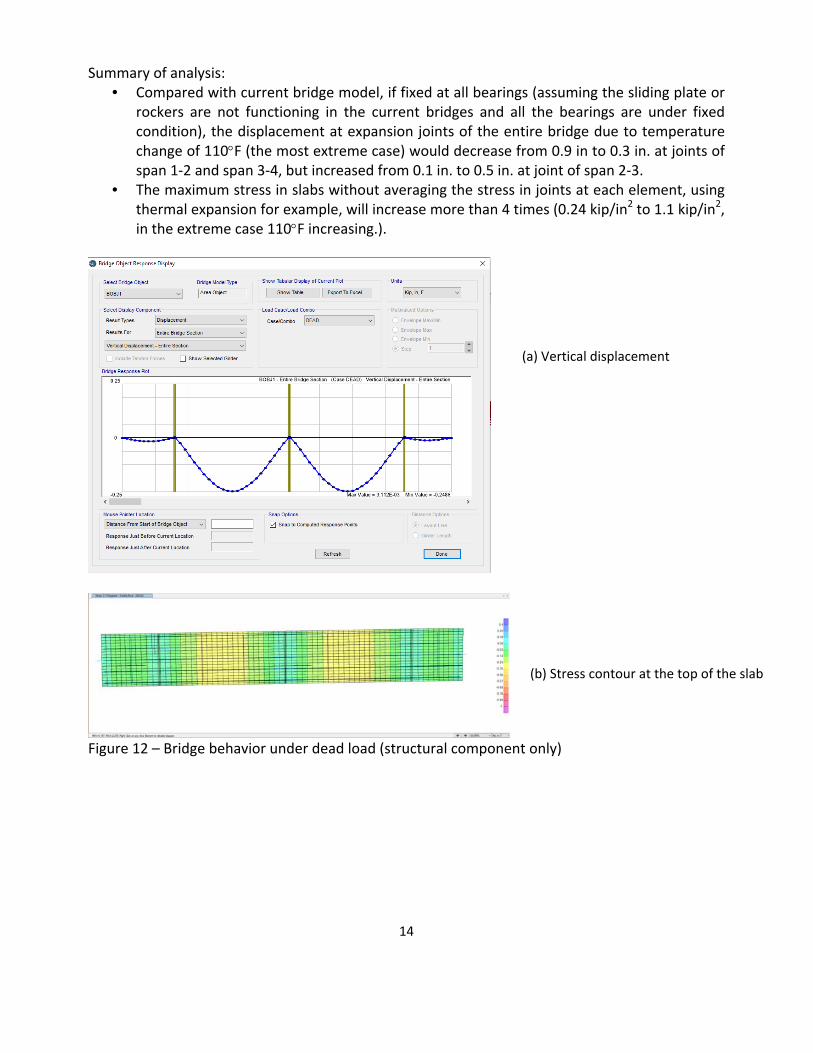
Summary of analysis: • Compared with current bridge model, if fixed at all bearings (assuming the sliding plate or
rockers are not functioning in the current bridges and all the bearings are under fixed condition), the displacement at expansion joints of the entire bridge due to temperature change of 110F (the most extreme case) would decrease from 0.9 in to 0.3 in. at joints of span 1‐2 and span 3‐4, but increased from 0.1 in. to 0.5 in. at joint of span 2‐3.
• The maximum stress in slabs without averaging the stress in joints at each element, using thermal expansion for example, will increase more than 4 times (0.24 kip/in2 to 1.1 kip/in2, in the extreme case 110F increasing.).
Figure 12 – Bridge behavior under dead load (structural component only)
(a) Vertical displacement
(b) Stress contour at the top of the slab

15
Figure 13 – Bridge behavior under live load Summary of analysis:
• Compared with vertical displacement (maximum 0.5132 in. at the middle of 2 and 3 spans), longitudinal displacement (maximum 0.0658 in. at the center bearing) is relatively small under dead load.
• This bridge has a displacement decrease if fixed at all boundaries under both dead and live loads. For bridge decks, the stress in the longitudinal direction is also decreased.
• The maximum stresses in the deck due to thermal movement are located near the bearings.
(b) Stress contour at the view on the
top of the slab
(a) Vertical displacement

16
3.4 General case of model with link slab .
Figure 14 – Typical thermal movement at bearings for bridges with link slab (bridge with UHPC link slab for example)
Summary of analysis: • The displacement distribution would change and the values between 2 spans are small
compared with current multi‐simple span bridges. • The stress distribution changes a lot.
Thus, results and comparisons are focused on stress distribution at bridge deck due to thermal movement, dead load, and live load.

17
3.5 Model with current boundary conditions and ECC/RC link slab
Figure 15 –Thermal behaviors of bridges with ECC link slab (left and middle joints) and RC link slab (right joint, change of debonded zone at the right span)
(a) Stress at the bottom of slabs due to
Positive Temperature Gradients
(b) Stresses at top of the slab for
temperature decrease of 110F
(c) Stress contour at top of the slab
for temperature decrease ECC Link Slab
RC Link Slab
Change of Debonded length
18
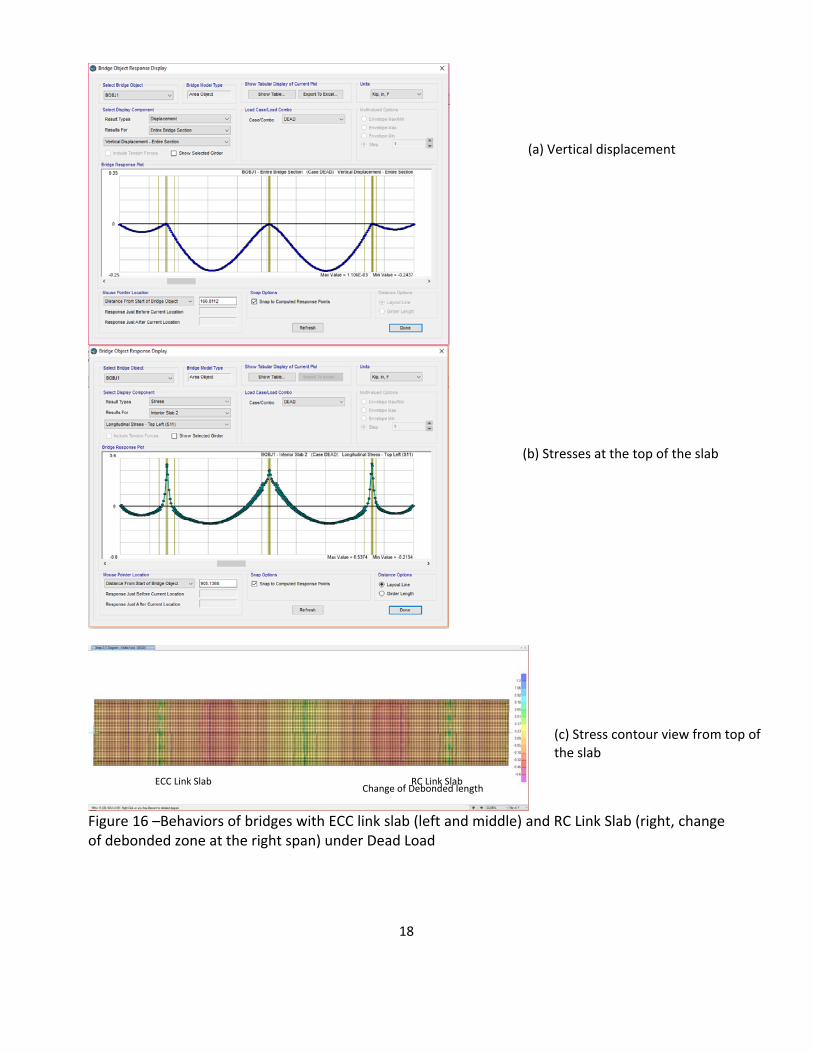
Figure 16 –Behaviors of bridges with ECC link slab (left and middle) and RC Link Slab (right, change of debonded zone at the right span) under Dead Load
(a) Vertical displacement
(b) Stresses at the top of the slab
(c) Stress contour view from top of
the slab
ECC Link Slab RC Link Slab Change of Debonded length

19
Figure 17 –Behaviors of bridges with ECC link slab (left and middle) and RC Link Slab (right, change of debonded zone at the right span) under Live Load
(a) Vertical displacement
(b) Longitudinal stress of slab
(c) Stress contour view from top of
the slab ECC Link Slab RC Link Slab
Change of Debonded length
20
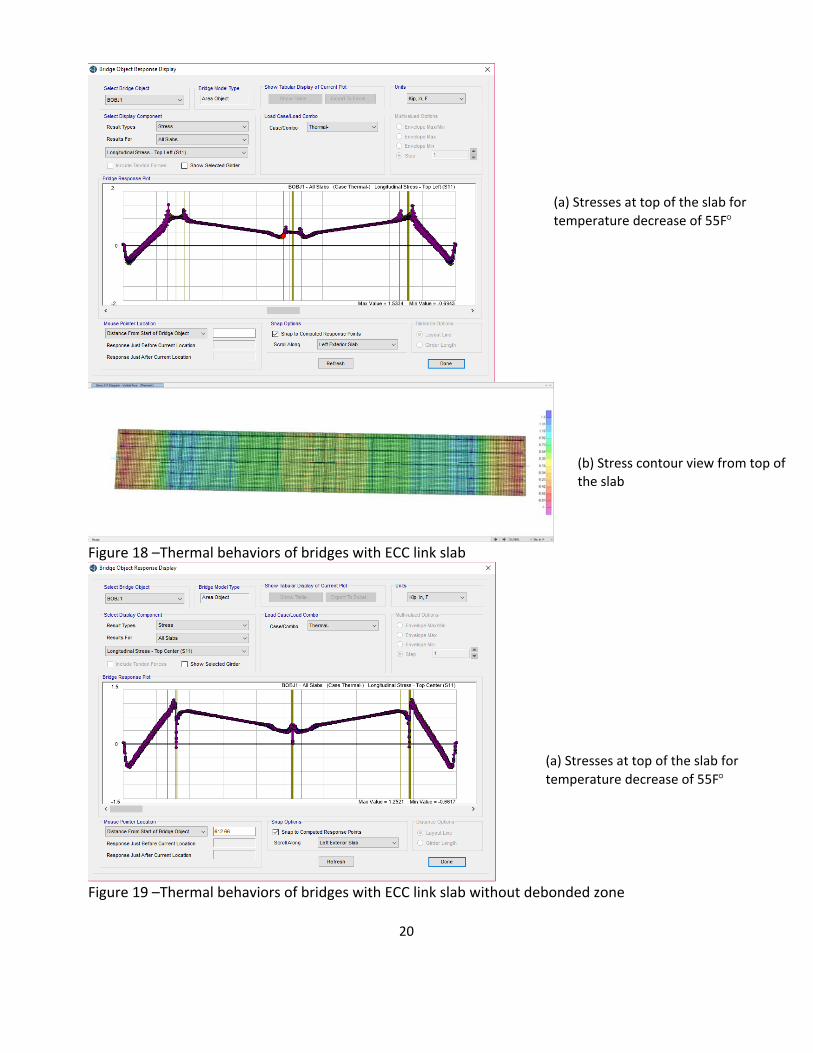
Figure 18 –Thermal behaviors of bridges with ECC link slab
Figure 19 –Thermal behaviors of bridges with ECC link slab without debonded zone
(b) Stress contour view from top of
the slab
(a) Stresses at top of the slab for
temperature decrease of 55F
(a) Stresses at top of the slab for
temperature decrease of 55F

21
Details of analysis: • For comparison, change debonded zone of link slabs in the left and right span • Link slab in span 4 is using RC slab with small debonded zone • In the analysis, the parameter of thermal expansion for ECC is assumed
Summary of analysis: The maximum tensile stress due to thermal movement will occur when temperature decreases.
So the results show the most extreme case, which is, the temperature decrease 110F 1) Compared with the current multi‐simple span model:
• Displacement due to dead load, live load and thermal movement in the longitudinal direction are all decreased.
• Stress due to thermal movement (in the extreme case 110F decrease which would not happen in the real situation) are less than 3.5 kip/in2 for maximum calculated stress and
2.6 kip/in2 when averaging stresses in joints (if in a 55 F range, the results would be 1.7 kip/in2 and 1.3 kip/in2).
2) Compared with ECC and RC link slabs in different debonded zones • RC link slab with short debonded zone has a worse performance under thermal
movement. Since the regular reinforce concrete is assumed not to take any tension, RC link slab is not recommended.
• Exterior span slabs will take more stresses under thermal movement with RC link slabs.
3) Compared with ECC link slab case: • Deboned length would not affect much on stress distribution due to thermal movement. • If using all ECC link slabs rather than ECC and RC link slabs, the maximum tensile stress
would slightly decrease in the link slab zones.

22
3.6 Model with changed boundary conditions and ECC/RC link slab
This case is to modify the model shown in Section 3.5 with current boundary conditions to changed boundary conditions with one fixed bearing in the middle and extension bearings at other locations.
Figure 20 –Thermal behaviors of bridges with ECC link slab and RC Link Slab
(c) Stress contour at top of the slab
for temperature decrease ECC Link Slab
RC Link Slab
Change of Debonded length
(a) Stress at the bottom of the slab due
to positive temperature gradients
(b) Stresses at top of the slab for
temperature decrease of 110F

23
Figure 21 –Behaviors of bridges with ECC link slab (left and middle) and RC Link Slab (right, change of debonded zone at the right span) under Dead Load
(a) Vertical displacement
(b) Stresses at top of the slab
(c) Stress contour view from top of
the slab ECC Link Slab
RC Link Slab Change of Debonded length

24
Figure 22 –Behaviors of bridges with ECC link slab (left and middle) and RC link slab (right, change of debonded zone at the right span) under Live Load
(a) Vertical displacement
(b) Longitudinal stress of slab
(c) Stress contour at the top of the
slab ECC Link Slab RC Link Slab
Change of Debonded length

25
Figure 23 – Stress distribution on decks due to thermal behaviors of bridges with ECC link slab
Summary of analysis: Compared with results shown in Section 3.5, i.e., the bridge using current bearing conditions
with ECC/ RC link slab: • For thermal movement, there are significant changes for maximum stresses occurring at
link slabs. Also, the stresses on bridge decks are tending to close to zero, which means the deck will take less stress than the case of current boundary conditions.
• The maximum tensile stress on the RC link slab significantly increased. • If using ECC for all link slabs and changing the boundary conditions, the stress due to
thermal movement will decrease to a negligible level. • For the model under dead load and live load, both maximum displacement and maximum
stress are increased.

26
3.7 Model with current boundary conditions and UHPC link slab
Figure 24 – Thermal movement at bearings and stress/stress contour at the top of the slab
(a) Longitudinal stress at the top of the
slab under temperature decrease of
110F
(b) Stresses at top of the slab
for temperature increase
(b) Stress contour for temperature
decrease of 110F
(b) Longitudinal Stress at the bottom of
the slab under temperature decrease of
110F
27
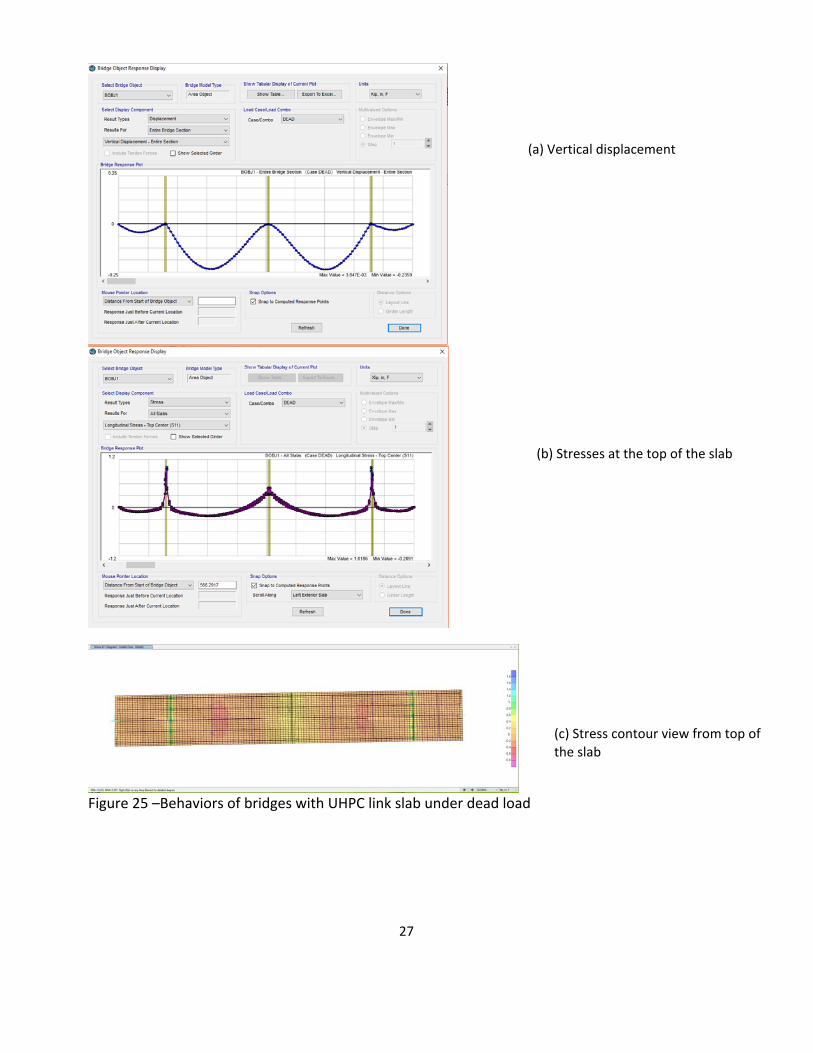
Figure 25 –Behaviors of bridges with UHPC link slab under dead load
(a) Vertical displacement
(b) Stresses at the top of the slab
(c) Stress contour view from top of
the slab

28
Figure 26 –Behaviors of bridges with UHPC link slab under Live Load
(a) Vertical Displacement
(b) Longitudinal Stress of slab
(c) Stress contour view from top of
the slab

29
Details of analysis: • Debonded zones for UHPC link slabs are relatively small than in ECC link slabs • No obvious deformation in the link slab zone • All the parameters are adopted from Lafarge and NYDOT design example
Summary of analysis:
• The maximum stress occurs at the location above bearing (also above girders) in the model.
• The entire slab will be under tension where maximum tensile stress values could reach 5 kips/in2 when there is a 110°F temperature decrease for the extreme case, and in the
common 55F range, the maximum tensile stress could reach up to 2.5 kip/in2. • Tension/Compression phase changes comparing with current bridge. • Compared with the current bridge model with or without ECC link slabs, stresses in the
UHPC link slabs will increase significantly. • Compared with bridge model with ECC link slab, the maximum stresses in UHPC link slab
are larger but with similar deformation under dead load and live load cases. • The material properties for UHPC, mentioned by Lafarge engineer, are designed for strain
control.
30
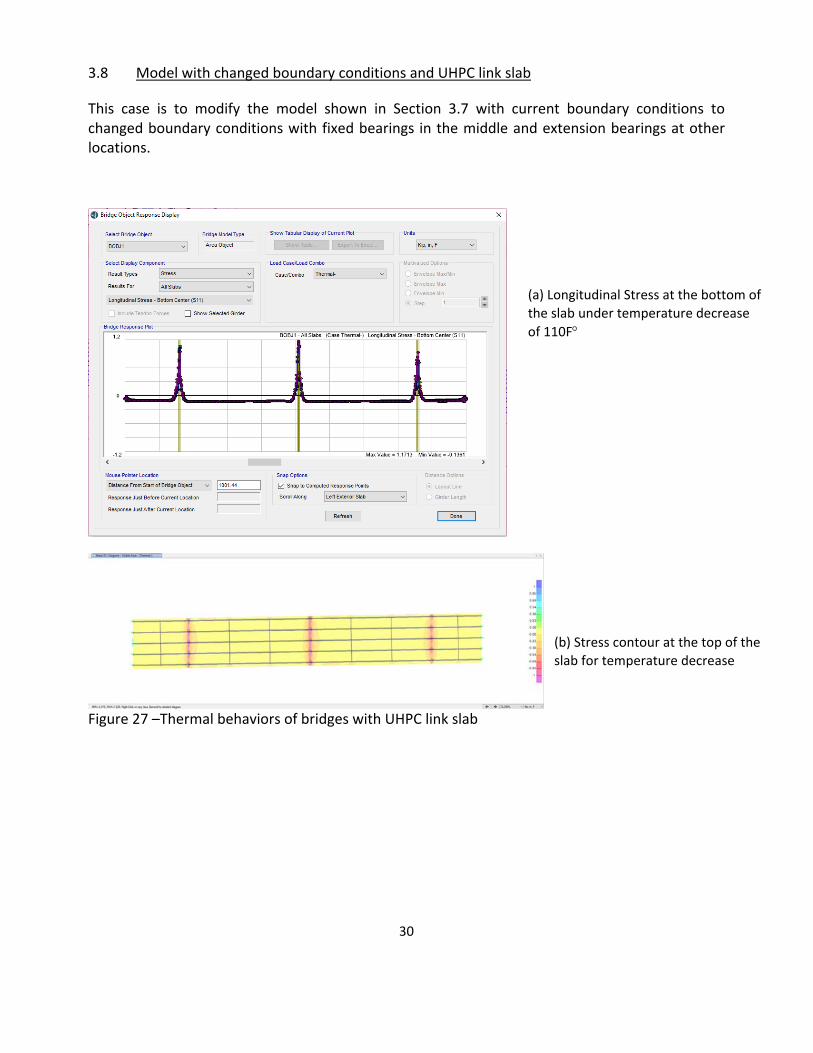
3.8 Model with changed boundary conditions and UHPC link slab
This case is to modify the model shown in Section 3.7 with current boundary conditions to changed boundary conditions with fixed bearings in the middle and extension bearings at other locations.
Figure 27 –Thermal behaviors of bridges with UHPC link slab
(a) Longitudinal Stress at the bottom of
the slab under temperature decrease
of 110F
(b) Stress contour at the top of the
slab for temperature decrease

31
Figure 28 – Behaviors of the bridge with UHPC link slab under dead load
(a) Vertical displacement
(b) Stresses at the top of the slab
(c) Stress contour view from top of
the slab

32
Summary of analysis: • Compared with the result of section 3.7, stresses due to thermal movement in slabs and
girders decreased significantly • The maximum stress due to thermal movement (110F° decreased, known as the extreme
case but should not happened) are decreased from 4.5 to 1.5 kip/in2 in average solution
for the extreme case, but for the common 55F range, the result of maximum stress should decrease from 2.3 kip/in2 to 0.7 kip/in2 in this case.
• The maximum displacement and stress caused by dead load are increasing when changing the boundary conditions.
• When the maximum tensile stress due to thermal movement happens in UHPC link slab, other parts of the bridge deck are mostly under compression when changing the bearing conditions.
33
4. Task 4 ‐ Provide recommendation of standard practice Based on previous computer runs, we have the following findings and have them listed here for discussion:
For the current bearing arrangement, the pilot bridge (CEXA27001) with link slab is tolerable with the thermal movement, but thermal stress would increase.
At abutments fixed bearings are specified for current bridge bearing arrangement. MDOT (SHA Standards) specifies the same details for the expansion and fixed bearings for spans under 50’, but the former one with slotted holes and the latter one without. If slotted holes are introduced for the fixed bearings at abutments, we may treat them as expansion ends and thermal stresses could be released. The question is whether it is feasible or not in real situations. If feasible, the boundary conditions of this 4‐span case can be treated as RRHRR and the link slab option is feasible numerically (, which is recommended to be validated physically.) In NYSDOT bearings are all replaced by elastomeric bearings and the 3‐span case are treated as RHRR.
Most of the MDTA overpass bridges are in the same pattern so we may consider them as a group and find the feasible range for link slab application.
5. Task 5 ‐ Summary and Report
Following missions are completed in this study:
Task 1: Kick‐off meeting to present the study plan was performed on June 14, 2017.
Task 1: literature search and information collection were performed; meeting with Lafarge, the sole UHPC producer in the US, and tele‐con with NYDOT engineers on their experience using UHPC were set on November 29, 2017,
Task 2: ECC mixing and testing were performed in the summer of 2017; the best performed ECC mix from a collected three candidates for the pilot project was selected.
Task 2: presentation on ECC mixes and testing results was made to the MDTA on September 28, 2017,
Task 3: several bridges from MDTA inventory for the pilot bridge implementation and modeling were investigated for possible pilot study candidate.
Task 3: a pilot bridge was selected and a site visit was conducted with MDTA and Lafarge representatives on November 29, 2017.
Tasks 3 and 4: studies of the feasibility of implementing ECC as well as UHPC without modifying bearings were performed.
Tasks 3 and 4: studies of a side‐by‐side ECC and UHPC implementations on the same bridge were concluded with suggestions,
Task 5: Report of the study was drafted and delivered here.

1
APPENDIX A
Table A1 – Candidate considered for Link Slab Pilot Demonstration
Bridge Number Bridge Name Facility Year Built Structure Type Total Length Width # Spans 2016 ADT
H‐X894001 Lapidum Rd over I‐95 JFK 1963, 1974 Steel Beam 33' 40' 76' 76' 225' 26' 4 100
CEXA27001 Union Church Rd over I‐95 JFK 1963 Steel Beam 34' 31' 76' 76' 217' 26' 4 375
CEX952001 Winch Rd over I‐95 JFK 1963, 1974 Steel Beam 34' 29' 76' 76' 215' 26' 4 1,000
CEXA11001 Bouchelle Rd over I‐95 JFK 1963 Steel Beam 31' 40' 76' 76' 223' 26' 4 1,000
CEXA38001 Deaver Rd over I‐95 JFK 1963 Steel Beam 39' 30' 77' 77' 223' 26' 4 1,000
H‐X881001 Earlton Rd over I‐95 JFK 1963, 1974 Steel Beam 36' 34' 83' 83' 236' 26' 4 1,095
HOY012001 I‐895 SBR Ramp over US 1, Patapsco River BHT 1957 Steel Beam 76' 74' 36' 60' 135' 57' 438' 26' 6 1,190
H‐X837001 Stepney Rd over I‐95 JFK 1963 Steel Beam & Girder 53' 34' 100' 100' 287' 30' 4 1,210
HOY013001 I‐895 NBR Ramp over Patapsco River BHT 1957 Steel Beam 38' 107' 107' 40' 42' 30' 364' 26' 6 1,350
BCWT34001 I‐395 Ramp EE over Warner St FMT 1980 Steel Box Girder 116' 135' 251' 22' 2 1,596
H‐X878001 Chapel Rd over I‐95 JFK 1963, 1974 Steel Beam 33' 33' 78' 78' 222' 26' 4 1,765
CEX960001 Belvedere Rd over I‐95 JFK 1963 Steel Beam 41' 33' 81' 81' 236' 26' 4 1,800
CEXA83001 MD 316 (Appleton Rd) over I‐95 JFK 1963, 1987 Steel Beam 43' 76' 76' 30' 225' 32' 4 4,300
H‐X859001 Maxa Rd over I‐95 JFK 1963, 1987 Steel Beam 45' 86' 86' 32' 249' 28' 4 5,000
H‐X796001 MD 136 (Calvary Rd) over I‐95 JFK 1963, 1974 Steel Beam 39' 29' 77' 77' 222' 30' 4 6,760
CEXA62001 MD 213 (Singerly Rd) over I‐95 JFK 1963 Steel Beam 30' 42' 79' 79' 230' 30' 4 9,700
CEX934001 MD 222 (Perrylawn Dr) over I‐95 JFK 1963 Steel Beam 35' 46' 89' 89' 259' 30' 4 14,800
Span Lengths

2
Figure A1 ‐ MDTA Bridge CEXA27001 GPE & Framing Plan

3
Figure A2 ‐ Bridge CEXA27001 Figure A3 – Exterior pier top deck expansion joint
4
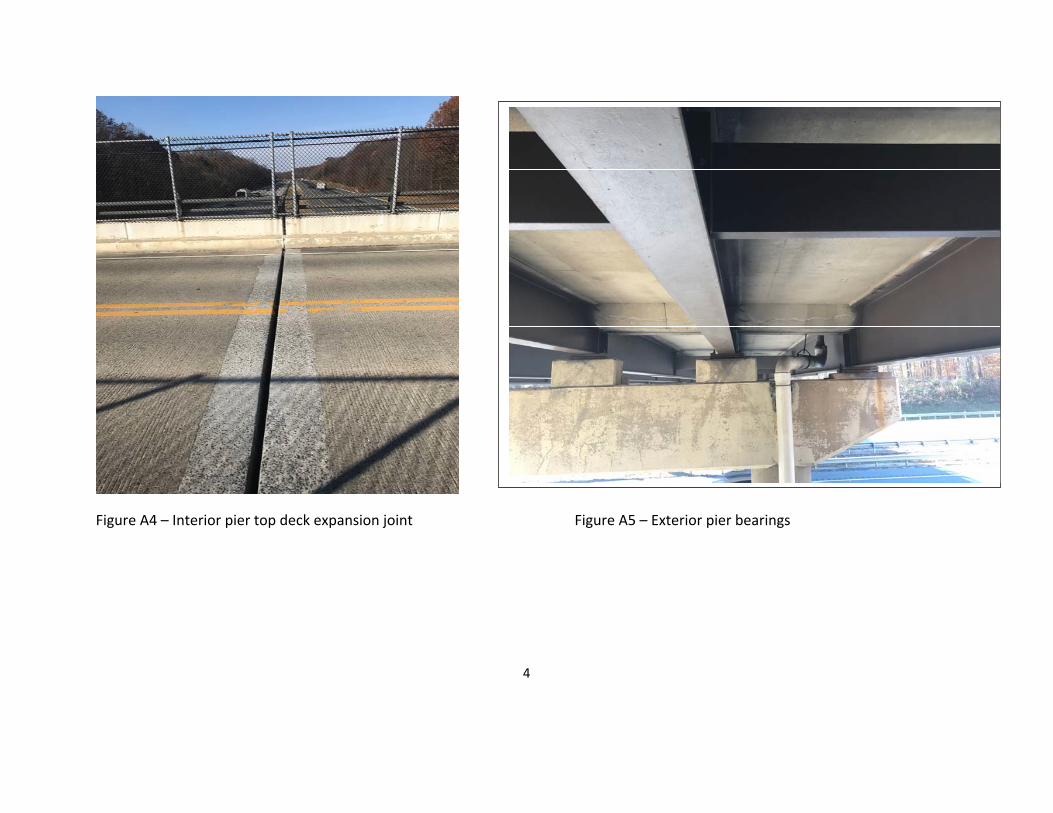
Figure A4 – Interior pier top deck expansion joint Figure A5 – Exterior pier bearings

5
Figure A6 – Abutment fixed bearing Figure A7 – Exterior pier extension bearings