Embed Size (px)
Citation preview

1 | P a g e
REPORT
VOLUME - 1 September 12th, 2017
Basmati survey report
APEDA, New Delhi
Basmati Survey - Report-1 (Season 2017)
This is the 1st report for Basmati crop across 7 states totalling 81 districts. Detailed microscopic level has been
collected and compiled in this report. The report begins with an overview of the entire scenario of Basmati crop
for the current season and then goes on to provide details state wise and then district wise. Varietal segregation
of crops has also been undertaken in the survey.
Geotrans Technologies Pvt. Ltd.

2 | P a g e
Table of Contents Chapter 1 ............................................................................................................................................................... 3
Executive Summary ........................................................................................................................................... 3
Kharif Rice Acreage ........................................................................................................................................ 3 Basmati Acreage ............................................................................................................................................ 3 Basmati Acreage of Major Varieties .............................................................................................................. 4 Long Grain Non-Basmati Acreage .................................................................................................................. 4
Chapter 2 ............................................................................................................................................................... 5 Project Background ........................................................................................................................................... 5
Map of current scope of study and report .................................................................................................... 6 Chapter 3 ............................................................................................................................................................... 7
State Level Details ............................................................................................................................................. 7
Haryana.......................................................................................................................................................... 8 Punjab ............................................................................................................................................................ 9 Uttar Pradesh .............................................................................................................................................. 10 Uttarakhand ................................................................................................................................................. 11 Jammu & Kashmir ........................................................................................................................................ 11 Himachal Pradesh ........................................................................................................................................ 11
Chapter 4 ............................................................................................................................................................. 12 Percentage share of Basmati over total rice (District wise) ............................................................................ 12
Haryana........................................................................................................................................................ 12 Punjab .......................................................................................................................................................... 13 Uttar Pradesh .............................................................................................................................................. 14 Uttarakhand ................................................................................................................................................. 14 Jammu & Kashmir ........................................................................................................................................ 15 Himachal Pradesh ........................................................................................................................................ 15
Chapter 5 ............................................................................................................................................................. 16 Price Charts ...................................................................................................................................................... 16
Chapter 6 ............................................................................................................................................................. 19 State level variety wise details ........................................................................................................................ 19
Chapter 7 ............................................................................................................................................................. 23 Rainfall ............................................................................................................................................................. 23
Methodology ................................................................................................................................................... 31
Way Forward ................................................................................................................................................... 31
Data Source ..................................................................................................................................................... 31

3 | P a g e
Chapter 1 Executive Summary
Study districts
The study area covers 81 districts, which includes 22 districts of Punjab, 21 districts of Haryana, 30 districts of
Uttar Pradesh, 4 districts of Uttarakhand, 1 district of Himachal Pradesh and 3 districts of Jammu & Kashmir.
Kharif Rice Acreage
This year the total rice transplanted area has decreased in area by 2.99% i.e. from 59,85,500 ha to 58,06,400
ha in the studied area of 7 states and 81 districts. The percentage area occupied by Basmati has reduced in
major states of Haryana and Punjab by 8% to 9% as observed during the first survey estimates. In U.P. the
area under Basmati has decreased 10,000 h. Overall the Basmati area has decreased by 7.92% in
comparison to last year i.e. 2016.
Table: 1 Kharif rice area across major states
Area (in 000 Ha.)
S.No State 2016 2017 % Change LY
Rice Area
1 Haryana 1303.1 1273.7 -2.26%
2 Punjab 3010.0 2865.6 -4.80%
3 Uttar Pradesh 1342.5 1336.2 -0.47%
4 Uttarakhad 129.4 129.6 0.15%
5 J & K 139.0 139.0 0.00%
6 Himachal Pradesh 60.0 60.8 1.25%
7 Delhi 1.5 1.5 4.11%
Total 5985.5 5806.4 -2.99%
Basmati Acreage
The total Basmati (notified varieties) area in these targeted districts has decreased by 7.93%. The notified
Basmati varieties majorly comprises of Basmati-370, Basmati- 386, Type-3 (Dehraduni), Taraori, Ranbir,
Pusa-1509, Pusa Basmati-1, CSR–30 and Pusa Basmati-1121
Table: 2 Basmati rice area across major states
Area(in 000 Ha.)
S.No State 2016 2017 % Change LY
Basmati Area
1 Haryana 719.6 652.0 -9.39%
2 Punjab 615.6 561.2 -8.84%
3 Uttar Pradesh 266.2 256.2 -3.76%
4 Uttarakhad 15.6 15.2 -2.43%
5 J & K 62.3 61.0 -2.09%
6 Himachal Pradesh 8.0 7.9 -1.25%
7 Delhi 1.5 1.5 -2.67%
Total 1688.8 1555.0 -7.92%
4 | P a g e
Basmati Acreage of Major Varieties
This year PB -1121 has been reduced to 10.53% while Pusa-1509 increased by 8.07%, clearly indicates that
farmer replaced PB 1121 with Pusa -1509 due to lesser price differential from last year. Farmer preferred high
yielding Pusa-1509 in place of low yielding PB-1121 also on account of its shorter time period and early
maturity trait. Pusa basmati – 1 is continuously reducing in acreage over years and now is only preferred by
farmers who take it for their self-consumption, however PB -1 still has good market potential in Europe & Saudi
Arabia, which is about 1.5-2 lacs ton each.
Table: 3 State wise Basmati Acreage of Major Varieties (Fig in 000 ha.)
Pusa Basmati 1121 Pusa-1509 Pusa Basmati -1
States 2016 2017 % Change 2016 2017 % Change 2016 2017 % Change
Haryana 504.9 443.5 -12.16% 26.2 29.9 14.12% 90.7 85.6 -5.62%
Punjab 555.8 499.5 -10.13% 35.2 38.7 9.94% 24.3 23.0 -5.35%
U.P 156.3 144.4 -7.61% 53.7 56.0 4.38% 43.3 42.9 -0.92%
U.K 4.2 4.1 -2.38% 2.5 2.6 2.60% 2.3 2.3 0.00%
J & K 8.4 8.3 -1.19% 0.3 0.3 4.00% - - -
H.P 2.0 2.0 0.00% 2.0 2.0 2.00% - - -
Delhi 1.5 1.5 -3.00% - - - - -
Total 1233.10 1103.26 -10.53% 119.80 129.47 8.07% 160.60 153.80 -4.23%
Long Grain Non-Basmati Acreage
The acreage under long grain non-basmati varieties (Sharbati and Sugandha) in these targeted districts has
increased by 4.30%.
This year Sharbati is the clear preference by the farmers not only over basmati but also over high yielding HYV
varieties in Western & Central part of UP / Punjab & Haryana. Primarily this acreage shift towards Sharbati is
not only due to lesser price differential between basmati & non-basmati varieties but also its high yields / lesser
susceptibility towards diseases / high demand / lesser cost of cultivation etc
Sugandha, which is primarily complimenting PB-1121 has been not grown in big way due to lesser preference
on PB -1121 this year. Usually Sugandha is not preferred by farmers as independent choice in long grain rice
Table: 4 State wise Sharbati, Sugandha (Fig in 000 ha.)
Sharbati Sugandha Total Non-Basmati
States 2016 2017 % Change 2016 2017 % Change 2016 2017 % Change
Haryana 5.75 6.0 4.87% - - - 5.75 6.0 4.87%
Punjab 5.75 5.9 2.61% - - - 5.75 5.9 2.61%
U.P 163.92 173.9 6.12% 90.86 91.9 1.14% 254.78 265.8 4.34%
U.K 14.57 15.2 4.13% 0.49 0.5 0.65% 15.06 15.66 4.02%
Total 189.99 201.1 5.82% 91.35 92.39 1.14% 281.34 293.43 4.30%
The presence of Sharbati and Sugandha is negligible in J&K, Himachal Pradesh and Delhi as compared to
other states..

5 | P a g e
Chapter 2 Project Background
Basmati rice is an important export commodity among the food grains exported from India. During the past few
years, the Basmati export has been growing steadily, from 7.71 lakh metric tonnes in 2003 to an estimated
4.05 million metric tonnes in 2015-16 on robust demand from the traditional markets in West Asia.Almost 132
countries have been importing Basmati from India every year. Out of which, Iran, Saudi Arabia, UAE and Iraq
are the major importers. Apart from India second is Pakistan from where Basmati is exported to many
countries.
Work of field survey validation based acreage estimation for all rice for Basmati crop for selected other non-
notified varieties), crop health monitoring and yield estimation and production for Basmati rice and non-notified
varieties and questionnaire based sample survey of farmers, for 81 districts in the selected seven states i.e.
Punjab, Haryana, Uttar Pradesh, Uttarakhand, Himachal Pradesh, and Jammu & Kashmir apart from Delhi.
The field survey based approach has been being applied to collect the information at block level to improve the
accuracy further to a desired level.
Table describing the districts of study under each state.
UTTAR PRADESH PUNJAB HARYANA UTTARAKHAND J & K HIMACHAL PRADESH
Agra Amritsar Ambala Dehradun Jammu Kangra
Aligarh Barnala Bhiwani Haridwar Kathua Mandi Auraiya Bhatinda Faridabad + Palwal Nainital Samba DELHI
Baghpat Faridkot Gurgaon U S Nagar
Bareilly Fatehgarh Sahib Fatehabad
Bijnore Fazilka Hisar
Budaun Firozepur Jajjhar
Bulandshahr Gurdaspur Jind
Etah+Kasganj Pathankot Kaithal
Farukhabad Hoshiarpur Karnal
Firozabad Jalandhar Kurukshetra
Etawah Kapurthala Mewat
Gautam Buddha Ngr Ludhiana MahendraGarh
Ghaziabad+Hapur Mansa Panchkula
Hathras Moga Panipat
Mathura Mohali Rewari
Mainpuri Muktsar Rohtak
Meerut Nawanshahar Sirsa
Moradabad Patiala Sonepat
J.P.Nagar Rupnagar Yamunanagar
Kannauj Sangrur
Muzaffarnagar+Shamli Tarantaran
Pilibhit
Rampur
Saharanpur
Shahjahanpur
Sambhal
The Basmati varieties for which
information is provided include Basmati-
370, Basmati- 386, Type-3 (Dehraduni),
Taraori, Ranbir), Pusa-1509, Pusa
Basmati-1, CSR–30 and Pusa Basmati-
1121 and non-notified, non- Basmati
(Sharbati, and Permal).

6 | P a g e
Map of current scope of study and report
The present report being the first cycle of report for Kharif-(2017-2018) covers the results of field survey based
total rice and total Basmati acreage in different states.
Validation using satellite mapping: We also used advanced stellite mapping technology to verify the findings of
the survey and the same have been found to the accurate. Satellite mapping uses various bands of recance to
segrigate crops.
Based on this and using several filteres we have segrigated the crops and crops to verify the data.

7 | P a g e
Chapter 3 State Level Details
This year Total rice is the studied 81 districts has been reduced to 3.% while basmati acreage has been
reduced to 7.93%. This year in India total kharif rice has been reduced 1.4% from 379,12,000 to 374,02,000.
In targeted 81 districts farmers preferred sugarcane and cotton crop over rice due to higher returns on these
crops. The basmati acreage share in total rice has been also reduced from 28.21% to 26.78% in the studied
areas.
Table: 5 State wise rice transplanted area and Basmati area in Kharif 2017
State-wise Rice Transplanted Area and Basmati Area in kharif-2017-18
Area '000 ha
S.No. State
Area Transplanted
2016 2017
Total rice Basmati Total rice Basmati
1 Haryana 1303.1 719.6 1273.7 652.0
2 Punjab 3010.0 615.6 2865.6 561.2
3 Uttar Pradesh 1342.5 266.2 1336.2 256.2
4 Uttarakhand 129.4 15.62 129.6 15.2
5 Jammu & Kashmir 139.0 62.3 139.0 61.0
6 Himachal Pradesh 60.0 8.0 60.8 7.9
7 Delhi 1.5 1.5 1.5 1.46
Total 5985.5 1688.8 5806.4 1555.0

8 | P a g e
Haryana
In Haryana, the total rice acreage based on field survey has been
estimated at 1,273,750 ha in 20 districts as on 10 Sept 2017.
Karnal district has the highest target area under total rice (1,59,697 ha),
followed by Kaithal district (1,57,707 ha).
The transplanting is almost completed in the state. Basmati area has
reduced by 9.4% in comparison to last year.
Table: 6 Basmati rice acreages in Haryana Kharif 2017
S. No. District
Total rice acreage Total basmati acreage
2016 2017 % Change LY 2016 2017 % Change LY
Acreage in '000 hac
1 Ambala 82.0 80.0 -2.5% 16.9 15.4 -8.7%
2 Bhiwani 21.7 20.9 -3.5% 22.1 18.7 -15.0%
3 Faridabad + Palwal 33.3 32.5 -2.5% 28.8 25.5 -11.3%
4 Gurgaon 4.9 4.7 -4.1% 2.6 2.2 -14.2%
5 Fatehabad 113.0 107.9 -4.5% 49.7 44.7 -10.0%
6 Hisar 64.4 61.5 -4.5% 44.8 38.4 -14.2%
7 Jajjhar 43.6 42.5 -2.5% 43.6 38.6 -11.4%
8 Jind 130.0 126.8 -2.5% 81.2 70.6 -13.1%
9 Kaithal 158.5 157.7 -0.5% 64.6 60.9 -5.7%
10 Karnal 160.5 159.7 -0.5% 78.6 75.0 -4.6%
11 Kurukshetra 120.0 118.2 -1.5% 30.8 29.1 -5.6%
12 Mewat 8.0 7.9 -1.5% 7.5 6.6 -12.0%
13 MahendraGarh - - - - - -
14 Panchkula 9.5 9.3 -2.5% - - -
15 Panipat 72.0 70.9 -1.5% 68.1 63.5 -6.8%
16 Rewari 1.8 1.7 -3.5% 1.2 1.1 -12.0%
17 Rohtak 44.0 42.0 -4.5% 36.3 30.8 -14.9%
18 Sirsa 74.4 71.1 -4.5% 60.6 57.0 -6.0%
19 Sonepat 90.0 88.7 -1.5% 73.5 65.2 -11.3%
20 Yamunanagar 71.5 69.9 -2.3% 9.0 8.7 -3.9%
Total 1303.1 1273.7 -2.3% 719.7 652.0 -9.4%

9 | P a g e
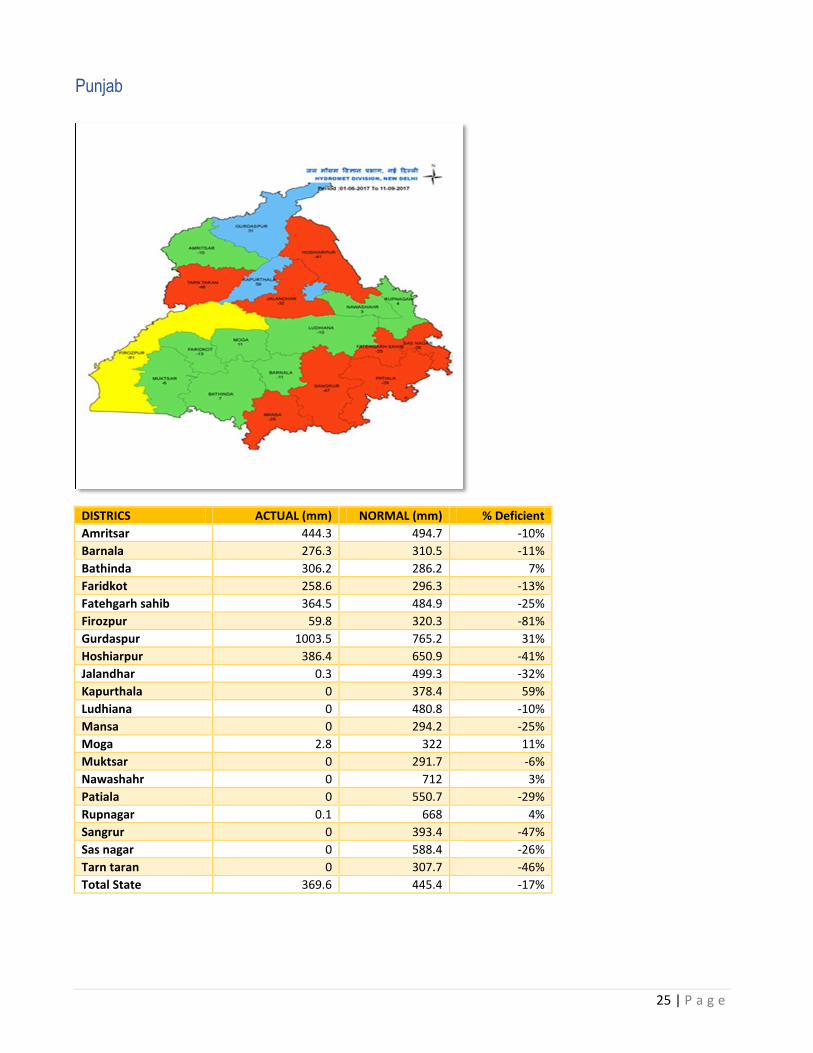
Punjab
In Punjab, the rice transplanting has been 2,865,600 ha in 22 districts
this year, which is about 4.8% lower than last year. Sangrur district has
the largest area under rice (266,005 ha), followed by Ludhiana district
(248,005ha). Farmer shifted in cotton crop due to its higher return
The total basmati acreage in Punjab has been reduced to 8.9%. The
districts like Muktsar/ Mansa / Rupnagar/ Sangrur/ Bhatinda has seen
basmati acreage reduce in the tune of 13-15%
Table: 7 Basmati rice acreages in Punjab Kharif 2017
S. No. District
Total rice acreage Total basmati acreage
2016 2017 % Change LY 2016 2017 % Change LY
Acreage in '000 hac
1 Amritsar 180.0 177.3 -1.5% 113.9 103.6 -9.1%
2 Barnala 110.0 105.1 -4.5% 2.6 2.3 -9.6%
3 Bhatinda 160.0 148.0 -7.5% 11.3 9.6 -15.0%
4 Faridkot 114.0 108.9 -4.5% 22.8 20.5 -10.0%
5 Fatehgarh Sahib 86.0 82.1 -4.5% 10.4 9.5 -9.0%
6 Fazilka 187.0 169.2 -9.5% 70.3 66.8 -5.0%
7 Firozepur 125.0 113.1 -9.5% 50.9 48.3 -5.0%
8 Gurdaspur 174.0 166.2 -4.5% 44.2 42.0 -5.0%
9 Pathankot 27.0 25.8 -4.5% 3.0 2.7 -10.0%
10 Hoshiarpur 65.0 62.1 -4.5% 7.3 6.6 -10.0%
11 Jalandhar 164.0 156.6 -4.5% 11.4 10.4 -8.9%
12 Kapurthala 118.0 116.2 -1.5% 8.5 7.7 -10.0%
13 Ludhiana 257.0 248.0 -3.5% 24.5 22.7 -7.5%
14 Mansa 99.0 89.6 -9.5% 1.0 0.9 -15.0%
15 Moga 182.0 173.8 -4.5% 20.1 18.1 -10.0%
16 Mohali 31.0 29.6 -4.5% 4.3 3.9 -10.0%
17 Muktsar 160.0 148.0 -7.5% 58.9 50.7 -13.9%
18 Nawanshahar 54.0 53.2 -1.5% 5.4 4.9 -9.3%
19 Patiala 230.0 219.7 -4.5% 21.6 19.8 -8.5%
20 Rupnagar 34.0 32.5 -4.5% 3.2 2.8 -11.9%
21 Sangrur 276.0 266.3 -3.5% 36.6 32.0 -12.7%
22 Tarantaran 177.0 174.3 -1.5% 83.3 75.6 -9.2%
Total 3010.0 2865.6 -4.8% 615.6 561.2 -8.8%

10 | P a g e
Uttar Pradesh
In Uttar Pradesh, timely onset of monsoon, rice transplanting was
started in time and continued in full swing during July. A total of
13,36,190 ha rice acreage based on field survey has been estimated as
transplanted in the 27 districts of the state as on 10 Sept 2017.
Shahjehanpur district has the largest total rice area (1,97,051 ha),
followed by Pilibhit (1,52,500 ha).
The area under Basmati rice has decreased in Uttar Pradesh in
comparison to last year. And in districts like Muzaffarnagar, Bagpat,
Meerut, many farmers have sown sugarcane replacing Basmati
speculating quick returns from the sugar mills. Moreoer, this year
basmati has been relaced with Sharbati & high Yielding varieties which
gave high returns to farmers last year.
Table: 8 Basmati rice acreages in Uttar Pradesh Kharif 2017
S. No. District
Total rice acreage Total basmati acreage
2016 2017 % Change LY 2016 2017 % Change LY
Acreage in '000 hac
1 Agra 4.1 4.0 -3.5% 0.9 0.9 -2.9%
2 Aligarh 58.3 58.3 0.0% 27.6 26.1 -5.4%
3 Auraiya 44.5 44.9 1.0% 2.0 1.9 -4.6%
4 Baghpat 5.1 4.9 -3.5% 3.9 3.7 -4.3%
5 Bareilly 151.6 150.1 -1.0% 3.1 3.0 -1.7%
6 Bijnore 45.3 43.7 -3.5% 6.9 6.9 -1.0%
7 Budaun 47.8 47.8 0.0% 14.2 14.1 -0.9%
8 Bulandshahr 52.5 52.0 -1.0% 30.7 28.7 -6.6%
9 Etah+Kasganj 32.5 33.2 2.0% 8.6 8.7 0.5%
10 Farukhabad 11.1 11.3 2.0% 2.7 2.7 -1.1%
11 Firozabad 12.4 12.5 1.0% 3.9 3.8 -1.2%
12 Etawah 40.2 40.6 1.0% 9.0 8.9 -1.1%
13 Gautam Buddha Ngr 27.1 26.8 -1.0% 21.4 20.3 -5.2%
14 Ghaziabad+Hapur 27.8 27.0 -3.0% 10.0 9.7 -2.7%
15 Hathras 14.2 13.6 -4.5% 7.3 7.1 -3.4%
16 Mathura 38.2 35.7 -6.5% 29.4 27.3 -7.2%
17 Mainpuri 47.1 48.0 2.0% 18.7 18.1 -2.9%
18 Meerut 17.6 16.3 -7.5% 7.3 7.1 -2.9%
19 Moradabad 65.2 66.5 2.0% 3.4 3.4 1.3%
20 J.P.Nagar 16.3 16.0 -2.0% 4.1 4.1 0.3%
21 Kannauj 12.2 12.3 1.0% 2.2 2.2 0.3%
22 Muzaffarnagar+Shamli 32.2 29.8 -7.5% 11.1 10.6 -4.6%
23 Pilibhit 152.5 152.5 0.0% 4.4 4.4 1.0%
24 Rampur 110.2 112.4 2.0% 2.0 2.0 0.9%
25 Saharanpur 53.5 50.5 -5.6% 23.1 22.3 -3.4%
26 Shahjehanpur 195.1 197.1 1.0% 4.4 4.3 -1.8%
27 Sambhal 27.9 28.5 2.0% 3.7 3.6 -0.4%
Total 1342.5 1336.2 -0.5% 266.2 256.2 -3.7%

11 | P a g e
Uttarakhand
In Uttarakhand, A total of 1,29,628 ha rice acreage based on first field
survey has been estimated as transplanted in the 4 districts as on 10
Sept 2017. Udham Singh Nagar district has the largest area under rice
(99,468 ha). The total Basmati area is estimated to be 158,20 ha out of
which 2,565 ha. is under Pusa Basmati-1509.
Table: 9 Basmati rice acreages in Uttarakhand Kharif 2017
S. No. District
Total Rice Acreage Total Basmati Acreage
2016 2017 % Change 2016 2017 % Change
Acreage in '000 hac
1 Dehradun 7.4 7.4 0.2% 3.1 3.0 -2.4%
2 Haridwar 14.2 14.2 0.2% 6.7 6.5 -2.3%
3 Nainital 8.5 8.5 0.2% 1.5 1.5 -1.0%
4 U S Nagar 99.3 99.5 0.2% 4.3 4.2 -3.1%
Total 129.4 129.6 0.2% 15.6 15.2 -2.4%
Jammu & Kashmir
In Jammu & Kashmir, three districts have been taken up for the study.
The total rice area is estimated to be 1,39,000 ha. in these districts.
Jammu & Samba have an area of 97,000 ha. and Kathua only 42,000
ha. The state has received excess rainfall this year and the
transplanting is complete.
Table: 10 Basmati rice acreages in Jammu & Kashmit Kharif 2017
S.No District Total Rice 2017 Total Basmati Rice
2017 % Share of Basmati
Rice
1 Jammu 85.0 48.1 57.2%
2 Kathua 42.0 10.2 24.5%
3 Samba 12.0 2.7 22.5%
Total 139.0 61.0 44.3%
Himachal Pradesh
In Himachal Pradesh, A total of 76,550 ha rice acreage based on field
survey has been estimated as transplanted in 11 districts. Kangra district
has the highest area (60,750 ha). The Basmati varieties are grown mostly
in Kangra. The farmers opted Permal varieties including PR-123 in the
increased paddy area and the area under Pusa Basmati- 1509.
Table: 11 Basmati rice acreages in Himachal Pradesh Kharif 2017
S.No District Total Rice 2017 Total Basmati Rice
2017 % Share of Basmati
Rice
1 Kangra 60.8 4.0 6.6%
2 Mandi - 3.9 -
Total 60.8 7.9 13.0%

12 | P a g e
Chapter 4 Percentage share of Basmati over total rice (District wise)
Haryana
Table: 12 District-wise acreage under total rice and Basmati area transplanted in Haryana during Kharif-(2017)
S.No District Total Rice Basmati Rice % Share of Basmati Rice
1 Ambala 80.0 15.4 19.3%
2 Bhiwani 20.9 18.7 89.5%
3 Faridabad + Palwal 32.5 25.5 78.6%
4 Gurgaon 4.7 2.2 47.2%
5 Fatehabad 107.9 44.7 41.5%
6 Hisar 61.5 38.4 62.5%
7 Jajjhar 42.5 38.6 90.9%
8 Jind 126.8 70.6 55.7%
9 Kaithal 157.7 60.9 38.6%
10 Karnal 159.7 75.0 46.9%
11 Kurukshetra 118.2 29.1 24.6%
12 Mewat 7.9 6.6 83.8%
13 MahendraGarh - - -
14 Panchkula 9.3 0.0 0.0%
15 Panipat 70.9 63.5 89.5%
16 Rewari 1.7 1.1 60.8%
17 Rohtak 42.0 30.8 73.4%
18 Sirsa 71.1 57.0 80.2%
19 Sonepat 88.7 65.2 73.5%
20 Yamunanagar 69.9 8.7 12.4%
TOTAL 1273.7 652.0 51.2%

13 | P a g e
Punjab
Table: 13 District-wise acreage under total rice and Basmati area transplanted in Punjab during Kharif-(2017)
S.No District Total Rice Basmati Rice % Share of Basmati Rice
1 Amritsar 177.3 103.6 58.4%
2 Barnala 105.1 2.3 2.2%
3 Bhatinda 148.0 9.6 6.5%
4 Faridkot 108.9 20.5 18.8%
5 Fatehgarh Sahib 82.1 9.5 11.6%
6 Fazilka 169.2 66.8 39.5%
7 Firozepur 113.1 48.3 42.7%
8 Gurdaspur 166.2 42.0 25.3%
9 Pathankot 25.8 2.7 10.5%
10 Hoshiarpur 62.1 6.6 10.6%
11 Jalandhar 156.6 10.4 6.6%
12 Kapurthala 116.2 7.7 6.6%
13 Ludhiana 248.0 22.7 9.1%
14 Mansa 89.6 0.9 0.9%
15 Moga 173.8 18.1 10.4%
16 Mohali 29.6 3.9 13.1%
17 Muktsar 148.0 50.7 34.3%
18 Nawanshahar 53.2 4.9 9.2%
19 Patiala 219.7 19.8 9.0%
20 Rupnagar 32.5 2.8 8.7%
21 Sangrur 266.3 32.0 12.0%
22 Tarantaran 174.3 75.6 43.4%
Total 2865.6 561.2 19.6%

14 | P a g e
Uttar Pradesh
Table: 14 District-wise acreage under total rice and Basmati area transplanted in U.P during Kharif-(2017)
S.No District Total Rice Basmati Rice % Share of Basmati Rice
1 Agra 4.0 0.9 22.7%
2 Aligarh 58.3 26.1 44.8%
3 Auraiya 45.0 1.9 4.2%
4 Baghpat 4.9 3.7 75.2%
5 Bareilly 150.1 3.0 2.0%
6 Bijnore 43.7 6.9 15.8%
7 Budaun 47.8 14.1 29.5%
8 Bulandshahr 52.0 28.7 55.2%
9 Etah+Kasganj 33.2 8.7 26.2%
10 Farukhabad 11.3 2.7 23.9%
11 Firozabad 12.5 3.8 30.4%
12 Etawah 40.6 8.9 21.9%
13 Gautam Buddha Ngr 26.8 20.3 75.7%
14 Ghaziabad+Hapur 27.0 9.7 36.0%
15 Hathras 13.6 7.1 52.4%
16 Mathura 35.7 27.3 76.4%
17 Mainpuri 48.0 18.1 37.7%
18 Meerut 16.3 7.1 43.6%
19 Moradabad 66.5 3.4 5.1%
20 J.P.Nagar 16.0 4.1 25.7%
21 Kannauj 12.3 2.2 17.9%
22 Muzaffarnagar+Shamli 29.8 10.6 35.6%
23 Pilibhit 152.5 4.4 2.9%
24 Rampur 112.4 2.0 1.8%
25 Saharanpur 50.5 22.3 44.2%
26 Shahjehanpur 197.1 4.3 2.2%
27 Sambhal 28.5 3.6 12.6%
Total 1336.2 256.2 19.2%
Uttarakhand
Table: 15 District-wise acreage under total rice and Basmati area transplanted in U.K during Kharif-(2017)
S.No District Total Rice Basmati Rice % Share of Basmati Rice
1 Dehradun 7.4 0.6 8.1%
2 Haridwar 14.2 4.3 30.2%
3 Nainital 8.5 0.6 7.1%
4 U S Nagar 99.5 3.5 3.5%
Total 129.6 9.0 6.9%

15 | P a g e
Jammu & Kashmir
Table: 16 District-wise acreage under total rice and Basmati area transplanted in J & K during Kharif-(2017)
S.No District Total Rice Basmati Rice % Share of Basmati Rice
1 Jammu 85.0 48.6 57.2%
2 Kathua 42.0 10.3 24.5%
3 Samba 12.0 2.7 22.5%
Total 139.0 61.6 44.3%
Himachal Pradesh
Table: 17 District-wise acreage under total rice and Basmati area transplanted in H & P during Kharif-(2017)
S.No District Total Rice 2017 Total Basmati
Rice 2017 % Share of Basmati Rice
1 Kangra* 60.8 4.0 6.6%
2 Mandi*
3.9 40.0%
Total 60.8 7.9 11.2%

16 | P a g e
Chapter 5 Price Charts
We tried to compare the price charts for the different competing variants of basmati & non -basmati rice , so
that facts can be established over period in time that how market was not supporting the anticipated price and
that’s why farmer shifted to other crops. The data-sets on prices are from market pooling exercise done
independently by the agency.

17 | P a g e

18 | P a g e

19 | P a g e
Chapter 6 State level variety wise details
Table: 18 HARYANA District-wise Variety-wise Basmati Acreage ( fig in 000 hc )
2016 2017 2016 2017 2016 2017 2016 2017 2016 2017
S.No District Pusa Basmati
1121 Pusa 1509
PB -1(inlcd PB-3/ PB-6/1401)
CSR 30 & other evolved varieties
Total Basmati
1 Ambala 7.2 6.2 0.1 0.1 0.3 0.2 9.3 8.8 16.9 15.4
2 Bhiwani 22.1 18.7 0.0 0.0 0.0 22.1 18.7
3 Faridabad + Palwal 25.1 22.1 0.2 0.2 3.5 3.2 0.0 28.8 25.5
4 Gurgaon 2.4 2.0 0.0 0.2 0.2 0.0 2.6 2.2
5 Fatehabad 27.4 23.3 1.3 1.5 20.0 19.0 1.1 1.0 49.7 44.7
6 Hisar 42.4 36.0 0.5 0.5 0.9 0.8 1.1 1.0 44.8 38.4
7 Jajjhar 42.4 37.3 0.9 1.1 0.0 0.3 0.3 43.6 38.6
8 Jind 65.0 55.3 1.9 2.2 8.3 7.4 6.0 5.7 81.2 70.6
9 Kaithal 37.3 34.3 2.8 3.4 0.1 0.1 24.4 23.2 64.6 60.9
10 Karnal 39.7 36.5 8.9 9.9 0.3 0.2 29.8 28.3 78.6 75.0
11 Kurukshetra 11.0 9.9 2.7 3.0 2.6 2.3 14.5 13.8 30.8 29.1
12 Mewat 7.5 6.6 0.0 0.0 0.0 7.5 6.6
13 MahendraGarh
14 Panchkula 0.0 0.0 0.0 0.0 0.0 0.0
15 Panipat 56.0 51.5 2.2 2.5 2.1 2.0 7.9 7.5 68.1 63.5
16 Rewari 1.2 1.1 0.0 0.0 0.0 1.2 1.1
17 Rohtak 36.2 30.7 0.1 0.1 0.0 0.1 0.1 36.3 30.8
18 Sirsa 11.9 10.1 3.0 3.4 45.5 43.2 0.3 0.3 60.6 57.0
19 Sonepat 69.3 61.0 1.2 1.4 0.0 2.9 2.8 73.5 65.2
20 Yamunanagar 0.8 0.7 0.6 0.7 7.2 6.9 0.4 0.4 9.0 8.7
TOTAL 504.9 443.5 26.2 29.9 90.7 85.6 98.0 93.1 719.7 652.0

20 | P a g e
Table: 19 PUNJAB District-wise Variety-wise Basmati Acreage ( fig in 000 hc )
2016 2017 2016 2017 2016 2017 2016 2017
S.No District Pusa Basmati 1121 Pusa 1509 PB -1( inlcd PB-3/ PB-
6/ 1401 Total Basmati
acreage
1 Amritsar 85.5 72.6 28.1 30.9 113.9 103.6
2 Barnala 2.0 1.8 0.5 0.5 2.6 2.3
3 Bhatinda 11.3 9.6 11.3 9.6
4 Faridkot 22.8 20.5 22.8 20.5
5 Fatehgarh Sahib 8.4 7.6 2.0 1.9 10.4 9.5
6 Fazilka 70.3 66.8 70.3 66.8
7 Firozepur 50.9 48.3 50.9 48.3
8 Gurdaspur 44.1 41.9 0.1 0.1 44.2 42.0
9 Pathankot 3.0 2.7 3.0 2.7
10 Hoshiarpur 7.3 6.6 7.3 6.6
11 Jalandhar 10.7 9.7 0.7 0.8 11.4 10.4
12 Kapurthala 8.5 7.7 0.0 8.5 7.7
13 Ludhiana 19.3 17.4 2.0 2.1 3.3 3.2 24.5 22.7
14 Mansa 1.0 0.9 1.0 0.9
15 Moga 19.9 17.9 0.1 0.1 20.1 18.1
16 Mohali 4.3 3.9 4.3 3.9
17 Muktsar 49.9 42.4 9.0 8.3 58.9 50.7
18 Nawanshahar 5.2 4.7 0.2 0.2 5.4 4.9
19 Patiala 17.9 16.1 1.0 1.1 2.7 2.6 21.6 19.8
20 Rupnagar 3.2 2.8 0.0 0.0 3.2 2.8
21 Sangrur 30.1 25.6 6.6 6.4 36.6 32.0
22 Tarantaran 80.2 72.2 3.1 3.4 83.3 75.6
Total 555.8 499.5 35.2 38.7 24.3 23.0 615.6 561.2

21 | P a g e
Table: 20 UTTAR PRADESH District-wise Variety-wise Basmati Acreage ( fig in 000 hc )
2016 2017 2016 2017 2016 2017 2016 2017
S.No District Pusa Basmati
1121 Pusa 1509
PB -1( inlcd PB-3/ PB-6/ 1401
Total Basmati incl others basmati
varieties
1 Agra 0.4 0.3 0.5 0.5 0.1 0.1 0.9 0.9
2 Aligarh 18.6 16.9 4.2 4.3 4.9 4.9 27.6 26.1
3 Auraiya 1.1 1.0 0.2 0.2 0.1 0.0 2.0 1.9
4 Baghpat 2.1 1.9 0.5 0.5 1.2 1.2 3.9 3.7
5 Bareilly 1.3 1.2 0.6 0.7 0.5 0.5 3.1 3.0
6 Bijnore 1.6 1.5 2.2 2.3 3.2 3.1 6.9 6.9
7 Budaun 2.0 1.9 2.0 2.1 0.8 0.7 14.2 14.1
8 Bulandshahr 20.7 18.5 4.2 4.5 5.8 5.8 30.7 28.7
9 Etah+Kasganj 5.2 5.0 2.9 3.1 0.5 0.5 8.6 8.7
10 Farukhabad 1.8 1.8 0.8 0.9 0.1 0.1 2.7 2.7
11 Firozabad 2.3 2.3 1.3 1.3 0.2 0.2 3.9 3.8
12 Etawah 6.3 6.2 2.5 2.6 0.2 0.2 9.0 8.9
13 Gautam Buddha Nagar 18.9 17.7 0.8 0.8 1.8 1.8 21.4 20.3
14 Ghaziabad+Hapur 5.8 5.4 2.8 2.9 1.4 1.4 10.0 9.7
15 Hathras 4.2 3.9 2.3 2.4 0.8 0.8 7.3 7.1
16 Mathura 25.1 22.8 3.3 3.4 1.1 1.0 29.4 27.3
17 Mainpuri 16.1 15.5 2.4 2.5 0.2 0.2 18.7 18.1
18 Meerut 2.6 2.2 2.4 2.5 2.4 2.3 7.3 7.1
19 Moradabad 1.0 0.9 2.1 2.2 0.3 0.3 3.4 3.4
20 J.P.Nagar 1.2 1.2 1.9 2.0 1.0 1.0 4.1 4.1
21 Kannauj 0.7 0.6 1.4 1.4 0.2 0.2 2.2 2.2
22 Muzaffarnagar+Shamli 4.6 4.1 2.4 2.5 4.0 3.9 11.1 10.6
23 Pilibhit 0.9 0.8 3.3 3.4 0.2 0.2 4.4 4.4
24 Rampur 0.7 0.7 1.2 1.2 0.1 0.1 2.0 2.0
25 Saharanpur 7.8 6.9 3.1 3.3 12.0 11.9 23.1 22.3
26 Shahjehanpur 1.6 1.5 0.8 0.8 0.3 0.3 4.4 4.3
27 Sambhal 1.6 1.5 1.7 1.7 0.4 0.4 3.7 3.6
Total 156.3 144.4 53.7 56.0 43.3 42.9 266.2 256.2
Table: 21 UTTARAKHAND District-wise Variety-wise Basmati Acreage ( fig in 000 hc )
2016 2017 2016 2017 2016 2017 2016 2017
S.No District Pusa Basmati 1121 Pusa 1509 PB -1( inlcd PB-3/ PB-6/ 1401)
Total Basmati incl others basmati varieties
1 Dehradun 0.4 0.4 0.2 0.2 3.1 3.0
2 Haridwar 1.6 1.5 0.5 0.5 2.2 2.2 6.7 6.5
3 Nainital 0.3 0.3 0.3 0.3 1.5 1.5
4 U S Nagar 1.9 1.7 1.5 1.5 0.1 0.1 4.3 4.2
Total 4.2 3.9 2.5 2.6 2.3 2.3 15.6 15.2

22 | P a g e
Table: 22 JAMMU & KASHMIR District-wise Variety-wise Basmati Acreage ( fig in 000 hc )
2016 2017 2016 2017 2016 2017 2016 2017
S.No District Pusa Basmati 1121 Pusa 1509 BASMATI 370 Total Basmati incl others
basmati varieties
1 Jammu 1.4 1.4 0.0 0.0 47.7 46.7 49.1 48.1
2 Kathua 6.4 6.3 0.2 0.2 3.8 3.7 10.4 10.2
3 Samba 0.6 0.6 0.1 0.1 2.1 2.1 2.8 2.7
Total 8.4 8.2 0.3 0.3 53.6 52.5 62.3 61.0
Table: 23 HIMACHAL PRADESH District-wise Variety-wise Basmati Acreage ( fig in 000 hc )
2016 2017 2016 2017 2016 2017 2016 2017
S.No District Pusa Basmati 1121 Pusa 1509 Others Basmati
Varieties Total Basmati incl
others basmati varieties
1 Kangra* 2.0 1.9 1.0 1.0 1.0 1.0 4.0 3.9
2 Mandi* 2.0 1.9 1.0 1.0 1.0 1.0 4.0 3.9
Total 4.0 3.8 2.0 2.0 2.0 1.9 8.0 7.8

23 | P a g e
Chapter 7 Rainfall
The Basmati growing belt has witnessed normal to deficient rainfall in the months of June and July this year in
the states of Punjab, Haryana and Western U.P. But transplanting has been timely due to good distribution of
rainfall in the districts.
Table: 24 Rainfall across various states Normal Vs Actual
DISTRICS ACTUAL (mm) NORMAL (mm) % Deficient
Haryana 308.4 421.7 -27%
Punjab 369.6 445.4 -17%
U. P 531.2 749.6 -29%
U. K 1083.4 1123.2 -4%
J & K 540.0 499.7 8%
H.P 674.0 753.9 -14%
Delhi 385.2 591.5 -35%
Rain fall graph

24 | P a g e
Rainfall of the area, Maps
Haryana
DISTRICS ACTUAL (mm) NORMAL (mm) % Deficient
Ambala 523.6 818.2 -36%
Bhiwani 223.4 321.7 -31%
Faridabad 398.7 551.8 -28%
Fatehabad 137.8 256.5 -46%
Gurgaon 212.2 442 -52%
Hisar 247.2 296 -16%
Jhajjar 369.7 390.1 -5%
Jind 309.5 372.5 -17%
Kaithal 351.2 348.5 1%
Karnal 495.5 524.5 -6%
Kurukshetra 367.9 511.7 -28%
Mahendragarh 306.6 374 -18%
Mewat 355 462.5 -23%
Palwal 197.4 401.4 -51%
Panchkula 358.6 867.5 -59%
Panipat 275.2 480.1 -43%
Rewari 345.8 407.2 -15%
Rohtak 252 480.7 -48%
Sirsa 152.3 218.7 -30%
Sonipat 312.8 495.9 -37%
Yamunanagar 752.6 829.4 -9%
Total State 308.4 421.7 -27%
25 | P a g e
Punjab
DISTRICS ACTUAL (mm) NORMAL (mm) % Deficient
Amritsar 444.3 494.7 -10%
Barnala 276.3 310.5 -11%
Bathinda 306.2 286.2 7%
Faridkot 258.6 296.3 -13%
Fatehgarh sahib 364.5 484.9 -25%
Firozpur 59.8 320.3 -81%
Gurdaspur 1003.5 765.2 31%
Hoshiarpur 386.4 650.9 -41%
Jalandhar 0.3 499.3 -32%
Kapurthala 0 378.4 59%
Ludhiana 0 480.8 -10%
Mansa 0 294.2 -25%
Moga 2.8 322 11%
Muktsar 0 291.7 -6%
Nawashahr 0 712 3%
Patiala 0 550.7 -29%
Rupnagar 0.1 668 4%
Sangrur 0 393.4 -47%
Sas nagar 0 588.4 -26%
Tarn taran 0 307.7 -46%
Total State 369.6 445.4 -17%

26 | P a g e
Uttar Pradesh
DISTRICS ACTUAL (mm) NORMAL (mm) % Deficient
Agra 204.3 618.1 -67%
Aligarh 422.5 581.1 -27%
Auraiya 268.3 623.8 -57%
Baghpat 472.8 494.2 -4%
Bareilly 748.8 766.9 -2%
Bijnore 766.7 828.8 -7%
Budaun 465.2 681.4 -32%
Bulandshahr 382.9 591.4 -35%
Etah+kasganj 400.7 549.5 -27%
Farukhabad 504.8 671.3 -25%
Firozabad 484.4 590.4 -18%
Etawah 350.7 651 -46%
Gautam buddha ngr 484.4 590.4 -18%
Ghaziabad+hapur 231 492.8 -53%
Mathura 229.5 522.1 -0.56
Mainpuri 456.3 581.3 -22%
Meerut 446.7 701 -36%
Moradabad 771.8 770.8 0%
J.p. nagar 620.5 697.6 -11%
Kannauj 573.3 692 -17%
Muzaffarnagar+shamli 385.4 663.8 -42%
Pilibhit 371.1 875 -58%
Rampur 417.9 825.3 -49%
Saharanpur 614.4 732.8 -16%
Shahjehanpur 382.4 772.7 -51%
Total State 531.2 749.6 -29%

27 | P a g e
Uttarakhand
DISTRICS ACTUAL (mm) NORMAL (mm) % Deficient
Almora 854.7 771.4 11%
Bageshwar 1035.3 771.4 34%
Chamoli 1124.1 796.7 41%
Champawat 1162.9 1191.9 -2%
Dehradun 1613 1676.5 -4%
Haridwar 730.5 889.9 -18%
Nanital 1523.8 1296.2 18%
Pauri garhwal 795.7 1120.2 -29%
Pithoragarh 1419.4 1542.4 -8%
Rudraprayag 1318.4 1565.7 -16%
Tehri garwal 673.6 965.4 -30%
Udham singh ngr 832.1 1003 -17%
Uttarkashi 891.9 1030.9 -13%
Total State 1083.4 1123.2 -4%

28 | P a g e
Jammu & Kashmir
DISTRICS ACTUAL (mm) NORMAL (mm) % Deficient
Jammu 0 807 2%
Kathua 4.2 908.7 21%
Samba 0 807 -38%
Total State 540.0 499.7 8%

29 | P a g e
Himachal Pradesh
DISTRICS ACTUAL (mm) NORMAL (mm) % Deficient
Bilaspur 0 797.7 11%
Chamba 2.2 1300.4 -49%
Hamirpur 1.3 997.6 4%
Kangra 2.7 1477.3 8%
Kinnaur 1.4 220.8 -40%
Kullu 0.5 473.4 10%
Mandi 3.2 1020.7 11%
Shimla 4.2 575.2 1%
Sirmaur 0 1233.6 -14%
Solan 0 912.5 -16%
Una 7.5 786 25%
Total State 674.0 753.9 -14%

30 | P a g e
Delhi
DISTRICS ACTUAL (mm) NORMAL (mm) % Deficient
Central Delhi 497.8 591.5 -16%
New Delhi 620.6 591.5 5%
North Delhi 464.3 591.5 -22%
North East Delhi 256.5 591.5 -57%
North West Delhi 358 591.5 -39%
South Delhi 418.7 591.5 -29%
South West Delhi 360.8 591.5 -39%
West Delhi 430.5 591.5 -27%
Total State 385.2 591.5 -35%

31 | P a g e
Methodology
We have done the complete study based on field based survey
We have deputed the field teams in targeted 7 states which conducted the farmer interviews in
around 78 districts of total 81 districts
We have done questionnaires’ based farmer survey and taken farmers pictures along with actual
survey days newspapers. We taged the farmer pictures through geo-tagging wherever possible by
the field team
To vet the complete study, we have also taken assistance from satellite images and tele-calling so
that complete perspective can be taken into considerations while arriving the results of the study
To further validate the results, we have also taken the last year’s figures from the previous reports,
so that survey results error has to be minimized and actual figures can be achieved in the study
Way Forward
Survey teams will be continuously in the field throughout the survey and report on crop progress, so
that subsequent reports will be presented in the more meaning & timely manner
Next report will be presented during first week of Oct, which will actually highlight the crop yields /
crop health / crop progress / monsoon impact / and any deviation from the first report if it is
highlighted from the field
We will also try to highlight the crop arrival pace / prices and quality of rice which is coming in the
different studied markets
During the survey we will highlight any important crop updates which may impact on the overall
crop progress
Data Source
All figures based on farmer interview and feedback for current year
Last year dataset from previously submitted reports
Prices are taken from independent price pooling exercise from last Dec 2016 onwards
Monsoon data was collected from IMD & other meteorological departments

![Kharif- 6 Basmati Acreage & Yield Estimation in Punjab ... · Report Volume-4 (26 October, 2016) 201 Page 0 of 16 AgriNet Solutions asd [Type the company name] Kharif-2013 Basmati](https://img.pdfslide.net/doc/110x75/5fb63cda3b5e3f1b5525f39c/kharif-6-basmati-acreage-yield-estimation-in-punjab-report-volume-4-26.jpg)