Embed Size (px)
Citation preview

Report Local Plan and CIL Update Viability Study
West Oxfordshire District Council
February 2015

© Aspinall Verdi Limited West Oxfordshire DC Local Plan and CIL Viability Study Final Report
February 2015
Quality Assurance Date February 2015
Version V4.3
Filename and path 150219 West Oxon LPlan CIL Economic Viability Update report_v4.3
Authorised by
Limitation This report has been prepared on behalf of and for the exclusive
use of Aspinall Verdi Limited’s Client and it is subject to and issued in connection with the provisions of the agreement between Aspinall Verdi Limited and its Client. Aspinall Verdi Limited accepts no liability or responsibility whatsoever for or in respect of any use of or reliance upon this report by any third party.

© Aspinall Verdi Limited West Oxfordshire DC Local Plan and CIL Viability Study Final Report
February 2015
Contents Executive Summary
Report 1 Introduction 1
2 Statutory Requirements 6
3 Local Plan Context 11
West Oxfordshire Draft Local Plan (2012) 11 Pre-Submission Draft Local Plan (2015) 12 Affordable Housing 14 CIL PDCS (December 2013) 22 Draft IDP Update (June 2014) 24
4 Viability Assessment 25
Viability Method 26 Threshold Land Value 27
5 Residential 30
Residential Typologies 30 Open Market Values 34 Affordable Housing Transfer Values 45 Gross Development Value 46 Development Costs 46 Residual Land Value 54 Residential Threshold Land Value (TLV) 55 Residential Viability Results 58
6 Supported Living 64
Supported Living Typologies 64 Open Market Values 65 Gross Development Value 66 Development Costs 66 Residual Land Value 68 Supported Living TLV 68 Supported Living Viability Results 69
7 Commercial Uses 71
Commercial Typologies 71 Commercial Property Values 71 Gross Development Values 74 Development Costs 74 Residual Land Value 77 Commercial Uses TLV 77 Commercial Viability Results 78
8 Retail 79
Retail Typologies 80 Gross Development Values 82 Development Costs 83 Residual Land Value 85 Town Centre and Retail TLV 85

© Aspinall Verdi Limited West Oxfordshire DC Local Plan and CIL Viability Study Final Report
February 2015
Retail Viability Results 86 State Aid 88
9 Other Uses 90
10 Strategic Development Area (SDA) Viability 91
SDA Assumptions 91 Pro-Dev Appraisals 92 Viability Results 92
11 Conclusions and Recommendations 94
Residential Uses 94 Commercial Uses 95 Retail Uses 95 Other Uses 96
Appendices Appendix 1 – Hypothetical Typologies
Appendix 2 – Residential Appraisals
Appendix 3 – Supported Living Appraisals
Appendix 4 – Commercial Appraisals
Appendix 5 – Retail Appraisals
Appendix 6 – SDA Assumptions and Appraisals

© Aspinall Verdi Limited West Oxfordshire DC Local Plan and CIL Viability Study Final Report
February 2015
i
Executive Summary
ES1 AspinallVerdi – Property Regeneration Consultants has been commissioned by West
Oxfordshire District Council to prepare an economic viability assessment (EVA) of development
across the District. This is an update to an earlier economic viability assessment (EVA) dated
30 September 2013 (referred to as the ‘September 2013’ report or the ‘earlier’ report).
ES2 This reported is intended to be used as evidence to support the statutory requirements of the
Local Plan preparation and the Draft Charging Schedule for CIL (Community Infrastructure
Levy).
ES3 In carrying out this update we have had regard to the latest statutory requirements, guidance
and best practice including inter alia the NPPG (National Planning Practice Guidance).
ES4 We have also reviewed all the stakeholder representations and sought clarification and further
evidence from industry. In this respect we have reviewed and updated all the market value and
cost assumptions.
ES5 Our general approach is illustrated on the diagram below (ES.1). We have carried our residual
appraisals to establish the Residual Land Value (RLV). This is a traditional model having
regard to the gross development value (GDV) of the scheme and deducting all costs including
Affordable Housing and CIL to arrive at the RLV. This is compared to the Threshold Land
Value (TLV). The TLV is derived from benchmark Market Values (and for some brownfield
typologies – Existing Use Value (EUV)), the size of the hypothetical scheme and the
development density assumption.
ES.1 - Our Appraisal Methodology
© Aspinall Verdi Limited West Oxfordshire DC Local Plan and CIL Viability Study Final Report
February 2015
ES6 It is important that the Local Plan policy requirements do not ‘outweigh’ the TLV and that there
is an ‘appropriate balance’ between the CIL/policy requirements and the TLV.
ES7 Our detailed assumptions are set out with the relevant section of this report together with our
detailed appraisals which are appended. The results of our analysis are set out on the
following tables.
Table ES.2 – Recommended Affordable Housing and CIL Rates – Residential

© Aspinall Verdi Limited West Oxfordshire DC Local Plan and CIL Viability Study Final Report
February 2015
Table ES.3 – Recommended Affordable Housing and CIL Rates – Supported Living
Table ES.4 – Recommended CIL Rates – Retail
ES8 CIL is not recommended for other commercial uses due to the lack of residual viability and also
the high Threshold Land Values particularly for residential (and some retail) alternative uses.

© Aspinall Verdi Limited West Oxfordshire DC Local Plan and CIL Viability Study Final Report
February 2015
1
1 Introduction
1.1 AspinallVerdi – Property Regeneration Consultants has been commissioned by West
Oxfordshire District Council to update and revise an earlier economic viability assessment
(EVA) dated 30 September 2013 (the ‘September 2013’ EVA report).
1.2 The September 2013 report was the subject of public consultation alongside the CIL
(Community Infrastructure Levy) Preliminary Draft Charging Schedule (PDCS) and an
Affordable Housing Consultation Paper between 11 December 2013 and 5 February 2014.
1.3 The purpose of this EVA update is to be used as evidence to:
inform a Draft Charging Schedule (DCS) for CIL (Community Infrastructure Levy);
assess the cumulative impact of the pre-submission Draft Local Plan (taking into account
CIL and other Plan policies (including affordable housing)); and
assess the viability of the Strategic Development Areas (SDAs) identified in the pre-
submission Draft Local Plan – namely (1) East Witney, (2) North Witney (3) REEMA Central
at Carterton and (4) Tank Farm, Chipping Norton1.
1.4 This is in the context of:
the representations received during the previous consultation
updated property market value evidence
revised development cost evidence
updated local and national planning policy requirements e.g. CIL regulations and policy on
thresholds for affordable housing commuted sums etc.
1.5 The above considerations are explained at the relevant points within this EVA.
1.6 This EVA should be read in conjunction with the previous EVA dated September 2013. We do not repeat information and analysis within this report which is an update only.
1.7 West Oxfordshire is located in the south east of England in the County of Oxfordshire, which
has borders with Warwickshire, Northamptonshire, Buckinghamshire, Berkshire, Wiltshire and
1 Note that North Witney and Chipping Norton were not previously appraised in the September 2013 EVA.

© Aspinall Verdi Limited West Oxfordshire DC Local Plan and CIL Viability Study Final Report
February 2015
2
Gloucestershire. The District’s central location, coupled with its high environmental quality
makes it an attractive place to live and work2.
Figure 1.1 – West Oxfordshire District Location Plan
1.8 The diverse character of West Oxfordshire makes it particularly challenging in terms of
appraising the economic viability of development at a District Wide level. In this respect a
number of respondents to the previous CIL and affordable housing consultation in December
2013, observed that proposed CIL rates and Affordable Housing targets should be consistent
with neighbouring Authorities. The property market for development is a continuum across
boundaries with West Oxfordshire falling within a wider Oxfordshire Housing Market Area
(HMA). We therefore accept to a point the logic that CIL and Affordable Housing targets ought
not be to significantly different across boundaries. However, this fails to take into consideration
the different economic circumstances of Local Authority areas which could result in different
EVA evidence. For example, the City of Oxford with its tight administrative boundaries has
different threshold land values which impacts on the overall economic viability of projects. Also
CIL is not to be used as a policy tool across boundaries, but based on the EVA evidence from
the relevant authority.
1.9 Notwithstanding the above we set out below the headline CIL and Affordable Housing targets
from surrounding Authorities for ease of comparison (Table 1.2). 2 Consultation Draft Local Plan (October 2012) West Oxfordshire District Council paragraph 2.2
© Aspinall Verdi Limited West Oxfordshire DC Local Plan and CIL Viability Study Final Report
February 2015
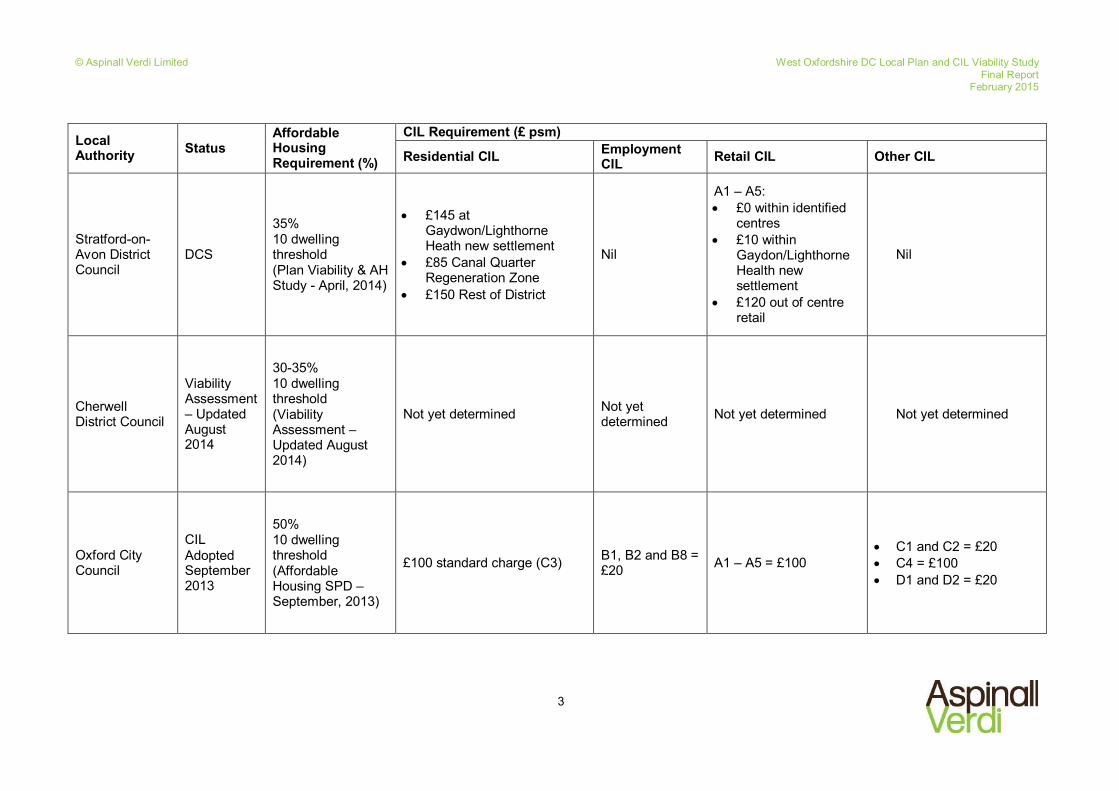
3
Local Authority Status
Affordable Housing Requirement (%)
CIL Requirement (£ psm)
Residential CIL Employment CIL Retail CIL Other CIL
Stratford-on-Avon District Council
DCS
35% 10 dwelling threshold (Plan Viability & AH Study - April, 2014)
£145 at Gaydwon/Lighthorne Heath new settlement
£85 Canal Quarter Regeneration Zone
£150 Rest of District
Nil
A1 – A5: £0 within identified
centres £10 within
Gaydon/Lighthorne Health new settlement
£120 out of centre retail
Nil
Cherwell District Council
Viability Assessment – Updated August 2014
30-35% 10 dwelling threshold (Viability Assessment – Updated August 2014)
Not yet determined Not yet determined Not yet determined Not yet determined
Oxford City Council
CIL Adopted September 2013
50% 10 dwelling threshold (Affordable Housing SPD – September, 2013)
£100 standard charge (C3) B1, B2 and B8 = £20 A1 – A5 = £100
C1 and C2 = £20 C4 = £100 D1 and D2 = £20

© Aspinall Verdi Limited West Oxfordshire DC Local Plan and CIL Viability Study Final Report
February 2015
4
Local Authority Status
Affordable Housing Requirement (%)
CIL Requirement (£ psm)
Residential CIL Employment CIL Retail CIL Other CIL
South Oxfordshire District Council
Viability Assessment (PDCS consultation 20 Oct – 17 Nov 2014)
40% 3 dwelling threshold (AH Viability Study Update – October, 2014)
Zone 1 – Rest of District = £150 Zone 2 – Didcot and Berinsfield = £85
B1 Offices (including B1b) = £35
Large supermarkets, superstores and retail warehouses = £70
-
Vale of White Horse District Council
PDCS (November, 2014)
40% 3 dwelling threshold (AH Viability Study – January, 2010)
Zone 1: £120 Zone 2 Faringdon, Wantage and Grove) : £85 Zone 3 (Crab Hill and Monks Farm: £0
-
Supermarkets and retail warehousing (A1) exceeding 280 sqm (GIA): £100
-
Swindon Borough Council
Examination 30% (AH Viability Study – July, 2012)
Two Zones: 1: £55 2: £0
- Two Zones: 1: £140 2: £0
-
Cotswold District Council
Viability Assessment (preparing PDCS)
50% 10 dwelling threshold (AH SPD – February, 2007)
Four Zones: 1: £45 2: £79 3: £90 4: £115
Nil £120 Hotels: £70 Student: £60
Table 1.2 - Neighbouring Authorities Adopted and Proposed CIL Requirements
© Aspinall Verdi Limited West Oxfordshire DC Local Plan and CIL Viability Study Final Report
February 2015
5
1.10 To summarise, the CIL rates presented at Table 1.2 show that the residential CIL charges have
mostly been separated into different charging zones. We note the average residential CIL rate
across all the charging areas listed above is £108 psm, with a range of £45 and £200 psm. It is
also notable that the charges for employment uses are either nil or negligible. The average
retail CIL charge from the list above is £110 psm.
1.11 Our update report is set out in the same format as the September 2013 report in order to
facilitate cross-referencing, as follows:
Section 2 – Statutory
Requirements
This section sets out the statutory requirements of the
Local Plan Viability Assessment and the CIL Draft
Charging Schedule.
Section 3 – Local Plan Context This section sets out the Pre-submission Draft Local Plan
context and identifies those emerging policies which will
have a direct impact on viability.
Section 4 – Viability Assessment
Method
This section describes our generic methodology for
appraising the viability of development which is based on
the residual approach as required by guidance and best
practice.
Sections 5 - 9 These sections provide the property market context,
development monitoring and viability for each sector of
the property market including residential, commercial and
retail uses.
Section 10 – Strategic
Development Area Viability
This section sets out our appraisals of the proposed
Strategic Development Areas in more detail. This to act
as a ‘sense check’ on the aforementioned emerging
Local Plan policies (including affordable housing) and the
CIL DCS.
Section 11 – Conclusions and
Recommendations
Finally, we make our recommendations in respect of the
Local Plan viability, Affordable Housing and set out our
recommended CIL Draft Charging Schedule.

© Aspinall Verdi Limited West Oxfordshire DC Local Plan and CIL Viability Study Final Report
February 2015
6
2 Statutory Requirements
2.1 Our economic viability appraisal for both the Local Plan and CIL (Community Infrastructure
Levy) has been carried out having regard to the various statutory requirements comprising
primary legislation, Statutory Regulations and mandatory guidance.
2.2 The main statutory requirements are contained within the following documents which have
been updated since our September 2013 report, including:
The CIL Regulations 20103, latest amendments February 20144
The National Planning Policy Framework (NPPF) March 20125, and the Planning Practice
Guidance (PPG) website6 launched 6 March 2014
DCLG Community Infrastructure Levy (CIL) standalone Guidance February 20147 which
itself was added to the PPG website on 12 June 2014.
2.3 To avoid repetition we refer you to the September 2013 report for a detailed explanation of the
various statutory requirements. We set out below some of the key changes arising from the
latest regulations and guidance.
The PPG - Viability
2.4 The PPG has a section on Viability including a specific subsection on Viability and Plan Making.
This is predicated on Paragraph 173 of the NPPF.
2.5 The PPG confirms that (notwithstanding the separate CIL guidance),
‘the principles for understanding viability set out in this document will also be relevant
for Community Infrastructure Levy evidence collection. Above all, consistency is
required.’8
2.6 Hence we are to appraise the Local Plan Affordable Housing targets and other relevant policies
alongside considerations for CIL.
3 The Community Infrastructure Levy Regulations 2010 coming into force 6 April 2010 under section 222(2)(b) of the Planning Act 2008 4 The Community Infrastructure Levy (Amendment) Regulations 2014 made 24 February 2014 under section 222(2)(b) of the Planning Act 2008 5 Department of Communities and Local Government (March 2012) The National Planning Policy Framework ISBN: 978-1-4098-3413-7 6 http://planningguidance.planningportal.gov.uk/blog/guidance/viability-guidance/ 7 Department of Communities and Local Government (February 2014) Community Infrastructure Levy Guidance issued by the Secretary of State under section 221 of the Planning Act 2008 8 Paragraph: 003 Reference ID: 10-003-20140306

© Aspinall Verdi Limited West Oxfordshire DC Local Plan and CIL Viability Study Final Report
February 2015
7
2.7 The PPG refers to the specific viability requirements of brownfield sites in plan-making. This is
as follows:
‘How should viability be considered for brownfield sites in plan-making?
The National Planning Policy Framework sets out a core planning principle that
planning policies should encourage the effective use of land by re-using land that has
been previously developed (brownfield land), provided that it is not of high
environmental value.
Local Plan policies should reflect the desirability of re-using brownfield land, and the
fact that brownfield land is often more expensive to develop. Where the cost of land is a
major barrier, landowners should be engaged in considering options to secure the
successful development of sites. Particular consideration should also be given to Local
Plan policies on planning obligations, design, density and infrastructure investment, as
well as in setting the Community Infrastructure Levy, to promote the viability of
brownfield sites across the local area. Provided sites are likely to deliver a competitive
return for willing landowners and willing developers authorities should seek to select
sites that meet the range of their policy objectives, having regard to any risks to the
delivery of their plan. Authorities do not have to allocate only those sites that provide
the maximum return for landowners and developers.
Local planning authorities should seek to work with interested parties to promote the
redevelopment of brownfield sites, for example Local Enterprise Partnerships.
To incentivise the bringing back into use of brownfield sites, local planning authorities
should also look at the different funding mechanisms available to them to cover
potential costs of bringing such sites back into use, when considering which sites to
allocate. For brownfield sites, assumptions about land values should clearly reflect the
levels of mitigation and investment required to bring sites back into use. The impact of
land remediation relief could also be considered when looking at the viability of
brownfield sites.’9
2.8 We refer to the detailed sections in the September 2013 EVA which describe the detailed
Brownfield/Greenfield Land Economics (p 29-32) and the preceding section on Threshold Land
Value Summary (pp 28-29) which were relevant in 2013 and more so now due to the PPG.
2.9 Finally, the PPG gives guidance on Land Value, as follows:
9 Paragraph: 025 Reference ID: 10-025-20140306

© Aspinall Verdi Limited West Oxfordshire DC Local Plan and CIL Viability Study Final Report
February 2015
8
‘….., estimated land or site value should:
reflect emerging policy requirements and planning obligations and, where
applicable, any Community Infrastructure Levy charge;
provide a competitive return to willing developers and land owners (including
equity resulting from those building their own homes); and
be informed by comparable, market-based evidence wherever possible.
Where transacted bids are significantly above the market norm, they should
not be used as part of this exercise10. (our emphasis)
2.10 As you can see the emphasis in the PPG is for ‘market-based’ evidence and we refer you to our
detailed discussion on the merits of The Harman Report and RICS Guidance within the
September 2013 EVA (pp 24–27).
10 Unit Threshold
2.11 In November 2014, the NPPG was updated to introduce the “10 unit threshold” for ‘affordable
housing and tariff style planning obligations’. The Guidance states that, ‘affordable housing and
tariff style planning obligations (section 106 planning obligations)’ should not be sought from
small scale and self-build development.’11 Specifically,
contributions should not be sought from developments of 10-units or less, and which have
a maximum combined gross floorspace of no more than 1,000sqm
in designated rural areas [e.g. the Cotswolds Area of Outstanding Natural Beauty], local
planning authorities may choose to apply a lower threshold of 5-units or less. No affordable
housing or tariff-style contributions may be sought from these developments. In addition, in
a rural area where the lower 5-unit or less threshold is applied, affordable housing and tariff
style contributions should be sought from developments of between 6 and 10-units in the
form of cash payments which are commuted until after completion of units within the
development [commuted sum].
affordable housing and tariff-style contributions should not be sought from any development
consisting only of the construction of a residential annex or extension to an existing home.
2.12 This is an emerging area of policy implementation and we have factored the 10 unit threshold
into our economic viability analysis.
10 Paragraph: 014 Reference ID: 10-014-20140306 11 Paragraph: 012 Reference ID: 23b-012-201451128

© Aspinall Verdi Limited West Oxfordshire DC Local Plan and CIL Viability Study Final Report
February 2015
9
CIL Regulations and Guidance
2.13 The latest (2014) regulations and guidance make subtle changes, but nothing that significantly
alters our robust approach from 2013.
2.14 The main changes which are relevant are as follows.
2.15 The 2014 guidance sets out what is meant by an appropriate balance. This is as follows:
‘The levy is expected to have a positive economic effect on development across a local
plan area. When deciding the levy rates, an appropriate balance must be struck
between additional investment to support development and the potential effect on the
viability of developments.’12 (our emphasis)
2.16 This is a subtle change of emphasis as the appropriate balance ‘must’ now be struck whereas a
previously the emphasis was on the Authority to ‘show and explain’ how the proposed levy rate
would contribute towards the implementation of the relevant Plan.13
2.17 This change of emphasis does not alter our methodology which is always to provide robust
evidence on the viability of development and the ‘appropriate balance’.
2.18 Paragraph: 018 of the 2014 guidance requires the following evidence,
‘….the charging authority should also provide information about the amount of funding
collected in recent years through section 106 agreements. This should include
information on the extent to which their affordable housing and other targets have been
met.’
2.19 West Oxfordshire District Council proposes to provide evidence to this effect as part of its
consultation on its CIL Draft Charging Schedule (DCS). In addition we have had regard to a
sample of previous Viability appraisals for specific developments and development monitoring
data in order to inform the EVA assumptions.
2.20 More guidance has been provided in the 2014 revision in respect of differential rates. The
guidance states (Paragraph: 019 Reference ID 25-019-20140612) that,
‘Charging authorities that decide to set differential rates…may need to undertake more
fine-grained sampling, on a higher proportion of total sites, to help them to estimate the
boundaries for their differential rates. Fine-grained sampling is also likely to be
12 Paragraph: 009 Reference ID: 25-009-20140612 13 Paragraph: 018 Reference ID: 25-018-20140612

© Aspinall Verdi Limited West Oxfordshire DC Local Plan and CIL Viability Study Final Report
February 2015
10
necessary where they wish to differentiate between categories or scales of intended
use.
The focus should be in particular on strategic sites on which the relevant Plan relies
and those sites (such as brownfield sites) where the impact of the levy is likely to be
most significant.’14 (our emphasis)
2.21 Furthermore (Paragraph: 021 Reference ID: 25-021-20140612)
‘The regulations allow charging authorities to apply differential rates in a flexible way, to
help ensure the viability of development is not put at risk. Differences in rates need to
be justified by reference to the economic viability of development. Differential
rates should not be used as a means to deliver policy objectives.
Differential rates may be appropriate in relation to
geographical zones within the charging authority’s boundary
types [of uses] of development; and/or
scales of development.
A charging authority that plans to set differential rates should seek to avoid undue complexity. Charging schedules with differential rates should not have a
disproportionate impact on particular sectors or specialist forms of development.
Charging authorities should consider the views of developers at an early stage.
If the evidence shows that the area includes a zone, which could be a strategic site, which has low, very low or zero viability, the charging authority should consider setting
a low or zero levy rate in that area. The same principle should apply where the
evidence shows similarly low viability for particular types and/or scales of development.
In all cases, differential rates must not be set in such a way that they constitute a notifiable state aid under European Commission regulations….’15 (our emphasis)
2.22 This is important, because it enables differentiation by geographical zone (which could be a
strategic [brownfield] site), type and scale of development.
14 Paragraph: 019 Reference ID 25-019-20140612 15 Paragraph: 021 Reference ID: 25-021-20140612

© Aspinall Verdi Limited West Oxfordshire DC Local Plan and CIL Viability Study Final Report
February 2015
11
3 Local Plan Context
3.1 The current Local Plan for the District is the West Oxfordshire Local Plan 2011 (adopted 2006).
This is due to be superseded by a new Local Plan which is due to be formally published in
March 2015. This will build on an earlier consultation draft published in 2012.
West Oxfordshire Draft Local Plan (2012)
3.2 The Draft Local Plan:
sets out how much development will take place, what type, where and when it will
come forward as well as what infrastructure is needed to support it. In this respect it
seeks to provide certainty for the local community, service providers and those looking
to invest or move into the area. It is aspirational, yet realistic about what can be
delivered on the ground.16
3.3 The Draft Local Plan identified a range of key issues that need to be addressed in West
Oxfordshire up to 2029. These were set out within the previous September 2013 EVA.
3.4 The Draft Local plan incorporated 18 Core Objectives listed under four key headings in order to
address the key issues above. Again, we refer to the previous September 2013 EVA where
these are summarised.
Draft Local Plan Policies
3.5 Beneath these Core Objectives were a series of 35 Core Policies. In order to appraise the
Local Plan viability we analysed each of the Draft Core Policies in order to determine which
policies have a direct or indirect impact on development viability (see Appendix 2 of the
September 2013 EVA).
3.6 Following the PDCS and Affordable Housing consultation we received a number of
representations in respect of the analysis of the policy requirements. These related to the
following policy areas -
Proposed policies should reflect the housing mix recommendations of the SHMA to ensure
that the Plan is viable for the relevant development typologies
Construction cost allowances should be made for the Code for Sustainable Homes to
reflect statutory requirements
16 Consultation Draft Local Plan (October 2012) West Oxfordshire District Council paragraph 1.3

© Aspinall Verdi Limited West Oxfordshire DC Local Plan and CIL Viability Study Final Report
February 2015
12
Construction cost allowance should be made for the proposed policy requirement that 10%
of energy is derived from decentralised and renewable or low carbon sources
Affordable Housing targets and thresholds should be considered alongside CIL to ensure
both infrastructure and housing is delivered
Affordable Housing commuted sums for smaller sites approach and equity when compared
to larger schemes
Support for extra-care housing to meet the needs of local people (Core Policy 7)
Not setting CIL [and Affordable Housing] right up to the margins of viability and ensuring an
appropriate instalments policy.
3.7 We have had regard to all the representations when updating the EVA and we refer to the
detailed appraisal assumptions set out below (sections 5 – 9).
Pre-Submission Draft Local Plan (2015)
3.8 Subject to the agreement of Cabinet and Council in February 2015, the District Council
proposes to publish the pre-submission draft West Oxfordshire Local Plan in March 2015. In
preparing this EVA update, we have had regard to the policies set out in the draft Local Plan
and the extent to which they have the potential to impact on development viability. A number of
the policies have been the subject of amendments since 2012 and some new policies have
been introduced.
3.9 In terms of development viability, those policies considered to have a direct impact are set out
in the table below:
Policy Direct impact on viability and how this has been addressed
Policy OS3 - Prudent Use of Natural Resources
Consideration for the environmental aspects of development will directly impact viability as meeting environmental obligations may add costs to development. The sensitivity analysis carried out takes account of potentially higher costs associated with achieving the requisite standards.
Policy OS4 - High Quality Design
Considerations of high quality design will augment development costs and thus directly impact viability, such as: • Quality design; • Environmental Improvements; • Enhancing the local area; • Adhering to the SPD/Design Code. Within our viability appraisals we have had regard to the

© Aspinall Verdi Limited West Oxfordshire DC Local Plan and CIL Viability Study Final Report
February 2015
13
Policy Direct impact on viability and how this has been addressed BCIS cost indices for West Oxfordshire which takes into consideration the requirement for high quality design (this has always been the case so the costs are embedded in the indices).
Policy OS5 - Supporting Infrastructure
Contributing to infrastructure via CIL and planning obligations is a direct cost to developers. Our economic viability appraisals calculate the CIL contribution for various development typologies for a given ‘threshold’ land value, developers profit and various affordable housing / S106 scenarios.
Policy H3 – Affordable Housing
Affordable housing contributions (both on-site and offsite commuted sums) will directly impact the GDV of a scheme and therefore viability. This has been a key part of the viability assessment undertaken.
Policy H4 - Type and Mix of New Homes
Developers will be required to show how they meet housing need, and the most viable option may not be the developers preferred option thus directly impacting viability. The design aspects in terms of meeting the needs of disabled people will also add to the costs of development. We have reflected identified housing needs in our development mix for the residential appraisals. In addition the sensitivity analysis undertaken takes account of any potential increase in cost associated with achieving the specified standards.
Policy H5 – Custom and Self-Build Housing
The policy requires larger development schemes of 100 or more dwellings to set aside 5% of the plots for the purposes of self-build. These would however be made available at market value so not impact greatly on viability given the percentage requirement and the relatively high trigger point.
Policy EH1 - Landscape Character
Depending on the nature of the development, adhering to conservation or enhancement of the landscape may increase the costs of development (for example in the design or configuration). This is factored into our appraisals through conservative development density assumptions and BCIS construction cost data which is rebased for Oxfordshire and therefore location specific.
Policy EH2 – Biodiversity Depending on the nature of the development adhering to the requirements of biodiversity may increase the costs of development (for example in the design or configuration). This is factored into our appraisals through conservative development density assumptions and BCIS construction cost data which is rebased for Oxfordshire and therefore location specific.
Policy EH3 – Public Realm and Green Infrastructure
Replacement provision onsite of, or contribution towards the improvement of green infrastructure and open space will directly impact on costs. This is factored in through our development density assumptions.
Policy EH4 - Decentralised and renewable or low carbon energy development
The policy requires an energy assessment or strategy which assesses the viability of decentralised energy systems for certain forms of development. Notwithstanding this, we note

© Aspinall Verdi Limited West Oxfordshire DC Local Plan and CIL Viability Study Final Report
February 2015
14
Policy Direct impact on viability and how this has been addressed from the Renewable Energy and Sustainable Construction Study that it is not recommended that the Council adopt renewable energy targets. These costs being subsumed by other costs.
Table 3.1 – Pre-Submission Draft West Oxfordshire Local Plan Policies (2015)
Affordable Housing
3.10 The Affordable Housing policy has a significant impact on the viability of the Local Plan. It is
also inextricably linked with the CIL rate.
3.11 We received a number of representations to the September 2013 EVA proposing that CIL be
set ‘side-by-side’ with affordable housing to ensure equality between the delivery of housing
(affordable housing) and other critical infrastructure (CIL) required to deliver the Local Plan. In
particular, concerns were expressed by a number of parties that the recommendation to exempt
small-scale housing schemes from CIL but to require them to pay an affordable housing
commuted sum, would be inequitable and contrary to the primary objective of CIL which is to
ensure that the cost burden of infrastructure provision is more evenly spread.
3.12 We have therefore updated our methodology to sensitivity test this key relationship between
affordable housing and CIL.
3.13 The Council’s current, adopted Affordable Housing Policy is set out within the September 2013
EVA, but we summarise the policy below for ease of reference.

© Aspinall Verdi Limited West Oxfordshire DC Local Plan and CIL Viability Study Final Report
February 2015
15
Current Affordable Housing Policy (2006)
3.14 The Council’s current approach towards affordable housing is set out in Policy H11 of the West
Oxfordshire Local Plan (adopted 2006). This is as follows (box 3.2):
Policy H11, West Oxfordshire Local Plan (adopted 2006)
Allocated land:
o 30% on sites in the towns of Witney and Carterton
o up to 50% in the remainder of the District
Unallocated land:
o 30% on sites in the towns of Witney and Carterton
o up to 50% affordable housing will be sought where:
- the site is in Witney, Carterton, Chipping Norton or Eynsham
and has an area of 0.5 Ha or greater or when 15 or more
dwellings are proposed or;
- elsewhere, when a development of 2 or more dwellings are
proposed
Affordable Housing SPD (April 2007)
Preferred tenure split –
o 70% Social Rent
o 30% Intermediate
Thresholds apply at –
o 15 for developments in Witney, Carterton, Chipping Norton and Eynsham
(0.5 Hectare sites)
o 2 dwellings elsewhere in the District
Box 3.2 – Current Adopted Affordable Housing Policy (2006)

© Aspinall Verdi Limited West Oxfordshire DC Local Plan and CIL Viability Study Final Report
February 2015
16
Emerging Affordable Housing Policy Proposals
3.15 The emerging Affordable Housing policy has been the subject of various studies and proposals.
3.16 The preferred options Local Plan consultation in 2010 adopted a blanket target of 40%
affordable housing across the District.
3.17 The draft Core Strategy published in January 2011 introduced a slightly more refined approach
with 50% on greenfield sites and in relation to other types of (previously developed) land 35% in
Witney and Carterton and 40% elsewhere.
Draft Local Plan Affordable Housing Policy (2012)
3.18 In October 2012, the Draft Local Plan17 was published with detailed polices for providing new
homes. The draft Affordable Housing policy is summarised as follows (box 3.3):
Core Policy 8 – Affordable Housing
Thresholds apply at –
o 1 dwelling – i.e. net gain of one or more market homes
Target -
o 35% Carterton
o 40% Witney
o 50% Elsewhere in the District
Affordable Housing can be reduced, subject to demonstrating -
o the mix of housing has been considered to maximise the Affordable
Housing contribution, and
o allsources of funding have been taken into consideration (e.g. HCA
Housing Grant), and
o subject to viability appriasal
Commuted Sum – for schemes of 1-5 dwellings of ‘broadly equivalent value’
Tenure mix – ‘responsive to identified local needs and site specific opportunities’
17 Consultation Draft Local Plan (October 2012) West Oxfordshire District Council

© Aspinall Verdi Limited West Oxfordshire DC Local Plan and CIL Viability Study Final Report
February 2015
17
Paragraph 5.27 of the Local Plan18
‘there is a significantly greater need for rented accommodation than for the
various forms of intermediate housing therefore a ratio of 2:1 in favour of rented
homes will be generally sought’ i.e. -
o 66% affordable rented
o 34% intermediate tenure/sub-market
Box 3.3 – Draft Local Plan Affordable Housing Policy (2012)
Affordable Housing Viability Consultation (December 2013)
3.19 Following the September 2013 EVA, WODC consulted further on its emerging Affordable
Housing policy alongside its CIL (PDCS) from 11 December 2013 – 5 February 2014.
3.20 Views were sought through the consultation on a number of matters. In terms of the threshold
at which affordable housing would be sought, it was suggested that this should be retained at
one dwelling (net) as per the draft Local Plan (2012). Also, in line with the draft Local Plan it
was suggested that the threshold for on-site provision of affordable housing should be set at 6
or more dwellings with a commuted sum to be sought for schemes of 1-5 dwellings.
3.21 The percentage on-site affordable housing requirement and commuted sum were proposed to
be varied according to location. The District was divided into three value areas (based on the
findings of the 2013 EVA) as shown on the map below.
18 Consultation Draft Local Plan (October 2012) West Oxfordshire District Council page 40

© Aspinall Verdi Limited West Oxfordshire DC Local Plan and CIL Viability Study Final Report
February 2015
18
Figure 3.4 – Housing Value Zones (2013)

© Aspinall Verdi Limited West Oxfordshire DC Local Plan and CIL Viability Study Final Report
February 2015
19
3.22 In terms of on-site provision (6 or more dwellings) it was proposed that the requirement for
affordable housing would be set at 50% in the higher value area, 40% in the medium value area
and 35% in the lower value area. The commuted sums were based on a fixed rate £ ‘per
market unit’ following on from earlier analysis19. The suggested commuted sums were £55,000
per market unit in the higher value area, £27,000 per unit in the medium value area and
£14,000 per unit in the lower value area based on the principle of ‘equivalence’ as calculated by
the residual land value. To allow for the payment of these affordable housing commuted sums,
it was proposed that the smaller schemes of 1-5 units would be exempt from having to pay CIL.
3.23 Views were also sought on affordable housing tenure with a suggested split of 2:1 between
affordable rent and intermediate housing respectively.
3.24 In terms of the consultation responses received, there was general support for the principle of a
commuted sum applying to smaller residential schemes but some concern about the suggested
amounts and the fact that they would apply to all market dwellings regardless of size or type,
thus a single bedroom flat would be expected to pay the same as a 5-bedroom house. It was
suggested that a more reasonable alternative would be to establish an affordable housing
commuted sum on a similar basis to CIL (i.e. £ per square metre).
3.25 In relation to the threshold for on-site affordable housing provision, a number of respondents
felt that the threshold should be increased from 6 to 10 or even 15 dwellings.
3.26 Importantly, a number of respondents made the point that it would be inequitable to seek an
affordable housing contribution from smaller residential schemes, but exempt them from CIL. It
was felt that because such small schemes form an important component of the housing land
supply in West Oxfordshire, exempting them from CIL would mean an important source of
revenue funding for new and enhanced infrastructure provision would be excluded. As such it
was suggested that it would be more equitable for smaller schemes to contribute both
affordable housing and CIL simultaneously rather than approach of affordable housing first
followed by CIL if viability allowed.
3.27 For example,
“The County Council does not agree that small-scale residential schemes of 1-5 dwellings
should be exempt from CIL and instead pay a contribution towards affordable housing. One of
the CIL principles is to ensure all development provides its fair share towards infrastructure
while maintaining development viability. The majority of recent residential developments in
19 Golland, Dr Andrew (October 2012) Affordable Housing and the use of a Single Dwelling Threshold

© Aspinall Verdi Limited West Oxfordshire DC Local Plan and CIL Viability Study Final Report
February 2015
20
West Oxfordshire have come from these smaller schemes of 1-5 dwellings and the cumulative
impact of these schemes on infrastructure (e.g. schools) has the potential to be very significant.
The viability study assumes that commuted sums for affordable housing should be paid before
CIL and the level of commuted sum assumed together with an acceptance of the Threshold
Land Value for these schemes results in no CIL charge being viable. The County Council
considers that there should be a CIL charge for development of 1-5 dwellings and that this
could be achieved by reducing the commuted sum for affordable housing and/or pressing down
on the Threshold Land Value (i.e. landowners aspiration).”
…….
“It is not considered equitable for residential developments of 1 – 5 dwellings to not pay any CIL
charge,…..
Given that on larger schemes extensive infrastructure is normally provided both on and off-site
as part of the development, whereas this is often not the case for small developments which
cumulatively can have a significant impact, the proposal not to charge CIL on small residential
developments is grossly unfair.....
The case in West Oxfordshire where the Local Plan has not been adopted is different [from Mid
Devon] and the respective need for affordable housing and infrastructure need to be considered
together to ensure that both are supported by the evidence base and would not make
development unviable.”
…….
“The proposed relief from payment in the proposed CIL schedule is for developments under 6
houses. It is the consortiums view that this relief is not based on exceptional cost burdens but
on the basis that the affordable housing policy should take precedence. This decision is
considered to be flawed against the “exceptional cost burden test”......
.....It is considered that the affordable housing rates and thresholds for on-site provision should
be reconsidered in the light of this current viability testing for CIL payments and on the basis
that all sites make a CIL contribution.”
…….

© Aspinall Verdi Limited West Oxfordshire DC Local Plan and CIL Viability Study Final Report
February 2015
21
“On the basis that all residential developments will have the documented cumulative effect on
services in terms of schools, recreation facilities, infrastructure; it is equitable that each new
house pays an amount.”
…….
“Given 86% of development in West Oxfordshire in the last three years has been development
of less than 6 there is a danger of significant development taking place with no CIL being paid.
Will the threshold of 6 cause small sites to be built out with 5 rather than 6 or 7 dwellings just to
avoid the charge?”
…….
3.28 We have therefore not pre-determined the Affordable Housing targets and calculate the
sensitivity and viability of schemes for different levels of affordable housing and CIL in order to
form our recommendations (see Section 5 below).
Oxfordshire SHMA (April 2014) and West Oxfordshire Local Plan Focused Housing Consultation (August 2014)
3.29 Subsequently, a new County-wide Strategic Housing Market Assessment (SHMA)20 was
published in April 2014 which suggests a significant increase in new housing is needed
compared to that which was identified in the draft Local Plan (2012).
3.30 WODC published their response21 to the findings of the SHMA on 8th August 2014 and this was
the subject of a further 6 week consultation.
3.31 The proposed housing target was identified at 9,450 homes to be provided in West Oxfordshire
over the period 2011 – 2029 (525 per annum)22.
3.32 The local plan consultation document sought further views on the issue of affordable housing
provision, taking account of the responses received to the previous consultation in December
2013 and also reflecting changes in Government policy (including the exemption of certified
self-build schemes from CIL). In terms of the threshold at which affordable housing would be
sought, this was proposed to be retained at 1 dwelling (net) but with an exemption to be applied
to certified self-build schemes (as per CIL). Views were also sought on the threshold at which
the on-site provision of affordable housing would be required, with two options proposed; 6 or
more units (as per the previous consultation) or 11 or more units (taking account of the
20 Oxfordshire Strategic Housing Market Assessment – Final Report, April 2014, GL Hearn Limited, London 21 West Oxfordshire District Council, Local Plan – Housing Consultation (July 2014) 22 West Oxfordshire District Council, Local Plan – Housing Consultation (July 2014) – page 20

© Aspinall Verdi Limited West Oxfordshire DC Local Plan and CIL Viability Study Final Report
February 2015
22
Government’s previous consultation on 10 unit threshold subsequently introduced in November
2014. On-site percentage requirements were retained at 35% - 50% depending on location (as
per the previous consultation). To provide flexibility, these targets were expressed in the form of
‘up to X%....’. In terms of tenure mix, the consultation document suggested a 2:1 split of
affordable rented and intermediate housing (as per the previous consultation).
3.33 The consultation responses can be summarised as follows:
General support for the proposed tenure split
General support for the calculation of a commuted sum on a £ per m2 basis
General agreement that self-build schemes should be exempt
General agreement that it would be reasonable to expect all schemes of one or more
dwellings (net) with the exception of self-build to provide for affordable housing
Mixed-views about the threshold at which the requirement for on-site affordable
housing provision should be sought
Mixed-views about the percentage requirements to be sought for on-site affordable
housing (35% - 50%)
Some concerns about the use of the phrase ‘up to X%’ which some felt would
undermine the process and should instead be phrased as ‘at least X%’
3.34 In addition to the issue of affordable housing, the consultation document also sought views on
housing mix and the distribution of housing sites including a number of proposed Strategic
Development Areas (SDAs). The details outlined above and the consultation responses
received are reflected in our assumptions contained in the relevant sections below (Section 5 –
Residential, Section 6 – Supported Living and Section 10 SDA Viability).
CIL PDCS (December 2013)
3.35 As set out above, WODC consulted on its CIL Preliminary Draft Charging Schedule (PDCS)
policy from 11 December 2013 – 5 February 2014. The rates for residential and commercial
uses proposed at that time are set out in the tables below.

© Aspinall Verdi Limited West Oxfordshire DC Local Plan and CIL Viability Study Final Report
February 2015
23
Housing Market Area Type/size of scheme Recommended CIL Rate (£ psm)23
High value 1 (single dwelling) £0
“ 2-5 units (inclusive)24 £0
“ 6+ units £200
“ Sheltered Housing £200
“ Extra care Housing £100
Medium value 1 (single dwelling) £0
“ 2-5 units (inclusive) £0
“ 6+ units £200
“ Sheltered Housing £100
“ Extra care Housing £0
Lower value 1 (single dwelling) £0
“ 2-5 units (inclusive) £0
“ 6+ units £200
“ Sheltered Housing £0
“ Extra care Housing £0
Table 3.5 – PDCS Recommended Residential CIL Rates
23 Based on analysis of Appraisal Results (Table 11.1) and assuming the recommended Affordable Housing Rates (Table 11.2) 24 Number of units refers to both traditional housing and apartments

© Aspinall Verdi Limited West Oxfordshire DC Local Plan and CIL Viability Study Final Report
February 2015
24
Use Location Max CIL Rate £ psm
Recommended CIL PDCS Rate £ psm
Offices District wide n/a – not viable £0
Industrial District wide n/a – not viable £0
Shops District wide (except Town Centres)
£235 £160
Town Centres (as per Local Plan)
£160 £110
Supermarkets District wide £210-£290 £175
Retail Warehouses
District wide £200 £140
Table 3.6 – PDCS Commercial and Retail CIL Rates Summary
3.36 We have worked through all of the representations received to the PDCS with the Council and
reflected these throughout this EVA update.
Draft IDP Update (June 2014)
3.37 West Oxfordshire District Council originally prepared an Infrastructure Delivery Plan (IDP)
published in October 201225. This was described in detail in the September 2013 EVA.
3.38 The IDP was subject to a review and an update was published in June 201426 alongside the
Local Plan Focused Housing Consultation. The IDP will be further refined and will help to
inform the Council’s CIL Regulation 123 List which will be published alongside the CIL Draft
Charging Schedule (DCS) in 2015.
3.39 In addition Oxfordshire County Council has appointed consultants to develop CIL Protocols with
all the District Councils by April 2015 (see S106 and CIL, section 5 below).
3.40 Throughout our work we have been mindful to not ‘double-count’ the cost of this infrastructure
in terms of CIL and site-specific S106 (‘double-dipping’) and we have sense-checked site-
specific infrastructure requirements in our appraisals of the Strategic Development Areas (see
section 10 below).
25 Draft Infrastructure Delivery Plan (IDP), October 2012, West Oxfordshire District Council 26 Infrastructure Delivery Plan (IDP), June 2014 update, West Oxfordshire District Council

© Aspinall Verdi Limited West Oxfordshire DC Local Plan and CIL Viability Study Final Report
February 2015
25
4 Viability Assessment
4.1 In this section of our previous EVA report (September 2013) we set out our detailed viability
methodology, the relevant professional guidance and some important principles of land
economics.
4.2 We do not repeat this again here and refer you to the previous report and Section 2 above in
respect of changes to statutory requirements.
4.3 The general principle is that the CIL will be levied on the increase in land value resulting from
the grant of planning permission. However, there are fundamental differences between the
land economics and every development scheme is different. Therefore in order to derive the
potential CIL and understand the ‘appropriate balance’ it is important to understand the micro-
economic principles which underpin the viability analysis.
4.4 Figure 4.1 below, illustrates the principles of a viability appraisal.
Figure 4.1 – Elements Required for a Viability Assessment (Harman)27
4.5 Section 4 of our previous EVA (September 2013) describes each of the above components in
detail.
4.6 We set out our specific assumptions for each sector of the property market in Sections 5 – 9
below. 27 Local Housing Delivery Group, Local Government Association / Home Builders Federation / NHBC (20 June 2012) Viability Testing Local Plans, Advice for planning practitioners, Edition 1 (the ‘Harman’ report) page 25

© Aspinall Verdi Limited West Oxfordshire DC Local Plan and CIL Viability Study Final Report
February 2015
26
Viability Method
4.7 Figure 4.1 shows the elements required for a viability assessment. A scheme is viable if the
total of all the costs of development including land acquisition, planning obligations and profit
are less than the GDV of the scheme. Conversely, if the GDV is less than the total costs of
development (including land, S106s and profit) the scheme will be unviable.
4.8 Our residual development appraisals are structured to reflect all of the above elements and in a
format that will be familiar to developers – i.e. follows the approach that developers would
typically adopt to establish the Residual Land Value (RLV) of a site or scheme, as follows
(Figure 4.2)
Gross Development Value (including on-site affordable housing)
less Policy Requirements (e.g. CIL, AH commuted sums, site specific S106)
less Profit, Finance and Overhead
less Development Costs (including costs of construction etc)
= Residual Land Value (gross)
less Site Acquisition Costs / Finance on Land
= Residual Land Value (net)
………..
less Threshold Land Value
= Balance
If +ve, viable
If –ve, not viable
………..
consider ‘appropriate balance’ having regard to sensitivity analysis
Figure 4.2 – Residual Value Appraisal Methodology
4.9 Once the RLV is calculated this is compared to the Threshold Land Value (TLV).
4.10 Where the RLV is greater than the TLV, the policy requirements are viable. Where the RLV is
less than the TLV the policy requirements are not viable.
Where the RLV = TLV, this is the maximum level of viability.
© Aspinall Verdi Limited West Oxfordshire DC Local Plan and CIL Viability Study Final Report
February 2015
27
Threshold Land Value
4.11 Our approach to the TLV is set out in sections 2 and 5 of our previous EVA.
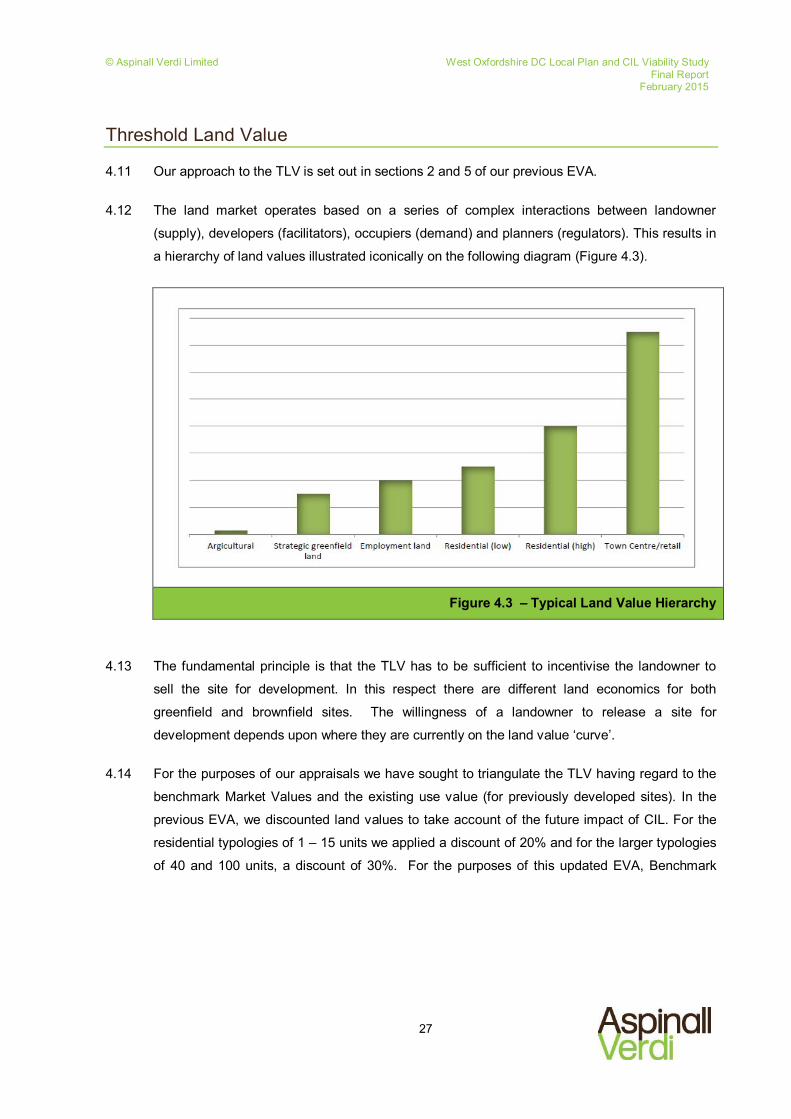
4.12 The land market operates based on a series of complex interactions between landowner
(supply), developers (facilitators), occupiers (demand) and planners (regulators). This results in
a hierarchy of land values illustrated iconically on the following diagram (Figure 4.3).
Figure 4.3 – Typical Land Value Hierarchy
4.13 The fundamental principle is that the TLV has to be sufficient to incentivise the landowner to
sell the site for development. In this respect there are different land economics for both
greenfield and brownfield sites. The willingness of a landowner to release a site for
development depends upon where they are currently on the land value ‘curve’.
4.14 For the purposes of our appraisals we have sought to triangulate the TLV having regard to the
benchmark Market Values and the existing use value (for previously developed sites). In the
previous EVA, we discounted land values to take account of the future impact of CIL. For the
residential typologies of 1 – 15 units we applied a discount of 20% and for the larger typologies
of 40 and 100 units, a discount of 30%. For the purposes of this updated EVA, Benchmark

© Aspinall Verdi Limited West Oxfordshire DC Local Plan and CIL Viability Study Final Report
February 2015
28
Market Values have been discounted by 25% across the District. This follows the Greater
Norwich Development Partnership’s CIL Examiners report28, which states:
Bearing in mind that the cost of CIL needs to largely come out of the land value, it is
necessary to establish a threshold land value i.e. the value at which a typical willing
landowner is likely to release land for development. Based on market experience in the
Norwich area the Councils’ viability work assumed that a landowner would expect to receive at least 75% of the benchmark value. Obviously what individual land owners
will accept for their land is very variable and often depends on their financial
circumstances. However in the absence of any contrary evidence it is reasonable to see a 25% reduction in benchmark values as the maximum that should be used in
calculating a threshold land value. (our emphasis)
4.15 This approach was uncontested and accepted at the Sandwell CIL Examination in Public (24
July 2014)29.
4.16 Note also that for the brownfield typologies we have cross-checked this by reference to EUV
(Existing Use Value) for secondary B2/B8 property + a premium.
Viability ‘buffer’
4.17 Notwithstanding the above discount from benchmark land values, good practice requires that
policy requirements are set within a ‘viability buffer’. In this respect the CIL guidance states
that,
“A charging authority’s proposed rate or rates should be reasonable, given the
available evidence, but there is no requirement for a proposed rate to exactly mirror the
evidence. For example, this might not be appropriate if the evidence pointed to setting
a charge right at the margins of viability. There is room for some pragmatism. It would
be appropriate to ensure that a ‘buffer’ or margin is included, so that the levy rate is
able to support development when economic circumstances adjust. In all cases, the
charging authority should be able to explain its approach clearly.”30
4.18 The need to set CIL rates within an appropriate viability buffer was a key theme raised by
respondents to the PDCS consultation in December 2013. Note that the buffer is to be 28 Report to the Greater Norwich Development Partnership – for Broadland District Council, Norwich City Council and South Norfolk Council, by Keith Holland BA (Hons) Dip TP, MRTPI ARICS, 4 December 2012, File Ref: PINS/G2625/429/6 – paragraph 9 29 Report to Sandwell Metropolitan Borough Council – on the Examination of the Draft Sandwell MBC Community Infrastructure Levy Charging Schedule, but Diana Fitzsimons MA MSc FRICS MRTPI, 16 December 2014, File Ref: PINS/G4620/429/9 – paragraph 16. 30 Department of Communities and Local Government (February 2014) Community Infrastructure Levy Guidance issued by the Secretary of State under section 221 of the Planning Act 2008 page 16-17

© Aspinall Verdi Limited West Oxfordshire DC Local Plan and CIL Viability Study Final Report
February 2015
29
commensurate to the ‘economic circumstances’, which in the case of a rising market could
arguably be smaller.
4.19 We have therefore tested various sensitivities in respect of the policy requirements and applied
an appropriate buffer in making our recommendations.
© Aspinall Verdi Limited West Oxfordshire DC Local Plan and CIL Viability Study Final Report
February 2015
30
5 Residential
5.1 This section deals with Use Class C3 – Dwelling Houses. We set out below our assumptions in
respect of residential typologies, appraisal assumptions and sensitivity outputs.
Residential Typologies
5.2 Within our previous EVA we appraised a number of hypothetical residential typologies ranging
from 1 – 100 dwellings. We set out a detailed analysis in respect of the typical sizes and mixes
of residential developments in West Oxfordshire in order to arrive at these typologies.
5.3 This analysis was not generally disputed but we did receive a number of representations in
respect of smaller schemes/commuted sums, greenfield and brownfield sites, and Rural
Exception Sites.
5.4 In addition we received a number of representations about how we applied the analysis to the
EVA – for example, our assumptions about scheme mix and density in different housing value
zones. We have therefore carried out further analysis and research to evidence these
assumptions and made a number of adjustments where appropriate.
5.5 Our scheme typologies are set out in Appendix 1. The table appended shows the scheme
typology in terms of number of units, value zone, hypothetical scenario (e.g.
greenfield/brownfield), development density, scheme mix and affordable housing assumptions.
Residential Unit Mix
5.6 In terms of residential unit mix, information can be drawn from the Oxfordshire Strategic
Housing Market Assessment (April 2014). This suggests that as a general guide the Council
should seek the following proportions of market housing:
4.8% 1-bed
27.9% 2-bed
43.4% 3-bed
23.9% 4-bed
5.7 This indicative mix updates the Council’s earlier Housing Needs Assessment (2011) which
suggested a need for a greater proportion of 1 and 2-bed units to address the current
dominance of larger properties within the District’s existing housing stock.

© Aspinall Verdi Limited West Oxfordshire DC Local Plan and CIL Viability Study Final Report
February 2015
31
5.8 Views on the mix of market housing were therefore sought through the Council’s Local Plan
Focused Housing Consultation (August 2014). Although a mix of responses was received, the
majority of respondents considered that the indicative market housing mix set out in the SHMA
(see above) is reasonable albeit with the need to retain some flexibility on a case by case basis.
5.9 In relation to affordable housing, the SHMA suggests that the following mix should be sought as
a general guide:
23.3% 1-bed
43.7% 2-bed
30.4% 3-bed
2.6% 4+bed
5.10 Having regard to the SHMA, the Council’s Local Plan Housing Consultation Paper (August
2014) suggested that as a general guide the Council would seek affordable housing in the
following proportions:
65% - 67% 1-bed and 2-bed
33% - 35% 3-bed and 4-bed
5.11 Again, there was general agreement through the consultation that this indicative mix is
reasonable subject to the need for some flexibility.
5.12 It is important to note that the SHMA, ‘emphasises that this is a general guide only and Local
Plans should not be overly prescriptive about the size of property sought as the ‘market’ is to
some degree a better judge of what is the most appropriate profile of homes to deliver at any
point in time.’31
5.13 The residential scheme mix used in this EVA (Appendix 1) is derived from this evidence, plus:
the previous development monitoring analysis (September 2013 EVA),
Further evidence supplied by WODC on the mix of a number of sample residential schemes
that have taken place/been permitted in the District,
stakeholder representations received,
the Council’s experience and knowledge of schemes likely to come forward,
viability in terms of unit sizes, density and economies of scale.

© Aspinall Verdi Limited West Oxfordshire DC Local Plan and CIL Viability Study Final Report
February 2015
32
5.14 The scheme mix was approved and agreed by the Council prior to the calculation of the viability
appraisals.
5.15 The following sub-sections refer to the different variables used in the viability appraisal models
(Appendix 2).
Floor Areas
5.16 Within our previous EVA report we sought to vary the size (and mix) of residential units by
housing zone – thus, assuming that larger units would be provided in the higher value areas. In
this respect we assumed the following floor areas (Table 5.1):
Dwelling Type Sqm high
value zone Sqm medium
value zone Sqm lower value zone
1 Bed Flat 50 50 45-50
2 Bed Flat 70 70 60-70
2 Bed House 75 75 75
3 Bed House 90 90 90-10032
4 Bed House 110-150 110-140 100-130
5 Bed House (pro-rata)33 200 190 155
Table 5.1 – GIA Floor Area Assumptions (September 2013)
5.17 We consulted upon the residential unit size assumptions at the stakeholder workshop in April
2013 and no issues were specifically raised by the industry. This was similarly the case at the
PDCS and Affordable Housing consultation stage. However, we did receive representations
concerned that the differentiation of unit sizes by housing value zone was not justifiable and
that the same dwelling size assumptions should be applied across the District irrespective of
location. This it was felt would be less complex and more transparent and take account of the
fact that unit size will be a matter of site-specifics as much as location and scheme value.
5.18 Notably, since the last EVA report the government (DCLG) has issued draft technical
standards34 for residential development including national standards for internal space (floor
32 Includes detached house type delivered as 4 and 5 bed units in higher value zones 33 We have pro-rated the 5 Bed house type as data was not supplied by the registered providers for a 5-bed affordable unit. 34 Department for Communities and Local Government, Housing Standards Review, Illustrative Technical Standards Developed by the Working Groups (August 2013)

© Aspinall Verdi Limited West Oxfordshire DC Local Plan and CIL Viability Study Final Report
February 2015
33
areas). At the time of writing it is proposed that the internal space standards will be applied
through local plans.
5.19 The draft national space standards are as follows (Table 5.2):
Dwelling Type Sqm – ‘Level 1’ General Needs35
1 Bed Flat 47
2 Bed Flat 60
2 Bed House (2 Storey) 68
3 Bed House (2 Storey) 81
3 Bed House (3 Storey) 86
4 Bed House (2 Storey) 94
4 Bed House (3 Storey) 99
5 Bed House (2 Storey) 107
5 Bed House (3 Storey) 112
Table 5.2 – DRAFT National Housing Standards (DCLG, August 2013)
5.20 Note also that the development of 2- or 3-storey units has an impact on the development
density of a scheme in terms of ‘floorspace (sqm) per hectare’. However, density assumptions
for planning policy and EVA’s are generally expressed in terms of ‘dwellings per hectare’ (dph)
and therefore we have sought to use the most appropriate ‘average’ unit size commensurate
with an ‘average’ density assumption (dph) (see below).
5.21 It is evident that the unit sizes for the smaller properties are broadly in-line with our previous
assumptions and particularly 1 and 2 bed flats, 3 bed houses and 4 bed houses. However, the
sizes of larger houses are assumed to be larger than the national space standards. It is
important to note that the national space standards represent a minimum and in affluent areas
one would expect these standards to be exceeded. For example, typical 4 bed houses for sale
in the West Oxfordshire range in size between 111 sqm and 345 sqm with an average of 171
sqm and a median of 138 sqm.
5.22 For the purposes of this EVA we have adopted the following floor area assumptions (Table 5.3):
35 Level 1 homes will provide adequate accessibility for most people, including many older people, and basic visitor access for people who use wheelchairs

© Aspinall Verdi Limited West Oxfordshire DC Local Plan and CIL Viability Study Final Report
February 2015
34
Dwelling Type Sqm (rounded)
1 Bed Flat 50
2 Bed Flat 70
2 Bed House 75
3 Bed House 90
4 Bed House 130
5 Bed House 155
Table 5.3 – GIA Floor Area Assumptions Used
Open Market Values
5.23 The residential property market in West Oxfordshire has been the subject of numerous studies
and reports including inter alia:
DCA Consultants (2008) West Oxfordshire Housing Needs Assessment, Final Report
DCA Consultants (2011) West Oxfordshire Housing Needs Assessment Update, Final
Report
Three Dragons (November 2009) West Oxfordshire District Council Affordable Housing
Viability Study Final Report
Golland, Dr Andrew and Three Dragons (AG) Ltd (May 2011) West Oxfordshire District
Council Affordable Housing Viability Study Position Statement
Golland, Dr Andrew (October 2012) Affordable Housing and the use of a Single Dwelling
Threshold
5.24 Within our September 2013 EVA report we reviewed this evidence base and carried out our
own property market analysis to derive our residential sales value assumptions. This was
consulted upon at the stakeholder workshop in April 2013 and adjustments made. We
completed our September 2013 EVA based on the following values (Table 5.4):

© Aspinall Verdi Limited West Oxfordshire DC Local Plan and CIL Viability Study Final Report
February 2015
35
Area Post Code 1 Bed 2 Bed 3 Bed 4 Bed 5 Bed
Witney & Carterton (Lower Value)
(OX28 1, OX28 2, OX28 3, OX28 4, OX28 5, OX28 6, OX18 1, OX18 3)
£120,000 - £140,000
£160,000 - £190,000
£190,000 - £230,000
£280,000 - £320,000
£340,000 - £360,000
Other Rural (all other postcodes) (Medium Value)
Rest £170,000 - £190,000
£180,000 – £210,000
£260,000 - £290,000
£350,000 - £380,000
£420,000 - £500,000
Cotswolds Belt + Oxford Belt (High value)
(OX7 6, OX18 4, GL7 3) + (OX7 4,OX20 1 OX25 4, OX25 5, OX25 6)
£200,000 – £220,000
£250,000 - £270,000
£320,000 - £350,000
£420,000 - £460,000
£500,000 - £600,000
Table 5.4 – Base Sales Value by House Type and Area (September 2013 Assumptions)
5.25 In reviewing and updating the various affordable housing viability reports we consolidated the
value zones into three.
5.26 As noted previously, these are ‘average’ values only for a range of house types/sizes in various
towns/locations within the sub-market areas. There will always be houses with a higher and/or
lower value at either end of the range.
Residential Market Update
5.27 Various organisations produce statistics on the residential property market including the Office
for National Statistics (ONS), Land Registry, Halifax (HBOS plc) and Nationwide Building
Society.
5.28 Figure 5.5 below shows a comparison of housing marketing annual house price growth
produced by the aforementioned organisations. As you can see they are all broadly similar
over the long-term.

© Aspinall Verdi Limited West Oxfordshire DC Local Plan and CIL Viability Study Final Report
February 2015
36
Figure 5.5 – Housing Market Annual Growth comparison (by ONS)
5.29 Notwithstanding the momentum in the UK housing market in 2013, some of this has ‘cooled’
more recently as the impact of the new mortgage ‘affordability ‘ regulations has come into force
on 26 April 2014.
5.30 Figure 5.6 below shows the annual house price growth (%) over the shorter-term since the
earlier EVA report in September 2013. In Quarter 3 2013 annual housing market growth was
recorded as between 1.8% and 6.2% and by Quarter 1 2014 this had risen to between 5.1%
and 9.2% (depending on the source).

© Aspinall Verdi Limited West Oxfordshire DC Local Plan and CIL Viability Study Final Report
February 2015
37
Figure 5.6 – Housing Market Quarterly Growth comparison (source ONS)
5.31 The current annual house price rise is 7.8% (Jan 2015).
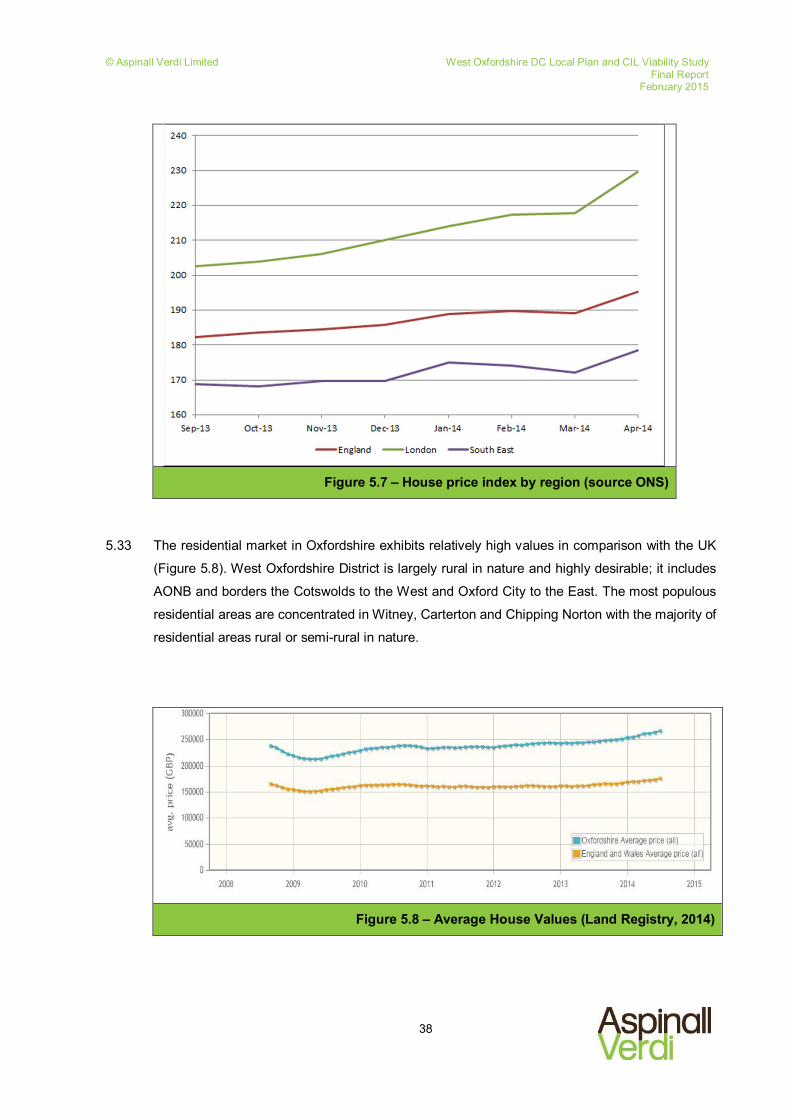
5.32 The ONS also publishes monthly housing market data by region. Figure 5.7 shows the house
price index for London, England and the South East (February 2002 = 100). London house
prices have increased by 13.4% between September 2013 and April 2014 compared to more
modest growth of 7.2% for England over the same period and 5.7% for the South East. Note
that the South East region includes Kent, the south coast and round to Oxfordshire.
© Aspinall Verdi Limited West Oxfordshire DC Local Plan and CIL Viability Study Final Report
February 2015
38
Figure 5.7 – House price index by region (source ONS)
5.33 The residential market in Oxfordshire exhibits relatively high values in comparison with the UK
(Figure 5.8). West Oxfordshire District is largely rural in nature and highly desirable; it includes
AONB and borders the Cotswolds to the West and Oxford City to the East. The most populous
residential areas are concentrated in Witney, Carterton and Chipping Norton with the majority of
residential areas rural or semi-rural in nature.
Figure 5.8 – Average House Values (Land Registry, 2014)

© Aspinall Verdi Limited West Oxfordshire DC Local Plan and CIL Viability Study Final Report
February 2015
39
5.34 The average values of all property types in Oxfordshire at July 2014 was £266,472, which
compares with the England and Wales average of £175,653; the average values for detached
homes were £424,930, and semi-detached homes were £249,536, while terraces were
£229,900 and flats were £183,468 (source Land Registry).
5.35 To inform this EVA update, residential value information has been gathered across the whole of
West Oxfordshire utilising; the Land Registry, Zoopla, Mouseprice, and West Oxfordshire
District Council. The focus has been on up-to-date market information, utilising a variety of
sources to ensure the validity of the assumptions as fair as possible.
Achieved Values
5.36 Using the Land Registry we have reviewed all sold prices for both new and second-hand
homes within the OX postcode areas over the period 2013 to Q2 2014; the Land Registry is the
most robust resource of house price data as it is based upon actual transactions. We sorted
this data into average values across each postcode area by: by house type, new build and
second-hand transactions, as well as overall sales volume to understand the local housing
market. As some postcodes did not witness any new home sales, or some had very few, it was
necessary to review the data for both new and second-hand transactions.
5.37 Table 5.9 below sets out the average sales values across all house types within the different
West Oxfordshire postcode areas.
5.38 The more recent data analysis presents that there are only two lower value postcode areas.
Although the table below shows that there is some merging within the medium and high value
areas, there is still a strong correlation between the values by postcode area and housing
market zones (Figure 5.10). Witney, which was previously included in the lower value zone has
now been moved into the medium value zone having regard to the further analysis of property
transactions that we have undertaken.

© Aspinall Verdi Limited West Oxfordshire DC Local Plan and CIL Viability Study Final Report
February 2015
40
KEY:
Table 5.9 – Average Values of all Property Types from 2013 to Q2 2014
(Land Registry, 2014)
5.39 This is illustrated on the map below (Figure 5.10).

© Aspinall Verdi Limited West Oxfordshire DC Local Plan and CIL Viability Study Final Report
February 2015
41
Figure 5.10 – Housing Market Zones (2015)

© Aspinall Verdi Limited West Oxfordshire DC Local Plan and CIL Viability Study Final Report
February 2015
42
5.40 We received a number of representations to the PDCS and the Affordable Housing consultation
suggesting that we use the five sub-areas identified within the emerging Local Plan, namely:
Witney, Carterton, Chipping Norton, Burford/Charlbury, and Eynsham/Woodstock.
5.41 We therefore repeated the above analysis for the five sub-areas, however we did not find a
strong correlation of values. This is likely to be because these zones have been derived for the
purposes of spatial planning and not with regard to values.
5.42 We have also reviewed the sold values from Zoopla of new residential schemes within West
Oxfordshire to establish to values achieved. We summarise our findings below at Table 5.11.
Property Type Min Max Average
Detached £239,000 £580,000 £375,214
Semi-detached £235,000 £274,000 £254,400
Terraced £341,400 £430,000 £306,425
Flats £145,000 £275,000 £195,000
Table 5.11 – New Residential Development Sold Values (Zoopla, 2014)
Asking Prices
5.43 The Land Registry data only breaks-down the sales data by house type (e.g. terraced, semi-
detached, detached etc). To supplement this information and to analyse value differentials by
number of bedrooms and other key differentials such as size, current asking prices have been
obtained from Zoopla/Mouseprice and in consultation with stakeholders and residential agents.
5.44 Agent consultations were successfully undertaken in Autumn 2014 with local branches of
Connells, Savills, Taylor Fletcher, and Wychwood Flowers (for which we are grateful). Other
identified local agents were contacted but unresponsive. From the consultations obtaining
broad differentials across West Oxon was very difficult as the knowledge held was highly
localised. The consultations served to confirm the high level of variance of house prices
dependent on the nature of the property on offer, the particulars of the location and desirability
factors. It was confirmed that:
Carterton on the whole was of a lower value than neighbouring locations;
In Witney some areas exhibited medium values and others lower – but more on a par with
the medium value area than the lower;

© Aspinall Verdi Limited West Oxfordshire DC Local Plan and CIL Viability Study Final Report
February 2015
43
Certain villages (e.g. Kingham / Shipton-under-Wychwood) with good train line connections
to Oxford and London were of higher value;
Large differentials were noted between values in the rural villages;
The Oxford belt was identified as being more expensive;
Chipping Norton town was distinguished as lower value than its more rural neighbours.
5.45 Similarly, we have reviewed the asking values of new schemes per square metre currently on
the market with Zoopla. However, we would stress these values are asking prices and not
achieved prices, therefore are likely to be higher than values achieved. We present our findings
below at Table 5.12.
Asking Value psm
Min Max Average
Private Housing £2,717 £4,210 £3,360
Table 5.12 – New Residential Development Asking Values (Zoopla, 2014)
5.46 The difficulty with the above data is that the websites do not always provide accessible large
scale data about the size of units in terms of either number of bedrooms or floor space.
Updated Market Value Assumptions
5.47 Having regard to all of the above sources of house price data we derived the following
residential value assumptions in Table 5.13 below. These values have been used within this
EVA update.

© Aspinall Verdi Limited West Oxfordshire DC Local Plan and CIL Viability Study Final Report
February 2015
44
Table 5.13 – Market Housing Sales Value Assumptions (£’000)
5.48 Table 5.14 shows these sales values per square metre (psm) based on the floor areas in Table
5.3 above. Note that we have excluded 2 bedroom units from this table as there are differing
floor areas for 2 bed houses and flats.
Table 5.14 – Market Housing Sales Value Assumptions (£ psm)
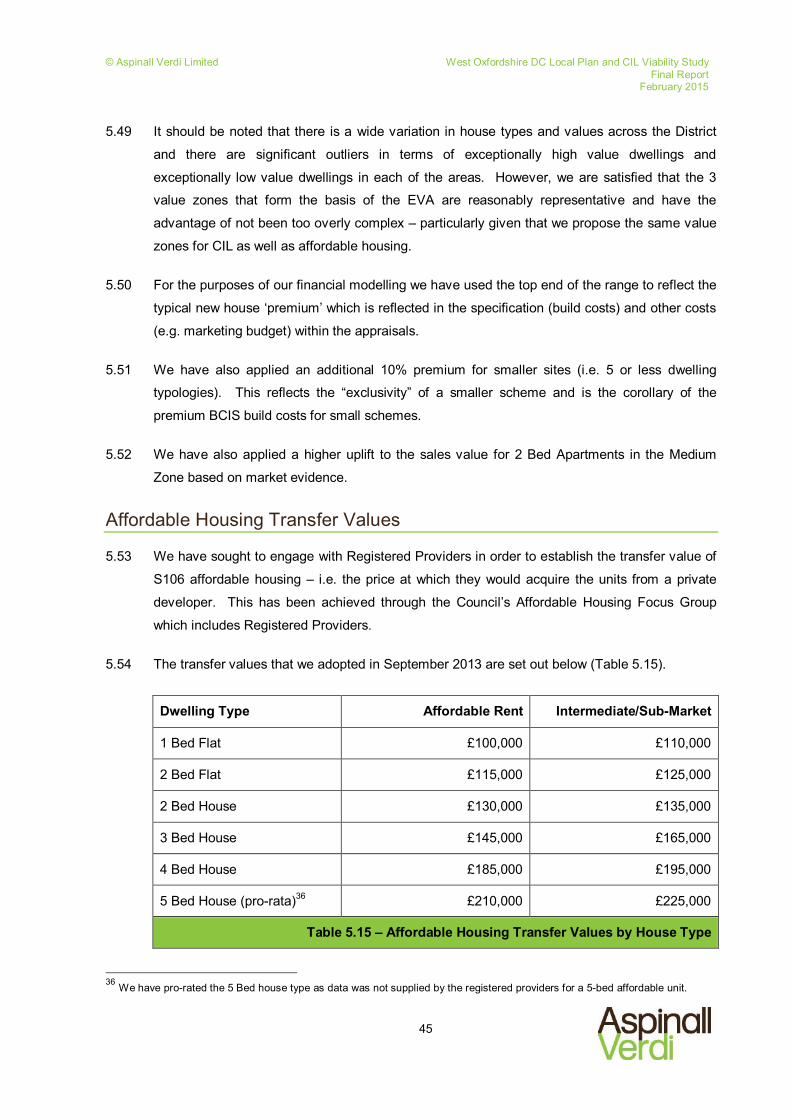
© Aspinall Verdi Limited West Oxfordshire DC Local Plan and CIL Viability Study Final Report
February 2015
45
5.49 It should be noted that there is a wide variation in house types and values across the District
and there are significant outliers in terms of exceptionally high value dwellings and
exceptionally low value dwellings in each of the areas. However, we are satisfied that the 3
value zones that form the basis of the EVA are reasonably representative and have the
advantage of not been too overly complex – particularly given that we propose the same value
zones for CIL as well as affordable housing.
5.50 For the purposes of our financial modelling we have used the top end of the range to reflect the
typical new house ‘premium’ which is reflected in the specification (build costs) and other costs
(e.g. marketing budget) within the appraisals.
5.51 We have also applied an additional 10% premium for smaller sites (i.e. 5 or less dwelling
typologies). This reflects the “exclusivity” of a smaller scheme and is the corollary of the
premium BCIS build costs for small schemes.
5.52 We have also applied a higher uplift to the sales value for 2 Bed Apartments in the Medium
Zone based on market evidence.
Affordable Housing Transfer Values
5.53 We have sought to engage with Registered Providers in order to establish the transfer value of
S106 affordable housing – i.e. the price at which they would acquire the units from a private
developer. This has been achieved through the Council’s Affordable Housing Focus Group
which includes Registered Providers.
5.54 The transfer values that we adopted in September 2013 are set out below (Table 5.15).
Dwelling Type Affordable Rent Intermediate/Sub-Market
1 Bed Flat £100,000 £110,000
2 Bed Flat £115,000 £125,000
2 Bed House £130,000 £135,000
3 Bed House £145,000 £165,000
4 Bed House £185,000 £195,000
5 Bed House (pro-rata)36 £210,000 £225,000
Table 5.15 – Affordable Housing Transfer Values by House Type
36 We have pro-rated the 5 Bed house type as data was not supplied by the registered providers for a 5-bed affordable unit.
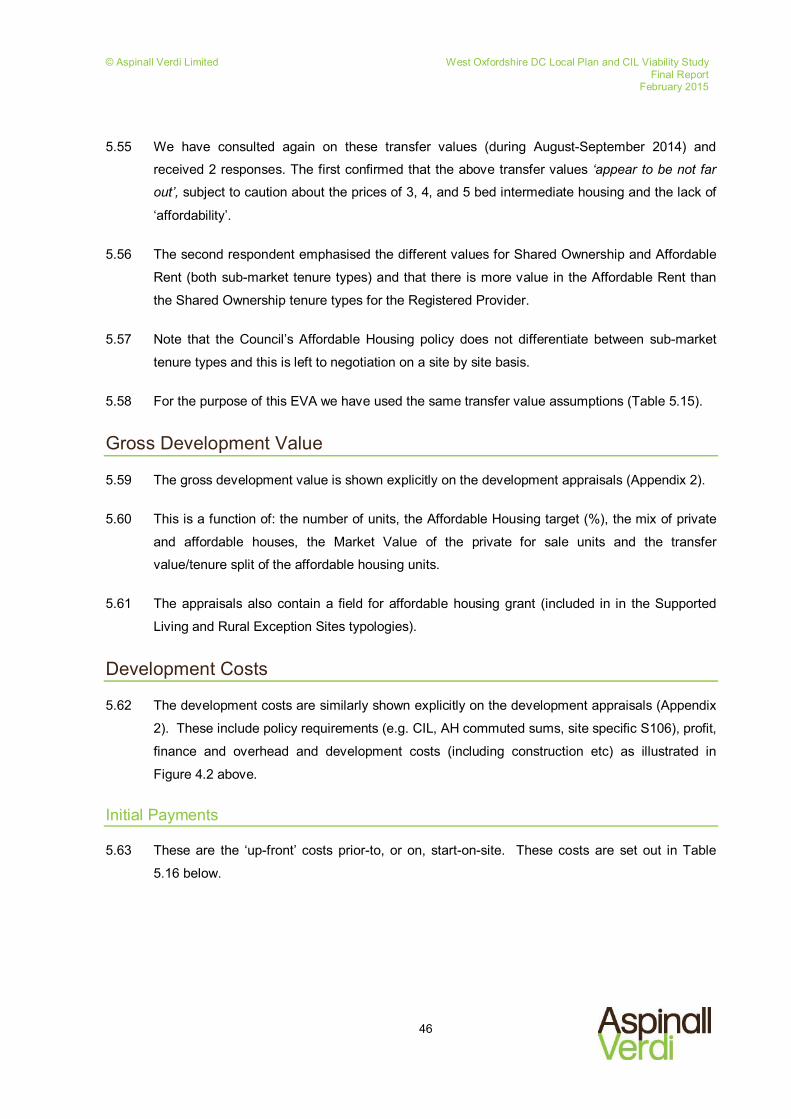
© Aspinall Verdi Limited West Oxfordshire DC Local Plan and CIL Viability Study Final Report
February 2015
46
5.55 We have consulted again on these transfer values (during August-September 2014) and
received 2 responses. The first confirmed that the above transfer values ‘appear to be not far
out’, subject to caution about the prices of 3, 4, and 5 bed intermediate housing and the lack of
‘affordability’.
5.56 The second respondent emphasised the different values for Shared Ownership and Affordable
Rent (both sub-market tenure types) and that there is more value in the Affordable Rent than
the Shared Ownership tenure types for the Registered Provider.
5.57 Note that the Council’s Affordable Housing policy does not differentiate between sub-market
tenure types and this is left to negotiation on a site by site basis.
5.58 For the purpose of this EVA we have used the same transfer value assumptions (Table 5.15).
Gross Development Value
5.59 The gross development value is shown explicitly on the development appraisals (Appendix 2).
5.60 This is a function of: the number of units, the Affordable Housing target (%), the mix of private
and affordable houses, the Market Value of the private for sale units and the transfer
value/tenure split of the affordable housing units.
5.61 The appraisals also contain a field for affordable housing grant (included in in the Supported
Living and Rural Exception Sites typologies).
Development Costs
5.62 The development costs are similarly shown explicitly on the development appraisals (Appendix
2). These include policy requirements (e.g. CIL, AH commuted sums, site specific S106), profit,
finance and overhead and development costs (including construction etc) as illustrated in
Figure 4.2 above.
Initial Payments
5.63 These are the ‘up-front’ costs prior-to, or on, start-on-site. These costs are set out in Table
5.16 below.

© Aspinall Verdi Limited West Oxfordshire DC Local Plan and CIL Viability Study Final Report
February 2015
47
Item Assumption
Planning Application Professional Fees and reports
Allowance for typology
Statutory Planning Fees Based on national formula
CIL This is the CIL rate (£ psm) and an input to the CIL sensitivity tables
Site specific S106/S278 Site Specific Allowance for typology – note that this is in addition to CIL and
external works costs
AH Commuted Sum This is a field for affordable housing commuted sums on smaller scheme
typologies where there is 0% affordable housing ‘on-site’
Table 5.16 – Residential Appraisals Initial Cost Assumptions
S106 and CIL
5.64 Throughout our viability analysis we have taken great care to avoid any double-counting of
S106 costs.
5.65 After the introduction of CIL only site specific S106s will be allowable and this will have to pass
the tests set out in the NPPF.
5.66 Currently, pooled S106’s are negotiated for a range of different types of infrastructure by both
West Oxfordshire District Council and Oxfordshire County Council. Oxfordshire County Council
has procured Consultants to:
develop CIL Protocols with all the District Councils by April 2015
establish a mitigation strategy to reduce any negative impact on the County Council’s ability
to deliver infrastructure.
coordinate the County Council’s infrastructure needs to ensure that they are clearly
identified and evidenced to qualify for CIL.
Ensure CIL expenditure is prioritised across the County to ensure infrastructure
fundamental to enabling growth is appropriately funded.
establish efficient and effective governance processes, both internally and with the District
Councils.

© Aspinall Verdi Limited West Oxfordshire DC Local Plan and CIL Viability Study Final Report
February 2015
48
ensure that the County Council has a thorough understanding of the unmet pressures for
infrastructure development that feed into additional funding negotiations via the Growth
Board and Local Enterprise Partnership.
5.67 These various contributions are set out on the table below (Table 5.17).
Table 5.17 – S106 and CIL
5.68 As you can see the current S106 requirement equates to approximately £5,110 per dwelling for
West Oxfordshire District Council and £11,231 per dwelling for Oxfordshire County Council
(Total £16,341). Note: this assumes that a contribution is made to all of the elements listed. In
some instances, contributions may not be sought where they are not needed or may be
foregone if evidence suggests the scheme is not viable.
5.69 It is evident that the majority of contributions will be funded by CIL, once adopted.
5.70 It is important to note that the above charges are only currently sought on larger schemes (10+
units) and schemes of less than 10 units are not required to contribute at all (other than in
relation to site-specific matters). In theory, CIL should make this fairer by spreading the costs
of infrastructure provision across all schemes including the majority of smaller (single dwelling)
schemes (except self-build) and not left to the larger schemes to fund.
5.71 Within our appraisals we have made appropriate allowances for site specific S106’s which are
not covered by CIL or affordable housing. These are set out in the table below (Table 5.18).

© Aspinall Verdi Limited West Oxfordshire DC Local Plan and CIL Viability Study Final Report
February 2015
49
Item Site Specific S106/S278 Assumption
10 units or less £0 per unit
>10 units £1,500 per unit
40 units or more (greenfield) £10,000 per unit
Table 5.18 – Site Specific S106/S278 Assumptions
5.72 This is reasonable given the above current ‘threshold’ and allocation between CIL and S106
(Table 5.12). Note also that the above costs should also be considered ‘in-the-round’ with our
other assumptions in respect of external works, site clearance and demolitions, contingency
and the CIL viability ‘buffer’.
Demolition and Site Clearance
5.73 Within our September 2013 EVA we included an allowance of £20,000 per acre for site
clearance and demolitions in respect of brownfield site typologies. This is purely hypothetical
and depends on the circumstances of a particular site. Given the high TLV for brownfield sites
(see Figure 4.3) we have increased this to £50,000 per acre.
Construction Costs
5.74 The construction costs adopted for our September 2013 EVA were (Table 5.19):
Use BCIS £ psm37
‘One-off’ housing (<3 units)38 £1,224 (high value areas),
£1,100 (medium value areas),
£1,000 (lower value areas)
Estate Housing £838
Flats/apartments £971
Table 5.19 – Construction Cost Assumptions (BCIS) (September 2013)
37 based on the BCIS cost indices rebased for Oxfordshire (accessed website 24 April 2013). 38 BCIS defines “one-off’ housing of 3 units or less” and “estate housing”. We have applied the “one-off” build rates to the 5x house development typologies are these are more akin to the 3 units or less than estate housing. We have discounted this back to reflect the differing market areas. We have applied the estate housing build rate to the 15x house development typology.
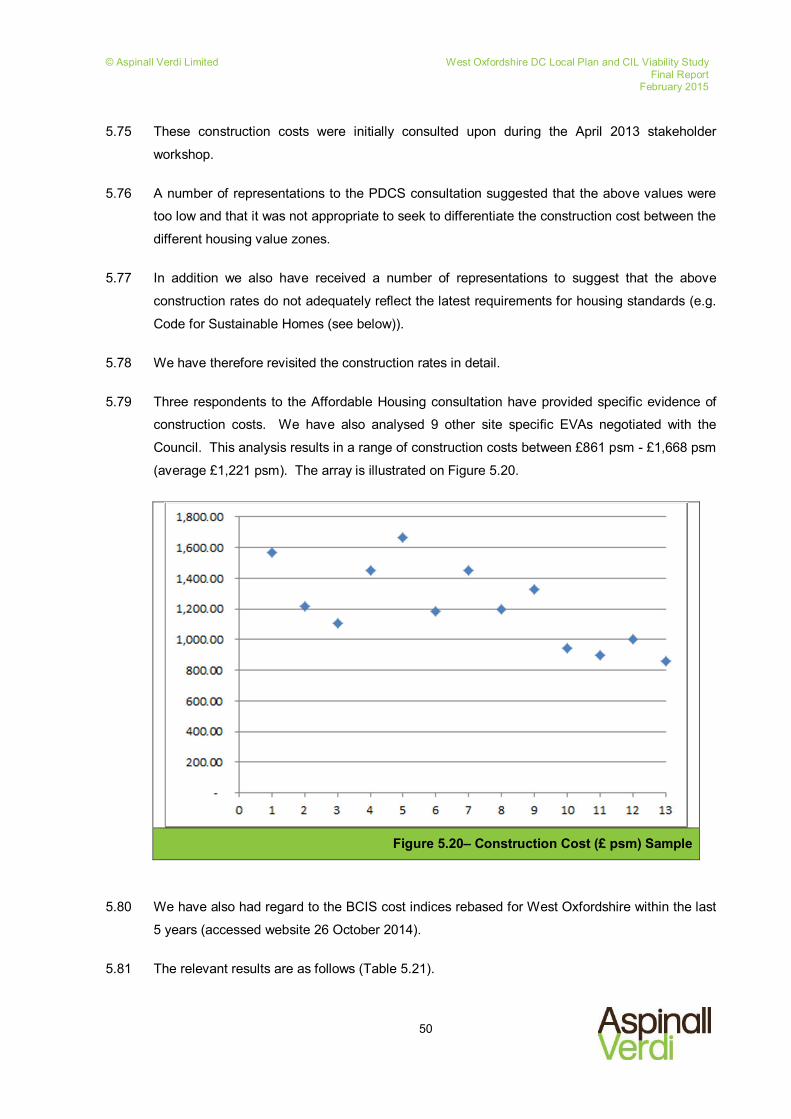
© Aspinall Verdi Limited West Oxfordshire DC Local Plan and CIL Viability Study Final Report
February 2015
50
5.75 These construction costs were initially consulted upon during the April 2013 stakeholder
workshop.
5.76 A number of representations to the PDCS consultation suggested that the above values were
too low and that it was not appropriate to seek to differentiate the construction cost between the
different housing value zones.
5.77 In addition we also have received a number of representations to suggest that the above
construction rates do not adequately reflect the latest requirements for housing standards (e.g.
Code for Sustainable Homes (see below)).
5.78 We have therefore revisited the construction rates in detail.
5.79 Three respondents to the Affordable Housing consultation have provided specific evidence of
construction costs. We have also analysed 9 other site specific EVAs negotiated with the
Council. This analysis results in a range of construction costs between £861 psm - £1,668 psm
(average £1,221 psm). The array is illustrated on Figure 5.20.
Figure 5.20– Construction Cost (£ psm) Sample
5.80 We have also had regard to the BCIS cost indices rebased for West Oxfordshire within the last
5 years (accessed website 26 October 2014).
5.81 The relevant results are as follows (Table 5.21).
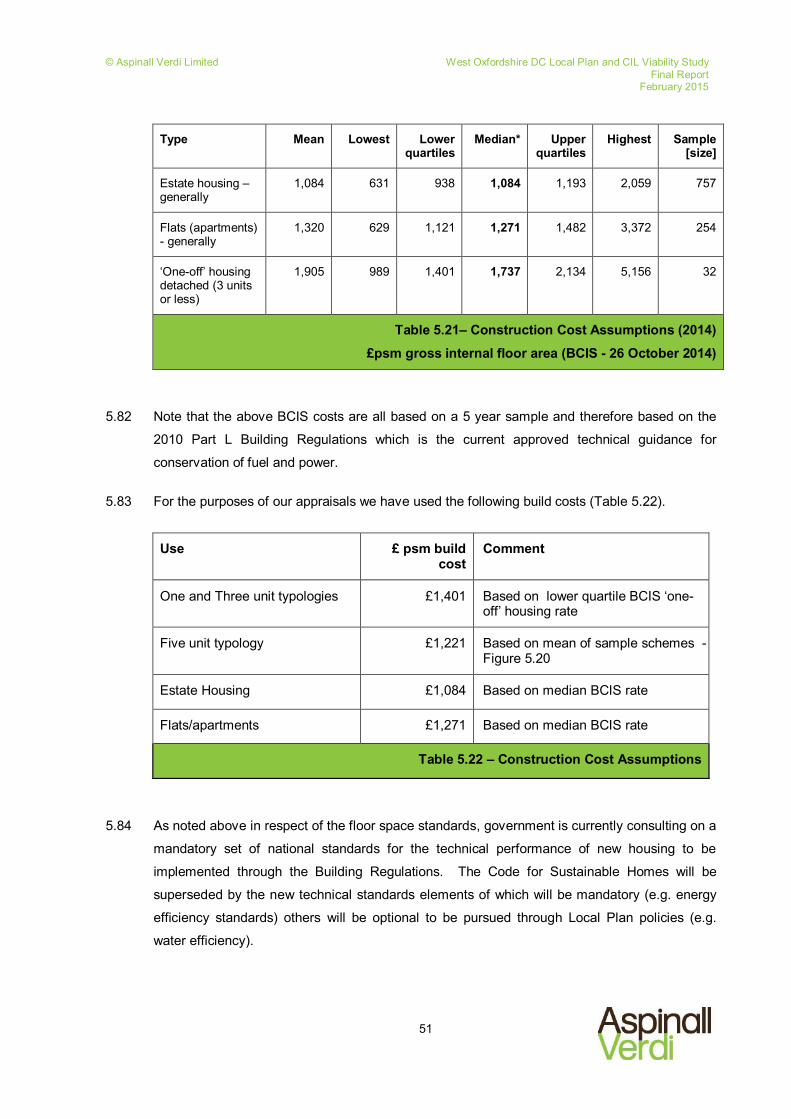
© Aspinall Verdi Limited West Oxfordshire DC Local Plan and CIL Viability Study Final Report
February 2015
51
Type Mean Lowest Lower quartiles
Median* Upper quartiles
Highest Sample [size]
Estate housing –generally
1,084 631 938 1,084 1,193 2,059 757
Flats (apartments) - generally
1,320 629 1,121 1,271 1,482 3,372 254
‘One-off’ housing detached (3 units or less)
1,905 989 1,401 1,737 2,134 5,156 32
Table 5.21– Construction Cost Assumptions (2014) £psm gross internal floor area (BCIS - 26 October 2014)
5.82 Note that the above BCIS costs are all based on a 5 year sample and therefore based on the
2010 Part L Building Regulations which is the current approved technical guidance for
conservation of fuel and power.
5.83 For the purposes of our appraisals we have used the following build costs (Table 5.22).
Use £ psm build cost
Comment
One and Three unit typologies £1,401 Based on lower quartile BCIS ‘one-off’ housing rate
Five unit typology £1,221 Based on mean of sample schemes - Figure 5.20
Estate Housing £1,084 Based on median BCIS rate
Flats/apartments £1,271 Based on median BCIS rate
Table 5.22 – Construction Cost Assumptions
5.84 As noted above in respect of the floor space standards, government is currently consulting on a
mandatory set of national standards for the technical performance of new housing to be
implemented through the Building Regulations. The Code for Sustainable Homes will be
superseded by the new technical standards elements of which will be mandatory (e.g. energy
efficiency standards) others will be optional to be pursued through Local Plan policies (e.g.
water efficiency).

© Aspinall Verdi Limited West Oxfordshire DC Local Plan and CIL Viability Study Final Report
February 2015
52
5.85 The government is still committed to the majority of homes built from 2016 being “zero carbon”.
However, we understand that the government’s definition of zero carbon is set at the equivalent
of level 5 of the Code for Sustainable Homes (not the highest level 6). In addition, current
consultation suggests that small sites of less than 10 dwellings will be exempt. This would
exempt a large proportion of the units developed in West Oxfordshire.
5.86 Because the regulations in respect of environmental standards continue to evolve it is
recommended that the EVA is reviewed at the point of any changes to mandatory standards.
5.87 In the meantime, we have had regard to the potential increase in construction costs as a result
of the requirement to achieve new technical standards (assumed to be Code level 5) within our
sensitivity analysis (see residential appraisals). In this respect we have relied on the DCLG
research Cost of building to the Code for Sustainable Homes, Updated cost review (August
2011)39. This sets out the extra costs over baseline Part L 2010 costs for building various
dwelling types and development scenarios.
5.88 As set out above, the emerging government technical standards are likely to require Code 5
(‘zero’ carbon) by 2016 for larger developments over 10 units. The extra-over costs for
achieving Code 5 over Part L 2010 are summarised on the following table (Table 5.23).
E/O cost %
Small brownfield (20 dwellings) £19,740 23.2%
City Infill [flats] (40 dwellings) £15,220 27.9%
Edge of Town (100 dwellings) £18,921 24.3%
Urban Regeneration (1000 dwellings) £15,103 23.9%
Strategic Greenfield (2000 dwellings) £20,469 25.8%
Large edge of town (3,300 dwellings) £20,035 26.3%
Average increase 25.2%
Table 5.23 – Extra-over cost of achieving Code 5 (source DCLG)
5.89 As you can see the average increase in cost is 25%.
5.90 The Council’s own independently commissioned research40 by CAG Consultants notes that the
impacts of increased costs upon development in the district will be affected by a wide range of
factors including housing demand and house price changes, other requirements placed on
39 DCLG, Cost of building to the Code for Sustainable Homes, Updated cost review (August 2011) by Element Energy and Davis Langdon, ISBN: 978 1 4098 3106 8, Table 4 page 16 40 CAG Consultants with Impetus Consulting, Adrian Smith and Dotted Eyes (September 2009) Renewable Energy and Sustainable Construction Study Final report for West Oxfordshire

© Aspinall Verdi Limited West Oxfordshire DC Local Plan and CIL Viability Study Final Report
February 2015
53
developers (e.g. affordable housing), technological changes, what neighbouring authorities
require, grant funding opportunities and changes in national policy and other regulations41.
External Works
5.91 Within the previous EVA (September 2014) we included an allowance of 10% for external
works. We received a number of representations suggesting that this was low.
5.92 The Harman report states, ‘[external works] are likely to vary significantly from site to site. The
planning authority should include appropriate average levels for each type of site unless more
specific information is available. Local developers should provide information to assist in this
area where they can, taking into account commercial sensitivity.’ 42
5.93 We have analysed the representations received and reviewed a number of project specific
EVAs and SDA appraisals provided by the Council to verify this assumption. Based on a
sample of 22, we calculate the maximum external works allowance to be £24,300 per unit
(35%) and the minimum £6,200 (5%). The median is 15% which equates to a figure of
approximately £15,000 per unit.
5.94 We have therefore increased our external works assumption (from 10%) to 15% within our
modelling.
Contingency
5.95 As previously, this is set at 5%. This has been generally accepted.
Professional Fees
5.96 Within our previous EVA (September 2013) we included an allowance of 10% for professional
fees.
5.97 In analysing a sample of actual site specific EVAs provided by the Council we have noted the
typical professional fees applied. This ranges from 5-15% based on a sample of 14. The
median % is 9% which we have applied through this update report.
5.98 Note, that ‘up-front’ fees such as planning fees are included under a separate heading (Initial
Payments above) and we are satisfied that 9% is adequate.
41 CAG Consultants with Impetus Consulting, Adrian Smith and Dotted Eyes (September 2009) Renewable Energy and Sustainable Construction Study Final report for West Oxfordshire page 111 42 Local Housing Delivery Group, Local Government Association / Home Builders Federation / NHBC (20 June 2012) Viability Testing Local Plans, Advice for planning practitioners, Edition 1 (the ‘Harman’ report) page 35

© Aspinall Verdi Limited West Oxfordshire DC Local Plan and CIL Viability Study Final Report
February 2015
54
Disposal Costs
5.99 Disposal costs are included based on 1% sale agents, 0.5% sales legal fees and 3% marketing
and promotion.
5.100 Few respondents to the previous EVA consultation queried these allowances. Note that the
marketing and promotion costs have to be considered ‘in-the-round’ with the sales values.
Whilst some developers may require a larger marketing budget, this is to achieve ‘premium’
values.
Finance Costs
5.101 Within our previous EVA we assumed interest at 7%, plus a 1% finance fee.
5.102 Few respondents to the previous EVA consultation queried these allowances. However, in
analysing a sample of actual site specific EVAs provided by the Council we have noted the
typical interest and finance fees applied. This ranges from 5-7.5% interest and nil-2% finance
fees (based on a sample of 14). The median interest rate is 7% and the median finance fee is
0% (0.6% mean).
5.103 We have therefore not changed our assumptions.
Developers Profit
5.104 Within our previous EVA we assumed developers profit at 20% on the total Gross Development
Value.
5.105 This tends to over-state the profit and best practice is to apply a lower rate to the affordable
housing element which is ‘pre-sold’. For the purposes of this EVA we have applied 20% to the
private housing and 6% to the on-site affordable housing (where applicable).
Residual Land Value
5.106 The Residual Land Value (RLV) is the product of the above values and costs (see Figure 4.2).
5.107 We have deducted Stamp Duty Land Tax (SDLT) based on the HMRC thresholds, Acquisition
agent and legal fees (1% and 0.5%) and interest on the land (7%) from the gross RLV to derive
the net RLV.
5.108 The net RLV is the maximum price that a developer could pay for a site (based on the above
parameters) and still maintain his profit margin.

© Aspinall Verdi Limited West Oxfordshire DC Local Plan and CIL Viability Study Final Report
February 2015
55
Residential Threshold Land Value (TLV)
5.109 The Threshold Land Value (TLV) is possibly the most important assumption in Plan Viability as
it is the difference between the TLV and the RLV that is the margin for CIL and affordable
housing (see Figure 4.2).
5.110 We received a number of representations from developers in respect of the TLV assumptions
contained within the September 2013 EVA. These were mainly to do with:
the application of the 20% - 30% ‘discount’ from benchmark Market Value to TLV, and
our valuation approach on smaller residential sites (per plot, rather than a density x price
per acre approach).
5.111 Where comments were made about the TLV these were in general terms and provided no
further specific evidence. We did receive support for our assumed values and one respondent
commented, “we believe that the minimum land value per acre (for large greenfield sites) can
be justified at at least £300,000 per net developable acre, which is the figure that Aspinall Verdi
appear to have arrived at ….”
5.112 Subsequently we have reverted to all those who made representations on the September 2013
EVA and requested any further specific land value evidence, but limited actual transactional
evidence has been forthcoming.
5.113 We have also carried out further desk based research on land values. A confidential schedule
can be provided to the Planning Inspectorate.
5.114 In terms of residential land values, we have accumulated a total of 46 residential land value
points from evidence from stakeholder consultation and representations, web-based research
and analysis of site specific EVA appraisals previously submitted to WODC. There is a
significant range in land values between £2.36 million per acre for a 0.5 acre plot down to
£115,000 per acre for 86 acres in Carterton depending on lot size, location and existing use.
5.115 We have analysed a subset of 12 schemes of less than 5 units where we have land value data
‘per plot’. This shows a range of plot prices between £47,000 per plot up to £350,000 per plot.
The average price is £153,000 per plot and the median is £132,500.
5.116 Similarly we have details of 9 smaller schemes of less than 1 acre. These smaller sites
command a higher land value ‘per acre’ than the large strategic sites. The values range from
£380,400 per acre to £2.36 million an acre – again, depending on lot size, location and existing
use.

© Aspinall Verdi Limited West Oxfordshire DC Local Plan and CIL Viability Study Final Report
February 2015
56
5.117 For larger sites the values are lower due to the quantum. Based on a sample of 23 points of
evidence, land values for larger sites range from £115,100 to £2,666,667 per acre with a
median of £227,700.
5.118 In terms of apartment schemes, we have evidence in the range of £41,500 - £76,000 per plot.
5.119 Rural Exception Sites are just that – exceptions. Therefore there is generally no other
alternative use value other than greenfield (agricultural, grazing or open space). As such land
values tend to be limited. The HCA viability toolkit for RES sites states that land values are
between £5,000 - £15,000 per plot (for both valuation terms and HCA grant purposes)43.
5.120 We have included RES plots in the appraisal model at £12,500 per plot. This is comparable
with a scheme at Bladon.
5.121 The benchmark Market Value and the TLV is set out on Appendix 1 for each typology. This
depends on the size and nature (e.g. greenfield or brownfield) of the typology. Note that we
have discounted the benchmark Market Values by 25% to arrive at the TLV following the best
practice in the Greater Norwich Development Partnership’s CIL Examiners report44 (see section
5 above). On brownfield sites we have also had regard to the EUV (Existing Use Value) for
secondary B2/B8 uses plus a premium to cross-check the TLV. We have based the TLV on a
price £ per acre basis, but show the price £ per plot to aid comparison.
Residential Density
5.122 The absolute TLV for any particular typology depends on the net developable site area that is
required for the construction the relevant scheme. This is on the basis that developer would not
attribute significant value to the ‘surplus’ land. The absolute TLV is therefore a function of
development density as well as TLV £ per hectare.
5.123 As noted previously the West Oxfordshire Design Guide (2006) suggests densities of 35-55 dph
will be appropriate in Medium density locations (e.g. the centres of most villages and small
towns in the District) and 40-75 dph in High density locations (e.g. the centres of the larger
settlements in the District generally formed by three and four storey buildings).45 Also, the
current adopted Local Plan (2011, Adopted 2006) requires residential development density of
30-50 dph46.
43 HCA & Scott Wilson Rural Housing Economic Viability Toolkit Stage 1 Report July 2010 paragraph 2.2.6 page 24 44 Report to the Greater Norwich Development Partnership – for Broadland District Council, Norwich City Council and South Norfolk Council, by Keith Holland BA (Hons) Dip TP, MRTPI ARICS, 4 December 2012, File Ref: PINS/G2625/429/6 – paragraph 9 45 West Oxfordshire Design Guide (2006) West Oxfordshire District Council 46 West Oxfordshire Local Plan (2011 – Adopted 2006) West Oxfordshire District Council page 81 paragraph 5.47

© Aspinall Verdi Limited West Oxfordshire DC Local Plan and CIL Viability Study Final Report
February 2015
57
5.124 During our previous research in the September 2013 EVA we noted that development density
in West Oxfordshire is low due to the high prevalence of smaller schemes taking place on
relatively large plots. We sought to reflect this in our viability model (e.g. by using plot values
rather than £/acre benchmarks) and by differentiating the density in the different housing zones.
However, we received representations during the consultation suggesting a simplified District-
wide density assumption would be preferable.
5.125 In particular we received one detailed representation which referred to general research which
that organisation has completed in respect of development densities. They have ‘analysed 18
residential sites designed by a range of developers with gross site areas ranging from 1.23 to
41.38 acres and with house numbers ranging from 11 to 372 dwellings. The range of densities
per net developable acre ranged from 10,582 to 15,851 ft per acre with an average density of
12,716 square feet per acre.’ (our emphasis). As noted above in respect of unit sizes, density
assumptions for planning policy and EVA’s are generally expressed in terms of ‘dwellings per
hectare’ (dph).
5.126 We received another representation stating that, ‘due to the administrative area, we believe a
density of between 30-35 dph should be adopted on all site typologies’.
Notwithstanding the above we have analysed a significant number of schemes across the
District (293) using mainly development monitoring data, but also data from other site specific
EVAs provided by the Council. Figure 5.24 below shows the distribution of the various scheme
densities.
Figure 5.24 – Development density sample distribution
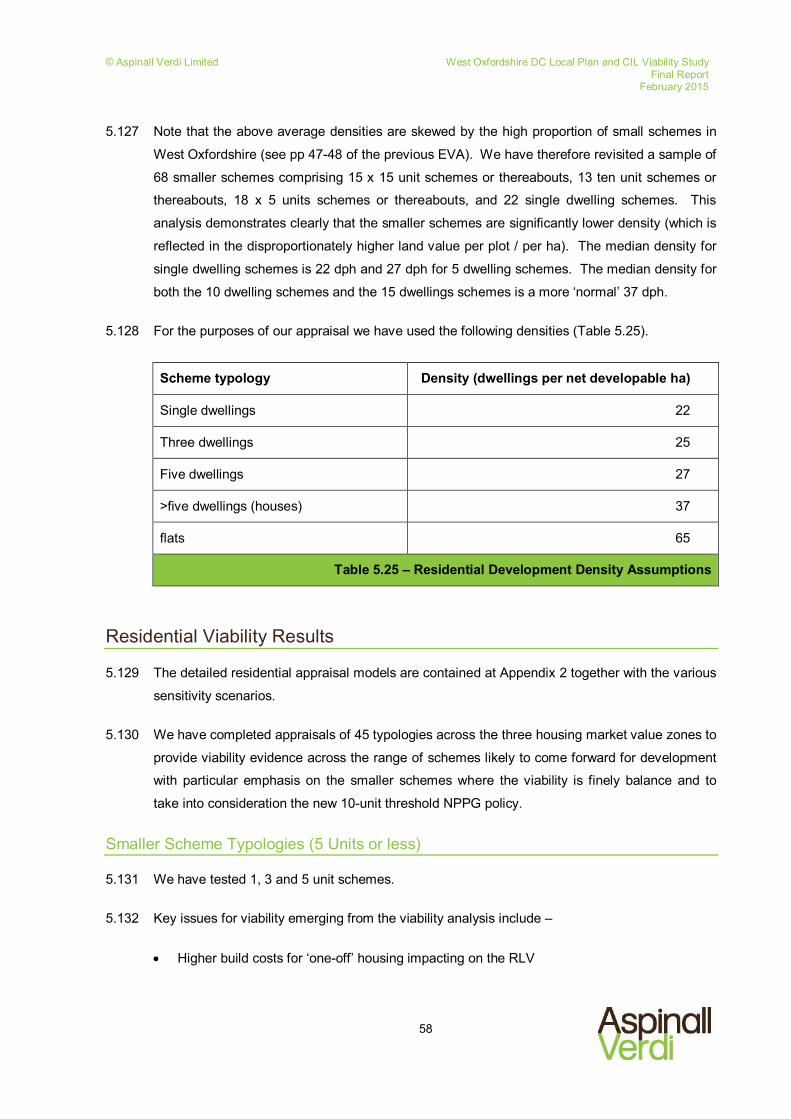
© Aspinall Verdi Limited West Oxfordshire DC Local Plan and CIL Viability Study Final Report
February 2015
58
5.127 Note that the above average densities are skewed by the high proportion of small schemes in
West Oxfordshire (see pp 47-48 of the previous EVA). We have therefore revisited a sample of
68 smaller schemes comprising 15 x 15 unit schemes or thereabouts, 13 ten unit schemes or
thereabouts, 18 x 5 units schemes or thereabouts, and 22 single dwelling schemes. This
analysis demonstrates clearly that the smaller schemes are significantly lower density (which is
reflected in the disproportionately higher land value per plot / per ha). The median density for
single dwelling schemes is 22 dph and 27 dph for 5 dwelling schemes. The median density for
both the 10 dwelling schemes and the 15 dwellings schemes is a more ‘normal’ 37 dph.
5.128 For the purposes of our appraisal we have used the following densities (Table 5.25).
Scheme typology Density (dwellings per net developable ha)
Single dwellings 22
Three dwellings 25
Five dwellings 27
>five dwellings (houses) 37
flats 65
Table 5.25 – Residential Development Density Assumptions
Residential Viability Results
5.129 The detailed residential appraisal models are contained at Appendix 2 together with the various
sensitivity scenarios.
5.130 We have completed appraisals of 45 typologies across the three housing market value zones to
provide viability evidence across the range of schemes likely to come forward for development
with particular emphasis on the smaller schemes where the viability is finely balance and to
take into consideration the new 10-unit threshold NPPG policy.
Smaller Scheme Typologies (5 Units or less)
5.131 We have tested 1, 3 and 5 unit schemes.
5.132 Key issues for viability emerging from the viability analysis include –
Higher build costs for ‘one-off’ housing impacting on the RLV

© Aspinall Verdi Limited West Oxfordshire DC Local Plan and CIL Viability Study Final Report
February 2015
59
Unit size assumptions which impact on GDV and hence the RLV
Lower site densities which require larger sites per plot and impacts (increases) the TLV
No affordable housing on sites of 5 units or less (as per national policy)
Affordable housing commuted sum on sites of 6 – 10 units in the AONB
Premium value assumptions for ‘exclusive’ homes (i.e. not estate housing) i.e. plus 10%
5.133 For schemes of 5 units or less, having regard to national policy, we have run the appraisals
excluding affordable housing (on-site and commuted sum). Our September 2013 included
affordable housing. This has a positive effect on viability for these smaller schemes.
5.134 It is important that the smaller schemes contribute to the infrastructure requirement across the
District. Many respondents to the previous consultation concurred with this but at that time we
recommend no CIL due to the requirement to obtain affordable housing contributions first. Due
to the changes to the NPPG it is not possible to obtain a commuted sum for affordable housing,
but the Council can still levy CIL. In this respect we have run the appraisals using £200 psm
(as previously in September 2013) on the small schemes where there is no affordable housing.
5.135 On this basis all the typologies are viable. The average viability buffer (i.e. the Surplus as a %
of TLV) is 71%. In the high value area the viability buffer is 83% compared to 53% in the
medium value area and 77% in the lower value areas. This is due to the different assumptions
in respect of unit sales values and TLV within the different value zones. In any event this is a
healthy viability buffer.
8 & 10 Unit Schemes
5.136 Similarly we have run appraisals for 8 and 10 unit schemes in order to test the impact of value
‘thresholds’ for affordable housing.
5.137 Key issues arising from these appraisals are that –
Affordable housing cannot be sought on sites of 10 units or less, except in the AONB where
an Affordable Housing commuted sum can be charged.
Density is assumed to be a constant.
The larger the scheme - the lower the TLV plot value due to quantum.
5.138 As above, where it is not possible to require Affordable Housing contributions, we have
assumed and tested a CIL rate of £200 psm. Where is it possible to require an Affordable
Housing commuted sum (i.e. within the AONB) we have split the CIL 50:50 into £100 psm for

© Aspinall Verdi Limited West Oxfordshire DC Local Plan and CIL Viability Study Final Report
February 2015
60
CIL and £100 psm Affordable Housing contribution. There is no impact on the viability (save for
minor impact on interest due to the timing of the payments) but this enables the Authority to
secure some contribution towards affordable housing from these sites.
5.139 On this basis all the typologies are viable. We calculate that the average viability buffer is 91%
for these sites. The average viability buffer for the sites in the high value area is 137%, 67% in
the medium value area and 45% in the lower value area (albeit this does not have any
commuted sum typologies as there is no part of the lower value area in the AONB). This is a
healthy viability buffer.
12 & 15 Unit Schemes
5.140 We have run appraisals for 12 and 15 unit schemes.
5.141 These schemes are above the 10-unit threshold and therefore there the Council is entitled to
seek a requirement for on-site affordable housing. This has been included explicitly in the
appraisals based on 50%, 40% and 35% in the high value, medium value and lower value
areas respectively.
5.142 Given the on-site provision of affordable housing and the associated impact on Gross
Development Value, we have tested the schemes based on a CIL rate of £100 psm which
again is shown explicitly in the appraisals.
5.143 It is important to note that as the Affordable Housing target increases, the quantum of private
housing (sqm) goes down, which reduces the total CIL £ as this is based on a £ psm rate. We
have tested this cumulative impact within our appraisals.
5.144 Again, all the typologies are viable. The average viability buffer is 54%. The viability buffer in
each of the housing value zones is: 80% high; 44% medium and 38% lower value areas. This is
a healthy viability buffer.
40 & 100 Unit Schemes
5.145 We have run appraisals for 40 and 100 unit schemes based on the same on-site affordable
housing (50%, 40% and 35%) and CIL assumptions (£100 psm).
5.146 It is important to note that these scheme typologies include an allowance of £10,000 per unit for
site specific S106/S278 to accommodate additional infrastructure requirements –
notwithstanding that much of the infrastructure could be funded by CIL (see Table 5.17 in
section 5) and/or external works allowances. This is to ensure that there is no ‘double-dipping’.
© Aspinall Verdi Limited West Oxfordshire DC Local Plan and CIL Viability Study Final Report
February 2015
61
5.147 Again, all the typologies are viable. The average viability buffer is 95%. The viability buffer in
each of the housing value zones is: 149% high; 86% medium and 50% lower value areas. This
is high due to the lower TLV for strategic greenfield sites which are the 100 unit typologies. The
viability buffer for the 40 unit typologies is 37%. Again this is an acceptable viability buffer.
Apartment Typologies
5.148 We have appraised a 15 unit apartment typology on previously developed brownfield land and
assuming a greenfield site.
5.149 It is important to note for these schemes that –
BCIS build costs are higher than for houses which impacts the RLV
The built floor area is greater than the sales area (net – to – gross ratio) due to the
corridors / circulation space which is not saleable area which impacts GDV and the RLV
The TLV is generally higher on brownfield sites (compared to say strategic greenfield sites)
due to the EUV
We have assumed a higher development density for brownfield sites (100 dph) compared
to greenfield sites (80 dph) which is reflected in the TLV.
5.150 On this basis the apartment schemes in the lower value area have a negative RLV i.e. not
viable. This is due to the above combination of bullet points above.
5.151 The apartment schemes in the medium value area have a positive RLV (i.e. viable) based on
the Affordable Housing policy target and £100 psm CIL. The greenfield typology shows a
significant viability buffer due to the significantly lower TLV and no requirements for site
clearance / demolition costs. The brownfield typology is marginally viable based on medium
zone values. Note that we have applied a consistent brownfield TLV across all housing market
zones and one would anticipate lower EUV/TLV in the medium and lower value areas.
5.152 The apartment schemes in the high value area are also viable based on the Affordable Housing
policy target and £100 psm CIL. Both the greenfield and the brownfield typologies show a
substantial viability buffer over the TLV.

© Aspinall Verdi Limited West Oxfordshire DC Local Plan and CIL Viability Study Final Report
February 2015
62
RES Sites
5.153 We have appraised two generic Rural Exceptions Site (RES) schemes – 3 units and 5 units.
5.154 These are based on –
100% affordable housing – i.e. they are ‘exceptions’ – this has a significant impact on the
GDV and the RLV
£12,500 per plot TLV
Substantial grant funding in order to cover the costs of construction
5.155 Accordingly, these sites are not viable for CIL.
5.156 We have calculated the amount of subsidy which would be required to make the scheme
typologies viable (£84,000). We appreciate that this may not be fundable given the emphasis by
the Homes and Communities Agency on reducing the reliance on grants. The trend has been
for diminishing levels of grant availability and this trend is expected to continue in future.
Subsidy is a complex area as Registered Providers may choose to subsidise schemes by
'blending' grant from across their programme.
5.157 The NPPF specifically states that 'local planning authorities should be responsive to local
circumstances, and consider whether allowing some market housing would facilitate the
provision of rural exception sites to meet local needs' 47
5.158 This is an option for consideration, however, the danger with the above policy of allowing
private housing on rural exceptions sites is that landowners will inevitably think that they can
charge more for the land i.e. the threshold land value will go up. The landowner will not
necessarily appreciate that the private market housing is to subsidise the affordable housing -
they will want their uplift in value particularly in comparison with allocated sites.
47 Department of Communities and Local Government (March 2012) The National Planning Policy Framework ISBN: 978-1-4098-3413-7 paragraph 54.

© Aspinall Verdi Limited West Oxfordshire DC Local Plan and CIL Viability Study Final Report
February 2015
63
Results Summary
5.159 A summary of the above is set out on the following table (Table 5.26):
Table 5.26 – Residential Results Summary

© Aspinall Verdi Limited West Oxfordshire DC Local Plan and CIL Viability Study Final Report
February 2015
64
6 Supported Living
6.1 This section deals with all aspects of supported living e.g. sheltered housing, extra-care,
residential and nursing homes. Much of the updated market analysis and commentary on the
private residential market is equally as applicable to supported living. We draw your attention to
the definitions of supported living and general market context contained within the September
2013 EVA report.
6.2 Consistent with national trends, West Oxfordshire has an ageing population. The latest
demographics from the Councils Focussed Housing Consultation paper (July 2014)48 confirm
that West Oxfordshire has the highest population of people aged 55 and over in Oxfordshire. In
West Oxfordshire the proportion of people aged 55+ is projected to increase by 54% with a
particularly high increase in the proportion of people aged 85+ (160%).
Supported Living Typologies
6.3 We noted previously (September 2013 EVA) the specific differences between the supported
living and general needs development typologies and the specific viability challenges that
supported living operators must overcome.
6.4 Since then, Knight Frank have published a research report, Retirement Housing 2014, which
highlights the weakness of treating supported living in the same planning use category as
general needs housing (C3). The report advocates treating supported living typologies
differently to general needs such that developers can “make the development finance add up
when the affordable housing requirements are added into the mix”.
6.5 Our approach has always been to consider supported living as a separate typology which is
consistent with the Knight Frank recommendations. In addition we received no consultation
representations to the Affordable Housing consultation and PDCS from the supported living
providers.
6.6 We were previously provided with evidence from the Retirement Housing Group who has
provided a paper on Retirement Housing Viability Base Data49. We have supplemented this
evidence with more recent evidence from McCarthy and Stone Retirement Living50. This
incorporates a series of parameters to appraise supported living schemes which we have
applied. These are as follows (Table 6.1):
48 West Oxfordshire District Council, Local Plan – Housing Consultation (July 2014) – pp 90-91 49 RHG Retirement Housing Group, Retirement Housing Viability Base Data (April 2013). Note that at the time of finalising our report we also received a further Briefing Paper for CIL Practitioners Retirement Housing and the Community Infrastructure Levy (June 2013) by Churchill Retirement Living and McCarthy and Stone to which we have had regard 50 Examination Statement for the Stratford on Avon Council Core Strategy, December 2014

© Aspinall Verdi Limited West Oxfordshire DC Local Plan and CIL Viability Study Final Report
February 2015
65
Sheltered Housing Extra-Care Housing (ECH)
No. of units 55 45
Development Density (dph) 110 100
1 Bed unit size (sqm) 50 60
2 Bed unit size (sqm) 75 80
Non-chargeable communal space (net-to-gross)
75% 65%
Table 6.1 – Sheltered Housing and ECH Typology Parameters
6.7 Our supported living typologies are set out on the matrix at Appendix 1.
Open Market Values
6.8 We were previously provided with evidence from the Retirement Housing Group who has
provided a paper on Retirement Housing Viability Base Data51. This recommends that
supported living sales values are a premium to private residential apartments as follows:
Sheltered housing unit prices - 10-15% premium to private market
Extra-care housing unit prices - 25% premium to private market
6.9 We have subsequently (July 2014) been provided with additional sales values evidence for
three sheltered housing schemes in the surrounding areas. This provides a breakdown of sales
achieved, a summary of which is set out below (Table 6.2).
51 RHG Retirement Housing Group, Retirement Housing Viability Base Data (April 2013). Note that at the time of finalising our report we also received a further Briefing Paper for CIL Practitioners Retirement Housing and the Community Infrastructure Levy (June 2013) by Churchill Retirement Living and McCarthy and Stone to which we have had regard

© Aspinall Verdi Limited West Oxfordshire DC Local Plan and CIL Viability Study Final Report
February 2015
66
1 Bed units - 2 Bed units -
No. sold Average price psm No. sold Average price
psm
Scheme 1 11 £4,159 13 £3,871
Scheme 2 no data no data 2 £3,273
Scheme 3 21 £4,251 5 £4,441
Total/Average 32 £4,219 20 £3,626
Table 6.2 – Achieved Sheltered Housing Sales Values (July 2014)
6.10 The above sales values broadly correspond with our “medium” value zone and we are therefore
satisfied with the above premiums to general needs apartments. Note that to achieve the
above sales one would expect 40-50% of the sales to be in the first year followed by 30% in the
second year and the balance in the third year. We have reflected this in our appraisals.
Gross Development Value
6.11 The gross development value is shown explicitly on the development appraisals (Appendix 3).
6.12 This is a function of: the number and mix of units, the Market Value of the units and any grant.
Development Costs
6.13 The development costs are shown explicitly on the development appraisals (Appendix 3). They
follow a similar format as the residential appraisals (see section 5 above), but the main
differences are highlighted below.
Initial Payments (S106 & CIL)
6.14 We understand that whilst affordable housing is generally applicable on these types of
schemes, the developers will generally negotiate this on a viability basis and pay a commuted
sum. This is because there are often high estate management charges in these types of
schemes and it is not viable for the service charge on the private units to cross-subsidise the
service charge for affordable units.

© Aspinall Verdi Limited West Oxfordshire DC Local Plan and CIL Viability Study Final Report
February 2015
67
6.15 In addition to testing the on-site Affordable Housing target we have tested the equivalent
commuted sum (£ psm) in addition to any CIL. This is shown within the Initial Payments
section of the appraisals and on the sensitivity tables.
Demolition and Site Clearance
6.16 For the purposes of our EVA we have assumed that the supported living typologies are
generally brownfield typologies, based on the redevelopment of sites within the town centres
where the providers perceive the occupier demand.
6.17 We have therefore included an allowance of £50,000 per acre for site clearance and
demolitions as per the residential typologies.
Construction Costs
6.18 The construction costs adopted for our September 2013 EVA were (Table 6.3):
Use BCIS £ psm52
Sheltered Housing £1,083 (£99453 + 9%)
Extra Care Housing £1,123 (£994 + 13%)
Table 6.3 – Construction Cost Assumptions (BCIS) (September 2013)
6.19 These construction costs were initially consulted upon during the April 2013 stakeholder
workshop. As you can see there is a 4% premium (13%-9%) for Extra Care Housing over
Sheltered Housing.
6.20 We have updated these costs based on the BCIS cost indices rebased for West Oxfordshire
within the last 5 years (accessed website 28 October 2014).
6.21 The relevant results are as follows (Table 6.4).
52 based on the BCIS cost indices rebased for Oxfordshire (accessed website 24 April 2013). 53 The build rates for Sheltered Housing and Extra Care Housing are based on the ‘Sheltered Housing’ BCIS category +9% for sheltered housing and +13% based on evidence received from RHG – Retirement Housing Group

© Aspinall Verdi Limited West Oxfordshire DC Local Plan and CIL Viability Study Final Report
February 2015
68
Type Mean Lowest Lower quartiles
Median* Upper quartiles
Highest Sample [size]
Flats (apartments) – generally (for comparison)
1,320 629 1,121 1,271 1,482 3,372 254
Sheltered housing generally
1,358 665 1,165 1,318 1,453 2,851 56
Extra care housing (+4% over Sheltered housing)
1,371
Table 6.4 – Construction Cost Assumptions (2014) £psm gross internal floor area (BCIS - 26 October 2014)
6.22 We have used the Median construction cost figures in our EVA modelling.
Other Costs
6.23 Other appraisal costs are the same as for the residential typologies (see section 5) and the
appraisals appended (Appendix 3).
Residual Land Value
6.24 The gross Residual Land Value (RLV) is the product of the above values and costs (see Figure
4.2) and the net RLV takes into consideration the usual site acquisition costs (see section 5
above).
Supported Living TLV
6.25 As previously we have sought to triangulate the Threshold Land Value for supported living
developments.
6.26 The benchmark Market Value and the TLV is set out on Appendix 1 for each typology. This is
set by reference to residential land values (albeit that these schemes tend to be significantly
denser than private residential schemes) subject to a minimum of benchmark land value for
industrial EUV given the hypothetical brownfield typology scenarios.
6.27 We have based the TLV on a price £ per acre basis, but show the price £ per plot to aid
comparison.

© Aspinall Verdi Limited West Oxfordshire DC Local Plan and CIL Viability Study Final Report
February 2015
69
6.28 Note that land values per plot are relatively low due to the high development density of these
typologies. The price per acre is comparable to the TLV assumed for the 40 unit residential
schemes.
6.29 Note that we have not appraised Residential and Nursing home schemes are these are valued
on a profits or investment basis which is subject to significant variance.
Supported Living Viability Results
6.30 We have tested both Sheltered Housing and Extra-Care typologies in the high, medium and
lower value zones.
6.31 Key viability issues for these typologies include –
The high net-to-gross ratio compared to C3 apartment typologies which reduces the
saleable area
The larger unit sizes which reduces the number of units that can be accommodated within
a particular sales area
The higher build cost based on the gross area an BCIS data
The high development density which reduces the quantum of land assumed and therefore
the TLV, but not by enough to off-set the above costs
The availability of grant – our appraisals assume no grant.
6.32 Our analysis shows that neither Sheltered Housing nor Extra-Care Housing (ECH) is viable in
the lower value zone, based on a brownfield typology. Additional analysis shows that Sheltered
Housing could be marginally viable on greenfield sites, but not sufficiently so to contribute
meaningfully to CIL or affordable housing and retain a viability buffer.
6.33 Similarly both Sheltered Housing and ECH are not viable at the policy target levels in the
medium value area. However, we calculate that Sheltered Housing is viable with 10% on-site
affordable housing (£50 psm commuted sum) including £100 psm CIL. ECH is not viable
based on brownfield typologies even at reduced requirements and marginally viable on
greenfield sites (but again not sufficiently so to contribute meaningfully to CIL or affordable
housing and retain a viability buffer).
6.34 In the high value area the Sheltered Housing is viable based on reduced Affordable Housing
target to 30% (or £375 psm commuted sum) - including £100 psm CIL.

© Aspinall Verdi Limited West Oxfordshire DC Local Plan and CIL Viability Study Final Report
February 2015
70
6.35 ECH is still not viable at the policy targets in the high value area. We calculate that viability
returns (including a suitable buffer) at 10% on-site affordable housing (or £50 psm commuted
sum) and £100 psm CIL.
6.36 A summary of this is set out on the following table (Table 6.5)
Table 6.5 – Supported Living Results Summary

© Aspinall Verdi Limited West Oxfordshire DC Local Plan and CIL Viability Study Final Report
February 2015
71
7 Commercial Uses
7.1 This section deals with all the B use classes (B1 offices, B2 industrial and B8 distribution).
Commercial Typologies
7.2 Our commercial typologies are based on detailed development monitoring and property market
analysis contained within our previous EVA (September 2103).
7.3 We received no representations in respect of the commercial property typologies during the CIL
PDCS consultation and having carried out an update of the market in terms of values (see
below) there is no reason to change the commercial typologies. These are set out on the table
in in Appendix 1.
Commercial Property Values
7.4 We previously carried out comprehensive property market research and analysis in summer
2013 and this summary should be read in conjunction with our previous report (September
2013).
7.5 As part of this update, we have reviewed transactions for commercial property over the period
September 2008 to September 2014.
Offices
7.6 There is a wide variation in rents across the district from a wide variation in stock and locations.
Average rents were £11.80 psf in September 2013 for offices ranging between £4.13 psf for the
poorest stock to £30.30 psf for the best. Similarly there was a wide variation in letting sizes up
to 7,000 sqft (650 sqm) and more typically 2,000 sqft (185 sqm).
7.7 Over the reviewed period (September 2008 – 2014) 411,475 sqft of office floorspace was
transacted across 132 units in West Oxfordshire (source EGi). Figure 7.1 shows the units in
highest demand were those sized between 1,001 and 2,500 sqft (53 units), followed by those in
the sub 1,000 sqft category (39 units).
7.8 The average rents paid by occupiers over this period were £14.30 psf, with a range of £3.60 psf
for lower grade offices to £30.30 psf for high quality stock. The average yield over this period
was 8%, whilst the average lease length agreed by occupiers was 5 years.

© Aspinall Verdi Limited West Oxfordshire DC Local Plan and CIL Viability Study Final Report
February 2015
72
Figure 7.1 – Office Deals September 2008 to September 2014 (EGi)
7.9 Analysis of the West Oxfordshire Property Register (June 2014) identifies 51 office properties
on the market. Of these properties the average size was 1,423 sqft (132 sqm) ranging between
95 sqft – 6,798 sqft (9 sqm – 631 sqm).
7.10 The median rents quoted for offices were circa £14.00 psf for second-hand stock across the
district up to a maximum quoting rent of £24.00 psf (second floor office suite on Witney High
Street). More typically quoting rents for Witney range between £12.00 - £18.00 psf.
7.11 Further analysis of the West Oxfordshire Property Register shows that capital values for office
accommodation range between £96 psf - £173 psf capital value.
7.12 This implies an all risks yield of 12.5% which represents the nature of the stock and the
covenant strength.
Industrial
7.13 Industrial rents were equally as variable and were typically £5.35 psf (£3 - £8 psf range) (source
EGi Town Report) (September 2013).
7.14 Over the reviewed period (2008 – 2014) 2,441,922 sqft of industrial floorspace was transacted
across 119 units in West Oxfordshire (source EGi). Figure 7.2 below demonstrates that the unit
in highest demand over this period were sized between 2,501 to 5,000 sqft (40 units), followed
0
10
20
30
40
50
60
0
20,000
40,000
60,000
80,000
100,000
120,000
140,000
160,000
0 - 1000 sqft 1,001 -2,500 sqft
2,501 -5,000 sqft
5,001 -10,000 sqft
10,001 -50,000 sqft
Uni
ts
Sqft
Total Sqft
Total Units

© Aspinall Verdi Limited West Oxfordshire DC Local Plan and CIL Viability Study Final Report
February 2015
73
by 5,001 to 10,000 sqft (31 transactions). Average rents paid by occupiers over this period were
£5.80 with average lease lengths of 5 years. The average yield for industrial property over this
period was 8.5%. The largest transaction was an investment sale for Windrush Industrial Estate
sized 1,728,940 sqft.
Figure 7.2 – Industrial Deals September 2008 to September 2014 (EGi)
7.15 Again, analysis of the West Oxfordshire Property Register (June 2014) identifies 16 industrial
and commercial properties on the market. Of these properties the average size was 3,892 sqft
(362 sqm) ranging between 300 sqft – 8,548 sqft (28 sqm – 794 sqm).
7.16 Rents quoted for industrial accommodation were generally circa £6.95 psf for new floorsapce
with a range of £5.50 psf (for typical second hand space) up to £12 psf for a modern industrial
unit in an established location.
7.17 Further analysis of the West Oxfordshire Property Register shows that capital values for
industrial accommodation range between £47 psf - £78 psf capital value.
7.18 This implies an all risks yield of 11.5-15%.
0
5
10
15
20
25
30
35
40
45
0
200,000
400,000
600,000
800,000
1,000,000
1,200,000
1,400,000
1,600,000
1,800,000
2,000,000
0 - 1,000sqft
1,001 -2,500sqft
2,501 -5,000sqft
5,001 -10,000
sqft
10,001 -20,000
sqft
20,001 -50,000
sqft
50,000sqft +
Uni
ts
Sqft
Total Sqft
Total Units
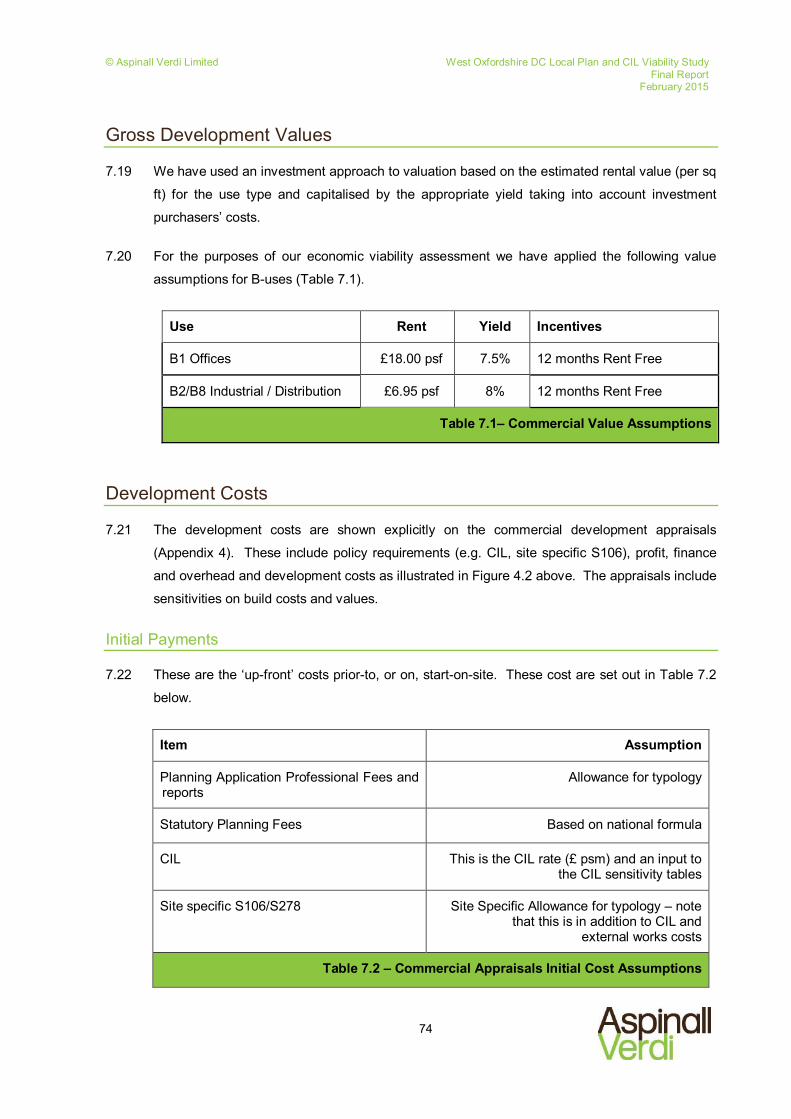
© Aspinall Verdi Limited West Oxfordshire DC Local Plan and CIL Viability Study Final Report
February 2015
74
Gross Development Values
7.19 We have used an investment approach to valuation based on the estimated rental value (per sq
ft) for the use type and capitalised by the appropriate yield taking into account investment
purchasers’ costs.
7.20 For the purposes of our economic viability assessment we have applied the following value
assumptions for B-uses (Table 7.1).
Use Rent Yield Incentives
B1 Offices £18.00 psf 7.5% 12 months Rent Free
B2/B8 Industrial / Distribution £6.95 psf 8% 12 months Rent Free
Table 7.1– Commercial Value Assumptions
Development Costs
7.21 The development costs are shown explicitly on the commercial development appraisals
(Appendix 4). These include policy requirements (e.g. CIL, site specific S106), profit, finance
and overhead and development costs as illustrated in Figure 4.2 above. The appraisals include
sensitivities on build costs and values.
Initial Payments
7.22 These are the ‘up-front’ costs prior-to, or on, start-on-site. These cost are set out in Table 7.2
below.
Item Assumption
Planning Application Professional Fees and reports
Allowance for typology
Statutory Planning Fees Based on national formula
CIL This is the CIL rate (£ psm) and an input to the CIL sensitivity tables
Site specific S106/S278 Site Specific Allowance for typology – note that this is in addition to CIL and
external works costs
Table 7.2 – Commercial Appraisals Initial Cost Assumptions
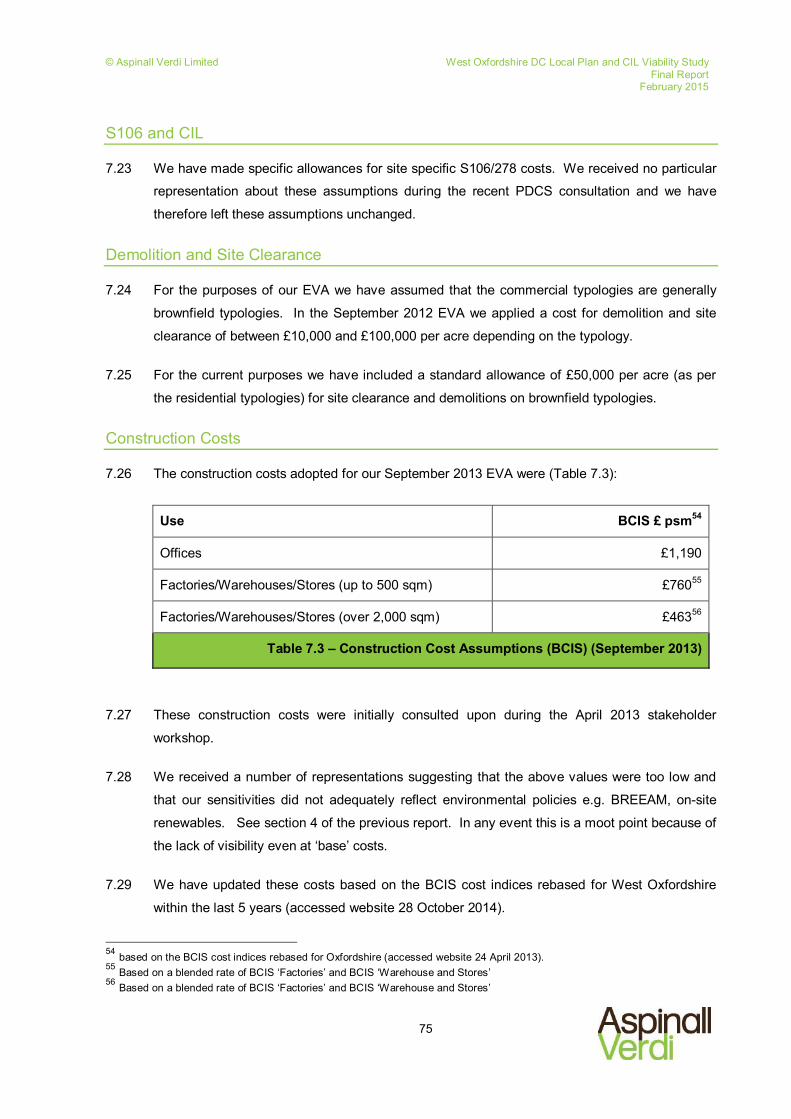
© Aspinall Verdi Limited West Oxfordshire DC Local Plan and CIL Viability Study Final Report
February 2015
75
S106 and CIL
7.23 We have made specific allowances for site specific S106/278 costs. We received no particular
representation about these assumptions during the recent PDCS consultation and we have
therefore left these assumptions unchanged.
Demolition and Site Clearance
7.24 For the purposes of our EVA we have assumed that the commercial typologies are generally
brownfield typologies. In the September 2012 EVA we applied a cost for demolition and site
clearance of between £10,000 and £100,000 per acre depending on the typology.
7.25 For the current purposes we have included a standard allowance of £50,000 per acre (as per
the residential typologies) for site clearance and demolitions on brownfield typologies.
Construction Costs
7.26 The construction costs adopted for our September 2013 EVA were (Table 7.3):
Use BCIS £ psm54
Offices £1,190
Factories/Warehouses/Stores (up to 500 sqm) £76055
Factories/Warehouses/Stores (over 2,000 sqm) £46356
Table 7.3 – Construction Cost Assumptions (BCIS) (September 2013)
7.27 These construction costs were initially consulted upon during the April 2013 stakeholder
workshop.
7.28 We received a number of representations suggesting that the above values were too low and
that our sensitivities did not adequately reflect environmental policies e.g. BREEAM, on-site
renewables. See section 4 of the previous report. In any event this is a moot point because of
the lack of visibility even at ‘base’ costs.
7.29 We have updated these costs based on the BCIS cost indices rebased for West Oxfordshire
within the last 5 years (accessed website 28 October 2014).
54 based on the BCIS cost indices rebased for Oxfordshire (accessed website 24 April 2013). 55 Based on a blended rate of BCIS ‘Factories’ and BCIS ‘Warehouse and Stores’ 56 Based on a blended rate of BCIS ‘Factories’ and BCIS ‘Warehouse and Stores’

© Aspinall Verdi Limited West Oxfordshire DC Local Plan and CIL Viability Study Final Report
February 2015
76
7.30 The relevant results are as follows (Table 7.4).
Type Mean Lowest Lower quartiles
Median Upper quartiles
Highest Sample [size]
Purpose built factories - generally
1,148 208 397 747 1,770 3,280 12
Purpose warehouses/stores - generally
1,112 403 485 680 1,291 3,610 12
Average 714
Offices - generally 1,658 948 1,179 1,630 1,997 2,633 13
Table 7.4 – Construction Cost Assumptions (2014) £psm gross internal floor area (BCIS - 26 October 2014)
7.31 We have used the Median construction cost figures in our EVA modelling.
External Works
7.32 External works costs are set at 10% for commercial typologies. We received no particular
representation about these assumptions during the recent PDCS consultation and we have
therefore left these assumptions unchanged.
Contingency
7.33 As previously, this is set at 5%. This has been generally accepted.
Professional Fees
7.34 Within our previous EVA (September 2013) we included an allowance of 10% for professional
fees. We received no particular representation about these assumptions during the recent
PDCS consultation and we have therefore left these assumptions unchanged.
Disposal Costs
7.35 Disposal costs are included based on 1% sale agents, 0.5% sales legal fees, 15% joint letting
agency fees, 5% letting legal fees and 1% marketing and promotion.

© Aspinall Verdi Limited West Oxfordshire DC Local Plan and CIL Viability Study Final Report
February 2015
77
7.36 Few respondents to the previous EVA consultation queried these allowances. We received no
particular representation about these assumptions during the recent PDCS consultation and we
have therefore left these assumptions unchanged.
Finance Costs
7.37 Within our previous EVA we assumed interest at 7%, plus a 1% finance fee. Again, this is
unchanged.
Developers Profit
7.38 Within our previous EVA we assumed developers profit at 20% of the total costs. We received
no particular representation about these assumptions during the recent PDCS consultation and
we have therefore left these assumptions unchanged.
Residual Land Value
7.39 The gross Residual Land Value (RLV) is the product of the above values and costs (see Figure
4.2) and the net RLV takes into consideration the usual site acquisition costs (see section 5
above).
Commercial Uses TLV
7.40 We have sought to establish the Threshold Land Value (TLV) for B-use classes from a variety
of sources including consultation with local agents and other stakeholders.
7.41 As part of this update we have not found any evidence to move the industrial TLV assumptions
from the September 2013 levels. We received no stakeholder representations in this respect
during the PDCS consultation.
7.42 Benchmark Market Values range from £150,000 per acres (quoted) for previously undeveloped
sites to £600,000 per acres (quoted) for ‘prime’ sites at Witney with outline planning permission
for B1, B2 and B8 uses.
7.43 Stakeholder consultation would suggest that typically industrial land has a value in the range of
£300,000 - £425,000 per acre. For the purposes of our EVA we have adopted £300,000 per
acre TLV which equates to £400,000 per acre benchmark land value before the 25% discount
© Aspinall Verdi Limited West Oxfordshire DC Local Plan and CIL Viability Study Final Report
February 2015
78
(following the best practice in the Greater Norwich Development Partnership’s CIL Examiners
report57 (see section 5 above)).
7.44 Notwithstanding the use of this lower level, the EVA demonstrates that commercial
development is still not viable – see below.
Commercial Viability Results
7.45 The results of the viability appraisals (Appendix 4) show that it is not viable to charge CIL on
commercial (B) uses. This is due to a number of reasons including -
Low headline rents and weak yields compounded by the rent free period required
High build costs and cumulative fees, payments etc
Higher interest charges due to the cash ‘all out’ before the GDV is realised after a void
period
Developers profit required for speculative development.
7.46 In all cases the CIL is therefore £0 psm.
57 Report to the Greater Norwich Development Partnership – for Broadland District Council, Norwich City Council and South Norfolk Council, by Keith Holland BA (Hons) Dip TP, MRTPI ARICS, 4 December 2012, File Ref: PINS/G2625/429/6 – paragraph 9

© Aspinall Verdi Limited West Oxfordshire DC Local Plan and CIL Viability Study Final Report
February 2015
79
8 Retail
8.1 This section deals with all the A use classes.
8.2 We received a small number of representations during the PDCS consultation which we have
sought to address. The PDCS feedback was mainly in respect of the following areas:
‘The development of any new retail floor space in the town centres and what this might
comprise in terms of re-provision of car-parking - whether multi-storey or basement.
How supermarkets will be treated if delivered within a town centre. Supermarkets in town
centres are unlikely to come forward in isolation and will be delivered as extensions to
existing stores, or as part of a larger town centre scheme. Therefore clarity is required as
to whether a supermarket be delivered within a town centre would be charged the town
centre retail rate, as opposed to a rate applicable for standalone supermarket
developments outside town centres.
What is meant by a 'District Centre' and how this compares with 'Town Centres'. [In the
interests of clarity we only refer to ‘Town Centres’ within this report]
The definition of 'Shops' and whether this is intended to include the use class A1 only.
Concern that the suggested [supermarket CIL] charge will have a significant adverse
impact on the overall viability of future retail development in West Oxfordshire. It is
considered that a balance has not been found between infrastructure funding requirements
and viability [albeit the representor has provided no financial evidence].
That the charge rate of £160/m2 on all retail uses outside the town centres will dissuade
local initiatives to create shops. This is in direct conflict with the NPPF, the Local Plan and
the need to promote sustainable development within the rural areas. It is considered that
small shops should be exempt from this charge in order to promote local services and
businesses which will serve and support new households across the District.
We urge the Council to … prepare a draft instalment policy, as managing cash flow during
development is often key in determining whether a scheme will be successfully delivered.
The UK government has not applied for a block exemption for CIL. CIL charges do not
form part of the UK's taxation system and there does not appear to be an exemption in
place to cover any State Aid issues that may arise. With this in mind, we would be grateful
if the Council adopted a flat levy rate for comparable sectors of the economy/use classes
or, if it is not prepared to do so, providing an explanation as to why State Aid issues are not
engaged by the setting of differential rates within use classes to the Inspector at Inquiry.’
© Aspinall Verdi Limited West Oxfordshire DC Local Plan and CIL Viability Study Final Report
February 2015
80
Retail Typologies
8.3 Our retail typologies are based on detailed development monitoring and property market
analysis contained within our previous EVA (September 2103).
8.4 We are not aware of any specific retail development proposals other than an Aldi development
at Chipping Norton.
8.5 Over recent years supermarkets have been investing in small-store growth. Despite the amount
of floorspace at the pre-planning consent stage in the grocery pipeline falling over the last year
from circa 18.5m sqft to 15.2m sqft, the amount of new store proposals as continued to rise.
The average size of store proposal is falling due to a sharp reduction in the number of
hypermarkets coming into the development pipeline. The reason for the shift to smaller stores is
in part a response to changing consumer shopping patterns, with the increase of basket and
internet shopping, but also because they require less capital expenditure to deliver, have less
impact on trade of existing stores and are easier to secure planning58.
8.6 Discount Aldi and Lidl are continuing to gain market share; the two stores have added 779
additional stores since 1998. The discounters will continue to chip away at the big-5 with their
continuing aggressive expansion59. In this instance we refer to the current Tesco accounts
issue in the press, where Deloitte identified executives were pulling forward payments in order
to paint a more flattering picture of the supermarket’s finances60.
8.7 As you can see the supermarket sector is rapidly changing and we set out below the typical
requirements of the major operators from AspinallVerdi’s 2014 database of retailer
requirements (Table 8.1).
58 CBRE Supermarkets Invest in Small-Store Growth August 2014 59 CBRE Supermarkets Invest in Small-Store Growth August 2014 60 The Guardian Criminal Investigation Launched into Tesco’s Accounting 29 October 2014

© Aspinall Verdi Limited West Oxfordshire DC Local Plan and CIL Viability Study Final Report
February 2015
81
Retailer Min Max Site Area
(sqft) (sqm) (sqft) (sqm)
Aldi - 14,600 1,400 Min 1 acre
Lidl 8,000 700 19,000 1,800 0.8
Asda 6,500 600 20,000 1,900 Min 0.6 acre
Budgens 2,500 200 10,000 900 -
Co-op 1,500 100 6,000 600 -
Waitrose Local 3,000 300 6,000 600 -
Sainsbury’s 2,500 200 9,500 900 -
Tesco 3,000 300 8,000 700 -
Morrisons 3,000 300 70,000 6,500 -
Table 8.1 – Convenience Retailer Requirements (AVL, 2014)
8.8 As mentioned above we received a number of representations seeking further clarifications on
the proposed retail CIL rates. We have therefore updated the retail typologies to provide the
necessary clarification and to take into consideration the current retail environment.
8.9 As can be seen from the above the current convenience retailer requirements are mainly at the
smaller end. The typical minimum size for the smaller local stores is between 100 – 300 sqm
with an average of 233 sqm and median of 250 sqm. We previously (September 2103)
appraised stores of 280 sqm and there were no representations on this typology.
8.10 All the convenience retailers operate mid-sizes stores of between 600-900 sqm. In this respect
the average size is 714 sqm and the median 700 sqm. We did not appraise this size store
previously and we have done so in this 2014 update at 700 sqm.
8.11 As discussed above there is an emerging ‘discount’ sector with store size of between 1,400 –
1,900 sqm (max) e.g. Aldi, Lidl, Asda (previously Netto). In this sector the average size is
1,700 sqm and the median size is 1,800 sqm. We have therefore appraised a ‘discount’ store
format at 1,700 sqm for this 2014 update.
8.12 We previously appraised a ‘large’ format supermarket at 5,000 sqm and we have updated this
for completeness. Similarly for retail warehouses.

© Aspinall Verdi Limited West Oxfordshire DC Local Plan and CIL Viability Study Final Report
February 2015
82
8.13 Finally, we have sought to clarify the town centre developments. We have appraised
predominantly single-storey free standing retail stores/warehouse with surface car parking in
the defined town centres and other brownfield locations (e.g. edge of centre, local centres) and
greenfield/SDA locations. In addition, and for completeness, we have appraised a hypothetical
high density multi-storey town centre retail development (for example the intensification of
development by, say, building a MSCP and two storey retail on existing surface car parks).
8.14 The revised retail typologies are set out on the table in Appendix 1.
Gross Development Values
8.15 The Colliers Midsummer Retail Report (2014) provides an overview of the UK retail market. All
retail rents increased 0.1% in Q1 2014, which ended 11 consecutive quarters of decline and
provides further evidence that conditions in the retail market are stabilising. Retail development
across the UK is increasing; there are new schemes being built and others seem certain to
follow. As noted above, the foodstore revolution is driving new out of town development as
maturing discount operators look for new outlets. It is notable that online retail spending grew
by 11% to over £36bn in 2013; however its annual rate of increase is now slowing61.
8.16 Further retail market commentary is contained within our previous EVA (September 2013) and
we have updated the chart (Figure 8.2) of prime retail rents in Witney.
Figure 8.2 – Prime In Town Retail Rents (i.e. Witney) (EGi Town Report (2014))
61 Colliers Midsummer Retail Report Coming up for Air 2014
£0£10£20£30£40£50£60£70£80£90
Zone
A R
ent (
£psf
)
Year - Figures published every June

© Aspinall Verdi Limited West Oxfordshire DC Local Plan and CIL Viability Study Final Report
February 2015
83
8.17 We have used an investment approach to valuation based on the estimated rental value (per sq
ft) for the use type and capitalised by the appropriate yield taking into account investment
purchasers’ costs.
8.18 Table 8.3 below sets out our commercial valuation assumptions for retail.
Use Rent Yield Incentives
Small Convenience Retail Parade
£17.50 psf (£188.37 psm) 6.5% 6 months rent free including fitting-out
Supermarket £21.00 psf (£223.48 psm) 5.25% 12 months rent free including fitting-out
Retail Warehouse £18.00 psf (£193.75 psm) 6.5% 12 months rent free including fitting-out
Town Centre Shopping Centre
£28.00 psf (£301.39 psm) 6.5% 24 months rent free including fitting-out
Table 8.3 – Retail Value Assumptions (2014)
Development Costs
8.19 These are generally the same as for the commercial typologies above (see section 7).
Initial Payments
8.20 We have incorporated site specific S106/S278 contributions commensurate with the scale of
each typology.
8.21 See comments above (section 7).
Construction Costs
8.22 The construction costs adopted for our September 2013 EVA were (Table 8.4):

© Aspinall Verdi Limited West Oxfordshire DC Local Plan and CIL Viability Study Final Report
February 2015
84
Use BCIS £ psm62
Shops £689
Supermarkets (1,000 – 7,000 sqm) £1,146
Retail warehouses £523
Table 8.4 – Construction Cost Assumptions (BCIS) (September 2013)
8.23 These construction costs were initially consulted upon during the April 2013 stakeholder
workshop.
8.24 We received a number of representations suggesting that the above values were too low and
that our sensitivities did not adequately reflect environmental policies e.g. BREEAM, on-site
renewables. Notwithstanding this we have used the latest BICS costs and included an
adequate viability buffer when setting the CIL rate. We have updated these costs based on the
BCIS cost indices rebased for Oxfordshire (accessed website 28 October 2014).
8.25 The relevant results are as follows (Table 8.5).
Type Mean Lowest Lower quartiles
Median Upper quartiles
Highest Sample [size]
Retail warehouses - generally 780 382 586 687 856 2,277 40
Hypermarkets, supermarkets - generally
1,798 1,086 - 1,962 - 2,181 4
Shops - generally 1,457 635 837 1,154 1,774 3,468 10
Table 8.5 – Construction Cost Assumptions (2014) £psm gross internal floor area (BCIS - 26 October 2014)
8.26 We have used the Median construction cost figures in our EVA modelling
8.27 Note that the high density multi-storey town centre retail development typology – Scheme 9
(see 8.13 above) is likely to be significantly more to construct than the other single storey
supermarket and retail warehouse typologies depending on the quality of the scheme.
62 based on the BCIS cost indices rebased for Oxfordshire (accessed website 24 April 2013).

© Aspinall Verdi Limited West Oxfordshire DC Local Plan and CIL Viability Study Final Report
February 2015
85
However, there are no samples on BCIS for ‘shopping centres’ in Oxfordshire recorded. We
have therefore use the ‘highest’ BCIS construction cost £3,468 psm for this typology.
External Works
8.28 See comments above (section 7).
Contingency
8.29 See comments above (section 7).
Professional Fees
8.30 See comments above (section 7).
Disposal Costs
8.31 See comments above (section 7).
Finance Costs
8.32 See comments above (section 7).
Developers Profit
8.33 See comments above (section 7).
Residual Land Value
8.34 The gross Residual Land Value (RLV) is the product of the above values and costs (see Figure
4.2) and the net RLV takes into consideration the usual site acquisition costs (see section 5
above).
Town Centre and Retail TLV
8.35 We have sought to establish the Threshold Land Value (TLV) for A-use classes from a variety
of sources including consultation with local agents and other stakeholders.
8.36 Again we have again sought to triangulate the Threshold Land Value for retail schemes. This is
very difficult given the often complex site assembly (particularly for town centre schemes) and
the lack of transparency in the market for convenience stores. We refer you to our commentary
within our earlier EVA report in this respect.

© Aspinall Verdi Limited West Oxfordshire DC Local Plan and CIL Viability Study Final Report
February 2015
86
8.37 There is a lack of specific transactional evidence but we have established our Threshold Land
Values based on:
Consultations with local agents
Our own experience of acting for and against retailers on regeneration projects
Residual appraisals
Premium over Existing Use Values (EUV) and next best alternative use values (residential
– see Table 5.19 above)
8.38 For the purposes of our appraisals we have used similar TLV’s as previously, but updated them
in the context of the increased range of retail typologies appraised. We have applied £650,000
per acre for ‘town centre’ typologies; £500,000 per acre for secondary edge of centre locations
and £225,000 per acre for the strategic greenfield locations. These are consistent with the
hierarchy of values illustrated on Figure 4.3 in section 4.
Retail Viability Results
8.39 The appraisals (Appendix 5) show that retail development is generally viable with the exception
of the high density multi-storey town centre typology. This typology is more akin to a town
centre regeneration project and the viability reflects the high costs of site assembly and the high
construction costs.
8.40 The other retail typologies are all viable to a varying extent. Key issues for viability arising from
the appraisals are –
Greenfield typologies are generally highly viable due to the low TLV compared to a town
centre location with higher EUVs
Retail warehouses are generally viable due to the substantially lower BCIS construction
costs
Smaller convenience retail parades are generally viable due to the higher development
density assumption and therefore the lower site area required and the lower absolute TLV
Medium to large supermarkets on brownfield sites are generally only marginally viable due
to (1) the high TLV / lower site density (2) high BCIS build costs (3) higher site specific
S106 assumptions.

© Aspinall Verdi Limited West Oxfordshire DC Local Plan and CIL Viability Study Final Report
February 2015
87
8.41 The greenfield typologies both have high viability. We have appraised these schemes based
on the £175 psm CIL recommend previously. These both have substantial viability buffers due
to the greenfield TLV.
8.42 Similarly we have appraised the retail warehouse typology based on the previously
recommended £140 psm CIL. Again this gives a substantial viability buffer due to the lower
construction costs. This would be higher in a greenfield scenario. Given that there is relatively
limited development of this type in the District and in the interests of keeping the CIL Charging
Schedule simple we have incorporated this into ‘retail’.
8.43 The retail schemes in the town centre are least viable due to the high TLV assumptions. It is
acknowledged that high density multi-storey development is not viable, but this is not the
‘normal’ typology. We have appraised single storey ‘supermarket’ and parade shops in the
town centre and these are viable at £30 psm CIL.
8.44 In other urban locations (i.e. between the defined Town Centre and the greenfield settlement
limits) we have appraised these previously developed land typologies based on £50 psm
(including site specific S106/S278 agreements) which includes an adequate viability buffer.
8.45 A summary of this is set out on the following table (Table 8.6)
Table 8.6 – Retail Results Summary

© Aspinall Verdi Limited West Oxfordshire DC Local Plan and CIL Viability Study Final Report
February 2015
88
State Aid
8.46 A respondent to the PDCS consultation has raised an objection about state aid in the context of
the proposed retail CIL rates.
8.47 The principle of state aid is that, where an organisation is ‘skewing the market’ by making
money at the expense of another firm, any public [state] aid to that organisation for that purpose
would be encouraging unfair competition and is deemed to be “state aid”.
8.48 The CIL guidance63 on state aid is in the context of exemptions and relief. The guidance states,
‘State aid is a European Union member state’s support to ‘undertakings’ …..in whatever form,
which could distort competition and affect trade by favouring certain parties or the production of
certain goods, is incompatible with the common market…..’
8.49 The CIL guidance sets out various tests (criterion) for state aid64 which we have applied in the
context of the retail CIL in table 8.7 below.
NPPG Criterion Comments
Criterion 1: Is the relief granted by the state or through state resources? Relief from the levy will always be granted by the State and therefore this criterion is always met.
Not applicable – WODC is not proposing any relief for retail CIL.
Criterion 2: Does the relief favour certain undertakings or the production of certain goods? Charging and collecting authorities should determine whether the claimant is an entity engaged in economic activity i.e. the putting of goods or services on a given market.
Again not applicable – WODC is not proposing any relief for retail CIL.
Note that the CIL will be applicable to all retailer and therefore there is no unfair advantage for any one retailer.
Criterion 3: Does relief distort or threaten to distort competition? Relief from the levy is by its nature a selective aid and will invariably have the potential to distort competition where a body is engaged in economic activity. Where criterion 2 is met it is likely that this criterion is also met.
ditto
Criterion 4: Does relief affect trade between Member States? Again, where criterion 2 is met, it is likely that this will also be met. It may be possible to argue that aid will not affect trade between Member States, as the organisation’s activities are purely local, but charging and collecting authorities will need to manage this risk. While the European Commission’s interpretation of this test is broad and the legal threshold low
Again not applicable – WODC is not proposing any relief for retail CIL.
Again, the retail CIL will apply to all retailers – large or small companies – who
63 NPPG website - Paragraph: 155 Reference ID: 25-155-20140612 64 NPPG website - Paragraph: Paragraph: 156 Reference ID: 25-156-20140612
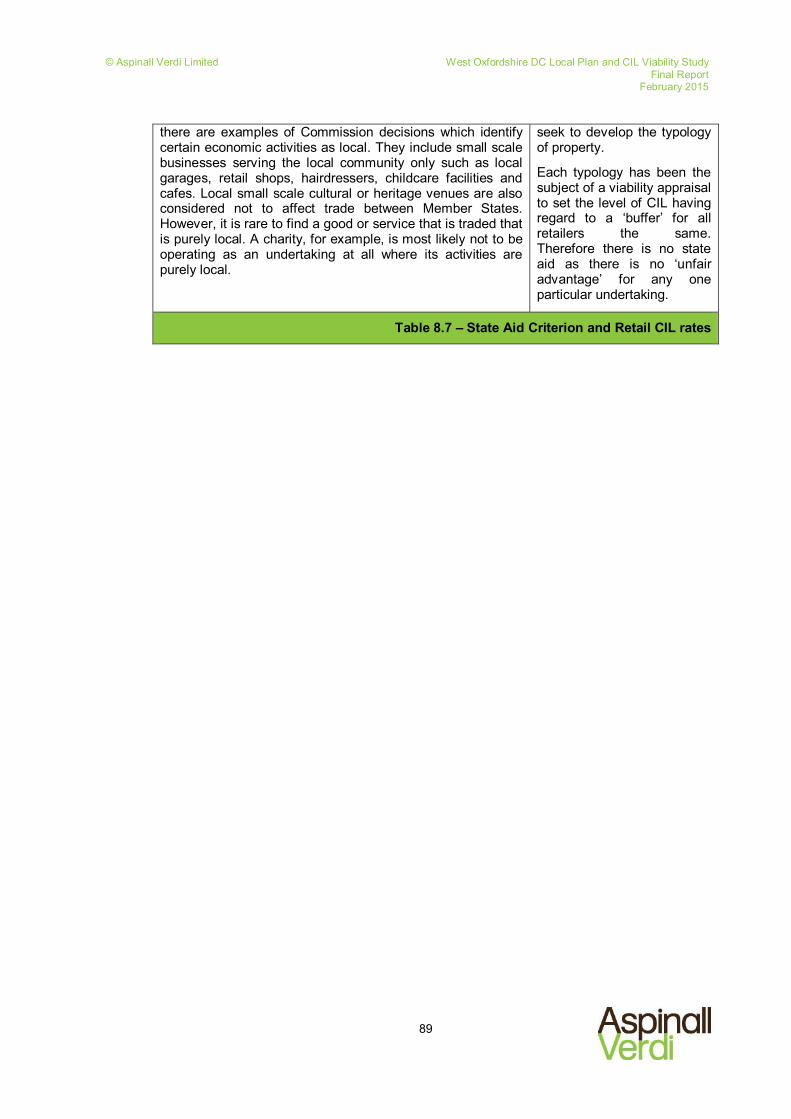
© Aspinall Verdi Limited West Oxfordshire DC Local Plan and CIL Viability Study Final Report
February 2015
89
there are examples of Commission decisions which identify certain economic activities as local. They include small scale businesses serving the local community only such as local garages, retail shops, hairdressers, childcare facilities and cafes. Local small scale cultural or heritage venues are also considered not to affect trade between Member States. However, it is rare to find a good or service that is traded that is purely local. A charity, for example, is most likely not to be operating as an undertaking at all where its activities are purely local.
seek to develop the typology of property.
Each typology has been the subject of a viability appraisal to set the level of CIL having regard to a ‘buffer’ for all retailers the same. Therefore there is no state aid as there is no ‘unfair advantage’ for any one particular undertaking.
Table 8.7 – State Aid Criterion and Retail CIL rates

© Aspinall Verdi Limited West Oxfordshire DC Local Plan and CIL Viability Study Final Report
February 2015
90
9 Other Uses
9.1 See the previous September 2013 EVA report. As noted at paragraph 9.3 previously new build
A2-A5 uses should be levied CIL at the appropriate retail rate above (section 8).
9.2 Other uses including hotels (C3), non-residential institutions (D1), assembly and leisure (D2),
Sui generis and agricultural buildings should not be levied CIL.

© Aspinall Verdi Limited West Oxfordshire DC Local Plan and CIL Viability Study Final Report
February 2015
91
10 Strategic Development Area (SDA) Viability
10.1 This section deals with the specific viability of the Draft Strategic Development Areas having
regard to the affordable housing levels and CIL rates considered above.
10.2 The Strategic Development Areas (SDAs) identified in the pre-submission Draft Local Plan
comprise (1) East Witney, (2) North Witney (3) REEMA Central at Carterton and (4) Tank Farm,
Chipping Norton65.
10.3 We have not appraised the strategic site at East Carterton as this has now secured planning
permission and is subject to a separate S106 negotiation.
SDA Assumptions
10.4 Appendix 6 contains our assumptions for each of the SDA sites. This includes the following
breakdown –
Net developable site area, density and number of dwellings
Development phasing assumptions
Affordable housing assumptions – % target / unit mix / tenure mix / transfer values
Market housing assumptions – unit mix / market values
Infrastructure / external works costs – these are shown explicitly where we have this
information
10.5 For each of the SDAs, we have been instructed to appraise the scheme on the basis that the
infrastructure is funded as follows:
Scenario A – assuming that CIL is paid and therefore a reduced site-specific S106 payment
of £10,000 per unit, and
Scenario B – assuming a higher S106 payment of £16,000 per unit and no CIL.
10.6 These assumptions are also shown on the spreadsheets (Appendix 6).
65 Note that North Witney and Chipping Nortonwere not previously appraised in the September 2013 EVA.

© Aspinall Verdi Limited West Oxfordshire DC Local Plan and CIL Viability Study Final Report
February 2015
92
Pro-Dev Appraisals
10.7 Appendix 6 also contains Pro-Dev appraisals for each of the SDA’s. This is a proprietary
development appraisal software package which we have used to calculate the residual value of
the SDA.
10.8 The appraisals are based on the above scheme parameters with otherwise generic
assumptions for consistency with the 100 unit typology and other residential typologies.
10.9 The appraisals include the relevant Affordable Housing policy target (40% in the medium value
zone and 35% in the lower value zone). CIL is included at £100 psm on the private market
housing.
10.10 We have calculated the residual value based on a blended profit of 17% on value which reflects
a lower level of profit on the affordable housing.
Viability Results
10.11 For each of the SDA’s we have calculated the residual land value (RLV) using Pro-Dev -
including the relevant affordable housing and CIL assumptions. This is then compared to the
TLV in order to determine whether the SDA is viable. The viability results are set out below
(Table 10.1).
Table 10.1 – SDA Appraisal Results Summary

© Aspinall Verdi Limited West Oxfordshire DC Local Plan and CIL Viability Study Final Report
February 2015
93
10.12 As can be seen from the above table, all of the SDA’s deliver a positive RLV on both scenarios
– where the infrastructure is funded by CIL (Scenario A) and by S106 (Scenario B).
10.13 All of the appraisals, except North Witney SDA, result in a RLV per acre which is greater than
our assumed greenfield TLV of £225,000 per acre. Accordingly these schemes are viable
including the policy obligations.
10.14 The North Witney SDA is viable in that the RLV is positive, but it does not generate enough
land value to overcome our assumed greenfield TLV. This is unsurprising given the very high
costs that have been factored into the appraisal for highway infrastructure and flood risk
mitigation. We would suggest that there is clearly scope for the scheme to be viable either on
the basis of a lower TLV or through negotiation over the package of planning obligations to be
sought e.g. the percentage of affordable housing which has a significant effect on gross
development value.
10.15 It is important that the Council is clear about which infrastructure is to be funded by the
developer (through S106 or S106 and CIL) and which is to be funded by the Authority through
CIL in order to avoid any “double dipping”.
10.16 The Community Infrastructure Levy Regulations 2010 enabled land to be transferred to the
charging authority in satisfaction of a CIL liability. The 2014 amendments have introduced
provisions which also enable infrastructure to be provided in lieu of payment of the levy.
However the application of these regulations is complex in relation to the S106 tests and also
has implications for the Regulation 123 List.
10.17 The circumstances in which an infrastructure payment is likely to be attractive to a developer
are where they would otherwise be unable to carry out the development until the infrastructure
has been provided and so they want to be able to control delivery and timescale. But where, as
will more often than not be the case, the infrastructure is necessary to make a development
acceptable in planning terms, the CIL Regulations will not assist.
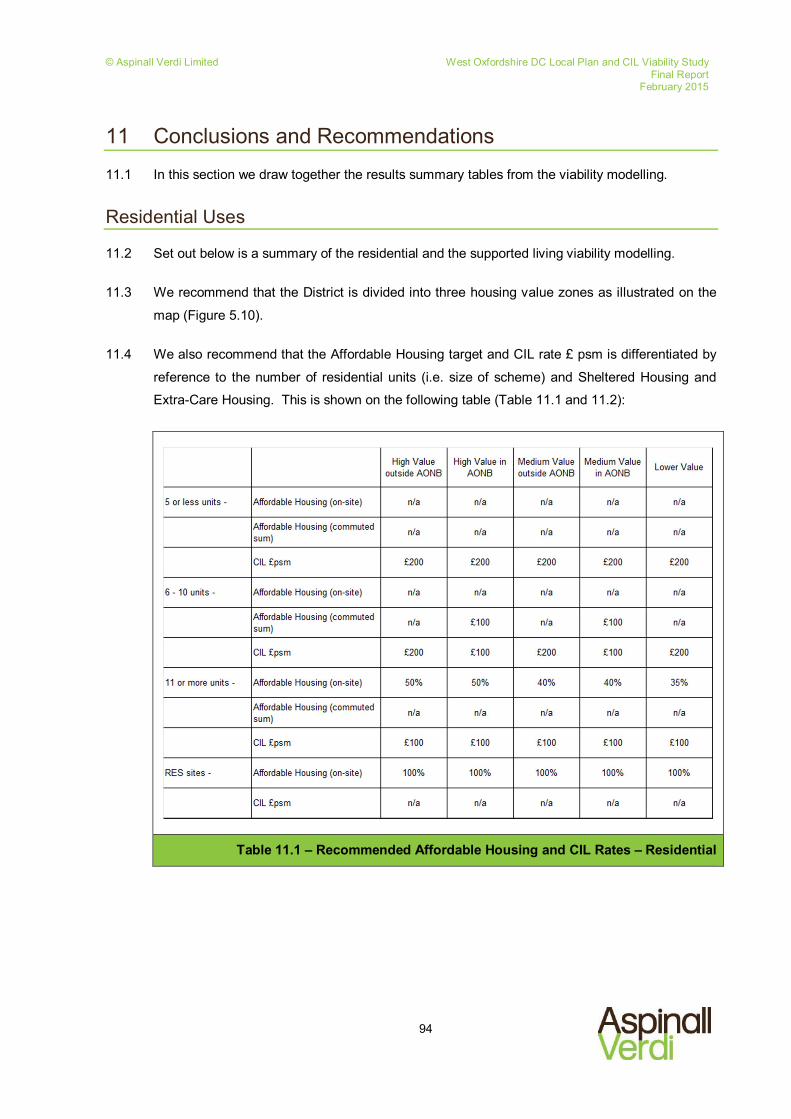
© Aspinall Verdi Limited West Oxfordshire DC Local Plan and CIL Viability Study Final Report
February 2015
94
11 Conclusions and Recommendations
11.1 In this section we draw together the results summary tables from the viability modelling.
Residential Uses
11.2 Set out below is a summary of the residential and the supported living viability modelling.
11.3 We recommend that the District is divided into three housing value zones as illustrated on the
map (Figure 5.10).
11.4 We also recommend that the Affordable Housing target and CIL rate £ psm is differentiated by
reference to the number of residential units (i.e. size of scheme) and Sheltered Housing and
Extra-Care Housing. This is shown on the following table (Table 11.1 and 11.2):
Table 11.1 – Recommended Affordable Housing and CIL Rates – Residential

© Aspinall Verdi Limited West Oxfordshire DC Local Plan and CIL Viability Study Final Report
February 2015
95
Table 11.2 – Recommended Affordable Housing and CIL Rates – Supported Living
Commercial Uses
11.5 Our appraisals show that commercial office and industrial development is not viable based on
the RLV appraisals and TLV assumptions herein. We therefore recommend £0 CIL for
commercial uses.
Retail Uses
11.6 We have appraised various retail typologies (A Use Class) as described above in section 8.
We have found varying levels of viability depending on the assumptions and hypothetical
locations of the schemes (e.g. greenfield or town centre). Based on our sampling we
recommend the following CIL rates (Table 11.3).

© Aspinall Verdi Limited West Oxfordshire DC Local Plan and CIL Viability Study Final Report
February 2015
96
Table 11.3 – Recommended CIL Rates –Retail
Other Uses
11.7 Other uses including hotels (C3), non-residential institutions (D1), assembly and leisure (D2),
Sui generis and agricultural buildings should not be levied CIL.