Embed Size (px)
Citation preview
1
Reports on tasksfor scientific cooperation
Report of experts participating in Task 3.2.7
January 2002
Assessment of dietary intake of Ochratoxin Aby the population of EU Member States
Directorate-General Health and Consumer Protection
2
TASK 3.2.7 "ASSESSMENT OF DIETARY INTAKE OFOCHRATOXIN A BY THE POPULATION OF EU MEMBER STATES"
Co-ordinators: Marina Miraglia and Carlo Brera
Istituto Superiore di Sanità – Rome – Italy
Collaborators: Barnaba Pazzaglini and Silvana Grossi
Istituto Superiore di Sanità – Rome – Italy
3
CONTENTS
Foreword………………………………………………………………………………………
Introduction……………………………………………………………………………………
OA Occurrence in food………………………………………………………………………..
Consumption data……………………………………………………………………………..
OA Dietary intake……………………………………………………………………………..
OA Occurrence in biological fluids…………………………………………………………...
• Estimate of the OA dietary intake on the basis of OA level in serum/plasma………...• OA level in human milk and estimated dietary intakes for babies……………………
Discussion and Conclusions………………………………………………….…………….…
Acknowledgements……………………………………………………………………………
Annex 1 Basic information on Ochratoxin A
Annex 2 Timetable
Annex 3 Instructions for participants
Annex 4 Glossary
Annex 5 List of participants
Annex 6 References
4
FOREWORD
According to Council Directive 93/5/EEC "on the assistance to the Commission and co-operationby the Member States in the scientific examination of questions relating to food" Member States ofthe European Union can co-operate on problems facing the Commission in the area of food.Directive 93/5/EEC also indicates that an inventory of Tasks to be undertaken has to be publishedas a Commission Decision at least every six months. For each Task, the participating MemberStates, the Member State which provides co-ordination and time limit for completion will beindicated. The rationale for each Task is to provide harmonised and reliable information to be used by theCommission for the management of problems related to food. With this aim the Competent Authorities responsible for Scientific Co-operation in the MemberStates nominate experts in the specific field of interest, that will provide the Co-ordinator with theinformation necessary to prepare a final report. In principle the final report should contain factual information, but it should be underlined thatgathering and presenting scientific data, especially deriving from sources of different origin, canrequire a degree of interpretation by experts and by Co-ordinator. It is therefore important to stress that the interpretation and views in the present report are notnecessarily those of the participating Member States or those of the European Commission.
5
INTRODUCTION
As reported the document SCOOP/CNTM/9 Rev 3 “Council Regulation (EEC) 315/93 of 8February 1993 provides the legal framework for establishing maximum levels for foodcontaminants at Community level”. In 1995, a Task 3.2.2 concerning the assessment of dietary intake of Ochratoxin A by thepopulation was completed and resulted in report EUR 17523 "Assessment of dietary intake ofOchratoxin A by the population of EU Member States". The report was extremely useful as a toolfor basic information and future decision, but it was admitted that the estimates of dietary intakes ofOchratoxin A in that report were based on a limited amount of data. Due to the growing interest and concern of the public authorities for the presence of naturallyoccurring toxicants in the human food, such as mycotoxins, and to the discussions at Communitylevel concerning the fixing of maximum limits, a more frequent control on the presence ofmycotoxins and in particular Aflatoxins and Ochratoxin A, was carried out in food. Researcheshave also been launched to investigate the frequency and level of Ochratoxin A in human biologicalfluids such as blood, plasma and breast milk. As a consequence, many recent data on the occurrenceof Ochratoxin A in human food and human biological fluids have become available since 1995 andnew sources of exposition (i.e. raisins, wine and spices) were reported only recently. In addition aspecific emphasis was also given to the evaluation of the impact of Ochratoxin A on human health,therefore asking for a more accurate evaluation of the exposure to this toxin by the Europeanpopulation. It seems therefore appropriate to update the Task undertaken in 1995 and complete it with recentdata, in order to check whether the recent data change or not the conclusions of the report EUR17523. Commission Decision 1999/143/EC, of January the 27th 1999 amending Decision 94/652/ECestablishing the inventory and distribution of the Tasks to be undertaken within the framework ofco-operation by Member States in the scientific examination of questions relating to food,established Task 3.2.7 "Assessment of dietary intake of Ochratoxin A by the population of EUMember States". Italy was designated as Member State to develop the Task. Basic information on Ochratoxin A are given in Annex 1. Following the appointment of Italy as Co-ordinator, the timetable of the Task (Annex 2) wasdecided jointly with representatives of the Commission. For administrative reasons the Commissionhas decided to postpone the deadline for the completion of the Task to the end of June 2001.
After receiving the list of experts nominated by the Competent Authorities of the Member States, inMay 1999, the instructions for Task 3.2.7 (Annex 3) were issued to participants, who were alsoasked for comments.Basically, participants were asked to provide information on the exposure of the population to OAin their country through the elaboration of the following categories of data:
1. Occurrence data in food and beverages, including those from different methodologicalapproaches (i.e. total diet, duplicate test portion)
2. Consumption data3. Best estimate of dietary intake4. Occurrence data in biological fluids and intake as derived from data on serum5. Data of intake for lactating babies through the ingestion of breast milk.
6
Additional information was also asked, among others and whenever possible, on the followingissues:
• Sampling procedures employed• Quality Assurance of Analytical data• Data on OA occurrence in working places• Regulations related to the toxin (maximum limits, sampling plans, others).
The draft version of the instructions for participants was sent in June 1999.In July 1999 a meeting was organised in Rome, Italy, with the aim of illustrating and discussing thefinal version of the Instructions to participants, modified according to the suggestions previouslyreceived.The format for collecting and sending data was also agreed in order to allow the drawing ofsummary Tables by the Co-ordinators.Information from participants was gathered during the period November 1999-September 2000.After the evaluation and harmonisation by the Co-ordinators of the provided information a set ofTables was prepared.All 13 participating countries have sent results on occurrence of OA in food. Six participants havesent results on serum/blood and 4 on breast milk. Results on other human fluids (urine and amnioticfluid) and tissues (placenta and funiculum) were also provided by 3 countries. Since consumptiondata were not provided by Ireland, Co-ordinators included the Irish data in Tables wheneverappropriate.Data provided by participants were collected, harmonised, and reported by the Co-ordinatorsaccording to the following criteria:Ø To provide a description, harmonised at European level, of the status of OA contamination in
foodstuffs in each participating Member StateØ To group available information on each raw material and/or food productsØ To evaluate the best estimates of the OA dietary intake from food, and to compare them with the
dietary intake as calculated from biological fluids, both for each participating Member State andat European level
Ø To evaluate the OA dietary intake of particular groups of population (high consumers, children,babies etc.).
A glossary of the employed terms and the list of participants are reported in Annex 4 and 5.
1. OA OCCURRENCE IN FOOD
Calculation of the mean 1 and mean 2
Basically, for the calculation of the mean 1 and 2, the same approach used in the previous tasks onOchratoxin A and Aflatoxins has been followed. This for assuring a certain degree of comparabilitywith the previous outcoming results. A quite marked difference among the limits of detectionprovided by each Member State still persisted, by rendering quite difficult a correct interpretation ofthe distribution of the results around the mean values and the corresponding intake calculations. Thevalue the Co-ordinators believed as representing the greatest closeness of the calculated value toreal figure was the weighed arithmetic mean. It should be also noted that the uncertaintiesassociated to non representative sampling methodologies associated to the surveys should representa much more complex scenario for a correct determination of the real exposure of population toochratoxin A.
Mean 1 accounts for all the individual provided values according to the following criteria:
7
1) If LOD and LOQ are available, participants were requested to calculate mean level using LOD/2for results lower than the LOD. For results between LOD and LOQ, numerical values, if available,were used.
2) If only LOQ is available, or if numerical values between LOD and LOQ are not available,LOQ/2 for values below the LOQ was used.
Mean 2 accounts for all positive above LOD values and it accounts for the distribution and level ofpositive results.
Range of contamination and median value
The ranges of concentration were chosen in order to provide a wide spectra of the low region ofconcentration.
The median value, corresponding to the 50th percentile, provides an indication, along with mean 1,of the distribution of data population.
Occurrence data by each Member State
Table 1 presents the occurrence data as provided by participants (N = 13). The total number ofanalysed samples for each Member State is graphically represented in Fig.1. According to therequest of information reported in Annex 3, most of the participants have sent their information onthe occurrence of OA in various food, generally by following the food categorisation systemprovided by the Co-ordinators. The system allowed for setting data in groups and subgroups andparticipants were also requested to include other possible classes of food as additional subgroups. Inorder to allow the Co-ordinators to better harmonise the occurrence data by each Member State,participants were asked to send, whenever possible, also the individual data for each group orsubgroup. Whenever provided by participants, the sum of the subgroups for some food categories(cereals together, wine together, coffee together etc.) as calculated by participants is reported inTable 1 (grey rows).The Co-ordinators decided to omit in Table 1 the provided information on AQA, sampling, and ifrepresentative of the Member State, since almost in all cases the provided data were indicated byparticipants as deriving from good sampling procedures, analysed according to quality assuranceprinciples, and representative of the Member State. Data on OA occurrence in susceptible foodcommodities as provided by each country are represented in Fig.2.The total number of reported occurrence data in Task 3.2.2 was N = 11.085, while in Task 3.2.7 atotal of N = 18.599 was processed. In order to account for the increase in the knowledge on OAcontamination in food products in Europe, the total number of data available in Task 3.2.2 and 3.2.7for selected commodities are reported in Table 1bis and represented in Fig.1bis. In this figure, asfar as Task 3.2.7 is concerned, under the category “Others”, a number of data higher than elsewheregiven in this Report, was due to the different food categorisation systems used in the two Tasks.Wine, coffee, dried fruits and cocoa were by far much more investigated in Task 3.2.7 than in theprevious Task, while the opposite trend was shown by cereals (barley, bran, maize, rye and wheat).In addition, the comparison between available data in the two Tasks, for each Member State, isreported in Table 1tris.Irish data has been included only in Tables 1,1bis and 1tris, and in Figg.1-16, since the providedinformation did not allow the inclusion neither in the European means (Tables 1A-1I), nor in thecalculation of the intake (Tables 3A-3I).

8
Occurrence data for selected commodities
In order to account for the overall incidence of OA contamination in different food matrices inEuropean countries (both raw material and derived products), all provided data on the occurrence incereal grains, coffee (green and processed), beer, wine, cocoa products, dried fruits, meat products,spices and “others” are gathered in Tables 1A, 1B1 and 1B2, 1C, 1D, 1E, 1F, 1G, 1H and 1Irespectively. In these Tables, all available occurrence data were included, even though in somecases the corresponding consumption data were not available. In order to have realistic values forthe intake, in some cases OA levels in finished products (such as bread for Denmark and Spain, andcoffee for France) were calculated by participants on the basis of the level of contamination in theraw material used as ingredient (wheat or rye bread, and green coffee), and of the percentage ofdestruction by technological procedures (coffee). The calculated occurrence data on finishedproducts were not included in the corresponding Tables (1,1A and 1B2), but they were used for thecalculation of the intakes.Weighed mean 1 and 2 were calculated for each commodity.At the bottom of the Tables 1A-1I the weighed mean 1 and 2 among all participating countries(Europe) were calculated, and, whenever a sufficient number of data were available, also means forNorth Europe (Denmark, Finland, France, Germany, Norway, Sweden, the Netherlands and UK)and South Europe (Italy, Greece, Spain and Portugal) were calculated. Countries were assigned toonly two geographical areas (North and South Europe), since the available number of data did notallowed a more detailed attribution.
• Cereals
The occurrence data for cereals (raw material and derived products) in each participating countryare gathered in Table 1A. The total number of results was 5.180, with 55% of positive samples, andthey ranged from LOD (0,005 ug/kg) to 33,3 ug/kg (Denmark). All participating countries providedresults on this food matrices except Greece. The weighed means 1 and 2 for Europe were 0,294ug/kg and 0,484 ug/kg respectively. Weighed mean 1 for North Europe and South Europe wasrather similar (N tot = 4.832; positive: 56% and N tot = 348; positive: 31% respectively). Thenumber of available data for North Europe was much higher than for South Europe, the level ofcontaminated samples being slightly higher in the latter (mean 2: 0,482 ug/kg vs 0,519 ug/kg). Thenumber of total and OA positive samples in each Member State for different types of cereal grainand for cereal derived products is shown in Fig.3 and Fig.4 respectively.
Cereal grains: since information on the extent of contamination in raw materials is very relevant notonly from the health, but also from the economic and commercial point of view, the occurrence dataon cereal raw materials (wheat, corn, oat, millet, rye, barley and rice) were derived from Table 1Aand reported in a separate Table (Table 1A1).
WheatContributions were given by all countries except Greece, Ireland and Spain. The mean 1 rangedbetween 0,025 ug/kg for Italy and 0,76 ug/kg for the Netherlands, for a total of N = 979 samples(positive: 28%). Weighed mean 1 for Europe was 0,269 ug/kg, the contamination in North Europe(0,281 ug/kg) being more relevant than in South Europe (0,102 ug/kg), the latter having provideddata on 64 samples only, all of them reported as negative. In Fig.5 the number of total and OApositive samples in wheat for each Member State is shown.
CornContributions were provided by five countries (France, Germany, Italy, Spain and UK), with a totalof 267 analysed samples (positive: 13%). Weighed mean 1 was 0,165 ug/kg (all contributing
9
countries), 0,123 ug/kg for North Europe (Germany and France) and 0,266 ug/kg for South Europe(Italy and Spain). In Fig.6 the number of total and OA positive samples in corn for each MemberState is shown.
OatContributions were provided only by seven Northern European countries (Finland, France,Germany, Ireland, Norway, Sweden and UK) with a total of 164 analysed samples (positive: 30%).Weighed mean 1 was 0,192 ug/kg. In Fig.7 the number of total and OA positive samples in oat foreach Member State is shown.
MilletOnly two countries (Finland and Germany) provided data (24 positive out of 34 samples) for millet.Due to the low number of the available data, weighed mean 1 (0,136 ug/kg) does not fully accountfor contamination in millet at European level. In Fig.8 the number of total and OA positive samplesin millet for each Member State is shown.
RyeA total of N = 444 (positive: 53%) data were provided by seven countries (Denmark, Finland,Germany, Italy, Norway, Sweden and UK). Weighed mean 1 for Europe was 0,597 ug/kg, reflectingmainly the contamination in North Europe (0,654 ug/kg), since the only contribution from SouthEurope (mean 1 = 0,050 ug/kg) was provided by Italy (N = 42, all negative). In Fig.9 the number oftotal and OA positive samples in rye for each Member State is shown.
BarleyFive countries (Finland, France, Germany, Italy, UK) provided data on barley (N = 142; positive:24%), weighed mean 1 for Europe (0,301 ug/kg) being particularly influenced by weighed mean 1 =0,515 ug/kg for South Europe (represented by Italy), while for North Europe, weighed mean 1 was0,255 ug/kg. In Fig.10 the number of total and OA positive samples in barley for each MemberState is shown.
RiceData on 63 samples (4 positive) were provided by four countries (France, Germany, Ireland, Italyand Spain), the weighed mean 1 being 0,217 ug/kg for Europe. Weighed mean 1 and 2 for Northand South Europe are not representative of the OA contamination due to the paucity of data. InFig.11 the number of total and OA positive samples in rice for each Member State is shown.
Comments on OA Occurrence in Cereals
A considerable number of data was provided for cereals and derived products, even if the mostrelevant part of information was derived from North European countries.
Cereal grains• Weighed mean 1 (Europe) ranged from 0,136 ug/kg for millet (N = 34) to 0,597 ug/kg for rye
(N = 444)• Weighed mean 2 (all positive samples) (Europe) ranged from 0,120 ug/kg for millet to 1,095
ug/kg for rye• Among the individual cereal commodities, wheat has been investigated more widely in
comparison with the other grains, especially in North Europe• Rye showed the highest level of contamination as derived from both the mean 1 and mean 2
levels, with 50% of positive samples.
10
Cereals and derived products
For comments on these commodities see section on best estimate intake from cereals.
• Coffee
In consideration of the ascertained destruction of OA during technological procedures, still matterof debate in terms of percentage, two separate Tables were prepared for this food matrix, Table 1B1(green coffee) and Table 1B2 (processed coffee).
Green coffee: six participating countries (Finland, France, Greece, Italy, Norway and UK) haveprovided data on green coffee (N = 1.704; positive: 36%), with contribution from North and SouthEurope of N = 1.096 and N = 608 respectively. Weighed mean 1 level was 1,620 ug/kg for Europe,it being higher in South Europe (2,290 ug/kg) than in North Europe (1,248 ug/kg). In this respect aneven more striking difference is shown by weighed mean 2 (Europe 3,641 ug/kg, North Europe2,681 ug/kg, South Europe 6,376 ug/kg). This trend could be attributable to differences in hygienicquality of the imported green coffee. It should be noted that during the past few years preventionmeasures for OA in green coffee were studied and probably somehow applied in the producingcountries. In Fig.12 the number of total and OA positive samples in green coffee for each MemberState is shown.
Processed coffee: all countries have provided data on roasted coffee and many provided informationon different kind of processed coffee (Europe : N = 1.184; positive: 46%; North Europe: N = 862;positive: 51%; South Europe: N = 322; positive: 34 %). Weighed mean 1 levels were 0,724 ug/kg,0,749 ug/kg and 0,656 ug/kg for Europe, North Europe and South Europe respectively. Weighedmean 2 levels were 1,092 ug/kg, 0,971 ug/kg and 1,582 ug/kg for Europe, North Europe and SouthEurope respectively. In Fig.13 the number of total and OA positive samples in roasted coffee foreach Member State is shown.
Comments on OA Occurrence in Coffee
The overall number of data provided for coffee was sufficiently high to provide sound informationon the problem of contamination by OA, both for green and for processed coffee. Green coffee isconfirmed to be a raw material susceptible of OA contamination. In this respect it is foreseen that inthe next future the preventing measures put into practice at world-wide level will decrease theoverall OA contamination in the countries of origin. The percentage of positive samples inprocessed coffee was higher than in green coffee (46% vs 36%) suggesting that samplingprocedures in raw material should still be improved. Also the practice of blending coffee to obtaindifferent flavours (Robusta and Arabica varieties) could account for the above difference.The comparison between European means 2 in green and processed coffee samples (3,641 ug/kg vs1,092 ug/kg) indicates a marked reduction of OA to be probably attributed both to blending and tolosses during the technological procedures usually adopted in South Europe, where more drasticroasting procedures are employed with respect to Northern countries.
• Beer
OA occurrence data in beer are shown in Table 1C.Data were provided by all countries except France, Greece, Norway and the Netherlands, and theyare rather representative of Europe (N = 496; positive: 39%), North Europe (N = 376; positive:
11
32%) and South Europe (N = 120; positive: 58%). Weighed mean 1 and mean 2 were rather similar(0,028 ug/kg and 0,032 ug/kg respectively) for Europe, North Europe and South Europe.In Fig.14 the number of total and OA positive samples in beer for each Member State is shown.
Comments on OA Occurrence in Beer
The extent OA incidence of contamination in beer was rather low as well as the average levels(mean 1 similar to mean 2). In addition no difference was found in the different parts of Europe,neither for imported nor low alcoholic beer.
• Wine
Ten out of 13 countries provided occurrence data on wine (Table 1D). The types of analysed wineswere rather different (sweet, sparkling, red, white, rosé, domestic, imported etc.) and the range ofLODs was quite wide (0,003 ug/kg – 1 ug/kg).The total number of data was N = 1.470, with positive: 59%. The levels of contamination rangedfrom 0,003 ug/kg (Spain) to 15,60 ug/kg (Italy). Among countries, mean 1 values were in the range0,01ug/kg – 1,29 ug/kg.The number of data for North Europe (N = 835; positive: 50,3%) and South Europe (N = 625;positive: 72,3%) was similar, the percentage of positive samples being higher in South than inNorth Europe.Weighed mean 1 levels for North Europe and South Europe were 0,181 ug/kg and 0,636 ug/kgrespectively, with a European mean level of 0,357 ug/kg.The number of total and OA positive samples in red and white wine for each Member State isshown in Fig.15 and Fig.16 respectively.
Comments on OA Occurrence in Wine
In consideration of the wide variety of monitored wine, and of the differences in the LODs of theemployed methods of analysis, it seems rather difficult to make sound comparisons amongcountries, both for the percentage of positive samples and for the resulting levels of contamination.Nevertheless the means seem to be quite close together.Among the different types, red and sweet wine seem to be the most contaminated, even if on thebasis of a rather low number of samples for sweet wine.
• Cocoa derived products
Occurrence data in cocoa and cocoa derived products are shown in Table 1E.OA occurrence in cocoa and cocoa derived products was much better evaluated than in previousTask 3.2.2, even if data were provided by three countries only (Germany, the Netherlands and UK).The total number of data was N = 547, with an high incidence of contamination (81,3%), eventhough OA levels in contaminated samples were not high (mean 2 = 0,277 ug/kg, rather close tomean 1= 0,236 ug/kg). In Fig.17 the number of total and OA positive samples in cocoa and derivedproducts for each Member State is shown.
12
Comments on OA Occurrence in Cocoa Derived Products
No data was provided on OA contamination in cocoa beans. However results on processed productsconfirmed cocoa beans as a raw material largely susceptible to OA contamination. Since most of thedata was provided by Germany, the available information was neither sufficient to draw conclusionson the relevance of the problem all over the European countries, nor on the influence oftechnological procedures on the reduction of OA contamination.
• Dried fruits
Data on dried fruits (Table 1F) were rather numerous (N = 800), even if many of them concernedvine fruits derived products (raisins, sultanas, currants). Northern European countries (Finland,France, Germany and UK) provided most of the data, while only Greece provided information (N =82) on the OA contamination in such products in South Europe. Details on data from Sweden werenot included in the Table due to the lack of sufficient information on the data. The percentage ofcontaminated samples was rather high (73% in Europe, 75% in North Europe).Mean 1 and 2 for Europe were 2,298 ug/kg and 3,078 ug/kg respectively. The mean 1 and 2 levelswere nearly equal in North Europe and in South Europe (mean 1 = 2,339 ug/kg vs 1,933 ug/kg andmean 2 = 3,077 ug/kg vs 3,092 ug/kg respectively).
Comments on OA Occurrence in Dried Fruits
Data on dried fruits, with particular reference to vine fruits derived products, indicate thesecommodities to be highly susceptible to OA contamination.
• Meat products
A considerable number of data (N = 1.860) were provided by four countries (France, Germany,Italy and UK) on meat products (Table 1G). Almost all of them concerned pork derived products,41 data (all negative) was given for poultry meat. The percentage of positive results was rather low(18%), but mean 2 was quite higher than mean 1, indicating the possibility of high levels in somesamples, mainly pig kidney and pork offal.
Comments on OA Occurrence in Meat Products
The results on meat products suggest the need for more investigation in South Europe countries onthese and similar products.
• Spices
A total of N = 361 data were presented on spices by four countries (Germany, Italy, Portugal andthe Netherlands). Results (Table 1H) indicate that also these food products are susceptible to OAcontamination (positive 52%).
13
Comments on OA Occurrence in Spices
Among different spices, nutmeg, paprika, coriander and pepper powder were the most highly andfrequently contaminated, most of the data being provided by North Europe. Mean 1 and 2 forEurope were 1,150 ug/kg and 5,061 ug/kg respectively. The marked difference between mean 1 inNorth and South Europe (0,980 ug/kg vs 4,659 ug/kg) could be attributed to the different country oforigin of the products.
• Other food commodities
Information on food commodities other than those so far taken into consideration were provided byparticipants and gathered in Table 1I. Fruit juice, including grape juice, milk and pulses were themain categories of contaminated food.
2. CONSUMPTION DATA
Consumption data as provided by participating countries are presented in Table 2.Most countries (except France, Germany, Norway, Sweden and UK) provided consumption data forall population.In addition since in the instruction for participants it was requested, whenever possible, to provideconsumption data also for specific groups of consumers (consumers only, by age, by gender, byliving area), France, UK, Germany, Greece, Italy, Norway, the Netherlands and Sweden providedalso information in this respect.Consumption data was either provided as grouped foods and/or as individual foods by almost allparticipants.Information on finished cereal based products was generally rather insufficient, since the majorityof data was given for raw materials.For coffee, an adequate number of data were provided, even if for some type of coffee products(instant, decaffeinated, etc.) information is still lacking.A lack of information does still exist on different types of wine and beer (red, white, rosé, tablewine, sweet etc. for wine and strong , black, white etc. for beer).As far as coffee is concerned, some participants provided consumption data of the generic category“coffee”, while some others could indicate consumption of roasted, instant and decaffeinatedcoffee. UK provided occurrence and consumption data in terms of soluble coffee powder.In some case conversion factors, as provided by Member States, from the beverage (ml) to thepowder (g), have been used to calculate the intake from coffee consumption.As for consumption data of cocoa powder, UK included a contribution from the cocoa powdercontained within chocolate.Mean, median and 95th percentile, and information on the adopted methodology for recording theconsumption data were generally also sent, and reported in Table 2A.In some cases (Italy, Sweden and Greece) consumption data of groups or subgroups of foodcommodities was presented, even if the corresponding data of OA occurrence was not available.
3. OA DIETARY INTAKE
In order to obtain the overall European scenario of the exposure to OA, through the combination ofOA occurrence data in food products and consumption data, various approaches were followed,namely by country, by food commodity and by groups of population. Another approach, throughthe occurrence in biological fluids will be presented in sections 4 and 4A.
14
Best estimate of the dietary intakes
In general on the basis of the provided data, four different estimates of dietary intakes from eachfood commodity, as derived by the combination of the above sets of data, were calculated (Tables3; 3A-3I):
A. Mean food consumption and mean 1 occurrence dataB. Mean food consumption and mean 2 occurrence dataC. 95th percentile food consumption (if available) and mean 1 occurrence dataD. 95th percentile food consumption (if available) and mean 2 occurrence data
In order to harmonise the results, all the figures were re-arranged by the Co-ordinators, byconsidering only two decimal figures. This could have caused minor discrepancies with theprovided data.
For each Member State, the best estimate of total dietary intake (ng/kg bw/day) was calculatedonly by summing up the dietary intakes A from each food commodity, since this approach providesthe value closest to the real situation.As far as dietary intake C is concerned, it was agreed that the summing up of the contributionfrom each contributing food commodities should provide an overestimation of the totaldietary intake; therefore only the major contributor food commodity was considered relevantand reported in bold type in the Tables 3 and 3A-3I.Dietary intakes B and D for each food commodity were also calculated, but they had not beensummed up for the evaluation of total dietary intakes, since they would represent a grossoverestimation.The intake estimates were calculated as referred both to person and per kg of body weight (bw), thelatter being calculated on the bw values (Table 3.1) as sent by participants.Consistently with the consumption data provided, most countries calculated the best estimates for“all population”. Many countries have provided consumption data for specific groups of populationand the dietary intakes were calculated also for those groups. Main categories considered byparticipants included consumers only, children and adults. Dietary intakes for these groups ofpopulation allow for the recommendations outlined in the CODEX guidelines (1999), related to theevaluation of dietary intake of food chemicals. According to these recommendations “………asappropriate, risk assessors and risk managers should consider differences in food consumptionpatterns across population and in vulnerability to toxicity within population as they estimateexposure to, and potential human health consequences resulting from exposure to chemicals foundin foods………..”.
Total dietary intake in participating countries
Participants calculated the best estimates of OA dietary intake for all population and/or for specificgroups of population, and for groups and/or specific subgroups of food products (Table 3).Table 3 reports only dietary intake values related to commodities on which both occurrence andconsumption data were available, the corresponding consumption and occurrence data also beingreported in the same Table.In addition, on the basis of the available data, the total dietary intakes A (ng/kg bw/day) werecalculated by Co-ordinators for each Member State by summing up the contributions from eachcommodities. From these values, a decreasing order among countries for dietary intake A wasderived and reported below. Information on the consistent group of population (all population or
15
consumers only), on the range of age (whenever relevant) and on the main contributing foodcommodity is also given.
It should be underlined that, as shown in Table 1tris and Fig. 2, most countries did notprovide information on all food products potentially affected by OA contamination; thereforethe total dietary intake A by country, as shown in Table 3, should be generally consideredunderestimated (see Discussion and Conclusions section).
Total dietary intake A and main contributing food commodity.UK (3,55 ng/kg bw/day, consumers only, 1,5÷4,5 years; dried fruits: 2,20 ng/kg bw/day) Italy (3,52 ng/ kg bw/day, consumers only; red wine: 2,94 ng/kg bw/day)France (3,39 ng/kg bw/day, consumers only, children; cereals and cereal products: 2,26 ng/kgbw/day)Germany (3,14 ng/kg bw/day, all population, girls- 4÷6 years; bread and rolls: 0,90 ng/kg bw/day)France (2,51 ng/kg bw/day, consumers only, 2÷65 years; cereal and cereal products:1,24 ng/kgbw/day)France (2,31 ng/kg bw/day, consumers only, 15÷65 years; cereal and cereal products: 1,14 ng/kgbw/day)Sweden (2,03 ng/kg bw/day, consumers only, children; rye: 0,75 ng/kg bw/day)Germany (1,82 ng/kg bw/day, all population, children <14 years; bread and rolls: 0,58 ng/kgbw/day)Finland (1,71 ng/kg bw/day, all population; rye: 0,65 ng/kg bw/day)The Netherlands (1,59 ng/kg bw/day, all population; wheat:1,28 ng/kg bw/day)Sweden (1,42 ng/kg bw/day, consumers only, adults; rye: 0,55 ng/kg bw/day)UK (1,42 ng/kg bw/day, all population, 1,5÷4,5 years; wheat and cocoa, included cocoa powdercontained within chocolate: 0,55 ng/kg bw/day)The Netherlands (1,26 ng/kg bw/day, consumers only; red wine: 0,58 ng/kg bw/day)Denmark (1,19 ng/kg bw/day, all population; rye bread: 0,50 ng/kg bw/daySpain (1,18 ng/kg bw/day, all population; wheat bread: 0,77 ng/kg bw/day)Italy (1,13 ng/kg bw/day, all population; red wine: 0,86 ng/kg bw/day)Germany (1,09 ng/kg bw/day, all population, adult >14 years; bread and rolls: 0,36 ng/kg bw/day)Norway (1,04 ng/kg bw/day, consumers only, men; wheat: 0,73 ng/kg bw/day)UK (0.91 ng/kg bw/day, consumers only, 16÷64 years; cereals: 0,32 ng/kg bw/day)Norway (0,97 ng/kg bw/day, consumers only, all population (men and women); wheat : 0,67 ng/kgbw/day)Norway (0,88 ng/kg bw/day, consumers only, women; wheat: 0,59 ng/kg bw/day)Portugal (0,81 ng/kg bw/day, all population; wheat and white wheat flour: 0,69 ng/kg bw/day)UK (0,53 ng/kg bw/day, all population, 16÷64 years; wheat: 0,31 ng/kg bw/day)Greece (0,23 ng/kg bw/day, all population, rural; coffee: 0,12 ng/kg bw/day)Greece (0,16 ng/kg bw/day, all population, semi-urban; coffee : 0,10 ng/kg bw/day)Greece (0,15 ng/kg bw/day, all population; coffee: 0,10 ng/kg bw/day)Greece (0,13 ng/kg bw/day, all population, urban; coffee: 0,10 ng/kg bw/day)
Estimated dietary intake from susceptible food commodities
With the aim to evaluate the contribution to the OA dietary intake by European population fromeach food matrix, the estimated dietary intakes from each commodity were also calculated, andpresented in Tables 3A, 3B, 3C, 3D, 3E, 3F, 3G, 3H, 3I.The sum of contributions from processed foods derived from the same raw matrix was alsocalculated.
16
The best estimates of dietary intakes were calculated only for those commodities, for which bothconsumption and occurrence data were provided.In order to provide a more exhaustive overview of all data available for each commodity, OAoccurrence values related to food commodities for which consumption data were not available arealso reported in the Tables.Underneath comments on calculated dietary intakes A from food matrices are given; please notethat, consistently with the information provided by participants, comments refer both to allpopulation in general and to specific groups of population (consumers, population divided by age,gender, and geographical area).
• Cereals
The best estimate dietary intakes from cereals and cereal products are reported in Table 3A. Insome cases the best estimate was rearranged by Co-ordinators in order to harmonise treatment ofindividual data on occurrence.The OA dietary intake from cereals has been calculated by summing up the dietary intakes fromeach subgroup of cereals.
Ø All population: all countries except Germany, France, Norway, Sweden and UK providedconsumption data for all population. The among countries range of dietary intake A was0,06 ng/kg bw/day (Italy) – 1,28 ng/kg bw/day (The Netherlands).
Ø Specific groups of population: France, Germany, Italy, Norway, Sweden, the Netherlandsand UK provided dietary intake estimate for various groups of population. As a generaltrend, intakes for bw were higher in the young than in the adult population.
• Coffee
The best estimate dietary intakes from coffee are reported in Table 3B. The best estimates of OAdietary intake were not calculated for green coffee, but only for the total consumed coffee products(i.e. roasted, instant and decaffeinated).All participant countries have provided best estimate of dietary intakes on the basis of the availableoccurrence and consumption data.
Ø All population: the dietary intakes A among countries ranged from 0,06 ng/kg bw/day (Italy)to 0,42 ng/kg bw/day (Finland).
Ø Specific groups of population: in most countries no marked differences in dietary intakevalues among groups of population were found. The increase in dietary intake, within eachcountry, was not very relevant for consumers (0,06 ng/kg bw/day vs 0,09 ng/kg bw/day inItaly; 0,23 ng/kg bw/day vs 0,32 ng/kg bw/day in the Netherlands; 0,05 ng/kg bw/day vs0,06 ng/kg bw/day in UK). An intake of 0,04 ng/kg bw/day was reported for children(consumers) in UK.
• Beer
The best estimates dietary intakes from beer are reported in Table 3C.Seven out of 12 participants provided best estimate of dietary intake from beer.
Ø All population: the dietary intakes A ranged from 0,01 ng/kg bw/day (Italy), to 0,14 ng/kg bw/day (Denmark).
17
Ø Specific groups of population: no marked differences were found nor among differentgroups of population neither in comparison with all population.
• Wine
The best estimate dietary intakes from wine are reported in Table 3D. Ten out of 12 participantsevaluated dietary intake A from wine.
Ø All population: the dietary intakes A ranged from 0,02 ng/kg bw/day (Portugal) to 0,86ng/kg bw/day (Italy).
Ø Specific groups of population: the dietary intakes ranged from 0,03 ng/kg bw/day (French,consumers children) to 2,94 ng/kg bw/day (Italy, consumers only).
• Cocoa derived products
The best estimate dietary intakes from cocoa and cocoa products are reported in Table 3E.Only Germany and UK provided best estimates.
Ø All population: no data was provided.Ø Specific groups of population: the highest best estimate was related to children in both
countries (0,67 ng/kg bw/day in UK and 0,66 ng/kg bw/day in Germany).
• Dried fruits
In Table 3F the best estimate dietary intakes from dried fruits (mainly various types of vine fruitproducts) are reported.Four out of 12 countries provided estimates on dietary intake.
Ø All population: only Greece and Finland provided suitable data for the calculation of dietaryintake A (Greece: 0,001 ng/kg bw/day – Finland: 0,02 ng/kg bw/day).
Ø Specific groups of population: the highest best estimates were related to consumers aged1,5-4,5 in UK (2,20 ng/kg bw/day as sum of various types of vine fruit products) while thelowest level was for Greece (all group of population).As for UK data the difference between values for consumers 16-64 and 1,5-4,5 years, is dueto different consumption rates within these two groups, as provided by the Member State.
• Meat products
Three countries provided estimates of dietary intakes from meat.Best estimates of the dietary intakes from meat and meat products are shown in Table 3G.
Ø The highest calculated intake value was observed for Germany (girls 4-6 year; 0,2 ng/kgbw/day).
18
• Spices
Best estimates of the dietary intake from spices are shown in Table 3H. The calculation is relatedonly to Italian data.
• Other food commodities
Six countries provided occurrence and consumption data necessary for the intake calculation fromother food commodities. Best estimates of the dietary intakes are shown in Table 3I. Among all thefood categories included in this group, fruit juices seem to play the major contributing role with thehighest value reported by France for 2-14 years children (0,88 ng/kg bw/day).
4. OA OCCURRENCE IN BIOLOGIC FLUIDS
Another approach to assess the exposure to mycotoxins in general and OA in particular isrepresented by monitoring programmes also in biological fluids. This approach for the evaluation ofdietary intake can be compared to that calculated through consumption data and incidence ofcontamination in food.Data deriving from studies on biomarkers represents also a tool for supplying information on theimpairment to human health attributable to mycotoxins.A total of N = 2.712 data on OA occurrence in serum and plasma was provided by 6 countries(Germany, Italy, Norway, Spain, Sweden and UK).A summary of OA occurrence data in human biological fluids and tissues is reported in Table 4.The considered biological fluids and tissues were serum (included one sample of umbilical cord),plasma, urine, milk, amniotic fluid, placenta and funiculum. OA levels in samples of urine andplasma as derived from special diets (ethnic and vegetarian) were provided by UK. Some countriesprovided also data on serum samples collected from defined groups of population (male, female,children, pregnant women, women at birth). One country (Italy) has reported data on OA in serumsamples associated to working places. In some specific groups of population the number of samplesseems not to be representative of the group.The range of OA concentration in individual serum/plasma samples was 0,11 ug/L (Germany) –5,58 ug/L (Spain), the wide range not being explained in terms of differences in LOD.The weighed mean 1 (as defined for occurrence data) for adult European population was 0,34 ug/Land the mean 2 (as defined for occurrence data) was 0,35 ug/L.The means 1 for pregnant women (Germany and Italy) was 0,31 ug/L and 0,25 ug/L, and the mean1 for children (Germany) was 0,15 ug/L (see Table 4).The mean 1 level for adult population among countries ranged from 0,18 ug/L (Norway) to 1,19ug/L (Spain).
4 A. ESTIMATE OF THE OA DIETARY INTAKE ON THE BASIS OF OA LEVEL INSERUM/PLASMA
OA levels in serum/plasma samples as reported in Table 4 were used to calculate the estimate dailyintake through the Klaassen equation:
K0 = ClpxCp/A= 1.97 Cp
K0 = continuous dietary intake (ng/Kg bw/ day)Clp = plasma clearance (ml/kg bw/ day)Cp = plasma concentration of OA (ng/ml)
19
A = bioavailabilityAccording to Hagelberg (J. of Appl. Toxic., 9, 91, 1989) the bioavailability of OA is around 50%and plasma clearance is calculated by considering renal filtration as the only route of elimination.In Table 4A the estimated daily intakes calculated from OA serum/ plasma concentration accordingto Klaassen equation are reported. It was assumed that Cp values in plasma can be consideredsimilar to Cp in serum.In the same Table, means 1 for OA level in serum/plasma in each country and for group ofpopulation, and the estimated daily intakes, as calculated on the basis of occurrence andconsumption data, are also reported.In order to make the correlation as representative as possible, figures associated to similar groups ofpopulation have been compared.Calculation was not performed for samples of workers (Italy), since the subjects were exposed to asource of exposure (inhalation of OA contaminated dust) additional to ingestion. Also data fromumbilical cord, amniotic fluid, placenta and funiculum was not used in the calculation of intakes byKlaassen equation.The estimated daily intake by Klaassen equation ranged from 0,41 ug/L (Sweden) to 2,34 ug/L(UK).
By comparing results of the two approaches (estimated daily intake from serum/plasma and fromoccurrence/consumption data in all population), each country presented rather unaccountableresults: in Germany, Sweden and Norway the estimated daily intakes from fluids are lower thanthose deriving from food occurrence data; Spain and UK presented the opposite trend since intakescalculation from human fluids were higher than those from occurrence in food commodities. Italypresents a different situation depending on the group of population taken into account.
5. OA LEVEL IN HUMAN MILK AND ESTIMATED DIETARY INTAKES FOR BABIES
Data on human milk (N = 324) were provided by Germany, Italy, Norway and Sweden and arereported in Table 5. The range of mean 1 values on individuals was 0,01 – 0,24 ug/L and the maxvalue was 2,35 ug/L (Italy). The overall weighed means 1 and 2, approximately indicating anaverage European level, were 0,09 and 0,18 ug/L.Even if at quite low levels of contamination, OA level in milk samples from Italy were ten foldhigher than in other countries. No other data from Southern countries in human milk were available.
In Table 5A the calculated OA intake from human milk is reported.The intake was calculated on the basis of the 600 ml milk consumption (100 ml/suck) and on mean1 as OA level in milk. The average calculated intake from human milk ranged from 1,00 ng/kgbw/day (Norway) to 24,00 ng/kg bw/day (Italy).
20
DISCUSSION AND CONCLUSIONS
Participating countries provided a conspicuous number of data on OA occurrence, related to foodcommodities considered as the most susceptible to OA contamination, and on their consumption.The considerably high number of data on biological fluids also demonstrated the interest in thisarea.The bulk of information allows to draw relevant conclusions from different points of view and toprovide recommendation for future work.
OCCURRENCE
• Status of OA contamination of foodstuffs in each European country (for detailedcomments on each food commodities see Section on Occurrence):
o the number of positive samples in Task 3.2.7 (48.8%) was much higher thanin the previous Task (18.6%), probably due to the improvement in thedetection limits of the employed methods of analysis and to the highernumber of analysis.
o even though to a less extent with respect to previous Task, the lack ofharmonisation in sampling procedures and in analytical methods could insome cases influence the soundness of the results. Nevertheless the providedinformation on the OA occurrence depicted a sufficient overall scenario ofOA contamination, to be used as the benchmark for future Europeanlegislation.
o a lack of information on many susceptible food commodities still persists inmany countries, strongly influencing the evaluation of the overall intakeboth at European and at national level.
o in consideration of the forthcoming communitary maximum limits that mostprobably will be put into force in the next future for cereals and dried vinefruits, the provided occurrence data for cereals showed levels ofcontamination much lower than the proposed legal limits, leading to ageneral conclusion that cereal products circulating in EU are of goodsanitary quality with respect to OA contamination.
CONSUMPTION
• A scarcity of consumption data does still persist in some countries. In particular,information on single food products are generally not available for the maincontributors like cereals, wine, coffee, and beer.
• In addition, it has not been possible to handle the provided data homogeneously,since they were referred, in some cases, to all population and in other cases tospecific groups of population.
DIETARY INTAKE
The summary of contribution to dietary intake A (mean level for foodconsumption and mean 1 level for OA occurrence), from each group ofcommodities in participating Member States is presented in Table 6, both for allpopulation and for specific groups of consumers. The total dietary intake, asobtained by the summing up of contributions from the data available for
21
commodities is also given. Only the dietary intake A was taken intoconsideration due to its closeness to real situation.Each commodity considered in Table 6 contributed to the OA intake, but itshould be noted that no participating country could estimate intakes from allthe commodities known to be susceptible to OA contamination.In consideration of the already mentioned limiting factors (see occurrence andconsumption sections) some aspects contribute to overestimate or underestimatethe calculated total dietary intake:
• since it is rather unlikely that one single person is a consumer of all theconsidered food groups, the calculated total dietary intake should beconsidered overestimated when applied to consumers only.
• whenever dietary intakes were calculated on the basis of occurrence dataon raw materials, this led to an overestimation of the intakes, due to thelack of information on the OA reduction attributable to technologicalprocedures, or on the actual percentage of raw materials in the finalproduct.
• for each country, the fewer the number of the tested food, the moreunderestimated should the total dietary intake be considered.
• since in most cases, occurrence data were not corrected for recoveryfactors, an additional underestimation of the intakes should be considered.
Therefore, as shown in Table 6 and keeping into due consideration the limitationsabove mentioned, the following are the resulting contributions of each commodityto the total exposure in each country (the number of countries that provided data forthe considered commodity is indicated in brackets):
o Cereals (11 countries) represent the main source of intake in Denmark,Finland, France, Germany, Norway, Portugal, Spain, Sweden for all groupsof population taken into consideration, and they represent the major sourceof intake only for all population in the Netherlands and UK. Greece did notprovide any occurrence data on cereals. Among cereal grains, rye generallyseems to be the most frequently and heavily contaminated.
o Coffee (all countries) is the main contributor in Greece.o Beer (7 countries) contributes to the total intake to a low extent.o Wine (10 countries) represents the main source of intake in Italy and, as far
as consumers are concerned, in the Netherlands.o Cocoa (2 countries), including cocoa powder contained within chocolate,
provides a considerable contribution to the total intake in UK; suchcontribution for 1,5-4,5 years population was similar to that attributed tocereals.
o Dried fruits (4 countries) contribute generally to a low extent to the totalintake, except for young population in UK; in this country this commodity,especially raisins, represents the main source for children consumers.
o Meat and spices contribute to a low extent to the total intake.o As far as intakes from other source of contamination is concerned, the high
percentage of contribution to the overall intake is mainly due to the widevariety of specific group of food commodities taken into consideration byeach Member State. Among the category “Others”, fruit juice seems to bethe more susceptible commodity.
o Breast milk represents a relevant source of exposure for lactating babies.Taking into consideration that in the earlier stage of life this food oftenrepresents the main component of the diet, and considering that this group
22
of population should be considered highly susceptible to exposure tocontaminants, preventing measures should be designed in this respect inorder to prevent any possible risk.
The contribution of each food groups, as derived from the data in table 6, is shown in Fig.18.Cereals resulted the main contributors (50%) followed by wine (13%), coffee (10%), spices (8%),others (6%), beer (5%), cocoa (4%), dried fruits (3%) and meat (1%).As for the contribution from the wide category of “Others”, fruit juice provide the most relevantcontributors.
As far as the comparison with TDI (5ng/kg bw/day) for OA suggested by SCF (ScientificCommittee for Food. Working Group on Contaminants, 17 September 1998, SCF opinion onAflatoxin, Ochratoxin A and Patulin.) is concerned, from the observations reported in tables 6, theexposure seems to be in most cases quite below the value indicated by SCF. Nevertheless, somecountries seem to be suffering from a more relevant contamination especially if specific group ofconsumers are considered.
Since almost all countries did not provide information for some food products, a tentativecalculation of the overall intake from all OA susceptible food commodities was performed by Co-ordinators (Table 6bis) by including surrogate values according to the following rationale:
• Whenever only occurrence data were lacking, the intake data were calculated by taking intoaccount the mean occurrence values as derived for the countries belonging to the samegeographical area. The obtained intakes were divided by the body weight corresponding to thecountry under examination.
• The same procedure was applied also in the case of lack of information on consumption data. Inthis case, whenever possible, consumption data were employed for the calculation of the intake.For France, Norway and Sweden, consumption data related to consumers only were employedsince the only available.
• For those food matrices where the data from the same geographical area was scarce, the lackingdata (occurrence or consumption) was derived from the mean of all countries.
The calculated surrogate values, are typed in blue, and they were applied both to all population(normal font) and to other groups of population (italic font) as shown in Fig.19.Cereals are the main contributors (44%) followed by others (15%), wine (10%), coffee (9%), beer(7%), cocoa and derived products (5%), dried fruits (4%), meat (3%) and spices(3%).

23
FUTURE NEEDS Occurrence As far as the factors influencing the reliability of data are concerned, some lack of information stillpersists. In fact, harmonised sampling plans and methods of analysis, number and type of analysedcommodities, quality assurance of data, information on the role of technological processing on thefate of ochratoxin A should be improved.
Consumption
In consideration of the wide spectrum of methodologies used in each Member State to calculateconsumption data, research projects should be launched by EU in order to define specific guidelinesaimed at improving the harmonisation of methodology for the survey on consumption data to beadopted by each Member State.In addition, to assess more accurately the exposure of European population, data for consumers onlyshould be collected. Furthermore, in order to better address to the information regarding the intakefrom food categories data for specific groups of population like children or subdivided by agegroups should be activated.
Intake
Additional data based upon total diet or duplicate test portion should be developed in order toovercome uncertainties due to many factors including not representative sampling procedures, andinaccurate consumption data.By comparing results from Fig.18 and 19, it should be noted that the contribution to the total OAintake by cereals, wine and coffee, is rather similar, while minor modifications as shown within theremaining food groups.
24
Acknowledgements
The Co-ordinators would like to thank all participants, Dr. Rothe, Dr. Verstraete and Mrs Andrewsfor their co-operation during this Task.In addition they would like to thank Dr. Carla di Fabio and Dr. Rosamaria Caputi for their validcontribution to the preparation of this report.
25
Annex 1
Basic information on Ochratoxin A
Sources and properties
Ochratoxins are a group of structurally related secondary metabolites, that are produced by sometoxic fungi such as Penicillium Verrucosum and by Aspergillus ochraceus; occasionally alsoisolates of the common species Aspergillus niger can produce Ochratoxin A (OA) (1). OA is themain mycotoxin in the group of Ochratoxins, and it appears to be the only one of toxicologicalsignificance. OA contains an isocoumarin moiety linked by a peptide bond to phenylalanine and itis generally found in cereals, oleaginous seeds, green coffee, pulses, wine, and poultry meat. OAproduction depends on both environmental and processing conditions (climatic conditions,abnormally long storage, transportation, wet or dry milling , roasting procedures, fermentation etc.).
Biosynthesis of OA
The effects of water activity (aw) and temperature, the main factors controlling mycotoxinformation, have been elucidated for three fungal organism: A. ochraceus, P. cyclopyium, and P.viridicatum. The minimum aw values for Ochratoxin production are 0.83-0.87, 0.87-0.90, and 0.83-0.86 respectively. At 24°C, optimum aw values for A. ochraceus are 0.99 and for both Penicilliumfungi are 0.95-0.99. At optimum aw, the temperature range for OA production by A ochraceus is 12-37°C, whereas that for Penicillium ones is 4-31 °C (2).The biosynthesis of OA has been studied using both 14C- and 13C- labelled precursors. DL-[1-14C]-α-phenylalanine was incorporated into OA by cultures of A. ochraceus. Hydrolysis of thelabelled OA gave the isocoumarin acid and L-phenylalanine with the amino-acid containing all theactivity. The isocoumarin acid derived upon acid hydrolysis of OA contained all activity. Kuhn-Roth oxidation and subsequent Schmidt degradation of the acetic acid provided evidence for thepentaketide origin of the dihydroisocoumarin moiety. The origin of the carboxy group at C (8) wasestablished through the addition of DL-[methyl-14C] methionine to a resting culture of A.ochraceus. Selective degradation experiments established that the C(12) was derived from methyl-methionine (3).
Toxicity Ochratoxin A (OA) has been shown to be nephrotoxic, hepatotoxic, teratogenic and immunotoxic toseveral species of animals and to cause kidney and liver tumours in mice and rats (4). As far ashumans are concerned, the IARC (International Agency for Research on Cancer) classified OA as apossible carcinogen to humans (Group 2B), (5). With regard to nephrotoxicity, OA is considered tobe involved in the Balkan Endemic Nephropaty (BEN), a severe kidney pathology, generallyoccurring in some areas of South-Eastern Europe (Bosnia, Croatia, Bulgaria and Romania) andlinked to urinary tracts tumours (6). Wider possibilities of impact on human health are reviewed byJ. L. Richard, J. Fink-Gremmels and M. Kontaxi et al. in “Mycotoxins and Phycotoxins –Developments in Chemistry, Toxicology and Food Safety”, edited by M. Miraglia, H. P. vanEgmond, C. Brera and J. Gilbert, Alaken (1998). As regards to the toxicity of OA, it was observedthat its biotransformation is cytochrome P450 dependent in animals and humans, and it results inthe formation of metabolic intermediates active in the carcinogenic and other toxic activities. Thecytochrome stimulates the OA induced lipids peroxidation, this process involves moreover someenzymes, present in the cell, and leads to the formation of toxic metabolites (7). Actually themetabolites of OA involved in its genotoxic power are not exactly known, but it is demonstrated
26
that dietary feeding of this toxin induces renal adenomas and hepatocellular carcinomas in mice andin rats, and it is suspected for humans.As regards oral LD50 values, they are 20 mg/kg and 3.6 mg/kg in young rats and in day-old chicks,respectively; OA is also lethal to mice, trout, dogs and pigs (1).The complex toxic activity of OA is multifaceted in relation to the role of one of its structuralcomponents, L-phenylalanine, which is involved in the inhibition of numerous reactions where it isknown to function. The covalent bonds of chemical substances, or their metabolites, to DNA areconsidered a key step in the processes which induces to carcinogenesis.OA, as not ionized form, is passively absorbed in the gastrointestinal tract and throughenterohepatic circulation can undergo secretion and reabsorption (8). Moreover the absorption ofthis mycotoxin occurs in the kidney proximal and distal tubules.It has been observed that OA induces the formation of several DNA-adducts, because of itschemical structure, in many tissues. These ones are generally repaired in a few time, but in kidneythey are still present after 16 days (9). OA mean-life is longer than 500 hours, as it was establishedaccording to some studies concerning the metabolism of the toxin in monkeys, which are the animalspecies the most similar to humans (10).
Recommendations for maximum exposure The Joint FAO/WHO Expert Committee on Food Additives (JEFCA), on the basis of thenephrotoxicity of OA, proposed a provisional tolerable weekly intake (PTWI) for OA of 0.1 µg/kgbody mass (equivalent to 14 ng/kg body mass/day) (11). However on the basis of carcinogenitydata, The Working Group of the Nordic Council of Ministers proposed a maximum tolerable dailyintake of 5 ng/kg bw of toxin (12), similar to the provisional tolerable daily intake (PTDI)established by the Canadian authority (1.2 - 5.7 ng/kg bw) (13). In 1998, taking into account the SCOOP data, the Scientific Committee for Food of the EuropeanCommission suggested that it was prudent to reduce exposure to OA as much as possible, “ensuringthat exposures are towards the lower end of the range of tolerable daily intakes of 1.2-14 ng/kgbw/day which have been estimated by other bodies, e.g. below 5 ng/kg bw/day” (14).
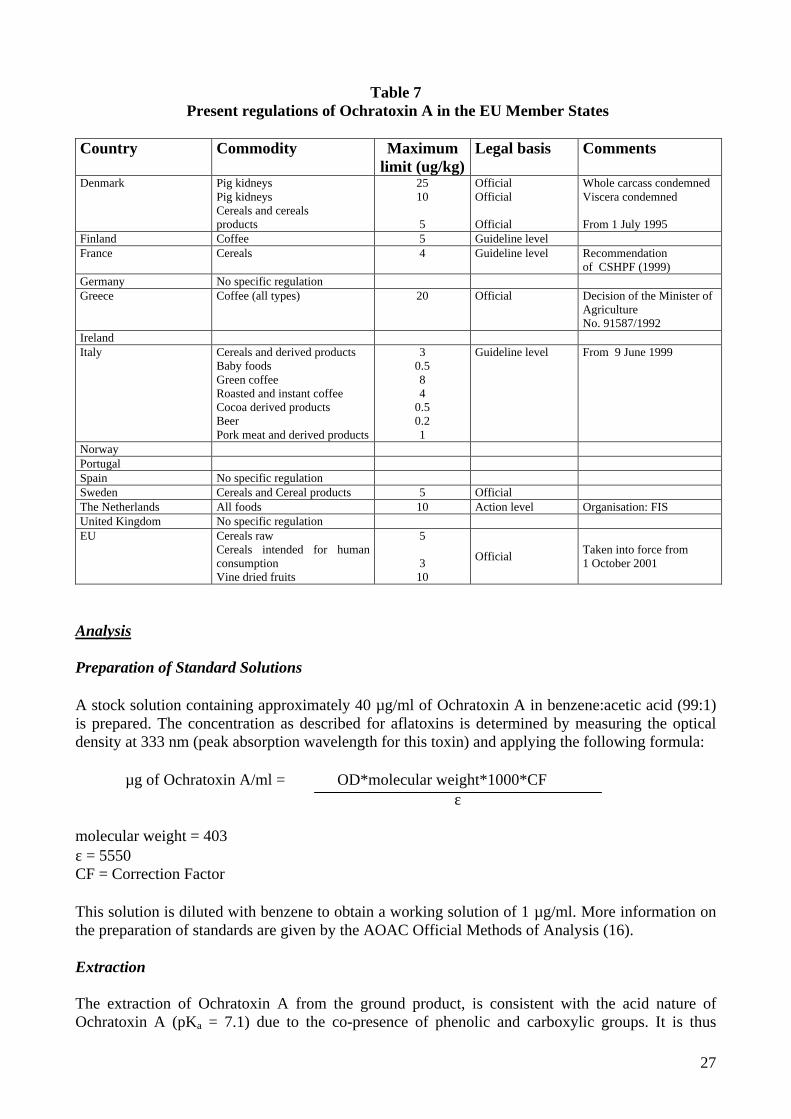
Ochratoxin A regulation in EU Member States As far as regulation is concerned, nine countries set specific regulations for OA in one or morecommodities at levels ranging from 1 to 50 µg/Kg for foods, and from 5 to 300 µg/Kg for animalfeeds (15). In 1999, a regulation was taken into force in Italy, establishing the maximum acceptablevalues for the contamination by OA in some food commodities (cereals and derived productscoffee, baby foods, cocoa and derived products, beer, pig meat).
27
Table 7 Present regulations of Ochratoxin A in the EU Member States
Country Commodity Maximumlimit (ug/kg)
Legal basis Comments
Denmark Pig kidneysPig kidneysCereals and cerealsproducts
2510
5
OfficialOfficial
Official
Whole carcass condemnedViscera condemned
From 1 July 1995Finland Coffee 5 Guideline levelFrance Cereals 4 Guideline level Recommendation
of CSHPF (1999)Germany No specific regulationGreece Coffee (all types) 20 Official Decision of the Minister of
AgricultureNo. 91587/1992
IrelandItaly Cereals and derived products
Baby foodsGreen coffeeRoasted and instant coffeeCocoa derived productsBeerPork meat and derived products
30.584
0.50.21
Guideline level From 9 June 1999
NorwayPortugalSpain No specific regulationSweden Cereals and Cereal products 5 OfficialThe Netherlands All foods 10 Action level Organisation: FISUnited Kingdom No specific regulationEU Cereals raw
Cereals intended for humanconsumptionVine dried fruits
5
310
Official Taken into force from1 October 2001
Analysis
Preparation of Standard Solutions
A stock solution containing approximately 40 µg/ml of Ochratoxin A in benzene:acetic acid (99:1)is prepared. The concentration as described for aflatoxins is determined by measuring the opticaldensity at 333 nm (peak absorption wavelength for this toxin) and applying the following formula:
µg of Ochratoxin A/ml = OD*molecular weight*1000*CF ε
molecular weight = 403ε = 5550CF = Correction Factor
This solution is diluted with benzene to obtain a working solution of 1 µg/ml. More information onthe preparation of standards are given by the AOAC Official Methods of Analysis (16).
Extraction
The extraction of Ochratoxin A from the ground product, is consistent with the acid nature ofOchratoxin A (pKa = 7.1) due to the co-presence of phenolic and carboxylic groups. It is thus
28
possible to extract Ochratoxin A with organic solvents in acid medium, especially whenimmunoaffinity columns are used for further purification. Extraction methods are similar to thosedescribed for aflatoxin, i.e. shaking (mechanical or magnetic) for 30 - 60 min. or blending from 1 to3 min. with Ultra Turrax apparatus or Waring Blendor. The most common extraction solvents aremixtures of acetonitrile or methanol and water, chloroform and 0.1 M H3PO4, toluene/2Nhydrochloric acid /MgCl2 or aqueous solutions in alkaline medium, e.g. bicarbonate.
Clean-up
Basically the clean-up step may consist of the two approaches already described in the aflatoxinsection, e.g.: i) the use of solid phase extraction (SPE) columns or ii) the use of immunoaffinity (IA)columns.
Purification by the immunoaffinity column can be carried out manually, or by using acommercially available automated sample preparation system. After the conditioning of theimmunoaffinity column with PBS (20 ml), the sample extract (50 ml) is pushed through the columnat a flow rate of approximately 5 ml/min. The column is washed with distilled water and OchratoxinA is eluted from the column with methanol for HPLC over 2 min., collecting the eluate in a 4 mlamber vial. The sample is diluted with water before HPLC analysis. In some cases (e.g. beer and wine) the sample is loaded directly into the column without anyextraction step. A unique IA column with a specificity both for aflatoxins and Ochratoxin A hasalso recently become available.The main disadvantages of an immunoaffinity clean-up for OA, could in some cases be the lack ofspecificity for Ochratoxin A, since a cross-reaction with Ochratoxin C can occur (17), the potentialcontamination with release of Ochratoxin A from the support of the IA (18), and the high cost ofeach column, even though some authors considered the possibility of regenerating the column forfurther analyses (19).
HPLC Analysis
The general principles reported for aflatoxins are applicable also to Ochratoxin A. Morespecifically, methods currently existing for the determination of Ochratoxin A by HPLC, are basedprincipally on fluorescence detection with an excitation wavelength of 330-333 nm, and anemission wavelength of 445-470 nm. The mobile phases most commonly used are a binary mixtureof water : acid (acetic or phosphoric): acetonitrile in ratios such as 99:2:99, 100:1:100, 47:2:51,220:2:99, and 43:2:57. Retention times vary from 6 to 14 minutes depending on the type of LCcolumn.
Confirmation of the identity
Three methods are usually adopted for confirmation of Ochratoxin A:i) Methylation (Method A and B)ii) Ammonia derivative formationiii) LC-MS confirmation.
i) Methyl ester formation:Method A: 50 µl (ca 250 ng) of the stock solution or of the purified extract is transferred into a
reaction tube. 1 ml of boron trifluoride is added to the methanol, the cap is closed and the tubekept on a block heater (80°C) for 10 min. 2 ml of water and 2 ml of n-hexane are added. Aftermixing thoroughly the layers are left to separate. Using disposable glass Pasteur pipettes, theupper layer is transferred to a clean small vial. The extraction is repeated another two times with2 ml portions of n-hexane. The hexane extracts are taken to dryness with a nitrogen stream, andthe residue dissolved in 1-2 ml of injection solvent. OA is confirmed by the presence of an OA-methyl ester peak at delayed retention time, and the disappearance of the OA peak (20).
29
Method B: This method was originally published by Uchiyama et al.(21): two hundred microlitersof the purified extract was evaporated to dryness and 2.5 ml methanol and 0.1 ml concentratedHCl were added. The solution was left standing overnight at room temperature. The methanolwas evaporated and the residue was taken up in 200 µl acetonitrile.
ii) Ammonia derivative formation: the derivatisation is carried out using a 10% ammonia solutionmixed with the column effluent (22). The main advantages are an increase in sensitivity (1.7times the signal of the underivatised Ochratoxin A), and the availability of a confirmation test forOchratoxin A, as a consequence of this change of sensitivity. A second HPLC pump, similar tothat described in fig.2 for aflatoxins, and a reaction coil of 10 cm are necessary. Conditions areas follows: 0.5 ml/min as flow rate, room temperature, excitation wavelength of 370 nm, andemission wavelength of 460 nm . Further confirmation can be obtained by making achromatographic run of the derivatised Ochratoxin A, at the wavelengths normally used forunderivatised Ochratoxin A, i.e. 333 nm for excitation and 470 nm for emission. Thedisappearance of the derivatised Ochratoxin A peak will act as a confirmation of its presence(23).
iii) Confirmation by LC-MS, is not largely used, since it involves expensive apparatus, and rathergood experience in the technique is needed. Abramson (24) illustrated the advantages resultingfrom the combination of liquid chromatography and mass spectrometry for Ochratoxin A inbarley. Among the types of interfaces most used for Ochratoxin A analysis were thermospray,direct liquid induction (DLI) and the moving belt. Sensitivity is one of the weakest point of thistechnique, but can be enhanced by operating MS in selected ion monitoring (SIM) mode and insome cases with negative-ion chemical ionisation (NCI). Ominski et al.(25) used LC-MS for theconfirmation of Ochratoxin A in serum samples of swine. The quadruple mass spectrometer wasequipped for negative-ion chemical ionisation and Ochratoxin A standards werechromatagraphed and scanned from masses 150-450 to determine retention time and ion mass.For maximum sensitivity, sample extracts were analysed by monitoring the ion of mass 403.1.
References
1- Pitt J.I., Toxigenis fungi and mycotoxins, Br. Med. Bull., 2000, 56 (1), 184-92
2- 2Krogh P, Mycotoxins in food, edited by Academic Press, 1987.
3- Creppy E., Castegnaro M., Dirheimer G., Human Ochratoxicosis and its patologies, Eds E.Colloque INSERM/ John Libbey Eurotext Ltd. 1993, vol. 231.
4- Ochratoxin A- Toxicological Evaluation of Certain Food Additives and Contaminants, WHOFood Additives series 35, World Health Organization (WHO), Geneva, 1996, pp. 363-376.
5- IARC Monographs on the evaluation of carcinogenic Risks to humans, some naturallyOccurring Substances: Food Items and Constituents, Heterocyclic Aromatic Amines andMycotoxins, Vol. 56, International Agency for Research on cancer, Lyon, 1993, pp. 489-521.
6- M. Castegnaro, R. Plestina, G. Dirheimer, I.N. Chernozemisky, H. Bartsch (Eds.), Mycotoxins,Endemic Nephropaty and Urinary Tracts Tumours, IARC Scientific Publication No. 115,International Agency for Research on cancer, Lyon, 1991.
7- Fink-Gremmels J., Blom M.J., Woutersen van Nijnantem F.M.A., Jahn A., de Groen E.M.,Biotransformation process in the etiology of ochratoxicosis. In: Molecular Approaches to FoodSafety: Issues Involving Toxic Microorganisms. M. Eklund, J.L. Richard, K. Mise (Eds.).Alaken, Inc., Ft. Collins, 1995, pp 107-121.
30
8- Frohlich A.A., Marquardt R.R., Ominsky K.H., Ochratoxin A as a contaminant in the humanfod chain: a Canadian perspective. In: Mycotoxins, Endemic Nephropaty and Urinary TractsTumours, M. Castegnaro, R. Plestina, G. Dirheimer, I.N. Chernozemisky, H. Bartsch (Eds.),IARC Scientific Publication No. 115, Oxford University Press, UK, 1991, pp.139-143.
9- Pfhol-Leszkowicz A., Grosse Y., Kane A., Creppy E., Dirheimer G., Genotoxicity and DNAbinding of Ochratoxin A, as ubiquitous mycotoxin found in food and feed, 1993, In: DenglerH.J., Mutschler E., Eds. Metabolism of Xenobiotics and clinical pharmacology, Gustav FischerVerlag.
10- Holberg S., Hult K., Fuchs R., Toxicokinetics of Ochratoxin A in several species and itsplasma binding properties, J. Appl. Toxicol., 9, 91-96, 1988.
11- Ochratoxin A- Toxicological Evaluation of Certain Food Additives and Contaminants, WHOFood Additives series 35, World Health Organization (WHO), Geneva, 1996, pp. 363-376.
12- M. Olsen, I. Thorup, I. Knudsen, J.-J.Larsen, B. Hald, J. Olsen, in: Nordiske Seminar-ogArbejds-rapporter, Health Evaluation of Ochratoxin A in Food Products, Vol.545, NordicCouncil of Ministers, Copenhagen, 1991.
13- T. Kuiper-Goodman, Food Addit. Contam. 13 (Suppl.), 1996, 53.
14- Scientific Committee on Food Opinion on Ochratoxin A, CS/CNTM/MYC/14 final, Annex IIto Document XXIV/2210/98, European Commission, Bruxelles, 17 September 1998.
15- Food and Agriculture Organization of the United Nations (FAO), World-wide Regulations ForMycotoxins 1995- A Compendium, FAO Food and Nutrition Paper 64 , FAO, Rome, 1997.
16- AOAC, Official Method of Analysis of the Analytical Chemist. 15th Edition, 1990, chapter 49
17- Zimmerli B, Dick R. Ochratoxin A in table wine and grape-juice: occurrence and riskassessment. Food Add. Contam. 13(6): 665-668, 1996.
18- Zimmerli B, Dick R. Determination of Ochratoxin A at the ppt level in human blood, serum,milk and some foodstuffs by high-performance liquid chromatography with fluorescencedetection and immunoaffinity column clean-up: methodology and Swiss data. J Chrom. B 666:85-99, 1995.
19- Scott P.M., Trucksess M.W. Application of immunoaffinity columns to mycotoxin analysis. J.AOAC Int. 80(5): 941-949, 1997.
20- Cantafora A., Grossi M., Miraglia M., Benelli L. Determination of ochratoxin A in coffeebeans using reverse phase high performance liquid chromatography. Riv.. Soc. Ital. Sci. Alim.12(2): 103-108, 1983.
21- Uchiyama S., Saito Y. Uchiyama M. Protein-binding of Ochratoxin A and its extractabilityfrom proteinous food. J. Food Hygene Soc. Japan 26: 651-657, 1985.
22- Hunt D.C., Lesley A., Philip N., Crosby N.T. Determination of Ochratoxin A in pig’s kidneyusing enzymic digestion, dialysis and high performance liquid chromatography with post-column derivatization. Analyst 104: 1171-1175, 1979.
31
23- Micco M., Ambruzzi M.A., Miraglia M., Brera C., Benelli L., Corneli S. Evaluation ofOchratoxin A in human milk. Food Add. Contam. 12: 351-354, 1995.
24- Abramson D. Measurement of Ochratoxin A in barley by liquid chromatography-massspectrometry. J. Chrom. 391: 315-320, 1987.
25- Omiski K.H., Frohlich A.A., Marquardt rR.R., Crow G.H., Abramson D. The incidence anddistribution of Ochratoxin A in western Canadian swine. Food Add. Contam. 13(2): 185-198,1996.
32
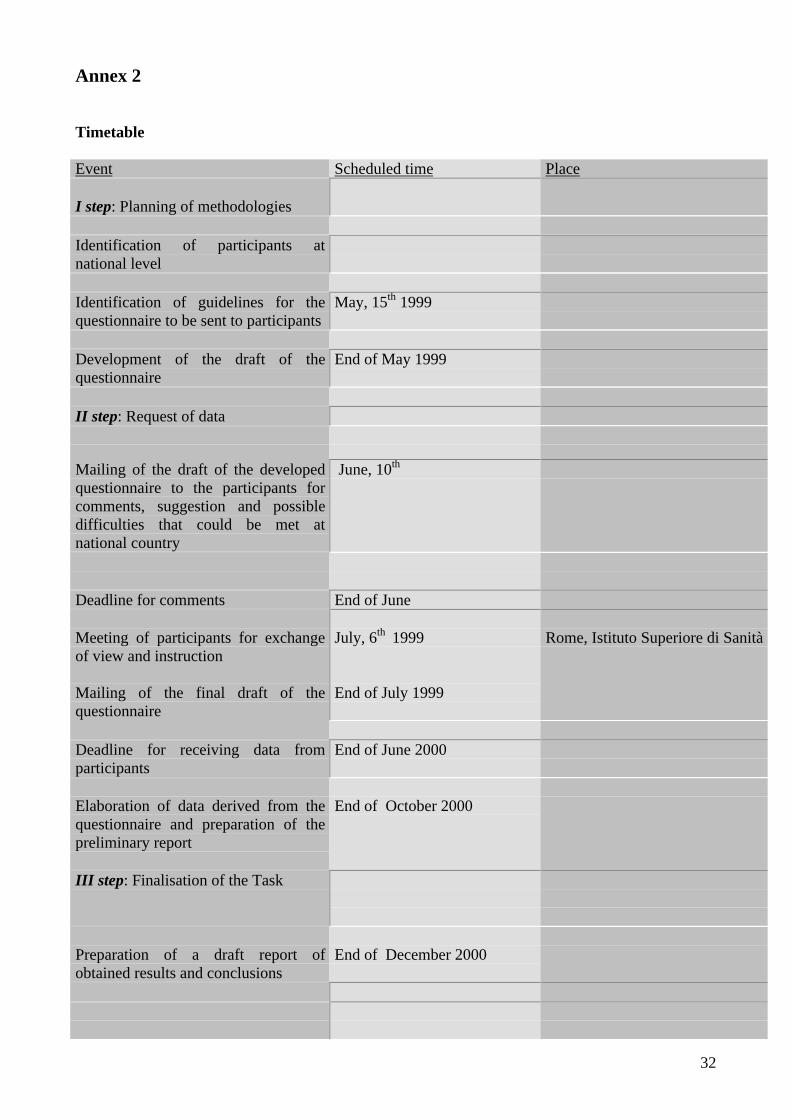
Annex 2
Timetable
Event Scheduled time Place
I step: Planning of methodologies
Identification of participants atnational level
Identification of guidelines for thequestionnaire to be sent to participants
May, 15th 1999
Development of the draft of thequestionnaire
End of May 1999
II step: Request of data
Mailing of the draft of the developedquestionnaire to the participants forcomments, suggestion and possibledifficulties that could be met atnational country
June, 10th
Deadline for comments End of June
Meeting of participants for exchangeof view and instruction
Mailing of the final draft of thequestionnaire
July, 6th 1999
End of July 1999
Rome, Istituto Superiore di Sanità
Deadline for receiving data fromparticipants
End of June 2000
Elaboration of data derived from thequestionnaire and preparation of thepreliminary report
End of October 2000
III step: Finalisation of the Task
Preparation of a draft report ofobtained results and conclusions
End of December 2000
33
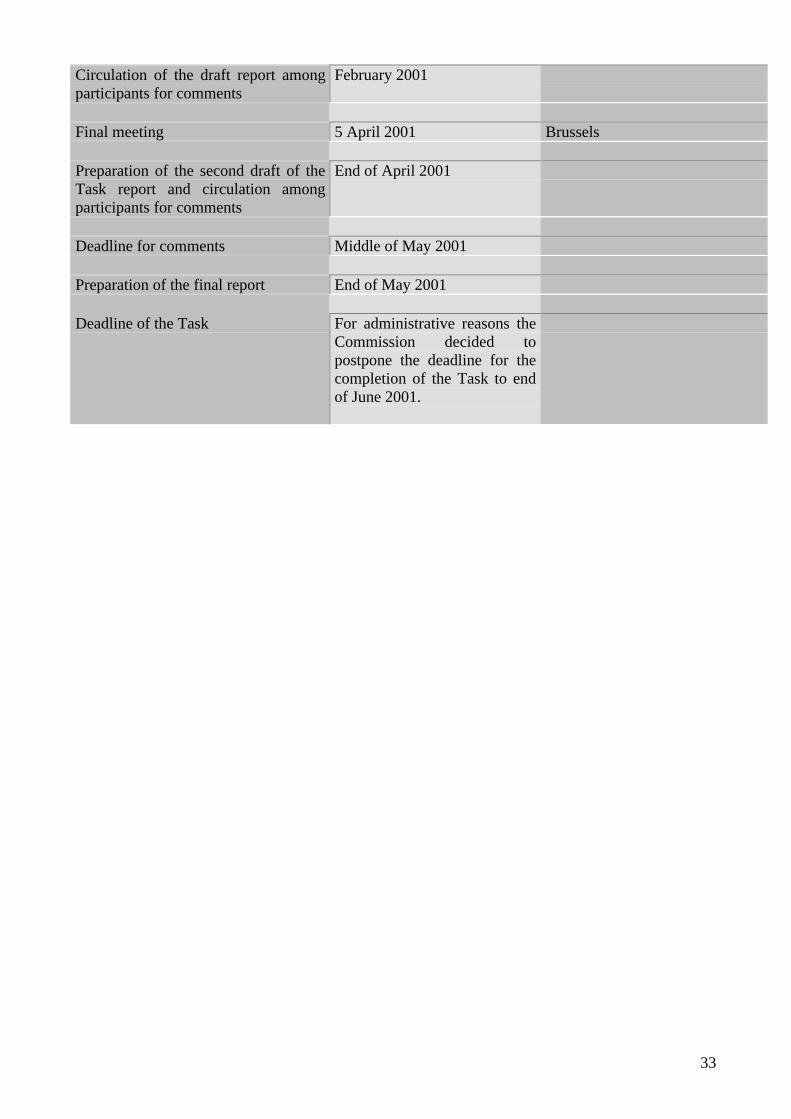
Circulation of the draft report amongparticipants for comments
February 2001
Final meeting 5 April 2001 Brussels
Preparation of the second draft of theTask report and circulation amongparticipants for comments
End of April 2001
Deadline for comments Middle of May 2001
Preparation of the final report End of May 2001
Deadline of the Task For administrative reasons theCommission decided topostpone the deadline for thecompletion of the Task to endof June 2001.
34
Annex 3
Instruction for participants
Subject: SCIENTIFIC COOPERATION ON QUESTIONS RELATING TO FOOD; Task 3.2.7"Assessment of dietary intake of Ochratoxin A by the population of EU Member States"
INFORMATION TO PARTICIPATING INSTITUTES*
Scientific Co-operation on Questions Relating to Food: preparation of a working documentupdating the report EUR 17523 (November 1997)
Task 3.2.7 "Assessment of dietary intake of Ochratoxin A by the population of EU Member States"
Background
As reported the document SCOOP/CNTM/9 Rev 3 “Council Regulation (EEC) 315/93 of 8February 1993 provides the legal framework for establishing maximum levels for foodcontaminants at Community level.In 1995, a Task 3.2.2 concerning the assessment of dietary intake of Ochratoxin A by thepopulation has been completed and resulted in report EUR 17523 "Assessment of dietary intake ofOchratoxin A by the population of EU Member States". It was admitted that the estimates of dietaryintakes of Ochratoxin A in that report were based on a limited amount of data.A grawing interest and concern of the public authorities for the presence of naturally occurringtoxicants in the human food, such as aflatoxins, Ochratoxin A, and the discussions at Communitylevel concerning the fixing of maximum limits, have resulted in a more frequent control on thepresence of naturally occurring toxicants, in particular aflatoxins and Ochratoxin A, in food.Research has also been launched to link the occurrence of Ochratoxin A in human blood plasmawith dietary intake patterns.As a consequence, many recent data on the occurrence of Ochratoxin A in human food and humanblood plasma has become available since 1995 i.e the presence of Ochratoxin A in raisinswas-reported only recently. It seems therefore appropriate to update the Task undertaken in 1995and complete it with the recent data, in order to check if these recent data do not change theconclusions of the report EUR 17523.”
Commission Decision 1999/143/EC, of 27 January 1999 amending Decision 94/652/ECestablishing the inventory and distribution of Task to be undertaken within the framework of co-operation by Member States in the scientific examination of questions relating to food, establishedTask 3.2.7 "Assessment of dietary intake of Ochratoxin A by the population of EU Member States".Italy was designated as Member State to develop the Task
Objectives
To provide the scientific basis for the evaluation and management of risk to public health arisingfrom dietary exposure to Ochratoxin A, taking into account recent available data. Particularemphasis is placed on evaluation of dietary intake of Ochratoxin A in each Member State and inhigh-risk sub-groups of the population.
Timetable
The timescale for the Task is attached in Annex 2.
35
General statements on the development of the Task (according to document SCOOP/ GEN/ 25Rev.3 , January 1998)The Co-ordinators take overall responsibility for carrying out the agreed work, including invitingfurther experts to participate, after consultation of the secretariat, and preparing the workingdocument to fulfil the objective of the Task.
In this respect the Co-ordinators will:• Establish a common format for the submission of information• Obtain and collate relevant information available to the Member State, exploring the quality or
validity of data submitted with the expert submitting that data and if necessary with the Taskgroup as a whole
• Prepare the working document in an agreed format• Maintaining an agreed time-scale
The participating Institutes will provide the co-ordinator with the latest national information inaccordance with the agreed format.They should also:• Ensure that information provided to the Task group and any working papers is regarded as
confidential until the final report has been endorsed by the SCOOP Working Group, exceptwhere information is already of the public domain
• Ensure that information submitted as part of the Task meets the required specification and isprovided by the agreed date.
Information to be collected by the participating Institutes
Participating Institutes from each country, on the basis of information available in their country(publications, reports and results of surveillance programmes), are requested to provide informationrelated to Ochratoxin A.
Any relevant information collected over the last four years should be included i.e., from 1995inclusive.Also recent data intended for publication should be included.
Since in principle minimum data aimed at gathering information on exposure to Ochratoxin A insupport to SCF work are requested, the basic requested information mainly deals with:
1. The occurrence of Ochratoxin A in foods and beverages imported and commercialised in theirown country.
2. Consumption data of the relevant foods and beverages.3. Dietary intake of Ochratoxin A for specific groups of population on the basis of occurrence and
consumption data.4. Occurrence of Ochratoxin A in human blood , milk and other biological fluids and tissues.5. Occurrence of Ochratoxin A in working places.6. Regulations related to Ochratoxin A (maximum limits, sampling plans, others).
In addition, in view of the peculiarity of the contaminant under discussion and the relevance ofseveral issues, additional data are well accepted. Such data may include information, gathered inparticipant country, dealing with different topics (dietary intake, sensitivity of particular group ofpopulation, influence of technological or cooking procedures, changes in agricultural techniques,prevention actions, consideration in HACCP or other systems etc.) to be included in a separate partof the report.
36
It is accepted that participants will not always be able to provide the information requested. All theinformation should be given in English and collected electronically.
Guidelines for participants
Participating Institutes are asked to provide summaries of the data for their country as described inthe next sections 1, 2, 3, 4, 5 and 6 using the given Tables (1-5) and forms (1-6) to report their data.The Tables and forms should be copied in needed quantities by the participants. With respect tonumeration of the Tables, each number(1,2……..) is referred a topic (occurrence, consumption etc)and is subdivided for the different issues. The Tables and forms are also distributed as………..The rationale in the organisation of the Task is that the part of the Tables will provide the basicinformation for the SCF, while others will contribute with additional information that will beincluded in the final report and could be taken into consideration by SCF.Original reports, publications and analytical raw data cannot be evaluated, but copies of the originalliterature (original reports, publications etc.) should be sent to the co-ordinator in a reasonableextent (at least main Tables and figures from the original literature). All the used references shouldbe numbered consecutively and the numbers should be used in Tables and forms for identification.
References should be provided in the format prescribed by the journal 'Food Additives andContaminants' e.g.,
HOAD, A. B., and LUMLEY, R., 1981, Leaching of antioxidants by packaged cheese from filmwrappings. Journal of Food Packaging, 18, 179-188.
Food categorisation system
As the grouping of the data in food categories is concerned, the CODEX ALIMENTARIOUS System………….is adopted as basic system. However, since it has been shown not fully adequate to thepurpose, it was considered necessary to make further subdivisions to the groups. A modified systemfor food grouping and sub grouping is given in Anne 1 , in which subgroupings that take intoaccount specific foods for which OA contamination is considered relevant. In the subgroup“other” participants can allocate data related to foods other than those specifically indicated.For each food category for which data (occurrence, consumption, intake) are reported insubgroups it is requested to calculate also the sum for the subgroups and refer it to the group.The previous procedure should, in principle, allow the collection of all possible data. However, ifin the opinion of the participant an alternative “free food categorisation system” better fits with thebulk of the available data, he/she can, in addition to the fixed categorisation system, collect datain separate Tables you can use a “free” categorisation system and therefore 1) arrange groupsthat best fit with data available in your country or that could in principle benefit the reliability ofthe final result 2) report occurrence data for single kind of food that are part of a category inAnnex 3. As an example it might be necessary to combine kind of foods in one group, because onlyconsumption data are available for that group and not for the separate products and vice versa. Itis very important that you make the scientific evaluation of the occurrence and consumption dataavailable in your country and combine them in a way, which gives the best estimate of theOchratoxin A intake in your country. Suggestions and comments from participants on the adaptedversion ( Annex 2) of the CIAA Food Categorisation system on the food labelling and food groupingand sub grouping is well accepted for discussion a few days before the first meeting ( 6th July)
1. Occurrence data
Participants are requested to summaries occurrence data for Ochratoxin A in food and beverages.Data could be referred to:
37
1. goods collected at port of entry ( in bulk or in packaging )2. food and beverages sold at retails3. data related to studies on total diet, market basket, duplicate portion
• Data related to points 1 and 2 will be reported in Tables 1A (Table 1A: occurrence dataaccording to food categorisation in Annex 2; Table 1A bis: occurrence data according to “free “food categorisation, Table 1A tris : best estimates of the data reported in Tables 1a and 1a bis);
• Data related to points 3 will be reported in Tables 1B (Table 1B: data indicated in point 3, Table1B bis: best estimate of data in Table 1B)
Comments on Tables related to occurrence data
All concentrations should be in ug/ kg with the results given on fresh weight basis. In the case ofdata that are not reported on fresh weight basis the participant is kindly requested to make thenecessary conversion, according to the characteristics of the food in their country.
Food or group: Name of food or beverage use
Ref. and year : Reference identification number (source of the occurrence data) and year ofsampling
Eventual geographic or other characteristic of the region from which samples are derived
No. of samples: Number of samples
LOQ/LOD: Limit of quantification (LOQ) or limit of detection, determination (LOD)
No. of samples < LOQ (or LOD): Number of samples less than LOQ or LOD
No. of samples containing Ochratoxin A in the range ... : Subdivision of the data of positive sampleresults into ranges LOQ (or LOD)-4.9, 5.0-9.9, 10.0-24.9, and > 25 pg/kg. If this subdivision isconsidered inadequate, please fill the Table in the best possible way and in addition report the samedata in a similar Table with “free” subdivision.
Maximum value: The highest concentration found
Mean ( 1): Arithmetic mean value of all samples (both positive and negative samples)Mean (2) Arithmetic mean value of all positive samplesMedian: 50th percentile
Evidence of AQA: Evidence of Analytical Quality Assurance both for sampling and for analysis:Yes or no; more information (accredited laboratories etc.) can be given in form 1.
Random or target: Were the samples taken for suspicion control or randomly for survey
Sampling strategy : procedures employed for the sampling ( both from bulk and at retails)
Representative for the Member State: Are the data evaluated to be representative for thecontamination level of Ochratoxin A in the given food in the Member State?: Yes or no; moreinformation can be given in form 1
Analytical method: HPLC/Fluor, TLC …, possibly provide reference of the employedmethodology if different from the authors of the occurrence data
38
For each food or beverages, where results from more than one survey are available, best estimatesshould be given in appropriate Tables. These best estimates should be used for the intakecalculation described in section 3.
In addition please consider that :• If only occurrence data are available for unprocessed cereals, for instance wheat grain, and
consumption data are available for wheat bread, it will be necessary to calculate how muchwheat grain there is in wheat bread taking water content, extraction rate etc. into consideration.
• If data are available for both foreign and home grawn cereals please report them separately. Inrelation to the estimation of the Ochratoxin A intake the used data should naturally reflect theconsumed cereals in the country, so information on the ratio between foreign/home grawncereals consumed is needed.
• Since different definitions are used for the limit of quantification (LOQ), determination,detection (LOD), participant must use the occurrence data as they are available and describe inform 1 and form 4 how the used limits are defined and used .
Comments on Form 1
Every reported reference should be described in form 1. Participant are strongly request to give theiropinion on the overall level of reliability of the data given in the reference, in relation to the theircontribution to the estimate of the overall intake of Ochratoxin A
2. Food consumption data
Institutes should provide an estimate of the food consumption data for an average adult person inthe Member State even for food items for which occurrence data on OA are not available in thatMember State. Where possible, values for mean/median and high level consumption ( 95thpercentile) for an average adult and data for sub-group of population ( population adult males,adult females, adolescents, children, infants , vegetarians, ethnic etc.) should be provided. In allcases the age range should be specified. In addition since the difficulties in obtaining food consumption data exactly relevant to a specificfood category are well known, it is suggested that the Institutes provide any information that theyhave available on consumption of relevant foods and beverages together with comments to allowthe estimate of the limitations for the provided data ( reliability of consumption data relevant tothat specific food). As an example average alcoholic beverages consumption should be calculatedtaking into account groups of population that do not consume alcohol containing beverages. If dataallowing such correction are not available comments and indications on that should be given.
Therefore participants are requested to fill in the following Tables:1) Tables 2A1,2A2.2A3……………for each source of data and for each population group using
CIAA Food Categorisation system ( Annex 2)2) Tables 2B1,2B2,2B3……… for each source of data and for each population group using “free”
categorisation system3) Table 2C1 for the best estimate of the mean consumption and high consumption (90th , , 9 7th ) ,
for an average adult person ,using CIAA Food Categorisation system ( Annex 2)4) Table 2C2 for the best estimate of the mean consumption and high consumption (90th , , 9 7th )
for an average adult person, using “free” categorisation system5) Tables 2D1 for the best estimate of consumption for particular group of population using CIAA
Food Categorisation system ( Annex 2)6) Tables 2D2 for the best estimate of consumption for particular group of population using “free” categorisation system
39
The best estimates in Tables 2D1 and 2D2 should be used for the intake calculation described insection 3.
Comments on Tables 2: Food or group: Name of food or beverage
Ref. and year: Identification number of the reference (source of the consumption data) and periodover which data were collected Survey methods: dietary records/diary (specify period and frequency weighed intake, interview,purchase records).
Typology of Data: (all foods and beverages consumed, food intake, purchase records, home grownfood, foods eaten outside the home…..)
Sample size: Number of subjects
Data Collection: Spot, continuous (specify frequency)
Geographical level: National, regional, urban, rural (specify geographical region covered)
Mean: The arithmetic mean consumption (g/person/day)
Median: The median (50th percentile) (g/person/day)
95th percentile: Estimate of high consumption (g/person/day)
Method: Method for obtaining food consumption data: Food balance sheets, household budgetsurveys, dietary surveys .....Region : Specify geographical region covered (national, regional, urban, rural)
Representative for the Member State: Are the data evaluated to be representative for the averageconsumption of the item for an average adult person in the Member State: Yes or no; moreinformation can be given in form 2.
For each source of the food consumption data, information requested in form 2 should be given
3. Estimate of daily intake of Ochratoxin A
Please use Tables 3( A,B,C,…….) and form 3.Comments on Tables 3:
Body weight: The body weight related to the group under consideration ( average adult person (kg),adult male, adult female, …………..) in the country
Food or group: Name of food, group or beverage
Intake Mean: Best estimate from Table 2 ( referred to the corresponding group of population).
High level 95th percentile: Best estimate from the corresponding Table 2.

40
Mean Ochratoxin A level in food: Best estimate from Table 1.
Intake of Ochratoxin A * (ng/day):Mean: (mean intake of food) x (mean level in food)High level: (high level intake of food) x (mean level in food)
Intake of Ochratoxin A (ng/day/kg body weight):Mean: (mean intake of food) x (mean level in food) / (body weight)High level: (high level intake of food) x (mean level in food) / (body weight)
The best estimate of the total mean intake of Ochratoxin A for an average adult person should begiven at the bottom of Table 3. The total mean intake is simple calculated as the sum of the meanintakes of Ochratoxin A through the different foods and beverages reported.
4. Occurrence of Ochratoxin A in human blood, milk and other biological fluids
In some Member States data are available for occurrence of Ochratoxin A in human blood and milk.These data is asked to be reported in Table 4 and form 4.
Comments on Table 4 (All concentrations in µg/1).
Biological fluid, Ref: biological fluid, reference identification number
Year: Year of sampling
No. of samples: Number of samples
LOQ/LOD: Limit of quantification (LOQ) or limit of detection, determination (LOD)
No. of samples < LOQ (or LOD): Number of samples less than LOQ or LODNo. of samples containing Ochratoxin A in the range ... : Subdivision of the number of positivesample results into ranges LOQ (or L0D)-0.9, 1.0-1.9, 2.0-4.9, and > 5 µg /1.
Maximum value: The highest concentration found
Mean 1: Arithmetic mean value of all samples (both positive and negative samples).
Mean 2: Arithmetic mean value of positive samples.
Median: 50th percentile
Evidence of AQA: Evidence of Analytical Quality Assurance: Yes or no; more information can begiven in form 4.
Random or target: Were the samples. taken randomly or from a special group of people.
Geographical origin: Specify geographical region covered (national, regional, urban, rural)
Representative for the Member State: Are the data evaluated to be representative for thecontamination level of Ochratoxin A in human blood/milk in the Member State: Yes or no; moreinformation can be given in form 4.
41
Analytical method: HPLC/Fluor, TLC .....
5.Other sources of Ochratoxin A intake
It is recognised that airborne particulate contaminated by mycotoxin can represent a source ofmycotoxin for human. Participant are requested to fill in Table 5 with data on Ochratoxin Acontamination in workplaces and house, wherever available. Form 5 should contain relevantinformation on the source of the data provided in Table 5.
6. Present regulations for Ochratoxin A
Information on present maximum limits for content of Ochratoxin A in food and beverages is askedto be given in form 6.
Form 1. Occurrence data Country:
Reference No.
Summary:(main Tables, figures and summary from the reference can be copied and attached to this form)
Comments on
Evidence of Analytical Quality Assurance (AQA):
(Is it an accredited laboratory, which also participates in national or international proficiency testschemes)
Limits of quantification (LOQ) or limits of detection, determination (LOD):(How is the limit defined, difference in LOQ/LOD for different foods)
42
Annex 4
Glossary
AQA Analytical Quality Assurance
HPLC High Performance Liquid Chromatography
LOD Limit of Detection
LOQ Limit of Quantification ( determination)
OA Ochratoxin A
SCF Scientific Committee for Food
SCOOP Scientific Co-operation on Question relating to Food (Directive 93/5/EEC)
43
Annex 5
List of participants
Participating Nominated Institute Country
Italy Marina Miraglia(Co-ordinators) Istituto Superiore di Sanità
Laboratorio AlimentiReparto Chimica dei CerealiViale Regina Elena 299I -00161 RomeTel: 39 6 4990 2367Fax: 39 6 4990 2377e-mail: [email protected]
Carlo BreraIstituto Superiore di SanitàLaboratorio AlimentiReparto Chimica dei CerealiViale Regina Elena 299I -00161 RomeTel: 39 6 4990 2367Fax: 39 6 4990 2377e-mail: [email protected]
Denmark Kevin JorgensenDanish Veterinary and Food Administration, IFEFMorkhoj Bygade 19DK-2860 SoborgTel: 45 33 95 64 93Fax: 45 33 95 66 96e-mail: [email protected]
Finland Anja HallikainenNational Food AgencyP.O. Box 28FIN-00581 HelsinkiTel: 358 9 3931 540Fax: 358 9 3931 592e-mail: [email protected]
France Jean-Charles LeblancInstitut National de la Recherche AgronomiqueINA-PG16 rue Claude BernardF-75231 Paris CEDEX 05Tel: 33 144 08 72 79Fax: 33 144 08 72 76e-mail: [email protected]
44
Philippe VergerInstitut National de la Recherche Agronomique147, rue de l’universitéF-75338 Paris CEDEX 07Tel: 33 142 75 94 93Fax: 33 142 75 91 87
e-mail: [email protected]
Germany Rudolf WeberBundesinstitut fur gesundheitlichen Verbraucherschutzund Veterinarmedezin (BGVV)Thielallee 88-92, (Postfach 14191)D-14195 BerlinTel: 49 30 84 12 32 98Fax: 49 30 84 12 47 41e-mail: [email protected]
Greece Eleni Foufa and Mrs Irene StefanakiMinistry of FinanceGeneral State Chemical LaboratoryDivision of Environment16 An. Tsocha StrGR- 115 21 AthensTel: 30 1 64 79 427, 64 79 457Fax: 30 1 64 65 123e-mail: [email protected]
Ireland Alan W.D. DobsonUniversity College CorkMicrobiology DepartmentIRE - CorkTel: 353 21902 743Fax: 353 21903 101e-mail: [email protected]
Norway Arne VidnesNorwegian Food Control AuthorityPostbox 8187 Dep.N - 0034 OsloTel: 47 22 24 67 59Fax: 47 22 24 66 99e-mail: [email protected]
Portugal Ilidia FelgueirasDepartamento de Tecnologia das Industrias AlimentaresINETI-DTIAEstrada do Pago do Lumiar 221694-038 LisboaTel., 351 1716 27 12 Ext.2921Fax: 351 1 716 37 86e-mail: [email protected]
45
Spain Marìa Isabel Garcìa FajardoServicio de Normativa TécnicaSubdirecciòn General de Higiene AlimentariaDirecciòn General de Salud Pùblica y ConsumoPaseo del Prado, 18-2028078 MadridTel: 34 91 59 61 999Fax: 34 91 59 64 487e-mail: [email protected]
Pedro A. BurdaspalArea QuìmicaCentro Nacional de AlimentaciònInstituto de Salud Carlos III28220 MAJADAHONDA (Madrid)Tel: 34 91 5097931Fax: 34 91 5097926e-mail: [email protected]
Sweden Ann ThuvanderNational Food AdministrationHamnesplanaden 5, (Box 622)SE 751 26 UppsalaTel: 46 18 17 57 63Fax: 46 18 10 58,48e-mail: [email protected]
The Netherlands H.P.van EgmondNational Institute for Public Health andEnvironmental ProtectionAntonie van Leeuwenhoeklaan 9NL - 3721 MA BilthovenTel: 3130 274 24 40Fax: 3130 274 44 03e-mail: [email protected]
United Kingdom Wendy Matthews Food Standards Agency
Rm 703CAviation House
125 KingswayLondon WC2B 6NHTel: 44 20 7276 8708Fax: 44 20 7276 8717e-mail: [email protected]
46
Scientific Advisers
Anna Ferro luzziDirector Unit of Human NutritionNational Research Institute for Food and NutritionVia Ardeatina 54600178 Rome, ItalyTel: 39 06 5032412Fax: 39 06 5031592e-mail: [email protected]
Aida TurriniUnit of Statistics ad Food EconomicsNational Research Institute for Food and NutritionVia Ardeatina 54600178 Rome, ItalyTel: 39 06 5032412Fax: 39 06 5031592e-mail: [email protected]
47
Annex 6
References
Denmark
1. The Danish food monitoring system 1993-97, Part. 2: Chemical Contaminants, 2000 (in Danish).
2. Jørgensen K., Survey of pork, poultry, coffee, beer and pulses for ochratoxin A, Food Additivesand Contaminants, 1998, vol. 15, 550.
Finland
No references
Ireland
No references
France
ASPCC, CREDOC 1993/1994: Rigaud et al., 1997, Enquête française de consommationsalimentaires. Charier de Nutrition Diététique, 32,6.
Viani R., Fate of OTA during processing of coffee; Food additives and contaminants, 1996, vol. 13supplement, 29.
Germany
1. Wolff J. et al., Belastung des Verbrauchers und der Lebensmittel mit Ochratoxin A (Dietaryintake of ochratoxin A by the population of Germany, report of an unpublished research project ofthe German Minstry of Health).
2. Vrabcheva T., Gareis M., Bresch H., Bodechtel C., Engel G., Majerus P., Rosner H., Wolff J.,Occurence of Ochratoxin A and B in Spices and Herbs, Revue Méd. Vét., 1998, vol. 149, 533.
3. Vrabcheva T., Gareis M., Natural occurrence of Ochratoxin A and B in Spices and Herbs,Manuscript forwarded to Journal of Food Add. Contam. 1999.
4. Majerus P., Weber R., Wolff J., Nachweis und Bestimmung von Ochratoxin A in Getreide undGetreideprodukten, Bundesgesundheitsblatt, 1994, vol. 37, 454.
5. Beker D., and Radic, Fast determination of ochratoxin A in serum by liquid chromatography-comparison with enzymic spectrofluorimetric method, J. Chrom., 1991, vol. 570, 441.
Greece
1. The data are not published. The data for the occurrence of ochratoxin A in foodstuffs (dried vine
48
fruits, wine, coffee) are derived from official controls performed in the laboratory of the Division ofthe environment of the General State Chemical Laboratory of Greece, Tsocha 16, 11521, Athens,Greece.
2. The data for the occurrence of ochratoxin A in porcine blood serum come from the laboratory ofMycotoxins of the Institute of Biochemistry, Toxicology and Nourishment of Animals of the Centerof Veterinarian Institutes of Athens. Contact person: Mrs. Vassiliki Rousi, tel. 00301 6010903 ,6010925, fax. 00301 639 9477.
Italy
1. Miragila M., Brera C., Onori R., Corneli S., Colatosti M., Cava E., Ippoliti D., Quaglia M.,“Mycotoxins Contamination in Italy Over Last Decade”, In: Mycotoxins and Phycotoxins -Developments in Chemistry, Toxicology and Food Safety. Proceedings of IX INTERNATIONALSYMPOSIUM ON MYCOTOXINS AND PHYCOTOXINS. Eds.: M.Miraglia, H. Van Egmond,C.Brera, J. Gilbert. Alaken publisher, 1998, 601.
2. Miraglia M., Brera C., Corneli S., Cava E., Montanino G., Miraglia E., “Occurrence ofOchratoxin A (OA) in maternal serum, placenta and funiculum” In Mycotoxins and Phycotoxins -Developments in Chemistry, Toxicology and Food Safety. Proceedings of IX INTERNATIONALSYMPOSIUM ON MYCOTOXINS AND PHYCOTOXINS. Eds.: M.Miraglia, H. Van Egmond,C.Brera, J. Gilbert. Alaken publisher, 1998, 165.
3. Palli D., Miraglia M., Saieva C., Masala G., Cava E., Colatosti M., Corsi A.M., Russo A., BreraC., Serum levels of Ochratoxin A in Healthy Adults in Tuscany: Correlation with IndividualCharacteristics and between Repeat Measurements. Cancer Epidemiology, Biomarkers &Prevention, 1999, vol. 8, 265.
4. Miraglia M., Brera C., Cava E., Calfapietra F.R., Grossi S., “Exposure assessment ofOchratoxin A in lactating mothers and babies”. Proceedings of X INTERNATIONALSYMPOSIUM ON MYCOTOXINS AND PHYCOTOXINS, San Paulo, Brazil, 21-25 May 2000.In press.
Norway
1. Skaug M.A., Analysis of Norwegian milk and infant formulas for Ochratoxin A, Food Additivesand Contaminants, 1999, vol. 16 (2), 75.
2. Unpublished data
3. Unpublished data
4. Unpublished data
5. Unpublished data
6. Unpublished data
7. Unpublished data
8. Unpublished data
9. Unpublished data
10. Unpublished data
49
11. Levels of Ochratoxin A in blood from Norwegian blood donors: estimated ochratoxin intakeand correlation between levels and habits of food consumption.
12. Skakug M.A., Stormer F.C., Saugstad O.D., Ochratoxin A: a naturally mycotoxins found inhuman milk samples from Norway, Acta Pædiatr., 1998, vol. 87, 1275.
Portugal
1. Unpublished data
2. Unpublished data
3. Festas et al., Ochratoxin A in some Portuguese wines: method validation and screening in PortWine and “Vinho Verde”. Submitted to the American Journal of Enology.
Spain
1. Unpublished data. Survey study organised by The Ministry of Health and Consuming Affair andThe Institute of Health Carlos III (Centro National de Alimentatiòn).
2. Burdaspal P.A., Legarda T.M., Ochratoxin A in beers brewed in Spain and other Europeancountries, Alimentaria, 1998, vol. 291, 115.
3. Burdaspal P.A., Legarda T.M., Ochratoxin A in roasted and soluble coffee marketed in Spain,Alimentaria, 1998, vol. 296, 31.
4. Burdaspal P.A., Legarda T.M., Ochratoxin A in wines and grape products originated from Spainand Other European countries, Alimentaria, 1999, vol. 299, 99.
5. Legarda T.M., Burdaspal P.A., Occurrence of Ochratoxin A in samples of bread marketed inSpain and twelve foreign countries, Alimentaria, 2001, vol.391, 91.
Sweden
1. Mycotoxins in food- levels, intake and risks, Report from the National Food Administration,Uppsala, Sweden, no. 22/98. 2. Möller et al., Analysis of ochratoxin A in cereals, coffee, wine and beer, 1999. Unpublished data. 3. Breitholtz-Emanuelsson A., Olsen M., Oskarsson A., Palminger I., and Hult C., Ochratoxin A incow's milk and in human milk with corresponding human blood samples, Journal of AOACInternational, 1993, vol. 76, 842.
4. National Food Administration, Regulations (including ochratoxin A in cereals), SLV FS,1997:34.
5. Becker W., Befolkningens kostvanor och näringsintag, Vår Föda, 1992, vol. 44(8), 349.
6. Olsen M., Möller T., Åkerstrand K., Ochratoxin A: occurrence and intake by Swedish population.Proceedings of the UK WORKSHOP ON MYCOTOXINS, 1993, 21-22 April 1993.
7. Holmberg T., Hagelberg S., Lundeheim N., Thafvelin B., and Hult K., Ochratoxin A in swineblood used for evaluation of cereal handling procedures, J. Vet. Med. B., 1990, vol. 37, 97.
8. Maff, Survey of aflatoxin and ochratoxin in cereals and retail products, Food Surveillance sheet1997, vol. 130, 1.
50
9. European Commission, SCOOP-task 3.2.2., Assessment of dietary intake of Ochratoxin A by thepopulation in EU Member States, Report EUR 17523 EN 1997, (revised version).
10. Majerus P., and Otteneder H., Nachweis and vorkommen von ochratoxin A in wein undtraubensaft, Deutsche Lebensmittel-Rundschau, 1996, vol. 92, 388.
11. Van der Stegen G., Jörissen U., Pittet A., Saccon M., Steiner W., Vincenzi M., Winkler M.,Zapp J., Schlatter Chr., Screening of European coffee final products for occurrence of ochratoxin A(OTA), Food Addit. Contam., 1997, vol. 14, 211.
12. Olsen et al., 1999. Ochratoxin A in blood from subjects from Gotland, 1994. Unpublished data.
13. Breitholtz A., Olsen M., Dahlbäck Å., and Hult C., Plasma ochratoxin A levels in three Swedishpopulations surveyed using an ion-pair HPLC technique, Food Addit. Contamin., 1991, vol. 8, 183.
The Netherlands
1. Sizoo E.A., van Egmond H.P., Investigations on the occurrence of ochratoxin A in animalfeeding-stuffs and cereals. Samples drawn in the Netherlands in 1995, RIVM report 388802013.1997.
2. Inspectorate Health Protection, 1999, personal communication.
2a. Van Dooren-Flipsen M.M.H. et.al., Dietary exposure to residues and contaminants. Cases: 1.butyl benzyl phthalates (BBP); 2. ochratoxin A, RIKILT-DLO Report 99.007, 1999.
3. Van der Stegen G. et al., Screening of European coffee final products for occurrence ofochratoxin A (OTA), Food Additives and Contaminants, 1997, vol. 14, 211. Results for theNetherlands: personal communication.
4. Van der Stegen, G., 1999, personal communication.
5. Anonymous, 1999, personal confidential communication.
United Kingdom
1. Food Surveillance Information Sheet Number 73 (September 1995), Ochratoxin A in retailcoffees, Joint Food Safety and Standards Group, Ministry of Agriculture, Fisheries and Food/Department of Health.
2. Food Surveillance Information Sheet Number 80 (March 1996), Surveillance of ochratoxin A ingreen (unroasted) coffee beans, Joint Food Safety and Standards Group, Ministry of Agriculture,Fisheries and Food/ Department of Health.
3. Food Surveillance Information Sheet Number 95 (October 1996), Ochratoxin A in cereals andflour, and carry-over into retail processed foods, Joint Food Safety and Standards Group, Ministryof Agriculture, Fisheries and Food/ Department of Health.
4. Food Surveillance Information Sheet Number 130 (November 1997), Ochratoxin A andaflatoxins in retail products and cereals, Joint Food Safety and Standards Group, Ministry ofAgriculture, Fisheries and Food/ Department of Health.
5. Food Surveillance Information Sheet Number 171 (February 1999), Survey of ochratoxin A ingrain traded by central depots 1997-1998, Joint Food Safety and Standards Group, Ministry ofAgriculture, Fisheries and Food/ Department of Health.
51
6. Food Surveillance Information Sheet Number 172 (April 1999), A survey of human exposure toochratoxin A, Joint Food Safety and Standards Group, Ministry of Agriculture, Fisheries and Food/Department of Health.
7. Food Surveillance Information Sheet Number 185 (August 1999), 1998 survey of retail productsfor ochratoxin A, Joint Food Safety and Standards Group, Ministry of Agriculture, Fisheries andFood/ Department of Health.
8. Food Surveillance Information Sheet Number 192, Survey for aflatoxins, ochratoxin A,fumonisins and zearalenone in raw maize, December 1999.
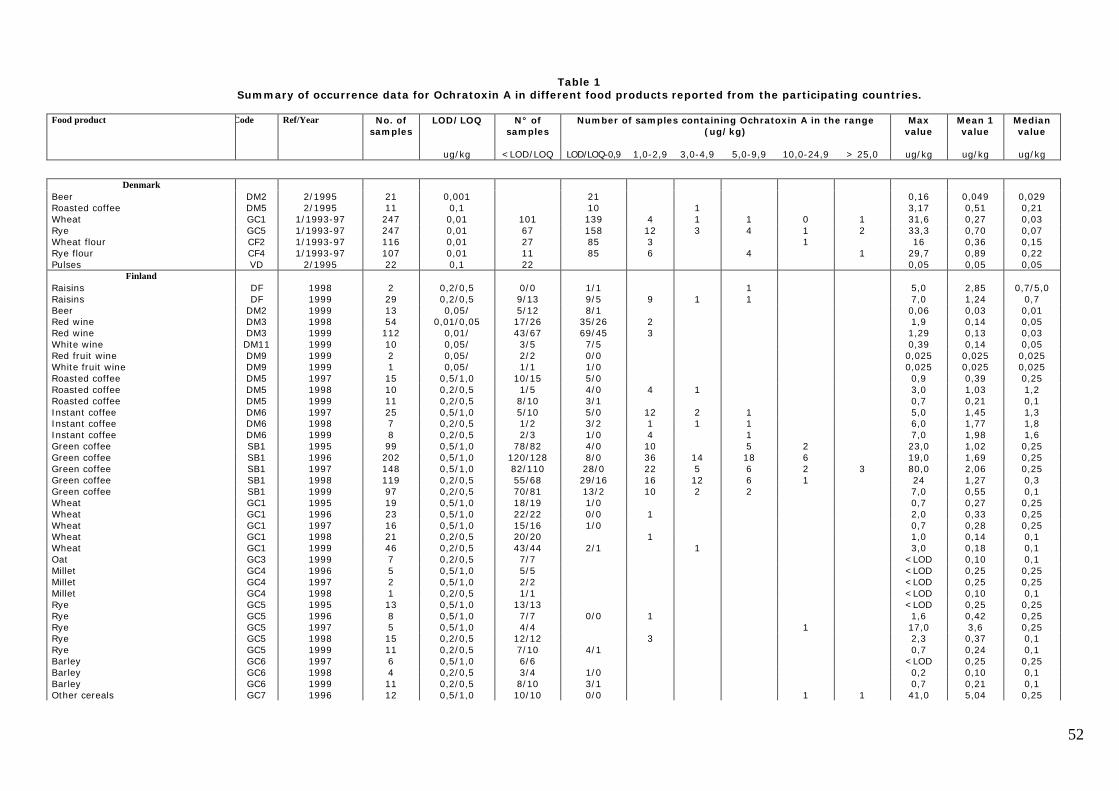
52
Table 1Summary of occurrence data for Ochratoxin A in different food products reported from the participating countries.
Food product Code Ref/Year No. ofsamples
LOD/LOQ N° ofsamples
Number of samples containing Ochratoxin A in the range(ug/kg)
Maxvalue
Mean 1value
Medianvalue
ug/kg <LOD/LOQ LOD/LOQ-0,9 1,0-2,9 3,0-4,9 5,0-9,9 10,0-24,9 > 25,0 ug/kg ug/kg ug/kg
DenmarkBeer DM2 2/1995 21 0,001 21 0,16 0,049 0,029Roasted coffee DM5 2/1995 11 0,1 10 1 3,17 0,51 0,21Wheat GC1 1/1993-97 247 0,01 101 139 4 1 1 0 1 31,6 0,27 0,03Rye GC5 1/1993-97 247 0,01 67 158 12 3 4 1 2 33,3 0,70 0,07Wheat flour CF2 1/1993-97 116 0,01 27 85 3 1 16 0,36 0,15Rye flour CF4 1/1993-97 107 0,01 11 85 6 4 1 29,7 0,89 0,22Pulses VD 2/1995 22 0,1 22 0,05 0,05 0,05
FinlandRaisins DF 1998 2 0,2/0,5 0/0 1/1 1 5,0 2,85 0,7/5,0Raisins DF 1999 29 0,2/0,5 9/13 9/5 9 1 1 7,0 1,24 0,7Beer DM2 1999 13 0,05/ 5/12 8/1 0,06 0,03 0,01Red wine DM3 1998 54 0,01/0,05 17/26 35/26 2 1,9 0,14 0,05Red wine DM3 1999 112 0,01/ 43/67 69/45 3 1,29 0,13 0,03White wine DM11 1999 10 0,05/ 3/5 7/5 0,39 0,14 0,05Red fruit wine DM9 1999 2 0,05/ 2/2 0/0 0,025 0,025 0,025White fruit wine DM9 1999 1 0,05/ 1/1 1/0 0,025 0,025 0,025Roasted coffee DM5 1997 15 0,5/1,0 10/15 5/0 0,9 0,39 0,25Roasted coffee DM5 1998 10 0,2/0,5 1/5 4/0 4 1 3,0 1,03 1,2Roasted coffee DM5 1999 11 0,2/0,5 8/10 3/1 0,7 0,21 0,1Instant coffee DM6 1997 25 0,5/1,0 5/10 5/0 12 2 1 5,0 1,45 1,3Instant coffee DM6 1998 7 0,2/0,5 1/2 3/2 1 1 1 6,0 1,77 1,8Instant coffee DM6 1999 8 0,2/0,5 2/3 1/0 4 1 7,0 1,98 1,6Green coffee SB1 1995 99 0,5/1,0 78/82 4/0 10 5 2 23,0 1,02 0,25Green coffee SB1 1996 202 0,5/1,0 120/128 8/0 36 14 18 6 19,0 1,69 0,25Green coffee SB1 1997 148 0,5/1,0 82/110 28/0 22 5 6 2 3 80,0 2,06 0,25Green coffee SB1 1998 119 0,2/0,5 55/68 29/16 16 12 6 1 24 1,27 0,3Green coffee SB1 1999 97 0,2/0,5 70/81 13/2 10 2 2 7,0 0,55 0,1Wheat GC1 1995 19 0,5/1,0 18/19 1/0 0,7 0,27 0,25Wheat GC1 1996 23 0,5/1,0 22/22 0/0 1 2,0 0,33 0,25Wheat GC1 1997 16 0,5/1,0 15/16 1/0 0,7 0,28 0,25Wheat GC1 1998 21 0,2/0,5 20/20 1 1,0 0,14 0,1Wheat GC1 1999 46 0,2/0,5 43/44 2/1 1 3,0 0,18 0,1Oat GC3 1999 7 0,2/0,5 7/7 <LOD 0,10 0,1Millet GC4 1996 5 0,5/1,0 5/5 <LOD 0,25 0,25Millet GC4 1997 2 0,5/1,0 2/2 <LOD 0,25 0,25Millet GC4 1998 1 0,2/0,5 1/1 <LOD 0,10 0,1Rye GC5 1995 13 0,5/1,0 13/13 <LOD 0,25 0,25Rye GC5 1996 8 0,5/1,0 7/7 0/0 1 1,6 0,42 0,25Rye GC5 1997 5 0,5/1,0 4/4 1 17,0 3,6 0,25Rye GC5 1998 15 0,2/0,5 12/12 3 2,3 0,37 0,1Rye GC5 1999 11 0,2/0,5 7/10 4/1 0,7 0,24 0,1Barley GC6 1997 6 0,5/1,0 6/6 <LOD 0,25 0,25Barley GC6 1998 4 0,2/0,5 3/4 1/0 0,2 0,10 0,1Barley GC6 1999 11 0,2/0,5 8/10 3/1 0,7 0,21 0,1Other cereals GC7 1996 12 0,5/1,0 10/10 0/0 1 1 41,0 5,04 0,25
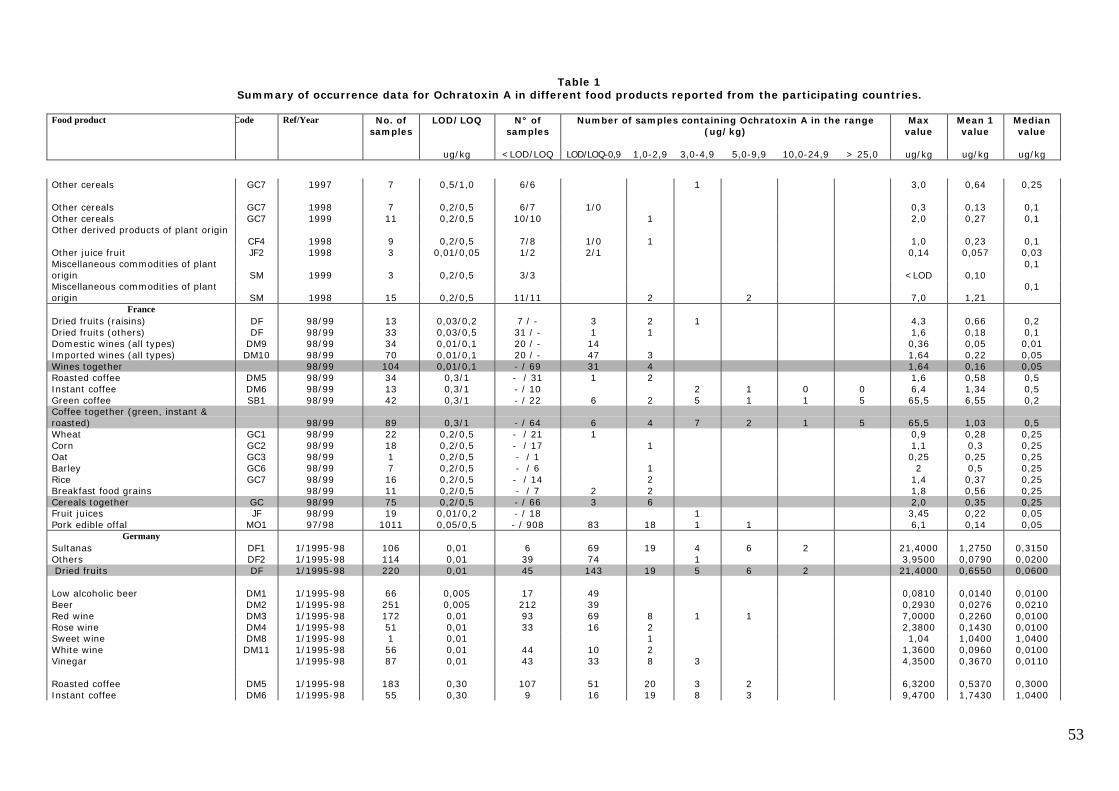
53
Table 1Summary of occurrence data for Ochratoxin A in different food products reported from the participating countries.
Food product Code Ref/Year No. ofsamples
LOD/LOQ N° ofsamples
Number of samples containing Ochratoxin A in the range(ug/kg)
Maxvalue
Mean 1value
Medianvalue
ug/kg <LOD/LOQ LOD/LOQ-0,9 1,0-2,9 3,0-4,9 5,0-9,9 10,0-24,9 > 25,0 ug/kg ug/kg ug/kg
Other cereals GC7 1997 7 0,5/1,0 6/6 1 3,0 0,64 0,25
Other cereals GC7 1998 7 0,2/0,5 6/7 1/0 0,3 0,13 0,1Other cereals GC7 1999 11 0,2/0,5 10/10 1 2,0 0,27 0,1Other derived products of plant origin
CF4 1998 9 0,2/0,5 7/8 1/0 1 1,0 0,23 0,1Other juice fruit JF2 1998 3 0,01/0,05 1/2 2/1 0,14 0,057 0,03Miscellaneous commodities of plantorigin SM 1999 3 0,2/0,5 3/3 <LOD 0,10
0,1
Miscellaneous commodities of plantorigin SM 1998 15 0,2/0,5 11/11 2 2 7,0 1,21
0,1
FranceDried fruits (raisins) DF 98/99 13 0,03/0,2 7 / - 3 2 1 4,3 0,66 0,2Dried fruits (others) DF 98/99 33 0,03/0,5 31 / - 1 1 1,6 0,18 0,1Domestic wines (all types) DM9 98/99 34 0,01/0,1 20 / - 14 0,36 0,05 0,01Imported wines (all types) DM10 98/99 70 0,01/0,1 20 / - 47 3 1,64 0,22 0,05Wines together 98/99 104 0,01/0,1 - / 69 31 4 1,64 0,16 0,05Roasted coffee DM5 98/99 34 0,3/1 - / 31 1 2 1,6 0,58 0,5Instant coffee DM6 98/99 13 0,3/1 - / 10 2 1 0 0 6,4 1,34 0,5Green coffee SB1 98/99 42 0,3/1 - / 22 6 2 5 1 1 5 65,5 6,55 0,2Coffee together (green, instant &roasted) 98/99 89 0,3/1 - / 64 6 4 7 2 1 5 65,5 1,03 0,5Wheat GC1 98/99 22 0,2/0,5 - / 21 1 0,9 0,28 0,25Corn GC2 98/99 18 0,2/0,5 - / 17 1 1,1 0,3 0,25Oat GC3 98/99 1 0,2/0,5 - / 1 0,25 0,25 0,25Barley GC6 98/99 7 0,2/0,5 - / 6 1 2 0,5 0,25Rice GC7 98/99 16 0,2/0,5 - / 14 2 1,4 0,37 0,25Breakfast food grains 98/99 11 0,2/0,5 - / 7 2 2 1,8 0,56 0,25Cereals together GC 98/99 75 0,2/0,5 - / 66 3 6 2,0 0,35 0,25Fruit juices JF 98/99 19 0,01/0,2 - / 18 1 3,45 0,22 0,05Pork edible offal MO1 97/98 1011 0,05/0,5 - / 908 83 18 1 1 6,1 0,14 0,05
GermanySultanas DF1 1/1995-98 106 0,01 6 69 19 4 6 2 21,4000 1,2750 0,3150Others DF2 1/1995-98 114 0,01 39 74 1 3,9500 0,0790 0,0200 Dried fruits DF 1/1995-98 220 0,01 45 143 19 5 6 2 21,4000 0,6550 0,0600
Low alcoholic beer DM1 1/1995-98 66 0,005 17 49 0,0810 0,0140 0,0100Beer DM2 1/1995-98 251 0,005 212 39 0,2930 0,0276 0,0210Red wine DM3 1/1995-98 172 0,01 93 69 8 1 1 7,0000 0,2260 0,0100Rose wine DM4 1/1995-98 51 0,01 33 16 2 2,3800 0,1430 0,0100Sweet wine DM8 1/1995-98 1 0,01 1 1,04 1,0400 1,0400White wine DM11 1/1995-98 56 0,01 44 10 2 1,3600 0,0960 0,0100Vinegar 1/1995-98 87 0,01 43 33 8 3 4,3500 0,3670 0,0110
Roasted coffee DM5 1/1995-98 183 0,30 107 51 20 3 2 6,3200 0,5370 0,3000Instant coffee DM6 1/1995-98 55 0,30 9 16 19 8 3 9,4700 1,7430 1,0400
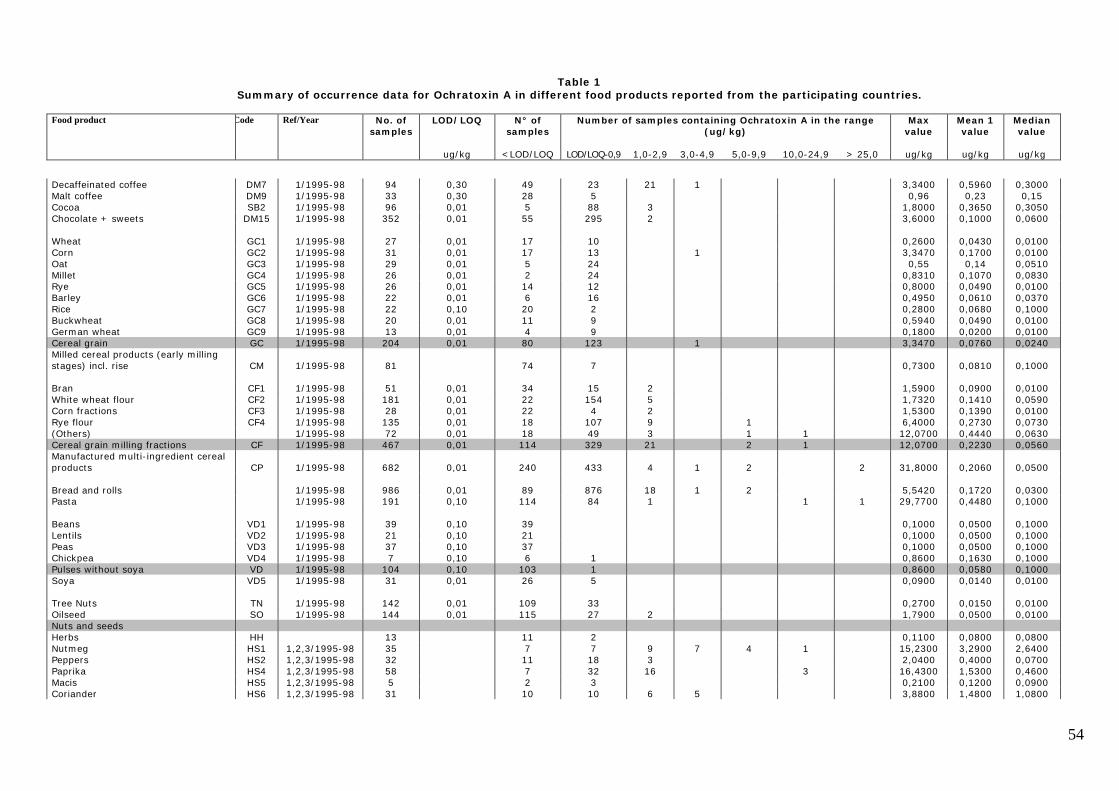
54
Table 1Summary of occurrence data for Ochratoxin A in different food products reported from the participating countries.
Food product Code Ref/Year No. ofsamples
LOD/LOQ N° ofsamples
Number of samples containing Ochratoxin A in the range(ug/kg)
Maxvalue
Mean 1value
Medianvalue
ug/kg <LOD/LOQ LOD/LOQ-0,9 1,0-2,9 3,0-4,9 5,0-9,9 10,0-24,9 > 25,0 ug/kg ug/kg ug/kg
Decaffeinated coffee DM7 1/1995-98 94 0,30 49 23 21 1 3,3400 0,5960 0,3000Malt coffee DM9 1/1995-98 33 0,30 28 5 0,96 0,23 0,15Cocoa SB2 1/1995-98 96 0,01 5 88 3 1,8000 0,3650 0,3050Chocolate + sweets DM15 1/1995-98 352 0,01 55 295 2 3,6000 0,1000 0,0600
Wheat GC1 1/1995-98 27 0,01 17 10 0,2600 0,0430 0,0100Corn GC2 1/1995-98 31 0,01 17 13 1 3,3470 0,1700 0,0100Oat GC3 1/1995-98 29 0,01 5 24 0,55 0,14 0,0510Millet GC4 1/1995-98 26 0,01 2 24 0,8310 0,1070 0,0830Rye GC5 1/1995-98 26 0,01 14 12 0,8000 0,0490 0,0100Barley GC6 1/1995-98 22 0,01 6 16 0,4950 0,0610 0,0370Rice GC7 1/1995-98 22 0,10 20 2 0,2800 0,0680 0,1000Buckwheat GC8 1/1995-98 20 0,01 11 9 0,5940 0,0490 0,0100German wheat GC9 1/1995-98 13 0,01 4 9 0,1800 0,0200 0,0100Cereal grain GC 1/1995-98 204 0,01 80 123 1 3,3470 0,0760 0,0240Milled cereal products (early millingstages) incl. rise CM 1/1995-98 81 74 7 0,7300 0,0810 0,1000
Bran CF1 1/1995-98 51 0,01 34 15 2 1,5900 0,0900 0,0100White wheat flour CF2 1/1995-98 181 0,01 22 154 5 1,7320 0,1410 0,0590Corn fractions CF3 1/1995-98 28 0,01 22 4 2 1,5300 0,1390 0,0100Rye flour CF4 1/1995-98 135 0,01 18 107 9 1 6,4000 0,2730 0,0730(Others) 1/1995-98 72 0,01 18 49 3 1 1 12,0700 0,4440 0,0630Cereal grain milling fractions CF 1/1995-98 467 0,01 114 329 21 2 1 12,0700 0,2230 0,0560Manufactured multi-ingredient cerealproducts CP 1/1995-98 682 0,01 240 433 4 1 2 2 31,8000 0,2060 0,0500
Bread and rolls 1/1995-98 986 0,01 89 876 18 1 2 5,5420 0,1720 0,0300Pasta 1/1995-98 191 0,10 114 84 1 1 1 29,7700 0,4480 0,1000
Beans VD1 1/1995-98 39 0,10 39 0,1000 0,0500 0,1000Lentils VD2 1/1995-98 21 0,10 21 0,1000 0,0500 0,1000Peas VD3 1/1995-98 37 0,10 37 0,1000 0,0500 0,1000Chickpea VD4 1/1995-98 7 0,10 6 1 0,8600 0,1630 0,1000Pulses without soya VD 1/1995-98 104 0,10 103 1 0,8600 0,0580 0,1000Soya VD5 1/1995-98 31 0,01 26 5 0,0900 0,0140 0,0100
Tree Nuts TN 1/1995-98 142 0,01 109 33 0,2700 0,0150 0,0100Oilseed SO 1/1995-98 144 0,01 115 27 2 1,7900 0,0500 0,0100Nuts and seedsHerbs HH 13 11 2 0,1100 0,0800 0,0800Nutmeg HS1 1,2,3/1995-98 35 7 7 9 7 4 1 15,2300 3,2900 2,6400Peppers HS2 1,2,3/1995-98 32 11 18 3 2,0400 0,4000 0,0700Paprika HS4 1,2,3/1995-98 58 7 32 16 3 16,4300 1,5300 0,4600Macis HS5 1,2,3/1995-98 5 2 3 0,2100 0,1200 0,0900Coriander HS6 1,2,3/1995-98 31 10 10 6 5 3,8800 1,4800 1,0800
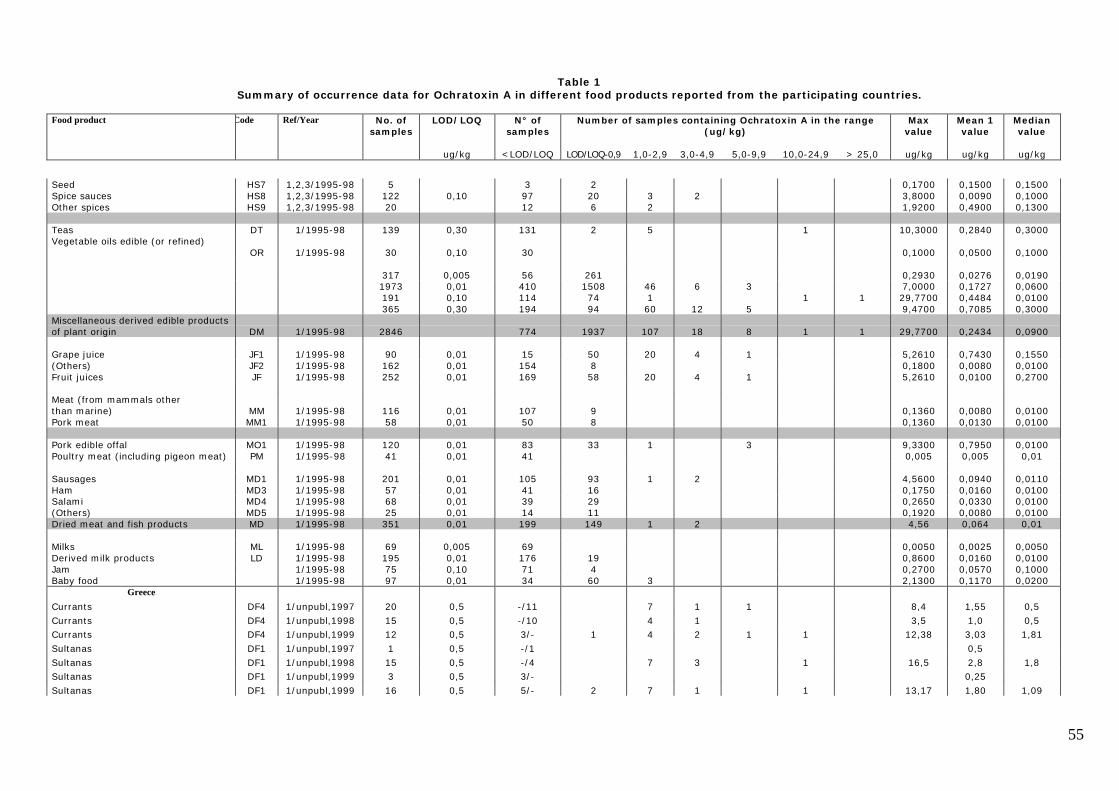
55
Table 1Summary of occurrence data for Ochratoxin A in different food products reported from the participating countries.
Food product Code Ref/Year No. ofsamples
LOD/LOQ N° ofsamples
Number of samples containing Ochratoxin A in the range(ug/kg)
Maxvalue
Mean 1value
Medianvalue
ug/kg <LOD/LOQ LOD/LOQ-0,9 1,0-2,9 3,0-4,9 5,0-9,9 10,0-24,9 > 25,0 ug/kg ug/kg ug/kg
Seed HS7 1,2,3/1995-98 5 3 2 0,1700 0,1500 0,1500Spice sauces HS8 1,2,3/1995-98 122 0,10 97 20 3 2 3,8000 0,0090 0,1000Other spices HS9 1,2,3/1995-98 20 12 6 2 1,9200 0,4900 0,1300
Teas DT 1/1995-98 139 0,30 131 2 5 1 10,3000 0,2840 0,3000Vegetable oils edible (or refined)
OR 1/1995-98 30 0,10 30 0,1000 0,0500 0,1000
317 0,005 56 261 0,2930 0,0276 0,01901973 0,01 410 1508 46 6 3 7,0000 0,1727 0,0600191 0,10 114 74 1 1 1 29,7700 0,4484 0,0100365 0,30 194 94 60 12 5 9,4700 0,7085 0,3000
Miscellaneous derived edible productsof plant origin DM 1/1995-98 2846 774 1937 107 18 8 1 1 29,7700 0,2434 0,0900
Grape juice JF1 1/1995-98 90 0,01 15 50 20 4 1 5,2610 0,7430 0,1550(Others) JF2 1/1995-98 162 0,01 154 8 0,1800 0,0080 0,0100Fruit juices JF 1/1995-98 252 0,01 169 58 20 4 1 5,2610 0,0100 0,2700
Meat (from mammals otherthan marine) MM 1/1995-98 116 0,01 107 9 0,1360 0,0080 0,0100Pork meat MM1 1/1995-98 58 0,01 50 8 0,1360 0,0130 0,0100
Pork edible offal MO1 1/1995-98 120 0,01 83 33 1 3 9,3300 0,7950 0,0100Poultry meat (including pigeon meat) PM 1/1995-98 41 0,01 41 0,005 0,005 0,01
Sausages MD1 1/1995-98 201 0,01 105 93 1 2 4,5600 0,0940 0,0110Ham MD3 1/1995-98 57 0,01 41 16 0,1750 0,0160 0,0100Salami MD4 1/1995-98 68 0,01 39 29 0,2650 0,0330 0,0100(Others) MD5 1/1995-98 25 0,01 14 11 0,1920 0,0080 0,0100Dried meat and fish products MD 1/1995-98 351 0,01 199 149 1 2 4,56 0,064 0,01
Milks ML 1/1995-98 69 0,005 69 0,0050 0,0025 0,0050Derived milk products LD 1/1995-98 195 0,01 176 19 0,8600 0,0160 0,0100Jam 1/1995-98 75 0,10 71 4 0,2700 0,0570 0,1000Baby food 1/1995-98 97 0,01 34 60 3 2,1300 0,1170 0,0200
Greece
Currants DF4 1/unpubl,1997 20 0,5 -/11 7 1 1 8,4 1,55 0,5Currants DF4 1/unpubl,1998 15 0,5 -/10 4 1 3,5 1,0 0,5Currants DF4 1/unpubl,1999 12 0,5 3/- 1 4 2 1 1 12,38 3,03 1,81Sultanas DF1 1/unpubl,1997 1 0,5 -/1 0,5Sultanas DF1 1/unpubl,1998 15 0,5 -/4 7 3 1 16,5 2,8 1,8Sultanas DF1 1/unpubl,1999 3 0,5 3/- 0,25Sultanas DF1 1/unpubl,1999 16 0,5 5/- 2 7 1 1 13,17 1,80 1,09
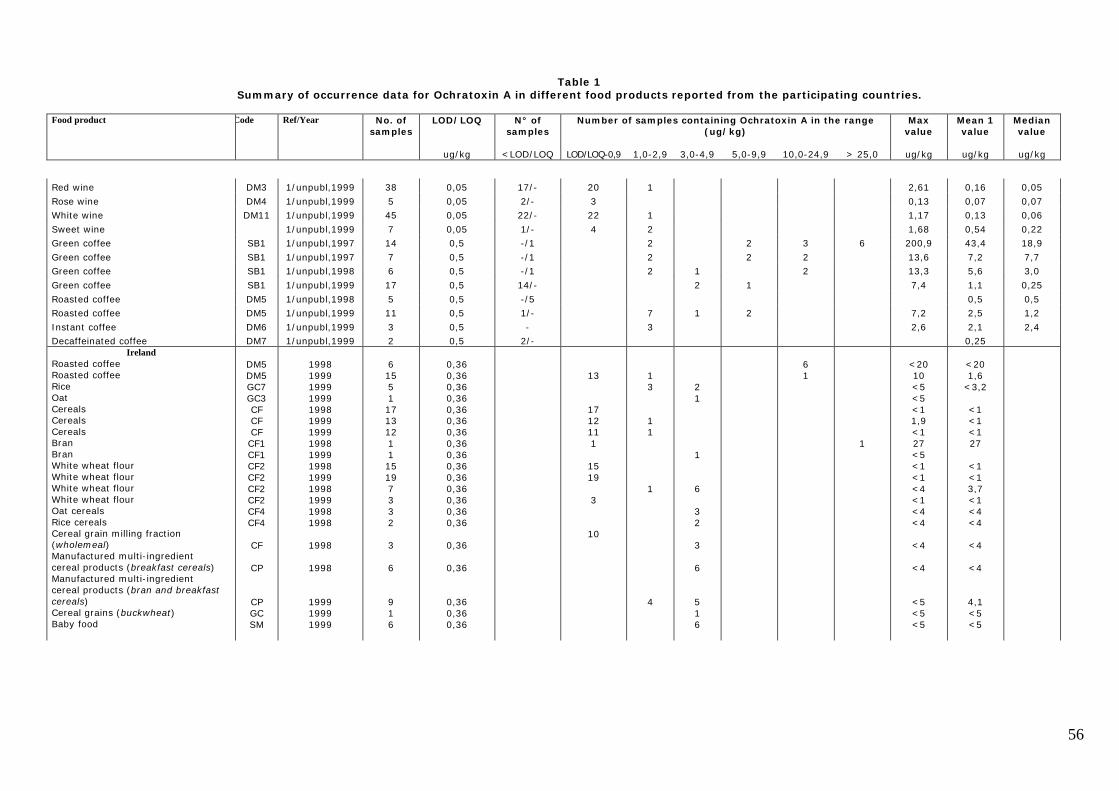
56
Table 1Summary of occurrence data for Ochratoxin A in different food products reported from the participating countries.
Food product Code Ref/Year No. ofsamples
LOD/LOQ N° ofsamples
Number of samples containing Ochratoxin A in the range(ug/kg)
Maxvalue
Mean 1value
Medianvalue
ug/kg <LOD/LOQ LOD/LOQ-0,9 1,0-2,9 3,0-4,9 5,0-9,9 10,0-24,9 > 25,0 ug/kg ug/kg ug/kg
Red wine DM3 1/unpubl,1999 38 0,05 17/- 20 1 2,61 0,16 0,05Rose wine DM4 1/unpubl,1999 5 0,05 2/- 3 0,13 0,07 0,07White wine DM11 1/unpubl,1999 45 0,05 22/- 22 1 1,17 0,13 0,06Sweet wine 1/unpubl,1999 7 0,05 1/- 4 2 1,68 0,54 0,22Green coffee SB1 1/unpubl,1997 14 0,5 -/1 2 2 3 6 200,9 43,4 18,9Green coffee SB1 1/unpubl,1997 7 0,5 -/1 2 2 2 13,6 7,2 7,7Green coffee SB1 1/unpubl,1998 6 0,5 -/1 2 1 2 13,3 5,6 3,0Green coffee SB1 1/unpubl,1999 17 0,5 14/- 2 1 7,4 1,1 0,25Roasted coffee DM5 1/unpubl,1998 5 0,5 -/5 0,5 0,5Roasted coffee DM5 1/unpubl,1999 11 0,5 1/- 7 1 2 7,2 2,5 1,2Instant coffee DM6 1/unpubl,1999 3 0,5 - 3 2,6 2,1 2,4Decaffeinated coffee DM7 1/unpubl,1999 2 0,5 2/- 0,25
IrelandRoasted coffeeRoasted coffeeRiceOatCerealsCerealsCerealsBranBranWhite wheat flourWhite wheat flourWhite wheat flourWhite wheat flourOat cerealsRice cerealsCereal grain milling fraction(wholemeal)Manufactured multi-ingredientcereal products (breakfast cereals)Manufactured multi-ingredientcereal products (bran and breakfastcereals)Cereal grains (buckwheat)Baby food
DM5DM5GC7GC3CFCFCFCF1CF1CF2CF2CF2CF2CF4CF4
CF
CP
CPGCSM
199819991999199919981999199919981999199819991998199919981998
1998
1998
199919991999
615511713121115197332
3
6
916
0,360,360,360,360,360,360,360,360,360,360,360,360,360,360,36
0,36
0,36
0,360,360,36
13
1712111
1519
3
10
13
11
1
4
21
1
6
32
3
6
516
61
1
<2010<5<5<11,9<127<5<1<1<4<1<4<4
<4
<4
<5<5<5
<201,6
<3,2
<1<1<127
<1<13,7<1<4<4
<4
<4
4,1<5<5
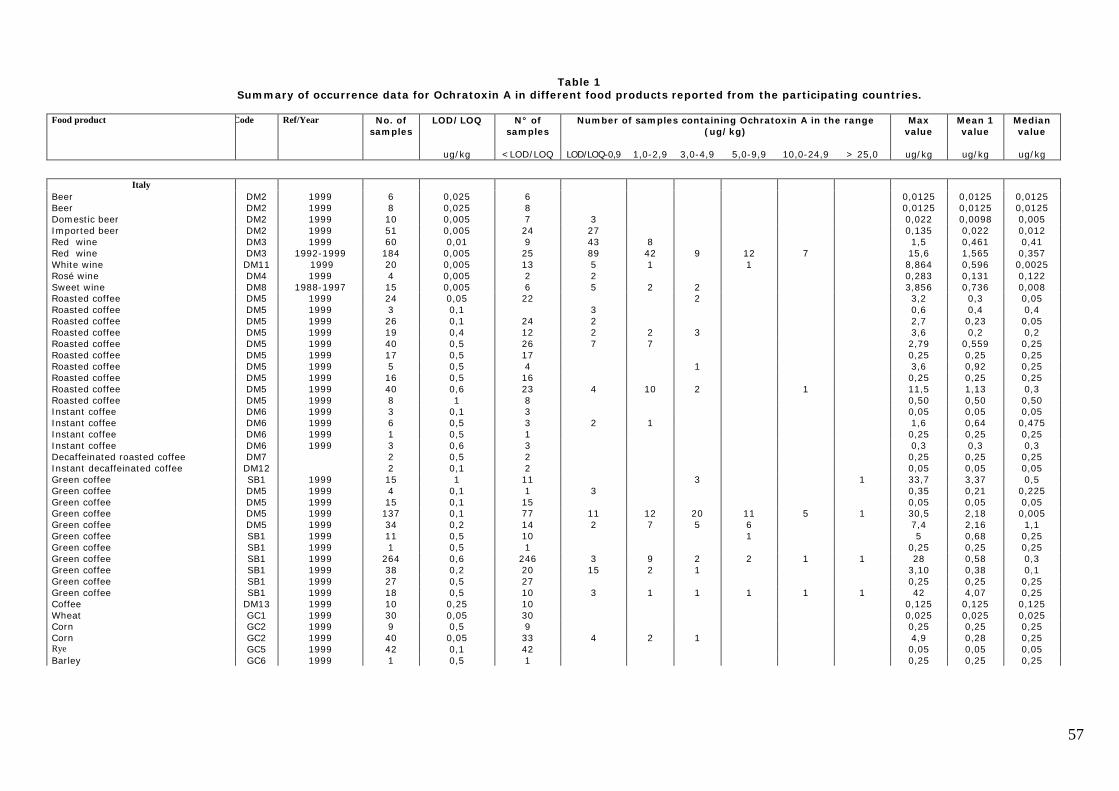
57
Table 1Summary of occurrence data for Ochratoxin A in different food products reported from the participating countries.
Food product Code Ref/Year No. ofsamples
LOD/LOQ N° ofsamples
Number of samples containing Ochratoxin A in the range(ug/kg)
Maxvalue
Mean 1value
Medianvalue
ug/kg <LOD/LOQ LOD/LOQ-0,9 1,0-2,9 3,0-4,9 5,0-9,9 10,0-24,9 > 25,0 ug/kg ug/kg ug/kg
ItalyBeer DM2 1999 6 0,025 6 0,0125 0,0125 0,0125Beer DM2 1999 8 0,025 8 0,0125 0,0125 0,0125Domestic beer DM2 1999 10 0,005 7 3 0,022 0,0098 0,005Imported beer DM2 1999 51 0,005 24 27 0,135 0,022 0,012Red wineRed wineWhite wineRosé wineSweet wine
DM3DM3DM11DM4DM8
19991992-1999
19991999
1988-1997
6018420415
0,010,0050,0050,0050,005
9251326
4389525
8421
2
9
2
121
71,515,68,8640,2833,856
0,4611,5650,5960,1310,736
0,410,3570,00250,1220,008
Roasted coffee DM5 1999 24 0,05 22 2 3,2 0,3 0,05Roasted coffee DM5 1999 3 0,1 3 0,6 0,4 0,4Roasted coffee DM5 1999 26 0,1 24 2 2,7 0,23 0,05Roasted coffee DM5 1999 19 0,4 12 2 2 3 3,6 0,2 0,2Roasted coffee DM5 1999 40 0,5 26 7 7 2,79 0,559 0,25Roasted coffee DM5 1999 17 0,5 17 0,25 0,25 0,25Roasted coffee DM5 1999 5 0,5 4 1 3,6 0,92 0,25Roasted coffee DM5 1999 16 0,5 16 0,25 0,25 0,25Roasted coffee DM5 1999 40 0,6 23 4 10 2 1 11,5 1,13 0,3Roasted coffee DM5 1999 8 1 8 0,50 0,50 0,50Instant coffee DM6 1999 3 0,1 3 0,05 0,05 0,05Instant coffee DM6 1999 6 0,5 3 2 1 1,6 0,64 0,475Instant coffee DM6 1999 1 0,5 1 0,25 0,25 0,25Instant coffee DM6 1999 3 0,6 3 0,3 0,3 0,3Decaffeinated roasted coffee DM7 2 0,5 2 0,25 0,25 0,25Instant decaffeinated coffee DM12 2 0,1 2 0,05 0,05 0,05Green coffee SB1 1999 15 1 11 3 1 33,7 3,37 0,5Green coffee DM5 1999 4 0,1 1 3 0,35 0,21 0,225Green coffee DM5 1999 15 0,1 15 0,05 0,05 0,05Green coffee DM5 1999 137 0,1 77 11 12 20 11 5 1 30,5 2,18 0,005Green coffee DM5 1999 34 0,2 14 2 7 5 6 7,4 2,16 1,1Green coffee SB1 1999 11 0,5 10 1 5 0,68 0,25Green coffee SB1 1999 1 0,5 1 0,25 0,25 0,25Green coffee SB1 1999 264 0,6 246 3 9 2 2 1 1 28 0,58 0,3Green coffee SB1 1999 38 0,2 20 15 2 1 3,10 0,38 0,1Green coffee SB1 1999 27 0,5 27 0,25 0,25 0,25Green coffee SB1 1999 18 0,5 10 3 1 1 1 1 1 42 4,07 0,25Coffee DM13 1999 10 0,25 10 0,125 0,125 0,125Wheat GC1 1999 30 0,05 30 0,025 0,025 0,025Corn GC2 1999 9 0,5 9 0,25 0,25 0,25Corn GC2 1999 40 0,05 33 4 2 1 4,9 0,28 0,25Rye GC5 1999 42 0,1 42 0,05 0,05 0,05Barley GC6 1999 1 0,5 1 0,25 0,25 0,25
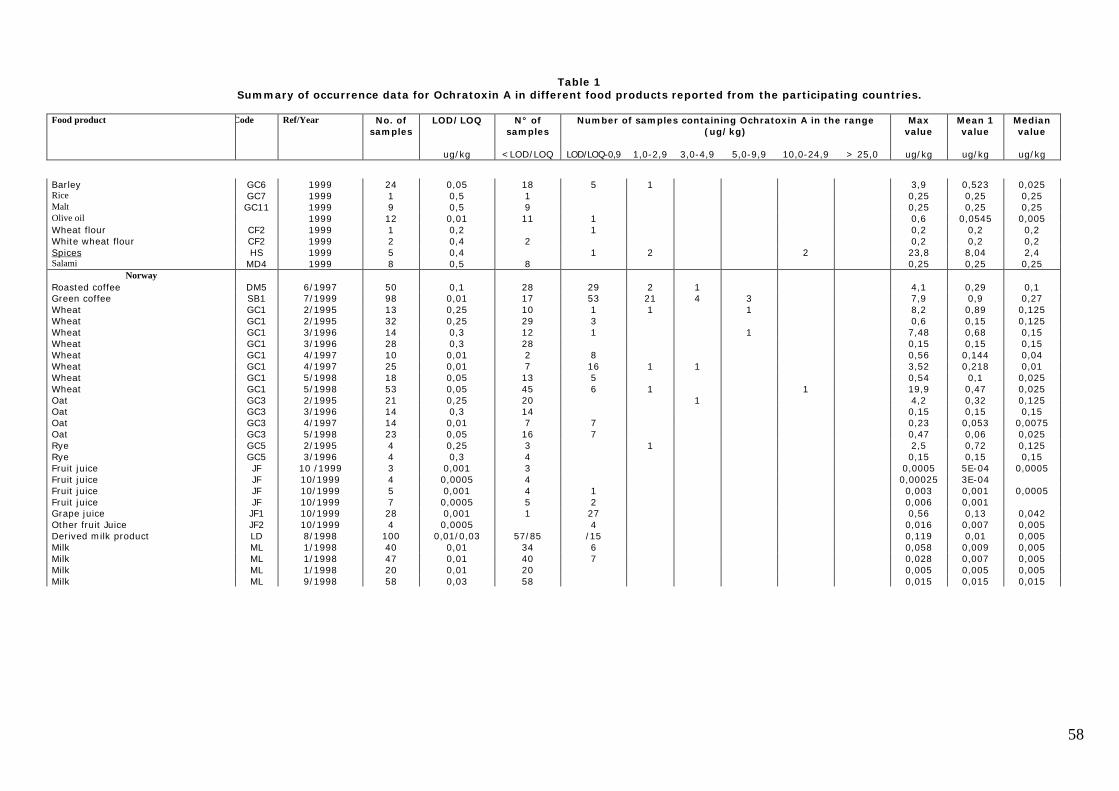
58
Table 1Summary of occurrence data for Ochratoxin A in different food products reported from the participating countries.
Food product Code Ref/Year No. ofsamples
LOD/LOQ N° ofsamples
Number of samples containing Ochratoxin A in the range(ug/kg)
Maxvalue
Mean 1value
Medianvalue
ug/kg <LOD/LOQ LOD/LOQ-0,9 1,0-2,9 3,0-4,9 5,0-9,9 10,0-24,9 > 25,0 ug/kg ug/kg ug/kg
Barley GC6 1999 24 0,05 18 5 1 3,9 0,523 0,025Rice GC7 1999 1 0,5 1 0,25 0,25 0,25Malt GC11 1999 9 0,5 9 0,25 0,25 0,25Olive oil 1999 12 0,01 11 1 0,6 0,0545 0,005Wheat flour CF2 1999 1 0,2 1 0,2 0,2 0,2White wheat flour CF2 1999 2 0,4 2 0,2 0,2 0,2Spices HS 1999 5 0,4 1 2 2 23,8 8,04 2,4Salami MD4 1999 8 0,5 8 0,25 0,25 0,25
NorwayRoasted coffee DM5 6/1997 50 0,1 28 29 2 1 4,1 0,29 0,1Green coffee SB1 7/1999 98 0,01 17 53 21 4 3 7,9 0,9 0,27Wheat GC1 2/1995 13 0,25 10 1 1 1 8,2 0,89 0,125Wheat GC1 2/1995 32 0,25 29 3 0,6 0,15 0,125Wheat GC1 3/1996 14 0,3 12 1 1 7,48 0,68 0,15Wheat GC1 3/1996 28 0,3 28 0,15 0,15 0,15Wheat GC1 4/1997 10 0,01 2 8 0,56 0,144 0,04Wheat GC1 4/1997 25 0,01 7 16 1 1 3,52 0,218 0,01Wheat GC1 5/1998 18 0,05 13 5 0,54 0,1 0,025Wheat GC1 5/1998 53 0,05 45 6 1 1 19,9 0,47 0,025Oat GC3 2/1995 21 0,25 20 1 4,2 0,32 0,125Oat GC3 3/1996 14 0,3 14 0,15 0,15 0,15Oat GC3 4/1997 14 0,01 7 7 0,23 0,053 0,0075Oat GC3 5/1998 23 0,05 16 7 0,47 0,06 0,025Rye GC5 2/1995 4 0,25 3 1 2,5 0,72 0,125Rye GC5 3/1996 4 0,3 4 0,15 0,15 0,15Fruit juice JF 10 /1999 3 0,001 3 0,0005 5E-04 0,0005Fruit juice JF 10/1999 4 0,0005 4 0,00025 3E-04Fruit juice JF 10/1999 5 0,001 4 1 0,003 0,001 0,0005Fruit juice JF 10/1999 7 0,0005 5 2 0,006 0,001Grape juice JF1 10/1999 28 0,001 1 27 0,56 0,13 0,042Other fruit Juice JF2 10/1999 4 0,0005 4 0,016 0,007 0,005Derived milk product LD 8/1998 100 0,01/0,03 57/85 /15 0,119 0,01 0,005Milk ML 1/1998 40 0,01 34 6 0,058 0,009 0,005Milk ML 1/1998 47 0,01 40 7 0,028 0,007 0,005Milk ML 1/1998 20 0,01 20 0,005 0,005 0,005Milk ML 9/1998 58 0,03 58 0,015 0,015 0,015
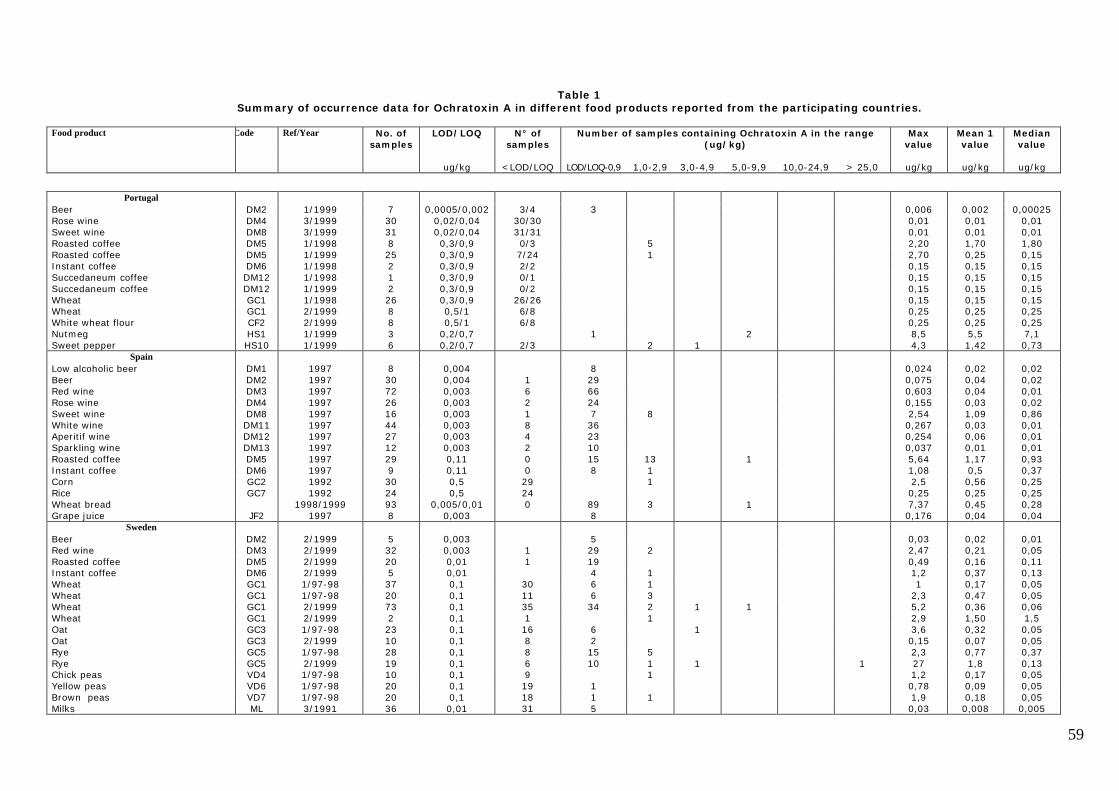
59
Table 1Summary of occurrence data for Ochratoxin A in different food products reported from the participating countries.
Food product Code Ref/Year No. ofsamples
LOD/LOQ N° ofsamples
Number of samples containing Ochratoxin A in the range(ug/kg)
Maxvalue
Mean 1value
Medianvalue
ug/kg <LOD/LOQ LOD/LOQ-0,9 1,0-2,9 3,0-4,9 5,0-9,9 10,0-24,9 > 25,0 ug/kg ug/kg ug/kg
PortugalBeer DM2 1/1999 7 0,0005/0,002 3/4 3 0,006 0,002 0,00025Rose wine DM4 3/1999 30 0,02/0,04 30/30 0,01 0,01 0,01Sweet wine DM8 3/1999 31 0,02/0,04 31/31 0,01 0,01 0,01Roasted coffee DM5 1/1998 8 0,3/0,9 0/3 5 2,20 1,70 1,80Roasted coffee DM5 1/1999 25 0,3/0,9 7/24 1 2,70 0,25 0,15Instant coffee DM6 1/1998 2 0,3/0,9 2/2 0,15 0,15 0,15Succedaneum coffee DM12 1/1998 1 0,3/0,9 0/1 0,15 0,15 0,15Succedaneum coffee DM12 1/1999 2 0,3/0,9 0/2 0,15 0,15 0,15Wheat GC1 1/1998 26 0,3/0,9 26/26 0,15 0,15 0,15Wheat GC1 2/1999 8 0,5/1 6/8 0,25 0,25 0,25White wheat flour CF2 2/1999 8 0,5/1 6/8 0,25 0,25 0,25Nutmeg HS1 1/1999 3 0,2/0,7 1 2 8,5 5,5 7,1Sweet pepper HS10 1/1999 6 0,2/0,7 2/3 2 1 4,3 1,42 0,73
SpainLow alcoholic beer DM1 1997 8 0,004 8 0,024 0,02 0,02Beer DM2 1997 30 0,004 1 29 0,075 0,04 0,02Red wine DM3 1997 72 0,003 6 66 0,603 0,04 0,01Rose wine DM4 1997 26 0,003 2 24 0,155 0,03 0,02Sweet wine DM8 1997 16 0,003 1 7 8 2,54 1,09 0,86White wine DM11 1997 44 0,003 8 36 0,267 0,03 0,01Aperitif wine DM12 1997 27 0,003 4 23 0,254 0,06 0,01Sparkling wine DM13 1997 12 0,003 2 10 0,037 0,01 0,01Roasted coffee DM5 1997 29 0,11 0 15 13 1 5,64 1,17 0,93Instant coffee DM6 1997 9 0,11 0 8 1 1,08 0,5 0,37Corn GC2 1992 30 0,5 29 1 2,5 0,56 0,25Rice GC7 1992 24 0,5 24 0,25 0,25 0,25Wheat bread 1998/1999 93 0,005/0,01 0 89 3 1 7,37 0,45 0,28Grape juice JF2 1997 8 0,003 8 0,176 0,04 0,04
SwedenBeer DM2 2/1999 5 0,003 5 0,03 0,02 0,01Red wine DM3 2/1999 32 0,003 1 29 2 2,47 0,21 0,05Roasted coffee DM5 2/1999 20 0,01 1 19 0,49 0,16 0,11Instant coffee DM6 2/1999 5 0,01 4 1 1,2 0,37 0,13Wheat GC1 1/97-98 37 0,1 30 6 1 1 0,17 0,05Wheat GC1 1/97-98 20 0,1 11 6 3 2,3 0,47 0,05Wheat GC1 2/1999 73 0,1 35 34 2 1 1 5,2 0,36 0,06Wheat GC1 2/1999 2 0,1 1 1 2,9 1,50 1,5Oat GC3 1/97-98 23 0,1 16 6 1 3,6 0,32 0,05Oat GC3 2/1999 10 0,1 8 2 0,15 0,07 0,05Rye GC5 1/97-98 28 0,1 8 15 5 2,3 0,77 0,37Rye GC5 2/1999 19 0,1 6 10 1 1 1 27 1,8 0,13Chick peas VD4 1/97-98 10 0,1 9 1 1,2 0,17 0,05Yellow peas VD6 1/97-98 20 0,1 19 1 0,78 0,09 0,05Brown peas VD7 1/97-98 20 0,1 18 1 1 1,9 0,18 0,05Milks ML 3/1991 36 0,01 31 5 0,03 0,008 0,005
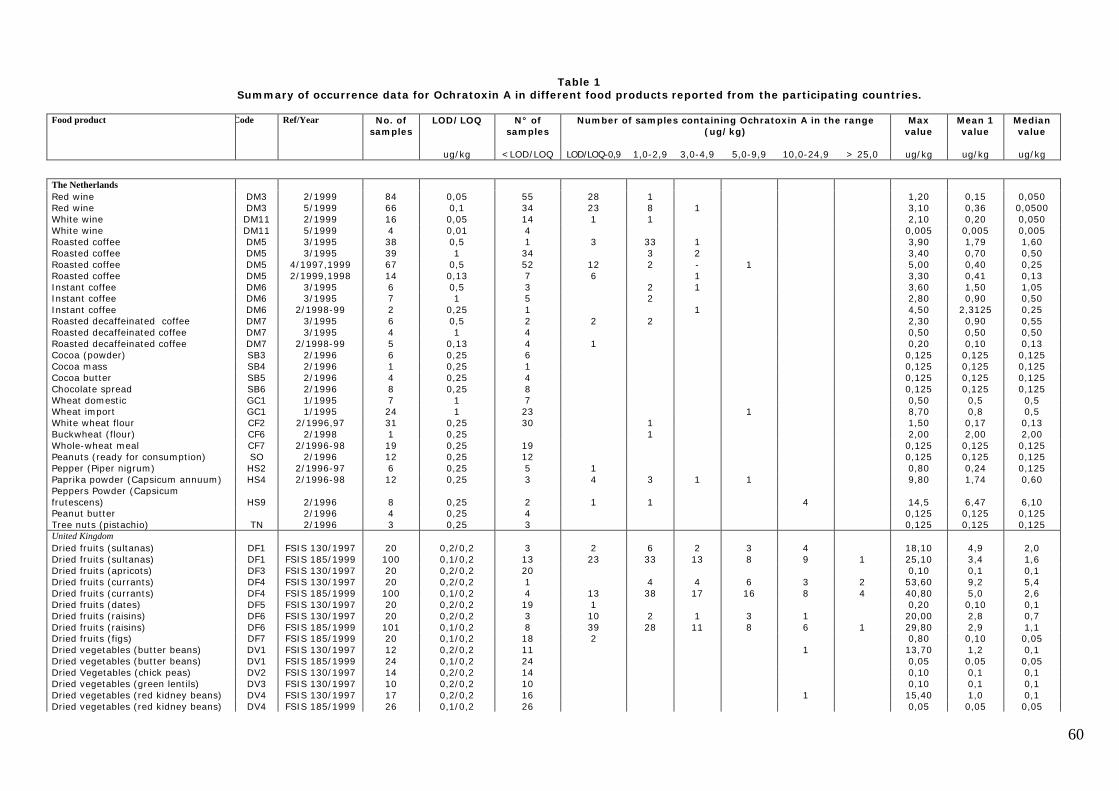
60
Table 1Summary of occurrence data for Ochratoxin A in different food products reported from the participating countries.
Food product Code Ref/Year No. ofsamples
LOD/LOQ N° ofsamples
Number of samples containing Ochratoxin A in the range(ug/kg)
Maxvalue
Mean 1value
Medianvalue
ug/kg <LOD/LOQ LOD/LOQ-0,9 1,0-2,9 3,0-4,9 5,0-9,9 10,0-24,9 > 25,0 ug/kg ug/kg ug/kg
The NetherlandsRed wine DM3 2/1999 84 0,05 55 28 1 1,20 0,15 0,050Red wine DM3 5/1999 66 0,1 34 23 8 1 3,10 0,36 0,0500White wine DM11 2/1999 16 0,05 14 1 1 2,10 0,20 0,050White wine DM11 5/1999 4 0,01 4 0,005 0,005 0,005Roasted coffee DM5 3/1995 38 0,5 1 3 33 1 3,90 1,79 1,60Roasted coffee DM5 3/1995 39 1 34 3 2 3,40 0,70 0,50Roasted coffee DM5 4/1997,1999 67 0,5 52 12 2 - 1 5,00 0,40 0,25Roasted coffee DM5 2/1999,1998 14 0,13 7 6 1 3,30 0,41 0,13Instant coffee DM6 3/1995 6 0,5 3 2 1 3,60 1,50 1,05Instant coffee DM6 3/1995 7 1 5 2 2,80 0,90 0,50Instant coffee DM6 2/1998-99 2 0,25 1 1 4,50 2,3125 0,25Roasted decaffeinated coffee DM7 3/1995 6 0,5 2 2 2 2,30 0,90 0,55Roasted decaffeinated coffee DM7 3/1995 4 1 4 0,50 0,50 0,50Roasted decaffeinated coffee DM7 2/1998-99 5 0,13 4 1 0,20 0,10 0,13Cocoa (powder) SB3 2/1996 6 0,25 6 0,125 0,125 0,125Cocoa mass SB4 2/1996 1 0,25 1 0,125 0,125 0,125Cocoa butter SB5 2/1996 4 0,25 4 0,125 0,125 0,125Chocolate spread SB6 2/1996 8 0,25 8 0,125 0,125 0,125Wheat domestic GC1 1/1995 7 1 7 0,50 0,5 0,5Wheat import GC1 1/1995 24 1 23 1 8,70 0,8 0,5White wheat flour CF2 2/1996,97 31 0,25 30 1 1,50 0,17 0,13Buckwheat (flour) CF6 2/1998 1 0,25 1 2,00 2,00 2,00Whole-wheat meal CF7 2/1996-98 19 0,25 19 0,125 0,125 0,125Peanuts (ready for consumption) SO 2/1996 12 0,25 12 0,125 0,125 0,125Pepper (Piper nigrum) HS2 2/1996-97 6 0,25 5 1 0,80 0,24 0,125Paprika powder (Capsicum annuum) HS4 2/1996-98 12 0,25 3 4 3 1 1 9,80 1,74 0,60Peppers Powder (Capsicumfrutescens) HS9 2/1996 8 0,25 2 1 1 4 14,5 6,47 6,10Peanut butter 2/1996 4 0,25 4 0,125 0,125 0,125Tree nuts (pistachio) TN 2/1996 3 0,25 3 0,125 0,125 0,125United KingdomDried fruits (sultanas) DF1 FSIS 130/1997 20 0,2/0,2 3 2 6 2 3 4 18,10 4,9 2,0Dried fruits (sultanas) DF1 FSIS 185/1999 100 0,1/0,2 13 23 33 13 8 9 1 25,10 3,4 1,6Dried fruits (apricots) DF3 FSIS 130/1997 20 0,2/0,2 20 0,10 0,1 0,1Dried fruits (currants) DF4 FSIS 130/1997 20 0,2/0,2 1 4 4 6 3 2 53,60 9,2 5,4Dried fruits (currants) DF4 FSIS 185/1999 100 0,1/0,2 4 13 38 17 16 8 4 40,80 5,0 2,6Dried fruits (dates) DF5 FSIS 130/1997 20 0,2/0,2 19 1 0,20 0,10 0,1Dried fruits (raisins) DF6 FSIS 130/1997 20 0,2/0,2 3 10 2 1 3 1 20,00 2,8 0,7Dried fruits (raisins) DF6 FSIS 185/1999 101 0,1/0,2 8 39 28 11 8 6 1 29,80 2,9 1,1Dried fruits (figs) DF7 FSIS 185/1999 20 0,1/0,2 18 2 0,80 0,10 0,05Dried vegetables (butter beans) DV1 FSIS 130/1997 12 0,2/0,2 11 1 13,70 1,2 0,1Dried vegetables (butter beans) DV1 FSIS 185/1999 24 0,1/0,2 24 0,05 0,05 0,05Dried Vegetables (chick peas) DV2 FSIS 130/1997 14 0,2/0,2 14 0,10 0,1 0,1Dried vegetables (green lentils) DV3 FSIS 130/1997 10 0,2/0,2 10 0,10 0,1 0,1Dried vegetables (red kidney beans) DV4 FSIS 130/1997 17 0,2/0,2 16 1 15,40 1,0 0,1Dried vegetables (red kidney beans) DV4 FSIS 185/1999 26 0,1/0,2 26 0,05 0,05 0,05
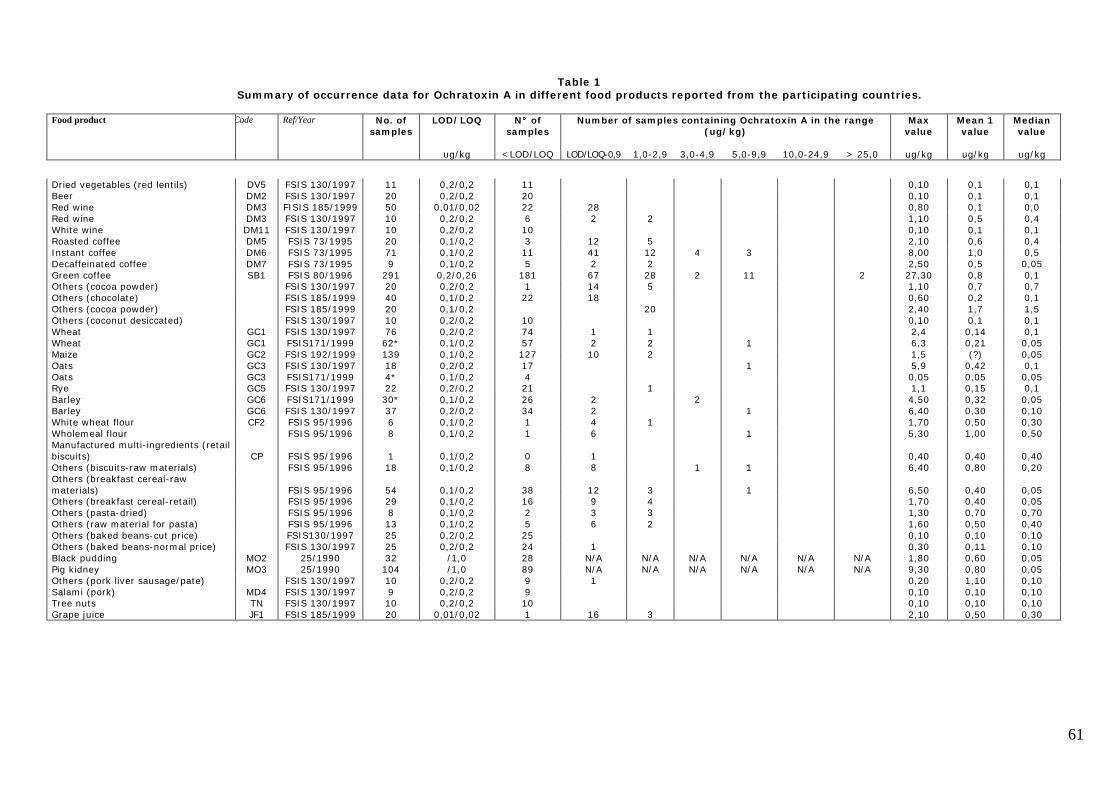
61
Table 1Summary of occurrence data for Ochratoxin A in different food products reported from the participating countries.
Food product Code Ref/Year No. ofsamples
LOD/LOQ N° ofsamples
Number of samples containing Ochratoxin A in the range(ug/kg)
Maxvalue
Mean 1value
Medianvalue
ug/kg <LOD/LOQ LOD/LOQ-0,9 1,0-2,9 3,0-4,9 5,0-9,9 10,0-24,9 > 25,0 ug/kg ug/kg ug/kg
Dried vegetables (red lentils) DV5 FSIS 130/1997 11 0,2/0,2 11 0,10 0,1 0,1Beer DM2 FSIS 130/1997 20 0,2/0,2 20 0,10 0,1 0,1Red wine DM3 FISIS 185/1999 50 0,01/0,02 22 28 0,80 0,1 0,0Red wine DM3 FSIS 130/1997 10 0,2/0,2 6 2 2 1,10 0,5 0,4White wine DM11 FSIS 130/1997 10 0,2/0,2 10 0,10 0,1 0,1Roasted coffee DM5 FSIS 73/1995 20 0,1/0,2 3 12 5 2,10 0,6 0,4Instant coffee DM6 FSIS 73/1995 71 0,1/0,2 11 41 12 4 3 8,00 1,0 0,5Decaffeinated coffee DM7 FSIS 73/1995 9 0,1/0,2 5 2 2 2,50 0,5 0,05Green coffee SB1 FSIS 80/1996 291 0,2/0,26 181 67 28 2 11 2 27,30 0,8 0,1Others (cocoa powder) FSIS 130/1997 20 0,2/0,2 1 14 5 1,10 0,7 0,7Others (chocolate) FSIS 185/1999 40 0,1/0,2 22 18 0,60 0,2 0,1Others (cocoa powder) FSIS 185/1999 20 0,1/0,2 20 2,40 1,7 1,5Others (coconut desiccated) FSIS 130/1997 10 0,2/0,2 10 0,10 0,1 0,1Wheat GC1 FSIS 130/1997 76 0,2/0,2 74 1 1 2,4 0,14 0,1Wheat GC1 FSIS171/1999 62* 0,1/0,2 57 2 2 1 6,3 0,21 0,05Maize GC2 FSIS 192/1999 139 0,1/0,2 127 10 2 1,5 (?) 0,05Oats GC3 FSIS 130/1997 18 0,2/0,2 17 1 5,9 0,42 0,1Oats GC3 FSIS171/1999 4* 0,1/0,2 4 0,05 0,05 0,05Rye GC5 FSIS 130/1997 22 0,2/0,2 21 1 1,1 0,15 0,1Barley GC6 FSIS171/1999 30* 0,1/0,2 26 2 2 4,50 0,32 0,05Barley GC6 FSIS 130/1997 37 0,2/0,2 34 2 1 6,40 0,30 0,10White wheat flour CF2 FSIS 95/1996 6 0,1/0,2 1 4 1 1,70 0,50 0,30Wholemeal flour FSIS 95/1996 8 0,1/0,2 1 6 1 5,30 1,00 0,50Manufactured multi-ingredients (retailbiscuits) CP FSIS 95/1996 1 0,1/0,2 0 1 0,40 0,40 0,40Others (biscuits-raw materials) FSIS 95/1996 18 0,1/0,2 8 8 1 1 6,40 0,80 0,20Others (breakfast cereal-rawmaterials) FSIS 95/1996 54 0,1/0,2 38 12 3 1 6,50 0,40 0,05Others (breakfast cereal-retail) FSIS 95/1996 29 0,1/0,2 16 9 4 1,70 0,40 0,05Others (pasta-dried) FSIS 95/1996 8 0,1/0,2 2 3 3 1,30 0,70 0,70Others (raw material for pasta) FSIS 95/1996 13 0,1/0,2 5 6 2 1,60 0,50 0,40Others (baked beans-cut price) FSIS130/1997 25 0,2/0,2 25 0,10 0,10 0,10Others (baked beans-normal price) FSIS 130/1997 25 0,2/0,2 24 1 0,30 0,11 0,10Black pudding MO2 25/1990 32 /1,0 28 N/A N/A N/A N/A N/A N/A 1,80 0,60 0,05Pig kidney MO3 25/1990 104 /1,0 89 N/A N/A N/A N/A N/A N/A 9,30 0,80 0,05Others (pork liver sausage/pate) FSIS 130/1997 10 0,2/0,2 9 1 0,20 1,10 0,10Salami (pork) MD4 FSIS 130/1997 9 0,2/0,2 9 0,10 0,10 0,10Tree nuts TN FSIS 130/1997 10 0,2/0,2 10 0,10 0,10 0,10Grape juice JF1 FSIS 185/1999 20 0,01/0,02 1 16 3 2,10 0,50 0,30

62
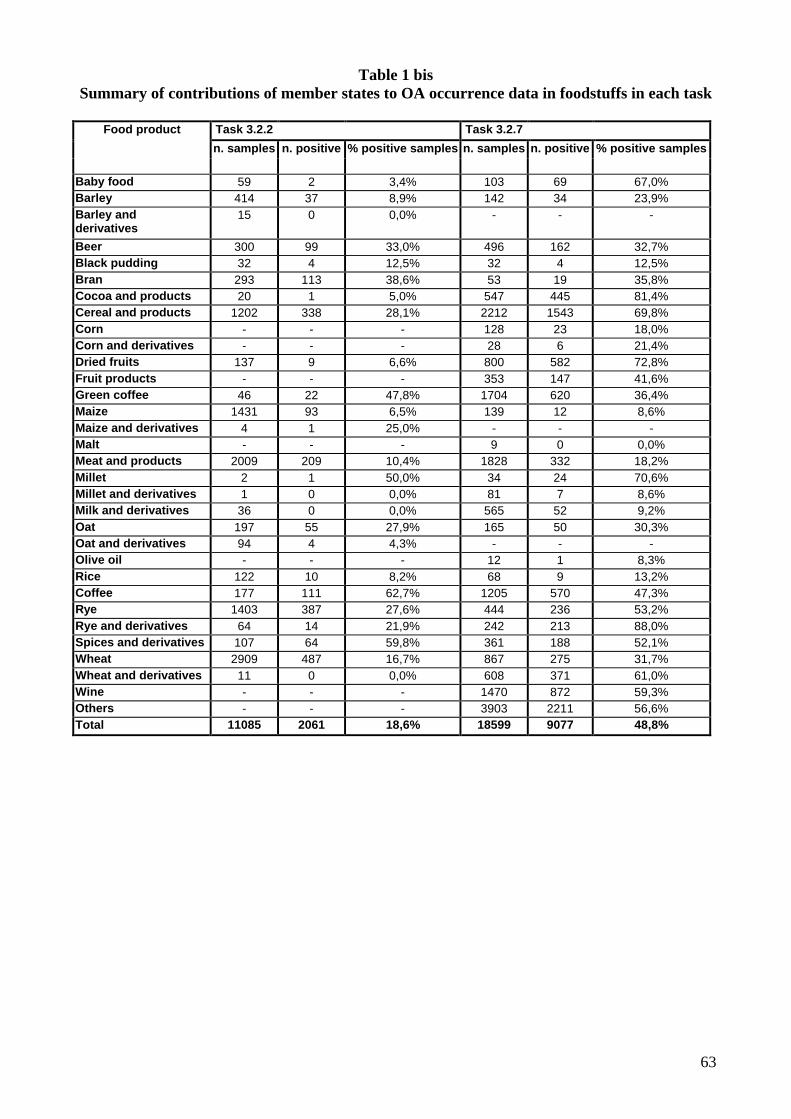
63
Table 1 bisSummary of contributions of member states to OA occurrence data in foodstuffs in each task
Food product Task 3.2.2 Task 3.2.7
n. samples n. positive % positive samples n. samples n. positive % positive samples
Baby food 59 2 3,4% 103 69 67,0%Barley 414 37 8,9% 142 34 23,9%Barley andderivatives
15 0 0,0% - - -
Beer 300 99 33,0% 496 162 32,7%Black pudding 32 4 12,5% 32 4 12,5%Bran 293 113 38,6% 53 19 35,8%Cocoa and products 20 1 5,0% 547 445 81,4%Cereal and products 1202 338 28,1% 2212 1543 69,8%Corn - - - 128 23 18,0%Corn and derivatives - - - 28 6 21,4%Dried fruits 137 9 6,6% 800 582 72,8%Fruit products - - - 353 147 41,6%Green coffee 46 22 47,8% 1704 620 36,4%Maize 1431 93 6,5% 139 12 8,6%Maize and derivatives 4 1 25,0% - - -Malt - - - 9 0 0,0%Meat and products 2009 209 10,4% 1828 332 18,2%Millet 2 1 50,0% 34 24 70,6%Millet and derivatives 1 0 0,0% 81 7 8,6%Milk and derivatives 36 0 0,0% 565 52 9,2%Oat 197 55 27,9% 165 50 30,3%Oat and derivatives 94 4 4,3% - - -Olive oil - - - 12 1 8,3%Rice 122 10 8,2% 68 9 13,2%Coffee 177 111 62,7% 1205 570 47,3%Rye 1403 387 27,6% 444 236 53,2%Rye and derivatives 64 14 21,9% 242 213 88,0%Spices and derivatives 107 64 59,8% 361 188 52,1%Wheat 2909 487 16,7% 867 275 31,7%Wheat and derivatives 11 0 0,0% 608 371 61,0%Wine - - - 1470 872 59,3%Others - - - 3903 2211 56,6%Total 11085 2061 18,6% 18599 9077 48,8%
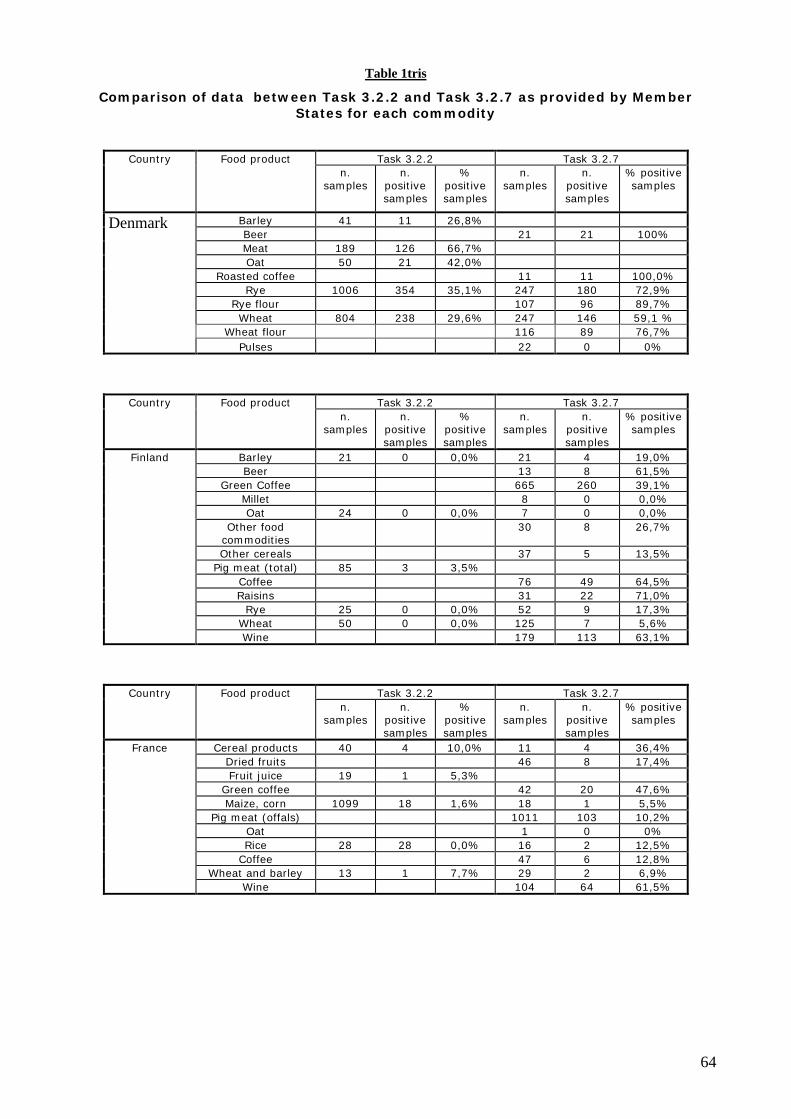
64
Table 1tris
Comparison of data between Task 3.2.2 and Task 3.2.7 as provided by MemberStates for each commodity
Task 3.2.2 Task 3.2.7Country Food productn.
samplesn.
positivesamples
%positivesamples
n.samples
n.positivesamples
% positivesamples
Barley 41 11 26,8%Beer 21 21 100%Meat 189 126 66,7%Oat 50 21 42,0%
Roasted coffee 11 11 100,0%Rye 1006 354 35,1% 247 180 72,9%
Rye flour 107 96 89,7%Wheat 804 238 29,6% 247 146 59,1 %
Wheat flour 116 89 76,7%
Denmark
Pulses 22 0 0%
Task 3.2.2 Task 3.2.7Country Food productn.
samplesn.
positivesamples
%positivesamples
n.samples
n.positivesamples
% positivesamples
Barley 21 0 0,0% 21 4 19,0%Beer 13 8 61,5%
Green Coffee 665 260 39,1%Millet 8 0 0,0%Oat 24 0 0,0% 7 0 0,0%
Other foodcommodities
30 8 26,7%
Other cereals 37 5 13,5%Pig meat (total) 85 3 3,5%
Coffee 76 49 64,5%Raisins 31 22 71,0%
Rye 25 0 0,0% 52 9 17,3%Wheat 50 0 0,0% 125 7 5,6%
Finland
Wine 179 113 63,1%
Task 3.2.2 Task 3.2.7Country Food productn.
samplesn.
positivesamples
%positivesamples
n.samples
n.positivesamples
% positivesamples
Cereal products 40 4 10,0% 11 4 36,4%Dried fruits 46 8 17,4%Fruit juice 19 1 5,3%
Green coffee 42 20 47,6%Maize, corn 1099 18 1,6% 18 1 5,5%
Pig meat (offals) 1011 103 10,2%Oat 1 0 0%Rice 28 28 0,0% 16 2 12,5%
Coffee 47 6 12,8%Wheat and barley 13 1 7,7% 29 2 6,9%
France
Wine 104 64 61,5%
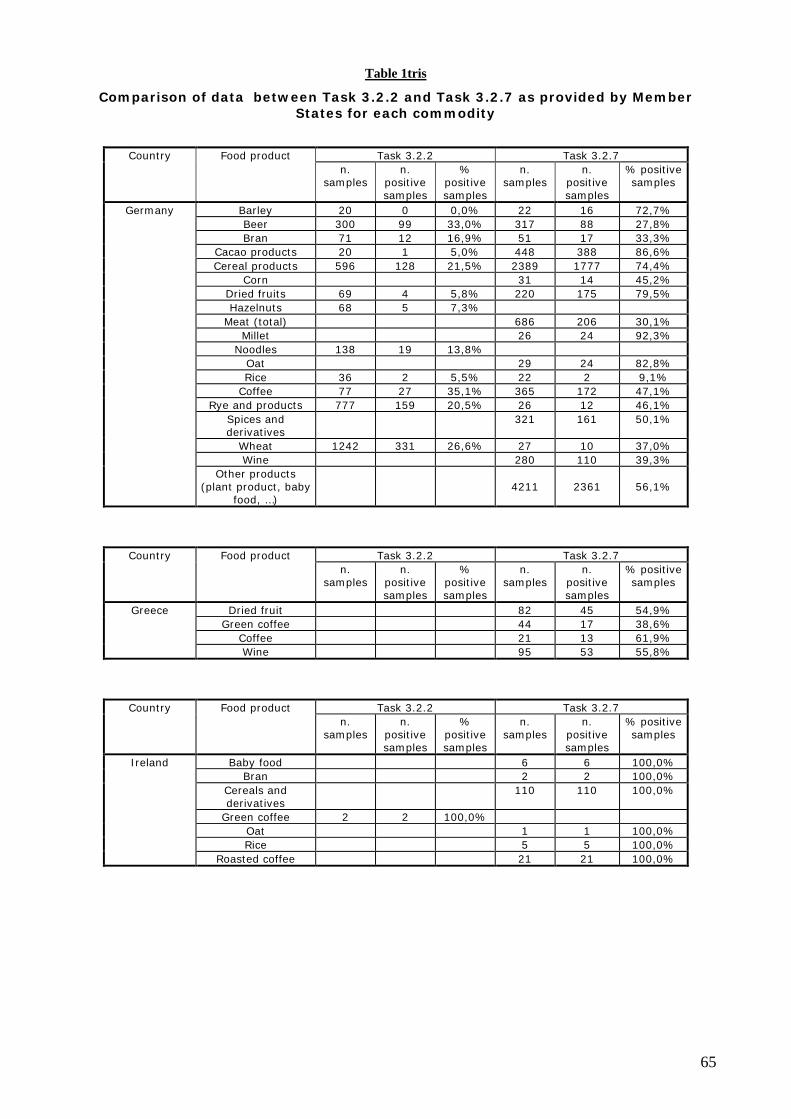
65
Table 1tris
Comparison of data between Task 3.2.2 and Task 3.2.7 as provided by MemberStates for each commodity
Task 3.2.2 Task 3.2.7Country Food productn.
samplesn.
positivesamples
%positivesamples
n.samples
n.positivesamples
% positivesamples
Barley 20 0 0,0% 22 16 72,7%Beer 300 99 33,0% 317 88 27,8%Bran 71 12 16,9% 51 17 33,3%
Cacao products 20 1 5,0% 448 388 86,6%Cereal products 596 128 21,5% 2389 1777 74,4%
Corn 31 14 45,2%Dried fruits 69 4 5,8% 220 175 79,5%Hazelnuts 68 5 7,3%
Meat (total) 686 206 30,1%Millet 26 24 92,3%
Noodles 138 19 13,8%Oat 29 24 82,8%Rice 36 2 5,5% 22 2 9,1%
Coffee 77 27 35,1% 365 172 47,1%Rye and products 777 159 20,5% 26 12 46,1%
Spices andderivatives
321 161 50,1%
Wheat 1242 331 26,6% 27 10 37,0%Wine 280 110 39,3%
Germany
Other products(plant product, baby
food, …)4211 2361 56,1%
Task 3.2.2 Task 3.2.7Country Food productn.
samplesn.
positivesamples
%positivesamples
n.samples
n.positivesamples
% positivesamples
Dried fruit 82 45 54,9%Green coffee 44 17 38,6%
Coffee 21 13 61,9%
Greece
Wine 95 53 55,8%
Task 3.2.2 Task 3.2.7Country Food productn.
samplesn.
positivesamples
%positivesamples
n.samples
n.positivesamples
% positivesamples
Baby food 6 6 100,0%Bran 2 2 100,0%
Cereals andderivatives
110 110 100,0%
Green coffee 2 2 100,0%Oat 1 1 100,0%Rice 5 5 100,0%
Ireland
Roasted coffee 21 21 100,0%
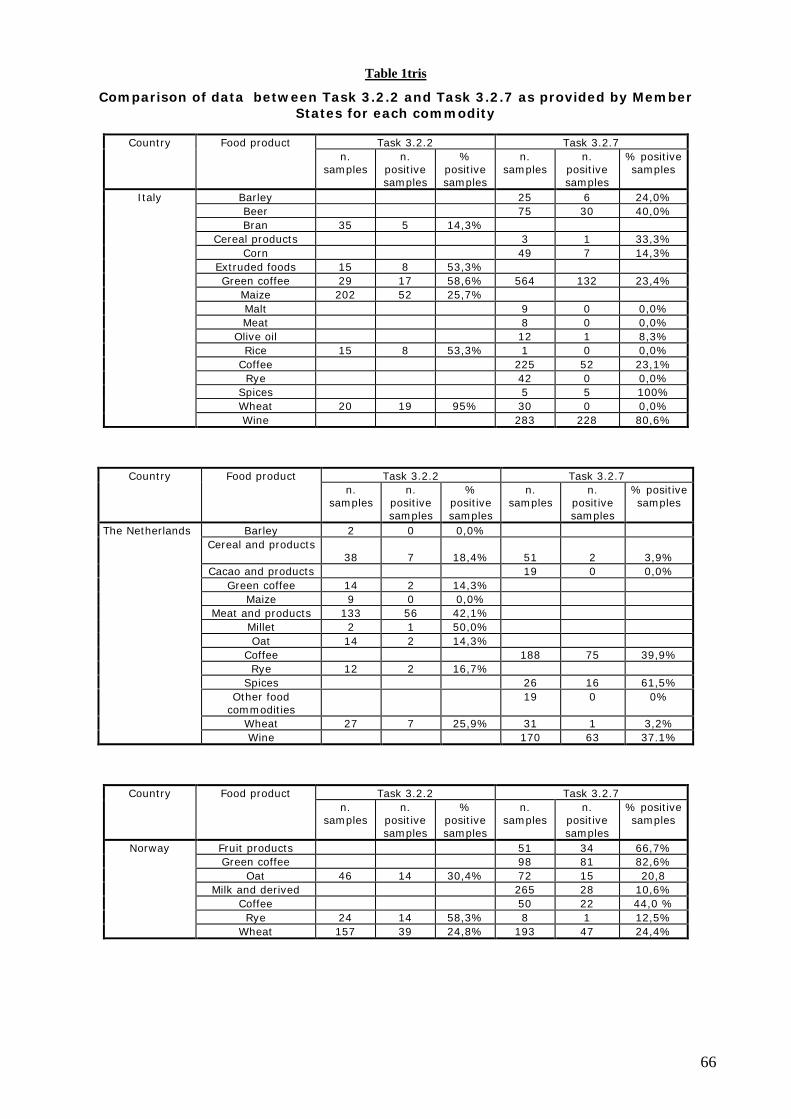
66
Table 1tris
Comparison of data between Task 3.2.2 and Task 3.2.7 as provided by MemberStates for each commodity
Task 3.2.2 Task 3.2.7Country Food productn.
samplesn.
positivesamples
%positivesamples
n.samples
n.positivesamples
% positivesamples
Barley 25 6 24,0%Beer 75 30 40,0%Bran 35 5 14,3%
Cereal products 3 1 33,3%Corn 49 7 14,3%
Extruded foods 15 8 53,3%Green coffee 29 17 58,6% 564 132 23,4%
Maize 202 52 25,7%Malt 9 0 0,0%Meat 8 0 0,0%
Olive oil 12 1 8,3%Rice 15 8 53,3% 1 0 0,0%
Coffee 225 52 23,1%Rye 42 0 0,0%
Spices 5 5 100%Wheat 20 19 95% 30 0 0,0%
Italy
Wine 283 228 80,6%
Task 3.2.2 Task 3.2.7Country Food productn.
samplesn.
positivesamples
%positivesamples
n.samples
n.positivesamples
% positivesamples
Barley 2 0 0,0%Cereal and products
38 7 18,4% 51 2 3,9%Cacao and products 19 0 0,0%
Green coffee 14 2 14,3%Maize 9 0 0,0%
Meat and products 133 56 42,1%Millet 2 1 50,0%Oat 14 2 14,3%
Coffee 188 75 39,9%Rye 12 2 16,7%
Spices 26 16 61,5%Other food
commodities19 0 0%
Wheat 27 7 25,9% 31 1 3,2%
The Netherlands
Wine 170 63 37.1%
Task 3.2.2 Task 3.2.7Country Food productn.
samplesn.
positivesamples
%positivesamples
n.samples
n.positivesamples
% positivesamples
Fruit products 51 34 66,7%Green coffee 98 81 82,6%
Oat 46 14 30,4% 72 15 20,8Milk and derived 265 28 10,6%
Coffee 50 22 44,0 %Rye 24 14 58,3% 8 1 12,5%
Norway
Wheat 157 39 24,8% 193 47 24,4%
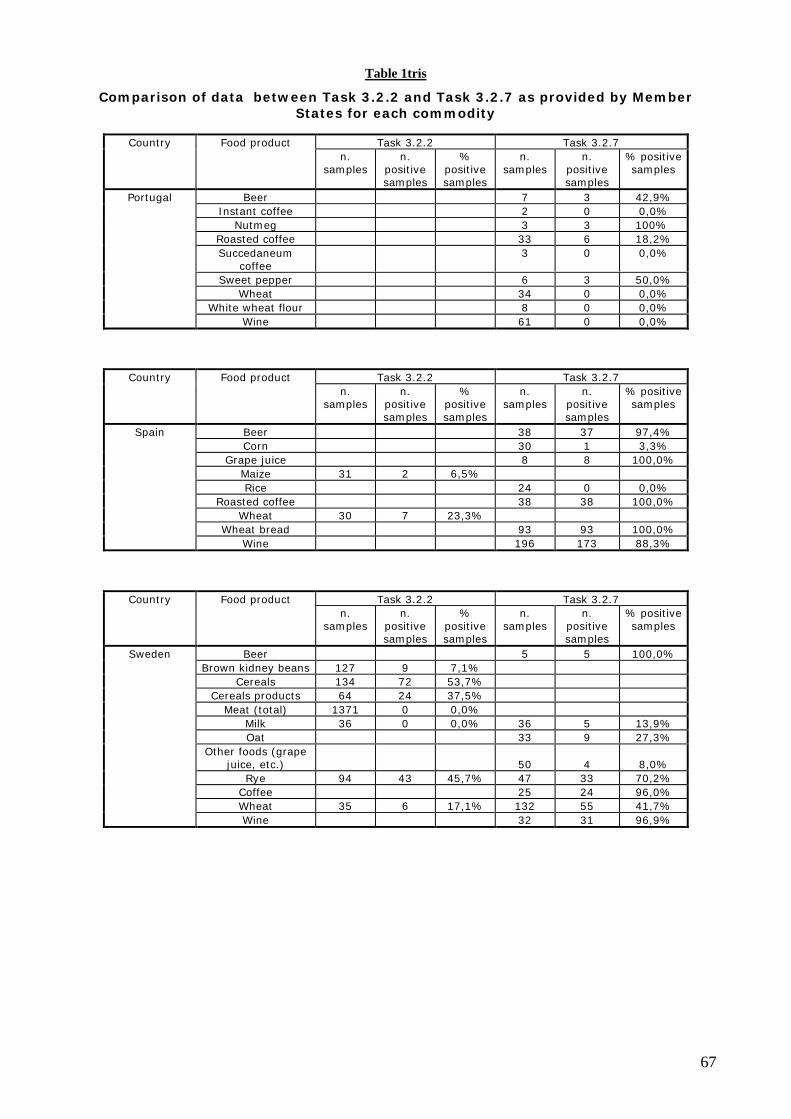
67
Table 1tris
Comparison of data between Task 3.2.2 and Task 3.2.7 as provided by MemberStates for each commodity
Task 3.2.2 Task 3.2.7Country Food productn.
samplesn.
positivesamples
%positivesamples
n.samples
n.positivesamples
% positivesamples
Beer 7 3 42,9%Instant coffee 2 0 0,0%
Nutmeg 3 3 100%Roasted coffee 33 6 18,2%Succedaneum
coffee3 0 0,0%
Sweet pepper 6 3 50,0%Wheat 34 0 0,0%
White wheat flour 8 0 0,0%
Portugal
Wine 61 0 0,0%
Task 3.2.2 Task 3.2.7Country Food productn.
samplesn.
positivesamples
%positivesamples
n.samples
n.positivesamples
% positivesamples
Beer 38 37 97,4%Corn 30 1 3,3%
Grape juice 8 8 100,0%Maize 31 2 6,5%Rice 24 0 0,0%
Roasted coffee 38 38 100,0%Wheat 30 7 23,3%
Wheat bread 93 93 100,0%
Spain
Wine 196 173 88,3%
Task 3.2.2 Task 3.2.7Country Food productn.
samplesn.
positivesamples
%positivesamples
n.samples
n.positivesamples
% positivesamples
Beer 5 5 100,0%Brown kidney beans 127 9 7,1%
Cereals 134 72 53,7%Cereals products 64 24 37,5%
Meat (total) 1371 0 0,0%Milk 36 0 0,0% 36 5 13,9%Oat 33 9 27,3%
Other foods (grapejuice, etc.) 50 4 8,0%
Rye 94 43 45,7% 47 33 70,2%Coffee 25 24 96,0%Wheat 35 6 17,1% 132 55 41,7%
Sweden
Wine 32 31 96,9%
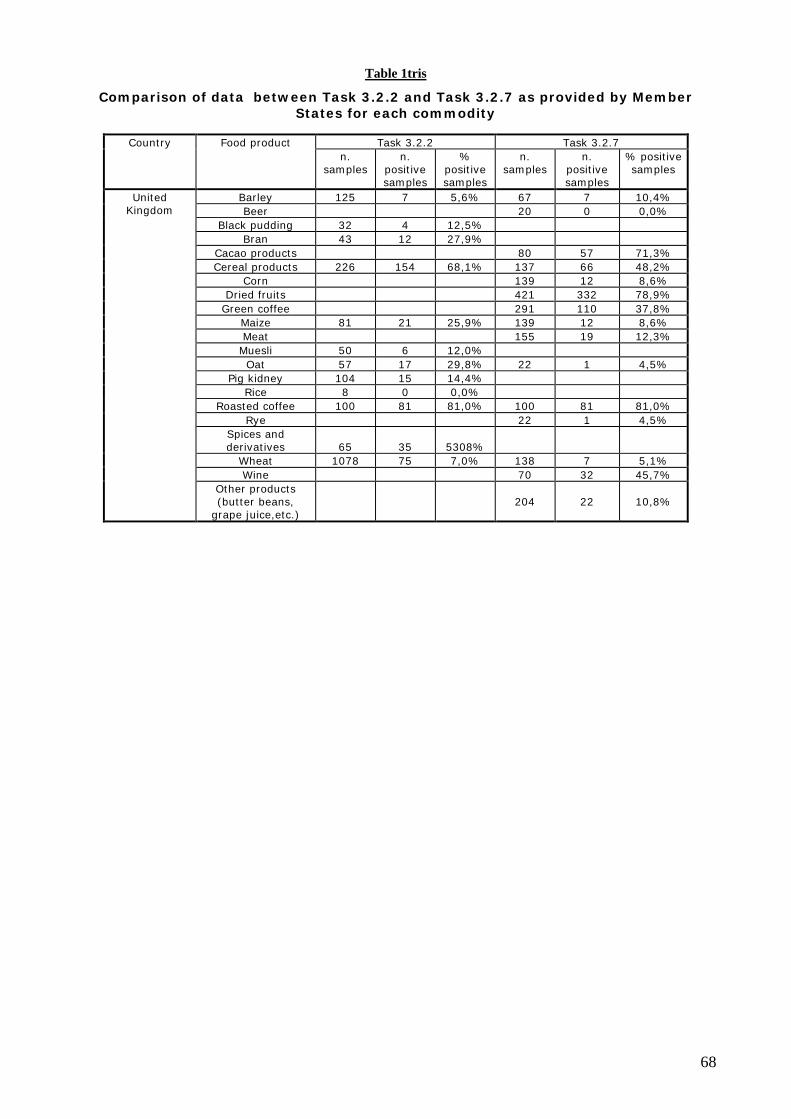
68
Table 1tris
Comparison of data between Task 3.2.2 and Task 3.2.7 as provided by MemberStates for each commodity
Task 3.2.2 Task 3.2.7Country Food productn.
samplesn.
positivesamples
%positivesamples
n.samples
n.positivesamples
% positivesamples
Barley 125 7 5,6% 67 7 10,4%Beer 20 0 0,0%
Black pudding 32 4 12,5%Bran 43 12 27,9%
Cacao products 80 57 71,3%Cereal products 226 154 68,1% 137 66 48,2%
Corn 139 12 8,6%Dried fruits 421 332 78,9%
Green coffee 291 110 37,8%Maize 81 21 25,9% 139 12 8,6%Meat 155 19 12,3%
Muesli 50 6 12,0%Oat 57 17 29,8% 22 1 4,5%
Pig kidney 104 15 14,4%Rice 8 0 0,0%
Roasted coffee 100 81 81,0% 100 81 81,0%Rye 22 1 4,5%
Spices andderivatives 65 35 5308%
Wheat 1078 75 7,0% 138 7 5,1%Wine 70 32 45,7%
UnitedKingdom
Other products(butter beans,
grape juice,etc.)204 22 10,8%
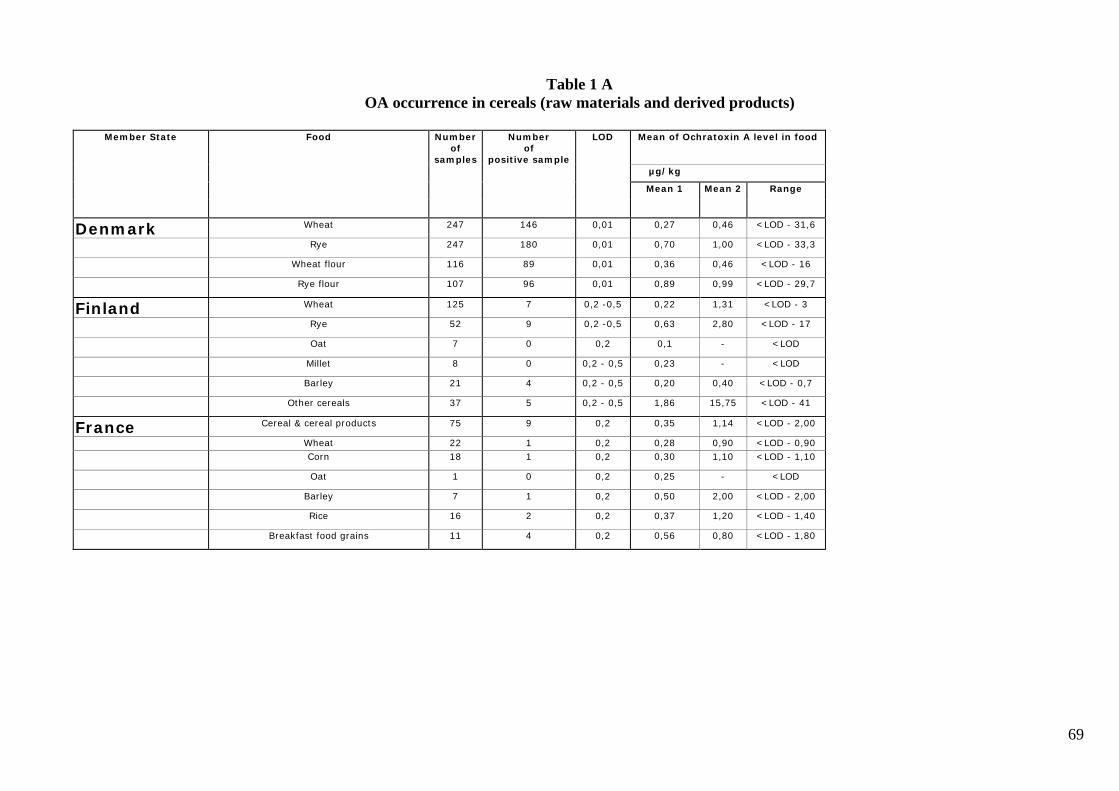
69
Table 1 AOA occurrence in cereals (raw materials and derived products)
Member State Food Numberof
samples
Numberof
positive sample
LOD Mean of Ochratoxin A level in food
µg/kg
Mean 1 Mean 2 Range
Denmark Wheat 247 146 0,01 0,27 0,46 <LOD - 31,6
Rye 247 180 0,01 0,70 1,00 <LOD - 33,3
Wheat flour 116 89 0,01 0,36 0,46 <LOD - 16
Rye flour 107 96 0,01 0,89 0,99 <LOD - 29,7
Finland Wheat 125 7 0,2 -0,5 0,22 1,31 <LOD - 3
Rye 52 9 0,2 -0,5 0,63 2,80 <LOD - 17
Oat 7 0 0,2 0,1 - <LOD
Millet 8 0 0,2 - 0,5 0,23 - <LOD
Barley 21 4 0,2 - 0,5 0,20 0,40 <LOD - 0,7
Other cereals 37 5 0,2 - 0,5 1,86 15,75 <LOD - 41
France Cereal & cereal products 75 9 0,2 0,35 1,14 <LOD - 2,00
Wheat 22 1 0,2 0,28 0,90 <LOD - 0,90Corn 18 1 0,2 0,30 1,10 <LOD - 1,10
Oat 1 0 0,2 0,25 - <LOD
Barley 7 1 0,2 0,50 2,00 <LOD - 2,00
Rice 16 2 0,2 0,37 1,20 <LOD - 1,40
Breakfast food grains 11 4 0,2 0,56 0,80 <LOD - 1,80
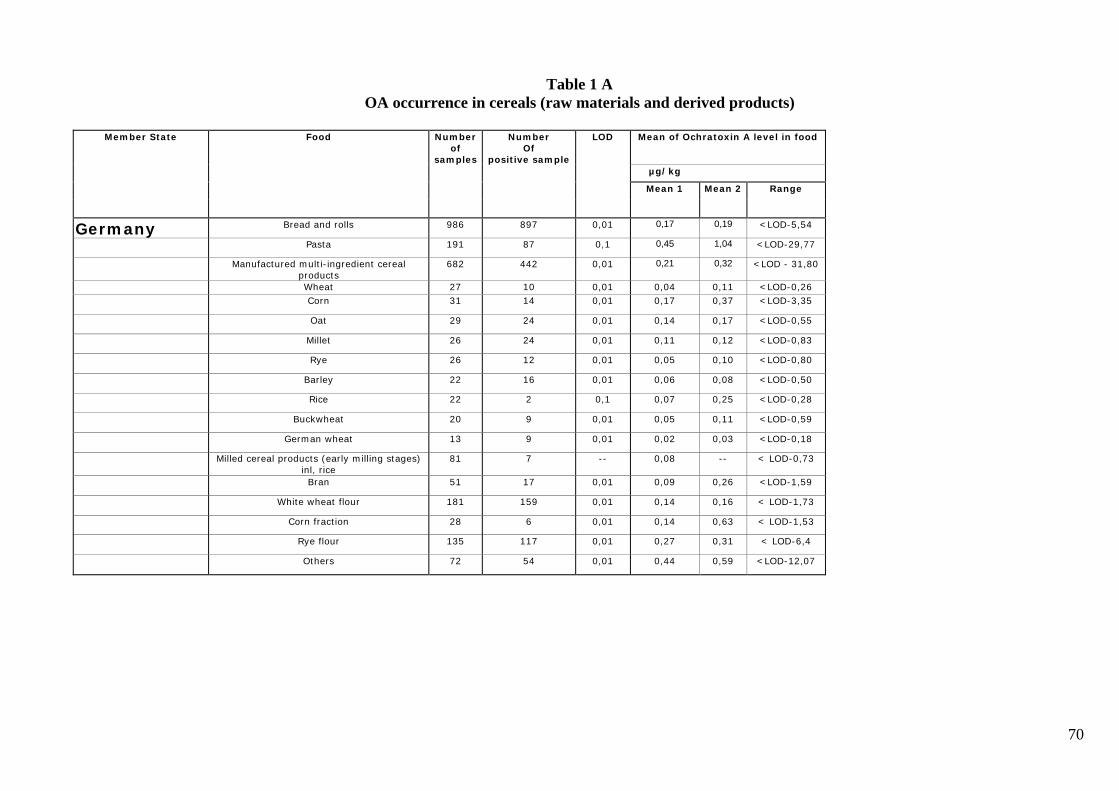
70
Table 1 AOA occurrence in cereals (raw materials and derived products)
Member State Food Numberof
samples
NumberOf
positive sample
LOD Mean of Ochratoxin A level in food
µg/kg
Mean 1 Mean 2 Range
Germany Bread and rolls 986 897 0,01 0,17 0,19 <LOD-5,54
Pasta 191 87 0,1 0,45 1,04 <LOD-29,77
Manufactured multi-ingredient cerealproducts
682 442 0,01 0,21 0,32 <LOD - 31,80
Wheat 27 10 0,01 0,04 0,11 <LOD-0,26Corn 31 14 0,01 0,17 0,37 <LOD-3,35
Oat 29 24 0,01 0,14 0,17 <LOD-0,55
Millet 26 24 0,01 0,11 0,12 <LOD-0,83
Rye 26 12 0,01 0,05 0,10 <LOD-0,80
Barley 22 16 0,01 0,06 0,08 <LOD-0,50
Rice 22 2 0,1 0,07 0,25 <LOD-0,28
Buckwheat 20 9 0,01 0,05 0,11 <LOD-0,59
German wheat 13 9 0,01 0,02 0,03 <LOD-0,18
Milled cereal products (early milling stages)inl, rice
81 7 -- 0,08 -- < LOD-0,73
Bran 51 17 0,01 0,09 0,26 <LOD-1,59
White wheat flour 181 159 0,01 0,14 0,16 < LOD-1,73
Corn fraction 28 6 0,01 0,14 0,63 < LOD-1,53
Rye flour 135 117 0,01 0,27 0,31 < LOD-6,4
Others 72 54 0,01 0,44 0,59 <LOD-12,07
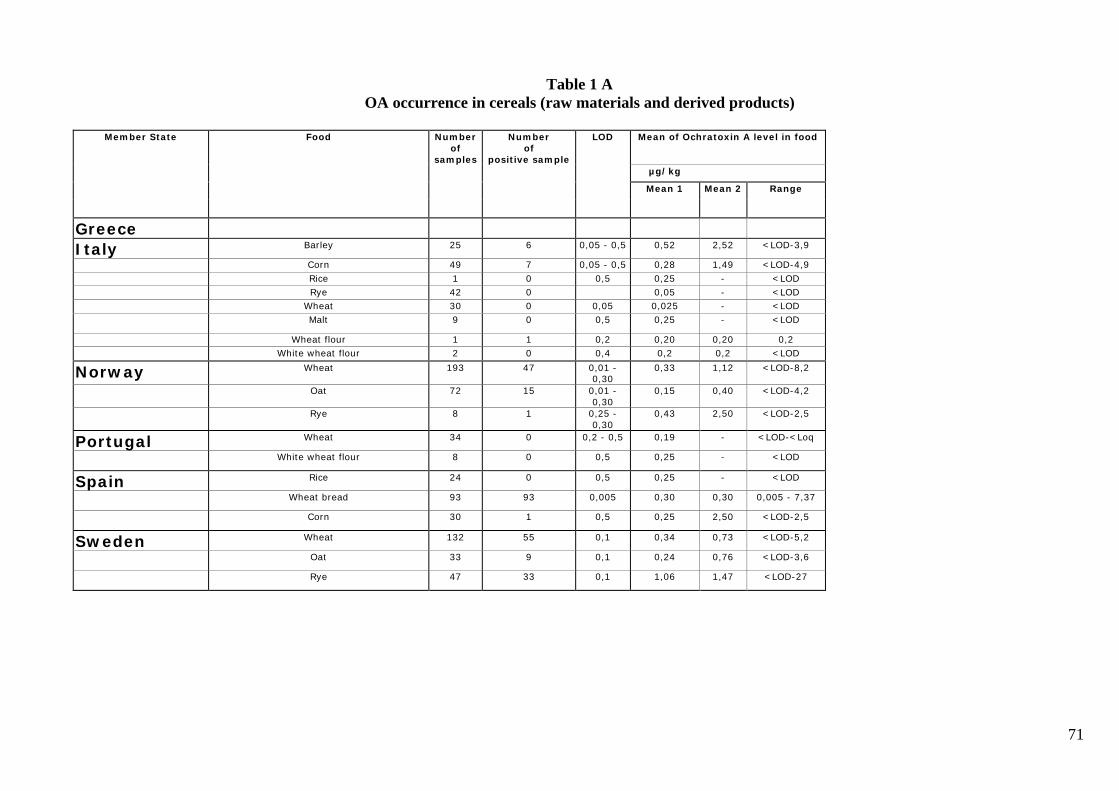
71
Table 1 AOA occurrence in cereals (raw materials and derived products)
Member State Food Numberof
samples
Numberof
positive sample
LOD Mean of Ochratoxin A level in food
µg/kg
Mean 1 Mean 2 Range
GreeceItaly Barley 25 6 0,05 - 0,5 0,52 2,52 <LOD-3,9
Corn 49 7 0,05 - 0,5 0,28 1,49 <LOD-4,9Rice 1 0 0,5 0,25 - <LODRye 42 0 0,05 - <LOD
Wheat 30 0 0,05 0,025 - <LODMalt 9 0 0,5 0,25 - <LOD
Wheat flour 1 1 0,2 0,20 0,20 0,2White wheat flour 2 0 0,4 0,2 0,2 <LOD
Norway Wheat 193 47 0,01 -0,30
0,33 1,12 <LOD-8,2
Oat 72 15 0,01 -0,30
0,15 0,40 <LOD-4,2
Rye 8 1 0,25 -0,30
0,43 2,50 <LOD-2,5
Portugal Wheat 34 0 0,2 - 0,5 0,19 - <LOD-<Loq
White wheat flour 8 0 0,5 0,25 - <LOD
Spain Rice 24 0 0,5 0,25 - <LOD
Wheat bread 93 93 0,005 0,30 0,30 0,005 - 7,37
Corn 30 1 0,5 0,25 2,50 <LOD-2,5
Sweden Wheat 132 55 0,1 0,34 0,73 <LOD-5,2
Oat 33 9 0,1 0,24 0,76 <LOD-3,6
Rye 47 33 0,1 1,06 1,47 <LOD-27
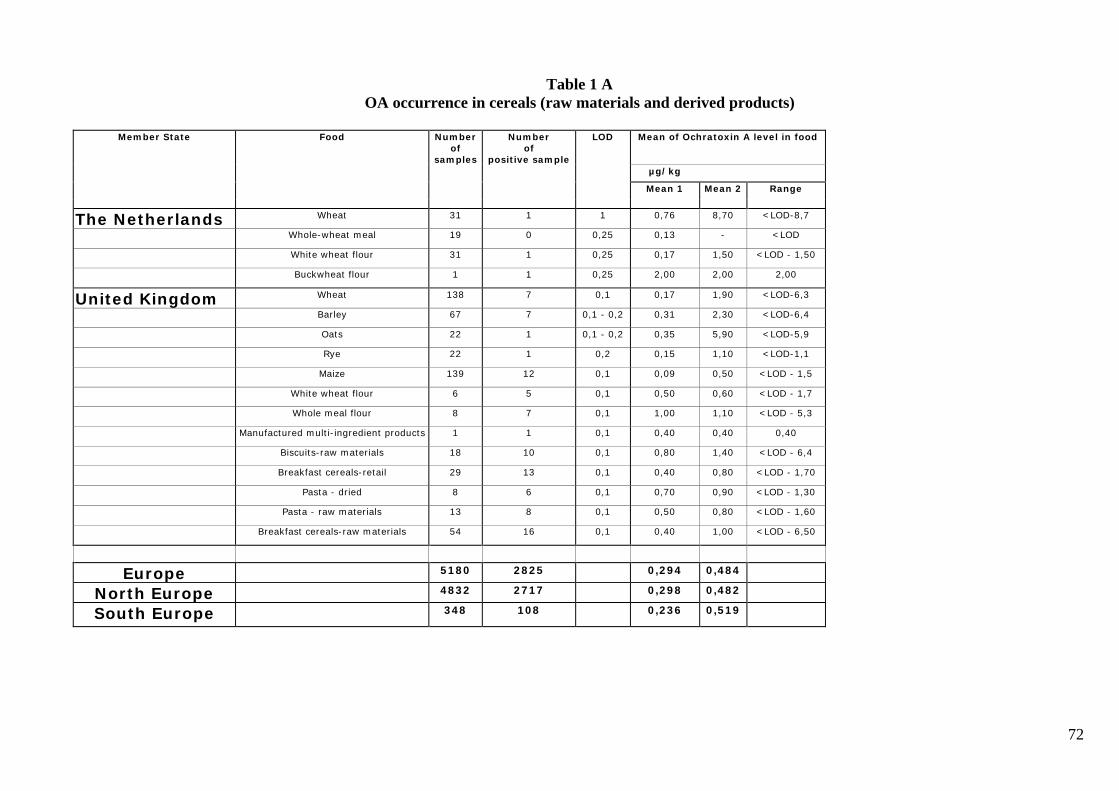
72
Table 1 AOA occurrence in cereals (raw materials and derived products)
Member State Food Numberof
samples
Numberof
positive sample
LOD Mean of Ochratoxin A level in food
µg/kg
Mean 1 Mean 2 Range
The Netherlands Wheat 31 1 1 0,76 8,70 <LOD-8,7
Whole-wheat meal 19 0 0,25 0,13 - <LOD
White wheat flour 31 1 0,25 0,17 1,50 <LOD - 1,50
Buckwheat flour 1 1 0,25 2,00 2,00 2,00
United Kingdom Wheat 138 7 0,1 0,17 1,90 <LOD-6,3
Barley 67 7 0,1 - 0,2 0,31 2,30 <LOD-6,4
Oats 22 1 0,1 - 0,2 0,35 5,90 <LOD-5,9
Rye 22 1 0,2 0,15 1,10 <LOD-1,1
Maize 139 12 0,1 0,09 0,50 <LOD - 1,5
White wheat flour 6 5 0,1 0,50 0,60 <LOD - 1,7
Whole meal flour 8 7 0,1 1,00 1,10 <LOD - 5,3
Manufactured multi-ingredient products 1 1 0,1 0,40 0,40 0,40
Biscuits-raw materials 18 10 0,1 0,80 1,40 <LOD - 6,4
Breakfast cereals-retail 29 13 0,1 0,40 0,80 <LOD - 1,70
Pasta - dried 8 6 0,1 0,70 0,90 <LOD - 1,30
Pasta - raw materials 13 8 0,1 0,50 0,80 <LOD - 1,60
Breakfast cereals-raw materials 54 16 0,1 0,40 1,00 <LOD - 6,50
Europe 5180 2825 0,294 0,484
North Europe 4832 2717 0,298 0,482
South Europe 348 108 0,236 0,519
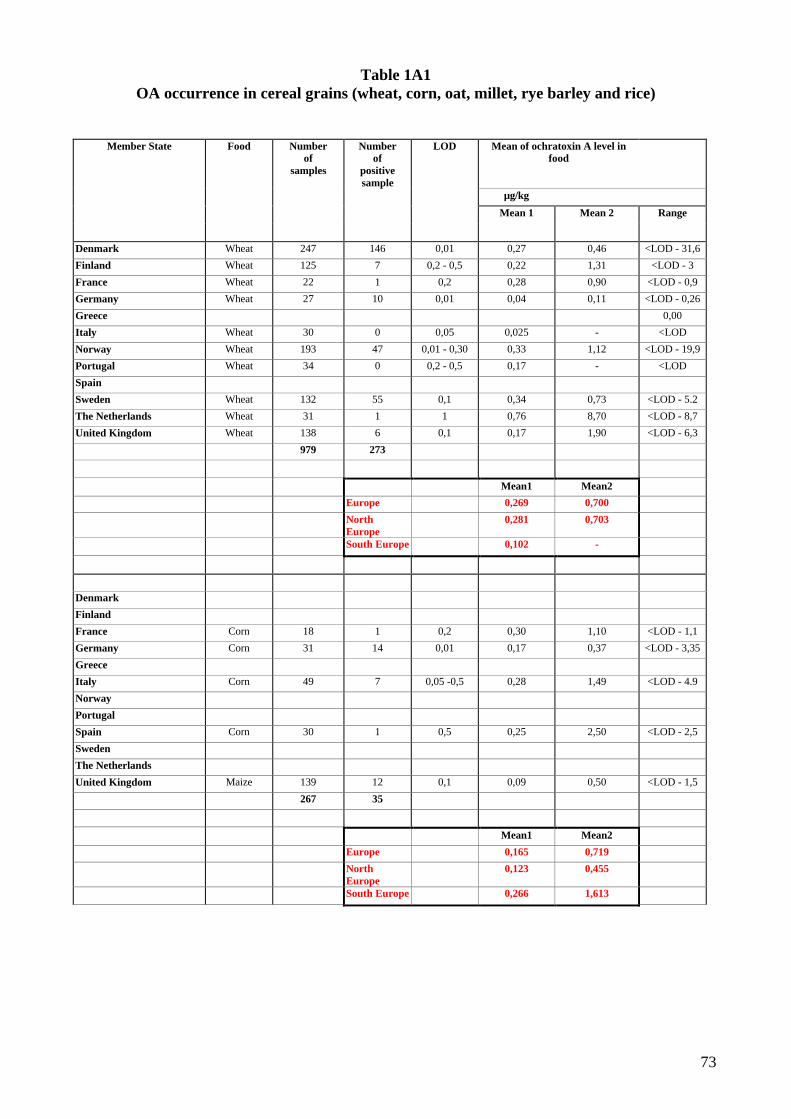
73
Table 1A1OA occurrence in cereal grains (wheat, corn, oat, millet, rye barley and rice)
Member State Food Numberof
samples
Numberof
positivesample
LOD Mean of ochratoxin A level infood
µg/kg
Mean 1 Mean 2 Range
Denmark Wheat 247 146 0,01 0,27 0,46 <LOD - 31,6
Finland Wheat 125 7 0,2 - 0,5 0,22 1,31 <LOD - 3
France Wheat 22 1 0,2 0,28 0,90 <LOD - 0,9
Germany Wheat 27 10 0,01 0,04 0,11 <LOD - 0,26
Greece 0,00
Italy Wheat 30 0 0,05 0,025 - <LOD
Norway Wheat 193 47 0,01 - 0,30 0,33 1,12 <LOD - 19,9
Portugal Wheat 34 0 0,2 - 0,5 0,17 - <LOD
Spain
Sweden Wheat 132 55 0,1 0,34 0,73 <LOD - 5.2
The Netherlands Wheat 31 1 1 0,76 8,70 <LOD - 8,7
United Kingdom Wheat 138 6 0,1 0,17 1,90 <LOD - 6,3
979 273
Mean1 Mean2
Europe 0,269 0,700
NorthEurope
0,281 0,703
South Europe 0,102 -
Denmark
Finland
France Corn 18 1 0,2 0,30 1,10 <LOD - 1,1
Germany Corn 31 14 0,01 0,17 0,37 <LOD - 3,35
Greece
Italy Corn 49 7 0,05 -0,5 0,28 1,49 <LOD - 4.9
Norway
Portugal
Spain Corn 30 1 0,5 0,25 2,50 <LOD - 2,5
Sweden
The Netherlands
United Kingdom Maize 139 12 0,1 0,09 0,50 <LOD - 1,5
267 35
Mean1 Mean2
Europe 0,165 0,719
NorthEurope
0,123 0,455
South Europe 0,266 1,613
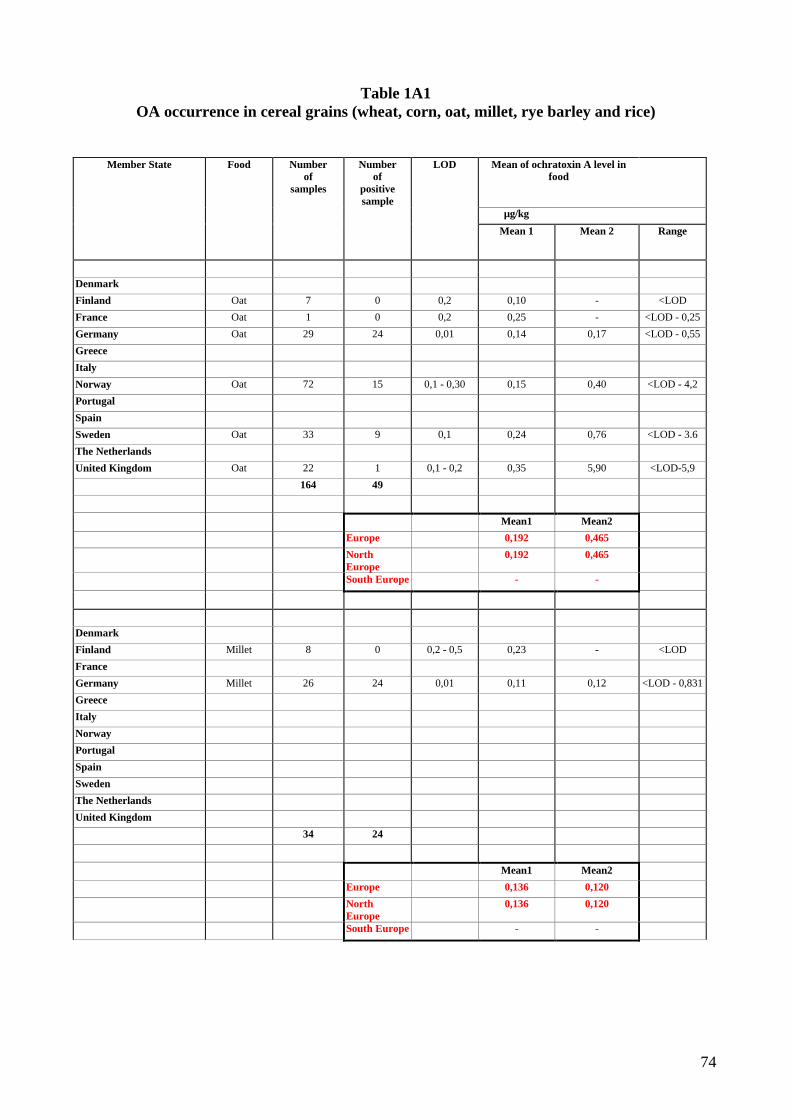
74
Table 1A1OA occurrence in cereal grains (wheat, corn, oat, millet, rye barley and rice)
Member State Food Numberof
samples
Numberof
positivesample
LOD Mean of ochratoxin A level infood
µg/kg
Mean 1 Mean 2 Range
Denmark
Finland Oat 7 0 0,2 0,10 - <LOD
France Oat 1 0 0,2 0,25 - <LOD - 0,25
Germany Oat 29 24 0,01 0,14 0,17 <LOD - 0,55
Greece
Italy
Norway Oat 72 15 0,1 - 0,30 0,15 0,40 <LOD - 4,2
Portugal
Spain
Sweden Oat 33 9 0,1 0,24 0,76 <LOD - 3.6
The Netherlands
United Kingdom Oat 22 1 0,1 - 0,2 0,35 5,90 <LOD-5,9
164 49
Mean1 Mean2
Europe 0,192 0,465
NorthEurope
0,192 0,465
South Europe - -
Denmark
Finland Millet 8 0 0,2 - 0,5 0,23 - <LOD
France
Germany Millet 26 24 0,01 0,11 0,12 <LOD - 0,831
Greece
Italy
Norway
Portugal
Spain
Sweden
The Netherlands
United Kingdom
34 24
Mean1 Mean2
Europe 0,136 0,120
NorthEurope
0,136 0,120
South Europe - -
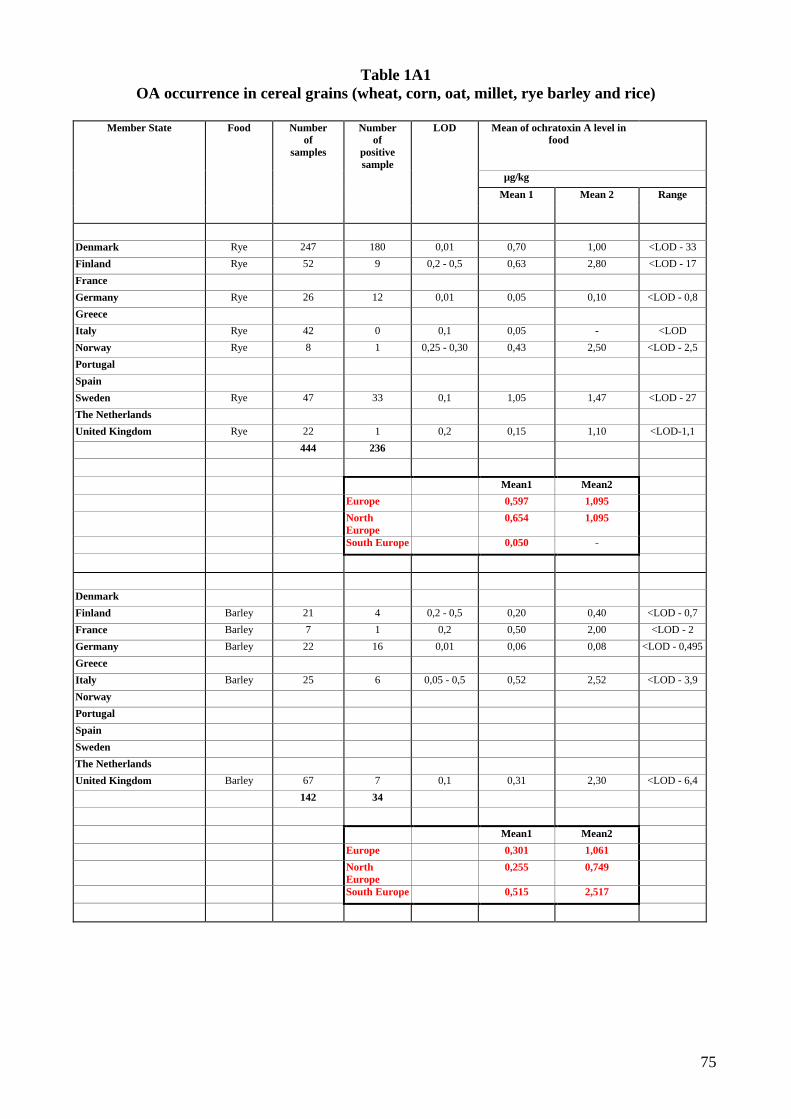
75
Table 1A1OA occurrence in cereal grains (wheat, corn, oat, millet, rye barley and rice)
Member State Food Numberof
samples
Numberof
positivesample
LOD Mean of ochratoxin A level infood
µg/kg
Mean 1 Mean 2 Range
Denmark Rye 247 180 0,01 0,70 1,00 <LOD - 33
Finland Rye 52 9 0,2 - 0,5 0,63 2,80 <LOD - 17
France
Germany Rye 26 12 0,01 0,05 0,10 <LOD - 0,8
Greece
Italy Rye 42 0 0,1 0,05 - <LOD
Norway Rye 8 1 0,25 - 0,30 0,43 2,50 <LOD - 2,5
Portugal
Spain
Sweden Rye 47 33 0,1 1,05 1,47 <LOD - 27
The Netherlands
United Kingdom Rye 22 1 0,2 0,15 1,10 <LOD-1,1
444 236
Mean1 Mean2
Europe 0,597 1,095
NorthEurope
0,654 1,095
South Europe 0,050 -
Denmark
Finland Barley 21 4 0,2 - 0,5 0,20 0,40 <LOD - 0,7
France Barley 7 1 0,2 0,50 2,00 <LOD - 2
Germany Barley 22 16 0,01 0,06 0,08 <LOD - 0,495
Greece
Italy Barley 25 6 0,05 - 0,5 0,52 2,52 <LOD - 3,9
Norway
Portugal
Spain
Sweden
The Netherlands
United Kingdom Barley 67 7 0,1 0,31 2,30 <LOD - 6,4
142 34
Mean1 Mean2
Europe 0,301 1,061
NorthEurope
0,255 0,749
South Europe 0,515 2,517
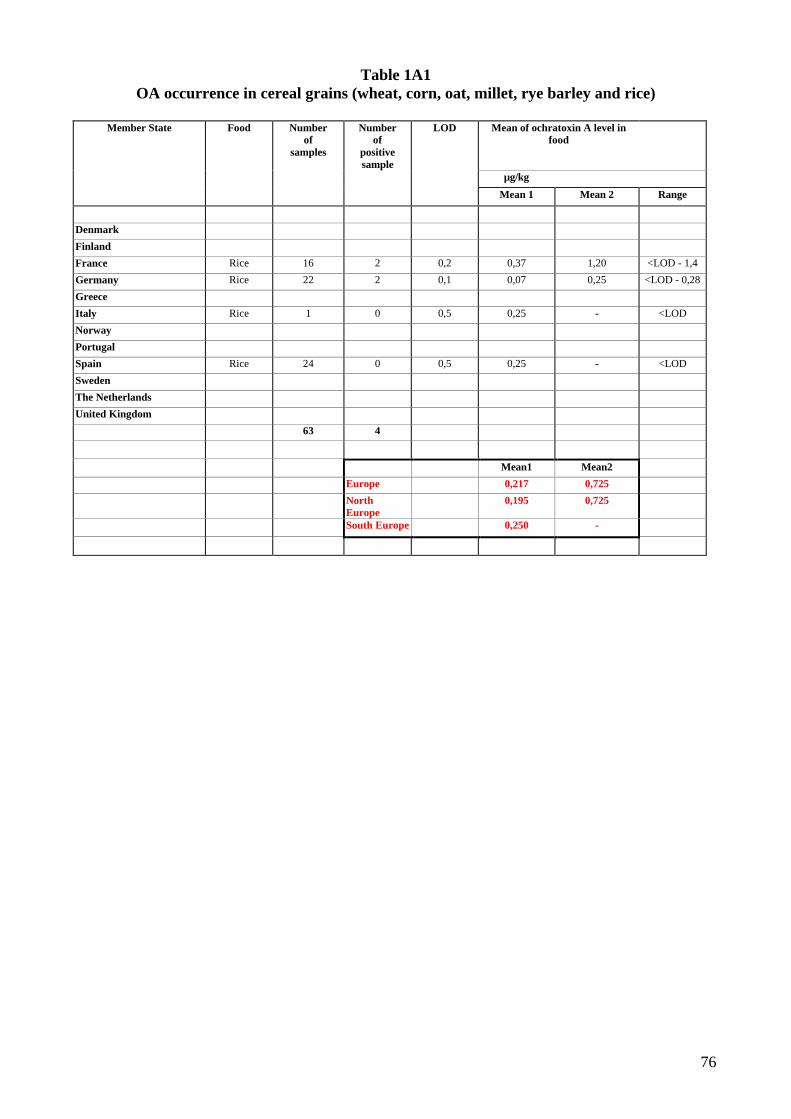
76
Table 1A1OA occurrence in cereal grains (wheat, corn, oat, millet, rye barley and rice)
Member State Food Numberof
samples
Numberof
positivesample
LOD Mean of ochratoxin A level infood
µg/kg
Mean 1 Mean 2 Range
Denmark
Finland
France Rice 16 2 0,2 0,37 1,20 <LOD - 1,4
Germany Rice 22 2 0,1 0,07 0,25 <LOD - 0,28
Greece
Italy Rice 1 0 0,5 0,25 - <LOD
Norway
Portugal
Spain Rice 24 0 0,5 0,25 - <LOD
Sweden
The Netherlands
United Kingdom
63 4
Mean1 Mean2
Europe 0,217 0,725
NorthEurope
0,195 0,725
South Europe 0,250 -
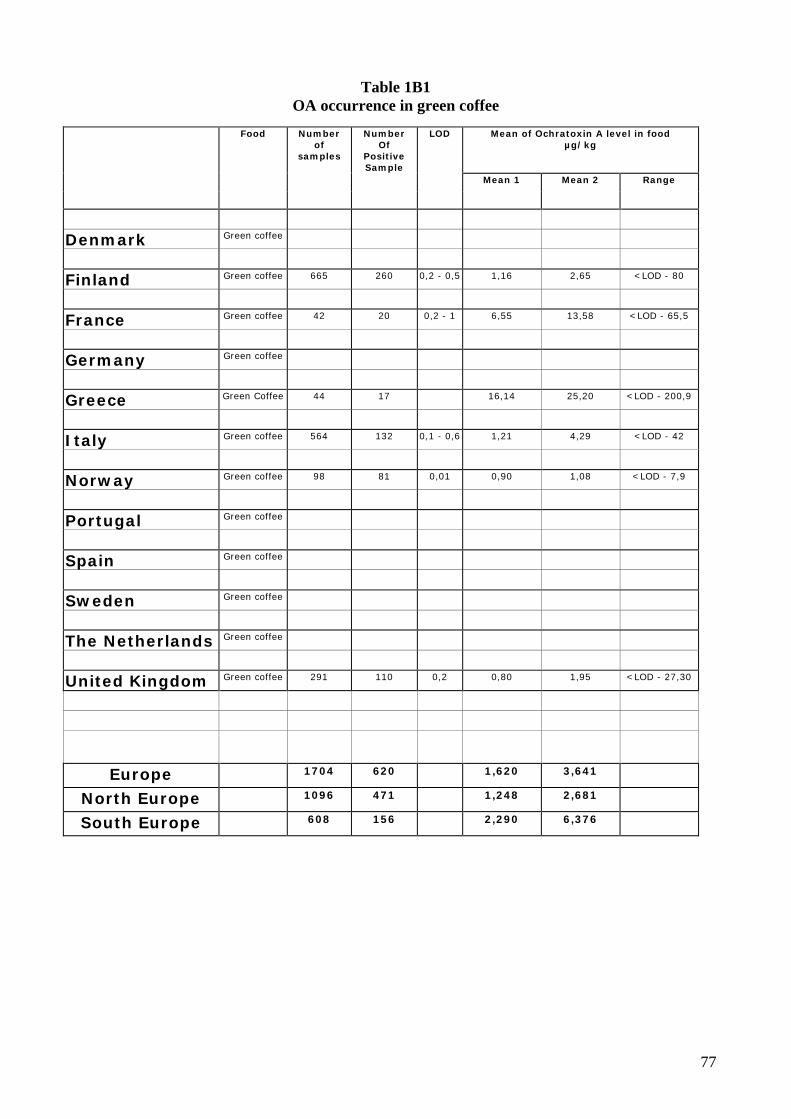
77
Table 1B1OA occurrence in green coffee
Food Numberof
samples
NumberOf
PositiveSample
LOD Mean of Ochratoxin A level in foodµg/kg
Mean 1 Mean 2 Range
Denmark Green coffee
Finland Green coffee 665 260 0,2 - 0,5 1,16 2,65 <LOD - 80
France Green coffee 42 20 0,2 - 1 6,55 13,58 <LOD - 65,5
Germany Green coffee
Greece Green Coffee 44 17 16,14 25,20 <LOD - 200,9
Italy Green coffee 564 132 0,1 - 0,6 1,21 4,29 <LOD - 42
Norway Green coffee 98 81 0,01 0,90 1,08 <LOD - 7,9
Portugal Green coffee
Spain Green coffee
Sweden Green coffee
The Netherlands Green coffee
United Kingdom Green coffee 291 110 0,2 0,80 1,95 <LOD - 27,30
Europe 1704 620 1,620 3,641
North Europe 1096 471 1,248 2,681
South Europe 608 156 2,290 6,376
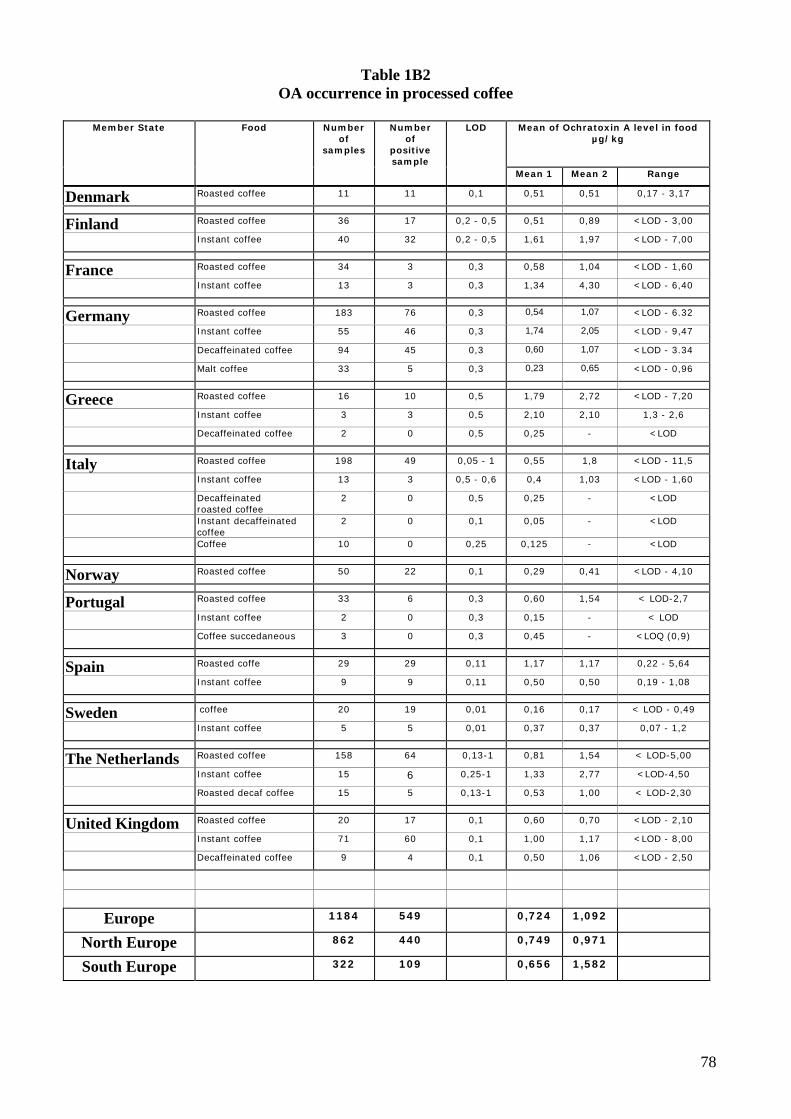
78
Table 1B2OA occurrence in processed coffee
Member State Food Numberof
samples
Numberof
positivesample
LOD Mean of Ochratoxin A level in foodµg/kg
Mean 1 Mean 2 Range
Denmark Roasted coffee 11 11 0,1 0,51 0,51 0,17 - 3,17
Finland Roasted coffee 36 17 0,2 - 0,5 0,51 0,89 <LOD - 3,00
Instant coffee 40 32 0,2 - 0,5 1,61 1,97 <LOD - 7,00
France Roasted coffee 34 3 0,3 0,58 1,04 <LOD - 1,60
Instant coffee 13 3 0,3 1,34 4,30 <LOD - 6,40
Germany Roasted coffee 183 76 0,3 0,54 1,07 <LOD - 6.32
Instant coffee 55 46 0,3 1,74 2,05 <LOD - 9,47
Decaffeinated coffee 94 45 0,3 0,60 1,07 <LOD - 3.34
Malt coffee 33 5 0,3 0,23 0,65 <LOD - 0,96
Greece Roasted coffee 16 10 0,5 1,79 2,72 <LOD - 7,20
Instant coffee 3 3 0,5 2,10 2,10 1,3 - 2,6
Decaffeinated coffee 2 0 0,5 0,25 - <LOD
Italy Roasted coffee 198 49 0,05 - 1 0,55 1,8 <LOD - 11,5
Instant coffee 13 3 0,5 - 0,6 0,4 1,03 <LOD - 1,60
Decaffeinatedroasted coffee
2 0 0,5 0,25 - <LOD
Instant decaffeinatedcoffee
2 0 0,1 0,05 - <LOD
Coffee 10 0 0,25 0,125 - <LOD
Norway Roasted coffee 50 22 0,1 0,29 0,41 <LOD - 4,10
Portugal Roasted coffee 33 6 0,3 0,60 1,54 < LOD-2,7
Instant coffee 2 0 0,3 0,15 - < LOD
Coffee succedaneous 3 0 0,3 0,45 - <LOQ (0,9)
Spain Roasted coffe 29 29 0,11 1,17 1,17 0,22 - 5,64
Instant coffee 9 9 0,11 0,50 0,50 0,19 - 1,08
Sweden d coffee 20 19 0,01 0,16 0,17 < LOD - 0,49
Instant coffee 5 5 0,01 0,37 0,37 0,07 - 1,2
The Netherlands Roasted coffee 158 64 0,13-1 0,81 1,54 < LOD-5,00
Instant coffee 15 6 0,25-1 1,33 2,77 <LOD-4,50
Roasted decaf coffee 15 5 0,13-1 0,53 1,00 < LOD-2,30
United Kingdom Roasted coffee 20 17 0,1 0,60 0,70 <LOD - 2,10
Instant coffee 71 60 0,1 1,00 1,17 <LOD - 8,00
Decaffeinated coffee 9 4 0,1 0,50 1,06 <LOD - 2,50
Europe 1184 549 0,724 1,092
North Europe 862 440 0,749 0,971
South Europe 322 109 0,656 1,582
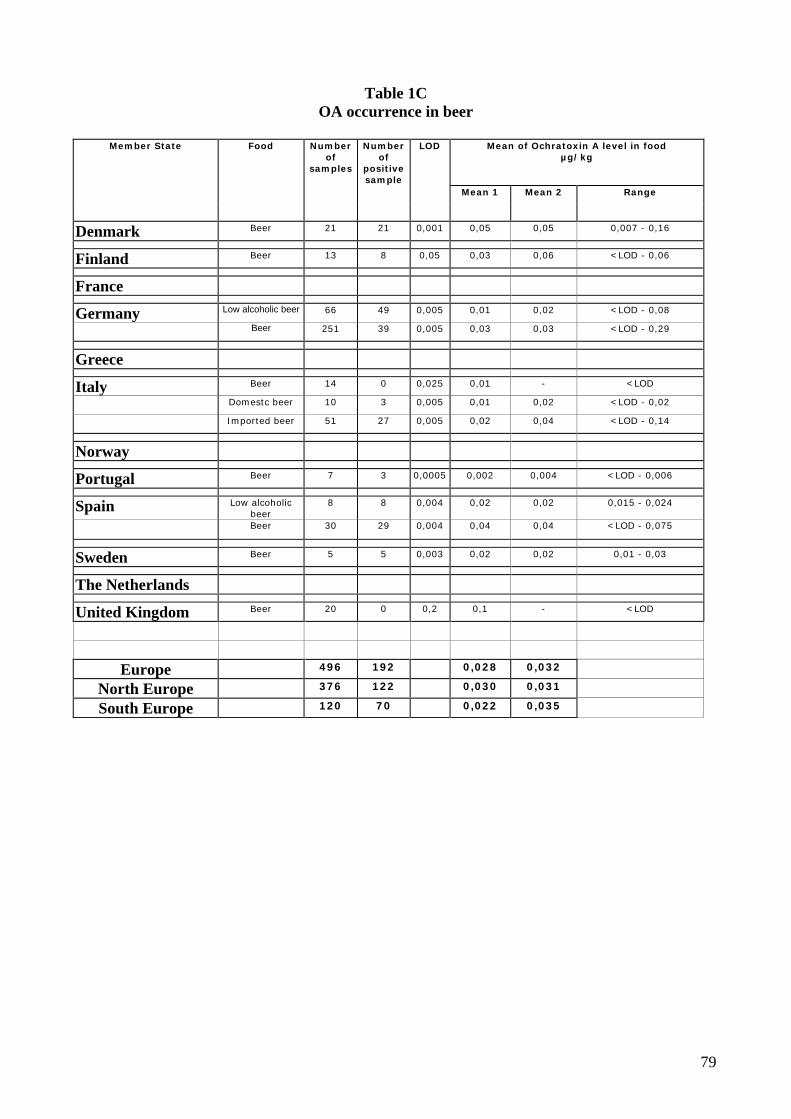
79
Table 1COA occurrence in beer
Member State Food Numberof
samples
Numberof
positivesample
LOD Mean of Ochratoxin A level in foodµg/kg
Mean 1 Mean 2 Range
Denmark Beer 21 21 0,001 0,05 0,05 0,007 - 0,16
Finland Beer 13 8 0,05 0,03 0,06 <LOD - 0,06
France
Germany Low alcoholic beer 66 49 0,005 0,01 0,02 <LOD - 0,08
Beer 251 39 0,005 0,03 0,03 <LOD - 0,29
Greece
Italy Beer 14 0 0,025 0,01 - <LOD
Domestc beer 10 3 0,005 0,01 0,02 <LOD - 0,02
Imported beer 51 27 0,005 0,02 0,04 <LOD - 0,14
Norway
Portugal Beer 7 3 0,0005 0,002 0,004 <LOD - 0,006
Spain Low alcoholicbeer
8 8 0,004 0,02 0,02 0,015 - 0,024
Beer 30 29 0,004 0,04 0,04 <LOD - 0,075
Sweden Beer 5 5 0,003 0,02 0,02 0,01 - 0,03
The Netherlands
United Kingdom Beer 20 0 0,2 0,1 - <LOD
Europe 496 192 0,028 0,032
North Europe 376 122 0,030 0,031
South Europe 120 70 0,022 0,035
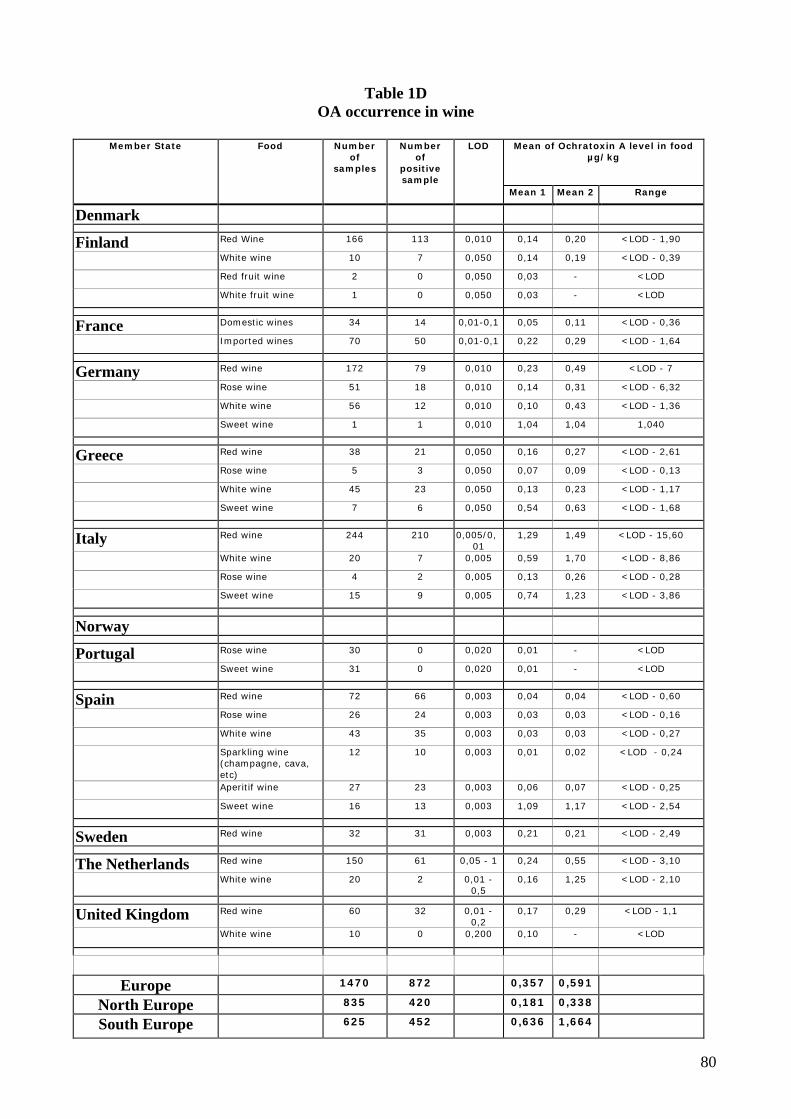
80
Table 1DOA occurrence in wine
Member State Food Numberof
samples
Numberof
positivesample
LOD Mean of Ochratoxin A level in foodµg/kg
Mean 1 Mean 2 Range
Denmark
Finland Red Wine 166 113 0,010 0,14 0,20 <LOD - 1,90
White wine 10 7 0,050 0,14 0,19 <LOD - 0,39
Red fruit wine 2 0 0,050 0,03 - <LOD
White fruit wine 1 0 0,050 0,03 - <LOD
France Domestic wines 34 14 0,01-0,1 0,05 0,11 <LOD - 0,36
Imported wines 70 50 0,01-0,1 0,22 0,29 <LOD - 1,64
Germany Red wine 172 79 0,010 0,23 0,49 <LOD - 7
Rose wine 51 18 0,010 0,14 0,31 <LOD - 6,32
White wine 56 12 0,010 0,10 0,43 <LOD - 1,36
Sweet wine 1 1 0,010 1,04 1,04 1,040
Greece Red wine 38 21 0,050 0,16 0,27 <LOD - 2,61
Rose wine 5 3 0,050 0,07 0,09 <LOD - 0,13
White wine 45 23 0,050 0,13 0,23 <LOD - 1,17
Sweet wine 7 6 0,050 0,54 0,63 <LOD - 1,68
Italy Red wine 244 210 0,005/0,01
1,29 1,49 <LOD - 15,60
White wine 20 7 0,005 0,59 1,70 <LOD - 8,86
Rose wine 4 2 0,005 0,13 0,26 <LOD - 0,28
Sweet wine 15 9 0,005 0,74 1,23 <LOD - 3,86
Norway
Portugal Rose wine 30 0 0,020 0,01 - <LOD
Sweet wine 31 0 0,020 0,01 - <LOD
Spain Red wine 72 66 0,003 0,04 0,04 <LOD - 0,60
Rose wine 26 24 0,003 0,03 0,03 <LOD - 0,16
White wine 43 35 0,003 0,03 0,03 <LOD - 0,27
Sparkling wine(champagne, cava,etc)
12 10 0,003 0,01 0,02 <LOD - 0,24
Aperitif wine 27 23 0,003 0,06 0,07 <LOD - 0,25
Sweet wine 16 13 0,003 1,09 1,17 <LOD - 2,54
Sweden Red wine 32 31 0,003 0,21 0,21 <LOD - 2,49
The Netherlands Red wine 150 61 0,05 - 1 0,24 0,55 <LOD - 3,10
White wine 20 2 0,01 -0,5
0,16 1,25 <LOD - 2,10
United Kingdom Red wine 60 32 0,01 -0,2
0,17 0,29 <LOD - 1,1
White wine 10 0 0,200 0,10 - <LOD
Europe 1470 872 0,357 0,591
North Europe 835 420 0,181 0,338
South Europe 625 452 0,636 1,664
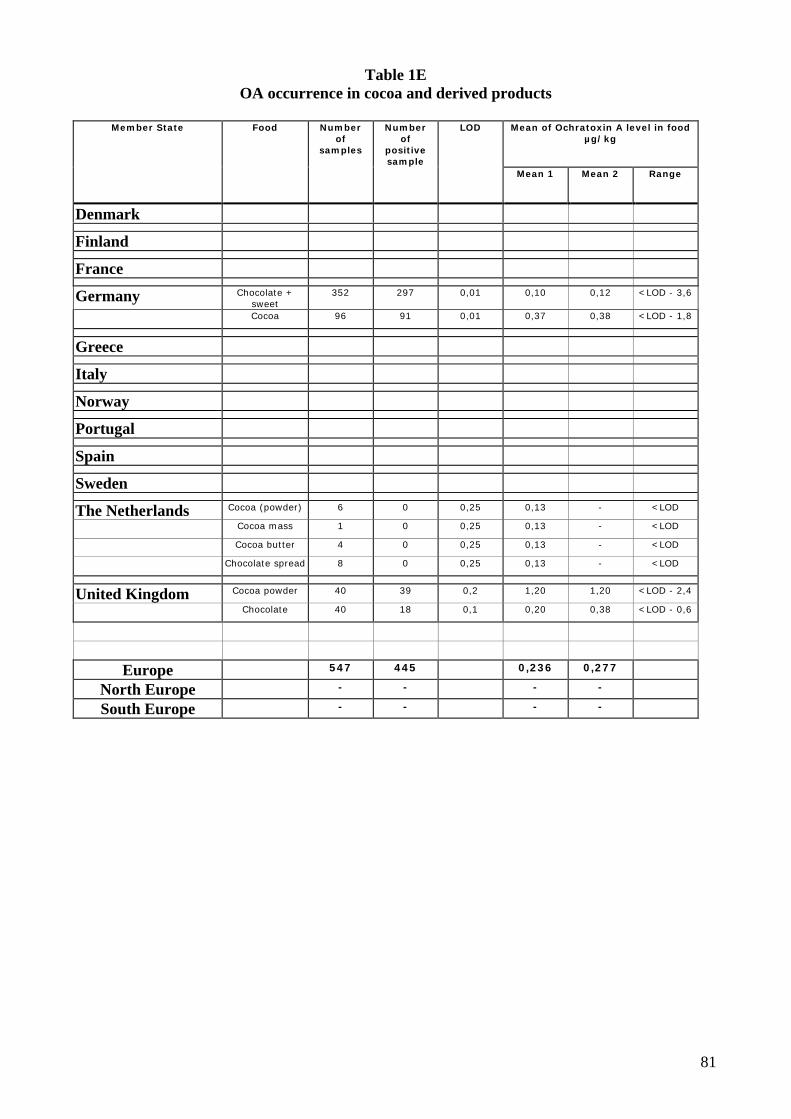
81
Table 1EOA occurrence in cocoa and derived products
Member State Food Numberof
samples
Numberof
positivesample
LOD Mean of Ochratoxin A level in foodµg/kg
Mean 1 Mean 2 Range
Denmark
Finland
France
Germany Chocolate +sweet
352 297 0,01 0,10 0,12 <LOD - 3,6
Cocoa 96 91 0,01 0,37 0,38 <LOD - 1,8
Greece
Italy
Norway
Portugal
Spain
Sweden
The Netherlands Cocoa (powder) 6 0 0,25 0,13 - <LOD
Cocoa mass 1 0 0,25 0,13 - <LOD
Cocoa butter 4 0 0,25 0,13 - <LOD
Chocolate spread 8 0 0,25 0,13 - <LOD
United Kingdom Cocoa powder 40 39 0,2 1,20 1,20 <LOD - 2,4
Chocolate 40 18 0,1 0,20 0,38 <LOD - 0,6
Europe 547 445 0,236 0,277
North Europe - - - -
South Europe - - - -
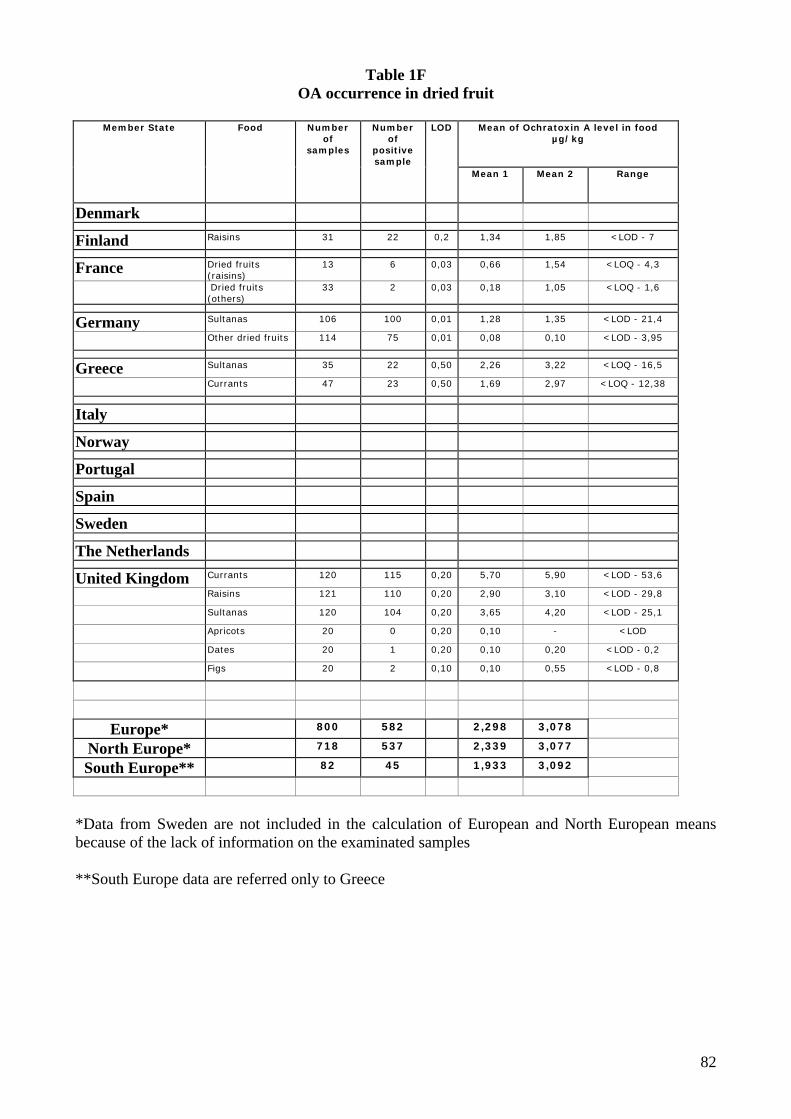
82
Table 1FOA occurrence in dried fruit
Member State Food Numberof
samples
Numberof
positivesample
LOD Mean of Ochratoxin A level in foodµg/kg
Mean 1 Mean 2 Range
Denmark
Finland Raisins 31 22 0,2 1,34 1,85 <LOD - 7
France Dried fruits(raisins)
13 6 0,03 0,66 1,54 <LOQ - 4,3
Dried fruits(others)
33 2 0,03 0,18 1,05 <LOQ - 1,6
Germany Sultanas 106 100 0,01 1,28 1,35 <LOD - 21,4
Other dried fruits 114 75 0,01 0,08 0,10 <LOD - 3,95
Greece Sultanas 35 22 0,50 2,26 3,22 <LOQ - 16,5
Currants 47 23 0,50 1,69 2,97 <LOQ - 12,38
Italy
Norway
Portugal
Spain
Sweden
The Netherlands
United Kingdom Currants 120 115 0,20 5,70 5,90 <LOD - 53,6
Raisins 121 110 0,20 2,90 3,10 <LOD - 29,8
Sultanas 120 104 0,20 3,65 4,20 <LOD - 25,1
Apricots 20 0 0,20 0,10 - <LOD
Dates 20 1 0,20 0,10 0,20 <LOD - 0,2
Figs 20 2 0,10 0,10 0,55 <LOD - 0,8
Europe* 800 582 2,298 3,078
North Europe* 718 537 2,339 3,077
South Europe** 82 45 1,933 3,092
*Data from Sweden are not included in the calculation of European and North European meansbecause of the lack of information on the examinated samples
**South Europe data are referred only to Greece
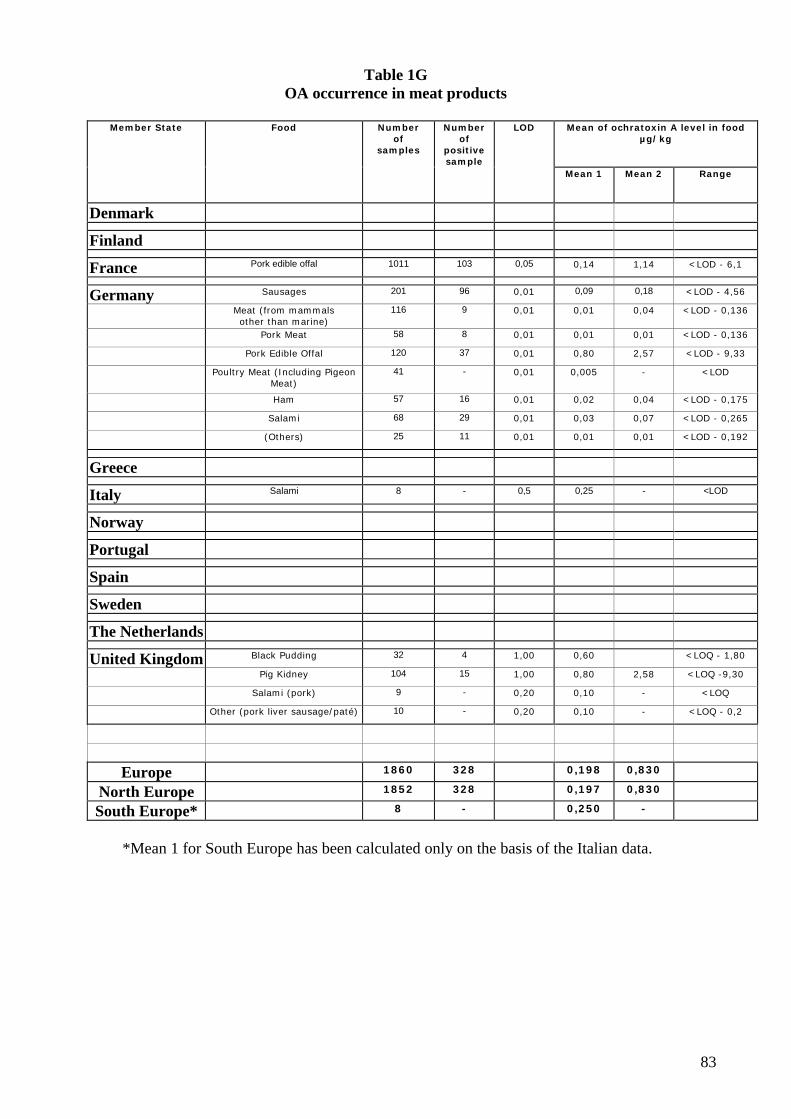
83
Table 1GOA occurrence in meat products
Member State Food Numberof
samples
Numberof
positivesample
LOD Mean of ochratoxin A level in foodµg/kg
Mean 1 Mean 2 Range
Denmark
Finland
France Pork edible offal 1011 103 0,05 0,14 1,14 <LOD - 6,1
Germany Sausages 201 96 0,01 0,09 0,18 <LOD - 4,56
Meat (from mammalsother than marine)
116 9 0,01 0,01 0,04 <LOD - 0,136
Pork Meat 58 8 0,01 0,01 0,01 <LOD - 0,136
Pork Edible Offal 120 37 0,01 0,80 2,57 <LOD - 9,33
Poultry Meat (Including PigeonMeat)
41 - 0,01 0,005 - <LOD
Ham 57 16 0,01 0,02 0,04 <LOD - 0,175
Salami 68 29 0,01 0,03 0,07 <LOD - 0,265
(Others) 25 11 0,01 0,01 0,01 <LOD - 0,192
Greece
Italy Salami 8 - 0,5 0,25 - <LOD
Norway
Portugal
Spain
Sweden
The Netherlands
United Kingdom Black Pudding 32 4 1,00 0,60 <LOQ - 1,80
Pig Kidney 104 15 1,00 0,80 2,58 <LOQ -9,30
Salami (pork) 9 - 0,20 0,10 - <LOQ
Other (pork liver sausage/paté) 10 - 0,20 0,10 - <LOQ - 0,2
Europe 1860 328 0,198 0,830
North Europe 1852 328 0,197 0,830
South Europe* 8 - 0,250 -
*Mean 1 for South Europe has been calculated only on the basis of the Italian data.

84
Table 1HOA occurrence in spices
Member State Food Numberof
samples
Numberof
positivesample
LOD Mean of ochratoxin A level in foodµg/kg
Mean 1 Mean 2 Range
Denmark
Finland
France
Germany Herbs 13 2 0,08 <LOD - 0,11
Nutmeg 35 28 3,29 <LOD - 15,23
Peppers 32 21 0,40 <LOD - 2,04
Paprika 58 51 1,53 <LOD - 16,43
Macis 5 3 0,120 <LOD - 0,21
Coriander 31 21 1,48 <LOD - 3,88
Seed 5 2 0,15 <LOD - 0,17
Spice Sauces 122 25 0,10 0,01 <LOD - 3,8
Other Spices 20 8 0,49 <LOD - 1,92
Greece
Italy Spices 5 5 0,4 8,04 8,04 <LOD - 23,8
Norway
Portugal Nutmeg 3 3 0,2 5,50 5,50 <LOD - 8,5
Sweet pepper 6 3 0,2 1,42 2,50 <LOD - 4,3
Spain
Sweden
The Netherlands Pepper(Piper nigrum)
6 1 0,25 0,24 0,80 <LOD - 0,80
Pepper powder(Capsicum frutescens)
8 6 0,25 6,47 8,58 <LOD - 14,5
Paprika powder(Capsicum annuum)
12 9 0,25 1,74 2,24 <LOD - 9,80
United Kingdom
Europe* 361 188 1,150 5,061
North Europe* 347 177 0,980 4,528
South Europe 14 11 4,659 5,836
*The mean 2 has been calculated without considering the samples from Germany since individualdata were not provided.
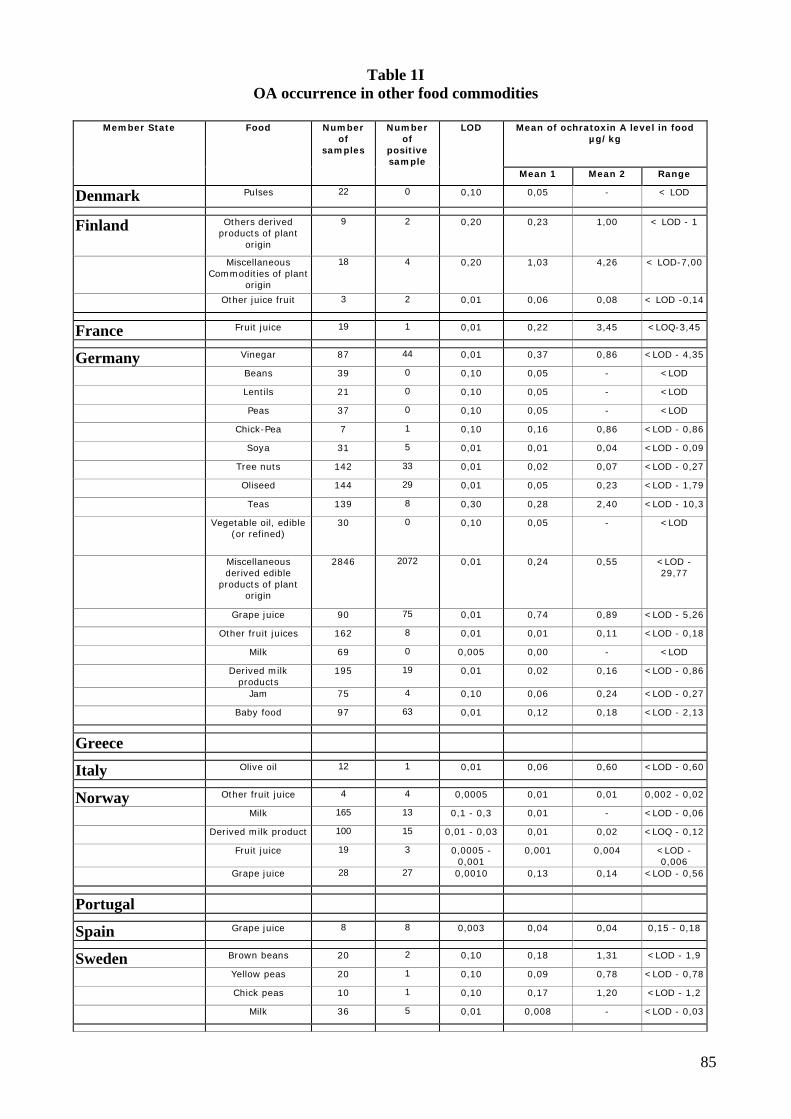
85
Table 1IOA occurrence in other food commodities
Member State Food Numberof
samples
Numberof
positivesample
LOD Mean of ochratoxin A level in foodµg/kg
Mean 1 Mean 2 Range
Denmark Pulses 22 0 0,10 0,05 - < LOD
Finland Others derivedproducts of plant
origin
9 2 0,20 0,23 1,00 < LOD - 1
MiscellaneousCommodities of plant
origin
18 4 0,20 1,03 4,26 < LOD-7,00
Other juice fruit 3 2 0,01 0,06 0,08 < LOD -0,14
France Fruit juice 19 1 0,01 0,22 3,45 <LOQ-3,45
Germany Vinegar 87 44 0,01 0,37 0,86 <LOD - 4,35
Beans 39 0 0,10 0,05 - <LOD
Lentils 21 0 0,10 0,05 - <LOD
Peas 37 0 0,10 0,05 - <LOD
Chick-Pea 7 1 0,10 0,16 0,86 <LOD - 0,86
Soya 31 5 0,01 0,01 0,04 <LOD - 0,09
Tree nuts 142 33 0,01 0,02 0,07 <LOD - 0,27
Oliseed 144 29 0,01 0,05 0,23 <LOD - 1,79
Teas 139 8 0,30 0,28 2,40 <LOD - 10,3
Vegetable oil, edible(or refined)
30 0 0,10 0,05 - <LOD
Miscellaneousderived edible
products of plantorigin
2846 2072 0,01 0,24 0,55 <LOD -29,77
Grape juice 90 75 0,01 0,74 0,89 <LOD - 5,26
Other fruit juices 162 8 0,01 0,01 0,11 <LOD - 0,18
Milk 69 0 0,005 0,00 - <LOD
Derived milkproducts
195 19 0,01 0,02 0,16 <LOD - 0,86
Jam 75 4 0,10 0,06 0,24 <LOD - 0,27
Baby food 97 63 0,01 0,12 0,18 <LOD - 2,13
Greece
Italy Olive oil 12 1 0,01 0,06 0,60 <LOD - 0,60
Norway Other fruit juice 4 4 0,0005 0,01 0,01 0,002 - 0,02
Milk 165 13 0,1 - 0,3 0,01 - <LOD - 0,06
Derived milk product 100 15 0,01 - 0,03 0,01 0,02 <LOQ - 0,12
Fruit juice 19 3 0,0005 -0,001
0,001 0,004 <LOD -0,006
Grape juice 28 27 0,0010 0,13 0,14 <LOD - 0,56
Portugal
Spain Grape juice 8 8 0,003 0,04 0,04 0,15 - 0,18
Sweden Brown beans 20 2 0,10 0,18 1,31 <LOD - 1,9
Yellow peas 20 1 0,10 0,09 0,78 <LOD - 0,78
Chick peas 10 1 0,10 0,17 1,20 <LOD - 1,2
Milk 36 5 0,01 0,008 - <LOD - 0,03
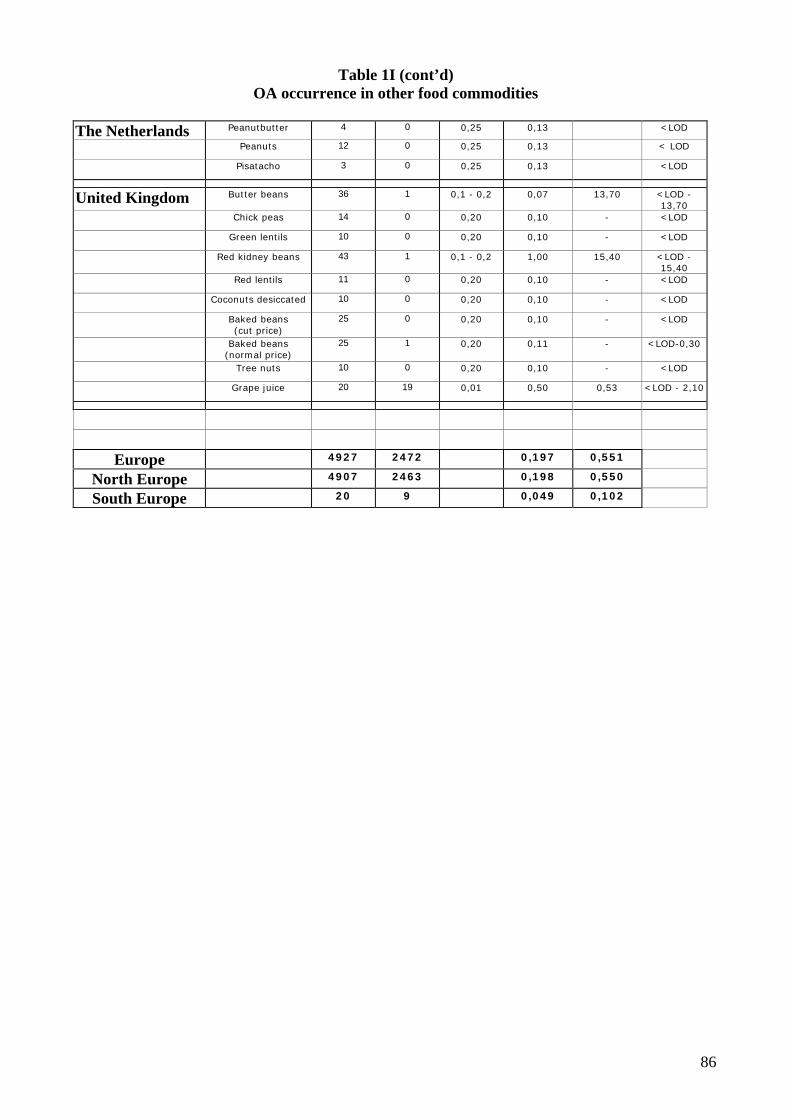
86
Table 1I (cont’d)OA occurrence in other food commodities
The Netherlands Peanutbutter 4 0 0,25 0,13 <LOD
Peanuts 12 0 0,25 0,13 < LOD
Pisatacho 3 0 0,25 0,13 <LOD
United Kingdom Butter beans 36 1 0,1 - 0,2 0,07 13,70 <LOD -13,70
Chick peas 14 0 0,20 0,10 - <LOD
Green lentils 10 0 0,20 0,10 - <LOD
Red kidney beans 43 1 0,1 - 0,2 1,00 15,40 <LOD -15,40
Red lentils 11 0 0,20 0,10 - <LOD
Coconuts desiccated 10 0 0,20 0,10 - <LOD
Baked beans(cut price)
25 0 0,20 0,10 - <LOD
Baked beans(normal price)
25 1 0,20 0,11 - <LOD-0,30
Tree nuts 10 0 0,20 0,10 - <LOD
Grape juice 20 19 0,01 0,50 0,53 <LOD - 2,10
Europe 4927 2472 0,197 0,551
North Europe 4907 2463 0,198 0,550
South Europe 20 9 0,049 0,102
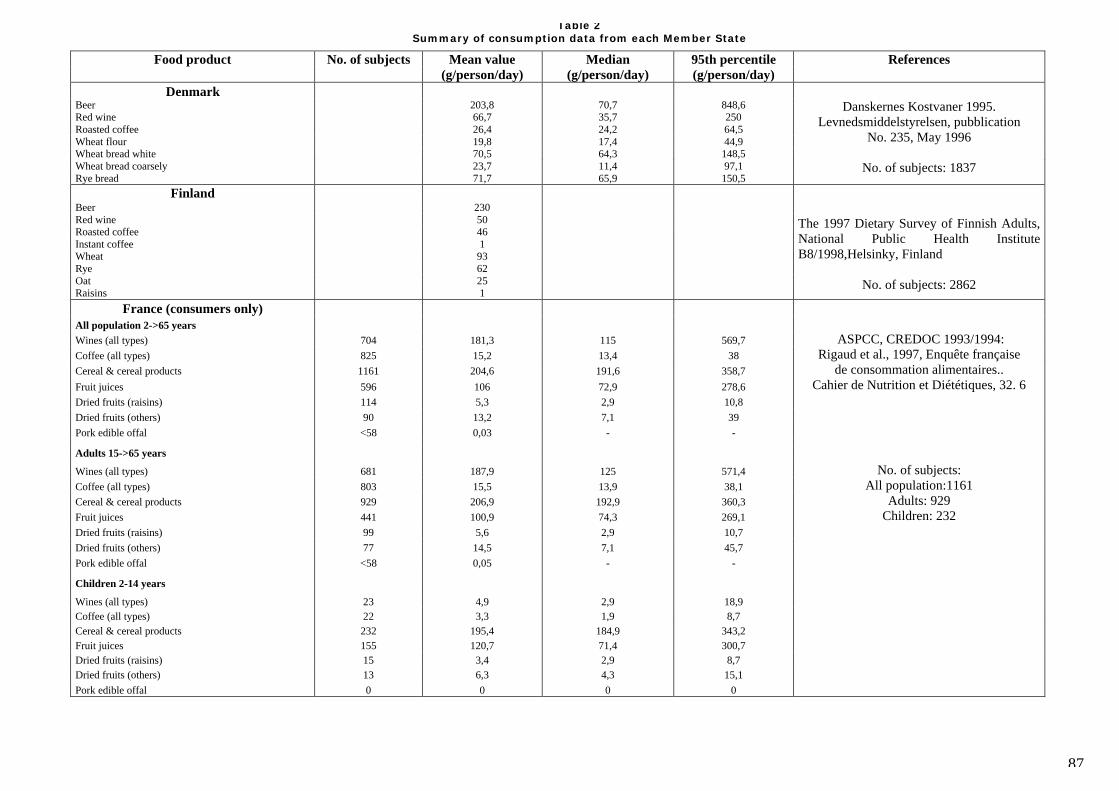
87
Table 2Summary of consumption data from each Member State
Food product No. of subjects Mean value Median 95th percentile References(g/person/day) (g/person/day) (g/person/day)
DenmarkBeer 203,8 70,7 848,6Red wine 66,7 35,7 250Roasted coffee 26,4 24,2 64,5Wheat flour 19,8 17,4 44,9Wheat bread white 70,5 64,3 148,5Wheat bread coarsely 23,7 11,4 97,1Rye bread 71,7 65,9 150,5
Danskernes Kostvaner 1995.Levnedsmiddelstyrelsen, pubblication
No. 235, May 1996
No. of subjects: 1837
FinlandBeer 230Red wine 50Roasted coffee 46Instant coffee 1Wheat 93Rye 62Oat 25Raisins 1
The 1997 Dietary Survey of Finnish Adults,National Public Health InstituteB8/1998,Helsinky, Finland
No. of subjects: 2862
France (consumers only)All population 2->65 yearsWines (all types) 704 181,3 115 569,7 ASPCC, CREDOC 1993/1994:Coffee (all types) 825 15,2 13,4 38 Rigaud et al., 1997, Enquête françaiseCereal & cereal products 1161 204,6 191,6 358,7 de consommation alimentaires..Fruit juices 596 106 72,9 278,6 Cahier de Nutrition et Diététiques, 32. 6Dried fruits (raisins) 114 5,3 2,9 10,8Dried fruits (others) 90 13,2 7,1 39Pork edible offal <58 0,03 - -
Adults 15->65 years
Wines (all types) 681 187,9 125 571,4 No. of subjects:Coffee (all types) 803 15,5 13,9 38,1 All population:1161Cereal & cereal products 929 206,9 192,9 360,3 Adults: 929Fruit juices 441 100,9 74,3 269,1 Children: 232Dried fruits (raisins) 99 5,6 2,9 10,7Dried fruits (others) 77 14,5 7,1 45,7Pork edible offal <58 0,05 - -
Children 2-14 years
Wines (all types) 23 4,9 2,9 18,9Coffee (all types) 22 3,3 1,9 8,7Cereal & cereal products 232 195,4 184,9 343,2Fruit juices 155 120,7 71,4 300,7Dried fruits (raisins) 15 3,4 2,9 8,7Dried fruits (others) 13 6,3 4,3 15,1Pork edible offal 0 0 0 0
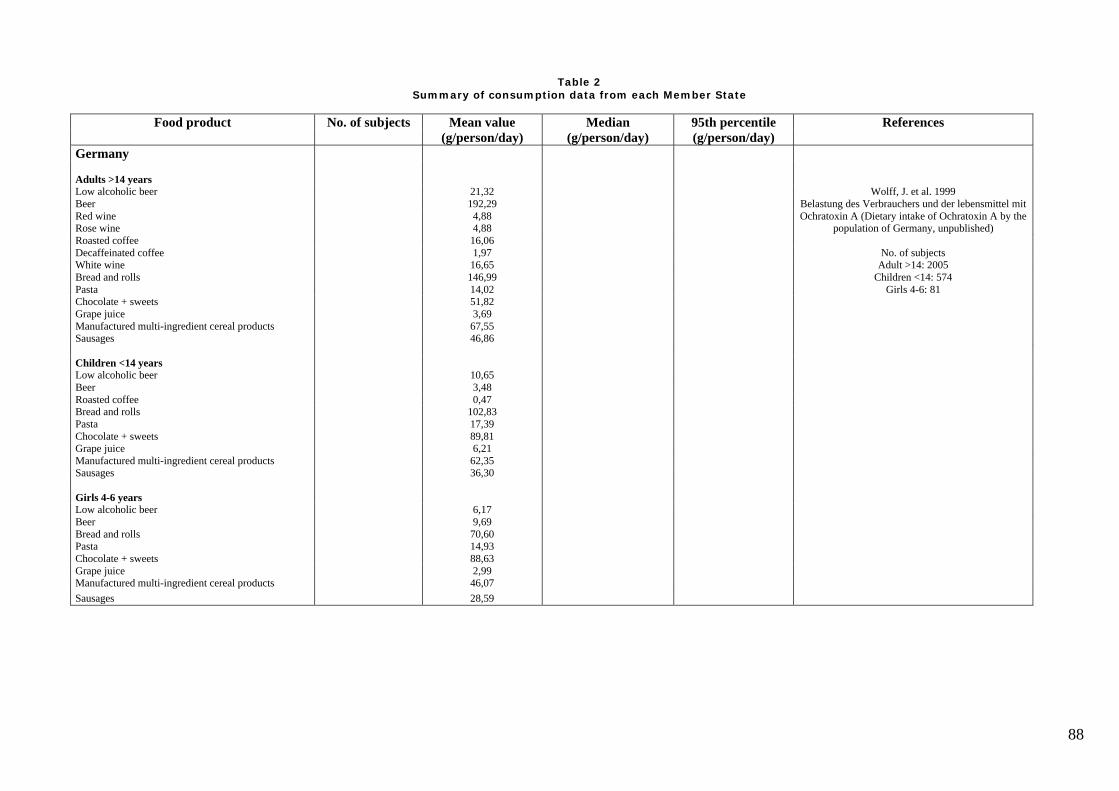
88
Table 2Summary of consumption data from each Member State
Food product No. of subjects Mean value Median 95th percentile References(g/person/day) (g/person/day) (g/person/day)
Germany
Adults >14 yearsLow alcoholic beer 21,32Beer 192,29Red wine 4,88Rose wine 4,88Roasted coffee 16,06Decaffeinated coffee 1,97White wine 16,65Bread and rolls 146,99Pasta 14,02Chocolate + sweets 51,82Grape juice 3,69Manufactured multi-ingredient cereal products 67,55
Wolff, J. et al. 1999Belastung des Verbrauchers und der lebensmittel mitOchratoxin A (Dietary intake of Ochratoxin A by the
population of Germany, unpublished)
No. of subjectsAdult >14: 2005
Children <14: 574Girls 4-6: 81
Sausages 46,86
Children <14 yearsLow alcoholic beer 10,65Beer 3,48Roasted coffee 0,47Bread and rolls 102,83Pasta 17,39Chocolate + sweets 89,81Grape juice 6,21Manufactured multi-ingredient cereal products 62,35Sausages 36,30
Girls 4-6 yearsLow alcoholic beer 6,17Beer 9,69Bread and rolls 70,60Pasta 14,93Chocolate + sweets 88,63Grape juice 2,99Manufactured multi-ingredient cereal products 46,07Sausages 28,59

89
Table 2Summary of consumption data from each Member State
Food product No. of subjects Mean value Median 95th percentile References(g/person/day) (g/person/day) (g/person/day)
GreeceUrbanWine (all types) 12Coffee (all types) 4,1Bread (all types) 159Rusks + biscuits (pastries incl.) 14Rice cereals and others cereal basedproducts (quaker etc.)
15
Methodology for the exploitation of HBS food dataand results on food availability in six European
countries. Directorate – General, Science, Researchand Development, EUR 18357 EN, European
Commission 1998
Flour (wheat, corn) 14Pasta 22Dried vine fruits 0,03
SemiurbanWine (all types) 25Coffee (all types) 4,1
No. of subjects 6756:Bread, rusks, rice, cereals, flour, pasta
(all population):
Bread (all types) 210Rusks + biscuits (pastries incl.) 12Rice. cereals and others cereal basedProducts (quaker etc.)
17
Flour (wheat, corn) 23Pasta 24Dried vine fruits 0,01
RuralWine (all types) 46Coffee (all types) 4,8Bread (all types) 271Rusks + biscuits (pastries incl.) 11Rice. cereals and others cereal basedProducts (quaker etc.)
21
Flour (wheat, corn) 43Pasta 30Dried vine fruits 0,02
All populationWine (all types) 22 0 139Coffee (all types) 4,3 2,4 16Bread (all types) 193Rusks + biscuits (pastries incl.) 13Rice, cereals and others cereal basedproducts (quaker etc.)
17
Flour (wheat, corn) 22Pasta 24Dried vine fruits 0,03 0 0
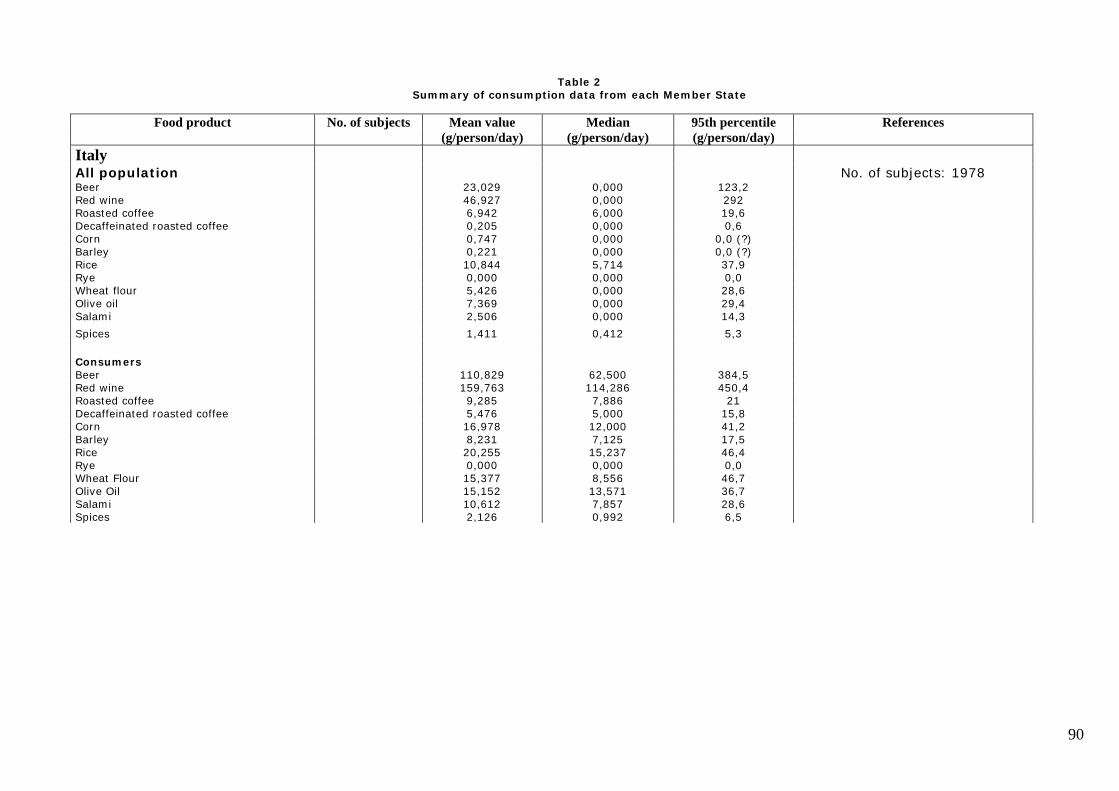
90
Table 2Summary of consumption data from each Member State
Food product No. of subjects Mean value Median 95th percentile References(g/person/day) (g/person/day) (g/person/day)
ItalyAll populationBeer 23,029 0,000 123,2Red wine 46,927 0,000 292Roasted coffee 6,942 6,000 19,6Decaffeinated roasted coffee 0,205 0,000 0,6Corn 0,747 0,000 0,0 (?)Barley 0,221 0,000 0,0 (?)Rice 10,844 5,714 37,9Rye 0,000 0,000 0,0Wheat flour 5,426 0,000 28,6Olive oil 7,369 0,000 29,4Salami 2,506 0,000 14,3
No. of subjects: 1978
Spices 1,411 0,412 5,3
ConsumersBeer 110,829 62,500 384,5Red wine 159,763 114,286 450,4Roasted coffee 9,285 7,886 21Decaffeinated roasted coffee 5,476 5,000 15,8Corn 16,978 12,000 41,2Barley 8,231 7,125 17,5Rice 20,255 15,237 46,4Rye 0,000 0,000 0,0Wheat Flour 15,377 8,556 46,7Olive Oil 15,152 13,571 36,7Salami 10,612 7,857 28,6Spices 2,126 0,992 6,5
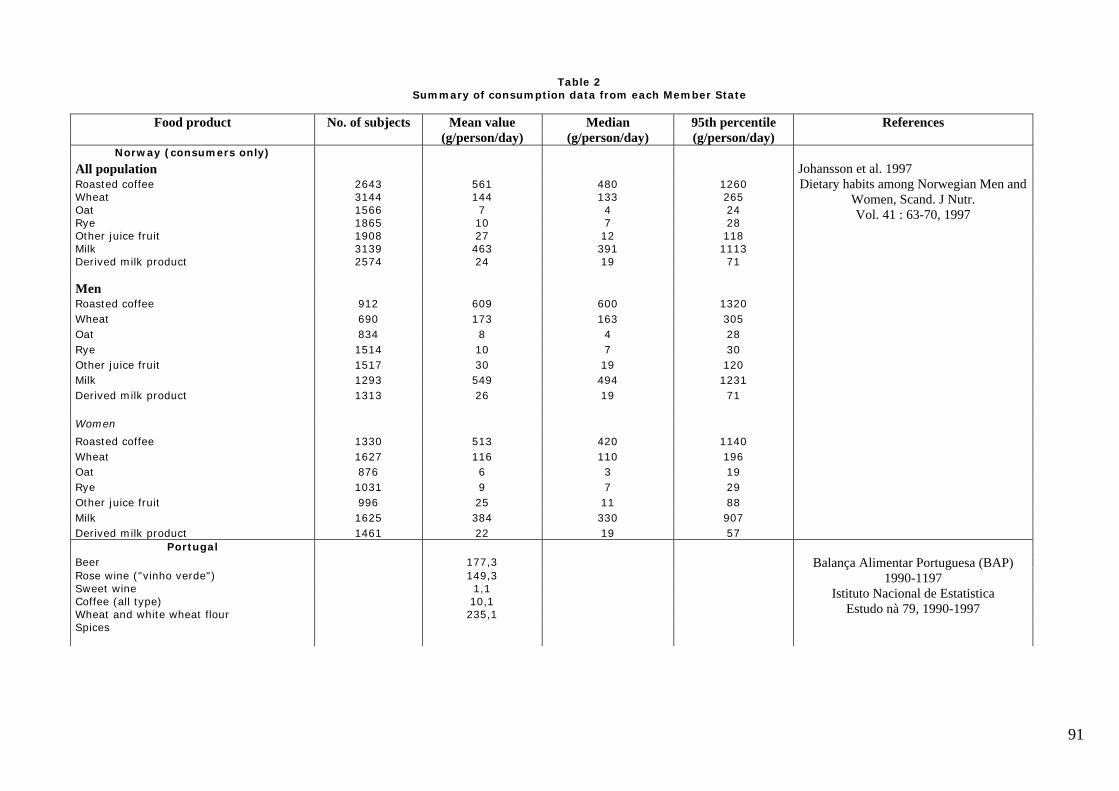
91
Table 2Summary of consumption data from each Member State
Food product No. of subjects Mean value Median 95th percentile References(g/person/day) (g/person/day) (g/person/day)
Norway (consumers only)
All populationRoasted coffee 2643 561 480 1260Wheat 3144 144 133 265Oat 1566 7 4 24Rye 1865 10 7 28Other juice fruit 1908 27 12 118Milk 3139 463 391 1113Derived milk product 2574 24 19 71
MenRoasted coffee 912 609 600 1320
Johansson et al. 1997Dietary habits among Norwegian Men and
Women, Scand. J Nutr.Vol. 41 : 63-70, 1997
Wheat 690 173 163 305Oat 834 8 4 28Rye 1514 10 7 30Other juice fruit 1517 30 19 120Milk 1293 549 494 1231Derived milk product 1313 26 19 71
Women
Roasted coffee 1330 513 420 1140Wheat 1627 116 110 196Oat 876 6 3 19Rye 1031 9 7 29Other juice fruit 996 25 11 88Milk 1625 384 330 907Derived milk product 1461 22 19 57
PortugalBeer 177,3Rose wine ("vinho verde") 149,3Sweet wine 1,1Coffee (all type) 10,1Wheat and white wheat flour 235,1Spices
Balança Alimentar Portuguesa (BAP)1990-1197
Istituto Nacional de EstatisticaEstudo nà 79, 1990-1997
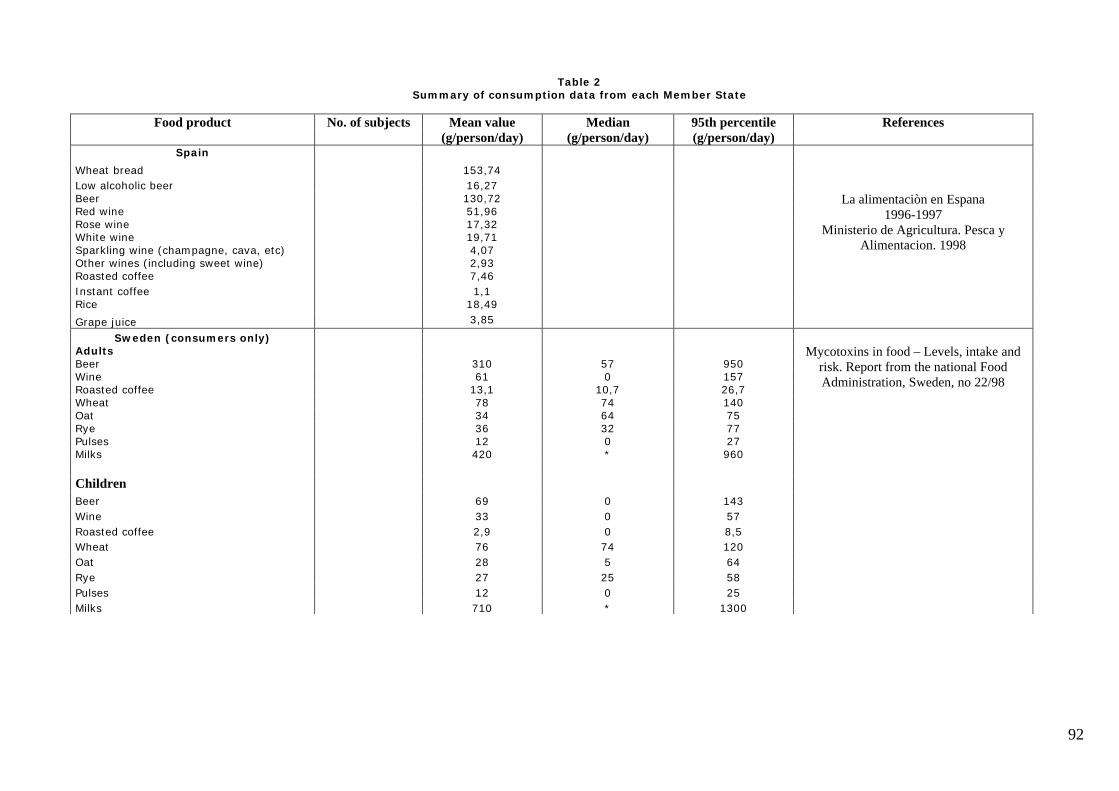
92
Table 2Summary of consumption data from each Member State
Food product No. of subjects Mean value Median 95th percentile References(g/person/day) (g/person/day) (g/person/day)
Spain
Wheat bread 153,74Low alcoholic beer 16,27Beer 130,72Red wine 51,96Rose wine 17,32White wine 19,71Sparkling wine (champagne, cava, etc) 4,07Other wines (including sweet wine) 2,93Roasted coffee 7,46
La alimentaciòn en Espana1996-1997
Ministerio de Agricultura. Pesca yAlimentacion. 1998
Instant coffee 1,1Rice 18,49
Grape juice 3,85
Sweden (consumers only)AdultsBeer 310 57 950Wine 61 0 157Roasted coffee 13,1 10,7 26,7Wheat 78 74 140Oat 34 64 75Rye 36 32 77Pulses 12 0 27Milks 420 * 960
Mycotoxins in food – Levels, intake andrisk. Report from the national FoodAdministration, Sweden, no 22/98
ChildrenBeer 69 0 143Wine 33 0 57Roasted coffee 2,9 0 8,5Wheat 76 74 120Oat 28 5 64Rye 27 25 58Pulses 12 0 25Milks 710 * 1300
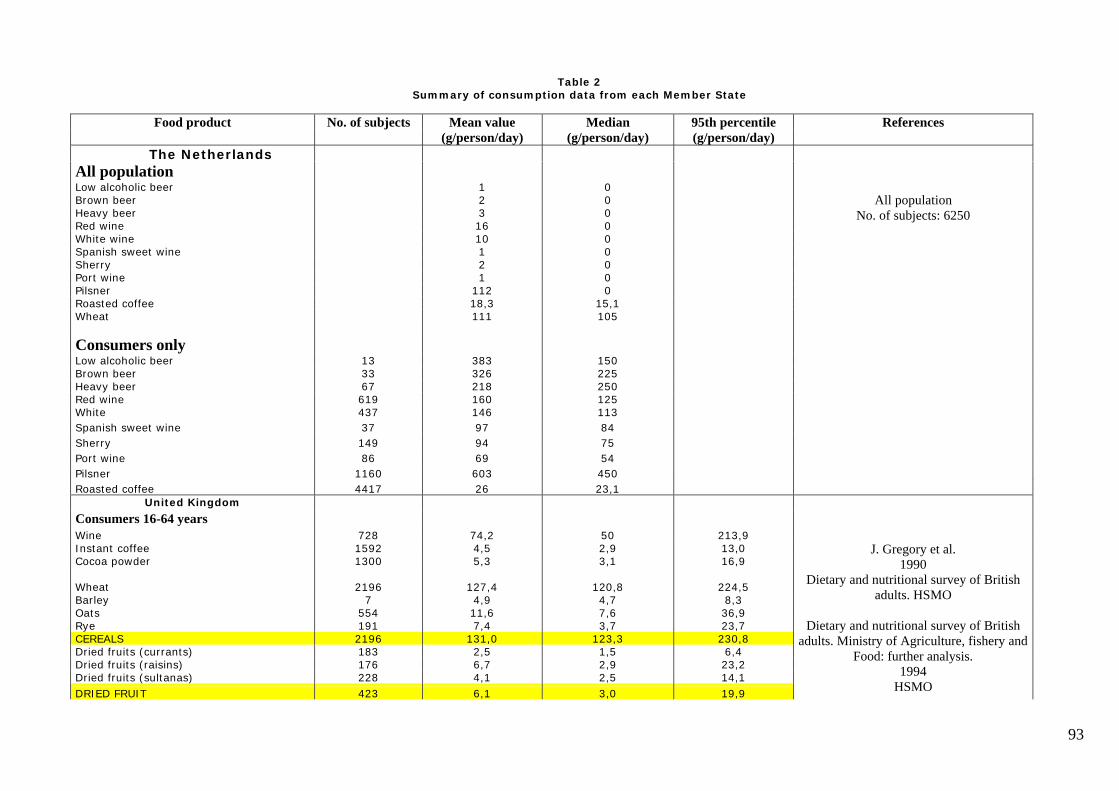
93
Table 2Summary of consumption data from each Member State
Food product No. of subjects Mean value Median 95th percentile References(g/person/day) (g/person/day) (g/person/day)
The NetherlandsAll populationLow alcoholic beer 1 0Brown beer 2 0Heavy beer 3 0Red wine 16 0White wine 10 0Spanish sweet wine 1 0Sherry 2 0Port wine 1 0Pilsner 112 0Roasted coffee 18,3 15,1Wheat 111 105
Consumers onlyLow alcoholic beer 13 383 150Brown beer 33 326 225Heavy beer 67 218 250Red wine 619 160 125White 437 146 113
All populationNo. of subjects: 6250
Spanish sweet wine 37 97 84Sherry 149 94 75Port wine 86 69 54Pilsner 1160 603 450Roasted coffee 4417 26 23,1
United Kingdom
Consumers 16-64 yearsWine 728 74,2 50 213,9Instant coffee 1592 4,5 2,9 13,0Cocoa powder 1300 5,3 3,1 16,9
Wheat 2196 127,4 120,8 224,5Barley 7 4,9 4,7 8,3Oats 554 11,6 7,6 36,9Rye 191 7,4 3,7 23,7CEREALS 2196 131,0 123,3 230,8Dried fruits (currants) 183 2,5 1,5 6,4Dried fruits (raisins) 176 6,7 2,9 23,2Dried fruits (sultanas) 228 4,1 2,5 14,1DRIED FRUIT 423 6,1 3,0 19,9
J. Gregory et al.1990
Dietary and nutritional survey of Britishadults. HSMO
Dietary and nutritional survey of Britishadults. Ministry of Agriculture, fishery and
Food: further analysis.1994
HSMO
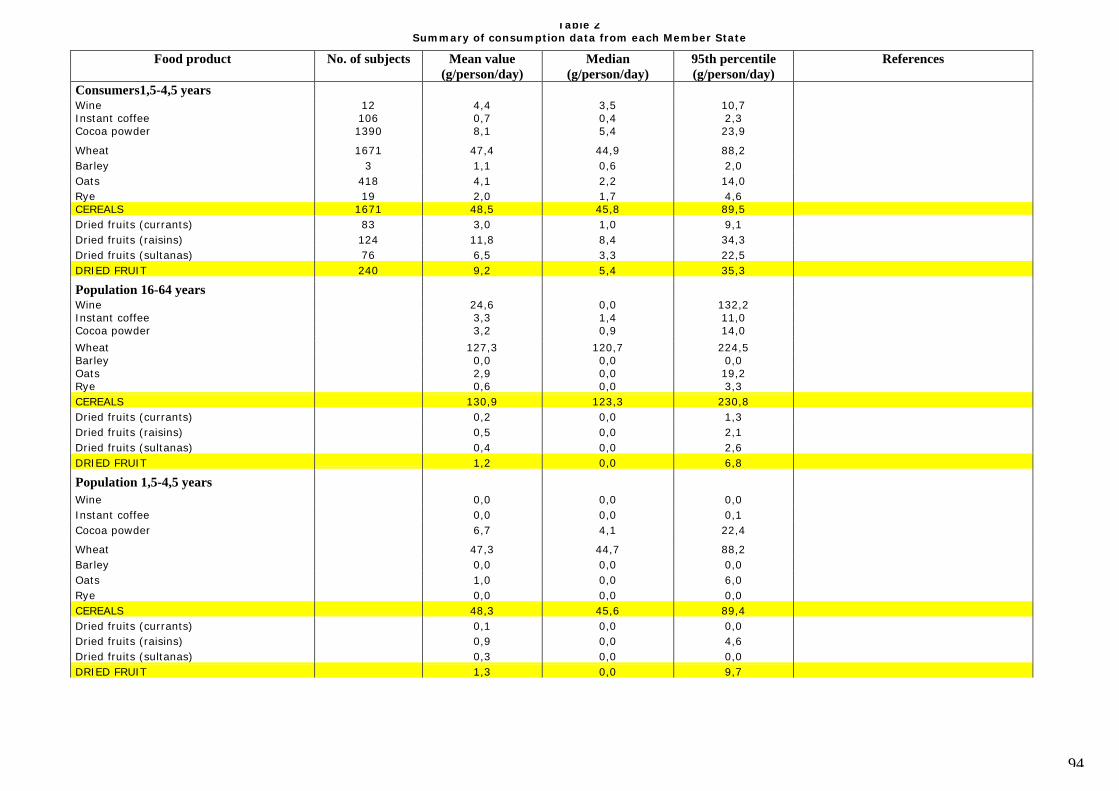
94
Table 2Summary of consumption data from each Member State
Food product No. of subjects Mean value Median 95th percentile References(g/person/day) (g/person/day) (g/person/day)
Consumers1,5-4,5 yearsWine 12 4,4 3,5 10,7Instant coffee 106 0,7 0,4 2,3Cocoa powder 1390 8,1 5,4 23,9
Wheat 1671 47,4 44,9 88,2Barley 3 1,1 0,6 2,0Oats 418 4,1 2,2 14,0Rye 19 2,0 1,7 4,6CEREALS 1671 48,5 45,8 89,5Dried fruits (currants) 83 3,0 1,0 9,1Dried fruits (raisins) 124 11,8 8,4 34,3Dried fruits (sultanas) 76 6,5 3,3 22,5DRIED FRUIT 240 9,2 5,4 35,3
Population 16-64 yearsWine 24,6 0,0 132,2Instant coffee 3,3 1,4 11,0Cocoa powder 3,2 0,9 14,0
Wheat 127,3 120,7 224,5Barley 0,0 0,0 0,0Oats 2,9 0,0 19,2Rye 0,6 0,0 3,3CEREALS 130,9 123,3 230,8Dried fruits (currants) 0,2 0,0 1,3Dried fruits (raisins) 0,5 0,0 2,1Dried fruits (sultanas) 0,4 0,0 2,6DRIED FRUIT 1,2 0,0 6,8
Population 1,5-4,5 yearsWine 0,0 0,0 0,0Instant coffee 0,0 0,0 0,1Cocoa powder 6,7 4,1 22,4
Wheat 47,3 44,7 88,2Barley 0,0 0,0 0,0Oats 1,0 0,0 6,0Rye 0,0 0,0 0,0CEREALS 48,3 45,6 89,4Dried fruits (currants) 0,1 0,0 0,0Dried fruits (raisins) 0,9 0,0 4,6Dried fruits (sultanas) 0,3 0,0 0,0DRIED FRUIT 1,3 0,0 9,7
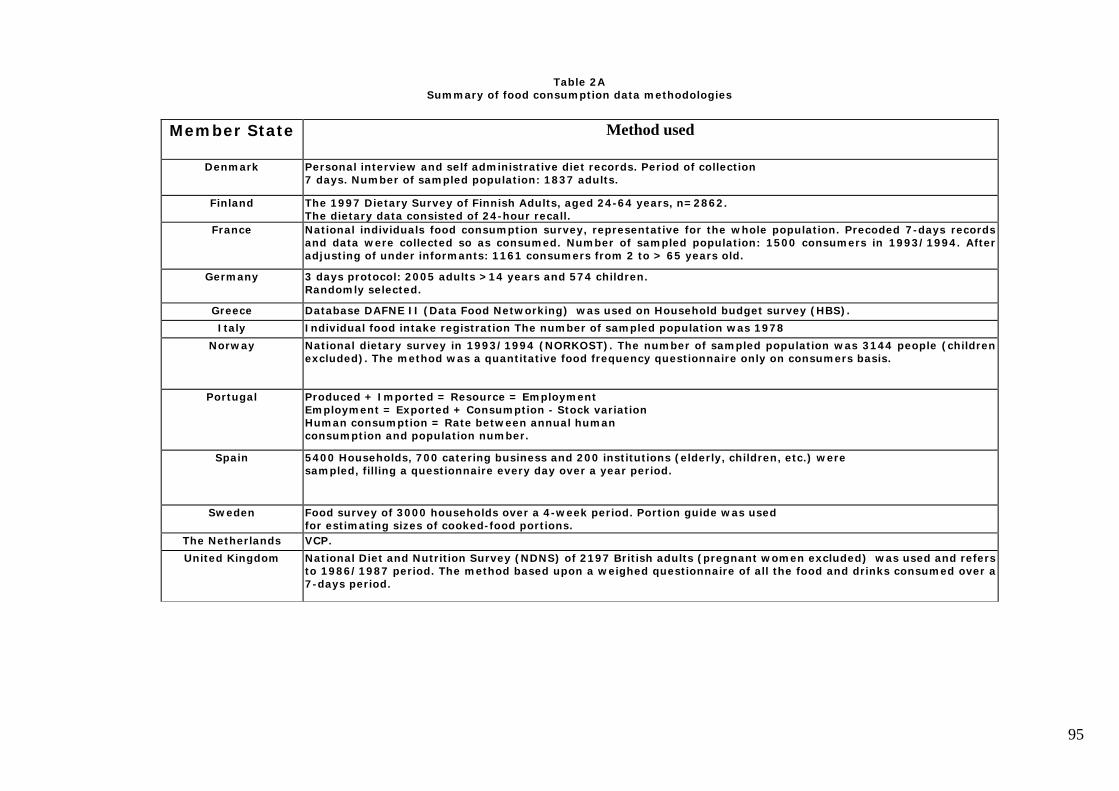
95
Table 2ASummary of food consumption data methodologies
Member State Method used
Denmark Personal interview and self administrative diet records. Period of collection7 days. Number of sampled population: 1837 adults.
Finland The 1997 Dietary Survey of Finnish Adults, aged 24-64 years, n=2862.The dietary data consisted of 24-hour recall.
France National individuals food consumption survey, representative for the whole population. Precoded 7-days recordsand data were collected so as consumed. Number of sampled population: 1500 consumers in 1993/1994. Afteradjusting of under informants: 1161 consumers from 2 to > 65 years old.
Germany 3 days protocol: 2005 adults >14 years and 574 children.Randomly selected.
Greece Database DAFNE II (Data Food Networking) was used on Household budget survey (HBS).
Italy Individual food intake registration The number of sampled population was 1978
Norway National dietary survey in 1993/1994 (NORKOST). The number of sampled population was 3144 people (childrenexcluded). The method was a quantitative food frequency questionnaire only on consumers basis.
Portugal Produced + Imported = Resource = EmploymentEmployment = Exported + Consumption - Stock variationHuman consumption = Rate between annual humanconsumption and population number.
Spain 5400 Households, 700 catering business and 200 institutions (elderly, children, etc.) weresampled, filling a questionnaire every day over a year period.
Sweden Food survey of 3000 households over a 4-week period. Portion guide was usedfor estimating sizes of cooked-food portions.
The Netherlands VCP.
United Kingdom National Diet and Nutrition Survey (NDNS) of 2197 British adults (pregnant women excluded) was used and refersto 1986/1987 period. The method based upon a weighed questionnaire of all the food and drinks consumed over a7-days period.
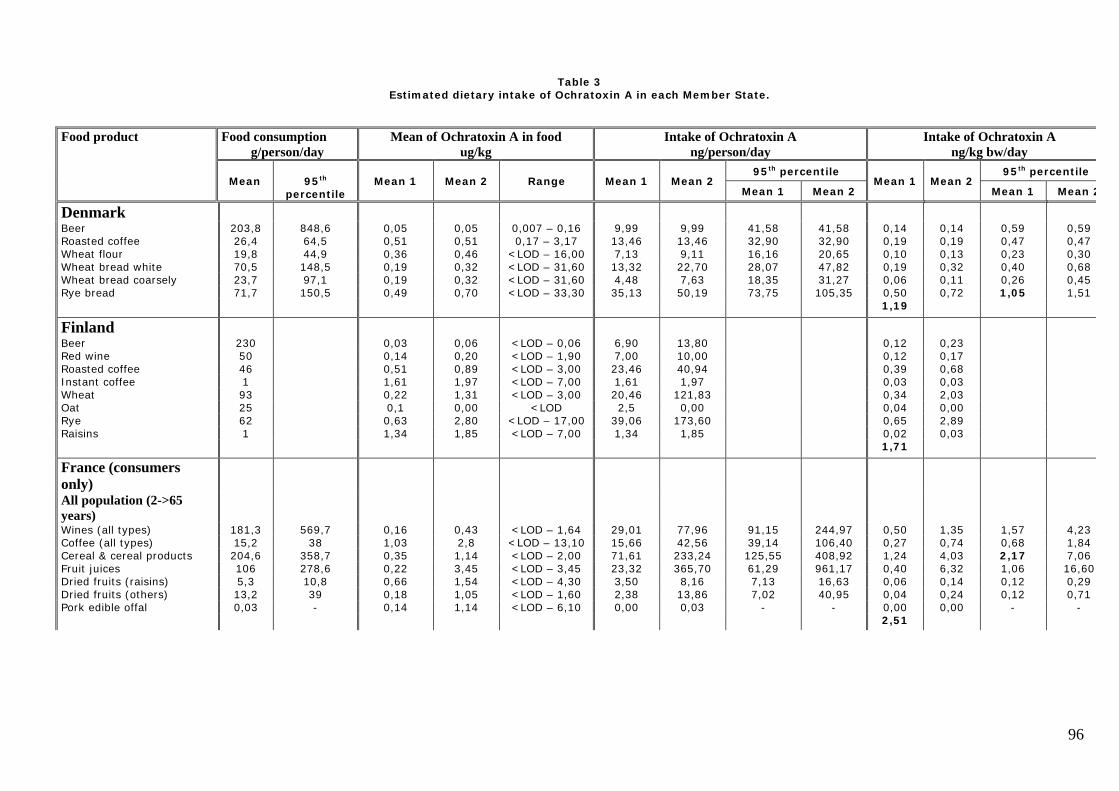
96
Table 3Estimated dietary intake of Ochratoxin A in each Member State.
Food product Food consumptiong/person/day
Mean of Ochratoxin A in foodug/kg
Intake of Ochratoxin Ang/person/day
Intake of Ochratoxin Ang/kg bw/day
95th percentile 95th percentileMean 95th
percentileMean 1 Mean 2 Range Mean 1 Mean 2
Mean 1 Mean 2Mean 1 Mean 2
Mean 1 Mean 2
DenmarkBeer 203,8 848,6 0,05 0,05 0,007 – 0,16 9,99 9,99 41,58 41,58 0,14 0,14 0,59 0,59Roasted coffee 26,4 64,5 0,51 0,51 0,17 – 3,17 13,46 13,46 32,90 32,90 0,19 0,19 0,47 0,47Wheat flour 19,8 44,9 0,36 0,46 <LOD – 16,00 7,13 9,11 16,16 20,65 0,10 0,13 0,23 0,30Wheat bread white 70,5 148,5 0,19 0,32 <LOD – 31,60 13,32 22,70 28,07 47,82 0,19 0,32 0,40 0,68Wheat bread coarsely 23,7 97,1 0,19 0,32 <LOD – 31,60 4,48 7,63 18,35 31,27 0,06 0,11 0,26 0,45Rye bread 71,7 150,5 0,49 0,70 <LOD – 33,30 35,13 50,19 73,75 105,35 0,50 0,72 1,05 1,51
1,19
FinlandBeer 230 0,03 0,06 <LOD – 0,06 6,90 13,80 0,12 0,23Red wine 50 0,14 0,20 <LOD – 1,90 7,00 10,00 0,12 0,17Roasted coffee 46 0,51 0,89 <LOD – 3,00 23,46 40,94 0,39 0,68Instant coffee 1 1,61 1,97 <LOD – 7,00 1,61 1,97 0,03 0,03Wheat 93 0,22 1,31 <LOD – 3,00 20,46 121,83 0,34 2,03Oat 25 0,1 0,00 <LOD 2,5 0,00 0,04 0,00Rye 62 0,63 2,80 <LOD – 17,00 39,06 173,60 0,65 2,89Raisins 1 1,34 1,85 <LOD – 7,00 1,34 1,85 0,02 0,03
1,71
France (consumersonly)All population (2->65years)Wines (all types) 181,3 569,7 0,16 0,43 <LOD – 1,64 29,01 77,96 91,15 244,97 0,50 1,35 1,57 4,23Coffee (all types) 15,2 38 1,03 2,8 <LOD – 13,10 15,66 42,56 39,14 106,40 0,27 0,74 0,68 1,84Cereal & cereal products 204,6 358,7 0,35 1,14 <LOD – 2,00 71,61 233,24 125,55 408,92 1,24 4,03 2,17 7,06Fruit juices 106 278,6 0,22 3,45 <LOD – 3,45 23,32 365,70 61,29 961,17 0,40 6,32 1,06 16,60Dried fruits (raisins) 5,3 10,8 0,66 1,54 <LOD – 4,30 3,50 8,16 7,13 16,63 0,06 0,14 0,12 0,29Dried fruits (others) 13,2 39 0,18 1,05 <LOD – 1,60 2,38 13,86 7,02 40,95 0,04 0,24 0,12 0,71Pork edible offal 0,03 - 0,14 1,14 <LOD – 6,10 0,00 0,03 - - 0,00 0,00 - -
2,51
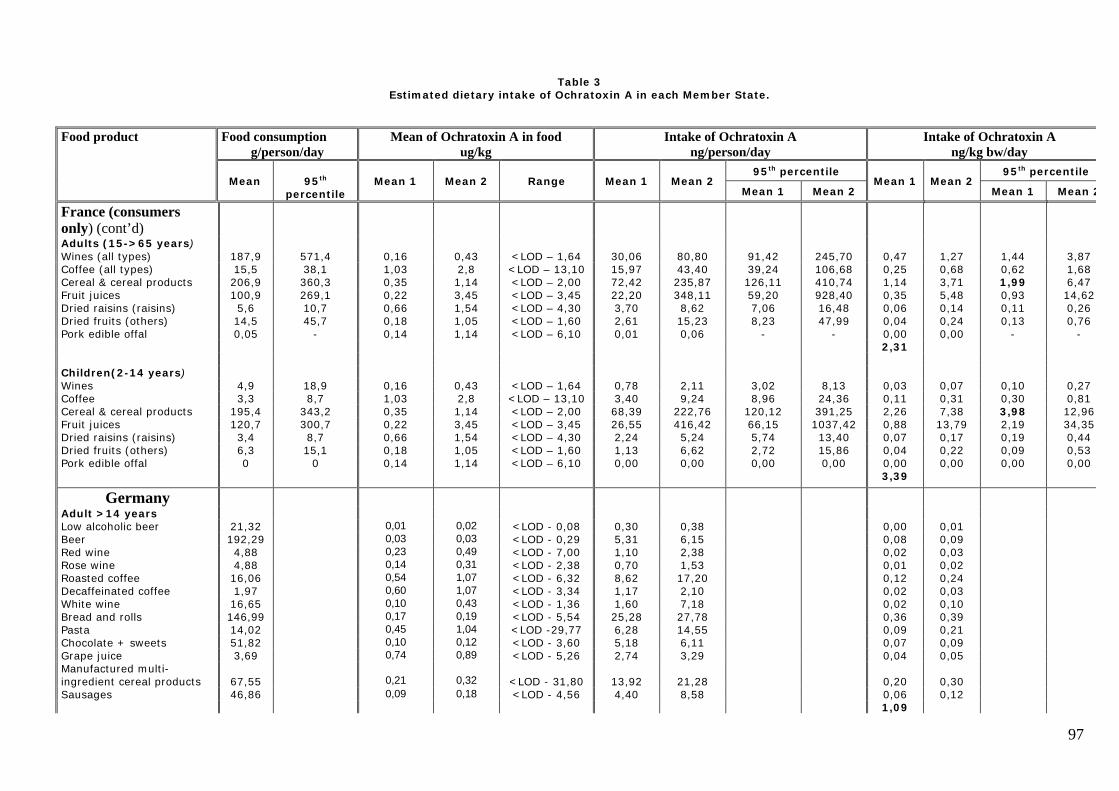
97
Table 3Estimated dietary intake of Ochratoxin A in each Member State.
Food product Food consumptiong/person/day
Mean of Ochratoxin A in foodug/kg
Intake of Ochratoxin Ang/person/day
Intake of Ochratoxin Ang/kg bw/day
95th percentile 95th percentileMean 95th
percentileMean 1 Mean 2 Range Mean 1 Mean 2
Mean 1 Mean 2Mean 1 Mean 2
Mean 1 Mean 2
France (consumersonly) (cont’d)Adults (15->65 years)Wines (all types) 187,9 571,4 0,16 0,43 <LOD – 1,64 30,06 80,80 91,42 245,70 0,47 1,27 1,44 3,87Coffee (all types) 15,5 38,1 1,03 2,8 <LOD – 13,10 15,97 43,40 39,24 106,68 0,25 0,68 0,62 1,68Cereal & cereal products 206,9 360,3 0,35 1,14 <LOD – 2,00 72,42 235,87 126,11 410,74 1,14 3,71 1,99 6,47Fruit juices 100,9 269,1 0,22 3,45 <LOD – 3,45 22,20 348,11 59,20 928,40 0,35 5,48 0,93 14,62Dried raisins (raisins) 5,6 10,7 0,66 1,54 <LOD – 4,30 3,70 8,62 7,06 16,48 0,06 0,14 0,11 0,26Dried fruits (others) 14,5 45,7 0,18 1,05 <LOD – 1,60 2,61 15,23 8,23 47,99 0,04 0,24 0,13 0,76Pork edible offal 0,05 - 0,14 1,14 <LOD – 6,10 0,01 0,06 - - 0,00 0,00 - -
2,31
Children(2-14 years)Wines 4,9 18,9 0,16 0,43 <LOD – 1,64 0,78 2,11 3,02 8,13 0,03 0,07 0,10 0,27Coffee 3,3 8,7 1,03 2,8 <LOD – 13,10 3,40 9,24 8,96 24,36 0,11 0,31 0,30 0,81Cereal & cereal products 195,4 343,2 0,35 1,14 <LOD – 2,00 68,39 222,76 120,12 391,25 2,26 7,38 3,98 12,96Fruit juices 120,7 300,7 0,22 3,45 <LOD – 3,45 26,55 416,42 66,15 1037,42 0,88 13,79 2,19 34,35Dried raisins (raisins) 3,4 8,7 0,66 1,54 <LOD – 4,30 2,24 5,24 5,74 13,40 0,07 0,17 0,19 0,44Dried fruits (others) 6,3 15,1 0,18 1,05 <LOD – 1,60 1,13 6,62 2,72 15,86 0,04 0,22 0,09 0,53Pork edible offal 0 0 0,14 1,14 <LOD – 6,10 0,00 0,00 0,00 0,00 0,00 0,00 0,00 0,00
3,39
GermanyAdult >14 yearsLow alcoholic beer 21,32 0,01 0,02 <LOD - 0,08 0,30 0,38 0,00 0,01Beer 192,29 0,03 0,03 <LOD - 0,29 5,31 6,15 0,08 0,09Red wine 4,88 0,23 0,49 <LOD - 7,00 1,10 2,38 0,02 0,03Rose wine 4,88 0,14 0,31 <LOD - 2,38 0,70 1,53 0,01 0,02Roasted coffee 16,06 0,54 1,07 <LOD - 6,32 8,62 17,20 0,12 0,24Decaffeinated coffee 1,97 0,60 1,07 <LOD - 3,34 1,17 2,10 0,02 0,03White wine 16,65 0,10 0,43 <LOD - 1,36 1,60 7,18 0,02 0,10Bread and rolls 146,99 0,17 0,19 <LOD - 5,54 25,28 27,78 0,36 0,39Pasta 14,02 0,45 1,04 <LOD -29,77 6,28 14,55 0,09 0,21Chocolate + sweets 51,82 0,10 0,12 <LOD - 3,60 5,18 6,11 0,07 0,09Grape juice 3,69 0,74 0,89 <LOD - 5,26 2,74 3,29 0,04 0,05Manufactured multi-ingredient cereal products 67,55 0,21 0,32 <LOD - 31,80 13,92 21,28 0,20 0,30Sausages 46,86 0,09 0,18 <LOD - 4,56 4,40 8,58 0,06 0,12
1,09
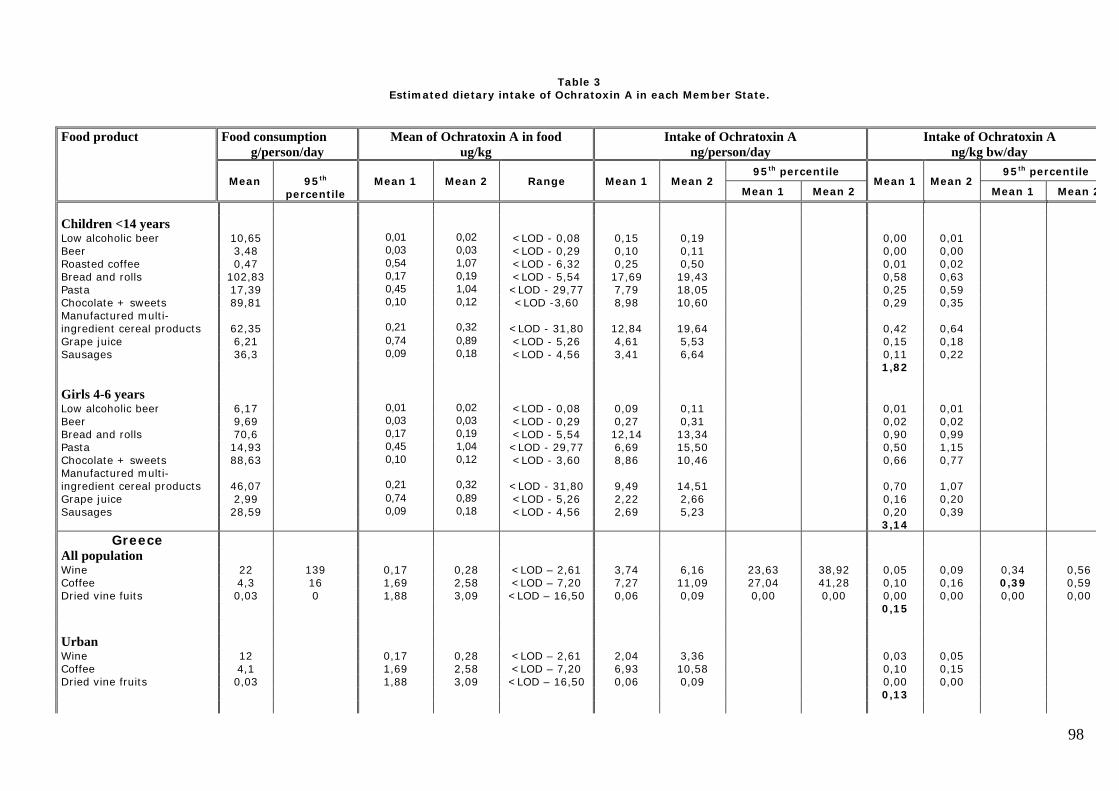
98
Table 3Estimated dietary intake of Ochratoxin A in each Member State.
Food product Food consumptiong/person/day
Mean of Ochratoxin A in foodug/kg
Intake of Ochratoxin Ang/person/day
Intake of Ochratoxin Ang/kg bw/day
95th percentile 95th percentileMean 95th
percentileMean 1 Mean 2 Range Mean 1 Mean 2
Mean 1 Mean 2Mean 1 Mean 2
Mean 1 Mean 2
Children <14 yearsLow alcoholic beer 10,65 0,01 0,02 <LOD - 0,08 0,15 0,19 0,00 0,01Beer 3,48 0,03 0,03 <LOD - 0,29 0,10 0,11 0,00 0,00Roasted coffee 0,47 0,54 1,07 <LOD - 6,32 0,25 0,50 0,01 0,02Bread and rolls 102,83 0,17 0,19 <LOD - 5,54 17,69 19,43 0,58 0,63Pasta 17,39 0,45 1,04 <LOD - 29,77 7,79 18,05 0,25 0,59Chocolate + sweets 89,81 0,10 0,12 <LOD -3,60 8,98 10,60 0,29 0,35Manufactured multi-ingredient cereal products 62,35 0,21 0,32 <LOD - 31,80 12,84 19,64 0,42 0,64Grape juice 6,21 0,74 0,89 <LOD - 5,26 4,61 5,53 0,15 0,18Sausages 36,3 0,09 0,18 <LOD - 4,56 3,41 6,64 0,11 0,22
1,82
Girls 4-6 yearsLow alcoholic beer 6,17 0,01 0,02 <LOD - 0,08 0,09 0,11 0,01 0,01Beer 9,69 0,03 0,03 <LOD - 0,29 0,27 0,31 0,02 0,02Bread and rolls 70,6 0,17 0,19 <LOD - 5,54 12,14 13,34 0,90 0,99Pasta 14,93 0,45 1,04 <LOD - 29,77 6,69 15,50 0,50 1,15Chocolate + sweets 88,63 0,10 0,12 <LOD - 3,60 8,86 10,46 0,66 0,77Manufactured multi-ingredient cereal products 46,07 0,21 0,32 <LOD - 31,80 9,49 14,51 0,70 1,07Grape juice 2,99 0,74 0,89 <LOD - 5,26 2,22 2,66 0,16 0,20Sausages 28,59 0,09 0,18 <LOD - 4,56 2,69 5,23 0,20 0,39
3,14Greece
All populationWine 22 139 0,17 0,28 <LOD – 2,61 3,74 6,16 23,63 38,92 0,05 0,09 0,34 0,56Coffee 4,3 16 1,69 2,58 <LOD – 7,20 7,27 11,09 27,04 41,28 0,10 0,16 0,39 0,59Dried vine fuits 0,03 0 1,88 3,09 <LOD – 16,50 0,06 0,09 0,00 0,00 0,00 0,00 0,00 0,00
0,15
UrbanWine 12 0,17 0,28 <LOD – 2,61 2,04 3,36 0,03 0,05Coffee 4,1 1,69 2,58 <LOD – 7,20 6,93 10,58 0,10 0,15Dried vine fruits 0,03 1,88 3,09 <LOD – 16,50 0,06 0,09 0,00 0,00
0,13
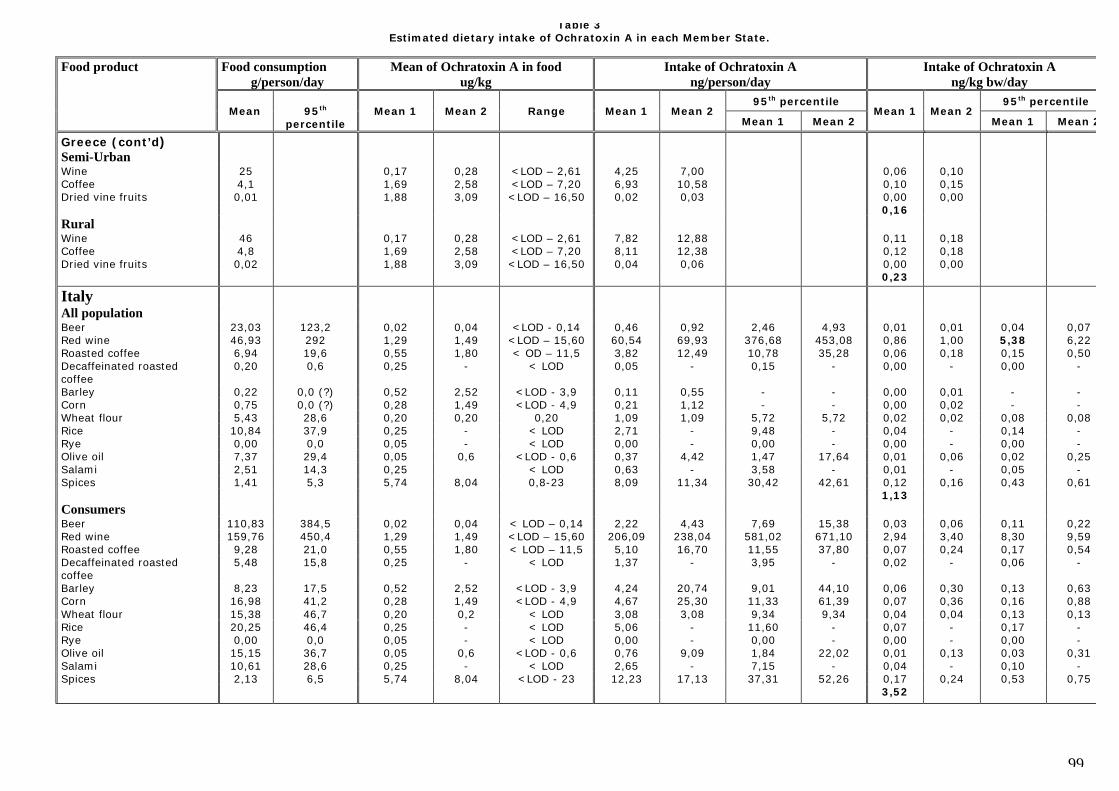
99
Table 3Estimated dietary intake of Ochratoxin A in each Member State.
Food product Food consumptiong/person/day
Mean of Ochratoxin A in foodug/kg
Intake of Ochratoxin Ang/person/day
Intake of Ochratoxin Ang/kg bw/day
95th percentile 95th percentileMean 95th
percentileMean 1 Mean 2 Range Mean 1 Mean 2
Mean 1 Mean 2Mean 1 Mean 2
Mean 1 Mean 2
Greece (cont’d)Semi-UrbanWine 25 0,17 0,28 <LOD – 2,61 4,25 7,00 0,06 0,10Coffee 4,1 1,69 2,58 <LOD – 7,20 6,93 10,58 0,10 0,15Dried vine fruits 0,01 1,88 3,09 <LOD – 16,50 0,02 0,03 0,00 0,00
0,16RuralWine 46 0,17 0,28 <LOD – 2,61 7,82 12,88 0,11 0,18Coffee 4,8 1,69 2,58 <LOD – 7,20 8,11 12,38 0,12 0,18Dried vine fruits 0,02 1,88 3,09 <LOD – 16,50 0,04 0,06 0,00 0,00
0,23
ItalyAll populationBeer 23,03 123,2 0,02 0,04 <LOD - 0,14 0,46 0,92 2,46 4,93 0,01 0,01 0,04 0,07Red wine 46,93 292 1,29 1,49 <LOD – 15,60 60,54 69,93 376,68 453,08 0,86 1,00 5,38 6,22Roasted coffee 6,94 19,6 0,55 1,80 < OD – 11,5 3,82 12,49 10,78 35,28 0,06 0,18 0,15 0,50Decaffeinated roastedcoffee
0,20 0,6 0,25 - < LOD 0,05 - 0,15 - 0,00 - 0,00 -
Barley 0,22 0,0 (?) 0,52 2,52 <LOD - 3,9 0,11 0,55 - - 0,00 0,01 - -Corn 0,75 0,0 (?) 0,28 1,49 <LOD - 4,9 0,21 1,12 - - 0,00 0,02 - -Wheat flour 5,43 28,6 0,20 0,20 0,20 1,09 1,09 5,72 5,72 0,02 0,02 0,08 0,08Rice 10,84 37,9 0,25 - < LOD 2,71 - 9,48 - 0,04 - 0,14 -Rye 0,00 0,0 0,05 - < LOD 0,00 - 0,00 - 0,00 - 0,00 -Olive oil 7,37 29,4 0,05 0,6 <LOD - 0,6 0,37 4,42 1,47 17,64 0,01 0,06 0,02 0,25Salami 2,51 14,3 0,25 < LOD 0,63 - 3,58 - 0,01 - 0,05 -Spices 1,41 5,3 5,74 8,04 0,8-23 8,09 11,34 30,42 42,61 0,12 0,16 0,43 0,61
1,13ConsumersBeer 110,83 384,5 0,02 0,04 < LOD – 0,14 2,22 4,43 7,69 15,38 0,03 0,06 0,11 0,22Red wine 159,76 450,4 1,29 1,49 <LOD – 15,60 206,09 238,04 581,02 671,10 2,94 3,40 8,30 9,59Roasted coffee 9,28 21,0 0,55 1,80 < LOD – 11,5 5,10 16,70 11,55 37,80 0,07 0,24 0,17 0,54Decaffeinated roastedcoffee
5,48 15,8 0,25 - < LOD 1,37 - 3,95 - 0,02 - 0,06 -
Barley 8,23 17,5 0,52 2,52 <LOD - 3,9 4,24 20,74 9,01 44,10 0,06 0,30 0,13 0,63Corn 16,98 41,2 0,28 1,49 <LOD - 4,9 4,67 25,30 11,33 61,39 0,07 0,36 0,16 0,88Wheat flour 15,38 46,7 0,20 0,2 < LOD 3,08 3,08 9,34 9,34 0,04 0,04 0,13 0,13Rice 20,25 46,4 0,25 - < LOD 5,06 - 11,60 - 0,07 - 0,17 -Rye 0,00 0,0 0,05 - < LOD 0,00 - 0,00 - 0,00 - 0,00 -Olive oil 15,15 36,7 0,05 0,6 <LOD - 0,6 0,76 9,09 1,84 22,02 0,01 0,13 0,03 0,31Salami 10,61 28,6 0,25 - < LOD 2,65 - 7,15 - 0,04 - 0,10 -Spices 2,13 6,5 5,74 8,04 <LOD - 23 12,23 17,13 37,31 52,26 0,17 0,24 0,53 0,75
3,52
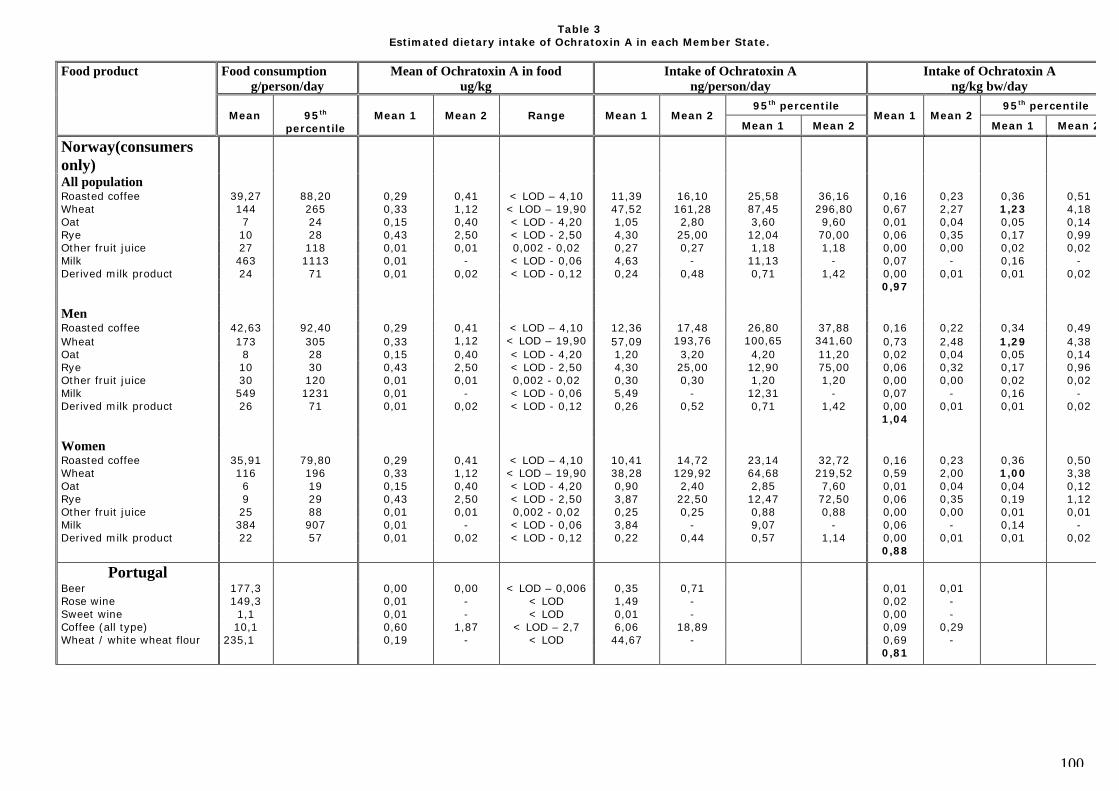
100
Table 3Estimated dietary intake of Ochratoxin A in each Member State.
Food product Food consumptiong/person/day
Mean of Ochratoxin A in foodug/kg
Intake of Ochratoxin Ang/person/day
Intake of Ochratoxin Ang/kg bw/day
95th percentile 95th percentileMean 95th
percentileMean 1 Mean 2 Range Mean 1 Mean 2
Mean 1 Mean 2Mean 1 Mean 2
Mean 1 Mean 2
Norway(consumersonly)All populationRoasted coffee 39,27 88,20 0,29 0,41 < LOD – 4,10 11,39 16,10 25,58 36,16 0,16 0,23 0,36 0,51Wheat 144 265 0,33 1,12 < LOD – 19,90 47,52 161,28 87,45 296,80 0,67 2,27 1,23 4,18Oat 7 24 0,15 0,40 < LOD - 4,20 1,05 2,80 3,60 9,60 0,01 0,04 0,05 0,14Rye 10 28 0,43 2,50 < LOD - 2,50 4,30 25,00 12,04 70,00 0,06 0,35 0,17 0,99Other fruit juice 27 118 0,01 0,01 0,002 - 0,02 0,27 0,27 1,18 1,18 0,00 0,00 0,02 0,02Milk 463 1113 0,01 - < LOD - 0,06 4,63 - 11,13 - 0,07 - 0,16 -Derived milk product 24 71 0,01 0,02 < LOD - 0,12 0,24 0,48 0,71 1,42 0,00 0,01 0,01 0,02
0,97
MenRoasted coffee 42,63 92,40 0,29 0,41 < LOD – 4,10 12,36 17,48 26,80 37,88 0,16 0,22 0,34 0,49Wheat 173 305 0,33 1,12 < LOD – 19,90 57,09 193,76 100,65 341,60 0,73 2,48 1,29 4,38Oat 8 28 0,15 0,40 < LOD - 4,20 1,20 3,20 4,20 11,20 0,02 0,04 0,05 0,14Rye 10 30 0,43 2,50 < LOD - 2,50 4,30 25,00 12,90 75,00 0,06 0,32 0,17 0,96Other fruit juice 30 120 0,01 0,01 0,002 - 0,02 0,30 0,30 1,20 1,20 0,00 0,00 0,02 0,02Milk 549 1231 0,01 - < LOD - 0,06 5,49 - 12,31 - 0,07 - 0,16 -Derived milk product 26 71 0,01 0,02 < LOD - 0,12 0,26 0,52 0,71 1,42 0,00 0,01 0,01 0,02
1,04
WomenRoasted coffee 35,91 79,80 0,29 0,41 < LOD – 4,10 10,41 14,72 23,14 32,72 0,16 0,23 0,36 0,50Wheat 116 196 0,33 1,12 < LOD – 19,90 38,28 129,92 64,68 219,52 0,59 2,00 1,00 3,38Oat 6 19 0,15 0,40 < LOD - 4,20 0,90 2,40 2,85 7,60 0,01 0,04 0,04 0,12Rye 9 29 0,43 2,50 < LOD - 2,50 3,87 22,50 12,47 72,50 0,06 0,35 0,19 1,12Other fruit juice 25 88 0,01 0,01 0,002 - 0,02 0,25 0,25 0,88 0,88 0,00 0,00 0,01 0,01Milk 384 907 0,01 - < LOD - 0,06 3,84 - 9,07 - 0,06 - 0,14 -Derived milk product 22 57 0,01 0,02 < LOD - 0,12 0,22 0,44 0,57 1,14 0,00 0,01 0,01 0,02
0,88
PortugalBeer 177,3 0,00 0,00 < LOD – 0,006 0,35 0,71 0,01 0,01Rose wine 149,3 0,01 - < LOD 1,49 - 0,02 -Sweet wine 1,1 0,01 - < LOD 0,01 - 0,00 -Coffee (all type) 10,1 0,60 1,87 < LOD – 2,7 6,06 18,89 0,09 0,29Wheat / white wheat flour 235,1 0,19 - < LOD 44,67 - 0,69 -
0,81
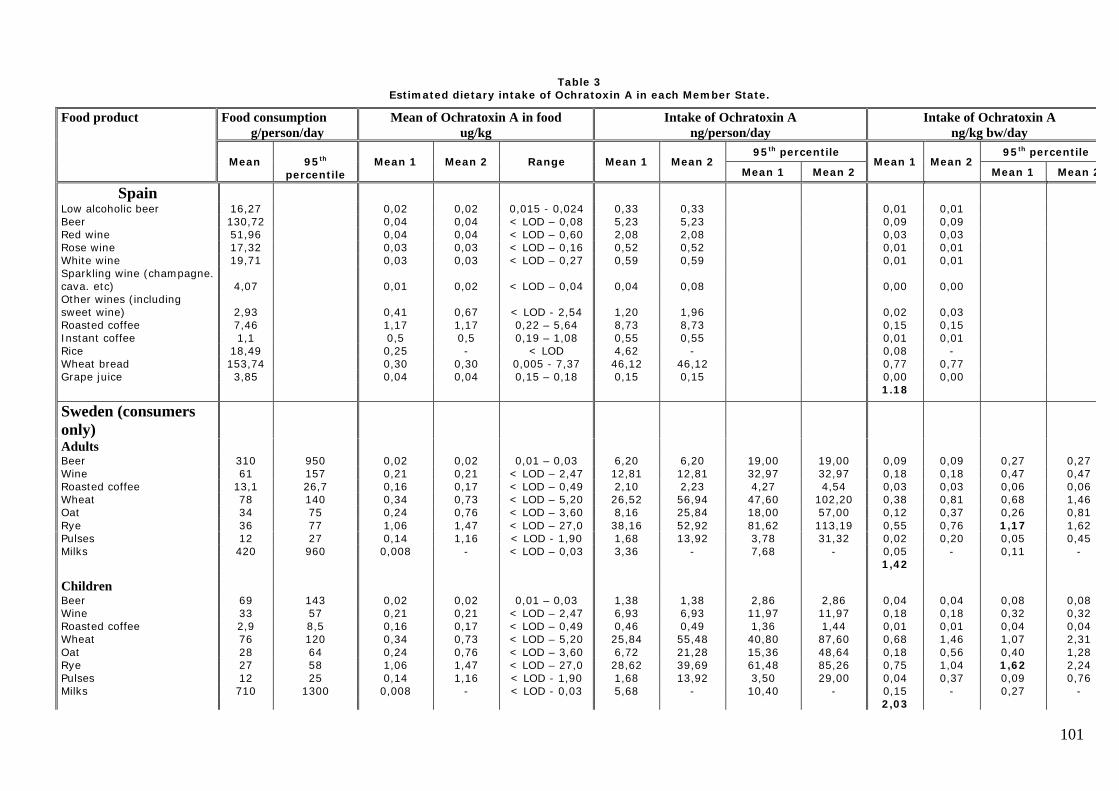
101
Table 3Estimated dietary intake of Ochratoxin A in each Member State.
Food product Food consumptiong/person/day
Mean of Ochratoxin A in foodug/kg
Intake of Ochratoxin Ang/person/day
Intake of Ochratoxin Ang/kg bw/day
95th percentile 95th percentileMean 95th
percentileMean 1 Mean 2 Range Mean 1 Mean 2
Mean 1 Mean 2Mean 1 Mean 2
Mean 1 Mean 2
SpainLow alcoholic beer 16,27 0,02 0,02 0,015 - 0,024 0,33 0,33 0,01 0,01Beer 130,72 0,04 0,04 < LOD – 0,08 5,23 5,23 0,09 0,09Red wine 51,96 0,04 0,04 < LOD – 0,60 2,08 2,08 0,03 0,03Rose wine 17,32 0,03 0,03 < LOD – 0,16 0,52 0,52 0,01 0,01White wine 19,71 0,03 0,03 < LOD – 0,27 0,59 0,59 0,01 0,01Sparkling wine (champagne.cava. etc) 4,07 0,01 0,02 < LOD – 0,04 0,04 0,08 0,00 0,00Other wines (includingsweet wine) 2,93 0,41 0,67 < LOD - 2,54 1,20 1,96 0,02 0,03Roasted coffee 7,46 1,17 1,17 0,22 – 5,64 8,73 8,73 0,15 0,15Instant coffee 1,1 0,5 0,5 0,19 – 1,08 0,55 0,55 0,01 0,01Rice 18,49 0,25 - < LOD 4,62 - 0,08 -Wheat bread 153,74 0,30 0,30 0,005 - 7,37 46,12 46,12 0,77 0,77Grape juice 3,85 0,04 0,04 0,15 – 0,18 0,15 0,15 0,00 0,00
1.18
Sweden (consumersonly)AdultsBeer 310 950 0,02 0,02 0,01 – 0,03 6,20 6,20 19,00 19,00 0,09 0,09 0,27 0,27Wine 61 157 0,21 0,21 < LOD – 2,47 12,81 12,81 32,97 32,97 0,18 0,18 0,47 0,47Roasted coffee 13,1 26,7 0,16 0,17 < LOD – 0,49 2,10 2,23 4,27 4,54 0,03 0,03 0,06 0,06Wheat 78 140 0,34 0,73 < LOD – 5,20 26,52 56,94 47,60 102,20 0,38 0,81 0,68 1,46Oat 34 75 0,24 0,76 < LOD – 3,60 8,16 25,84 18,00 57,00 0,12 0,37 0,26 0,81Rye 36 77 1,06 1,47 < LOD – 27,0 38,16 52,92 81,62 113,19 0,55 0,76 1,17 1,62Pulses 12 27 0,14 1,16 < LOD - 1,90 1,68 13,92 3,78 31,32 0,02 0,20 0,05 0,45Milks 420 960 0,008 - < LOD – 0,03 3,36 - 7,68 - 0,05 - 0,11 -
1,42
ChildrenBeer 69 143 0,02 0,02 0,01 – 0,03 1,38 1,38 2,86 2,86 0,04 0,04 0,08 0,08Wine 33 57 0,21 0,21 < LOD – 2,47 6,93 6,93 11,97 11,97 0,18 0,18 0,32 0,32Roasted coffee 2,9 8,5 0,16 0,17 < LOD – 0,49 0,46 0,49 1,36 1,44 0,01 0,01 0,04 0,04Wheat 76 120 0,34 0,73 < LOD – 5,20 25,84 55,48 40,80 87,60 0,68 1,46 1,07 2,31Oat 28 64 0,24 0,76 < LOD – 3,60 6,72 21,28 15,36 48,64 0,18 0,56 0,40 1,28Rye 27 58 1,06 1,47 < LOD – 27,0 28,62 39,69 61,48 85,26 0,75 1,04 1,62 2,24Pulses 12 25 0,14 1,16 < LOD - 1,90 1,68 13,92 3,50 29,00 0,04 0,37 0,09 0,76Milks 710 1300 0,008 - < LOD - 0,03 5,68 - 10,40 - 0,15 - 0,27 -
2,03
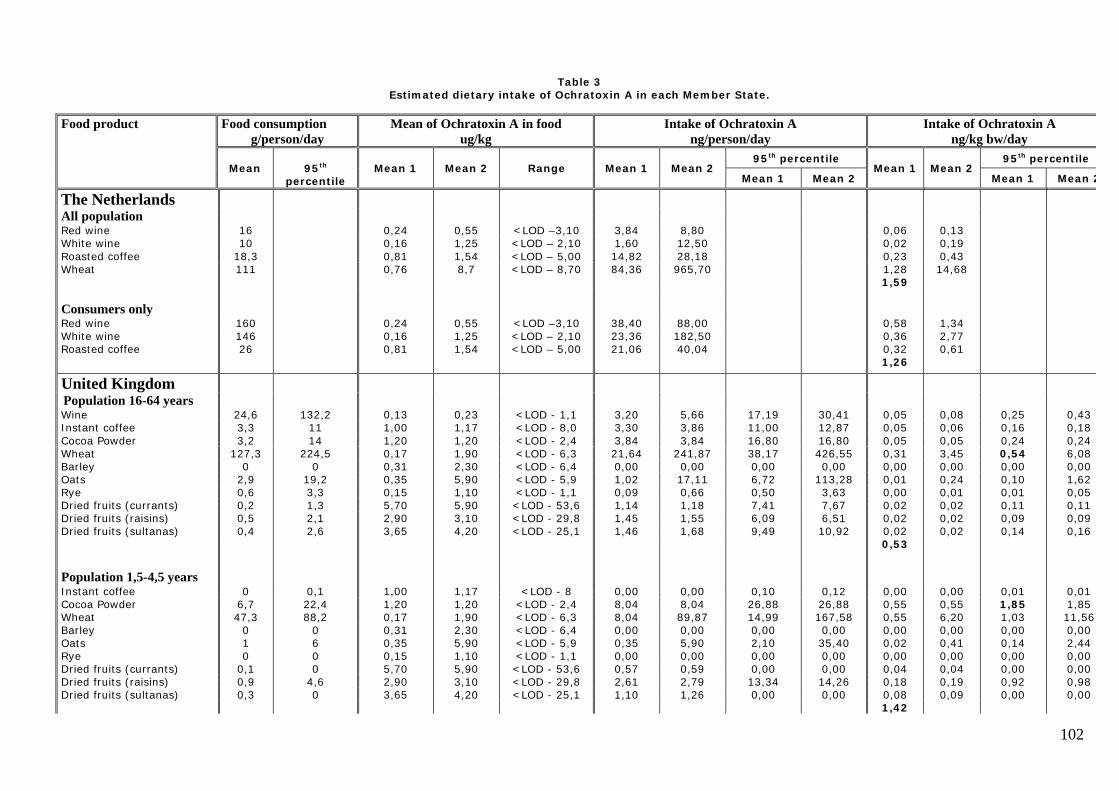
102
Table 3Estimated dietary intake of Ochratoxin A in each Member State.
Food product Food consumptiong/person/day
Mean of Ochratoxin A in foodug/kg
Intake of Ochratoxin Ang/person/day
Intake of Ochratoxin Ang/kg bw/day
95th percentile 95th percentileMean 95th
percentileMean 1 Mean 2 Range Mean 1 Mean 2
Mean 1 Mean 2Mean 1 Mean 2
Mean 1 Mean 2
The NetherlandsAll populationRed wine 16 0,24 0,55 <LOD –3,10 3,84 8,80 0,06 0,13White wine 10 0,16 1,25 <LOD – 2,10 1,60 12,50 0,02 0,19Roasted coffee 18,3 0,81 1,54 <LOD – 5,00 14,82 28,18 0,23 0,43Wheat 111 0,76 8,7 <LOD – 8,70 84,36 965,70 1,28 14,68
1,59
Consumers onlyRed wine 160 0,24 0,55 <LOD –3,10 38,40 88,00 0,58 1,34White wine 146 0,16 1,25 <LOD – 2,10 23,36 182,50 0,36 2,77Roasted coffee 26 0,81 1,54 <LOD – 5,00 21,06 40,04 0,32 0,61
1,26
United KingdomPopulation 16-64 yearsWine 24,6 132,2 0,13 0,23 <LOD - 1,1 3,20 5,66 17,19 30,41 0,05 0,08 0,25 0,43Instant coffee 3,3 11 1,00 1,17 <LOD - 8,0 3,30 3,86 11,00 12,87 0,05 0,06 0,16 0,18Cocoa Powder 3,2 14 1,20 1,20 <LOD - 2,4 3,84 3,84 16,80 16,80 0,05 0,05 0,24 0,24Wheat 127,3 224,5 0,17 1,90 <LOD - 6,3 21,64 241,87 38,17 426,55 0,31 3,45 0,54 6,08Barley 0 0 0,31 2,30 <LOD - 6,4 0,00 0,00 0,00 0,00 0,00 0,00 0,00 0,00Oats 2,9 19,2 0,35 5,90 <LOD - 5,9 1,02 17,11 6,72 113,28 0,01 0,24 0,10 1,62Rye 0,6 3,3 0,15 1,10 <LOD - 1,1 0,09 0,66 0,50 3,63 0,00 0,01 0,01 0,05Dried fruits (currants) 0,2 1,3 5,70 5,90 <LOD - 53,6 1,14 1,18 7,41 7,67 0,02 0,02 0,11 0,11Dried fruits (raisins) 0,5 2,1 2,90 3,10 <LOD - 29,8 1,45 1,55 6,09 6,51 0,02 0,02 0,09 0,09Dried fruits (sultanas) 0,4 2,6 3,65 4,20 <LOD - 25,1 1,46 1,68 9,49 10,92 0,02 0,02 0,14 0,16
0,53
Population 1,5-4,5 yearsInstant coffee 0 0,1 1,00 1,17 <LOD - 8 0,00 0,00 0,10 0,12 0,00 0,00 0,01 0,01Cocoa Powder 6,7 22,4 1,20 1,20 <LOD - 2,4 8,04 8,04 26,88 26,88 0,55 0,55 1,85 1,85Wheat 47,3 88,2 0,17 1,90 <LOD - 6,3 8,04 89,87 14,99 167,58 0,55 6,20 1,03 11,56Barley 0 0 0,31 2,30 <LOD - 6,4 0,00 0,00 0,00 0,00 0,00 0,00 0,00 0,00Oats 1 6 0,35 5,90 <LOD - 5,9 0,35 5,90 2,10 35,40 0,02 0,41 0,14 2,44Rye 0 0 0,15 1,10 <LOD - 1,1 0,00 0,00 0,00 0,00 0,00 0,00 0,00 0,00Dried fruits (currants) 0,1 0 5,70 5,90 <LOD - 53,6 0,57 0,59 0,00 0,00 0,04 0,04 0,00 0,00Dried fruits (raisins) 0,9 4,6 2,90 3,10 <LOD - 29,8 2,61 2,79 13,34 14,26 0,18 0,19 0,92 0,98Dried fruits (sultanas) 0,3 0 3,65 4,20 <LOD - 25,1 1,10 1,26 0,00 0,00 0,08 0,09 0,00 0,00
1,42
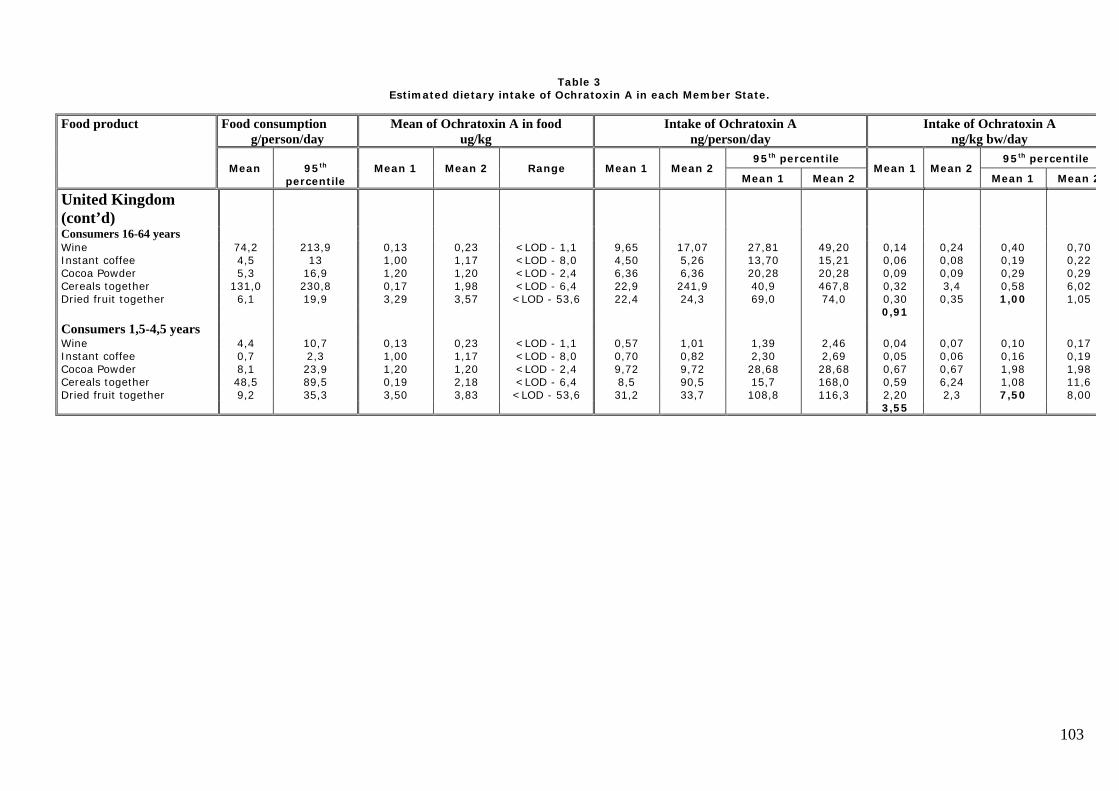
103
Table 3Estimated dietary intake of Ochratoxin A in each Member State.
Food product Food consumptiong/person/day
Mean of Ochratoxin A in foodug/kg
Intake of Ochratoxin Ang/person/day
Intake of Ochratoxin Ang/kg bw/day
95th percentile 95th percentileMean 95th
percentileMean 1 Mean 2 Range Mean 1 Mean 2
Mean 1 Mean 2Mean 1 Mean 2
Mean 1 Mean 2
United Kingdom(cont’d)Consumers 16-64 yearsWine 74,2 213,9 0,13 0,23 <LOD - 1,1 9,65 17,07 27,81 49,20 0,14 0,24 0,40 0,70Instant coffee 4,5 13 1,00 1,17 <LOD - 8,0 4,50 5,26 13,70 15,21 0,06 0,08 0,19 0,22Cocoa Powder 5,3 16,9 1,20 1,20 <LOD - 2,4 6,36 6,36 20,28 20,28 0,09 0,09 0,29 0,29Cereals together 131,0 230,8 0,17 1,98 <LOD - 6,4 22,9 241,9 40,9 467,8 0,32 3,4 0,58 6,02Dried fruit together 6,1 19,9 3,29 3,57 <LOD - 53,6 22,4 24,3 69,0 74,0 0,30 0,35 1,00 1,05
0,91
Consumers 1,5-4,5 yearsWine 4,4 10,7 0,13 0,23 <LOD - 1,1 0,57 1,01 1,39 2,46 0,04 0,07 0,10 0,17Instant coffee 0,7 2,3 1,00 1,17 <LOD - 8,0 0,70 0,82 2,30 2,69 0,05 0,06 0,16 0,19Cocoa Powder 8,1 23,9 1,20 1,20 <LOD - 2,4 9,72 9,72 28,68 28,68 0,67 0,67 1,98 1,98Cereals together 48,5 89,5 0,19 2,18 <LOD - 6,4 8,5 90,5 15,7 168,0 0,59 6,24 1,08 11,6Dried fruit together 9,2 35,3 3,50 3,83 <LOD - 53,6 31,2 33,7 108,8 116,3 2,20 2,3 7,50 8,00
3,55
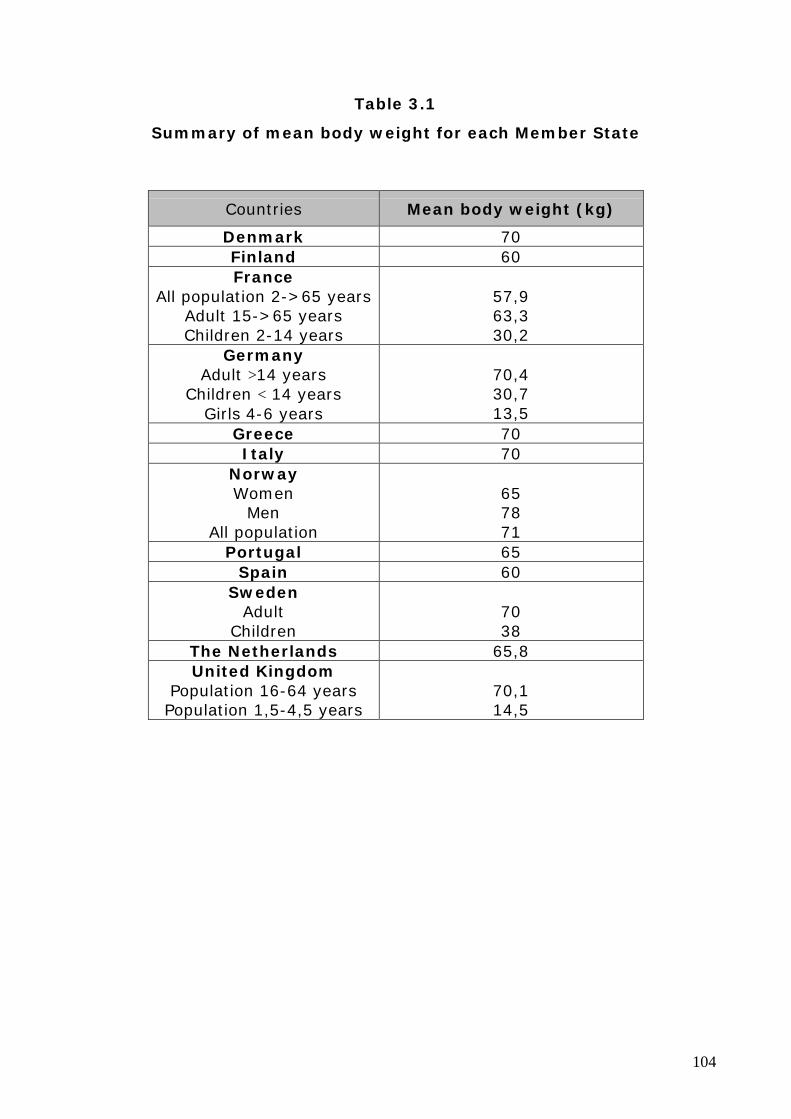
104
Table 3.1
Summary of mean body weight for each Member State
Countries Mean body weight (kg)
Denmark 70Finland 60France
All population 2->65 yearsAdult 15->65 yearsChildren 2-14 years
57,963,330,2
GermanyAdult >14 years
Children < 14 yearsGirls 4-6 years
70,430,713,5
Greece 70Italy 70
NorwayWomen
MenAll population
657871
Portugal 65Spain 60
SwedenAdult
Children7038
The Netherlands 65,8United Kingdom
Population 16-64 yearsPopulation 1,5-4,5 years
70,114,5
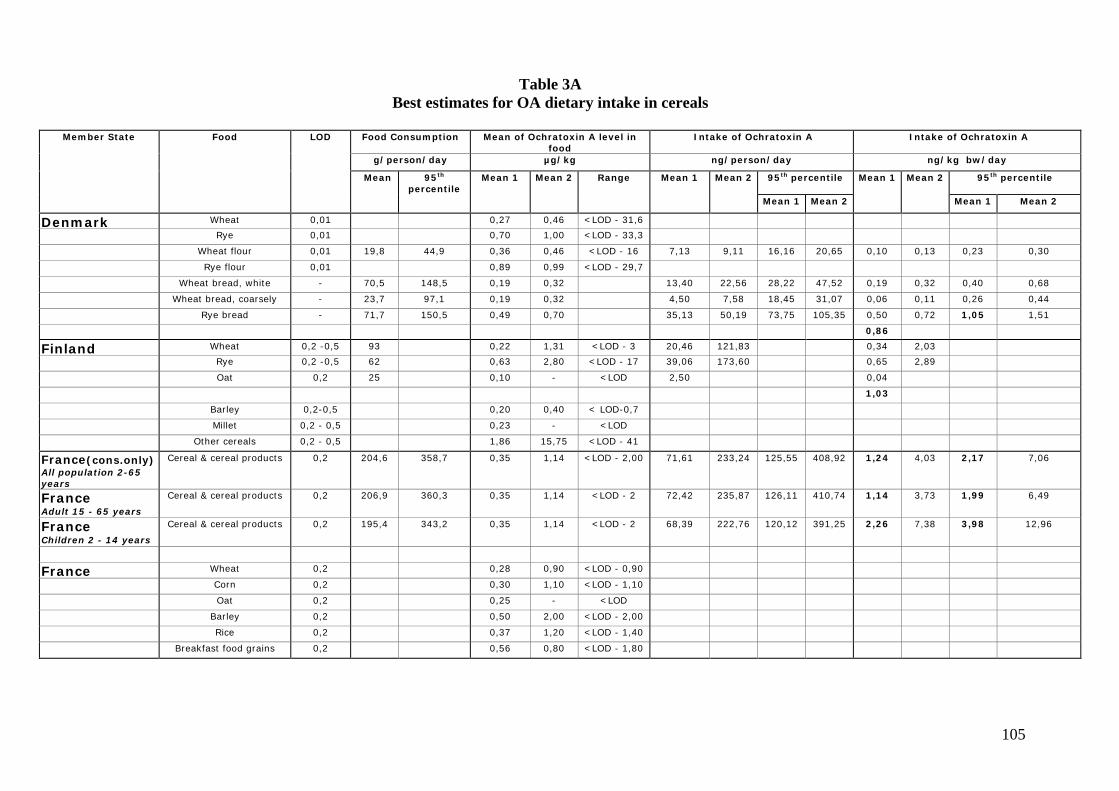
105
Table 3ABest estimates for OA dietary intake in cereals
Member State Food LOD Food Consumption Mean of Ochratoxin A level infood
Intake of Ochratoxin A Intake of Ochratoxin A
g/person/day µg/kg ng/person/day ng/kg bw/day
Mean 95th
percentileMean 1 Mean 2 Range Mean 1 Mean 2 95th percentile Mean 1 Mean 2 95th percentile
Mean 1 Mean 2 Mean 1 Mean 2
Denmark Wheat 0,01 0,27 0,46 <LOD - 31,6
Rye 0,01 0,70 1,00 <LOD - 33,3
Wheat flour 0,01 19,8 44,9 0,36 0,46 <LOD - 16 7,13 9,11 16,16 20,65 0,10 0,13 0,23 0,30
Rye flour 0,01 0,89 0,99 <LOD - 29,7
Wheat bread, white - 70,5 148,5 0,19 0,32 13,40 22,56 28,22 47,52 0,19 0,32 0,40 0,68
Wheat bread, coarsely - 23,7 97,1 0,19 0,32 4,50 7,58 18,45 31,07 0,06 0,11 0,26 0,44
Rye bread - 71,7 150,5 0,49 0,70 35,13 50,19 73,75 105,35 0,50 0,72 1,05 1,51
0,86
Finland Wheat 0,2 -0,5 93 0,22 1,31 <LOD - 3 20,46 121,83 0,34 2,03
Rye 0,2 -0,5 62 0,63 2,80 <LOD - 17 39,06 173,60 0,65 2,89
Oat 0,2 25 0,10 - <LOD 2,50 0,04
1,03
Barley 0,2-0,5 0,20 0,40 < LOD-0,7
Millet 0,2 - 0,5 0,23 - <LOD
Other cereals 0,2 - 0,5 1,86 15,75 <LOD - 41
France(cons.only)All population 2-65years
Cereal & cereal products 0,2 204,6 358,7 0,35 1,14 <LOD - 2,00 71,61 233,24 125,55 408,92 1,24 4,03 2,17 7,06
FranceAdult 15 - 65 years
Cereal & cereal products 0,2 206,9 360,3 0,35 1,14 <LOD - 2 72,42 235,87 126,11 410,74 1,14 3,73 1,99 6,49
FranceChildren 2 - 14 years
Cereal & cereal products 0,2 195,4 343,2 0,35 1,14 <LOD - 2 68,39 222,76 120,12 391,25 2,26 7,38 3,98 12,96
France Wheat 0,2 0,28 0,90 <LOD - 0,90
Corn 0,2 0,30 1,10 <LOD - 1,10
Oat 0,2 0,25 - <LOD
Barley 0,2 0,50 2,00 <LOD - 2,00
Rice 0,2 0,37 1,20 <LOD - 1,40
Breakfast food grains 0,2 0,56 0,80 <LOD - 1,80
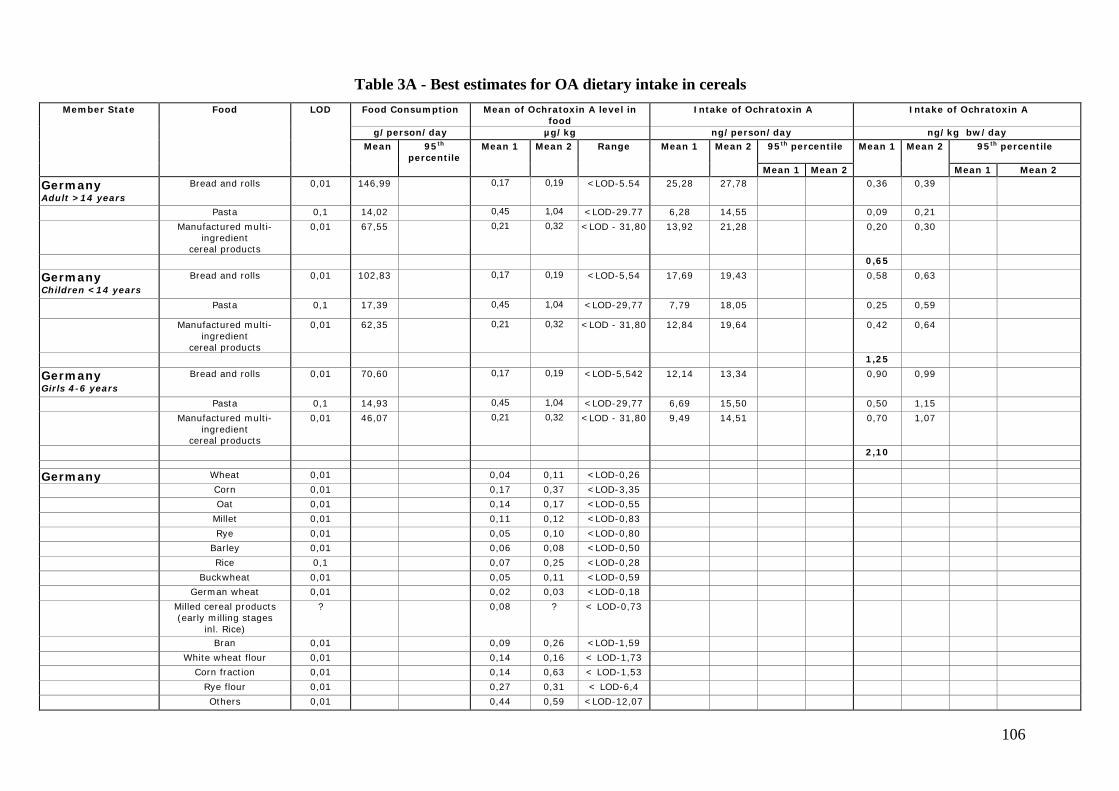
106
Table 3A - Best estimates for OA dietary intake in cerealsMember State Food LOD Food Consumption Mean of Ochratoxin A level in
food Intake of Ochratoxin A Intake of Ochratoxin A
g/person/day µg/kg ng/person/day ng/kg bw/day Mean 95th
percentileMean 1 Mean 2 Range Mean 1 Mean 2 95th percentile Mean 1 Mean 2 95th percentile
Mean 1 Mean 2 Mean 1 Mean 2
GermanyAdult >14 years
Bread and rolls 0,01 146,99 0,17 0,19 <LOD-5.54 25,28 27,78 0,36 0,39
Pasta 0,1 14,02 0,45 1,04 <LOD-29.77 6,28 14,55 0,09 0,21
Manufactured multi-ingredient
cereal products
0,01 67,55 0,21 0,32 <LOD - 31,80 13,92 21,28 0,20 0,30
0,65
GermanyChildren <14 years
Bread and rolls 0,01 102,83 0,17 0,19 <LOD-5,54 17,69 19,43 0,58 0,63
Pasta 0,1 17,39 0,45 1,04 <LOD-29,77 7,79 18,05 0,25 0,59
Manufactured multi-ingredient
cereal products
0,01 62,35 0,21 0,32 <LOD - 31,80 12,84 19,64 0,42 0,64
1,25
GermanyGirls 4-6 years
Bread and rolls 0,01 70,60 0,17 0,19 <LOD-5,542 12,14 13,34 0,90 0,99
Pasta 0,1 14,93 0,45 1,04 <LOD-29,77 6,69 15,50 0,50 1,15
Manufactured multi-ingredient
cereal products
0,01 46,07 0,21 0,32 <LOD - 31,80 9,49 14,51 0,70 1,07
2,10
Germany Wheat 0,01 0,04 0,11 <LOD-0,26
Corn 0,01 0,17 0,37 <LOD-3,35
Oat 0,01 0,14 0,17 <LOD-0,55
Millet 0,01 0,11 0,12 <LOD-0,83
Rye 0,01 0,05 0,10 <LOD-0,80
Barley 0,01 0,06 0,08 <LOD-0,50
Rice 0,1 0,07 0,25 <LOD-0,28
Buckwheat 0,01 0,05 0,11 <LOD-0,59
German wheat 0,01 0,02 0,03 <LOD-0,18
Milled cereal products(early milling stages
inl. Rice)
? 0,08 ? < LOD-0,73
Bran 0,01 0,09 0,26 <LOD-1,59
White wheat flour 0,01 0,14 0,16 < LOD-1,73
Corn fraction 0,01 0,14 0,63 < LOD-1,53
Rye flour 0,01 0,27 0,31 < LOD-6,4
Others 0,01 0,44 0,59 <LOD-12,07
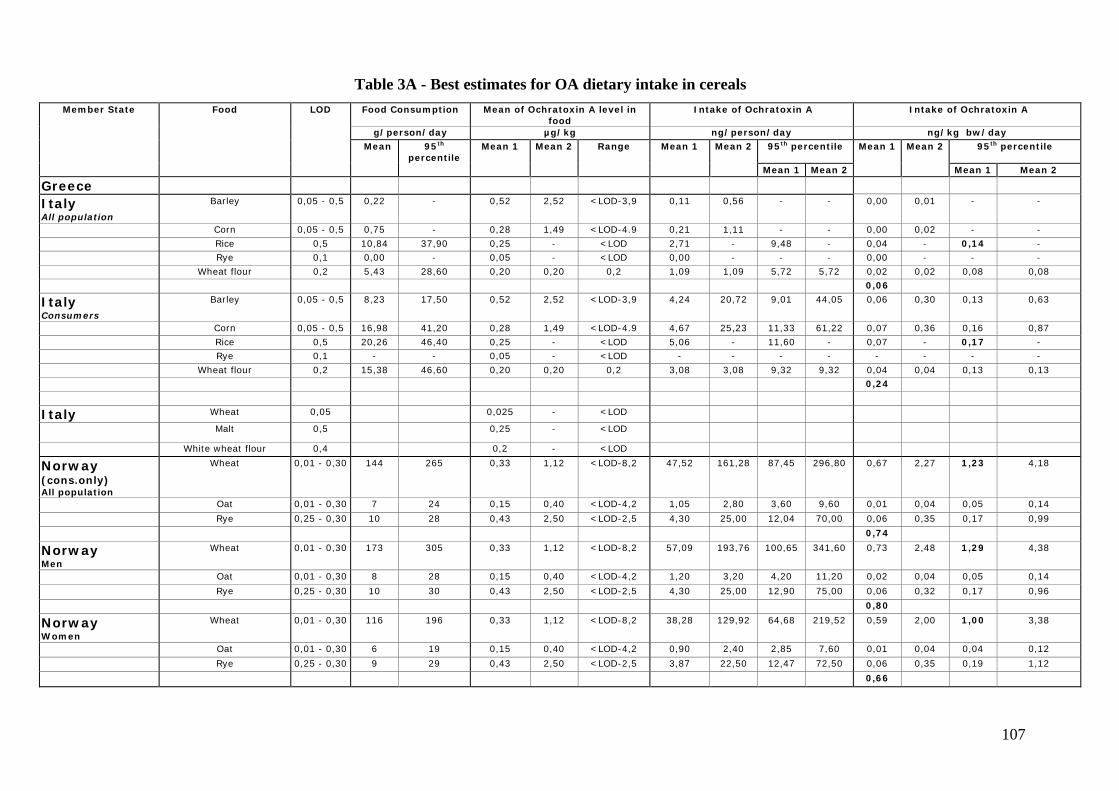
107
Table 3A - Best estimates for OA dietary intake in cerealsMember State Food LOD Food Consumption Mean of Ochratoxin A level in
food Intake of Ochratoxin A Intake of Ochratoxin A
g/person/day µg/kg ng/person/day ng/kg bw/day Mean 95th
percentileMean 1 Mean 2 Range Mean 1 Mean 2 95th percentile Mean 1 Mean 2 95th percentile
Mean 1 Mean 2 Mean 1 Mean 2
GreeceItalyAll population
Barley 0,05 - 0,5 0,22 - 0,52 2,52 <LOD-3,9 0,11 0,56 - - 0,00 0,01 - -
Corn 0,05 - 0,5 0,75 - 0,28 1,49 <LOD-4.9 0,21 1,11 - - 0,00 0,02 - -Rice 0,5 10,84 37,90 0,25 - <LOD 2,71 - 9,48 - 0,04 - 0,14 -Rye 0,1 0,00 - 0,05 - <LOD 0,00 - - - 0,00 - - -
Wheat flour 0,2 5,43 28,60 0,20 0,20 0,2 1,09 1,09 5,72 5,72 0,02 0,02 0,08 0,080,06
ItalyConsumers
Barley 0,05 - 0,5 8,23 17,50 0,52 2,52 <LOD-3,9 4,24 20,72 9,01 44,05 0,06 0,30 0,13 0,63
Corn 0,05 - 0,5 16,98 41,20 0,28 1,49 <LOD-4.9 4,67 25,23 11,33 61,22 0,07 0,36 0,16 0,87Rice 0,5 20,26 46,40 0,25 - <LOD 5,06 - 11,60 - 0,07 - 0,17 -Rye 0,1 - - 0,05 - <LOD - - - - - - - -
Wheat flour 0,2 15,38 46,60 0,20 0,20 0,2 3,08 3,08 9,32 9,32 0,04 0,04 0,13 0,130,24
Italy Wheat 0,05 0,025 - <LOD
Malt 0,5 0,25 - <LOD
White wheat flour 0,4 0,2 - <LOD
Norway(cons.only)All population
Wheat 0,01 - 0,30 144 265 0,33 1,12 <LOD-8,2 47,52 161,28 87,45 296,80 0,67 2,27 1,23 4,18
Oat 0,01 - 0,30 7 24 0,15 0,40 <LOD-4,2 1,05 2,80 3,60 9,60 0,01 0,04 0,05 0,14
Rye 0,25 - 0,30 10 28 0,43 2,50 <LOD-2,5 4,30 25,00 12,04 70,00 0,06 0,35 0,17 0,99
0,74
NorwayMen
Wheat 0,01 - 0,30 173 305 0,33 1,12 <LOD-8,2 57,09 193,76 100,65 341,60 0,73 2,48 1,29 4,38
Oat 0,01 - 0,30 8 28 0,15 0,40 <LOD-4,2 1,20 3,20 4,20 11,20 0,02 0,04 0,05 0,14
Rye 0,25 - 0,30 10 30 0,43 2,50 <LOD-2,5 4,30 25,00 12,90 75,00 0,06 0,32 0,17 0,96
0,80
NorwayWomen
Wheat 0,01 - 0,30 116 196 0,33 1,12 <LOD-8,2 38,28 129,92 64,68 219,52 0,59 2,00 1,00 3,38
Oat 0,01 - 0,30 6 19 0,15 0,40 <LOD-4,2 0,90 2,40 2,85 7,60 0,01 0,04 0,04 0,12
Rye 0,25 - 0,30 9 29 0,43 2,50 <LOD-2,5 3,87 22,50 12,47 72,50 0,06 0,35 0,19 1,12
0,66
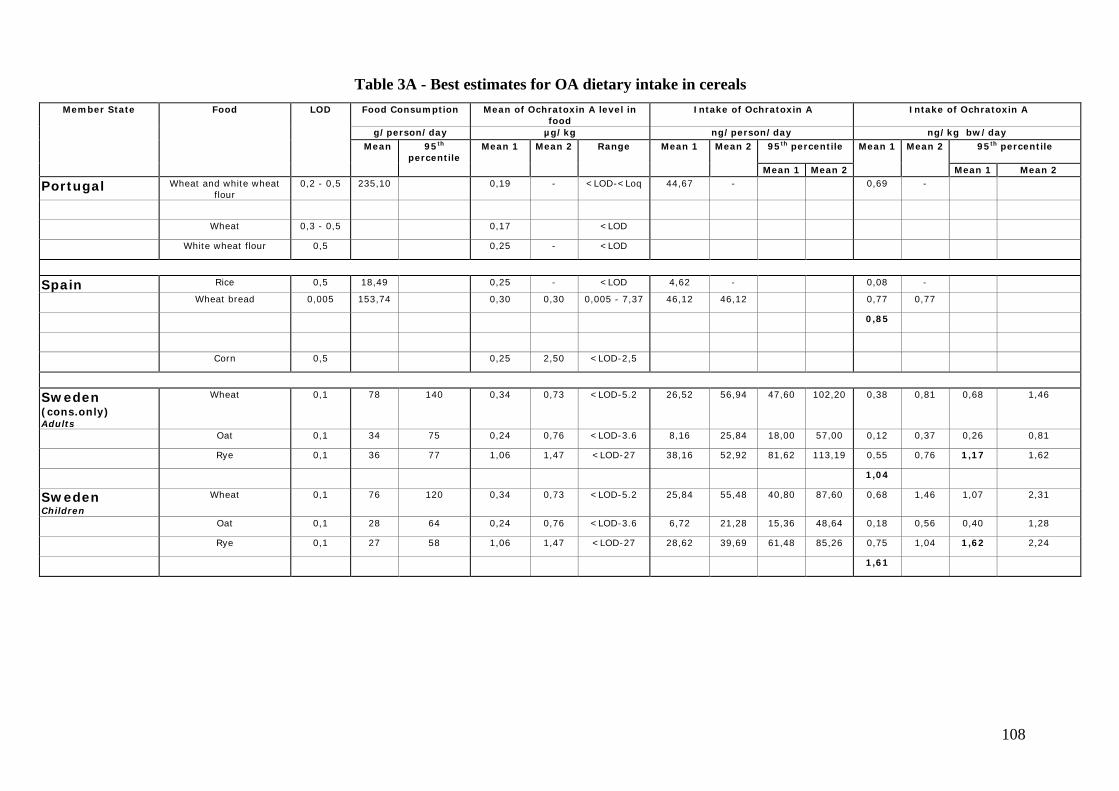
108
Table 3A - Best estimates for OA dietary intake in cerealsMember State Food LOD Food Consumption Mean of Ochratoxin A level in
food Intake of Ochratoxin A Intake of Ochratoxin A
g/person/day µg/kg ng/person/day ng/kg bw/day Mean 95th
percentileMean 1 Mean 2 Range Mean 1 Mean 2 95th percentile Mean 1 Mean 2 95th percentile
Mean 1 Mean 2 Mean 1 Mean 2
Portugal Wheat and white wheatflour
0,2 - 0,5 235,10 0,19 - <LOD-<Loq 44,67 - 0,69 -
Wheat 0,3 - 0,5 0,17 <LOD
White wheat flour 0,5 0,25 - <LOD
Spain Rice 0,5 18,49 0,25 - <LOD 4,62 - 0,08 -
Wheat bread 0,005 153,74 0,30 0,30 0,005 - 7,37 46,12 46,12 0,77 0,77
0,85
Corn 0,5 0,25 2,50 <LOD-2,5
Sweden(cons.only)Adults
Wheat 0,1 78 140 0,34 0,73 <LOD-5.2 26,52 56,94 47,60 102,20 0,38 0,81 0,68 1,46
Oat 0,1 34 75 0,24 0,76 <LOD-3.6 8,16 25,84 18,00 57,00 0,12 0,37 0,26 0,81
Rye 0,1 36 77 1,06 1,47 <LOD-27 38,16 52,92 81,62 113,19 0,55 0,76 1,17 1,62
1,04
SwedenChildren
Wheat 0,1 76 120 0,34 0,73 <LOD-5.2 25,84 55,48 40,80 87,60 0,68 1,46 1,07 2,31
Oat 0,1 28 64 0,24 0,76 <LOD-3.6 6,72 21,28 15,36 48,64 0,18 0,56 0,40 1,28
Rye 0,1 27 58 1,06 1,47 <LOD-27 28,62 39,69 61,48 85,26 0,75 1,04 1,62 2,24
1,61
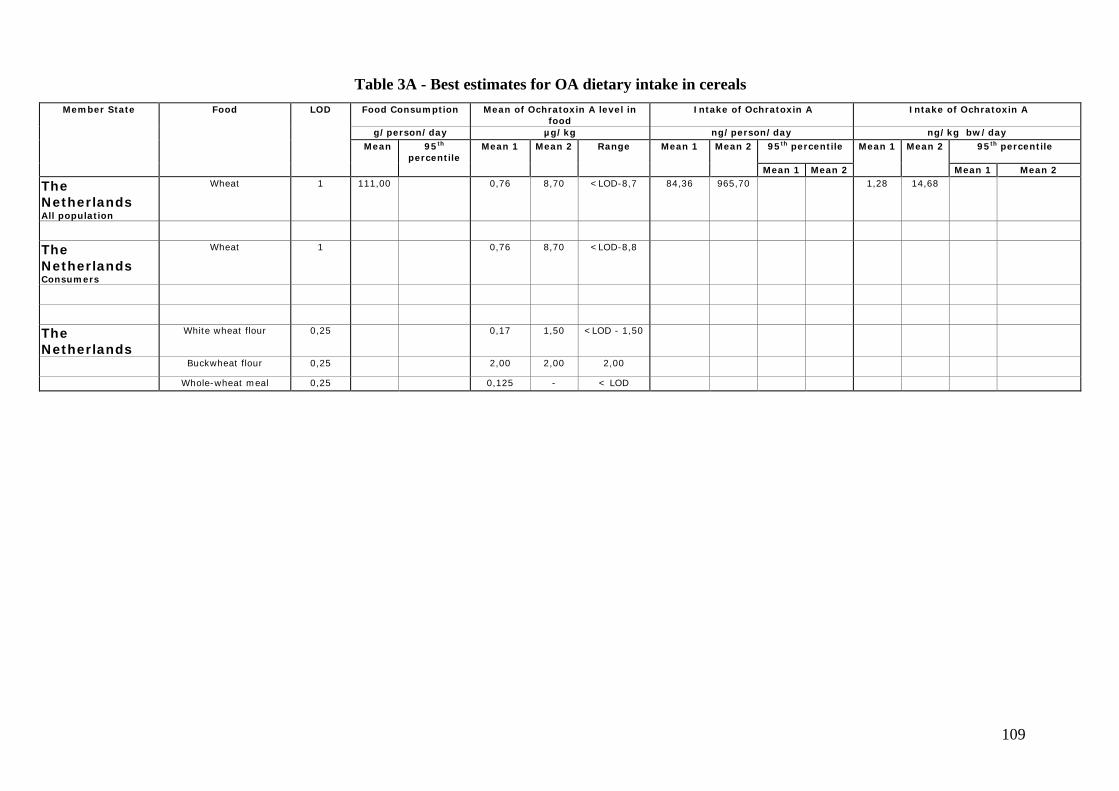
109
Table 3A - Best estimates for OA dietary intake in cerealsMember State Food LOD Food Consumption Mean of Ochratoxin A level in
food Intake of Ochratoxin A Intake of Ochratoxin A
g/person/day µg/kg ng/person/day ng/kg bw/day Mean 95th
percentileMean 1 Mean 2 Range Mean 1 Mean 2 95th percentile Mean 1 Mean 2 95th percentile
Mean 1 Mean 2 Mean 1 Mean 2
TheNetherlandsAll population
Wheat 1 111,00 0,76 8,70 <LOD-8,7 84,36 965,70 1,28 14,68
TheNetherlandsConsumers
Wheat 1 0,76 8,70 <LOD-8,8
TheNetherlands
White wheat flour 0,25 0,17 1,50 <LOD - 1,50
Buckwheat flour 0,25 2,00 2,00 2,00
Whole-wheat meal 0,25 0,125 - < LOD
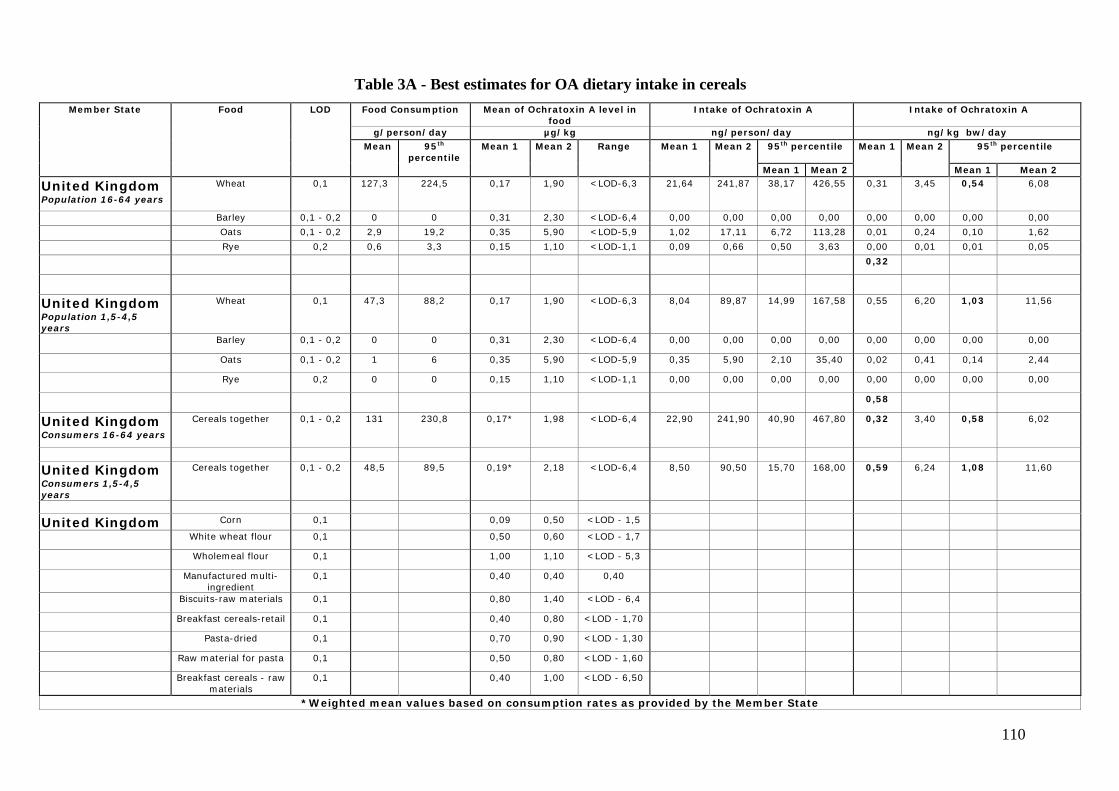
110
Table 3A - Best estimates for OA dietary intake in cerealsMember State Food LOD Food Consumption Mean of Ochratoxin A level in
food Intake of Ochratoxin A Intake of Ochratoxin A
g/person/day µg/kg ng/person/day ng/kg bw/day Mean 95th
percentileMean 1 Mean 2 Range Mean 1 Mean 2 95th percentile Mean 1 Mean 2 95th percentile
Mean 1 Mean 2 Mean 1 Mean 2
United KingdomPopulation 16-64 years
Wheat 0,1 127,3 224,5 0,17 1,90 <LOD-6,3 21,64 241,87 38,17 426,55 0,31 3,45 0,54 6,08
Barley 0,1 - 0,2 0 0 0,31 2,30 <LOD-6,4 0,00 0,00 0,00 0,00 0,00 0,00 0,00 0,00
Oats 0,1 - 0,2 2,9 19,2 0,35 5,90 <LOD-5,9 1,02 17,11 6,72 113,28 0,01 0,24 0,10 1,62
Rye 0,2 0,6 3,3 0,15 1,10 <LOD-1,1 0,09 0,66 0,50 3,63 0,00 0,01 0,01 0,05
0,32
United KingdomPopulation 1,5-4,5years
Wheat 0,1 47,3 88,2 0,17 1,90 <LOD-6,3 8,04 89,87 14,99 167,58 0,55 6,20 1,03 11,56
Barley 0,1 - 0,2 0 0 0,31 2,30 <LOD-6,4 0,00 0,00 0,00 0,00 0,00 0,00 0,00 0,00
Oats 0,1 - 0,2 1 6 0,35 5,90 <LOD-5,9 0,35 5,90 2,10 35,40 0,02 0,41 0,14 2,44
Rye 0,2 0 0 0,15 1,10 <LOD-1,1 0,00 0,00 0,00 0,00 0,00 0,00 0,00 0,00
0,58
United KingdomConsumers 16-64 years
Cereals together 0,1 - 0,2 131 230,8 0,17* 1,98 <LOD-6,4 22,90 241,90 40,90 467,80 0,32 3,40 0,58 6,02
United KingdomConsumers 1,5-4,5years
Cereals together 0,1 - 0,2 48,5 89,5 0,19* 2,18 <LOD-6,4 8,50 90,50 15,70 168,00 0,59 6,24 1,08 11,60
United Kingdom Corn 0,1 0,09 0,50 <LOD - 1,5
White wheat flour 0,1 0,50 0,60 <LOD - 1,7
Wholemeal flour 0,1 1,00 1,10 <LOD - 5,3
Manufactured multi-ingredient
0,1 0,40 0,40 0,40
Biscuits-raw materials 0,1 0,80 1,40 <LOD - 6,4
Breakfast cereals-retail 0,1 0,40 0,80 <LOD - 1,70
Pasta-dried 0,1 0,70 0,90 <LOD - 1,30
Raw material for pasta 0,1 0,50 0,80 <LOD - 1,60
Breakfast cereals - rawmaterials
0,1 0,40 1,00 <LOD - 6,50
*Weighted mean values based on consumption rates as provided by the Member State
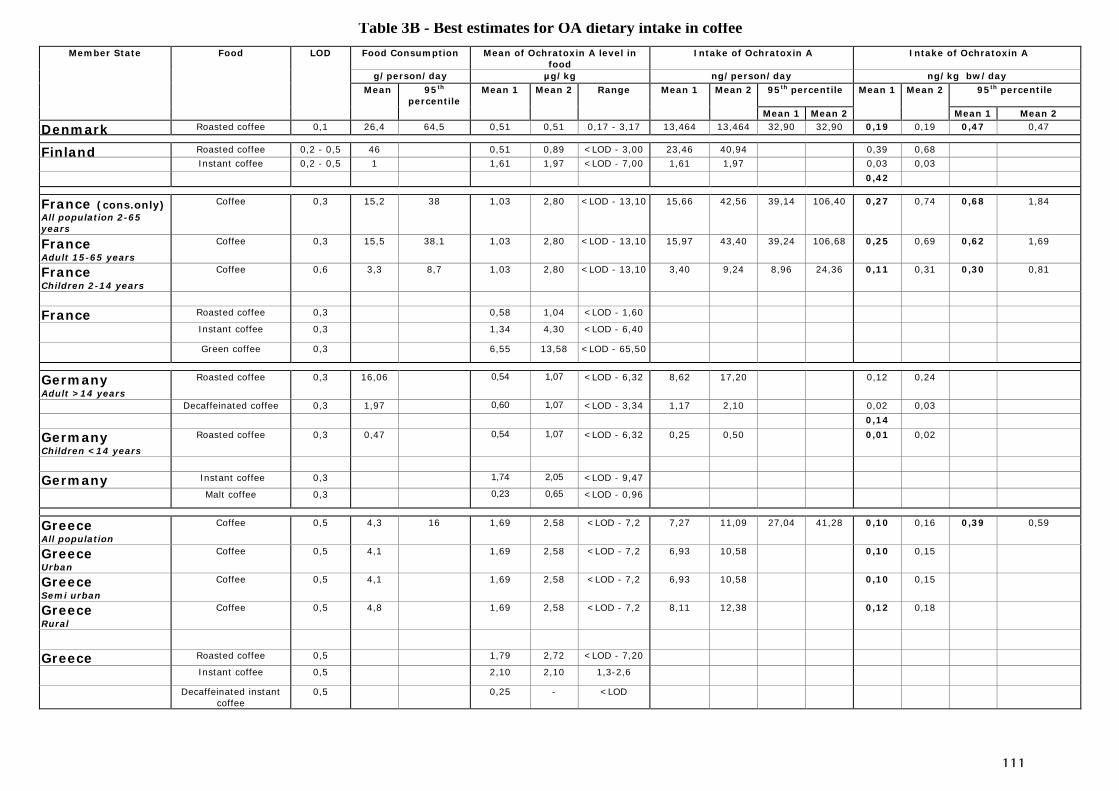
111
Table 3B - Best estimates for OA dietary intake in coffeeMember State Food LOD Food Consumption Mean of Ochratoxin A level in
food Intake of Ochratoxin A Intake of Ochratoxin A
g/person/day µg/kg ng/person/day ng/kg bw/day Mean 95th
percentileMean 1 Mean 2 Range Mean 1 Mean 2 95th percentile Mean 1 Mean 2 95th percentile
Mean 1 Mean 2 Mean 1 Mean 2
Denmark Roasted coffee 0,1 26,4 64,5 0,51 0,51 0,17 - 3,17 13,464 13,464 32,90 32,90 0,19 0,19 0,47 0,47
Finland Roasted coffee 0,2 - 0,5 46 0,51 0,89 <LOD - 3,00 23,46 40,94 0,39 0,68Instant coffee 0,2 - 0,5 1 1,61 1,97 <LOD - 7,00 1,61 1,97 0,03 0,03
0,42
France (cons.only)All population 2-65years
Coffee 0,3 15,2 38 1,03 2,80 <LOD - 13,10 15,66 42,56 39,14 106,40 0,27 0,74 0,68 1,84
FranceAdult 15-65 years
Coffee 0,3 15,5 38,1 1,03 2,80 <LOD - 13,10 15,97 43,40 39,24 106,68 0,25 0,69 0,62 1,69
FranceChildren 2-14 years
Coffee 0,6 3,3 8,7 1,03 2,80 <LOD - 13,10 3,40 9,24 8,96 24,36 0,11 0,31 0,30 0,81
France Roasted coffee 0,3 0,58 1,04 <LOD - 1,60
Instant coffee 0,3 1,34 4,30 <LOD - 6,40
Green coffee 0,3 6,55 13,58 <LOD - 65,50
GermanyAdult >14 years
Roasted coffee 0,3 16,06 0,54 1,07 <LOD - 6,32 8,62 17,20 0,12 0,24
Decaffeinated coffee 0,3 1,97 0,60 1,07 <LOD - 3,34 1,17 2,10 0,02 0,03
0,14
GermanyChildren <14 years
Roasted coffee 0,3 0,47 0,54 1,07 <LOD - 6,32 0,25 0,50 0,01 0,02
Germany Instant coffee 0,3 1,74 2,05 <LOD - 9,47
Malt coffee 0,3 0,23 0,65 <LOD - 0,96
GreeceAll population
Coffee 0,5 4,3 16 1,69 2,58 <LOD - 7,2 7,27 11,09 27,04 41,28 0,10 0,16 0,39 0,59
GreeceUrban
Coffee 0,5 4,1 1,69 2,58 <LOD - 7,2 6,93 10,58 0,10 0,15
GreeceSemi urban
Coffee 0,5 4,1 1,69 2,58 <LOD - 7,2 6,93 10,58 0,10 0,15
GreeceRural
Coffee 0,5 4,8 1,69 2,58 <LOD - 7,2 8,11 12,38 0,12 0,18
Greece Roasted coffee 0,5 1,79 2,72 <LOD - 7,20
Instant coffee 0,5 2,10 2,10 1,3-2,6
Decaffeinated instantcoffee
0,5 0,25 - <LOD
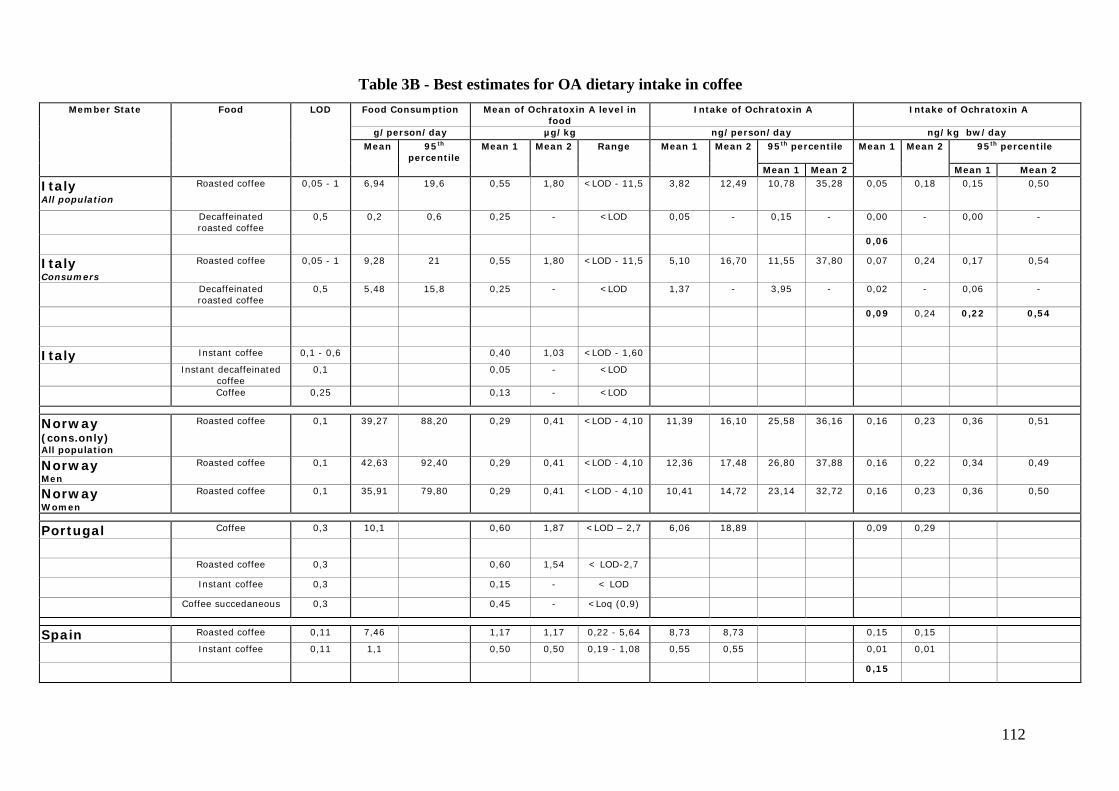
112
Table 3B - Best estimates for OA dietary intake in coffeeMember State Food LOD Food Consumption Mean of Ochratoxin A level in
food Intake of Ochratoxin A Intake of Ochratoxin A
g/person/day µg/kg ng/person/day ng/kg bw/day Mean 95th
percentileMean 1 Mean 2 Range Mean 1 Mean 2 95th percentile Mean 1 Mean 2 95th percentile
Mean 1 Mean 2 Mean 1 Mean 2
ItalyAll population
Roasted coffee 0,05 - 1 6,94 19,6 0,55 1,80 <LOD - 11,5 3,82 12,49 10,78 35,28 0,05 0,18 0,15 0,50
Decaffeinatedroasted coffee
0,5 0,2 0,6 0,25 - <LOD 0,05 - 0,15 - 0,00 - 0,00 -
0,06
ItalyConsumers
Roasted coffee 0,05 - 1 9,28 21 0,55 1,80 <LOD - 11,5 5,10 16,70 11,55 37,80 0,07 0,24 0,17 0,54
Decaffeinatedroasted coffee
0,5 5,48 15,8 0,25 - <LOD 1,37 - 3,95 - 0,02 - 0,06 -
0,09 0,24 0,22 0,54
Italy Instant coffee 0,1 - 0,6 0,40 1,03 <LOD - 1,60
Instant decaffeinatedcoffee
0,1 0,05 - <LOD
Coffee 0,25 0,13 - <LOD
Norway(cons.only)All population
Roasted coffee 0,1 39,27 88,20 0,29 0,41 <LOD - 4,10 11,39 16,10 25,58 36,16 0,16 0,23 0,36 0,51
NorwayMen
Roasted coffee 0,1 42,63 92,40 0,29 0,41 <LOD - 4,10 12,36 17,48 26,80 37,88 0,16 0,22 0,34 0,49
NorwayWomen
Roasted coffee 0,1 35,91 79,80 0,29 0,41 <LOD - 4,10 10,41 14,72 23,14 32,72 0,16 0,23 0,36 0,50
Portugal Coffee 0,3 10,1 0,60 1,87 <LOD – 2,7 6,06 18,89 0,09 0,29
Roasted coffee 0,3 0,60 1,54 < LOD-2,7
Instant coffee 0,3 0,15 - < LOD
Coffee succedaneous 0,3 0,45 - <Loq (0,9)
Spain Roasted coffee 0,11 7,46 1,17 1,17 0,22 - 5,64 8,73 8,73 0,15 0,15
Instant coffee 0,11 1,1 0,50 0,50 0,19 - 1,08 0,55 0,55 0,01 0,01
0,15
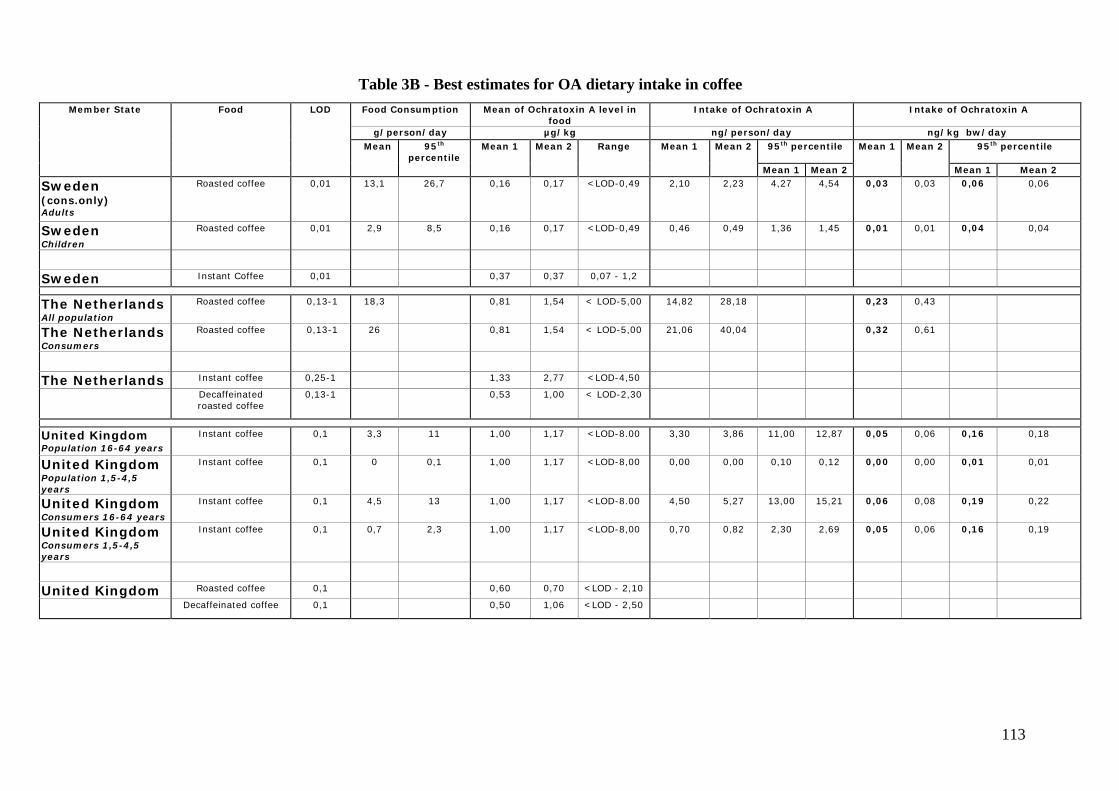
113
Table 3B - Best estimates for OA dietary intake in coffeeMember State Food LOD Food Consumption Mean of Ochratoxin A level in
food Intake of Ochratoxin A Intake of Ochratoxin A
g/person/day µg/kg ng/person/day ng/kg bw/day Mean 95th
percentileMean 1 Mean 2 Range Mean 1 Mean 2 95th percentile Mean 1 Mean 2 95th percentile
Mean 1 Mean 2 Mean 1 Mean 2
Sweden(cons.only)Adults
Roasted coffee 0,01 13,1 26,7 0,16 0,17 <LOD-0,49 2,10 2,23 4,27 4,54 0,03 0,03 0,06 0,06
SwedenChildren
Roasted coffee 0,01 2,9 8,5 0,16 0,17 <LOD-0,49 0,46 0,49 1,36 1,45 0,01 0,01 0,04 0,04
Sweden Instant Coffee 0,01 0,37 0,37 0,07 - 1,2
The NetherlandsAll population
Roasted coffee 0,13-1 18,3 0,81 1,54 < LOD-5,00 14,82 28,18 0,23 0,43
The NetherlandsConsumers
Roasted coffee 0,13-1 26 0,81 1,54 < LOD-5,00 21,06 40,04 0,32 0,61
The Netherlands Instant coffee 0,25-1 1,33 2,77 <LOD-4,50
Decaffeinatedroasted coffee
0,13-1 0,53 1,00 < LOD-2,30
United KingdomPopulation 16-64 years
Instant coffee 0,1 3,3 11 1,00 1,17 <LOD-8.00 3,30 3,86 11,00 12,87 0,05 0,06 0,16 0,18
United KingdomPopulation 1,5-4,5years
Instant coffee 0,1 0 0,1 1,00 1,17 <LOD-8,00 0,00 0,00 0,10 0,12 0,00 0,00 0,01 0,01
United KingdomConsumers 16-64 years
Instant coffee 0,1 4,5 13 1,00 1,17 <LOD-8.00 4,50 5,27 13,00 15,21 0,06 0,08 0,19 0,22
United KingdomConsumers 1,5-4,5years
Instant coffee 0,1 0,7 2,3 1,00 1,17 <LOD-8,00 0,70 0,82 2,30 2,69 0,05 0,06 0,16 0,19
United Kingdom Roasted coffee 0,1 0,60 0,70 <LOD - 2,10
Decaffeinated coffee 0,1 0,50 1,06 <LOD - 2,50
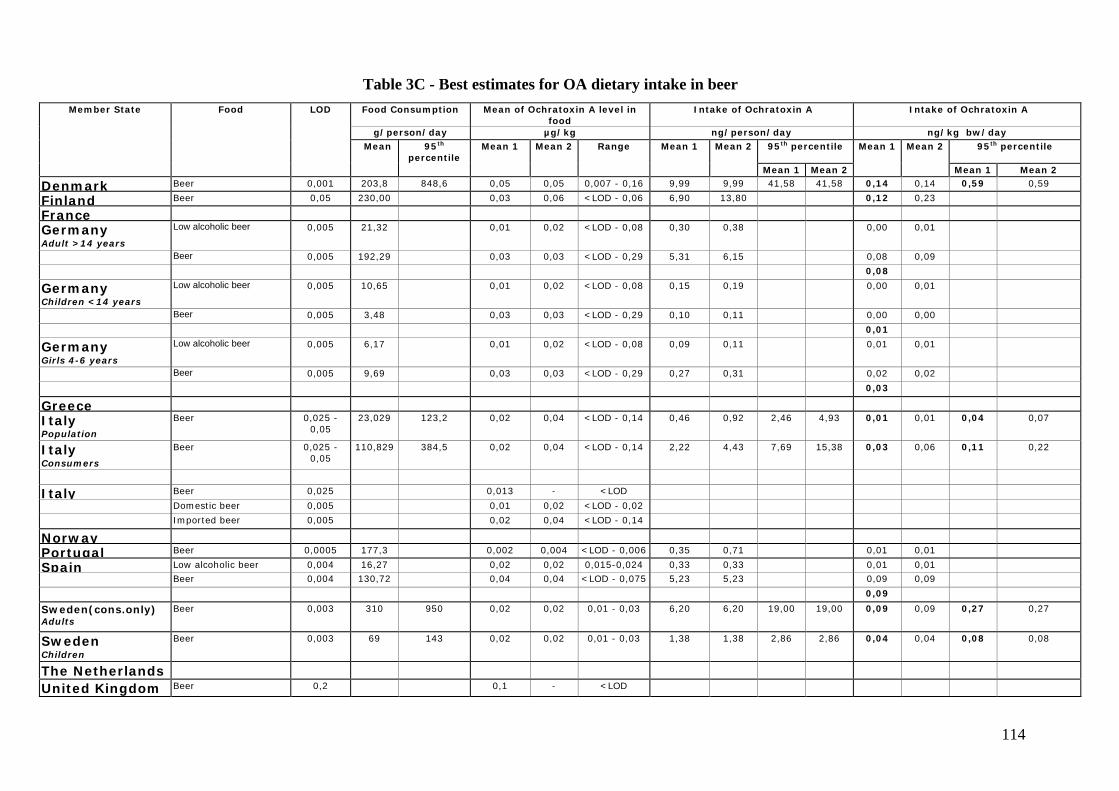
114
Table 3C - Best estimates for OA dietary intake in beerMember State Food LOD Food Consumption Mean of Ochratoxin A level in
food Intake of Ochratoxin A Intake of Ochratoxin A
g/person/day µg/kg ng/person/day ng/kg bw/day Mean 95th
percentileMean 1 Mean 2 Range Mean 1 Mean 2 95th percentile Mean 1 Mean 2 95th percentile
Mean 1 Mean 2 Mean 1 Mean 2
Denmark Beer 0,001 203,8 848,6 0,05 0,05 0,007 - 0,16 9,99 9,99 41,58 41,58 0,14 0,14 0,59 0,59
Finland Beer 0,05 230,00 0,03 0,06 <LOD - 0,06 6,90 13,80 0,12 0,23
FranceGermanyAdult >14 years
Low alcoholic beer 0,005 21,32 0,01 0,02 <LOD - 0,08 0,30 0,38 0,00 0,01
Beer 0,005 192,29 0,03 0,03 <LOD - 0,29 5,31 6,15 0,08 0,09
0,08
GermanyChildren <14 years
Low alcoholic beer 0,005 10,65 0,01 0,02 <LOD - 0,08 0,15 0,19 0,00 0,01
Beer 0,005 3,48 0,03 0,03 <LOD - 0,29 0,10 0,11 0,00 0,00
0,01
GermanyGirls 4-6 years
Low alcoholic beer 0,005 6,17 0,01 0,02 <LOD - 0,08 0,09 0,11 0,01 0,01
Beer 0,005 9,69 0,03 0,03 <LOD - 0,29 0,27 0,31 0,02 0,02
0,03
GreeceItalyPopulation
Beer 0,025 -0,05
23,029 123,2 0,02 0,04 <LOD - 0,14 0,46 0,92 2,46 4,93 0,01 0,01 0,04 0,07
ItalyConsumers
Beer 0,025 -0,05
110,829 384,5 0,02 0,04 <LOD - 0,14 2,22 4,43 7,69 15,38 0,03 0,06 0,11 0,22
Italy Beer 0,025 0,013 - <LOD
Domestic beer 0,005 0,01 0,02 <LOD - 0,02
Imported beer 0,005 0,02 0,04 <LOD - 0,14
NorwayPortugal Beer 0,0005 177,3 0,002 0,004 <LOD - 0,006 0,35 0,71 0,01 0,01
Spain Low alcoholic beer 0,004 16,27 0,02 0,02 0,015-0,024 0,33 0,33 0,01 0,01Beer 0,004 130,72 0,04 0,04 <LOD - 0,075 5,23 5,23 0,09 0,09
0,09
Sweden(cons.only)Adults
Beer 0,003 310 950 0,02 0,02 0,01 - 0,03 6,20 6,20 19,00 19,00 0,09 0,09 0,27 0,27
SwedenChildren
Beer 0,003 69 143 0,02 0,02 0,01 - 0,03 1,38 1,38 2,86 2,86 0,04 0,04 0,08 0,08
The NetherlandsUnited Kingdom Beer 0,2 0,1 - <LOD
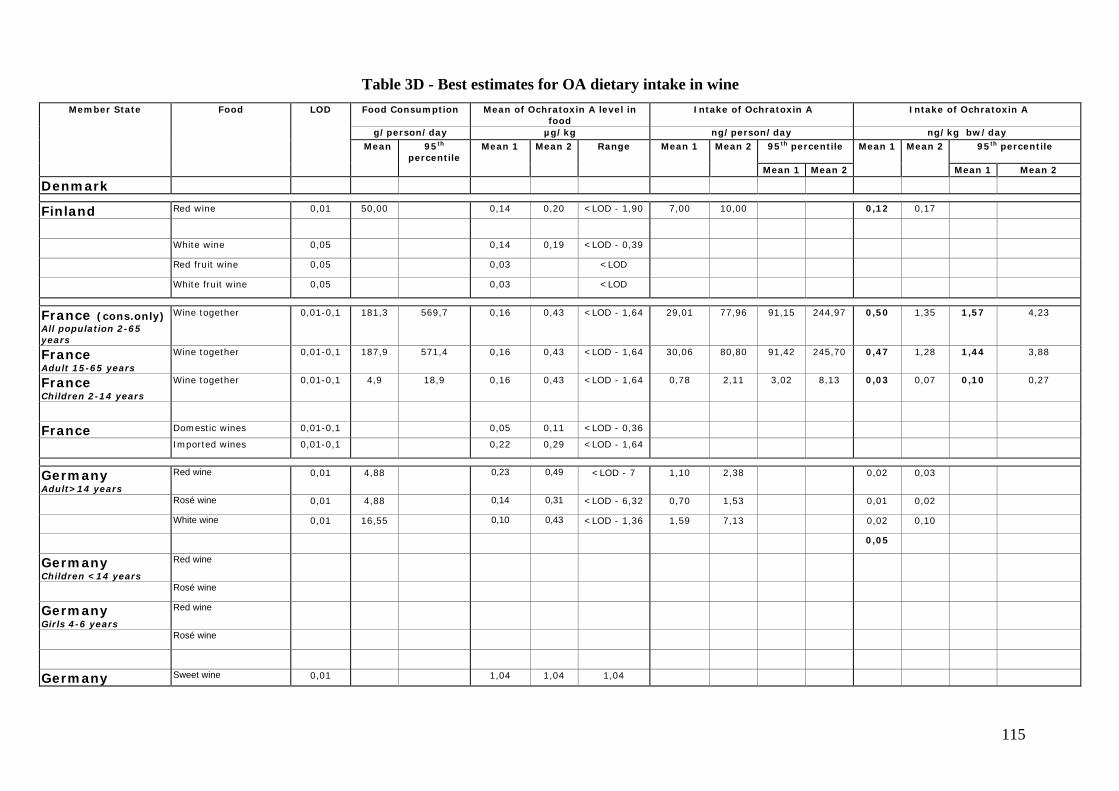
115
Table 3D - Best estimates for OA dietary intake in wineMember State Food LOD Food Consumption Mean of Ochratoxin A level in
food Intake of Ochratoxin A Intake of Ochratoxin A
g/person/day µg/kg ng/person/day ng/kg bw/day Mean 95th
percentileMean 1 Mean 2 Range Mean 1 Mean 2 95th percentile Mean 1 Mean 2 95th percentile
Mean 1 Mean 2 Mean 1 Mean 2
Denmark
Finland Red wine 0,01 50,00 0,14 0,20 <LOD - 1,90 7,00 10,00 0,12 0,17
White wine 0,05 0,14 0,19 <LOD - 0,39
Red fruit wine 0,05 0,03 <LOD
White fruit wine 0,05 0,03 <LOD
France (cons.only)All population 2-65years
Wine together 0,01-0,1 181,3 569,7 0,16 0,43 <LOD - 1,64 29,01 77,96 91,15 244,97 0,50 1,35 1,57 4,23
FranceAdult 15-65 years
Wine together 0,01-0,1 187,9 571,4 0,16 0,43 <LOD - 1,64 30,06 80,80 91,42 245,70 0,47 1,28 1,44 3,88
FranceChildren 2-14 years
Wine together 0,01-0,1 4,9 18,9 0,16 0,43 <LOD - 1,64 0,78 2,11 3,02 8,13 0,03 0,07 0,10 0,27
France Domestic wines 0,01-0,1 0,05 0,11 <LOD - 0,36
Imported wines 0,01-0,1 0,22 0,29 <LOD - 1,64
GermanyAdult>14 years
Red wine 0,01 4,88 0,23 0,49 <LOD - 7 1,10 2,38 0,02 0,03
Rosé wine 0,01 4,88 0,14 0,31 <LOD - 6,32 0,70 1,53 0,01 0,02
White wine 0,01 16,55 0,10 0,43 <LOD - 1,36 1,59 7,13 0,02 0,10
0,05
GermanyChildren <14 years
Red wine
Rosé wine
GermanyGirls 4-6 years
Red wine
Rosé wine
Germany Sweet wine 0,01 1,04 1,04 1,04
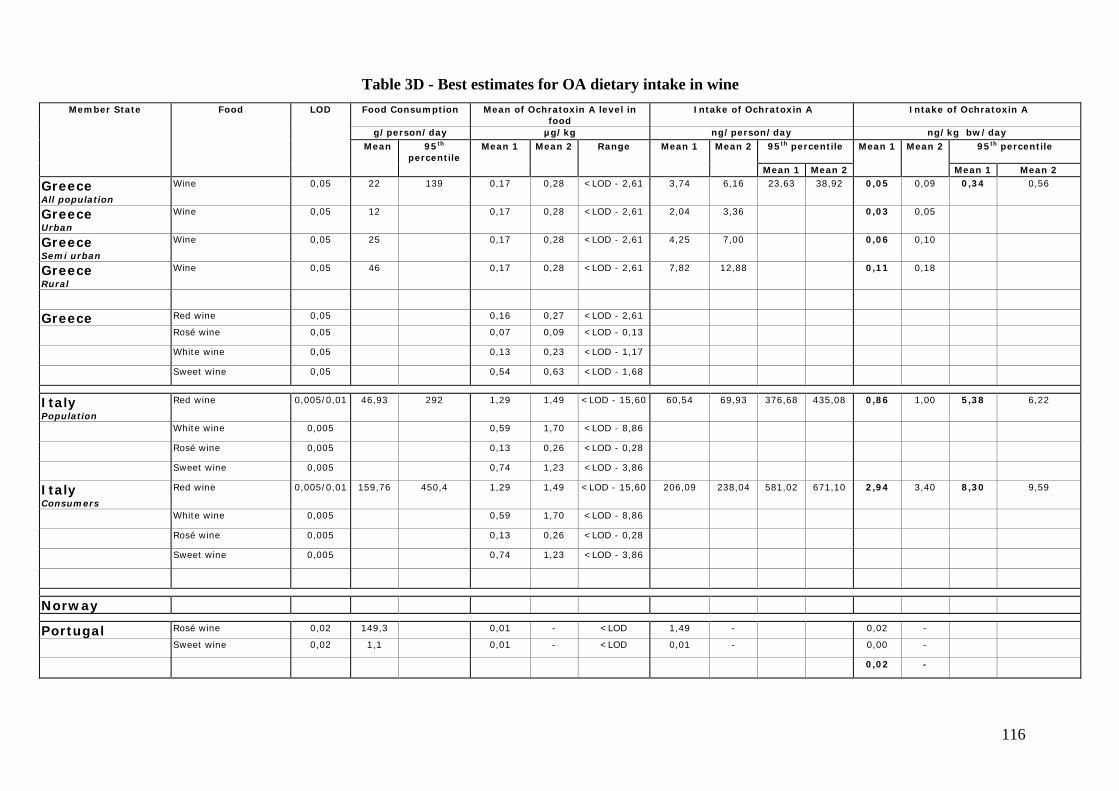
116
Table 3D - Best estimates for OA dietary intake in wineMember State Food LOD Food Consumption Mean of Ochratoxin A level in
food Intake of Ochratoxin A Intake of Ochratoxin A
g/person/day µg/kg ng/person/day ng/kg bw/day Mean 95th
percentileMean 1 Mean 2 Range Mean 1 Mean 2 95th percentile Mean 1 Mean 2 95th percentile
Mean 1 Mean 2 Mean 1 Mean 2
GreeceAll population
Wine 0,05 22 139 0,17 0,28 <LOD - 2,61 3,74 6,16 23,63 38,92 0,05 0,09 0,34 0,56
GreeceUrban
Wine 0,05 12 0,17 0,28 <LOD - 2,61 2,04 3,36 0,03 0,05
GreeceSemi urban
Wine 0,05 25 0,17 0,28 <LOD - 2,61 4,25 7,00 0,06 0,10
GreeceRural
Wine 0,05 46 0,17 0,28 <LOD - 2,61 7,82 12,88 0,11 0,18
Greece Red wine 0,05 0,16 0,27 <LOD - 2,61
Rosé wine 0,05 0,07 0,09 <LOD - 0,13
White wine 0,05 0,13 0,23 <LOD - 1,17
Sweet wine 0,05 0,54 0,63 <LOD - 1,68
ItalyPopulation
Red wine 0,005/0,01 46,93 292 1,29 1,49 <LOD - 15,60 60,54 69,93 376,68 435,08 0,86 1,00 5,38 6,22
White wine 0,005 0,59 1,70 <LOD - 8,86
Rosé wine 0,005 0,13 0,26 <LOD - 0,28
Sweet wine 0,005 0,74 1,23 <LOD - 3,86
ItalyConsumers
Red wine 0,005/0,01 159,76 450,4 1,29 1,49 <LOD - 15,60 206,09 238,04 581,02 671,10 2,94 3,40 8,30 9,59
White wine 0,005 0,59 1,70 <LOD - 8,86
Rosé wine 0,005 0,13 0,26 <LOD - 0,28
Sweet wine 0,005 0,74 1,23 <LOD - 3,86
Norway
Portugal Rosé wine 0,02 149,3 0,01 - <LOD 1,49 - 0,02 -
Sweet wine 0,02 1,1 0,01 - <LOD 0,01 - 0,00 -
0,02 -
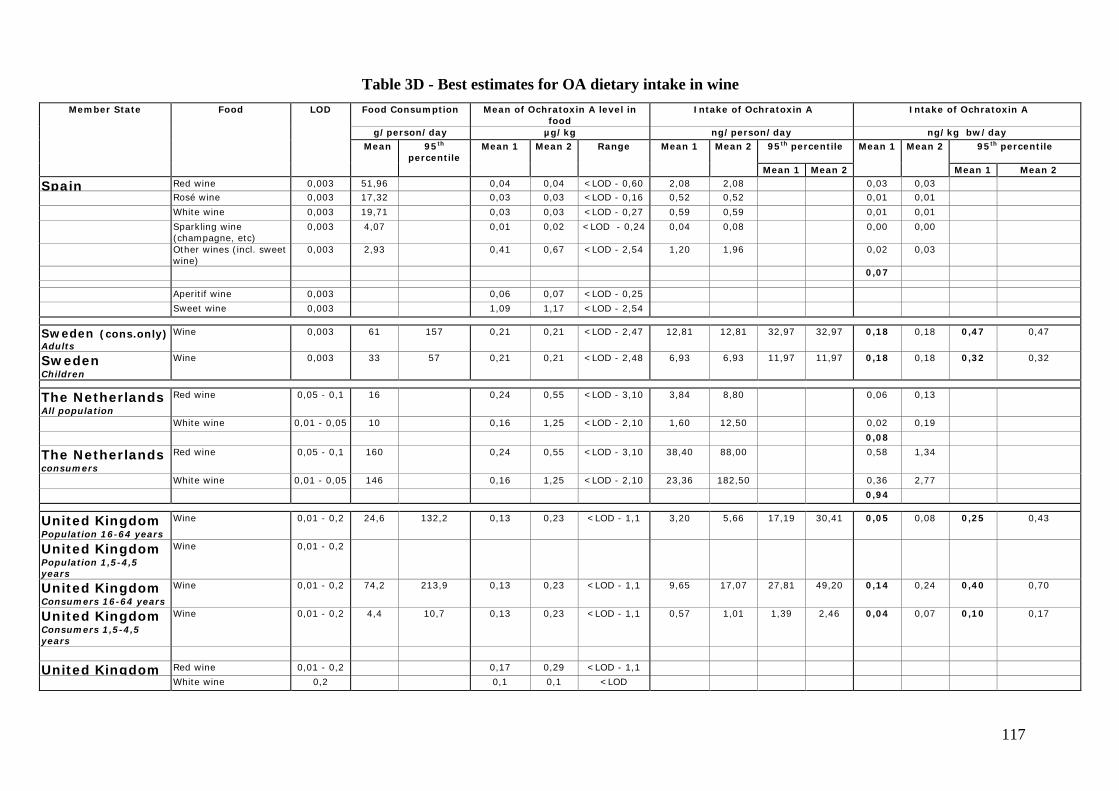
117
Table 3D - Best estimates for OA dietary intake in wineMember State Food LOD Food Consumption Mean of Ochratoxin A level in
food Intake of Ochratoxin A Intake of Ochratoxin A
g/person/day µg/kg ng/person/day ng/kg bw/day Mean 95th
percentileMean 1 Mean 2 Range Mean 1 Mean 2 95th percentile Mean 1 Mean 2 95th percentile
Mean 1 Mean 2 Mean 1 Mean 2
Spain Red wine 0,003 51,96 0,04 0,04 <LOD - 0,60 2,08 2,08 0,03 0,03Rosé wine 0,003 17,32 0,03 0,03 <LOD - 0,16 0,52 0,52 0,01 0,01
White wine 0,003 19,71 0,03 0,03 <LOD - 0,27 0,59 0,59 0,01 0,01
Sparkling wine(champagne, etc)
0,003 4,07 0,01 0,02 <LOD - 0,24 0,04 0,08 0,00 0,00
Other wines (incl. sweetwine)
0,003 2,93 0,41 0,67 <LOD - 2,54 1,20 1,96 0,02 0,03
0,07
Aperitif wine 0,003 0,06 0,07 <LOD - 0,25
Sweet wine 0,003 1,09 1,17 <LOD - 2,54
Sweden (cons.only)Adults
Wine 0,003 61 157 0,21 0,21 <LOD - 2,47 12,81 12,81 32,97 32,97 0,18 0,18 0,47 0,47
SwedenChildren
Wine 0,003 33 57 0,21 0,21 <LOD - 2,48 6,93 6,93 11,97 11,97 0,18 0,18 0,32 0,32
The NetherlandsAll population
Red wine 0,05 - 0,1 16 0,24 0,55 <LOD - 3,10 3,84 8,80 0,06 0,13
White wine 0,01 - 0,05 10 0,16 1,25 <LOD - 2,10 1,60 12,50 0,02 0,19
0,08
The Netherlandsconsumers
Red wine 0,05 - 0,1 160 0,24 0,55 <LOD - 3,10 38,40 88,00 0,58 1,34
White wine 0,01 - 0,05 146 0,16 1,25 <LOD - 2,10 23,36 182,50 0,36 2,77
0,94
United KingdomPopulation 16-64 years
Wine 0,01 - 0,2 24,6 132,2 0,13 0,23 <LOD - 1,1 3,20 5,66 17,19 30,41 0,05 0,08 0,25 0,43
United KingdomPopulation 1,5-4,5years
Wine 0,01 - 0,2
United KingdomConsumers 16-64 years
Wine 0,01 - 0,2 74,2 213,9 0,13 0,23 <LOD - 1,1 9,65 17,07 27,81 49,20 0,14 0,24 0,40 0,70
United KingdomConsumers 1,5-4,5years
Wine 0,01 - 0,2 4,4 10,7 0,13 0,23 <LOD - 1,1 0,57 1,01 1,39 2,46 0,04 0,07 0,10 0,17
United Kingdom Red wine 0,01 - 0,2 0,17 0,29 <LOD - 1,1
White wine 0,2 0,1 0,1 <LOD
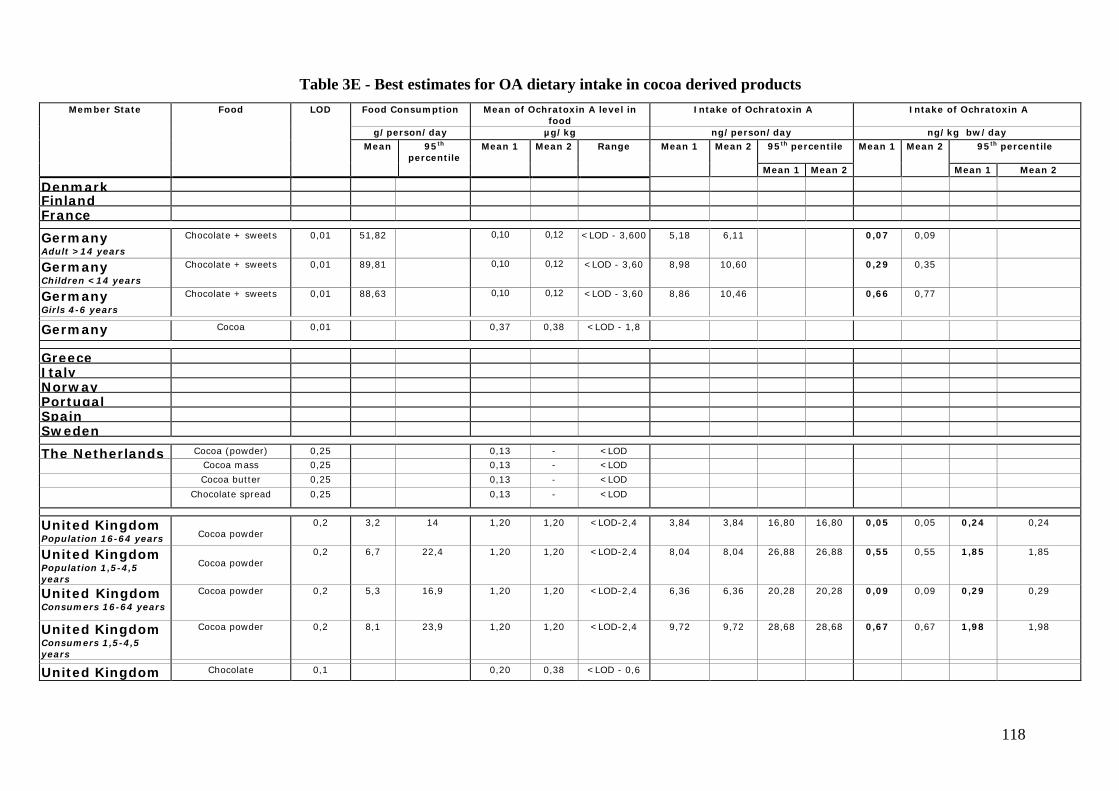
118
Table 3E - Best estimates for OA dietary intake in cocoa derived productsMember State Food LOD Food Consumption Mean of Ochratoxin A level in
food Intake of Ochratoxin A Intake of Ochratoxin A
g/person/day µg/kg ng/person/day ng/kg bw/day Mean 95th
percentileMean 1 Mean 2 Range Mean 1 Mean 2 95th percentile Mean 1 Mean 2 95th percentile
Mean 1 Mean 2 Mean 1 Mean 2
DenmarkFinlandFrance
GermanyAdult >14 years
Chocolate + sweets 0,01 51,82 0,10 0,12 <LOD - 3,600 5,18 6,11 0,07 0,09
GermanyChildren <14 years
Chocolate + sweets 0,01 89,81 0,10 0,12 <LOD - 3,60 8,98 10,60 0,29 0,35
GermanyGirls 4-6 years
Chocolate + sweets 0,01 88,63 0,10 0,12 <LOD - 3,60 8,86 10,46 0,66 0,77
Germany Cocoa 0,01 0,37 0,38 <LOD - 1,8
GreeceItalyNorwayPortugalSpainSweden
The Netherlands Cocoa (powder) 0,25 0,13 - <LODCocoa mass 0,25 0,13 - <LOD
Cocoa butter 0,25 0,13 - <LOD
Chocolate spread 0,25 0,13 - <LOD
United KingdomPopulation 16-64 years Cocoa powder
0,2 3,2 14 1,20 1,20 <LOD-2,4 3,84 3,84 16,80 16,80 0,05 0,05 0,24 0,24
United KingdomPopulation 1,5-4,5years
Cocoa powder0,2 6,7 22,4 1,20 1,20 <LOD-2,4 8,04 8,04 26,88 26,88 0,55 0,55 1,85 1,85
United KingdomConsumers 16-64 years
Cocoa powder 0,2 5,3 16,9 1,20 1,20 <LOD-2,4 6,36 6,36 20,28 20,28 0,09 0,09 0,29 0,29
United KingdomConsumers 1,5-4,5years
Cocoa powder 0,2 8,1 23,9 1,20 1,20 <LOD-2,4 9,72 9,72 28,68 28,68 0,67 0,67 1,98 1,98
United Kingdom Chocolate 0,1 0,20 0,38 <LOD - 0,6
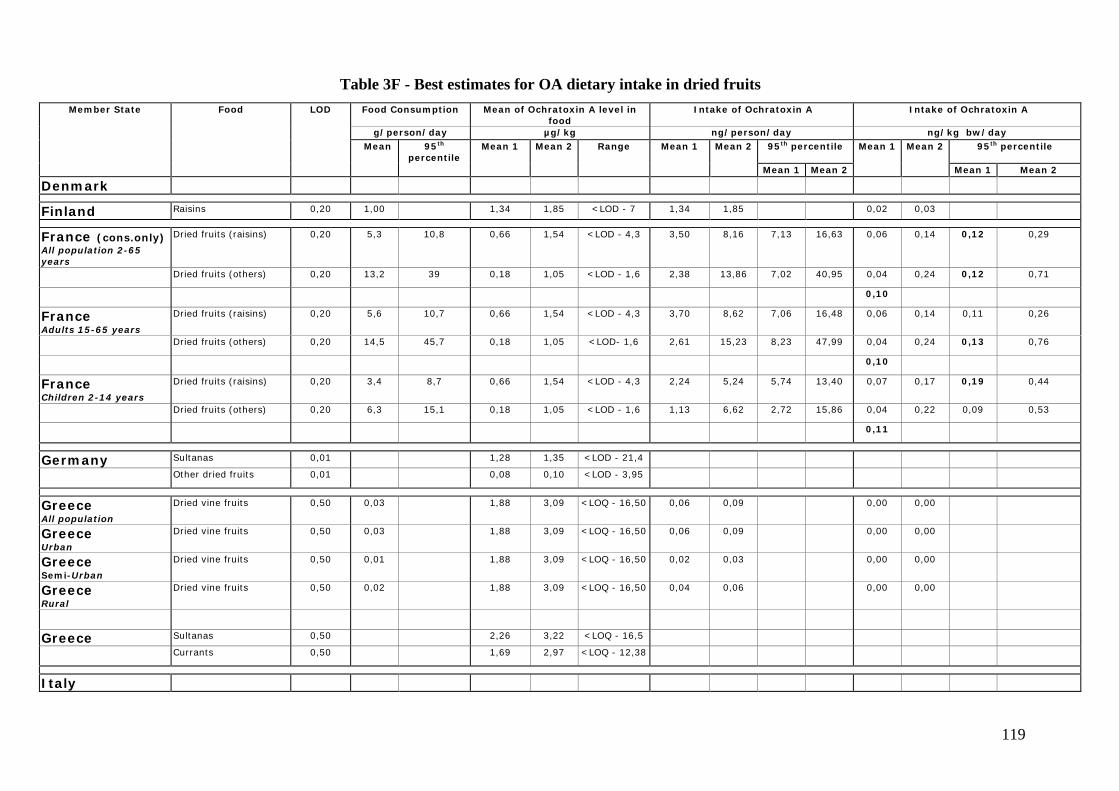
119
Table 3F - Best estimates for OA dietary intake in dried fruitsMember State Food LOD Food Consumption Mean of Ochratoxin A level in
food Intake of Ochratoxin A Intake of Ochratoxin A
g/person/day µg/kg ng/person/day ng/kg bw/day Mean 95th
percentileMean 1 Mean 2 Range Mean 1 Mean 2 95th percentile Mean 1 Mean 2 95th percentile
Mean 1 Mean 2 Mean 1 Mean 2
Denmark
Finland Raisins 0,20 1,00 1,34 1,85 <LOD - 7 1,34 1,85 0,02 0,03
France (cons.only)All population 2-65years
Dried fruits (raisins) 0,20 5,3 10,8 0,66 1,54 <LOD - 4,3 3,50 8,16 7,13 16,63 0,06 0,14 0,12 0,29
Dried fruits (others) 0,20 13,2 39 0,18 1,05 <LOD - 1,6 2,38 13,86 7,02 40,95 0,04 0,24 0,12 0,71
0,10
FranceAdults 15-65 years
Dried fruits (raisins) 0,20 5,6 10,7 0,66 1,54 <LOD - 4,3 3,70 8,62 7,06 16,48 0,06 0,14 0,11 0,26
Dried fruits (others) 0,20 14,5 45,7 0,18 1,05 <LOD- 1,6 2,61 15,23 8,23 47,99 0,04 0,24 0,13 0,76
0,10
FranceChildren 2-14 years
Dried fruits (raisins) 0,20 3,4 8,7 0,66 1,54 <LOD - 4,3 2,24 5,24 5,74 13,40 0,07 0,17 0,19 0,44
Dried fruits (others) 0,20 6,3 15,1 0,18 1,05 <LOD - 1,6 1,13 6,62 2,72 15,86 0,04 0,22 0,09 0,53
0,11
Germany Sultanas 0,01 1,28 1,35 <LOD - 21,4
Other dried fruits 0,01 0,08 0,10 <LOD - 3,95
GreeceAll population
Dried vine fruits 0,50 0,03 1,88 3,09 <LOQ - 16,50 0,06 0,09 0,00 0,00
GreeceUrban
Dried vine fruits 0,50 0,03 1,88 3,09 <LOQ - 16,50 0,06 0,09 0,00 0,00
GreeceSemi-Urban
Dried vine fruits 0,50 0,01 1,88 3,09 <LOQ - 16,50 0,02 0,03 0,00 0,00
GreeceRural
Dried vine fruits 0,50 0,02 1,88 3,09 <LOQ - 16,50 0,04 0,06 0,00 0,00
Greece Sultanas 0,50 2,26 3,22 <LOQ - 16,5
Currants 0,50 1,69 2,97 <LOQ - 12,38
Italy
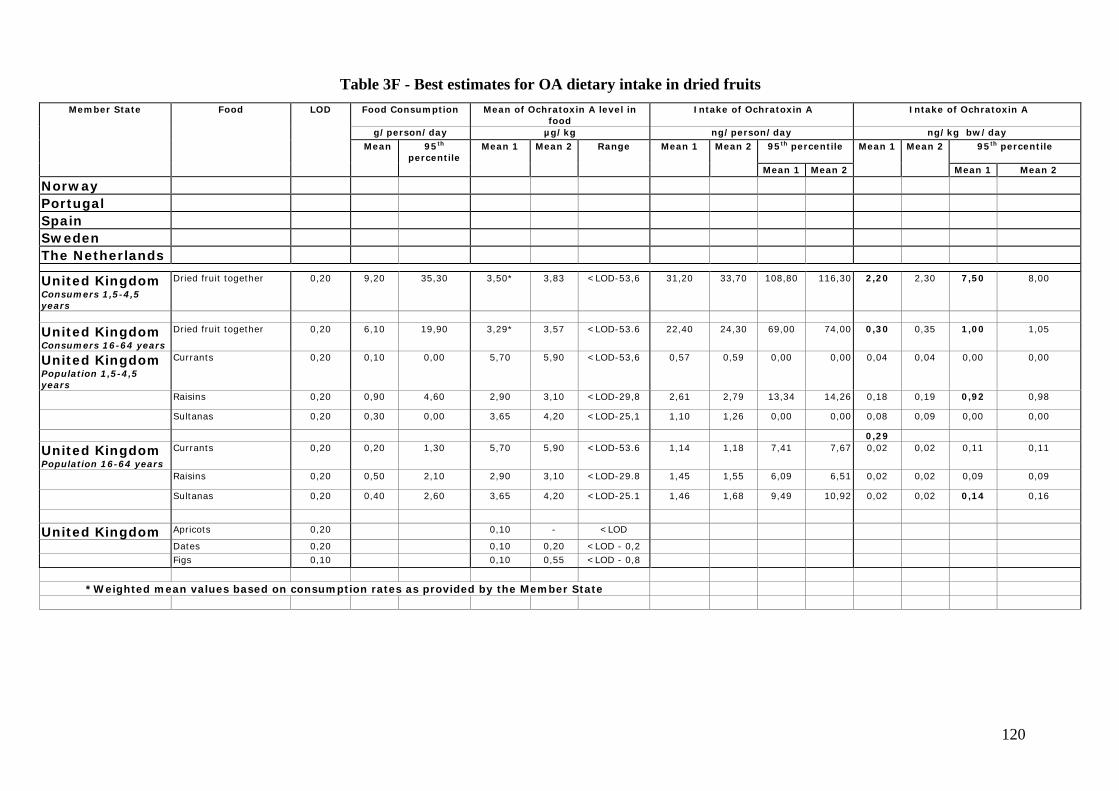
120
Table 3F - Best estimates for OA dietary intake in dried fruitsMember State Food LOD Food Consumption Mean of Ochratoxin A level in
food Intake of Ochratoxin A Intake of Ochratoxin A
g/person/day µg/kg ng/person/day ng/kg bw/day Mean 95th
percentileMean 1 Mean 2 Range Mean 1 Mean 2 95th percentile Mean 1 Mean 2 95th percentile
Mean 1 Mean 2 Mean 1 Mean 2
NorwayPortugalSpainSwedenThe Netherlands
United KingdomConsumers 1,5-4,5years
Dried fruit together 0,20 9,20 35,30 3,50* 3,83 <LOD-53,6 31,20 33,70 108,80 116,30 2,20 2,30 7,50 8,00
United KingdomConsumers 16-64 years
Dried fruit together 0,20 6,10 19,90 3,29* 3,57 <LOD-53.6 22,40 24,30 69,00 74,00 0,30 0,35 1,00 1,05
United KingdomPopulation 1,5-4,5years
Currants 0,20 0,10 0,00 5,70 5,90 <LOD-53,6 0,57 0,59 0,00 0,00 0,04 0,04 0,00 0,00
Raisins 0,20 0,90 4,60 2,90 3,10 <LOD-29,8 2,61 2,79 13,34 14,26 0,18 0,19 0,92 0,98
Sultanas 0,20 0,30 0,00 3,65 4,20 <LOD-25,1 1,10 1,26 0,00 0,00 0,08 0,09 0,00 0,00
0,29
United KingdomPopulation 16-64 years
Currants 0,20 0,20 1,30 5,70 5,90 <LOD-53.6 1,14 1,18 7,41 7,67 0,02 0,02 0,11 0,11
Raisins 0,20 0,50 2,10 2,90 3,10 <LOD-29.8 1,45 1,55 6,09 6,51 0,02 0,02 0,09 0,09
Sultanas 0,20 0,40 2,60 3,65 4,20 <LOD-25.1 1,46 1,68 9,49 10,92 0,02 0,02 0,14 0,16
United Kingdom Apricots 0,20 0,10 - <LOD
Dates 0,20 0,10 0,20 <LOD - 0,2Figs 0,10 0,10 0,55 <LOD - 0,8
*Weighted mean values based on consumption rates as provided by the Member State
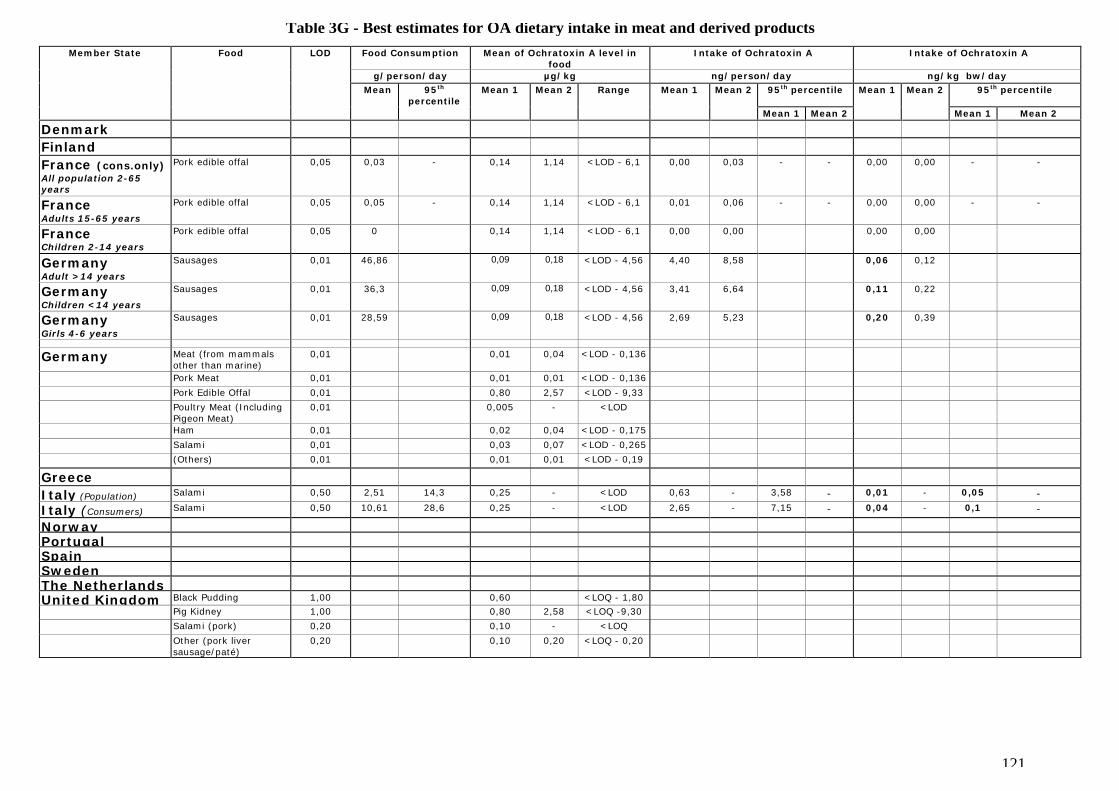
121
Table 3G - Best estimates for OA dietary intake in meat and derived productsMember State Food LOD Food Consumption Mean of Ochratoxin A level in
food Intake of Ochratoxin A Intake of Ochratoxin A
g/person/day µg/kg ng/person/day ng/kg bw/day Mean 95th
percentileMean 1 Mean 2 Range Mean 1 Mean 2 95th percentile Mean 1 Mean 2 95th percentile
Mean 1 Mean 2 Mean 1 Mean 2
DenmarkFinlandFrance (cons.only)All population 2-65years
Pork edible offal 0,05 0,03 - 0,14 1,14 <LOD - 6,1 0,00 0,03 - - 0,00 0,00 - -
FranceAdults 15-65 years
Pork edible offal 0,05 0,05 - 0,14 1,14 <LOD - 6,1 0,01 0,06 - - 0,00 0,00 - -
FranceChildren 2-14 years
Pork edible offal 0,05 0 0,14 1,14 <LOD - 6,1 0,00 0,00 0,00 0,00
GermanyAdult >14 years
Sausages 0,01 46,86 0,09 0,18 <LOD - 4,56 4,40 8,58 0,06 0,12
GermanyChildren <14 years
Sausages 0,01 36,3 0,09 0,18 <LOD - 4,56 3,41 6,64 0,11 0,22
GermanyGirls 4-6 years
Sausages 0,01 28,59 0,09 0,18 <LOD - 4,56 2,69 5,23 0,20 0,39
Germany Meat (from mammalsother than marine)
0,01 0,01 0,04 <LOD - 0,136
Pork Meat 0,01 0,01 0,01 <LOD - 0,136
Pork Edible Offal 0,01 0,80 2,57 <LOD - 9,33
Poultry Meat (IncludingPigeon Meat)
0,01 0,005 - <LOD
Ham 0,01 0,02 0,04 <LOD - 0,175
Salami 0,01 0,03 0,07 <LOD - 0,265
(Others) 0,01 0,01 0,01 <LOD - 0,19
GreeceItaly (Population) Salami 0,50 2,51 14,3 0,25 - <LOD 0,63 - 3,58 - 0,01 - 0,05 -
Italy (Consumers) Salami 0,50 10,61 28,6 0,25 - <LOD 2,65 - 7,15 - 0,04 - 0,1 -
NorwayPortugalSpainSwedenThe NetherlandsUnited Kingdom Black Pudding 1,00 0,60 <LOQ - 1,80
Pig Kidney 1,00 0,80 2,58 <LOQ -9,30
Salami (pork) 0,20 0,10 - <LOQ
Other (pork liversausage/paté)
0,20 0,10 0,20 <LOQ - 0,20
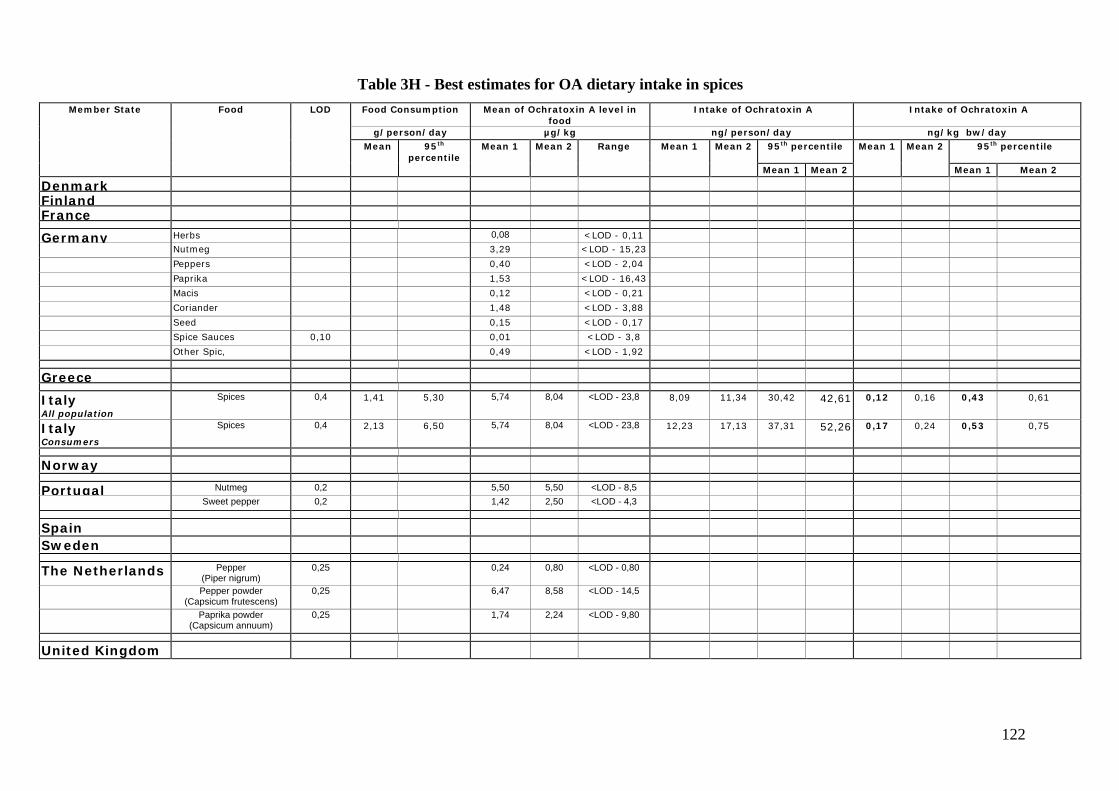
122
Table 3H - Best estimates for OA dietary intake in spicesMember State Food LOD Food Consumption Mean of Ochratoxin A level in
food Intake of Ochratoxin A Intake of Ochratoxin A
g/person/day µg/kg ng/person/day ng/kg bw/day Mean 95th
percentileMean 1 Mean 2 Range Mean 1 Mean 2 95th percentile Mean 1 Mean 2 95th percentile
Mean 1 Mean 2 Mean 1 Mean 2
DenmarkFinlandFrance
Germany Herbs 0,08 <LOD - 0,11Nutmeg 3,29 <LOD - 15,23
Peppers 0,40 <LOD - 2,04
Paprika 1,53 <LOD - 16,43
Macis 0,12 <LOD - 0,21
Coriander 1,48 <LOD - 3,88
Seed 0,15 <LOD - 0,17
Spice Sauces 0,10 0,01 <LOD - 3,8
Other Spic, 0,49 <LOD - 1,92
Greece
ItalyAll population
Spices 0,4 1,41 5,30 5,74 8,04 <LOD - 23,8 8,09 11,34 30,42 42,61 0,12 0,16 0,43 0,61
ItalyConsumers
Spices 0,4 2,13 6,50 5,74 8,04 <LOD - 23,8 12,23 17,13 37,31 52,26 0,17 0,24 0,53 0,75
Norway
Portugal Nutmeg 0,2 5,50 5,50 <LOD - 8,5
Sweet pepper 0,2 1,42 2,50 <LOD - 4,3
SpainSweden
The Netherlands Pepper(Piper nigrum)
0,25 0,24 0,80 <LOD - 0,80
Pepper powder(Capsicum frutescens)
0,25 6,47 8,58 <LOD - 14,5
Paprika powder(Capsicum annuum)
0,25 1,74 2,24 <LOD - 9,80
United Kingdom
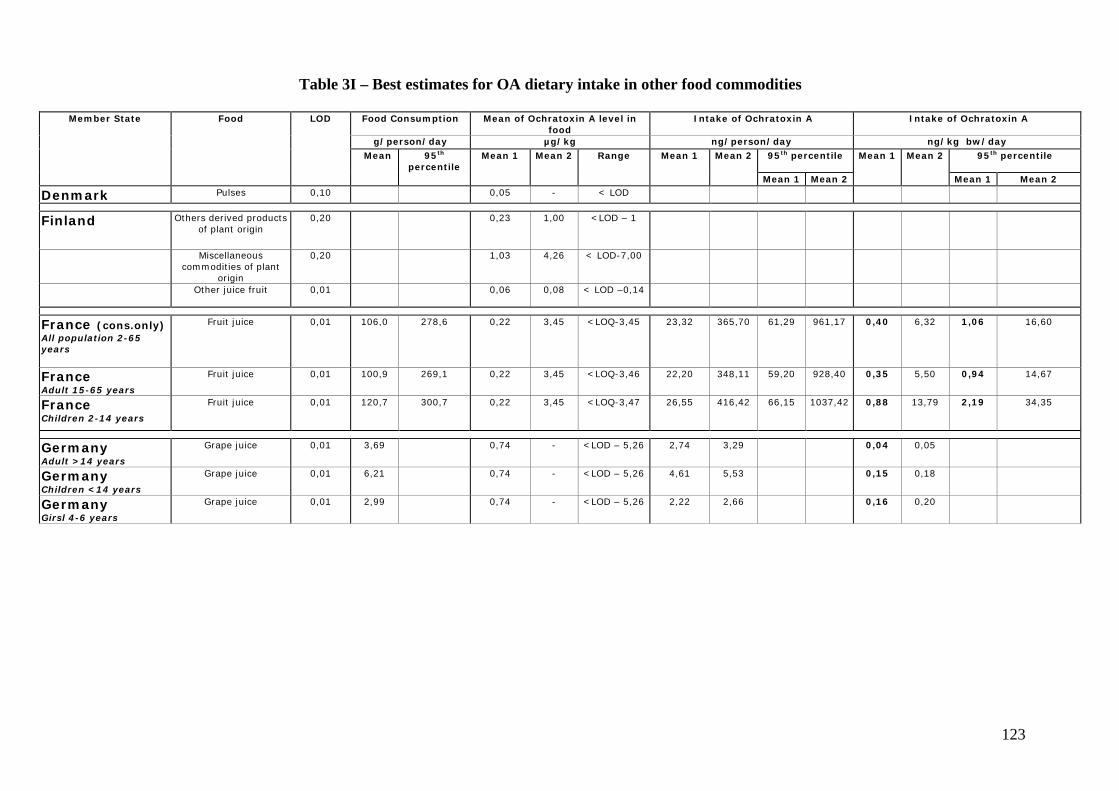
123
Table 3I – Best estimates for OA dietary intake in other food commodities
Member State Food LOD Food Consumption Mean of Ochratoxin A level infood
Intake of Ochratoxin A Intake of Ochratoxin A
g/person/day µg/kg ng/person/day ng/kg bw/day Mean 95th
percentileMean 1 Mean 2 Range Mean 1 Mean 2 95th percentile Mean 1 Mean 2 95th percentile
Mean 1 Mean 2 Mean 1 Mean 2
Denmark Pulses 0,10 0,05 - < LOD
Finland Others derived productsof plant origin
0,20 0,23 1,00 <LOD – 1
Miscellaneouscommodities of plant
origin
0,20 1,03 4,26 < LOD-7,00
Other juice fruit 0,01 0,06 0,08 < LOD –0,14
France (cons.only)All population 2-65years
Fruit juice 0,01 106,0 278,6 0,22 3,45 <LOQ-3,45 23,32 365,70 61,29 961,17 0,40 6,32 1,06 16,60
FranceAdult 15-65 years
Fruit juice 0,01 100,9 269,1 0,22 3,45 <LOQ-3,46 22,20 348,11 59,20 928,40 0,35 5,50 0,94 14,67
FranceChildren 2-14 years
Fruit juice 0,01 120,7 300,7 0,22 3,45 <LOQ-3,47 26,55 416,42 66,15 1037,42 0,88 13,79 2,19 34,35
GermanyAdult >14 years
Grape juice 0,01 3,69 0,74 - <LOD – 5,26 2,74 3,29 0,04 0,05
GermanyChildren <14 years
Grape juice 0,01 6,21 0,74 - <LOD – 5,26 4,61 5,53 0,15 0,18
GermanyGirsl 4-6 years
Grape juice 0,01 2,99 0,74 - <LOD – 5,26 2,22 2,66 0,16 0,20
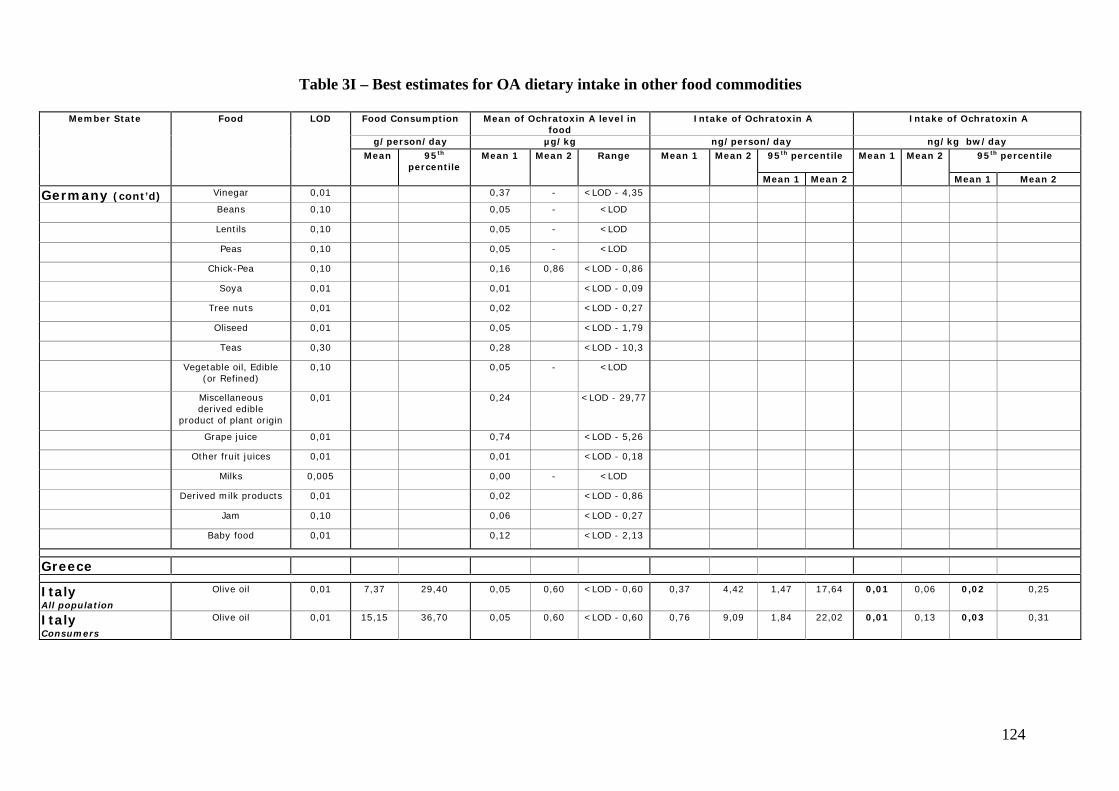
124
Table 3I – Best estimates for OA dietary intake in other food commodities
Member State Food LOD Food Consumption Mean of Ochratoxin A level infood
Intake of Ochratoxin A Intake of Ochratoxin A
g/person/day µg/kg ng/person/day ng/kg bw/day Mean 95th
percentileMean 1 Mean 2 Range Mean 1 Mean 2 95th percentile Mean 1 Mean 2 95th percentile
Mean 1 Mean 2 Mean 1 Mean 2
Germany (cont’d) Vinegar 0,01 0,37 - <LOD - 4,35
Beans 0,10 0,05 - <LOD
Lentils 0,10 0,05 - <LOD
Peas 0,10 0,05 - <LOD
Chick-Pea 0,10 0,16 0,86 <LOD - 0,86
Soya 0,01 0,01 <LOD - 0,09
Tree nuts 0,01 0,02 <LOD - 0,27
Oliseed 0,01 0,05 <LOD - 1,79
Teas 0,30 0,28 <LOD - 10,3
Vegetable oil, Edible(or Refined)
0,10 0,05 - <LOD
Miscellaneousderived edible
product of plant origin
0,01 0,24 <LOD - 29,77
Grape juice 0,01 0,74 <LOD - 5,26
Other fruit juices 0,01 0,01 <LOD - 0,18
Milks 0,005 0,00 - <LOD
Derived milk products 0,01 0,02 <LOD - 0,86
Jam 0,10 0,06 <LOD - 0,27
Baby food 0,01 0,12 <LOD - 2,13
Greece
ItalyAll population
Olive oil 0,01 7,37 29,40 0,05 0,60 <LOD - 0,60 0,37 4,42 1,47 17,64 0,01 0,06 0,02 0,25
ItalyConsumers
Olive oil 0,01 15,15 36,70 0,05 0,60 <LOD - 0,60 0,76 9,09 1,84 22,02 0,01 0,13 0,03 0,31

125
Table 3I – Best estimates for OA dietary intake in other food commodities
Member State Food LOD Food Consumption Mean of Ochratoxin A level infood
Intake of Ochratoxin A Intake of Ochratoxin A
g/person/day µg/kg ng/person/day ng/kg bw/day Mean 95th
percentileMean 1 Mean 2 Range Mean 1 Mean 2 95th percentile Mean 1 Mean 2 95th percentile
Mean 1 Mean 2 Mean 1 Mean 2
Norway(cons.only)All population
Other fruit juice 0,0005 27 118 0,01 0,01 0,002 - 0,02 0,27 0,27 1,18 1,18 0,00 0,00 0,02 0,02
Milk 0,1 - 0,3 463 1113 0,01 - <LOD - 0,06 4,63 - 11,13 - 0,07 - 0,16 -
Derived milk product 0,01 - 0,03 24 71 0,01 0,02 <LOQ - 0,12 0,24 0,48 0,71 1,42 0,00 0,01 0,01 0,02
0,07
NorwayMen
Other fruit juice 0,0005 30 120 0,01 0,01 0,002 - 0,02 0,30 0,30 1,20 1,20 0,00 0,00 0,02 0,02
Milk 0,1 - 0,3 549 1231 0,01 - <LOD - 0,06 5,49 - 12,31 - 0,07 - 0,16 -
Derived milk product 0,01 - 0,03 26 71 0,01 0,02 <LOQ - 0,12 0,26 0,52 0,71 1,42 0,00 0,01 0,01 0,02
0,07
NorwayWomen
Other fruit juice 0,0005 25 88 0,01 0,01 0,002 - 0,02 0,25 0,25 0,88 0,88 0,00 0,00 0,01 0,01
Milk 0,1 - 0,3 384 907 0,01 - <LOD - 0,06 3,84 - 9,07 - 0,06 - 0,14 -
Derived milk product 0,01 - 0,03 22 57 0,01 0,02 <LOQ - 0,12 0,22 0,44 0,57 1,14 0,00 0,01 0,01 0,02
0,06
Fruit juice 0,0005 -0,001
0,001 0,004 <LOD - 0,006
Grape juice 0,0010 0,13 0,14 <LOD - 0,56
Portugal
Spain Grape juice 0,003 3,85 0,04 0,04 0,15 - 0,18 0,15 0,15 0,00 0,00
Sweden cons.only)Adults
Pulses 0,10 12 27 0,14 1,16 <LOD - 1,90 1,68 13,92 3,78 31,32 0,02 0,20 0,05 0,45
Milks 0,01 420 960 0,008 - <LOD - 0,03 3,36 - 7,68 - 0,05 - 0,11 -
0,07
SwedenChildren
Pulses 0,10 12 25 0,14 1,16 <LOD - 1,90 1,68 13,92 3,50 29,00 0,04 0,37 0,09 0,76
Milks 0,01 710 1300 0,008 0,008 <LOD - 0,03 5,68 5,68 10,40 10,40 0,15 0,15 0,27 0,27
0,19
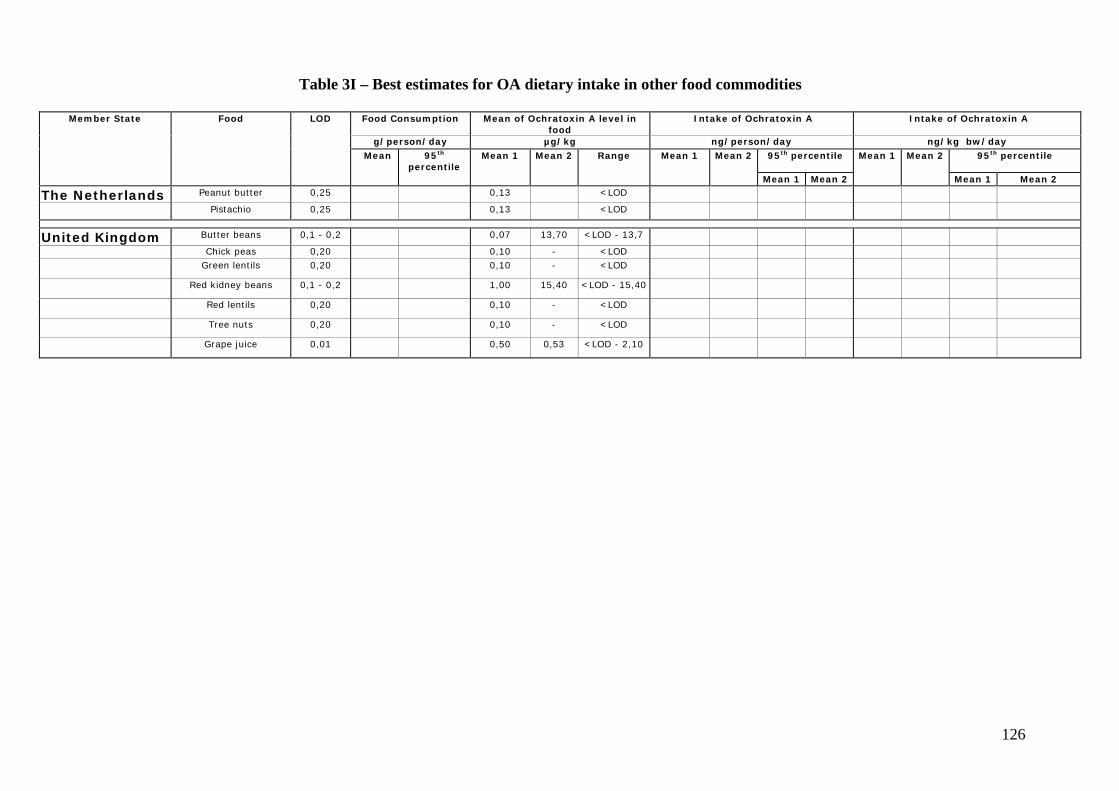
126
Table 3I – Best estimates for OA dietary intake in other food commodities
Member State Food LOD Food Consumption Mean of Ochratoxin A level infood
Intake of Ochratoxin A Intake of Ochratoxin A
g/person/day µg/kg ng/person/day ng/kg bw/day Mean 95th
percentileMean 1 Mean 2 Range Mean 1 Mean 2 95th percentile Mean 1 Mean 2 95th percentile
Mean 1 Mean 2 Mean 1 Mean 2
The Netherlands Peanut butter 0,25 0,13 <LOD
Pistachio 0,25 0,13 <LOD
United Kingdom Butter beans 0,1 - 0,2 0,07 13,70 <LOD - 13,7
Chick peas 0,20 0,10 - <LODGreen lentils 0,20 0,10 - <LOD
Red kidney beans 0,1 - 0,2 1,00 15,40 <LOD - 15,40
Red lentils 0,20 0,10 - <LOD
Tree nuts 0,20 0,10 - <LOD
Grape juice 0,01 0,50 0,53 <LOD - 2,10
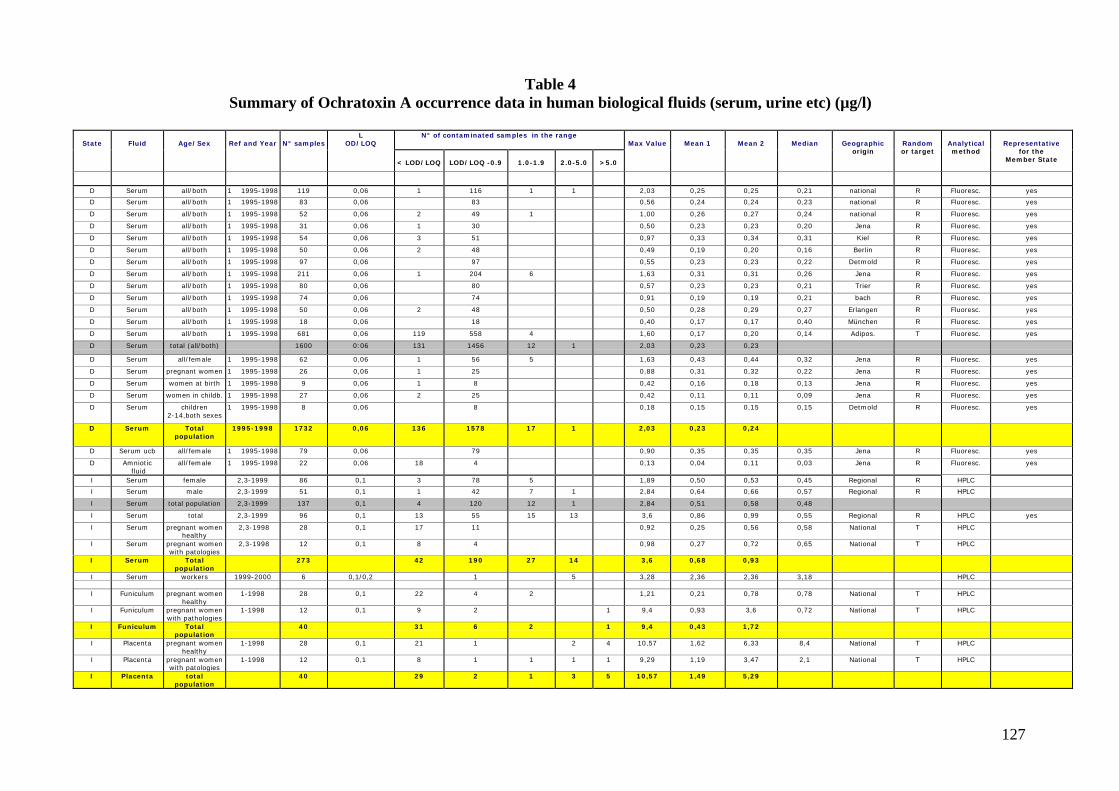
127
Table 4Summary of Ochratoxin A occurrence data in human biological fluids (serum, urine etc) (µg/l)
N° of contaminated samples in the rangeState Fluid Age/Sex Ref and Year N° samples
LOD/LOQ
< LOD/LOQ LOD/LOQ -0.9 1.0-1.9 2.0-5.0 >5.0
Max Value Mean 1 Mean 2 Median Geographicorigin
Randomor target
Analyticalmethod
Representativefor the
Member State
D Serum all/both 1 1995-1998 119 0,06 1 116 1 1 2,03 0,25 0,25 0,21 national R Fluoresc. yes
D Serum all/both 1 1995-1998 83 0,06 83 0,56 0,24 0,24 0,23 national R Fluoresc. yes
D Serum all/both 1 1995-1998 52 0,06 2 49 1 1,00 0,26 0,27 0,24 national R Fluoresc. yes
D Serum all/both 1 1995-1998 31 0,06 1 30 0,50 0,23 0,23 0,20 Jena R Fluoresc. yes
D Serum all/both 1 1995-1998 54 0,06 3 51 0,97 0,33 0,34 0,31 Kiel R Fluoresc. yes
D Serum all/both 1 1995-1998 50 0,06 2 48 0,49 0,19 0,20 0,16 Berlin R Fluoresc. yes
D Serum all/both 1 1995-1998 97 0,06 97 0,55 0,23 0,23 0,22 Detmold R Fluoresc. yes
D Serum all/both 1 1995-1998 211 0,06 1 204 6 1,63 0,31 0,31 0,26 Jena R Fluoresc. yes
D Serum all/both 1 1995-1998 80 0,06 80 0,57 0,23 0,23 0,21 Trier R Fluoresc. yes
D Serum all/both 1 1995-1998 74 0,06 74 0,91 0,19 0,19 0,21 bach R Fluoresc. yes
D Serum all/both 1 1995-1998 50 0,06 2 48 0,50 0,28 0,29 0,27 Erlangen R Fluoresc. yes
D Serum all/both 1 1995-1998 18 0,06 18 0,40 0,17 0,17 0,40 München R Fluoresc. yes
D Serum all/both 1 1995-1998 681 0,06 119 558 4 1,60 0,17 0,20 0,14 Adipos. T Fluoresc. yes
D Serum total (all/both) 1600 0:06 131 1456 12 1 2,03 0,23 0,23
D Serum all/female 1 1995-1998 62 0,06 1 56 5 1,63 0,43 0,44 0,32 Jena R Fluoresc. yes
D Serum pregnant women 1 1995-1998 26 0,06 1 25 0,88 0,31 0,32 0,22 Jena R Fluoresc. yes
D Serum women at birth 1 1995-1998 9 0,06 1 8 0,42 0,16 0,18 0,13 Jena R Fluoresc. yes
D Serum women in childb. 1 1995-1998 27 0,06 2 25 0,42 0,11 0,11 0,09 Jena R Fluoresc. yes
D Serum children2-14,both sexes
1 1995-1998 8 0,06 8 0,18 0,15 0,15 0,15 Detmold R Fluoresc. yes
D Serum Totalpopulation
1995-1998 1732 0,06 136 1578 17 1 2,03 0,23 0,24
D Serum ucb all/female 1 1995-1998 79 0,06 79 0,90 0,35 0,35 0,35 Jena R Fluoresc. yes
D Amniotic fluid
all/female 1 1995-1998 22 0,06 18 4 0,13 0,04 0,11 0,03 Jena R Fluoresc. yes
I Serum female 2,3-1999 86 0,1 3 78 5 1,89 0,50 0,53 0,45 Regional R HPLC
I Serum male 2,3-1999 51 0,1 1 42 7 1 2,84 0,64 0,66 0,57 Regional R HPLC
I Serum total population 2,3-1999 137 0,1 4 120 12 1 2,84 0,51 0,58 0,48
I Serum total 2,3-1999 96 0,1 13 55 15 13 3,6 0,86 0,99 0,55 Regional R HPLC yes
I Serum pregnant womenhealthy
2,3-1998 28 0,1 17 11 0,92 0,25 0,56 0,58 National T HPLC
I Serum pregnant womenwith patologies
2,3-1998 12 0,1 8 4 0,98 0,27 0,72 0,65 National T HPLC
I Serum Totalpopulation
273 42 190 27 14 3,6 0,68 0,93
I Serum workers 1999-2000 6 0,1/0,2 1 5 3,28 2,36 2,36 3,18 HPLC
I Funiculum pregnant womenhealthy
1-1998 28 0,1 22 4 2 1,21 0,21 0,78 0,78 National T HPLC
I Funiculum pregnant womenwith pathologies
1-1998 12 0,1 9 2 1 9,4 0,93 3,6 0,72 National T HPLC
I Funiculum Totalpopulation
40 31 6 2 1 9,4 0,43 1,72
I Placenta pregnant womenhealthy
1-1998 28 0,1 21 1 2 4 10,57 1,62 6,33 8,4 National T HPLC
I Placenta pregnant womenwith patologies
1-1998 12 0,1 8 1 1 1 1 9,29 1,19 3,47 2,1 National T HPLC
I Placenta totalpopulation
40 29 2 1 3 5 10,57 1,49 5,29
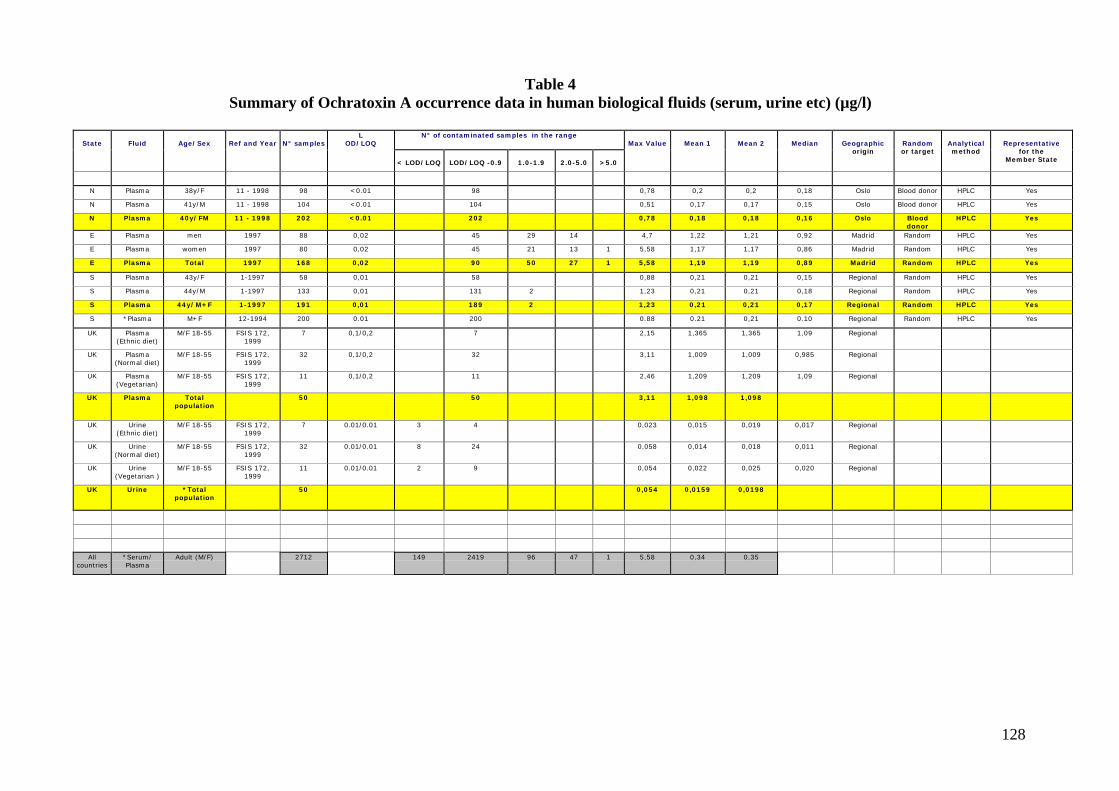
128
Table 4Summary of Ochratoxin A occurrence data in human biological fluids (serum, urine etc) (µg/l)
N° of contaminated samples in the rangeState Fluid Age/Sex Ref and Year N° samples
LOD/LOQ
< LOD/LOQ LOD/LOQ -0.9 1.0-1.9 2.0-5.0 >5.0
Max Value Mean 1 Mean 2 Median Geographicorigin
Randomor target
Analyticalmethod
Representativefor the
Member State
N Plasma 38y/F 11 - 1998 98 <0.01 98 0,78 0,2 0,2 0,18 Oslo Blood donor HPLC Yes
N Plasma 41y/M 11 - 1998 104 <0.01 104 0,51 0,17 0,17 0,15 Oslo Blood donor HPLC Yes
N Plasma 40y/FM 11 - 1998 202 <0.01 202 0,78 0,18 0,18 0,16 Oslo Blooddonor
HPLC Yes
E Plasma men 1997 88 0,02 45 29 14 4,7 1,22 1,21 0,92 Madrid Random HPLC Yes
E Plasma women 1997 80 0,02 45 21 13 1 5,58 1,17 1,17 0,86 Madrid Random HPLC Yes
E Plasma Total 1997 168 0,02 90 50 27 1 5,58 1,19 1,19 0,89 Madrid Random HPLC Yes
S Plasma 43y/F 1-1997 58 0,01 58 0,88 0,21 0,21 0,15 Regional Random HPLC Yes
S Plasma 44y/M 1-1997 133 0,01 131 2 1,23 0,21 0,21 0,18 Regional Random HPLC Yes
S Plasma 44y/M+F 1-1997 191 0,01 189 2 1,23 0,21 0,21 0,17 Regional Random HPLC Yes
S *Plasma M+F 12-1994 200 0.01 200 0.88 0.21 0,21 0.10 Regional Random HPLC Yes
UK Plasma(Ethnic diet)
M/F 18-55 FSIS 172,1999
7 0,1/0,2 7 2,15 1,365 1,365 1,09 Regional
UK Plasma(Normal diet)
M/F 18-55 FSIS 172,1999
32 0,1/0,2 32 3,11 1,009 1,009 0,985 Regional
UK Plasma(Vegetarian)
M/F 18-55 FSIS 172,1999
11 0,1/0,2 11 2,46 1,209 1,209 1,09 Regional
UK Plasma Totalpopulation
50 50 3,11 1,098 1,098
UK Urine(Ethnic diet)
M/F 18-55 FSIS 172,1999
7 0.01/0.01 3 4 0,023 0,015 0,019 0,017 Regional
UK Urine(Normal diet)
M/F 18-55 FSIS 172,1999
32 0.01/0.01 8 24 0,058 0,014 0,018 0,011 Regional
UK Urine(Vegetarian )
M/F 18-55 FSIS 172,1999
11 0.01/0.01 2 9 0,054 0,022 0,025 0,020 Regional
UK Urine *Totalpopulation
50 0,054 0,0159 0,0198
Allcountries
*Serum/Plasma
Adult (M/F) 2712 149 2419 96 47 1 5,58 0,34 0,35
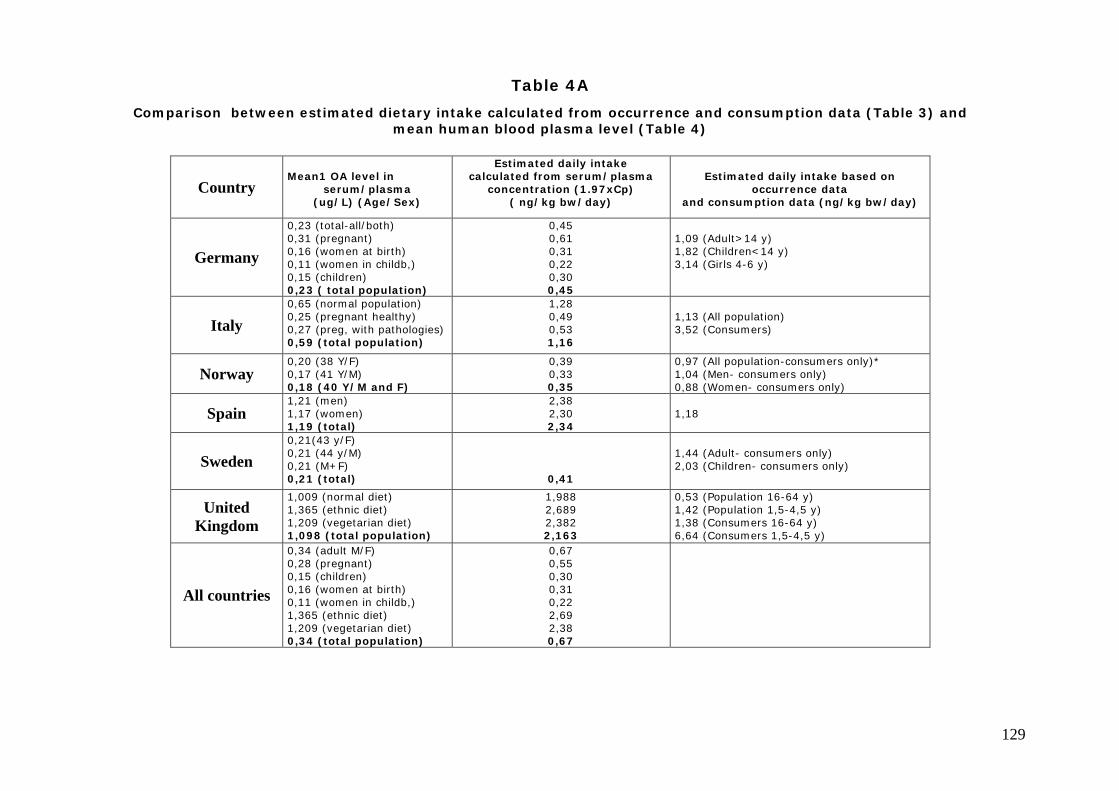
129
Table 4A
Comparison between estimated dietary intake calculated from occurrence and consumption data (Table 3) andmean human blood plasma level (Table 4)
CountryMean1 OA level in
serum/plasma(ug/L) (Age/Sex)
Estimated daily intakecalculated from serum/plasma
concentration (1.97xCp)( ng/kg bw/day)
Estimated daily intake based onoccurrence data
and consumption data (ng/kg bw/day)
Germany
0,23 (total-all/both)0,31 (pregnant)0,16 (women at birth)0,11 (women in childb,)0,15 (children)0,23 ( total population)
0,450,610,310,220,300,45
1,09 (Adult>14 y)1,82 (Children<14 y)3,14 (Girls 4-6 y)
Italy0,65 (normal population)0,25 (pregnant healthy)0,27 (preg, with pathologies)0,59 (total population)
1,280,490,531,16
1,13 (All population)3,52 (Consumers)
Norway0,20 (38 Y/F)0,17 (41 Y/M)0,18 (40 Y/M and F)
0,390,330,35
0,97 (All population-consumers only)*1,04 (Men- consumers only)0,88 (Women- consumers only)
Spain1,21 (men)1,17 (women)1,19 (total)
2,382,302,34
1,18
Sweden0,21(43 y/F)0,21 (44 y/M)0,21 (M+F)0,21 (total) 0,41
1,44 (Adult- consumers only)2,03 (Children- consumers only)
UnitedKingdom
1,009 (normal diet)1,365 (ethnic diet)1,209 (vegetarian diet)1,098 (total population)
1,9882,6892,3822,163
0,53 (Population 16-64 y)1,42 (Population 1,5-4,5 y)1,38 (Consumers 16-64 y)6,64 (Consumers 1,5-4,5 y)
All countries
0,34 (adult M/F)0,28 (pregnant)0,15 (children)0,16 (women at birth)0,11 (women in childb,)1,365 (ethnic diet)1,209 (vegetarian diet)0,34 (total population)
0,670,550,300,310,222,692,380,67
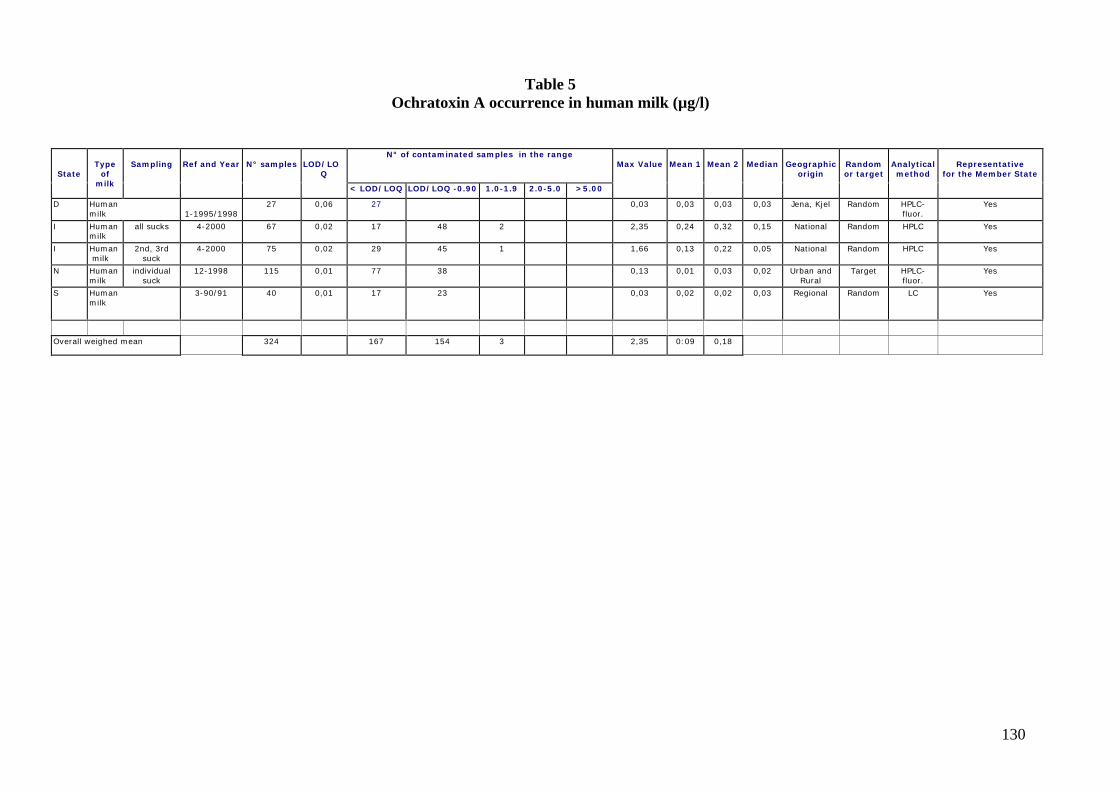
130
Table 5Ochratoxin A occurrence in human milk (µg/l)
N° of contaminated samples in the range
StateType
ofmilk
Sampling Ref and Year N° samples LOD/LOQ
< LOD/LOQ LOD/LOQ -0.90 1.0-1.9 2.0-5.0 >5.00
Max Value Mean 1 Mean 2 Median Geographicorigin
Randomor target
Analyticalmethod
Representativefor the Member State
D Humanmilk 1-1995/1998
27 0,06 27 0,03 0,03 0,03 0,03 Jena, Kjel Random HPLC-fluor.
Yes
I Humanmilk
all sucks 4-2000 67 0,02 17 48 2 2,35 0,24 0,32 0,15 National Random HPLC Yes
I Human milk
2nd, 3rdsuck
4-2000 75 0,02 29 45 1 1,66 0,13 0,22 0,05 National Random HPLC Yes
N Humanmilk
individualsuck
12-1998 115 0,01 77 38 0,13 0,01 0,03 0,02 Urban andRural
Target HPLC-fluor.
Yes
S Humanmilk
3-90/91 40 0,01 17 23 0,03 0,02 0,02 0,03 Regional Random LC Yes
Overall weighed mean 324 167 154 3 2,35 0:09 0,18
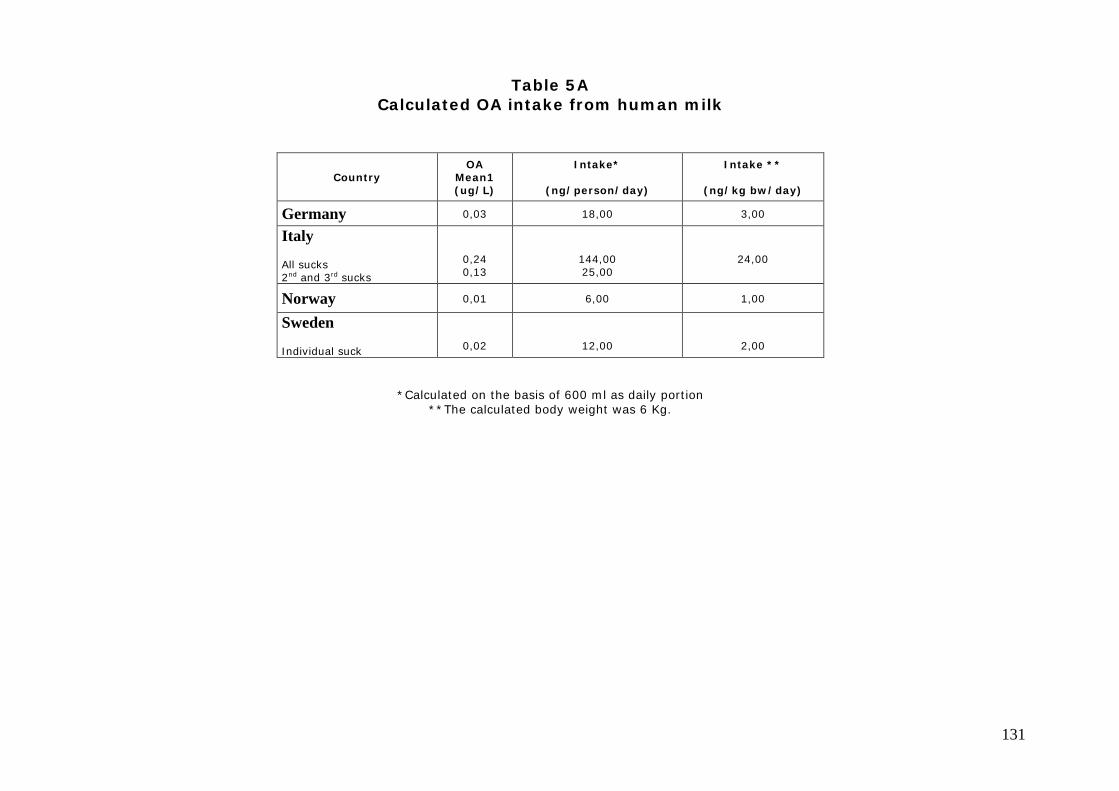
131
Table 5ACalculated OA intake from human milk
CountryOA
Mean1(ug/L)
Intake*
(ng/person/day)
Intake **
(ng/kg bw/day)
Germany 0,03 18,00 3,00
Italy
All sucks2nd and 3rd sucks
0,240,13
144,0025,00
24,00
Norway 0,01 6,00 1,00
Sweden
Individual suck 0,02 12,00 2,00
*Calculated on the basis of 600 ml as daily portion**The calculated body weight was 6 Kg.
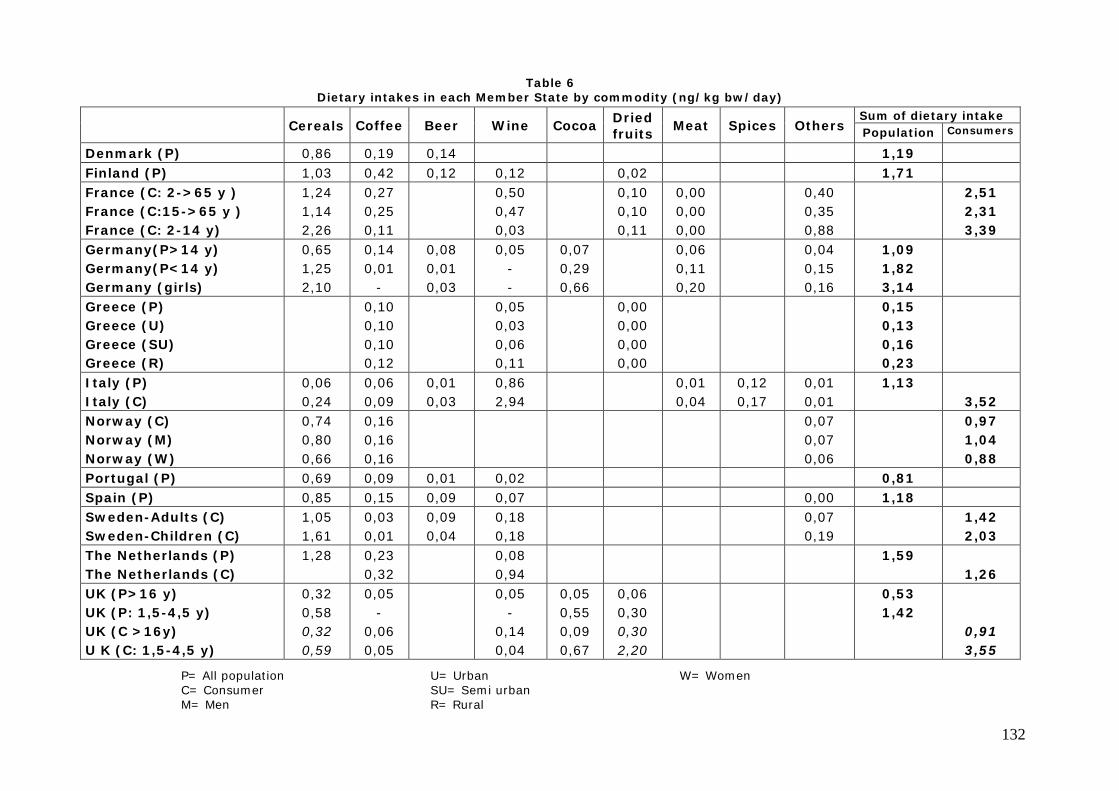
132
Table 6Dietary intakes in each Member State by commodity (ng/kg bw/day)
Sum of dietary intakeCereals Coffee Beer Wine Cocoa Dried
fruitsMeat Spices Others Population Consumers
Denmark (P) 0,86 0,19 0,14 1,19Finland (P) 1,03 0,42 0,12 0,12 0,02 1,71France (C: 2->65 y )France (C:15->65 y )France (C: 2-14 y)
1,241,142,26
0,270,250,11
0,500,470,03
0,100,100,11
0,000,000,00
0,400,350,88
2,512,313,39
Germany(P>14 y)Germany(P<14 y)Germany (girls)
0,651,252,10
0,140,01
-
0,080,010,03
0,05--
0,070,290,66
0,060,110,20
0,040,150,16
1,091,823,14
Greece (P)Greece (U)Greece (SU)Greece (R)
0,100,100,100,12
0,050,030,060,11
0,000,000,000,00
0,150,130,160,23
Italy (P)Italy (C)
0,060,24
0,060,09
0,010,03
0,862,94
0,010,04
0,120,17
0,010,01
1,133,52
Norway (C)Norway (M)Norway (W)
0,740,800,66
0,160,160,16
0,070,070,06
0,971,040,88
Portugal (P) 0,69 0,09 0,01 0,02 0,81Spain (P) 0,85 0,15 0,09 0,07 0,00 1,18Sweden-Adults (C)Sweden-Children (C)
1,051,61
0,030,01
0,090,04
0,180,18
0,070,19
1,422,03
The Netherlands (P)The Netherlands (C)
1,28 0,230,32
0,080,94
1,591,26
UK (P>16 y)UK (P: 1,5-4,5 y)UK (C >16y)U K (C: 1,5-4,5 y)
0,320,580,320,59
0,05-
0,060,05
0,05-
0,140,04
0,050,550,090,67
0,060,300,302,20
0,531,42
0,913,55
P= All population U= Urban W= WomenC= Consumer SU= Semi urbanM= Men R= Rural
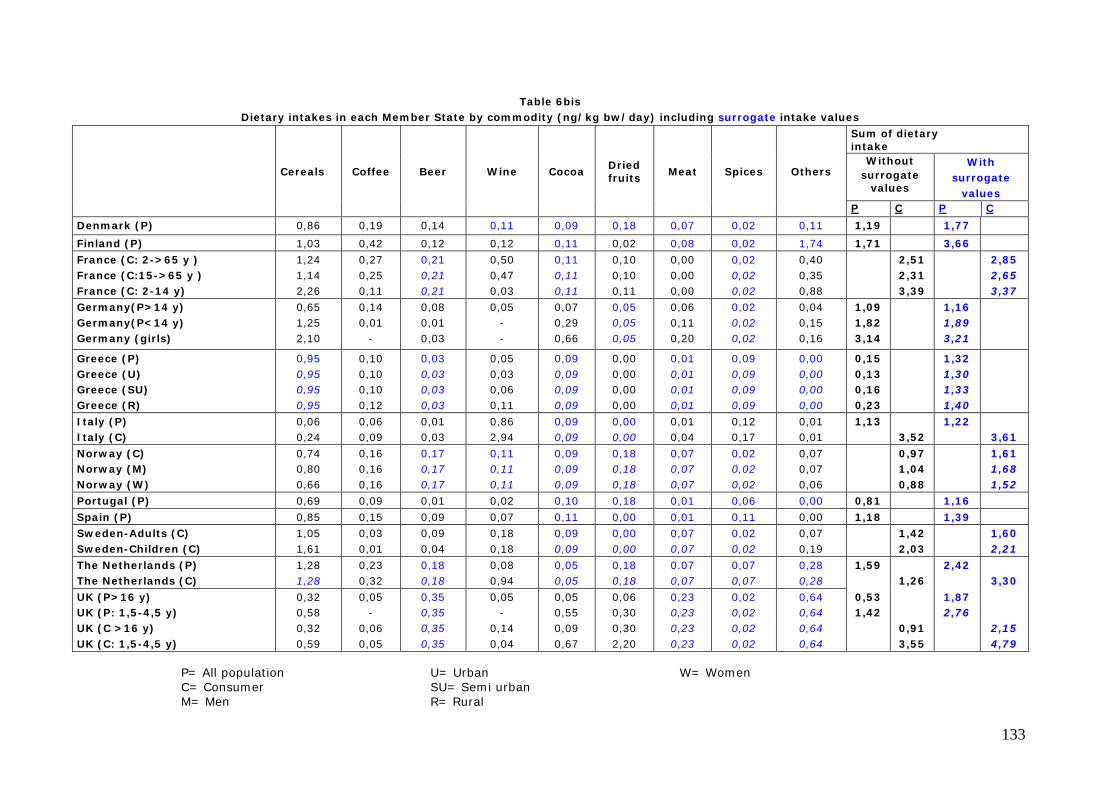
133
Table 6bisDietary intakes in each Member State by commodity (ng/kg bw/day) including surrogate intake values
Sum of dietaryintake
Withoutsurrogate
values
Withsurrogate
values
Cereals Coffee Beer Wine CocoaDriedfruits Meat Spices Others
P C P C
Denmark (P) 0,86 0,19 0,14 0,11 0,09 0,18 0,07 0,02 0,11 1,19 1,77
Finland (P) 1,03 0,42 0,12 0,12 0,11 0,02 0,08 0,02 1,74 1,71 3,66
France (C: 2->65 y )France (C:15->65 y )France (C: 2-14 y)
1,241,142,26
0,270,250,11
0,210,210,21
0,500,470,03
0,110,110,11
0,100,100,11
0,000,000,00
0,020,020,02
0,400,350,88
2,512,313,39
2,852,653,37
Germany(P>14 y)Germany(P<14 y)Germany (girls)
0,651,252,10
0,140,01
-
0,080,010,03
0,05--
0,070,290,66
0,050,050,05
0,060,110,20
0,020,020,02
0,040,150,16
1,091,823,14
1,161,893,21
Greece (P)Greece (U)Greece (SU)Greece (R)
0,950,950,950,95
0,100,100,100,12
0,030,030,030,03
0,050,030,060,11
0,090,090,090,09
0,000,000,000,00
0,010,010,010,01
0,090,090,090,09
0,000,000,000,00
0,150,130,160,23
1,321,301,331,40
Italy (P)Italy (C)
0,060,24
0,060,09
0,010,03
0,862,94
0,090,09
0,000,00
0,010,04
0,120,17
0,010,01
1,133,52
1,223,61
Norway (C)Norway (M)Norway (W)
0,740,800,66
0,160,160,16
0,170,170,17
0,110,110,11
0,090,090,09
0,180,180,18
0,070,070,07
0,020,020,02
0,070,070,06
0,971,040,88
1,611,681,52
Portugal (P) 0,69 0,09 0,01 0,02 0,10 0,18 0,01 0,06 0,00 0,81 1,16
Spain (P) 0,85 0,15 0,09 0,07 0,11 0,00 0,01 0,11 0,00 1,18 1,39Sweden-Adults (C)Sweden-Children (C)
1,051,61
0,030,01
0,090,04
0,180,18
0,090,09
0,000,00
0,070,07
0,020,02
0,070,19
1,422,03
1,602,21
The Netherlands (P)The Netherlands (C)
1,281,28
0,230,32
0,180,18
0,080,94
0,050,05
0,180,18
0.070,07
0,070,07
0,280,28
1,591,26
2,423,30
UK (P>16 y)UK (P: 1,5-4,5 y)UK (C >16 y)UK (C: 1,5-4,5 y)
0,320,580,320,59
0,05-
0,060,05
0,350,350,350,35
0,05-
0,140,04
0,050,550,090,67
0,060,300,302,20
0,230,230,230,23
0,020,020,020,02
0,640,640,640,64
0,531,42
0,913,55
1,872,76
2,154,79
P= All population U= Urban W= WomenC= Consumer SU= Semi urbanM= Men R= Rural
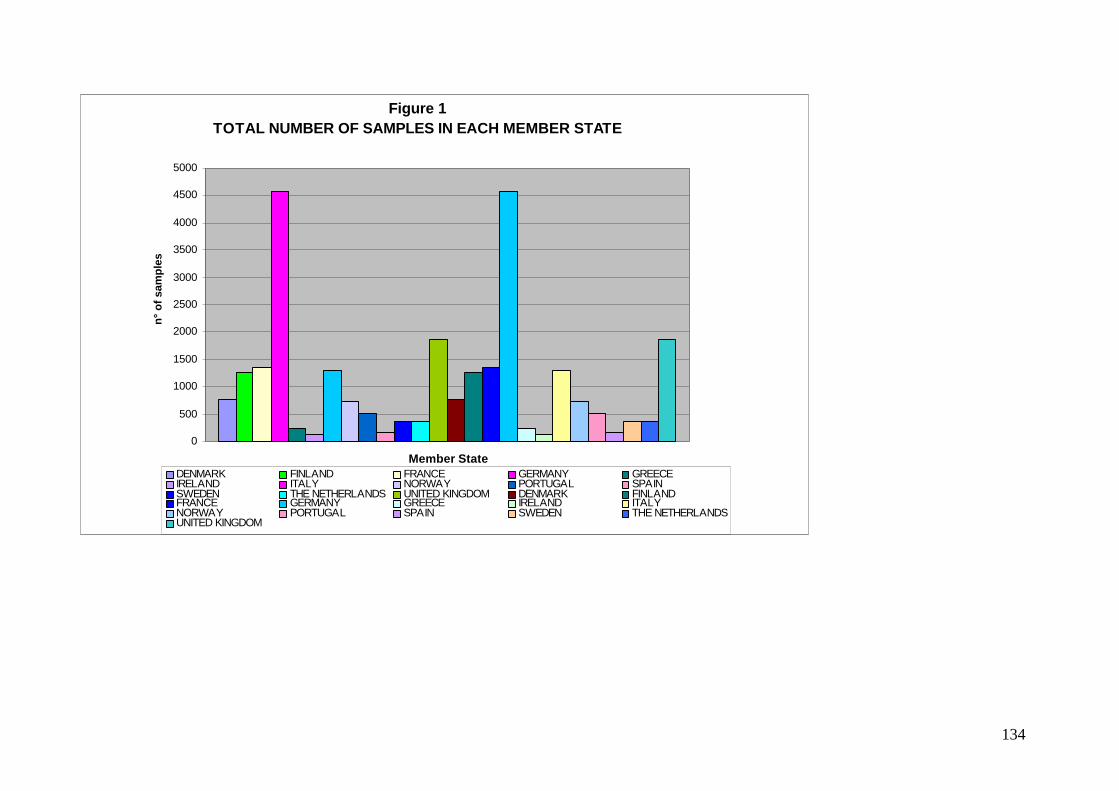
134
Figure 1TOTAL NUMBER OF SAMPLES IN EACH MEMBER STATE
0
500
1000
1500
2000
2500
3000
3500
4000
4500
5000
Member State
n°
of
sam
ple
s
DENMARK FINLAND FRANCE GERMANY GREECEIRELAND ITALY NORWAY PORTUGAL SPAINSWEDEN THE NETHERLANDS UNITED KINGDOM DENMARK FINLANDFRANCE GERMANY GREECE IRELAND ITALYNORWAY PORTUGAL SPAIN SWEDEN THE NETHERLANDSUNITED KINGDOM
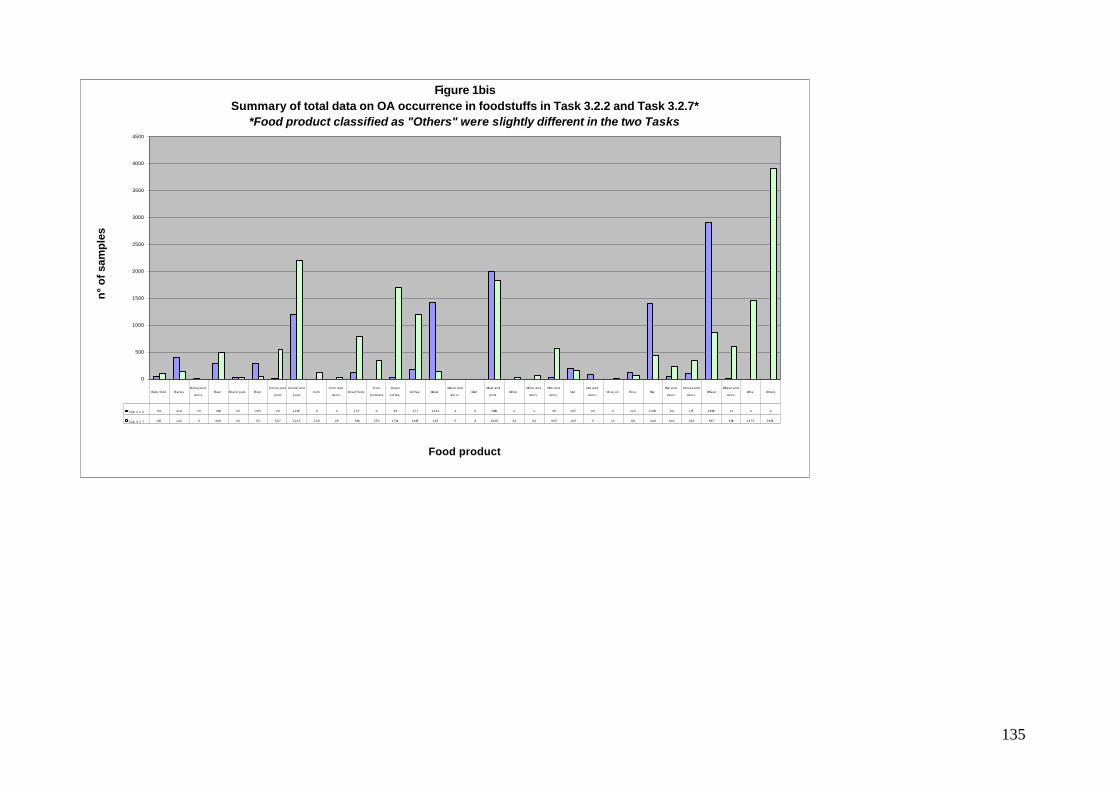
135
Figure 1bisSummary of total data on OA occurrence in foodstuffs in Task 3.2.2 and Task 3.2.7*
*Food product classified as "Others" were slightly different in the two Tasks
0
500
1000
1500
2000
2500
3000
3500
4000
4500
Food product
n°
of
sam
ple
s
Task 3.2.2 59 414 15 300 32 293 20 1202 0 0 137 0 46 177 1431 4 0 2009 2 1 36 197 94 0 122 1403 64 107 2909 11 0 0
Task 3.2.7 103 142 0 496 32 53 547 2212 128 28 800 353 1704 1205 139 0 9 1828 34 81 565 165 0 12 68 444 242 361 867 608 1470 3903
Baby food BarleyBarley and
der iv .Beer Black pud. Bran
Cocoa and
prod.
Cereal and
prod.Corn
Corn and
der iv .Dried fruits
Fruit
products
Green
cof feeCoffee Maize
Maize and
der iv .Malt
Meat and
prod.Mi l le t
Mi l le t and
der iv .
Mi lk and
der iv .Oa t
Oat and
der iv .Ol i ve o i l R ice Rye
Rye and
der iv .
Spices and
der iv .Whea t
Wheat and
der iv .Wine Others
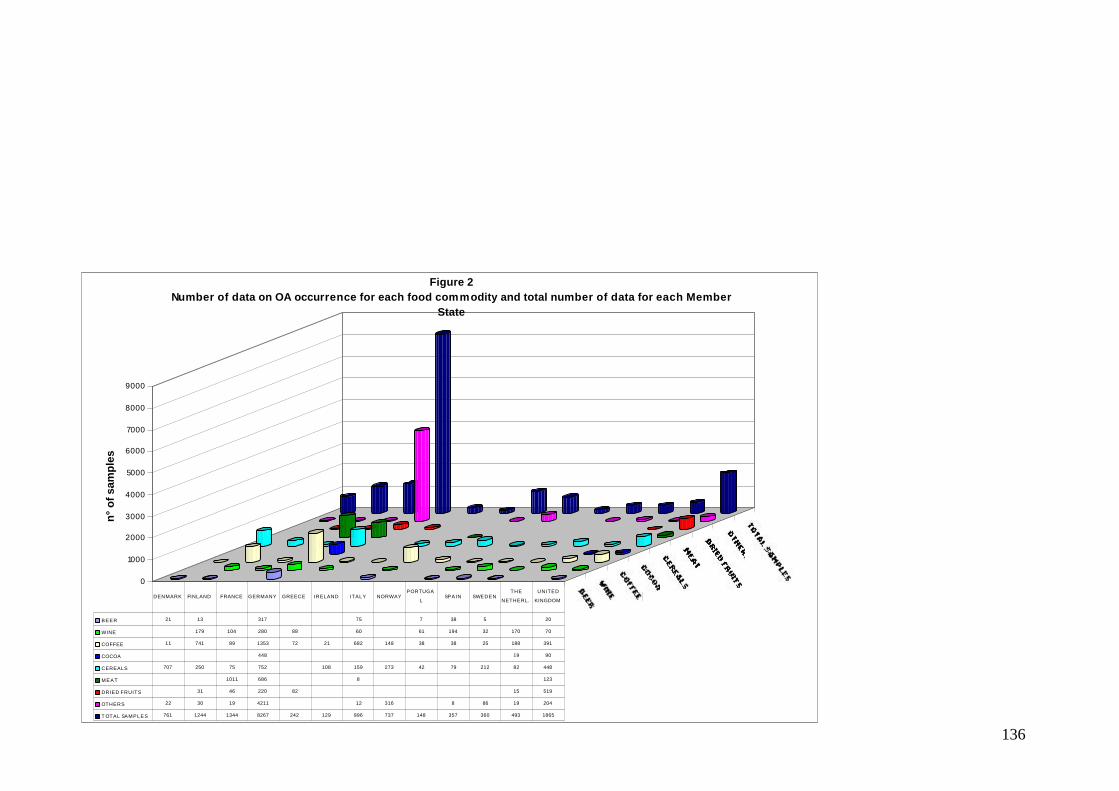
136
0
1000
2000
3000
4000
5000
6000
7000
8000
9000
n°
of
sam
ple
s
Figure 2 Number of data on OA occurrence for each food commodity and total number of data for each Member
State
BEER 21 13 317 75 7 38 5 20
WINE 179 104 280 88 60 61 194 32 170 70
COFFEE 11 741 89 1353 72 21 682 148 38 38 25 188 391
COCOA 448 19 90
CEREALS 707 250 75 752 108 159 273 42 79 212 82 448
M E A T 1011 686 8 123
DRIED FRUITS 31 46 220 82 15 519
OTHERS 22 30 19 4211 12 316 8 86 19 204
T OTAL SAMPLES 761 1244 1344 8267 242 129 996 737 148 357 360 493 1865
DENMARK FINLAND FRANCE GERMANY GREECE IRELAND ITALY NORWAYPORTUGA
LSPAIN SWEDEN
THE
NETHERL.
UNITED
KINGDOM
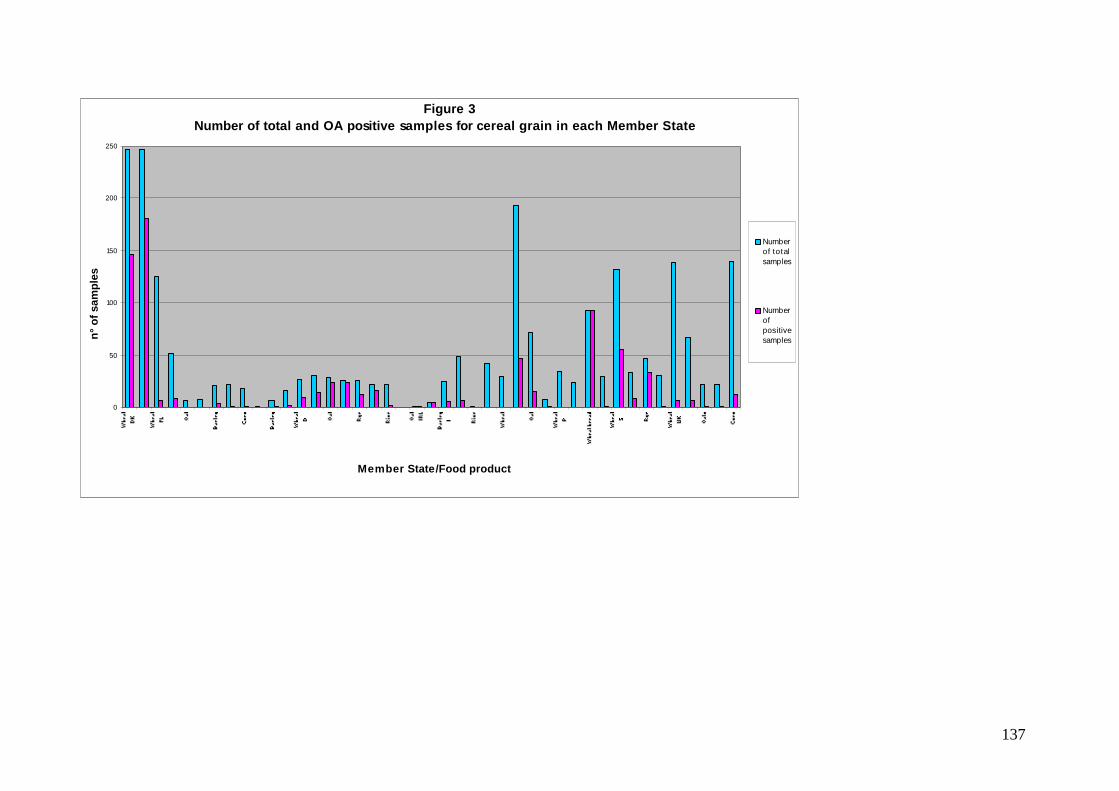
137
Figure 3Number of total and OA positive samples for cereal grain in each Member State
0
50
100
150
200
250
Member State/Food product
n°
of
sam
ple
s
Numberof totalsamples
Numberofpositivesamples
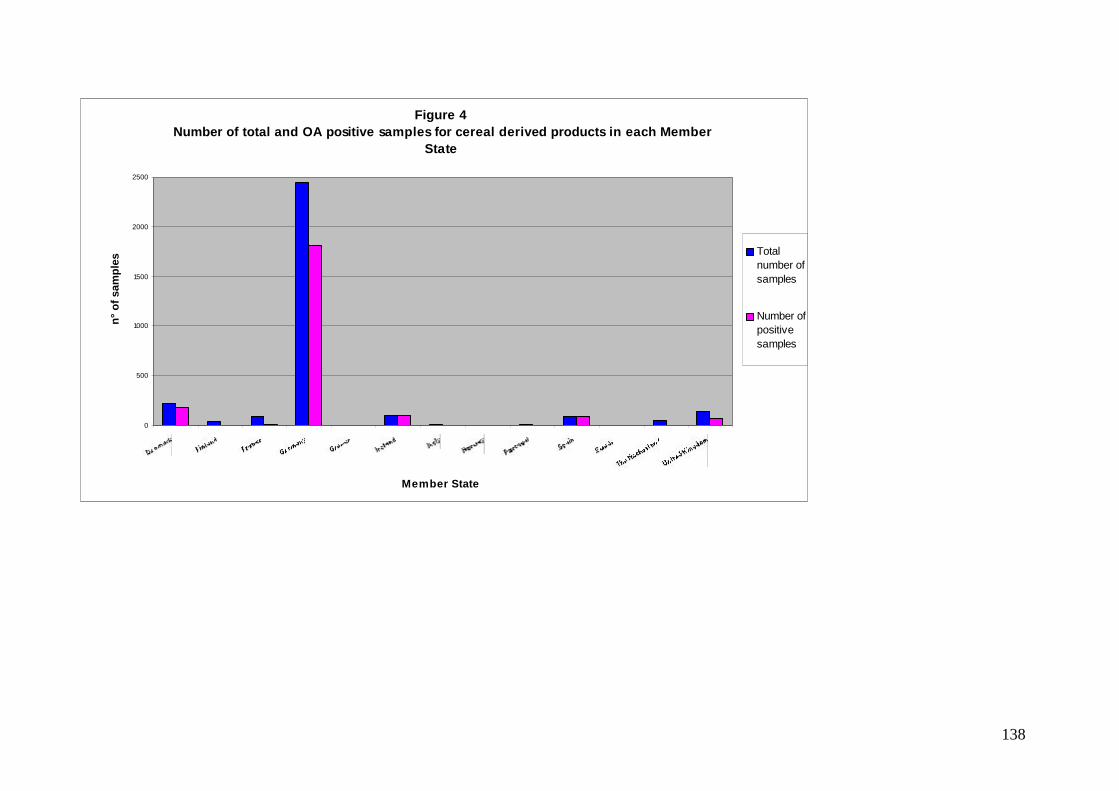
138
Figure 4 Number of total and OA positive samples for cereal derived products in each Member
State
0
500
1000
1500
2000
2500
Member State
n°
of
sam
ple
s Totalnumber ofsamples
Number ofpositivesamples
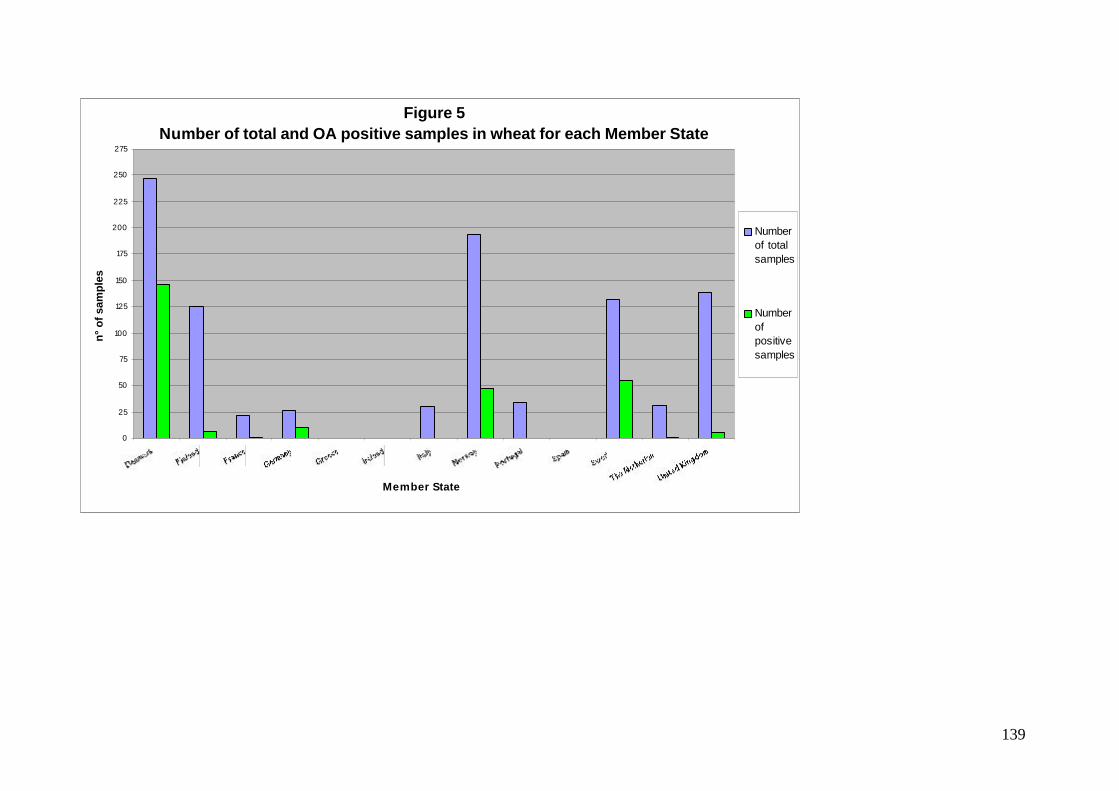
139
Figure 5Number of total and OA positive samples in wheat for each Member State
0
25
50
75
100
125
150
175
200
225
250
275
Member State
n°
of
sam
ple
s
Numberof totalsamples
Numberofpositivesamples
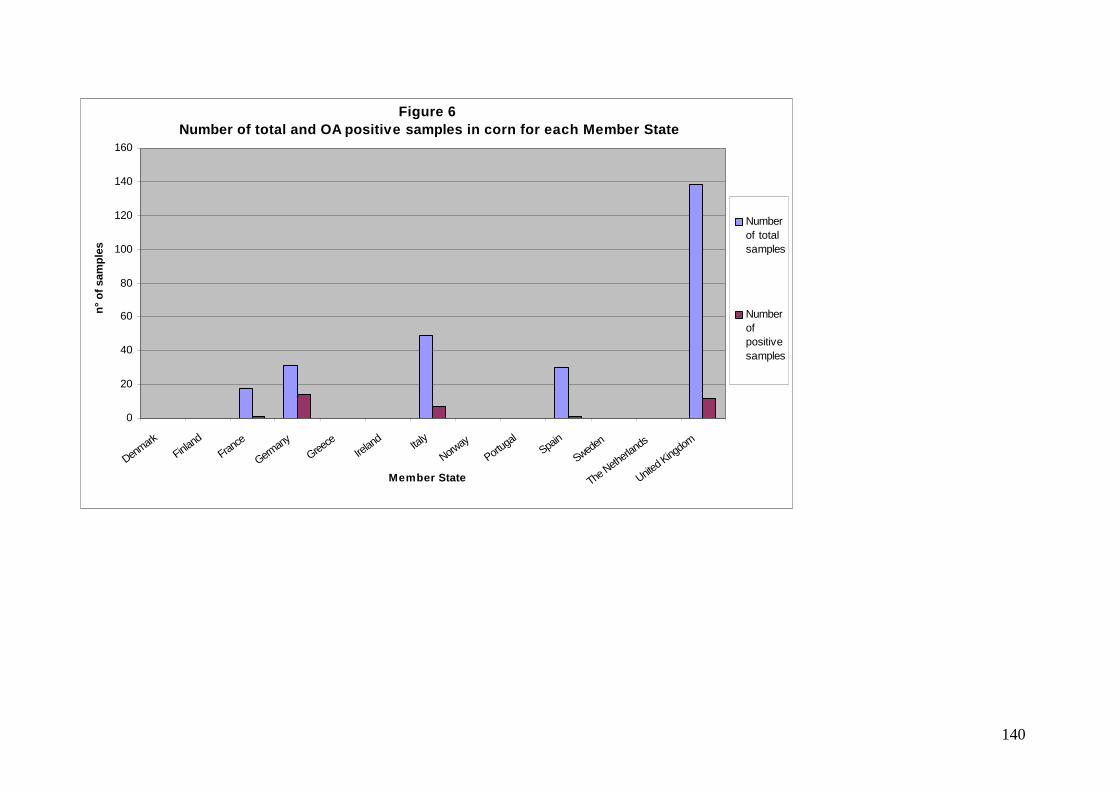
140
Figure 6 Number of total and OA positive samples in corn for each Member State
0
20
40
60
80
100
120
140
160
Denmark
Finland
France
Germany
Greece
Irelan
dItal
y
Norway
Portug
alSpa
in
Sweden
The Neth
erlands
United K
ingdo
m
Member State
n°
of
sam
ple
s
Numberof totalsamples
Numberofpositivesamples
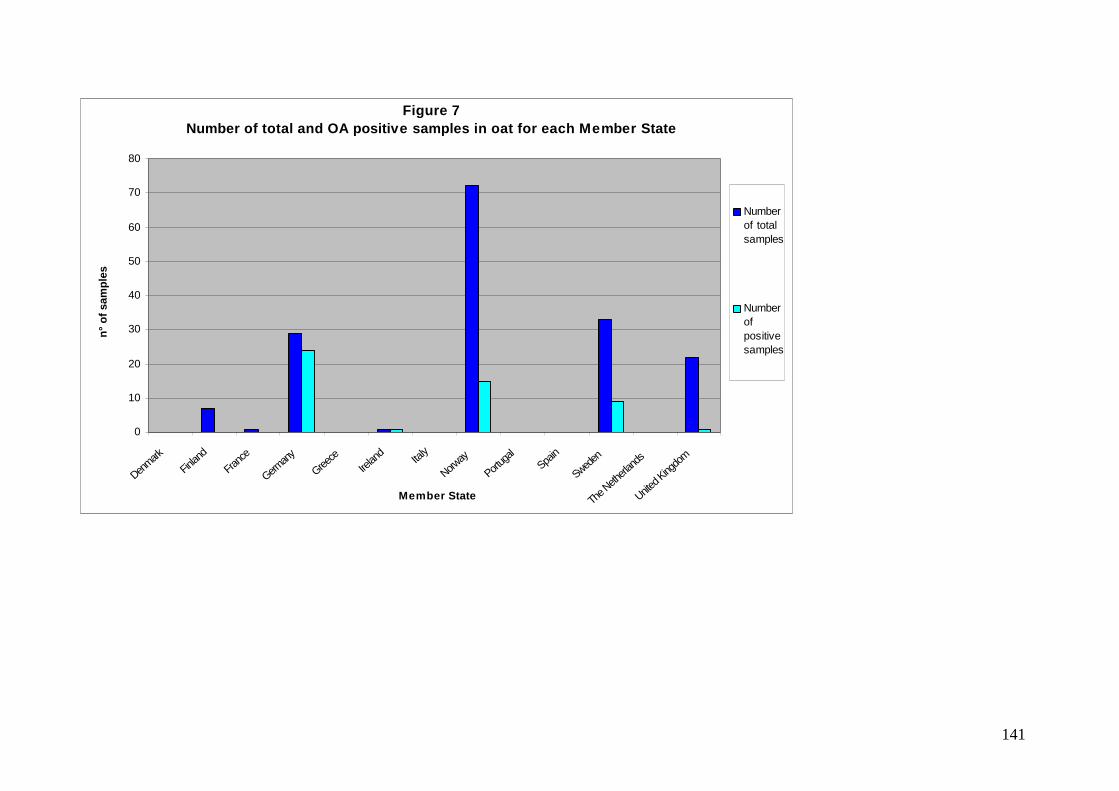
141
Figure 7Number of total and OA positive samples in oat for each Member State
0
10
20
30
40
50
60
70
80
Denmark
Finlan
d
Franc
e
German
y
Greece
Irelan
dIta
ly
Norway
Portug
alSpa
in
Sweden
The N
etherl
ands
United K
ingdo
m
Member State
n°
of
sam
ple
s
Numberof totalsamples
Numberofpositivesamples
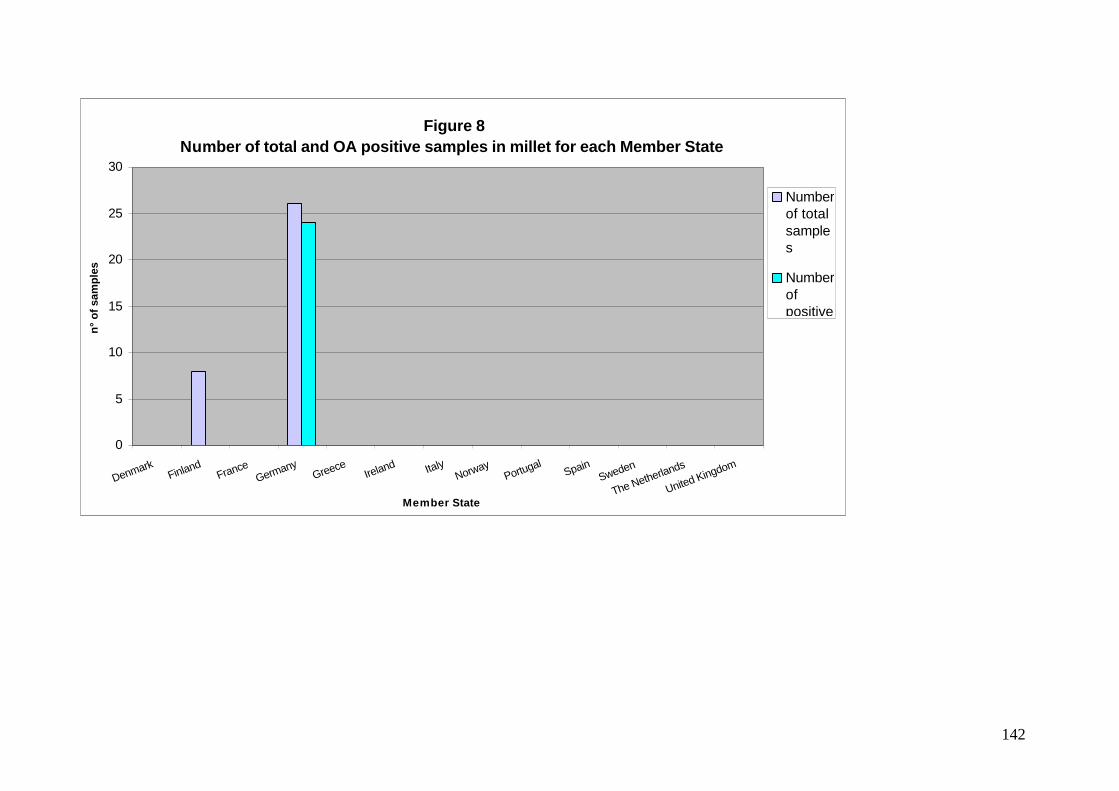
142
Figure 8Number of total and OA positive samples in millet for each Member State
0
5
10
15
20
25
30
DenmarkFinland
FranceGermany
GreeceIreland Italy
NorwayPortugal
SpainSweden
The Netherlands
United Kingdom
Member State
n°
of
sam
ple
s
Numberof totalsamples
Numberofpositive
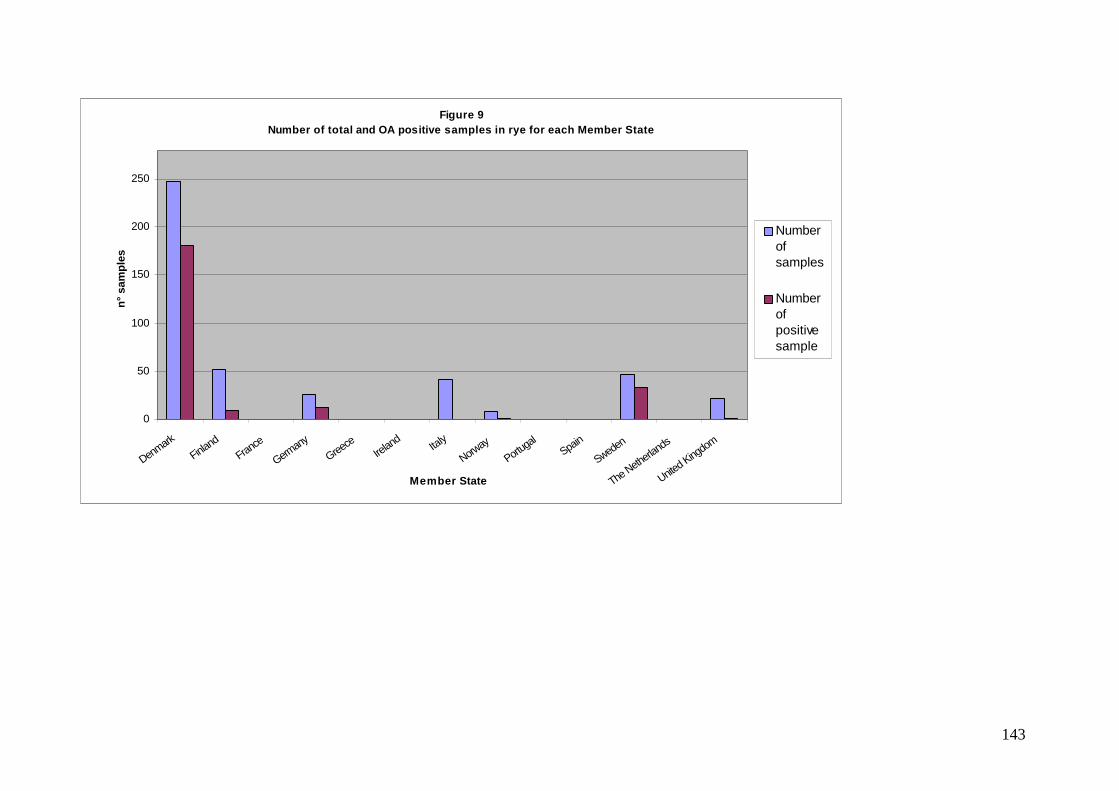
143
Figure 9 Number of total and OA positive samples in rye for each Member State
0
50
100
150
200
250
Denmark
Finland
France
Germany
Greece
Ireland Italy
Norway
Portugal
Spain
Sweden
The Neth
erlands
United K
ingdom
Member State
n°
sam
ple
s
Numberofsamples
Numberofpositivesample
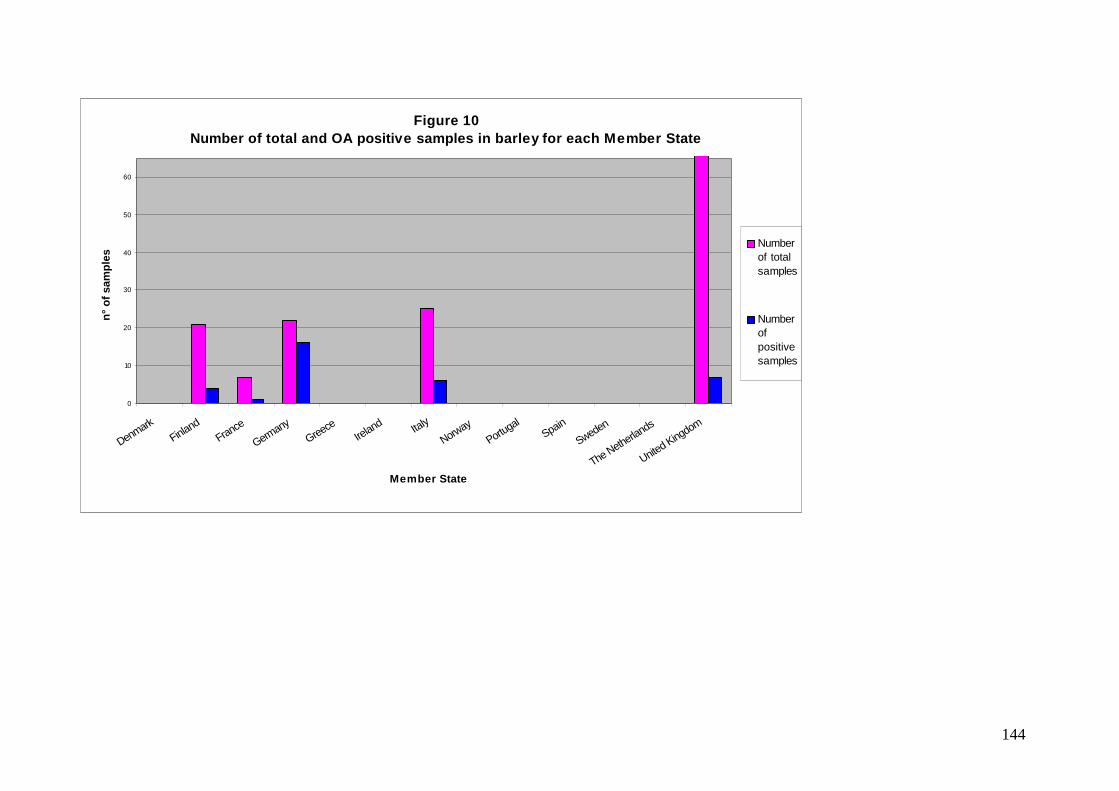
144
Figure 10Number of total and OA positive samples in barley for each Member State
0
10
20
30
40
50
60
DenmarkFinland
France
GermanyGreece
Ireland Italy
NorwayPortugal
Spain
Sweden
The Netherlands
United Kingdom
Member State
n°
of
sam
ple
s
Numberof totalsamples
Numberofpositivesamples
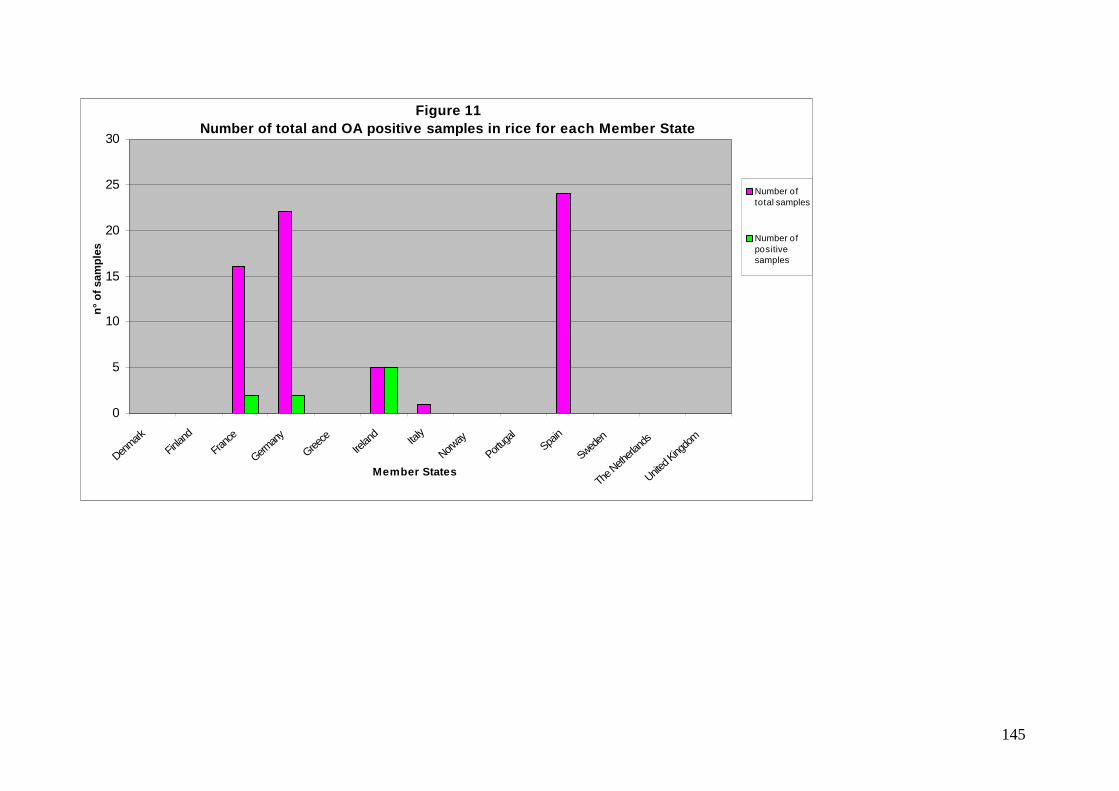
145
Figure 11Number of total and OA positive samples in rice for each Member State
0
5
10
15
20
25
30
Denmark
Finlan
d
Franc
e
German
y
Greece
Irelan
dIta
ly
Norway
Portug
alSpa
in
Sweden
The N
etherl
ands
United K
ingdo
m
Member States
n°
of
sam
ple
s
Number oftotal samples
Number ofpositivesamples
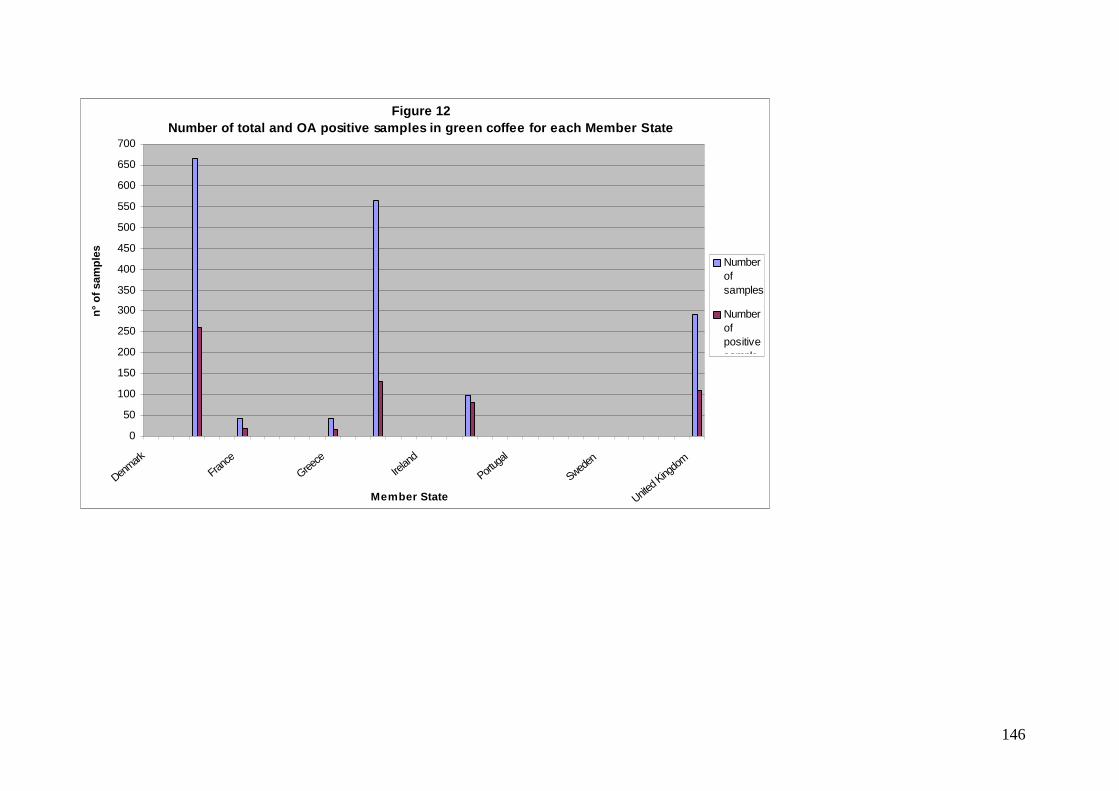
146
Figure 12Number of total and OA positive samples in green coffee for each Member State
0
50
100
150
200
250
300
350
400
450
500
550
600
650
700
Denmark
France
Greece
Irelan
d
Portug
al
Sweden
United K
ingdo
m
Member State
n°
of
sam
ple
s
Numberofsamples
Numberofpositivesample
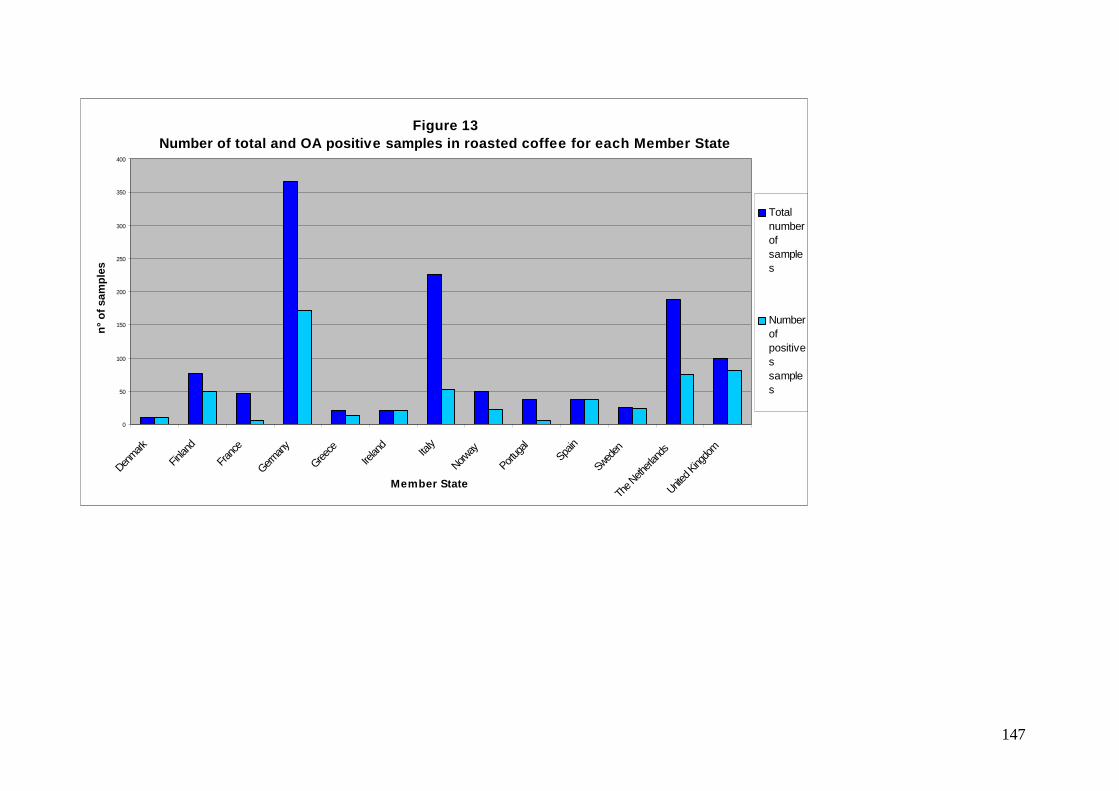
147
Figure 13Number of total and OA positive samples in roasted coffee for each Member State
0
50
100
150
200
250
300
350
400
Denmark
Finlan
d
Franc
e
German
y
Greece
Irelan
dIta
ly
Norway
Portug
alSpa
in
Swed
en
The N
etherl
ands
United K
ingdo
m
Member State
n°
of
sam
ple
s
Totalnumberofsamples
Numberofpositivessamples
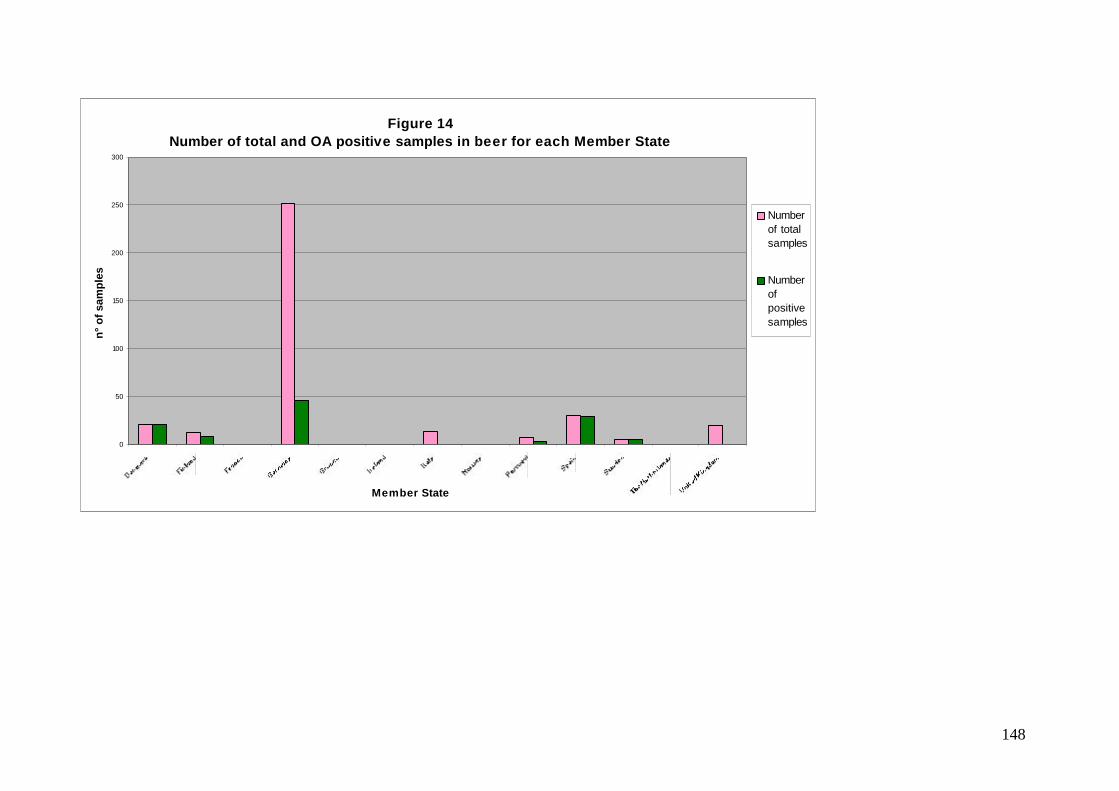
148
Figure 14Number of total and OA positive samples in beer for each Member State
0
50
100
150
200
250
300
Member State
n°
of
sam
ple
s
Numberof totalsamples
Numberofpositivesamples
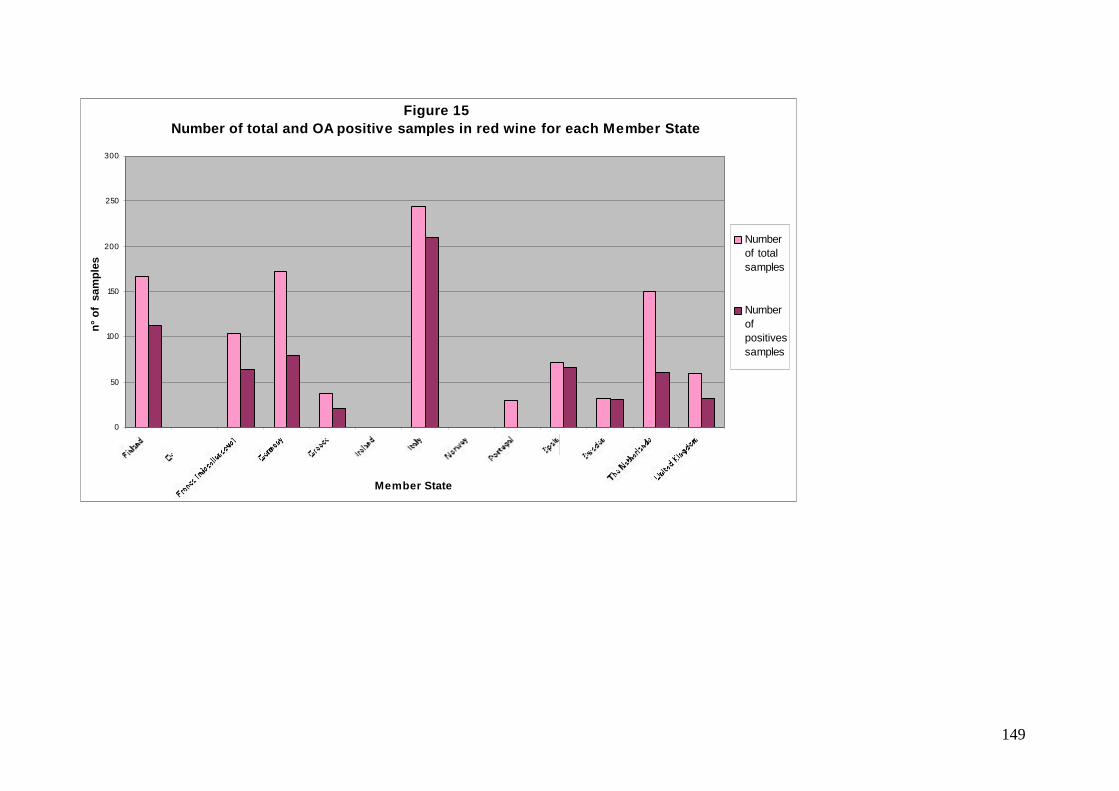
149
Figure 15 Number of total and OA positive samples in red wine for each Member State
0
50
100
150
200
250
300
Member State
n°
of
sam
ple
s
Numberof totalsamples
Numberofpositivessamples
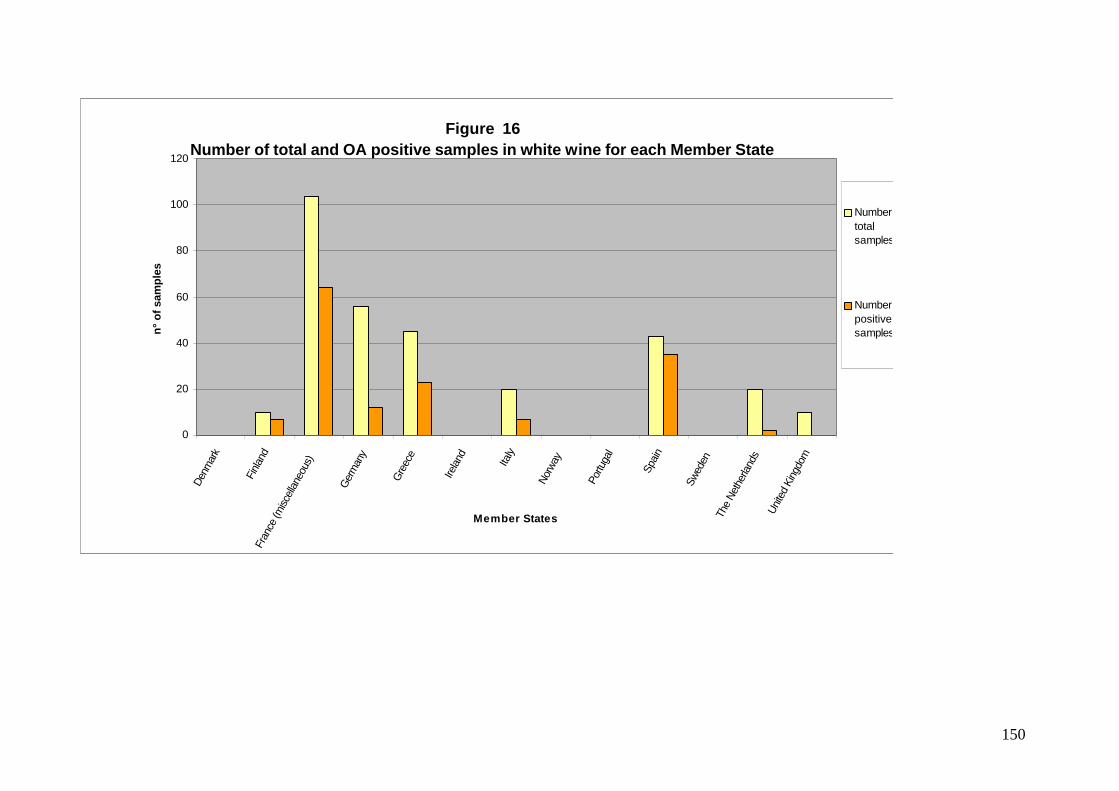
150
Figure 16Number of total and OA positive samples in white wine for each Member State
0
20
40
60
80
100
120
Denm
ark
Finl
and
Fran
ce (m
iscel
lane
ous)
Ger
man
y
Gre
ece
Irela
nd Italy
Norw
ay
Portu
gal
Spai
n
Swed
enTh
e Ne
ther
lands
Unite
d Ki
ngdo
m
Member States
n°
of
sam
ple
s
Number oftotalsamples
Number ofpositivesamples
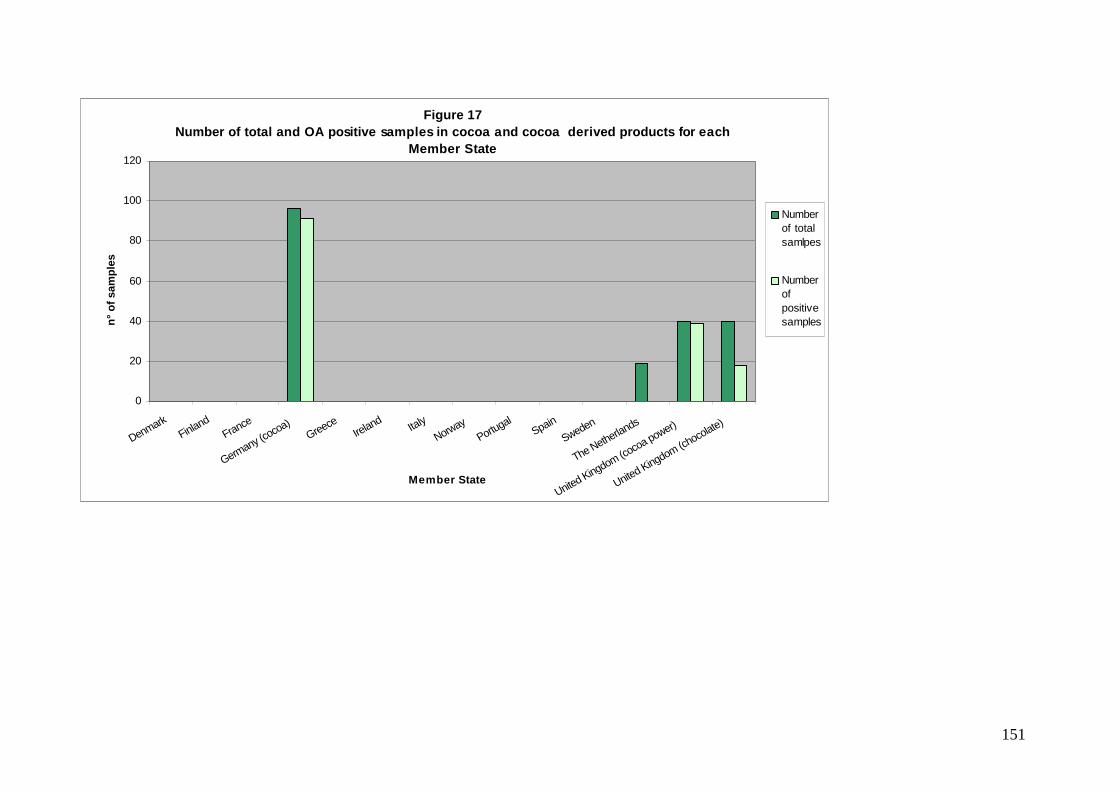
151
Figure 17 Number of total and OA positive samples in cocoa and cocoa derived products for each
Member State
0
20
40
60
80
100
120
DenmarkFinland
France
Germany (cocoa)
GreeceIreland Italy
NorwayPortugal
Spain
Sweden
The Netherlands
United Kingdom (cocoa power)
United Kingdom (chocolate)
Member State
n°
of
sam
ple
s
Numberof totalsamlpes
Numberofpositivesamples
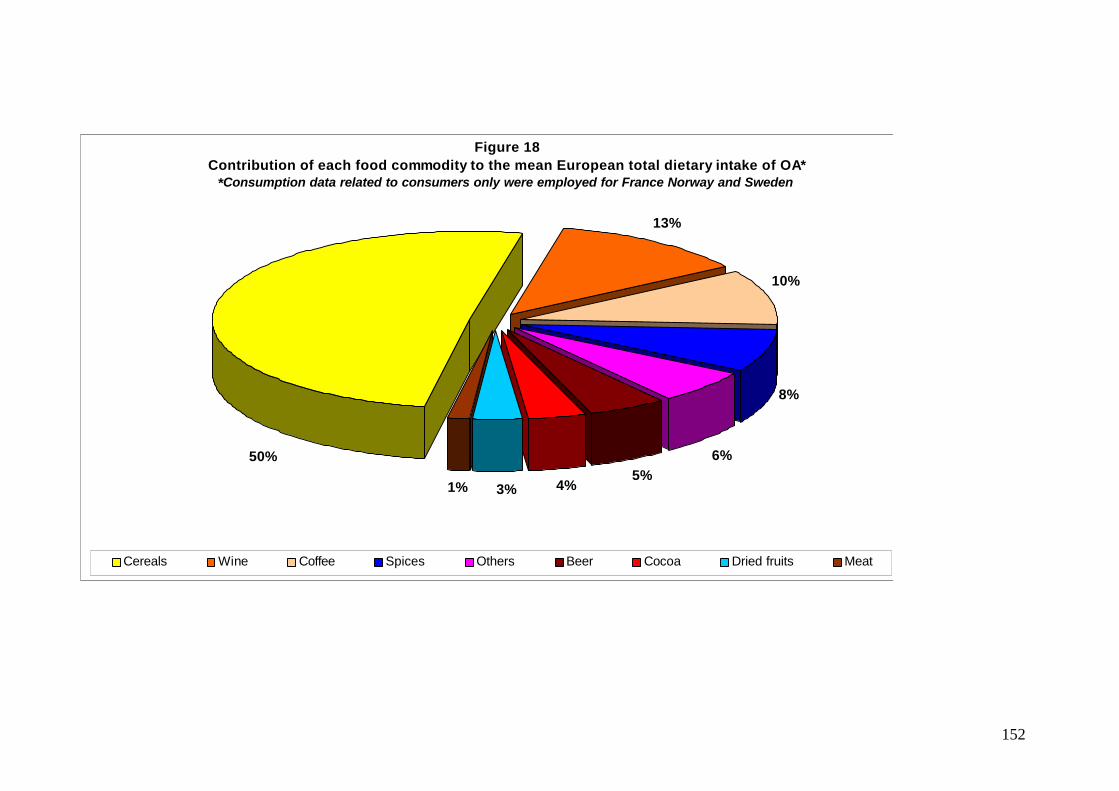
152
Figure 18Contribution of each food commodity to the mean European total dietary intake of OA*
*Consumption data related to consumers only were employed for France Norway and Sweden
1% 3%5%
6%
4%
8%
10%
13%
50%
Cereals Wine Coffee Spices Others Beer Cocoa Dried fruits Meat
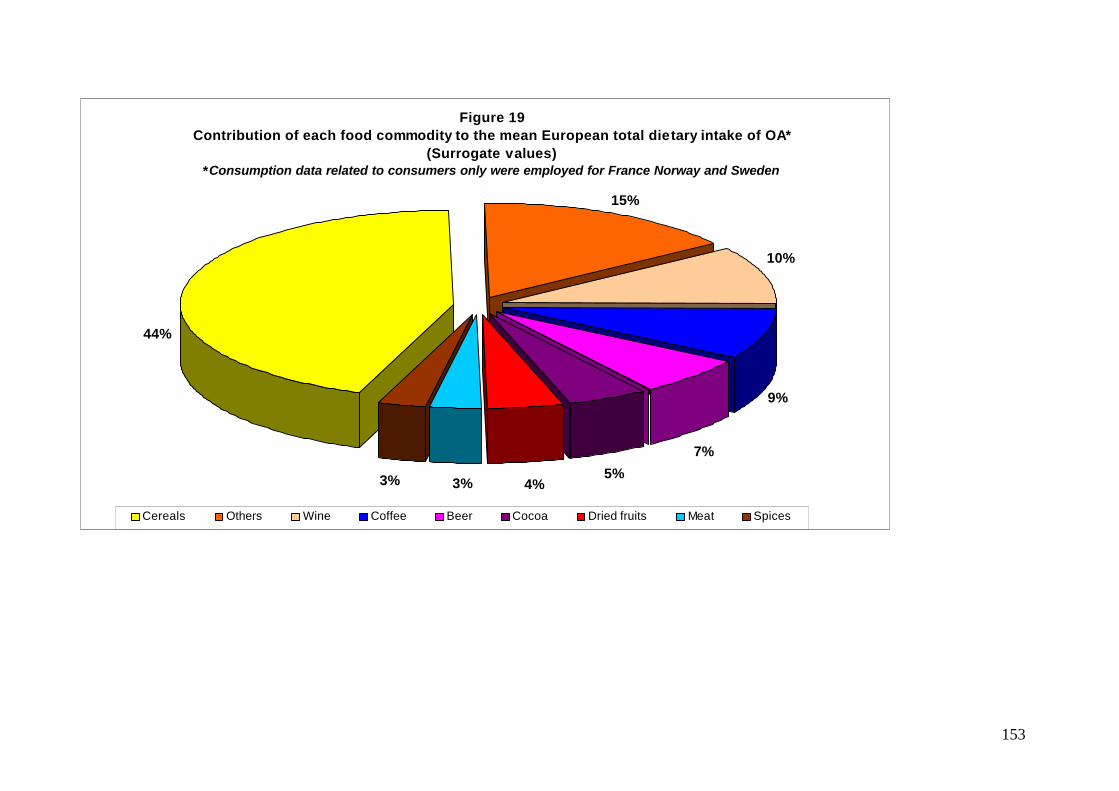
153
Figure 19Contribution of each food commodity to the mean European total dietary intake of OA*
(Surrogate values) *Consumption data related to consumers only were employed for France Norway and Sweden
3%3%
7%
9%
5%4%
44%
10%
15%
Cereals Others Wine Coffee Beer Cocoa Dried fruits Meat Spices