Embed Size (px)
Citation preview

1
Centre for Advanced Spatial Analysis, University College LondonCentre for Advanced Spatial Analysis
Representation & Visualization in GIS: Representation & Visualization in GIS: Emerging Trends, New MethodsEmerging Trends, New Methods
Michael BattyMichael Batty
University College LondonUniversity College Londonwww.casa.ucl.ac.ukwww.casa.ucl.ac.uk
Kinugasa CampusRitsumeikan UniversityKyoto, Japan
Centre for Advanced Spatial Analysis, University College LondonCentre for Advanced Spatial Analysis
Outline
Pushing pictures – displaying and communicating data, spatial data – it’s all about Web 2.0!
GMapCreator and ImageCutter
MapTube: a kind of YouTube + Napster
Pulling pictures – pulling spatial data – crowdsourcing, Survey Mapper
Seriously Capturing and Scraping Data: Twitter and online streaming, London Bikes
2D to 3D: GIS to CAD and back and on the web
The future – disseminating spatial data in multimedia –

2
Centre for Advanced Spatial Analysis, University College LondonCentre for Advanced Spatial Analysis
We will begin by
Pushing pictures – displaying and communicating data, spatial data – it’s all about Web 2.0!
GMapCreator and ImageCutter
MapTube: a kind of YouTube + Napster
Using Maps to Visualize Pictures
Centre for Advanced Spatial Analysis, University College LondonCentre for Advanced Spatial Analysis

3
Centre for Advanced Spatial Analysis, University College LondonCentre for Advanced Spatial Analysis
Tooth courtesy ofTooth courtesy ofJohan LundinBiomedical Informatics Research GroupDepartment of OncologyUniversity of Helinskihttp://www.webmicroscope.net/
The Kremer Collectionhttp://www.thekremercollection.com/
One of my key points in this talk is that software being developed for a particular spatial application often easily generalises to a quite different one ….. But let me first outline my talk before elaborating
http://chs75.harvard.edu/manuscripts/
Centre for Advanced Spatial Analysis, University College LondonCentre for Advanced Spatial Analysis
GMapCreator and ImageCutterThe Google Map Creator creates Google Maps websites from thematic data contained in shapefiles.
It effectively layers your map on top of a Google Map or the Google Map
For audiences other than yourselves, I always have to make the point that a map is not a picture – it is a bunch of vector geometries and a set of attributes – and a shape file is a proprietary but widely used format by ESRI
Let us see how it works

4
Centre for Advanced Spatial Analysis, University College LondonCentre for Advanced Spatial Analysis
Centre for Advanced Spatial Analysis, University College LondonCentre for Advanced Spatial Analysis
We can do the same sort of thing in 3D of course with GEarthCreator – the key is to convert the shapefiles to KML files – and there are many other maphacks using similar open map bases like Open Street Map
From all of this we have devised an open resource for maps called MapTubeMapTube
5
Centre for Advanced Spatial Analysis, University College LondonCentre for Advanced Spatial Analysis
Centre for Advanced Spatial Analysis, University College LondonCentre for Advanced Spatial Analysis
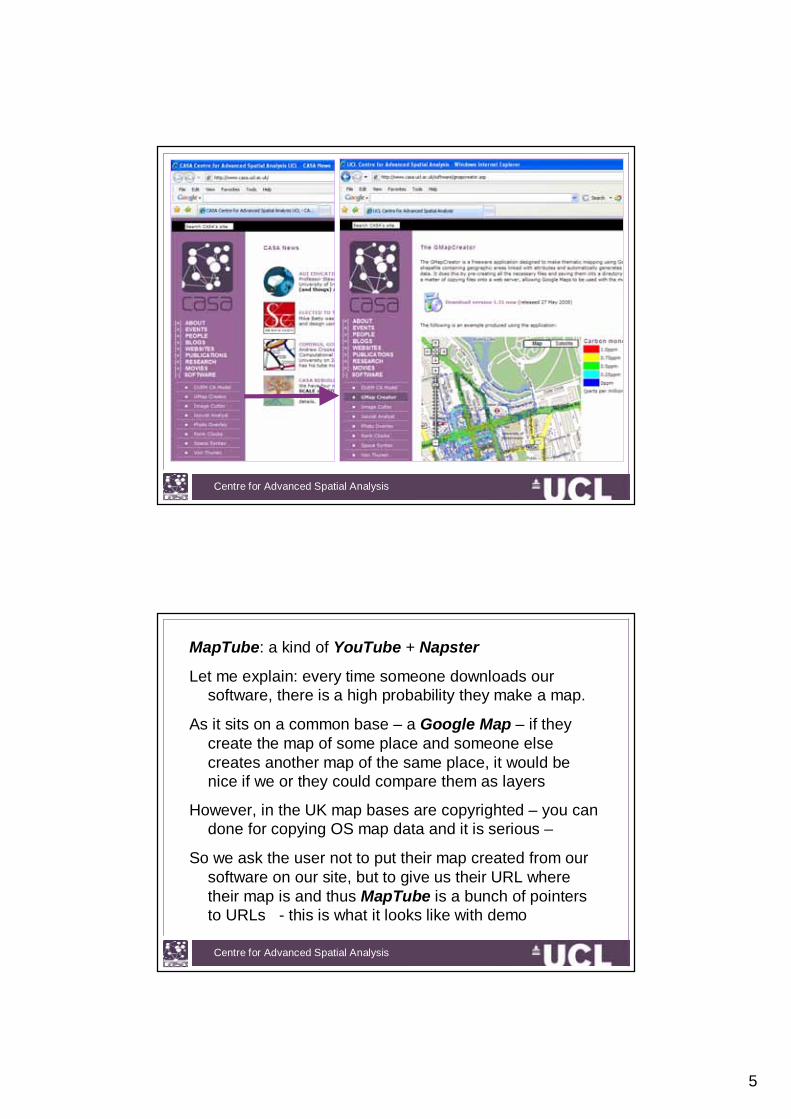
MapTube: a kind of YouTube + Napster
Let me explain: every time someone downloads our software, there is a high probability they make a map.
As it sits on a common base – a Google Map – if they create the map of some place and someone else creates another map of the same place, it would be nice if we or they could compare them as layers
However, in the UK map bases are copyrighted – you can done for copying OS map data and it is serious –
So we ask the user not to put their map created from our software on our site, but to give us their URL where their map is and thus MapTube is a bunch of pointers to URLs - this is what it looks like with demo

6
Centre for Advanced Spatial Analysis, University College LondonCentre for Advanced Spatial Analysis
Centre for Advanced Spatial Analysis, University College LondonCentre for Advanced Spatial Analysis

7
Centre for Advanced Spatial Analysis, University College LondonCentre for Advanced Spatial Analysis
Here are some of the user map data in/on MapTube
1. Knife Crime Update, 2. SC IMD Score, 3. SEC IMD Score, 4. PCT Obesity, 5.NO2 Bristol, 6. AGFC Wildlife
1 2 3 4 5 1 2 3 4 5 66
7. Southeast IMD, 8. Southeast IMD (LSOA), 9. Wild Land Quality Scotland, 10.NSSeC L8 (never worked)%, 11. CO2 index
The data behind the knife crimes map (1) has been in the news the last few days after it emerged that the Government had manipulated the data.
7 8 9 10 7 8 9 10 1111
Centre for Advanced Spatial Analysis, University College LondonCentre for Advanced Spatial Analysis
Pulling pictures – pulling spatial data – crowd-sourcing
We have turned all this around and basically used the system to record spatial responses to topical questions
We broadcast the questions through TV and radio and then ask users to respond and key in their post code –7 digit in UK but actually only record postcode sector –first three or four digits
Then our server issues a request to scan the continually refreshed database and rebuilds the map on the fly so to speak, every half hour, using GMapCreator etc
We have so far looked at the credit crunch, antisocial behaviour and the Manchester road pricing proposal

8
Centre for Advanced Spatial Analysis, University College LondonCentre for Advanced Spatial Analysishttp://www.maptube.org/creditcrunch/
23,475 responsesApril, May, June 2008
A new credit crunch survey started in October and currently has 3,802 responses.
Centre for Advanced Spatial Analysis, University College LondonCentre for Advanced Spatial Analysis
http://www.maptube.org/lookeast
July, August, September 20086,902 responses
BBC Look East: Anti-Social Behaviour

9
Centre for Advanced Spatial Analysis, University College LondonCentre for Advanced Spatial Analysis
Manchester Congestion Charge15,902 responsesOctober to December 2008
Centre for Advanced Spatial Analysis, University College LondonCentre for Advanced Spatial Analysis
BBC Look East: Credit Crunch
http://www.maptube.org/LookEastCreditCrunch/
September 20082,052 responses (with age group)

10
Centre for Advanced Spatial Analysis, University College LondonCentre for Advanced Spatial Analysis
GeoVUE Family Tree
GMapCreatorGoogle Image
Tools
MapTube
Second Life
GMap ImageCutter
Photo Overlay Creator
BayScienceBig Image Cutter
Shape Builder
Mood Maps
London Profiler
Virtual London
GEarth Creator
GeoVUE
Centre for Advanced Spatial Analysis, University College LondonCentre for Advanced Spatial Analysis

11
Centre for Advanced Spatial Analysis, University College LondonCentre for Advanced Spatial Analysis
Centre for Advanced Spatial Analysis, University College LondonCentre for Advanced Spatial Analysis
Seriously Capturing and Scraping Data: Twitter and online streaming, London Bikes

12
Centre for Advanced Spatial Analysis, University College LondonCentre for Advanced Spatial Analysis
10953
5788
5789
Dratted cold snap has killed the car battery..£70 for a new one...#uksnow
Steady heavy snow in Chesham HP5 #uksnow
#uksnow SG10 3/10
21/12/2009 22:53
21/12/2009 15:57
21/12/2009 15:57
pablothehat (pablothehat)
iotaMEDIA (Gordon O'Neill)
domsparkes (domsparkes)
6 Jan 2010
21 Dec 2009
Centre for Advanced Spatial Analysis, University College LondonCentre for Advanced Spatial Analysis
Tweets Per Hour (#uksnow)
20 Dec2009
26 Jan2010
6 Jan2010
13 Jan2010
Tweets using the #uksnow tag shown as tweets (grey) and those containing a valid postcode (red)
Run Movie

13
Centre for Advanced Spatial Analysis, University College LondonCentre for Advanced Spatial Analysis
#uksnow tweets: Wed 13 January 2010Tweets using the #uksnow tag for Wednesday 13th January 2010 plotted as a count by postcode for the whole day, compared to UKMO data for 12Z
5-9cm
10-14cm
15-19cm
20cm+
0-4cm
Centre for Advanced Spatial Analysis, University College LondonCentre for Advanced Spatial Analysis

14
Centre for Advanced Spatial Analysis, University College LondonCentre for Advanced Spatial Analysis
Tweets as Background Radiation about Dynamics in the City
Centre for Advanced Spatial Analysis, University College LondonCentre for Advanced Spatial Analysis
New York London Paris Moscow

15
Centre for Advanced Spatial Analysis, University College LondonCentre for Advanced Spatial Analysis
London
Heathrow
Kingston
Purley
Croydon
Colindale
Enfield
Barking
1
10
100
1000
1 10 100 1000 10000
0
200
400
600
800
1000
1200
1400
1600
1800
0 4 8 12 16 20 24
Time by 24 Hour Clock
Num
ber
of T
we
ets
1.4
1.5
1.6
1.7
1.8
1.9
2
2.1
Zip
f Par
ame
ter
Centre for Advanced Spatial Analysis, University College LondonCentre for Advanced Spatial Analysis
Scraping Data: The London Bikes Experiment
Locally called Boris’s Bikes
Essentially a scheme to introduce public bike transport to central London to take people out of cars and trains and even buses and to promote sustainability, as well as counter obesity
4200 bikes, 340 stations, access via online registration or by paying on a credit card at the local bike station – so all online data

16
Centre for Advanced Spatial Analysis, University College LondonCentre for Advanced Spatial Analysis
Ollie O’Brien in CASA has built an online resource to scrape the data continually – every few minutes of demand and supply of bikes – how full the bike stations are. From this you can assess where there is space and where there is congestion
And he does this all the time, so if you log onto his web site – his blog in fact
http://oobrien.com/vis/bikes/Then you will get all this data – let me show you some
pictures of it – I may even log on and show it now live but it is slow in Explorer on this machine
This is a great example of a real time demand supply management system which is powered by maps - OSM
Centre for Advanced Spatial Analysis, University College LondonCentre for Advanced Spatial Analysis

17
Centre for Advanced Spatial Analysis, University College LondonCentre for Advanced Spatial Analysis
As yet no records of demand from people logging on, so no management capabilities, but could happen probably from an App based software but maybe from the server
Centre for Advanced Spatial Analysis, University College LondonCentre for Advanced Spatial Analysis

18
Centre for Advanced Spatial Analysis, University College LondonCentre for Advanced Spatial Analysis
Centre for Advanced Spatial Analysis, University College LondonCentre for Advanced Spatial Analysis
2D to 3D: GIS to CAD and back and on the web
We are attempting to integrate much of this data with more conventional spatial information
And to construct and make this available in various kinds of multimedia from 3-D GIS to CAD to movies to virtual exhibition spaces based on virtual worlds

19
Centre for Advanced Spatial Analysis, University College LondonCentre for Advanced Spatial Analysis
The key issue for us is to populate this data base of 3.6 million building blocks with socio-economic data
This is linking geometry to geography in a way that will explode the data base to levels much more reminiscent of large scale databases in the physical sciences than the rather modest social data bases based on aggregates of population
Linking these to individual address point data is another related issue too as well as tagging buildings to populations
Centre for Advanced Spatial Analysis, University College LondonCentre for Advanced Spatial Analysis
From geometry to geography and back – populating really large spatial data bases

20
Centre for Advanced Spatial Analysis, University College LondonCentre for Advanced Spatial Analysis
Dwellings
Address
Address
Address
Address
Address
Address
Centre for Advanced Spatial Analysis, University College LondonCentre for Advanced Spatial Analysis
Adding Land Use, Transport and Populations and Aggregating Scales

21
Centre for Advanced Spatial Analysis, University College LondonCentre for Advanced Spatial Analysis
Centre for Advanced Spatial Analysis, University College LondonCentre for Advanced Spatial Analysis

22
Centre for Advanced Spatial Analysis, University College LondonCentre for Advanced Spatial Analysis
Part of this future is disseminating spatial data in multimedia – games and virtual worlds
Centre for Advanced Spatial Analysis, University College LondonCentre for Advanced Spatial Analysis
Thanks, Any Questions?Thanks, Any Questions?Look at our web sites
http://www.casa.ucl.ac.uk/
http://www.surveymapper.com/
http://www.maptube.org/
http://www.oobrien.com/
Our Blogs
http://www.digitalurban.blogspot.com/
http://gisagents.blogspot.com/
http://www.genesis.ncess.ac.uk/
Credits
Andy HudsonAndy Hudson--Smith, Ollie OSmith, Ollie O’’Brien, Richard Milton, Brien, Richard Milton, Steven Gray, Duncan Smith, Steven Gray, Duncan Smith, FabianFabian NeuhausNeuhaus