Embed Size (px)
Citation preview

Representative Samples and PARCC to MCAS Concordance StudiesThis report describes the methods and outcomes for a) selecting representative samples of test-takers for MCAS and PARCC in 2015, and b) identifying estimated MCAS results for PARCC test-takers.
February 2016
Massachusetts Department of Elementary and Secondary Education75 Pleasant Street, Malden, MA 02148-4906Phone 781-338-3000 TTY: N.E.T. Relay 800-439-2370www.doe.mass.edu

This document was prepared by the Massachusetts Department of Elementary and Secondary Education
Mitchell D. Chester, Ed.D.Commissioner
The Massachusetts Department of Elementary and Secondary Education, an affirmative action employer, is committed to ensuring that all of its programs and facilities are accessible to all members of the public.
We do not discriminate on the basis of age, color, disability, national origin, race, religion, sex, gender identity, or sexual orientation.
Inquiries regarding the Department’s compliance with Title IX and other civil rights laws may be directed to the Human Resources Director, 75 Pleasant St., Malden, MA 02148-4906. Phone: 781-338-6105.
© 2016 Massachusetts Department of Elementary and Secondary EducationPermission is hereby granted to copy any or all parts of this document for non-commercial educational purposes.
Please credit the “Massachusetts Department of Elementary and Secondary Education.”
This document printed on recycled paper
Massachusetts Department of Elementary and Secondary Education75 Pleasant Street, Malden, MA 02148-4906
Phone 781-338-3000 TTY: N.E.T. Relay 800-439-2370www.doe.mass.edu


Table of Contents
Introduction............................................................................................................................1
Background and Purpose.........................................................................................................1
PART 1: SELECTING REPRESENTATIVE SAMPLES
The Need for Representative Samples.....................................................................................3
Method to Identify Representative Samples............................................................................5
Results from the Representative Sample Study.......................................................................7
PART 2: CONCORDANCE TABLES AND GUIDANCE FOR USE OF DATA
Concordance Tables Comparing MCAS to PARCC Results.......................................................10Introduction...................................................................................................................................10Methods for Generating.................................................................................................................10Composite Performance Index (CPI) Results for PARCC Schools and Districts..................................13
Guidance for Using Representative Samples and Concordance Tables...................................15Concordance Tables.......................................................................................................................15Conducting Analyses at the State Level with Representative Samples............................................15Conducting Analyses that are Not State-Level................................................................................16
References.............................................................................................................................18
Appendix A: Proof-of-Concept Study.....................................................................................19Counts...........................................................................................................................................19Balance..........................................................................................................................................19Replication of 2013–14 Psychometric Results.................................................................................21Replication of 2013–14 Student Growth Percentiles.......................................................................23Replication of 2013–14 Accountability Results...............................................................................24Summary of Results from the Proof-of-Concept Study....................................................................25
Appendix B: Method Used to Select Representative Samples................................................26
Appendix C: Logistic Regression Variables and Results...........................................................29

Introduction
During the 2014–15 school year, school districts in Massachusetts were offered a choice regarding their grades 3–8 summative testing programs: whether to participate in MCAS or PARCC. In order to generate stable trends for the 2014–15 school year, the State embarked on two analytical studies. The first addressed non-equivalence in MCAS and PARCC samples of test-takers through the selection of representative samples from each group. The second estimated MCAS scores for PARCC test-takers to generate Composite Performance Index values (CPIs, which are measures of proficiency for schools and districts).
Although each test was taken by roughly half of the grades 3–8 examinees, demographic differences between the two groups of examinees remained. If left unaddressed, these demographic differences would distort state trends and other analyses. To reduce unintended differences between the two groups of examinees, the Department, with assistance from national testing experts (members of the MCAS Technical Assistance Committee), developed a method to select representative samples from the total samples of examinees taking MCAS and PARCC in 2015. This first analysis produced representative samples of examinees taking MCAS and PARCC that were significantly more similar to each other than the total samples were.
The second analysis used the representative samples produced in the first analysis to match MCAS scores for examinees, by grade and subject/test, to PARCC scores, using an equipercentile linking approach (which links scores across the distributions of the two tests). The resulting data were used to generate CPIs for students, schools, and districts.
This report details the methods used to identify representative samples for MCAS and PARCC test-takers and the methods used to estimate MCAS scores for PARCC examinees, and presents outcomes from both analyses to show how well each study worked. Guidance for using the representative samples is also provided.
Background and Purpose
Massachusetts has administered its Massachusetts Comprehensive Assessment System (MCAS) tests in English language arts and mathematics every year since 1998. In 2010 it joined the PARCC consortium to develop new tests aimed at measuring college and career readiness. In 2013–14 Massachusetts participated in PARCC field testing, and in 2014–15 Massachusetts continued its trial of the PARCC test for a second year while continuing to administer the MCAS.
For the spring 2015 test administration, Massachusetts public school districts serving grades 3 to 8 were offered the option to administer either the MCAS or PARCC tests in English language arts and mathematics.1 Because districts were not assigned randomly to take PARCC or MCAS, the groups of students who took MCAS were likely to be systematically different (i.e., higher- or lower-performing or having different demographic characteristics) than those who took PARCC. When samples
1 The state’s three largest districts (Boston, Worcester, and Springfield) were offered the opportunity to choose PARCC or MCAS school by school rather than district-wide. All districts that selected PARCC had the option of administering the test online or on paper (e.g., choice by mode).
1

systematically differ, it interferes with the ability to observe whether changes in state-level student achievement from one year to the next are due to actual changes in performance or to differences in the samples (or both), and simply combining results from the two assessments will not produce an accurate picture of statewide performance.
To address this issue, the State developed a methodology to identify samples of 2015 MCAS and PARCC test-takers that were representative of all students in the state. These students’ performance would be used to determine how MCAS and PARCC results compared and could be linked. The purposes for doing so were
to report state-level results for 2015, including results from both MCAS and PARCC test-takers; to maintain trends for MCAS results relative to prior years; to calculate student growth percentiles (SGPs) for MCAS and PARCC test-takers; and to calculate accountability levels for all districts and schools; PARCC accountability levels are
calculated using concordance tables that identify associated MCAS score estimates for a range of PARCC scores.
Part 1 of this report explains in further detail the need for representative samples, and describes the methodology the Department used to select them. Part 2 of the report explains the process for generating the concordance tables linking PARCC results to MCAS, and provides guidance about how to interpret and use assessment data from the 2015 school year.
2

PART 1: SELECTING REPRESENTATIVE SAMPLES
The Need for Representative Samples
As expected the students taking MCAS and PARCC were not equivalent, with differences on prior performance and student demographic variables. In terms of numbers, although about 50% of the districts participated in each test0, the number of PARCC test-takers was slightly higher. Table 1 compares the numbers of districts and grades 3–8 students that participated in PARCC and MCAS. The full list of district choices for the 2015 assessments is available on the State PARCC website, in the Excel file (“list by district”).
Table 1: District Assessment Choices for 2015Assessment Choices for Spring 2015*
# of
Districts% of
Districts# of
Students% of
StudentsMCAS 230 55% 197480 47%PARCC 192 45% 225572 53%Total 422 100% 423052 100%
*District counts do not include the three largest districts or any single-school district. Schools in the three largest districts (Boston, Springfield, and Worcester) were assigned either MCAS or PARCC. In single-school districts, 188 districts administered MCAS and 6 administered PARCC.
MCAS and PARCC 2015 test-takers scored similarly on MCAS in 2014, as shown in Table 2. In both English language arts and mathematics, the percentages scoring at each proficiency level are similar across the assessments, with the 2015 MCAS test-takers performing slightly higher at the Advanced level.
0 This estimate does not include single-school districts – 188 out of 194 single-school districts administered MCAS in 2015.
3
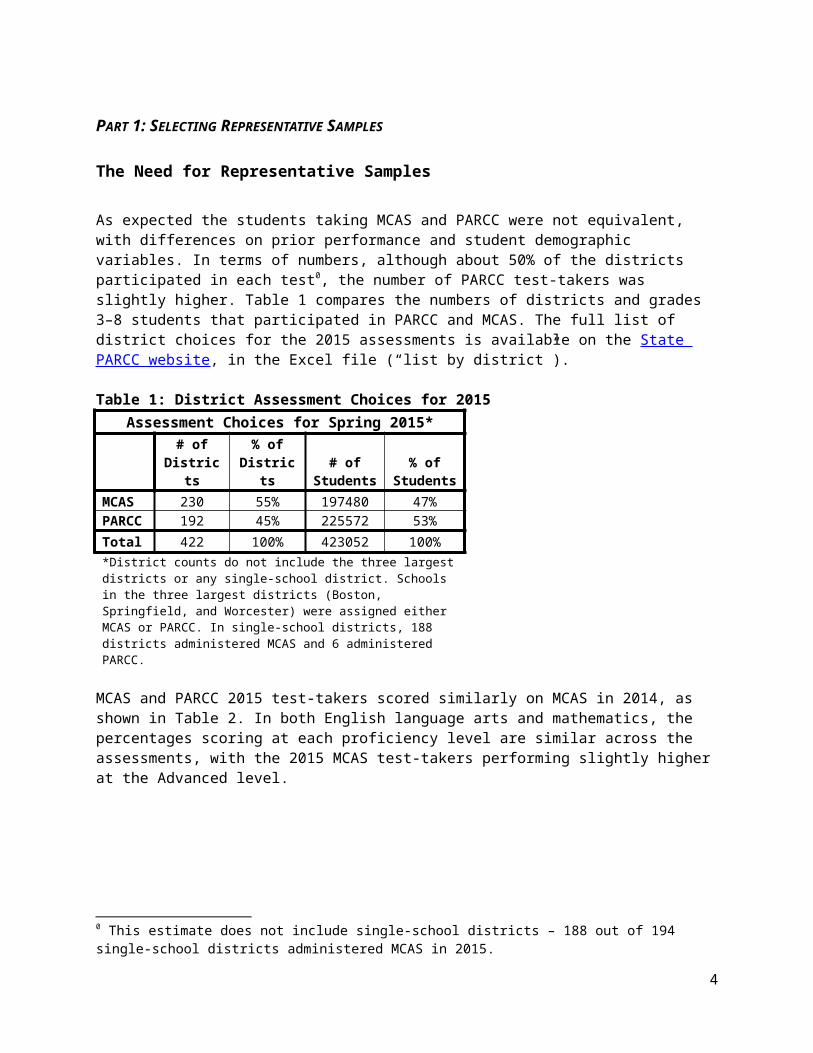
Table 2: 2014 MCAS Results for 2015 MCAS and PARCC Test-TakersGroup Achievement Levels and SGP Differences, Grades 3–8
2014 Average MCAS & PARCC
Test-Takers
2014 MCAS Results of 2015
MCAS-takers
2014 MCAS Results of 2015 PARCC-takers
ELA Achievement Level: Advanced 14.4% 15.1% 13.8%ELA Achievement Level: Proficient 52.6% 52.8% 52.4%ELA Achievement Level: Needs Improvement 25.2% 24.3% 26.0%ELA Achievement Level: Warning 7.8% 7.9% 7.8%ELA Student Growth Percentile 50.1 50.2 49.9Total Number ELA 410811 187465 223346Math Achievement Level: Advanced 24.7% 25.5% 24.1%Math Achievement Level: Proficient 33.3% 33.5% 33.3%Math Achievement Level: Needs Improvement 27.5% 26.7% 28.1%Math Achievement Level: Warning 14.5% 14.3% 14.6%Math Student Growth Percentile 50.2 50.6 49.8Total Number Math 412005 187704 224301
Table 3 compares MCAS and PARCC test-takers by demographic characteristics. The demographic differences between the two are somewhat larger than the achievement differences, driven in part by the decision in some large school districts to administer PARCC. Overall, students with higher needs are more heavily weighted in the PARCC sample.
4

Table 3: 2014 Demographics for 2015 MCAS and PARCC Test-TakersGroup Demographic Differences, Across Grades
2014 Overall Population
2015 MCAS-takers
2015 PARCC-takers
Ever ELL 14.5% 15.1% 17.0%High Needs* 49.1% 47.5% 54.0%Free/Reduced Lunch** 39.1% 36.7% 44.8%Race: AA/Black 8.3% 5.1% 11.0%Race: Asian 6.2% 7.5% 6.0%Race: Hispanic 16.4% 17.3% 18.8%Race: White 66.0% 67.2% 60.7%Race: More than One 3.0% 2.9% 3.1%Race: Other 0.3% 0.3% 0.4%Race: AA/Hispanic 24.6% 22.5% 29.8%No Special Needs Services 81.8% 81.1% 81.3%Minimal Hours Special Needs Services 2.7% 2.7% 2.7%Low Hours Special Needs Services 3.6% 3.4% 3.5%Moderate Hours Special Needs Services 9.6% 9.3% 9.2%High Hours Special Needs Services 2.2% 3.4% 3.3%Total N 442982 202938 240044*High Needs Students belong to at least one of these groups: current/former English Language Learner (ELL), low income, student with disabilities.**2014 Values, Imputed.
Although the demographic differences between MCAS and PARCC test-takers are not great, they are large enough to call into question whether the two groups can fairly be compared without making an adjustment for selection bias.
Method to Identify Representative Samples
The process used to identify representative samples involved matching each of the 2015 testing populations (MCAS test-takers and PARCC test-takers) to the characteristics of the overall 2014 MCAS population using student-level data. (The Department chose 2014 as the target population because 2014 was the last year for which the state has statewide results on a single assessment: MCAS). By removing from each 2015 sample those test-takers who were most dissimilar to the 2014 test-takers, the Department was able to create two 2015 samples that are well-matched to the 2014 student population. By definition, the two 2015 samples are also roughly equivalent. This matching process is represented visually in the logic model in Figure 1.
5

Figure 1: Logic Model for the Sample-Matching Study
The methodology for selecting representative samples is a variation of propensity score matching, a statistical technique commonly used to estimate the impact of a treatment when participants are not randomly assigned to it (Angrist & Pischke, 2009; Austin, 2011; Murnane & Willett, 2011; Rosenbaum, 2010). The situation here is not precisely analogous, as the self-selection into the MCAS or PARCC test is determined by districts, not by student characteristics. But the principle applies nonetheless: we can identify a representative sample of students who are similar to one another in all measurable ways except the assignment of taking MCAS or PARCC. We can then use these representative groups to estimate state findings.
The propensity score matching conducted in this analysis used prior MCAS results and student demographic variables to match test-takers in each sample (MCAS and PARCC) in the current year to the population of test-takers in the prior year. (It should be noted that prior MCAS results were emphasized in the analysis, resulting in better balance on prior achievement than on demographic variables, although it will be shown that the method worked to create better balance on both sets of variables.) The method worked by removing test-takers who were more unlike the prior year’s population of test-takers, creating two sets of representative samples comprised of test-takers more like those of the prior year’s population of students.
Results using this methodology were evaluated in a “proof-of-concept study” that applied the method to draw representative samples in 2014 that were equivalent to the population of examinees in 2013. If the method worked well, then we would expect to get identical results for analyses conducted in 2014, which we did. The four critical checks conducted and the results were
1) The prior achievement and key demographic variables looked similar across the samples and were similar to the prior year’s data (2013).
2) The MCAS cut scores (i.e., the raw scores that correspond with the MCAS achievement levels of “220, Needs Improvement,” “240, Proficient,” and “260, Advanced”) were replicated for the representative sample of examinees assigned to MCAS in 2014.0
0 Each year, the current year’s MCAS results are linked to the prior year’s results using a method called “equating.” The equating method identifies the raw scores for each MCAS achievement level (e.g., 220 is Needs Improvement) that yield consistent measurements from the year prior. In other words, the equating method establishes consistency in the MCAS measurement scales.
6

3) The student growth percentiles (SGPs) had a uniform (flat) distribution with a median at or near 50.0 The majority of SGPs generated using the representative samples were the same as or very close to the actual SGPs.
4) School- and district-level accountability results were nearly equivalent to what was reported in 2014 for both samples.
The proof-of-concept study provided evidence that the methodology worked well. Consequently, the State should be able to use the representative samples as the data source for psychometric and analytical work and still obtain the same results as it would have if it had used the full sample. A full presentation of the evidence from the proof-of-concept study is presented in Appendix A.
The proof-of-concept study also allowed the State to establish the methodology for selecting the samples prior to the generation of 2015 assessment data, to avoid any concern that the State might select a sampling strategy that would advantage students who took one or the other assessment.
Using a slightly refined methodology, the same analysis used in the proof-of-concept study was conducted for 2015 to select representative samples of MCAS and PARCC test-takers from the 2015 administration, measuring their representativeness by the characteristics of the state in 2014. Further details on the matching methodology are provided in Appendix B.
Results from the Representative Sample Study
The number of overall test-takers and the number of students selected for each representative sample are shown in Table 4.
Table 4: PARCC and MCAS Samples for 2015PARCC and MCAS Samples, 2015
MCAS PARCC
Total MCAS
MCAS Rep.
SampleMCAS %
RemovedTotal
PARCC
PARCC Rep.
SamplePARCC % Removed
Grade 3 33251 25086 25% 39534 29704 25%Grade 4 33205 25324 24% 39114 30026 23%Grade 5 33962 26058 23% 39828 30416 24%Grade 6 33978 25357 25% 40284 30198 25%Grade 7 33579 26154 22% 40327 30624 24%Grade 8 34963 26252 25% 40957 31209 24%
Total 202938 154231 24% 240044 182177 24%
Approximately 75 percent of test-takers were retained in each representative sample. Retaining a large N was important to minimize error, particularly for down-the-line calculations such as student growth percentiles that depend on a large amount of student data to be estimated accurately.
Looking first at how well the representative samples are matched to the population in 2014 and to each other, Tables 5 and 6 demonstrate that the MCAS and PARCC samples are well-matched to the state on 0 Student growth percentiles, by definition, have a flat, uniform distribution with a median of 50 and a roughly equal percentage of students in each percentile, from 1 to 99.
7

students’ prior performance and demographic characteristics. As shown in Table 5, the MCAS sample is nearly identical on prior performance to MCAS test-takers as a whole, but the PARCC representative sample selects disproportionately from higher-performing PARCC test-takers to make the sample more similar to the state.
Table 5: Comparison of Achievement Outcomes for MCAS and PARCC Test-Takers, by Grade and Sample, to 2014 MCAS Population
Comparison of Achievement Outcomes for 2015 Test-Takers, by Grade and Sampleto 2014 Population
2014 MCAS Population
Average
All 2015 MCAS Test-
Takers
All 2015 PARCC Test-
Takers2015 Rep.
Sample MCAS
2015 Rep. Sample PARCC
Gr. 3 * 53% 54% 51% 53% 53%Gr. 4–8** 50% 51% 49% 51% 51%Average Ach. Gr. 4–8*** 58% 58% 55% 56% 56%*2014 Achievement Outcome Grade 3: Estimated percent scoring Proficient+ on MCAS ELA & Math, by school and demographic group **2014 Achievement Outcome Grade 4–8: Percent scoring Proficient+ on MCAS ELA & Math***Average percent of examinees scoring Proficient+ on 2014 MCAS ELA and Math, separately
As shown in Table 6, the MCAS and PARCC representative samples are fairly equivalent across most demographic comparisons. The largest differences are identified in the Black/African American and High Needs categories, again likely stemming from the choice of some large school districts to administer PARCC. The representative samples do balance this difference somewhat, but the PARCC representative sample still has slightly higher percentages of test-takers in these categories (along with fewer White students) than the 2014 Population and the 2015 representative sample for MCAS. In addition, the PARCC sample has slightly more examinees who were English language learners or who received free- or reduced-priced lunch in 2014.
Table 6: Comparison of Demographics for 2015 MCAS and PARCC Test-Takers to 2014 Population of Examinees
Comparison of 2015 Demographics to 2014 Examinee Population
Demographic 2014 Population
All 2015 MCAS-Takers
All 2015 PARCC-Takers
2015 Rep. Sample MCAS
2015 Rep. Sample PARCC
Ever ELL 14.7% 15.1% 17.0% 14.2% 16.7%High Needs* 47.2% 47.5% 54.0% 46.0% 47.9%Free Lunch (2014, imp.)** 38.0% 36.7% 44.8% 35.6% 39.7%Race: Black/African American 8.5% 5.1% 11.0% 5.7% 10.8%Race: Asian 5.8% 7.0% 5.9% 7.0% 6.4%Race: Hispanic 15.3% 17.3% 18.8% 16.0% 16.0%Race: White 67.7% 67.2% 60.7% 67.9% 63.6%Race: Other 0.3% 0.3% 0.4% 0.3% 0.4%Special Education 16.9% 17.7% 17.6% 17.2% 15.8%*Students in the High Needs category belong to any of these groups: special education, low-income, and ELL or ever-ELL students
8

**Free lunch values were estimated for students with missing values
Student growth percentiles (SGPs) generated for 2015 MCAS and PARCC (provided in Table 7) show a median at or near 50 in all grades for the representative samples, while there is a greater departure from 50 for examinees not included in the representative samples. Across all test-takers in the state, SGPs hover at or near a median of 50, as expected.
Table 7: Statewide ELA SGPs for 2015, by SampleComparison of Median Student Growth Percentiles,
by Testing Program and Sample
Group Grade
PARCC Sample MCAS SampleELA Math ELA Math
Median Number Median Number Median Number Median NumberSelected 04 50 26321 50 26289 50 22176 49 22283
05 50 27052 50 27196 50 23451 50 2362106 50 26625 50 26656 50 22640 50 2259707 50 26166 50 26156 50 23180 51 2322208 50 27127 50 27070 50 23267 50 23297
Un-Selected
04 52 8126 49 8049 53 7441 50 748105 48 7566 50 7621 46 6945 51 705506 49 8205 50 8166 50 7742 52 780007 49 8095 48 8128 50 6932 48 691408 47 7835 50 7944 50 7780 50 7811
Total 04 50 34447 50 34338 50 29617 49 2976405 50 34618 50 34817 49 30396 50 3067606 50 34830 50 34822 50 30382 50 3039707 50 34261 50 34284 50 30112 50 3013608 50 34962 50 35014 50 31047 50 31108
9

PART 2: CONCORDANCE TABLES AND GUIDANCE FOR USE OF DATA
Concordance Tables Comparing MCAS to PARCC Results
Introduction
This section of Part 2 describes the methods and outcomes for the MCAS and PARCC concordance studies. The selection of representative samples enabled greater accuracy when comparing MCAS to PARCC outcomes, and also allowed the State to calculate achievement trends for the 2015 test administrations. The concordance work allowed the State to directly compare PARCC to MCAS results using an equipercentile approach and concordance tables.
Methods for Generating Concordance Tables Comparing MCAS to PARCC Results
The representative samples were used to generate concordance tables that estimate MCAS scores based on PARCC test-takers’ results. The concordance tables serve two primary purposes:
1. to provide a better understanding of the relationships between the new PARCC test scores and MCAS scores
2. to enable use of PARCC results in the State’s accountability formulas, which involve four-year trends
The equipercentile method, which identifies comparable test scores across two different tests using student achievement percentiles generated from each set of test results,0 was used to generate the concordance tables. The equipercentile method is appropriate because a) the two tests measure similar educational standards (the PARCC assessments measure the Common Core State Standards, and the Massachusetts Curriculum Frameworks are based on the Common Core State Standards0), and b) the representative samples drawn from the prior year’s population appear to satisfy the single-subject requirement (see “single-subject requirement,” Kolen & Brennan, 2004, pp. 293–294).0 Additionally, the equipercentile method for estimating MCAS scores from PARCC scores also works under the given conditions of a) non-linear relationships between test scales, b) differences in test difficulty, and c) the need to have accurate estimated MCAS scores across the PARCC scaled-score continuum (Kolen & Brennan, 2004, p. 294).
With the equipercentile method, the representative sample of test-takers for each test are first ranked from lowest to highest with scores matched to percentiles.0 The graphs in Figure 2 show the distribution 0 Student achievement percentiles are synonymous with student score rankings. To generate the percentiles in this application, results on either test were ranked from low to high and assigned a percentile from 0 to 100 (this range was used to provide more differentiation at the ends of the score distribution on MCAS).0 See: http://www.doe.mass.edu/candi/commoncore/, document #1.0 The single subject requirement stipulates that a single group of test-takers sit for both exams. Since almost all Massachusetts test-takers took MCAS in 2014, the State, using the representative samples approach, identified 2015 test-takers in both the MCAS and PARCC groups that were nearly equivalent to the population of examinees in 2014. As illustrated in Figure 1 on p. 5, once the representative samples are found to approximate the comparison population, they are also considered approximately equivalent to each other.0 Percentiles were calculated on student ability measures (thetas), which underlie each of the scaled scores. Percentile buckets ranged from 0 to 100 with each bucket identifying one percentile. “0” and “100” were retained in the analysis to provide additional differentiation of student achievement at the ends (bottom and top) of the
10

of MCAS and PARCC scaled scores by percentile. For each test, as the percentile increases, the scaled score increases in a logistic manner (i.e., in a non-linear fashion that is bounded by 0 and 1— or in this case, 0 and 100).
Figure 2: Distribution of Grade 4 ELA and Math Scaled Scores by Percentile for MCAS and PARCC
This example illustrates two issues. First, the MCAS scale did not stretch out across all of the percentiles computed, so gaps are noted in Graph 1. To address these gaps, MCAS scores were repeated across percentiles so there was an estimated MCAS score for every percentile. Second, the scale did not stretch completely from the beginning to the end of the distribution for some grades and subjects (in grade 3 ELA, for example, the MCAS score that mapped to the “0” percentile is 206 and not 200, as shown in Table 8).
The MCAS estimates for each percentile were then mapped on the PARCC percentiles so that every student with a valid PARCC score also received an estimated MCAS score. Table 8 shows a portion of the concordance table for grade 4. Estimated MCAS scores by PARCC scaled scores are shown for percentiles that range from 0 to 10 and from 51 to 61. Looking at the first row of results, PARCC fourth-grade test-takers who had a valid scaled score from 650 to 668 on the ELA exam received an estimated MCAS score of 206. In Math, fourth-grade test-takers with a valid PARCC score that ranged from 650 to 676 received an MCAS scaled score of 206. Toward the middle of the PARCC scale, fourth-graders who received a PARCC ELA scaled score that ranged from 756 to 757 received an estimated MCAS scaled score of 240. The full set of concordance tables, by grade, is published here, in the “Spring 2015 Grades 3–8 MCAS and PARCC Concordance Tables.”
distribution.
11

Table 8: Segment of Concordance Table for PARCC and MCAS, Grade 4, ELA and MathConcordance: MCAS and PARCC by Percentile, Grade 4
Percentile PARCC ELA SS
MCAS ELA SS
PARCC Math SS
MCAS Math SS Percentile PARCC
ELA SSMCAS ELA SS
PARCC Math SS
MCAS Math SS
0 650 to 668 206 650 to 676 206 51 756 to 757 240 748 to 748 2381 668 to 681 208 676 to 685 210 52 757 to 758 240 748 to 749 2382 681 to 689 210 685 to 690 214 53 758 to 758 240 749 to 750 2383 689 to 694 214 690 to 694 214 54 759 to 759 240 750 to 751 2404 694 to 698 214 694 to 697 214 55 759 to 760 240 751 to 752 2405 698 to 701 214 697 to 699 216 56 760 to 761 242 752 to 753 2406 701 to 704 216 699 to 701 216 57 761 to 762 242 753 to 753 2427 704 to 707 216 701 to 704 216 58 762 to 763 242 753 to 754 2428 707 to 709 216 704 to 705 218 59 763 to 763 242 754 to 755 2429 709 to 711 218 705 to 707 218 60 763 to 764 242 755 to 756 242
10 711 to 713 218 707 to 709 218 61 764 to 765 244 756 to 757 244
The graphs in Figure 3 display the relationship between PARCC and MCAS scaled scores for ELA and Math at grade 4. The graphs show the gradual increase of MCAS scores as PARCC scores increase, as well as the range of PARCC scores associated with each concordant MCAS score.
Figure 3: Relationship Between MCAS and PARCC Scaled Scores for Grade 4 ELA and Math
A similar equipercentile method, using the SGP and Equate packages through the statistical platform, R (Albano, 2014, Betebenner, 2015), was applied for eighth-graders taking the PARCC Algebra I test. This methodology better adjusted the MCAS math score estimates for the higher-achieving eighth-graders taking Algebra 1 by accounting for students’ prior achievement. The resulting concordance table for the Algebra 1 test features ranges of estimated scores for both MCAS and PARCC, as shown by the segment provided in Table 9.
12

Table 9: Segment of PARCC to MCAS Concordance Table for Algebra 1, Grade 8Concordance: MCAS and PARCC by Percentile, Algebra I
Percentile PARCC Math SS
MCAS Math SS Percentile PARCC
Math SSMCAS Math
SS0 677 to 694 214 to 218 51 772 to 773 252 to 2541 695 to 706 218 to 220 52 773 to 774 254 to 2542 706 to 714 218 to 220 53 774 to 775 254 to 2543 714 to 720 220 to 222 54 775 to 775 254 to 2544 720 to 723 222 to 222 55 775 to 776 254 to 2545 723 to 726 222 to 224 56 776 to 777 254 to 2566 726 to 727 224 to 224 57 777 to 777 256 to 2567 727 to 731 224 to 226 58 777 to 778 256 to 2568 731 to 733 226 to 228 59 778 to 779 256 to 2569 733 to 735 228 to 228 60 779 to 780 256 to 256
10 735 to 737 228 to 230 61 780 to 780 256 to 256
Composite Performance Index (CPI) Results for PARCC Schools and Districts
Estimated MCAS scores from the concordance study were used to generate Composite Performance Indices (CPIs) for school- and district-level accountability purposes. Although schools and districts taking PARCC for the first time in 2015 were “held harmless” from negative accountability decisions, the CPIs were reported and are part of the historical record.
CPIs were generated from the estimated MCAS scores using the standard formula, as shown in the first column of Table 10. Table 10 provides the range of PARCC scores associated with each CPI level in ELA and Math for grades 3 through 8.
Table 10: PARCC Values for CPIs2015 PARCC Composite performance Index (CPI) Concordance Table
CPI Points per Student
PARCC Scaled ScoresGrade 3 Grade 4 Grade 5 Grade 6 Grade 7 Grade 8
ELA Math ELA Math ELA Math ELA Math ELA Math ELA Math Alg 01100 (240-280) 745-850 735-850 754-850 750-850 743-850 740-850 741-850 741-850 746-850 746-850 727-850 743-850 749-85075 (230-238) 720-745 724-735 737-754 729-750 725-743 728-740 726-741 725-741 737-746 737-746 712-727 729-743 736-74850 (220-228) 691-720 708-724 717-737 709-729 711-725 712-728 713-726 701-725 726-737 726-737 695-712 712-729 705-73525 (210-218) 668-691 667-708 681-717 676-709 677-711 686-712 674-713 662-700 692-723 692-723 662-695 667-712 672-7040 (200-208) 650-668 650-667 650-681 650-676 650-677 650-686 650-674 650-662 650-692 650-692 650-662 650-667 659-672
The average CPIs were compared by grade level, test, and testing group. Comparisons by CPIs across groups (representative sample vs. total sample), by grade, are provided in Tables 11 and 12. In all cases except for one, the CPI differences across the MCAS and PARCC examinees are smaller for the representative sample group than for the total sample. Differences for all representative sample groups are “1” or less, indicating that the CPIs are fairly comparable across the tests.
13

Table 11: Comparison of CPIs by Test and Testing Group, ELAComparison of CPIs, by Test and Testing Group, ELA*
PARCC MCAS PARCC - MCAS
Median Mean Valid N Median Mean Valid N Difference ES*
Repr
esen
tativ
e Sa
mpl
e
03 100 82.49 28075 100 83.48 24104 -0.99 -0.0404 100 77.63 27859 100 78.60 23908 -0.97 -0.0405 100 87.09 28504 100 87.35 24810 -0.26 -0.0106 100 86.63 28006 100 86.70 23968 -0.07 0.0007 100 86.28 28005 100 87.14 24672 -0.86 -0.0408 100 92.17 28647 100 91.52 24481 0.65 0.03
Tota
l
03 100 81.25 36901 100 83.30 32297 -2.06 -0.0804 100 78.91 36431 100 81.03 32256 -2.12 -0.0805 100 84.83 37105 100 85.95 32915 -1.12 -0.0506 100 85.28 37204 100 86.27 32806 -0.99 -0.0407 100 86.29 36909 100 88.17 32371 -1.88 -0.0808 100 91.09 37368 100 90.97 33116 0.12 0.01
*ES = Effect Size
Table 12: Comparison of CPIs by Test and Testing Group, MathComparison of CPIs, by Test and Testing Group, Math**
PARCC MCAS PARCC - MCAS
Median Mean Valid N Median Mean Valid N Difference ES**
Repr
esen
tativ
e Sa
mpl
e
03 100 85.28 28089 100 85.45 24104 -0.17 -0.0104 75 76.96 27880 75 77.32 23908 -0.36 -0.0105 100 83.18 28466 100 83.71 24810 -0.53 -0.0206 100 81.19 27995 100 81.57 23968 -0.38 -0.0107 100 72.30 27754 100 73.18 24672 -0.88 -0.0308 100 78.05 24956 100 78.85 24481 -0.80 -0.03Alg. 1* 100 92.43 3558
Tota
l
03 100 84.22 36942 100 85.43 32297 -1.21 -0.0504 75 78.32 36461 100 79.90 32256 -1.58 -0.0605 100 79.53 37085 100 81.42 32915 -1.88 -0.0706 100 79.10 37194 100 81.11 32806 -2.01 -0.0707 100 72.48 36593 100 75.82 32371 -3.33 -0.1108 100 75.52 32984 100 78.40 33116 -2.88 -0.10Alg. 1* 100 91.54 4264
*Algebra 1 taken by eighth-graders.**ES = Effect Size
The last column in both Table 11 and Table 12 shows the effect size of the differences between the two groups. Effect sizes indicate the “standardized mean difference” between two groups. Basic rules indicate that effect sizes of 0.2 or less indicate small differences, and effect sizes near 0 indicate almost no difference (Becker, 2000). It should be noted, however, that smaller differences tended to favor the MCAS examinee group (with the MCAS group showing slightly higher achievement than the PARCC group).
14

Guidance for Using Representative Samples and Concordance Tables
Concordance Tables
LocationsEstimated MCAS results that correspond with PARCC scores are available in the concordance tables and are linked to PARCC results in several datasets, as shown in Table 13. Because CPIs for PARCC test-takers, schools, and districts are calculated using concordant MCAS scores, CPIs also provide information of MCAS concordance with PARCC.
Table 13: Datasets Containing PARCC to MCAS Concordance ResultsDatasets Containing PARCC to MCAS Concordance Results
Dataset Name Description LocationResearch Files (student level)
De-identified student-level files
Request access: www.doe.mass.edu/infoservices/research
School and District PARCC Results
Full set of PARCC data with MCAS concordance results and CPIs included
School/District Dropboxes
MCAS Achievement Distribution and Growth Reports
A collection of reports that provide results by MCAS performance levels and by CPIs based on MCAS levels
Edwin Analytics, see: PE334, PE434, PE305, PE405, among others
CautionsThere are several things to keep in mind when using concordance scores. First, because test-takers took only one of the tests (PARCC or MCAS), the concordant results approximate, but are not exactly the same as, the results test-takers would have gotten if the alternative test had been administered. Users are cautioned against making consequential decisions based on a single test score, a single two-year comparison, or a single analysis, particularly when estimated scores are being used. Second, due to the requirements for conducting concordance studies (described on page 10), the concordance results are specifically applicable to 2015. A refinement of this approach will be used to generate concordance tables for 2016. 0 It is anticipated that while the 2015 concordance tables apply primarily to 2015, the 2016 tables will be applicable to both 2015 and 2016. Analyses using concordance tables applied to non-designated years should be used with strong caution. Third, concordance results for PARCC were identified without consideration of the mode of administration (paper or online); therefore, no adjustments were made for any differences that may be attributable to mode.
0 Refined concordance tables for 2016 will be published on the Department’s website by summer 2016.
15

Conducting Analyses at the State Level with Representative Samples
In 2015, datasets and data reports with state-level results provide information on the representative samples either by reporting state-wide results only for representative samples (as is done in Edwin Analytics), or by providing a “representative samples flag” (a column of “1s” that denote the cases [students] that belong to the representative samples for each test). The representative samples are useful for comparing state-level results from 2015, either in their entirety or disaggregated by the demographic groups studied in this paper, and are useful for comparing to state-level results in prior or subsequent years. Data users conducting their own analyses are encouraged to apply the representative samples flags, which will be available in all state-wide data sets, when using 2015 state-level results in analyses.
As shown in Figure 4, when representative samples are reported for state-level results, a superscript (¹) in the report links to a footnoted description of how those representative samples are used.
Figure 4: State-Level Results Based on Representative Samples in 2015
Conducting Analyses that are Not State-Level
Representative samples are not applicable to smaller units of analysis (e.g., analyses at the school- or district-level) because these samples were identified for state-level use only. In situations where students within a school or a district took the same test two years in a row, year-to-year comparisons can be made using typical procedures (e.g., comparing across student demographic groups using the scaled scores).
Scaled-score comparisons should only be made using scores on the same scale. Therefore, if a school or district changed from administering the MCAS tests in 2014 to administering the PARCC tests in 2015, then scaled score comparisons should be made by applying estimated results from the concordance tables for 2015 and/or the concordance tables for 2016.
16

SGPs and CPIs can also be used in comparing groups or in evaluating trends over time. However, once again, caution is advised when rendering judgments based on small differences between transitional 2015 SGPs or CPIs and traditional SGPs or CPIs generated from MCAS data.
Data users may wish to take mode into consideration when conducting analyses with PARCC data, based on potential mode differences (paper versus online) resulting from variations in prior experience with online testing. For example, users may wish to take caution when comparing PARCC results across schools with different administration modes, or when comparing year-to-year results that involve different mode administrations. The Department has identified the 2015 PARCC test mode for each school and district in the file titled list by district. In addition, a variable denoting mode is provided in the 2015 research files, which can be requested here.
17

References
Albano, A. D. (2014). equate: an R Package for Observed-Score Linking and Equating. Retrieved from: https://cran.r-project.org/web/packages/equate/vignettes/equatevignette.pdf.
Angrist, J. D., & Pischke, J-S. (2009). Making regression make sense In J. D. Angrist and J-S. Pischke (Eds.) Mostly Harmless Econometrics, An Empiricist’s Companion (pp. 8094). Princeton, NJ: Princeton University Press.
Betebenner, D. (2012). On the Precision of MCAS SGPs. Presentation given to the MCAS Technical Assistance Committee, April 2013.
Betebenner, D. (2015, February 19). SGP: An R Package for the Calculation and Visualization of Student Growth Percentiles & Percentile Growth Trajectories. Retrieved from: https://cran.r-project.org/web/packages/SGP/SGP.pdf.
Becker, L. A. (2000). Effect Size (ES). Retrieved from: http://www2.jura.uni-hamburg.de/instkrim/kriminologie/Mitarbeiter/Enzmann/Lehre/StatIIKrim/EffectSizeBecker.pdf.
Honaker, J., King, G., & Blackwell, M. (2014, November 14). Amelia: Multiple Imputation of Incomplete Multivariate Data. Retrieved from: https://cran.r-project.org/web/packages/Amelia/Amelia.pdf.
Ho, D. E., Imai, K., King, G., & Stuart, E. A. (2007, January 31). Matching as nonparametric preprocessing for reducing model dependence in parametric causal inference. Political Analysis, 15, pp. 199–236. Retrieved from: http://gking.harvard.edu/files/matchp.pdf.
Ho, D. E., Imai, K., King, G., & Stuart, E. A. (2011, June 28). MatchIt: Nonparametric Preprocessing for Parametric Causal Inference. Retrieved from: http://raptor1.bizlab.mtsu.edu/s-drive/TEFF/Rlib/library/MatchIt/doc/matchit.pdf.
Kolen, M. J., & R. L. Brennan. (2004). Test Equating, Scaling, and Linking: Methods and Practices, 2nd Ed. New York, NY: Springer Science+Business Media, Inc.
Murnane, R. J. & Willett, J. B. (2012). Dealing with selection bias in nonexperimental data In R. J. Murnane and J. B. Willette (Eds.) Methods Matter: Improving Causal Inference in Educational and Social Science Research (pp. 304–331). NY, NY: Oxford University Press.
Rosenbaum, P. R. (2010). Design of Observational Studies. New York, NY: Springer Science+Business Media, Inc.
Rosenthal, R, and Rubin, D.B. (1982). A simple, general purpose display of magnitude of experimental effect. Journal of Educational Psychology, 74, pp. 166–169.
18

Appendix A: Proof-of-Concept Study
Results from the proof-of-concept study were examined to evaluate and refine the models. The proof-of-concept study compared 2013–14 representative sample results with 2012–13 population-level results, allowing for a direct examination of how well the matching models worked with respect to four key factors:
1. Balance on prior achievement and key demographic variables between the 2013–14 representative samples and the 2012–13 population; a direct comparison between the MCAS and PARCC groups in 2013–14 was also conducted
2. Replication of 2013–14 MCAS psychometric results in the representative samples (the replication of cut scores was examined)
3. Replication of the 2013–14 student growth percentiles in the representative samples4. Similarity of school- and district-level accountability results in 2013-14.
Counts
In the 1:1 matching of the 2013–14 examinees to the 2012–13 examinees, a designated percentage (~13–14%) of examinees is removed from the self-selected samples. The removed examinees are more dissimilar to the prior year’s population of examinees than those selected for the representative samples. The numbers of examinees included and removed from the representative samples in the proof-of-concept study, by grade, is shown in Table A1.
Table A1: PARCC and MCAS Samples, Proof-of-Concept StudyPARCC and MCAS Samples, 2014 Proof-of-Concept Study
Grade
MCAS PARCC
Total MCAS
MCAS Rep. Sample
MCAS % Removed
Total PARCC
PARCC Rep.
Sample
PARCC % Removed
3 29686 26119 12% 35579 31120 13%4 30719 26183 15% 35461 31054 12%5 30644 26318 14% 35584 31110 13%6 30041 26708 11% 35931 31194 13%7 31393 26636 15% 36456 31686 13%8 31850 26988 15% 36317 31775 13%
Total 184333 158952 14% 215328 187939 13%
Balance
Balance refers to the comparability of groups according to the demographic variables studied. When two groups are equivalent across a large range of relevant demographic variables, they are said to be balanced or equivalent (Ho, Imai, King, and Stuart, 2007). The goal of drawing representative samples was to generate two sets of samples that were each more comparable to the prior year in terms of student demographics and prior achievement than were their respective overall groups of examinees. For the two 2014 representative samples, results on balance showed that the matching procedures resulted in better matching both to the previous year’s population and to each other, in terms of achievement and demographic variables.
19

Table A2 shows the results of matching for the criterion (achievement) variables. Achievement results did not differ much for examinees in the 2014 unmatched samples; however, the matching procedure achieved better balance on these variables. The columns in the table show the following achievement results:
population average in 2013 average of all 2014 MCAS examinees average of selected (matched) MCAS examinees average of all 2014 PARCC examinees average of selected PARCC examinees
The first two rows provide comparisons for the grade 3 and the grades 4–8 criterion variables. The third row provides the average for two achievement variables for grades 4–8. With respect to MCAS achievement variables, there is very little change achieved from the matching, as the overall MCAS group results were already close to the mean. For PARCC test-takers, however, very low-scoring examinees were removed from the PARCC sample, putting it more closely in line with both the MCAS sample and the 2013 population results. The selected samples are nearly identical to the population and to each other.
Table A2: Comparison of 2014 Samples to Population Achievement Results, by GroupComparison to Achievement Outcomes for 2014 Test-Takers,
by Grade and Sample to Population2013 Pop. Average
All 2014 MCAS Test-Takers
2014 MCAS Rep. Sample
All 2014 PARCC Test-Takers
2014 PARCC Rep. Sample
Gr. 3 * 60% 63% 62% 57% 60%Gr. 4–8** 51% 52% 50% 50% 51%Average Ach. Gr. 4–8*** 63% 61% 60% 59% 60%*2013 Achievement Outcome, Grade 3. Estimated percent scoring Proficient+ on MCAS ELA & Math, by school and demographic group **2013 Achievement Outcome Grade 4-8: Percent scoring Proficient+ on MCAS ELA & Math***Average percent of students scoring Proficient+ on 2013 MCAS ELA and Math, separately
Table A3 presents similar population and group outcomes for demographic comparisons. Adjustments to group demographic proportions are larger for some categories than for others. The largest group differences are noted on the Race: Black/African American, High Needs, and Free Lunch categories. After matching, the MCAS and PARCC samples are brought more closely in line to the population proportions, with the MCAS group having slightly fewer examinees in these categories and the PARCC group having slightly more.
20

Table A3: Comparison of 2014 Demographic Characteristics (Proportions), by GroupComparison of Group Demographics to the 2013 Population of Examinees
2013
Population
All 2014 MCAS
Test-Takers2014 MCAS Rep. Sample
All 2014 PARCC
Test-Takers2014 PARCCRep. Sample
Race: Black/African American 8.2% 5.1% 5.7% 11.0% 10.4%Race: Hispanic 15.8% 15.6% 16.5% 16.9% 16.3%Race: White 67.0% 69.6% 67.6% 63.1% 64.0%Race: Asian 5.9% 6.5% 6.8% 5.6% 5.8%Free Lunch (2013, imp)* 37.5% 34.4% 36.0% 41.8% 39.6%High Needs** 47.5% 45.4% 47.4% 52.1% 49.9%Special Education 18.0% 18.1% 19.1% 18.0% 17.8%Ever-ELL 14.1% 13.5% 14.0% 15.3% 15.0%*Free lunch values were estimated for students with missing values **Students in the High Needs category belong to any of these groups: special education, low income, and ELL or ever-ELL students
Replication of 2013–14 Psychometric Results
Measured Progress, the testing contractor for MCAS, evaluated the impact of the representative samples approach on the cut scores assigned to MCAS for the 2014 test administration. The evaluation involved re-running the 2014 MCAS results using the representative samples from the proof-of-concept study. The comparison of the number of raw score points assigned to each cut score is provided in the last two columns of Table A4. In the table, the “2014 Actual” column provides the number of raw score points actually assigned to each cut score in 2014 and the “Rep. Sample” column (shaded green) indicates the number of raw score points that would be assigned to each cut score using the representative samples.
Comparisons for four tests/grade combinations are presented. As is shown, the number of raw score points assigned to each cut score using the representative samples matched the actual raw score cuts in 2014 for the four test/grade combinations studied except in one instance (Math Grade 4, W/F to NI) where one raw score point difference is noted. Measured Progress psychometricians indicated that this small difference is anticipated with re-analyses and that the results were nearly equivalent.
A second check of the representative samples was conducted by comparing graphs of student results for the four test/grade combinations studied. The graphs in Figure A1 depict examinees’ expected raw scores (Expected Total Score) by examinees’ ability measures (Theta) for the 2014 Actual population results (red dashed line) and the results based on the representative samples (‘2015 Matched’ – blue line – which denotes the 2014 test characteristic curves based on the representative samples). As is shown in the graphs, the examinees’ expected results for the 2014 populations of students and the 2014 representative samples are nearly identical in all instances, indicating that the use of the representative samples yields equivalent results to those generated with the population-level data.
21

Table A4: Replication of 2014 MCAS Results with Representative Samples2014 Comparison of MCAS Actual Cut Scores and
Cut Scores from Representative SamplesTest Cut 2014 Actual Rep. Sample
ELA Grade 3
W/F to NI 23 23NI to Prof 37 37Prof to Adv 44 44
ELA Grade 7
W/F to NI 30 30NI to Prof 47 47Prof to Adv 64 64
Math Grade 4W/F to NI 23 22NI to Prof 39 39Prof to Adv 48 48
Math Grade 8 W/F to NI 24 24 NI to Prof 37 37 Prof to Adv 48 48
Figure A1: Comparison of 2014 Expected MCAS Results by Ability (Theta), for Four Subject/Grade Combinations
-4 -2 0 2 4
010
2030
40
ELA03
Theta
Expe
cted
Tot
al S
core
2014 Actual2015 Matched
-4 -2 0 2 4
010
2030
4050
6070
ELA07
Theta
Expe
cted
Tot
al S
core
2014 Actual2015 Matched
-4 -2 0 2 4
010
2030
4050
MAT04
Theta
Expe
cted
Tot
al S
core
2014 Actual2015 Matched
-4 -2 0 2 4
010
2030
4050
MAT08
Theta
Expe
cted
Tot
al S
core
2014 Actual2015 Matched
22

Replication of 2013–14 Student Growth Percentiles
The 2013–14 representative samples were used to recompute the SGPs for the students designated to take MCAS, to both evaluate the impact of the samples on the generation of SGPs for 2014–15 and to ensure that the SGPs could be replicated using the representative samples approach. The graphs in Figure A2 display differences on MCAS SGPs generated with the representative samples in ELA and Math. The majority of the recalculated SGPs were between -2 and 2 (94% for ELA and 92% for Math)—far smaller than the expected standard error for SGPs, which is generally between 5 and 7 (Betebenner, 2013).
Figure A2: Replication of 2013–14 Student Growth Percentiles (SGPs)
Table A5 provides descriptive statistics for the recalculated SGPs, by sample. The anticipated mean and median SGP across the state was 50. Here we can see that the SGPs for the unselected sample vary more from the expected median of 50 than the recalculated SGPs for the selected sample. For the selected sample, the median and mean SGPs for all grades are within one point of 50. The total SGPs are also within one point of 50. These results confirm that the representative samples can be used to calculate population-level SGPs for the 2015 test administrations.
23
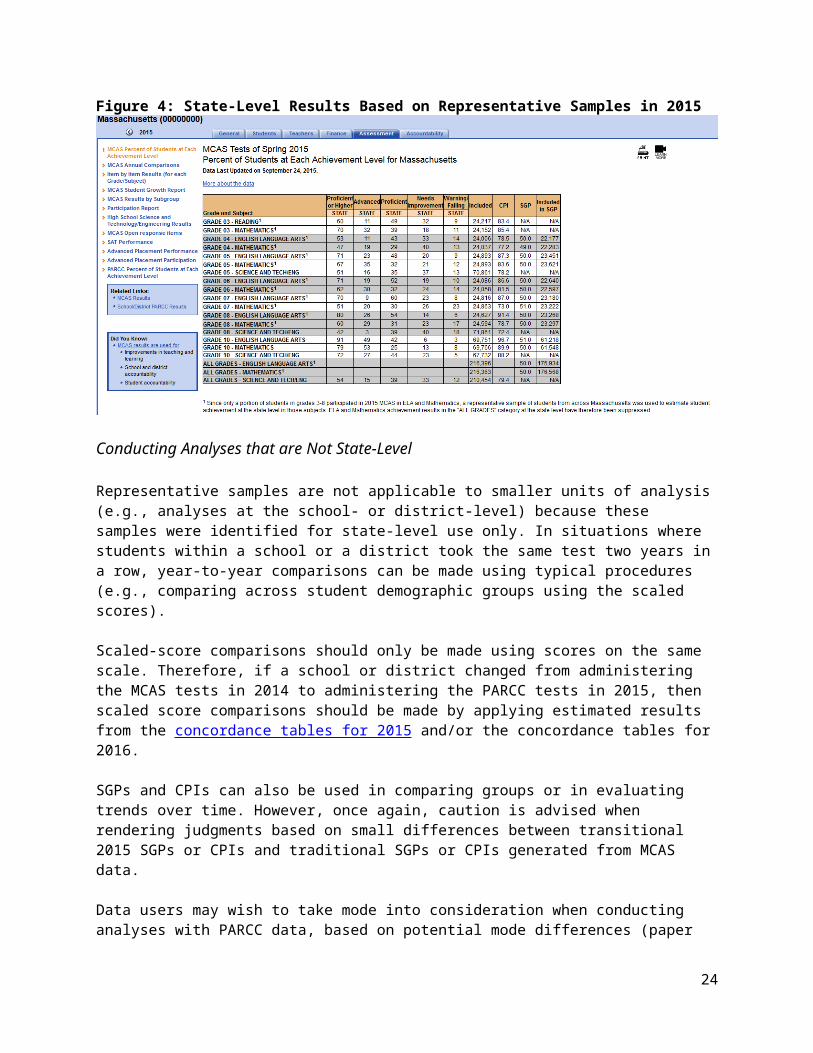
Table A5: Descriptive Statistics for Recalculated SGPs, by SampleRecalculated SGPs for MCAS Examinees, by Sample, Proof of Concept Study
Recalculated SGP ELA Recalculated SGP Math
Median Mean Min. Max. Number Median Mean Min. Max. NumberUnSelected 04 55 53 1 99 3613 51 51 1 99 3614
05 47 48 1 99 3340 50 50 1 99 337706 51 51 1 99 2690 48 48 1 99 269607 51 51 1 99 3754 52 51 1 99 375008 50 50 1 99 3852 50 50 1 99 3872
Selected 04 49 50 1 99 20800 50 50 1 99 2084305 50 50 1 99 21073 50 50 1 99 2115206 50 50 1 99 21649 50 50 1 99 2166907 50 50 1 99 21278 50 50 1 99 2128808 50 50 1 99 21213 51 51 1 99 21322
Total 04 49 50 1 99 24413 50 50 1 99 2445705 50 50 1 99 24413 50 50 1 99 2452906 50 50 1 99 24339 50 50 1 99 2436507 50 50 1 99 25032 50 50 1 99 2503808 50 50 1 99 25065 51 50 1 99 25194
Replication of 2013–14 Accountability Results
The method for selecting representative samples was evaluated with a final check on how the method affected accountability results. The 2014 CPI means for each representative sample (MCAS and PARCC) were compared to those of the examinees excluded from the representative samples. In both sets of comparisons (in ELA and in Math), mean CPIs for the representative samples matched exactly, while the mean CPIs for the excluded student samples differed considerably, as shown in Table A6. These results confirmed the use of the representative samples for calculating the Department’s accountability measures.
Table A6: Comparison of 2014 CPI CalculationsComparison of 2014 CPIs for Representative Samples and Excluded Samples,
by Test GroupSAMPLE ELA 2014 CPI Math 2014 CPI
MCAS Representative Sample 85.4 78.9Students excluded from the MCAS rep. sample 89.3 83.6PARCC Representative Sample 85.4 78.9Students excluded from the PARCC rep. sample 82.7 74.1
24

Summary of Results from the Proof-of-Concept Study
The proof-of-concept study examined the representative samples approach for generating results that were very close or identical to the actual results (population-level results) for the 2014 test administration. In each of the four areas investigated, this approach yielded results for the representative samples that were equivalent or nearly equivalent to the actual results in 2014:
The comparisons of prior achievement and demographic averages indicated identical or more similar results (balanced) than the results for the total samples, indicating that the matching approach ameliorated differences by testing group (MCAS vs. PARCC).
The 2014 cut scores on four MCAS tests (i.e., four grade/subject combinations) were replicated using the representative samples approach, indicating that this approach can be used to maintain testing trends in 2015.
The 2014 SGPs were nearly replicated using the representative samples approach, indicating that SGPs can be generated for 2015 using this method.
The 2014 accountability results (average CPIs in ELA and Math) were replicated using the representative samples approach, indicating that this approach can be used to generate accountability statistics for 2015.
All results from the proof-of-concept study demonstrated that the representative sample results more consistently matched results for the testing population than did the overall sample group results; the representative samples yielded results nearly equivalent to the actual results in 2014.
25

Appendix B: Method Used to Select Representative Samples
A derivation of propensity score matching was used to identify representative samples. Propensity score matching uses a host of background variables to match individuals across two conditions (e.g., intervention, treatment). The formula shown in Figure B1 computes a “propensity score” that captures the differences among examinees for each condition (e.g., treatment) with respect to the group of variables used to compute it. Typically, propensity scores (x) are used to match people who received an intervention (z) to students who have not, using a set of variables (X, covariates). The propensity score is an estimated probability (p), based on the background variables and the condition (e.g., intervention). The propensity scores are then used to match individuals across the two conditions (or more than two conditions).
For our study, there is no intervention – the condition (z) being evaluated is assignment to a testing program, which is not really dependent on a student’s background variables; instead, assignment is determined by the district or school a student attends. Consequently, estimating propensity scores based on testing assignment would yield a poorly fitting model and poor matching of students across conditions.
Figure B1: Typical Propensity Score Equation
)|1()( Xzpxe
propensity score
Z = treatment assignment
(e.g., test assignment)
Vector of covariates
(e.g., student demographics)
The Department, in consultation with testing experts from the MCAS Technical Advisory Committee, matched students taking MCAS to students taking PARCC using prior MCAS results instead of test assignment (z = prior test results: Not Proficient vs. Proficient/Advanced). Using this approach, propensity scores (x) were generated outside of the matching program, as shown in Figure B2.
26

Figure B2: Derivation of Propensity Score Equation
)|1()( Xzpxe
propensity score z = prior MCAS
Results:0=Not Prof./Adv.
1=Prof/Adv
Vector of covariates
(e.g., student demographics)
Probability (can be
computed outside of the
matching program)
The propensity scores are probabilities for achieving Proficient or Advanced on the criterion variable used, given the examinee demographics. Propensity scores are generated using a binary logistic regression for each grade and subject.0
Two primary matching models were used that differed largely by the achievement variable (criterion variable) used for the matching. These two models are described below.
1. The main model that identified representative samples in grades 4–8 used the prior MCAS results in ELA (0=W/NI, 1=Prof/Adv), and included the prior MCAS results in Math, (0=W/NI, 1=Prof/Adv) as one of the covariates.
2. Since grade 3 does not have prior achievement results, the criterion variable used to match examinees was a dichotomized (0, 1) average score (based on the results for prior students in that school, grade, and that student’s demographic group) that indicated whether or not students scored Proficient or Advanced on both ELA and Math for the prior year (2014). For example, a grade 3 student in 2015 was matched to another grade 3 student in 2014 in that same school and grade according to the average MCAS results for that group (by race and whether the examinee was enrolled in special education or not).
Model variables and coefficients are provided in Appendix C. Model fits for the three models are shown in Table B1; for all three, higher numbers indicate better fit.
The column labeled “% Corr” shows how accurately the model classified students according to the criterion variable used (MCAS results, proficient or not proficient, in 2014). This statistic ranges from 0 to 100%, and the fits shown indicate moderately strong model fit.
The data in the columns labeled “C & S” (Cox and Snell) and “Nagel” (Nagelkerke) are two additional model fit statistics that describe the proportions of variance (score spread) explained by the models, with higher proportions indicating better fit. Nagelkerke ranges from 0 to 1 and
0 First, a binary logistic regression was run using the prior year’s data (the prior year provides population-level results). Next, the population-level coefficients for each variable used in the model were applied to the current year’s data to yield population-level results for the current year—in this case, coefficients generated using data from 2014 were applied to the 2015 model.
27
Cox and Snell from 0 to a limit below 1. The model fits on these metrics indicate moderate fit for most of the models.0
Table B1: Model Fits for Matching ModelsModel Fit: Log. Regression
% Corr C & S Nagel.Grade 3 83.8 .453 .604Grade 4 78.3 .352 .471Grade 5 80.1 .345 .475Grade 6 82.8 .370 .522Grade 7 82.8 .348 .507Grade 8 85.5 .308 .488
Prior to generating the propensity scores, a multiple imputation procedure (from the R Amelia package) was used to substitute estimated values for all missing data used in the analysis. The matching was conducted with the R Package MatchIt using the nearest neighbor matching algorithm. The nearest neighbor match conducts a 1:1 match. Therefore, each examinee included in each representative sample was matched to an examinee the prior year in that grade using the propensity scores generated through the logistic regression.
After the matching was conducted, all data were evaluated to determine how similar the matched groups were on student demographic and achievement variables used in the models.
Matched samples for 2014–15 were evaluated for balance on the demographic and prior achievement variables, as well as for comparability on SGP and accountability results. These results, presented in the body of this report, showed that the method generated samples that were significantly more equivalent to the prior year’s population than the unmatched samples. Further, the matched samples for MCAS and PARCC test-takers were more similar to each other than were the unmatched samples.
0 The higher model fits for grade 3 are largely an artifact of the criterion variable, which includes information on student demographic information. Because the remainding models used actual examinee results, those model fits provide better information for matching than does the grade 3 model, despite appearances.
28

Appendix C: Logistic Regression Variables and Results
Table C1 provides information about the variables included in the two logistic regression models used to generate the propensity scores.
Table C1: Variables Used in the Logistic Regression Models*Variables Used Across the Models
Type of Variable Variable Name Description Model
Criterion emperf2013_PA_mean_imp_cat Proficient or Advanced on MCAS ELA/Math in the prior year, in that grade and school, by Race and Free/Reduced Lunch Status, Imputed, Dichotomized (0,1)
Grade 3
Criterion eperf2014_imp Proficient or Advanced on MCAS ELA in the prior year Grades 4-8Covariate race_B Race/Ethnicity = African American/Black Grades 3-8Covariate race_H Race/Ethnicity = Hispanic/Latino Grades 3-8Covariate race_A Race/Ethnicity = Asian Grades 3-8Covariate race_W Race/Ethnicity = Caucasian/White Grades 3-8Covariate race_M Race/Ethnicity = Mixed Grades 3-8Covariate ever_ell Ever an English Language Learner Grades 3-8Covariate Highneeds High Needs (Student with Disability + Free/Reduced
Lunch Eligible)Grades 3-8
Covariate freelunch2014_imp Free/Reduced Lunch Eligible (prior year), Imputed Grades 3-8Covariate yrsinmass_imp Number of years in Massachusetts schools, Imputed Grades 3-8Covariate levelofneed0_B Interaction: No Special Needs * Race_B Grades 3-8Covariate levelofneed0_H Interaction: No Special Needs * Race_H Grades 3-8Covariate levelofneed0_W Interaction: No Special Needs * Race_W Grades 3-8Covariate levelofneed0_A Interaction: No Special Needs * Race_A Grades 3-8Covariate freelunch2014_BH Interaction: freelunch2014_imp * Race_BH Grades 3-8Covariate freelunch2014_H Interaction: freelunch2014_imp * Race_H Grades 3-8Covariate freelunch2014_A Interaction: freelunch2014_imp * Race_A Grades 3-8Covariate freelunch2014_W Interaction: freelunch2014_imp * Race_W Grades 3-8Covariate emperf2012_PA_mean_imp Proficient or Advanced on MCAS ELA and Math,
proportion for that school, grade, race, and free/reduced lunch category, two years' prior, imputed
Grades 4-8
Covariate emperf2012_B Interaction: emperf2012_PA_mean_imp * Race_B Grades 4-8Covariate emperf2012_H Interaction: emperf2012_PA_mean_imp * Race_H Grades 4-8Covariate emperf2012_W Interaction: emperf2012_PA_mean_imp * Race_W Grades 4-8Covariate emperf2012_A Interaction: emperf2012_PA_mean_imp * Race_A Grades 4-8Covariate emperf2012_levelofneed0 Interaction: emperf2012_PA_mean_imp *
leverofneed0Grades 4-8
Covariate emperf2013_PA_imp Proficient or Advanced on MCAS ELA nd Math, 2013, Imputed
Grades 4-8
Covariate eperf2013_imp Proficient or Advanced on MCAS ELA in the prior year Grades 4-8Covariate mperf2013_imp Proficient or Advanced on MCAS ELA, 2013, Imputed Grades 4-8Covariate emperf2013_PA_mean_imp_cat Proficient or Advanced on MCAS Math, 2013, Imputed Grades 4-8
* Variables were used only in the Grade 3 model, only in the Grades 4–8 model, or in both models (Grades 3–8), as indicated by the far right column.
Tables C2 and C3 provide information on the covariates used in the logistic regression models. Table C2 provides information for the models used in grades 3 through 5, and Table C3 provides information for grades 6 through 8. Within each set of grade-level results, the first column indicates the population-level
29

coefficient, the second column provides the standard error of the coefficient, and the third column, the statistical significance of the coefficient. For propensity-matching purposes, variables should be retained in the model if the probability (significance) is less than 0.5; however, all variables were kept in for consistency across models.
Table C2: Information for Model Variables, Grades 3–5Coefficients for Covariates used in the Logistic Regression Models, Grades 3–5
Grade 3 Grade 4 Grade 5
CoefficientSt.
Error Sign. CoefficientSt.
Error Sign. CoefficientSt.
Error Sign.race_B -3.135 .234 .000 -0.225 0.231 .329 -0.073 0.219 .740race_H -2.718 .208 .000 -0.352 0.214 .101 -0.126 0.209 .548race_A -0.682 .217 .002 -0.028 0.252 .912 0.025 0.240 .916race_W -3.400 .179 .000 -0.005 0.193 .981 -0.052 0.194 .789race_M 0.297 .163 .068 0.175 0.178 .327 0.216 0.177 .222ever_ell -0.236 .042 .000 -0.369 0.035 .000 -0.415 0.034 .000highneeds -0.742 .064 .000 -0.300 0.051 .000 -0.329 0.049 .000freelunch2014_imp -0.922 .102 .000 -0.211 0.113 .062 -0.234 0.121 .053yrsinmass_imp -0.029 .017 .098 0.029 0.012 .014 0.029 0.009 .002levelofneed0_B 1.696 .161 .000 0.895 0.118 .000 0.629 0.093 .000levelofneed0_H 1.224 .125 .000 1.071 0.089 .000 0.614 0.070 .000levelofneed0_W 4.324 .077 .000 0.328 0.055 .000 0.169 0.056 .002levelofneed0_A 2.189 .150 .000 0.565 0.172 .001 0.371 0.160 .020freelunch2014_B 0.529 .121 .000 0.020 0.137 .884 -0.082 0.144 .567freelunch2014_H -0.756 .105 .000 -0.220 0.125 .079 -0.126 0.134 .347freelunch2014_A -0.700 .125 .000 -0.135 0.139 .331 -0.290 0.152 .056freelunch2014_W 0.174 .094 .065 -0.051 0.109 .642 -0.034 0.120 .779mperf2014_imp 1.851 0.020 .000 1.909 0.021 .000emperf2013_PA_mean_imp 3.019 0.087 .000 2.873 0.094 .000emperf2013_B -0.392 0.130 .003 -0.100 0.146 .492emperf2013_H -0.074 0.113 .516 -0.181 0.124 .144emperf2013_W -0.051 0.084 .538 -0.101 0.095 .287emperf2013_A -0.091 0.122 .455 -0.079 0.133 .555emperf2013_levelofneed0 -0.097 0.082 .239 -0.063 0.093 .500Constant 1.137 0.178 .000 -2.219 0.199 .000 -1.600 0.201 .000
30

Table C3: Information for Model Variables, Grades 6–8Coefficients for Covariates Used in the Logistic Regression Models, Grades 6–8
Grade 6 Grade 7 Grade 8
Coefficien
tSt.
ErrorSign
.Coefficien
tSt.
ErrorSign
.Coefficien
tSt.
ErrorSign
.race_B -0.282 0.246 .251 -0.079 0.232 .733 -0.089 0.244 .715race_H -0.144 0.235 .539 -0.075 0.226 .740 0.025 0.238 .917race_A -0.183 0.277 .509 -0.111 0.263 .672 0.014 0.278 .960race_W 0.135 0.221 .541 -0.026 0.213 .901 0.231 0.225 .305race_M 0.234 0.205 .254 -0.182 0.196 .353 0.244 0.200 .224ever_ell -0.379 0.035 .000 -0.413 0.034 .000 -0.609 0.035 .000highneeds -0.403 0.052 .000 -0.280 0.051 .000 -0.394 0.053 .000freelunch2014_imp -0.405 0.136 .003 0.021 0.133 .874 -0.190 0.157 .226yrsinmass_imp 0.055 0.008 .000 0.063 0.006 .000 0.072 0.006 .000levelofneed0_B 0.780 0.094 .000 0.746 0.083 .000 0.743 0.080 .000levelofneed0_H 0.593 0.071 .000 0.729 0.067 .000 0.739 0.063 .000levelofneed0_W 0.059 0.061 .336 0.097 0.062 .114 0.203 0.063 .001levelofneed0_A 0.452 0.184 .014 0.234 0.171 .172 0.305 0.175 .082freelunch2014_B 0.333 0.159 .036 -0.210 0.155 .174 0.044 0.178 .804freelunch2014_H 0.199 0.149 .183 -0.450 0.148 .002 -0.124 0.171 .468freelunch2014_A -0.111 0.176 .527 -0.365 0.178 .040 -0.282 0.205 .168freelunch2014_W 0.133 0.135 .325 -0.361 0.133 .007 -0.189 0.157 .230mperf2014_imp 2.147 0.023 .000 2.224 0.030 .000 2.259 0.037 .000emperf2013_PA_mean_imp 3.308 0.108 .000 3.672 0.104 .000 3.580 0.116 .000emperf2013_B -0.273 0.152 .072 -0.373 0.157 .017 -0.151 0.158 .339emperf2013_H -0.123 0.148 .404 -0.083 0.140 .550 -0.174 0.146 .234emperf2013_W -0.153 0.116 .187 -0.230 0.109 .034 -0.003 0.122 .980emperf2013_A 0.058 0.156 .708 -0.166 0.153 .276 -0.060 0.166 .716emperf2013_levelofneed0 -0.062 0.114 .586 -0.014 0.105 .891 -0.266 0.119 .026Constant -1.802 0.228 .000 -1.476 0.218 .000 -1.104 0.231 .000
31