Representing isotopic ratio data using state of the art mapping
3
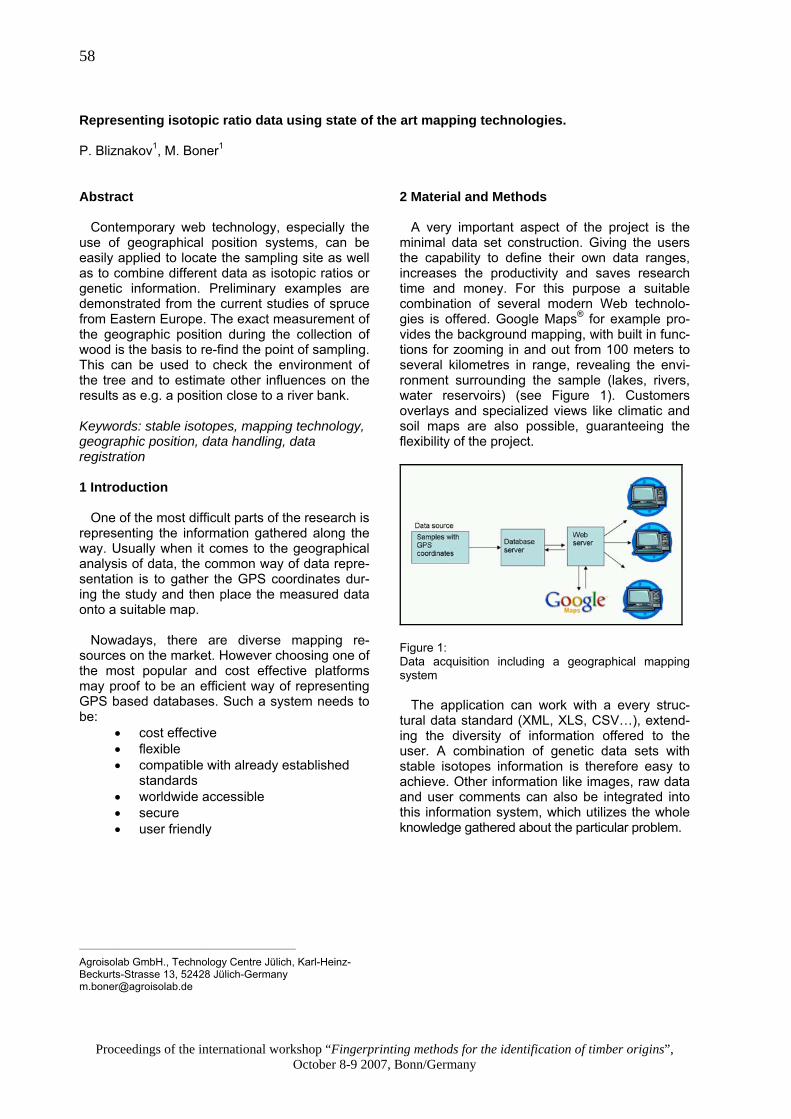
Proceedings of the international workshop “Fingerprinting methods for the identification of timber origins”, October 8-9 2007, Bonn/Germany 58 Representing isotopic ratio data using state of the art mapping technologies. P. Bliznakov 1 , M. Boner 1 Abstract Contemporary web technology, especially the use of geographical position systems, can be easily applied to locate the sampling site as well as to combine different data as isotopic ratios or genetic information. Preliminary examples are demonstrated from the current studies of spruce from Eastern Europe. The exact measurement of the geographic position during the collection of wood is the basis to re-find the point of sampling. This can be used to check the environment of the tree and to estimate other influences on the results as e.g. a position close to a river bank. Keywords: stable isotopes, mapping technology, geographic position, data handling, data registration 1 Introduction One of the most difficult parts of the research is representing the information gathered along the way. Usually when it comes to the geographical analysis of data, the common way of data repre- sentation is to gather the GPS coordinates dur- ing the study and then place the measured data onto a suitable map. Nowadays, there are diverse mapping re- sources on the market. However choosing one of the most popular and cost effective platforms may proof to be an efficient way of representing GPS based databases. Such a system needs to be: • cost effective • flexible • compatible with already established standards • worldwide accessible • secure • user friendly ___________________________________________________________ Agroisolab GmbH., Technology Centre Jülich, Karl-Heinz- Beckurts-Strasse 13, 52428 Jülich-Germany [email protected]2 Material and Methods A very important aspect of the project is the minimal data set construction. Giving the users the capability to define their own data ranges, increases the productivity and saves research time and money. For this purpose a suitable combination of several modern Web technolo- gies is offered. Google Maps ® for example pro- vides the background mapping, with built in func- tions for zooming in and out from 100 meters to several kilometres in range, revealing the envi- ronment surrounding the sample (lakes, rivers, water reservoirs) (see Figure 1). Customers overlays and specialized views like climatic and soil maps are also possible, guaranteeing the flexibility of the project. Figure 1: Data acquisition including a geographical mapping system The application can work with a every struc- tural data standard (XML, XLS, CSV…), extend- ing the diversity of information offered to the user. A combination of genetic data sets with stable isotopes information is therefore easy to achieve. Other information like images, raw data and user comments can also be integrated into this information system, which utilizes the whole knowledge gathered about the particular problem.
Representing isotopic ratio data using state of the art mapping