Embed Size (px)
Citation preview

REPUBLIC OF GHANA
MINISTRY OF EDUCATION
EDUCATION SECTOR PERFORMANCE REPORT
2012
MAY 2012
Education Sector Performance Report 2012
Ministry of Education (MoE)
2
TABLE OF CONTENTS
LIST OF ACRONYMS
AESOP Annual Education Sector Operational Plan
BECE Basic Education Certificate Examination
CBT Competency Based Training
COTVET Council for Technical Vocational Education and Training
CPSSS Computerized Placement System for Secondary School
DEO District Education Office
DP Development Partners
DFID Department For International Development
EdSeP Education Sector Project
EFA Education For All
EM Educational Management
EMH Education for the Mentally Handicapped
EMIS Education Management Information System
EQUALL Education Quality for All
ERRC Education Reform Review Committee
ESD Entrepreneurship Skill Development
ESP Education Strategic Plan
ESR Education Sector Review
ESTAC Education Sector Technical Advisory Committee
FBO Faith Based Organisation
FCUBE Free Compulsory Universal Basic Education
FPMU Funds and Procurement Management Unit
GER Gross Enrolment Ratio
GES Ghana Education Service
GESDI Ghana Education Staff Development Institute
GeSCI Global e-Schools Initiative
GETFund Ghana Education Trust Fund
GoG Government of Ghana
GPRS Ghana Poverty Reduction Strategy
GSS Ghana Statistical Service
HIV/AIDS Human Immunodeficiency Virus/Acquired Immune Deficiency Syndrome
HQ Head Quarters
HRMD Human Resource Management Division
HT Head Teacher
IGO Inter-Governmental Organisation
INSET In-Service Education of Teachers
JICA Japan International Cooperation Agency
KG Kindergarten
MDRI Multilateral Debt Relief Initiative
M&E Monitoring and Evaluation
MNS Minimum National Standards

Education Sector Performance Report 2012
Ministry of Education (MoE)
3
MICS Multiple Indicator Cluster Survey
MoES Ministry of Education and Sports
MoFEP Ministry of Finance and Economic Planning
MoH Ministry of Health
MOU Memorandum of Understanding
MoMYE Ministry of Manpower Youth and Employment
MSP Minimum Standards of Performance
MTEF Medium Term Expenditure Framework
NAP National Apprenticeship Programme
NCTE National Council for Tertiary Education
NDPC National Development Planning Commission
NEA National Education Assessment
NER Net Enrolment Ratio
NFED Non-Formal Education Division
NGO Non-Governmental Organisation
NMS National Minimum Standards
NVTI National Vocational Training Institute
OHCS Office of Head of Civil Service
OICG Opportunities Industrialization Center - Ghana
PBME Planning, Budgeting, Monitoring and Evaluation
PTA Parent Teacher Association
PTPDM Pre-Tertiary Teacher Professional Development and Management
PTR Pupil Teacher Ratio
PTTR Pupil Trained Teacher Ratio
QE Quality of Education
SEN Special Education Needs
SHEP School Health in Education Programme
SHS Senior High School
SMC School Management Committee
SPAM School Performance Appraisal Meeting
SPIP School Performance Improvement Plan
SRIMPR Statistics, Research, Information Management and Public Relations
ST Science, Technology and TVET
TALIF Teaching and Learning Innovation Fund
TOT Trainers of Trainers/Tutors
TTI Technical Training Institute
TVET Technical and Vocational Education and Training
UTTDBE Untrained Teachers Diploma in Basic Education Programme
UNESCO United Nations Education, Science and Cultural Organisation
UNICEF United Nations Children’s Fund
USAID UNITED States Agency for International Development
WAEC West African Examination Council
WFP World Food Programme

Education Sector Performance Report 2012
Ministry of Education (MoE)
4
TABLE OF CONTENTS
TABLE OF CONTENTS
List of Tables and Figures xx
List of Acronyms xx
Executive Summary xx
1. Section One :Background
2. Section Two: Basic Education
3. Section Three: Second Cycle Education
Section Four: Inclusive and Special Education xx
4 Section Five: Non-Formal Education xx
5 Tertiary Education xx
6 Education Management xx
7 Education Finance xx
8 Conclusion xx
References xx

Education Sector Performance Report 2012
Ministry of Education (MoE)
5
INTRODUCTION
1.1 Structure of the Report
The first section of this report provides a summary of key indicators together with actual
expenditures and outputs for related priority activities as outlined in AESOP (2011-13). The
selection of these priorities is in part a reflection of discussions and agreements made at
previous NESAR meetings. This new structure reflects an attempt to draw a closer link
between expenditure and outcomes in the education sector. A brief narrative of key trends
for each objective is reported here so that this section can function as summary, though
more detailed information on indicators is provided in the main narrative section of the
report.
It was not possible to receive the breakdown of funds for all funding sources, as detailed in
the section. Where information becomes available it will be updated after the NESAR when
the finalized Performance Report will be submitted.
The main narrative section of the report is organized around the six thematic groupings of
the Education Strategic Plan (ESP) 2010-2020.
Basic Education
Second Cycle Education
Inclusive and Special Education
Non-Formal Education
Tertiary Education
Education Management/ Finance
The performance of each sub sector with respect to key education indicators is reported in
each section.
1.2 Data and Reporting
The majority of the data included in this report is sourced from the EMIS school census,
various years, with the most recent data deriving from the 2011/12 cycle. It was hoped that
the 2010 GSS census data would be made available in time for the preparation of this
report in order that the updated population figures could be utilized for calculating enrolment
and completion rates. The population data should be released mid-May and the indicators
will be updated when these are released in order that the finalized Education Sector Report
for 2012 will have the correct information. Enrolment rates and GPI can therefore be
considered provisional before the updated population data is received.
The key indicators are reported at the national level with annual targets where available,
and time trend data. The medium term targets are based on the 2015 sector targets
(reported in ESP), with the result that some of these medium term targets are unrealistic
based on recent trends. One of the tasks of this annual review process will be to arrive at

Education Sector Performance Report 2012
Ministry of Education (MoE)
6
some more realistic annual targets for inclusion in the AESOP, which will be produced at
the end of the review process. Setting of realistic targets will enable the education sector
performance review to be more evidence based and data driven.
The data is also disaggregated for deprived districts, with data for 2010/11 and 2011/12
presented. An attempt has been made to incorporate regional variations through the
inclusion of data maps for key indicators.
Due to the timings of the regional reviews it was not possible for regional report data to be
incorporated fully in the draft performance report. These inputs will however be
incorporated in the final ESPR.
Deprived Districts
Recommendations in previous annual reviews included the need to update the criteria for
deprived districts and ensure that the selection is reviewed periodically to assess the
progress of these districts. A new criterion has been developed in May 2012 as part of the
World Bank Global Partnership for Education Fund application that is currently ongoing.
The deprived district data in this report, however, focuses on tracking the performance of
the original deprived districts. The 2011/12 data will however be used to create a baseline
for the new deprived districts which in the GPEF programme will operate, once approved.

Education Sector Performance Report 2012
Ministry of Education (MoE)
7
Basic Education
ACCESS
KG:
The expansion in access to pre primary education enjoyed in recent years has
continued in 2011/12 and Ghana is on target to achieve 100% access to KG by
2015.
Official age enrolment, however, remains an area of concern with NER significantly
lower at 64.2, although after a period of decline, the proportion of children enrolled at
the correct age has been increasing since 2009/10, with a 4 percentage point
increase this year.
The regional indicators especially in the municipals as compared to the national
average require additional study into this issue. For instance, the GER of KG in
Accra Metro is 132.8% in 2011/12 while the national average is 99.4%. possibly, this
may partly be attributed to large number of enrolment in unrecognised private KGs
and or failure of data collection from recognised private KGs. Tema also showed
65.2% as it GER of KG. Additional study would help to clarify this
2008/09 2009/10 2010/11 2011/12
Target
2011/1
2
Depr.
Distric
t 2011
Depr.
Distric
t 2012
KG GER 92.9 97.3 98.4 99.4 98.7 98.5 101.2
KG NER 63.6 58.7 60.11 64.17 NA 64.2 68
Enrol. KG
1,338,45
4
1,440,73
2
1,491,45
0
1,543,31
4
Enrol KG (4-5
yr) 916,455 869,552 911,305 996,232
1 Greater Accra Regional Review Report, 2011-12
Education Sector Performance Report 2012
Ministry of Education (MoE)
8
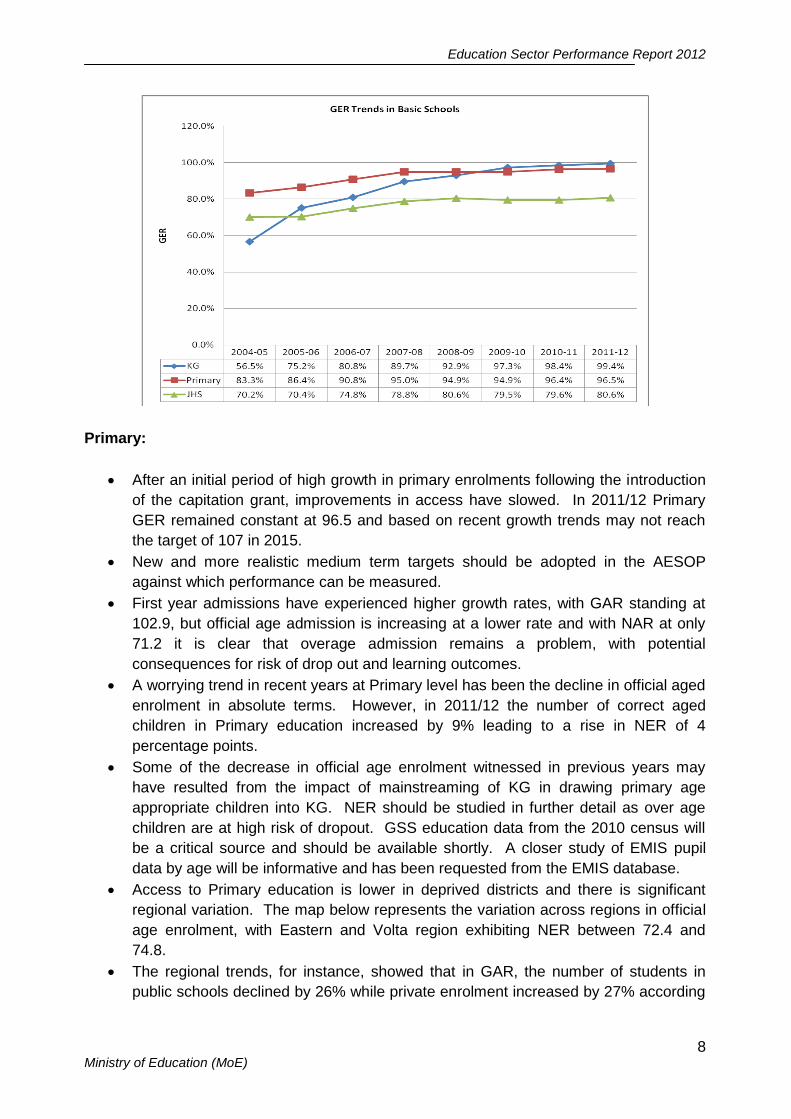
Primary:
After an initial period of high growth in primary enrolments following the introduction
of the capitation grant, improvements in access have slowed. In 2011/12 Primary
GER remained constant at 96.5 and based on recent growth trends may not reach
the target of 107 in 2015.
New and more realistic medium term targets should be adopted in the AESOP
against which performance can be measured.
First year admissions have experienced higher growth rates, with GAR standing at
102.9, but official age admission is increasing at a lower rate and with NAR at only
71.2 it is clear that overage admission remains a problem, with potential
consequences for risk of drop out and learning outcomes.
A worrying trend in recent years at Primary level has been the decline in official aged
enrolment in absolute terms. However, in 2011/12 the number of correct aged
children in Primary education increased by 9% leading to a rise in NER of 4
percentage points.
Some of the decrease in official age enrolment witnessed in previous years may
have resulted from the impact of mainstreaming of KG in drawing primary age
appropriate children into KG. NER should be studied in further detail as over age
children are at high risk of dropout. GSS education data from the 2010 census will
be a critical source and should be available shortly. A closer study of EMIS pupil
data by age will be informative and has been requested from the EMIS database.
Access to Primary education is lower in deprived districts and there is significant
regional variation. The map below represents the variation across regions in official
age enrolment, with Eastern and Volta region exhibiting NER between 72.4 and
74.8.
The regional trends, for instance, showed that in GAR, the number of students in
public schools declined by 26% while private enrolment increased by 27% according

Education Sector Performance Report 2012
Ministry of Education (MoE)
9
to their draft ARPR2. Some urban districts like Accra and Tema recorded lower
enrolment rates than deprived districts.
2008/09 2009/10 2010/11 2011/12
Target
2011/1
2
Depr.
Distric
t 2011
Depr.
Distric
t 2012
Primary GER 94.9 94.9 96.4 96.5 98.5 92.9 94.7
Primary NER 88.5 83.6 77.9 81.7 80.1 77.7 80.8
Primary GAR 97.8 99.6 101.3 102.9 100.5 100.4
Primary NAR 71.0 71.0 71.1 72.1 72.8 72.7
Enrol. Primary
3,710,64
7
3,809,25
8
3,962,77
9 4,451,878
Enrol Primary (6-
11yr)
3,461,08
7
3,356,74
3 3201541 3,439,573
The recent slowdown in enrolment growth may be due to the increasingly complex
barriers that the remaining out of school children face as Ghana approaches
universal primary enrolment. This informed the inclusion of Complementary Basic
Education interventions in the AESOP as a means by which to transition those
pupils into mainstream schooling. Government did not undertake any CBE activities
in 2011 meaning the target of 10,000 learners was not met. UNICEF funded 750
children in Savulugu Nanton district. Government has however developed a CBE
policy and a CBE component for District Grants has been included in the GPEF
application which if approved will be rolled out in the last quarter of 2012.
2 Greater Accra Regional Review Report, 2011-12

Education Sector Performance Report 2012
Ministry of Education (MoE)
10
JHS:
Enrolment in JHS remains low, with minimal expansion in recent years as GER
fluctuates around 80%. Coupled with low completion rates (see Quality section) it is
clear that Universal Basic Education will not be reached by 2015 and medium term
targets need to be revised.
Official age enrolment in JHS is a significant problem with a NER of only 46.1, which
has been declining in recent years, though kept pace with population growth in
2011/12. The significant overage school population in JHS raises the risk of drop
out and most likely contributes to the low completion rates observed at JHS level
(66%).
A source of concern is the decreasing trend in transition rates from P6 to JHS1
witnessed in recent years, falling below 90% in 2011/12. A note of caution is
however required for the current transition rate data, which may be misleading as it
utilises data from 2010/11 and 2011/12 to construct the indicator. With the
expansion of EMIS to all 170 districts in 2010/11 it seems that there may have been
some issues with double reporting of schools in “old” and “new” districts,
compromising the validity of indicators using data across years. Despite the lower
transition rate, the gross admissions rate has been increasing.
The issue of correct age enrolment is, however, even more pertinent in admissions
where the NAR at 43.6% is half the value of GAR at 88%.
Access to JHS education is lower in deprived districts, although access has been
expanding faster, narrowing the gap in 2011/12.
2008/09 2009/10 2010/11 2011/12
Target
2011/1
2
Depr.
Distric
t 2011
Depr.
Distric
t 2012
JHS GER 80.6 79.5 79.6 80.6 84.6 70.9 72.5

Education Sector Performance Report 2012
Ministry of Education (MoE)
11
JHS NER 47.8 47.5 46.1 46.1 57.0 39.2 39.6
JHS GAR 84.6 86.6 86.3 88.1 77.3 79.6
JHS NAR 44.5 43.9 43.8 43.6 36.7 38.0
Transition to
SHS1
94.6 92.4 89.5
Enrol. JHS
1,285,27
7
1,301,94
0
1,335,40
0 1,434,211
Enrol JHS (12-
14yr) 762,898 778,855 772,979 792,491
The targets for NER need to be revised downwards in the medium term in order to
enable performance to be measured on an annual basis. This revision downwards
of targets will however be undertaken in combination with a more rigorous analysis
for the worrying and in some cases counter intuitive trends for official age enrolment
in basic education. The widely reported negative impact of over age enrolment on
drop out risk and learning outcomes mean that this is a very important issue facing
the education sector.
Private Provision
The percentage of education provision contributed by the private sector has continued to
grow and now lies at more than one in every five pupils at KG and Primary, at 22% of
enrolled pupils. The proportion is slightly lower in JHS where 19% of pupils are enrolled in
private schools. Coverage of private schools is substantially lower in deprived districts.
% enrolment
in Private
education 2008/09 2009/10 2010/11 2011/12
Depr.
District
2011
Depr.
District
2012
KG 19.4 19.5 20.8 22.2 10.1 9.2
Primary 18.0 18.6 19.3 22.1 8.9 8.9
JHS 17.2 17.4 17.6 19.0 8.5 9.0

Education Sector Performance Report 2012
Ministry of Education (MoE)
12
There may be considerable scope within the education sector to enhance support for
private provision of education, particularly for low cost private schools which target low
income families.
Gender
The Ghanaian education sector set itself the target of reaching gender parity in
access to education by 2012, which has not occurred in any sub sector, although KG
has fluctuated around parity in recent years
Based on current trends at Primary level, full gender parity could be reached within 5
years although the experience of the KG subsector suggests closing the final gap to
parity may take longer. Crucially it will require addressing the significant variations
at district level and targeting those districts with persistently low GPI, many of which
are geographically concentrated in the Northern region. At the primary level 30
districts have GPI below 0.9 and of these 3 are below 0.8.
The issue of access to education by gender is greatest for JHS, with a GPI of 0.94
and 32 districts exhibiting a GPI of less than 0.8. There is also a 6 percentage point
gap in completion rates between male and female JHS students, indicating that
problems of retention are greater for girls who face higher risk of drop out. The map
below depicts the significant regional variations in GPI.
GPI 2008/09 2009/10 2010/11 2011/12
Target
2012
Depr.
District
2011
Depr.
District
2012
KG 0.99 0.98 0.98 0.98 1 0.97 0.97
Primary 0.96 0.96 0.97 0.97 1 0.95 0.95
JHS 0.92 0.92 0.93 0.94 1 0.92 0.94

Education Sector Performance Report 2012
Ministry of Education (MoE)
13
Issues of barriers to access to education are compounded by lower learning
outcomes for girls e.g. BECE, where the pass rates are higher for boys in all
subjects except English (see Quality section).
Tracking performance of expenditure on priority gender activities in the AESOP 2011
reveals that actual expenditures are far below the estimated costs for the prioritised
activities. It is however important to note that the reported expenditure does not
include district level expenditures, including DFID district level budget support, as
these are currently not aggregated to the national level by activity.
Gender issues have gained considerable prominence in the education sphere in
Ghana and a gender strategy is currently in development with the GEU. For the
2012 budget year, gender activities were highlighted as one of the key national
priorities for District level Budget Officers when compiling their budgets by GES
Budget division. It will be important to review the AESOP priority activities with
respect to the new strategy.
Quality
There are limited measures of learning outcomes in Basic Education, which means that
many of the quality indicators relate to inputs such as teachers, textbooks etc.
The NEA is the only standardized test currently undertaken, measuring learning outcomes
in English and Maths at P3 and P6 level using two criteria for competency: the less
stringent minimal competency and proficiency.
The 2011 NEA results reveal that the proportion of pupils displaying proficiency at
Maths remains extremely low (less than one in five pupils at both P3 and P6) and
though slightly higher for English (particularly at P6 with 35%), quality improvements
are not occurring at the level expected.
There has been some increase in the percentage of pupils tested revealing a
minimum competency at English at both P3 and P6, but in contrast the percentage
of pupils displaying minimum competency in Mathematics has decreased3.
The NEA report showed that private schools contluously outperforms public schools
with huge gap in NEA4.
Overall Distribution of Minimum-Competency And Proficiency NEA 2005, 2007, 2009
and 2011
Grade Levels, Subjects and % pupils reaching Minimum Competency
(M-C) and Proficiency (Profi.) levels
PRIMARY 3 PRIMARY 6
3 Comparing scores across years for NEA is complex as the tests are not standardized for performance, though comparisons may
have some indicative value.
4 NEA Report, 2011 p25.

Education Sector Performance Report 2012
Ministry of Education (MoE)
14
ENGLISH MATHEMATICS ENGLISH MATHEMATICS
M-C Profi. M-C Profi. M-C Profi. M-C Profi.
2005 50.6 16.4 47.2 18.6 63.9 23.6 47.2 9.8
2007 50.2 15.0 42.6 14.6 69.7 26.1 46.2 10.8
2009 57.6 20.0 61.2 25.2 76.9 35.6 61.9 13.8
2011 66.3 24.2 52.6 18.2 78.9 35.3 56.9 16.1
The AESOP expenditure review reveals that support of the NALAP programme, an
identified priority in the area of quality education, has not been undertaken in 2011.
Ongoing support of NALAP is crucial for improved literacy outcomes as the original
review of the programme revealed that ongoing training of teachers was crucial and
has not been occurring. USAID are however planning a NALAP refresher training
course for 80,000 teachers in 2013 and planning to provide TLMs in 2012 or 2013.
GES and partners attended a forum on Early Grade Reading in Kigali in early 2012
which has spurred the development of an early grade reading strategy. USAID are
also planning to support this area through the Early Grade Reading Assessment
(EGRA) programme. The government’s commitment to improving learning
outcomes through a focus on basic literacy is reflected in the inclusion of EGRA
components in the GPEF application.
Implementation of in school monitoring activities highlighted in the AESOP has not
been funded to the level anticipated, though this obscures any district funded
activities.
BECE
The BECE taken at the end of JHS 3 cannot provide any information about learning
achievements over time as it uses a normalized grading methodology, however it can
highlight variations within the same cohort i.e. by gender, region etc.
The 2011 BECE was undertaken by a total of 372,799 pupils in 2011, of whom 171,965
qualified for Second Cycle education and of which 171,711 were placed (46% of
candidates). The table below gives the subjects passes rates for the core subjects
disaggregated by gender. Boys outperformed girls in all core subjects with the exception of
English.
Total Pass
Rate
Male Pass
Rate
Female Pass
Rate
English 59% 58% 60%
Social Studies 59% 62% 57%
Maths 60% 62% 57%
Science 60% 62% 57%

Education Sector Performance Report 2012
Ministry of Education (MoE)
15
BECE scores reflect geographic variations. The table below breaks the pass rates down by
region and reveals significant variation, with the percentage of pupils passing English
varying from 40% (Upper East) to 82% (Greater Accra) and for Maths from 39% (Upper
East) to 74% (Ashanti). Volta, Central and the three Northern Regions have pass rates
below the average in both subjects.
BECE Pass Rate in English and Mathematics by Region
English Pass Rate
Maths Pass
Rate
Ashanti 61% 74%
Brong Ahafo 55% 72%
Central 50% 48%
Eastern 53% 50%
Greater Accra 82% 68%
Northern 44% 48%
Upper East 40% 39%
Upper West 48% 47%
Volta 51% 40%
Western 60% 65%
NATIONAL 59% 60%
Completion Rates
Completion rates measure the internal efficiency of the education system.
The Primary completion rate continued to rise in 2011/12 but is slightly below the
target required to remain on track to ensure a 100% completion rate by 2015. The
completion rate for girls remains 3 percentage points lower than for boys, but has
demonstrated higher growth rates in recent years, leading to a closing of the gender
gap.
Completion rates in JHS have stagnated around 66 in recent years. There is
significant variation across districts, with much lower completion rates in deprived
districts.
The issues with over age enrolment outlined in the Access section are likely to
contribute to the problems with retention highlighted by the Completion Rate.
School Completion Rates for Primary and JHS
Completion
Rate
2008/0
9
2009/1
0
2010/1
1
2011/1
2
Targe
t 2012
Targe
t -
2015
Deprive
d
District
2011
Deprive
d
District
2012

Education Sector Performance Report 2012
Ministry of Education (MoE)
16
Primary 86.3 87.1 91.6 93.7 95 100 86.9 91.1
JHS 75 66 66.9 66.8 80.1 100 57 57.8
Teachers
The ESP includes PTR targets for basic education to arrive at a more efficient deployment
of teachers. Discussions with GES have however highlighted that they view this measure
as too crude as it does not reflect the reality of the teacher deployment model used by GES.
Using PTR underestimates the number of teachers required in rural schools with very low
enrolment and in their view PTR should therefore be seen as a maximum rather than as a
sector wide target. Discussions are underway to develop a more nuanced target for
teacher requirements beyond simply enrolment but none is available at present.
Teacher numbers in the EMIS system reveal some trends which cannot be explained by
known factors and developments in teacher stock. The number of untrained teachers
fluctuates significantly and despite the delayed deployment in NYEP teachers last year,
which meant that untrained teachers were under counted, the number of untrained teachers
at the primary level has fallen by a further 10,000 teachers in 2011/12. This variation raises
questions about the reliability of the teacher data in EMIS. The extensive information may
be undermining the reliability of the data. It may be advisable to instead focus on less
detailed information in order to enhance reliability. A more thorough review of teacher
numbers using other sources of historical data including Payroll, NSS and NYEP will be
included in the final report but was unfortunately not possible before completion of the
provisional report.
Deployment of trained teachers to more remote and rural areas has long been recognized
as a problem in Ghana and has led to significant variation at the regional/district level. This
is reflected in the much higher PTTRs in deprived districts at all levels of education and
maps depicting regional variation in trained teacher supply are thus included for each sub-
sector. This issue of inefficient deployment of resources has called for incentives to be
provided for teachers taking up postings in rural and remote areas. There was extensive
discussion around the 20% top up for teachers in deprived districts during 2011 but this
policy was not deemed to be feasible at present in light of the move to Single Spine Salary
Scheme.
Level 2008/09 2009/10 2010/11 2011/12
Target
2012
Depr.
District
2011
Depr.
District
2012
KG PTR 37 34 37 38 37 51.8 52.8
KG PTTR 117 105 96 85 205.6 177.0
KG % Trained
Teachers 31.3 32.2 38.8 44.8 61.0
25 30

Education Sector Performance Report 2012
Ministry of Education (MoE)
17
Supply of teachers has not kept pace with the expansion in access to KG and the
supply of trained teachers is particularly low. The PTTR for KG reflects a trained
teaching level that equates to one trained teacher per KG (average enrolment in KG
is 88 pupils per school).
The problem of trained teacher supply is exacerbated in the deprived district where it
is over two times the national rate.
The Ministry of Education together with the Basic Division of GES is currently
developing a national plan for quality KG delivery. At the recent Steering Committee
meeting (May 2012) 9 key elements were presented and it was agreed that teacher
training elements should be given priority.
2008/09 2009/10 2010/11 2011/12
Target
2012
Depr.
District
2011
Depr.
District
2012
Primary PTR 34 31 34 34 36 39.5 39.0
Primary PTTR 59 53 54 52 86.6 77.4
Primary %
Trained
Teachers 58.4 58.2 62.8 66.3 76.0 46
50
The target PTR reported in the table above aims for a PTR of 45 by 2015, which is
one of the efficiency enhancing measures included in the ESP. Primary PTR
remains inefficiently low by this measure.
The percentage of trained teachers has increased at Primary as at all levels of basic
education. This reflects not only an increase in the supply of untrained teachers but
also a decrease in the absolute number of untrained teachers in the system.
The proportion of trained Primary teachers is 16 percentage points lower in the
deprived districts, but supply of trained teachers has shown greater increase in
deprived districts in 2011/12, with the PTTR decreasing from 86.6 to 77.4.

Education Sector Performance Report 2012
Ministry of Education (MoE)
18
JHS
2008/09 2009/10 2010/11 2011/12
Target
2012
Depr.
District
2011
Depr.
District
2012
JHS PTR 18 15 17 17 20 19.9 20.4
JHS PTTR 23 20 22 20 29.8 27.4
JHS % Trained
Teachers 76.7 72.8 78.4 82.9 85.0
67 74
Teacher provision at JHS level is very high relative to KG and Primary due to the
introduction of subject teaching at this level of education. The PTR of 17 is below the
target of 20, indicating an inefficient deployment of teachers, and even PTTR is only 20
nationally and 29 for deprived districts.
Curriculum and Text Books
Core
textbook per
pupil 2008/09 2009/10 2010/11 2011/12
Target
2012
Target
– 2015
Depr.
District
2011
Depr.
District
2012
KG 0.1 0.2 0.4 0.3
0.3 0.3
Primary 1.6 1.6 1.0 0.9 1.8 3 0.9 0.9
JHS 2.1 1.5 0.9 1.1 1.7 3 0.9 1.0
With no central procurement of textbooks since 2008 it is not surprising to see that the
core textbook ratio is significantly below the ideal of 3 core textbooks per pupil at all
levels of basic education.

Education Sector Performance Report 2012
Ministry of Education (MoE)
19
Interestingly there has been an increase in the number of core JHS textbooks per pupil
despite increased enrolments and loss/attrition of textbooks. This could in part be due
to district level procurement but is more likely due to data problems, related to which
textbooks are being counted by schools in the census i.e. current textbooks, library
books etc.
Since 2008, no central procurement has been undertaken to replenish current stock of
textbooks. In 2011 the gaps in core textbook provision were identified at the district level
but no funds for textbook purchase have been identified.
The issue of sufficient textbook provision is a pertinent one with respect to the ongoing
GPEF grant application which focuses on raising the quality of education in deprived
districts through a number of district and school level interventions (textbook
procurement is not permitted). Wider quality enhancing interventions, such as teacher
training, may be undermined if textbook provision is woefully inadequate.
Class size and Furniture
Class sizes are significantly higher than sector standards. The AESOP includes
output targets for new classrooms required to ensure classroom ratio targets are
reached by 2015. The costs involved in building sufficient classrooms are however
prohibitive with regards to the sector budget and the PCR target will therefore not be
reached in the next three years, as reflected in the trends in classroom ratio in the
table above.
PCR is highest for KG which has experienced the greatest expansion in access in
recent years and school building has not been able to keep up. The enrolment data
outlined earlier in this chapter found that access to KG is higher in deprived districts
than in non deprived districts but it seems that equivalent facilities are not available
in these deprived districts leading to higher PCR in deprived districts
There has been no change in supply of furniture with constant pupil seating ratios at
all levels of basic education. Supply is lowest in KG where there are two pupils per
seating place. This means that in effect every other KG pupil will be sitting on the
floor or on some make-shift piece of furniture.
Pupil Classroom Ratio in Basic Schools
Pupil Classroom
Ratio 2008/09 2009/10 2010/11 2011/12
Depr.
District
2011
Depr.
District
2012
KG 53.5 57.4 63.7 64.3 82.3 86.1
Primary 39.8 40.0 41.9 42.3 44.4 44.5
JHS 38.0 37.1 38.9 38.7 43.4 43.0
Pupil seating ratio in Basic Schools

Education Sector Performance Report 2012
Ministry of Education (MoE)
20
Pupil seating
ratio 2008/09 2009/10 2010/11 2011/12
Depr.
District
2011
Depr.
District
2012
KG 2.0 2.0 2.0 2.0 2.7 2.6
Primary 1.3 1.4 1.4 1.4 1.7 1.5
JHS 1.3 1.3 1.3 1.3 1.4 1.3

Education Sector Performance Report 2012
Ministry of Education (MoE)
21
SECOND CYCLE EDUCATION
SENIOR HIGH SCHOOLS
ACCESS
The target for GER at SHS is only 40% by 2015, but given that demand for second
cycle education is likely to increase with expansion in access at the basic level this
target may be too low. Official age enrolment however stands at only 23.6%.
Progression to SHS is dependent on BECE performance and the transition rate
currently stands at 50%. Increasing progression to Second Cycle education was
captured as a priority in the 2010 Aide Memoire. Transition rates have been
increasing steadily except for the jump witnessed in 2010/11 and resultant decrease
in 2011/12. This may be due to a data issue arising from the inclusion of all 170
districts in EMIS in 2010/11 and potential problems of double reporting of schools in
“old” and “new” districts affecting indicators which use two different years of data
such as transition rates: leading to overestimation of 2010/11 transition variable and
underestimation of 2011/12 indicators.
GER and NER Trend in SHS
2008/09 2009/10 2010/11 2011/12
GER 33.9 36.1 36.45 36.9
NER 17.7 32.9 24.4 23.6
Transition rate from JHS3 to
SHS1 47.2 48.9 57.3 50.2
% of pupils in private education 10.0 10.8 8.9 8.8
GENDER
Percentage of Female Enrolment and Completion in SHS
Details 2008/09 2009/10 2010/11 2011/12
% female enrolment – SHS 44.3 44.7 45.4 45
SHS Completion rate –
Male - 35.8 34.6 37.4
SHS Completion rate –
Female - 29.8 31.1 31.1
Gender remains a factor in access to SHS, with only 45% of pupils enrolled in SHS
being female. Gender also affects retention, with the completion rate for male
students 6 percentage points higher than for female students.
Quality
In 2011 there was an increase in WASSCE pass rates for all core subjects
especially for English. This coincided with the first year that the new 4 year SHS

Education Sector Performance Report 2012
Ministry of Education (MoE)
22
students were being examined. This improvement cannot be attributed to the extra
year of schooling without further analysis, though this does appear to be an
indicative trend. It is perhaps to be expected that performance in the core subjects
would increase under the 4 year programme as the change to the syllabus for the 4
year programme meant that a significant proportion of the “extra” year was spent on
the core subjects. Any increased performance must of course be weighed up
against the additional costs incurred to the government and students.
Quality Indicators for SHS: Completion Rate, TLMs and Student
Teacher Ratio
2008/09 2009/10 2010/11 2011/12
Completion rate 32.9 34.3
PTR 22 21 27.31 21.5
PTTR 26 25 32 25.6
% Teachers trained 86.8 85.9 85.34 83.9
Textbook per pupil English 1.0 0.9 0.56 0.74
Textbook per pupil Maths 1.0 0.9 0.52 0.75
Textbook per pupil Science 0.6 0.7 0.48 0.68
Pupil Classroom ratio - 45.8 60.43 55.5
Pupil seating ratio - 1.2 1.32 1.3
Pupil desk ratio - 1.4 1.31 1.49

Education Sector Performance Report 2012
Ministry of Education (MoE)
23
The completion rate for SHS is on target at 34%, as mentioned earlier this national
rate hides the higher risks of drop out for female pupils through a six percentage
point gender gap in Completion Rates.
The provision of trained teachers is very high in SHS at 85.3% and with a PTTR of
25.6. PTR and PTTR rose sharply in 2010/11, which was the first year with 4 SHS
classes. Although there are still 4 classes in SHS, the ratios have returned to their
original levels suggesting that increased provision has been made for the increase in
enrolment created by the four year programme, though with some lag.
Each pupil should have 4 core textbooks, though on average each pupil only has
2.2. This is however substantially higher than the textbook coverage at the basic
level.
PCR has fallen in 2011/12 which may reflect the emergency building projects being
overseen by MoE to build new classroom blocks and dormitories for SHS due to the
enrolment of an extra year. The AESOP expenditure reporting reveals that 65m GHc
was utilised for emergency construction projects for SHS.
Technical Vocational Institutes (TVIs)
ACCESS
2008/09 2009/10 2010/11 2011/12
Enrolment Public 32,127 34,333 37,301 51,176
Enrolment Private 20,534 22,632 27,177 22,770
% of pupils private -– All 37.0 38.3 31.4
% of pupils private - Full
time only 39.0 39.7 42.1 30.80%
Public enrolment in TVET increased by 37% in 2011/12, which is in part due to the
absorption of some private TVIs into the public system. EMIS however also
confirmed that the coverage of TVET institutions is not as robust as with secondary
schools, meaning that there may be considerable variation in the institutes that are
reporting in consecutive years. This warrants further study and if this is found to be
the case measures taken to ensure that TVET providers take part fully in the EMIS
census process.
GER for TVET is 3.5% for 2011/12, below the AESOP target of 5%.
The target of 75% GER for Second Cycle education is extremely high given the
limited provision of SHS education and limited demand for TVET.
GENDER
2008/09 2009/10 2010/11 2011/12
% female enrolment -–
TVET 45 50.1 45.1 37.1

Education Sector Performance Report 2012
Ministry of Education (MoE)
24
Gender parity is weaker for TVET than for SHS with currently only 37.1% of pupils being
female. This reflects a significant decrease in the proportion of female trainees in TVET,
QUALITY
The only quality indicators reported on for TVET relate to the supply of trained teachers,
which have increased in 2011/12. The divergent trends in TVET suggest that there may be
some issues with the reliability of the data.
Trend in teacher Population in the Technical and Vocational Institutes
2008/09 2009/10 2010/11 2011/12
% Trained teachers 69.7 63.0 64.4 71.1
% Teachers with technical
qualifications 88.7 83.6 84.1 92.3
COTVET
National Aprenticeship Programme: in 2011 1,600 trainees were undergoing training
in Garments, Cosmetology, Auto mechanics and Electronics. NAP is designed as an
alternative training route for JHS graduates who were not placed in SHS. The
training includes the teaching of ICT, Entrepreneurial, Basic Literacy and Numeracy
skills. Apprentices will be assessed at the proficiency grade two level after the one
year training. NAP is being piloted in 50 districts, the first phase will include training
of 1,500 master craftsmen who will be distributed by regions as detailed in the table
below.
Regional Distribution For Master Craft Persons To Be
Used In Phase One
Region Provisional Number
Upper-East 50
Upper-West 50
Northern 90
Volta 80
Central 90
Brong-Ahafo 90
Eastern 100
Western 100
Ashanti 185
Greater-Accra 165
TOTAL 1,000
Ghana harmonized Competency Based Training in selected trade areas piloted in 3
TVIs.

Education Sector Performance Report 2012
Ministry of Education (MoE)
25
The Skills Development Fund was launched in September 2010 and SDF
Committee was inaugurated in January 2011. Operations manual developed and
first call for proposals advertised in June 2011, with 487 concept notes received by
the deadline. 192 of the applications invited to submit detailed proposals, 110
proposals had been submitted by December 31, 2011.
National TVET Qualifications Framework under development – submitted request for
Legilsative Framework to Attorney General’s Office.
Currently, there are about nine Ministries offering TVET under different Acts of
Parliament, eg. Polytechnics Act, NVTI Act, NABPTEX Act, these existing Acts and
the COTVET Act seems to be conflicting and poses considerable challenge in
effective and efficient formulation and implementation of TVET policies.

Education Sector Performance Report 2012
Ministry of Education (MoE)
26
INCLUSIVE AND SPECIAL EDUCATION
Inclusive Education - Mainstreaming
Due to limited provision of special education facilities for pupils with special educational
needs (SEN) and in line with the policy of inclusive education, the majority of SEN pupils
are enrolled in mainstream schools. In 21011/12 the number of mainstreamed SEN pupils
rose by 13% at the basic level to 19,775 and the enrolment growth in KG was even higher
(16%).
Enrolment of pupils with special needs in mainstreamed schooling
2006/7 2007/8 2008/09 2009/10 2010/11 2011/12
KG 5886 3129 3284 3413 3123 3636
Primary 20730 11613 11081 11035 9804 11,112
JHS 8113 4172 4399 3814 4489 5027
BASIC
TOTAL 34729 18914 18764 18262 17416 19775
SHS 1373 989 974 944 108 2
Although the data reported here is national, the Inclusive Education policy of SpED
operates in a 34 districts within 8 regions. Inclusive Education is supported in these
districts through the District Inclusive Education Teams (DIET) comprised of the District
Special Education Officer, Training Officer, 1 Circuit Supervisor, 1 Nurse and representation
from the Guidance & Counselling and SHEP district teams. The team coordinates capacity
building of teachers and community sensitization. Approximately 8,000 SEN pupils are
mainstreamed in these supported districts according to SpED data, meaning that
approximately 11,000 of the pupils identified by EMIS are attending schools in districts
without this support. It is therefore crucial that SpED expands the programme to all more
districts, not only to improve the quality of education provided to mainstreamed pupils but
also increase enrolments. Since 2004 over 5,000 teachers, head teachers, circuit
supervisors and District Directors of Education have been trained. In 2011 five new districts
were incorporated into the Inclusive Education framework. As yet only the management
team in these districts have been sensitized on Inclusive Education, the next steps include
capacity building of teachers and community sensitization.
There appears to be serious problems with the SHS data, with enrollment falling from 944
to 2 over two years. This is highly unlikely and suggests that there is an issue in reporting
on or collecting this indicator. This issue has been raised with EMIS and discussions will
continue after the review process. Final report should reflect the result of the discussion
Special Schools and Units

Education Sector Performance Report 2012
Ministry of Education (MoE)
27
After witnessing a decline in 2010/11 enrolment in specialist schools for pupils with special
educational needs has risen in 2011/12 to 6,432 pupils. The majority of these pupils are
enrolled in Special Schools although SpED also has a number of specialist units attached
to mainstreamed schools.
2006/7 2007/8 2008/09 2009/10 2010/11 2011/12
Enrollment in Special
Schools – Total 5,092 5,654 6,308 6,900 5,504 6,432
All pupils in Special Schools are provided with Feeding Grants in 2011, although those in
units attached to mainstream schools were not included unless the mainstreamed school
was covered by GSFP. SpED would like the unit schools to be included automatically in
any expansions of the GSFP or for these schools to be covered by the Feeding Grant.
Boarding costs for all students in special schools were paid in 2011 though there is an issue
with arrears. SpED’s GETFund allocation was spent on construction of Teacher
Accomodation and Classrooms in 2011.
SpED tasks the District Special Education Coordinators to undertake screenings in schools
using simple assessment tools. Identified pupils are then referred to local hospitals for
further tests. In 2011 Upper East (not all districts) and three districts in Greater Accra
carried out screening activities. The exercise screened …number of children and …was
found to have

Education Sector Performance Report 2012
Ministry of Education (MoE)
28
NON FORMAL EDUCATION
Enrolment figures are still not available for the most recent batch (2011/13) of Non
Formal Education provision as the classes have not stabilized, with 3 regions yet to
provide initial training to facilitators. Targets are, therefore, reported for this batch.
Dropout rates are available for the 2008/10 batch, and are very low at 2.1%. This
may however in part be due to the delay in collecting enrolment data for the
programmes, meaning that some dropouts may not have been captured.
Funding issues remain a problem for NFED who will not enrol any new learners
during 2012 due to limited funds.
NFED also produces radio programmes for broadcast on local stations, but in 2011
the production of programmes and frequency of broadcasts varied across regions.
For example, 34 programmes were aired in Greater Accra region, but no radio
programmes were broadcast in Eastern Region during 2011.
Review of existing literacy policy to include NFE has seen the development of
proposal and other preliminary works completed. The takeoff of the next phase is
awaiting release of funding.
Learner Enrolment by Year and Gender
Batch Year
Enrolled %
Female male female total
13 2006/ 08 12,164 19,204 31,368 61%
14 2007/ 09 11,573 19,612 31,185 63%
15 2008/ 10 14,813 24,041 38,854 62%
16 2009/ 11 17,224 24,796 42,020 59%
17 2010/ 12 18,904 31,777 50,681 63%
18** 2011/ 13 20,000* 30,000* 50,000* 60%
Total 94,678 149,430 244,108 61%
**Batch 18 (2011/2013) figures are targets since recruitment is
ongoing.
Dropout rates in NFED programmes
Batch Year
Enrolled Drop-out Rates (%)
male female total male female total
13
2006/
2008 12,164 19,204 31,368 11.58 9.62 10.38
14
2007/
2009 11,573 19,612 31,185 9.38 10.16 9.87
15
2008/
2010 14,813 24,041 38,854 1.86 2.29 2.13

Education Sector Performance Report 2012
Ministry of Education (MoE)
29
National Qualifications Framework
One factor militating against effective performance in the NFE sector is the absence of a
National Qualifications Framework (NQF) as the call to action directs countries to recognise,
rate and certify all learning outcomes in non-formal education and all adult learning and
education (ALE) in established equivalency frameworks. Absence of a National
Qualifications Framework frustrates valuing of previous knowledge and experience and
transfer of these to formal education.
Other Non-Formal Education Programmes
NFED has also been developing partnerships with the following organizations:
Vocational Literacy Project
The Hunger Project (a Trainer of Trainers workshop was conducted for the Hunger
Project staff who will in turn provide training for facilitators in their project areas)
The Ghana Women’s Voices Foundation-Mentoring and Literacy Programme for
Vulnerable Youth
The International Project on the Elimination of Child Labour of the ILO
The Standard Chartered Bank Financial Literacy Project
NFED are also interested in developing a qualifications framework: some work has been
started by COTVET. Need to bring all learning providers on board for this.

Education Sector Performance Report 2012
Ministry of Education (MoE)
30
TERTIARY EDUCATION
Data on tertiary education provision for 2011-12 is still being collated by the NCTE. Hence
data relating to the 2010-11 academic year has been used for this report.
Enrolment in Tertiary institutions has continued to expand, surpassing the target for
2012 of 174,574. Data on private tertiary enrolment was captured this year and
currently represents 14% of enrolment in the tertiary sector.
Female enrolment however remains low at 34.5%, female participation is highest in
Colleges of Education (41%) and lowest in Polytechnics (31%).
Government targets to focus university studies on science and technical subjects
have been met with limited progress.
The very low proportion of students studying Science and Technical related subjects
at Polytechnics reflects the popularity of business related courses, such as
Marketing and Accounting which account for 51% of all students enrolled in
Polytechnics.
ACCESS
Public and Private Tertiary institutions
Institution Number
Public Universities/university colleges 7
Public Specialized/Professional Colleges 7
Chartered Private Tertiary Institutions 3
Private Tertiary Institutions 51
Polytechnics 10
Public Colleges of Education 38
Private Colleges of Education 3
Public Nursing Training Colleges 13
Private Nursing Training Colleges 4
Total 136
Enrolment in Tertiary Institutions
Details 2006/7 2007/8 2008/9 2009/10 2010/11
Public Universities 88,445 93,973 102,548 107,058 115452
Polytechnics 28,695 34,448 38,656 46,079 43113
Colleges of Education 26,025 27,589 26,861 26703
Total 117,140 154,446 168,793 179,998 185268
Enrolment in Private
Universities
32,275
Female Participation in Public Tertiary Education

Education Sector Performance Report 2012
Ministry of Education (MoE)
31
% Female Enrolment 2006/7 2007/8 2008/9 2009/10 2010/11
Public Universities 34.3 33.7 37.4 32.3 33.3
Polytechnics 29.5 29.6 29.7 30.2 31
Colleges of Education 41.7 40.0 41.2
Total 33.1 32.6 36.3 32.9 34.5
Promoting Science and Technical Education
Enrolment Trend in Science and Technical
Programmes 2006/7 2007/8 2008/9 2009/10 2010/11
Enrol. in science and technical disciplines (%) 36.3 35.6 36.9 34.6 30.7
Enrol. in science and technical disciplines (%)
Public Units 34
Enrol. in science and technical disciplines (%):
Polytechnics 22.8

Education Sector Performance Report 2012
Ministry of Education (MoE)
32
Education Finance Overview and Key Issues Based on the experience of industrial countries that have emphasized the role of education in supporting economic growth and social cohesion, an appropriate range for the overall level of investment in education as a share of gross domestic product (GDP) is between 4 and 6 percent. UNESCO and the African Union’s suggestion is that actual expenditure should be approximately 6% of GDP. It is noted that Education spending as a share of gross domestic product (GDP) by international standard is between 4 and 6 percent; and expenditure on Tertiary education is expected to be within 15 and 20 percent of all public expenditures on public education. The understanding is that developing countries that devote more than 20 percent of their education budget to tertiary education (especially those that have not attained universal primary education coverage) are likely to have a distorted allocation. Trends in Education Expenditure Before the rebasing of Ghana’s economy baseline 2008, Ghana had apparently had a high share of education expenditure as a percentage surpassing, UNESCO and the African Union’s suggestion is that actual education expenditure should be approximately 6% of GDP. In Ghana, the tables below indicate that actual education expenditure increased from 5.3% in 2008 to 6.1 % in 2011 after the rebasing of the GDP. The rebasing has giving a reality check that Ghana was not after all over-spending on education and we have hovered around the limits of education as a percentage of GDP for a middle income country. Table X: Trends in Education Resource Envelope and Expenditure as a share of GDP and Total Public Spending
Source 2008 2009 2010 2011
GoG 1,219,028,427 1,461,721,144 1,825,819,889 2,563,391,576
Donor 100,652,087 95,067,893 64,742,440 127,255,813
IGF 164,097,989 210,524,567 302,013,754 354,288,649
GETfund 212,541,633 150,636,100 313,283,250 518,486,027
HIPC/MDRI 47,251,582 31,818,711 58,504,024 2,288,506
Total Education Expenditure 1,743,571,718 1,949,768,414 2,564,363,357 3,565,710,570
GDP5 30,179,000,000 36,598,000,000 46,232,000,000 57,013,000,000
Total Government Expenditure 9,538,244,209 8,756,146,694 11,532,209,320 13,837,325,330
Education Exp. as a % of GDP 5.8% 5.3% 5.5% 6.3%
Education Exp. as a % of GoG Exp.
18.3% 22.3% 22.2% 25.8%
Source: Ministry of Finance and Economic Planning and MoE
5 This is the rebased GDP using 2008 as the baseline (source: Ministry of Finance and Economic Planning, 2012
Budget Statement)

Education Sector Performance Report 2012
Ministry of Education (MoE)
33
Figure X: Education Expenditure as a percentage of GDP compared with UNESCO benchmark on of Percent GDP Expenditure on Education
Source: Ministry of Finance and Economic Planning and MoE The next table presents the trends in expenditure by level of education from 2008 – 2011 a. The share of expenditure accruing to primary education has been steady at end periods of 2008 and 2011, but fluctuated between period 2009and 2010. Basic education still captures the largest share followed by tertiary and SHS. Spending on tertiary continue to decline from 21.7% in 2008 to 17.9% in 2011. KG allocation also continues to dwindle increasing the perception of lack of commitment to the mainstreaming KG policy. Table X: Trends in Expenditure by level of Education
Sources
2008 2009 2010 2011
Amt. (GH¢) % Amt. (GH¢) % Amt. (GH¢) % Amt. (GH¢) %
Pre-school
65,901,027 3.8
60,272,779 3.1
72,036,051 2.8
103,391,337 2.9
Primary
613,661,054 35
594,950,694 30.5
715,160,506 27.9
1,234,146,460 34.6
JHS
292,419,320 16.8
297,665,072 15.3
370,235,825 14.4
411,648,553 11.5
SHS
171,058,251 9.8
337,369,027 17.3
400,030,646 15.6
526,809,606 14.8
TVET
18,311,207 1.1
35,038,819 1.8
38,436,313 1.5
126,982,366 3.6
SPED
10,662,566 0.6
7,493,238 0.4
17,214,633 0.7
19,149,996 0.5
NFED
6,327,284 0.4
3,715,031 0.2
13,357,023 0.5
15,154,167 0.4 Teacher Education
55,274,368 3.2
50,377,753 2.6
62,056,093 2.4
- -
Tertiary
378,615,134 21.7
401,191,936 20.6
511,806,744 20
639,230,889 17.9 Mgt. & 7.5 8.2 14.1 13.7

Education Sector Performance Report 2012
Ministry of Education (MoE)
34
Subvtd 130,011,299 160,837,566 362,459,208 487,809,862
HIV-AIDS
1,330,209 0.1
856,499 0
1,570,316 0.1
1,387,335 0.04
Total
1,743,571,719 100
1,949,768,414 100
2,564,363,357 100
3,565,710,570 100
The following table provides a breakdown of total expenditure in 2011 by source. PE accounts for 68.5% of the total expenditure in the education sector. Administration, Service and Investment account for 2.4%, 14.7% and 14.1% respectively. GoG funds are the bulk of the expenditure at 79.9%, followed by GETFund expenditure at 14.5%. Internally Generated Funds provide 9.9% of expenditure and donors 3.6% with HIPC fund contributing 0.01% Table X: Education Resource Envelope and Item Expenditure 2011
Sources PE Administration Service Investment Total %
GoG 2,450,824,393 41,114,714 17,469,398 53,983,071 2,563,391,576 71.9%
Donor 97,469,383 29,786,430 127,255,813 3.6%
IGF - 45,855,049 307,437,490 996,110 354,288,649 9.9%
GETfund 99,645,410 418,840,617 518,486,027 14.5%
HIPC 2,288,506 - 2,288,506 0.1%
Total 2,450,824,393 86,969,763 524,310,187 503,606,228 3,565,710,570 1.00
% 68.7% 2.4% 14.7% 14.1%
Source: Ministry of Education
Education Resource Envelope
Expenditure on Item
The following table provides a breakdown of total expenditure in 2011 by level of education. Primary education captures the largest proportion of all expenditure at 34.6% of total expenditure. The second largest proportion of expenditure is tertiary with 17.9%. JHS and

Education Sector Performance Report 2012
Ministry of Education (MoE)
35
SHS received 11.5% and 14.8% respectively. These shares continue of pre-school, demonstrates lack of commitment to the policy of mainstreaming KG and attaching one to every existing \primary school in the medium ter. Table X: Expenditure by Level of Education and Item 2011
Level PE Administration Service Investment Total %
Pre-school 88,852,590 356,801 8,642,215 5,539,730 103,391,337 2.9%
Primary 1,098,234,672 1,902,034 77,234,407 56,775,347 1,234,146,460 34.6%
JHS 335,138,328 1,102,001 45,769,630 29,638,594 411,648,553 11.5%
SHS 172,253,691 2,258,994 182,922,574 169,374,348 526,809,606 14.8%
TVET 24,711,452 562,544 33,226,215 68,482,154 126,982,366 3.6%
SPED 9,388,756 611,550 5,145,889 4,003,800 19,149,996 0.5%
NFED 13,473,650 988,202 692,314 - 15,154,167 0.4%
Tertiary 339,158,378 69,412,638 138,995,901 91,663,972 639,230,889 17.9%
Management & Subvented
369,612,876 9,774,998 30,293,706 78,128,282 487,809,862 13.7%
HIV-AIDS - - 1,387,335 - 1,387,335 0.0%
Total 2,450,824,393 86,969,763 524,310,187 503,606,228 3,565,710,570 100%
GoG Expenditure 2011 The following table gives the breakdown of GOG expenditure by Item and by level of education. PE constitutes 95.6% of the total expenditure with Administration, Service and Investment accounting for 1.6%, 0.7%, and 2.1% respectively. This implies that salaries continue to account for the largest share of expenditures.
The largest proportion of the GoG budget is spent on primary education (43.1%). Management and Sub vented agencies receive the second highest share with 15.5%, followed by 14.3% at the tertiary level which is much higher than international norms. The remaining levels of education receive minimal proportions of the total expenditure. Table X: GoG Expenditure by level of Education 2011
Level PE Administration Service Investment Total %
Pre-school
88,852,590
356,801
19,957 350,000
89,579,348
3.5%
Primary
1,098,234,672 1,902,034
308,100
4,200,000
1,104,644,806 43.1%

Education Sector Performance Report 2012
Ministry of Education (MoE)
36
JHS
335,138,328 1,102,001
161,774
2,100,000
338,502,102 13.2%
SHS
172,253,691
2,258,994
226,901
30,000,000
204,739,586 8.0%
TVET
24,711,452 562,544
95,275
12,000,000
37,369,272
1.5%
SPED
9,388,756
611,550
10,502
362,026
10,372,834 0.4%
NFED
13,473,650
988,202
692,314
-
15,154,167 0.6%
Tertiary
339,158,378
23,557,589
536,482
2,808,807
366,061,256 14.3%
Management & Subvented
369,612,876
9,774,998
15,418,093
2,162,238
396,968,205
15.5%
HIV-AIDS - - - - - 0.0%
Total
2,450,824,393
41,114,714
17,469,398
53,983,071
2,563,391,576
% of Total 95.6% 1.6% 0.7% 2.1% 100.0%
Source: MoE The following table depicts the execution rate for GOG expenditure for 2011. The overall execution rate for GoG funds was 168%. The Ministry’s total PE expenditure for the year 2011 was GH¢ 2.45 billion as against a budget of GH¢ 1.42 billion thereby creating a budget overrun of GH¢ 1.03 billion. The PE execution rate of 172% can be attributed to two major factors namely:
The low level of PE ceiling given to the sector by MOFEP. For example, the PE ceiling for the year 2011 (GH¢ 1.42 billion) was 19.8% lower than the actual PE expenditure (GH¢ 1.78 billion) for the 2010.
The second factor is the implementation of the Single Spine Salary Scheme. The execution rate for Administration was 137%. The overrun of 37% was attributed to the release of extra funds by the Ministry of Finance and Economic Planning to NCTE for the payment of Book and Research allowances to senior academic staff at the tertiary sector. The Service execution rate was 83%. Even though this is lower than the budget provision, it is an improvement over previous year’s execution rates of 52.4% in 2010. The investment budget allocation of GH¢53.9 million includes a supplementary budget of GH¢49 million for the construction of Schools Under Trees, classrooms and dormitories for Senior High Schools and the revamping of Science Resource Centers. The budget execution rate of 105% indicates a budget overrun of 5%. Table X: GoG Budget Execution Rate 2011
Budget Head
PE Administration
Allocation Expenditure Execution
Rate Allocation Expenditure
Execution Rate
140 Main Ministry 189,279,000 211,318,221 112% 5,000,000 4,845,978 97%
141 GES Headquarters 3,480,717 5,366,041 154% 4,887,331 4,651,485 95%
142 GES Regional 1,070,048,114 1,885,592,997 176% 7,501,116 7,448,112 99%

Education Sector Performance Report 2012
Ministry of Education (MoE)
37
143
Institutions of the Handicapped 5,721,882 9,388,756 164% 611,553 611,550 100%
145 Tertiary 156,000,000 339,158,378 217% 12,000,000 23,557,589 196%
Total 1,424,529,713 2,450,824,393 172% 30,000,000
41,114,714 137%
Budget Head
Service Investment
Allocation Expenditure Execution
Rate Allocation Expenditure
Execution Rate
140 Main Ministry 5,027,820 3,249,704 65% 49,300,000 50,807,000 103%
141 GES Headquarters 4,876,923 12,292,562 252% 1,400,000 355,238 25%
142 GES Regional 6,477,275 1,380,149 21% 0 0 0
143
Institutions of the Handicapped 645,771 10,502 2% 0 12,026 0
145 Tertiary 4,000,000 536,482 13% 473,295 2,808,807 593%
Total 21,027,789 17,469,398 83% 51,173,295 53,983,071 105%
GETfund continue to the second biggest contributor to education resource envelope followed by IGF, Donor and HIP sources respectively. HIPC resources was applied to some social intervention programmes at the basic level. Surprisingly GETfund allocation to SHS surpassed tertiary allocation for the first in the history of GETfund expenditure trends.SHS led the lot with 30.4% followed by tertiary with 20.4% and the least 1.0% going to KG with no allocations made NFED and HIV-AIDS activities. The jump in allocation to SHS is explained the massive construction across the country to expand access to SHS.
Table X: Expenditure by level of Education of other education resources2011
Level HIPC GETfund IGF Donor
Amount % Amount % Amount % Total %
Pre-school 114,425 5.0 5,309,764 1.0 914,036 0.3 7,473,763 5.9
Primary 1,373,103 60.0 63,717,174 12.3 18,722,434 5.3 45,688,942 35.9
JHS 686,552 30.0 38,196,629 7.4 8,546,207 2.4 25,717,063 20.2
SHS - 0.0 157,408,772 30.4 144,422,659 40.0 20,238,589 15.9
TVET - 0.0 69,479,126 13.4 17,367,236 4.9 2,766,733 2.2
SPED 114,425 5.0 8,662,736 1.7 - 0.0 - 0.0
NFED - 0.0 - 0.0 - 0.0 - 0.0
Tertiary - 0.0 105,839,589 20.4 159,384,291 45.0 7,945,754 6.2
Management & Subvented
- 0.0 69,872,237 13.5 4,931,786 1.4 16,037,634 12.6
HIV-AIDS - 0.0 - 0.0 - 0.0 1,387,335 1.1
Total 2,288,506 100 518,486,027 100 354,288,649 100 127,255,813 100
IGF is concentrated at the second cycle level and tertiary where cost sharing policy is in place, between them they 85% of the resources. Donors spending continue to show their emphasis on basic education with a total allocation 0f 35.9% made to primary, 20.2% to JHS.

Education Sector Performance Report 2012
Ministry of Education (MoE)
38
UNIT Cost Analysis Unit cost in education continues to depict a steady rise in cost across all levels of education, except SHS level, where the recent massive infrastructure projects to expand access at this level has distorted unit cost trends. TVET equally demonstrates some distorted trend also due to the same reason of expansion of second cycle education Table X: Unit Cost
6 and Student Per Capita
7
Level 2008 2009 2010 2011
Primary
Per Capita GH¢ 201.74 191.97 223.59 389.96
Unit Cost GH¢ 189.02 180.55 213.75 372.02
JHS
Per Capita GH¢ 274.81 276.89 336.37 366.69
Unit Cost GH¢ 256.73 259.74 319.6 340.28
SHS
Per Capita GH¢ 387.6 703.88 602.91 694.57
Unit Cost GH¢ 281.12 636.35 397.33 471.26
TVET
Per Capita GH¢ 378.74 884.64 1,030.44 2,481.29
Unit Cost GH¢ 304.81 649.94 775.35 1,143.12
TERTIARY
Per Capita GH¢ 2,681.33 2,619.82 2,762.52 -
Unit Cost GH¢ 2,012.37 2,034.48 1,932.05 -
6 Student Unit Cost is the recurrent expenditure per student by level of education which indicates
7 Cost per capita is the total expenditure per ub-sector

AESOP 2011 Reporting Template
This table aims to capture the performance of the education sector with regards to the Annual Education Sector Operational Plan in an attempt to draw a closer link between expenditure and outcomes in the education sector. The expenditure on key priority activities is reported alongside the corresponding indicators, with the annual targets reported in the AESOP. The expenditure information relates to the budget year 2011 and the education indicators to the school year (2011/12). The targets for the 2011/12 school year are therefore derived from the subsequent AESOP 2012-14. A brief narrative of key trends for each objective is reported here so that this section can function as summary, though more detailed information on indicators is provided in the main narrative section of the report. NOTE: District Education Office Expenditure data is not aggregated at the national level by activity and as such it was not possible to capture this expenditure information in the matrix below. This includes the 15m GHc DFID sector budget support that is given to DEOs. Expenditure and output information was not received from all Development Partners but it is hoped that this information will be submitted after NESAR in order that it will be captured in the final Education Sector Performance Report for 2012.
BASIC EDUCATION
Improve equitable access to and participation in quality education at all levels
KEY INDICATORS
GER 2011 2012 target
2012 actual
Total Number of Schools 2011
2012 target
2012 actual NER 2011
2012 target
2012 actual
KG 98.4 98.7 99.4 KG 13,263 14,568 13,505 KG 60.1 NA 64.2
Primary 96.4 98.5
96.5 Primary 14,431 14,875 14,360 Primary 77.9 80.9 81.7
JHS 79.6 84.6
80.6 JHS 8,462 10,711 8,557 JHS 46.1 57 46.1
Summary of Key Trends by Education Sub-Sector
KG:
The expansion in access to pre primary education enjoyed in recent years has continued in 2011/12 and Ghana is on target to achieve 100% access to KG by 2015. Official age enrolment however remains an area of concern with NER significantly lower at 64.2, although after a period of decline the proportion of children enrolled at the correct age has been increasing since 2009/10, with a 4 percentage point increase this year.
Primary:
After an initial period of high growth in primary enrolments following the introduction of the capitation grant, improvements in access have slowed. In 2011/12 Primary GER remained constant at 96.5 and based on recent growth trends will not reach the target of 107 in 2015. New and more realistic medium targets should be adopted in the AESOP against which performance can be measured. First year admissions have experienced higher growth rates, with GAR standing at 102.9,

Education Sector Performance Report 2012
Ministry of Education (MoE)
40
but official age admission is increasing at a lower rate and with NAR at only 71.2 it is clear that overage admission remains a problem, with potential consequences for risk of drop out and learning outcomes. A worrying trend in recent years at Primary level has been the decline in correct aged enrolment in absolute terms. However, in 2011/12 the number of correct aged children in Primary education increased by 9% leading to a rise in NER of 4 percentage points.
JHS:
Enrolment in JHS remains low, with minimal expansion in recent years as GER fluctuates around 80%. A source of concern is the decreasing trend in transition rates from P6 to JHS1 witnessed in recent years, falling below 90% in 2011/12. A note of caution is however required for the current transition rate data, which may be misleading as it utilises data from 2010/11 and 2011/12 to construct the indicator. With the expansion of EMIS to all 170 districts in 2010/11 it seems that there may have been some issues with double reporting of schools in “old” and “new” districts, compromising the validity of indicators using data across years. Despite the lower transition rate, the gross admissions rate has been increasing. The issue of correct age enrolment is however even more pertinent in admissions where the NAR at 43.6% is half the value of GAR at 88%.
Activity Output
Targets Actual Output
Estimated Costs
Actual Costs Notes
Construction of new basic classrooms (including schools under trees), with furnishing. Unit cost 30,000 Gh Cedi 6,666 200.0 21.9
The output targets for classroom construction included in the AESOP are based on projections from the sector Financial Model which are driven by classroom ratios. This generates unfeasibly high asset costs relative to the government budget, leading to significantly lower execution rates.
1,226 Schools Under Trees projects are currently underway, with 37 completed by MoE in 2011 (no data on GETFund completion available). 2011 expenditure also includes furniture provision for Schools Under Trees.
In 2011 USAID began a project which involves construction of 157 classrooms by 2013, but there was no completion in 2011.
In 2011 the last phase of the Northern Flood Schools project was completed, though most of the funds had been spent in previous years.
District Assemblies are an important component of infrastructure spending but no information is captured here as it was not available to MoE. A recent study undertaken jointly with DPs has revealed the extent of issues involved in accessing information on breakdown of DA expenditure is very difficult.
JICA building 4JHS and 29 primary schools in Central and Northern Region

Education Sector Performance Report 2012
Ministry of Education (MoE)
41
Embassy of Japan building one JHS model school.
Refurbishment of basic classrooms. Unit cost 14,000 Gh Cedi 6,666
39 (USAID) 93.3 5.5
No Basic classrooms refurbished from HQ level, but potential district funding of this activity, which is currently not aggregated. Under PPS 5.5m GHc was spent on School Rehabilitation and Furniture in deprived districts in 2011. Unfortunately the number of classrooms refurbished is not available. USAID completed refurbishment of 39 classrooms in 2011. DEO expenditure not currently aggregated but most likely to contribute to this activity.
Develop child-friendly school standards and guidelines 1 0 2.3 0.07
UNICEF have worked on developing Child Safe School Standards in 2011 although Government has yet to officially adopt any specific standards/guidelines. A commitment has however been made on the part of government to adopt a set of standards in 2012 as part of the ongoing GPEF application process.
School uniform and ExerciseBook Provision (PAS) - (from Budget Request)
428,156 (uniform) 12,100,000 (exercise books) 10.0
10.0 (uniform), 7.0 (Ex. Books)
428,156 School Uniforms were distributed in 2011 using 10m GHc from GETFund. GES procured 12,100,000 exercise books but the books were not distributed in 2011 and the Supplies and Logistics division is currently arranging distribution.
Support hard-to-reach children and current complementary education programmes (SFL);
10,000 750 2.0 0.12
Government did not undertake any CBE activities in 2011, although work continued on developing a CBE policy, which laid the foundations for the inclusion of CBE as a component for District Grants in the GPEF application. UNICEF supported 750 learners in Savulugu Nanton district in Northern Region.
Sign MoU with MoESW to target children most in need. 1 0 0.0 0.0 Not undertaken.
Infrastructure support to students with special needs /
12 districts 6.0 0.1
No funds released from GES HQ for special needs infrastructure. Under PPS, 12 deprived districts undertook enrolment drives in 2011.

Education Sector Performance Report 2012
Ministry of Education (MoE)
42
enrolment drives
Completion of potable water and sanitation facilities for 4600 schools. This target exceeds financial model targets.
1,500
458 boreholes (PPS), 58 latrine blocks (UNICEF) 100.0
4.4 (PPS), 0.5 (UNICEF)
Under the PPS project 458 boreholes were constructed in 2011. UNICEF constructed 58 4-seater institutional KVIP latrine blocks comprising 116 separate drop holes for boys and 116 for girls and hand washing facilities in 32 schools in 9 districts in the Northern Region providing access to improved latrines for approximately 6,700 pupils.
Non AESOP Costs: Feeding Programme
162,000 (WFP)
4.0m USD (WFP), 0.85 (DFID BS)
WFP supported 162,000 students with school feeding in 2011. In addition 850,000 GHc from DFID sector budget support was spent on supporting feeding and take home rations provided by GES/WFP. Total Ghana School Feeding Programme coverage in 2010/11 school year is 1,040,745 (administered by Ministry of Local Government).
Objective 2: Bridge gender gap in access to education [SH]
KEY INDICATORS
GPI
2011 2012 target 2012 actual GAR Male Female Completion Rate Male Female
KG 0.98 1.0 0.98 KG - - KG - -
Primary 0.97 1.0 0.97 Primary 99.5 96.2 Primary 95.4 91.9
JHS 0.93 1.0 0.94 JHS 89.8 86.3 JHS 70.4 63
BECE PASS RATE Male Female
English 58% 60%
Social Studies 62% 57%
Maths 62% 57%
Science 62% 57%

Education Sector Performance Report 2012
Ministry of Education (MoE)
43
Summary of Key Trends by Education Sub-Sector
KG: KG has fluctuated around parity in recent years
Primary:
Based on current trends at Primary level, full gender parity could be reached within 5 years although the experience of the KG subsector suggests closing the final gap to parity may take longer. Crucially it will require addressing the significant variations at district level and targeting those districts with persistently low GPI, many of which are geographically concentrated in the Northern region.
JHS:
The issue of access to education by gender is greatest for JHS, with a GPI of 0.94 and 32 districts exhibiting a GPI of less than 0.8. There is also a 6 percentage point gap in completion rates between male and female JHS students, indicating that problems of retention are greater for girls who face higher risk of drop out. Issues of barriers to access to education are compounded by lower learning outcomes for girls e.g. BECE, where the pass rates are higher for boys in all subjects except English.
Activity Output
Targets Actual Output
Estimated Costs
Actual Costs Notes
Maintain JHS Girls' clubs and deployment of female role models in schools/ communities
4.8
0.04 (UNICEF)
UNICEF supported Female Role Models to Visit 5 regions (NR, UWR, UE). USAID established girls football clubs in 78 JHS.
Continue Scholarship Programmes for Girls
3,894 2.2
0.05m USD (WFP)
WFP supported 129 girls with scholarships and USAID provided 3,765 scholarships in 2011.
Girl-friendly guidance and counselling system [Stock Figure: Further discussion needed]
2.0
78 girls coaches trained to provide life skills counselling for girls.
Non AESOP costs: Take Home Rations
10,000
1m USD WFP supported 10,000 girls with Take Home Rations
Non AESOP costs: Running costs of GEU division.
0.1
Running costs of GEU including Planning worskshop, review meetings, Strategic Planning and Training of District Girls Education Officers (funded through WUSC decentralisation programme: see management section).
Objective 5: Improve quality of teaching and learning [ED]

Education Sector Performance Report 2012
Ministry of Education (MoE)
44
KEY INDICATORS
Completion Rate
2011
2012 target
2012 actual
% Trained Teachers
2011
2012 target
2012 actual
Core Textbk Ratio
2011
2012 target
2012 actual NEA
Min. Comp.
Proficiency
KG
KG 37.4
61 44.8 KG 0.4
0.3 Eng P3
66.3 24.2
Primary 91.6
95 93.7 Primary
62.8 76 66.3 Primary
1.0 1.8 0.9
Eng P6
78.9 35.3
JHS 66.9
80.1 66.8 JHS 78.4
85 82.9 JHS 0.9
1.7 1.1 Maths P3
52.6 18.2
Math P6
56.9 16.1
PTR 2011
2012 target
2012 actual PTTR
2011
2012 target
2012 actual
KG 37 37 38 KG 84.5 - 85
Primary 34
36 34 Primary
54 - 52
JHS 17 25 17 JHS 22 - 20
Summary of Key Trends by Education Sub-Sector
KG:
Supply of trained teachers has not managed to keep up with the expanded enrolment witnessed in recent years, reflected in the high PTTR. The national indicators however mask significant disparities at the district level, the PTTR for deprived districts is more than double the national rate at 177. This has led to calls for incentives to be provided for teachers taking up postings in rural and remote areas. There was extensive discussion around the 20% top up for teachers in deprived districts during 2011 but this policy was not deemed to be feasible at present in light of the move to Single Spine Salary Scheme.
Primary:
Primary Completion Rate has increased but is slightly below 2012 target, it is not surprising though that growth in completion rates slows as Ghana nears universal primary completion. The growth rate for Female PCR has however been higher in recent years, indicating that the gender gap is closing. NEA reveals poor learning outcomes at primary level. Although there has been some improvement in NEA scores in 2011, learning levels are still worryingly low (AESOP target for 60% proficiency in P6 Maths by 2012). There is also significant regional variation in NEA results. Core Textbook Ratio: No central procurement undertaken during 2011 means textbook ratios continue to fall and are substantially below the 2012 target of 1.8. Teacher provision at the Primary level has kept up with enrolments and indeed at 34 is below the target for

Education Sector Performance Report 2012
Ministry of Education (MoE)
45
efficient allocation of teachers. Discussions with GES have however revealed that they find the focus on PTR misleading as it is too crude a measure of staffing requirements in schools, underestimating needs in small schools with low enrolment. Provision of trained teachers is however a greater problem, with a PTTR of 52 at the national level and of 87 for deprived districts.
JHS:
Completion Rate at JHS are substantially below target levels, indicating that retention in JHS is a crucial issue facing basic education. Based on these trends it is clear that Universal Basic Education will not be achieved by 2015. Trained Teacher provision at JHS level is very high relative to KG and Primary. PTR at 17 is below the target of 20, indicating an inefficient deployment of teachers, even PTTR is only 20 nationally and 29 for deprived districts. Core Textbook Ratio for JHS remains low due to the lack of a systematic textbook procurement process within the Ministry of Education. There has been a slight increase in the textbook ratio, which could in part be due to district level procurement but is more likely due to data problems, related to which textbooks are being counted by schools in the census i.e. current textbooks, library books etc. BECE results reveal significant regional variation in learning outcomes: English pass rates range from 82% (Greater Accra) to 40% (Upper East). Volta, Central and the three Northern Regions have pass rates below the average in both subjects.
Activity Output
Targets Actual Output
Estimated Costs
Actual Costs Notes
Follow-up training on Mother Tongue Instruction 90,000 0 5.7 0
No provision for NALAP in GES budget allocation for 2011 and thus activities carried out. Assurance from Basic Education division that NALAP activities will be included in 2013 budget. USAID planning refresher NALAP Training for about 80,000 teachers in 2013. NALAP integrated into GPEF programme components.
Strengthen in-school monitoring and supervision of BE literacy and numeracy teaching (head teachers and SMCs) - From GES Budget 7.7
0.5 (GoG), 0.1 (UNICEF)
BECE monitoring undertaken by GES but no specific monitoring for literacy and numeracy teaching. UNICEF supported monitoring and supervision in 5 Regions (NR, UWR, UER, CR, ER). USAID supported head teacher and SMC training detailed in Management section below.
Materials Provision for Mother Tongue Instruction (supplementaty materials; second printing of original materials) 0 0.0 0
No provision for NALAP in 2011, but USAID planning to support Mother tongue instructional material provision in 2012 or 2013.
Revise CoE languages syllabi to focus on the teaching of literacy and numeracy / develop 0.1
Not undertaken.

Education Sector Performance Report 2012
Ministry of Education (MoE)
46
methodologies for teaching such.
Continue NEA, SEA tests to measure literacy and numeracy in P3 and P6; 1 1 0.3 2.3
NEA undertaken in 2011 funded by USAID (1.3m USD) and GES (0.5m GHc through DFID budget support). Results reported above. USAID also currently supporting SEA (conducted in even years) for 2012, assessment tools are being piloted.
Review BE curricula at all levels in collaboration with key stakeholders to ensure relevance to national needs, skills development and social norms 1.0
Curricula reviewed for 3 subjects in 2011, remainder undertaken in first quarter of 2012.
Print syllabus updates and distribute to BE schools 2.8 0
Not undertaken.
Objective 6: Promote science and technical education at all levels [ED]
NO KEY INDICATORS
Summary of Key Trends by Education Sub-Sector
Activity Output
Targets Actual Output
Estimated Costs
Actual Costs Notes
ICT Policy Implementation
70.0 30.0
60,000 laptops purchased for 2,500 Junior High Schools in Ghana at a cost of 30m GHc financed by GETFund.
Comprehensive review of Pre-Tertiary Science Policy 1.0
Not undertaken.
Objective 8: Improve management of education service delivery [ECON]
KEY INDICATORS
NEW DBE GRADUATES
2012 target 2012 actual
TEACHER EFFECTIVEN 2012 target 2012 actual

Education Sector Performance Report 2012
Ministry of Education (MoE)
47
ESS
CofE graduates 8,500
Time on Task 48% No Data
UTDBE 8,800 0 Teacher Absenteeism 21% No Data
Cert A Upgrade - -
Summary of Key Trends by Education Sub-Sector
Studies of the Ghanaian education sector indicate that Teacher Absenteeism and Time on Task are serious issues, reflected in the low targets for 2012 in these indicators. Unfortunately there are currently no reliable measures for these indicators at the national level and thus performance cannot be tracked. The School Report Cards, which were rolled out nationwide in 2010/11 should provide data on Teacher Absenteeism and it is hoped that when the 2011/12 report card data is aggregated ( June 2012) a baseline should be available. New Diploma graduates: Though no government sponsored UTDBE programme was undertaken in 2011, the trigger for the 2012 MDBS is to enrol 8,000 untrained teachers in this scheme, which is currently underway to start in September 2012. The total number of UTDBE participants is likely to be higher if GPEF is approved as 8,000 teachers will be trained under the fund in deprived districts and GES plans to support teachers in non deprived districts. No new Certificate A teachers were enrolled in 2011, although 2,000 teachers are currently completing the course. TED of GES are planning to enrol a further 2,000 Cert A teachers in 2012. All fees for Certificate A upgrading is currently provided by the teachers themselves.
Activity Output
Targets Actual Output
Estimated Costs
Actual Costs Notes
Review of current teacher deployment policy and practices 0.0
Yet to be undertaken. As part of GPEF application donor partners have committed to employing a consultant to review teacher norms.
MoU with MOLGRD and MWH to provide infrastructure to teachers in deprived districts 0.0 Not undertaken.
Teacher Salary Top-up: 15% salary top-up to approximately 30% of the teaching force (those in deprived districts) - Based on FM. Not likely in 2011 37.0
Not undertaken in 2011 despite much discussion and even ultimate inclusion in the 2012 budget allocation. 20% top up has been put on hold due to issues with incorporating the allowance in the single spine structure.
Teacher Housing - Based on FM. Not likely in 2011 500 0 12.5 0
Target derived from Financial model but due to high costs execution has not been undertaken. Some may be

Education Sector Performance Report 2012
Ministry of Education (MoE)
48
undertaken at district level by District Assemblies which are not captured here.
Provide specialized INSET training in multi-grade teaching for teachers in rural areas [inclusion based on budget request] 3.2
0.9 (DFID BS)
JICA INSET project for Primary education. . DFID Budget Support for INSET.
UTDBE (Number of Participants) 37,000 260 5.2 0
No government UTDBE programme initiated in 2011, GES sponsored trainees to begin the programme in 2012. GPEF also includes UTDBE component for 8,000 primary and KG teachers. USAID supported 260 untrained community teachers with two years of teacher training under UTDBE program. Two additional years of study are required for the community teachers to complete the UTDBE program
Headteacher Training (Number of Participants) 8,000 10,017 0.9
0.8 (UNICEF)
UNICEF supported training of 6,337 head teachers in 5 Regions (NR, UWR, UER, CR, ER). USAID supported 3,680 Head Teachers in 2011 under PAGE programme.
Policy Dialogue on NSS, NVS, NYEP 0.0
Not undertaken. Role of untrained teachers remains unclear with respect to targets, recommendations have included returning these staff to teaching assistants rather than teachers. Data on these teachers in schools collected by EMIS appears to be very noisy, as it is not clear that they are adequately captured. Analysis on teacher data to be undertaken by PBME.
Implementing PTPDM policy: 1) Upgrading Cert-A teachers. Teachers participating in Sandwich course. 2) Establishing structure of supporting PTPDM at DEO 3)Establishing structure of supporting PTPDM at school
1) 10,000 2) 1,140 3) 15,000
1) 2,000 2) 1,140 3) 15,226
1) 0.4
1) 0.2
3.0 (JICA)
1)2,000 teachers continued on the sandwich course from 2010, but no new teachers enroled under 2011. TED expect another cohort to enrol in 2012. Costs for Certificate A upgrading are predominantly borne by the teachers themselves rather than GES though 200,000 GHc from DFID budget support was spent on the sandwich course in 2011. 2) JICA INSET project for Primary education :JICA supported TED/GES to organize DDE sensitization workshop for 170 DDEs; Orientation for District INSET Committee (DIC); and

Education Sector Performance Report 2012
Ministry of Education (MoE)
49
4) Support school to organize SBI/CBI in science and mathematics 5) Provision of motorbikes
4) 9,189 schools 5) 0
4) 2,800 schools 5) 30
Training for District Master Trainers (DMT) and District Teacher Support Team (DTST) on how to organize SBI/CBI and assess lessons in science and mathematics.
3) JICA supported TED/GES to support each DEO to train headteacher and Curriculum Leader (CL) of public primary schools on how to organize SBI/CBI and assess lesson in science and mathematics. 4) 2800 schools organized SBI/CBI in math and science in 2011. 5) JICA provided 30 motorbikes to 15 well-performing district for effective monitoring.
CoE Stipends 21.0 72.9
Allowances for College of Education exceeded estimated cost, this is in part due to the move to single spine salary which also affects allowances since trainees were moved onto the IPPD payroll. The out years for AESOP envisages that the coverage of allowances will be reduced as the Colleges are now Tertiary institutions and thus trainees should be eligible for student loans. The Budget request for 2012 however includes no anticipated reduction in allowances, requesting 119m GHc for the year.
Study Leave 8,306 42.0 58.7
Study Leave was paid for an average of 8,306 teachers over 2011 (numbers fluctuate on a monthly basis). The total cost for 2011 was 58,691,952 GHc. The higher expenditure than envisioned in the AESOP was due to the introduction of the single spine salary structure. Although a cap of 3,000 has been placed on the number of new teachers approved for study leave, the AESOP includes much larger reductions in study leave in out years, but there is currently no commitment to reduce coverage of Study Leave further. Work needs to be undertaken on alternatives for professional development of teachers if study leave is removed e.g. Distance Learning.

Education Sector Performance Report 2012
Ministry of Education (MoE)
50
BECE Subsidies 7.0 6.4
The subsidy covered all 372,826 registered BECE candidates (both public and private). Out year targets in AESOP include a reduction in coverage of BECE, though there are no plans at present to amend eligibility criteria.
Complete SMC Policy and SMC Management Handbook with
attention effective use of Capitation Grants 1 1 0.0
New handbooks completed. USAID supported printing of additional 15,000 of revised SMC Handbooks under the PAGE program for 46 districts.
Train in 5100 selected BE schools (30 per District to 3 SMC
members (to include at least 1 woman and the Treasurer)
together with the head teacher of each selected school. 2500 3,680 1.1 USAID trained 3,680 SMCs under PAGE programme.
Capitation Grant (4.5, 4.7 and 4.9 Gh cedi, per year respectively)
Arrears included in 2011. Outputs are number of pupils receiving
grants 5.5m 33.6 15.2
Expenditure covers only two tranches of Capitation Grant as the first tranche of 2011/12 school year was not paid out until beginning of 2012 (8.5m GHc). AESOP envisions raising grant amount, although there are currently no plans to undertake this within GES. The impact of a higher grant and a base grant will be tested through the GPEF programme if approved.
Operationalizing SRC, Performance Agreements and
Awards for top performing schools and districts 2.1
SRCs have been rolled out nationally and as the completion of SRCs is an indicator in MDBS GES is currently collating the responses.
Establishment of NIB 0.8 0.15
GOG funds provided to establish NIB. USAID supported activities to operationalise NIB through the Ghana Education Decentralization Project.

Education Sector Performance Report 2012
Ministry of Education (MoE)
51
SECOND CYCLE
Improve equitable access to and participation in quality education at all levels
KEY INDICATORS
2011
2012 targe
t
2012 actua
l
2011 2012
target
2012 actua
l
2011 2012 target
2012 actual
2011 2012 target
2012 actual
SHS GER
36.5 38 36.9 SHS GAR
38.5 41 35
SHS NER
24.4 - 23.6
SHS Total No. of Schools
511 547 515
TVET GER
5 3.6
Transition Rate to SHS
57.3 -
50.2
Summary of Key Trends by Education Sub-Sector
SHS: Progression to SHS is dependent on qualifying based on BECE performance and the transition rate currently stands at 50%. The target for GER at SHS is only 40%, but given that demand for second cycle education is likely to increase with expansion in access at the basic level this is perhaps not sufficient. Official age enrolment however stands at only 24%.
TVET:
Enrolment in TVET institutions increased, but fell short of the target of 5% GER. The EMIS sample however does not cover all TVET providers. Besides formal TVET, COTVET launched the National Apprenticeship Programme in 2011.
Activity
Output Targets
Actual Output
Estimated Costs
Actual Costs Notes
Continue SHS construction and refurbishment 33.0 64.0
Construction of 55 SHS Dormitories ongoing, 160 Classroom Blocks completed and 248 ongoing. Provision of Furniture for SHS (GETFund).
Rehabilitate all 26 Technical Schools 7 17.0 0.2
1 Rehabilitation of 7 Technical Schools/Institutes.

Education Sector Performance Report 2012
Ministry of Education (MoE)
52
Objective 2: Bridge gender gap in access to education [SH]
KEY INDICATORS
2011 2012 Target
2012 actual
2011 2012 actual Male
Female
% Female Enrolment SHS
45.4% 47% 45%
% Female Enrolment TVET
45.1% 37.1%
Completion Rate 37.4
31.1
Summary of Key Trends by Education Sub-Sector
SHS: Gender remains a factor in access to SHS, with only 45% of pupils enrolled in SHS being female. Gender is also a factor in the chances of progressing through SHS, the completion rate for male students is 6 percentage points higher than for female students.
TVET:
Gender parity is weaker for TVET than for SHS with currently only 37.1% of pupils being female. This reflects a significant decrease in the proportion of female trainees in TVET, though the coverage of the EMIS sample is not as consistent for TVET as for SHS and basic meaning that there may be some issues with the data in these indicators.
NO PRIORITY ACTIVITIES IN AESOP UNDER THIS OBJECTIVE
Objective 5: Improve quality of teaching and learning [ED]
KEY INDICATORS
SHS ONLY 2011
2012 target 2012 actual 2011
2012 target 2012 actual WASSCE pass rate 2009 2011
Completion Rate
32.9% 34% 34.2% PTTR
32 - 25.6 Maths 59.6 58.5
PTR 27.3
23.6 21.5 Core Textbook
- 2.2 English 81.8 87
% Trained 85.3 87% 85.3% Science 72.8 60.6
Social Studies 94.8 91.5
Currently no quality indicators for TVET.
Summary of Key Trends by Education Sub-Sector

Education Sector Performance Report 2012
Ministry of Education (MoE)
53
SHS:
The completion rate for SHS is on target at 34%, as mentioned earlier this national rate hides the higher risks of drop out for female pupils through a six percentage point gender gap in Completion Rates. The provision of trained teachers is very high in SHS at 85.3% and with a PTTR of 25.6. PTR and PTTR rose sharply last year, which was the first year that there were 4 SHS year groups. Although there are still 4 classes in SHS, the ratios have returned to their original levels suggesting that increased provision was made for the increase in enrolment created by four years, though with some lag. Each pupil should have 4 core textbooks, though on average each pupil only has 2.2. This is however substantially higher than the textbook coverage at the basic level. WASSCE pass rates by subject reveal that there has been an improvement in performance in English by 5 percentage points, although there has been a decrease in the remaining core subjects. These results relate to the first year of the Four Year SHS programme and due to the larger focus on the core subjects in the first year compared with the traditional 3 year programme, it is perhaps not surprising that performance has increased in English, though it is surprising to see that performance in the other core subjects has in fact decreased, particularly Science which sees a significant drop of 12 percentage points. Another TIMMS survey was not undertaken in Ghana in 2011.
NO PRIORITY ACTIVITIES IN AESOP UNDER THIS OBJECTIVE
Objective 6: Promote science and technical education at all levels [ED]
NO KEY INDICATORS
Activity
Output Target Actual Output
Estimated Costs
Actual Costs Notes
Revamp Science Resource Centers and provide with teaching and learning aids 87 1.2
Work on 54 Science Resource Centres commenced in 2011, with 17 completed.
Objective 8: Improve management of education service delivery [ECON]
NO KEY INDICATORS
Activity
Output Target Actual Output
Estimated Costs
Actual Costs Notes
Provide SHS/Tech.Voc Subsidies to 673,000 SHS students and 54,000 TVET pupils.
39.4
44.6

Education Sector Performance Report 2012
Ministry of Education (MoE)
54

Education Sector Performance Report 2012
Ministry of Education (MoE)
55
INCLUSIVE AND SPECIAL EDUCATION
Improve equitable access to and participation in quality education at all levels
KEY INDICATORS
Special Schools 2011 2012 target 2012 actual
Mainstreamed Pupils 2011 2012
Enrolment 5,676 8,280 6,432 KG 3,123 3,636
Primary 9,804 11,112
JHS 4,489 5,027
SHS 108 2
Summary of Key Trends
Due to limited provision of specialist education facilities for pupils with special educational needs (SEN) and in line with the policy of inclusive
education, the majority of SEN pupils are enrolled in mainstream schools. In 21011/12 the number of mainstreamed SEN pupils rose by 13% at the
basic level to 19,775 and the enrolment growth in KG was even higher (16%). After a decline in 2010/11 enrolment in specialist schools for pupils with
SEN has risen in 2011/12 to 6,432 pupils. The majority of these pupils are enrolled in Special Schools although SpED also has a number of specialist
units attached to mainstreamed schools.
Activity
Output Targets
Actual Output
Estimated Costs
Actual Costs Notes
Construct and/or rehabilitate 26 'special-needs friendly' school based libraries. 2
No funds were released for building special needs libraries in 2011 though the activity has been included in the budget request for 2012. GETfund allocation was spent on building teachers accommodation (Teachers are residential at Special Schools) and classrooms. The GPEF proposal includes components for enhancing access to education for children with special needs.

Education Sector Performance Report 2012
Ministry of Education (MoE)
56
NON FORMAL EDUCATION
Improve equitable access to and participation in quality education at all levels
KEY INDICATORS
2010/12 2011/13 2010/12 2011/13 2012 target 2012 actual
Enrolment (by batch) 50,681 50,000* % Female Learners 63% 60% Adult Literacy Rate 0.64 (Census)
*Target enrolment
Summary of Key Trends
Enrolment figures are still not available for the most recent batch (2011/13) of Non Formal Education provision as the classes have not stabilised, with 3 regions yet to provided initial training to facilitators. Targets are therefore included for this batch. Dropout rates are available for the 2008/10 batch, and are very low at 2.1%. This may however in part be due to the delay in collecting enrolment data for the programmes, meaning that some dropouts may not have been captured. Funding issues remain a problem for NFED who will not enrol any new learners during 2012 due to limited funds. NFED also produces radio programmes for broadcast on local stations, but in 2011 the production of programmes and frequency of broadcasts varied across regions. 34 programmes were aired in Greater Accra region, but no radio programmes were broadcast in Eastern Region during 2011.
NO PRIORITY ACTIVITIES FOR NFED IN AESOP

Education Sector Performance Report 2012
Ministry of Education (MoE)
57
TERTIARY EDUCATION
Improve equitable access to and participation in quality education at all levels
KEY INDICATORS
2012
target 2012
actual 2012
target 2012
actual 2012
target 2012
actual 2012
target 2012
actual
Enrolment 174,574 185,268 % Female 35% 34.50%
Enrolment: Science and Tech (Uni.) 37% 34
Expenditure as % of total envelope 27%
Enrolment Science and Tech. (Polytechnic) 40% 22.8
Summary of Key Trends
Enrolment in Tertiary institutions has continued to expand, surpassing the target for 2012. Female enrolment however remains low at 34.5%, female participation is highest in Colleges of Education (41%) and and lowest in Polytechnics (31%). Government targets to focus university studies on science and technical subjects have been met with limited progress. The very low proportion of students studying Science and Technical related subjects at Polytechnics reflects the popularity of business related courses, such as Marketing and Accounting which account for 51% of students enrolled in Polytechnics.
Activity
Output Targets
Actual Output
Estimated Costs Actual Costs Notes
Initial steps toward establishing OU. 0.7 0
[TE6] Ensure those who are academically eligible are able to benefit from tertiary education
Costed in MoE Budget Submission
[TE12] Ensure all tertiary graduates have acquired basic transferable skills
Costed in MoE Budget Submission

Education Sector Performance Report 2012
Ministry of Education (MoE)
58
EDUCATION MANAGEMENT
Objective 8: Improve management of education service delivery [ECON]
NO KEY INDICATORS
Activity
Output Targets
Actual Output
Estimated Costs Actual Costs Notes
Decentralization Implementation (EM2 Activities 1-12 in ESP Vol.2) 0.7
0.6(JICA)
2.9
Guidelines of ADEOP and ADPR developed in Sep 2011 and a training programme of ADEOP/ADPR for planning/statistics officers of all regions and districts conducted in Mar 2012 with support of JICA. Annual regional review improved though revision of reporting template made consisted with district reporting and SPIP/SPAM reviewed with technical support of JICA
USAID funded activity to operationalize the three new bodies (NTC, NCCA and NIB) through the Ghana Education Decentralization Project. Total cost of project in 2011 is 1.8m USD.
EM3: Strengthen M&E, accountability and efficiency measures across the whole sector at all levels (Ensure education system is efficient and publicly accountable)
0.1 (UNICEF)
0.7
(USAID)
UNICEF supported M&E at the National, Regional and District Levels in 5 Regions (NR, UWR, UER, CR, ER). USAID funded study on Data Capacity Assessment of the Education Sector in 2011.
Re-align and finalize the master plan for EMIS reform in conformity with the organizational structure of the MoE and ensure its timely impleemtnation 1.0 0.02
Trained 162 (10 from 5 regions) GES Statistical/Planning Personnel to use data to analyse/generate own reports of ADEOP at Regional/ District Levels (NR, UWR, UER, CR, ER)

Education Sector Performance Report 2012
Ministry of Education (MoE)
59
EM 4 Implementation (EM4 Activities 1-8). Non-master plan costs are embedded in directorate budgets.
USAID Data Capacity review incorporated a review of EMIS in 2011 (see costs above).
EM5 Implementation (EM5 Activities 1-4): Review Disadvantaged criteria. Costs embedded in directorate budgets.
Resource Allocation Model for GES fund disbursement updated for districts. Deprived district criteria updated in May 2012 as part of GPEF process.
Upgrading Financial Management System to support GIFMIS implementation
USAID provided support through the Data Management and Communication Strengthening program to assist GES upgrade its systems. No costs deriving from Education sector in 2011 for MoE, although some impending software costs for 2012.
Establish and operationalize: National Teaching Council 0.7 0.0 NTC inaugurated in 2012.
Establish and operationalize: National Council for Curriculum and Assessment
0.7 0.0 NCCA inaugurated in 2012.
MoE to clarify role of COTVET