Embed Size (px)
Citation preview

Republic of the PhilippinesNATIONAL STATISTICS OFFICE
Manila
Table 1 Monthly Consumer Price Index for All Income Households in the Philippines by Commodity Group
2 0 1 3 COMMODITY GROUP Jan Feb Mar Apr May Jun Jul Aug Sep Oct Nov Dec Ave
ALL ITEMS 132.0
Food and Non-Alcoholic Beverages 141.6
Alcoholic Beverages and Tobacco 146.8
Clothing and Footwear 126.5
Housing, Water, Electricity, Gas, and Other Fuels 127.0
Furnishing, Household Equipment and Routine Maintenance of the House 123.8
Health 130.1
Transport 126.0
Communication 92.7
Recreation and Culture 110.5
Education 138.7
Restaurant and Miscellaneous Goods and Services 124.7
2 0 1 2 COMMODITY GROUP Jan Feb Mar Apr May Jun Jul Aug Sep Oct Nov Dec AveALL ITEMS 128.1 128.1 128.4 129.4 129.5 130.1 130.5 131.5 131.4 131.3 131.4 131.3 130.1
Food and Non-Alcoholic Beverages 138.4 137.7 137.7 138.6 138.6 139.2 139.8 141.2 141.8 141.4 141.3 141.3 139.8
Alcoholic Beverages and Tobacco 125.1 125.8 126.4 127.8 128.5 129.0 129.5 129.8 129.9 130.3 130.8 131.2 128.7
Clothing and Footwear 120.6 120.9 121.2 122.8 123.8 124.4 125.0 125.4 125.6 125.7 125.9 126.0 123.9
Housing, Water, Electricity, Gas, and Other Fuels 122.6 123.5 124.2 125.8 125.6 126.3 127.0 128.0 126.6 126.5 126.7 126.4 125.8
Furnishing, Household Equipment and Routine Maintenance of the House 118.0 118.1 118.6 120.0 120.5 121.2 121.9 122.5 122.8 123.1 123.2 123.4 121.1
Health 125.9 126.2 126.4 127.3 127.9 128.3 128.8 128.9 129.0 129.2 129.4 129.5 128.1
Transport 124.6 125.2 125.8 127.0 126.5 125.3 124.7 125.5 126.2 126.1 125.8 125.8 125.7
Communication 92.2 92.1 92.2 92.4 92.5 92.5 92.6 92.6 92.6 92.6 92.6 92.6 92.5
Recreation and Culture 108.3 108.3 108.4 109.0 109.3 109.6 110.0 110.1 110.1 110.1 110.2 110.3 109.5
Education 132.9 132.9 132.9 132.9 132.9 138.7 138.7 138.7 138.7 138.7 138.7 138.7 136.3
Restaurant and Miscellaneous Goods and Services 121.3 121.5 121.8 122.4 123.1 123.4 123.8 123.8 123.9 124.1 124.3 124.3 123.1
January 2012 - January 2013(2006 = 100)

Republic of the PhilippinesNATIONAL STATISTICS OFFICE
Manila
Table 1A Monthly Consumer Price Index for All Income Households in the National Capital Region (NCR) by Commodity Group
2 0 1 3 COMMODITY GROUP Jan Feb Mar Apr May Jun Jul Aug Sep Oct Nov Dec Ave
ALL ITEMS 125.8
Food and Non-Alcoholic Beverages 135.2
Alcoholic Beverages and Tobacco 136.2
Clothing and Footwear 131.1
Housing, Water, Electricity, Gas, and Other Fuels 124.0
Furnishing, Household Equipment and Routine Maintenance of the House 120.1
Health 134.5
Transport 114.0
Communication 93.9
Recreation and Culture 112.7
Education 140.0
Restaurant and Miscellaneous Goods and Services 120.8
2 0 1 2 COMMODITY GROUP Jan Feb Mar Apr May Jun Jul Aug Sept Oct Nov Dec AveALL ITEMS 122.8 122.9 123.1 123.5 123.5 124.2 124.9 126.4 125.5 125.4 125.5 125.4 124.4
Food and Non-Alcoholic Beverages 132.4 131.1 131.2 131.7 131.9 132.5 133.3 136.4 136.3 135.4 134.9 135.4 133.5
Alcoholic Beverages and Tobacco 119.9 120.4 120.9 122.0 122.4 123.1 123.8 124.2 124.6 125.5 126.7 127.2 123.4
Clothing and Footwear 122.9 123.0 123.3 124.9 127.0 128.0 129.4 130.0 130.1 130.3 130.4 130.4 127.5
Housing, Water, Electricity, Gas, and Other Fuels 120.8 122.3 122.3 122.9 122.3 123.5 124.6 126.1 122.8 123.3 123.9 123.1 123.2
Furnishing, Household Equipment and Routine Maintenance of the House 112.6 112.6 112.8 113.3 113.8 115.1 116.1 118.1 119.0 119.1 119.1 119.3 115.9
Health 129.8 130.0 130.1 130.4 130.8 131.1 132.3 132.4 132.4 132.5 132.6 132.8 131.4
Transport 114.2 114.8 115.7 115.5 114.4 113.2 112.8 113.8 114.7 114.7 114.2 114.0 114.3
Communication 93.1 93.1 93.2 93.5 93.8 93.9 93.9 93.9 93.9 93.9 93.9 93.9 93.7
Recreation and Culture 110.2 110.2 110.3 110.6 110.9 111.7 112.4 112.5 112.5 112.5 112.5 112.6 111.6
Education 135.5 135.5 135.5 135.5 135.5 140.0 140.0 140.0 140.0 140.0 140.0 140.0 138.1
Restaurant and Miscellaneous Goods and Services 119.4 119.5 119.6 119.7 120.0 120.1 120.7 120.7 120.7 120.7 120.7 120.7 120.2
January 2012 - January 2013(2006 = 100)

Republic of the PhilippinesNATIONAL STATISTICS OFFICE
Manila
Table 1B Monthly Consumer Price Index for All Income Households in Areas Outside NCR by Commodity Group
2 0 1 3 COMMODITY GROUP Jan Feb Mar Apr May Jun Jul Aug Sep Oct Nov Dec Ave
ALL ITEMS 134.0
Food and Non-Alcoholic Beverages 143.0
Alcoholic Beverages and Tobacco 148.9
Clothing and Footwear 125.0
Housing, Water, Electricity, Gas, and Other Fuels 128.4
Furnishing, Household Equipment and Routine Maintenance of the House 125.1
Health 128.9
Transport 129.7
Communication 92.1
Recreation and Culture 109.7
Education 138.3
Restaurant and Miscellaneous Goods and Services 126.4
2 0 1 2 COMMODITY GROUP Jan Feb Mar Apr May Jun Jul Aug Sept Oct Nov Dec Ave
ALL ITEMS 129.7 129.7 130.0 131.3 131.4 132.0 132.3 133.1 133.3 133.2 133.3 133.2 131.9
Food and Non-Alcoholic Beverages 139.7 139.1 139.1 140.1 140.0 140.6 141.2 142.2 142.9 142.7 142.7 142.6 141.1
Alcoholic Beverages and Tobacco 126.1 126.9 127.5 129.0 129.7 130.2 130.6 130.9 131.0 131.3 131.6 132.0 129.7
Clothing and Footwear 119.9 120.2 120.5 122.1 122.7 123.2 123.6 123.9 124.1 124.2 124.4 124.6 122.8
Housing, Water, Electricity, Gas, and Other Fuels 123.4 124.0 125.0 127.1 127.1 127.6 128.1 128.8 128.3 128.0 128.0 127.9 126.9
Furnishing, Household Equipment and Routine Maintenance of the House 119.9 120.1 120.7 122.4 122.9 123.4 123.9 124.0 124.2 124.5 124.7 124.9 123.0
Health 124.8 125.1 125.4 126.5 127.1 127.5 127.8 128.0 128.1 128.3 128.5 128.6 127.1
Transport 127.8 128.4 129.0 130.6 130.3 129.1 128.4 129.2 129.8 129.7 129.4 129.5 129.3
Communication 91.8 91.7 91.8 91.9 91.9 91.9 92.0 92.0 92.0 92.0 92.0 92.0 91.9
Recreation and Culture 107.7 107.7 107.8 108.4 108.7 108.9 109.1 109.2 109.3 109.3 109.4 109.5 108.8
Education 132.1 132.1 132.1 132.1 132.1 138.3 138.3 138.3 138.3 138.3 138.3 138.3 135.7
Restaurant and Miscellaneous Goods and Services 122.2 122.4 122.8 123.6 124.4 124.8 125.1 125.2 125.3 125.6 125.8 125.9 124.4
January 2012 - January 2013(2006 = 100)

Republic of the PhilippinesNATIONAL STATISTICS OFFICE
Manila
Table 2 Monthly Consumer Price Index for All Income Households in the Philippines, by Commodity Group, Area/Region
C O M M O D I T Y G R O U P
Food and Non-Alcoholic Beverages Alcoholic Beverages and Tobacco
A R E A / R E G I O N JANUARY DECEMBER JANUARY DECEMBER JANUARY DECEMBER JANUARY DECEMBER
2013 2012 2012 2011 2013 2012 2012 2011 2013 2012 2012 2011 2013 2012 2012 2011Philippines 132.0 128.1 131.3 127.6 141.6 138.4 141.3 138.1 146.8 125.1 131.2 124.8 126.5 120.6 126.0 120.1NCR- National Capital Region 125.8 122.8 125.4 122.0 135.2 132.4 135.4 132.6 136.2 119.9 127.2 119.6 131.1 122.9 130.4 121.4Areas Outside NCR 134.0 129.7 133.2 129.4 143.0 139.7 142.6 139.3 148.9 126.1 132.0 125.8 125.0 119.9 124.6 119.7Regions: CAR - Cordillera Administrative Region 130.9 125.3 130.6 125.3 141.1 136.5 141.6 136.6 147.0 124.5 132.2 124.5 120.8 114.1 120.0 114.2 I - Ilocos Region 124.2 122.9 124.3 123.7 133.0 131.8 133.5 133.5 132.6 119.7 124.0 119.5 114.3 113.4 114.3 113.4 II - Cagayan Valley 133.3 129.7 132.5 129.7 142.2 141.8 142.5 142.1 157.1 124.4 129.9 123.3 119.0 111.4 118.8 110.8 III - Central Luzon 133.8 129.5 132.5 129.2 139.8 137.5 139.2 137.5 153.1 122.1 126.5 121.9 132.6 124.0 131.9 123.7 IV-A - CALABARZON 131.1 128.4 130.3 128.0 142.2 140.7 141.8 139.9 148.5 129.0 134.4 128.8 123.6 120.0 123.3 119.7 IV-B - MIMAROPA 135.5 131.1 135.2 130.6 145.1 140.0 145.0 139.3 139.7 121.4 129.9 121.7 129.6 125.8 129.3 125.2 V - Bicol Region 134.6 130.8 133.4 130.7 144.7 140.3 143.4 140.3 138.4 121.7 124.5 121.9 119.7 114.9 117.6 114.8 VI - Western Visayas 134.9 128.9 133.9 128.6 143.2 137.7 142.5 137.1 156.3 128.0 132.8 127.9 121.9 116.6 121.8 116.6 VII - Central Visayas 131.8 123.3 131.3 123.1 137.6 128.6 137.1 128.4 146.6 122.8 135.1 122.8 122.6 117.0 122.6 116.7 VIII - Eastern Visayas 136.0 131.2 135.4 130.9 147.5 143.3 146.5 143.0 133.1 121.2 125.6 120.8 117.7 114.6 117.6 114.5 IX - Zamboanga Peninsula 139.1 134.3 137.9 134.0 148.0 144.0 148.0 143.7 179.8 132.2 142.8 131.9 128.1 125.3 128.0 125.3 X - Northern Mindanao 141.0 136.4 140.4 135.3 150.1 148.5 149.5 147.4 141.8 129.8 137.8 128.7 129.8 122.9 129.4 122.9 XI - Davao Region 137.8 134.2 137.4 133.4 149.7 146.3 149.3 144.7 136.1 128.1 133.7 127.5 124.8 120.6 124.3 120.5 XII - SOCCSKSARGEN 138.2 134.2 137.3 133.8 142.7 140.6 142.9 140.0 162.9 126.7 130.8 126.3 130.7 127.1 130.7 127.0 XIII - Caraga 144.9 138.9 144.2 138.0 149.0 145.5 148.0 144.2 175.1 151.5 160.1 150.2 137.8 129.2 137.4 128.6
ARMM - Autonomous Region in Muslim Mindanao 143.7 139.9 143.2 140.0 156.5 152.6 156.2 152.6 138.4 132.9 137.2 132.9 124.2 121.2 124.0 121.1
January 2013 and 2012, December 2012 and 2011(2006 = 100)
All Items Clothing and Footwear

Table 2--Continued
C O M M O D I T Y G R O U P
A R E A / R E G I O N JANUARY DECEMBER JANUARY DECEMBER JANUARY DECEMBER JANUARY DECEMBER
2013 2012 2012 2011 2013 2012 2012 2011 2013 2012 2012 2011 2013 2012 2012 2011Philippines 127.0 122.6 126.4 121.9 123.8 118.0 123.4 117.8 130.1 125.9 129.5 125.6 126.0 124.6 125.8 124.3NCR- National Capital Region 124.0 120.8 123.1 120.0 120.1 112.6 119.3 112.5 134.5 129.8 132.8 129.1 114.0 114.2 114.0 113.6Areas Outside NCR 128.4 123.4 127.9 122.8 125.1 119.9 124.9 119.7 128.9 124.8 128.6 124.7 129.7 127.8 129.5 127.6Regions: CAR - Cordillera Administrative Region 125.9 116.3 125.4 116.0 120.5 116.3 120.4 116.2 126.1 123.7 126.1 123.7 130.4 129.2 130.4 128.9 I - Ilocos Region 117.9 117.4 118.3 117.7 117.0 116.4 117.0 116.4 120.0 119.0 119.9 119.0 124.0 121.7 123.9 121.3 II - Cagayan Valley 126.2 121.1 125.9 120.9 121.5 116.6 121.5 116.2 124.5 117.3 124.3 117.2 136.0 134.1 136.0 133.8 III - Central Luzon 128.9 126.3 128.5 125.5 125.2 120.9 125.1 120.8 125.9 120.4 125.4 120.4 133.8 130.1 133.1 129.8 IV-A - CALABARZON 124.2 120.9 122.8 120.4 124.1 118.3 123.9 118.1 130.2 127.2 129.8 126.9 122.7 121.8 122.6 121.6 IV-B - MIMAROPA 132.6 129.1 132.7 128.8 126.7 122.5 126.6 122.3 126.2 122.3 126.1 122.3 124.0 123.5 123.8 122.9 V - Bicol Region 123.2 122.3 122.6 121.7 126.9 123.0 125.3 123.0 122.2 118.0 121.4 117.9 139.1 138.6 138.6 138.4 VI - Western Visayas 128.9 121.4 128.6 121.0 130.4 121.8 130.2 121.4 130.7 128.5 130.6 128.4 132.4 130.2 132.2 130.1 VII - Central Visayas 133.5 120.0 133.5 119.9 124.9 118.5 124.9 117.6 123.5 116.8 123.3 116.8 134.4 134.2 134.3 134.1 VIII - Eastern Visayas 129.7 120.8 129.9 120.2 119.4 115.0 119.4 114.9 124.3 121.3 124.1 121.2 125.5 123.2 125.5 123.0 IX - Zamboanga Peninsula 132.6 125.5 130.3 125.0 125.3 121.2 125.3 121.1 123.1 120.5 123.0 120.5 145.2 144.7 145.2 144.4 X - Northern Mindanao 141.1 133.4 140.5 130.6 131.9 121.9 131.8 120.6 154.0 147.6 153.9 147.4 131.2 124.3 130.8 124.2
XI - Davao Region 127.6 123.6 127.2 123.4 124.5 122.3 124.3 122.1 141.1 138.1 140.8 138.0 130.4 129.9 130.4 129.8 XII - SOCCSKSARGEN 141.7 135.5 141.7 134.7 121.4 118.5 121.3 118.5 137.2 131.9 137.0 131.5 126.8 126.1 126.7 125.8 XIII - Caraga 151.3 138.4 152.3 137.6 133.7 127.5 133.5 127.5 141.5 134.2 141.4 134.1 136.5 133.9 136.5 133.5 ARMM - Autonomous Region in Muslim Mindanao 128.1 124.8 127.6 124.8 124.9 122.6 124.5 122.6 143.3 139.2 143.1 139.2 112.2 110.2 112.1 110.2
- 2 -
TransportHousing, Water, Electricity, Gas, and Other Fuels
Furnishing, Household Equipment and Routine Maintenance of the
HouseHealth
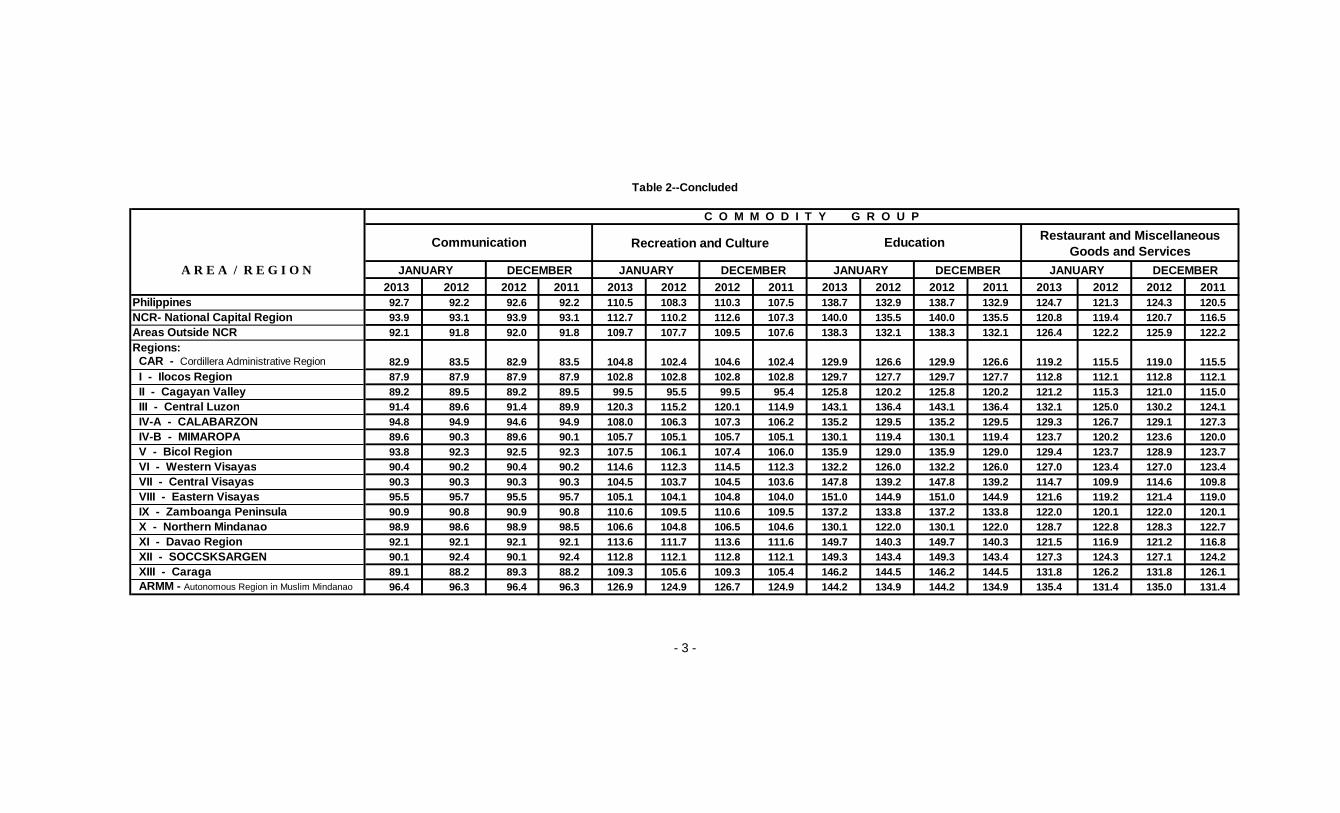
Table 2--Concluded
C O M M O D I T Y G R O U P
Recreation and Culture
A R E A / R E G I O N JANUARY DECEMBER JANUARY DECEMBER JANUARY DECEMBER JANUARY DECEMBER2013 2012 2012 2011 2013 2012 2012 2011 2013 2012 2012 2011 2013 2012 2012 2011
Philippines 92.7 92.2 92.6 92.2 110.5 108.3 110.3 107.5 138.7 132.9 138.7 132.9 124.7 121.3 124.3 120.5NCR- National Capital Region 93.9 93.1 93.9 93.1 112.7 110.2 112.6 107.3 140.0 135.5 140.0 135.5 120.8 119.4 120.7 116.5Areas Outside NCR 92.1 91.8 92.0 91.8 109.7 107.7 109.5 107.6 138.3 132.1 138.3 132.1 126.4 122.2 125.9 122.2Regions: CAR - Cordillera Administrative Region 82.9 83.5 82.9 83.5 104.8 102.4 104.6 102.4 129.9 126.6 129.9 126.6 119.2 115.5 119.0 115.5 I - Ilocos Region 87.9 87.9 87.9 87.9 102.8 102.8 102.8 102.8 129.7 127.7 129.7 127.7 112.8 112.1 112.8 112.1 II - Cagayan Valley 89.2 89.5 89.2 89.5 99.5 95.5 99.5 95.4 125.8 120.2 125.8 120.2 121.2 115.3 121.0 115.0 III - Central Luzon 91.4 89.6 91.4 89.9 120.3 115.2 120.1 114.9 143.1 136.4 143.1 136.4 132.1 125.0 130.2 124.1 IV-A - CALABARZON 94.8 94.9 94.6 94.9 108.0 106.3 107.3 106.2 135.2 129.5 135.2 129.5 129.3 126.7 129.1 127.3 IV-B - MIMAROPA 89.6 90.3 89.6 90.1 105.7 105.1 105.7 105.1 130.1 119.4 130.1 119.4 123.7 120.2 123.6 120.0 V - Bicol Region 93.8 92.3 92.5 92.3 107.5 106.1 107.4 106.0 135.9 129.0 135.9 129.0 129.4 123.7 128.9 123.7 VI - Western Visayas 90.4 90.2 90.4 90.2 114.6 112.3 114.5 112.3 132.2 126.0 132.2 126.0 127.0 123.4 127.0 123.4 VII - Central Visayas 90.3 90.3 90.3 90.3 104.5 103.7 104.5 103.6 147.8 139.2 147.8 139.2 114.7 109.9 114.6 109.8 VIII - Eastern Visayas 95.5 95.7 95.5 95.7 105.1 104.1 104.8 104.0 151.0 144.9 151.0 144.9 121.6 119.2 121.4 119.0 IX - Zamboanga Peninsula 90.9 90.8 90.9 90.8 110.6 109.5 110.6 109.5 137.2 133.8 137.2 133.8 122.0 120.1 122.0 120.1 X - Northern Mindanao 98.9 98.6 98.9 98.5 106.6 104.8 106.5 104.6 130.1 122.0 130.1 122.0 128.7 122.8 128.3 122.7 XI - Davao Region 92.1 92.1 92.1 92.1 113.6 111.7 113.6 111.6 149.7 140.3 149.7 140.3 121.5 116.9 121.2 116.8 XII - SOCCSKSARGEN 90.1 92.4 90.1 92.4 112.8 112.1 112.8 112.1 149.3 143.4 149.3 143.4 127.3 124.3 127.1 124.2 XIII - Caraga 89.1 88.2 89.3 88.2 109.3 105.6 109.3 105.4 146.2 144.5 146.2 144.5 131.8 126.2 131.8 126.1 ARMM - Autonomous Region in Muslim Mindanao 96.4 96.3 96.4 96.3 126.9 124.9 126.7 124.9 144.2 134.9 144.2 134.9 135.4 131.4 135.0 131.4
- 3 -
Communication Education Restaurant and Miscellaneous Goods and Services
Republic of the Philippines
NATIONAL STATISTICS OFFICE
Manila
(2006=100)
AREA 2 0 1 3 2 0 1 2
Jan Dec Nov Oct Sep Aug Jul Jun May Apr Mar Feb Jan
PHILIPPINES 0.5 -0.1 0.1 -0.1 -0.1 0.8 0.3 0.5 0.1 0.8 0.2 0.0 0.4
NATIONAL CAPITAL REGION (NCR) 0.3 -0.1 0.1 -0.1 -0.7 1.2 0.6 0.6 0.0 0.3 0.2 0.1 0.7
AREAS OUTSIDE NCR 0.6 -0.1 0.1 -0.1 0.2 0.6 0.2 0.5 0.1 1.0 0.2 0.0 0.2
Table 4 Year-on-Year Changes of the Consumer Price Index in Percent, by Area, January 2012 - January 2013
(2006=100)
A R E A 2 0 1 3 2 0 1 2
Jan Ave Dec Nov Oct Sep Aug Jul Jun May Apr Mar Feb Jan
PHILIPPINES 3.0 3.2 2.9 2.8 3.1 3.6 3.8 3.2 2.8 2.9 3.0 2.6 2.7 4.0
NATIONAL CAPITAL REGION (NCR) 2.4 2.9 2.8 2.6 2.9 3.5 4.4 3.1 2.3 2.3 2.5 2.7 2.3 3.5
AREAS OUTSIDE NCR 3.3 3.2 2.9 2.9 3.3 3.7 3.6 3.2 3.0 3.1 3.2 2.6 2.9 4.0
Table 3 Month-on-Month Changes of the Consumer Price Index in Percent, by Area, January 2012 - January 2013
Republic of the PhilippinesNATIONAL STATISTICS OFFICE
Manila
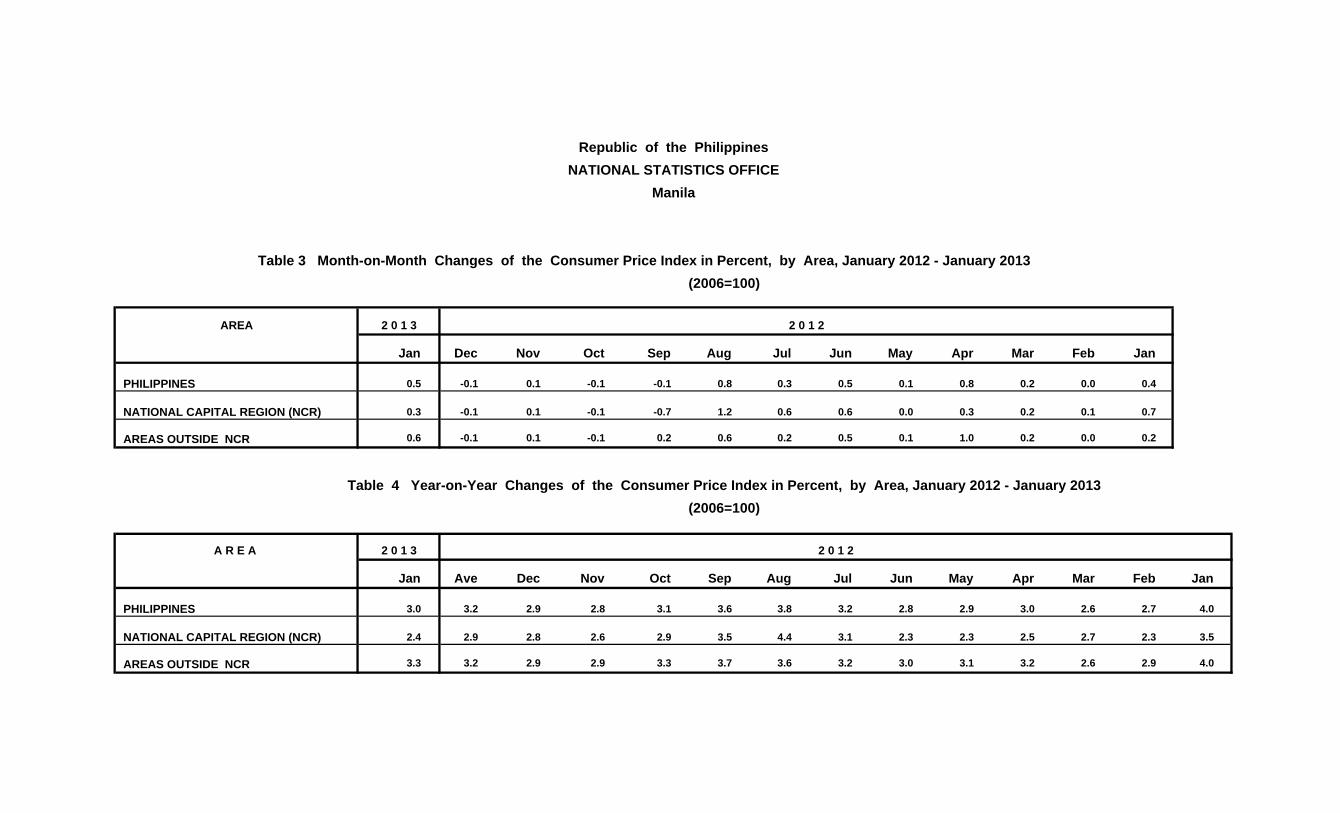
Table 5 Month-on-Month Changes of the Consumer Price Index in Percent by Area, by Commodity Group, January 2012 - January 2013(2006 = 100)
2 0 1 3 2 0 1 2Jan Dec Nov Oct Sep Aug Jul Jun May Apr Mar Feb Jan
PHILIPPINES
ALL ITEMS 0.5 -0.1 0.1 -0.1 -0.1 0.8 0.3 0.5 0.1 0.8 0.2 0.0 0.4
Food and Non-Alcoholic Beverages 0.2 0.0 -0.1 -0.3 0.4 1.0 0.4 0.4 0.0 0.7 0.0 -0.5 0.2
Alcoholic Beverages and Tobacco 11.9 0.3 0.4 0.3 0.1 0.2 0.4 0.4 0.5 1.1 0.5 0.6 0.2
Clothing and Footwear 0.4 0.1 0.2 0.1 0.2 0.3 0.5 0.5 0.8 1.3 0.2 0.2 0.4
Housing, Water, Electricity, Gas, and Other Fuels 0.5 -0.2 0.2 -0.1 -1.1 0.8 0.6 0.6 -0.2 1.3 0.6 0.7 0.6
Furnishing, Household Equipment and Routine Maintenance of the House 0.3 0.2 0.1 0.2 0.2 0.5 0.6 0.6 0.4 1.2 0.4 0.1 0.2
Health 0.5 0.1 0.2 0.2 0.1 0.1 0.4 0.3 0.5 0.7 0.2 0.2 0.2
Transport 0.2 0.0 -0.2 -0.1 0.6 0.6 -0.5 -0.9 -0.4 1.0 0.5 0.5 0.2
Communication 0.1 0.0 0.0 0.0 0.0 0.0 0.1 0.0 0.1 0.2 0.1 -0.1 0.0
Recreation and Culture 0.2 0.1 0.1 0.0 0.0 0.1 0.4 0.3 0.3 0.6 0.1 0.0 0.7
Education 0.0 0.0 0.0 0.0 0.0 0.0 0.0 4.4 0.0 0.0 0.0 0.0 0.0
Restaurant and Miscellaneous Goods and Services 0.3 0.0 0.2 0.2 0.1 0.0 0.3 0.2 0.6 0.5 0.2 0.2 0.7
AREA/COMMODITY GROUP
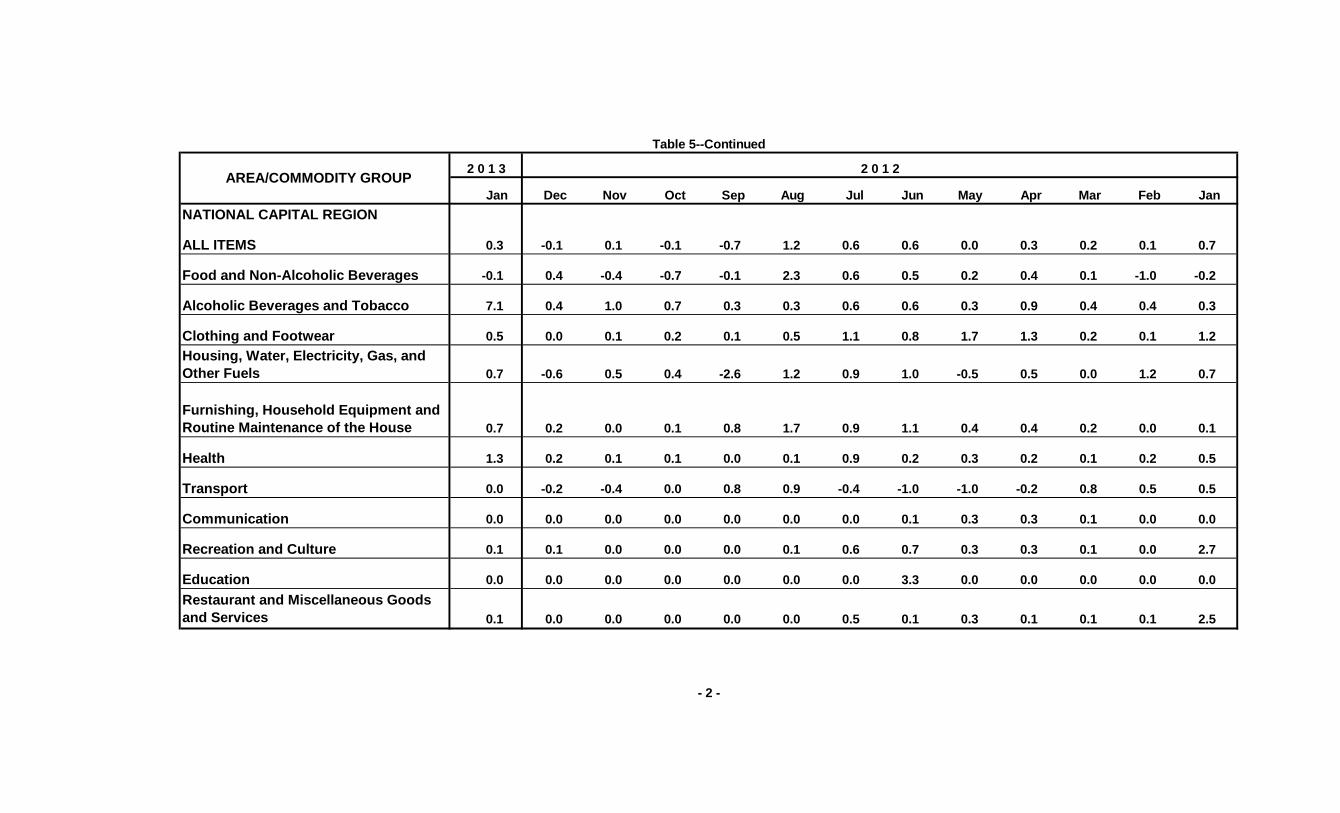
Table 5--Continued
2 0 1 3 2 0 1 2
Jan Dec Nov Oct Sep Aug Jul Jun May Apr Mar Feb Jan
NATIONAL CAPITAL REGION
ALL ITEMS 0.3 -0.1 0.1 -0.1 -0.7 1.2 0.6 0.6 0.0 0.3 0.2 0.1 0.7
Food and Non-Alcoholic Beverages -0.1 0.4 -0.4 -0.7 -0.1 2.3 0.6 0.5 0.2 0.4 0.1 -1.0 -0.2
Alcoholic Beverages and Tobacco 7.1 0.4 1.0 0.7 0.3 0.3 0.6 0.6 0.3 0.9 0.4 0.4 0.3
Clothing and Footwear 0.5 0.0 0.1 0.2 0.1 0.5 1.1 0.8 1.7 1.3 0.2 0.1 1.2
Housing, Water, Electricity, Gas, and Other Fuels 0.7 -0.6 0.5 0.4 -2.6 1.2 0.9 1.0 -0.5 0.5 0.0 1.2 0.7
Furnishing, Household Equipment and Routine Maintenance of the House 0.7 0.2 0.0 0.1 0.8 1.7 0.9 1.1 0.4 0.4 0.2 0.0 0.1
Health 1.3 0.2 0.1 0.1 0.0 0.1 0.9 0.2 0.3 0.2 0.1 0.2 0.5
Transport 0.0 -0.2 -0.4 0.0 0.8 0.9 -0.4 -1.0 -1.0 -0.2 0.8 0.5 0.5
Communication 0.0 0.0 0.0 0.0 0.0 0.0 0.0 0.1 0.3 0.3 0.1 0.0 0.0
Recreation and Culture 0.1 0.1 0.0 0.0 0.0 0.1 0.6 0.7 0.3 0.3 0.1 0.0 2.7
Education 0.0 0.0 0.0 0.0 0.0 0.0 0.0 3.3 0.0 0.0 0.0 0.0 0.0
Restaurant and Miscellaneous Goods and Services 0.1 0.0 0.0 0.0 0.0 0.0 0.5 0.1 0.3 0.1 0.1 0.1 2.5
- 2 -
AREA/COMMODITY GROUP
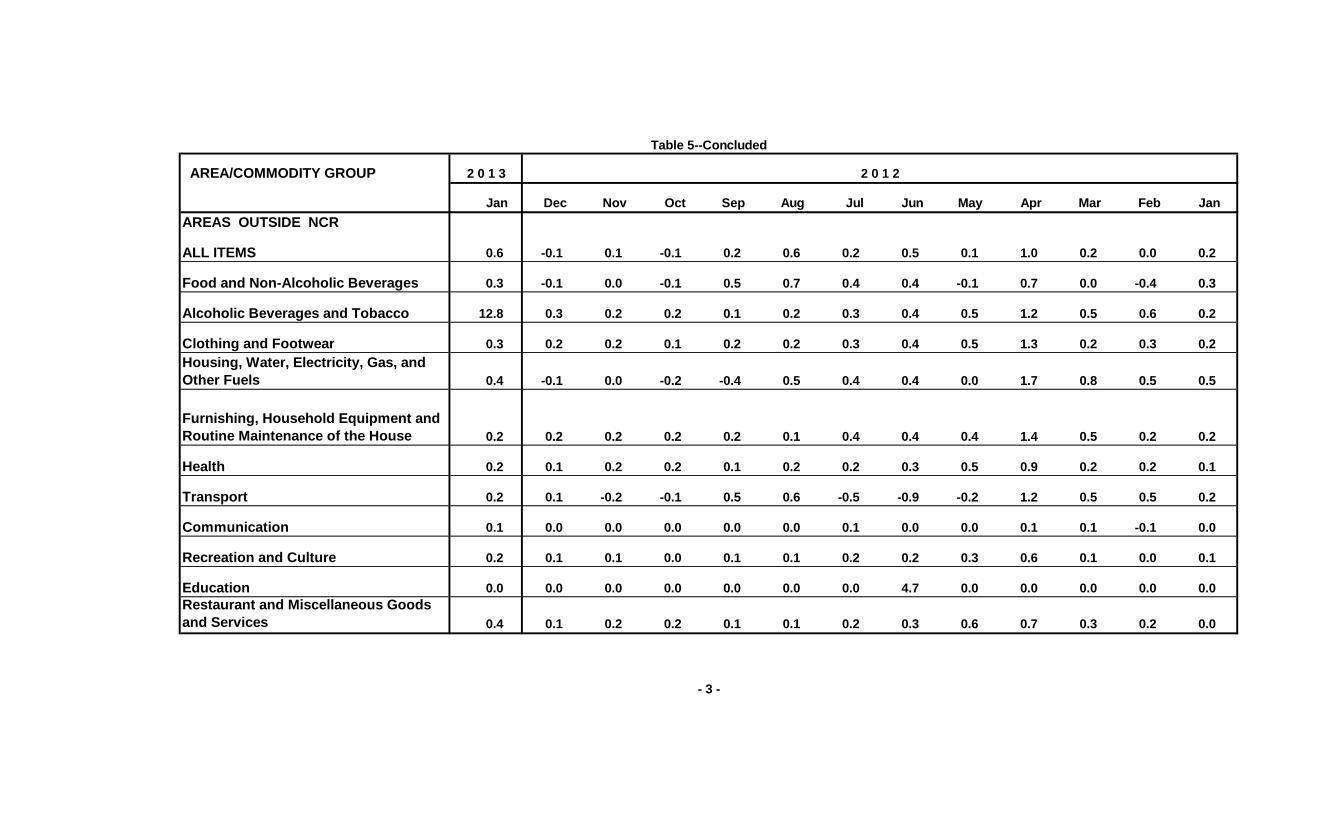
Table 5--Concluded
AREA/COMMODITY GROUP 2 0 1 3 2 0 1 2
Jan Dec Nov Oct Sep Aug Jul Jun May Apr Mar Feb Jan
AREAS OUTSIDE NCR
ALL ITEMS 0.6 -0.1 0.1 -0.1 0.2 0.6 0.2 0.5 0.1 1.0 0.2 0.0 0.2
Food and Non-Alcoholic Beverages 0.3 -0.1 0.0 -0.1 0.5 0.7 0.4 0.4 -0.1 0.7 0.0 -0.4 0.3
Alcoholic Beverages and Tobacco 12.8 0.3 0.2 0.2 0.1 0.2 0.3 0.4 0.5 1.2 0.5 0.6 0.2
Clothing and Footwear 0.3 0.2 0.2 0.1 0.2 0.2 0.3 0.4 0.5 1.3 0.2 0.3 0.2Housing, Water, Electricity, Gas, and Other Fuels 0.4 -0.1 0.0 -0.2 -0.4 0.5 0.4 0.4 0.0 1.7 0.8 0.5 0.5
Furnishing, Household Equipment and Routine Maintenance of the House 0.2 0.2 0.2 0.2 0.2 0.1 0.4 0.4 0.4 1.4 0.5 0.2 0.2
Health 0.2 0.1 0.2 0.2 0.1 0.2 0.2 0.3 0.5 0.9 0.2 0.2 0.1
Transport 0.2 0.1 -0.2 -0.1 0.5 0.6 -0.5 -0.9 -0.2 1.2 0.5 0.5 0.2
Communication 0.1 0.0 0.0 0.0 0.0 0.0 0.1 0.0 0.0 0.1 0.1 -0.1 0.0
Recreation and Culture 0.2 0.1 0.1 0.0 0.1 0.1 0.2 0.2 0.3 0.6 0.1 0.0 0.1
Education 0.0 0.0 0.0 0.0 0.0 0.0 0.0 4.7 0.0 0.0 0.0 0.0 0.0Restaurant and Miscellaneous Goods and Services 0.4 0.1 0.2 0.2 0.1 0.1 0.2 0.3 0.6 0.7 0.3 0.2 0.0
- 3 -

Republic of the PhilippinesNATIONAL STATISTICS OFFICE
Manila
Table 6 Year-on-Year Changes of the Consumer Price Index in Percent by Area, by Commodity Group, January 2012 - January 2013(2006 = 100)
2 0 1 3 2 0 1 2AREA/COMMODITY GROUP Jan Ave Dec Nov Oct Sep Aug Jul Jun May Apr Mar Feb Jan
PHILIPPINES
ALL ITEMS 3.0 3.2 2.9 2.8 3.1 3.6 3.8 3.2 2.8 2.9 3.0 2.6 2.7 4.0
Food and Non-Alcoholic Beverages 2.3 2.3 2.3 2.2 2.5 3.7 3.3 2.3 2.1 1.8 1.8 1.4 1.4 3.2
Alcoholic Beverages and Tobacco 17.3 5.0 5.1 5.0 4.8 4.8 4.8 4.9 4.8 5.2 5.0 4.3 4.7 5.6
Clothing and Footwear 4.9 4.6 4.9 5.0 5.0 5.0 5.2 5.0 5.2 5.1 4.6 3.6 3.8 3.9
Housing, Water, Electricity, Gas, and Other Fuels 3.6 4.6 3.7 3.7 4.5 4.5 5.6 5.0 4.1 4.4 4.7 4.5 4.7 5.3
Furnishing, Household Equipment and Routine Maintenance of the House 4.9 3.7 4.8 4.8 4.8 4.6 4.4 4.1 3.7 3.3 3.2 2.3 2.1 2.4
Health 3.3 3.1 3.1 3.1 3.0 3.0 3.1 3.2 3.3 3.2 3.3 2.8 2.8 2.8
Transport 1.1 2.3 1.2 1.4 1.7 1.7 1.1 0.6 1.3 2.2 3.2 3.5 4.1 5.5
Communication 0.5 0.1 0.4 0.4 0.3 0.3 0.2 0.2 0.1 0.1 0.0 -0.3 -0.3 -0.4
Recreation and Culture 2.0 2.6 2.6 2.6 2.6 2.7 2.7 2.7 2.4 2.8 2.6 2.2 2.6 2.5
Education 4.4 4.6 4.4 4.4 4.5 4.5 4.5 4.5 4.8 4.7 4.8 4.7 4.7 5.0
Restaurant and Miscellaneous Goods and Services 2.8 3.2 3.2 3.2 3.2 3.2 3.3 3.5 3.4 3.4 3.3 2.9 3.0 3.5

Table 6--Continued
2 0 1 3 2 0 1 2
AREA/COMMODITY GROUP Jan Ave Dec Nov Oct Sep Aug Jul Jun May Apr Mar Feb Jan
NATIONAL CAPITAL REGION
ALL ITEMS 2.4 2.9 2.8 2.6 2.9 3.5 4.4 3.1 2.3 2.3 2.5 2.7 2.3 3.5
Food and Non-Alcoholic Beverages 2.1 1.8 2.1 1.6 1.7 4.3 4.9 1.9 1.1 1.2 1.1 1.1 0.1 1.8
Alcoholic Beverages and Tobacco 13.6 3.9 6.4 6.0 5.2 4.5 4.3 3.9 3.4 2.9 2.9 2.2 2.4 2.6
Clothing and Footwear 6.7 6.2 7.4 7.5 7.4 7.3 7.3 6.8 7.6 6.8 5.0 3.7 3.6 3.7
Housing, Water, Electricity, Gas, and Other Fuels 2.6 3.7 2.6 2.5 3.4 3.0 5.5 4.5 2.9 2.9 3.5 3.9 4.1 5.3
Furnishing, Household Equipment and Routine Maintenance of the House 6.7 3.2 6.0 6.0 6.0 5.9 5.2 3.4 2.5 1.4 1.0 0.6 0.4 0.4
Health 3.6 2.7 2.9 2.8 2.8 2.8 2.8 2.8 3.1 3.0 2.7 2.6 2.6 2.5
Transport -0.2 1.0 0.4 0.4 0.8 0.6 r -0.2 -1.1 -0.9 -0.1 1.2 2.9 3.4 4.8
Communication 0.9 0.3 0.9 0.8 0.8 0.8 0.8 0.5 0.5 0.4 0.0 -0.3 -0.5 -0.5
Recreation and Culture 2.3 3.9 4.9 4.8 4.8 4.8 4.9 4.7 4.0 3.3 2.9 2.6 2.5 2.5
Education 3.3 3.4 3.3 3.3 3.3 3.3 3.3 3.3 3.3 3.8 3.8 3.8 3.8 3.8
Restaurant and Miscellaneous Goods and Services 1.2 3.7 3.6 3.6 3.7 3.8 3.8 3.9 3.4 3.3 3.8 3.7 3.6 4.9
- 2 -
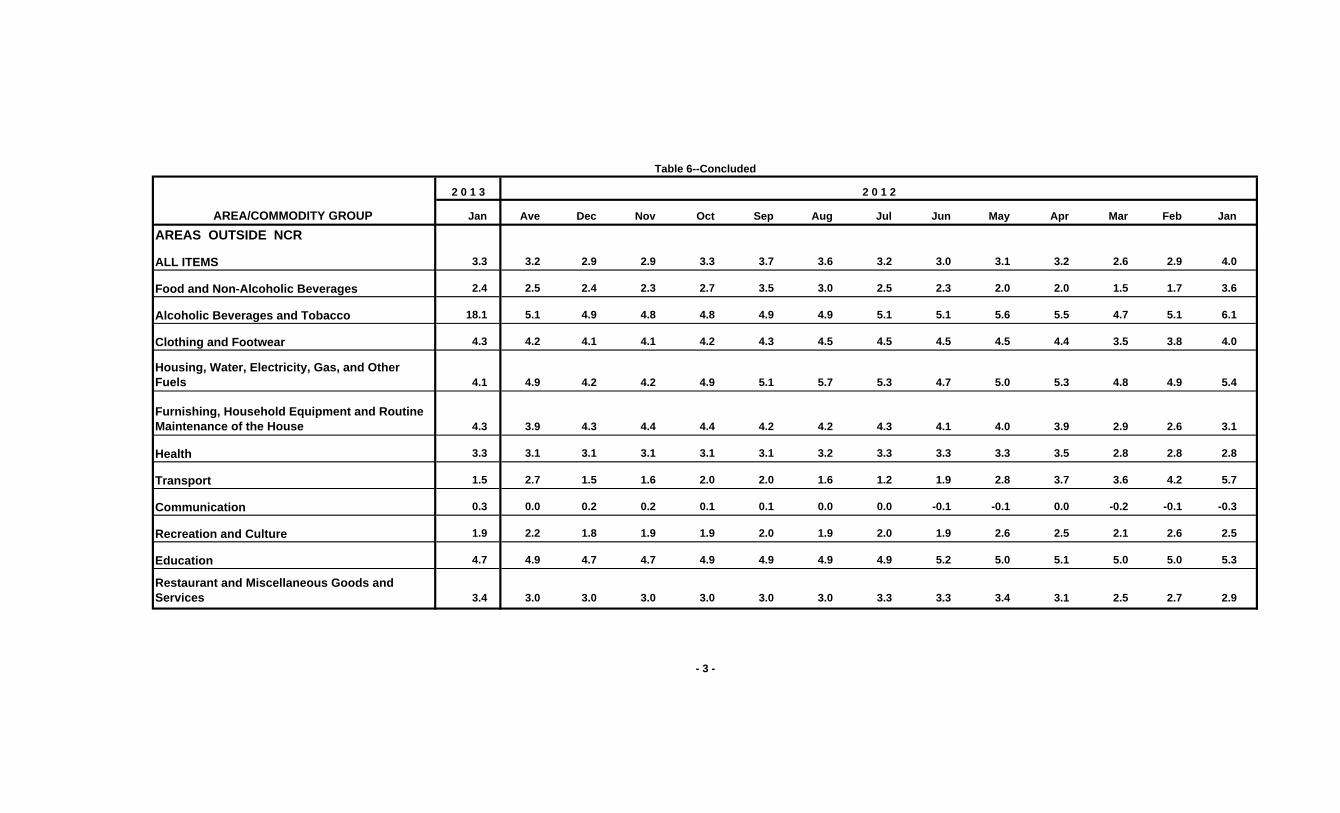
Table 6--Concluded
2 0 1 3 2 0 1 2
AREA/COMMODITY GROUP Jan Ave Dec Nov Oct Sep Aug Jul Jun May Apr Mar Feb Jan
AREAS OUTSIDE NCR
ALL ITEMS 3.3 3.2 2.9 2.9 3.3 3.7 3.6 3.2 3.0 3.1 3.2 2.6 2.9 4.0
Food and Non-Alcoholic Beverages 2.4 2.5 2.4 2.3 2.7 3.5 3.0 2.5 2.3 2.0 2.0 1.5 1.7 3.6
Alcoholic Beverages and Tobacco 18.1 5.1 4.9 4.8 4.8 4.9 4.9 5.1 5.1 5.6 5.5 4.7 5.1 6.1
Clothing and Footwear 4.3 4.2 4.1 4.1 4.2 4.3 4.5 4.5 4.5 4.5 4.4 3.5 3.8 4.0
Housing, Water, Electricity, Gas, and Other Fuels 4.1 4.9 4.2 4.2 4.9 5.1 5.7 5.3 4.7 5.0 5.3 4.8 4.9 5.4
Furnishing, Household Equipment and Routine Maintenance of the House 4.3 3.9 4.3 4.4 4.4 4.2 4.2 4.3 4.1 4.0 3.9 2.9 2.6 3.1
Health 3.3 3.1 3.1 3.1 3.1 3.1 3.2 3.3 3.3 3.3 3.5 2.8 2.8 2.8
Transport 1.5 2.7 1.5 1.6 2.0 2.0 1.6 1.2 1.9 2.8 3.7 3.6 4.2 5.7
Communication 0.3 0.0 0.2 0.2 0.1 0.1 0.0 0.0 -0.1 -0.1 0.0 -0.2 -0.1 -0.3
Recreation and Culture 1.9 2.2 1.8 1.9 1.9 2.0 1.9 2.0 1.9 2.6 2.5 2.1 2.6 2.5
Education 4.7 4.9 4.7 4.7 4.9 4.9 4.9 4.9 5.2 5.0 5.1 5.0 5.0 5.3
Restaurant and Miscellaneous Goods and Services 3.4 3.0 3.0 3.0 3.0 3.0 3.0 3.3 3.3 3.4 3.1 2.5 2.7 2.9
- 3 -

Republic of the PhilippinesNATIONAL STATISTICS OFFICE
Manila
Table 7 Month-on-Month Regional Inflation Rates by Commodity Group, January 2013 and December 2012(2006 = 100)
A R E A / R E G I O N
Current Previous Current Previous Current Previous Current Previous Current Previous Current Previous Current Previous
Philippines 0.5 -0.1 0.2 0.0 11.9 0.3 0.4 0.1 0.5 -0.2 0.3 0.2 0.5 0.1
NCR- National Capital Region 0.3 -0.1 -0.1 0.4 7.1 0.4 0.5 0.0 0.7 -0.6 0.7 0.2 1.3 0.2
Areas Outside NCR 0.6 -0.1 0.3 -0.1 12.8 0.3 0.3 0.2 0.4 -0.1 0.2 0.2 0.2 0.1
Regions:
CAR - Cordillera Administrative Region 0.2 -0.2 -0.4 -0.6 11.2 0.1 0.7 0.4 0.4 -0.1 0.1 0.2 0.0 0.2
I - Ilocos Region -0.1 -0.1 -0.4 -0.4 6.9 0.6 0.0 0.1 -0.3 0.4 0.0 0.0 0.1 0.1
II - Cagayan Valley 0.6 -0.1 -0.2 -0.1 20.9 0.7 0.2 0.0 0.2 0.0 0.0 0.1 0.2 0.0
III - Central Luzon 1.0 -0.1 0.4 -0.1 21.0 0.3 0.5 0.5 0.3 -0.3 0.1 0.2 0.4 0.2
IV-A - CALABARZON 0.6 -0.4 0.3 -0.6 10.5 0.3 0.2 0.1 1.1 -0.7 0.2 0.2 0.3 0.1
IV-B - MIMAROPA 0.2 -0.1 0.1 -0.4 7.5 0.3 0.2 0.1 -0.1 0.2 0.1 0.2 0.1 0.0
V - Bicol Region 0.9 -0.1 0.9 -0.3 11.2 0.1 1.8 0.0 0.5 0.2 1.3 0.0 0.7 0.1
VI - Western Visayas 0.7 0.1 0.5 -0.3 17.7 0.1 0.1 0.1 0.2 0.6 0.2 0.2 0.1 0.1
VII - Central Visayas 0.4 0.0 0.4 -0.1 8.5 0.9 0.0 0.0 0.0 0.2 0.0 0.1 0.2 0.0
VIII - Eastern Visayas 0.4 0.0 0.7 0.2 6.0 0.1 0.1 0.1 -0.2 -0.6 0.0 0.1 0.2 0.1
IX - Zamboanga Peninsula 0.9 0.4 0.0 0.7 25.9 0.4 0.1 -0.1 1.8 0.2 0.0 0.0 0.1 0.1
X - Northern Mindanao 0.4 0.3 0.4 0.5 2.9 0.1 0.3 0.1 0.4 0.4 0.1 0.2 0.1 0.2
XI - Davao Region 0.3 0.4 0.3 0.8 1.8 0.4 0.4 0.2 0.3 -0.2 0.2 0.2 0.2 0.2
XII - SOCCSKSARGEN 0.7 -0.1 -0.1 -0.1 24.5 0.0 0.0 0.2 0.0 0.3 0.1 0.2 0.1 0.1
XIII - Caraga 0.5 0.0 0.7 0.0 9.4 0.1 0.3 0.0 -0.7 -0.1 0.1 0.0 0.1 0.0
ARMM - Autonomous Region in Muslim Mindanao 0.3 0.3 0.2 0.5 0.9 0.2 0.2 0.1 0.4 0.1 0.3 0.2 0.1 0.2
Health All ItemsFood and Non-
Alcoholic Beverages
Alcoholic Beverages and
Tobacco
Clothing and Footwear
Housing, Water, Electricity, Gas, and
Other Fuels
Furnishing, Household Equipment and Routine
Maintenance of the House

Table 7--Concluded
Communication Education
A R E A / R E G I O N
Current Previous Current Previous Current Previous Current Previous Current Previous
Philippines 0.2 0.0 0.1 0.0 0.2 0.1 0.0 0.0 0.3 0.0
NCR- National Capital Region 0.0 -0.2 0.0 0.0 0.1 0.1 0.0 0.0 0.1 0.0
Areas Outside NCR 0.2 0.1 0.1 0.0 0.2 0.1 0.0 0.0 0.4 0.1
Regions:
CAR - Cordillera Administrative Region 0.0 0.0 0.0 0.0 0.2 0.1 0.0 0.0 0.2 0.6
I - Ilocos Region 0.1 0.2 0.0 0.0 0.0 0.0 0.0 0.0 0.0 0.0
II - Cagayan Valley 0.0 0.4 0.0 0.0 0.0 0.0 0.0 0.0 0.2 0.2
III - Central Luzon 0.5 0.2 0.0 0.2 0.2 0.0 0.0 0.0 1.5 0.0
IV-A - CALABARZON 0.1 0.0 0.2 0.0 0.7 0.0 0.0 0.0 0.2 0.0
IV-B - MIMAROPA 0.2 -0.1 0.0 0.0 0.0 0.0 0.0 0.0 0.1 0.0
V - Bicol Region 0.4 0.0 1.4 0.0 0.1 0.0 0.0 0.0 0.4 0.0
VI - Western Visayas 0.2 0.2 0.0 0.0 0.1 0.2 0.0 0.0 0.0 0.1
VII - Central Visayas 0.1 -0.2 0.0 0.1 0.0 0.0 0.0 0.0 0.1 0.1
VIII - Eastern Visayas 0.0 -0.2 0.0 0.0 0.3 0.0 0.0 0.0 0.2 0.0
IX - Zamboanga Peninsula 0.0 0.0 0.0 0.0 0.0 0.0 0.0 0.0 0.0 0.0
X - Northern Mindanao 0.3 -0.1 0.0 0.0 0.1 0.0 0.0 0.0 0.3 0.6
XI - Davao Region 0.0 0.2 0.0 0.0 0.0 0.6 0.0 0.0 0.2 0.5
XII - SOCCSKSARGEN 0.1 0.0 0.0 -0.1 0.0 0.0 0.0 0.0 0.2 -0.1
XIII - Caraga 0.0 -0.1 -0.2 0.0 0.0 0.0 0.0 0.0 0.0 0.1
ARMM - Autonomous Region in Muslim Mindanao 0.1 0.4 0.0 0.0 0.2 0.2 0.0 0.0 0.3 0.4
- 2 -
TransportRecreation and
Culture
Restaurant and Miscellaneous
Goods and Services

Republic of the Philippines
NATIONAL STATISTICS OFFICE
Manila
Table 8 Year-on-Year Regional Inflation Rates by Commodity Group, January 2013 and December 2012
(2006 = 100)
A R E A / R E G I O N
Current Previous Current Previous Current Previous Current Previous Current Previous Current Previous Current Previous
Philippines 3.0 2.9 2.3 2.3 17.3 5.1 4.9 4.9 3.6 3.7 4.9 4.8 3.3 3.1
NCR- National Capital Region 2.4 2.8 2.1 2.1 13.6 6.4 6.7 7.4 2.6 2.6 6.7 6.0 3.6 2.9
Areas Outside NCR 3.3 2.9 2.4 2.4 18.1 4.9 4.3 4.1 4.1 4.2 4.3 4.3 3.3 3.1
Regions:
CAR - Cordillera Administrative Region 4.5 4.2 3.4 3.7 18.1 6.2 5.9 5.1 8.3 8.1 3.6 3.6 1.9 1.9
I - Ilocos Region 1.1 0.5 0.9 0.0 10.8 3.8 0.8 0.8 0.4 0.5 0.5 0.5 0.8 0.8
II - Cagayan Valley 2.8 2.2 0.3 0.3 26.3 5.4 6.8 7.2 4.2 4.1 4.2 4.6 6.1 6.1
III - Central Luzon 3.3 2.6 1.7 1.2 25.4 3.8 6.9 6.6 2.1 2.4 3.6 3.6 4.6 4.2
IV-A - CALABARZON 2.1 1.8 1.1 1.4 15.1 4.3 3.0 3.0 2.7 2.0 4.9 4.9 2.4 2.3
IV-B - MIMAROPA 3.4 3.5 3.6 4.1 15.1 6.7 3.0 3.3 2.7 3.0 3.4 3.5 3.2 3.1
V - Bicol Region 2.9 2.1 3.1 2.2 13.7 2.1 4.2 2.4 0.7 0.7 3.2 1.9 3.6 3.0
VI - Western Visayas 4.7 4.1 4.0 3.9 22.1 3.8 4.5 4.5 6.2 6.3 7.1 7.2 1.7 1.7
VII - Central Visayas 6.9 6.7 7.0 6.8 19.4 10.0 4.8 5.1 11.3 11.3 5.4 6.2 5.7 5.6
VIII - Eastern Visayas 3.7 3.4 2.9 2.4 9.8 4.0 2.7 2.7 7.4 8.1 3.8 3.9 2.5 2.4
IX - Zamboanga Peninsula 3.6 2.9 2.8 3.0 36.0 8.3 2.2 2.2 5.7 4.2 3.4 3.5 2.2 2.1
X - Northern Mindanao 3.4 3.8 1.1 1.4 9.2 7.1 5.6 5.3 5.8 7.6 8.2 9.3 4.3 4.4
XI - Davao Region 2.7 3.0 2.3 3.2 6.2 4.9 3.5 3.2 3.2 3.1 1.8 1.8 2.2 2.0
XII - SOCCSKSARGEN 3.0 2.6 1.5 2.1 28.6 3.6 2.8 2.9 4.6 5.2 2.4 2.4 4.0 4.2
XIII - Caraga 4.3 4.5 2.4 2.6 15.6 6.6 6.7 6.8 9.3 10.7 4.9 4.7 5.4 5.4
ARMM - Autonomous Region in Muslim Mindanao 2.7 2.3 2.6 2.4 4.1 3.2 2.5 2.4 2.6 2.2 1.9 1.5 2.9 2.8
Housing, Water, Electricity, Gas, and
Other Fuels
Furnishing, Household Equipment and Routine
Maintenance of the HouseHealth All Items
Food and Non-Alcoholic Beverages
Alcoholic Beverages and
Tobacco
Clothing and Footwear

Table 8--Concluded
A R E A / R E G I O N
Current Previous Current Previous Current Previous Current Previous Current Previous
Philippines 1.1 1.2 0.5 0.4 2.0 2.6 4.4 4.4 2.8 3.2
NCR- National Capital Region -0.2 0.4 0.9 0.9 2.3 4.9 3.3 3.3 1.2 3.6
Areas Outside NCR 1.5 1.5 0.3 0.2 1.9 1.8 4.7 4.7 3.4 3.0
Regions:
CAR - Cordillera Administrative Region 0.9 1.2 -0.7 -0.7 2.3 2.1 2.6 2.6 3.2 3.0
I - Ilocos Region 1.9 2.1 0.0 0.0 0.0 0.0 1.6 1.6 0.6 0.6
II - Cagayan Valley 1.4 1.6 -0.3 -0.3 4.2 4.3 4.7 4.7 5.1 5.2
III - Central Luzon 2.8 2.5 2.0 1.7 4.4 4.5 4.9 4.9 5.7 4.9
IV-A - CALABARZON 0.7 0.8 -0.1 -0.3 1.6 1.0 4.4 4.4 2.1 1.4
IV-B - MIMAROPA 0.4 0.7 -0.8 -0.6 0.6 0.6 9.0 9.0 2.9 3.0
V - Bicol Region 0.4 0.1 1.6 0.2 1.3 1.3 5.3 5.3 4.6 4.2
VI - Western Visayas 1.7 1.6 0.2 0.2 2.0 2.0 4.9 4.9 2.9 2.9
VII - Central Visayas 0.1 0.1 0.0 0.0 0.8 0.9 6.2 6.2 4.4 4.4
VIII - Eastern Visayas 1.9 2.0 -0.2 -0.2 1.0 0.8 4.2 4.2 2.0 2.0
IX - Zamboanga Peninsula 0.3 0.6 0.1 0.1 1.0 1.0 2.5 2.5 1.6 1.6
X - Northern Mindanao 5.6 5.3 0.3 0.4 1.7 1.8 6.6 6.6 4.8 4.6
XI - Davao Region 0.4 0.5 0.0 0.0 1.7 1.8 6.7 6.7 3.9 3.8
XII - SOCCSKSARGEN 0.6 0.7 -2.5 -2.5 0.6 0.6 4.1 4.1 2.4 2.3
XIII - Caraga 1.9 2.2 1.0 1.2 3.5 3.7 1.2 1.2 4.4 4.5
ARMM - Autonomous Region in Muslim Mindanao 1.8 1.7 0.1 0.1 1.6 1.4 6.9 6.9 3.0 2.7
- 2 -
Transport CommunicationRecreation and
CultureEducation
Restaurant and Miscellaneous
Goods and Services
Republic of the PhilippinesNATIONAL STATISTICS OFFICE
Manila
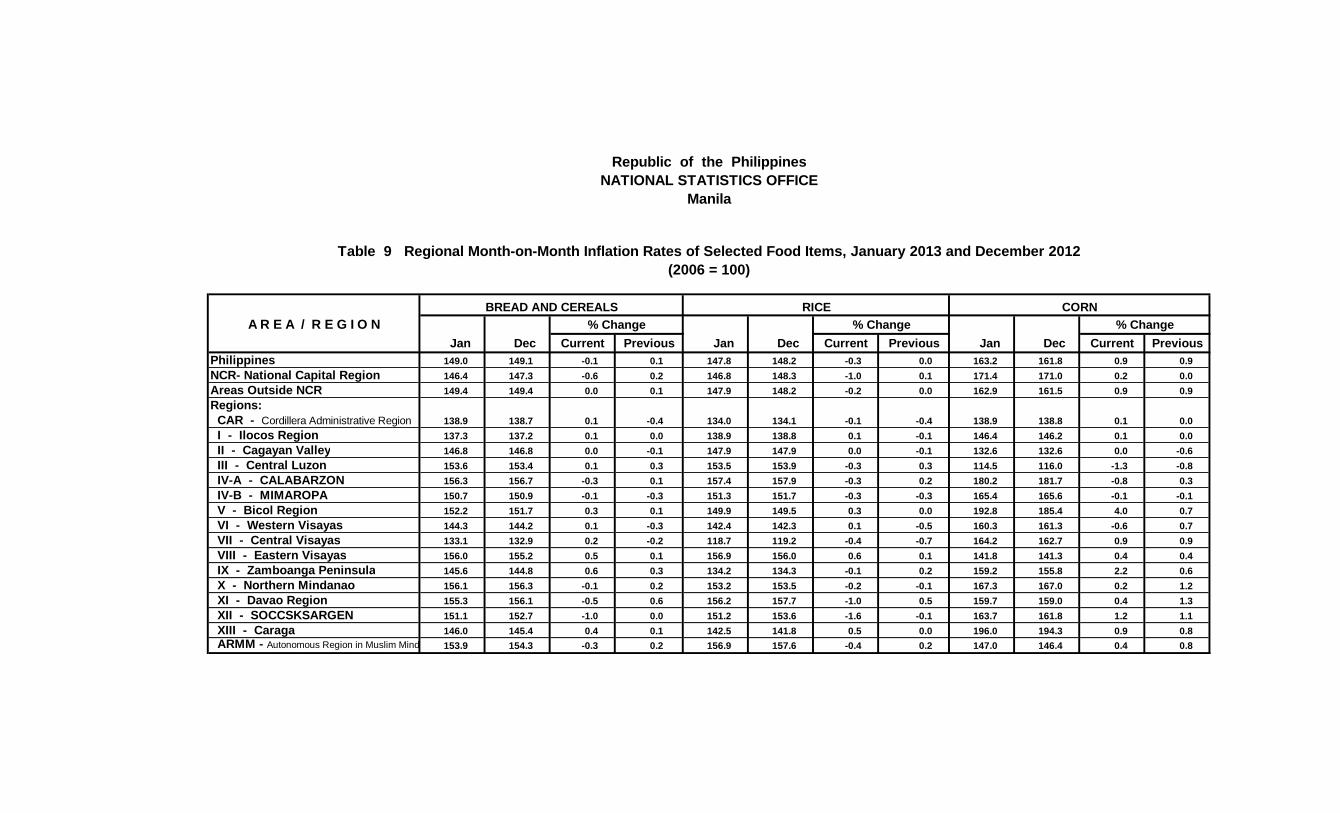
Table 9 Regional Month-on-Month Inflation Rates of Selected Food Items, January 2013 and December 2012(2006 = 100)
BREAD AND CEREALS RICE CORNA R E A / R E G I O N % Change % Change % Change
Jan Dec Current Previous Jan Dec Current Previous Jan Dec Current PreviousPhilippines 149.0 149.1 -0.1 0.1 147.8 148.2 -0.3 0.0 163.2 161.8 0.9 0.9
NCR- National Capital Region 146.4 147.3 -0.6 0.2 146.8 148.3 -1.0 0.1 171.4 171.0 0.2 0.0
Areas Outside NCR 149.4 149.4 0.0 0.1 147.9 148.2 -0.2 0.0 162.9 161.5 0.9 0.9
Regions: CAR - Cordillera Administrative Region 138.9 138.7 0.1 -0.4 134.0 134.1 -0.1 -0.4 138.9 138.8 0.1 0.0
I - Ilocos Region 137.3 137.2 0.1 0.0 138.9 138.8 0.1 -0.1 146.4 146.2 0.1 0.0
II - Cagayan Valley 146.8 146.8 0.0 -0.1 147.9 147.9 0.0 -0.1 132.6 132.6 0.0 -0.6
III - Central Luzon 153.6 153.4 0.1 0.3 153.5 153.9 -0.3 0.3 114.5 116.0 -1.3 -0.8
IV-A - CALABARZON 156.3 156.7 -0.3 0.1 157.4 157.9 -0.3 0.2 180.2 181.7 -0.8 0.3
IV-B - MIMAROPA 150.7 150.9 -0.1 -0.3 151.3 151.7 -0.3 -0.3 165.4 165.6 -0.1 -0.1
V - Bicol Region 152.2 151.7 0.3 0.1 149.9 149.5 0.3 0.0 192.8 185.4 4.0 0.7
VI - Western Visayas 144.3 144.2 0.1 -0.3 142.4 142.3 0.1 -0.5 160.3 161.3 -0.6 0.7
VII - Central Visayas 133.1 132.9 0.2 -0.2 118.7 119.2 -0.4 -0.7 164.2 162.7 0.9 0.9
VIII - Eastern Visayas 156.0 155.2 0.5 0.1 156.9 156.0 0.6 0.1 141.8 141.3 0.4 0.4
IX - Zamboanga Peninsula 145.6 144.8 0.6 0.3 134.2 134.3 -0.1 0.2 159.2 155.8 2.2 0.6
X - Northern Mindanao 156.1 156.3 -0.1 0.2 153.2 153.5 -0.2 -0.1 167.3 167.0 0.2 1.2
XI - Davao Region 155.3 156.1 -0.5 0.6 156.2 157.7 -1.0 0.5 159.7 159.0 0.4 1.3
XII - SOCCSKSARGEN 151.1 152.7 -1.0 0.0 151.2 153.6 -1.6 -0.1 163.7 161.8 1.2 1.1
XIII - Caraga 146.0 145.4 0.4 0.1 142.5 141.8 0.5 0.0 196.0 194.3 0.9 0.8 ARMM - Autonomous Region in Muslim Minda 153.9 154.3 -0.3 0.2 156.9 157.6 -0.4 0.2 147.0 146.4 0.4 0.8

Table 9--Continued
MEAT FISH MILK, CHEESE AND EGGA R E A / R E G I O N % Change % Change % Change
Jan Dec Current Previous Jan Dec Current Previous Jan Dec Current PreviousPhilippines 128.8 128.5 0.2 0.2 149.6 147.7 1.3 1.0 133.1 132.9 0.2 0.1
NCR- National Capital Region 128.3 128.3 0.0 0.2 132.9 133.1 -0.2 2.3 130.1 129.8 0.2 0.1
Areas Outside NCR 129.0 128.6 0.3 0.3 152.7 150.4 1.5 0.7 133.9 133.7 0.1 0.1
Regions: CAR - Cordillera Administrative Region 126.8 126.5 0.2 0.2 154.5 154.1 0.3 0.1 129.2 129.1 0.1 0.2
I - Ilocos Region 124.5 124.3 0.2 -0.1 142.4 141.8 0.4 0.3 129.8 129.8 0.0 0.0
II - Cagayan Valley 130.7 130.4 0.2 0.4 144.4 144.2 0.1 0.0 131.3 131.2 0.1 0.2
III - Central Luzon 128.7 128.0 0.5 0.9 138.6 136.0 1.9 2.3 133.6 133.5 0.1 0.0
IV-A - CALABARZON 126.0 125.7 0.2 -0.2 148.4 144.4 2.8 0.6 133.2 133.1 0.1 0.1
IV-B - MIMAROPA 134.8 134.6 0.1 0.1 152.2 150.0 1.5 -0.1 139.3 139.0 0.2 0.1
V - Bicol Region 129.5 128.6 0.7 0.7 153.8 148.6 3.5 -1.1 132.6 132.3 0.2 0.2
VI - Western Visayas 126.4 125.2 1.0 0.3 160.2 157.0 2.0 -0.6 133.5 133.1 0.3 0.0
VII - Central Visayas 129.7 129.8 -0.1 -0.2 153.5 152.3 0.8 0.5 134.9 134.5 0.3 0.1
VIII - Eastern Visayas 130.3 129.2 0.9 0.6 154.5 152.8 1.1 0.7 131.9 131.6 0.2 0.3
IX - Zamboanga Peninsula 131.9 131.7 0.2 0.0 159.5 162.1 -1.6 2.9 144.9 144.7 0.1 -0.1
X - Northern Mindanao 132.8 132.2 0.5 0.2 163.4 162.3 0.7 2.3 136.8 136.2 0.4 -0.1
XI - Davao Region 136.1 135.6 0.4 0.9 164.3 161.5 1.7 1.6 133.7 133.2 0.4 0.5
XII - SOCCSKSARGEN 135.4 135.6 -0.1 0.3 155.0 151.7 2.2 -0.6 129.5 129.2 0.2 0.1
XIII - Caraga 134.8 134.7 0.1 -0.2 168.3 165.8 1.5 -0.1 139.0 138.9 0.1 0.2
ARMM - Autonomous Region in Muslim Minda 146.4 144.9 1.0 0.6 172.1 170.3 1.1 1.2 149.6 149.1 0.3 0.3
- 2 -

Table 9--Continued
OILS AND FATS FRUITSA R E A / R E G I O N % Change % Change % Change
Jan Dec Current Previous Jan Dec Current Previous Jan Dec Current PreviousPhilippines 172.2 173.5 -0.7 -1.1 148.6 148.1 0.3 0.7 142.6 143.0 -0.3 -2.8
NCR- National Capital Region 207.0 210.0 -1.4 -0.1 141.2 141.4 -0.1 1.1 128.3 127.2 0.9 -1.6
Areas Outside NCR 164.2 165.1 -0.5 -1.3 150.7 149.9 0.5 0.6 145.7 146.5 -0.5 -3.0
Regions: CAR - Cordillera Administrative Region 178.8 178.7 0.1 -0.1 161.4 163.8 -1.5 1.1 156.7 162.3 -3.5 -4.3
I - Ilocos Region 158.6 158.7 -0.1 0.3 137.2 140.4 -2.3 0.0 136.7 141.9 -3.7 -3.3
II - Cagayan Valley 137.2 137.9 -0.5 -1.9 161.8 160.8 0.6 -0.3 165.4 168.8 -2.0 -0.8
III - Central Luzon 159.2 159.9 -0.4 -4.6 140.5 139.9 0.4 2.9 127.1 127.4 -0.2 -7.5
IV-A - CALABARZON 174.6 175.8 -0.7 -0.9 155.8 155.3 0.3 -0.4 135.7 137.8 -1.5 -7.9
IV-B - MIMAROPA 177.0 177.9 -0.5 -1.8 147.3 145.0 1.6 -0.6 148.8 150.2 -0.9 -2.0
V - Bicol Region 152.5 152.8 -0.2 -0.4 134.5 132.7 1.4 0.8 149.2 151.3 -1.4 -2.7
VI - Western Visayas 157.0 159.2 -1.4 -0.6 156.1 155.0 0.7 0.2 158.9 159.4 -0.3 -0.1
VII - Central Visayas 160.7 162.9 -1.4 -0.4 135.8 136.2 -0.3 -0.1 152.6 149.2 2.3 -1.2
VIII - Eastern Visayas 190.7 189.5 0.6 -0.5 149.4 145.2 2.9 -0.4 145.3 145.3 0.0 0.2
IX - Zamboanga Peninsula 174.9 177.5 -1.5 0.0 189.0 181.5 4.1 1.9 156.9 157.6 -0.4 -0.7
X - Northern Mindanao 146.3 146.3 0.0 0.1 154.3 154.0 0.2 1.9 155.8 151.6 2.8 -0.5
XI - Davao Region 184.4 184.6 -0.1 0.4 167.2 166.6 0.4 0.8 156.9 155.8 0.7 1.0
XII - SOCCSKSARGEN 140.0 140.5 -0.4 -2.9 141.1 140.7 0.3 -0.6 134.7 134.0 0.5 0.1
XIII - Caraga 173.9 174.3 -0.2 0.2 144.4 141.7 1.9 0.2 167.1 163.3 2.3 0.5 ARMM - Autonomous Region in Muslim Minda 164.6 165.0 -0.2 -0.3 184.9 183.7 0.7 0.6 154.9 154.1 0.5 0.7
- 3 -

Table 9--Concluded
SUGAR, JAM, HONEY, CHOCOLATE AND CONFECTIONERY FOOD PRODUCTS, N.E.C.
A R E A / R E G I O N % Change % Change
Jan Dec Current Previous Jan Dec Current PreviousPhilippines 126.1 128.1 -1.6 -1.9 143.2 141.9 0.9 0.6
NCR- National Capital Region 118.7 119.3 -0.5 -0.2 135.1 133.7 1.0 1.4
Areas Outside NCR 127.4 129.7 -1.8 -2.2 145.1 143.8 0.9 0.5
Regions: CAR - Cordillera Administrative Region 128.9 129.0 -0.1 -1.1 148.0 145.0 2.1 0.6
I - Ilocos Region 128.9 130.5 -1.2 -0.4 125.6 125.0 0.5 0.6
II - Cagayan Valley 126.1 128.2 -1.6 -1.8 140.9 140.7 0.1 0.0
III - Central Luzon 127.5 129.1 -1.2 -3.2 161.6 160.1 0.9 0.1
IV-A - CALABARZON 127.2 130.3 -2.4 -2.0 141.6 139.0 1.9 1.6
IV-B - MIMAROPA 119.5 123.4 -3.2 -2.1 125.6 125.4 0.2 -0.2
V - Bicol Region 123.1 124.0 -0.7 -1.4 140.9 139.3 1.1 0.4
VI - Western Visayas 123.3 127.0 -2.9 -4.2 139.7 138.4 0.9 0.1
VII - Central Visayas 129.4 131.7 -1.7 -3.7 145.7 144.7 0.7 0.6
VIII - Eastern Visayas 138.3 139.0 -0.5 -1.6 128.2 128.0 0.2 0.1
IX - Zamboanga Peninsula 118.4 125.3 -5.5 -0.7 152.7 150.6 1.4 -0.3
X - Northern Mindanao 133.0 134.2 -0.9 -1.3 170.9 170.6 0.2 -0.2
XI - Davao Region 123.7 123.9 -0.2 -0.9 136.1 135.8 0.2 0.4
XII - SOCCSKSARGEN 113.8 117.4 -3.1 -3.5 135.3 134.5 0.6 0.3
XIII - Caraga 121.0 123.7 -2.2 -3.1 160.5 158.4 1.3 0.1 ARMM - Autonomous Region in Muslim Minda 155.7 156.4 -0.4 -0.8 153.9 153.7 0.1 0.2
- 4 -

Republic of the PhilippinesNATIONAL STATISTICS OFFICE
Manila
Table 10 Regional Year-on-Year Inflation Rates of Selected Food Items, January 2013 and 2012, December 2012 and 2011(2006 = 100)
BREAD AND CEREALSA R E A / R E G I O N Inflation Rates (%) Inflation Rates (%)
Current Previous Current PreviousPhilippines 149.0 149.1 145.2 145.2 2.6 2.7 147.8 148.2 145.4 145.5 1.7 1.9
NCR- National Capital Region 146.4 147.3 143.5 143.5 2.0 2.6 146.8 148.3 146.7 146.8 0.1 1.0
Areas Outside NCR 149.4 149.4 145.5 145.5 2.7 2.7 147.9 148.2 145.2 145.3 1.9 2.0
Regions: CAR - Cordillera Administrative Region 138.9 138.7 135.0 135.0 2.9 2.7 134.0 134.1 130.8 130.9 2.4 2.4
I - Ilocos Region 137.3 137.2 135.2 136.6 1.6 0.4 138.9 138.8 136.8 138.6 1.5 0.1
II - Cagayan Valley 146.8 146.8 144.4 145.4 1.7 1.0 147.9 147.9 146.4 147.7 1.0 0.1
III - Central Luzon 153.6 153.4 147.9 147.9 3.9 3.7 153.5 153.9 150.3 150.3 2.1 2.4
IV-A - CALABARZON 156.3 156.7 153.9 153.8 1.6 1.9 157.4 157.9 155.2 155.6 1.4 1.5
IV-B - MIMAROPA 150.7 150.9 145.7 145.6 3.4 3.6 151.3 151.7 146.1 146.0 3.6 3.9
V - Bicol Region 152.2 151.7 148.9 149.2 2.2 1.7 149.9 149.5 147.6 147.9 1.6 1.1
VI - Western Visayas 144.3 144.2 140.3 140.6 2.9 2.6 142.4 142.3 138.9 139.3 2.5 2.2
VII - Central Visayas 133.1 132.9 126.0 125.8 5.6 5.6 118.7 119.2 119.0 118.9 -0.3 0.3
VIII - Eastern Visayas 156.0 155.2 154.8 154.6 0.8 0.4 156.9 156.0 156.5 156.3 0.3 -0.2
IX - Zamboanga Peninsula 145.6 144.8 140.3 139.3 3.8 3.9 134.2 134.3 130.0 128.8 3.2 4.3
X - Northern Mindanao 156.1 156.3 154.0 153.2 1.4 2.0 153.2 153.5 151.6 151.3 1.1 1.5
XI - Davao Region 155.3 156.1 151.1 150.8 2.8 3.5 156.2 157.7 151.0 150.5 3.4 4.8
XII - SOCCSKSARGEN 151.1 152.7 147.8 146.5 2.2 4.2 151.2 153.6 148.5 146.9 1.8 4.6
XIII - Caraga 146.0 145.4 140.9 140.6 3.6 3.4 142.5 141.8 136.4 135.9 4.5 4.3 ARMM - Autonomous Region in Muslim Mindanao 153.9 154.3 151.3 151.1 1.7 2.1 156.9 157.6 154.1 154.0 1.8 2.3
RICE
Jan-13 Dec-12 Jan-12 Dec-11 Jan-13 Dec-12 Jan-12 Dec-11
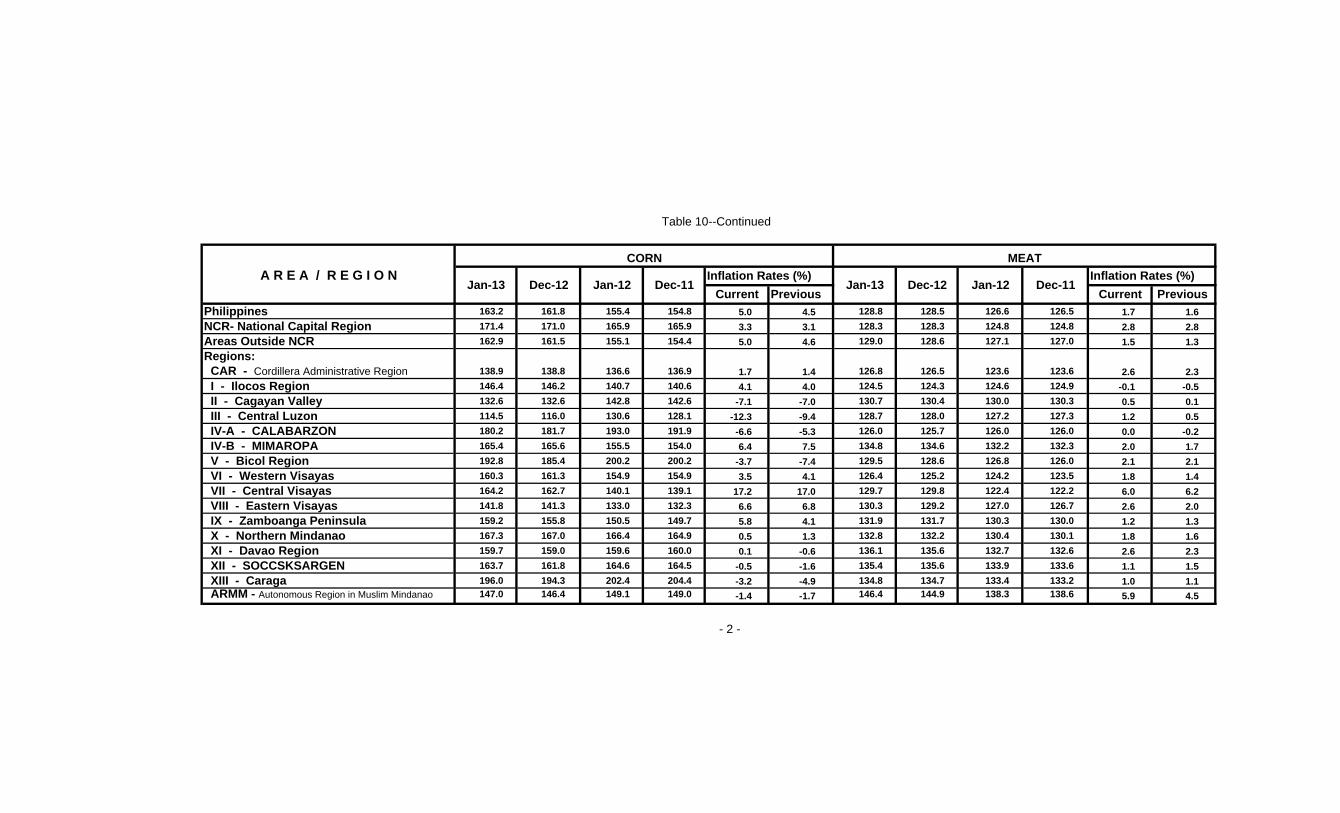
Table 10--Continued
A R E A / R E G I O N Inflation Rates (%) Inflation Rates (%)
Current Previous Current PreviousPhilippines 163.2 161.8 155.4 154.8 5.0 4.5 128.8 128.5 126.6 126.5 1.7 1.6
NCR- National Capital Region 171.4 171.0 165.9 165.9 3.3 3.1 128.3 128.3 124.8 124.8 2.8 2.8
Areas Outside NCR 162.9 161.5 155.1 154.4 5.0 4.6 129.0 128.6 127.1 127.0 1.5 1.3
Regions: CAR - Cordillera Administrative Region 138.9 138.8 136.6 136.9 1.7 1.4 126.8 126.5 123.6 123.6 2.6 2.3
I - Ilocos Region 146.4 146.2 140.7 140.6 4.1 4.0 124.5 124.3 124.6 124.9 -0.1 -0.5
II - Cagayan Valley 132.6 132.6 142.8 142.6 -7.1 -7.0 130.7 130.4 130.0 130.3 0.5 0.1
III - Central Luzon 114.5 116.0 130.6 128.1 -12.3 -9.4 128.7 128.0 127.2 127.3 1.2 0.5
IV-A - CALABARZON 180.2 181.7 193.0 191.9 -6.6 -5.3 126.0 125.7 126.0 126.0 0.0 -0.2
IV-B - MIMAROPA 165.4 165.6 155.5 154.0 6.4 7.5 134.8 134.6 132.2 132.3 2.0 1.7
V - Bicol Region 192.8 185.4 200.2 200.2 -3.7 -7.4 129.5 128.6 126.8 126.0 2.1 2.1
VI - Western Visayas 160.3 161.3 154.9 154.9 3.5 4.1 126.4 125.2 124.2 123.5 1.8 1.4
VII - Central Visayas 164.2 162.7 140.1 139.1 17.2 17.0 129.7 129.8 122.4 122.2 6.0 6.2
VIII - Eastern Visayas 141.8 141.3 133.0 132.3 6.6 6.8 130.3 129.2 127.0 126.7 2.6 2.0
IX - Zamboanga Peninsula 159.2 155.8 150.5 149.7 5.8 4.1 131.9 131.7 130.3 130.0 1.2 1.3
X - Northern Mindanao 167.3 167.0 166.4 164.9 0.5 1.3 132.8 132.2 130.4 130.1 1.8 1.6
XI - Davao Region 159.7 159.0 159.6 160.0 0.1 -0.6 136.1 135.6 132.7 132.6 2.6 2.3
XII - SOCCSKSARGEN 163.7 161.8 164.6 164.5 -0.5 -1.6 135.4 135.6 133.9 133.6 1.1 1.5
XIII - Caraga 196.0 194.3 202.4 204.4 -3.2 -4.9 134.8 134.7 133.4 133.2 1.0 1.1 ARMM - Autonomous Region in Muslim Mindanao 147.0 146.4 149.1 149.0 -1.4 -1.7 146.4 144.9 138.3 138.6 5.9 4.5
- 2 -
CORN MEAT
Jan-13 Dec-12 Jan-12 Dec-11 Jan-13 Dec-12 Jan-12 Dec-11

Table 10--Continued
FISH MILK, CHEESE AND EGGA R E A / R E G I O N Inflation Rates (%) Inflation Rates (%)
Current Previous Current PreviousPhilippines 149.6 147.7 142.2 139.5 5.2 5.9 133.1 132.9 129.1 128.8 3.1 3.2
NCR- National Capital Region 132.9 133.1 130.7 128.4 1.7 3.7 130.1 129.8 125.0 124.7 4.1 4.1
Areas Outside NCR 152.7 150.4 144.3 141.5 5.8 6.3 133.9 133.7 130.2 129.9 2.8 2.9
Regions: CAR - Cordillera Administrative Region 154.5 154.1 150.7 148.9 2.5 3.5 129.2 129.1 124.3 124.2 3.9 3.9
I - Ilocos Region 142.4 141.8 136.7 134.1 4.2 5.7 129.8 129.8 127.3 127.0 2.0 2.2
II - Cagayan Valley 144.4 144.2 142.1 136.8 1.6 5.4 131.3 131.2 127.1 126.7 3.3 3.6
III - Central Luzon 138.6 136.0 134.5 130.8 3.0 4.0 133.6 133.5 129.6 129.2 3.1 3.3
IV-A - CALABARZON 148.4 144.4 140.6 135.2 5.5 6.8 133.2 133.1 131.0 130.9 1.7 1.7
IV-B - MIMAROPA 152.2 150.0 141.7 137.3 7.4 9.2 139.3 139.0 135.7 135.3 2.7 2.7
V - Bicol Region 153.8 148.6 141.5 141.3 8.7 5.2 132.6 132.3 129.6 129.4 2.3 2.2
VI - Western Visayas 160.2 157.0 142.3 139.5 12.6 12.5 133.5 133.1 130.7 130.5 2.1 2.0
VII - Central Visayas 153.5 152.3 138.1 137.8 11.2 10.5 134.9 134.5 127.3 127.4 6.0 5.6
VIII - Eastern Visayas 154.5 152.8 144.6 143.6 6.8 6.4 131.9 131.6 128.5 128.1 2.6 2.7
IX - Zamboanga Peninsula 159.5 162.1 161.1 161.4 -1.0 0.4 144.9 144.7 140.1 140.0 3.4 3.4
X - Northern Mindanao 163.4 162.3 154.0 153.0 6.1 6.1 136.8 136.2 134.6 133.1 1.6 2.3
XI - Davao Region 164.3 161.5 160.0 153.7 2.7 5.1 133.7 133.2 127.6 126.9 4.8 5.0
XII - SOCCSKSARGEN 155.0 151.7 146.3 145.3 5.9 4.4 129.5 129.2 128.1 128.1 1.1 0.9
XIII - Caraga 168.3 165.8 166.0 161.6 1.4 2.6 139.0 138.9 132.8 132.7 4.7 4.7 ARMM - Autonomous Region in Muslim Mindanao 172.1 170.3 163.6 163.3 5.2 4.3 149.6 149.1 144.6 144.4 3.5 3.3
- 3 -
Jan-13 Dec-12 Jan-12 Dec-11 Jan-13 Dec-12 Jan-12 Dec-11
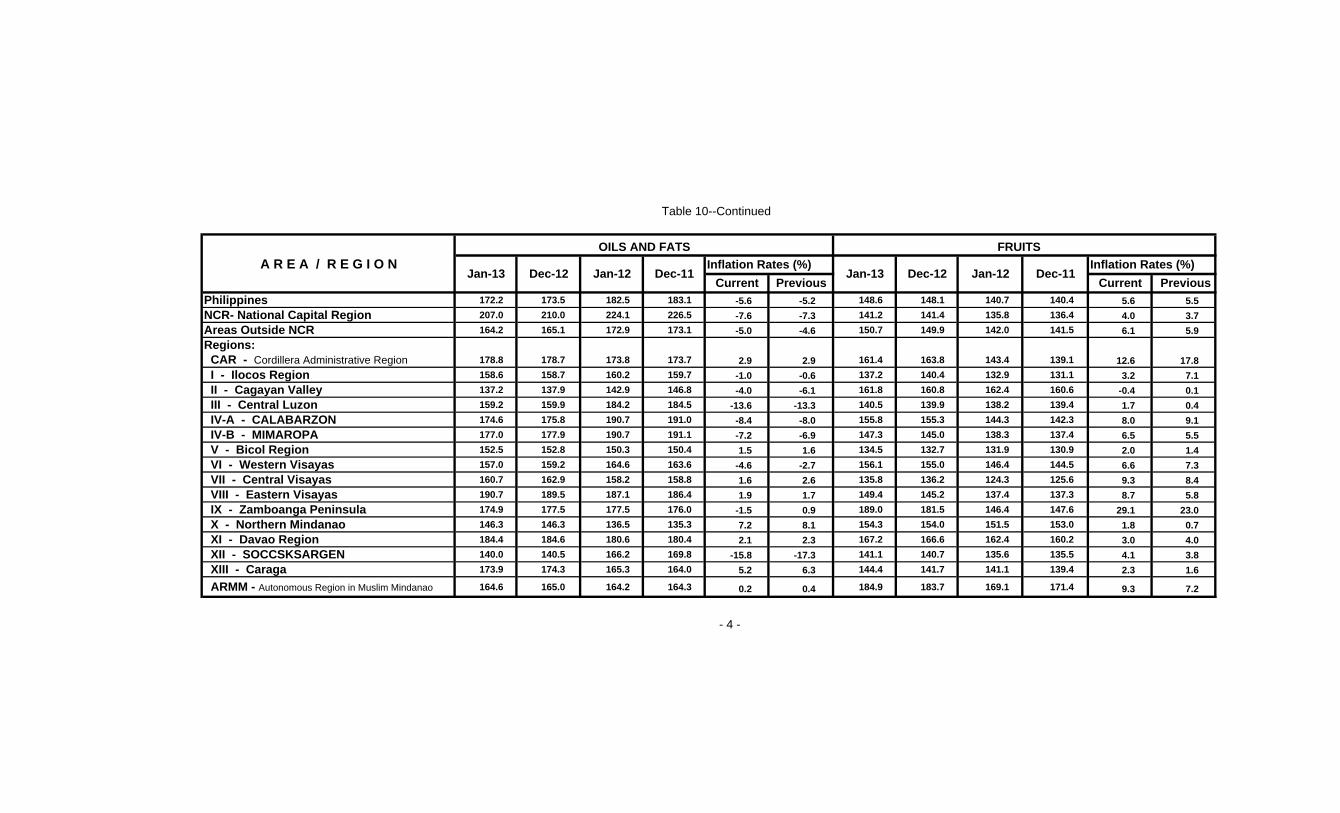
Table 10--Continued
OILS AND FATS FRUITSA R E A / R E G I O N Inflation Rates (%) Inflation Rates (%)
Current Previous Current PreviousPhilippines 172.2 173.5 182.5 183.1 -5.6 -5.2 148.6 148.1 140.7 140.4 5.6 5.5
NCR- National Capital Region 207.0 210.0 224.1 226.5 -7.6 -7.3 141.2 141.4 135.8 136.4 4.0 3.7
Areas Outside NCR 164.2 165.1 172.9 173.1 -5.0 -4.6 150.7 149.9 142.0 141.5 6.1 5.9
Regions: CAR - Cordillera Administrative Region 178.8 178.7 173.8 173.7 2.9 2.9 161.4 163.8 143.4 139.1 12.6 17.8
I - Ilocos Region 158.6 158.7 160.2 159.7 -1.0 -0.6 137.2 140.4 132.9 131.1 3.2 7.1
II - Cagayan Valley 137.2 137.9 142.9 146.8 -4.0 -6.1 161.8 160.8 162.4 160.6 -0.4 0.1
III - Central Luzon 159.2 159.9 184.2 184.5 -13.6 -13.3 140.5 139.9 138.2 139.4 1.7 0.4
IV-A - CALABARZON 174.6 175.8 190.7 191.0 -8.4 -8.0 155.8 155.3 144.3 142.3 8.0 9.1
IV-B - MIMAROPA 177.0 177.9 190.7 191.1 -7.2 -6.9 147.3 145.0 138.3 137.4 6.5 5.5
V - Bicol Region 152.5 152.8 150.3 150.4 1.5 1.6 134.5 132.7 131.9 130.9 2.0 1.4
VI - Western Visayas 157.0 159.2 164.6 163.6 -4.6 -2.7 156.1 155.0 146.4 144.5 6.6 7.3
VII - Central Visayas 160.7 162.9 158.2 158.8 1.6 2.6 135.8 136.2 124.3 125.6 9.3 8.4
VIII - Eastern Visayas 190.7 189.5 187.1 186.4 1.9 1.7 149.4 145.2 137.4 137.3 8.7 5.8
IX - Zamboanga Peninsula 174.9 177.5 177.5 176.0 -1.5 0.9 189.0 181.5 146.4 147.6 29.1 23.0
X - Northern Mindanao 146.3 146.3 136.5 135.3 7.2 8.1 154.3 154.0 151.5 153.0 1.8 0.7
XI - Davao Region 184.4 184.6 180.6 180.4 2.1 2.3 167.2 166.6 162.4 160.2 3.0 4.0
XII - SOCCSKSARGEN 140.0 140.5 166.2 169.8 -15.8 -17.3 141.1 140.7 135.6 135.5 4.1 3.8
XIII - Caraga 173.9 174.3 165.3 164.0 5.2 6.3 144.4 141.7 141.1 139.4 2.3 1.6
ARMM - Autonomous Region in Muslim Mindanao 164.6 165.0 164.2 164.3 0.2 0.4 184.9 183.7 169.1 171.4 9.3 7.2
- 4 -
Jan-13 Dec-12 Jan-12 Dec-11 Jan-13 Dec-12 Jan-12 Dec-11

Table 10--Continued
A R E A / R E G I O N Inflation Rates (%) Inflation Rates (%)
Current Previous Current PreviousPhilippines 142.6 143.0 147.9 150.9 -3.6 -5.2 126.1 128.1 123.0 123.9 2.5 3.4
NCR- National Capital Region 128.3 127.2 129.1 134.9 -0.6 -5.7 118.7 119.3 113.2 114.4 4.9 4.3
Areas Outside NCR 145.7 146.5 152.0 154.4 -4.1 -5.1 127.4 129.7 124.7 125.6 2.2 3.3
Regions: CAR - Cordillera Administrative Region 156.7 162.3 155.0 159.9 1.1 1.5 128.9 129.0 128.0 128.7 0.7 0.2
I - Ilocos Region 136.7 141.9 145.9 161.7 -6.3 -12.2 128.9 130.5 120.3 124.8 7.1 4.6
II - Cagayan Valley 165.4 168.8 177.7 184.7 -6.9 -8.6 126.1 128.2 119.1 119.3 5.9 7.5
III - Central Luzon 127.1 127.4 137.6 143.3 -7.6 -11.1 127.5 129.1 123.4 125.5 3.3 2.9
IV-A - CALABARZON 135.7 137.8 146.3 148.7 -7.2 -7.3 127.2 130.3 125.6 125.2 1.3 4.1
IV-B - MIMAROPA 148.8 150.2 143.7 142.6 3.5 5.3 119.5 123.4 113.2 114.1 5.6 8.2
V - Bicol Region 149.2 151.3 152.1 152.9 -1.9 -1.0 123.1 124.0 119.8 121.0 2.8 2.5
VI - Western Visayas 158.9 159.4 159.7 158.4 -0.5 0.6 123.3 127.0 121.6 123.1 1.4 3.2
VII - Central Visayas 152.6 149.2 147.4 147.2 3.5 1.4 129.4 131.7 127.7 127.8 1.3 3.1
VIII - Eastern Visayas 145.3 145.3 141.3 140.6 2.8 3.3 138.3 139.0 129.3 130.7 7.0 6.4
IX - Zamboanga Peninsula 156.9 157.6 161.4 161.6 -2.8 -2.5 118.4 125.3 118.3 118.1 0.1 6.1
X - Northern Mindanao 155.8 151.6 180.3 175.2 -13.6 -13.5 133.0 134.2 141.8 140.7 -6.2 -4.6
XI - Davao Region 156.9 155.8 161.8 157.6 -3.0 -1.1 123.7 123.9 116.2 118.4 6.5 4.6
XII - SOCCSKSARGEN 134.7 134.0 144.4 145.3 -6.7 -7.8 113.8 117.4 113.2 114.5 0.5 2.5
XIII - Caraga 167.1 163.3 167.0 164.2 0.1 -0.5 121.0 123.7 122.4 121.2 -1.1 2.1 ARMM - Autonomous Region in Muslim Mindanao 154.9 154.1 156.6 156.8 -1.1 -1.7 155.7 156.4 157.3 158.2 -1.0 -1.1
- 5 -
SUGAR, JAM, HONEY, CHOCOLATE AND CONFECTIONERY
Jan-13 Dec-12 Jan-12 Dec-11 Jan-13 Dec-12 Jan-12 Dec-11
VEGETABLES
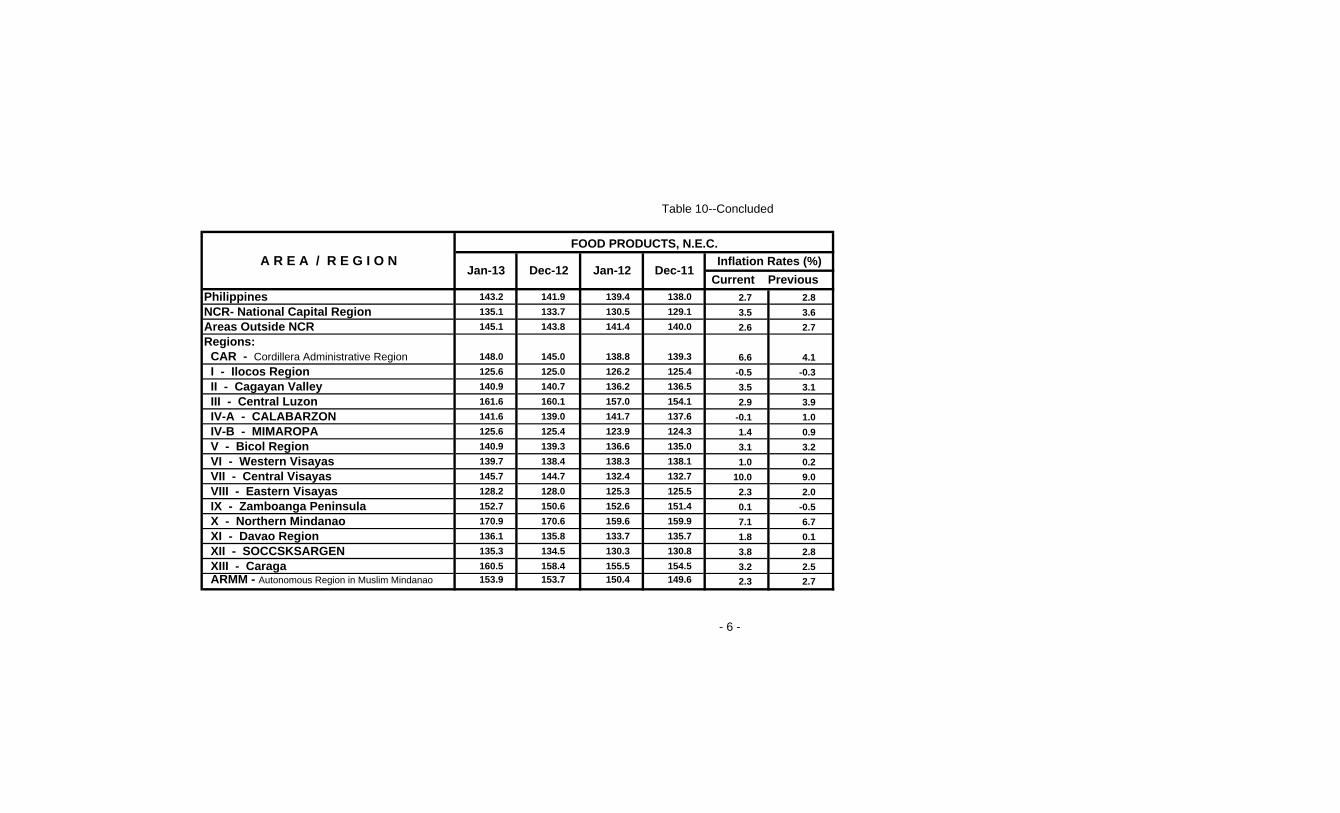
Table 10--Concluded
A R E A / R E G I O N Inflation Rates (%)
Current PreviousPhilippines 143.2 141.9 139.4 138.0 2.7 2.8
NCR- National Capital Region 135.1 133.7 130.5 129.1 3.5 3.6
Areas Outside NCR 145.1 143.8 141.4 140.0 2.6 2.7
Regions: CAR - Cordillera Administrative Region 148.0 145.0 138.8 139.3 6.6 4.1
I - Ilocos Region 125.6 125.0 126.2 125.4 -0.5 -0.3
II - Cagayan Valley 140.9 140.7 136.2 136.5 3.5 3.1
III - Central Luzon 161.6 160.1 157.0 154.1 2.9 3.9
IV-A - CALABARZON 141.6 139.0 141.7 137.6 -0.1 1.0
IV-B - MIMAROPA 125.6 125.4 123.9 124.3 1.4 0.9
V - Bicol Region 140.9 139.3 136.6 135.0 3.1 3.2
VI - Western Visayas 139.7 138.4 138.3 138.1 1.0 0.2
VII - Central Visayas 145.7 144.7 132.4 132.7 10.0 9.0
VIII - Eastern Visayas 128.2 128.0 125.3 125.5 2.3 2.0
IX - Zamboanga Peninsula 152.7 150.6 152.6 151.4 0.1 -0.5
X - Northern Mindanao 170.9 170.6 159.6 159.9 7.1 6.7
XI - Davao Region 136.1 135.8 133.7 135.7 1.8 0.1
XII - SOCCSKSARGEN 135.3 134.5 130.3 130.8 3.8 2.8
XIII - Caraga 160.5 158.4 155.5 154.5 3.2 2.5 ARMM - Autonomous Region in Muslim Mindanao 153.9 153.7 150.4 149.6 2.3 2.7
- 6 -
FOOD PRODUCTS, N.E.C.
Jan-13 Dec-12 Jan-12 Dec-11

Republic of the PhilippinesNATIONAL STATISTICS OFFICE
Manila
Table 11 Monthly Consumer Price Index for Food and Food and Non-Alcoholic Beverages for All Income Households,
by Area, January 2012 - January 2013
(2006 = 100)
2013 2012AREA COMMODITY GROUP Jan Ave Dec Nov Oct Sep Aug Jul Jun May Apr Mar Feb Jan
Food and Non-Alcoholic Beverages 141.6 139.8 141.3 141.3 141.4 141.8 141.2 139.8 139.2 138.6 138.6 137.7 137.7 138.4
PHILIPPINES Food 142.8 140.9 142.5 142.5 142.6 143.0 142.4 140.9 140.3 139.7 139.8 138.8 138.8 139.6
Food and Non-Alcoholic Beverages 135.2 133.5 135.4 134.9 135.4 136.3 136.4 133.3 132.5 131.9 131.7 131.2 131.1 132.4
NATIONAL CAPITAL REGION (NCR) Food 136.3 134.6 136.5 136.0 136.5 137.5 137.7 134.3 133.5 132.9 132.7 132.2 132.2 133.6 Food and Non-Alcoholic Beverages 143.0 141.1 142.6 142.7 142.7 142.9 142.2 141.2 140.6 140.0 140.1 139.1 139.1 139.7
AREAS OUTSIDE NCR Food 144.2 142.2 143.8 143.9 143.9 144.1 143.4 142.3 141.7 141.1 141.3 140.2 140.2 140.9
Table 12 Month-on-Month Changes of the Food and Food and Non-Alcoholic Beverages, in Percent, by Area, January 2012 - January 2013(2006=100)
2013 2012AREA COMMODITY GROUP Jan Dec Nov Oct Sep Aug Jul Jun May Apr Mar Feb Jan
Food and Non-Alcoholic Beverages 0.2 0.0 -0.1 -0.3 0.4 1.0 0.4 0.4 0.0 0.7 0.0 -0.5 0.2
PHILIPPINES Food 0.2 0.0 -0.1 -0.3 0.4 1.1 0.4 0.4 -0.1 0.7 0.0 -0.6 0.1 Food and Non-Alcoholic Beverages -0.1 0.4 -0.4 -0.7 -0.1 2.3 0.6 0.5 0.2 0.4 0.1 -1.0 -0.2
NATIONAL CAPITAL REGION (NCR) Food -0.1 0.4 -0.4 -0.7 -0.1 2.5 0.6 0.5 0.2 0.4 0.0 -1.0 -0.2 Food and Non-Alcoholic Beverages 0.3 -0.1 0.0 -0.1 0.5 0.7 0.4 0.4 -0.1 0.7 0.0 -0.4 0.3
AREAS OUTSIDE NCR Food 0.3 -0.1 0.0 -0.1 0.5 0.8 0.4 0.4 -0.1 0.8 0.0 -0.5 0.2
Table 13 Year-on-Year Changes of the Food and Food and Non-Alcoholic Beverages, in Percent, by Area, January 2012 - January 2013(2006 = 100)
2013 2012AREA COMMODITY GROUP Jan Ave Dec Nov Oct Sep Aug Jul Jun May Apr Mar Feb Jan
Food and Non-Alcoholic Beverages 2.3 2.3 2.3 2.2 2.5 3.7 3.3 2.3 2.1 1.8 1.8 1.4 1.4 3.2
PHILIPPINES Food 2.3 2.2 2.2 2.1 2.5 3.6 3.3 2.2 2.0 1.7 1.7 1.2 1.2 3.3 Food and Non-Alcoholic Beverages 2.1 1.8 2.1 1.6 1.7 4.3 4.9 1.9 1.1 1.2 1.1 1.1 0.1 1.8
NATIONAL CAPITAL REGION (NCR) Food 2.0 1.7 1.9 1.4 1.5 4.3 5.0 1.7 0.9 1.1 0.9 1.0 -0.1 1.8 Food and Non-Alcoholic Beverages 2.4 2.5 2.4 2.3 2.7 3.5 3.0 2.5 2.3 2.0 2.0 1.5 1.7 3.6
AREAS OUTSIDE NCR Food 2.3 2.3 2.3 2.2 2.7 3.4 2.9 2.4 2.2 1.9 1.9 1.3 1.5 3.6
Republic of the PhilippinesNATIONAL STATISTICS OFFICE
Manila
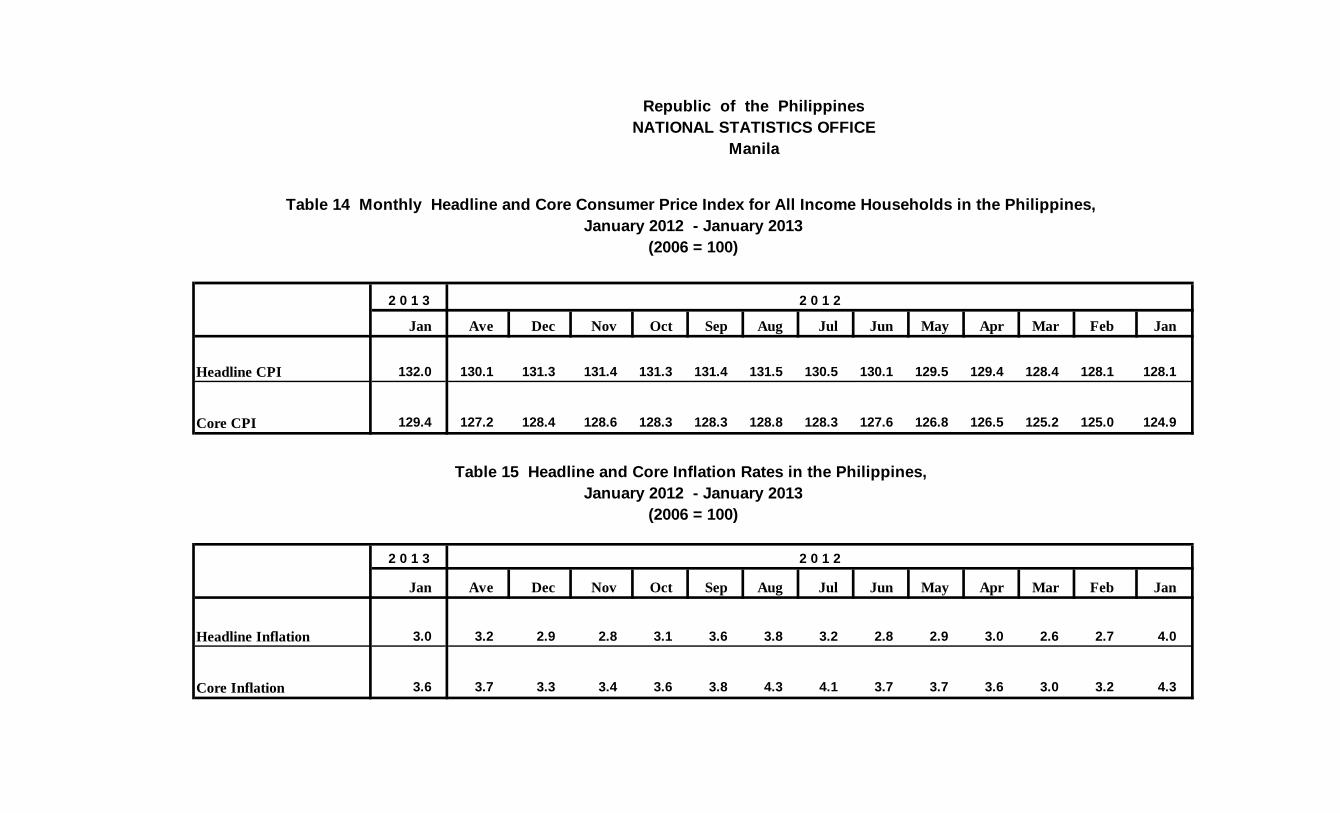
Table 14 Monthly Headline and Core Consumer Price Index for All Income Households in the Philippines, January 2012 - January 2013
2 0 1 3 2 0 1 2
Jan Ave Dec Nov Oct Sep Aug Jul Jun May Apr Mar Feb Jan
Headline CPI 132.0 130.1 131.3 131.4 131.3 131.4 131.5 130.5 130.1 129.5 129.4 128.4 128.1 128.1
Core CPI 129.4 127.2 128.4 128.6 128.3 128.3 128.8 128.3 127.6 126.8 126.5 125.2 125.0 124.9
Table 15 Headline and Core Inflation Rates in the Philippines, January 2012 - January 2013
2 0 1 3 2 0 1 2
Jan Ave Dec Nov Oct Sep Aug Jul Jun May Apr Mar Feb Jan
Headline Inflation 3.0 3.2 2.9 2.8 3.1 3.6 3.8 3.2 2.8 2.9 3.0 2.6 2.7 4.0
Core Inflation 3.6 3.7 3.3 3.4 3.6 3.8 4.3 4.1 3.7 3.7 3.6 3.0 3.2 4.3
(2006 = 100)
(2006 = 100)
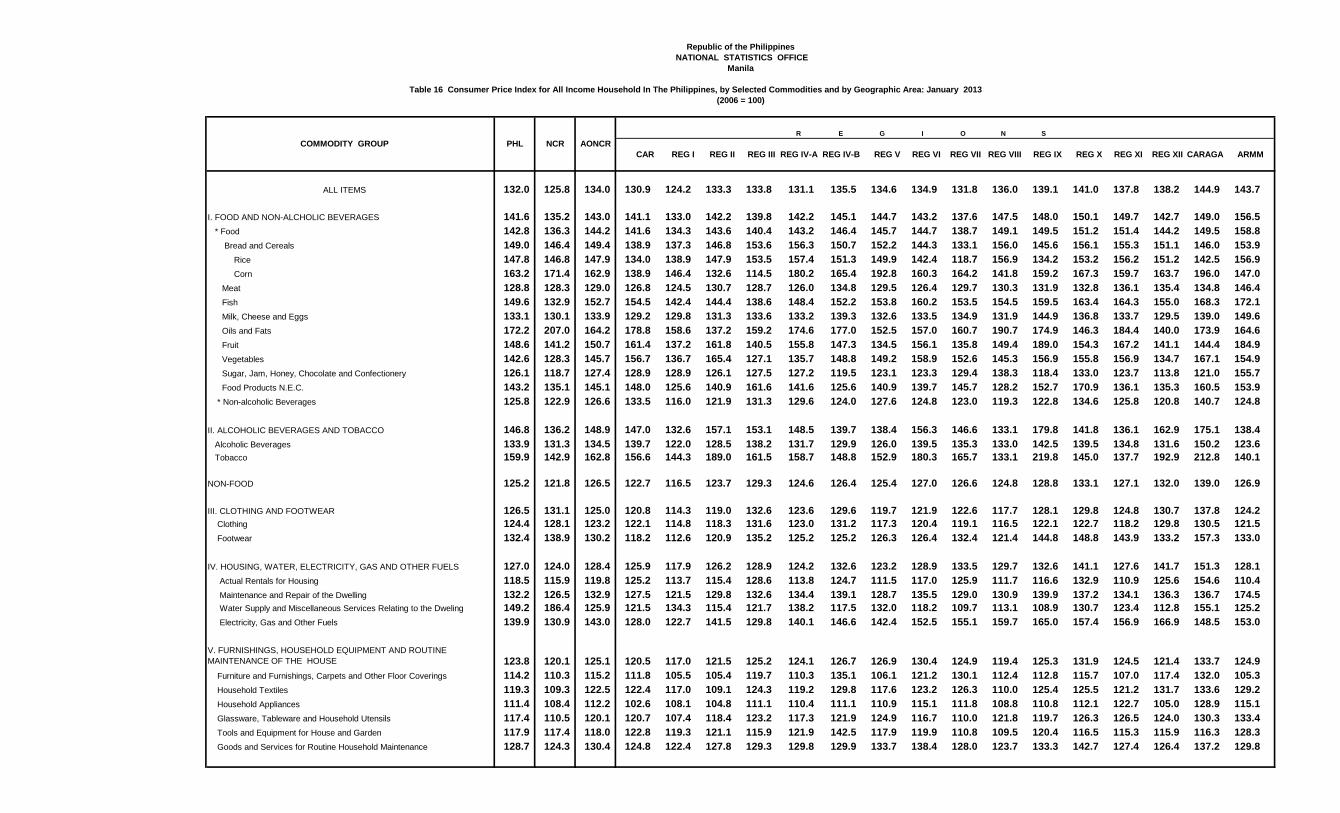
Table 16 Consumer Price Index for All Income Household In The Philippines, by Selected Commodities and by Geographic Area: January 2013
R E G I O N S
COMMODITY GROUP PHL NCR AONCRCAR REG I REG II REG III REG IV-A REG IV-B REG V REG VI REG VII REG VIII REG IX REG X REG XI REG XII CARAGA ARMM
ALL ITEMS 132.0 125.8 134.0 130.9 124.2 133.3 133.8 131.1 135.5 134.6 134.9 131.8 136.0 139.1 141.0 137.8 138.2 144.9 143.7
I. FOOD AND NON-ALCHOLIC BEVERAGES 141.6 135.2 143.0 141.1 133.0 142.2 139.8 142.2 145.1 144.7 143.2 137.6 147.5 148.0 150.1 149.7 142.7 149.0 156.5 * Food 142.8 136.3 144.2 141.6 134.3 143.6 140.4 143.2 146.4 145.7 144.7 138.7 149.1 149.5 151.2 151.4 144.2 149.5 158.8 Bread and Cereals 149.0 146.4 149.4 138.9 137.3 146.8 153.6 156.3 150.7 152.2 144.3 133.1 156.0 145.6 156.1 155.3 151.1 146.0 153.9 Rice 147.8 146.8 147.9 134.0 138.9 147.9 153.5 157.4 151.3 149.9 142.4 118.7 156.9 134.2 153.2 156.2 151.2 142.5 156.9 Corn 163.2 171.4 162.9 138.9 146.4 132.6 114.5 180.2 165.4 192.8 160.3 164.2 141.8 159.2 167.3 159.7 163.7 196.0 147.0 Meat 128.8 128.3 129.0 126.8 124.5 130.7 128.7 126.0 134.8 129.5 126.4 129.7 130.3 131.9 132.8 136.1 135.4 134.8 146.4 Fish 149.6 132.9 152.7 154.5 142.4 144.4 138.6 148.4 152.2 153.8 160.2 153.5 154.5 159.5 163.4 164.3 155.0 168.3 172.1 Milk, Cheese and Eggs 133.1 130.1 133.9 129.2 129.8 131.3 133.6 133.2 139.3 132.6 133.5 134.9 131.9 144.9 136.8 133.7 129.5 139.0 149.6 Oils and Fats 172.2 207.0 164.2 178.8 158.6 137.2 159.2 174.6 177.0 152.5 157.0 160.7 190.7 174.9 146.3 184.4 140.0 173.9 164.6 Fruit 148.6 141.2 150.7 161.4 137.2 161.8 140.5 155.8 147.3 134.5 156.1 135.8 149.4 189.0 154.3 167.2 141.1 144.4 184.9 Vegetables 142.6 128.3 145.7 156.7 136.7 165.4 127.1 135.7 148.8 149.2 158.9 152.6 145.3 156.9 155.8 156.9 134.7 167.1 154.9 Sugar, Jam, Honey, Chocolate and Confectionery 126.1 118.7 127.4 128.9 128.9 126.1 127.5 127.2 119.5 123.1 123.3 129.4 138.3 118.4 133.0 123.7 113.8 121.0 155.7 Food Products N.E.C. 143.2 135.1 145.1 148.0 125.6 140.9 161.6 141.6 125.6 140.9 139.7 145.7 128.2 152.7 170.9 136.1 135.3 160.5 153.9 * Non-alcoholic Beverages 125.8 122.9 126.6 133.5 116.0 121.9 131.3 129.6 124.0 127.6 124.8 123.0 119.3 122.8 134.6 125.8 120.8 140.7 124.8
II. ALCOHOLIC BEVERAGES AND TOBACCO 146.8 136.2 148.9 147.0 132.6 157.1 153.1 148.5 139.7 138.4 156.3 146.6 133.1 179.8 141.8 136.1 162.9 175.1 138.4 Alcoholic Beverages 133.9 131.3 134.5 139.7 122.0 128.5 138.2 131.7 129.9 126.0 139.5 135.3 133.0 142.5 139.5 134.8 131.6 150.2 123.6 Tobacco 159.9 142.9 162.8 156.6 144.3 189.0 161.5 158.7 148.8 152.9 180.3 165.7 133.1 219.8 145.0 137.7 192.9 212.8 140.1
NON-FOOD 125.2 121.8 126.5 122.7 116.5 123.7 129.3 124.6 126.4 125.4 127.0 126.6 124.8 128.8 133.1 127.1 132.0 139.0 126.9
III. CLOTHING AND FOOTWEAR 126.5 131.1 125.0 120.8 114.3 119.0 132.6 123.6 129.6 119.7 121.9 122.6 117.7 128.1 129.8 124.8 130.7 137.8 124.2 Clothing 124.4 128.1 123.2 122.1 114.8 118.3 131.6 123.0 131.2 117.3 120.4 119.1 116.5 122.1 122.7 118.2 129.8 130.5 121.5 Footwear 132.4 138.9 130.2 118.2 112.6 120.9 135.2 125.2 125.2 126.3 126.4 132.4 121.4 144.8 148.8 143.9 133.2 157.3 133.0
IV. HOUSING, WATER, ELECTRICITY, GAS AND OTHER FUELS 127.0 124.0 128.4 125.9 117.9 126.2 128.9 124.2 132.6 123.2 128.9 133.5 129.7 132.6 141.1 127.6 141.7 151.3 128.1 Actual Rentals for Housing 118.5 115.9 119.8 125.2 113.7 115.4 128.6 113.8 124.7 111.5 117.0 125.9 111.7 116.6 132.9 110.9 125.6 154.6 110.4 Maintenance and Repair of the Dwelling 132.2 126.5 132.9 127.5 121.5 129.8 132.6 134.4 139.1 128.7 135.5 129.0 130.9 139.9 137.2 134.1 136.3 136.7 174.5 Water Supply and Miscellaneous Services Relating to the Dweling 149.2 186.4 125.9 121.5 134.3 115.4 121.7 138.2 117.5 132.0 118.2 109.7 113.1 108.9 130.7 123.4 112.8 155.1 125.2 Electricity, Gas and Other Fuels 139.9 130.9 143.0 128.0 122.7 141.5 129.8 140.1 146.6 142.4 152.5 155.1 159.7 165.0 157.4 156.9 166.9 148.5 153.0
V. FURNISHINGS, HOUSEHOLD EQUIPMENT AND ROUTINE MAINTENANCE OF THE HOUSE 123.8 120.1 125.1 120.5 117.0 121.5 125.2 124.1 126.7 126.9 130.4 124.9 119.4 125.3 131.9 124.5 121.4 133.7 124.9 Furniture and Furnishings, Carpets and Other Floor Coverings 114.2 110.3 115.2 111.8 105.5 105.4 119.7 110.3 135.1 106.1 121.2 130.1 112.4 112.8 115.7 107.0 117.4 132.0 105.3 Household Textiles 119.3 109.3 122.5 122.4 117.0 109.1 124.3 119.2 129.8 117.6 123.2 126.3 110.0 125.4 125.5 121.2 131.7 133.6 129.2 Household Appliances 111.4 108.4 112.2 102.6 108.1 104.8 111.1 110.4 111.1 110.9 115.1 111.8 108.8 110.8 112.1 122.7 105.0 128.9 115.1 Glassware, Tableware and Household Utensils 117.4 110.5 120.1 120.7 107.4 118.4 123.2 117.3 121.9 124.9 116.7 110.0 121.8 119.7 126.3 126.5 124.0 130.3 133.4 Tools and Equipment for House and Garden 117.9 117.4 118.0 122.8 119.3 121.1 115.9 121.9 142.5 117.9 119.9 110.8 109.5 120.4 116.5 115.3 115.9 116.3 128.3 Goods and Services for Routine Household Maintenance 128.7 124.3 130.4 124.8 122.4 127.8 129.3 129.8 129.9 133.7 138.4 128.0 123.7 133.3 142.7 127.4 126.4 137.2 129.8
Republic of the Philippines NATIONAL STATISTICS OFFICE
Manila
(2006 = 100)

Table 16--Concluded
R E G I O N S
COMMODITY GROUP PHL NCR AONCR
CAR REG I REG II REG III REG IV-A REG IV-B REG V REG VI REG VII REG VIII REG IX REG X REG XI REG XII CARAGA ARMM
VI. HEALTH 130.1 134.5 128.9 126.1 120.0 124.5 125.9 130.2 126.2 122.2 130.7 123.5 124.3 123.1 154.0 141.1 137.2 141.5 143.3 Medical Products, Appliances and Equipment 123.9 119.8 124.9 118.6 121.6 119.7 126.6 121.6 118.7 119.2 120.2 119.2 120.3 128.0 159.2 131.9 134.5 130.1 137.5 Out-patient Services 135.3 145.4 132.7 141.6 122.7 120.1 124.4 136.2 139.2 134.2 141.1 127.5 136.4 128.0 153.4 140.4 136.2 143.7 135.9 Hospital Services 137.9 148.0 133.9 130.6 113.2 142.0 126.2 144.2 124.1 115.0 144.5 129.5 119.6 103.0 142.5 179.7 144.7 169.9 167.8
VII. TRANSPORT 126.0 114.0 129.7 130.4 124.0 136.0 133.8 122.7 124.0 139.1 132.4 134.4 125.5 145.2 131.2 130.4 126.8 136.5 112.2 Operation of Personal Transport Equipment 127.8 117.8 131.8 126.4 123.9 125.2 139.7 128.2 133.2 129.6 131.0 131.9 132.9 133.5 134.2 127.7 134.5 139.5 134.7 Transport Services 125.4 112.4 129.1 132.0 124.0 139.2 132.0 121.4 120.9 141.6 132.8 135.4 122.9 148.8 130.1 131.1 124.7 135.8 108.6
VIII. COMMUNICATION 92.7 93.9 92.1 82.9 87.9 89.2 91.4 94.8 89.6 93.8 90.4 90.3 95.5 90.9 98.9 92.1 90.1 89.1 96.4 Postal Services 124.8 131.4 122.3 129.7 125.8 135.0 135.7 116.3 118.6 135.4 117.2 132.1 125.4 122.9 126.7 129.5 114.7 128.6 107.2 Telephone and Telefax Equipment 55.9 54.0 56.6 53.9 54.0 49.6 51.0 65.1 56.1 52.5 49.7 57.9 66.4 54.9 51.3 55.0 65.0 48.1 57.3 Telephone and Telefax Services 104.1 104.2 104.1 93.2 102.9 102.4 104.5 104.5 100.8 106.8 103.4 100.4 105.5 102.8 114.5 107.4 98.8 104.1 110.6
IX. RECREATION AND CULTURE 110.5 112.7 109.7 104.8 102.8 99.5 120.3 108.0 105.7 107.5 114.6 104.5 105.1 110.6 106.6 113.6 112.8 109.3 126.9 Audio-visual, Photographic and Information Processing Equipment 98.4 95.9 99.2 92.4 94.9 88.1 98.4 96.0 95.6 98.1 109.3 99.5 99.0 101.6 96.8 103.8 106.4 97.4 109.9 Other Major Durables for Recreation and Culture 117.4 117.4 102.4 134.1 99.7 138.7 114.3 Other Recreational Items and Equipment 111.7 106.2 113.7 111.6 104.1 104.1 118.9 114.9 111.3 113.3 113.9 109.9 103.4 134.0 112.6 110.9 112.6 127.3 105.5 Recreational and Cultural Services 127.1 141.2 115.8 107.9 123.3 110.7 116.9 126.9 101.6 113.8 119.3 100.5 109.4 113.9 128.0 111.0 103.0 105.7 114.8 Newspapers, Books and Stationery 125.3 124.7 125.4 123.2 111.5 114.1 142.5 117.4 130.4 124.0 126.2 115.0 120.2 126.9 119.4 133.1 127.9 138.9 151.8
X. EDUCATION 138.7 140.0 138.3 129.9 129.7 125.8 143.1 135.2 130.1 135.9 132.2 147.8 151.0 137.2 130.1 149.7 149.3 146.2 144.2 Pre-primary and Primary Education 141.3 139.1 142.3 133.2 109.5 136.9 156.7 122.6 139.4 129.1 132.8 170.0 155.0 139.0 136.2 154.9 174.4 153.1 145.6 Secondary Education 135.9 140.5 134.4 127.0 158.2 131.8 132.4 132.4 124.9 148.3 126.2 130.4 151.2 134.3 128.4 158.0 137.3 133.6 146.2 Tertiary Education 139.3 140.6 139.1 131.5 127.6 116.6 144.9 150.8 131.9 131.9 135.4 143.1 149.1 139.3 128.7 135.0 135.1 149.0 143.3 Education Not Definable by Level 139.4 139.4 114.3 164.0 119.0
XI. RESTAURANT AND MISCELLANEOUS GOODS AND SERVICES 124.7 120.8 126.4 119.2 112.8 121.2 132.1 129.3 123.7 129.4 127.0 114.7 121.6 122.0 128.7 121.5 127.3 131.8 135.4 Catering Services 126.4 121.2 129.1 121.0 110.9 124.5 136.9 131.5 123.3 134.8 130.2 113.1 130.5 123.1 132.8 119.5 127.9 131.9 150.1 Personal Care 121.4 119.7 121.9 116.4 116.5 116.3 122.4 124.0 124.4 122.1 122.1 117.2 114.7 121.2 124.1 124.4 126.5 132.6 125.1 Personal Effects N.E.C. 119.9 118.1 120.5 126.0 104.9 126.1 126.7 120.0 120.1 123.6 117.4 121.0 112.4 118.9 118.5 121.5 126.1 123.6 121.6
- 2 -


![Coxpauteuua, ncno.n.syesn.re uenrp - rcrz.kz ерапия... · PDF fileKoJ],(KOJ],bl)no MKJi-lO: 130. Ba30MOTOPHbllll1 anrrepra-recxaii pMHMT. 130.1 - AJIJIeprW-IeCKl1ll pMHMT,](https://img.pdfslide.net/doc/110x75/5a79d8077f8b9a9e0c8d705b/coxpauteuua-ncnonsyesnre-uenrp-rcrzkz-kojkojblno-mkji-lo.jpg)