Embed Size (px)
Citation preview
Macroeconomics & Fiscal Management Global Practice
Middle East and North Africa Region
Report No: ACS16340
.
Republic of Tunisia
Impact of the Libya Crisis on the Tunisian Economy
.
February 2017
.
GMF05
MIDDLE EAST AND NORTH AFRICA
Pub
lic D
iscl
osur
e A
utho
rized
Pub
lic D
iscl
osur
e A
utho
rized
Pub
lic D
iscl
osur
e A
utho
rized
Pub
lic D
iscl
osur
e A
utho
rized
i
Contents
Acknowledgements .................................................................................................................................... v
Executive Summary .................................................................................................................................. 1
Introduction ................................................................................................................................................ 4
Chapter 1 Libyan Households in Tunisia: How Many and Who are They? ............................ 10 ....................................................................................................................................... 10
......................................... 11
......................................................... 12
...................... 18
................................................................................................................................................... 22
................................................................. 26
Chapter 2 The Impact on Financial Flows and the Banking System ......................................... 30 ....................................................................................................................................... 30
.... 31
......................................................................................................................... 34
.................................................................................................................................. 40
................................................................................................................ 45
Chapter 3 Contraband and Informal Foreign Exchange at the Tunisia–Libya Border ....... 48 ....................................................................................................................................... 48
................................................................................................................................................. 49
........................................................................................................................................... 51
............................................................................................................................. 57
............................................. 64
ii
........................................................................................................................................ 66
Chapter 4 An Estimation of the Macroeconomic and Fiscal Impacts ....................................... 68 ....................................................................................................................................... 68
......................... 69
.............................................................................................................. 73
......................................................................................................... 75
........................... 78
........................................................................................................................................ 81
Annexes ..................................................................................................................................................... 82
Appendices ............................................................................................................................................... 83
References ................................................................................................................................................ 91
Figures
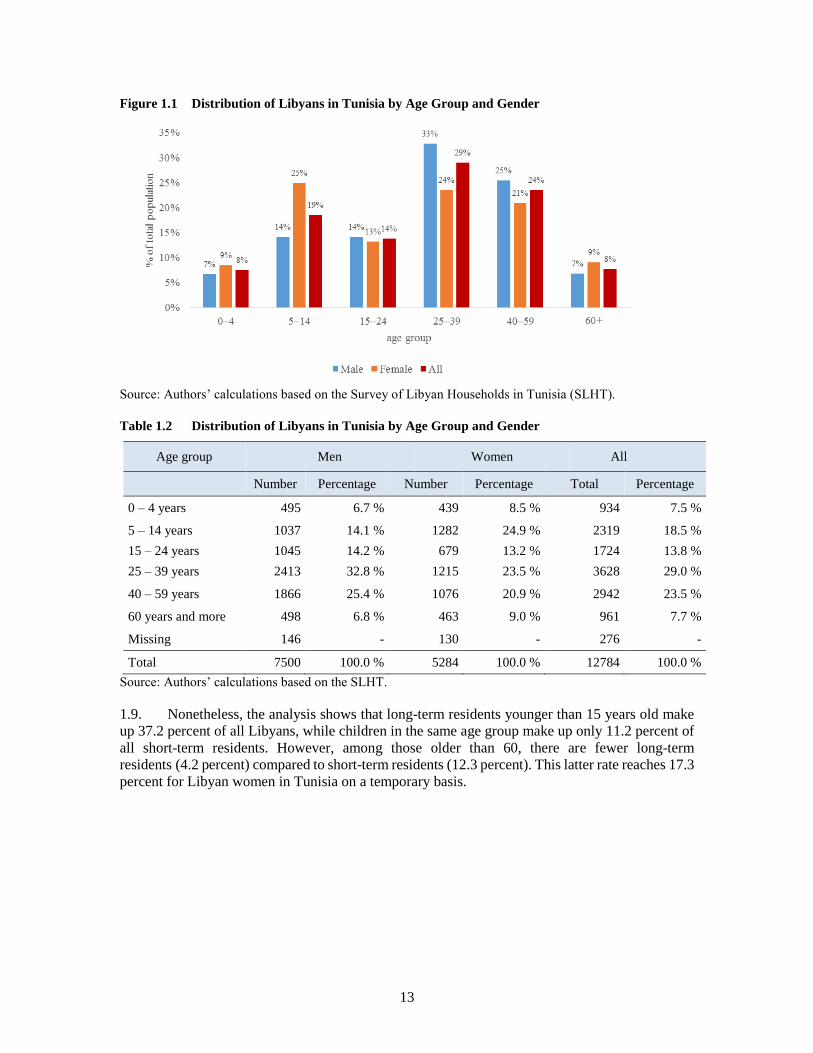
Figure 1.1 Distribution of Libyans in Tunisia by Age Group and Gender ......................................... 13
Figure 1.2 Distribution of Long-Term and Short-Term Libyan Residents in Tunisia by Age Group
and Gender ........................................................................................................................ 14
Figure 1.3 Libyan Residents by Education Level and Gender (Age 10 Years and Older) ................. 15
Figure 1.4 Libyan Children by School Attendance Status and Gender (Age Five to 14 Years) ........ 15
Figure 1.5 Economic Status of Long-Term Libyan Residents by Gender (Age 15 Years and Older) 16
Figure 1.6 Distribution of Employed Libyans in Tunisia, by Function .............................................. 17
Figure 1.7 Occupations of Employed Libyan Residents in Tunisia by Gender.................................. 17
Figure 1.8 Type of Housing by Libyan and Mixed Households ........................................................ 19
Figure 1.9 Ownership Rates of Durable Goods among Libyan Households ...................................... 20
Figure 1.10 Per Capita Expenditure Per Annum for Libyan and Mixed Households (TD) ................. 21
Figure 1.11 Shock Incidence ................................................................................................................ 22
Figure 1.12 Coping Strategies of Households that Experienced a Shock (%)...................................... 24
Figure 1.13 Households’ Recovery Status after a Shock Experience (%) ............................................ 25
Figure 1.14 Length of Stay of Long-Term Libyan Residents (Age 15 Years and Older) .................... 27
Figure 2.1 Libyan FDI in Tunisia ....................................................................................................... 32
Figure 2.2 Tunisian FDI in Libya ....................................................................................................... 32
Figure 2.3 Remittances by Country and Region of Origin (TD, millions) ......................................... 33
Figure 2.4 Money Orders by Region (TD, millions) .......................................................................... 33
Figure 2.5 Breakdown of Account Balance by Transaction Type (TD, millions) .............................. 44
Figure 2.6 Bank Account Source of Supply Balance by Nature of Transaction (%) ......................... 44
Figure 3.1 Number of Libyan Visitors in Tunisia (Millions) ............................................................. 50
Figure 3.2 Liquidities Imported from Libya (millions TD) ................................................................ 54
Figure 3.3 Liquidities in U.S. Dollars and Euros Imported into Tunisia from Libya (millions TD) .. 54
Figure 3.4 Estimates of Informal Trade Volumes (TD millions) ....................................................... 58
Figure 3.5 Subsidized Goods Seized by Tunisian Customs (TD–Thousands) ................................... 64
Figure 4.1 Aggregate investment 2010-15 (index, 100 in 2010) ........................................................ 69
Figure 4.2 Tunisia Terrorism Index ................................................................................................... 72

iii
Figure 4.3 Tunisia Security Budget, Interior and Defense Ministries (2010–15) .............................. 72
Figure 4.4 Hotel & Restaurant Sectors: Annual Growth Rate ............................................................ 73
Figure 4.5 Tourist Night Stays (Foreigners Only) .............................................................................. 73
Figure 4.6 Growth Rates (Predicted and Observed) ........................................................................... 76
Figure 4.7 Unemployment Rates (Predicted and Observed) .............................................................. 76
Figure 4.8 Growth Loss (percentage points) ...................................................................................... 76
Figure 4.9 Welfare Loss, GDP (TD, millions) ................................................................................... 76
Figure 4.10 Impact of Libyan Crisis vs. other factors (percentage points) .......................................... 77
Figure 4.11 Contribution of Various Effects (percentage points) ........................................................ 77
Figure 4.12 Aggregate Consumption (% difference relative to baseline) ............................................ 78
Figure 4.13 Investment (% difference relative to baseline) .................................................................. 78
Figure 4.14 Exchange Rate .................................................................................................................. 78
Figure 4.15 Exports and Imports (%) ................................................................................................... 78
Figure 4.16 Estimated Fiscal Revenues (%)......................................................................................... 79
Figure 4.17 Observed Tax Revenues (%)............................................................................................. 79
Figure 4.18 Simulated Impact on External Debt-to-GDP Ratio (Difference relative to baseline, in %
of GDP) ...................................................................................................................... 80
Figure 4.19 Growth Impact by Sector (% difference relative to baseline) ........................................... 80
Tables
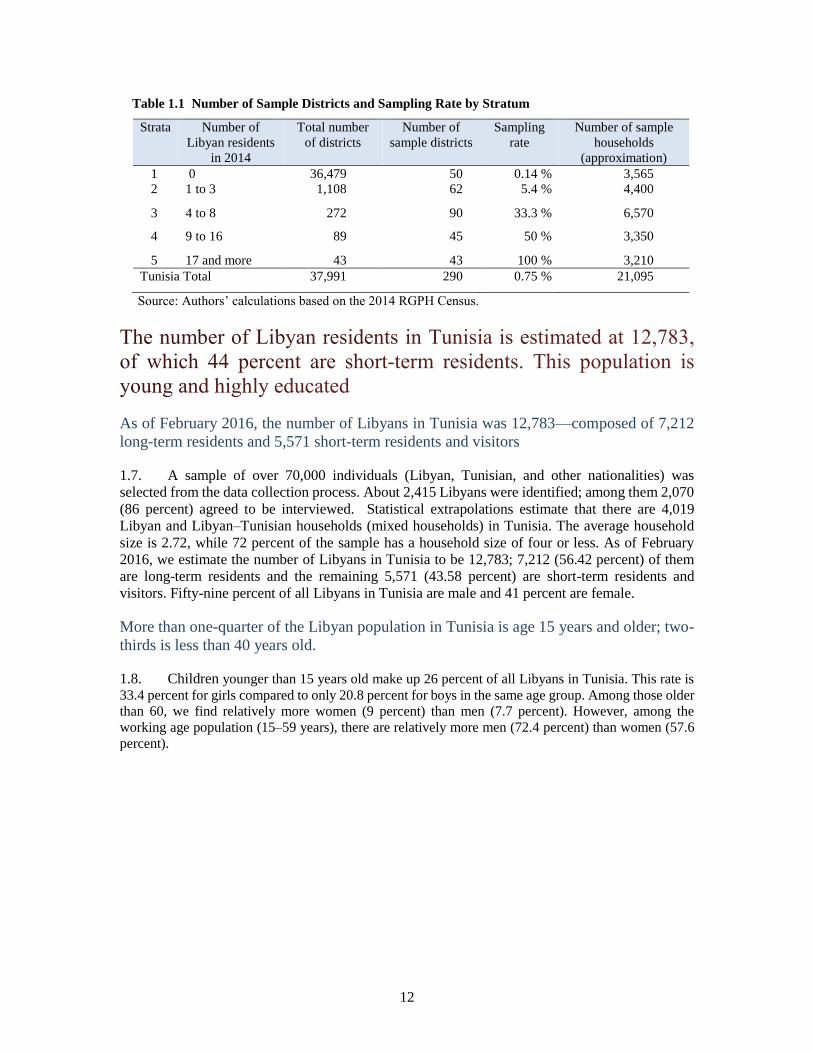
Table 1.1 Number of Sample Districts and Sampling Rate by Stratum ............................................ 12
Table 1.2 Distribution of Libyans in Tunisia by Age Group and Gender ......................................... 13
Table 1.3 Distribution of Long-Term and Short-Term Libyan Residents in Tunisia by Age Group
and Gender ........................................................................................................................ 14
Table 1.4 Distribution of Libyan Residents in Tunisia by Education Level and Gender (Age 10
Years and Older) ............................................................................................................... 15
Table 1.5 Distribution of Libyan Children in Tunisia by School Attendance Status and Gender (Age
Five to 14 years) ............................................................................................................... 15
Table 1.6 Economic Status of Long-Term Libyan Residents by Gender (Age 15 Years and Older) 16
Table 1.7 Occupations of Employed Libyan Residents in Tunisia by Gender.................................. 18
Table 1.8 Type of Housing by Libyan and Mixed Households ........................................................ 19
Table 1.9 Expenditure Breakdown and Budget Shares among Libyan Households ......................... 21
Table 1.10 Shock Incidence ................................................................................................................ 23
Table 1.11 Coping Strategies of Households that Experienced a Shock (%)...................................... 24
Table 1.12 Households’ Recovery Status after a Shock Experience (%) ............................................ 25
Table 1.13 Origin of Libyan Residents by Residence Status and Gender (Age 15 Years and Older) 26
Table 1.14 Libyans in Tunisia: Reason for Migration, Residence Status, and Sex (Age 15 Years
and Older) ......................................................................................................................... 27
Table 1.15 Intention to Return Permanently to Libya among Long-Term Libyan Residents (Age 15
Years and Older) ............................................................................................................... 28
Table 1.16 Main Reason for Intending to Return to Libya (Long-Term Residents, Age 15 Years
and Older) ......................................................................................................................... 28
Table 1.17 Main Reason for Not Returning to Libya (Long-Term Residents, Age 15 Years and
Older) ................................................................................................................................ 29
Table 1.18 Life Satisfaction Level in Tunisia among Libyans (Long-Term Residents, Age 15 Years
and Older) ......................................................................................................................... 29
Table 2.1 Tunisian Residents in Libya .............................................................................................. 32
Table 2.2 Assets of Tunisians in Libya (US$) .................................................................................. 34
Table 2.3 Size of the Seven Surveyed Banks (*) .............................................................................. 38
Table 2.4 Geographical Breakdown of Accounts Held by Libyans, End of 2014 (%) ..................... 39
Table 2.5 Libyan Accounts in Tunisia, by Currency (End of 2014) ................................................. 39
Table 2.6 Libyan Accounts by Immigration Status........................................................................... 40
Table 2.7 Profiles of Libyan Account Holders ................................................................................. 40
Table 2.8 Libyan Deposits in Surveyed Banks, Individuals (TD, millions) (a) ................................ 41
Table 2.9 Libyan Deposits in Surveyed Banks, Corporations (TD, millions) (a) ............................. 42
iv
Table 2.10 Libyan Deposits in Surveyed Banks (Individual & Corporate) (TD, millions) (a) ........... 43
Table 2.11 Average Income: Libyans in Tunisia ................................................................................ 44
Table 2.12 Credit Multiplier and Coverage Rate in the Surveyed Banks (TD, millions) ................... 45
Table 2A.1 Trends in Foreign Direct Investment between Tunisia and Libya (TD, millions–unless
otherwise specified) .......................................................................................................... 83
Table 2A.1 Comparative Trends in Foreign Direct Investment (TD, millions–unless otherwise
specified) ........................................................................................................................... 83
Table 2A.3 Money Orders by Transfer Amount (TD, thousands) ....................................................... 84
Table 2A.4 Deposit Accounts in Tunisia’s Banking System versus Libyan-Owned Accounts ........... 85
Table 2A.5 Students attending Libyan Schools in Tunisia (School Year 2014–15) ............................ 86
Table 2A.3 Bank Deposit Details (TD, millions) ................................................................................ 87
Table 3.1 Inflows and Outflows of People through Land Border Checkpoints ................................ 50
Table 3.2 Inflows and Outflows of Vehicles through the Ras Jedir and Dhehiba Checkpoints ........ 51
Table 3.3 Libyan Dinars Exchanged in the Informal Foreign Exchange Market .............................. 52
Table 3.4 Estimating Sarrafas’ Earnings ........................................................................................... 53
Table 3.5 Exchange Rate of the Algerian Dinar in Formal and Informal Markets ........................... 55
Table 3.6 Contraband Fuel at the Tunisia–Libya Border .................................................................. 59
Table 3.7 Profits in the Contraband Fuel Trade ................................................................................ 60
Table 3.8 Tobacco Confiscation Statistics ........................................................................................ 61
Table 3.9 Prices of Items Exported by Contraband to Libya ............................................................ 62
Table 3.10 Subsidized Food Illegally Exported by Individual Travelers ............................................ 63
Table 3.11 Subsidized Food Illegally Exported .................................................................................. 63
Table 4.1 Private Investment Contraction in Tunisia ........................................................................ 71
Table 4.2 Libyan Households in Tunisia: Revenue (TD, millions) .................................................. 71
Table 4.3 Consumption Profile of Libyans Living in Tunisia .......................................................... 74
Table 4.4 Hypotheses in Three Scenarios ......................................................................................... 75
Boxes
Box 3.1 Estimating Libyan dinars Exchanged in the Informal Foreign Exchange Market ............ 52
Box 3.2 Foreign Currency Confiscations Reported by Tunisian Media ......................................... 55
Box 3.3 How Liquidities Circulate to Finance Contraband ............................................................ 56
Box 3.4 Estimating Contraband Fuel Volumes .............................................................................. 59
Box 3.5 An Inside Look at the Subsidized Consumer Goods Contraband Market ......................... 62
Box 4.1 The Tunisian Business Environment Survey by ITCEQ .................................................. 70
Appendices
Appendix 2.1 Trends in Foreign Direct Investments ............................................................................... 83
Appendix 4.1 Ministries of Interior and Defense Budgets ...................................................................... 88
Appendix 4.2 Libyan Households in Tunisia: Revenue via Banking Sector ........................................... 88
Appendix 4.3 Libyan Households in Tunisia: Revenue via Informal Border .......................................... 88
Appendix 4.4 Libyan Households in Tunisia: Savings and Expenditures (2010) ................................... 89
Appendix 4.5 GDP Projections versus Actual GDP Values (Tunisia, 2010–15) .................................... 90
Appendix 4.6 IMF GDP Estimates versus Actual GDP (MENA Region, 2010–15) ............................... 90
v
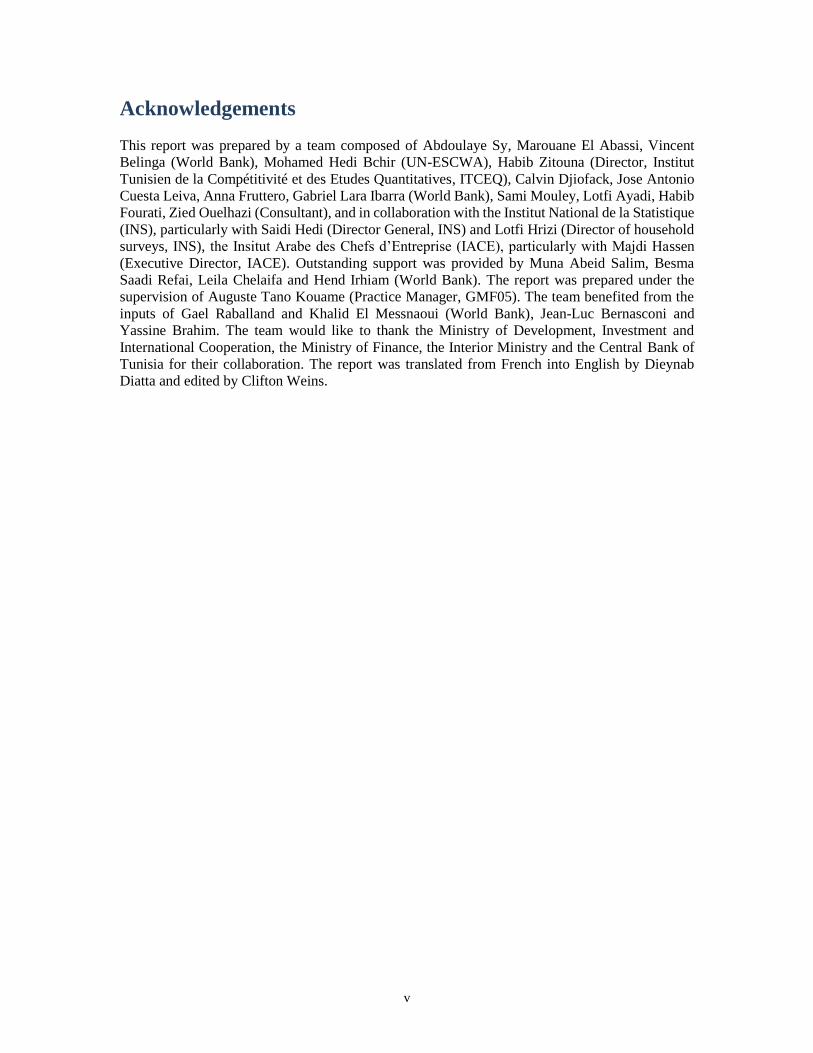
Acknowledgements
This report was prepared by a team composed of Abdoulaye Sy, Marouane El Abassi, Vincent
Belinga (World Bank), Mohamed Hedi Bchir (UN-ESCWA), Habib Zitouna (Director, Institut
Tunisien de la Compétitivité et des Etudes Quantitatives, ITCEQ), Calvin Djiofack, Jose Antonio
Cuesta Leiva, Anna Fruttero, Gabriel Lara Ibarra (World Bank), Sami Mouley, Lotfi Ayadi, Habib
Fourati, Zied Ouelhazi (Consultant), and in collaboration with the Institut National de la Statistique
(INS), particularly with Saidi Hedi (Director General, INS) and Lotfi Hrizi (Director of household
surveys, INS), the Insitut Arabe des Chefs d’Entreprise (IACE), particularly with Majdi Hassen
(Executive Director, IACE). Outstanding support was provided by Muna Abeid Salim, Besma
Saadi Refai, Leila Chelaifa and Hend Irhiam (World Bank). The report was prepared under the
supervision of Auguste Tano Kouame (Practice Manager, GMF05). The team benefited from the
inputs of Gael Raballand and Khalid El Messnaoui (World Bank), Jean-Luc Bernasconi and
Yassine Brahim. The team would like to thank the Ministry of Development, Investment and
International Cooperation, the Ministry of Finance, the Interior Ministry and the Central Bank of
Tunisia for their collaboration. The report was translated from French into English by Dieynab
Diatta and edited by Clifton Weins.
1
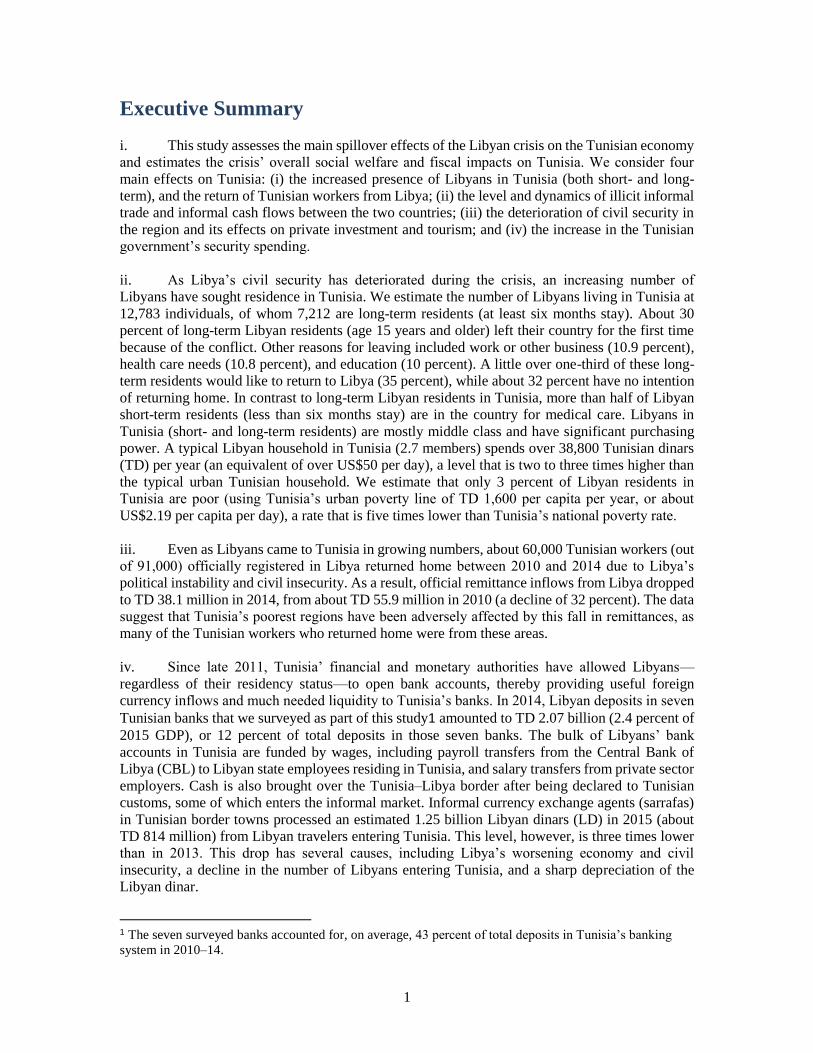
Executive Summary
i. This study assesses the main spillover effects of the Libyan crisis on the Tunisian economy
and estimates the crisis’ overall social welfare and fiscal impacts on Tunisia. We consider four
main effects on Tunisia: (i) the increased presence of Libyans in Tunisia (both short- and long-
term), and the return of Tunisian workers from Libya; (ii) the level and dynamics of illicit informal
trade and informal cash flows between the two countries; (iii) the deterioration of civil security in
the region and its effects on private investment and tourism; and (iv) the increase in the Tunisian
government’s security spending.
ii. As Libya’s civil security has deteriorated during the crisis, an increasing number of
Libyans have sought residence in Tunisia. We estimate the number of Libyans living in Tunisia at
12,783 individuals, of whom 7,212 are long-term residents (at least six months stay). About 30
percent of long-term Libyan residents (age 15 years and older) left their country for the first time
because of the conflict. Other reasons for leaving included work or other business (10.9 percent),
health care needs (10.8 percent), and education (10 percent). A little over one-third of these long-
term residents would like to return to Libya (35 percent), while about 32 percent have no intention
of returning home. In contrast to long-term Libyan residents in Tunisia, more than half of Libyan
short-term residents (less than six months stay) are in the country for medical care. Libyans in
Tunisia (short- and long-term residents) are mostly middle class and have significant purchasing
power. A typical Libyan household in Tunisia (2.7 members) spends over 38,800 Tunisian dinars
(TD) per year (an equivalent of over US$50 per day), a level that is two to three times higher than
the typical urban Tunisian household. We estimate that only 3 percent of Libyan residents in
Tunisia are poor (using Tunisia’s urban poverty line of TD 1,600 per capita per year, or about
US$2.19 per capita per day), a rate that is five times lower than Tunisia’s national poverty rate.
iii. Even as Libyans came to Tunisia in growing numbers, about 60,000 Tunisian workers (out
of 91,000) officially registered in Libya returned home between 2010 and 2014 due to Libya’s
political instability and civil insecurity. As a result, official remittance inflows from Libya dropped
to TD 38.1 million in 2014, from about TD 55.9 million in 2010 (a decline of 32 percent). The data
suggest that Tunisia’s poorest regions have been adversely affected by this fall in remittances, as
many of the Tunisian workers who returned home were from these areas.
iv. Since late 2011, Tunisia’ financial and monetary authorities have allowed Libyans—
regardless of their residency status—to open bank accounts, thereby providing useful foreign
currency inflows and much needed liquidity to Tunisia’s banks. In 2014, Libyan deposits in seven
Tunisian banks that we surveyed as part of this study1 amounted to TD 2.07 billion (2.4 percent of
2015 GDP), or 12 percent of total deposits in those seven banks. The bulk of Libyans’ bank
accounts in Tunisia are funded by wages, including payroll transfers from the Central Bank of
Libya (CBL) to Libyan state employees residing in Tunisia, and salary transfers from private sector
employers. Cash is also brought over the Tunisia–Libya border after being declared to Tunisian
customs, some of which enters the informal market. Informal currency exchange agents (sarrafas)
in Tunisian border towns processed an estimated 1.25 billion Libyan dinars (LD) in 2015 (about
TD 814 million) from Libyan travelers entering Tunisia. This level, however, is three times lower
than in 2013. This drop has several causes, including Libya’s worsening economy and civil
insecurity, a decline in the number of Libyans entering Tunisia, and a sharp depreciation of the
Libyan dinar.
1 The seven surveyed banks accounted for, on average, 43 percent of total deposits in Tunisia’s banking
system in 2010–14.
2
v. Other foreign currencies (mainly U.S. dollars and euros) imported by Libyans and reported
to Tunisian customs increased, on average, to TD 1.3 billion per year (about US$650 million)
between 2014 and 2015, up from TD 738 million in 2013, as informal cross-border trade volumes
between Tunisia and Libya—and also Algeria—have expanded. This highlights the increased use
of these channels for money laundering and financing the informal cross-border trade of fuel,
cigarettes, other consumption items, and also illicit products. In addition, some Tunisian banks have
benefited from Libyans’ deposits through active commercial strategies, but many appear vulnerable
to slowdowns in Libyan cash flows and transfer deposits, and to some degree, greater withdrawal
rates.
vi. This report also estimates the informal trade (imports and exports) passing through the
Tunisia–Libya border. The value of informal merchandise imports from Libya is estimated at TD
596 million in 2015 (against TD 590 million in 2013), driven by a large increase in informal fuel
imports (TD 296.9 million in 2015, against TD 66.8 million in 2013). During the same time frame,
informal imports of non-fuel consumption goods dropped (TD 300 million in 2015, against TD 524
million in 2013). Informal imports of cigarettes through the border with Libya is estimated TD 400
million in 2015. Last, informal exports from Tunisia to Libya of subsidized goods (such as pasta,
couscous, sugar, and milk) seized by Tunisian customs and border police has doubled from TD 496
million in 2013 to TD 1.1 billion in 2015. Even so, an estimated 43,000 tons of subsidized goods,
with a market value of TD 42.8 million, was exported illicitly to Libya in 2015.
vii. Private investment and tourism both have been greatly affected by the worsening security
situation in Tunisia and the overall Middle East and North Africa region since the beginning of the
Arab Spring. Since 2010, private investment in Tunisia has dropped by 20 percent, driven by
political instability, social tensions, the economic challenges presented by the Libyan crisis, and
lower investor confidence caused by regional civil insecurity and instability. This regional
insecurity has also negatively affected foreign tourists’ perception of Tunisia, resulting in dramatic
declines for Tunisia’s tourism sector. In response to domestic and regional security threats, Tunisia
has sharply increased defense and security spending. Between 2011 and 2015, these categories of
government expenditures have almost doubled, going from about TD 2.5 billion to TD 4.7 billion.
viii. We estimate that the Libyan crisis may have contributed 24 percent to the overall drop in
Tunisia’s growth over the five years from 2011 to 2015. This amounts to a welfare loss of TD 8.8
billion over this time frame, or about US$880 million per year (2 percent of 2015 GDP per year).
This welfare loss is driven by the spillover effects of the Libyan crisis on private investment and
tourism, which account, respectively, for 60.1 percent and 36 percent of the slowdown in growth.
These causes are followed by the reduction in remittances from Tunisian workers in Libya (1.4
percent); increased government security spending (1.2 percent); and the reduced purchasing power
of Libyans in Tunisia (0.8 percent). We estimate the fiscal cost of the Libyan crisis on Tunisia
(increased government security spending and losses in tax revenue) at TD 5.8 billion over the five
years from 2011 to 2015, or US$580 million per year (6.3 percent of 2015 tax revenues per year).
Covering this cost through taxation would require large tax increases, while financing it with debt
would increase the government’s financing needs by TD 7 billion over the five-year period (or 15
percent of the 2015 public debt-to-GDP ratio); this amount includes TD 274 million in additional
interest payments, and TD 920 million in additional debt amortization costs.
ix. Tunisia should confront, without delay, the challenges it faces that are associated with the
Libyan crisis in order to mitigate the ongoing negative effects of Libya’s turmoil on Tunisia. The
future stabilization of Libya’s civil security and political institutions, its economic recovery, and
the reconstruction of the country’s infrastructure will create many growth and economic
opportunities for Tunisia. And while Tunisia enjoys many comparative advantages in its trade with
3
Libya—including a shared language and proximity—it is imperative that Tunisia act now so that it
is prepared to seize these future opportunities. In specifics, Tunisia should forthwith address the
regulatory and infrastructure obstacles to trade and investment with Libya. The Tunisian
government should establish platforms for policy and business dialogue, and coordinate with
Libyan authorities on economic and security issues. To prevent the future reconstruction and
recovery of Libya from further fueling the already large informal cross-border markets (and the
security and economic challenges associated with illicit trade), it is important that the government
of Tunisia adopt and implement comprehensive reform and action plan that tackles the root causes
of this trade. This plan should include a reform of administered prices, subsidies and taxes on
products affected by this trade, liberalizing and promoting competition in sectors dominated by
state-owned enterprises and improving their performance, and promoting economic development
in border and lagging regions.
4
Introduction
x. The Libyan crisis has taken a great human and economic toll on the Libyan people
and the Libyan economy. On the humanitarian side, the political instability in Libya and the
escalation of violence has led to civilian deaths, large displacements, the disruption of basic social
services, and widespread destruction of public infrastructure. The World Food Programme (WFP)2
estimates the number of Libyans in need of humanitarian assistance and protection at 2.44 million
(about 40 percent of the population), 55 percent of whom are women and children. Of the 2.44
million, 1.2 million people are at risk of food insecurity. According to the United Nations High
Commissioner for Refugees (UNHCR), an estimated 435,000 people have been displaced and
require varying degrees of protection and assistance.3
xi. Political strife, weak security conditions, and blockaded oil production infrastructure have
constrained the supply side of Libya’s economy, leading to three consecutive years of severe
recession. GDP contracted by about 14 percent in 2013, 24 percent in 2014, and 10 percent in 2015.
Production of crude oil fell in 2015 to the lowest level on record, to around 0.4 million barrels per
day (bpd), which represents one-quarter of potential output.
xii. Per capita income has fallen to less than US$4,500, compared to almost US$13,000 in
2012. The fiscal deficit has skyrocketed from 4 percent of GDP in 2013 to about 75 percent in
2015, reflecting the collapse in oil export revenues. Spending, meanwhile, has remained high—
especially wage costs, which represent about 60 percent of GDP. This squeezes public investment
in health, education, electricity, and water and sanitation services. Being highly dependent on
hydrocarbon exports (representing about 97 percent of export revenues) and food imports, Libya’s
current account has deteriorated from a zero deficit in 2013 to about 76 percent of GDP in 2016.
This has led to a depletion of foreign reserves, which have declined by half, from US$107.6 billion
in 2013 to an estimated US$56.8 billion in 2015.
xiii. The Libyan crisis also has affected the Tunisian economy in multiple ways. The
objective of our study is to assess the interplay of these various effects, and to offer
quantitative estimates of the social welfare and fiscal consequences for Tunisia. We present,
in four chapters, evidence of the Libyan crisis’ effects on the Tunisian economy. We examine the
effects of the growing number of Libyans living (both short- and long-term) in Tunisia, and the
return of Tunisian workers from Libya. These issues are addressed in chapter 1, on the socio-
economic characteristics of Libyans in Tunisia; in chapter 2, on formal financial flows between
Libya and Tunisia; and chapter 4, on assessing the macroeconomic effects of the crisis on Tunisia.
Chapter 3 looks at the higher levels of informal cross-border trade and cash flows between the two
countries. In chapter 4, we analyze the region’s deteriorating civil security and its effect on
important sectors of the economy, such as private investment and tourism. Chapter 4 also looks at
the Tunisian government’s increased security spending in response to the crisis. And finally, we
give estimates of the social welfare and fiscal effects of the crisis on Tunisia.
xiv. Official statistics on Libyan citizens’ entries and exits at the Tunisia–Libya border
(land and airports) do not offer in-depth information on Libyans living in, or visiting,
Tunisia. Chapter 1 presents the main findings of a nationally representative survey of Libyan
2 WFP (World Food Progamme). 2015. Assistance to People Affected by the Crisis in Libya. Rome: WFP. 3 In 2015, WFP reached over 290,000 people in Libya with food assistance. It aims to assist up to 210,000
beneficiaries (of which 40,000 are refugees and asylum seekers registered by the UNHCR) by the end of
2016.
5
households in Tunisia we conducted to construct a detailed portrait of Tunisia’s Libyan
population. The 2014 Tunisian census estimated the number of Libyan residents (six months or
more of actual or intended stay) at 8,777 people. But in 2014, according to official statistics, 1.8
million Libyans entered in Tunisia and 1.4 million exited, suggesting that the number of long-term
(more than six months) and short-term (less than six months) Libyan residents and visitors in
Tunisia is larger than the census estimate. However, the aggregate entry and exit flows do not
provide information on the residency status of households, and are not helpful for estimating the
population of short- and long-term Libyan residents in Tunisia at a point in time. The same
household or individual can cross the border multiple times, and exits at border crossings are less
thoroughly and systematically recorded than entries.4
xv. Our nationally representative survey of Libyan households in Tunisia focuses on the socio-
economic characteristics of both short- and long-term residents (chapter 1):
Libyan residents in Tunisia tend to be long-term residents, with a relatively high level of
education. As of February 2016, the number of Libyans in Tunisia is estimated at 12,783
individuals, of whom 7,212 (56 percent) are long-term residents (reside or intend to stay for
six months or more); 41.3 percent are women and 26 percent are less than 15 years old. Over
48 percent of Libyan residents age 10 years and older have a university education, while 25
percent have attained middle school.
Most long-term Libyan residents have been living in Tunisia for less than three years. Of
adult Libyan long-term residents (age 15 years and older), 19.9 percent have been living in
Tunisia for two to three years; about 36 percent for one to two years; and 22.5 percent moved
to Tunisia less than a year ago. About 15.5 percent of Libyan permanent residents settled in
Tunisia before the beginning of the Libyan crisis in 2011.
The reasons Libyans live in Tunisia are a combination of push and pull factors; and while
one-third want to stay, another third hope to return to Libya. About 30 percent of long-
term Libyan residents, age 15 years and older, left their country for the first time because of
the Libyan crisis. This rate is much higher among women (38.5 percent), than men (25.1
percent). Others came to Tunisia for work or business activities (10.9 percent), health care
needs (10.8 percent), or education (about 10 percent). In contrast, more than half of short-term
Libyan residents (52.4 percent) are in Tunisia to seek health care. The survey also reveals that
among long-term residents, age 15 and older, a little over one-third (about 35 percent) would
like to return to Libya; about 32 percent have no intention of returning; 16 percent expect that
they could probably return; and the rest are uncertain. Optimism about a resolution of the
Libyan crisis, the desire for family reunification, and work and economic activities are the main
motives for desiring to return.
The Libyans that currently visit, reside, or stay on a long-term basis in Tunisia are mostly
middle class, with significant purchasing power. Only 3 percent are estimated to be poor
4 Other sources offer profiles of short-term residents and visitors. The Tunisian National Office of Tourism
(Office National de Tourisme Tunisien; ONTT) estimates the number of Libyan non-residents who spend at
least one night in the country—regardless of reason for stay (and thus are considered tourists)—at 1.75
million (2014). Nearly 400,000 of this number stay in a hotel and spend, on average, 2.5 nights per visitor.
The National Chamber of Private Clinics (Chambre Nationale des Clinique Privées; CNCP) estimates that
private clinics in Tunisia treat nearly 320,000 Libyan patients per year.
6
(based on Tunisia’s urban poverty line of TD 1,600 per capita per year, or about US$2.19 per
capita per day), a rate that is five times lower than Tunisia’s national poverty rate.
xvi. Since late 2011, Tunisia’s financial and monetary authorities have allowed Libyans
in Tunisia—regardless of their residency status—to open bank accounts and carry out
regular banking operations. This has provided useful foreign currency inflows and much
needed liquidity to the country’s banks. In collaboration with the Central Bank of Tunisia
(Banque Centrale de Tunisie; BCT), we conducted a survey of Libyan bank accounts in
several major banks (chapter 2). The survey targeted 13 banks (nine onshore and four offshore
banks) among Tunisia’s 30 banks (22 onshore and eight offshore); six onshore banks and one
offshore bank responded to the survey and provided sufficient data for us to analyze the 2010–14
period. These seven banks accounted for, on average, about 43 percent of the Tunisian banking
sector’s deposits during this time frame. The number of Libyans’ bank accounts (individuals only)
in the seven banks rose from 897 accounts in 2010 to 13,022 accounts in 2014; while for
corporations, the number of accounts has remained virtually constant at 730 accounts every year,
on average. About 86 percent of Libyans’ bank accounts are in foreign currencies (mainly U.S.
dollars and euros), 9.6 percent are denominated in Tunisian dinars, and 4.3 percent are in
convertible Tunisian dinars. In 2014, Libyan deposits in the seven Tunisian banks we surveyed
(which accounted for about 43 percent of total deposits) amounted to TD 2.07 billion (2.4 percent
of GDP), or 12 percent of all deposits in the seven banks.
xvii. In 2015, informal foreign exchange agents, known as sarrafas, processed LD 1.25
billion in 2015 (TD 814 million) from Libyan travelers entering Tunisia, a level three times
lower than in 2013. This decline in the informal exchange market was caused by several
dynamics: the deterioration of the Libyan economy and internal security threats, a fall in the
number of Libyans entering Tunisia, and a sharp depreciation of the Libyan dinar (chapter
3). According to official statistics, the number of Libyans crossing the land border into Tunisia
dropped from about 1.5 million in 2013 to about one million in 2015. This decline, combined with
the depreciation of the Libyan dinar in the informal market of about 50 percent (LD 0.77 per TD
1.0 in 2013, compared to LD 1.54 per TD 1.0 in 2015), has resulted in sluggish informal exchange
activity in Libyan dinars. On average, between 2014 and 2015 an equivalent of TD 1.34 billion
(LD 1.40 billion) was imported into Tunisia, down from TD 2.43 billion in 2013 (LD 1.86 billion),
a decline of 45 percent. During the same period, sarrafas’ income fees declined from TD 48.3
million to TD 26.75 million.
xviii. Imports of other foreign currency by Libyans that are reported to Tunisian customs
have increased by more than 70 percent as informal cross-border trade (contraband) between
Tunisia and Libya—and Algeria—has increased (chapter 3). This highlights the growing use
of such channels for money laundering and financing informal cross-border trade, including
illicit products. Foreign currencies declared by Libyans to Tunisian customs officials reached an
average amount of TD 1.3 billion between 2014 and 2015, up from TD 738 million in 2013, an
increase of some 77 percent. Foreign currency imports (U.S. dollars and euros) in Tunisia—unlike
imports of Libyan dinars—are not correlated to the entry of Libyans into Tunisia, but to foreign
currency collected in Tunisia and Algeria to finance the informal trade. Indeed, the major Tunisian
sarrafas export to Libya, through informal channels, foreign currencies collected in Tunisia and
Algeria, which are then: (i) reintroduced in Tunisia by their Libyan partners, (ii) declared at
Tunisian customs, and (iii) deposited in Tunisian banks or put back into legal economic activities.
xix. Informal cross-border trade between Tunisia and Libya has increased dramatically
in recent years as the Libyan state has weakened and Tunisia has faced its own post-
revolution challenges (chapter 3). Informal imports into Tunisia of non-petroleum products—
7
mainly electronic items, household appliances, clothes and shoes—have declined by about two-
thirds, to TD 300 million, from TD 524 million in 2013. This drop occurred because of a
strengthening of border controls and an increase in patrols on the Tunisian side of the border, and
conversely, because of the breakdown of civil security in Libya. Informal import activities have
shifted toward fuel, as it generates large profits for both Tunisians and Libyans involved in this
trade. We estimate informal fuel imports from Libya at 495 million liters in 2015 (17 percent of
Tunisia’s consumption in 2014), with a market value of TD 297 million, five times the 2013
estimate (TD 67 million). This informal trade, which employs an estimated 5,600 Tunisians, has
generated a net gain of about TD 320 million for Tunisian operators, of which TD 118.7 million
represents the net gain for the wholesale activity at the border, and TD 210.3 million the net gain
for retail sale inside the country. Informal tobacco imports from Libya are also significant, and we
estimate this market at TD 400 million in 2015.
xx. With rapid food price inflation in Libya, incentives and attempts to illicitly export
Tunisian subsidized food items to Libya have increased (chapter 3). The depreciation of the
Libyan dinar, combined with the drop in oil revenues and the weakening of subsidy programs, has
caused rapid food price inflation in Libya, thus widening the food price gap between the two
countries. This has created a high demand for food products from Tunisia, including subsidized
pasta, couscous, bread, semolina, sugar, and also pharmaceuticals. The value of subsidized products
smuggled over the border—that were seized by Tunisian customs or the National Guard—more
than doubled between 2013 and 2015, from TD 496 million to TD 1.1 billion. Nevertheless, we
estimate that at least 50,342 tons of subsidized Tunisian products with a market value of TD 42.8
million avoided detection and were exported illicitly to Libya in 2015.
xxi. Between 2010 and 2014, about 60,000 Tunisians working in Libya returned to Tunisia
because of the Libyan crisis. This large repatriation has resulted in a 32 percent decline in
official remittances from Libya (see chapter 2). The outbreak of the Libyan crisis and the
deterioration of civil security there resulted in a steady stream of Tunisians returning home
(including construction sector employees, self-employed business persons, and so forth). In 2014,
the number of officially registered Tunisian workers in Libya dropped to about 31,000, from 91,000
in 2010. Their return has resulted in official remittances inflows from Libya decreasing to TD 38.1
million in 2014, from about TD 55.9 million in 2010 (a 32 percent decline). Our analysis suggests
that many of these workers are from Tunisia’s poorer regions and thus these areas have been
adversely impacted by the fall in remittances.
xxii. Tunisia’s tourism sector has been greatly affected by the security crisis in both
Tunisia and the larger Middle East and North Africa region since the beginning of the Arab
Spring. In addition, conflict and constant security threats in Libya may have influenced
foreign tourists’ perception of neighboring Tunisia, thereby lowering Tunisia’s appeal as a
tourist destination. Tunisia’s tourism sector has been struggling since the beginning of the Arab
Spring. Between 2010 and 2015, foreign tourist arrivals dropped by 9.5 percent per year, compared
to an increase of 3.2 percent per year, on average, from 2000 to 2010. Similarly, night stays in
hotels and similar establishments have declined by 14.6 percent per year, on average, over the
2010–15 period, compared to an annual average growth rate near zero from 2000 to 2010. The two
terrorist attacks in Tunisia in 2015—at Tunis’ Bardo Museum in March and the tourist resort of
Port El Kantaoui in June—led to a sharp contraction in Tunisian tourism. Foreign tourist arrivals
(mostly European, but also Libyan and Algerian) and tourist night stays totaled only about 4.2
million people and 11.1 million nights in 2015, a decline of 31 and 55 percent, respectively, from
2014. The primary cause for this contraction was the decline in European arrivals, going from 2.8
million in 2014 to 1.3 million in 2015. To a lesser extent Libyan tourist arrivals also played a role.
8
As a consequence, Tunisia tourism receipts dropped by about 35 percent in this time frame. We do
not establish in this study any correlation between the Libyan crisis and Tunisia’s security situation.
However, we believe it is possible that security threats within Libya may have influenced foreign
tourists’ perception of Tunisia, thereby lowering Tunisia’s appeal as a tourist destination.
xxiii. Private investment in Tunisia also has been dramatically affected by the same
dynamics impacting Tunisia’s tourism sector. Private investment in Tunisia has dropped by 20
percent since 2010, driven by political instability, social tensions, and lower investor confidence in
the Tunisian market due to perceived regional security threats and social movements.
xxiv. The Tunisian government has increased defense and security spending in response to
domestic and regional security threats. Between 2011 and 2015, national defense and security
spending have almost doubled, going from TD 2.5 billion to TD 4.7 billion. In recent years, Tunisia
has increased its military and security staff and has intensified the frequency of border patrols. In
2015, Tunisia began constructing a 168-kilometer barrier along the Tunisia–Libya border to prevent
the incursion of militant and armed groups from Libya.
xxv. In chapter 4 we use a computable general equilibrium (CGE) model to assess the
aggregate consequences of the Libyan crisis for the Tunisian economy. Five effects of the
Libyan crisis are captured in the CGE model: (i) the effect of Libyans in Tunisia on household
consumption (drawing from the data on Libyans’ deposits in Tunisian banks and cash brought over
the border); (ii) the effect on remittances due to the return of Tunisian workers from Libya; (iii) the
effect of civil insecurity on private investment; (iv) the effect of domestic and regional security
threats on Tunisia’s tourism sector; and (v) the effect on the Tunisian government’s security
spending. The first challenge in this approach is the choice of a baseline scenario or counterfactual.
We make the assumption that Tunisia would have followed the growth and macroeconomic path
presented in the IMF 2010 Tunisia Article IV Consultation, but for the events that followed the
Arab Spring. The second challenge is that of separating effects of the Libyan crisis from effects
caused by the challenges faced by Tunisia as a result of its own revolution. Post-revolution
Tunisia’s internal dynamics also explain some of the deterioration in the domestic business climate,
domestic security, tourism appeal, and so forth.
xxvi. In our CGE model this translates into the difficulty of choosing specific parameters. What
portion of the decline in private investment can be attributed to the Libyan crisis? What percentage
of the decrease in tourism receipts and increase in government security spending can be accounted
for by the worsening regional security situation? The existing literature provides little evidence on
the magnitude of these impacts that also captures the specificities of Tunisia. Our preferred solution
to these challenges is to provide an estimate of the range of possible impact if these parameters are
chosen within a reasonable interval, and to summarize these in high, medium, and low case
scenarios. These hypotheses are summarized below.
Hypotheses Alternative Low Medium Case Alternative
High
Investment
(Share of the 25 percent decline
in investment attributed to the
Libyan crisis.)
2 percentage
points
4 percentage
points
6 percentage
points
Tourism
(Share of the decline in activity
attributed to the Libyan crisis—
12.5 percent 25 percent 37.5 percent
9
in 2015 only—zero in other
years.)
Government spending on
security and defense
(Share of the increase in
spending attributed to the
Libyan crisis.)
35 percent 50 percent 65 percent
xxvii. The main findings of the CGE model are summarized below:
We find that the Libyan crisis may have contributed 24 percent to the drop in
Tunisia’s growth over the five-year period from 2011–15 under the medium scenario. This amounts to a welfare loss of TD 8.8 billion over a five-year period, or about US$880
million per year (2 percent of 2015 GDP per year).
On the fiscal side, we estimate the cost of the Libyan crisis for Tunisia (increased
government security spending and lost tax revenues) at TD 5.8 billion over the five-
year period 2011–15, or US$580 million per year (6.3 percent of 2015 tax revenues
per year). Covering this cost through taxation would result in large tax increases, while
financing it with debt would increase the government’s financing needs by TD 7 billion
cumulatively over the five years (or 15 percent of the 2015 public debt-to-GDP ratio),
which includes TD 274 million in additional interest payments and TD 920 million in
additional debt amortization costs.
xxviii. Tunisia should confront, without delay, the challenges it faces that are associated with
the Libyan crisis in order to mitigate the ongoing negative effects of Libya’s turmoil on
Tunisia. Tunisia also should prepare now to seize the future opportunities presented by
Libya’s eventual reconstruction and economic recovery. The stabilization of Libya’s civil
security and political institutions, its economic recovery, and the reconstruction of the country’s
infrastructure will create many growth and economic opportunities for Tunisia. Indeed, Tunisia
enjoys many comparative advantages in trading with Libya, including a shared language and
proximity. To seize these opportunities, Tunisia should now—before these opportunities arise—
address the regulatory and infrastructure obstacles to trade and investment with Libya. The
Tunisian government should establish platforms for policy and business dialogue, and coordinate
with Libyan authorities on economic and security issues (see chapters 2 and 4). To prevent the
future reconstruction and recovery of Libya from further fueling the already large informal cross-
border markets (and the security and economic challenges associated with illicit trade), it is
important that the government of Tunisia adopt and implement as soon as possible a comprehensive
reform and action plan that tackles the root causes of this trade. This plan should include reforms
of administered prices and subsidies, state-owned enterprise reform, tax reform, and also regional
economic development (see chapter 3).
10
Chapter 1 Libyan Households in Tunisia: How Many and Who
are They?
A survey of Libyans residing temporarily (less than six months) and permanently (six months or
more) in Tunisia was conducted to determine their number and socio-economic status. In February
2016 there were an estimated 12,783 Libyans (5,571 temporary residents and 7,212 permanent
residents) living in Tunisia. These residents are mostly middle class with a high living standard. In
fact, 93 percent of these residents live in modern housing (villas or apartments), and 16.5 percent
are homeowners. More than 92 percent of Libyan households own a plasma screen television; more
than 50 percent own a computer, compared to 33 percent of Tunisian households. Forty-two
percent of Libyan households in Tunisia have an Internet connection compared to 29 percent for
their Tunisian counterparts. A Libyan household of 2.7 members spends on average 14,850
Tunisian dinars (TD) per person per year. This number is three times more than the expenses of
households in urban Tunisia. Only 3 percent of Libyans live in poverty. As of 2016, the poverty line
in urban areas was TD 1,600 per person per year. While Libyan households are generally resilient
to shocks experienced in the past years, they are vulnerable to economic shocks—loss of
employment and increasing debts; personal shocks—illness, the death of family members; and
covariate shocks—social conflicts and a lack of security. More than 90 percent of Libyan
households living in Tunisia report being satisfied or very satisfied with their life compared to 79
percent who were satisfied or very satisfied when they still lived in Libya. One-third of households
report a desire to return to Libya to reunite with their families once the crisis there has subsided;
another third are inclined to stay in Tunisia; and the last third is indecisive.
1.1. The official Tunisian 2014 census estimates that there are 877 permanent Libyan
residents in Tunisia; this number refers to Libyan citizens that live in Tunisia, or intend to stay
for a minimum of six months. These numbers, however, might be a dramatic underestimate of the
actual number of Libyans living in Tunisia, due to Libyans interviewed for the census
underreporting their lengths of stay. In fact, border patrol statistics on entry and exit of Libyans
suggest higher numbers. In 2014, the number of entries surpassed the number of exits by 400,000
(1.8 million entries compared to 1.4 million exits). Nonetheless, these statistics do not account for
the residence status of the Libyans that cross the Tunisian border, nor do they account for whether
these crossings are done by the same person. Furthermore, statistics on Libyans exiting Tunisia are
not as well, nor as systematically recorded, as entries.
1.2. Other sources indicate that a majority of Libyans enter Tunisia for short-term visits,
particularly for tourism and medical tourism. The Tunisian National Office of Tourism (Office
National de Tourisme Tunisien; ONTT) estimates that 1.75 million non-resident Libyans spend at
least one night in the country regardless of the purpose of stay (and are thus still considered
tourists). Among them, about 400,000 reserve a hotel room, with an average stay of 2.5 nights. The
National Chamber of Private Clinics (Chambre Nationale des Clinique Privées; CNCP) estimates
that about 320,000 Libyan patients are treated every year in Tunisian private clinics.
1.3. This chapter analyzes the results of a survey of Libyan households living in Tunisia
conducted in February 2016 by the National Institute of Statistics (Institut National de la
11
Statistique; INS) in collaboration with the World Bank. The main objectives are: i) to estimate the
number of temporary (less than six months) and permanent (six months or more) Libyan residents
in Tunisia, and ii) to establish a profile of the socio-economic characteristics of this population.
1.4. The chapter is organized as follows. Section 1 describes the objectives of the investigation
and methodology. Section 2 estimates the number of Libyans living in Tunisia (temporary and
permanent) and their demographic characteristics. Section 3 analyzes the living conditions of
Libyan households in Tunisia and provides an estimate of their poverty level. Section 4 analyzes
the shocks to Libyan households, and those households’ adaptations and resilience in response to
shocks. Section 5 discusses the migratory decisions of Libyan households—in particular their
preference to either return to Libya or remain permanently in Tunisia.
Objectives
1.5. The objectives of the investigation are: (i) to estimate the number of short-term (less than
six months) and long-term (six months or more) Libyan residents in Tunisia; ii) to study the socio-
economic characteristics and living conditions of these households; iii) to analyze their standard of
living and poverty level; iv) to study their coping strategies, vulnerability, or resilience to potential
economic, idiosyncratic, and covariate shocks; and v) to study their personal migration histories
and decisions.
Sample size and sampling rate
1.6. The Tunisian 2014 General Census of the Population (Recensement General de la
Population; RGPH) shows that long-term Libyan residents in Tunisia are unequally distributed in
1,507 out of 37,991 total districts (enumeration areas). Therefore, the investigation was conducted
on a sample of 290 primary districts of a little over 21,000 households (Tunisian, Libyan, and other
nationalities), based on the following sampling:
The first stratum consists of districts where there were no long-term Libyan residents as per the
RGPH 2014 (36,484 districts). A sample of 50 districts was randomly selected with a sampling
rate of 0.14 percent.
The second stratum includes RGPH 2014 districts with a very low number of Libyan residents
(between one and three) in April 2014. There are 1,108 districts in this stratum. We draw a
sample of 62 districts in this second stratum, with a survey rate of 5.4 percent.
The third stratum is composed of RGPH 2014 districts with a low number of Libyan residents
(between four and eight) in April 2014. There are 272 districts with between four and eight
Libyans. We draw a sample of 90 districts in this stratum, with a sampling rate of 33.3 percent.
The fourth stratum includes RGPH 2014 districts with a relatively high number of Libyan
residents (between nine and 16) in April 2014. There are 89 districts with in this stratum. We
draw a sample of 45 districts, with a sampling rate of 50 percent.
The fifth stratum includes the remaining RGPH 2014 districts, which contain 17 or more
Libyan residents. There are 43 districts in this stratum, which are all included in the sample.
12
Table 1.1 Number of Sample Districts and Sampling Rate by Stratum
Strata Number of
Libyan residents
in 2014
Total number
of districts
Number of
sample districts
Sampling
rate
Number of sample
households
(approximation)
1 0 36,479 50 0.14 % 3,565
2 1 to 3 1,108 62 5.4 % 4,400
3 4 to 8 272 90 33.3 % 6,570
4 9 to 16 89 45 50 % 3,350
5 17 and more 43 43 100 % 3,210
Tunisia Total 37,991 290 0.75 % 21,095
Source: Authors’ calculations based on the 2014 RGPH Census.
As of February 2016, the number of Libyans in Tunisia was 12,783—composed of 7,212
long-term residents and 5,571 short-term residents and visitors
1.7. A sample of over 70,000 individuals (Libyan, Tunisian, and other nationalities) was
selected from the data collection process. About 2,415 Libyans were identified; among them 2,070
(86 percent) agreed to be interviewed. Statistical extrapolations estimate that there are 4,019
Libyan and Libyan–Tunisian households (mixed households) in Tunisia. The average household
size is 2.72, while 72 percent of the sample has a household size of four or less. As of February
2016, we estimate the number of Libyans in Tunisia to be 12,783; 7,212 (56.42 percent) of them
are long-term residents and the remaining 5,571 (43.58 percent) are short-term residents and
visitors. Fifty-nine percent of all Libyans in Tunisia are male and 41 percent are female.
More than one-quarter of the Libyan population in Tunisia is age 15 years and older; two-
thirds is less than 40 years old.
1.8. Children younger than 15 years old make up 26 percent of all Libyans in Tunisia. This rate is
33.4 percent for girls compared to only 20.8 percent for boys in the same age group. Among those older
than 60, we find relatively more women (9 percent) than men (7.7 percent). However, among the
working age population (15–59 years), there are relatively more men (72.4 percent) than women (57.6
percent).
13
Figure 1.1 Distribution of Libyans in Tunisia by Age Group and Gender
Source: Authors’ calculations based on the Survey of Libyan Households in Tunisia (SLHT).
Table 1.2 Distribution of Libyans in Tunisia by Age Group and Gender
Age group Men Women All
Number Percentage Number Percentage Total Percentage
0 – 4 years 495 6.7 % 439 8.5 % 934 7.5 %
5 – 14 years 1037 14.1 % 1282 24.9 % 2319 18.5 %
15 – 24 years 1045 14.2 % 679 13.2 % 1724 13.8 %
25 – 39 years 2413 32.8 % 1215 23.5 % 3628 29.0 %
40 – 59 years 1866 25.4 % 1076 20.9 % 2942 23.5 %
60 years and more 498 6.8 % 463 9.0 % 961 7.7 %
Missing 146 - 130 - 276 -
Total 7500 100.0 % 5284 100.0 % 12784 100.0 %
Source: Authors’ calculations based on the SLHT.
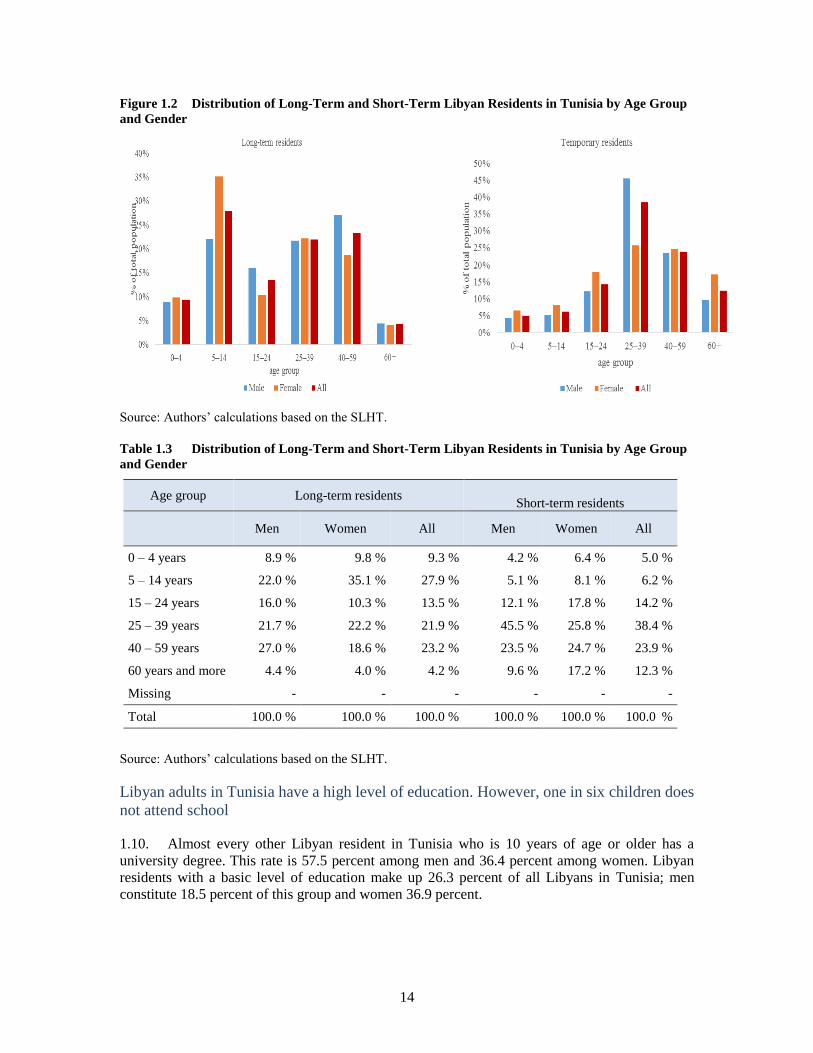
1.9. Nonetheless, the analysis shows that long-term residents younger than 15 years old make
up 37.2 percent of all Libyans, while children in the same age group make up only 11.2 percent of
all short-term residents. However, among those older than 60, there are fewer long-term
residents (4.2 percent) compared to short-term residents (12.3 percent). This latter rate reaches 17.3
percent for Libyan women in Tunisia on a temporary basis.
14
Figure 1.2 Distribution of Long-Term and Short-Term Libyan Residents in Tunisia by Age Group
and Gender
Source: Authors’ calculations based on the SLHT.
Table 1.3 Distribution of Long-Term and Short-Term Libyan Residents in Tunisia by Age Group
and Gender
Age group Long-term residents
Short-term residents
Men Women All Men Women All
0 – 4 years 8.9 % 9.8 % 9.3 % 4.2 % 6.4 % 5.0 %
5 – 14 years 22.0 % 35.1 % 27.9 % 5.1 % 8.1 % 6.2 %
15 – 24 years 16.0 % 10.3 % 13.5 % 12.1 % 17.8 % 14.2 %
25 – 39 years 21.7 % 22.2 % 21.9 % 45.5 % 25.8 % 38.4 %
40 – 59 years 27.0 % 18.6 % 23.2 % 23.5 % 24.7 % 23.9 %
60 years and more 4.4 % 4.0 % 4.2 % 9.6 % 17.2 % 12.3 %
Missing - - - - - -
Total 100.0 % 100.0 % 100.0 % 100.0 % 100.0 % 100.0 %
Source: Authors’ calculations based on the SLHT.
Libyan adults in Tunisia have a high level of education. However, one in six children does
not attend school
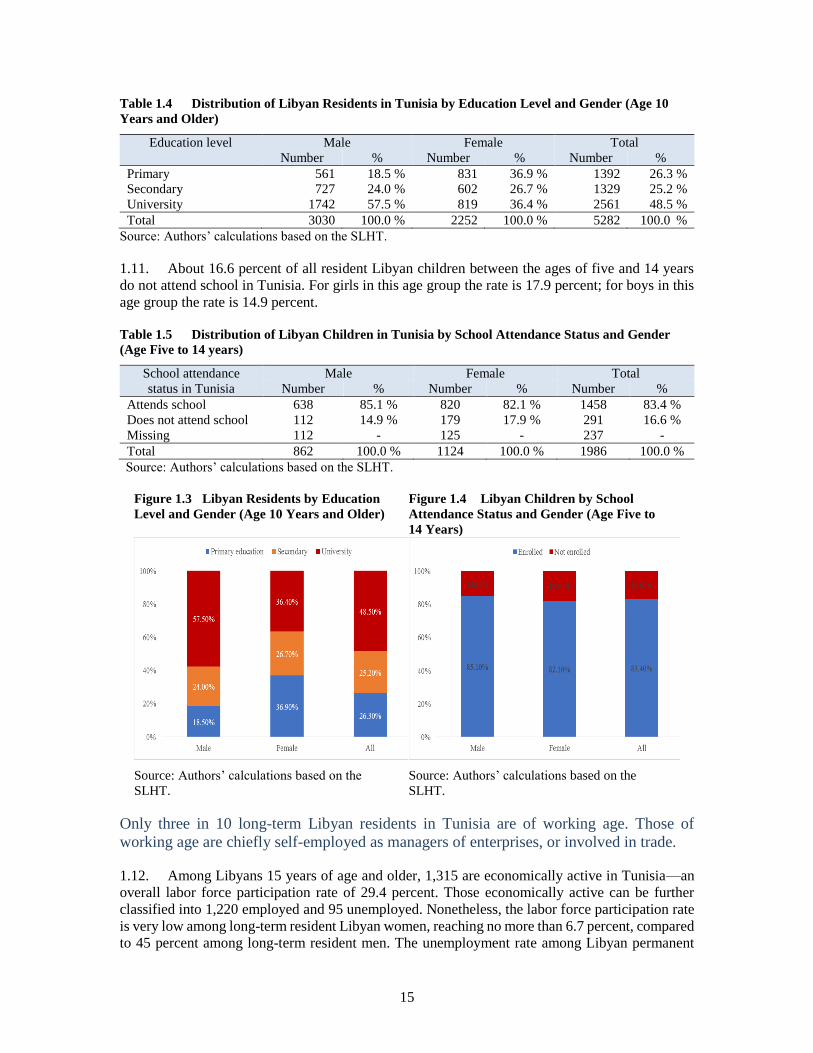
1.10. Almost every other Libyan resident in Tunisia who is 10 years of age or older has a
university degree. This rate is 57.5 percent among men and 36.4 percent among women. Libyan
residents with a basic level of education make up 26.3 percent of all Libyans in Tunisia; men
constitute 18.5 percent of this group and women 36.9 percent.
15
Table 1.4 Distribution of Libyan Residents in Tunisia by Education Level and Gender (Age 10
Years and Older)
Education level Male Female Total
Number % Number % Number %
Primary 561 18.5 % 831 36.9 % 1392 26.3 %
Secondary 727 24.0 % 602 26.7 % 1329 25.2 %
University 1742 57.5 % 819 36.4 % 2561 48.5 %
Total 3030 100.0 % 2252 100.0 % 5282 100.0 %
Source: Authors’ calculations based on the SLHT.
1.11. About 16.6 percent of all resident Libyan children between the ages of five and 14 years
do not attend school in Tunisia. For girls in this age group the rate is 17.9 percent; for boys in this
age group the rate is 14.9 percent. Table 1.5 Distribution of Libyan Children in Tunisia by School Attendance Status and Gender
(Age Five to 14 years)
School attendance
status in Tunisia
Male Female Total
Number % Number % Number %
Attends school 638 85.1 % 820 82.1 % 1458 83.4 %
Does not attend school 112 14.9 % 179 17.9 % 291 16.6 %
Missing 112 - 125 - 237 -
Total 862 100.0 % 1124 100.0 % 1986 100.0 %
Source: Authors’ calculations based on the SLHT.
Figure 1.3 Libyan Residents by Education
Level and Gender (Age 10 Years and Older) Figure 1.4 Libyan Children by School
Attendance Status and Gender (Age Five to
14 Years)
Source: Authors’ calculations based on the
SLHT. Source: Authors’ calculations based on the
SLHT.
Only three in 10 long-term Libyan residents in Tunisia are of working age. Those of
working age are chiefly self-employed as managers of enterprises, or involved in trade.
1.12. Among Libyans 15 years of age and older, 1,315 are economically active in Tunisia—an
overall labor force participation rate of 29.4 percent. Those economically active can be further
classified into 1,220 employed and 95 unemployed. Nonetheless, the labor force participation rate
is very low among long-term resident Libyan women, reaching no more than 6.7 percent, compared
to 45 percent among long-term resident men. The unemployment rate among Libyan permanent
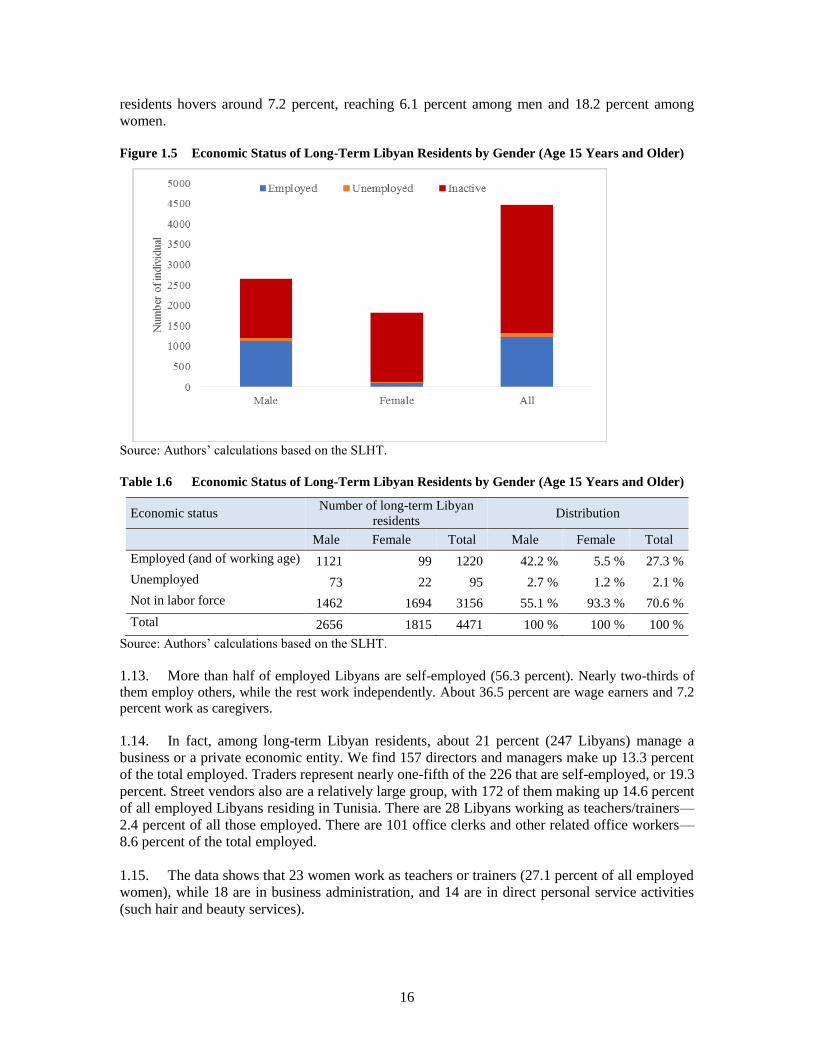
16
residents hovers around 7.2 percent, reaching 6.1 percent among men and 18.2 percent among
women. Figure 1.5 Economic Status of Long-Term Libyan Residents by Gender (Age 15 Years and Older)
Source: Authors’ calculations based on the SLHT.
Table 1.6 Economic Status of Long-Term Libyan Residents by Gender (Age 15 Years and Older)
Economic status Number of long-term Libyan
residents Distribution
Male Female Total Male Female Total
Employed (and of working age) 1121 99 1220 42.2 % 5.5 % 27.3 %
Unemployed 73 22 95 2.7 % 1.2 % 2.1 %
Not in labor force 1462 1694 3156 55.1 % 93.3 % 70.6 %
Total 2656 1815 4471 100 % 100 % 100 %
Source: Authors’ calculations based on the SLHT.
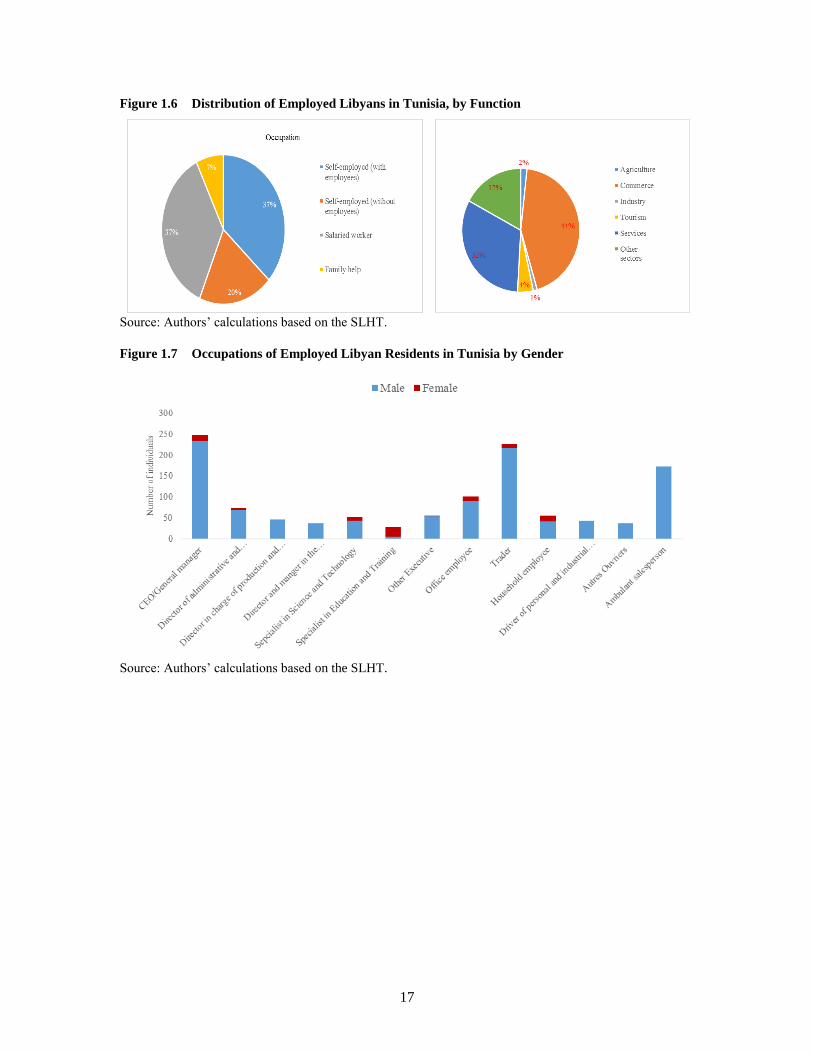
1.13. More than half of employed Libyans are self-employed (56.3 percent). Nearly two-thirds of
them employ others, while the rest work independently. About 36.5 percent are wage earners and 7.2
percent work as caregivers.
1.14. In fact, among long-term Libyan residents, about 21 percent (247 Libyans) manage a
business or a private economic entity. We find 157 directors and managers make up 13.3 percent
of the total employed. Traders represent nearly one-fifth of the 226 that are self-employed, or 19.3
percent. Street vendors also are a relatively large group, with 172 of them making up 14.6 percent
of all employed Libyans residing in Tunisia. There are 28 Libyans working as teachers/trainers—
2.4 percent of all those employed. There are 101 office clerks and other related office workers—
8.6 percent of the total employed.
1.15. The data shows that 23 women work as teachers or trainers (27.1 percent of all employed
women), while 18 are in business administration, and 14 are in direct personal service activities
(such hair and beauty services).
17
Figure 1.6 Distribution of Employed Libyans in Tunisia, by Function
Source: Authors’ calculations based on the SLHT.
Figure 1.7 Occupations of Employed Libyan Residents in Tunisia by Gender
Source: Authors’ calculations based on the SLHT.
18
Table 1.7 Occupations of Employed Libyan Residents in Tunisia by Gender
Types of occupations Sex
Men Women Total
Chief Executives of private entities 233 14 247
Directors of Administration and Trade of private entities 69 4 73
Directors and Senior Managers of Production and
Specialized Services of private entities 47 0 47
Directors and Managers of Restaurants, Hotels, Trade and
other Services 37 0 37
Scientists and Technical Specialists 43 9 52
Education and Training Specialists 5 23 28
Other Executives 54 1 55
Office workers 90 11 101
Traders and vendors 217 9 226
Service Personnel 42 14 56
Vehicle and Machine Operators 43 0 43
Other workers 37 0 37
Street Vendors 172 0 172
Total 1089 85 1174
Source: Authors’ calculations based on the SLHT.
Libyan households live in modern housing located near basic services
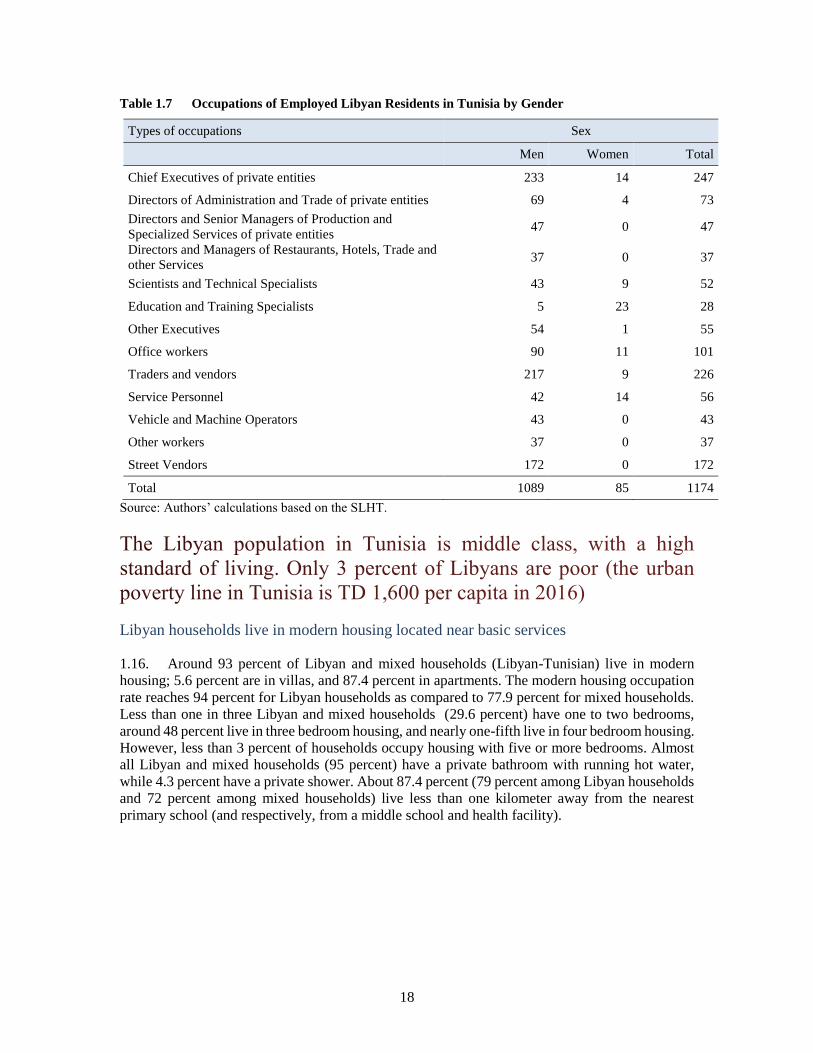
1.16. Around 93 percent of Libyan and mixed households (Libyan-Tunisian) live in modern
housing; 5.6 percent are in villas, and 87.4 percent in apartments. The modern housing occupation
rate reaches 94 percent for Libyan households as compared to 77.9 percent for mixed households.
Less than one in three Libyan and mixed households (29.6 percent) have one to two bedrooms,
around 48 percent live in three bedroom housing, and nearly one-fifth live in four bedroom housing.
However, less than 3 percent of households occupy housing with five or more bedrooms. Almost
all Libyan and mixed households (95 percent) have a private bathroom with running hot water,
while 4.3 percent have a private shower. About 87.4 percent (79 percent among Libyan households
and 72 percent among mixed households) live less than one kilometer away from the nearest
primary school (and respectively, from a middle school and health facility).
19
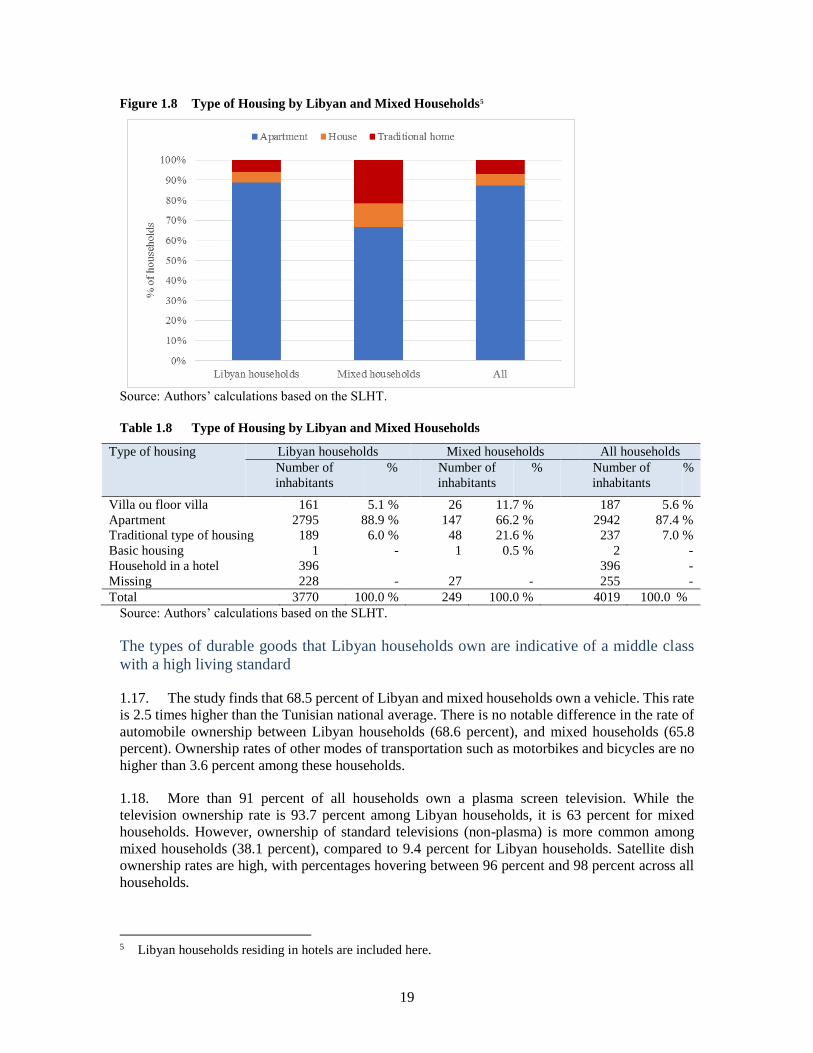
Figure 1.8 Type of Housing by Libyan and Mixed Households5
Source: Authors’ calculations based on the SLHT.
Table 1.8 Type of Housing by Libyan and Mixed Households
Type of housing Libyan households Mixed households All households
Number of
inhabitants
% Number of
inhabitants
% Number of
inhabitants
%
Villa ou floor villa 161 5.1 % 26 11.7 % 187 5.6 %
Apartment 2795 88.9 % 147 66.2 % 2942 87.4 %
Traditional type of housing 189 6.0 % 48 21.6 % 237 7.0 %
Basic housing 1 - 1 0.5 % 2 -
Household in a hotel 396 396 -
Missing 228 - 27 - 255 -
Total 3770 100.0 % 249 100.0 % 4019 100.0 %
Source: Authors’ calculations based on the SLHT.
The types of durable goods that Libyan households own are indicative of a middle class
with a high living standard
1.17. The study finds that 68.5 percent of Libyan and mixed households own a vehicle. This rate
is 2.5 times higher than the Tunisian national average. There is no notable difference in the rate of
automobile ownership between Libyan households (68.6 percent), and mixed households (65.8
percent). Ownership rates of other modes of transportation such as motorbikes and bicycles are no
higher than 3.6 percent among these households.
1.18. More than 91 percent of all households own a plasma screen television. While the
television ownership rate is 93.7 percent among Libyan households, it is 63 percent for mixed
households. However, ownership of standard televisions (non-plasma) is more common among
mixed households (38.1 percent), compared to 9.4 percent for Libyan households. Satellite dish
ownership rates are high, with percentages hovering between 96 percent and 98 percent across all
households.
5 Libyan households residing in hotels are included here.
20
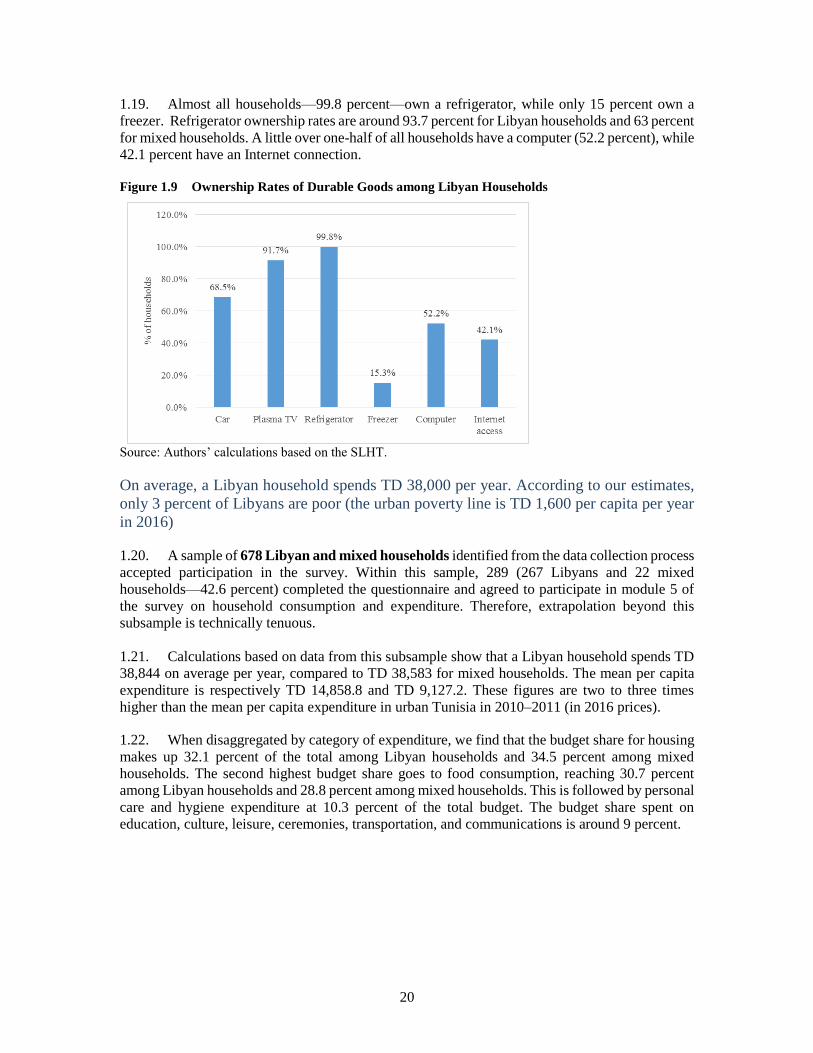
1.19. Almost all households—99.8 percent—own a refrigerator, while only 15 percent own a
freezer. Refrigerator ownership rates are around 93.7 percent for Libyan households and 63 percent
for mixed households. A little over one-half of all households have a computer (52.2 percent), while
42.1 percent have an Internet connection. Figure 1.9 Ownership Rates of Durable Goods among Libyan Households
Source: Authors’ calculations based on the SLHT.
On average, a Libyan household spends TD 38,000 per year. According to our estimates,
only 3 percent of Libyans are poor (the urban poverty line is TD 1,600 per capita per year
in 2016)
1.20. A sample of 678 Libyan and mixed households identified from the data collection process
accepted participation in the survey. Within this sample, 289 (267 Libyans and 22 mixed
households—42.6 percent) completed the questionnaire and agreed to participate in module 5 of
the survey on household consumption and expenditure. Therefore, extrapolation beyond this
subsample is technically tenuous.
1.21. Calculations based on data from this subsample show that a Libyan household spends TD
38,844 on average per year, compared to TD 38,583 for mixed households. The mean per capita
expenditure is respectively TD 14,858.8 and TD 9,127.2. These figures are two to three times
higher than the mean per capita expenditure in urban Tunisia in 2010–2011 (in 2016 prices).
1.22. When disaggregated by category of expenditure, we find that the budget share for housing
makes up 32.1 percent of the total among Libyan households and 34.5 percent among mixed
households. The second highest budget share goes to food consumption, reaching 30.7 percent
among Libyan households and 28.8 percent among mixed households. This is followed by personal
care and hygiene expenditure at 10.3 percent of the total budget. The budget share spent on
education, culture, leisure, ceremonies, transportation, and communications is around 9 percent.

21
Table 1.9 Expenditure Breakdown and Budget Shares among Libyan Households
Spending category
Libyan Household Mixed Households
Per capita
expenditure, per
annum (in
dinars)
Budget share
(in %)
Per capita
expenditure,
per annum (in
dinars)
Budget share
(in %)
Food consumption 4,555.4 30.7 % 2,629.3 28.8 %
Housing 4,772.5 32.1 % 3,151.4 34.5 %
Clothing 516.3 3.5 % 382.8 4.2 %
Personal care and hygiene 1,533.8 10.3 % 957.0 10.5 %
Transportation and
Communication 1,313.0 8.8 % 728.0 8.0 %
Education, culture and leisure 1,430.4 9.6 % 809.0 8.9 %
Other expenditures 737.4 5.0 % 469.7 5.1%
Total 14,858.8 100.0 % 9,127.2 100.0 %
Source: Authors’ calculations based on the SLHT
1.23. The breakdown of the Libyan population in Tunisia by groups based on spending
categories per person per year suggests that 3.4 percent of households live with less than TD 1,600
per person per year. Using February 2016 prices, this rate is a reassessment of the poverty line that
was calculated during the 2010–11 surveys on household consumption and expenditure, which was
then estimated at around TD 1,200 per person per year. We conclude that 3.4 percent of Libyans
living in Tunisia are below the poverty line. When we consider all households, Libyan and mixed
households, this rate hovers at around 3 percent, which is five times lower than the rate for
Tunisia (15.5 percent) in 2010–11.
1.24. Analysis of the expenditure distribution of Libyan households shows that 21.6 percent of
them spend more than TD 20,000 per year, with 9.3 percent spending twice that amount, or TD
40,000 per year. Figure 1.10 Per Capita Expenditure Per Annum for Libyan and Mixed Households (TD)
Source: Authors’ calculations based on the SLHT.
22
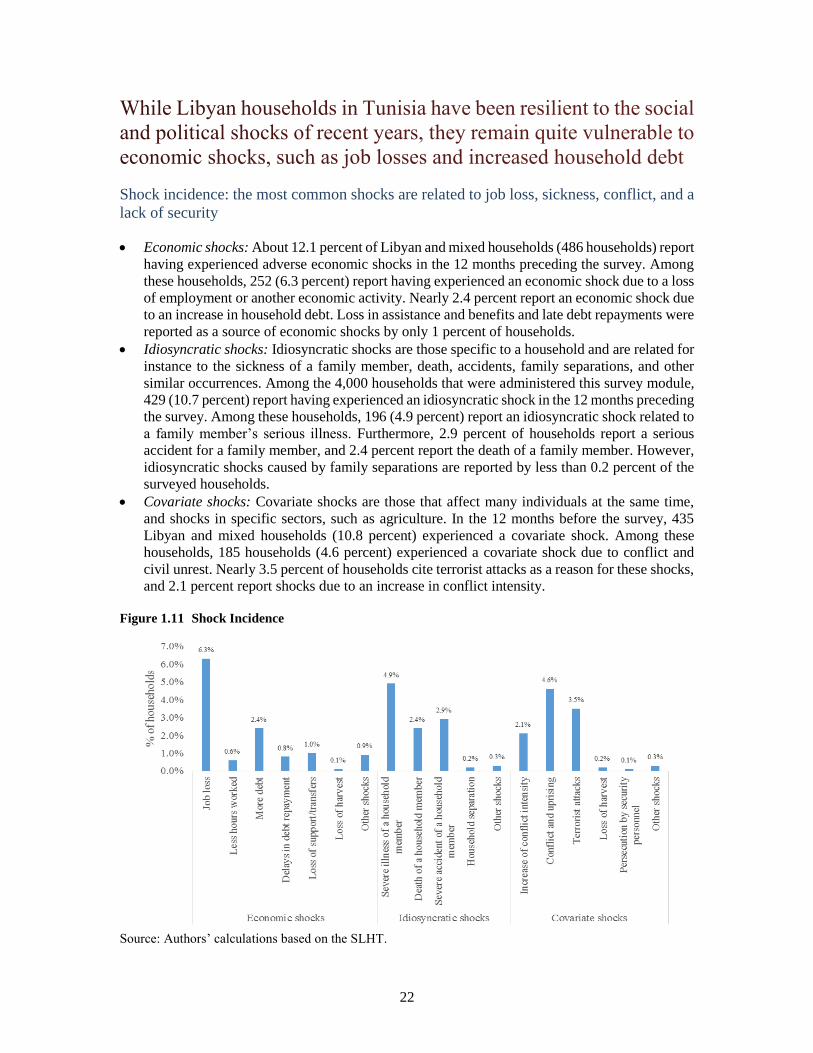
Shock incidence: the most common shocks are related to job loss, sickness, conflict, and a
lack of security
Economic shocks: About 12.1 percent of Libyan and mixed households (486 households) report
having experienced adverse economic shocks in the 12 months preceding the survey. Among
these households, 252 (6.3 percent) report having experienced an economic shock due to a loss
of employment or another economic activity. Nearly 2.4 percent report an economic shock due
to an increase in household debt. Loss in assistance and benefits and late debt repayments were
reported as a source of economic shocks by only 1 percent of households.
Idiosyncratic shocks: Idiosyncratic shocks are those specific to a household and are related for
instance to the sickness of a family member, death, accidents, family separations, and other
similar occurrences. Among the 4,000 households that were administered this survey module,
429 (10.7 percent) report having experienced an idiosyncratic shock in the 12 months preceding
the survey. Among these households, 196 (4.9 percent) report an idiosyncratic shock related to
a family member’s serious illness. Furthermore, 2.9 percent of households report a serious
accident for a family member, and 2.4 percent report the death of a family member. However,
idiosyncratic shocks caused by family separations are reported by less than 0.2 percent of the
surveyed households.
Covariate shocks: Covariate shocks are those that affect many individuals at the same time,
and shocks in specific sectors, such as agriculture. In the 12 months before the survey, 435
Libyan and mixed households (10.8 percent) experienced a covariate shock. Among these
households, 185 households (4.6 percent) experienced a covariate shock due to conflict and
civil unrest. Nearly 3.5 percent of households cite terrorist attacks as a reason for these shocks,
and 2.1 percent report shocks due to an increase in conflict intensity. Figure 1.11 Shock Incidence
Source: Authors’ calculations based on the SLHT.

23
Table 1.10 Shock Incidence
List of shocks
Number of
households that
experienced a
shock
Percentage of all
households %
A. Economic shocks
Loss of employment or economic activity 252 6.3
Involuntary reduction in work hours 23 0.6
Increase in debts 96 2.4
Late debt repayment 32 0.8
Loss of assistance/coverage/benefits 40 1.0
Loss of crop 6 0.1
Other shocks 37 0.9
Total 486 12.1
B. Idiosyncratic shocks
Serious illness of a family member 196 4.9
Death of a family member 97 2.4
Serious accident of a family member 115 2.9
Family separation 7 0.2
Other shocks 14 0.3
Total 429 10.7
C. Covariate shocks
Increased conflict intensity 86 2.1
Conflicts and civil unrests 185 4.6
Terrorist attacks 139 3.5
Loss of crop 7 0.2
Policy persecution 4 0.1
Other shocks 14 0.3
Total 435 10.8
Source: Authors’ calculations based on the SLHT
Adaptation and coping strategies: households adapt to economic shocks by reducing their
consumption and savings and are thus able to absorb other shocks without major changes
to their consumption, savings, or labor supply
Economic shocks: Households that have experienced shocks rely on different coping strategies.
Among the 486 households that report a shock, 258 (53 percent) changed their spending and
consumption behavior to buffer the impact of the shock. Moreover, 128 households (26
percent) reviewed their savings behavior, and 61 households (12.6 percent) made amendments
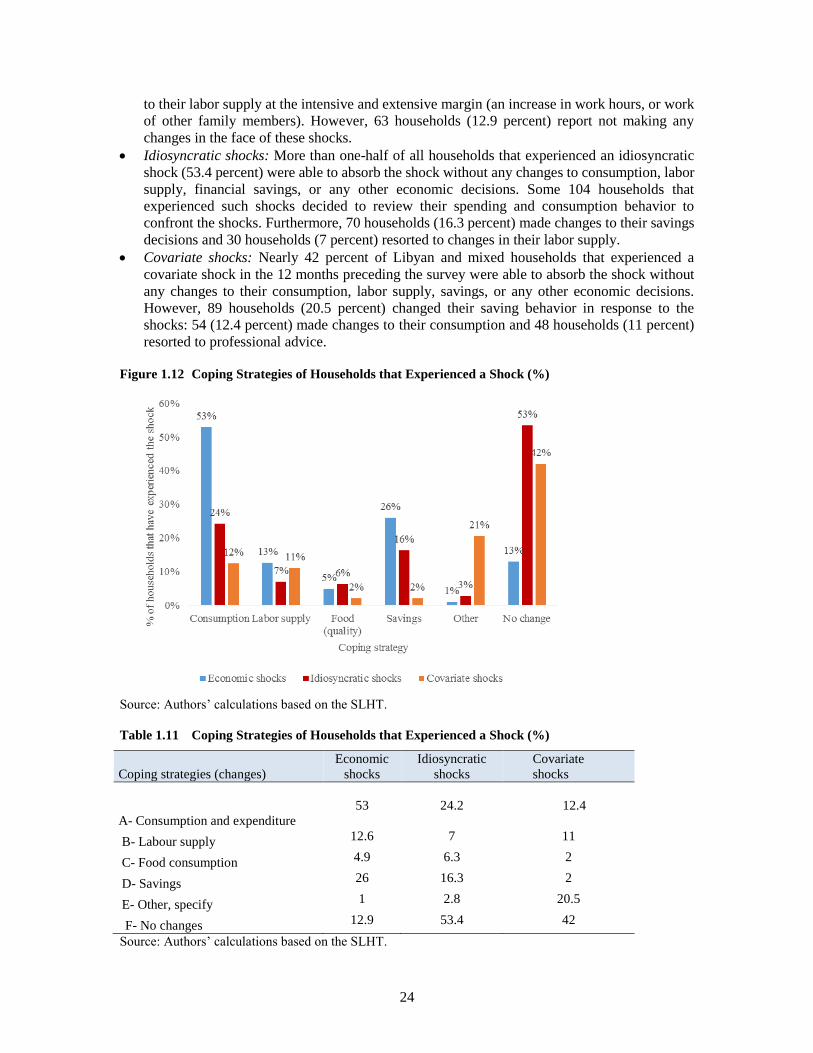
24
to their labor supply at the intensive and extensive margin (an increase in work hours, or work
of other family members). However, 63 households (12.9 percent) report not making any
changes in the face of these shocks.
Idiosyncratic shocks: More than one-half of all households that experienced an idiosyncratic
shock (53.4 percent) were able to absorb the shock without any changes to consumption, labor
supply, financial savings, or any other economic decisions. Some 104 households that
experienced such shocks decided to review their spending and consumption behavior to
confront the shocks. Furthermore, 70 households (16.3 percent) made changes to their savings
decisions and 30 households (7 percent) resorted to changes in their labor supply.
Covariate shocks: Nearly 42 percent of Libyan and mixed households that experienced a
covariate shock in the 12 months preceding the survey were able to absorb the shock without
any changes to their consumption, labor supply, savings, or any other economic decisions.
However, 89 households (20.5 percent) changed their saving behavior in response to the
shocks: 54 (12.4 percent) made changes to their consumption and 48 households (11 percent)
resorted to professional advice. Figure 1.12 Coping Strategies of Households that Experienced a Shock (%)
Source: Authors’ calculations based on the SLHT.
Table 1.11 Coping Strategies of Households that Experienced a Shock (%)
Coping strategies (changes)
Economic
shocks
Idiosyncratic
shocks
Covariate
shocks
A- Consumption and expenditure
53
24.2
12.4
B- Labour supply 12.6 7 11
C- Food consumption 4.9 6.3 2
D- Savings 26 16.3 2
E- Other, specify 1 2.8 20.5
F- No changes 12.9 53.4 42
Source: Authors’ calculations based on the SLHT.
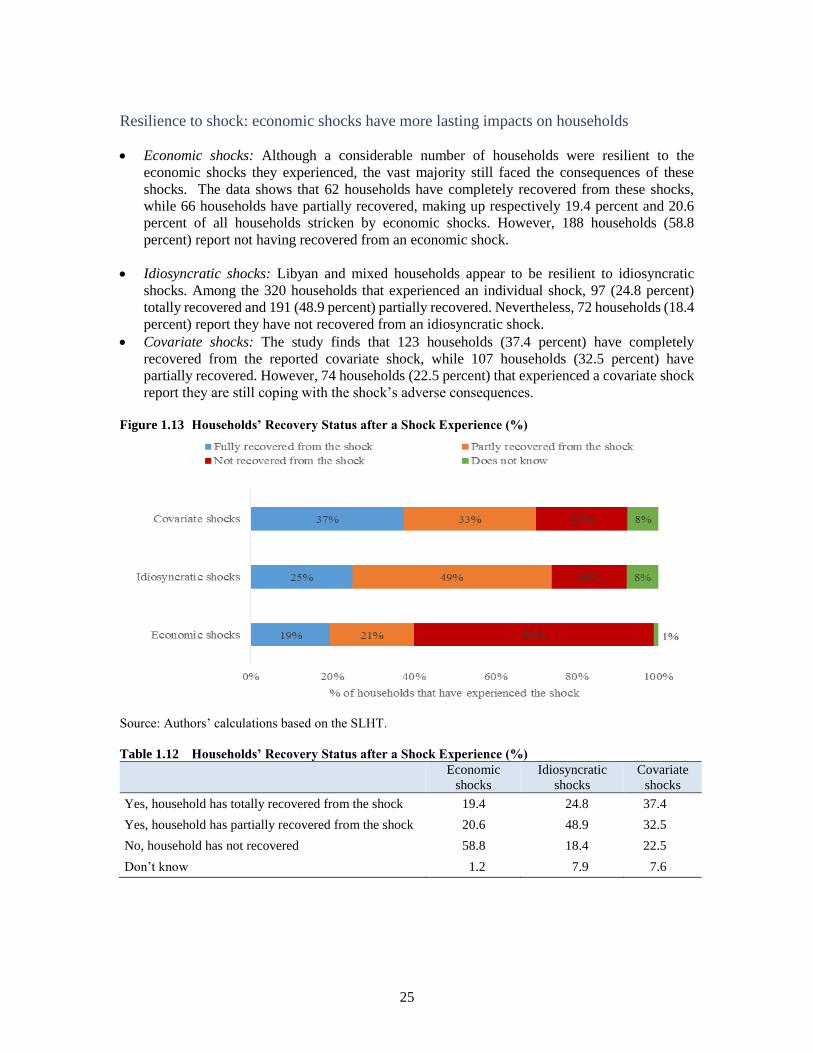
25
Resilience to shock: economic shocks have more lasting impacts on households
Economic shocks: Although a considerable number of households were resilient to the
economic shocks they experienced, the vast majority still faced the consequences of these
shocks. The data shows that 62 households have completely recovered from these shocks,
while 66 households have partially recovered, making up respectively 19.4 percent and 20.6
percent of all households stricken by economic shocks. However, 188 households (58.8
percent) report not having recovered from an economic shock.
Idiosyncratic shocks: Libyan and mixed households appear to be resilient to idiosyncratic
shocks. Among the 320 households that experienced an individual shock, 97 (24.8 percent)
totally recovered and 191 (48.9 percent) partially recovered. Nevertheless, 72 households (18.4
percent) report they have not recovered from an idiosyncratic shock.
Covariate shocks: The study finds that 123 households (37.4 percent) have completely
recovered from the reported covariate shock, while 107 households (32.5 percent) have
partially recovered. However, 74 households (22.5 percent) that experienced a covariate shock
report they are still coping with the shock’s adverse consequences. Figure 1.13 Households’ Recovery Status after a Shock Experience (%)
Source: Authors’ calculations based on the SLHT.
Table 1.12 Households’ Recovery Status after a Shock Experience (%)
Economic
shocks
Idiosyncratic
shocks
Covariate
shocks
Yes, household has totally recovered from the shock 19.4 24.8 37.4
Yes, household has partially recovered from the shock 20.6 48.9 32.5
No, household has not recovered 58.8 18.4 22.5
Don’t know 1.2 7.9 7.6
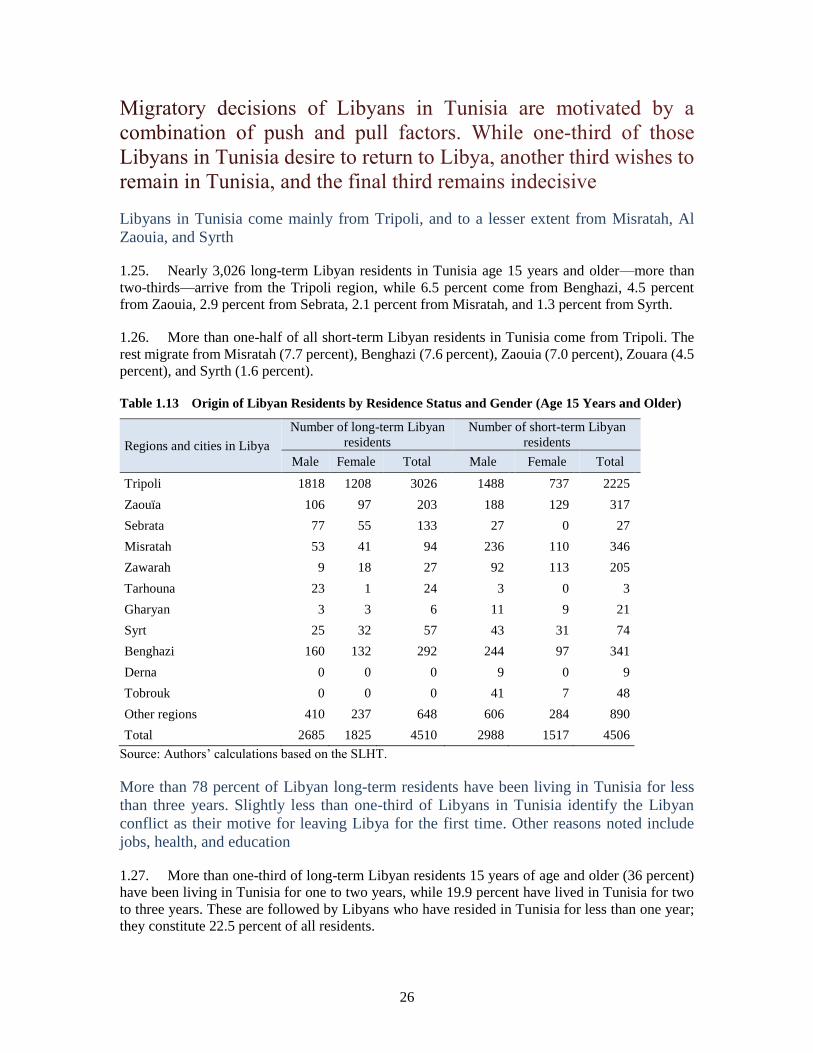
26
Libyans in Tunisia come mainly from Tripoli, and to a lesser extent from Misratah, Al
Zaouia, and Syrth
1.25. Nearly 3,026 long-term Libyan residents in Tunisia age 15 years and older—more than
two-thirds—arrive from the Tripoli region, while 6.5 percent come from Benghazi, 4.5 percent
from Zaouia, 2.9 percent from Sebrata, 2.1 percent from Misratah, and 1.3 percent from Syrth.
1.26. More than one-half of all short-term Libyan residents in Tunisia come from Tripoli. The
rest migrate from Misratah (7.7 percent), Benghazi (7.6 percent), Zaouia (7.0 percent), Zouara (4.5
percent), and Syrth (1.6 percent). Table 1.13 Origin of Libyan Residents by Residence Status and Gender (Age 15 Years and Older)
Regions and cities in Libya
Number of long-term Libyan
residents
Number of short-term Libyan
residents
Male Female Total Male Female Total
Tripoli 1818 1208 3026 1488 737 2225
Zaouïa 106 97 203 188 129 317
Sebrata 77 55 133 27 0 27
Misratah 53 41 94 236 110 346
Zawarah 9 18 27 92 113 205
Tarhouna 23 1 24 3 0 3
Gharyan 3 3 6 11 9 21
Syrt 25 32 57 43 31 74
Benghazi 160 132 292 244 97 341
Derna 0 0 0 9 0 9
Tobrouk 0 0 0 41 7 48
Other regions 410 237 648 606 284 890
Total 2685 1825 4510 2988 1517 4506
Source: Authors’ calculations based on the SLHT.
More than 78 percent of Libyan long-term residents have been living in Tunisia for less
than three years. Slightly less than one-third of Libyans in Tunisia identify the Libyan
conflict as their motive for leaving Libya for the first time. Other reasons noted include
jobs, health, and education
1.27. More than one-third of long-term Libyan residents 15 years of age and older (36 percent)
have been living in Tunisia for one to two years, while 19.9 percent have lived in Tunisia for two
to three years. These are followed by Libyans who have resided in Tunisia for less than one year;
they constitute 22.5 percent of all residents.
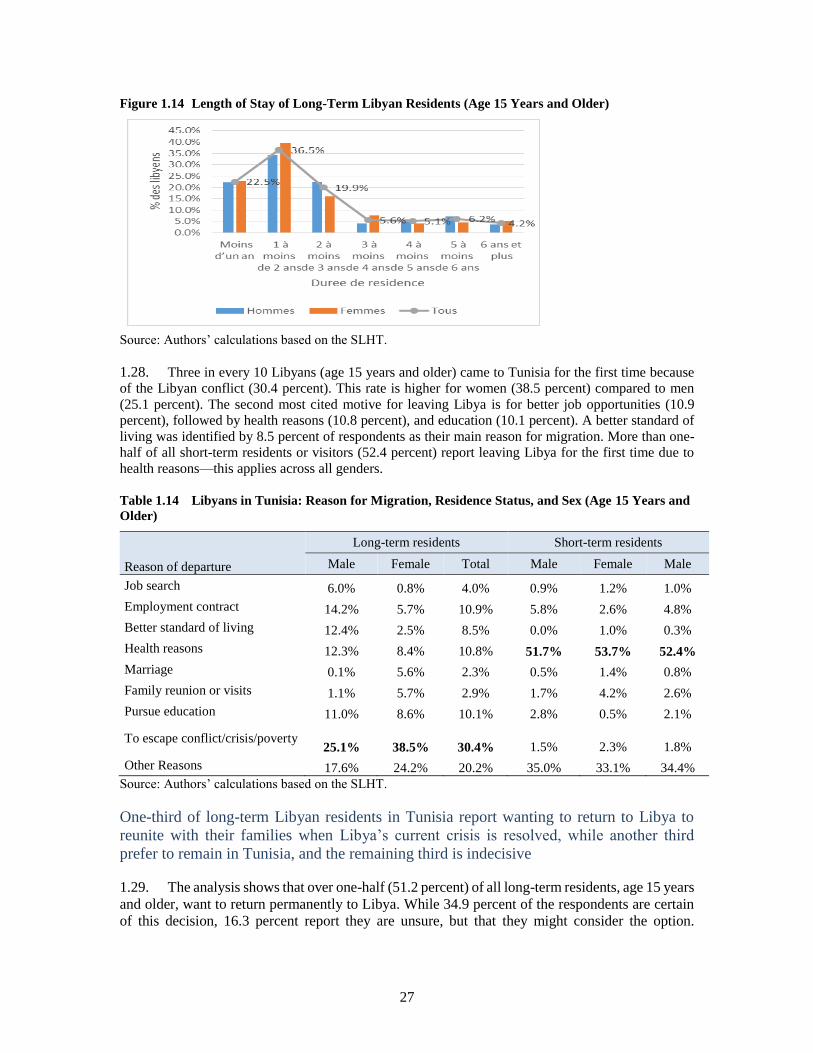
27
Figure 1.14 Length of Stay of Long-Term Libyan Residents (Age 15 Years and Older)
Source: Authors’ calculations based on the SLHT.
1.28. Three in every 10 Libyans (age 15 years and older) came to Tunisia for the first time because
of the Libyan conflict (30.4 percent). This rate is higher for women (38.5 percent) compared to men
(25.1 percent). The second most cited motive for leaving Libya is for better job opportunities (10.9
percent), followed by health reasons (10.8 percent), and education (10.1 percent). A better standard of
living was identified by 8.5 percent of respondents as their main reason for migration. More than one-
half of all short-term residents or visitors (52.4 percent) report leaving Libya for the first time due to
health reasons—this applies across all genders.
Table 1.14 Libyans in Tunisia: Reason for Migration, Residence Status, and Sex (Age 15 Years and
Older)
Reason of departure
Long-term residents Short-term residents
Male Female Total Male Female Male
Job search 6.0% 0.8% 4.0% 0.9% 1.2% 1.0%
Employment contract 14.2% 5.7% 10.9% 5.8% 2.6% 4.8%
Better standard of living 12.4% 2.5% 8.5% 0.0% 1.0% 0.3%
Health reasons 12.3% 8.4% 10.8% 51.7% 53.7% 52.4%
Marriage 0.1% 5.6% 2.3% 0.5% 1.4% 0.8%
Family reunion or visits 1.1% 5.7% 2.9% 1.7% 4.2% 2.6%
Pursue education 11.0% 8.6% 10.1% 2.8% 0.5% 2.1%
To escape conflict/crisis/poverty 25.1% 38.5% 30.4% 1.5% 2.3% 1.8%
Other Reasons 17.6% 24.2% 20.2% 35.0% 33.1% 34.4%
Source: Authors’ calculations based on the SLHT.
One-third of long-term Libyan residents in Tunisia report wanting to return to Libya to
reunite with their families when Libya’s current crisis is resolved, while another third
prefer to remain in Tunisia, and the remaining third is indecisive
1.29. The analysis shows that over one-half (51.2 percent) of all long-term residents, age 15 years
and older, want to return permanently to Libya. While 34.9 percent of the respondents are certain
of this decision, 16.3 percent report they are unsure, but that they might consider the option.

28
However, about one-third (1,381 respondents) have no intention of returning to Libya. The
remaining 17.1 percent did not specify any intention to return or stay. Table 1.15 Intention to Return Permanently to Libya among Long-Term Libyan Residents (Age 15
Years and Older)
Intention to return permanently
Number of long term Libyan
residents
Percentage of
Libyans
Yes 1522 34.9 %
Maybe 713 16.3 %
No 1381 31.7 %
Don’t know 748 17.1 %
Total 4364 100.0 %
Source: Authors’ calculations based on the SLHT.
1.30. Over one-third (34.5 percent) of Libyan residents, age 15 years and older, who intend to
return to Libya, plan to do so because they are optimistic that the Libyan crisis will improve or be
resolved. Family reunions are the second reason that Libyans residing in Tunisia report for wanting
to return to Libya (25.5 percent), followed by work and economic activity, which were cited as a
reason to return by 17.5 percent of households. Nearly 5 percent want to return because of poor
social integration and cohesion with Tunisians. About 42 percent of Libyan residents, age 15 years
and older, who do not intend to return to Libya, are pessimistic that there will be a positive
resolution to the Libyan crisis. Table 1.16 Main Reason for Intending to Return to Libya (Long-Term Residents, Age 15 Years and
Older)
Number of long term Libyan
residents intending to return Percentage
1. Improvement/resolution of the conflict/crisis in
Libya 517 34.5 %
2. Work 262 17.5 %
3. Retirement 7 0.5 %
4. Illness (dying at home) 23 1.5 %
5. Worsening life conditions in Tunisia 29 1.9 %
6. Lack of integration and cohesion with Tunisians 73 4.9 %
7. Family reunification 381 25.5 %
8. Changes in politics, rules, and laws 24 1.6 %
9. Others 181 12.1 %
Total 1497 100.0 %
Source: Authors’ calculations based on the SLHT.
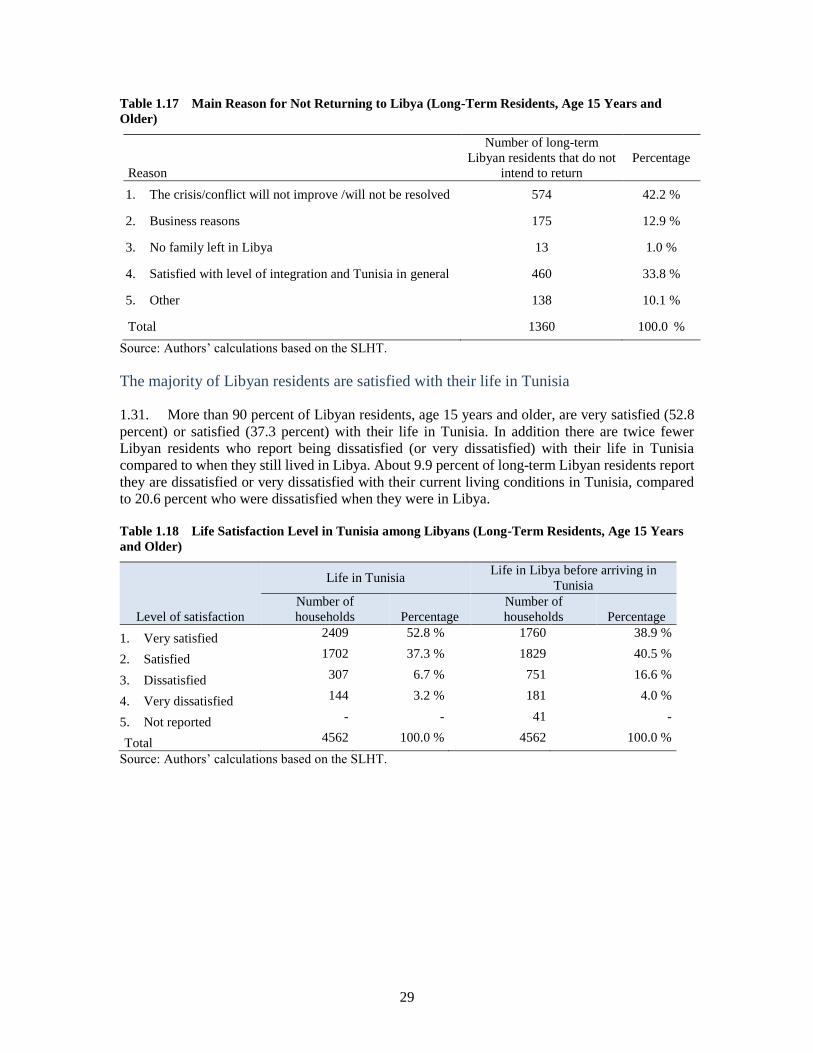
29
Table 1.17 Main Reason for Not Returning to Libya (Long-Term Residents, Age 15 Years and
Older)
Reason
Number of long-term
Libyan residents that do not
intend to return
Percentage
1. The crisis/conflict will not improve /will not be resolved 574 42.2 %
2. Business reasons 175 12.9 %
3. No family left in Libya 13 1.0 %
4. Satisfied with level of integration and Tunisia in general 460 33.8 %
5. Other 138 10.1 %
Total 1360 100.0 %
Source: Authors’ calculations based on the SLHT.
The majority of Libyan residents are satisfied with their life in Tunisia
1.31. More than 90 percent of Libyan residents, age 15 years and older, are very satisfied (52.8
percent) or satisfied (37.3 percent) with their life in Tunisia. In addition there are twice fewer
Libyan residents who report being dissatisfied (or very dissatisfied) with their life in Tunisia
compared to when they still lived in Libya. About 9.9 percent of long-term Libyan residents report
they are dissatisfied or very dissatisfied with their current living conditions in Tunisia, compared
to 20.6 percent who were dissatisfied when they were in Libya. Table 1.18 Life Satisfaction Level in Tunisia among Libyans (Long-Term Residents, Age 15 Years
and Older)
Level of satisfaction
Life in Tunisia Life in Libya before arriving in
Tunisia
Number of
households Percentage
Number of
households Percentage
1. Very satisfied 2409 52.8 % 1760 38.9 %
2. Satisfied 1702 37.3 % 1829 40.5 %
3. Dissatisfied 307 6.7 % 751 16.6 %
4. Very dissatisfied 144 3.2 % 181 4.0 %
5. Not reported - - 41 -
Total 4562 100.0 % 4562 100.0 %
Source: Authors’ calculations based on the SLHT.
30
Chapter 2 The Impact on Financial Flows and the Banking
System
Foreign direct investment (FDI) between Tunisia and Libya has declined drastically since 2011.
Libyan FDI in Tunisia decreased by 33.3 million Tunisian dinars (TD) between 2010 and 2014,
down from TD 75.1 million in 2010, compared to TD 41.8 million in 2014. Meanwhile, Tunisian
FDI in Libya contracted by TD 15 million in the same time period, from TD 18.3 million in 2010
to TD 3.3 million in 2014. A similar downward trend is seen in remittances from Tunisian workers
in Libya, which have also decreased since 2011 from TD 55.9 million to TD 38.1 million per year.
This decline primarily was the result of about 60,000 Tunisian workers returning home from Libya.
Since 2011, however, changes in financial and monetary regulations have allowed Libyans to open
bank accounts in Tunisia, providing Tunisia with useful foreign currency inflows and Tunisian
banks with much-needed liquidity. This study surveys seven major banks in Tunisia (which account
for 40 percent of banking deposits) to assess Libyan deposits in the Tunisian banking system. We
find that the number of bank accounts held by Libyans represent 0.5 percent of total bank accounts
in Tunisia and 20.9 percent of all foreign currency accounts. Eighty-six percent of Libyan bank
accounts in Tunisia are in U.S. dollars and euros, indicating a preference for foreign currencies.
Libyan deposits in the seven surveyed banks reached TD 2.07 billion in 2014 (2.4 percent of the
2014 GDP), representing 12.1 percent of total deposits in these banks. The Libyan deposits have
been relatively stable, thus allowing banks to reduce their resource mobilization costs while
improving their loan coverage rate. Now it is crucial to strengthen liquidity risk monitoring,
especially among banks with a high share of Libyan customer deposits. Moreover, more rigorous
controls need to be implemented to prevent money laundering, the financing of illegal activities,
and informal trade and terrorism. Deposits made by Libyans in Tunisia, together with the future
revival and rebuilding of the Libyan economy, present a unique opportunity for Tunisia. These
deposits can be used to stimulate the financing of productive investments and facilitate the
economic integration of the two countries.
2.1. The Libyan crisis’ repercussions for the Tunisian economy can be assessed through two
main effects: (i) direct macroeconomic effects (bilateral trade, trade and other services, food and
energy products, demand effects and inflation); and (ii) indirect macroeconomic effects (cross-
border trade, business cycles, informality, customs revenues, fiscal impact, increase in rent prices,
and job losses—whether direct or indirect). The financial impacts on (i) foreign direct investment
inflows, (ii) formal currency transfers, and (iii) the assets owned by Tunisians in Libya are mostly
negative.
2.2. In Tunisia, new regulations allowing Libyan migrants to open bank accounts—regardless of
their residency status—have resulted in positive microeconomic 6 impacts, thus highlighting the
economic potential Libyan in Tunisia represent. The lack of security in Libya has spurred an
6 Other positive microeconomic effects from Libyans living in Tunisia are also apparent. The internal
demand effect on the commercial value added and indirect fiscal gains (the contribution of taxes to the
value added, consumption rights, and so forth) could potentially temporarily counterbalance the additional
fiscal impact on subsidies (see chapter 4).
31
increase in money transfers, which in turn has translated into increased deposits in Tunisia’s
commercial banks. These incoming transfers have eased the trend of declining bank deposit rates
in Tunisia. This further indicates that the effect of the Libyan crisis on net bank transactions may
be positive, providing increased access to financial resources for the Tunisian banking system.
2.3. In light of the recent terrorism-related tragedies that negatively impacted Tunisia’s tourism
industry, there is a pressing need to: (i) secure the remittances of Libyan migrants in relation to
their contribution to the balance of payments and the external balance, and (ii) at the same time,
sustain banking and financial flows by channeling them toward investment financing.
2.4. This chapter’s objective is to evaluate the financial consequences of the Libyan crisis, and
also to assess the economic potential of Libyans banking in Tunisia. We conduct our analysis by
examining Libyan bank account holdings in Tunisia. Public policy implications also will be
discussed.
Tunisia–Libya FDI inflows have declined considerably since 2011
2.5. Preceding the Libyan crisis, investment flows between Libya and Tunisia were sustained
at nearly 2 billion U.S. dollars (US$),7 with more than 30 Libyan firms in the industry8 and service9
sectors generating about 3,000 new jobs (either directly or indirectly). Before the crisis, a merger
and acquisition project of Bank Tuniso-Libyenne (BTL) with Banque Nationale d'Investissement
Arabes (NAIB) was underway to promote trade between the two countries. In the aftermath of the
crisis, Libyan FDI in Tunisia contracted considerably compared to 201010 levels, especially in the
tourism and manufacturing sectors.
2.6. Although there was an upward swing in the tourism sector and other services between 2013
and 2014, the decline in FDI is still substantial. It currently is estimated at TD 33.3 million, from
TD 75.1 million in 2010 and TD 41.8 million in 2014. We thus note a decreasing trend in Tunisian
FDI in Libya, with a global decline of TD 15 million in the manufacturing sector, from TD 18.3
million in 2010 and TD 3.3 million in 2013 (see Figure 2.1 and Figure 2.2).11
7 Compared to predicted Tunisian investments of US$1.5 billion in Libya for ongoing and suspended
projects after the transition. 8 Such as the Skhira refinery project, currently suspended, that was slated to start in November 2010. 9 The Libyan Arab Investment Company (the Compagnie Libyenne d’Investissement Arabe; LAICO) is a
good example in the tourism sector. 10 In 2011, Libyan investment in Tunisia declined by about 82 percent. There is now an upward trend, but
volumes are still below 2010 levels. 11 FDI from Tunisia’s other trading partners is detailed in the appendix.
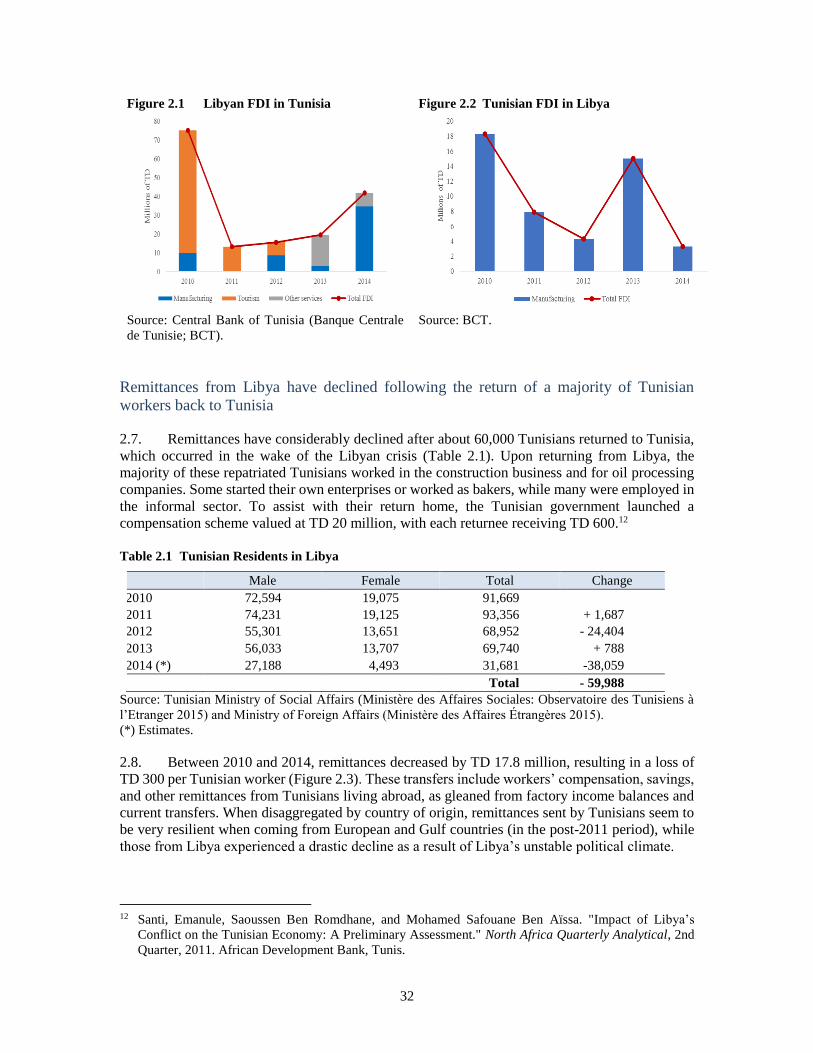
32
Figure 2.1 Libyan FDI in Tunisia
Source: Central Bank of Tunisia (Banque Centrale
de Tunisie; BCT).
Figure 2.2 Tunisian FDI in Libya
Source: BCT.
Remittances from Libya have declined following the return of a majority of Tunisian
workers back to Tunisia
2.7. Remittances have considerably declined after about 60,000 Tunisians returned to Tunisia,
which occurred in the wake of the Libyan crisis (Table 2.1). Upon returning from Libya, the
majority of these repatriated Tunisians worked in the construction business and for oil processing
companies. Some started their own enterprises or worked as bakers, while many were employed in
the informal sector. To assist with their return home, the Tunisian government launched a
compensation scheme valued at TD 20 million, with each returnee receiving TD 600.12
Table 2.1 Tunisian Residents in Libya
Male Female Total Change
2010 72,594 19,075 91,669
2011 74,231 19,125 93,356 + 1,687
2012 55,301 13,651 68,952 - 24,404
2013 56,033 13,707 69,740 + 788
2014 (*) 27,188 4,493 31,681 -38,059
Total - 59,988
Source: Tunisian Ministry of Social Affairs (Ministère des Affaires Sociales: Observatoire des Tunisiens à
l’Etranger 2015) and Ministry of Foreign Affairs (Ministère des Affaires Étrangères 2015).
(*) Estimates.
2.8. Between 2010 and 2014, remittances decreased by TD 17.8 million, resulting in a loss of
TD 300 per Tunisian worker (Figure 2.3). These transfers include workers’ compensation, savings,
and other remittances from Tunisians living abroad, as gleaned from factory income balances and
current transfers. When disaggregated by country of origin, remittances sent by Tunisians seem to
be very resilient when coming from European and Gulf countries (in the post-2011 period), while
those from Libya experienced a drastic decline as a result of Libya’s unstable political climate.
12 Santi, Emanule, Saoussen Ben Romdhane, and Mohamed Safouane Ben Aïssa. "Impact of Libya’s
Conflict on the Tunisian Economy: A Preliminary Assessment." North Africa Quarterly Analytical, 2nd
Quarter, 2011. African Development Bank, Tunis.
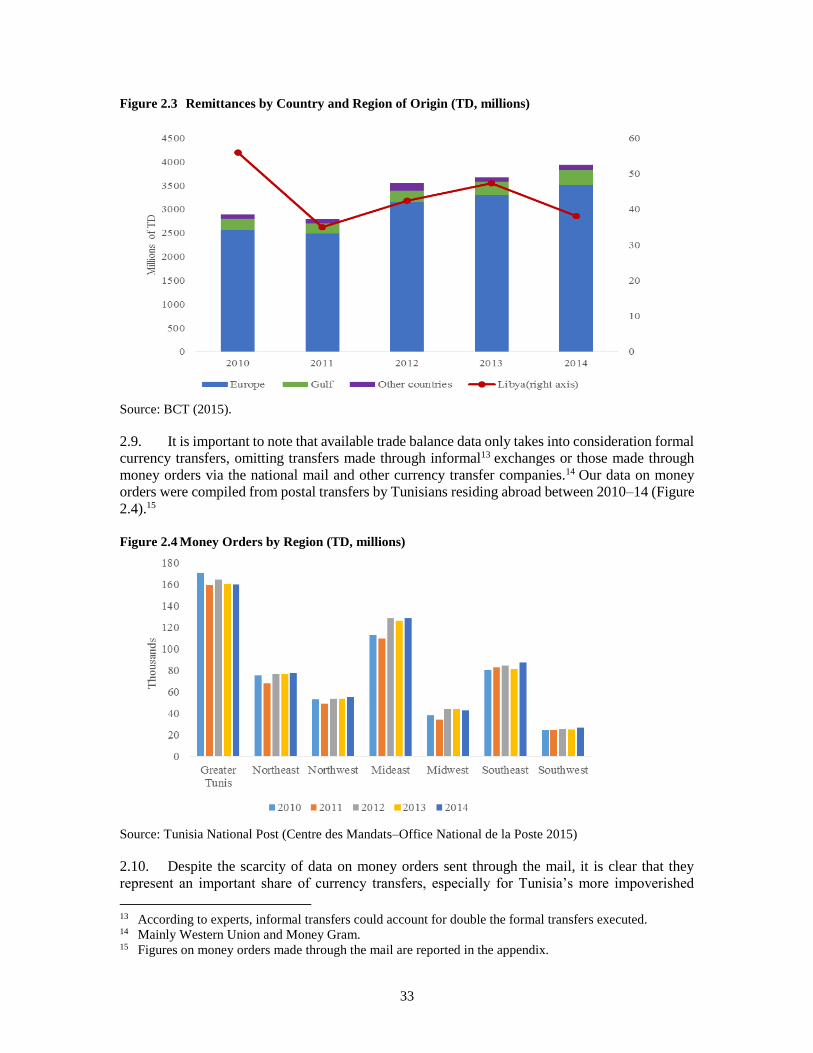
33
Figure 2.3 Remittances by Country and Region of Origin (TD, millions)
Source: BCT (2015).
2.9. It is important to note that available trade balance data only takes into consideration formal
currency transfers, omitting transfers made through informal13 exchanges or those made through
money orders via the national mail and other currency transfer companies.14 Our data on money
orders were compiled from postal transfers by Tunisians residing abroad between 2010–14 (Figure
2.4).15
Figure 2.4 Money Orders by Region (TD, millions)
Source: Tunisia National Post (Centre des Mandats–Office National de la Poste 2015)
2.10. Despite the scarcity of data on money orders sent through the mail, it is clear that they
represent an important share of currency transfers, especially for Tunisia’s more impoverished
13 According to experts, informal transfers could account for double the formal transfers executed. 14 Mainly Western Union and Money Gram. 15 Figures on money orders made through the mail are reported in the appendix.
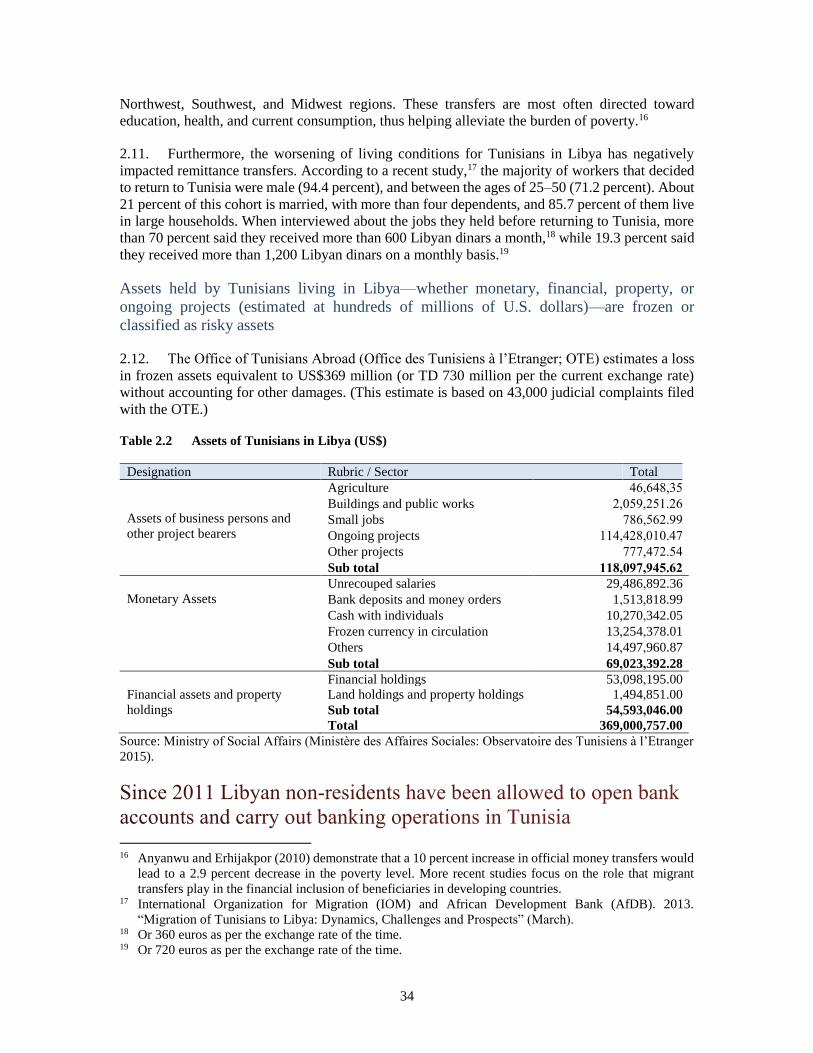
34
Northwest, Southwest, and Midwest regions. These transfers are most often directed toward
education, health, and current consumption, thus helping alleviate the burden of poverty.16
2.11. Furthermore, the worsening of living conditions for Tunisians in Libya has negatively
impacted remittance transfers. According to a recent study,17 the majority of workers that decided
to return to Tunisia were male (94.4 percent), and between the ages of 25–50 (71.2 percent). About
21 percent of this cohort is married, with more than four dependents, and 85.7 percent of them live
in large households. When interviewed about the jobs they held before returning to Tunisia, more
than 70 percent said they received more than 600 Libyan dinars a month,18 while 19.3 percent said
they received more than 1,200 Libyan dinars on a monthly basis.19
Assets held by Tunisians living in Libya—whether monetary, financial, property, or
ongoing projects (estimated at hundreds of millions of U.S. dollars)—are frozen or
classified as risky assets
2.12. The Office of Tunisians Abroad (Office des Tunisiens à l’Etranger; OTE) estimates a loss
in frozen assets equivalent to US$369 million (or TD 730 million per the current exchange rate)
without accounting for other damages. (This estimate is based on 43,000 judicial complaints filed
with the OTE.)
Table 2.2 Assets of Tunisians in Libya (US$)
Designation Rubric / Sector Total
Assets of business persons and
other project bearers
Agriculture 46,648,35
Buildings and public works 2,059,251.26
Small jobs 786,562.99
Ongoing projects 114,428,010.47
Other projects 777,472.54
Sub total 118,097,945.62
Monetary Assets
Unrecouped salaries 29,486,892.36
Bank deposits and money orders 1,513,818.99
Cash with individuals 10,270,342.05
Frozen currency in circulation 13,254,378.01
Others 14,497,960.87
Sub total 69,023,392.28
Financial assets and property
holdings
Financial holdings 53,098,195.00
Land holdings and property holdings 1,494,851.00
Sub total 54,593,046.00
Total 369,000,757.00
Source: Ministry of Social Affairs (Ministère des Affaires Sociales: Observatoire des Tunisiens à l’Etranger
2015).
16 Anyanwu and Erhijakpor (2010) demonstrate that a 10 percent increase in official money transfers would
lead to a 2.9 percent decrease in the poverty level. More recent studies focus on the role that migrant
transfers play in the financial inclusion of beneficiaries in developing countries. 17 International Organization for Migration (IOM) and African Development Bank (AfDB). 2013.
“Migration of Tunisians to Libya: Dynamics, Challenges and Prospects” (March). 18 Or 360 euros as per the exchange rate of the time. 19 Or 720 euros as per the exchange rate of the time.
35
Financial and monetary regulatory reforms implemented since the end of 2011 have
allowed nonresident Libyans to open bank accounts and conduct banking transactions.
2.13. A new currency exchange regulation has enabled Libyans in Tunisia—regardless of their
residency status—to open bank accounts. The Tunisia Finance Ministry’s October 28, 2011
currency exchange decision allowed for the establishment of accounts in Tunisian dinars for
nonresident Libyan citizens. A second currency exchange decision, issued on November 22, 2011,
sanctioned nonresidents to hold accounts in convertible currencies and accounts in convertible
dinars.20
On exchange rate procedures
2.14. A Central Bank of Tunisia (Banque Centrale de Tunisie; BCT) exchange notice (N 2011-
12; December 26, 2011), spells out the conditions permitted for deposits in accounts held in
Tunisian dinars. Such accounts can only be supplied by: (i) cash deposits in Tunisian dinars by the
account holder or any other nonresident Libyan; (ii) the dinar value of currencies from accounts
held in convertible currencies, from accounts in convertible dinars owned by nonresidents or
accounts in dinar opened in the name of a nonresident Libyan; and (iii) the product of placements
in accounts according to the conditions established by the central bank for accounts in dinars.
Accounts held in Tunisian dinars and owned by nonresident Libyans can be freely debited and
deposited in dinars according to the regulations in effect. The balance on these accounts can never
be negative.
2.15. However, in the case of convertible currency accounts and those held in convertible dinars,
the exchange rule of November 22, 2011, stipulates that these accounts can be credited with
deposits of foreign bank notes held by nonresident Libyans irrespective of the amount. 21
Furthermore, a BCT circular (N 2012-03; January 23, 2012), announced that the balances on these
accounts should not be fully debited.
2.16. Unless otherwise specified in earlier arrangements, accounts held in convertible currencies
were subsequently supplied by money transfers. By the end of 2011, direct transfers and cash
transfers increased by 20 percent and 200 percent respectively, compared to the same period the
previous year.22 According to the African Development Bank (AfDB),23 other types of transfers24
have moderated the loss caused by the declining value of letters of credits in bilateral trade.
2.17. Among incoming wire transfers, those originating from the Central Bank of Libya are of
particular importance. The principal income source (in Tunisia) for Libyan government officials
and employees, and those employed in the private sector, is work payment transfers. It is important
20 In addition to accounts held in Tunisian dinars, five account types for Libyan residents in Tunisia
(individuals) are available: special currency accounts; foreign currency accounts; accounts in convertible
dinars; interior accounts for nonresidents; and suspense accounts for nonresidents. 21 Customs declaration of these currency notes is required when opening such an account. 22 This evidence was gathered from an analysis of bank accounts held in three Tunisian–Libyan banks: Bank
Internationale d’Afrique du Nord (NAIB); ALUBAF International Bank; and the Bank Tuniso-Libyenne
(BTL). Transfers (direct or in cash) should not be confused with bank deposits that will be analyzed at a
later point. As per their definition in aggregate monetary value, deposits are essentially the net bank
balance that are cash deposits and transfers received net of credits and emitted transfers. 23 AfDB (2011). 24 According to AfDB (2011), as a consequence of the rupture of formal commercial transactions with Libya
(as a result of the 2011 crisis), letters of credits dropped by nearly 75 percent in 2011, compared to the
same period the previous year.
36
to note that the Central Bank of Libya has maintained a regular and operational payroll payment
system despite the political conflicts and security challenges the country faces.
2.18. These transfers, however, do not seem to always follow Tunisian regulations. In some
instances, these accounts were used to transfer funds to family members in Libya. This disregard
for regulations and BCT exchange rules was confirmed in one of the banks we visited.25 The
exceptions to such non-compliance tend to be cases of suspicious activity, which banks must report
to regulatory officials.
Procedures in effect for accounts opened prior to 2011
2.19. In addition to the accounts frozen in accordance with United Nations regulations,26 other
accounts opened prior to 2011 have been subject to declaration of dubious activity to the Tunisian
Commission of Financial Analysis (Commission Tunisienne d’Analyse Financière; CTAF). These
complaints are often made in relation to BCT circular N 2013-15 of November 7, 2013, directed at
credit institutions, which requires internal control rules. These regulations, which aim at better risk
management of money laundering and terrorism financing, have attempted to:
Identify the extent, and evaluate of the risk, of noncompliance with existing regulations;
Control the execution of banks’ legal obligations for each risk identified; and
Propose and follow through with recommendations to better manage these risks.
2.20. In addition to the regulations found in CTAF Directive 2, the Central Bank of Tunisia
circular N 2013-15 stipulates the security measures and procedures to be undertaken for: (i) client
and account profiling; (ii) transaction screening; and (iii) monitoring account changes; and (iv) an
alert system.27
An analysis of the bank account holdings of Libyans in Tunisia was undertaken to estimate
their bank assets
2.21. A survey of current bank accounts holdings of Libyans in Tunisia (mainly physical persons,
but also corporate entities when the information was available)28 has been analyzed in partnership
with the BCT to ascertain the potential resource mobilization within the Tunisian banking system.
Such a diagnostic is important as it enables the potential channeling of collected funds toward the
creation of Tunisian–Libyan enterprises in Tunisia29 and the development of different sectors.30
2.22. In addition to information gathered on accounts held in Tunisian dinars, an exhaustive
study was carried out on five types of accounts held by nonresident Libyans: (i) special currency
accounts; (ii) foreign currency accounts; (iii) accounts in convertible dinars; (iv) interior accounts
for nonresidents; and (v) suspense accounts for nonresidents.
25 See infra. 26 Libyan officials estimate deposit funds for these accounts in the Tunisian banking system at US$200–400
million. 27 These procedures have been further reinforced by law N 2015-26 of August 7, 2015, which defined other
control prerogatives. Other ethical alert mechanisms such as whistleblowing will soon be in place. 28 But also of corporate identities whenever the information was available. 29 During the transition period more than 200 new Tunisian–Libyan enterprises have been created in various
sectors. Moreover, Libyans not residing in Tunisia chose Tunisia as their base for their offshore activities. 30 A recent study by the Tunisian Ministry of Machinery and Housing shows that the housing sector was
one of the principal conduits for Libyan investments (both physical and moral entities) in 2014.

37
2.23. As per the specific exchange regulations, foreign accounts in convertible currency held by
individual owners allow (i) deposits in currency exchangeable in dinars, and (ii) the choice of the
foreign currency to be exchanged. In the case of accounts owned by a corporate entity, special
accounts in convertible dinars can be funded by (i) foreign transfers; (ii) foreign currency; and (iii)
transfers from accounts in convertible currency or dinars, or transfers from special accounts in
convertible currency.
Data
2.24. The main objectives of drawing the profile of the Libyan population in collaboration with
the BCT were to (i) analyze the breakdown of these accounts by type, credit agency (banks, mixed
banks), specialized or special status banks (offshore banks) for all agencies (also particular
agencies), and by geography; (ii) determine the breakdown of the such accounts by account holder
(individual or entities); (iii) estimate the contributions of these accounts to the banking system in
general, and for each bank in particular; and (iv) determine the average transfer amount by account
type. The data collected on the banking behavior of the Libyan population in Tunisia is for 2013–
14.
Banks visited
2.25. A representative sample of 13 banks, with nine onshore and four offshore of the first level
(in accordance with the definition of the BCT), was selected out of a group of 22 onshore31 banks
and eight offshore banks.
Onshore banks: Banque Tuniso-Libyenne (BTL), Arab Tunisian Bank (ATB), Société
Tunisienne de Banque (STB), Banque de Tunisie (BT), Banque Franco-Tunisienne (BFT),
Banque Internationale Arabe de Tunisie (BIAT), Amen Bank (AB), Attijari Bank (AtB) and
Union Bancaire pour le Commerce et l'Industrie (UBCI).
Offshore banks: Alubaf International Bank, North African International Bank (NAIB), Arab
Banking Corporation (ABC) and Citibank.
Bank accounts owned by Libyans in the sample banks represent 0.5 percent of all deposit
accounts in the Tunisian banking system, and 20.9 percent of all foreign currency accounts.
Eighty-six percent of Libyan bank accounts in Tunisia are in U.S. dollars and euros,
indicating a preference for foreign currencies
2.26. Six of the nine targeted onshore banks (ATB, BFT, BIAT, BT, BTL STB) shared data for
the purpose of this study, a 66 percent sampling rate. A sampling rate of 25 percent was recorded
among the offshore banks, with only the NAIB agreeing to respond to the requests of the study, out
of the four banks targeted. The seven banks that took part in the study hold 40.1 percent of all
deposits in Tunisia’s banks. Deposits in the participating banks constituted, on average, 42.9
percent of the total deposits in the banking sector during the period of the study (Table 2.3).
31 As of 2014, there were 22 onshore banks, following the universalization of Al Baraka Bank.
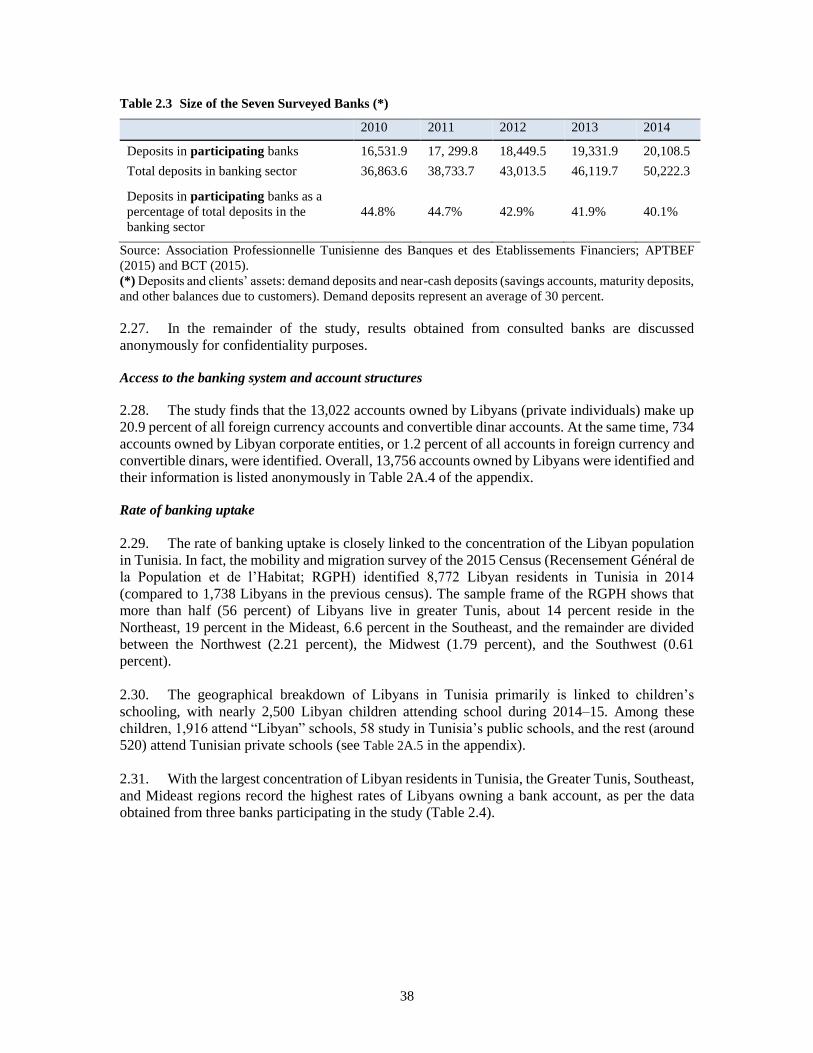
38
Table 2.3 Size of the Seven Surveyed Banks (*)
2010 2011 2012 2013 2014
Deposits in participating banks 16,531.9 17, 299.8 18,449.5 19,331.9 20,108.5
Total deposits in banking sector 36,863.6 38,733.7 43,013.5 46,119.7 50,222.3
Deposits in participating banks as a
percentage of total deposits in the
banking sector
44.8% 44.7% 42.9% 41.9% 40.1%
Source: Association Professionnelle Tunisienne des Banques et des Etablissements Financiers; APTBEF
(2015) and BCT (2015).
(*) Deposits and clients’ assets: demand deposits and near-cash deposits (savings accounts, maturity deposits,
and other balances due to customers). Demand deposits represent an average of 30 percent.
2.27. In the remainder of the study, results obtained from consulted banks are discussed
anonymously for confidentiality purposes.
Access to the banking system and account structures
2.28. The study finds that the 13,022 accounts owned by Libyans (private individuals) make up
20.9 percent of all foreign currency accounts and convertible dinar accounts. At the same time, 734
accounts owned by Libyan corporate entities, or 1.2 percent of all accounts in foreign currency and
convertible dinars, were identified. Overall, 13,756 accounts owned by Libyans were identified and
their information is listed anonymously in Table 2A.4 of the appendix.
Rate of banking uptake
2.29. The rate of banking uptake is closely linked to the concentration of the Libyan population
in Tunisia. In fact, the mobility and migration survey of the 2015 Census (Recensement Général de
la Population et de l’Habitat; RGPH) identified 8,772 Libyan residents in Tunisia in 2014
(compared to 1,738 Libyans in the previous census). The sample frame of the RGPH shows that
more than half (56 percent) of Libyans live in greater Tunis, about 14 percent reside in the
Northeast, 19 percent in the Mideast, 6.6 percent in the Southeast, and the remainder are divided
between the Northwest (2.21 percent), the Midwest (1.79 percent), and the Southwest (0.61
percent).
2.30. The geographical breakdown of Libyans in Tunisia primarily is linked to children’s
schooling, with nearly 2,500 Libyan children attending school during 2014–15. Among these
children, 1,916 attend “Libyan” schools, 58 study in Tunisia’s public schools, and the rest (around
520) attend Tunisian private schools (see Table 2A.5 in the appendix).
2.31. With the largest concentration of Libyan residents in Tunisia, the Greater Tunis, Southeast,
and Mideast regions record the highest rates of Libyans owning a bank account, as per the data
obtained from three banks participating in the study (Table 2.4).
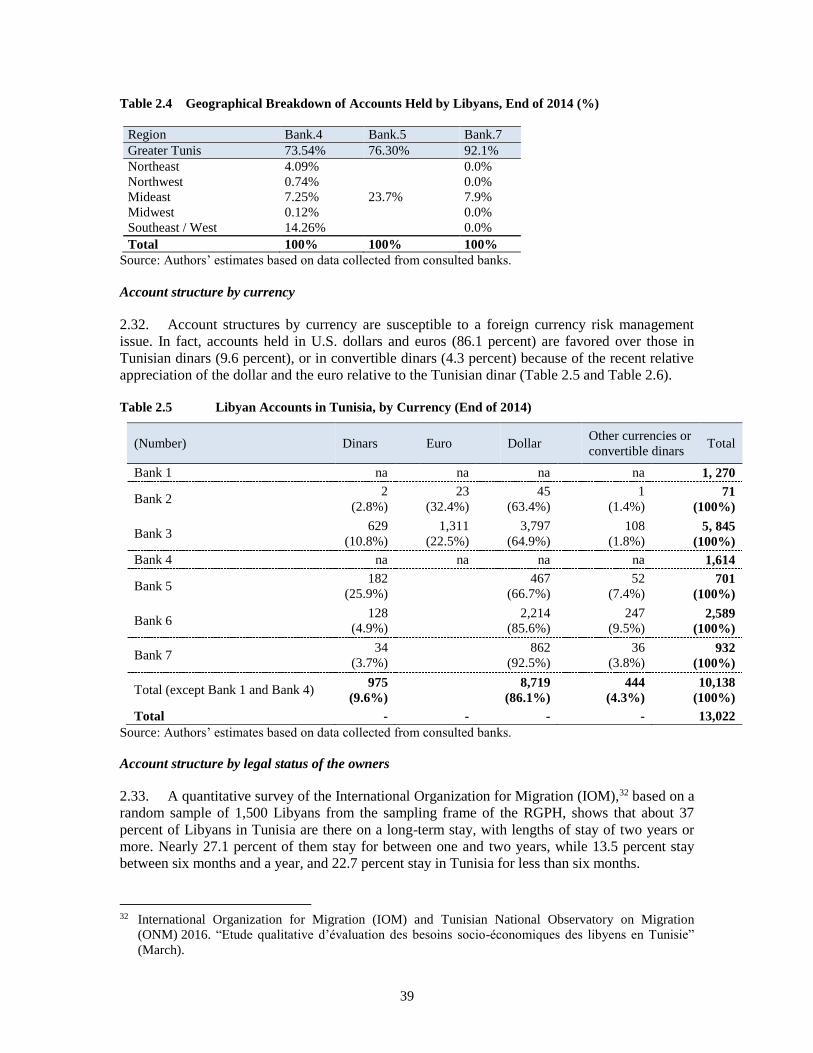
39
Table 2.4 Geographical Breakdown of Accounts Held by Libyans, End of 2014 (%)
Region Bank.4 Bank.5 Bank.7
Greater Tunis 73.54% 76.30% 92.1%
Northeast 4.09%
23.7%
0.0%
Northwest 0.74% 0.0%
Mideast 7.25% 7.9%
Midwest 0.12% 0.0%
Southeast / West 14.26% 0.0%
Total 100% 100% 100%
Source: Authors’ estimates based on data collected from consulted banks.
Account structure by currency
2.32. Account structures by currency are susceptible to a foreign currency risk management
issue. In fact, accounts held in U.S. dollars and euros (86.1 percent) are favored over those in
Tunisian dinars (9.6 percent), or in convertible dinars (4.3 percent) because of the recent relative
appreciation of the dollar and the euro relative to the Tunisian dinar (Table 2.5 and Table 2.6). Table 2.5 Libyan Accounts in Tunisia, by Currency (End of 2014)
(Number) Dinars Euro Dollar Other currencies or
convertible dinars Total
Bank 1 na na na na 1, 270
Bank 2 2
(2.8%)
23
(32.4%)
45
(63.4%)
1
(1.4%) 71
(100%)
Bank 3 629
(10.8%)
1,311
(22.5%)
3,797
(64.9%)
108
(1.8%) 5, 845
(100%)
Bank 4 na na na na 1,614
Bank 5 182
(25.9%)
467
(66.7%)
52
(7.4%) 701
(100%)
Bank 6 128
(4.9%)
2,214
(85.6%)
247
(9.5%) 2,589
(100%)
Bank 7 34
(3.7%)
862
(92.5%)
36
(3.8%) 932
(100%)
Total (except Bank 1 and Bank 4) 975
(9.6%)
8,719
(86.1%)
444
(4.3%)
10,138
(100%)
Total - - - - 13,022
Source: Authors’ estimates based on data collected from consulted banks.
Account structure by legal status of the owners
2.33. A quantitative survey of the International Organization for Migration (IOM),32 based on a
random sample of 1,500 Libyans from the sampling frame of the RGPH, shows that about 37
percent of Libyans in Tunisia are there on a long-term stay, with lengths of stay of two years or
more. Nearly 27.1 percent of them stay for between one and two years, while 13.5 percent stay
between six months and a year, and 22.7 percent stay in Tunisia for less than six months.
32 International Organization for Migration (IOM) and Tunisian National Observatory on Migration
(ONM) 2016. “Etude qualitative d’évaluation des besoins socio-économiques des libyens en Tunisie”
(March).
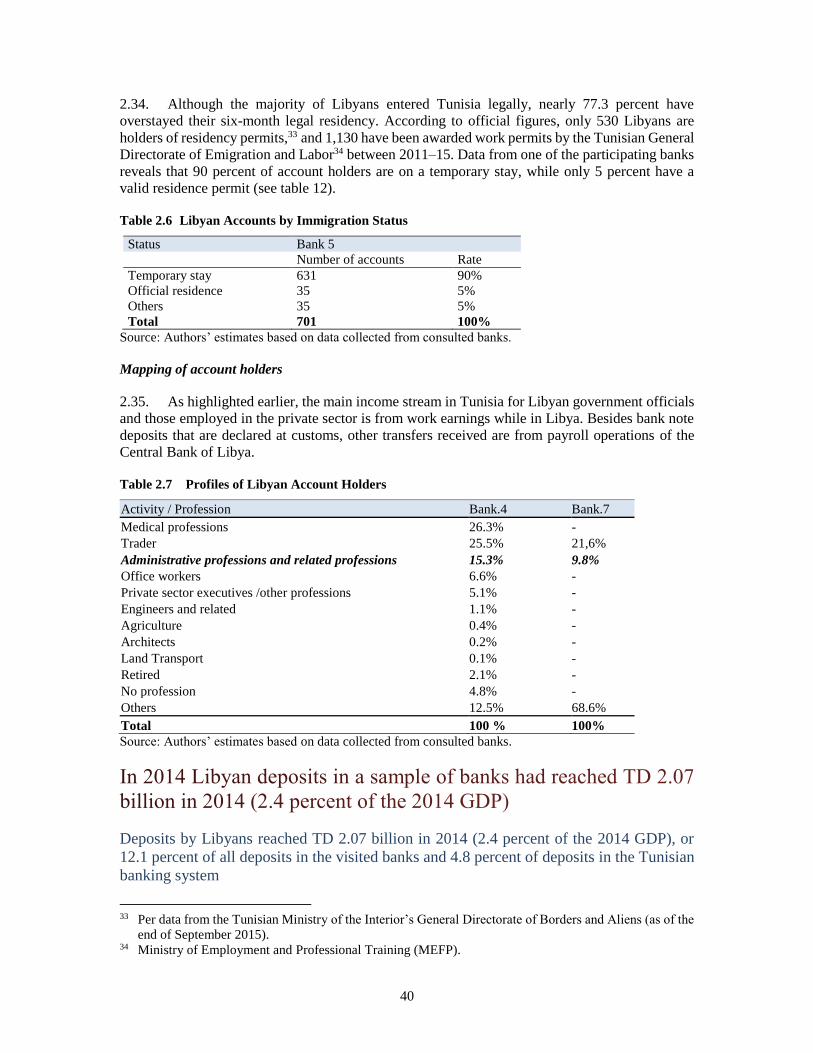
40
2.34. Although the majority of Libyans entered Tunisia legally, nearly 77.3 percent have
overstayed their six-month legal residency. According to official figures, only 530 Libyans are
holders of residency permits,33 and 1,130 have been awarded work permits by the Tunisian General
Directorate of Emigration and Labor34 between 2011–15. Data from one of the participating banks
reveals that 90 percent of account holders are on a temporary stay, while only 5 percent have a
valid residence permit (see table 12). Table 2.6 Libyan Accounts by Immigration Status
Status Bank 5
Number of accounts Rate
Temporary stay 631 90%
Official residence 35 5%
Others 35 5%
Total 701 100%
Source: Authors’ estimates based on data collected from consulted banks.
Mapping of account holders
2.35. As highlighted earlier, the main income stream in Tunisia for Libyan government officials
and those employed in the private sector is from work earnings while in Libya. Besides bank note
deposits that are declared at customs, other transfers received are from payroll operations of the
Central Bank of Libya. Table 2.7 Profiles of Libyan Account Holders
Activity / Profession Bank.4 Bank.7
Medical professions 26.3% -
Trader 25.5% 21,6%
Administrative professions and related professions 15.3% 9.8%
Office workers 6.6% -
Private sector executives /other professions 5.1% -
Engineers and related 1.1% -
Agriculture 0.4% -
Architects 0.2% -
Land Transport 0.1% -
Retired 2.1% -
No profession 4.8% -
Others 12.5% 68.6%
Total 100 % 100%
Source: Authors’ estimates based on data collected from consulted banks.
Deposits by Libyans reached TD 2.07 billion in 2014 (2.4 percent of the 2014 GDP), or
12.1 percent of all deposits in the visited banks and 4.8 percent of deposits in the Tunisian
banking system
33 Per data from the Tunisian Ministry of the Interior’s General Directorate of Borders and Aliens (as of the
end of September 2015). 34 Ministry of Employment and Professional Training (MEFP).
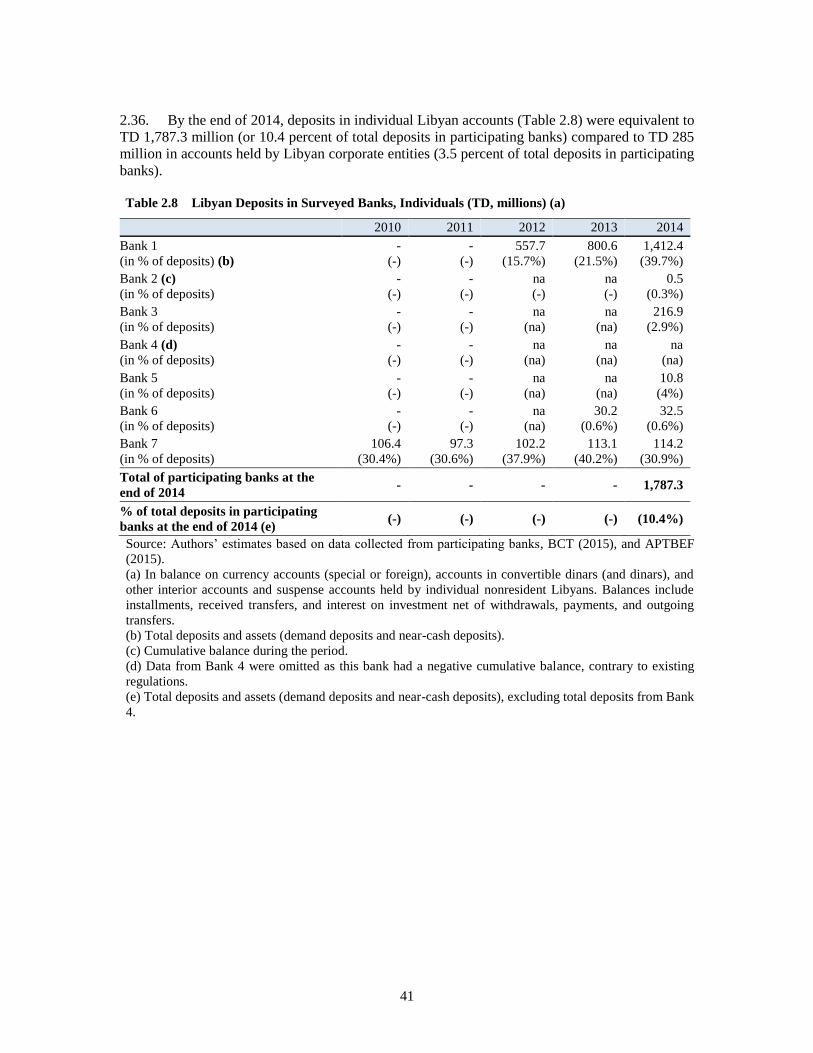
41
2.36. By the end of 2014, deposits in individual Libyan accounts (Table 2.8) were equivalent to
TD 1,787.3 million (or 10.4 percent of total deposits in participating banks) compared to TD 285
million in accounts held by Libyan corporate entities (3.5 percent of total deposits in participating
banks). Table 2.8 Libyan Deposits in Surveyed Banks, Individuals (TD, millions) (a)
2010 2011 2012 2013 2014
Bank 1
(in % of deposits) (b)
-
(-)
-
(-)
557.7
(15.7%)
800.6
(21.5%)
1,412.4
(39.7%)
Bank 2 (c)
(in % of deposits)
-
(-)
-
(-)
na
(-)
na
(-)
0.5
(0.3%)
Bank 3
(in % of deposits)
-
(-)
-
(-)
na
(na)
na
(na)
216.9
(2.9%)
Bank 4 (d)
(in % of deposits)
-
(-)
-
(-)
na
(na)
na
(na)
na
(na)
Bank 5
(in % of deposits)
-
(-)
-
(-)
na
(na)
na
(na)
10.8
(4%)
Bank 6
(in % of deposits)
-
(-)
-
(-)
na
(na)
30.2
(0.6%)
32.5
(0.6%)
Bank 7
(in % of deposits)
106.4
(30.4%)
97.3
(30.6%)
102.2
(37.9%)
113.1
(40.2%)
114.2
(30.9%)
Total of participating banks at the
end of 2014 - - - - 1,787.3
% of total deposits in participating
banks at the end of 2014 (e) (-) (-) (-) (-) (10.4%)
Source: Authors’ estimates based on data collected from participating banks, BCT (2015), and APTBEF
(2015).
(a) In balance on currency accounts (special or foreign), accounts in convertible dinars (and dinars), and
other interior accounts and suspense accounts held by individual nonresident Libyans. Balances include
installments, received transfers, and interest on investment net of withdrawals, payments, and outgoing
transfers.
(b) Total deposits and assets (demand deposits and near-cash deposits).
(c) Cumulative balance during the period.
(d) Data from Bank 4 were omitted as this bank had a negative cumulative balance, contrary to existing
regulations.
(e) Total deposits and assets (demand deposits and near-cash deposits), excluding total deposits from Bank
4.
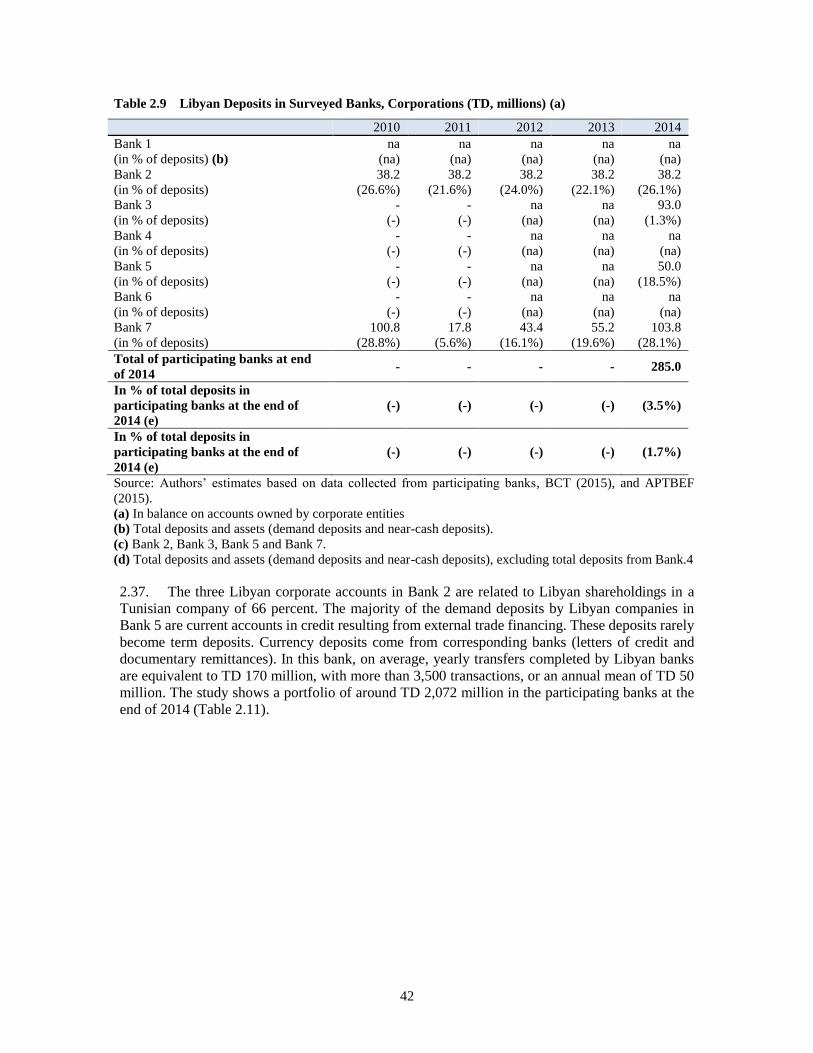
42
Table 2.9 Libyan Deposits in Surveyed Banks, Corporations (TD, millions) (a)
2010 2011 2012 2013 2014
Bank 1
(in % of deposits) (b)
na
(na)
na
(na)
na
(na)
na
(na)
na
(na)
Bank 2
(in % of deposits)
38.2
(26.6%)
38.2
(21.6%)
38.2
(24.0%)
38.2
(22.1%)
38.2
(26.1%)
Bank 3
(in % of deposits)
-
(-)
-
(-)
na
(na)
na
(na)
93.0
(1.3%)
Bank 4
(in % of deposits)
-
(-)
-
(-)
na
(na)
na
(na)
na
(na)
Bank 5
(in % of deposits)
-
(-)
-
(-)
na
(na)
na
(na)
50.0
(18.5%)
Bank 6
(in % of deposits)
-
(-)
-
(-)
na
(na)
na
(na)
na
(na)
Bank 7
(in % of deposits)
100.8
(28.8%)
17.8
(5.6%)
43.4
(16.1%)
55.2
(19.6%)
103.8
(28.1%)
Total of participating banks at end
of 2014 - - - - 285.0
In % of total deposits in
participating banks at the end of
2014 (e)
(-) (-) (-) (-) (3.5%)
In % of total deposits in
participating banks at the end of
2014 (e)
(-) (-) (-) (-) (1.7%)
Source: Authors’ estimates based on data collected from participating banks, BCT (2015), and APTBEF
(2015).
(a) In balance on accounts owned by corporate entities
(b) Total deposits and assets (demand deposits and near-cash deposits).
(c) Bank 2, Bank 3, Bank 5 and Bank 7.
(d) Total deposits and assets (demand deposits and near-cash deposits), excluding total deposits from Bank.4
2.37. The three Libyan corporate accounts in Bank 2 are related to Libyan shareholdings in a
Tunisian company of 66 percent. The majority of the demand deposits by Libyan companies in
Bank 5 are current accounts in credit resulting from external trade financing. These deposits rarely
become term deposits. Currency deposits come from corresponding banks (letters of credit and
documentary remittances). In this bank, on average, yearly transfers completed by Libyan banks
are equivalent to TD 170 million, with more than 3,500 transactions, or an annual mean of TD 50
million. The study shows a portfolio of around TD 2,072 million in the participating banks at the
end of 2014 (Table 2.11).
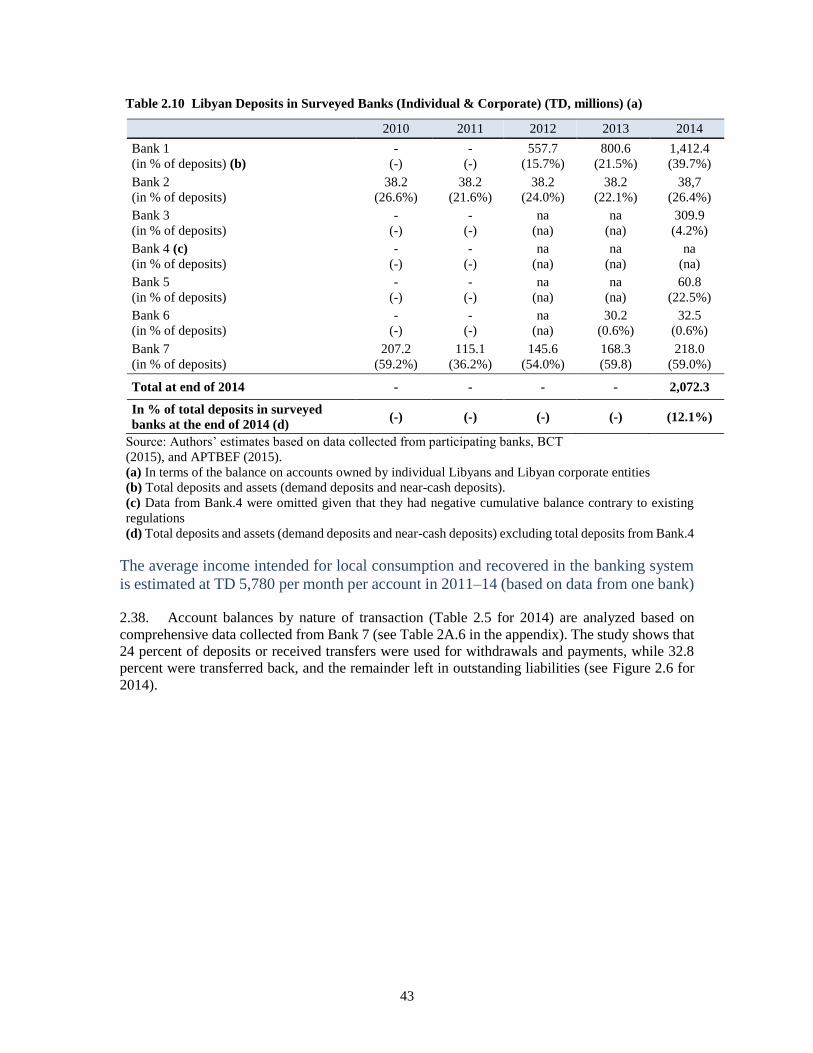
43
Table 2.10 Libyan Deposits in Surveyed Banks (Individual & Corporate) (TD, millions) (a)
2010 2011 2012 2013 2014
Bank 1
(in % of deposits) (b)
-
(-)
-
(-)
557.7
(15.7%)
800.6
(21.5%)
1,412.4
(39.7%)
Bank 2
(in % of deposits)
38.2
(26.6%)
38.2
(21.6%)
38.2
(24.0%)
38.2
(22.1%)
38,7
(26.4%)
Bank 3
(in % of deposits)
-
(-)
-
(-)
na
(na)
na
(na)
309.9
(4.2%)
Bank 4 (c)
(in % of deposits)
-
(-)
-
(-)
na
(na)
na
(na)
na
(na)
Bank 5
(in % of deposits)
-
(-)
-
(-)
na
(na)
na
(na)
60.8
(22.5%)
Bank 6
(in % of deposits)
-
(-)
-
(-)
na
(na)
30.2
(0.6%)
32.5
(0.6%)
Bank 7
(in % of deposits)
207.2
(59.2%)
115.1
(36.2%)
145.6
(54.0%)
168.3
(59.8)
218.0
(59.0%)
Total at end of 2014 - - - - 2,072.3
In % of total deposits in surveyed
banks at the end of 2014 (d) (-) (-) (-) (-) (12.1%)
Source: Authors’ estimates based on data collected from participating banks, BCT
(2015), and APTBEF (2015).
(a) In terms of the balance on accounts owned by individual Libyans and Libyan corporate entities
(b) Total deposits and assets (demand deposits and near-cash deposits).
(c) Data from Bank.4 were omitted given that they had negative cumulative balance contrary to existing
regulations
(d) Total deposits and assets (demand deposits and near-cash deposits) excluding total deposits from Bank.4
The average income intended for local consumption and recovered in the banking system
is estimated at TD 5,780 per month per account in 2011–14 (based on data from one bank)
2.38. Account balances by nature of transaction (Table 2.5 for 2014) are analyzed based on
comprehensive data collected from Bank 7 (see Table 2A.6 in the appendix). The study shows that
24 percent of deposits or received transfers were used for withdrawals and payments, while 32.8
percent were transferred back, and the remainder left in outstanding liabilities (see Figure 2.6 for
2014).
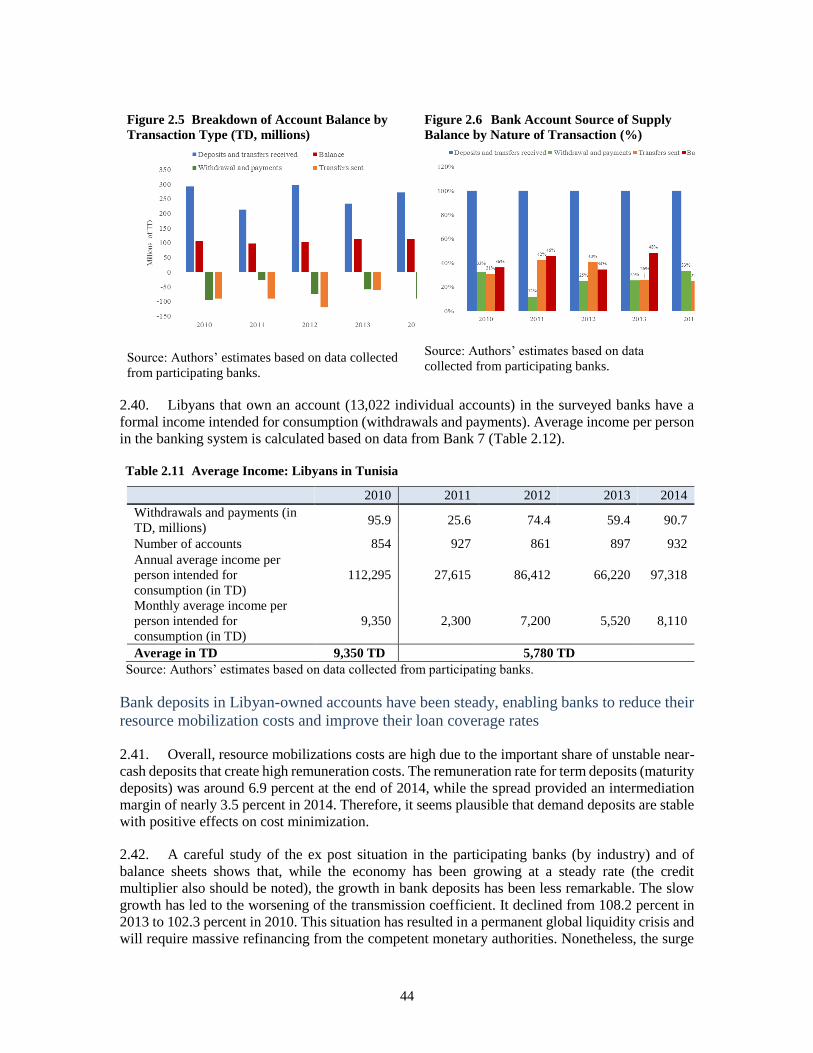
44
Figure 2.5 Breakdown of Account Balance by
Transaction Type (TD, millions)
Source: Authors’ estimates based on data collected
from participating banks.
Figure 2.6 Bank Account Source of Supply
Balance by Nature of Transaction (%)
Source: Authors’ estimates based on data
collected from participating banks.
2.40. Libyans that own an account (13,022 individual accounts) in the surveyed banks have a
formal income intended for consumption (withdrawals and payments). Average income per person
in the banking system is calculated based on data from Bank 7 (Table 2.12). Table 2.11 Average Income: Libyans in Tunisia
2010 2011 2012 2013 2014
Withdrawals and payments (in
TD, millions) 95.9 25.6 74.4 59.4 90.7
Number of accounts 854 927 861 897 932
Annual average income per
person intended for
consumption (in TD)
112,295 27,615 86,412 66,220 97,318
Monthly average income per
person intended for
consumption (in TD)
9,350 2,300 7,200 5,520 8,110
Average in TD 9,350 TD 5,780 TD
Source: Authors’ estimates based on data collected from participating banks.
Bank deposits in Libyan-owned accounts have been steady, enabling banks to reduce their
resource mobilization costs and improve their loan coverage rates
2.41. Overall, resource mobilizations costs are high due to the important share of unstable near-
cash deposits that create high remuneration costs. The remuneration rate for term deposits (maturity
deposits) was around 6.9 percent at the end of 2014, while the spread provided an intermediation
margin of nearly 3.5 percent in 2014. Therefore, it seems plausible that demand deposits are stable
with positive effects on cost minimization.
2.42. A careful study of the ex post situation in the participating banks (by industry) and of
balance sheets shows that, while the economy has been growing at a steady rate (the credit
multiplier also should be noted), the growth in bank deposits has been less remarkable. The slow
growth has led to the worsening of the transmission coefficient. It declined from 108.2 percent in
2013 to 102.3 percent in 2010. This situation has resulted in a permanent global liquidity crisis and
will require massive refinancing from the competent monetary authorities. Nonetheless, the surge
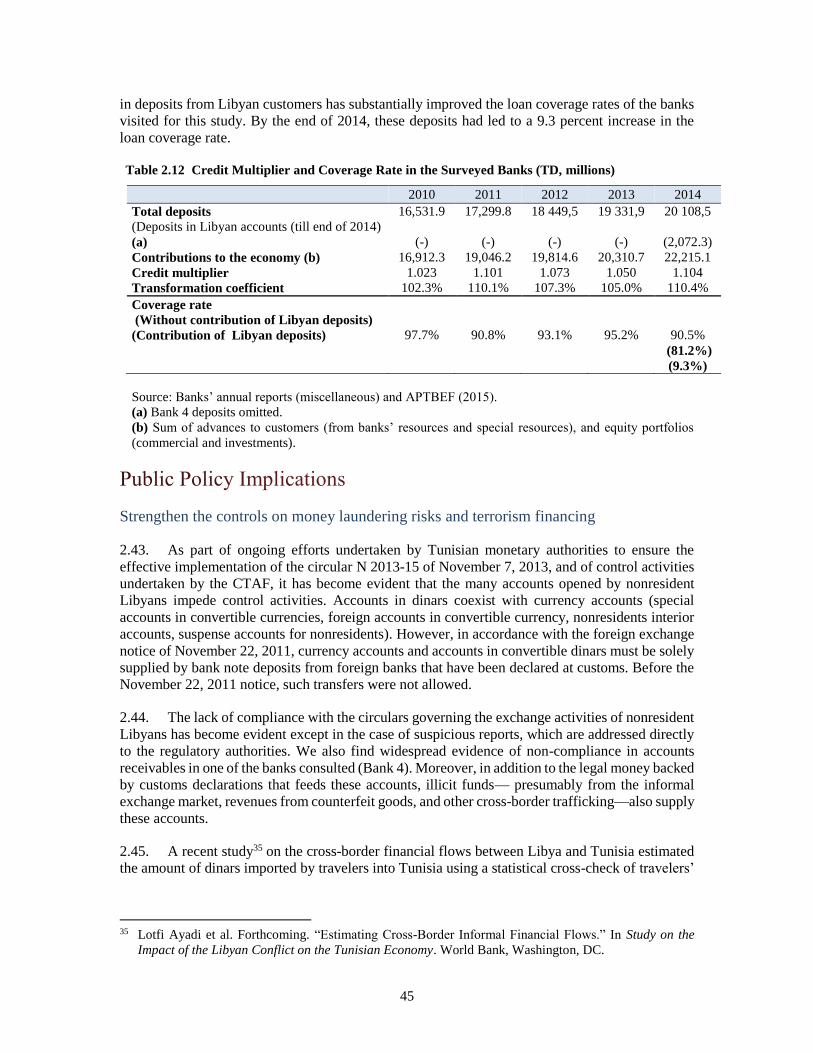
45
in deposits from Libyan customers has substantially improved the loan coverage rates of the banks
visited for this study. By the end of 2014, these deposits had led to a 9.3 percent increase in the
loan coverage rate. Table 2.12 Credit Multiplier and Coverage Rate in the Surveyed Banks (TD, millions)
2010 2011 2012 2013 2014
Total deposits
(Deposits in Libyan accounts (till end of 2014)
(a)
16,531.9
(-)
17,299.8
(-)
18 449,5
(-)
19 331,9
(-)
20 108,5
(2,072.3)
Contributions to the economy (b) 16,912.3 19,046.2 19,814.6 20,310.7 22,215.1
Credit multiplier
Transformation coefficient
1.023
102.3%
1.101
110.1%
1.073
107.3%
1.050
105.0%
1.104
110.4%
Coverage rate
(Without contribution of Libyan deposits)
(Contribution of Libyan deposits) 97.7% 90.8% 93.1% 95.2%
90.5%
(81.2%)
(9.3%)
Source: Banks’ annual reports (miscellaneous) and APTBEF (2015).
(a) Bank 4 deposits omitted.
(b) Sum of advances to customers (from banks’ resources and special resources), and equity portfolios
(commercial and investments).
Strengthen the controls on money laundering risks and terrorism financing
2.43. As part of ongoing efforts undertaken by Tunisian monetary authorities to ensure the
effective implementation of the circular N 2013-15 of November 7, 2013, and of control activities
undertaken by the CTAF, it has become evident that the many accounts opened by nonresident
Libyans impede control activities. Accounts in dinars coexist with currency accounts (special
accounts in convertible currencies, foreign accounts in convertible currency, nonresidents interior
accounts, suspense accounts for nonresidents). However, in accordance with the foreign exchange
notice of November 22, 2011, currency accounts and accounts in convertible dinars must be solely
supplied by bank note deposits from foreign banks that have been declared at customs. Before the
November 22, 2011 notice, such transfers were not allowed.
2.44. The lack of compliance with the circulars governing the exchange activities of nonresident
Libyans has become evident except in the case of suspicious reports, which are addressed directly
to the regulatory authorities. We also find widespread evidence of non-compliance in accounts
receivables in one of the banks consulted (Bank 4). Moreover, in addition to the legal money backed
by customs declarations that feeds these accounts, illicit funds— presumably from the informal
exchange market, revenues from counterfeit goods, and other cross-border trafficking—also supply
these accounts.
2.45. A recent study35 on the cross-border financial flows between Libya and Tunisia estimated
the amount of dinars imported by travelers into Tunisia using a statistical cross-check of travelers’
35 Lotfi Ayadi et al. Forthcoming. “Estimating Cross-Border Informal Financial Flows.” In Study on the
Impact of the Libyan Conflict on the Tunisian Economy. World Bank, Washington, DC.

46
traffic and collected data (see chapter 3). This flow of Libyans dinars, usually exchanged at Sarrafas
in Ben Guerdane and other southern routes, is not declared at customs.
2.46. Informal trade at the Tunisia–Libya border is most often linked to informal or semi-formal
financial flows. The resurgence of informality and cross-border counterfeiting36 in the aftermath of
the Libyan crisis has led to an economic loss estimated at TD 1.2 billion. This loss includes TD
500 billion in uncollected custom fees for products such as cement, concentrated tomato paste,
pasta, home appliances, hydrocarbon, textiles, beef and sheep meat, and more recently, tobacco
(estimates relevant to the end of 2013).
2.47. Similarly, illegal financial transactions at the Libya–Algeria border amounted to more than
TD 1.8 billion, while informal bilateral trade with Libya amounted to about 50 percent of formal
trade with Tunisia.37
2.48. Because of these dynamics, it is important to reduce the number of bank accounts that
Libyans can open, or consolidate these accounts. This will facilitate better monitoring and
classifying accounts by categories of beneficiaries. Such an initiative will align with recent
currency exchange reforms undertaken by the BCT.
Creation of an investment fund to promote economic integration between Tunisia and
Libya
2.49. With the recent tragic events that struck Tunisia and negatively impacted its tourism sector,
there is an imperative to secure, and at the same time sustain, the stream of Libyan deposits in the
banking system. This will be particularly crucial in the case of: (i) the contribution of transfers to
the external balance, and (ii) the contribution of demand deposits to the stability of resources
destined for bank credits.
2.50. The aforementioned developments indicate the real financial potential of the assets owned
by Libyans living in Tunisia (and Tunisians living in Libya) if turned into investments.38 Libyan
direct investment in Tunisia lacks diversity and is mostly concentrated in manufacturing and, until
2013, tourism. Real gains could be made in other sectors, such as agriculture. Authorities could
establish Tunisian–Libyan investment funds created from dormant funds in the two countries.
2.51. Tunisian authorities have historically encouraged capital fund investment activities using
tax incentives. Consequently, this sector experienced great strides, which were facilitated by the
legislative decree of 2011. These changes allowed the separation of the legal and fiscal frameworks.
2.52. However the impact of such changes on financing the larger Tunisian economy, and private
investment in particular, remains limited. Consequently, operators are left with large sums of
money that are not invested. The activity focuses on venture capitalism (at the beginning of the
project) and capital development, with little or no focus on capital amortization, rollover activities
(recovery of a challenged project), and transmission (transition or resumption of projects
challenged by leveraged buyouts).
36 Ayadi, Lotfi, Nancy Benjamin, Sami Bensassi, and Gaël Raballand. 2013. “Estimating Informal Trade
Across Tunisia's Land Borders.” Policy Research Working Paper 6731, World Bank, Washington, DC. 37 For similar evidence on the Tunisia–Libya border, see Haddar (2013). Haddar estimates the volume of
informal exchange transactions at about TD 700 million per year. 38 See sup.
47
2.53. With the ongoing relaxation of capital investment regulations by financial authorities, it is
appropriate to mobilize the financial resources of Libyan residents in Tunisia. This would increase
the impact of the private equity sector, and also better channel remittances toward productive
investments and greater regional inclusion. This option is timely given a flexible regulatory
environment and existing legal and institutional frameworks that have yet to be activated.
2.54. The current regulatory environment is conducive to the development of offshore capital
investment activities. The provision of the financial services code for nonresidents promulgated
under rule N 2009-64 of August 12, 2009, was open to nonresident service providers engaged in
investment, investment fund management, venture capitalism (private equity), and risk insurance.
The code has also incorporated the eligibility of offshore investment funds. However, the
implementing decrees relating to this code have yet to be adopted.
2.55. Investment funds are expected to finance investment projects in priority sectors that are
regionally relevant through the leverage of equity and debt. Thus, an agreement between the Caisse
des Dépôts et Consignations (CDC Management) and the custodians of Libyan deposits could be
reached to channel funds into productive investments. The creation of this sovereign investment
fund as per the code of financial service provision for nonresidents could be dedicated to identify
joint projects (distribution, construction materials, food industry, petrochemical industry, tourism
and recreation, and so forth).
Creation of an investment fund to promote the economic integration of Tunisia and Libya
2.56. In the short and medium term, it is crucial to establish operating procedures for a strategic
partnership and effective ways to optimize the business climate to attract potential Libyan
investment in Tunisia. There is a real potential for Libyan residents to participate in the Tunisian
economy through institutional cooperation and increased alliances.
2.57. Potential initiatives offering the greatest benefits (quick wins) were identified at a 2015
Arab Institute of Business Leaders (L’Institut Arabe des Chefs d’Entreprise; IACE) forum.39 These
development activities should be undertaken by government officials near border areas, and focus
on bilateral trade, natural resources, transport, health and tourism.40 The results of the present study
indicate that the contribution of Libyan bank deposits to spur investment activity could be
strengthened by the following “quick wins”:
Cooperation between the Central Bank of Tunisia and the Central Bank of Libya to liberalize
exchange control between the two countries and establish a secure transfer system to curb the
informal currency exchange market.
A merger between the three Tunisian–Libyan banks (Banque Tuniso-Libyenne; BTL, Alubaf
International Bank and North African International Bank; NAIB), to strengthen state involvement
and prepare this new entity for the financing the reconstruction of Libya.
Following the enactment of the recent law on public–private partnerships and the expected
introduction of a new investment code, there is a need for more ministerial orders to promote
investment in the border region, either offshore (duty-free) or onshore.
The reactivation of the Superior Council of Tunisian–Libyan Investments and the introduction of
an affairs committee, the latter composed of private sector stakeholders from both countries.
The institutional strengthening of the Tunisian–Libyan Chamber of Commerce.
39 Arab Institute of Business Leaders (L’Institut Arabe des Chefs d’Entreprise; IACE). 2015. “La Tunisie et
ses pays voisins: Risques communs et solutions” (June). 40 See appendix 2.
48
Chapter 3 Contraband and Informal Foreign Exchange at the
Tunisia–Libya Border
The events that have occurred in Libya and Tunisia in recent years have had major repercussions
on informal trade—both contraband and the illicit foreign exchange market—between the two
countries. In this chapter, we analyze and evaluate this phenomenon and its evolution over the last
three years. First, we look at the large amounts of currency in the informal foreign exchange market
at the Tunisia–Libya border. In 2013, this amounted to 2.42 billion Tunisian dinars (TD), or about
75 percent of tourism receipts during the same year. In 2015, this amount plummeted to TD 814
million due to two factors: the strong depreciation of the Libyan dinar (LD) in the informal foreign
exchange market, and the sharp decline in the number of Libyan tourists and visitors entering
Tunisia. At the same time, other foreign currencies (U.S. dollars and euros) declared by Libyans
visiting Tunisia at border checkpoints have increased from TD 738 million in 2013 to TD 1.5 billion
in 2014 and TD 1.1 billion in 2015. A large part of this money is revenue from contraband activities
between Algeria and Tunisia that is introduced into the banking system and used to finance
informal trade. Second, we estimate value of contraband (imports and exports) across the Tunisia–
Libya border. Informal goods and merchandise imports from Libya into Tunisia is estimated at TD
596 million in 2015, compared to TD 590 million in 2013. This increase mostly was driven by
informal fuel imports (TD 296.9 million in 2015 against TD 66.8 million in 2013), as informal
imports of non-fuel consumption goods dropped (TD 300 million in 2015 against TD 524 million
in 2013). We estimate the value of informal cigarette imports via the Libyan border at TD 400
million in 2015. Finally, informal exports from Tunisia to Libya seized by Tunisian customs
officials and border police has doubled from TD 496 million in 2013 to TD 1.1 billion in 2015.
Still, an estimated 43,000 tons of legitimate subsidized goods—with a market value of TND 42.8
million—was exported to Libya in 2015. Beyond border policing and control, a comprehensive
reform and development strategy is needed to fight against and reduce informal cross-border trade
in Tunisia. Such a strategy should include reforming administered prices and subsidies, state-
owned enterprise reform, fiscal reform, and an ambitious development program in the border
region.
3.1. For the last five years Libya has been undergoing a revolution that has dismantled the
government and plunged the country into a civil war. Moreover, the Libyan economy is facing
major difficulties, and the situation is worsening daily. Militias have replaced governmental
authority and contrabandists have replaced those operating in the legal business market. Tunisia
cannot escape Libya’s state of affairs as it has a direct impact on Tunisia’s economy and on the
lives of Tunisian citizens living in the Tunisia–Libya border region.
3.2. Libya is Tunisia’s second most important trade and economic partner after the European
Union, and an important part of Tunisia’s industrial sector’s exports are absorbed into the Libyan
economy. The two countries’ 500 kilometer land border facilitates the proliferation of informal
cross-border trade. In addition to sharing a border, Tunisia and Libya have strong cultural and
historical ties, which contributes to a pronounced flow of goods and people between the two
countries. Given all of these elements, the events in Libya necessarily have repercussions on the
border region, and on Tunisia in general.
49
3.3. In normal times, Libyans travel to Tunisia for many reasons, including tourism and
healthcare. Most Libyans enter Tunisia by passenger car, and bring with them cash liquidities that
they exchange in the border’s informal foreign exchange market. Because of the recent large
number of Libyan visitors to Tunisia, liquidity flows circulating in the informal market have
reached critically high levels.
3.4. In 2013 the cash flow volumes in the informal foreign exchange market were as high as 75
percent of all revenues from Tunisia’s tourism sector. The illicit trade of goods also has surged
along the border, and the situation is especially alarming in the tobacco and fuel markets. Haddar
(2014), Joussour (2016), and a World Bank study (2013) have all examined this illicit border trade.
3.5. This report furthers these earlier works in two ways: i) it provides an estimate of the
currency volumes in the informal foreign exchange market, and ii) it gives an update on 2013–15
contraband volumes.
3.6. The 2013 World Bank study defines informal trade as “an inflow of unreported or
underreported goods by Tunisian customs officers.” Large price differences due to asymmetric
subsidy and tariff policies between Tunisia and Libya are a major driver of this informal contraband
trade. For instance, a number of staple foods are subsidized in Tunisia and not in Libya. This leads
to great price disparities for these commodities between the two countries. Similarly, fuel is heavily
subsidized in Libya and not in Tunisia. These important differences in prices create arbitrage
opportunities and thus strong incentives to engage in illicit trade. In addition to disparities in
government subsidies and tariff policies, technical trade barriers in Tunisia lead traders and
businesses to operate in the informal sector.
To evaluate this impact, we use the inflow and outflow of people and vehicles at the
Tunisia–Libya border as proxies for business activity in the region. Since 2013, these
indicators have followed a downward trend (Figure 3.1)
3.7. The number of Libyan visitors entering Tunisia by air, land, and sea totaled 2,236 million
in 2013, before contracting by 46 percent to 1,216 million visitors in 2015. Looking exclusively at
the number of Libyans entering Tunisia via the land border shows a similar trend. Passenger car
travel is the preferred mode of transport for Libyans visiting Tunisia. In 2010, 92 percent of Libyans
that visited Tunisia traveled by car, and in 2014 this number was 74 percent.
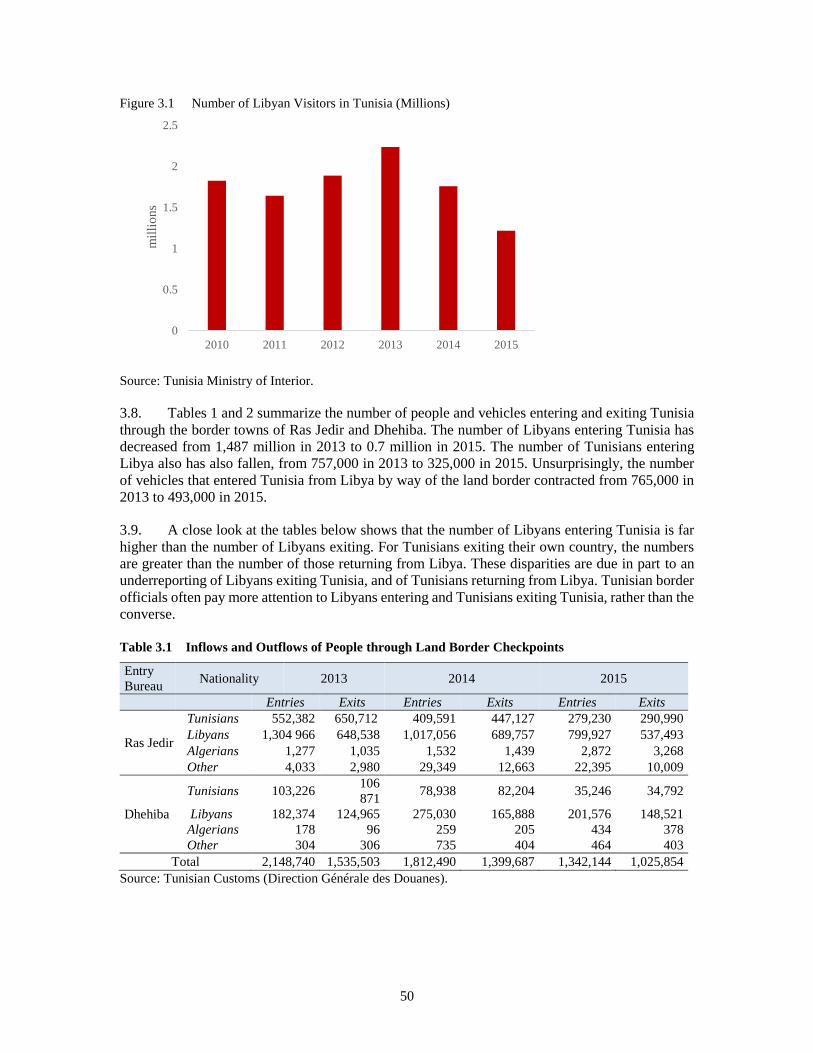
50
Figure 3.1 Number of Libyan Visitors in Tunisia (Millions)
Source: Tunisia Ministry of Interior.
3.8. Tables 1 and 2 summarize the number of people and vehicles entering and exiting Tunisia
through the border towns of Ras Jedir and Dhehiba. The number of Libyans entering Tunisia has
decreased from 1,487 million in 2013 to 0.7 million in 2015. The number of Tunisians entering
Libya also has also fallen, from 757,000 in 2013 to 325,000 in 2015. Unsurprisingly, the number
of vehicles that entered Tunisia from Libya by way of the land border contracted from 765,000 in
2013 to 493,000 in 2015.
3.9. A close look at the tables below shows that the number of Libyans entering Tunisia is far
higher than the number of Libyans exiting. For Tunisians exiting their own country, the numbers
are greater than the number of those returning from Libya. These disparities are due in part to an
underreporting of Libyans exiting Tunisia, and of Tunisians returning from Libya. Tunisian border
officials often pay more attention to Libyans entering and Tunisians exiting Tunisia, rather than the
converse.
Table 3.1 Inflows and Outflows of People through Land Border Checkpoints
Entry
Bureau Nationality 2013 2014 2015
Entries Exits Entries Exits Entries Exits
Ras Jedir
Tunisians 552,382 650,712 409,591 447,127 279,230 290,990
Libyans 1,304 966 648,538 1,017,056 689,757 799,927 537,493
Algerians 1,277 1,035 1,532 1,439 2,872 3,268
Other 4,033 2,980 29,349 12,663 22,395 10,009
Dhehiba
Tunisians 103,226 106
871 78,938 82,204 35,246 34,792
Libyans 182,374 124,965 275,030 165,888 201,576 148,521
Algerians 178 96 259 205 434 378
Other 304 306 735 404 464 403
Total 2,148,740 1,535,503 1,812,490 1,399,687 1,342,144 1,025,854
Source: Tunisian Customs (Direction Générale des Douanes).
0
0.5
1
1.5
2
2.5
2010 2011 2012 2013 2014 2015
mil
lio
ns
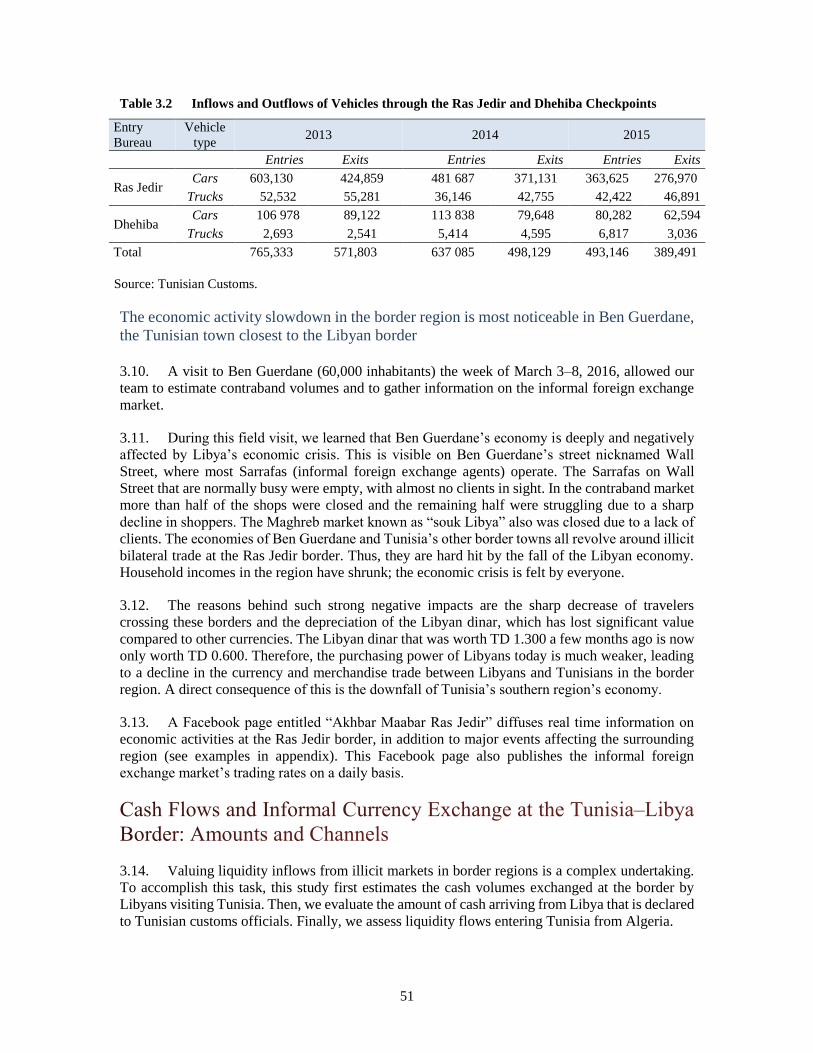
51
Table 3.2 Inflows and Outflows of Vehicles through the Ras Jedir and Dhehiba Checkpoints
Entry
Bureau
Vehicle
type 2013 2014 2015
Entries Exits Entries Exits Entries Exits
Ras Jedir Cars 603,130 424,859 481 687 371,131 363,625 276,970
Trucks 52,532 55,281 36,146 42,755 42,422 46,891
Dhehiba Cars 106 978 89,122 113 838 79,648 80,282 62,594
Trucks 2,693 2,541 5,414 4,595 6,817 3,036
Total 765,333 571,803 637 085 498,129 493,146 389,491
Source: Tunisian Customs.
The economic activity slowdown in the border region is most noticeable in Ben Guerdane,
the Tunisian town closest to the Libyan border
3.10. A visit to Ben Guerdane (60,000 inhabitants) the week of March 3–8, 2016, allowed our
team to estimate contraband volumes and to gather information on the informal foreign exchange
market.
3.11. During this field visit, we learned that Ben Guerdane’s economy is deeply and negatively
affected by Libya’s economic crisis. This is visible on Ben Guerdane’s street nicknamed Wall
Street, where most Sarrafas (informal foreign exchange agents) operate. The Sarrafas on Wall
Street that are normally busy were empty, with almost no clients in sight. In the contraband market
more than half of the shops were closed and the remaining half were struggling due to a sharp
decline in shoppers. The Maghreb market known as “souk Libya” also was closed due to a lack of
clients. The economies of Ben Guerdane and Tunisia’s other border towns all revolve around illicit
bilateral trade at the Ras Jedir border. Thus, they are hard hit by the fall of the Libyan economy.
Household incomes in the region have shrunk; the economic crisis is felt by everyone.
3.12. The reasons behind such strong negative impacts are the sharp decrease of travelers
crossing these borders and the depreciation of the Libyan dinar, which has lost significant value
compared to other currencies. The Libyan dinar that was worth TD 1.300 a few months ago is now
only worth TD 0.600. Therefore, the purchasing power of Libyans today is much weaker, leading
to a decline in the currency and merchandise trade between Libyans and Tunisians in the border
region. A direct consequence of this is the downfall of Tunisia’s southern region’s economy.
3.13. A Facebook page entitled “Akhbar Maabar Ras Jedir” diffuses real time information on
economic activities at the Ras Jedir border, in addition to major events affecting the surrounding
region (see examples in appendix). This Facebook page also publishes the informal foreign
exchange market’s trading rates on a daily basis.
3.14. Valuing liquidity inflows from illicit markets in border regions is a complex undertaking.
To accomplish this task, this study first estimates the cash volumes exchanged at the border by
Libyans visiting Tunisia. Then, we evaluate the amount of cash arriving from Libya that is declared
to Tunisian customs officials. Finally, we assess liquidity flows entering Tunisia from Algeria.
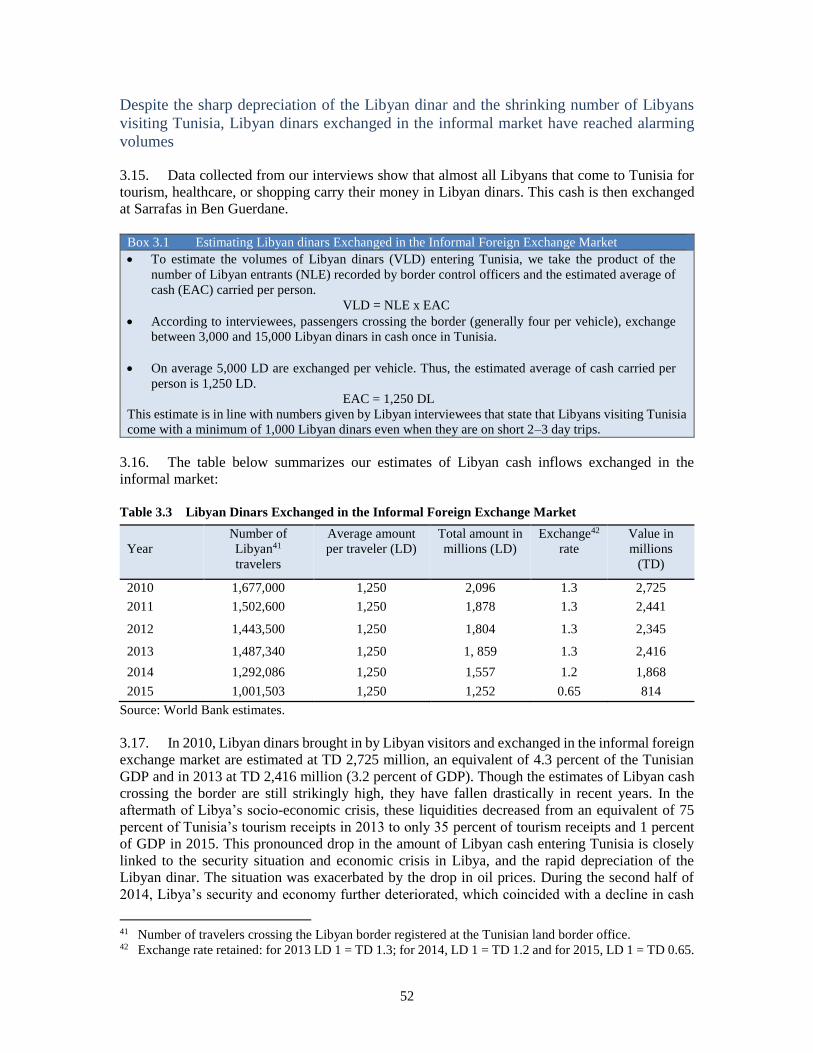
52
Despite the sharp depreciation of the Libyan dinar and the shrinking number of Libyans
visiting Tunisia, Libyan dinars exchanged in the informal market have reached alarming
volumes
3.15. Data collected from our interviews show that almost all Libyans that come to Tunisia for
tourism, healthcare, or shopping carry their money in Libyan dinars. This cash is then exchanged
at Sarrafas in Ben Guerdane.
Box 3.1 Estimating Libyan dinars Exchanged in the Informal Foreign Exchange Market
To estimate the volumes of Libyan dinars (VLD) entering Tunisia, we take the product of the
number of Libyan entrants (NLE) recorded by border control officers and the estimated average of
cash (EAC) carried per person.
VLD = NLE x EAC
According to interviewees, passengers crossing the border (generally four per vehicle), exchange
between 3,000 and 15,000 Libyan dinars in cash once in Tunisia.
On average 5,000 LD are exchanged per vehicle. Thus, the estimated average of cash carried per
person is 1,250 LD.
EAC = 1,250 DL
This estimate is in line with numbers given by Libyan interviewees that state that Libyans visiting Tunisia
come with a minimum of 1,000 Libyan dinars even when they are on short 2–3 day trips.
3.16. The table below summarizes our estimates of Libyan cash inflows exchanged in the
informal market:
Table 3.3 Libyan Dinars Exchanged in the Informal Foreign Exchange Market
Source: World Bank estimates.
3.17. In 2010, Libyan dinars brought in by Libyan visitors and exchanged in the informal foreign
exchange market are estimated at TD 2,725 million, an equivalent of 4.3 percent of the Tunisian
GDP and in 2013 at TD 2,416 million (3.2 percent of GDP). Though the estimates of Libyan cash
crossing the border are still strikingly high, they have fallen drastically in recent years. In the
aftermath of Libya’s socio-economic crisis, these liquidities decreased from an equivalent of 75
percent of Tunisia’s tourism receipts in 2013 to only 35 percent of tourism receipts and 1 percent
of GDP in 2015. This pronounced drop in the amount of Libyan cash entering Tunisia is closely
linked to the security situation and economic crisis in Libya, and the rapid depreciation of the
Libyan dinar. The situation was exacerbated by the drop in oil prices. During the second half of
2014, Libya’s security and economy further deteriorated, which coincided with a decline in cash
41 Number of travelers crossing the Libyan border registered at the Tunisian land border office. 42 Exchange rate retained: for 2013 LD 1 = TD 1.3; for 2014, LD 1 = TD 1.2 and for 2015, LD 1 = TD 0.65.
Year
Number of
Libyan41
travelers
Average amount
per traveler (LD)
Total amount in
millions (LD)
Exchange42
rate
Value in
millions
(TD)
2010 1,677,000 1,250 2,096 1.3 2,725
2011 1,502,600 1,250 1,878 1.3 2,441
2012 1,443,500 1,250 1,804 1.3 2,345
2013 1,487,340 1,250 1, 859 1.3 2,416
2014 1,292,086 1,250 1,557 1.2 1,868
2015 1,001,503 1,250 1,252 0.65 814
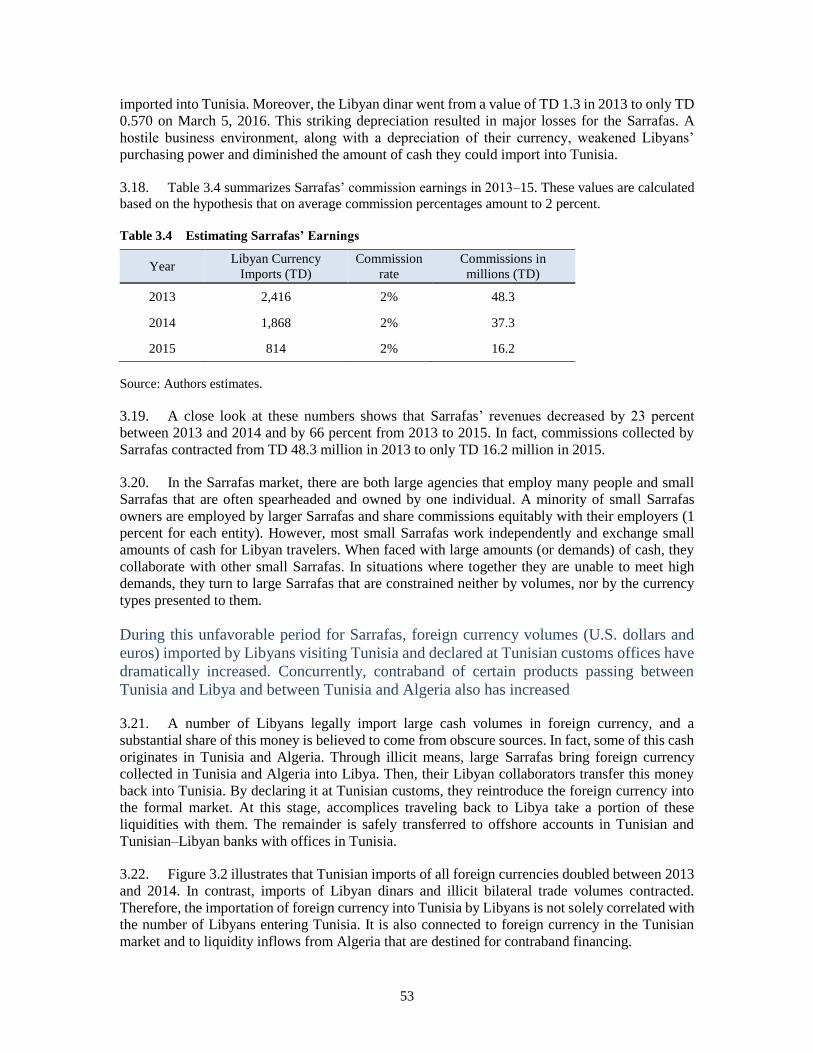
53
imported into Tunisia. Moreover, the Libyan dinar went from a value of TD 1.3 in 2013 to only TD
0.570 on March 5, 2016. This striking depreciation resulted in major losses for the Sarrafas. A
hostile business environment, along with a depreciation of their currency, weakened Libyans’
purchasing power and diminished the amount of cash they could import into Tunisia.
3.18. Table 3.4 summarizes Sarrafas’ commission earnings in 2013–15. These values are calculated
based on the hypothesis that on average commission percentages amount to 2 percent.
Table 3.4 Estimating Sarrafas’ Earnings
Source: Authors estimates.
3.19. A close look at these numbers shows that Sarrafas’ revenues decreased by 23 percent
between 2013 and 2014 and by 66 percent from 2013 to 2015. In fact, commissions collected by
Sarrafas contracted from TD 48.3 million in 2013 to only TD 16.2 million in 2015.
3.20. In the Sarrafas market, there are both large agencies that employ many people and small
Sarrafas that are often spearheaded and owned by one individual. A minority of small Sarrafas
owners are employed by larger Sarrafas and share commissions equitably with their employers (1
percent for each entity). However, most small Sarrafas work independently and exchange small
amounts of cash for Libyan travelers. When faced with large amounts (or demands) of cash, they
collaborate with other small Sarrafas. In situations where together they are unable to meet high
demands, they turn to large Sarrafas that are constrained neither by volumes, nor by the currency
types presented to them.
During this unfavorable period for Sarrafas, foreign currency volumes (U.S. dollars and
euros) imported by Libyans visiting Tunisia and declared at Tunisian customs offices have
dramatically increased. Concurrently, contraband of certain products passing between
Tunisia and Libya and between Tunisia and Algeria also has increased
3.21. A number of Libyans legally import large cash volumes in foreign currency, and a
substantial share of this money is believed to come from obscure sources. In fact, some of this cash
originates in Tunisia and Algeria. Through illicit means, large Sarrafas bring foreign currency
collected in Tunisia and Algeria into Libya. Then, their Libyan collaborators transfer this money
back into Tunisia. By declaring it at Tunisian customs, they reintroduce the foreign currency into
the formal market. At this stage, accomplices traveling back to Libya take a portion of these
liquidities with them. The remainder is safely transferred to offshore accounts in Tunisian and
Tunisian–Libyan banks with offices in Tunisia.
3.22. Figure 3.2 illustrates that Tunisian imports of all foreign currencies doubled between 2013
and 2014. In contrast, imports of Libyan dinars and illicit bilateral trade volumes contracted.
Therefore, the importation of foreign currency into Tunisia by Libyans is not solely correlated with
the number of Libyans entering Tunisia. It is also connected to foreign currency in the Tunisian
market and to liquidity inflows from Algeria that are destined for contraband financing.
Year Libyan Currency
Imports (TD)
Commission
rate
Commissions in
millions (TD)
2013 2,416 2% 48.3
2014 1,868 2% 37.3
2015 814 2% 16.2
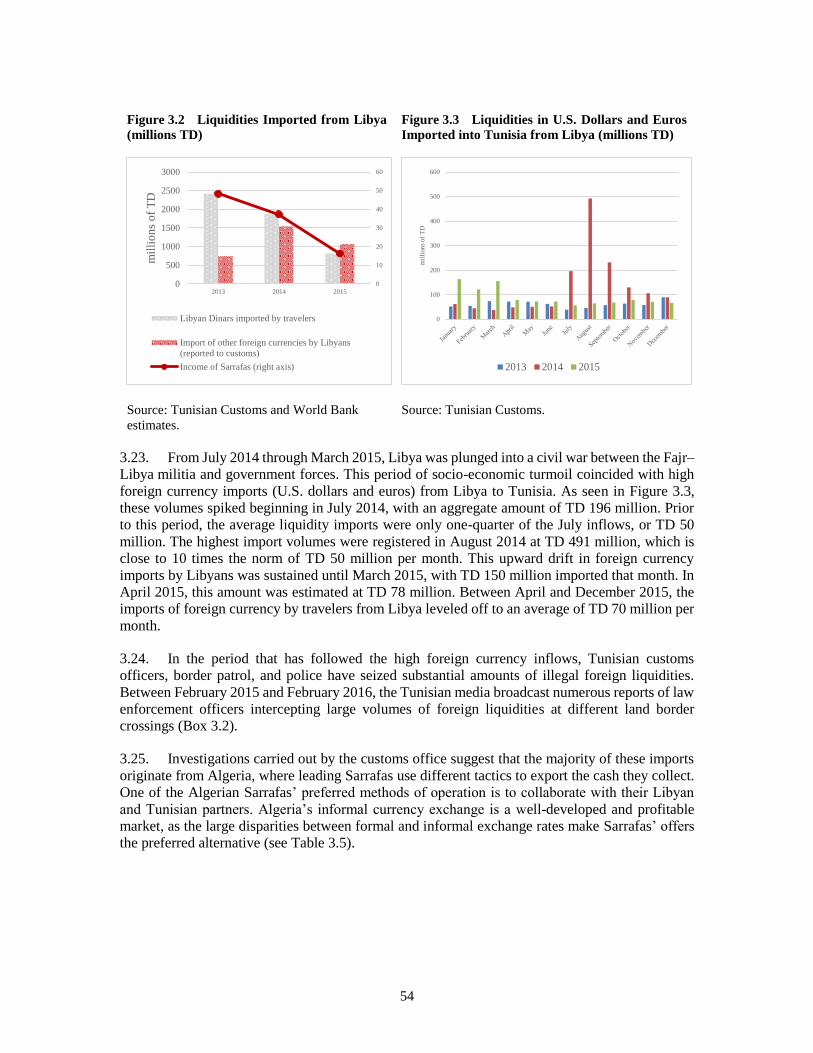
54
Figure 3.2 Liquidities Imported from Libya
(millions TD)
Figure 3.3 Liquidities in U.S. Dollars and Euros
Imported into Tunisia from Libya (millions TD)
Source: Tunisian Customs and World Bank
estimates.
Source: Tunisian Customs.
3.23. From July 2014 through March 2015, Libya was plunged into a civil war between the Fajr–
Libya militia and government forces. This period of socio-economic turmoil coincided with high
foreign currency imports (U.S. dollars and euros) from Libya to Tunisia. As seen in Figure 3.3,
these volumes spiked beginning in July 2014, with an aggregate amount of TD 196 million. Prior
to this period, the average liquidity imports were only one-quarter of the July inflows, or TD 50
million. The highest import volumes were registered in August 2014 at TD 491 million, which is
close to 10 times the norm of TD 50 million per month. This upward drift in foreign currency
imports by Libyans was sustained until March 2015, with TD 150 million imported that month. In
April 2015, this amount was estimated at TD 78 million. Between April and December 2015, the
imports of foreign currency by travelers from Libya leveled off to an average of TD 70 million per
month.
3.24. In the period that has followed the high foreign currency inflows, Tunisian customs
officers, border patrol, and police have seized substantial amounts of illegal foreign liquidities.
Between February 2015 and February 2016, the Tunisian media broadcast numerous reports of law
enforcement officers intercepting large volumes of foreign liquidities at different land border
crossings (Box 3.2).
3.25. Investigations carried out by the customs office suggest that the majority of these imports
originate from Algeria, where leading Sarrafas use different tactics to export the cash they collect.
One of the Algerian Sarrafas’ preferred methods of operation is to collaborate with their Libyan
and Tunisian partners. Algeria’s informal currency exchange is a well-developed and profitable
market, as the large disparities between formal and informal exchange rates make Sarrafas’ offers
the preferred alternative (see Table 3.5).
0
10
20
30
40
50
60
0
500
1000
1500
2000
2500
3000
2013 2014 2015
mil
lio
ns
of
TD
Libyan Dinars imported by travelers
Import of other foreign currencies by Libyans
(reported to customs)
Income of Sarrafas (right axis)
0
100
200
300
400
500
600
mil
lion
s of
TD
2013 2014 2015
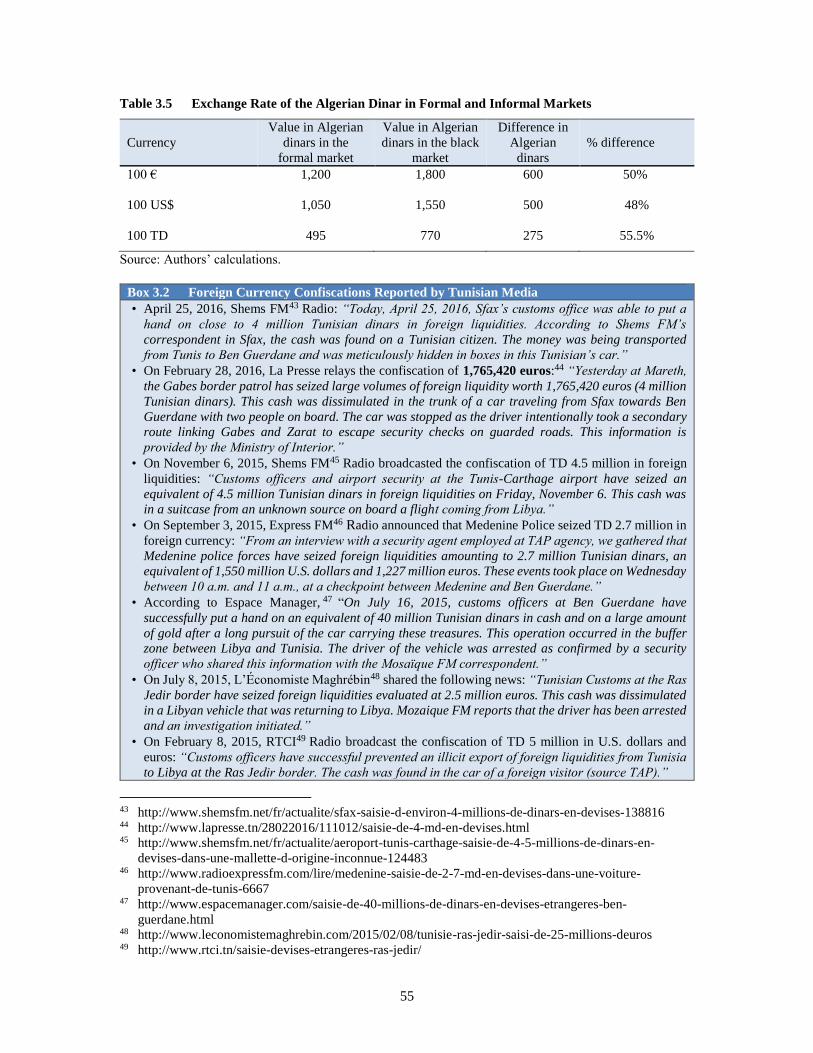
55
Table 3.5 Exchange Rate of the Algerian Dinar in Formal and Informal Markets
Currency
Value in Algerian
dinars in the
formal market
Value in Algerian
dinars in the black
market
Difference in
Algerian
dinars
% difference
100 € 1,200 1,800
600 50%
100 US$ 1,050 1,550
500 48%
100 TD 495 770 275 55.5%
Source: Authors’ calculations.
Box 3.2 Foreign Currency Confiscations Reported by Tunisian Media
• April 25, 2016, Shems FM43 Radio: “Today, April 25, 2016, Sfax’s customs office was able to put a
hand on close to 4 million Tunisian dinars in foreign liquidities. According to Shems FM’s
correspondent in Sfax, the cash was found on a Tunisian citizen. The money was being transported
from Tunis to Ben Guerdane and was meticulously hidden in boxes in this Tunisian’s car.”
• On February 28, 2016, La Presse relays the confiscation of 1,765,420 euros:44 “Yesterday at Mareth,
the Gabes border patrol has seized large volumes of foreign liquidity worth 1,765,420 euros (4 million
Tunisian dinars). This cash was dissimulated in the trunk of a car traveling from Sfax towards Ben
Guerdane with two people on board. The car was stopped as the driver intentionally took a secondary
route linking Gabes and Zarat to escape security checks on guarded roads. This information is
provided by the Ministry of Interior.”
• On November 6, 2015, Shems FM45 Radio broadcasted the confiscation of TD 4.5 million in foreign
liquidities: “Customs officers and airport security at the Tunis-Carthage airport have seized an
equivalent of 4.5 million Tunisian dinars in foreign liquidities on Friday, November 6. This cash was
in a suitcase from an unknown source on board a flight coming from Libya.”
• On September 3, 2015, Express FM46 Radio announced that Medenine Police seized TD 2.7 million in
foreign currency: “From an interview with a security agent employed at TAP agency, we gathered that
Medenine police forces have seized foreign liquidities amounting to 2.7 million Tunisian dinars, an
equivalent of 1,550 million U.S. dollars and 1,227 million euros. These events took place on Wednesday
between 10 a.m. and 11 a.m., at a checkpoint between Medenine and Ben Guerdane.”
• According to Espace Manager, 47 “On July 16, 2015, customs officers at Ben Guerdane have
successfully put a hand on an equivalent of 40 million Tunisian dinars in cash and on a large amount
of gold after a long pursuit of the car carrying these treasures. This operation occurred in the buffer
zone between Libya and Tunisia. The driver of the vehicle was arrested as confirmed by a security
officer who shared this information with the Mosaïque FM correspondent.”
• On July 8, 2015, L’Économiste Maghrébin48 shared the following news: “Tunisian Customs at the Ras
Jedir border have seized foreign liquidities evaluated at 2.5 million euros. This cash was dissimulated
in a Libyan vehicle that was returning to Libya. Mozaique FM reports that the driver has been arrested
and an investigation initiated.”
• On February 8, 2015, RTCI49 Radio broadcast the confiscation of TD 5 million in U.S. dollars and
euros: “Customs officers have successful prevented an illicit export of foreign liquidities from Tunisia
to Libya at the Ras Jedir border. The cash was found in the car of a foreign visitor (source TAP).”
43 http://www.shemsfm.net/fr/actualite/sfax-saisie-d-environ-4-millions-de-dinars-en-devises-138816 44 http://www.lapresse.tn/28022016/111012/saisie-de-4-md-en-devises.html 45 http://www.shemsfm.net/fr/actualite/aeroport-tunis-carthage-saisie-de-4-5-millions-de-dinars-en-
devises-dans-une-mallette-d-origine-inconnue-124483 46 http://www.radioexpressfm.com/lire/medenine-saisie-de-2-7-md-en-devises-dans-une-voiture-
provenant-de-tunis-6667 47 http://www.espacemanager.com/saisie-de-40-millions-de-dinars-en-devises-etrangeres-ben-
guerdane.html 48 http://www.leconomistemaghrebin.com/2015/02/08/tunisie-ras-jedir-saisi-de-25-millions-deuros 49 http://www.rtci.tn/saisie-devises-etrangeres-ras-jedir/
56
The cash flows circulating in the informal foreign exchange market are central to
contraband financing
3.26. The comparative advantage of Sarrafas is their wide network of business partners spread
across Tunisia, Libya, and Algeria—and potentially other countries. As a well-organized group
with efficiencies gained from experience, Sarrafas can offer businesspersons and contraband
traders what the legal banking sector cannot provide: instantaneous international financial
operations with minimal or no paperwork. All that is required is a phone call. In the formal banking
sector, such operations would take several days and involve considerable paperwork. In contrast,
large Sarrafas in Ben Guerdane that have decades-long partnerships with Sarrafas in Libya and
Algeria are able to ensure fluid transactions regardless of the cash volume involved.
3.27. The main sources for these Sarrafas are the following:
Funds collected from Libyan travelers purchasing Tunisian dinars from small Sarrafas on the
streets of Ben Guerdane.
Cash in Libyan dinars and foreign currencies imported by Libyan travelers visiting Tunisia.
Remittances from Tunisians working and residing in Libya.
Funds collected from the informal foreign exchange market in Tunisian territories and brought
into the country by tourists or Tunisians living abroad.
Cash collected in foreign countries from expatriate Tunisians.
3.28. Liquidities collected inside Tunisia are illegally exported to Libya. From Libya, the money
is transferred and deposited in overseas banks. Most of these banks are in Turkey and the United
Arab Emirates. These deposits are accomplished following one of the scenarios described in Box
3.3.
Box 3.3 How Liquidities Circulate to Finance Contraband
1. A Libyan traveler carries large volumes of cash on a trip to Istanbul, Dubai, or Abu Dhabi. At the
destination the money is deposited in a bank account. This journey, that sometimes involves a
layover in a Tunisian 50 airport, begins inside Libyan territory.
2. Liquidities are transferred from Libya to other countries under the guise of paying for fictitious or
over-taxed purchases—but this is a ruse to enable the illicit export of a currency. This method is
very lucrative for Libyan intermediaries who speculate on the differences between official exchange
rates and the prevailing rates in the informal sector. On March 5, 2016, the official rate was €1 for
LD 1.53 and the informal market rate was €1 for LD 4.
3. Sarrafas illegally export funds from Tunisia to Libya. Their partners in Libya then transport these
liquidities back into Tunisia where they are declared at border customs (Ras Jedir and Dhehiba),
and at Tunis Carthage, Sfax, and Monastir airports. Upon declaring these large volumes of cash,
agents deposit this cash in Tunisian banks and Tunisian–Libyan banks from where the funds can be
legally transferred to any foreign country. This money laundering method has worked decades,
enabling the financing of business transactions in the informal sector and the acquisition of assets
overseas.
3.29. Sarrafas in Ben Guerdane control cash flows beyond the Tunisia–Libya border; their reach
extends to Tunisia’s border with Algeria. Moreover, Sarrafas play a role in cash flows that enter
Tunisia illegally through the country’s air and sea frontiers, and this with the complicity of corrupt
officials.
50 http://www.shemsfm.net/fr/actualite/aeroport-tunis-carthage-saisie-de-4-5-millions-de-dinars-en-
devises-dans-une-mallette-d-origine-inconnue-124483
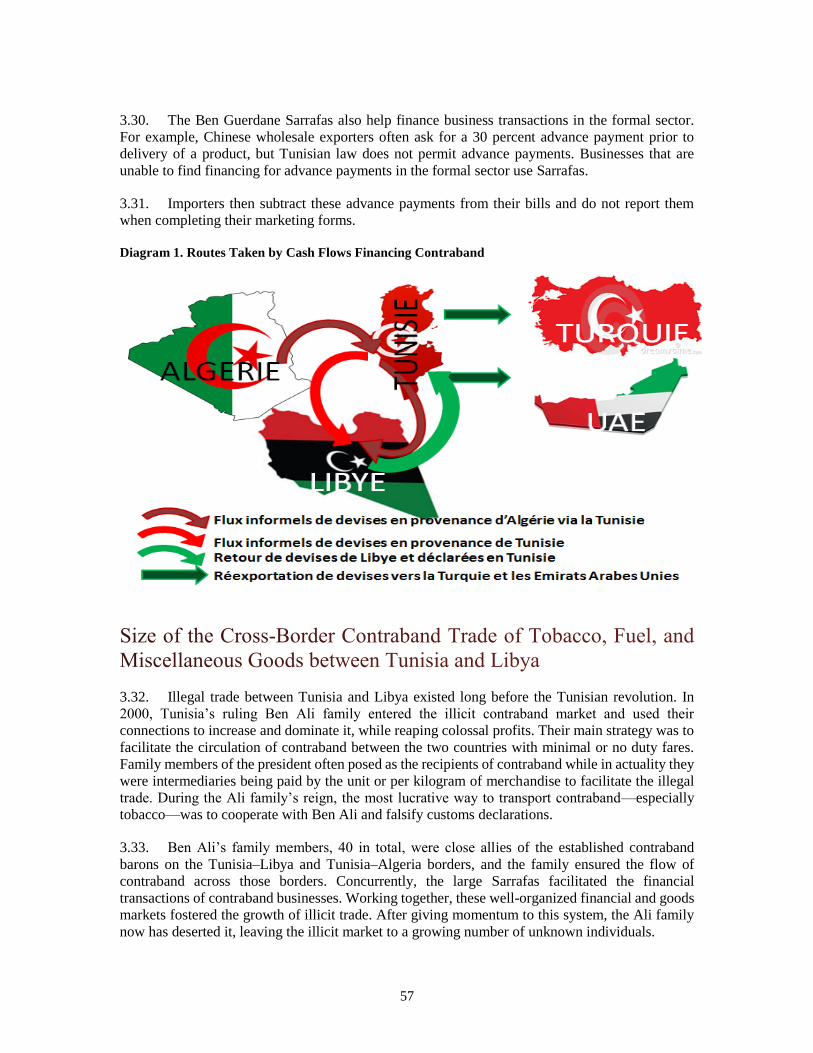
57
3.30. The Ben Guerdane Sarrafas also help finance business transactions in the formal sector.
For example, Chinese wholesale exporters often ask for a 30 percent advance payment prior to
delivery of a product, but Tunisian law does not permit advance payments. Businesses that are
unable to find financing for advance payments in the formal sector use Sarrafas.
3.31. Importers then subtract these advance payments from their bills and do not report them
when completing their marketing forms. Diagram 1. Routes Taken by Cash Flows Financing Contraband
3.32. Illegal trade between Tunisia and Libya existed long before the Tunisian revolution. In
2000, Tunisia’s ruling Ben Ali family entered the illicit contraband market and used their
connections to increase and dominate it, while reaping colossal profits. Their main strategy was to
facilitate the circulation of contraband between the two countries with minimal or no duty fares.
Family members of the president often posed as the recipients of contraband while in actuality they
were intermediaries being paid by the unit or per kilogram of merchandise to facilitate the illegal
trade. During the Ali family’s reign, the most lucrative way to transport contraband—especially
tobacco—was to cooperate with Ben Ali and falsify customs declarations.
3.33. Ben Ali’s family members, 40 in total, were close allies of the established contraband
barons on the Tunisia–Libya and Tunisia–Algeria borders, and the family ensured the flow of
contraband across those borders. Concurrently, the large Sarrafas facilitated the financial
transactions of contraband businesses. Working together, these well-organized financial and goods
markets fostered the growth of illicit trade. After giving momentum to this system, the Ali family
now has deserted it, leaving the illicit market to a growing number of unknown individuals.
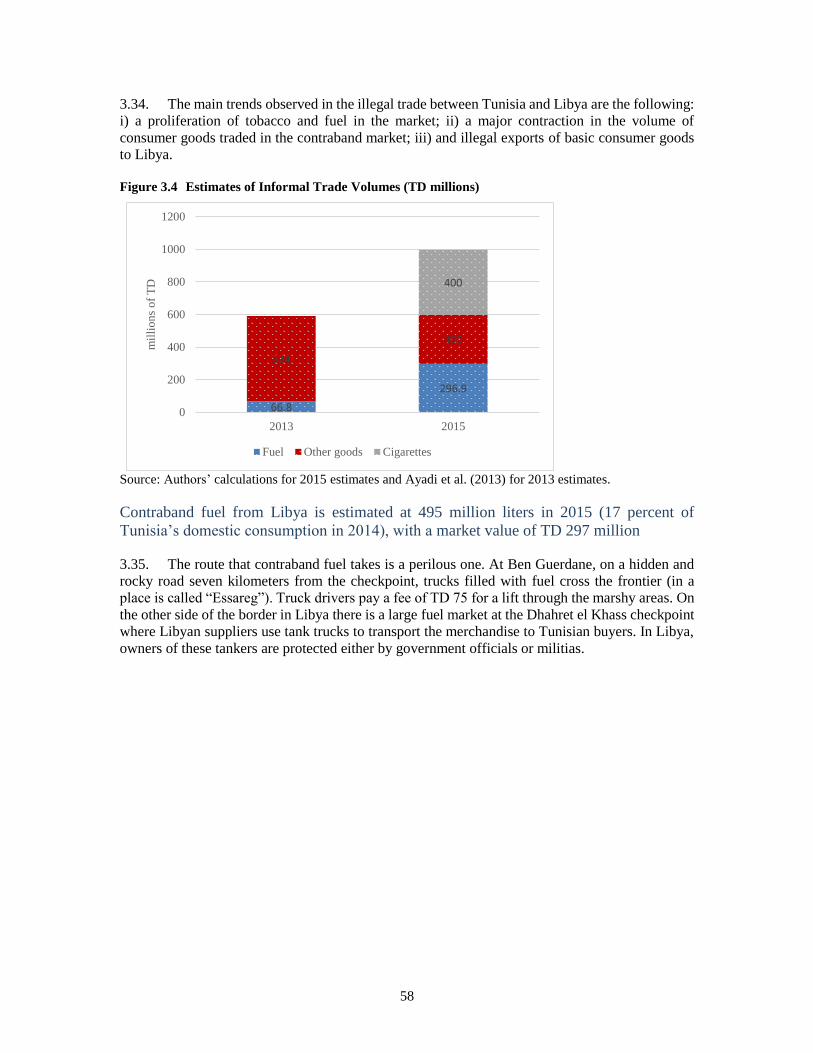
58
3.34. The main trends observed in the illegal trade between Tunisia and Libya are the following:
i) a proliferation of tobacco and fuel in the market; ii) a major contraction in the volume of
consumer goods traded in the contraband market; iii) and illegal exports of basic consumer goods
to Libya. Figure 3.4 Estimates of Informal Trade Volumes (TD millions)
Source: Authors’ calculations for 2015 estimates and Ayadi et al. (2013) for 2013 estimates.
Contraband fuel from Libya is estimated at 495 million liters in 2015 (17 percent of
Tunisia’s domestic consumption in 2014), with a market value of TD 297 million
3.35. The route that contraband fuel takes is a perilous one. At Ben Guerdane, on a hidden and
rocky road seven kilometers from the checkpoint, trucks filled with fuel cross the frontier (in a
place is called “Essareg”). Truck drivers pay a fee of TD 75 for a lift through the marshy areas. On
the other side of the border in Libya there is a large fuel market at the Dhahret el Khass checkpoint
where Libyan suppliers use tank trucks to transport the merchandise to Tunisian buyers. In Libya,
owners of these tankers are protected either by government officials or militias.
66.8
296.9
524
300
400
0
200
400
600
800
1000
1200
2013 2015
mil
lio
ns
of
TD
Fuel Other goods Cigarettes
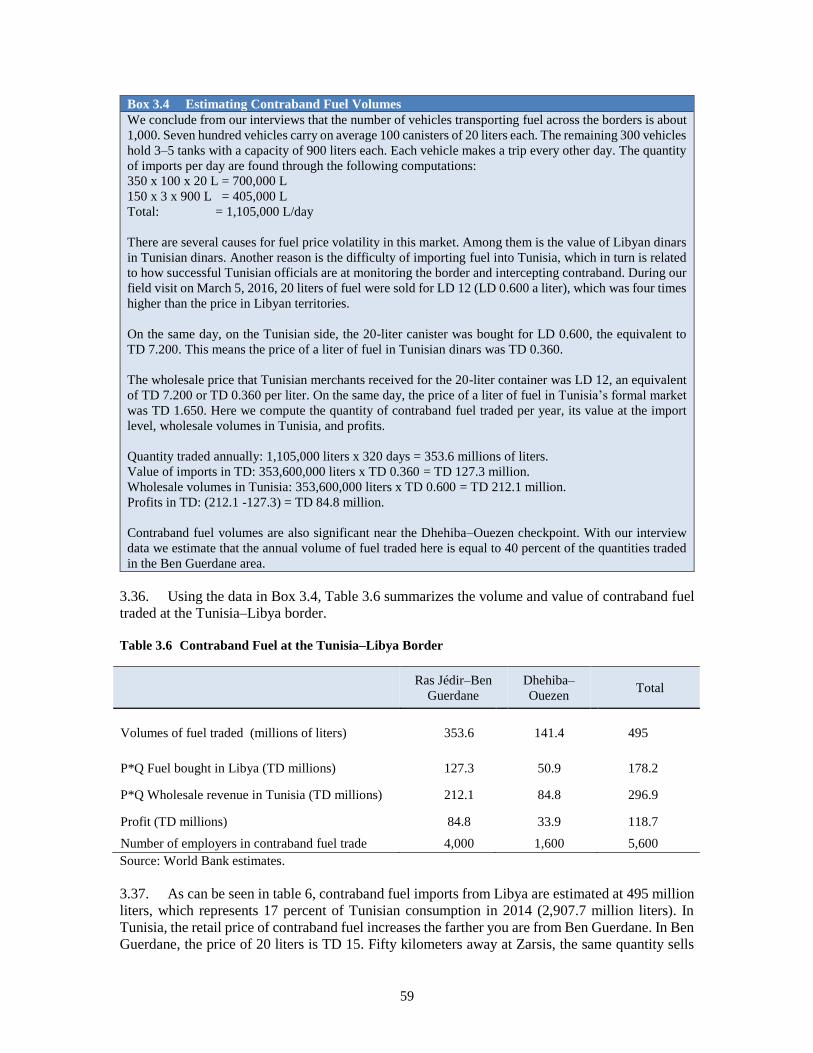
59
Box 3.4 Estimating Contraband Fuel Volumes
We conclude from our interviews that the number of vehicles transporting fuel across the borders is about
1,000. Seven hundred vehicles carry on average 100 canisters of 20 liters each. The remaining 300 vehicles
hold 3–5 tanks with a capacity of 900 liters each. Each vehicle makes a trip every other day. The quantity
of imports per day are found through the following computations:
350 x 100 x 20 L = 700,000 L
150 x 3 x 900 L = 405,000 L
Total: = 1,105,000 L/day
There are several causes for fuel price volatility in this market. Among them is the value of Libyan dinars
in Tunisian dinars. Another reason is the difficulty of importing fuel into Tunisia, which in turn is related
to how successful Tunisian officials are at monitoring the border and intercepting contraband. During our
field visit on March 5, 2016, 20 liters of fuel were sold for LD 12 (LD 0.600 a liter), which was four times
higher than the price in Libyan territories.
On the same day, on the Tunisian side, the 20-liter canister was bought for LD 0.600, the equivalent to
TD 7.200. This means the price of a liter of fuel in Tunisian dinars was TD 0.360.
The wholesale price that Tunisian merchants received for the 20-liter container was LD 12, an equivalent
of TD 7.200 or TD 0.360 per liter. On the same day, the price of a liter of fuel in Tunisia’s formal market
was TD 1.650. Here we compute the quantity of contraband fuel traded per year, its value at the import
level, wholesale volumes in Tunisia, and profits.
Quantity traded annually: 1,105,000 liters x 320 days = 353.6 millions of liters.
Value of imports in TD: 353,600,000 liters x TD 0.360 = TD 127.3 million.
Wholesale volumes in Tunisia: 353,600,000 liters x TD 0.600 = TD 212.1 million.
Profits in TD: (212.1 -127.3) = TD 84.8 million.
Contraband fuel volumes are also significant near the Dhehiba–Ouezen checkpoint. With our interview
data we estimate that the annual volume of fuel traded here is equal to 40 percent of the quantities traded
in the Ben Guerdane area.
3.36. Using the data in Box 3.4, Table 3.6 summarizes the volume and value of contraband fuel
traded at the Tunisia–Libya border. Table 3.6 Contraband Fuel at the Tunisia–Libya Border
Source: World Bank estimates.
3.37. As can be seen in table 6, contraband fuel imports from Libya are estimated at 495 million
liters, which represents 17 percent of Tunisian consumption in 2014 (2,907.7 million liters). In
Tunisia, the retail price of contraband fuel increases the farther you are from Ben Guerdane. In Ben
Guerdane, the price of 20 liters is TD 15. Fifty kilometers away at Zarsis, the same quantity sells
Ras Jédir–Ben
Guerdane
Dhehiba–
Ouezen Total
Volumes of fuel traded (millions of liters) 353.6 141.4
495
P*Q Fuel bought in Libya (TD millions) 127.3 50.9 178.2
P*Q Wholesale revenue in Tunisia (TD millions) 212.1 84.8 296.9
Profit (TD millions) 84.8 33.9 118.7
Number of employers in contraband fuel trade 4,000 1,600 5,600
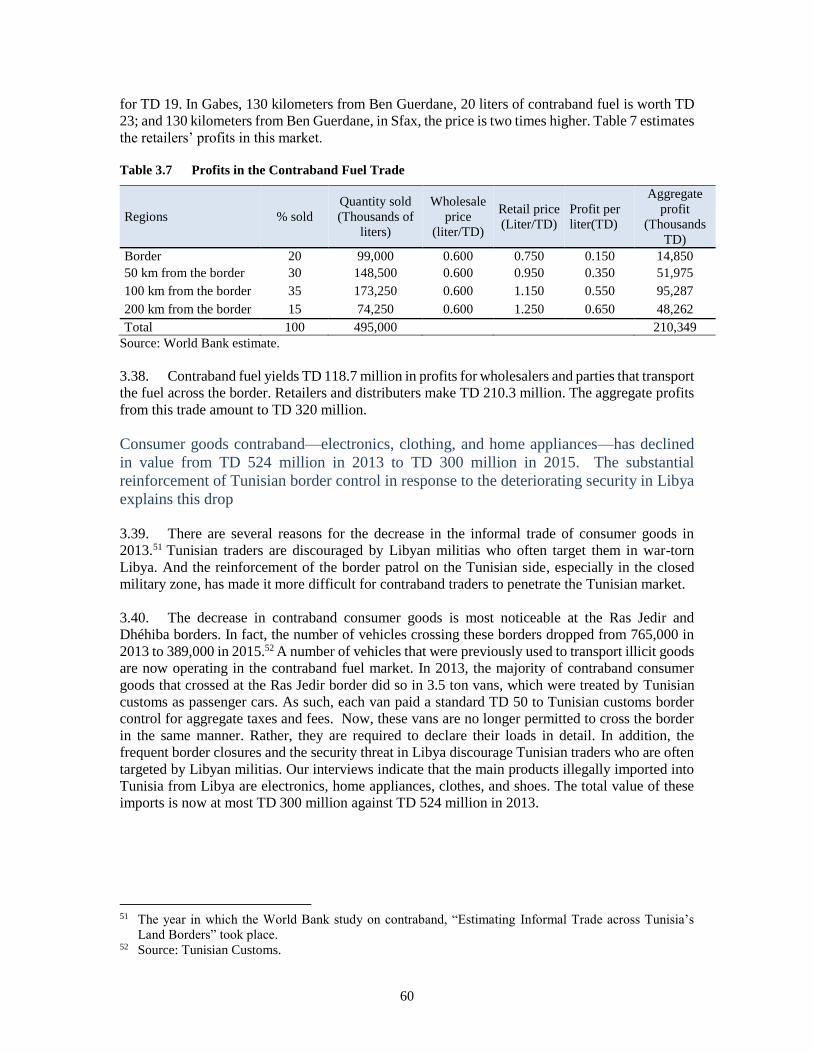
60
for TD 19. In Gabes, 130 kilometers from Ben Guerdane, 20 liters of contraband fuel is worth TD
23; and 130 kilometers from Ben Guerdane, in Sfax, the price is two times higher. Table 7 estimates
the retailers’ profits in this market. Table 3.7 Profits in the Contraband Fuel Trade
Regions % sold
Quantity sold
(Thousands of
liters)
Wholesale
price
(liter/TD)
Retail price
(Liter/TD)
Profit per
liter(TD)
Aggregate
profit
(Thousands
TD)
Border 20 99,000 0.600 0.750 0.150 14,850
50 km from the border 30 148,500 0.600 0.950 0.350 51,975
100 km from the border 35 173,250 0.600 1.150 0.550 95,287
200 km from the border 15 74,250 0.600 1.250 0.650 48,262
Total 100 495,000 210,349
Source: World Bank estimate.
3.38. Contraband fuel yields TD 118.7 million in profits for wholesalers and parties that transport
the fuel across the border. Retailers and distributers make TD 210.3 million. The aggregate profits
from this trade amount to TD 320 million.
Consumer goods contraband—electronics, clothing, and home appliances—has declined
in value from TD 524 million in 2013 to TD 300 million in 2015. The substantial
reinforcement of Tunisian border control in response to the deteriorating security in Libya
explains this drop
3.39. There are several reasons for the decrease in the informal trade of consumer goods in
2013.51 Tunisian traders are discouraged by Libyan militias who often target them in war-torn
Libya. And the reinforcement of the border patrol on the Tunisian side, especially in the closed
military zone, has made it more difficult for contraband traders to penetrate the Tunisian market.
3.40. The decrease in contraband consumer goods is most noticeable at the Ras Jedir and
Dhéhiba borders. In fact, the number of vehicles crossing these borders dropped from 765,000 in
2013 to 389,000 in 2015.52 A number of vehicles that were previously used to transport illicit goods
are now operating in the contraband fuel market. In 2013, the majority of contraband consumer
goods that crossed at the Ras Jedir border did so in 3.5 ton vans, which were treated by Tunisian
customs as passenger cars. As such, each van paid a standard TD 50 to Tunisian customs border
control for aggregate taxes and fees. Now, these vans are no longer permitted to cross the border
in the same manner. Rather, they are required to declare their loads in detail. In addition, the
frequent border closures and the security threat in Libya discourage Tunisian traders who are often
targeted by Libyan militias. Our interviews indicate that the main products illegally imported into
Tunisia from Libya are electronics, home appliances, clothes, and shoes. The total value of these
imports is now at most TD 300 million against TD 524 million in 2013.
51 The year in which the World Bank study on contraband, “Estimating Informal Trade across Tunisia’s
Land Borders” took place. 52 Source: Tunisian Customs.

61
Tobacco contraband is estimated at TD 400 million for the year 2015. This market involves
a number of countries in North Africa and the Sahel region
3.41. The volume of contraband tobacco trade has risen dramatically in recent years.53 This
increase is due in part to widely known factors, such as high taxes that inflate the price of tobacco
and government restrictions. Other elements inside Tunisia, however, are also involved in the
increase of illegally imported tobacco.54 Table 3.8 Tobacco Confiscation Statistics
Year Cigarettes (packs) Tobacco
Moassel (kg)
Tobacco
Girac (kg)
2013 5,210,163 27,247 4,269
2014 7,595,209 41,784 8,483
2015 8,093,562 80,964 10,707
Source: Tunisian Customs.
3.42. The volume of contraband tobacco seized by Tunisian officials is substantial (see table 8).
The illicit market is booming, making the country a hub where tobacco traders from Sahelo-African
countries (Mali, Niger, and Chad) cross paths. These traffickers target North African countries, and
in some cases, Europe.
3.43. Tobacco traffickers in Libya have seen barriers to their trade fall due to the absence of a
governing state body. Armed militias have replaced the state, allowing a fluid border for tobacco
smuggling in exchange for rents. Libyan militias thus amass large profits from the illicit tobacco
trade.
3.44. Contraband tobacco enters the Tunisian market in two ways. Some arrives tightly packed
inside small trucks.55 Other shipments are concealed in vehicles transporting legitimate products
across the border. These latter vehicles are ostensibly monitored by Tunisian customs officers.
3.45. Annual cigarette consumption in Tunisia is estimated at 1,000 million packs. Domestic
firms supply 466 million of these packs; another 154 million packs are legal imports and the
remaining 380 million packs are contraband. The loss in tax revenue from contraband is
approximately TD 500 million per year. Forty percent of this contraband, valued at TD 400 million,
originates from Libya. Thus, TD 200 million in losses are directly caused by illegal imports from
Libya.
53 http://kapitalis.com/tunisie/2016/01/03/saisie-dimportantes-quantites-de-tabac-de-contrebande-a-gabes/ 54 http://www.ilboursa.com/marches/tunisie--etude-les-barons-de-la-contrebande-engrangent-2-milliards-
de-dinars-par-an_8685
Similarly, YOUSSOUR’s study shows that there was an unjustified large deficit in the domestic supply
of tobacco. RNTA shrunk from 810 million packs in 2007 to 620 million packs in 2012. Despite 156
million packs in imports in 2012 against 52 million in 2007, the RNTA was unable compensate for the
drop in production. 55 http://www.espacemanager.com/deces-dun-contrebandier-de-tabac-ben-guerdane.html
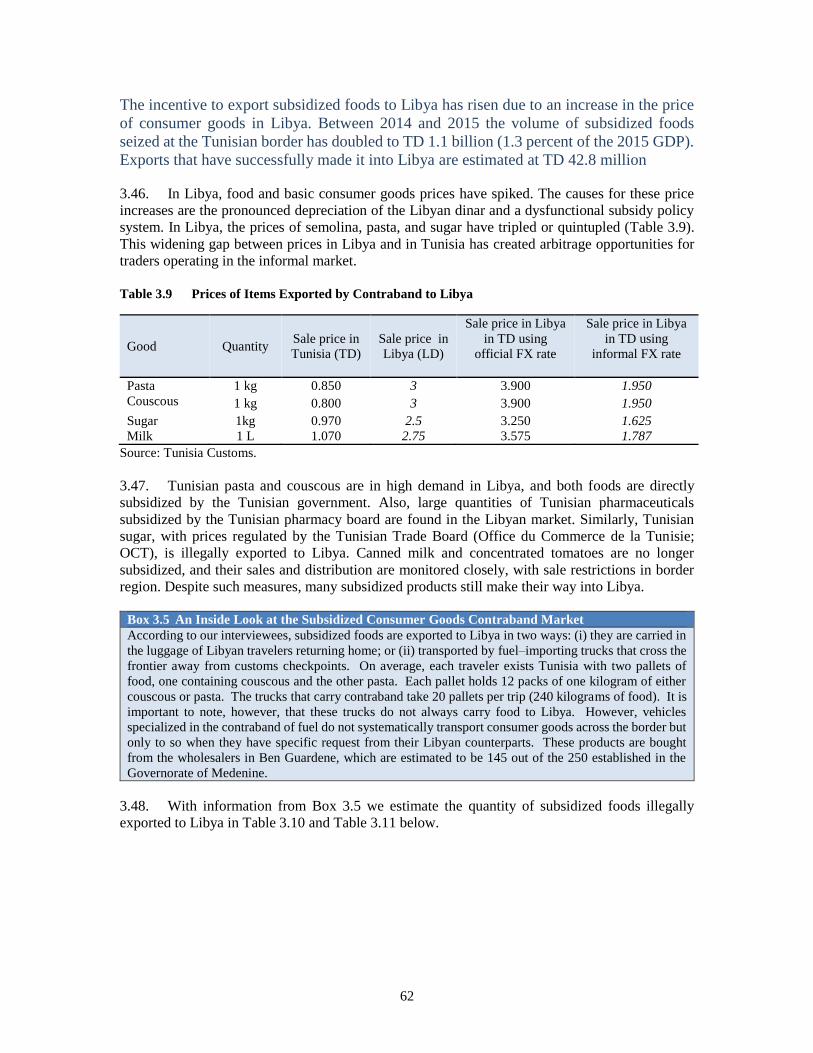
62
The incentive to export subsidized foods to Libya has risen due to an increase in the price
of consumer goods in Libya. Between 2014 and 2015 the volume of subsidized foods
seized at the Tunisian border has doubled to TD 1.1 billion (1.3 percent of the 2015 GDP).
Exports that have successfully made it into Libya are estimated at TD 42.8 million
3.46. In Libya, food and basic consumer goods prices have spiked. The causes for these price
increases are the pronounced depreciation of the Libyan dinar and a dysfunctional subsidy policy
system. In Libya, the prices of semolina, pasta, and sugar have tripled or quintupled (Table 3.9).
This widening gap between prices in Libya and in Tunisia has created arbitrage opportunities for
traders operating in the informal market.
Table 3.9 Prices of Items Exported by Contraband to Libya
Source: Tunisia Customs.
3.47. Tunisian pasta and couscous are in high demand in Libya, and both foods are directly
subsidized by the Tunisian government. Also, large quantities of Tunisian pharmaceuticals
subsidized by the Tunisian pharmacy board are found in the Libyan market. Similarly, Tunisian
sugar, with prices regulated by the Tunisian Trade Board (Office du Commerce de la Tunisie;
OCT), is illegally exported to Libya. Canned milk and concentrated tomatoes are no longer
subsidized, and their sales and distribution are monitored closely, with sale restrictions in border
region. Despite such measures, many subsidized products still make their way into Libya.
Box 3.5 An Inside Look at the Subsidized Consumer Goods Contraband Market According to our interviewees, subsidized foods are exported to Libya in two ways: (i) they are carried in
the luggage of Libyan travelers returning home; or (ii) transported by fuel–importing trucks that cross the
frontier away from customs checkpoints. On average, each traveler exists Tunisia with two pallets of
food, one containing couscous and the other pasta. Each pallet holds 12 packs of one kilogram of either
couscous or pasta. The trucks that carry contraband take 20 pallets per trip (240 kilograms of food). It is
important to note, however, that these trucks do not always carry food to Libya. However, vehicles
specialized in the contraband of fuel do not systematically transport consumer goods across the border but
only to so when they have specific request from their Libyan counterparts. These products are bought
from the wholesalers in Ben Guardene, which are estimated to be 145 out of the 250 established in the
Governorate of Medenine.
3.48. With information from Box 3.5 we estimate the quantity of subsidized foods illegally
exported to Libya in Table 3.10 and Table 3.11 below.
Good Quantity Sale price in
Tunisia (TD)
Sale price in
Libya (LD)
Sale price in Libya
in TD using
official FX rate
Sale price in Libya
in TD using
informal FX rate
Pasta 1 kg 0.850 3 3.900 1.950
Couscous 1 kg 0.800 3 3.900 1.950
Sugar 1kg 0.970 2.5 3.250 1.625
Milk 1 L 1.070 2.75 3.575 1.787
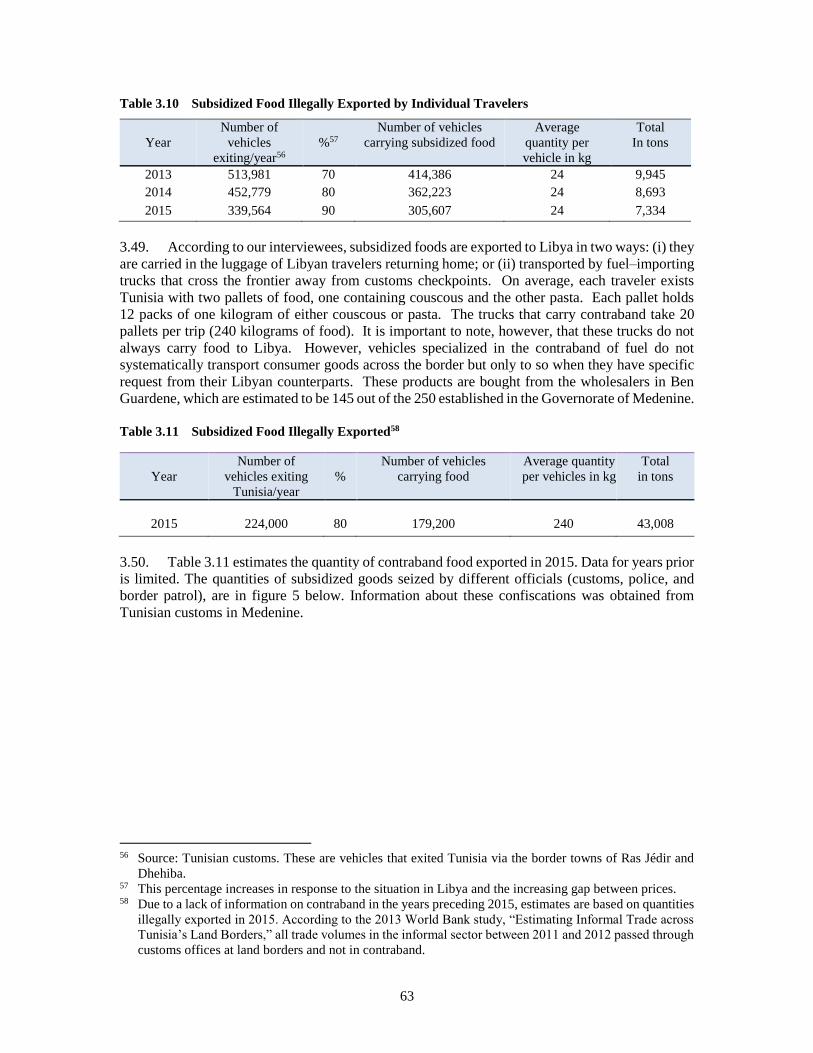
63
Table 3.10 Subsidized Food Illegally Exported by Individual Travelers
Year
Number of
vehicles
exiting/year56
%57
Number of vehicles
carrying subsidized food
Average
quantity per
vehicle in kg
Total
In tons
2013 513,981 70 414,386 24 9,945
2014 452,779 80 362,223 24 8,693
2015 339,564 90 305,607 24 7,334
3.49. According to our interviewees, subsidized foods are exported to Libya in two ways: (i) they
are carried in the luggage of Libyan travelers returning home; or (ii) transported by fuel–importing
trucks that cross the frontier away from customs checkpoints. On average, each traveler exists
Tunisia with two pallets of food, one containing couscous and the other pasta. Each pallet holds
12 packs of one kilogram of either couscous or pasta. The trucks that carry contraband take 20
pallets per trip (240 kilograms of food). It is important to note, however, that these trucks do not
always carry food to Libya. However, vehicles specialized in the contraband of fuel do not
systematically transport consumer goods across the border but only to so when they have specific
request from their Libyan counterparts. These products are bought from the wholesalers in Ben
Guardene, which are estimated to be 145 out of the 250 established in the Governorate of Medenine.
Table 3.11 Subsidized Food Illegally Exported58
3.50. Table 3.11 estimates the quantity of contraband food exported in 2015. Data for years prior
is limited. The quantities of subsidized goods seized by different officials (customs, police, and
border patrol), are in figure 5 below. Information about these confiscations was obtained from
Tunisian customs in Medenine.
56 Source: Tunisian customs. These are vehicles that exited Tunisia via the border towns of Ras Jédir and
Dhehiba. 57 This percentage increases in response to the situation in Libya and the increasing gap between prices. 58 Due to a lack of information on contraband in the years preceding 2015, estimates are based on quantities
illegally exported in 2015. According to the 2013 World Bank study, “Estimating Informal Trade across
Tunisia’s Land Borders,” all trade volumes in the informal sector between 2011 and 2012 passed through
customs offices at land borders and not in contraband.
Year
Number of
vehicles exiting
Tunisia/year
%
Number of vehicles
carrying food
Average quantity
per vehicles in kg
Total
in tons
2015
224,000
80
179,200
240
43,008
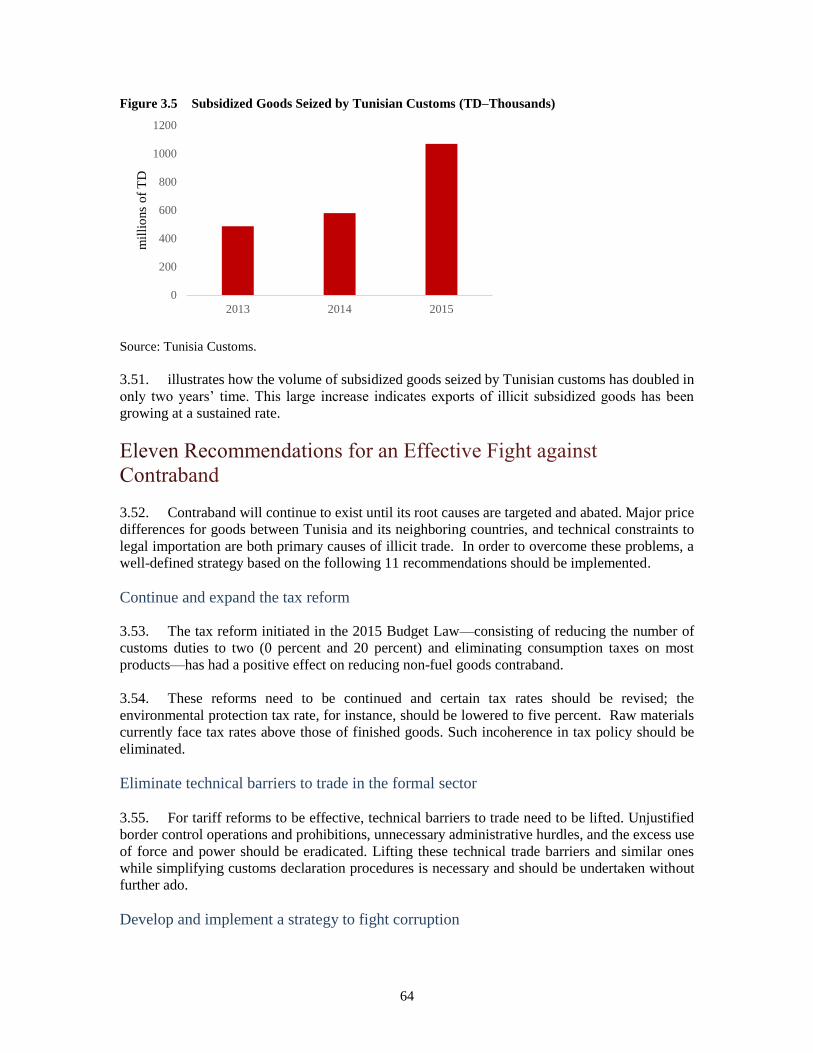
64
Figure 3.5 Subsidized Goods Seized by Tunisian Customs (TD–Thousands)
Source: Tunisia Customs.
3.51. illustrates how the volume of subsidized goods seized by Tunisian customs has doubled in
only two years’ time. This large increase indicates exports of illicit subsidized goods has been
growing at a sustained rate.
3.52. Contraband will continue to exist until its root causes are targeted and abated. Major price
differences for goods between Tunisia and its neighboring countries, and technical constraints to
legal importation are both primary causes of illicit trade. In order to overcome these problems, a
well-defined strategy based on the following 11 recommendations should be implemented.
Continue and expand the tax reform
3.53. The tax reform initiated in the 2015 Budget Law—consisting of reducing the number of
customs duties to two (0 percent and 20 percent) and eliminating consumption taxes on most
products—has had a positive effect on reducing non-fuel goods contraband.
3.54. These reforms need to be continued and certain tax rates should be revised; the
environmental protection tax rate, for instance, should be lowered to five percent. Raw materials
currently face tax rates above those of finished goods. Such incoherence in tax policy should be
eliminated.
Eliminate technical barriers to trade in the formal sector
3.55. For tariff reforms to be effective, technical barriers to trade need to be lifted. Unjustified
border control operations and prohibitions, unnecessary administrative hurdles, and the excess use
of force and power should be eradicated. Lifting these technical trade barriers and similar ones
while simplifying customs declaration procedures is necessary and should be undertaken without
further ado.
Develop and implement a strategy to fight corruption
0
200
400
600
800
1000
1200
2013 2014 2015
mil
lio
ns
of
TD
65
3.56. The high prevalence of corruption in the formal sector encourages illegal trade in two ways.
Bribes requested of legal business operators during routine customs procedures and unpredictable
merchandise confiscations are discouraging factors that make illegal trade more attractive.
Similarly, contraband operators can, through monetary incentives, persuade customs officers to
allow their goods to flow through well-guarded borders. It is well known that officers often fall
prey to corruption and facilitate illicit trade. Establishing a plan to defeat corruption in the formal
sector should be an important component in the fight against contraband.
Undertake specific analyses of contraband in sectors that are most affected
3.57. The consequences of illicit trade are different for different markets. Studies that focus on
the most affected markets will provide specific information that can guide the design of well-
targeted and effective policies. In the contraband market, the most traded goods are tobacco,
electronics, clothing and shoes, and fruits and vegetables.
Lift protectionist and costly policies that maintain inefficient and low quality production
3.58. A number of protectionist policies are currently in place to safeguard state owned
enterprises that are less productive than other competitors. For instance, barriers to trade in the tire
market are ensuring the survival of La Société Tunisienne des Industries de Pneumatiques (STIP)
while blocking the entry of more competitive companies into the market. Similarly, state owned
firms that are unable to meet the demand of tobacco in quantity and quality are protected against
competing importing firms. Such policies provide strong incentives for business operators to turn
to the illicit market.
Reform the foreign exchange code
3.59. While trying to push Sarrafas to integrate into the formal foreign exchange market, policy
makers should take into consideration the reality on the ground. For instance, the issue of
wholesalers in certain countries (such as China) requiring advance payments needs to be addressed.
Resolving such problems will bridge the differences between the formal and informal sectors that
make the second more attractive than the former.
Strengthen border control
3.60. For effective and high-impact border control, Tunisian customs, police, and various
security offices need to coordinate their actions and join efforts to reach their common goals and
achieve positive results. A comprehensive national strategy can be a powerful tool in discouraging
contraband.
Strengthen the technical and technological capacity of the customs office
3.61. Equipping customs officers with new and high-performance technology would improve
their efficiency in halting illicit trade and a wide range of illegal activities, such as arms trafficking
and drug and tobacco dealing. All of these activities are threats to the security and stability of
Tunisia. New tools and technology should be accompanied by well-informed strategies that
integrate risk factors with all available information on the contraband trade in the various markets.
66
Implement a specific development plan for the border region
3.62. Investment and job creation opportunities are scarce in the Tunisia–Libya border region.
In fact, contraband and informal commerce are the main sources of secure employment for the
border communities. Therefore, a solid development plan for these towns is urgently needed in
order to create legal job opportunities in the formal market.
Develop a real-time monitoring and alert system in the border region
3.63. A monitoring system that provides real-time information about events in and around
Tunisia’s border towns will enable decision makers in the customs and security departments to
respond to events in a timely and effective manner.
Deepen cooperation with neighboring countries to tackle contraband
3.64. A bilateral alliance against contraband will ensure that policies from either side of the
border are well-integrated. For Tunisia to effectively combat contraband, its tariff rates and subsidy
policies should be in line with those in bordering countries. Great disparities in different
governments’ policies create large differences in prices and arbitrage opportunities for operators in
the illicit trade sector. Thus, conscious efforts by Tunisia and its neighbors to integrate the
contraband threat into policy decisions are necessary. Neighboring countries should also work
together to fight poverty in the border regions where contraband is the main source of livelihood.
3.65. Cash flows in the informal trade sector have reached excessive levels. They facilitate the
exchange of illicit goods and feed the informal foreign exchange market. Despite the overall
decrease in contraband volumes, illicit imports of fuel and tobacco and illegal exports of subsidized
foods, drugs, and basic consumer goods have swelled.
3.66. The main means of livelihood in the Tunisia–Libya border towns are contraband goods and
the informal foreign exchange market. Alternative jobs and businesses in the formal sector are
scarce. Therefore, radical measures against contraband such as closing the borders can cause socio-
political turmoil in the region.
3.67. Finding solutions to the problem of illicit trade of goods and liquidities is not a simple task.
For generations this trade has fed Tunisia’s border towns’ economies. Moreover, labor used in this
informal sector is not easily adapted to formal economic activities. This is due to the reluctance of
business persons to transition to formal alternatives both because of a fear of the unknown and the
non-transferability of their major skills and assets. The established relationships between traders
and contraband barons in Tunisia and Libya have contributed to the illicit trade growth.
Furthermore, informal trade participants have taken advantage of the political revolutions and
instabilities in Libya and Tunisia to expand their trade.
3.68. Contraband and illicit currency exchange barons have amassed great fortunes, and are
suspected to have taken a share of the Libyan gold that was previously in Gaddafi’s vaults. These
groups have replaced Ben Ali’s family members in augmenting and fostering the contraband and
illicit currency markets.

67
3.69. Solid investment projects are vital to economic development. However, many illicit trade
promoters have low literacy levels and are not equipped to make sophisticated and high-impact
investment plans. Their past investments were in such things as real estate and cafes in chic
locations in Tunis. Moreover, a large percentage of informal sector profits are not recycled back
into the formal capital market. This capital loss hampers economic growth by limiting investment
potential.
68
Chapter 4 An Estimation of the Macroeconomic and Fiscal
Impacts
This chapter presents the results of a computable general equilibrium (CGE) model developed to
estimate the macroeconomic and fiscal consequences of the Libyan crisis on the Tunisian economy.
The model captures five different effects: i) the effect of Libyans living in Tunisia on aggregate
demand; ii) the effect on remittances sent from Tunisians working in Libya; iii) the effect of the
deteriorating business environment on private investment; iv) the effect of domestic and regional
security challenges on the tourism sector; and v) the effect on government security spending. Our
results suggest that the Libyan crisis is responsible for 24 percent of the deceleration of economic
growth in Tunisia during 2011–15. This is equivalent to a loss of 8.8 billion Tunisian dinars (TD)
or 880 million U.S. dollars (US$) per year, about 2 percent of 2015 GDP per year. This loss was
mainly driven by the crisis’ effects on private investment and tourism. The fall in private investment
because of the crisis is responsible for 60 percent of the slowdown in Tunisia’s economic growth,
while 36 percent of the deceleration is due to the decline in tourism. The decline in remittances
from Libya, the increased government spending on security, and the weakened purchasing power
of Libyan residents and visitors account respectively for 1.4 percent, 1.2 percent, and 0.8 percent
of the estimated losses caused by the crisis. The fiscal cost of the Libyan crisis (increased
government security spending and reduced tax revenues) is estimated at TD 5.8 billion from 2011–
15 (US$580 million per year, which is equivalent to 1.36 percent of 2015 GDP per year).
Simulations show that financing these costs through taxes would considerably increase tax rates.
Income taxes would have to increase by 41 percent cumulatively during 2011–15, as would the
need to strengthen tax administration (to oversee new tax rates and regulate unintended incentives
to evade those new rates. Financing the Libyan’ crisis fiscal cost with debt would increase
government financing needs by TD 7 billion over the five years (15 percent of the 2015 public debt
to GDP ratio) due to additional interest payments of TD 274 million and additional debt
amortization costs of TD 920 million.
4.1. Between 2011 and 2015, Tunisia lost on average 3.86 percentage points of growth every
year relative to the projections of the 2010 International Monetary Fund (IMF) Article IV report.
This poor performance is in line with predictions from the economic literature about economies
undergoing democratic transitions. Such economies are characterized by increased social demands
and tensions, a lack of transparency for investors, and a weakening of the state. In addition to these
internal challenges, Tunisia also has been affected by the security and economic crisis in
neighboring Libya (Tunisia’s sixth most important economic partner).
4.2. The objective of this chapter is to quantify the macroeconomic and fiscal consequences of
the Libyan crisis for the Tunisian economy during 2011–15, while controlling for a number of
endogenous and exogenous factors, including the economic costs of Tunisia’s ongoing political
transition, which has been underway since 2011.
4.3. The economic literature illustrates that civil war in a given country has negative
consequences on its neighbors. Conflicts in general, both minor and extended ones, have significant
effects on economic development in nearby countries. Murdoch and Sandler (2004) show that an
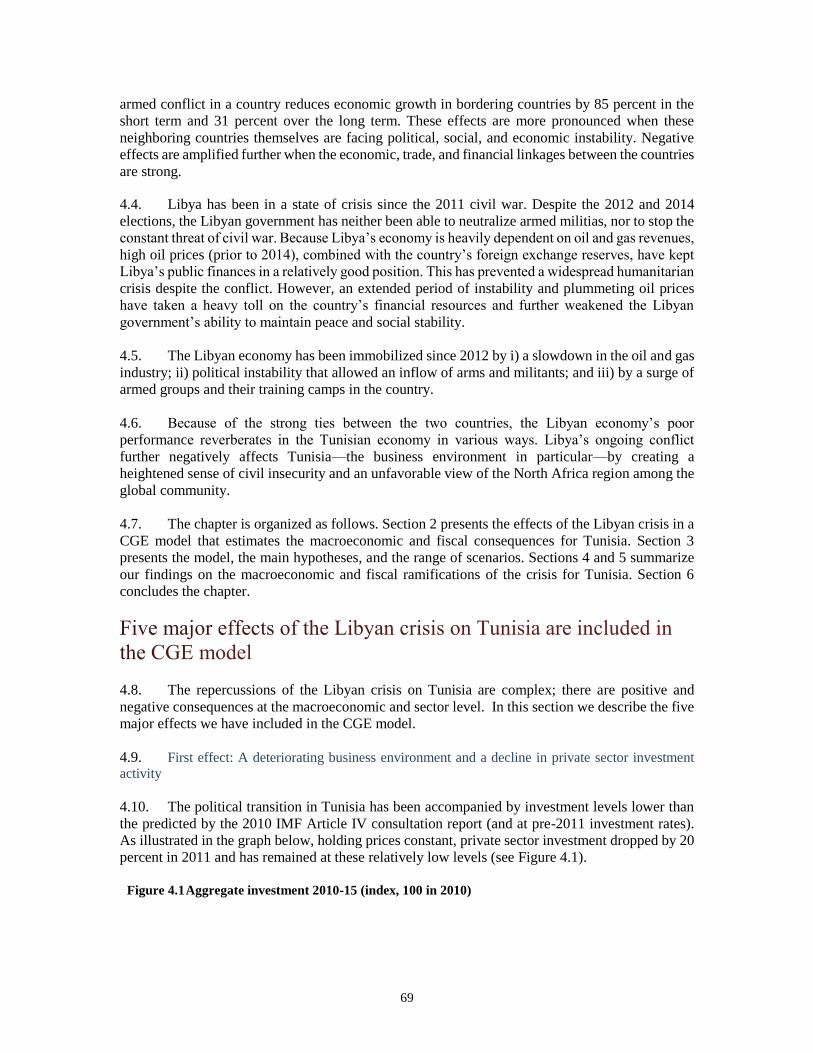
69
armed conflict in a country reduces economic growth in bordering countries by 85 percent in the
short term and 31 percent over the long term. These effects are more pronounced when these
neighboring countries themselves are facing political, social, and economic instability. Negative
effects are amplified further when the economic, trade, and financial linkages between the countries
are strong.
4.4. Libya has been in a state of crisis since the 2011 civil war. Despite the 2012 and 2014
elections, the Libyan government has neither been able to neutralize armed militias, nor to stop the
constant threat of civil war. Because Libya’s economy is heavily dependent on oil and gas revenues,
high oil prices (prior to 2014), combined with the country’s foreign exchange reserves, have kept
Libya’s public finances in a relatively good position. This has prevented a widespread humanitarian
crisis despite the conflict. However, an extended period of instability and plummeting oil prices
have taken a heavy toll on the country’s financial resources and further weakened the Libyan
government’s ability to maintain peace and social stability.
4.5. The Libyan economy has been immobilized since 2012 by i) a slowdown in the oil and gas
industry; ii) political instability that allowed an inflow of arms and militants; and iii) by a surge of
armed groups and their training camps in the country.
4.6. Because of the strong ties between the two countries, the Libyan economy’s poor
performance reverberates in the Tunisian economy in various ways. Libya’s ongoing conflict
further negatively affects Tunisia—the business environment in particular—by creating a
heightened sense of civil insecurity and an unfavorable view of the North Africa region among the
global community.
4.7. The chapter is organized as follows. Section 2 presents the effects of the Libyan crisis in a
CGE model that estimates the macroeconomic and fiscal consequences for Tunisia. Section 3
presents the model, the main hypotheses, and the range of scenarios. Sections 4 and 5 summarize
our findings on the macroeconomic and fiscal ramifications of the crisis for Tunisia. Section 6
concludes the chapter.
4.8. The repercussions of the Libyan crisis on Tunisia are complex; there are positive and
negative consequences at the macroeconomic and sector level. In this section we describe the five
major effects we have included in the CGE model.
4.9. First effect: A deteriorating business environment and a decline in private sector investment
activity
4.10. The political transition in Tunisia has been accompanied by investment levels lower than
the predicted by the 2010 IMF Article IV consultation report (and at pre-2011 investment rates).
As illustrated in the graph below, holding prices constant, private sector investment dropped by 20
percent in 2011 and has remained at these relatively low levels (see Figure 4.1).
Figure 4.1 Aggregate investment 2010-15 (index, 100 in 2010)
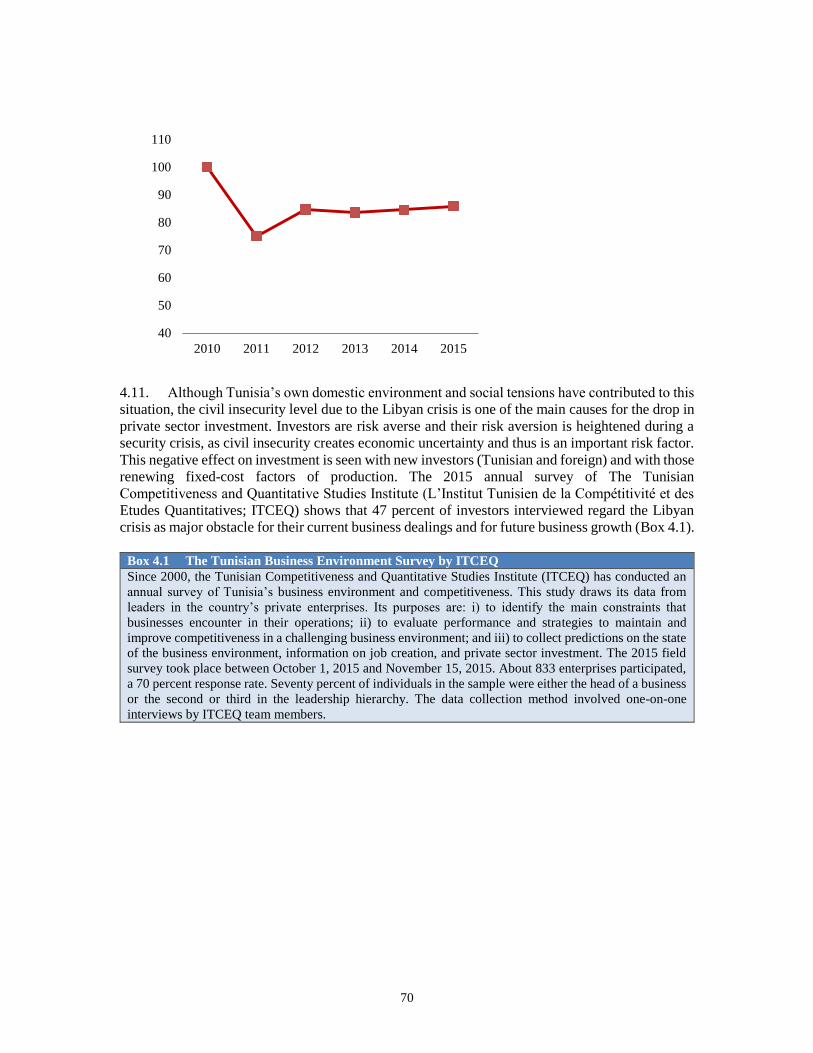
70
4.11. Although Tunisia’s own domestic environment and social tensions have contributed to this
situation, the civil insecurity level due to the Libyan crisis is one of the main causes for the drop in
private sector investment. Investors are risk averse and their risk aversion is heightened during a
security crisis, as civil insecurity creates economic uncertainty and thus is an important risk factor.
This negative effect on investment is seen with new investors (Tunisian and foreign) and with those
renewing fixed-cost factors of production. The 2015 annual survey of The Tunisian
Competitiveness and Quantitative Studies Institute (L’Institut Tunisien de la Compétitivité et des
Etudes Quantitatives; ITCEQ) shows that 47 percent of investors interviewed regard the Libyan
crisis as major obstacle for their current business dealings and for future business growth (Box 4.1).
Box 4.1 The Tunisian Business Environment Survey by ITCEQ
Since 2000, the Tunisian Competitiveness and Quantitative Studies Institute (ITCEQ) has conducted an
annual survey of Tunisia’s business environment and competitiveness. This study draws its data from
leaders in the country’s private enterprises. Its purposes are: i) to identify the main constraints that
businesses encounter in their operations; ii) to evaluate performance and strategies to maintain and
improve competitiveness in a challenging business environment; and iii) to collect predictions on the state
of the business environment, information on job creation, and private sector investment. The 2015 field
survey took place between October 1, 2015 and November 15, 2015. About 833 enterprises participated,
a 70 percent response rate. Seventy percent of individuals in the sample were either the head of a business
or the second or third in the leadership hierarchy. The data collection method involved one-on-one
interviews by ITCEQ team members.
40
50
60
70
80
90
100
110
2010 2011 2012 2013 2014 2015
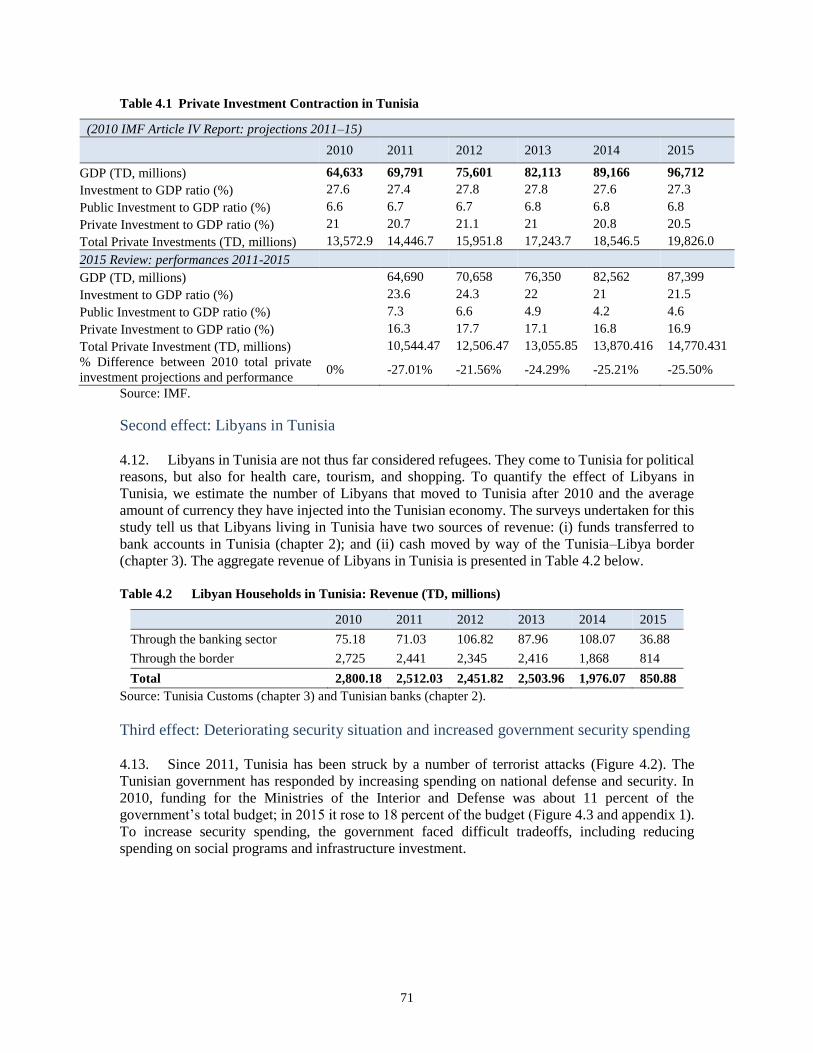
71
Table 4.1 Private Investment Contraction in Tunisia
(2010 IMF Article IV Report: projections 2011–15)
2010 2011 2012 2013 2014 2015
GDP (TD, millions) 64,633 69,791 75,601 82,113 89,166 96,712
Investment to GDP ratio (%) 27.6 27.4 27.8 27.8 27.6 27.3
Public Investment to GDP ratio (%) 6.6 6.7 6.7 6.8 6.8 6.8
Private Investment to GDP ratio (%) 21 20.7 21.1 21 20.8 20.5
Total Private Investments (TD, millions) 13,572.9 14,446.7 15,951.8 17,243.7 18,546.5 19,826.0
2015 Review: performances 2011-2015
GDP (TD, millions) 64,690 70,658 76,350 82,562 87,399
Investment to GDP ratio (%) 23.6 24.3 22 21 21.5
Public Investment to GDP ratio (%) 7.3 6.6 4.9 4.2 4.6
Private Investment to GDP ratio (%) 16.3 17.7 17.1 16.8 16.9
Total Private Investment (TD, millions) 10,544.47 12,506.47 13,055.85 13,870.416 14,770.431
% Difference between 2010 total private
investment projections and performance 0% -27.01% -21.56% -24.29% -25.21% -25.50%
Source: IMF.
Second effect: Libyans in Tunisia
4.12. Libyans in Tunisia are not thus far considered refugees. They come to Tunisia for political
reasons, but also for health care, tourism, and shopping. To quantify the effect of Libyans in
Tunisia, we estimate the number of Libyans that moved to Tunisia after 2010 and the average
amount of currency they have injected into the Tunisian economy. The surveys undertaken for this
study tell us that Libyans living in Tunisia have two sources of revenue: (i) funds transferred to
bank accounts in Tunisia (chapter 2); and (ii) cash moved by way of the Tunisia–Libya border
(chapter 3). The aggregate revenue of Libyans in Tunisia is presented in Table 4.2 below.
Table 4.2 Libyan Households in Tunisia: Revenue (TD, millions)
2010 2011 2012 2013 2014 2015
Through the banking sector 75.18 71.03 106.82 87.96 108.07 36.88
Through the border 2,725 2,441 2,345 2,416 1,868 814
Total 2,800.18 2,512.03 2,451.82 2,503.96 1,976.07 850.88
Source: Tunisia Customs (chapter 3) and Tunisian banks (chapter 2).
Third effect: Deteriorating security situation and increased government security spending
4.13. Since 2011, Tunisia has been struck by a number of terrorist attacks (Figure 4.2). The
Tunisian government has responded by increasing spending on national defense and security. In
2010, funding for the Ministries of the Interior and Defense was about 11 percent of the
government’s total budget; in 2015 it rose to 18 percent of the budget (Figure 4.3 and appendix 1).
To increase security spending, the government faced difficult tradeoffs, including reducing
spending on social programs and infrastructure investment.
72
Figure 4.2 Tunisia Terrorism Index Figure 4.3 Tunisia Security Budget, Interior
and Defense Ministries (2010–15)
Fourth effect: Tunisian workers returning from Libya
4.14. Before 2011, tens of thousands of Tunisians were official residents in Libya. The return of
many of them to Tunisia has resulted in a decline in remittances and a demand shock in the Tunisian
labor market. Official figures show that 91,669 Tunisians were living in Libya in 2010. This
number has dropped dramatically since then, with many Tunisians returning home in 2011 and in
subsequent years. In 2015, only 31,681 Tunisians were residing in Libya.
4.15. Recorded remittances from Libya in 2010 were TD 55.9 million; we therefore estimate
monthly remittances per worker for that time at TD 600. Actual remittances per worker were
probably higher as transactions are often in cash, much of which enters Tunisia through informal
markets. Anecdotal evidences suggest that actual remittances per worker per month may be 2.5
times greater than the formal sector estimate.
Fifth Effect: The tourism sector
4.16. The Libyan crisis has had adverse consequences for Tunisian tourism—one of the
country’s most important sectors. The crisis has tainted tourists’ perception of security in the
broader North Africa region, resulting in a drop in travel to Tunisia. Because tourism is an excellent
source of foreign currency, the challenges this sector faces resonate throughout the whole economy.
This trickle down effect is inevitable because of a structural deficit in the current account balance.
4.17. Moreover, the tourism sector’s situation has worsened since 2011. Before 2015, Libya’s
proximity to the Tunisian island of Djerba—a tourist destination, combined with tourists’
perception that the Libyan crisis was symptomatic of security issues in the broader region, were the
main causes for the slow down in Tunisian tourism. In 2015, the terrorist attacks on Tunis’ Bardo
National Museum and Sousse’s Port El Kantaoui resort—direct hits on tourists and the tourism
industry—worsened the situation. Tourist night stays fell by 34.4 percent compared to 2014
numbers and by 50 percent from 2010.
0%
4%
8%
12%
16%
20%
2010 2011 2012 2013 2014 2015
Min. Interieur Min. Defense
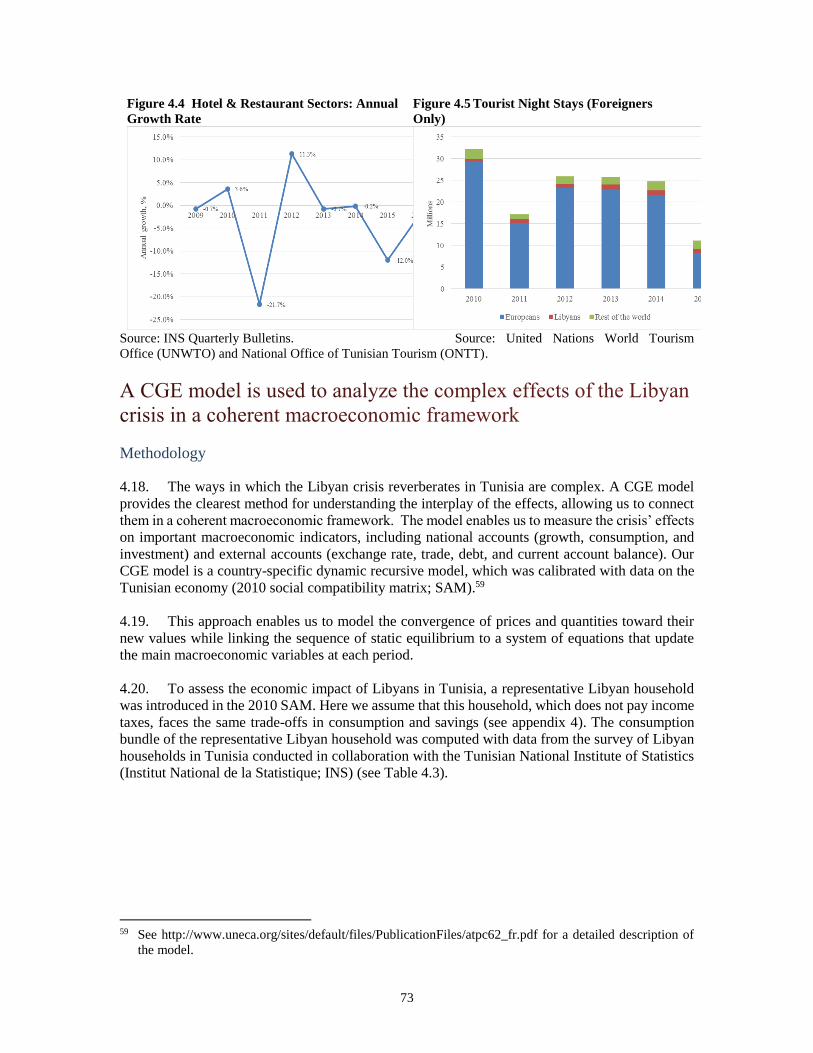
73
Figure 4.4 Hotel & Restaurant Sectors: Annual
Growth Rate Figure 4.5 Tourist Night Stays (Foreigners
Only)
Source: INS Quarterly Bulletins. Source: United Nations World Tourism
Office (UNWTO) and National Office of Tunisian Tourism (ONTT).
Methodology
4.18. The ways in which the Libyan crisis reverberates in Tunisia are complex. A CGE model
provides the clearest method for understanding the interplay of the effects, allowing us to connect
them in a coherent macroeconomic framework. The model enables us to measure the crisis’ effects
on important macroeconomic indicators, including national accounts (growth, consumption, and
investment) and external accounts (exchange rate, trade, debt, and current account balance). Our
CGE model is a country-specific dynamic recursive model, which was calibrated with data on the
Tunisian economy (2010 social compatibility matrix; SAM).59
4.19. This approach enables us to model the convergence of prices and quantities toward their
new values while linking the sequence of static equilibrium to a system of equations that update
the main macroeconomic variables at each period.
4.20. To assess the economic impact of Libyans in Tunisia, a representative Libyan household
was introduced in the 2010 SAM. Here we assume that this household, which does not pay income
taxes, faces the same trade-offs in consumption and savings (see appendix 4). The consumption
bundle of the representative Libyan household was computed with data from the survey of Libyan
households in Tunisia conducted in collaboration with the Tunisian National Institute of Statistics
(Institut National de la Statistique; INS) (see Table 4.3).
59 See http://www.uneca.org/sites/default/files/PublicationFiles/atpc62_fr.pdf for a detailed description of
the model.
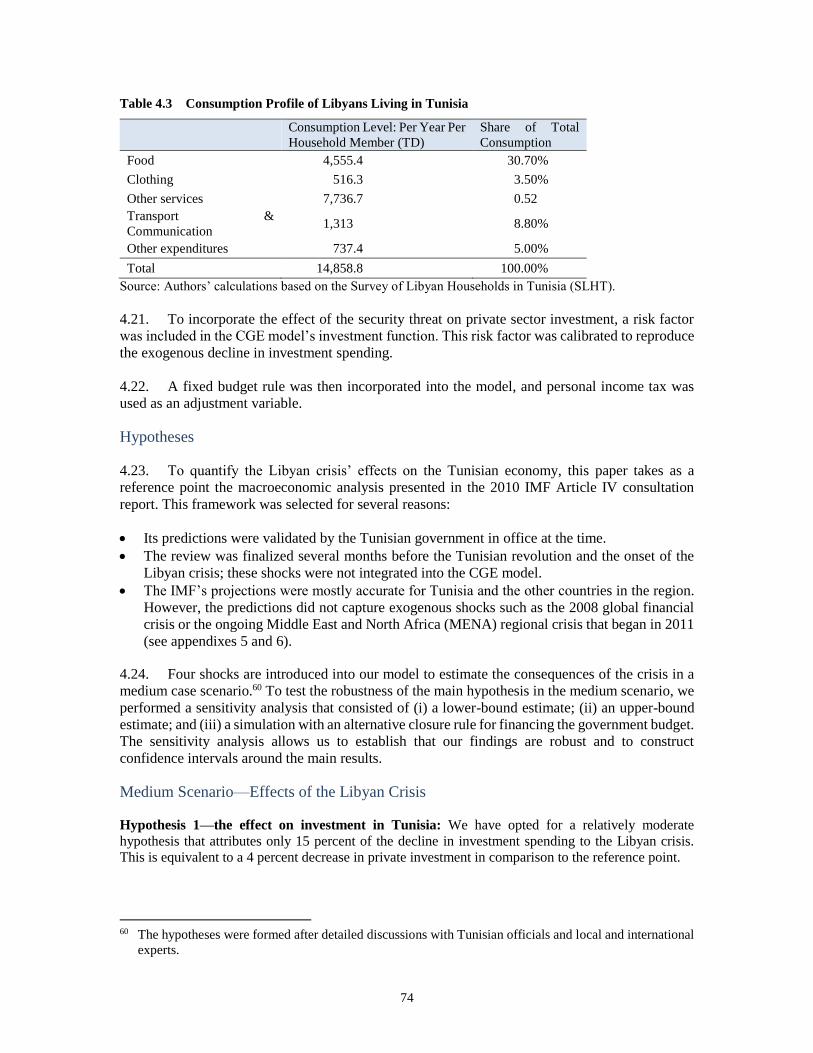
74
Table 4.3 Consumption Profile of Libyans Living in Tunisia
Consumption Level: Per Year Per
Household Member (TD)
Share of Total
Consumption
Food 4,555.4 30.70%
Clothing 516.3 3.50%
Other services 7,736.7 0.52
Transport &
Communication 1,313 8.80%
Other expenditures 737.4 5.00%
Total 14,858.8 100.00%
Source: Authors’ calculations based on the Survey of Libyan Households in Tunisia (SLHT).
4.21. To incorporate the effect of the security threat on private sector investment, a risk factor
was included in the CGE model’s investment function. This risk factor was calibrated to reproduce
the exogenous decline in investment spending.
4.22. A fixed budget rule was then incorporated into the model, and personal income tax was
used as an adjustment variable.
Hypotheses
4.23. To quantify the Libyan crisis’ effects on the Tunisian economy, this paper takes as a
reference point the macroeconomic analysis presented in the 2010 IMF Article IV consultation
report. This framework was selected for several reasons:
Its predictions were validated by the Tunisian government in office at the time.
The review was finalized several months before the Tunisian revolution and the onset of the
Libyan crisis; these shocks were not integrated into the CGE model.
The IMF’s projections were mostly accurate for Tunisia and the other countries in the region.
However, the predictions did not capture exogenous shocks such as the 2008 global financial
crisis or the ongoing Middle East and North Africa (MENA) regional crisis that began in 2011
(see appendixes 5 and 6).
4.24. Four shocks are introduced into our model to estimate the consequences of the crisis in a
medium case scenario.60 To test the robustness of the main hypothesis in the medium scenario, we
performed a sensitivity analysis that consisted of (i) a lower-bound estimate; (ii) an upper-bound
estimate; and (iii) a simulation with an alternative closure rule for financing the government budget.
The sensitivity analysis allows us to establish that our findings are robust and to construct
confidence intervals around the main results.
Medium Scenario—Effects of the Libyan Crisis
Hypothesis 1—the effect on investment in Tunisia: We have opted for a relatively moderate
hypothesis that attributes only 15 percent of the decline in investment spending to the Libyan crisis.
This is equivalent to a 4 percent decrease in private investment in comparison to the reference point.
60 The hypotheses were formed after detailed discussions with Tunisian officials and local and international
experts.
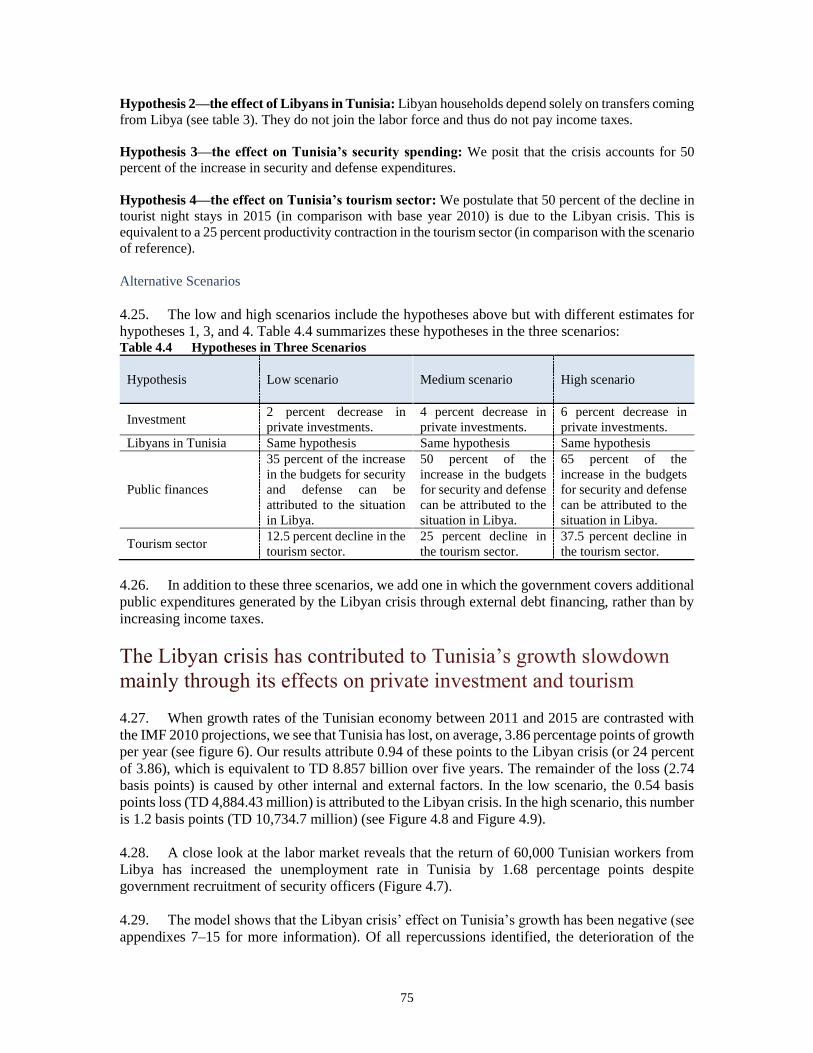
75
Hypothesis 2—the effect of Libyans in Tunisia: Libyan households depend solely on transfers coming
from Libya (see table 3). They do not join the labor force and thus do not pay income taxes.
Hypothesis 3—the effect on Tunisia’s security spending: We posit that the crisis accounts for 50
percent of the increase in security and defense expenditures.
Hypothesis 4—the effect on Tunisia’s tourism sector: We postulate that 50 percent of the decline in
tourist night stays in 2015 (in comparison with base year 2010) is due to the Libyan crisis. This is
equivalent to a 25 percent productivity contraction in the tourism sector (in comparison with the scenario
of reference).
Alternative Scenarios
4.25. The low and high scenarios include the hypotheses above but with different estimates for
hypotheses 1, 3, and 4. Table 4.4 summarizes these hypotheses in the three scenarios: Table 4.4 Hypotheses in Three Scenarios
Hypothesis Low scenario Medium scenario High scenario
Investment 2 percent decrease in
private investments.
4 percent decrease in
private investments.
6 percent decrease in
private investments.
Libyans in Tunisia Same hypothesis Same hypothesis Same hypothesis
Public finances
35 percent of the increase
in the budgets for security
and defense can be
attributed to the situation
in Libya.
50 percent of the
increase in the budgets
for security and defense
can be attributed to the
situation in Libya.
65 percent of the
increase in the budgets
for security and defense
can be attributed to the
situation in Libya.
Tourism sector 12.5 percent decline in the
tourism sector.
25 percent decline in
the tourism sector.
37.5 percent decline in
the tourism sector.
4.26. In addition to these three scenarios, we add one in which the government covers additional
public expenditures generated by the Libyan crisis through external debt financing, rather than by
increasing income taxes.
4.27. When growth rates of the Tunisian economy between 2011 and 2015 are contrasted with
the IMF 2010 projections, we see that Tunisia has lost, on average, 3.86 percentage points of growth
per year (see figure 6). Our results attribute 0.94 of these points to the Libyan crisis (or 24 percent
of 3.86), which is equivalent to TD 8.857 billion over five years. The remainder of the loss (2.74
basis points) is caused by other internal and external factors. In the low scenario, the 0.54 basis
points loss (TD 4,884.43 million) is attributed to the Libyan crisis. In the high scenario, this number
is 1.2 basis points (TD 10,734.7 million) (see Figure 4.8 and Figure 4.9).
4.28. A close look at the labor market reveals that the return of 60,000 Tunisian workers from
Libya has increased the unemployment rate in Tunisia by 1.68 percentage points despite
government recruitment of security officers (Figure 4.7).
4.29. The model shows that the Libyan crisis’ effect on Tunisia’s growth has been negative (see
appendixes 7–15 for more information). Of all repercussions identified, the deterioration of the
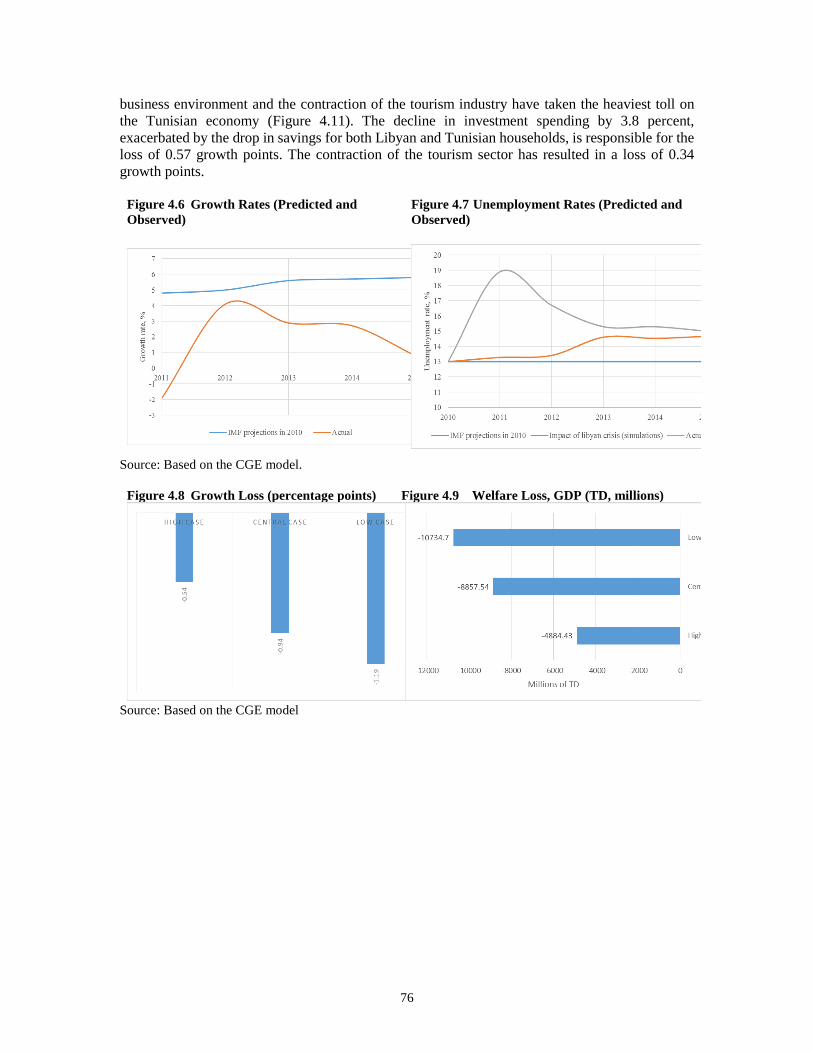
76
business environment and the contraction of the tourism industry have taken the heaviest toll on
the Tunisian economy (Figure 4.11). The decline in investment spending by 3.8 percent,
exacerbated by the drop in savings for both Libyan and Tunisian households, is responsible for the
loss of 0.57 growth points. The contraction of the tourism sector has resulted in a loss of 0.34
growth points.
Figure 4.6 Growth Rates (Predicted and
Observed)
Figure 4.7 Unemployment Rates (Predicted and
Observed)
Source: Based on the CGE model.
Figure 4.8 Growth Loss (percentage points) Figure 4.9 Welfare Loss, GDP (TD, millions)
Source: Based on the CGE model

77
Figure 4.10 Impact of Libyan Crisis vs.
other factors (percentage points)
Figure 4.11 Contribution of Various Effects
(percentage points)
Source: Based on the CGE model.
4.30. The Libyan crisis has affected the Tunisian economy in two important ways. The first effect
is on aggregate demand (Figure 4.12). Libyan and Tunisian households have lost some of their
income and as a result reduced their consumption during the five-year period (-26 percent for
Libyan households and -3.4 percent for Tunisian households). Moreover, the government increased
spending by 2.2 percent to address the security threat caused by the crisis. The additional
government expenditures were funded through an increase in income tax rates by 41 percent
(yielding TD 5,577.88 million), which in turn put downward pressure on household consumption.
4.31. The second effect is related to investment volumes. The worsening business environment
has led to a 4 percent decline in private investment activity (Figure 4.13). Moreover, the reduction
in income for Libyan and Tunisian households has further reduced investment. Despite the
maintenance of public investment at its baseline level, total investment has fallen by 4.7 percentage
points (TD 3,940.58 million).
4.32. Imports have fallen by 3.8 percent and exports by 1.7 percent. The drop in demand, and
the depreciation of the Tunisian dinar because of decline in currency inflows (Figure 4.16), caused
the contraction in imports, while lower production levels explain the export volume contraction
(Figure 4.17).
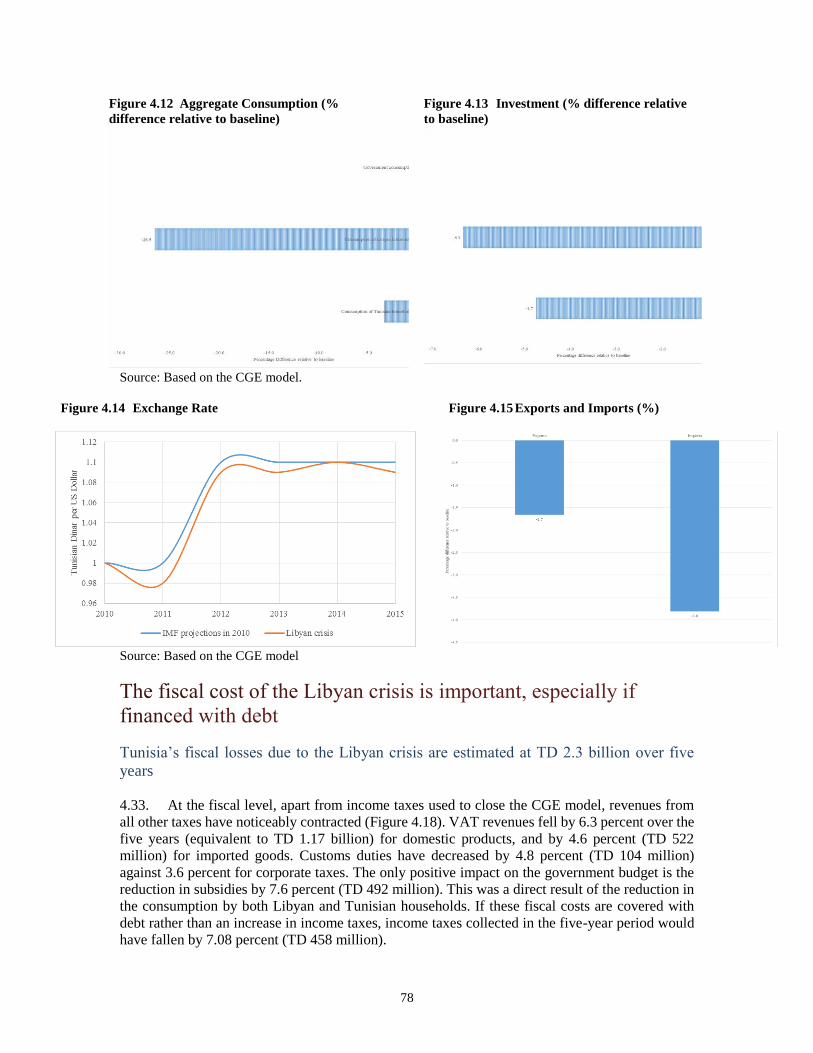
78
Figure 4.12 Aggregate Consumption (%
difference relative to baseline) Figure 4.13 Investment (% difference relative
to baseline)
Source: Based on the CGE model.
Figure 4.14 Exchange Rate Figure 4.15 Exports and Imports (%)
Source: Based on the CGE model
Tunisia’s fiscal losses due to the Libyan crisis are estimated at TD 2.3 billion over five
years
4.33. At the fiscal level, apart from income taxes used to close the CGE model, revenues from
all other taxes have noticeably contracted (Figure 4.18). VAT revenues fell by 6.3 percent over the
five years (equivalent to TD 1.17 billion) for domestic products, and by 4.6 percent (TD 522
million) for imported goods. Customs duties have decreased by 4.8 percent (TD 104 million)
against 3.6 percent for corporate taxes. The only positive impact on the government budget is the
reduction in subsidies by 7.6 percent (TD 492 million). This was a direct result of the reduction in
the consumption by both Libyan and Tunisian households. If these fiscal costs are covered with
debt rather than an increase in income taxes, income taxes collected in the five-year period would
have fallen by 7.08 percent (TD 458 million).
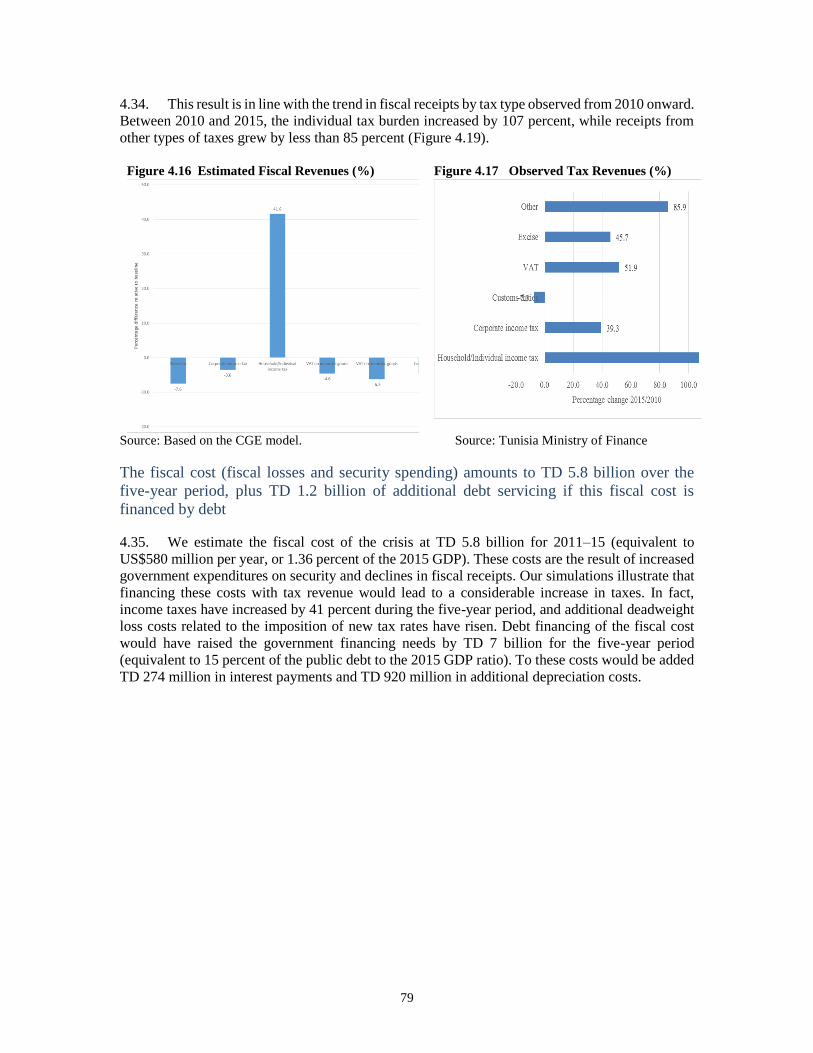
79
4.34. This result is in line with the trend in fiscal receipts by tax type observed from 2010 onward.
Between 2010 and 2015, the individual tax burden increased by 107 percent, while receipts from
other types of taxes grew by less than 85 percent (Figure 4.19).
Figure 4.16 Estimated Fiscal Revenues (%) Figure 4.17 Observed Tax Revenues (%)
Source: Based on the CGE model. Source: Tunisia Ministry of Finance
The fiscal cost (fiscal losses and security spending) amounts to TD 5.8 billion over the
five-year period, plus TD 1.2 billion of additional debt servicing if this fiscal cost is
financed by debt
4.35. We estimate the fiscal cost of the crisis at TD 5.8 billion for 2011–15 (equivalent to
US$580 million per year, or 1.36 percent of the 2015 GDP). These costs are the result of increased
government expenditures on security and declines in fiscal receipts. Our simulations illustrate that
financing these costs with tax revenue would lead to a considerable increase in taxes. In fact,
income taxes have increased by 41 percent during the five-year period, and additional deadweight
loss costs related to the imposition of new tax rates have risen. Debt financing of the fiscal cost
would have raised the government financing needs by TD 7 billion for the five-year period
(equivalent to 15 percent of the public debt to the 2015 GDP ratio). To these costs would be added
TD 274 million in interest payments and TD 920 million in additional depreciation costs.
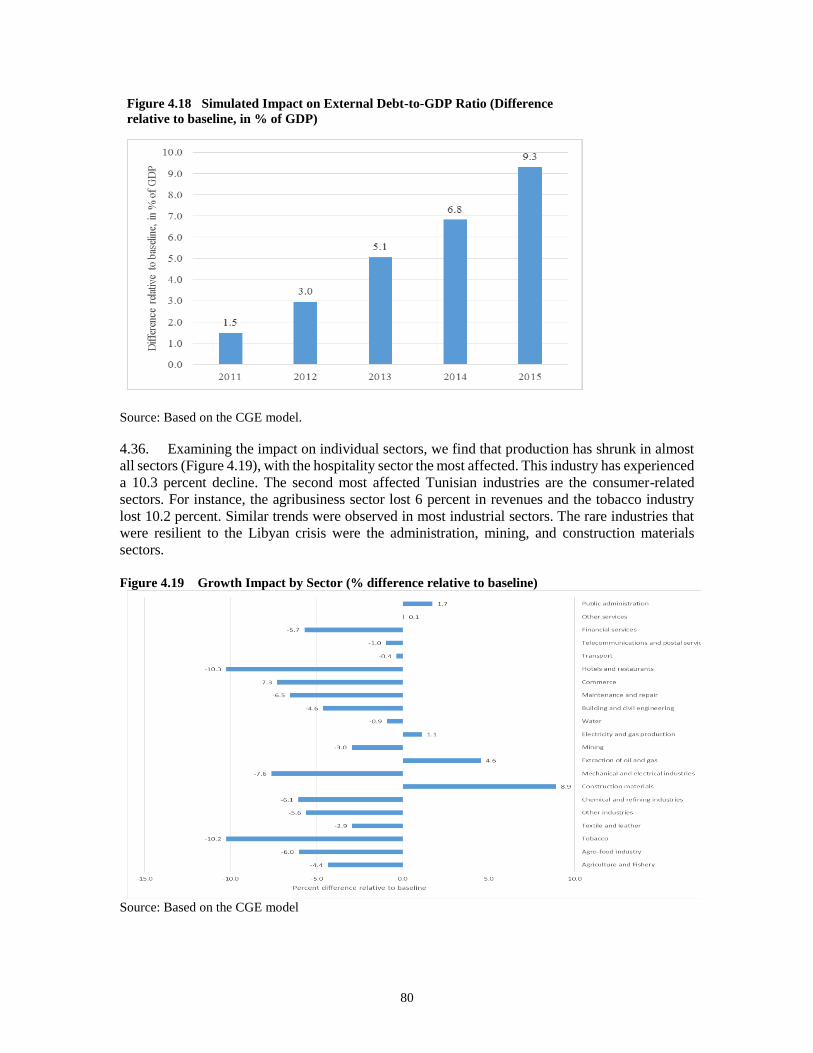
80
Figure 4.18 Simulated Impact on External Debt-to-GDP Ratio (Difference
relative to baseline, in % of GDP)
Source: Based on the CGE model.
4.36. Examining the impact on individual sectors, we find that production has shrunk in almost
all sectors (Figure 4.19), with the hospitality sector the most affected. This industry has experienced
a 10.3 percent decline. The second most affected Tunisian industries are the consumer-related
sectors. For instance, the agribusiness sector lost 6 percent in revenues and the tobacco industry
lost 10.2 percent. Similar trends were observed in most industrial sectors. The rare industries that
were resilient to the Libyan crisis were the administration, mining, and construction materials
sectors.
Figure 4.19 Growth Impact by Sector (% difference relative to baseline)
Source: Based on the CGE model
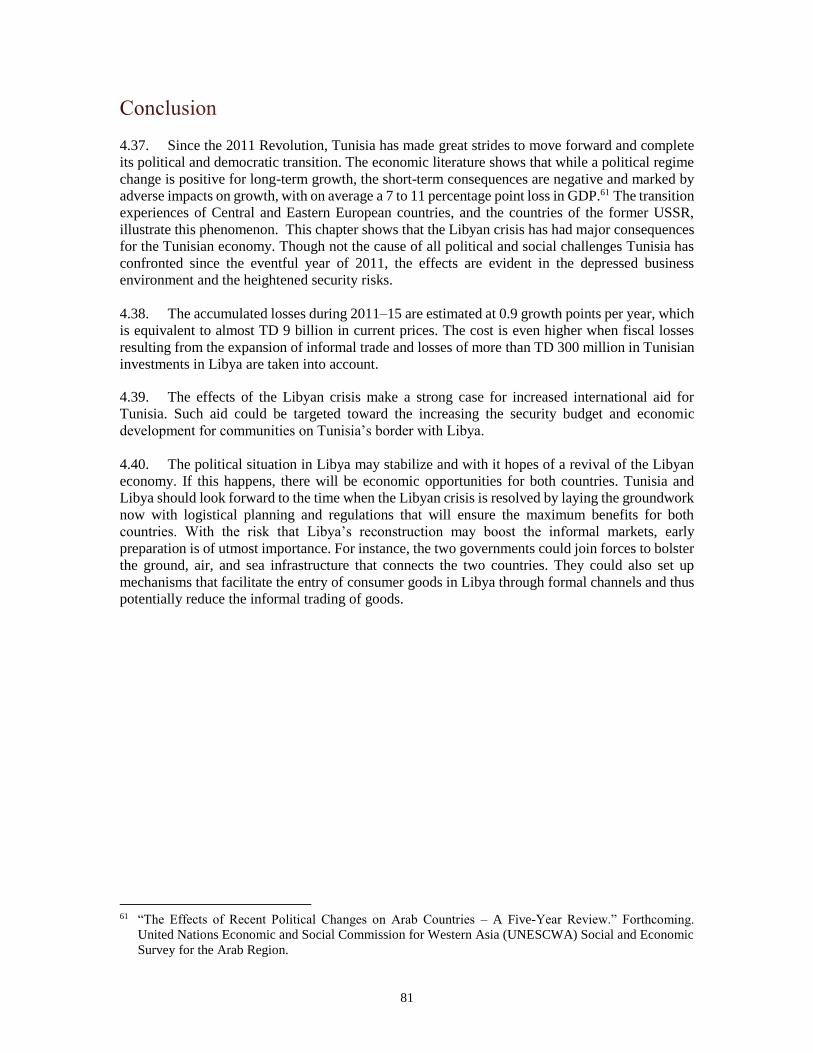
81
4.37. Since the 2011 Revolution, Tunisia has made great strides to move forward and complete
its political and democratic transition. The economic literature shows that while a political regime
change is positive for long-term growth, the short-term consequences are negative and marked by
adverse impacts on growth, with on average a 7 to 11 percentage point loss in GDP.61 The transition
experiences of Central and Eastern European countries, and the countries of the former USSR,
illustrate this phenomenon. This chapter shows that the Libyan crisis has had major consequences
for the Tunisian economy. Though not the cause of all political and social challenges Tunisia has
confronted since the eventful year of 2011, the effects are evident in the depressed business
environment and the heightened security risks.
4.38. The accumulated losses during 2011–15 are estimated at 0.9 growth points per year, which
is equivalent to almost TD 9 billion in current prices. The cost is even higher when fiscal losses
resulting from the expansion of informal trade and losses of more than TD 300 million in Tunisian
investments in Libya are taken into account.
4.39. The effects of the Libyan crisis make a strong case for increased international aid for
Tunisia. Such aid could be targeted toward the increasing the security budget and economic
development for communities on Tunisia’s border with Libya.
4.40. The political situation in Libya may stabilize and with it hopes of a revival of the Libyan
economy. If this happens, there will be economic opportunities for both countries. Tunisia and
Libya should look forward to the time when the Libyan crisis is resolved by laying the groundwork
now with logistical planning and regulations that will ensure the maximum benefits for both
countries. With the risk that Libya’s reconstruction may boost the informal markets, early
preparation is of utmost importance. For instance, the two governments could join forces to bolster
the ground, air, and sea infrastructure that connects the two countries. They could also set up
mechanisms that facilitate the entry of consumer goods in Libya through formal channels and thus
potentially reduce the informal trading of goods.
61 “The Effects of Recent Political Changes on Arab Countries – A Five-Year Review.” Forthcoming.
United Nations Economic and Social Commission for Western Asia (UNESCWA) Social and Economic
Survey for the Arab Region.
82
Annexes

83
Appendices
Appendix 2.1 Trends in Foreign Direct Investments
Table 2A.1 Trends in Foreign Direct Investment between Tunisia and Libya (TD, millions–unless
otherwise specified)
Category Foreign direct investment of Libyans
in Tunisia (Revenue: Undertakings)
Foreign direct investment of Tunisians
in Libya (Expenditure)
2010 2011 2012 2013 2014 2010 2011 2012 2013 2014
Foreign Direct Investments
(FDI) 75.1 13.2 15.5 19.3 41.8 18.3 7.9 4.3 11.5 3.3
Energy 0.0 0.0 0.0 0.0 0.0 0.0 0.0 0.0 0.0 0.0
Manufacturing 9.8 0.2 8.5 2.8 34.6 18.3 7.9 4.3 9.4 3.3
Agriculture 0.0 0.0 0.0 0.1 0.0 0.0 0.0 0.0 0.0 0.0
Tourism 65.3 13.0 7.0 0.0 0.0 0.0 0.0 0.0 0.0 0.0
Other services 0.0 0.0 0.0 16.4 7.2 0.0 0.0 0.0 2.1 0.0
Portfolio Investments 0.0 0.6 0.1 0.0 0.0 0.0 0.0 0.0 3.5 1.2
Total 75.1 13.8 15.6 19.3 41.8 18.3 7.9 4.3 15.0 4.5
Table 2A.2 Comparative Trends in Foreign Direct Investment (TD, millions–unless otherwise
specified)
Category (Revenue: Undertakings) Expenditure
2010 2011 2012 2013 2014 2010 2011 2012 2013 2014
Libya 75.1 13.8 15.6 19.3 41.8 18.3 7.9 4.3 15.0 4.5
Other Arab
countries
(UAE)
(Qatar)
(Others)
156.0
55.8
54.0
46.2
155.5
82.5
55.7
17.3
935.4
61.9
784.2
89.3
216.5
39.4
145.4
31.7
268.5
33.4
176.1
59.0
114.0
48.9
0.0
65.1
905.2
17.0
0.0
888.2
15.4
1.0
0.0
14.4
30.0
3.0
0.0
27.0
22.3
3.0
0.0
19.3
European Union
(France)
(Italy)
(Germany)
(Great Britain)
(Others)
1,442.6
254.4
325.6
14.6
439.9
408.1
1,146.4
224.5
276.4
36.3
224.9
384.3
1,226.1
393.2
243.6
102.0
224.9
262.4
1,034.1
261.0
155.8
63.4
202.3
351.6
1,295.5
277.6
92.6
54.0
325.3
546.0
375.8
187.9
43.8
55.4
71.9
16.8
164.7
41.8
4.5
4.5
45.1
68.8
129.3
31.0
18.6
2.9
56.9
19.9
81.4
14.6
11.9
4.5
39.3
11.1
71.4
11.9
10.8
5.9
27.3
15.5
NAFTA
(United States)
(Canada)
267.6
128.1
139.5
228.1
52.5
175.6
219.2
62.1
157.1
244.9
27.6
217.3
97.1
32.2
64.9
36.4
33.0
3.4
99.8
71.7
28.1
39.0
32.5
6.5
30.0
26.5
3.5
19.8
19.3
0.5
Other countries 223.7 72.1 107.7 300.2 101.6 105.0 4.4 10.0 4.6 11.4
Total 2,165.0 1,615.9 2,504.0 1,815.0 1,804.5 649.5 1,182.0 198.0 161.0 129.4
Source: BCT (2015).
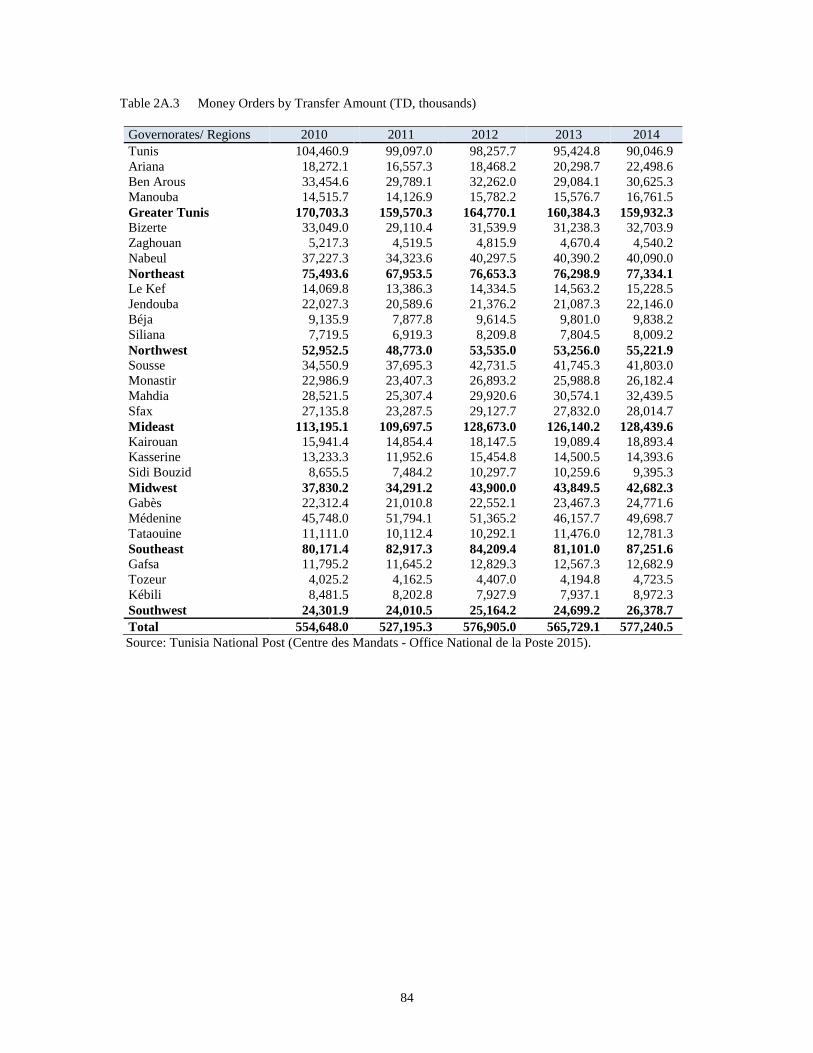
84
Table 2A.3 Money Orders by Transfer Amount (TD, thousands)
Governorates/ Regions 2010 2011 2012 2013 2014
Tunis 104,460.9 99,097.0 98,257.7 95,424.8 90,046.9
Ariana 18,272.1 16,557.3 18,468.2 20,298.7 22,498.6
Ben Arous 33,454.6 29,789.1 32,262.0 29,084.1 30,625.3
Manouba 14,515.7 14,126.9 15,782.2 15,576.7 16,761.5
Greater Tunis 170,703.3 159,570.3 164,770.1 160,384.3 159,932.3
Bizerte 33,049.0 29,110.4 31,539.9 31,238.3 32,703.9
Zaghouan 5,217.3 4,519.5 4,815.9 4,670.4 4,540.2
Nabeul 37,227.3 34,323.6 40,297.5 40,390.2 40,090.0
Northeast 75,493.6 67,953.5 76,653.3 76,298.9 77,334.1
Le Kef 14,069.8 13,386.3 14,334.5 14,563.2 15,228.5
Jendouba 22,027.3 20,589.6 21,376.2 21,087.3 22,146.0
Béja 9,135.9 7,877.8 9,614.5 9,801.0 9,838.2
Siliana 7,719.5 6,919.3 8,209.8 7,804.5 8,009.2
Northwest 52,952.5 48,773.0 53,535.0 53,256.0 55,221.9
Sousse 34,550.9 37,695.3 42,731.5 41,745.3 41,803.0
Monastir 22,986.9 23,407.3 26,893.2 25,988.8 26,182.4
Mahdia 28,521.5 25,307.4 29,920.6 30,574.1 32,439.5
Sfax 27,135.8 23,287.5 29,127.7 27,832.0 28,014.7
Mideast 113,195.1 109,697.5 128,673.0 126,140.2 128,439.6
Kairouan 15,941.4 14,854.4 18,147.5 19,089.4 18,893.4
Kasserine 13,233.3 11,952.6 15,454.8 14,500.5 14,393.6
Sidi Bouzid 8,655.5 7,484.2 10,297.7 10,259.6 9,395.3
Midwest 37,830.2 34,291.2 43,900.0 43,849.5 42,682.3
Gabès 22,312.4 21,010.8 22,552.1 23,467.3 24,771.6
Médenine 45,748.0 51,794.1 51,365.2 46,157.7 49,698.7
Tataouine 11,111.0 10,112.4 10,292.1 11,476.0 12,781.3
Southeast 80,171.4 82,917.3 84,209.4 81,101.0 87,251.6
Gafsa 11,795.2 11,645.2 12,829.3 12,567.3 12,682.9
Tozeur 4,025.2 4,162.5 4,407.0 4,194.8 4,723.5
Kébili 8,481.5 8,202.8 7,927.9 7,937.1 8,972.3
Southwest 24,301.9 24,010.5 25,164.2 24,699.2 26,378.7
Total 554,648.0 527,195.3 576,905.0 565,729.1 577,240.5
Source: Tunisia National Post (Centre des Mandats - Office National de la Poste 2015).
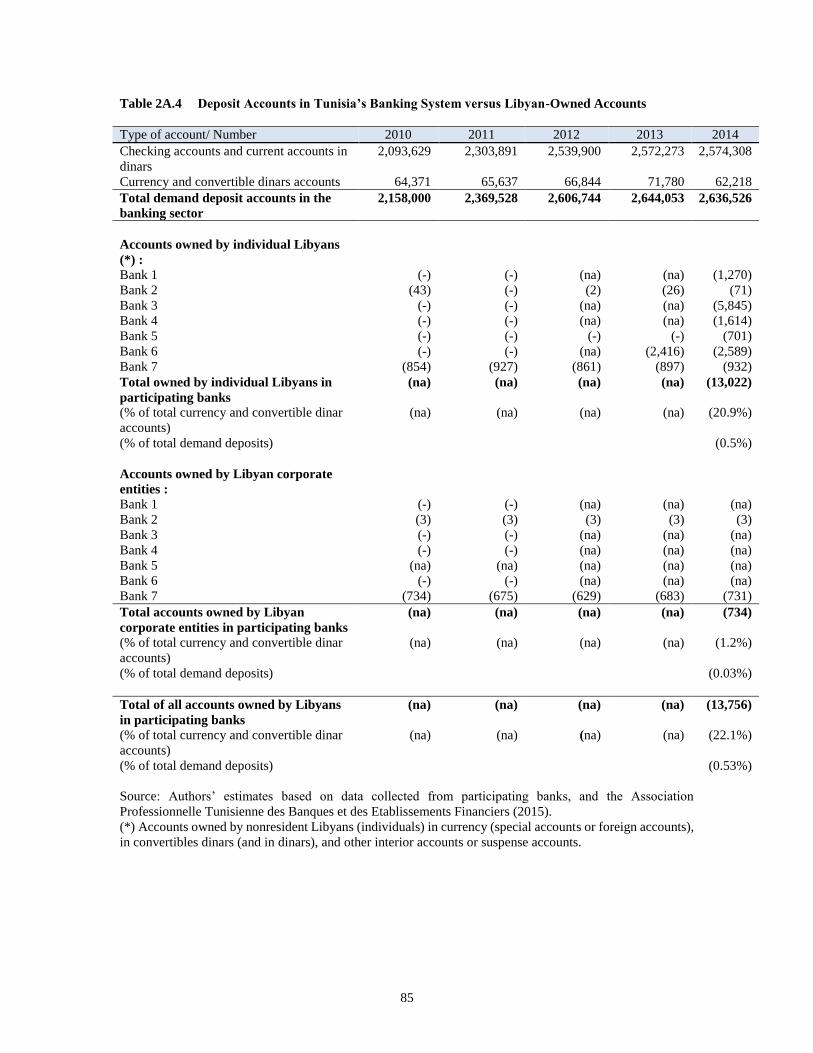
85
Table 2A.4 Deposit Accounts in Tunisia’s Banking System versus Libyan-Owned Accounts
Type of account/ Number 2010 2011 2012 2013 2014
Checking accounts and current accounts in
dinars
2,093,629 2,303,891 2,539,900 2,572,273 2,574,308
Currency and convertible dinars accounts 64,371 65,637 66,844 71,780 62,218
Total demand deposit accounts in the
banking sector
2,158,000 2,369,528 2,606,744 2,644,053 2,636,526
Accounts owned by individual Libyans
(*) :
Bank 1
Bank 2
Bank 3
Bank 4
Bank 5
Bank 6
Bank 7
(-)
(43)
(-)
(-)
(-)
(-)
(854)
(-)
(-)
(-)
(-)
(-)
(-)
(927)
(na)
(2)
(na)
(na)
(-)
(na)
(861)
(na)
(26)
(na)
(na)
(-)
(2,416)
(897)
(1,270)
(71)
(5,845)
(1,614)
(701)
(2,589)
(932)
Total owned by individual Libyans in
participating banks
(% of total currency and convertible dinar
accounts)
(% of total demand deposits)
(na)
(na)
(na)
(na)
(na)
(na)
(na)
(na)
(13,022)
(20.9%)
(0.5%)
Accounts owned by Libyan corporate
entities :
Bank 1
Bank 2
Bank 3
Bank 4
Bank 5
Bank 6
Bank 7
(-)
(3)
(-)
(-)
(na)
(-)
(734)
(-)
(3)
(-)
(-)
(na)
(-)
(675)
(na)
(3)
(na)
(na)
(na)
(na)
(629)
(na)
(3)
(na)
(na)
(na)
(na)
(683)
(na)
(3)
(na)
(na)
(na)
(na)
(731)
Total accounts owned by Libyan
corporate entities in participating banks
(% of total currency and convertible dinar
accounts)
(% of total demand deposits)
(na)
(na)
(na)
(na)
(na)
(na)
(na)
(na)
(734)
(1.2%)
(0.03%)
Total of all accounts owned by Libyans
in participating banks
(% of total currency and convertible dinar
accounts)
(% of total demand deposits)
(na)
(na)
(na)
(na)
(na)
(na)
(na)
(na)
(13,756)
(22.1%)
(0.53%)
Source: Authors’ estimates based on data collected from participating banks, and the Association
Professionnelle Tunisienne des Banques et des Etablissements Financiers (2015).
(*) Accounts owned by nonresident Libyans (individuals) in currency (special accounts or foreign accounts),
in convertibles dinars (and in dinars), and other interior accounts or suspense accounts.
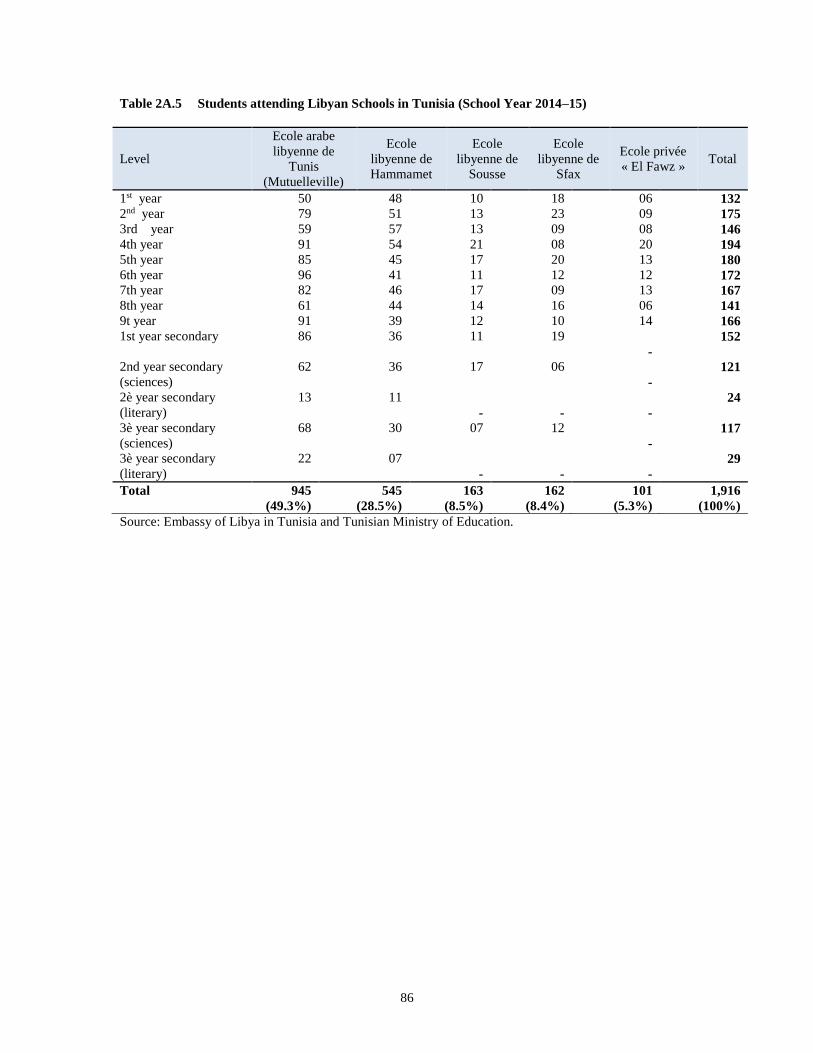
86
Table 2A.5 Students attending Libyan Schools in Tunisia (School Year 2014–15)
Level
Ecole arabe
libyenne de
Tunis
(Mutuelleville)
Ecole
libyenne de
Hammamet
Ecole
libyenne de
Sousse
Ecole
libyenne de
Sfax
Ecole privée
« El Fawz » Total
1st year 50 48 10 18 06 132
2nd year 79 51 13 23 09 175
3rd year 59 57 13 09 08 146
4th year 91 54 21 08 20 194
5th year 85 45 17 20 13 180
6th year 96 41 11 12 12 172
7th year 82 46 17 09 13 167
8th year 61 44 14 16 06 141
9t year 91 39 12 10 14 166
1st year secondary 86 36 11 19
-
152
2nd year secondary
(sciences)
62 36 17 06
-
121
2è year secondary
(literary)
13 11
-
-
-
24
3è year secondary
(sciences)
68 30 07 12
-
117
3è year secondary
(literary)
22 07
-
-
-
29
Total 945
(49.3%)
545
(28.5%)
163
(8.5%)
162
(8.4%)
101
(5.3%)
1,916
(100%)
Source: Embassy of Libya in Tunisia and Tunisian Ministry of Education.
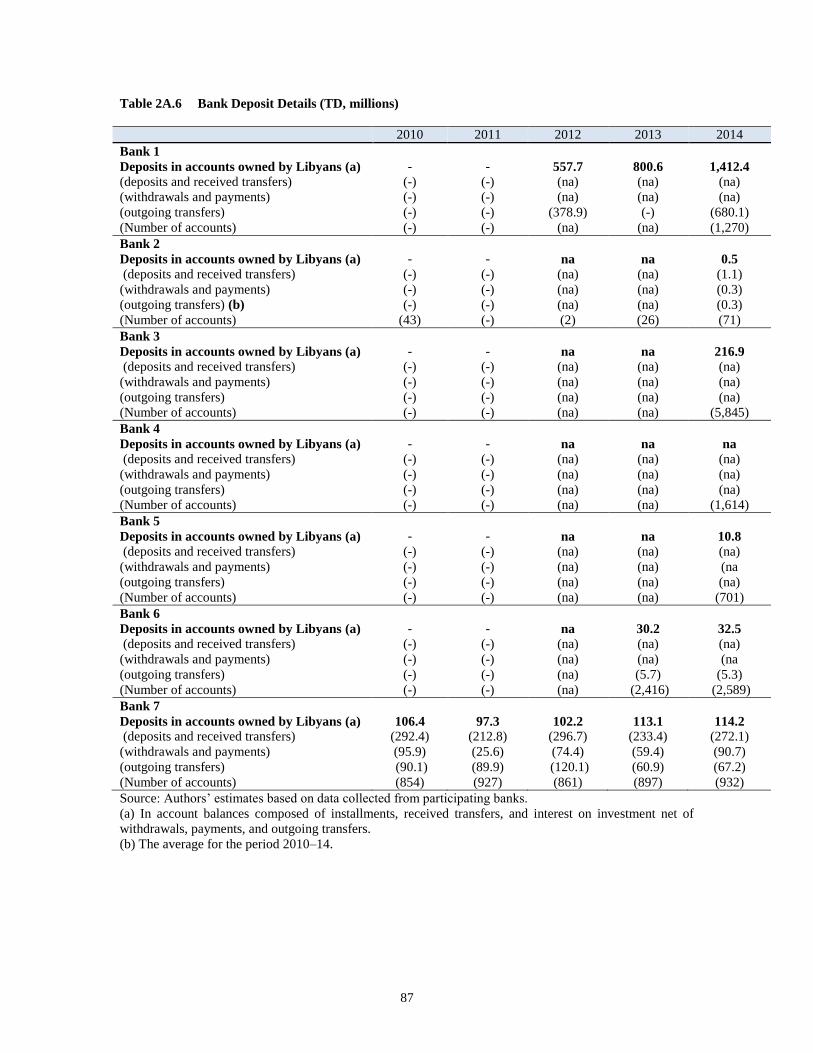
87
Table 2A.6 Bank Deposit Details (TD, millions)
2010 2011 2012 2013 2014
Bank 1
Deposits in accounts owned by Libyans (a) (deposits and received transfers)
(withdrawals and payments)
(outgoing transfers)
(Number of accounts)
-
(-)
(-)
(-)
(-)
-
(-)
(-)
(-)
(-)
557.7
(na)
(na)
(378.9)
(na)
800.6
(na)
(na)
(-)
(na)
1,412.4
(na)
(na)
(680.1)
(1,270)
Bank 2
Deposits in accounts owned by Libyans (a) (deposits and received transfers)
(withdrawals and payments)
(outgoing transfers) (b)
(Number of accounts)
-
(-)
(-)
(-)
(43)
-
(-)
(-)
(-)
(-)
na
(na)
(na)
(na)
(2)
na
(na)
(na)
(na)
(26)
0.5
(1.1)
(0.3)
(0.3)
(71)
Bank 3
Deposits in accounts owned by Libyans (a) (deposits and received transfers)
(withdrawals and payments)
(outgoing transfers)
(Number of accounts)
-
(-)
(-)
(-)
(-)
-
(-)
(-)
(-)
(-)
na
(na)
(na)
(na)
(na)
na
(na)
(na)
(na)
(na)
216.9
(na)
(na)
(na)
(5,845)
Bank 4
Deposits in accounts owned by Libyans (a) (deposits and received transfers)
(withdrawals and payments)
(outgoing transfers)
(Number of accounts)
-
(-)
(-)
(-)
(-)
-
(-)
(-)
(-)
(-)
na
(na)
(na)
(na)
(na)
na
(na)
(na)
(na)
(na)
na
(na)
(na)
(na)
(1,614)
Bank 5
Deposits in accounts owned by Libyans (a) (deposits and received transfers)
(withdrawals and payments)
(outgoing transfers)
(Number of accounts)
-
(-)
(-)
(-)
(-)
-
(-)
(-)
(-)
(-)
na
(na)
(na)
(na)
(na)
na
(na)
(na)
(na)
(na)
10.8
(na)
(na
(na)
(701)
Bank 6
Deposits in accounts owned by Libyans (a) (deposits and received transfers)
(withdrawals and payments)
(outgoing transfers)
(Number of accounts)
-
(-)
(-)
(-)
(-)
-
(-)
(-)
(-)
(-)
na
(na)
(na)
(na)
(na)
30.2
(na)
(na)
(5.7)
(2,416)
32.5
(na)
(na
(5.3)
(2,589)
Bank 7
Deposits in accounts owned by Libyans (a) (deposits and received transfers)
(withdrawals and payments)
(outgoing transfers)
(Number of accounts)
106.4
(292.4)
(95.9)
(90.1)
(854)
97.3
(212.8)
(25.6)
(89.9)
(927)
102.2
(296.7)
(74.4)
(120.1)
(861)
113.1
(233.4)
(59.4)
(60.9)
(897)
114.2
(272.1)
(90.7)
(67.2)
(932)
Source: Authors’ estimates based on data collected from participating banks.
(a) In account balances composed of installments, received transfers, and interest on investment net of
withdrawals, payments, and outgoing transfers.
(b) The average for the period 2010–14.
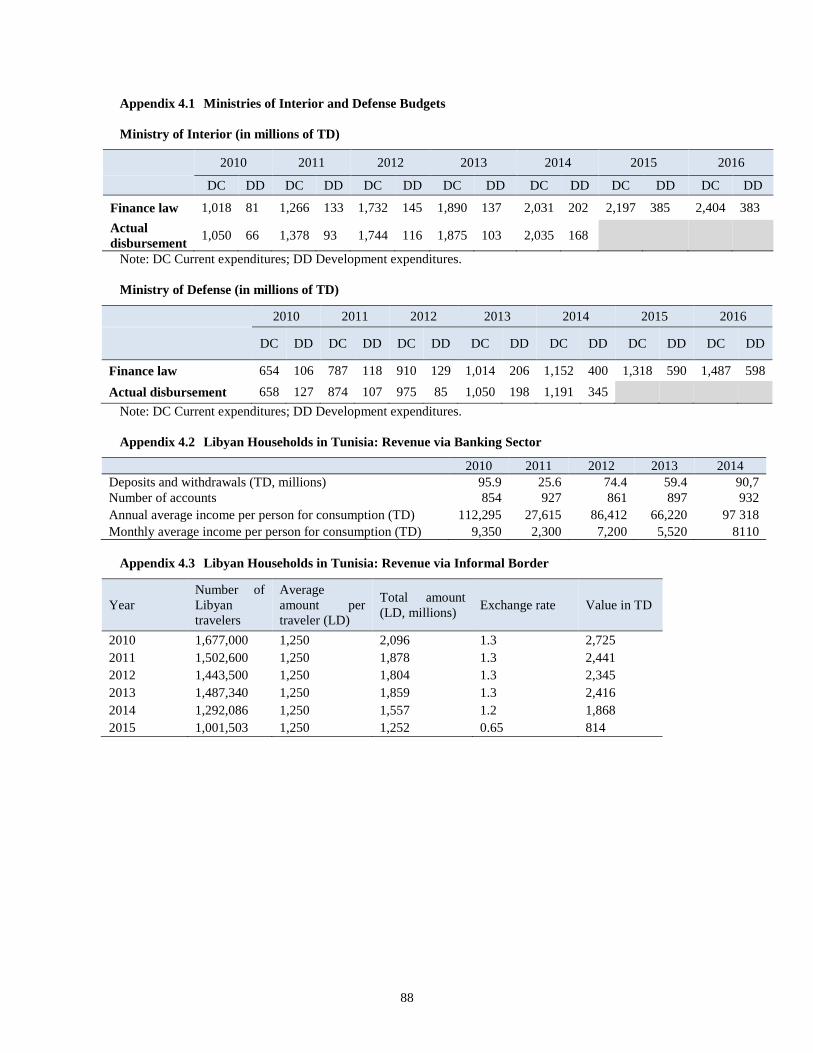
88
Appendix 4.1 Ministries of Interior and Defense Budgets
Ministry of Interior (in millions of TD)
2010 2011 2012 2013 2014 2015 2016
DC DD DC DD DC DD DC DD DC DD DC DD DC DD
Finance law 1,018 81 1,266 133 1,732 145 1,890 137 2,031 202 2,197 385 2,404 383
Actual
disbursement 1,050 66 1,378 93 1,744 116 1,875 103 2,035 168
Note: DC Current expenditures; DD Development expenditures.
Ministry of Defense (in millions of TD)
2010 2011 2012 2013 2014 2015 2016
DC DD DC DD DC DD DC DD DC DD DC DD DC DD
Finance law 654 106 787 118 910 129 1,014 206 1,152 400 1,318 590 1,487 598
Actual disbursement 658 127 874 107 975 85 1,050 198 1,191 345
Note: DC Current expenditures; DD Development expenditures.
Appendix 4.2 Libyan Households in Tunisia: Revenue via Banking Sector
2010 2011 2012 2013 2014
Deposits and withdrawals (TD, millions) 95.9 25.6 74.4 59.4 90,7
Number of accounts 854 927 861 897 932
Annual average income per person for consumption (TD) 112,295 27,615 86,412 66,220 97 318
Monthly average income per person for consumption (TD) 9,350 2,300 7,200 5,520 8110
Appendix 4.3 Libyan Households in Tunisia: Revenue via Informal Border
Year
Number of
Libyan
travelers
Average
amount per
traveler (LD)
Total amount
(LD, millions) Exchange rate Value in TD
2010 1,677,000 1,250 2,096 1.3 2,725
2011 1,502,600 1,250 1,878 1.3 2,441
2012 1,443,500 1,250 1,804 1.3 2,345
2013 1,487,340 1,250 1,859 1.3 2,416
2014 1,292,086 1,250 1,557 1.2 1,868
2015 1,001,503 1,250 1,252 0.65 814
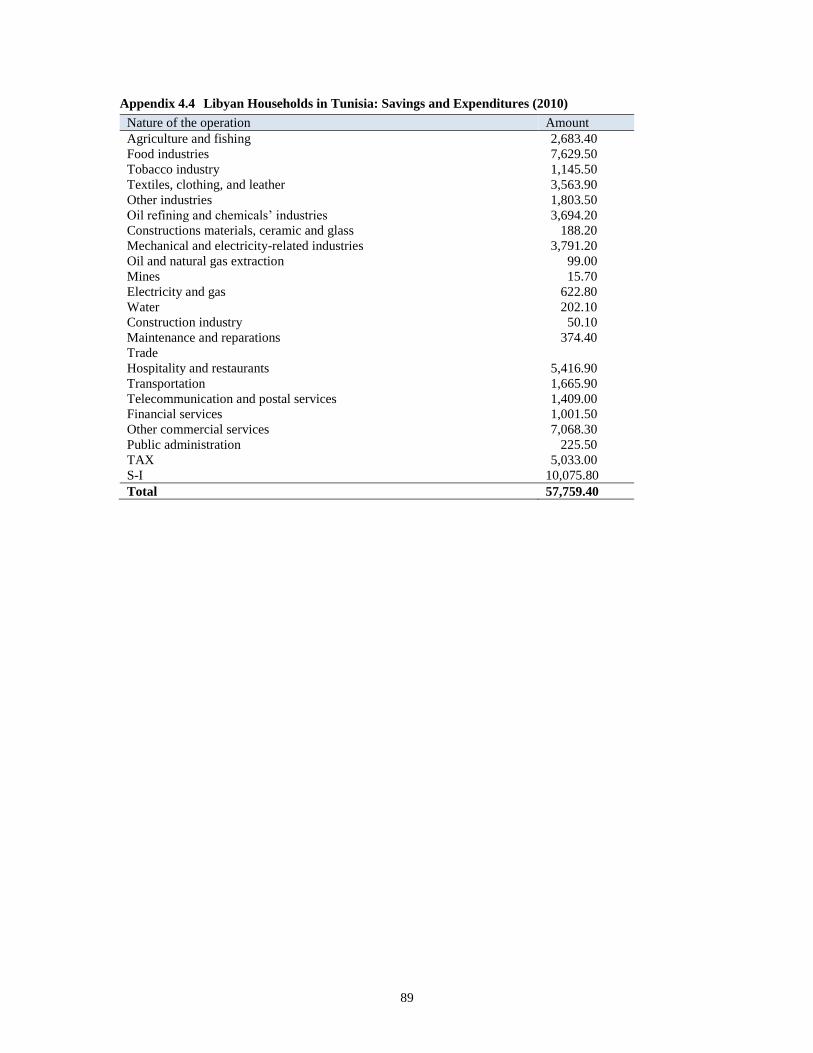
89
Appendix 4.4 Libyan Households in Tunisia: Savings and Expenditures (2010)
Nature of the operation Amount
Agriculture and fishing 2,683.40
Food industries 7,629.50
Tobacco industry 1,145.50
Textiles, clothing, and leather 3,563.90
Other industries 1,803.50
Oil refining and chemicals’ industries 3,694.20
Constructions materials, ceramic and glass 188.20
Mechanical and electricity-related industries 3,791.20
Oil and natural gas extraction 99.00
Mines 15.70
Electricity and gas 622.80
Water 202.10
Construction industry 50.10
Maintenance and reparations 374.40
Trade
Hospitality and restaurants 5,416.90
Transportation 1,665.90
Telecommunication and postal services 1,409.00
Financial services 1,001.50
Other commercial services 7,068.30
Public administration 225.50
TAX 5,033.00
S-I 10,075.80
Total 57,759.40
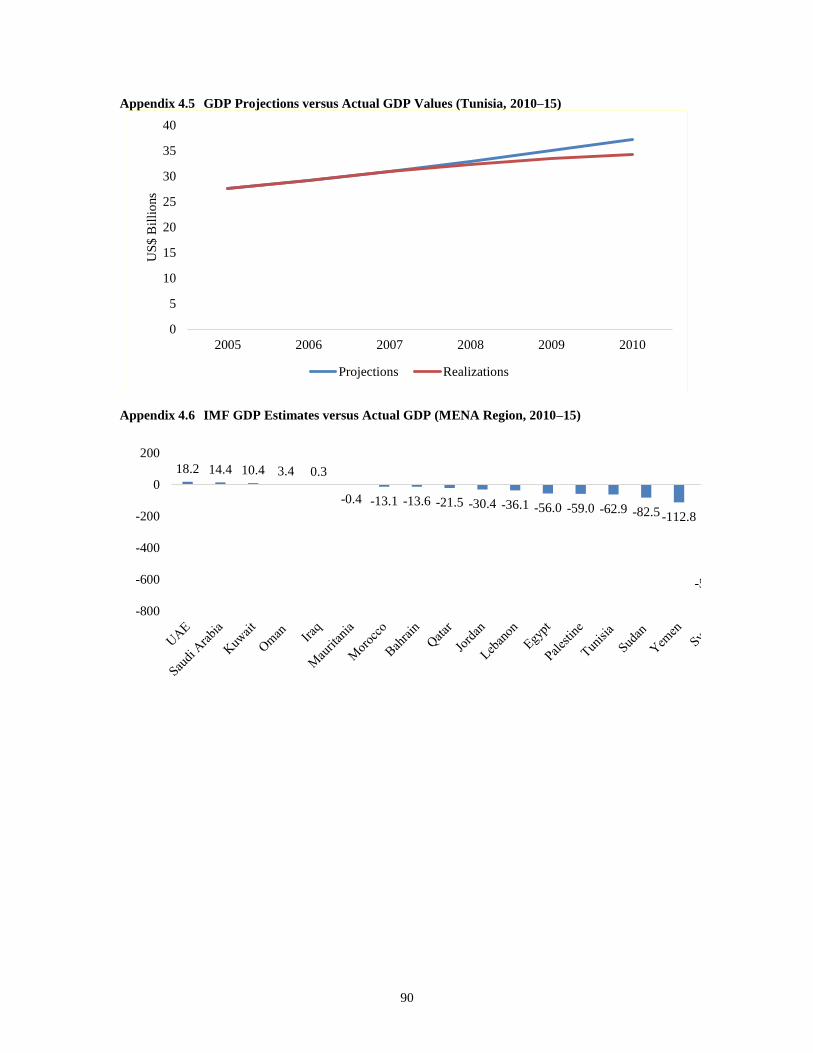
90
Appendix 4.5 GDP Projections versus Actual GDP Values (Tunisia, 2010–15)
Appendix 4.6 IMF GDP Estimates versus Actual GDP (MENA Region, 2010–15)
0
5
10
15
20
25
30
35
40
2005 2006 2007 2008 2009 2010
US
$ B
illi
ons
Projections Realizations
18.2 14.4 10.4 3.4 0.3
-0.4 -13.1 -13.6 -21.5 -30.4 -36.1 -56.0 -59.0 -62.9 -82.5 -112.8
-534.4
-636.6-800
-600
-400
-200
0
200

91
References
Anyanwu, J.C. and A.E.O. Erhijakpor. 2010. “Les transferts de fonds internationaux ont-ils un
impact sur la pauvreté en Afrique?” African Development Review 22 (1): 51-91.
Arab Institute of Business Leaders (L’Institut Arabe des Chefs d’Entreprise; IACE). 2015. “La
Tunisie et ses pays voisins: Risques communs et solutions” (June).
Ayadi, Lotfi, Nancy Benjamin, Sami Bensassi, and Gaël Raballand. 2013. “Estimating Informal
Trade Across Tunisia's Land Borders.” Policy Research Working Paper 6731, World Bank,
Washington, DC.
Ayadi, Lotfi. 2015. “Contraband of Tires: Estimates and Recommendations.” Mimeo.
Ayadi, Lotfi et al. Forthcoming. “Estimating Cross-Border Informal Financial Flows.” In Study on
the Impact of the Libyan Conflict on the Tunisian Economy. World Bank, Washington, DC.
Haddar M. 2013. “Rapport sur les relations économiques entre la Tunisie et la Libye auprès du Plan
Régional d’Environnement et de Développement Durable du Gouvernorat de Médenine
(PREDD) et de la Table Ronde Économique (TRE) à Médenine.” German Society
for International Cooperation (Deutsche Gesellschaft für Internationale Zusammenarbeit;
GIZ), Tunis.
Haddar, Mohamed. 2014. “Report on Economic Relations between Tunisia and Libya.” Mimeo.
International Organization for Migration (IOM). 2011. “IOM Response to the Libyan Crisis:
External Situation Report” (May).
International Organization for Migration (IOM) and African Development Bank (AfDB). 2013.
“Migration of Tunisians to Libya: Dynamics, Challenges and Prospects” (March).
International Organization for Migration (IOM) and Tunisian National Observatory on Migration
(ONM). 2016. “Etude qualitative d’évaluation des besoins socio-économiques des libyens en
Tunisie” (March).
Joussour. 2016. “How to Approach Contraband in order to prepare Its Containment: The Stakes for
Public Policy.”
Laroussi, Kamel. 2013. “The Tunisia–Libya Border Areas under the torment of globalization and
the Prospect of New Forms of Urbanization and Governance in the New Economic Regions.”
Institut des Regions Arides, Medenine, Revue des Regions Arides
Meddeb, Hamza. 2012. “Run or Die: Race at El Khoza and Daily Domination in Tunisia during
Ben Ali.” PhD thesis, Institut d’Etude Politique.
Murdoch, James C., and Todd Sandler. 2004. “Civil Wars and Economic Growth: Spatial
Dispersion. American Journal of Political Science, 48(1): 138–51.
92
Rijkers, Bob, Leila Baghdadi and Gael Raballand. 2015. “Political Connections and Tariff Evasion:
Evidence from Tunisia.” Policy Research Working Paper 7336, World Bank, Washington,
DC.
Santi, Emanule, Saoussen Ben Romdhane, and Mohamed Safouane Ben Aïssa. "Impact of Libya’s
Conflict on the Tunisian Economy: A Preliminary Assessment." North Africa Quarterly
Analytical, 2nd Quarter, 2011. African Development Bank, Tunis.