Embed Size (px)
Citation preview
Paper submitted at the Conference „Advanced Microsystems for automotive Applications“, April 2006, Berlin, accepted for conference proceedings and poster presentation.
Requirement Engineering for Active Safety Pedestrian Protection Systems based on Accident Research
R. Fröming, V. Schindler, TU Berlin
M. Kühn, VTIV
Abstract
The possibility to assess active safety measures for pedestrian protection is a prerequisite for the
definition of reasonable driver assistance systems and their sensor need. The Verps+-index combines In-
Depth accident data, driver models and vehicle tests in a new way. As an example, different brake assist
strategies are analysed regarding their safety benefit for pedestrian protection. Additionally, requirements
for the sensor system will be defined. Different sensing principles can be rated regarding their compliance
to these requirements. It can be shown that by use of environmental sensors a brake assist strategy which
keeps the driver in the loop already obtains remarkable safety benefits for pedestrians, while more
advanced autonomous emergency braking strategies retrieve only limited additional performance. This
means that mayor benefits in pedestrian protection can already be obtained by using “simpler”
environmental sensors with reduced pedestrian recognition capabilities.
A few years ago vehicle safety was all about occupant safety. The impact of the vehicle on its environment and to
vulnerable road users (VRU) had less priority. Huge efforts have been made in the last decades to increase road
safety. Therefore, modern cars are unprecedently safe in terms of occupant safety. Nevertheless, there is still a great
potential to save the lives of VRU’s and to minimise their injuries. During the last decade pedestrian and bicyclist
safety discussion peaked at national and international levels. Calls have been made to implement measures to
increase pedestrian safety. This has lead to European legislation concerning pedestrian safety and other VRU’s. The
recently released legislation is based on a component test procedure which assesses the vehicle front [1].
Nevertheless, active safety in general (infrastructural, educational and technical measures) has increased, helping to
keep the number of accidents nearly constant while traffic density is increased. Against the background of the
development of intelligent driver assistant systems (ADAS), the European pedestrian safety approach has to be
adapted. These active safety systems might be able to sense a crash before it happens and reduce its severity or even
avoid a crash by using advanced pre-crash sensors. The following chart (see Fig. 1) shows an expected penetration
of the car market by active safety systems within the next ten years in Germany.
Assistant Systems 2003
1. Generation (100%)
€ 4300,- per car
3. Generation (20%)
+ X
+ X
Assistant Systems 2010 Assistant Systems 2015
Fog Sensor
Crash Detection
+ X
Object DetectionPedestrian Protection
1. Generation (80%)
€ 3200,- per car
2. Generation (30%)
Lane-Keeping-Assistant
Lane-Change-Assistant
Wake-Up System
Automatic Emergency Brake
ABS
ESP
Pressure Control
Brake Assistant
ACC
€ 900,- per car
1. Generation (35%)
Adaptive Light
Fog Sensor
Crash Detection
+ X
Object DetectionPedestrian Protection
2. Generation (75%)
Lane-Keeping-Assistant
Lane-Change-Assistant
Wake-Up System
Automatic Emergency Brake
Fig. 1. Market share for driver assistant systems in Germany (based on [2])
Paper submitted at the Conference „Advanced Microsystems for automotive Applications“, April 2006, Berlin, accepted for conference proceedings and poster presentation.
1 Accident Research
Analysis of accidents involving vulnerable road users (VRU’s) helps to deduce suitable measures of protection.
Additionally, the effect in real world accident situations of certain measures can be proven by use of accident benefit
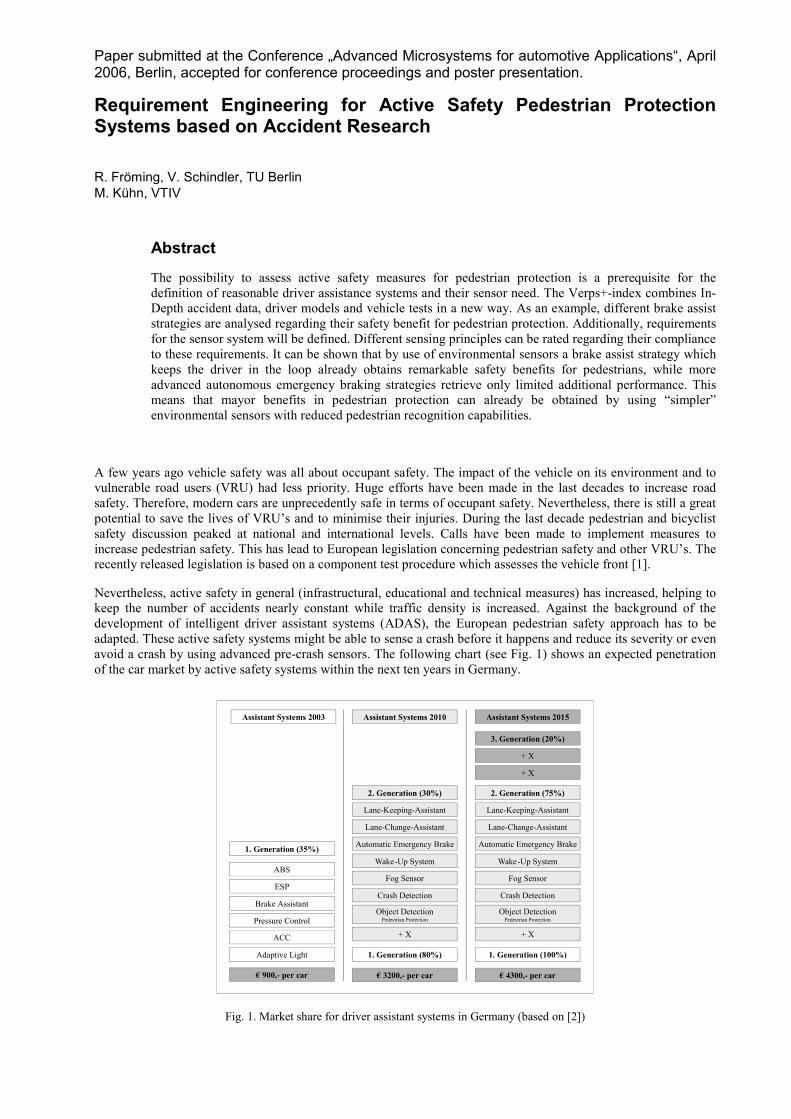
research. In this chapter data related to pedestrian accident situation is summarized. The accident figures in Tab. 1
give an impression concerning the relevance of pedestrian and bicyclist accidents worldwide.
Region Pedestrians
killed
Bicyclists killed Pedestrian
injured
Bicyclist
injured
EU-25 8.798 (2003) - 184.300 (2003) -
Germany 838 (2004) 475 (2004) 33.160 (2004) 73.000 (2004)
USA 4.641 (2004) 725 (2004) 78.000 (2001) 41.000 (2003)
Japan 2.332 (2003) 991 (2002) 85.592 (2003) -
Australia 232 (2003) 26 (2003) - -
Tab. 1. International comparison of accident figures concerning killed and injured pedestrians and bicyclists (based on current
governmental statistics).
Federal accident statistics are of limited use for detailed questions concerning the accident event or the cause of
injuries. For more detailed questions, in-depth accident analysis can give the answers. In Germany, the
“Bundesanstalt für Straßenwesen (BAST)” and the "Forschungsvereinigung Automobiltechnik e.V. (FAT)“
cooperate in conducting such studies (GIDAS1) [3]. Based on in-depth data of 663 pedestrian-car-accidents,
occurred since 1994, detailed analysis of this accident type can be done. The results are limited to the suburbs of
Hanover, slight changes are expected for accidents throughout Germany.
Accident event and location
Analysis of statistical data shows that 94 % of all pedestrian accidents happen in the urban environment. Only 6 %
of accidents happen in rural areas, but accidents in rural areas cause more severe and fatal injuries. 71.4 % of the
killed pedestrians were involved in accidents in rural areas.
80.2 % of all pedestrian accidents happen on roads classified as “city streets”. 9.7 % occur on country roads, 4.9 %
on federal roads and 3.2 % on parking sites. On other road classes, only 2 % of all pedestrian accidents take place.
This is to differentiate between gateways (0.8 %), autobahn (0.6 %), cycle-, footways and trails (0.4 %) and play
streets for children (0.2 %). Injury severity level depending on road class shows that the injury severity level
increases with increasing speed limit. Straight road is the most common accident scene in case of pedestrian
accidents. 60.3 % of all pedestrian accidents happen in this scene. Other common accident scenes are crossroads
with 19 % of the accidents and gateways with 11 % of the accidents.
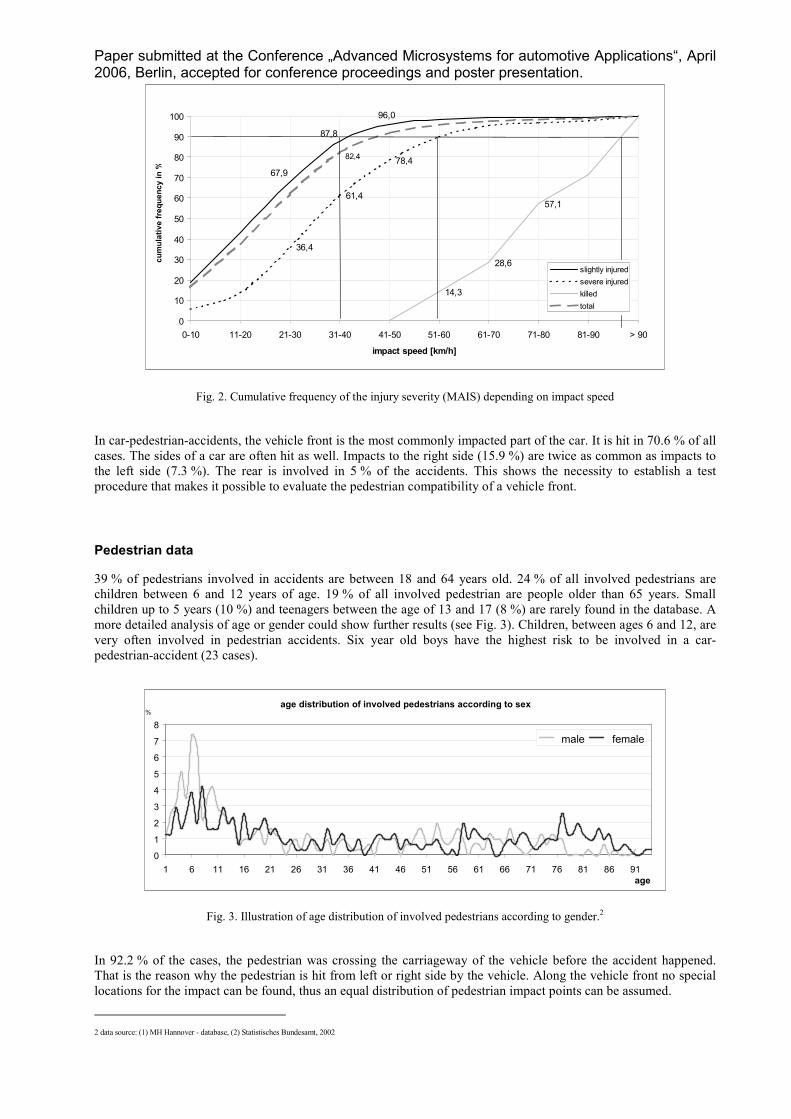
82 % of pedestrian accidents happen with an impact velocity up to 40 km/h. 87.8 % of accidents causing slight
injuries at this velocity level. The risk of more severe injuries increases with increasing impact velocity. Severe
injuries are sustained in 61.4 % of accidents at an impact velocity level up to 40 km/h. No deadly injuries are found
in the database up to 50 km/h.
1 GIDAS – German In-Depth - Data Analysis Study.
Paper submitted at the Conference „Advanced Microsystems for automotive Applications“, April 2006, Berlin, accepted for conference proceedings and poster presentation.
96,0
87,8
67,9
78,4
61,4
36,4
57,1
28,6
14,3
82,4
0
10
20
30
40
50
60
70
80
90
100
0-10 11-20 21-30 31-40 41-50 51-60 61-70 71-80 81-90 > 90
impact speed [km/h]
slightly injured
severe injured
killed
total
cum
ula
tive fre
quency in %
Fig. 2. Cumulative frequency of the injury severity (MAIS) depending on impact speed
In car-pedestrian-accidents, the vehicle front is the most commonly impacted part of the car. It is hit in 70.6 % of all
cases. The sides of a car are often hit as well. Impacts to the right side (15.9 %) are twice as common as impacts to
the left side (7.3 %). The rear is involved in 5 % of the accidents. This shows the necessity to establish a test
procedure that makes it possible to evaluate the pedestrian compatibility of a vehicle front.
Pedestrian data
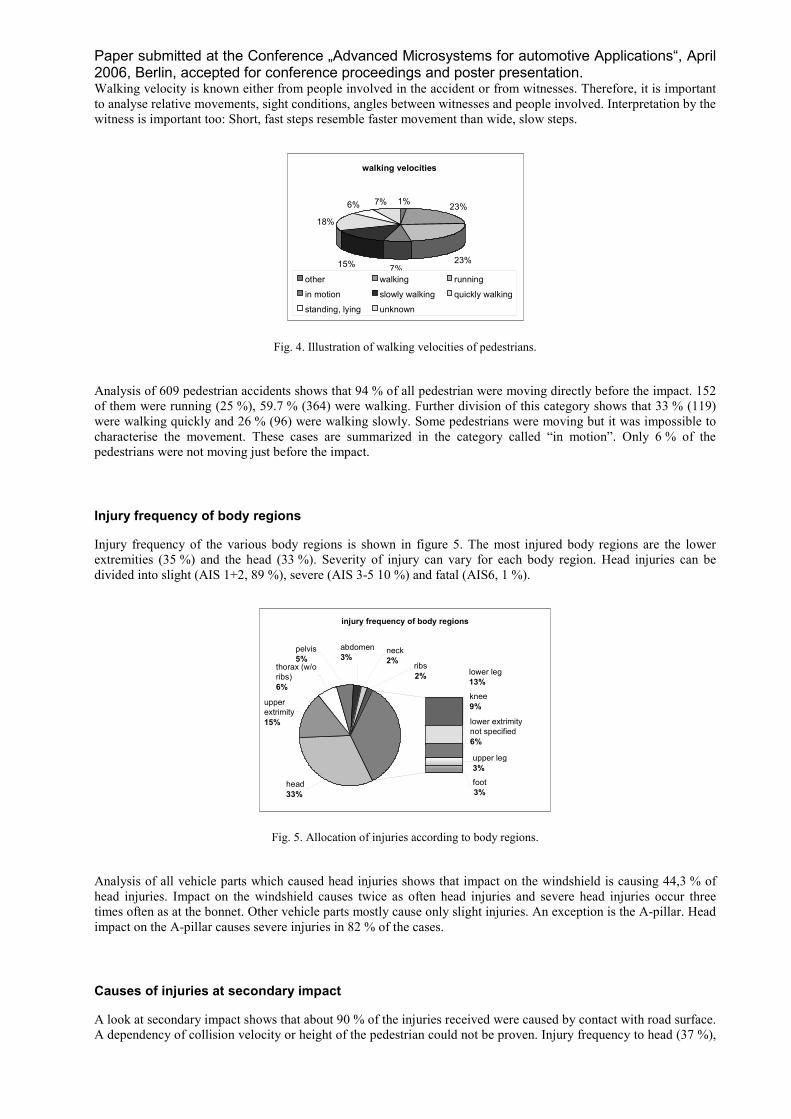
39 % of pedestrians involved in accidents are between 18 and 64 years old. 24 % of all involved pedestrians are
children between 6 and 12 years of age. 19 % of all involved pedestrian are people older than 65 years. Small
children up to 5 years (10 %) and teenagers between the age of 13 and 17 (8 %) are rarely found in the database. A
more detailed analysis of age or gender could show further results (see Fig. 3). Children, between ages 6 and 12, are
very often involved in pedestrian accidents. Six year old boys have the highest risk to be involved in a car-
pedestrian-accident (23 cases).
age distribution of involved pedestrians according to sex
0
1
2
3
4
5
6
7
8
1 6 11 16 21 26 31 36 41 46 51 56 61 66 71 76 81 86 91
male female
%
age
Fig. 3. Illustration of age distribution of involved pedestrians according to gender.2
In 92.2 % of the cases, the pedestrian was crossing the carriageway of the vehicle before the accident happened.
That is the reason why the pedestrian is hit from left or right side by the vehicle. Along the vehicle front no special
locations for the impact can be found, thus an equal distribution of pedestrian impact points can be assumed.
2 data source: (1) MH Hannover - database, (2) Statistisches Bundesamt, 2002
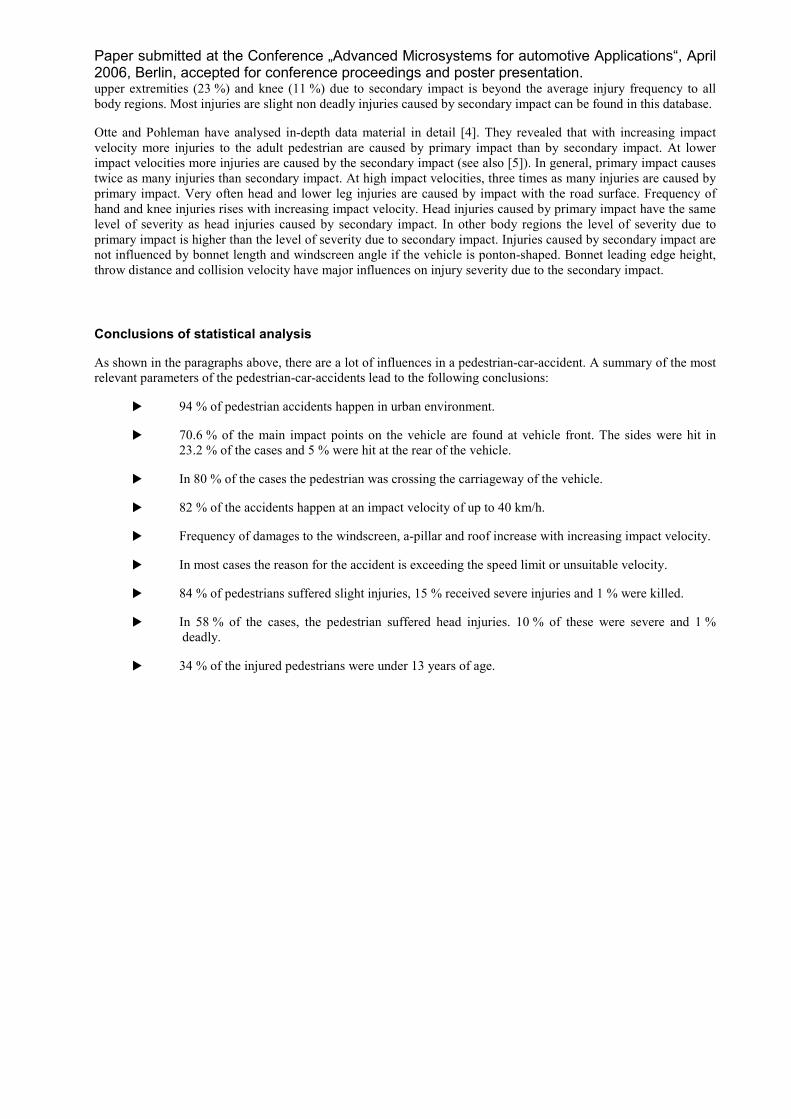
Paper submitted at the Conference „Advanced Microsystems for automotive Applications“, April 2006, Berlin, accepted for conference proceedings and poster presentation. Walking velocity is known either from people involved in the accident or from witnesses. Therefore, it is important
to analyse relative movements, sight conditions, angles between witnesses and people involved. Interpretation by the
witness is important too: Short, fast steps resemble faster movement than wide, slow steps.
walking velocities
1%23%
23%7%
15%
18%
6% 7%
other walking running
in motion slowly walking quickly walking
standing, lying unknown
Fig. 4. Illustration of walking velocities of pedestrians.
Analysis of 609 pedestrian accidents shows that 94 % of all pedestrian were moving directly before the impact. 152
of them were running (25 %), 59.7 % (364) were walking. Further division of this category shows that 33 % (119)
were walking quickly and 26 % (96) were walking slowly. Some pedestrians were moving but it was impossible to
characterise the movement. These cases are summarized in the category called “in motion”. Only 6 % of the
pedestrians were not moving just before the impact.
Injury frequency of body regions
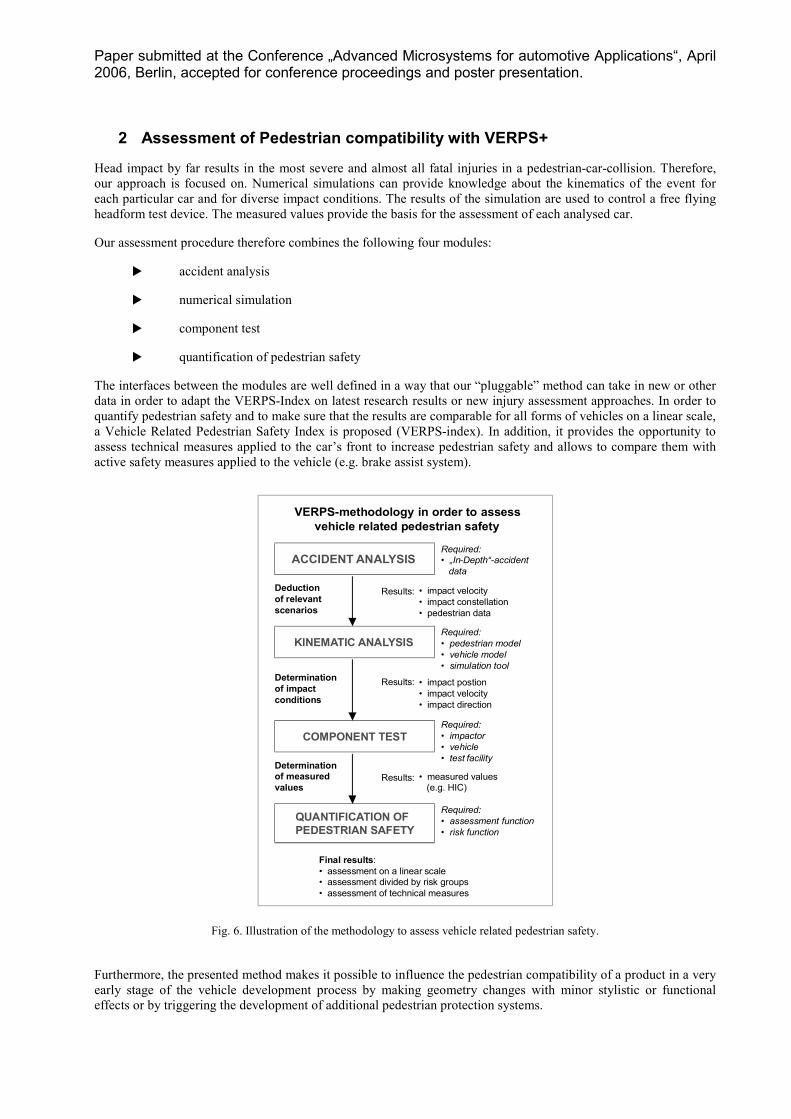
Injury frequency of the various body regions is shown in figure 5. The most injured body regions are the lower
extremities (35 %) and the head (33 %). Severity of injury can vary for each body region. Head injuries can be
divided into slight (AIS 1+2, 89 %), severe (AIS 3-5 10 %) and fatal (AIS6, 1 %).
injury frequency of body regions
head
33%
neck
2%
abdomen
3%ribs
2%
pelvis
5%thorax (w/o
ribs)
6%
upper
extrimity
15%
foot
3%
upper leg
3%
lower extrimity
not specified
6%
knee
9%
lower leg
13%
Fig. 5. Allocation of injuries according to body regions.
Analysis of all vehicle parts which caused head injuries shows that impact on the windshield is causing 44,3 % of
head injuries. Impact on the windshield causes twice as often head injuries and severe head injuries occur three
times often as at the bonnet. Other vehicle parts mostly cause only slight injuries. An exception is the A-pillar. Head
impact on the A-pillar causes severe injuries in 82 % of the cases.
Causes of injuries at secondary impact
A look at secondary impact shows that about 90 % of the injuries received were caused by contact with road surface.
A dependency of collision velocity or height of the pedestrian could not be proven. Injury frequency to head (37 %),
Paper submitted at the Conference „Advanced Microsystems for automotive Applications“, April 2006, Berlin, accepted for conference proceedings and poster presentation. upper extremities (23 %) and knee (11 %) due to secondary impact is beyond the average injury frequency to all
body regions. Most injuries are slight non deadly injuries caused by secondary impact can be found in this database.
Otte and Pohleman have analysed in-depth data material in detail [4]. They revealed that with increasing impact
velocity more injuries to the adult pedestrian are caused by primary impact than by secondary impact. At lower
impact velocities more injuries are caused by the secondary impact (see also [5]). In general, primary impact causes
twice as many injuries than secondary impact. At high impact velocities, three times as many injuries are caused by
primary impact. Very often head and lower leg injuries are caused by impact with the road surface. Frequency of
hand and knee injuries rises with increasing impact velocity. Head injuries caused by primary impact have the same
level of severity as head injuries caused by secondary impact. In other body regions the level of severity due to
primary impact is higher than the level of severity due to secondary impact. Injuries caused by secondary impact are
not influenced by bonnet length and windscreen angle if the vehicle is ponton-shaped. Bonnet leading edge height,
throw distance and collision velocity have major influences on injury severity due to the secondary impact.
Conclusions of statistical analysis
As shown in the paragraphs above, there are a lot of influences in a pedestrian-car-accident. A summary of the most
relevant parameters of the pedestrian-car-accidents lead to the following conclusions:
� 94 % of pedestrian accidents happen in urban environment.
� 70.6 % of the main impact points on the vehicle are found at vehicle front. The sides were hit in
23.2 % of the cases and 5 % were hit at the rear of the vehicle.
� In 80 % of the cases the pedestrian was crossing the carriageway of the vehicle.
� 82 % of the accidents happen at an impact velocity of up to 40 km/h.
� Frequency of damages to the windscreen, a-pillar and roof increase with increasing impact velocity.
� In most cases the reason for the accident is exceeding the speed limit or unsuitable velocity.
� 84 % of pedestrians suffered slight injuries, 15 % received severe injuries and 1 % were killed.
� In 58 % of the cases, the pedestrian suffered head injuries. 10 % of these were severe and 1 %
deadly.
� 34 % of the injured pedestrians were under 13 years of age.
Paper submitted at the Conference „Advanced Microsystems for automotive Applications“, April 2006, Berlin, accepted for conference proceedings and poster presentation.
2 Assessment of Pedestrian compatibility with VERPS+
Head impact by far results in the most severe and almost all fatal injuries in a pedestrian-car-collision. Therefore,
our approach is focused on. Numerical simulations can provide knowledge about the kinematics of the event for
each particular car and for diverse impact conditions. The results of the simulation are used to control a free flying
headform test device. The measured values provide the basis for the assessment of each analysed car.
Our assessment procedure therefore combines the following four modules:
� accident analysis
� numerical simulation
� component test
� quantification of pedestrian safety
The interfaces between the modules are well defined in a way that our “pluggable” method can take in new or other
data in order to adapt the VERPS-Index on latest research results or new injury assessment approaches. In order to
quantify pedestrian safety and to make sure that the results are comparable for all forms of vehicles on a linear scale,
a Vehicle Related Pedestrian Safety Index is proposed (VERPS-index). In addition, it provides the opportunity to
assess technical measures applied to the car’s front to increase pedestrian safety and allows to compare them with
active safety measures applied to the vehicle (e.g. brake assist system).
ACCIDENT ANALYSIS
KINEMATIC ANALYSIS
COMPONENT TEST
QUANTIFICATION OF
PEDESTRIAN SAFETY
Deduction
of relevant
scenarios
Determination
of impact
conditions
Determination
of measured
values
Required:
• „In-Depth“-accident
data
Required:
• pedestrian model
• vehicle model
• simulation tool
Required:
• impactor
• vehicle
• test facility
• impact velocity
• impact constellation
• pedestrian data
VERPS-methodology in order to assess
vehicle related pedestrian safety
Results:
Results:
Results:
• impact postion
• impact velocity
• impact direction
• measured values
(e.g. HIC)
Required:
• assessment function
• risk function
Final results:
• assessment on a linear scale
• assessment divided by risk groups
• assessment of technical measures
Fig. 6. Illustration of the methodology to assess vehicle related pedestrian safety.
Furthermore, the presented method makes it possible to influence the pedestrian compatibility of a product in a very
early stage of the vehicle development process by making geometry changes with minor stylistic or functional
effects or by triggering the development of additional pedestrian protection systems.
Paper submitted at the Conference „Advanced Microsystems for automotive Applications“, April 2006, Berlin, accepted for conference proceedings and poster presentation.
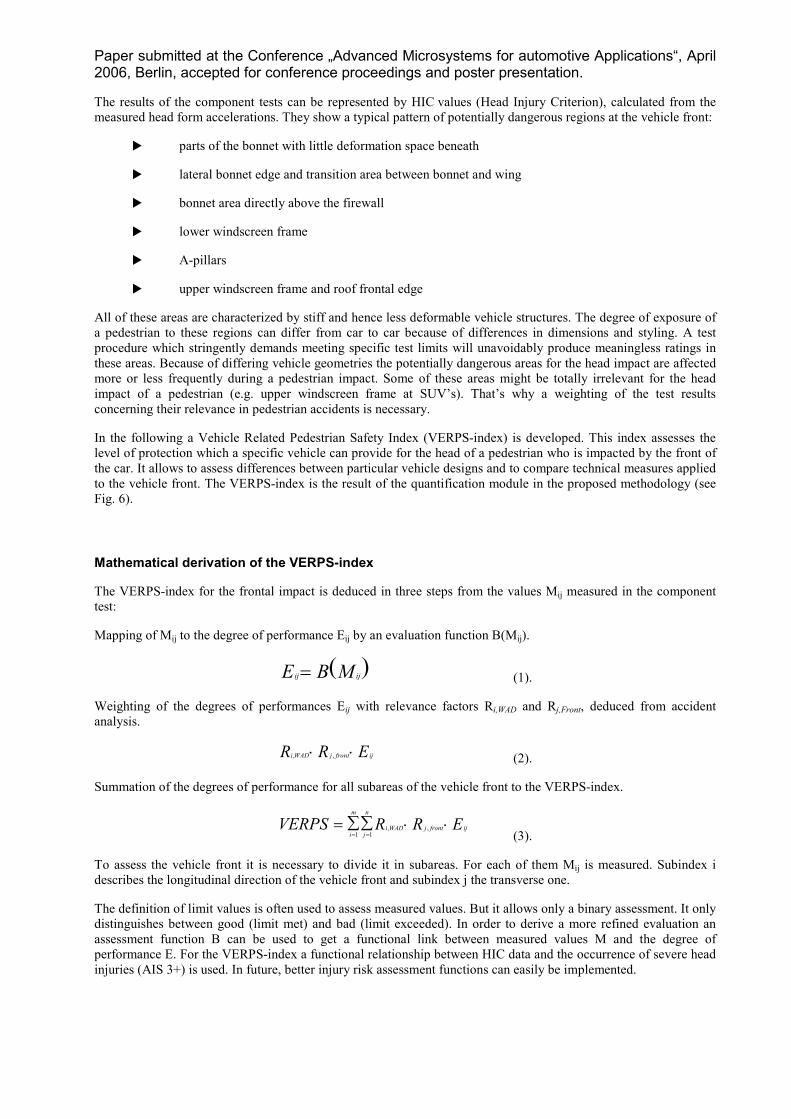
The results of the component tests can be represented by HIC values (Head Injury Criterion), calculated from the
measured head form accelerations. They show a typical pattern of potentially dangerous regions at the vehicle front:
� parts of the bonnet with little deformation space beneath
� lateral bonnet edge and transition area between bonnet and wing
� bonnet area directly above the firewall
� lower windscreen frame
� A-pillars
� upper windscreen frame and roof frontal edge
All of these areas are characterized by stiff and hence less deformable vehicle structures. The degree of exposure of
a pedestrian to these regions can differ from car to car because of differences in dimensions and styling. A test
procedure which stringently demands meeting specific test limits will unavoidably produce meaningless ratings in
these areas. Because of differing vehicle geometries the potentially dangerous areas for the head impact are affected
more or less frequently during a pedestrian impact. Some of these areas might be totally irrelevant for the head
impact of a pedestrian (e.g. upper windscreen frame at SUV’s). That’s why a weighting of the test results
concerning their relevance in pedestrian accidents is necessary.
In the following a Vehicle Related Pedestrian Safety Index (VERPS-index) is developed. This index assesses the
level of protection which a specific vehicle can provide for the head of a pedestrian who is impacted by the front of
the car. It allows to assess differences between particular vehicle designs and to compare technical measures applied
to the vehicle front. The VERPS-index is the result of the quantification module in the proposed methodology (see
Fig. 6).
Mathematical derivation of the VERPS-index
The VERPS-index for the frontal impact is deduced in three steps from the values Mij measured in the component
test:
Mapping of Mij to the degree of performance Eij by an evaluation function B(Mij).
( )MBE ijij= (1).
Weighting of the degrees of performances Eij with relevance factors Ri,WAD and Rj,Front, deduced from accident
analysis.
ERR ijfrontjWADi ⋅⋅ ,, (2).
Summation of the degrees of performance for all subareas of the vehicle front to the VERPS-index.
∑∑ ⋅⋅== =
m
i
n
jijfrontjWADi ERRVERPS
1 1,,
(3).
To assess the vehicle front it is necessary to divide it in subareas. For each of them Mij is measured. Subindex i
describes the longitudinal direction of the vehicle front and subindex j the transverse one.
The definition of limit values is often used to assess measured values. But it allows only a binary assessment. It only
distinguishes between good (limit met) and bad (limit exceeded). In order to derive a more refined evaluation an
assessment function B can be used to get a functional link between measured values M and the degree of
performance E. For the VERPS-index a functional relationship between HIC data and the occurrence of severe head
injuries (AIS 3+) is used. In future, better injury risk assessment functions can easily be implemented.
Paper submitted at the Conference „Advanced Microsystems for automotive Applications“, April 2006, Berlin, accepted for conference proceedings and poster presentation.
Injury severity probability for AIS3+ head injuries
0%
10%
20%
30%
40%
50%
60%
70%
80%
90%
100%
0 250 500 750 1000 1250 1500 1750 2000 2250 2500 2750 3000
HIC
ISP
HIC
,H,3
24.4%
93.9%
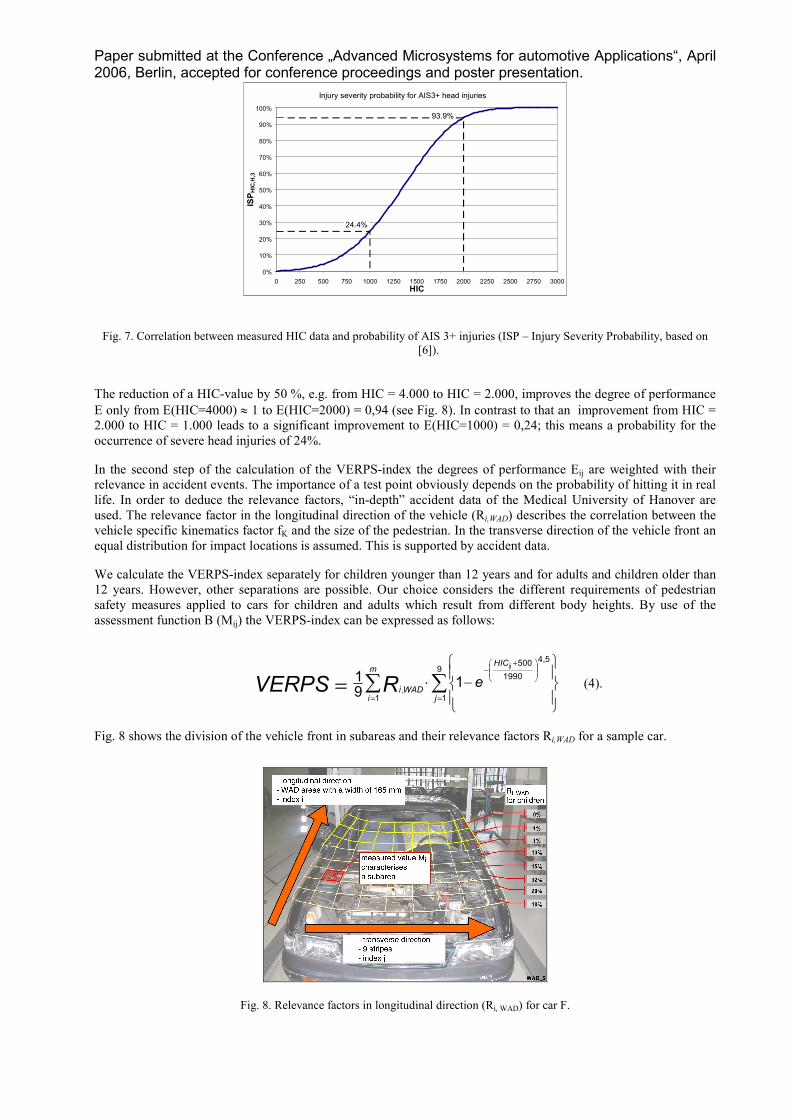
Fig. 7. Correlation between measured HIC data and probability of AIS 3+ injuries (ISP – Injury Severity Probability, based on
[6]).
The reduction of a HIC-value by 50 %, e.g. from HIC = 4.000 to HIC = 2.000, improves the degree of performance
E only from E(HIC=4000) ≈ 1 to E(HIC=2000) = 0,94 (see Fig. 8). In contrast to that an improvement from HIC = 2.000 to HIC = 1.000 leads to a significant improvement to E(HIC=1000) = 0,24; this means a probability for the
occurrence of severe head injuries of 24%.
In the second step of the calculation of the VERPS-index the degrees of performance Eij are weighted with their
relevance in accident events. The importance of a test point obviously depends on the probability of hitting it in real
life. In order to deduce the relevance factors, “in-depth” accident data of the Medical University of Hanover are
used. The relevance factor in the longitudinal direction of the vehicle (Ri,WAD) describes the correlation between the
vehicle specific kinematics factor fK and the size of the pedestrian. In the transverse direction of the vehicle front an
equal distribution for impact locations is assumed. This is supported by accident data.
We calculate the VERPS-index separately for children younger than 12 years and for adults and children older than
12 years. However, other separations are possible. Our choice considers the different requirements of pedestrian
safety measures applied to cars for children and adults which result from different body heights. By use of the
assessment function B (Mij) the VERPS-index can be expressed as follows:
∑ ∑== =
+−
−⋅
m
i j
HIC
WADi
ij
eRVERPS1
9
1
5,4
1990
500
,1
91
(4).
Fig. 8 shows the division of the vehicle front in subareas and their relevance factors Ri,WAD for a sample car.
Fig. 8. Relevance factors in longitudinal direction (Ri, WAD) for car F.
Paper submitted at the Conference „Advanced Microsystems for automotive Applications“, April 2006, Berlin, accepted for conference proceedings and poster presentation. The VERPS-index can run between (nearly) zero (no risk for AIS 3+ head injuries) and 1 (maximum risk for AIS 3+
head injuries). A car, which has a HIC-value of 1.000 in all subareas of its front, would have a VERPS-index of
VERPS = 0.24. It can be shown that the proposed procedure allows to assess vehicle fronts on a linear scale within
the limits of accuracy of the assumptions.
Application of the VERPS-index on two vehicles passive safety measures
The VERPS-index is calculated for two sample cars. It can clearly be seen, that pedestrian safety has to be assessed
separately for children and adults. Pedestrians hit different areas at the vehicle front because of their different body
heights. This is the reason why a particular technical measure can positively affect all groups of pedestrians only in
exceptional cases.
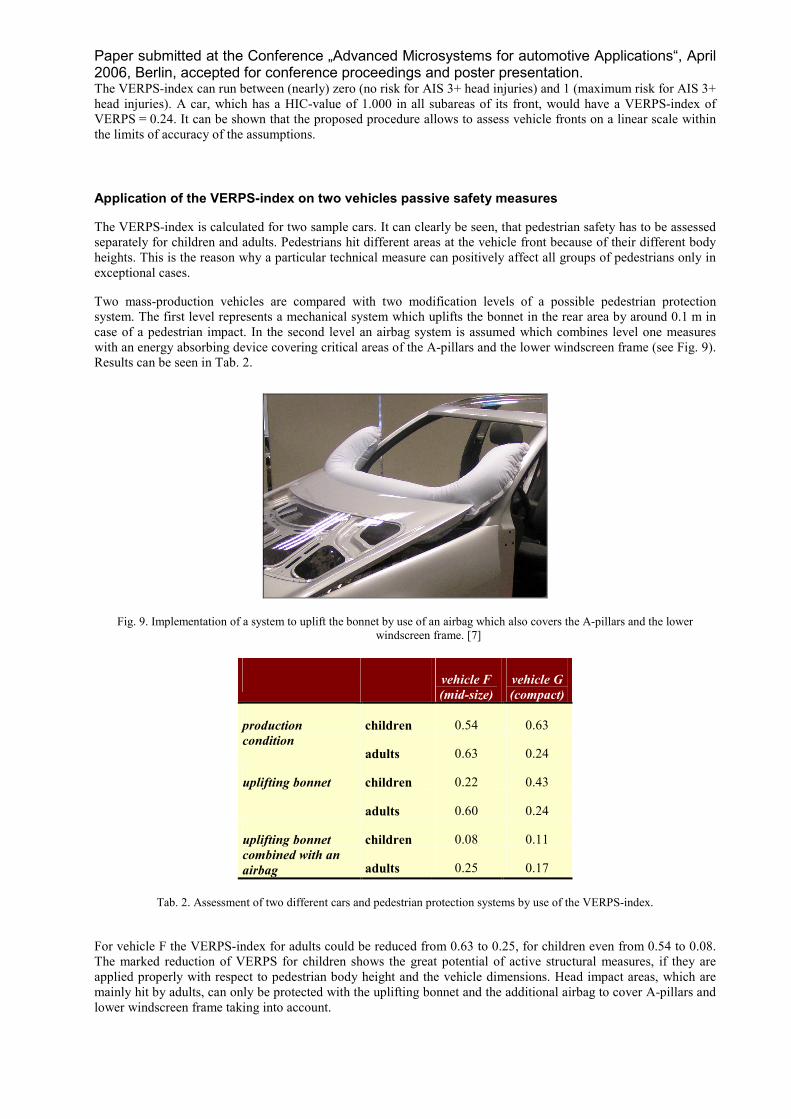
Two mass-production vehicles are compared with two modification levels of a possible pedestrian protection
system. The first level represents a mechanical system which uplifts the bonnet in the rear area by around 0.1 m in
case of a pedestrian impact. In the second level an airbag system is assumed which combines level one measures
with an energy absorbing device covering critical areas of the A-pillars and the lower windscreen frame (see Fig. 9).
Results can be seen in Tab. 2.
Fig. 9. Implementation of a system to uplift the bonnet by use of an airbag which also covers the A-pillars and the lower
windscreen frame. [7]
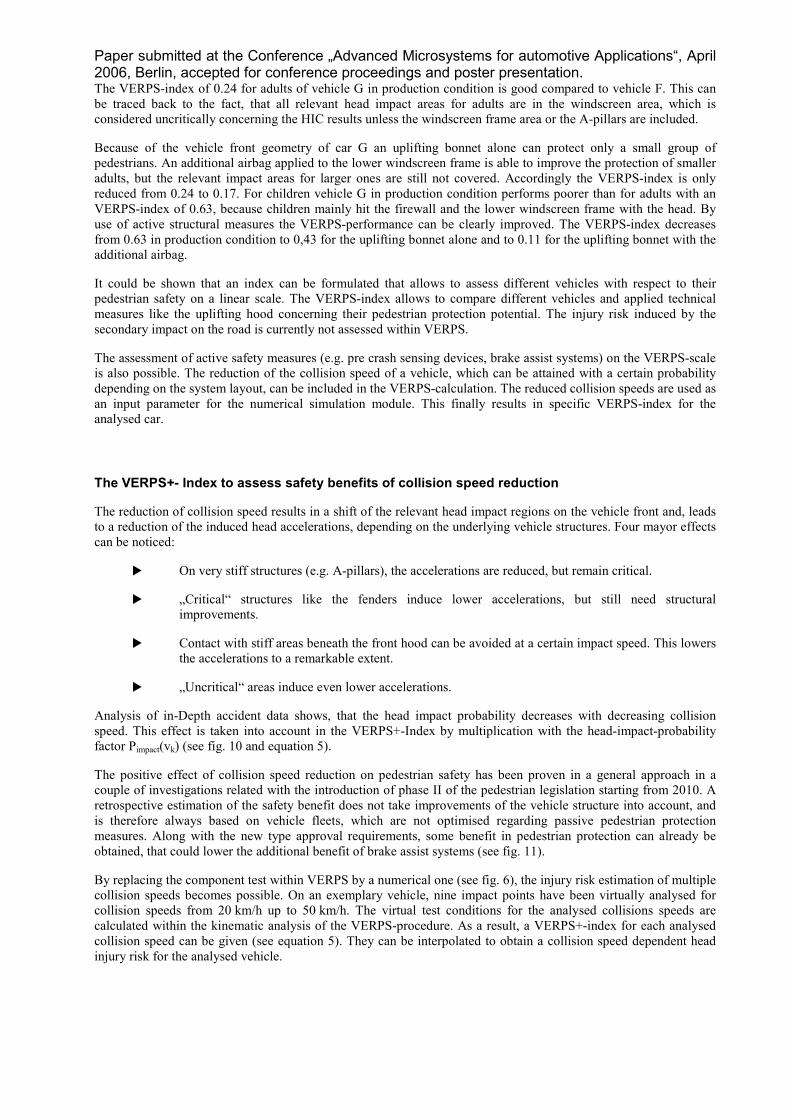
vehicle F
(mid-size)
vehicle G
(compact)
children 0.54 0.63 production
condition adults 0.63 0.24
children 0.22 0.43 uplifting bonnet
adults 0.60 0.24
children 0.08 0.11 uplifting bonnet
combined with an
airbag adults 0.25 0.17
Tab. 2. Assessment of two different cars and pedestrian protection systems by use of the VERPS-index.
For vehicle F the VERPS-index for adults could be reduced from 0.63 to 0.25, for children even from 0.54 to 0.08.
The marked reduction of VERPS for children shows the great potential of active structural measures, if they are
applied properly with respect to pedestrian body height and the vehicle dimensions. Head impact areas, which are
mainly hit by adults, can only be protected with the uplifting bonnet and the additional airbag to cover A-pillars and
lower windscreen frame taking into account.
Paper submitted at the Conference „Advanced Microsystems for automotive Applications“, April 2006, Berlin, accepted for conference proceedings and poster presentation. The VERPS-index of 0.24 for adults of vehicle G in production condition is good compared to vehicle F. This can
be traced back to the fact, that all relevant head impact areas for adults are in the windscreen area, which is
considered uncritically concerning the HIC results unless the windscreen frame area or the A-pillars are included.
Because of the vehicle front geometry of car G an uplifting bonnet alone can protect only a small group of
pedestrians. An additional airbag applied to the lower windscreen frame is able to improve the protection of smaller
adults, but the relevant impact areas for larger ones are still not covered. Accordingly the VERPS-index is only
reduced from 0.24 to 0.17. For children vehicle G in production condition performs poorer than for adults with an
VERPS-index of 0.63, because children mainly hit the firewall and the lower windscreen frame with the head. By
use of active structural measures the VERPS-performance can be clearly improved. The VERPS-index decreases
from 0.63 in production condition to 0,43 for the uplifting bonnet alone and to 0.11 for the uplifting bonnet with the
additional airbag.
It could be shown that an index can be formulated that allows to assess different vehicles with respect to their
pedestrian safety on a linear scale. The VERPS-index allows to compare different vehicles and applied technical
measures like the uplifting hood concerning their pedestrian protection potential. The injury risk induced by the
secondary impact on the road is currently not assessed within VERPS.
The assessment of active safety measures (e.g. pre crash sensing devices, brake assist systems) on the VERPS-scale
is also possible. The reduction of the collision speed of a vehicle, which can be attained with a certain probability
depending on the system layout, can be included in the VERPS-calculation. The reduced collision speeds are used as
an input parameter for the numerical simulation module. This finally results in specific VERPS-index for the
analysed car.
The VERPS+- Index to assess safety benefits of collision speed reduction
The reduction of collision speed results in a shift of the relevant head impact regions on the vehicle front and, leads
to a reduction of the induced head accelerations, depending on the underlying vehicle structures. Four mayor effects
can be noticed:
� On very stiff structures (e.g. A-pillars), the accelerations are reduced, but remain critical.
� „Critical“ structures like the fenders induce lower accelerations, but still need structural
improvements.
� Contact with stiff areas beneath the front hood can be avoided at a certain impact speed. This lowers
the accelerations to a remarkable extent.
� „Uncritical“ areas induce even lower accelerations.
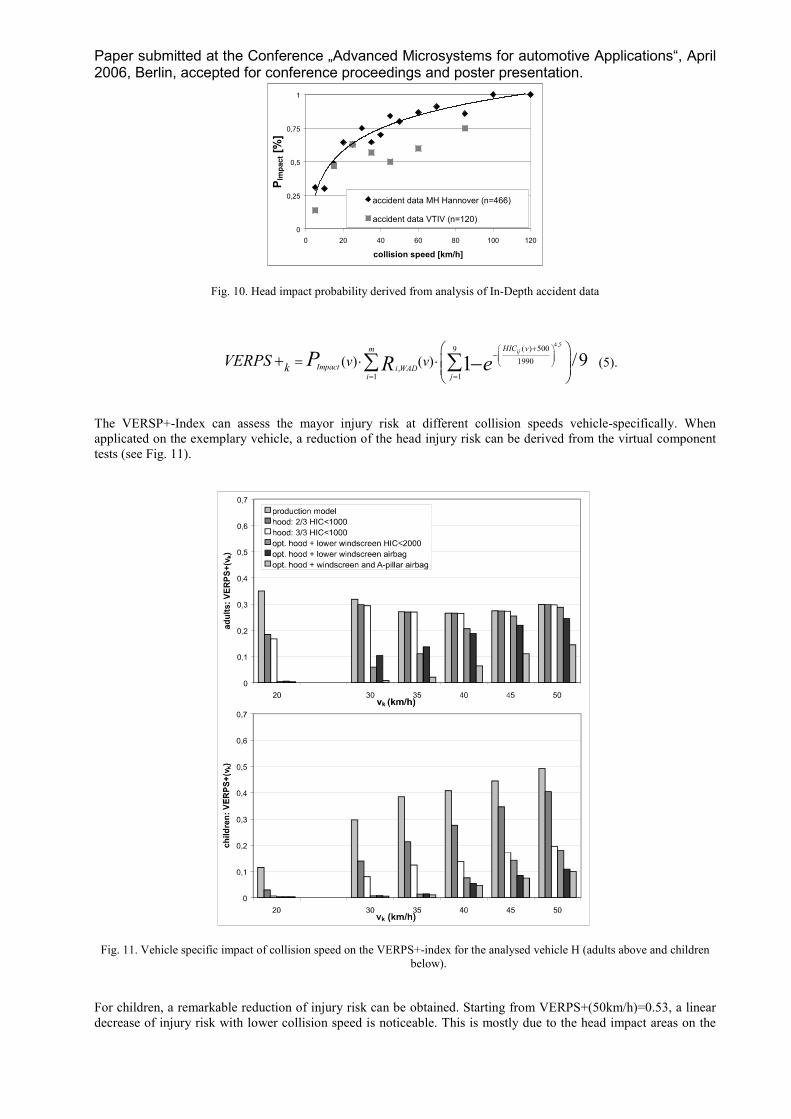
Analysis of in-Depth accident data shows, that the head impact probability decreases with decreasing collision
speed. This effect is taken into account in the VERPS+-Index by multiplication with the head-impact-probability
factor Pimpact(vk) (see fig. 10 and equation 5).
The positive effect of collision speed reduction on pedestrian safety has been proven in a general approach in a
couple of investigations related with the introduction of phase II of the pedestrian legislation starting from 2010. A
retrospective estimation of the safety benefit does not take improvements of the vehicle structure into account, and
is therefore always based on vehicle fleets, which are not optimised regarding passive pedestrian protection
measures. Along with the new type approval requirements, some benefit in pedestrian protection can already be
obtained, that could lower the additional benefit of brake assist systems (see fig. 11).
By replacing the component test within VERPS by a numerical one (see fig. 6), the injury risk estimation of multiple
collision speeds becomes possible. On an exemplary vehicle, nine impact points have been virtually analysed for
collision speeds from 20 km/h up to 50 km/h. The virtual test conditions for the analysed collisions speeds are
calculated within the kinematic analysis of the VERPS-procedure. As a result, a VERPS+-index for each analysed
collision speed can be given (see equation 5). They can be interpolated to obtain a collision speed dependent head
injury risk for the analysed vehicle.
Paper submitted at the Conference „Advanced Microsystems for automotive Applications“, April 2006, Berlin, accepted for conference proceedings and poster presentation.
0
0,25
0,5
0,75
1
0 20 40 60 80 100 120
collision speed [km/h]
PIm
pact [%
]
accident data MH Hannover (n=466)
accident data VTIV (n=120)
Fig. 10. Head impact probability derived from analysis of In-Depth accident data
4,5( ) 5009
1990,
1 1
( ) ( ) /91+
−
= =
= ⋅ ⋅
+ ∑ ∑ −
ijHIC vm
Impact i WADi j
kv vVERPS P eR
(5).
The VERSP+-Index can assess the mayor injury risk at different collision speeds vehicle-specifically. When
applicated on the exemplary vehicle, a reduction of the head injury risk can be derived from the virtual component
tests (see Fig. 11).
Fig. 11. Vehicle specific impact of collision speed on the VERPS+-index for the analysed vehicle H (adults above and children
below).
For children, a remarkable reduction of injury risk can be obtained. Starting from VERPS+(50km/h)=0.53, a linear
decrease of injury risk with lower collision speed is noticeable. This is mostly due to the head impact areas on the
Paper submitted at the Conference „Advanced Microsystems for automotive Applications“, April 2006, Berlin, accepted for conference proceedings and poster presentation. vehicles front hood. In this area, the head accelerations can be lowered to acceptable values by reduction of
collisions speeds. In contrast to the injury risk for children, the injury risk for adults does not show a reduction over
all collision speeds. At lower speeds, many adults have a head impact on the lower windscreen frame, which is a
very stiff area. Therefore, reduction of collision speed alone is not sufficient to protect adult pedestrian in real life.
But a reduction of collision speed in combination with basic structural measures shows a very good performance.
Additionally, one has to keep in mind, that the derived reductions of head injury risk is strongly vehicle specific.
Other vehicle front geometries with different stiffness patterns will lead to different impact kinematics and head
injury risks.
3 Collision speed reduction of different brake assist strategies
The introduction of driver assistance systems has changed the understanding of an accident. In parallel to the
upcoming of integrated safety approaches, the view of an accident has been widened onto the phase directly before
an imminent crash. Up to now, only passive safety systems are assessed in type approval test and consumer tests.
Nevertheless, active safety features like ESP offer a proven benefit for road safety [8]. For brake assist functions, a
similar benefit is expected. A specific safety benefit of driver assistance systems could only be proven in retrospect
accident analysis [9]. With VERPS+, the safety benefit of a reduced collision speed can be quantified prospectively
and specifically for every analysed vehicle. Additionally, a comparison with passive safety measures regarding their
safety benefit in real life accidents is possible.
Based on the drivers options to avoid a pedestrian accident, the precrash-phase can be divided into three phases
(v~40km/h):
0. a collision warning is possible and reasonable (>16m, depending on the drivers reaction time
treaction>1s)
1. collision can be avoided by braking only (~7m)
2. collision can be avoided by steering only (~6m)
3. collision can be avoided by combined steering and braking only (~5m)
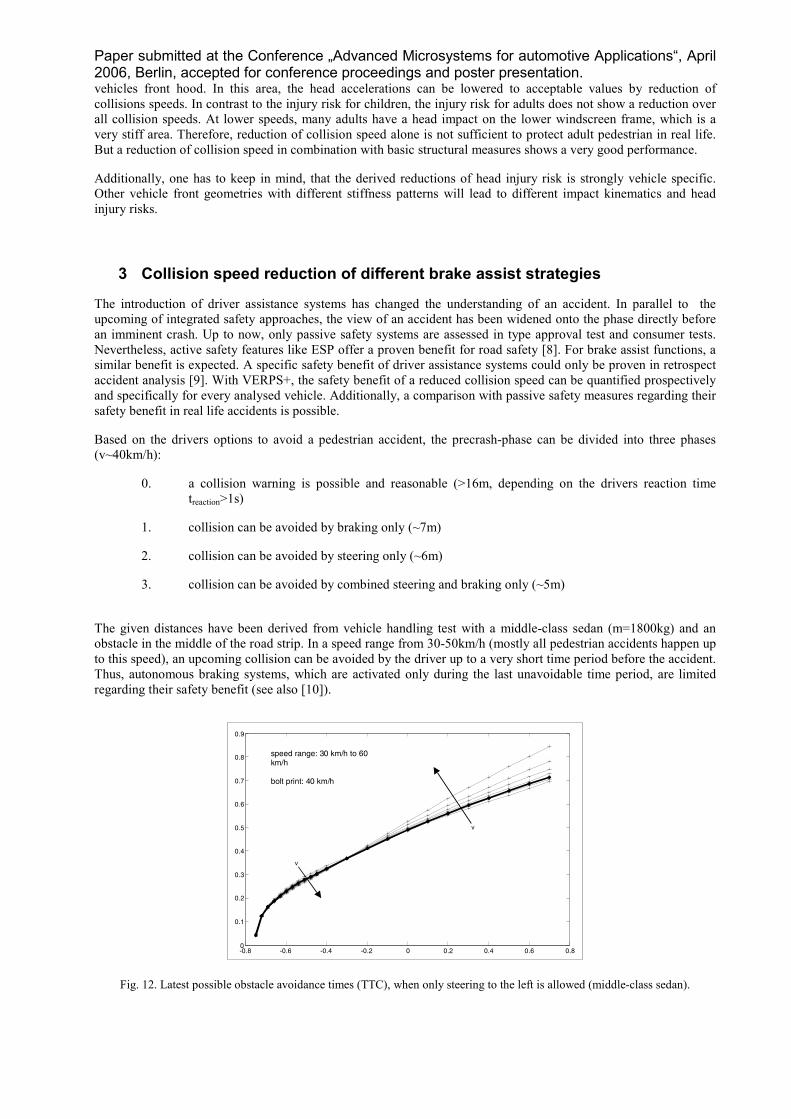
The given distances have been derived from vehicle handling test with a middle-class sedan (m=1800kg) and an
obstacle in the middle of the road strip. In a speed range from 30-50km/h (mostly all pedestrian accidents happen up
to this speed), an upcoming collision can be avoided by the driver up to a very short time period before the accident.
Thus, autonomous braking systems, which are activated only during the last unavoidable time period, are limited
regarding their safety benefit (see also [10]).
-0.8 -0.6 -0.4 -0.2 0 0.2 0.4 0.6 0.80
0.1
0.2
0.3
0.4
0.5
0.6
0.7
0.8
0.9
v
v
speed range: 30 km/h to 60km/h
bolt print: 40 km/h
Fig. 12. Latest possible obstacle avoidance times (TTC), when only steering to the left is allowed (middle-class sedan).
Paper submitted at the Conference „Advanced Microsystems for automotive Applications“, April 2006, Berlin, accepted for conference proceedings and poster presentation. In 64% of all analysed pedestrian accidents (data source MH Hannover), the driver performed a braking before the
accident. The lifting of the throttle pedal during the drivers reaction can be used by future brake assistant systems
(BAS) to initiate an optimised braking. Analysis of conventional BAS in driving simulations showed, that in
pedestrian accidents only 50% of braking drivers could activate the brake assist system [11].
Based on the fact, that future driver assistance systems should only support the driver in performing the driving task
and therefore, the driver has always to be in control of the vehicle, different brake assist strategies are defined, that
fulfil these requirements. They are assessed by their potential reduction of collision speed. This is done by an
automated case-by-case-analysis of each accident.
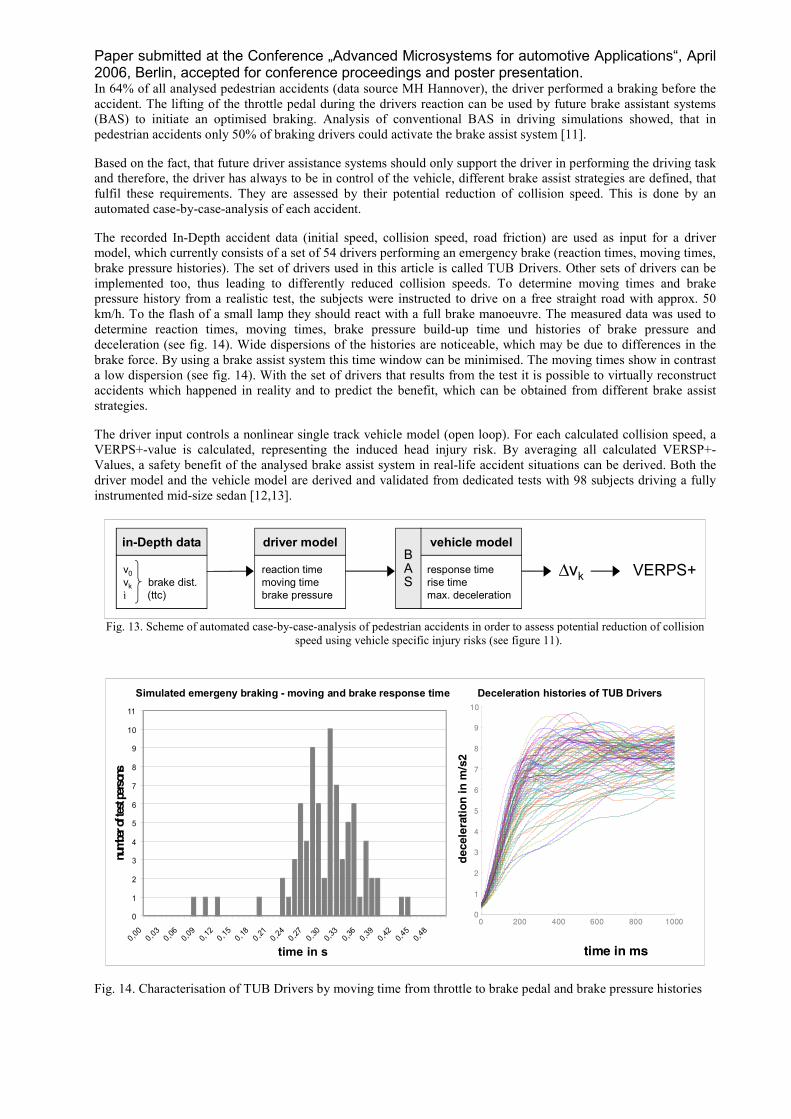
The recorded In-Depth accident data (initial speed, collision speed, road friction) are used as input for a driver
model, which currently consists of a set of 54 drivers performing an emergency brake (reaction times, moving times,
brake pressure histories). The set of drivers used in this article is called TUB Drivers. Other sets of drivers can be
implemented too, thus leading to differently reduced collision speeds. To determine moving times and brake
pressure history from a realistic test, the subjects were instructed to drive on a free straight road with approx. 50
km/h. To the flash of a small lamp they should react with a full brake manoeuvre. The measured data was used to
determine reaction times, moving times, brake pressure build-up time und histories of brake pressure and
deceleration (see fig. 14). Wide dispersions of the histories are noticeable, which may be due to differences in the
brake force. By using a brake assist system this time window can be minimised. The moving times show in contrast
a low dispersion (see fig. 14). With the set of drivers that results from the test it is possible to virtually reconstruct
accidents which happened in reality and to predict the benefit, which can be obtained from different brake assist
strategies.
The driver input controls a nonlinear single track vehicle model (open loop). For each calculated collision speed, a
VERPS+-value is calculated, representing the induced head injury risk. By averaging all calculated VERSP+-
Values, a safety benefit of the analysed brake assist system in real-life accident situations can be derived. Both the
driver model and the vehicle model are derived and validated from dedicated tests with 98 subjects driving a fully
instrumented mid-size sedan [12,13].
v0vk brake dist.
ì (ttc)
reaction time
moving time
brake pressure
response time
rise time
max. deceleration
in-Depth data driver model vehicle modelBAS
∆vk VERPS+
Fig. 13. Scheme of automated case-by-case-analysis of pedestrian accidents in order to assess potential reduction of collision
speed using vehicle specific injury risks (see figure 11).
Simulated emergeny braking - moving and brake response time
0
1
2
3
4
5
6
7
8
9
10
11
0,00
0,03
0,06
0,09
0,12
0,15
0,18
0,21
0,24
0,27
0,30
0,33
0,36
0,39
0,42
0,45
0,48
time in s
numberoftestpersons
0 200 400 600 800 10000
1
2
3
4
5
6
7
8
9
10
time in ms
decelerationin
m/s2
Deceleration histories of TUB Drivers
Fig. 14. Characterisation of TUB Drivers by moving time from throttle to brake pedal and brake pressure histories
Paper submitted at the Conference „Advanced Microsystems for automotive Applications“, April 2006, Berlin, accepted for conference proceedings and poster presentation.
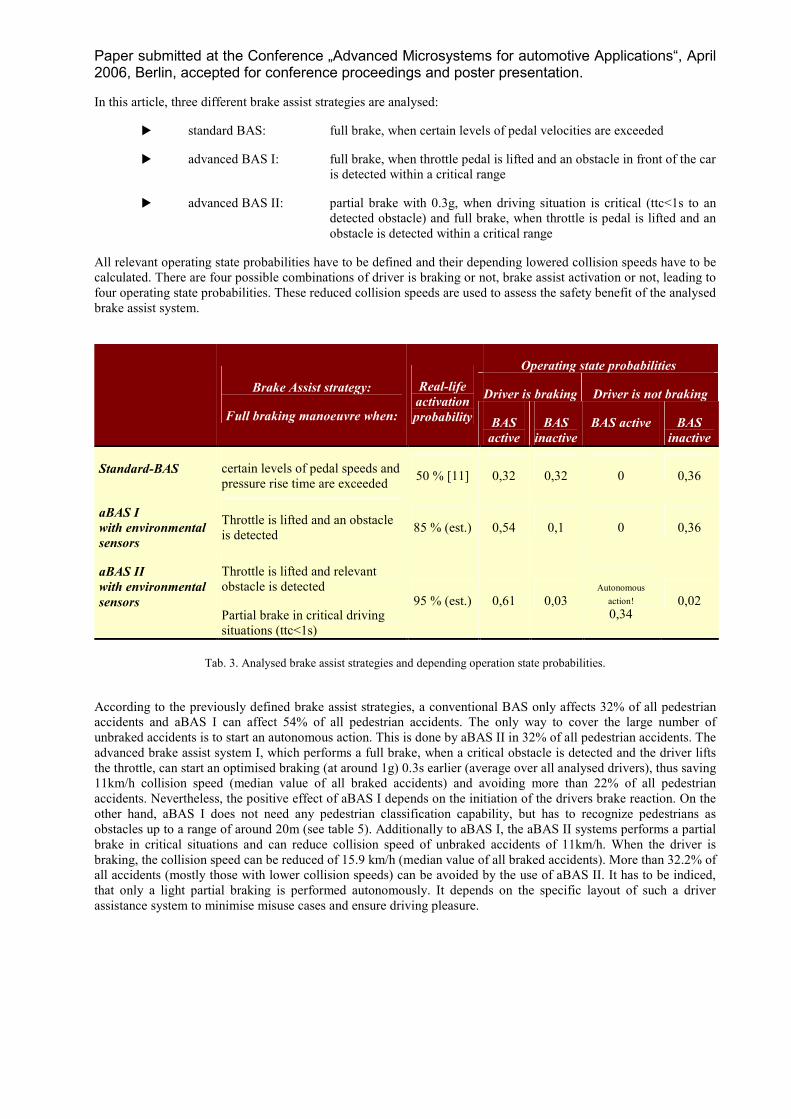
In this article, three different brake assist strategies are analysed:
� standard BAS: full brake, when certain levels of pedal velocities are exceeded
� advanced BAS I: full brake, when throttle pedal is lifted and an obstacle in front of the car
is detected within a critical range
� advanced BAS II: partial brake with 0.3g, when driving situation is critical (ttc<1s to an
detected obstacle) and full brake, when throttle is pedal is lifted and an
obstacle is detected within a critical range
All relevant operating state probabilities have to be defined and their depending lowered collision speeds have to be
calculated. There are four possible combinations of driver is braking or not, brake assist activation or not, leading to
four operating state probabilities. These reduced collision speeds are used to assess the safety benefit of the analysed
brake assist system.
Operating state probabilities
Driver is braking Driver is not braking
Brake Assist strategy:
Full braking manoeuvre when:
Real-life
activation
probability BAS
active
BAS
inactive
BAS active BAS
inactive
Standard-BAS certain levels of pedal speeds and
pressure rise time are exceeded 50 % [11] 0,32 0,32 0 0,36
aBAS I
with environmental
sensors
Throttle is lifted and an obstacle
is detected 85 % (est.) 0,54 0,1 0 0,36
aBAS II
with environmental
sensors
Throttle is lifted and relevant
obstacle is detected
Partial brake in critical driving
situations (ttc<1s)
95 % (est.) 0,61 0,03 Autonomous
action! 0,34
0,02
Tab. 3. Analysed brake assist strategies and depending operation state probabilities.
According to the previously defined brake assist strategies, a conventional BAS only affects 32% of all pedestrian
accidents and aBAS I can affect 54% of all pedestrian accidents. The only way to cover the large number of
unbraked accidents is to start an autonomous action. This is done by aBAS II in 32% of all pedestrian accidents. The
advanced brake assist system I, which performs a full brake, when a critical obstacle is detected and the driver lifts
the throttle, can start an optimised braking (at around 1g) 0.3s earlier (average over all analysed drivers), thus saving
11km/h collision speed (median value of all braked accidents) and avoiding more than 22% of all pedestrian
accidents. Nevertheless, the positive effect of aBAS I depends on the initiation of the drivers brake reaction. On the
other hand, aBAS I does not need any pedestrian classification capability, but has to recognize pedestrians as
obstacles up to a range of around 20m (see table 5). Additionally to aBAS I, the aBAS II systems performs a partial
brake in critical situations and can reduce collision speed of unbraked accidents of 11km/h. When the driver is
braking, the collision speed can be reduced of 15.9 km/h (median value of all braked accidents). More than 32.2% of
all accidents (mostly those with lower collision speeds) can be avoided by the use of aBAS II. It has to be indiced,
that only a light partial braking is performed autonomously. It depends on the specific layout of such a driver
assistance system to minimise misuse cases and ensure driving pleasure.
Paper submitted at the Conference „Advanced Microsystems for automotive Applications“, April 2006, Berlin, accepted for conference proceedings and poster presentation.
10 20 30 40 50 60 70 >750
10
20
30
40
50
60
deltav k[km/h]
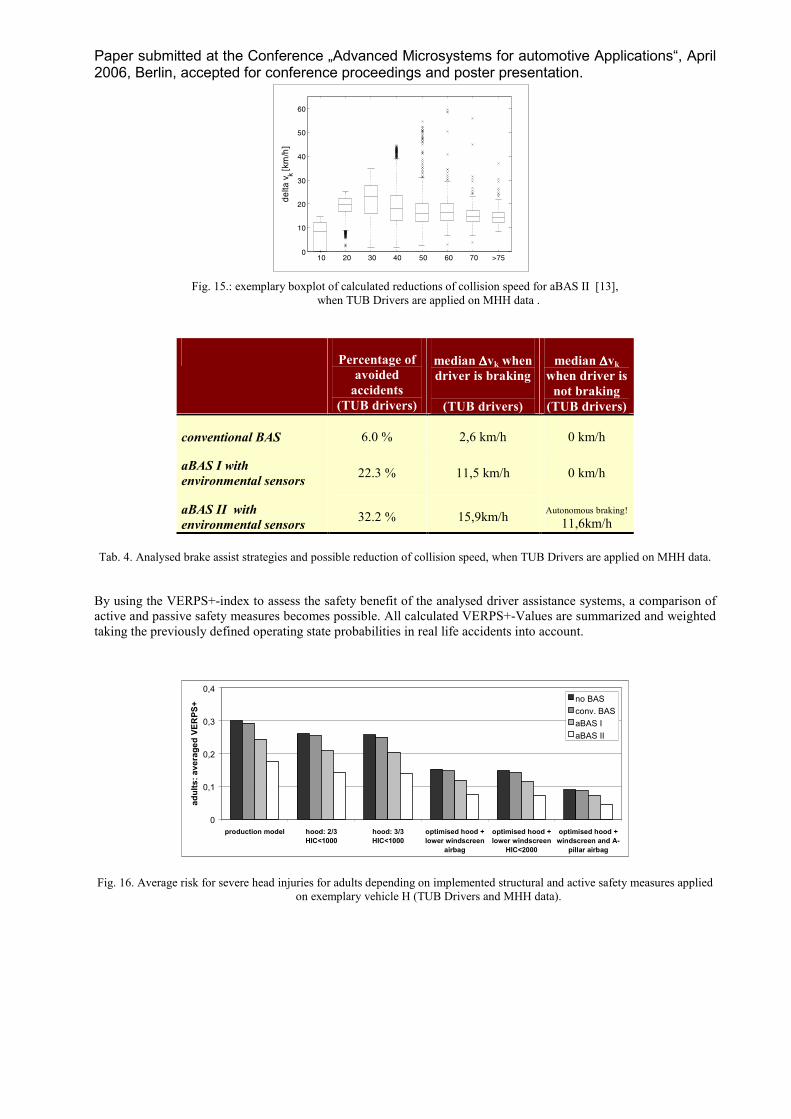
Fig. 15.: exemplary boxplot of calculated reductions of collision speed for aBAS II [13],
when TUB Drivers are applied on MHH data .
Percentage of
avoided
accidents
(TUB drivers)
median ∆∆∆∆vk when driver is braking
(TUB drivers)
median ∆∆∆∆vk when driver is
not braking
(TUB drivers)
conventional BAS 6.0 % 2,6 km/h 0 km/h
aBAS I with
environmental sensors 22.3 % 11,5 km/h 0 km/h
aBAS II with
environmental sensors 32.2 % 15,9km/h
Autonomous braking! 11,6km/h
Tab. 4. Analysed brake assist strategies and possible reduction of collision speed, when TUB Drivers are applied on MHH data.
By using the VERPS+-index to assess the safety benefit of the analysed driver assistance systems, a comparison of
active and passive safety measures becomes possible. All calculated VERPS+-Values are summarized and weighted
taking the previously defined operating state probabilities in real life accidents into account.
0
0,1
0,2
0,3
0,4
production model hood: 2/3
HIC<1000
hood: 3/3
HIC<1000
optimised hood +
lower windscreen
airbag
optimised hood +
lower windscreen
HIC<2000
optimised hood +
windscreen and A-
pillar airbag
adults: avera
ged V
ER
PS
+
no BAS
conv. BAS
aBAS I
aBAS II
Fig. 16. Average risk for severe head injuries for adults depending on implemented structural and active safety measures applied
on exemplary vehicle H (TUB Drivers and MHH data).
Paper submitted at the Conference „Advanced Microsystems for automotive Applications“, April 2006, Berlin, accepted for conference proceedings and poster presentation.
0
0,1
0,2
0,3
0,4
production
model
hood: 2/3
HIC<1000
hood: 3/3
HIC<1000
opt. hood + lower
windscreen
airbag
opt. hood + lower
windscreen
HIC<2000
opt. hood +
windscreen and
A-pillar airbag
childre
n: avera
ged V
ER
PS
+ no BAS
conv. BAS
aBAS I
aBAS II
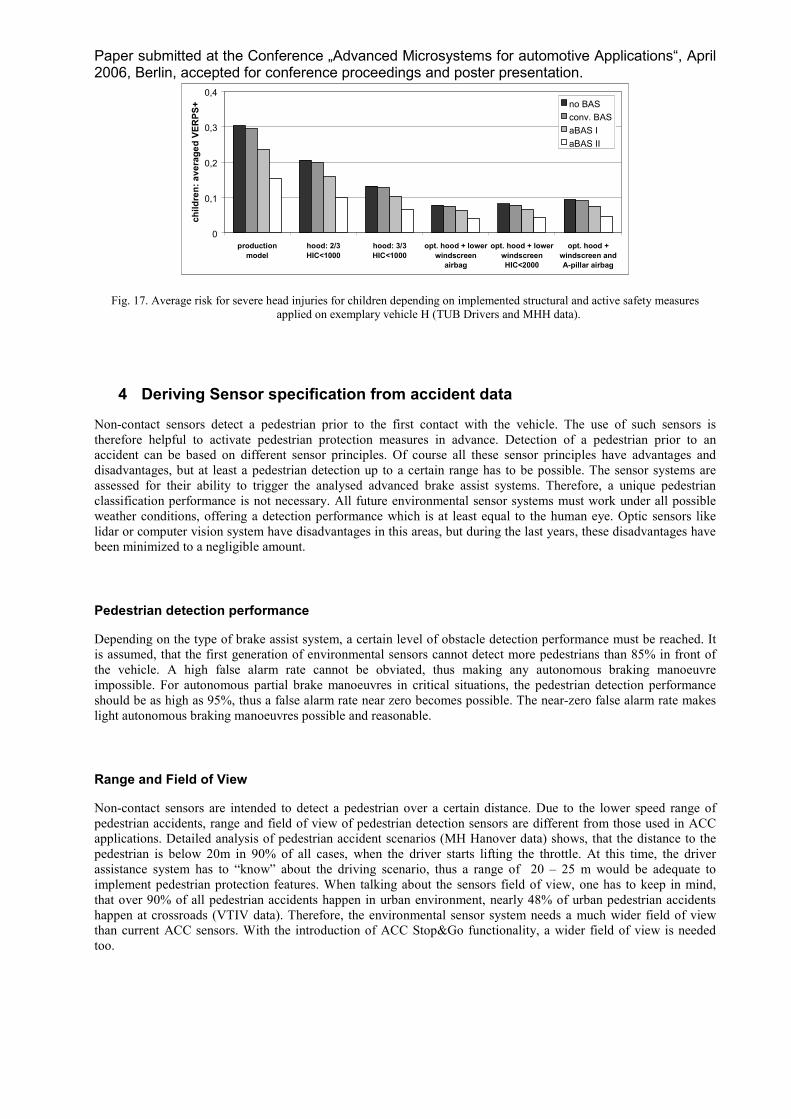
Fig. 17. Average risk for severe head injuries for children depending on implemented structural and active safety measures
applied on exemplary vehicle H (TUB Drivers and MHH data).
4 Deriving Sensor specification from accident data
Non-contact sensors detect a pedestrian prior to the first contact with the vehicle. The use of such sensors is
therefore helpful to activate pedestrian protection measures in advance. Detection of a pedestrian prior to an
accident can be based on different sensor principles. Of course all these sensor principles have advantages and
disadvantages, but at least a pedestrian detection up to a certain range has to be possible. The sensor systems are
assessed for their ability to trigger the analysed advanced brake assist systems. Therefore, a unique pedestrian
classification performance is not necessary. All future environmental sensor systems must work under all possible
weather conditions, offering a detection performance which is at least equal to the human eye. Optic sensors like
lidar or computer vision system have disadvantages in this areas, but during the last years, these disadvantages have
been minimized to a negligible amount.
Pedestrian detection performance
Depending on the type of brake assist system, a certain level of obstacle detection performance must be reached. It
is assumed, that the first generation of environmental sensors cannot detect more pedestrians than 85% in front of
the vehicle. A high false alarm rate cannot be obviated, thus making any autonomous braking manoeuvre
impossible. For autonomous partial brake manoeuvres in critical situations, the pedestrian detection performance
should be as high as 95%, thus a false alarm rate near zero becomes possible. The near-zero false alarm rate makes
light autonomous braking manoeuvres possible and reasonable.
Range and Field of View
Non-contact sensors are intended to detect a pedestrian over a certain distance. Due to the lower speed range of
pedestrian accidents, range and field of view of pedestrian detection sensors are different from those used in ACC
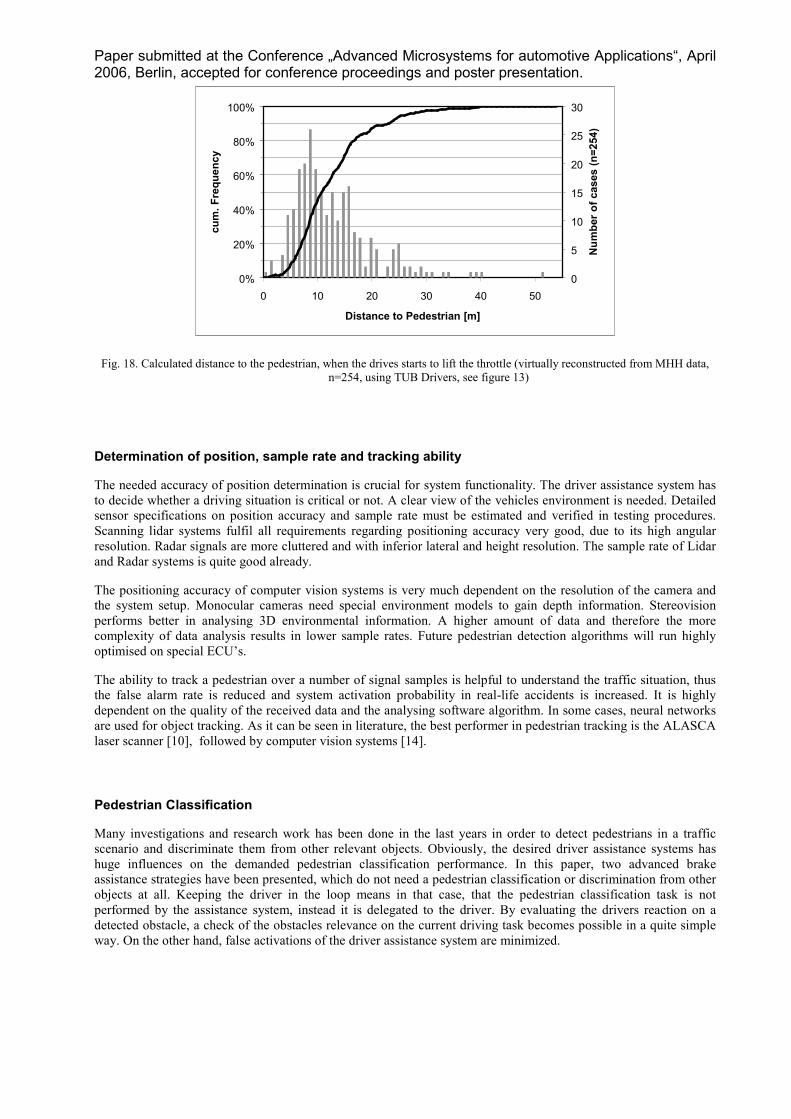
applications. Detailed analysis of pedestrian accident scenarios (MH Hanover data) shows, that the distance to the
pedestrian is below 20m in 90% of all cases, when the driver starts lifting the throttle. At this time, the driver
assistance system has to “know” about the driving scenario, thus a range of 20 – 25 m would be adequate to
implement pedestrian protection features. When talking about the sensors field of view, one has to keep in mind,
that over 90% of all pedestrian accidents happen in urban environment, nearly 48% of urban pedestrian accidents
happen at crossroads (VTIV data). Therefore, the environmental sensor system needs a much wider field of view
than current ACC sensors. With the introduction of ACC Stop&Go functionality, a wider field of view is needed
too.
Paper submitted at the Conference „Advanced Microsystems for automotive Applications“, April 2006, Berlin, accepted for conference proceedings and poster presentation.
0%
20%
40%
60%
80%
100%
0 10 20 30 40 50
Distance to Pedestrian [m]
cum
. Fre
quency
0
5
10
15
20
25
30
Num
ber
of cases (n=254)
Fig. 18. Calculated distance to the pedestrian, when the drives starts to lift the throttle (virtually reconstructed from MHH data,
n=254, using TUB Drivers, see figure 13)
Determination of position, sample rate and tracking ability
The needed accuracy of position determination is crucial for system functionality. The driver assistance system has
to decide whether a driving situation is critical or not. A clear view of the vehicles environment is needed. Detailed
sensor specifications on position accuracy and sample rate must be estimated and verified in testing procedures.
Scanning lidar systems fulfil all requirements regarding positioning accuracy very good, due to its high angular
resolution. Radar signals are more cluttered and with inferior lateral and height resolution. The sample rate of Lidar
and Radar systems is quite good already.
The positioning accuracy of computer vision systems is very much dependent on the resolution of the camera and
the system setup. Monocular cameras need special environment models to gain depth information. Stereovision
performs better in analysing 3D environmental information. A higher amount of data and therefore the more
complexity of data analysis results in lower sample rates. Future pedestrian detection algorithms will run highly
optimised on special ECU’s.
The ability to track a pedestrian over a number of signal samples is helpful to understand the traffic situation, thus
the false alarm rate is reduced and system activation probability in real-life accidents is increased. It is highly
dependent on the quality of the received data and the analysing software algorithm. In some cases, neural networks
are used for object tracking. As it can be seen in literature, the best performer in pedestrian tracking is the ALASCA
laser scanner [10], followed by computer vision systems [14].
Pedestrian Classification
Many investigations and research work has been done in the last years in order to detect pedestrians in a traffic
scenario and discriminate them from other relevant objects. Obviously, the desired driver assistance systems has
huge influences on the demanded pedestrian classification performance. In this paper, two advanced brake
assistance strategies have been presented, which do not need a pedestrian classification or discrimination from other
objects at all. Keeping the driver in the loop means in that case, that the pedestrian classification task is not
performed by the assistance system, instead it is delegated to the driver. By evaluating the drivers reaction on a
detected obstacle, a check of the obstacles relevance on the current driving task becomes possible in a quite simple
way. On the other hand, false activations of the driver assistance system are minimized.
Paper submitted at the Conference „Advanced Microsystems for automotive Applications“, April 2006, Berlin, accepted for conference proceedings and poster presentation.
Computer vision Measurement
category
Brake
assist
system
required
values
(Expert's
opinion) Far
Infrared
Visible
and NIR
Radar scanning
Lidar
Range aBAS I and
aBAS II 20 m (90 %) + + ++ ++
Object
tracking
aBAS I and
aBAS II helpful + + o ++
Determination
of position
aBAS I and
aBAS II ± 0,1 m ++ ++ + ++
Sample rate aBAS I and
aBAS II min. 10 Hz + + ++ ++
aBAS I 85% + + o + Object
detection aBAS II 95% o o o o
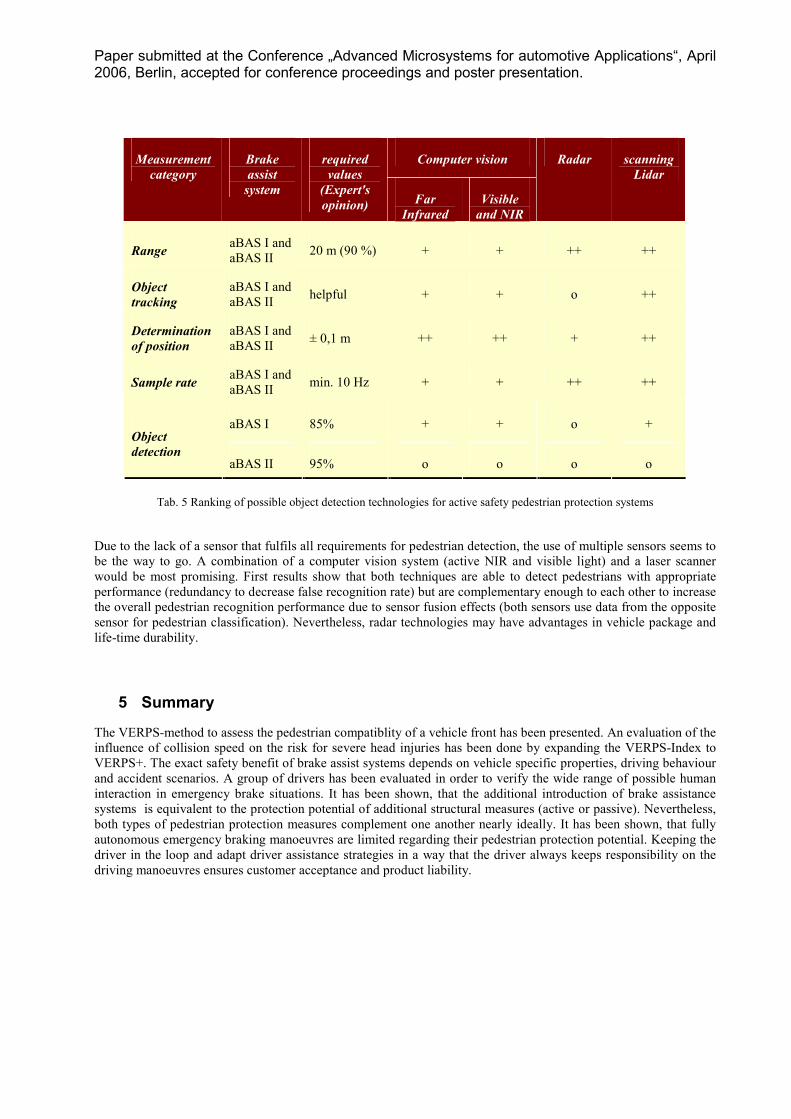
Tab. 5 Ranking of possible object detection technologies for active safety pedestrian protection systems
Due to the lack of a sensor that fulfils all requirements for pedestrian detection, the use of multiple sensors seems to
be the way to go. A combination of a computer vision system (active NIR and visible light) and a laser scanner
would be most promising. First results show that both techniques are able to detect pedestrians with appropriate
performance (redundancy to decrease false recognition rate) but are complementary enough to each other to increase
the overall pedestrian recognition performance due to sensor fusion effects (both sensors use data from the opposite
sensor for pedestrian classification). Nevertheless, radar technologies may have advantages in vehicle package and
life-time durability.
5 Summary
The VERPS-method to assess the pedestrian compatiblity of a vehicle front has been presented. An evaluation of the
influence of collision speed on the risk for severe head injuries has been done by expanding the VERPS-Index to
VERPS+. The exact safety benefit of brake assist systems depends on vehicle specific properties, driving behaviour
and accident scenarios. A group of drivers has been evaluated in order to verify the wide range of possible human
interaction in emergency brake situations. It has been shown, that the additional introduction of brake assistance
systems is equivalent to the protection potential of additional structural measures (active or passive). Nevertheless,
both types of pedestrian protection measures complement one another nearly ideally. It has been shown, that fully
autonomous emergency braking manoeuvres are limited regarding their pedestrian protection potential. Keeping the
driver in the loop and adapt driver assistance strategies in a way that the driver always keeps responsibility on the
driving manoeuvres ensures customer acceptance and product liability.
Paper submitted at the Conference „Advanced Microsystems for automotive Applications“, April 2006, Berlin, accepted for conference proceedings and poster presentation.
References
[1] EU-Directive 2003/102/EC on Protection of pedestrians and other vulnerable road users before and in the
event of a collision with a motor vehicle
[2] B&D (2004): Zukunftsmarkt „Aktive Sicherheitssysteme“. B&D-FORECAST-Studie, www.bd-forecast.de,
access: 5.05.2004.B&D, 2004
[3] Otte, D., Krettek, C., Brunner, H., Zwipp, H. (2003): Scintific Approach and Methodology of a new In–
Depth-Investigation Study in German so called Gidas. 18th Esv-Conference, Proceedings, 2003.
[4] Otte, D., Pohlemann, (2001): Analysis and Load Assessment of Secondary Impact to Adult Pedestrians
After Car Collisions on Roads. Ircobi-Conference, Proceedings, 2001.
[5] Ashton, S. J., Mackay, G. M.: Car Design for Pedestrian Injury Minimisation, 7th ESV Conference, 1979
[6] ISO 13232: Test Analysis Procedures for Research Evaluation of Rider Crash Protective Devices Fitted to
Motorcycles - Injury Indicies and Risk/Benefit Analysis. Part 5 Rev. 1, ISO/TC22 Road vehicles,
Subcommittee SC22, Motorcycles.
[7] Kalliske, I., Kühn, M., Otte, D., Heinrich, T., Schindler, V. (2003): „Fahrzeugseitige Ma߬nahmen zum
Schutz des Kopfes eines Fu߬gängers – eine ganzheitliche Betrachtung“; „Innovativer Insassen- und
Partnerschutz - Fahrzeugsicherheit 2010“, Berlin, 20. – 21.11. 2003, ISBN 3-18-091794-6
[8] Kreiss, J.-P., Schüler, L., Langwieder, K., The Effectiveness of Primary Safety Features in Passenger Cars
in Germany, 19th ESV Conference, 2005
[9] Busch, S., Entwicklung einer Bewertungsmethodik zur Prognose des Sicherheitsgewinns ausgewählter
Fahrerassistenzsysteme, Fortschrittsberichte VDI Nr. 588, 2005, ISBN 3-18-358812-9
[10] Fürstenberg, K., Pedestrian Safety Based on Laserscanner Data, Advanced Microsystems for Automotive
Applications, 2005, ISBN 3-540-24410-7
[11] Unselt, Th., Breuer, J., Eckstein, L., Fußgängerschutz durch Bremsassistenz, Conference Proceedings of
„Aktive Sicherheit durch Fahrerassistenzsysteme“, München, 2004
[12] Schulz, A., Fröming, R.: Experimentelle Untersuchungen zu Reaktionszeiten beim Führen eines Pkw unter
Variation der Komplexität der Randbedingungen, TU Berlin, Institute of Automotive Engineering, internal
Report, 2005
[13] Weyer, F., Fröming, R.: Erstellung eines Einspurmodells zur Analyse der PreCrash-Phase von
Fußgängerunfällen, TU Berlin, Institute of Automotive Engineering, internal Report, 2005
[14] Gavrila, D. M.(2004): Pre-Impact Pedestrian Sensing; Konferenz Fußgängerschutz 09.-11.03.2004 IIR
Deutschland GmbH, CTI, 2004.