Embed Size (px)
Citation preview

Rerefining Used Lubrication
and Industrial Oils
Effects on Virgin
Crude Oil Refining
California Department of Resources Recycling and Recovery May 24, 2013
Contractor's Report Produced Under Contract By:
HSB Solomon Associates LLC Dallas, Texas

S T A T E O F C A L I F O R N I A
Edmund G. Brown Jr.
Governor
Matt Rodriquez
Secretary, California Environmental Protection Agency
DEPARTMENT OF RESOURCES RECYCLING AND RECOVERY
Caroll Mortensen
Director
Department of Resources Recycling and Recovery Public Affairs Office
1001 I Street (MS 22-B) P.O. Box 4025
Sacramento, CA 95812-4025 www.calrecycle.ca.gov/Publications/
1-800-RECYCLE (California only) or (916) 341-6300
Publication # DRRR-2013-1481
To conserve resources and reduce waste, CalRecycle reports are produced in electronic format only. If printing copies of this document, please consider use of recycled paper containing 100 percent postconsumer
fiber and, where possible, please print images on both sides of the paper.
Copyright © 2013 by the California Department of Resources Recycling and Recovery (CalRecycle). All rights reserved. This publication, or parts thereof, may not be reproduced in any form without permission.
Prepared as part of contract number DDR 12041 for $88,000.00.
The California Department of Resources Recycling and Recovery (CalRecycle) does not discriminate on the basis of disability in access to its programs. CalRecycle publications are available in accessible formats upon request by calling the Public Affairs Office at (916) 341-6300. Persons with hearing
impairments can reach CalRecycle through the California Relay Service, 1-800-735-2929.
Disclaimer: This report was produced under contract by HSB Solomon Associates LLC. The
statements and conclusions contained in this report are those of the contractor and not
necessarily those of the Department of Resources Recycling and Recovery (CalRecycle), its
employees, or the State of California and should not be cited or quoted as official Department
policy or direction.
The state makes no warranty, expressed or implied, and assumes no liability for the information
contained in the succeeding text. Any mention of commercial products or processes shall not be
construed as an endorsement of such products or processes.

Contractor’s Report to CalRecycle i
Table of Contents
Background ................................................................................................................................................... 3
Markets ................................................................................................................................................... 3
Rerefined Base Oil Product Quality ....................................................................................................... 5
Volumetrics ............................................................................................................................................ 5
Refining Landscape ................................................................................................................................ 7
2010 Scenario................................................................................................................................................ 8
Net Effects .............................................................................................................................................. 9
Appendix 1: Data ........................................................................................................................................ 10
Appendix 2: Methodology .......................................................................................................................... 14
Initial Assumptions ............................................................................................................................... 14
Volume Expansion ............................................................................................................................... 14
Operating Expense ............................................................................................................................... 14
Energy Consumption ............................................................................................................................ 14
Refinery-Produced Fuel........................................................................................................................ 14
Emissions.............................................................................................................................................. 14
Freight .................................................................................................................................................. 15

Contractor’s Report to CalRecycle 3
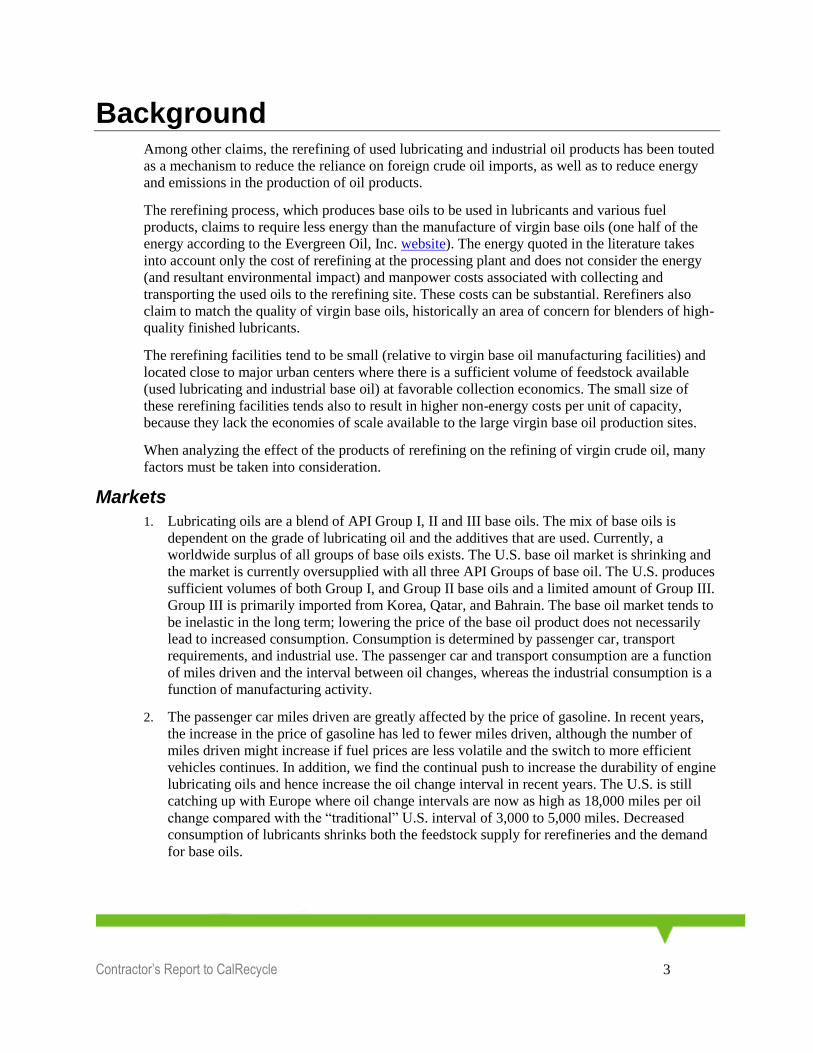
Background Among other claims, the rerefining of used lubricating and industrial oil products has been touted
as a mechanism to reduce the reliance on foreign crude oil imports, as well as to reduce energy
and emissions in the production of oil products.
The rerefining process, which produces base oils to be used in lubricants and various fuel
products, claims to require less energy than the manufacture of virgin base oils (one half of the
energy according to the Evergreen Oil, Inc. website). The energy quoted in the literature takes
into account only the cost of rerefining at the processing plant and does not consider the energy
(and resultant environmental impact) and manpower costs associated with collecting and
transporting the used oils to the rerefining site. These costs can be substantial. Rerefiners also
claim to match the quality of virgin base oils, historically an area of concern for blenders of high-
quality finished lubricants.
The rerefining facilities tend to be small (relative to virgin base oil manufacturing facilities) and
located close to major urban centers where there is a sufficient volume of feedstock available
(used lubricating and industrial base oil) at favorable collection economics. The small size of
these rerefining facilities tends also to result in higher non-energy costs per unit of capacity,
because they lack the economies of scale available to the large virgin base oil production sites.
When analyzing the effect of the products of rerefining on the refining of virgin crude oil, many
factors must be taken into consideration.
Markets
1. Lubricating oils are a blend of API Group I, II and III base oils. The mix of base oils is
dependent on the grade of lubricating oil and the additives that are used. Currently, a
worldwide surplus of all groups of base oils exists. The U.S. base oil market is shrinking and
the market is currently oversupplied with all three API Groups of base oil. The U.S. produces
sufficient volumes of both Group I, and Group II base oils and a limited amount of Group III.
Group III is primarily imported from Korea, Qatar, and Bahrain. The base oil market tends to
be inelastic in the long term; lowering the price of the base oil product does not necessarily
lead to increased consumption. Consumption is determined by passenger car, transport
requirements, and industrial use. The passenger car and transport consumption are a function
of miles driven and the interval between oil changes, whereas the industrial consumption is a
function of manufacturing activity.
2. The passenger car miles driven are greatly affected by the price of gasoline. In recent years,
the increase in the price of gasoline has led to fewer miles driven, although the number of
miles driven might increase if fuel prices are less volatile and the switch to more efficient
vehicles continues. In addition, we find the continual push to increase the durability of engine
lubricating oils and hence increase the oil change interval in recent years. The U.S. is still
catching up with Europe where oil change intervals are now as high as 18,000 miles per oil
change compared with the “traditional” U.S. interval of 3,000 to 5,000 miles. Decreased
consumption of lubricants shrinks both the feedstock supply for rerefineries and the demand
for base oils.

Contractor’s Report to CalRecycle 4
3. The freight transportation consumption and industrial consumption are driven more by the
overall economy than the price of fuel, although higher fuel prices may push more freight to
rail if rates rise enough.
4. Major base oil buyers tend to have contracts in place with base oil suppliers specifying
volume and price. They buy very small amounts on a spot basis outside of these contracts.
Smaller independent companies are willing to buy spot barrels, when available, to take
advantage of price opportunities. Smaller companies are more readily able to adjust their
purchases between the API Groups if economics are favorable. Their disadvantage tends to
be in the small volumes they require. As a result, they are often unable to buy if major
suppliers wish to move large (barge or even rail car) quantities.
5. Although substitution of base oils does happen (as indicated above), many finished oil
formulations have strict limits on the amount of substitution allowed without requiring
extensive recertification. Most finished lubricant producers are limited on the number of base
oils used by their tankage. They select a feedstock slate that will be acceptable to their
product lines, build tanks to suit, but often cannot adjust the slate without major issues around
tankage and inventory. As a result, many finished/blended lubricant oil producers “fix” their
formulations around base oil supplied by a single source. This results in the market being
fairly fixed, and is one of the main reasons that most base oil is supplied through long-term
contracts.
6. There is only one producer of base oils in Petroleum Administration for Defense District
(PADD) V: the Chevron refinery in Richmond, California. They have the capability to
produce Group II, Group II+, and Group III base oils. Group I base oils required within this
area are typically supplied by rail from U.S. Gulf Coast, U.S. Inland, or Canadian refineries.
Group I oils can be replaced by Group II oils in many formulations currently using Group I
base oils; the decision to use Group I over Group II for these formulations is based on price.
If the Group II oils are priced relatively close to the Group I prices, substitutions will occur.
Currently, some of the rerefined oils on the West Coast are being used in place of Group I
oils. Additional volumes of rerefined oils have displaced virgin Group II in finished product
formulations.
7. The motor fuels market in the U.S. is also shrinking as the recent high price of fuels has
curtailed some amount of driving; this, in turn, also reduces the demand for lubricating oils.
The emergence of hybrid and electric vehicles, along with the impending upgrade of the
federal Corporate Average Fuel Economy (CAFE) standards, will continue that decline. The
motor fuels market displays more price elasticity; lower fuel prices tend to lead to increased
driving with the resultant increase in fuel and lubricant consumption.
8. The base oil and motor fuels markets have moved from regional to worldwide as products are
shipped internationally to destinations where the market needs the product. In California,
base oil tends to be universal. Motor fuels prepared for use in California are manufactured to
rigid specifications that typically exceed those encountered in the rest of the world, making
imports and exports more difficult.

Contractor’s Report to CalRecycle 5
9. Supply and demand are not constant. Fluctuations in short-term supply are caused by refinery
incidents (for example, the 2012 Chevron Richmond refinery fire) and refinery maintenance.
Fluctuations in short-term demand are caused by seasonality (Americans tend to drive more
during the summer months than the winter months), weather conditions (hurricanes on the
U.S. Gulf Coast), and overall economic activity (petroleum demand substantially reduced
during the recent recession). Due to the size of the market in relation to the amount of
recycled oil, there are times when the oil will be absorbed into the market without any effect
on the refineries that produce competing product. Such was the case in 2012 when the
Richmond refinery was cut back and more imports were needed to supply the demand. Over
the longer term, the market will determine the demand and the demand is unaffected by the
source of supply—crude oil or rerefining oil. Additional supply from rerefiners will cause
decreased supply from other sources.
Rerefined Base Oil Product Quality
1. Product quality for most rerefiners is a direct result of the feedstock material collected. Most
of these facilities do not have the capability to upgrade the viscosity index, saturate content,
and other key properties of the product. At the small volumes fed to rerefineries today,
rerefiners that produce base oils have been able to selectively choose higher quality feeds
(such as waste oil from fast-change lube operations) to produce their base oil. If lower quality
oil is collected (such as industrial lubricants), the feedstock may not allow for the current
quality of base oil to be manufactured. Alternately, a higher percentage of residual fuel oil
will be manufactured.
2. Although conveniently grouped and categorized for discussion, not all base oil so grouped is
of the same quality in the eyes of the purchasers. This is true of rerefined as well as virgin
base oils. Currently, most rerefined base oil is classified as Group II. Rerefined oil can be
easily substituted for virgin base oil in many products that are highly additized, with the
properties of the additives allowing for quality differences in the base oil. It will also be
substitutable where it is a small volume component of blends with other base oils. But there
are applications where the recycled base oil will not be a suitable substitute for virgin base
oil. Considering the small volume of rerefined base oil at present, this is not a problem
because there are enough select applications in which to place the material.
Volumetrics
1. Table 1 (page 6) shows 2010 U.S. Energy Information Administration (EIA) for product
supply to PADD V (U.S. West Coast). For comparison purposes, the products of rerefining,
as supplied by UC Santa Barbara, are also shown. Note the volumes of rerefined product are
a small fraction of both production and imported volumes.

Contractor’s Report to CalRecycle 6
Table 1- 2010 Product Supply for PADD V
k b/d Gasoline Blending
Components
Distillate Fuel Oil
Residual Fuel Oil
Lubricants Asphalt
2010 Production 1,539 500 122 19 28
2010 Imports 26 9 57 0 3
2010 Exports 3 46 17 8 4
2010 Rerefined Products 0.6 1.8 1.1 1.0 1.5
The product volume of a rerefinery is small compared to the size of the markets where the
products will be sold. For example, the volume of recycled oil products in California in 2010
was approximately 6,000 barrels per day (b/d). In that same year, there were 14 California
crude oil refineries. Disregarding the two small specialty refiners (San Joaquin and Kern Oil),
the remaining 12 refiners processed approximately 1.6 million barrels per day of crude oil.
Thus, rerefined products amounted to just 0.4 percent of the crude oil processed at these 12
plants.
2. For 2012, Lubes’n’Greases magazine has published the following capacity data (Table 2) on
lube refineries and rerefineries worldwide.
Table 2 – Worldwide Base Oil Capacity
Virgin Paraffinic Base Oil Rerefined Base Oil
Area Capacity, b/d
No. of Plants
Average Capacity
Capacity, b/d
No. of Plants
Average Capacity
North America 196,000 20 9,800 10,050 5 2,010
South America 31,100 9 3,456 2,550 1 2,550
South Asia/Pacific/ Australia
117,300 16 7,331 1800 2 900
Western Europe 116,410 19 6,127 16,520 10 1,652
Central & Eastern Europe
99,020 22 4,501 1600 1 1,600
China 77,010 19 4,053 0 0 -
Japan and Korea 128,900 13 9,915 0 0 -
Middle East & Africa 82,520 22 3,751 0 0 -
Total/Average 880,780 140 6,059 32,520 19 1,712
Contractor’s Report to CalRecycle 7
Refining Landscape
1. Refineries are sophisticated in their planning and execution. They use linear programs to
optimize crude oil selection and adjust operating parameters to optimize the production to
achieve the highest economic return. Within the limits of crude oil logistics, price forecast
accuracy, and the configuration of the refinery, refiners adjust their crude purchases and
internal operating controls to supply the highest valued mix of products based on the market
price and volume forecast. For example, a refiner can change the mix of purchased of crude
oil to supply more gasoline or more diesel fuel as needed. The refiner also has the ability to
adjust operating parameters on the processes within the refinery to change the mix of
products from the plant. Operating parameter changes can adjust products produced to easily
compensate for the small volumes of products from rerefiners entering the marketplace.
2. Recent closures of refineries in California (Alon-Paramount) and in PADD V Hawaii
(Tesoro-Kapolei) have changed the supply in the PADD V region.
3. New large, high efficiency, export fuels refineries are being constructed in the Middle East
and Asia with the express purpose of providing petroleum products worldwide. Even though
not located in close proximity to the U.S., their product exports will have an effect on the
market in California.

Contractor’s Report to CalRecycle 8
2010 Scenario Based on the above background, the assumptions for 2010 are that the fuels products provided by
rerefiners displaced imports. The figure below shows the scenario graphically.
Replacement of refined products by re-refined products
Gasoline and diesel imports from Far East refineries into PADD V were displaced. Residual fuel
oils from Latin American refineries were displaced. For each of these displacements, the average
of all of the area refineries that had supplied the products were used for calculating the data
presented in the results.
For base oil, the assumption is that all of the rerefined base oil displaced Group I oils on the West
Coast. The Group I suppliers are located inland U.S. or on the U.S. Gulf Coast because Group I
base oil is not manufactured in PADD V. When the oil was backed up into these plants’
inventory, they were forced to export more oil to Latin America, where higher cost base oil
producers reduced their production of base oil.
Asphalt is a more difficult product to forecast because the demand is almost directly dependent
on government spending on roads. The asphalt product of rerefining is an asphalt flux that is used
to reduce the hardness or viscosity of asphalts produced from crude oil. The rerefined flux
consists of the polymeric additives originally blended into the motor oils as well as soot and other
non-volatile components of the used oil feedstock such as metal containing compounds. Asphalt
flux supplied by refiners is typically vacuum residual oil. Although there are different ways to
handle this material in the crude oil refinery, it is assumed that refineries sold less of this material
as asphalt flux and processed it alternately into fuels by feeding it into coker units.
In 2010, the average utilization of the 16 cokers located in California refineries was 77.7 percent.
If the asphalt flux was not supplied by rerefiners, the coker utilization would drop to 77.4 percent
as the refineries would have removed vacuum residuum from their cokers and make it available
for sale to asphalt blenders. The heavy vacuum gas oil produced from the coker is fed to a
Refinery Products
RefProd13-01
Gasoline/Naphtha
Diesel
Fuel
Backs outgasoline imports
Backs out
diesel imports
Reduces crude oil
processed byFar East refineries
ResidualFuel Oil
Backs outresidual fuel
oil imports
Gasoline/Naphtha
Base
Oil
Replaces Group Iformulations on
West Coast
Reduces shipment ofGroup I from US Inland
at USGC Refineries
US Inland & USGCrefineries export
more to LTA
Reduces crude oil
processed inLTA refineries
Asphalt
Flux
Reduces sales of
vacuum residby CA refineries
Gasoline/
Naphtha
Gasoline
Diesel
Fuel
RefineryProduced Gas
Petroleum
Coke
Reducesgasoline &
diesel imports
Replacesnatural gas
Increase exports
to Far East
Reduces crude
oil processed inFar East refineries

Contractor’s Report to CalRecycle 9
catalytic cracker to manufacture additional transportation fuel products. Disposition of the
gasoline and diesel produced from these processes would be as above. The disposition of the
product coke has not been addressed. Most likely, the additional volume would be exported to
Asia, where it is used to generate electricity, make steel, and manufacture cement. The data from
EIA regarding petroleum coke is shown in Table 3.
Table 3 – Petroleum Coke Production
Year Production, t/d Exports, t/d Production from Recycled Oil
2010 20,757 20,051 72
2011 21,293 21,472 60
2012 21,474 22,367 ?
Net Effects
The fuels products of the rerefineries were assumed to replace imports of similar products into
California. The base oil products of the rerefineries were assumed to replace Group I base oil
products shipped from refineries on the U.S. Gulf Coast or from U.S. inland refineries. The
displaced base oil products would in turn be exported to Latin America where higher cost
producers are located. The asphalt flux is assumed to have displaced vacuum resid produced by
California refineries.
As a result, Far East refineries would reduce crude runs by 3,379 b/d because they could no
longer export the current fuels volume into PADD V. The Latin American refineries would
reduce runs by 2,121 b/d because they could no longer export residual fuel oil into PADD V and
because their base oils would be replaced with oils from the U.S. California refineries would
increase coker unit charge by 1,504 b/d and increase catalytic cracker charge by 391 b/d. The
remaining effects are shown in Appendix 1.

Contractor’s Report to CalRecycle 10
Appendix 1: Data
Rerefined Products Produced (b/d)
Gasoline/Naphtha 606 699 704 707 707
Distillates 1,819 2,098 2,112 2,120 2120
Group II Base Oil 1,010 699 1,217 1,315 1328
RFO 1,112 1,219 348 257 280
Asphalt Flux 1,504 1,251 1,632 1,651 1653
Total 6,050 5,966 6,013 6,050 6,088
California Refinery Products to Market
Petroleum Coke (ton/d) 72 60 78 79 79
Displaced Natural Gas (MBtu/d) (1,576) (1,311) (1,709) (1,729) (1,731)
Crude Inputs (b/d) (5,500) (5,478) (5,409) (5,439) (5,477)
Latin America (2,121) (1,918) (1,565) (1,572) (1,608)
Far East (3,379) (3,561) (3,844) (3,867) (3,869)
Incremental Energy Consumption (MBtu/d) (1,458) (1,515) (1,340) (1,344) (1,359)
Latin America (862) (780) (636) (639) (654)
Natural Gas (754) (682) (557) (559) (572)
Electricity (108) (97) (80) (80) (82)
Far East (1,078) (1,136) (1,226) (1,234) (1,234)
Natural Gas (656) (692) (747) (751) (752)
Electricity (422) (444) (480) (483) (483)
California 482 401 523 529 529
Natural Gas 393 327 426 432 432
Electricity 89 74 96 97 98
(107) (112) (99) (99) (100)
Latin America (64) (58) (47) (47) (48)
Far East (82) (86) (93) (94) (94)
California 38 32 41 42 42
Changes In Incremental OpEx (US $/d) (15,620) (16,116) (15,306) (15,376) (15,489)
Latin America (6,533) (5,907) (4,820) (4,841) (4,953)
Far East (11,945) (12,588) (13,588) (13,673) (13,677)
California 2,859 2,379 3,102 3,138 3,141
Changes in Freight Costs (US $/d) (16,870) (17,144) (17,675) (17,795) (17,867)
Latin America (2,001) (2,195) (626) (463) (504)
Far East (12,880) (13,573) (14,651) (14,742) (14,747)
California (11,733) (8,120) (14,144) (15,281) (15,435)
USGC 9,744 6,744 11,747 12,691 12,819
2010 2011 2012
Change in Emissions based upon Refinery Average
Energy Mix (Tons CO2 Equivalents/d)
2013 2014

Contractor’s Report to CalRecycle 11
Rerefined Products Produced (b/d)
Gasoline/Naphtha 707 707 707 707 707
Distillates 2,120 2,120 2,120 2,120 2,120
Group II Base Oil 1,342 1,356 1,370 1,385 1,400
RFO 303 327 352 377 402
Asphalt Flux 1,655 1,657 1,658 1,660 1,663
Total 6,127 6,166 6,207 6,249 6,291
California Refinery Products to Market
Petroleum Coke (ton/d) 79 79 80 80 80
Displaced Natural Gas (MBtu/d) (1,733) (1,735) (1,737) (1,739) (1,741)
Crude Inputs (b/d) (5,515) (5,554) (5,594) (5,635) (5,677)
Latin America (1,645) (1,683) (1,722) (1,761) (1,802)
Far East (3,870) (3,871) (3,873) (3,874) (3,876)
Incremental Energy Consumption (MBtu/d) (1,373) (1,389) (1,404) (1,420) (1,436)
Latin America (669) (684) (700) (716) (732)
Natural Gas (585) (599) (612) (626) (641)
Electricity (84) (86) (87) (90) (92)
Far East (1,235) (1,235) (1,236) (1,236) (1,237)
Natural Gas (752) (752) (752) (753) (753)
Electricity (483) (483) (483) (483) (484)
California 530 531 531 532 533
Natural Gas 432 433 433 434 435
Electricity 98 98 98 98 98
(101) (102) (103) (105) (106)
Latin America (50) (51) (52) (53) (54)
Far East (94) (94) (94) (94) (94)
California 42 42 42 42 42
Changes In Incremental OpEx (US $/d) (15,604) (15,721) (15,841) (15,964) (16,090)
Latin America (5,067) (5,183) (5,302) (5,424) (5,549)
Far East (13,682) (13,687) (13,691) (13,696) (13,701)
California 3,145 3,149 3,152 3,156 3,160
Changes in Freight Costs (US $/d) (17,941) (18,017) (18,094) (18,173) (18,254)
Latin America (546) (589) (633) (678) (724)
Far East (14,752) (14,757) (14,762) (14,768) (14,773)
California (15,592) (15,754) (15,920) (16,090) (16,264)
USGC 12,949 13,084 13,221 13,362 13,507
2017
Change in Emissions based upon Refinery Average
Energy Mix (Tons CO2 Equivalents/d)
2015 2016 2018 2019

Contractor’s Report to CalRecycle 12
Rerefined Products Produced (b/d)
Gasoline/Naphtha 707 707 707 707 707
Distillates 2,120 2,120 2,120 2,120 2,120
Group II Base Oil 1,415 1,431 1,447 1,464 1,481
RFO 428 455 482 510 539
Asphalt Flux 1,665 1,667 1,669 1,671 1,674
Total 6,335 6,379 6,425 6,472 6,520
California Refinery Products to Market
Petroleum Coke (ton/d) 80 80 80 80 80
Displaced Natural Gas (MBtu/d) (1,744) (1,746) (1,748) (1,751) (1,753)
Crude Inputs (b/d) (5,720) (5,764) (5,809) (5,856) (5,903)
Latin America (1,843) (1,886) (1,929) (1,974) (2,020)
Far East (3,877) (3,879) (3,880) (3,882) (3,883)
Incremental Energy Consumption (MBtu/d) (1,453) (1,470) (1,487) (1,505) (1,524)
Latin America (749) (766) (784) (802) (821)
Natural Gas (656) (671) (686) (702) (718)
Electricity (94) (96) (98) (100) (103)
Far East (1,237) (1,237) (1,238) (1,238) (1,239)
Natural Gas (753) (754) (754) (754) (754)
Electricity (484) (484) (484) (484) (485)
California 533 534 535 535 536
Natural Gas 435 436 436 437 437
Electricity 98 98 98 99 99
(107) (108) (110) (111) (112)
Latin America (56) (57) (58) (59) (61)
Far East (94) (94) (94) (94) (94)
California 42 42 42 42 42
Changes In Incremental OpEx (US $/d) (16,219) (16,351) (16,487) (16,626) (16,768)
Latin America (5,677) (5,808) (5,942) (6,079) (6,220)
Far East (13,707) (13,712) (13,717) (13,723) (13,729)
California 3,164 3,168 3,172 3,177 3,181
Changes in Freight Costs (US $/d) (18,337) (18,422) (18,509) (18,598) (18,690)
Latin America (771) (819) (868) (919) (970)
Far East (14,779) (14,785) (14,791) (14,797) (14,803)
California (16,443) (16,626) (16,815) (17,008) (17,207)
USGC 13,656 13,808 13,965 14,125 14,290
Change in Emissions based upon Refinery Average
Energy Mix (Tons CO2 Equivalents/d)
2020 2021 2022 2023 2024

Contractor’s Report to CalRecycle 13
Rerefined Products Produced (b/d)
Gasoline/Naphtha 707 707 707 707 707 707
Distillates 2,120 2,120 2,120 2,120 2,120 2,120
Group II Base Oil 1,498 1,516 1,535 1,554 1,574 1,594
RFO 568 598 629 661 694 727
Asphalt Flux 1,676 1,679 1,681 1,684 1,686 1,689
Total 6,570 6,620 6,672 6,726 6,780 6,837
California Refinery Products to Market
Petroleum Coke (ton/d) 80 81 81 81 81 81
Displaced Natural Gas (MBtu/d) (1,756) (1,758) (1,761) (1,764) (1,766) (1,769)
Crude Inputs (b/d) (5,952) (6,002) (6,053) (6,105) (6,159) (6,215)
Latin America (2,067) (2,115) (2,164) (2,215) (2,267) (2,321)
Far East (3,885) (3,887) (3,889) (3,890) (3,892) (3,894)
Incremental Energy Consumption (MBtu/d) (1,543) (1,562) (1,582) (1,602) (1,623) (1,645)
Latin America (840) (860) (880) (900) (921) (943)
Natural Gas (735) (752) (770) (788) (806) (825)
Electricity (105) (107) (110) (113) (115) (118)
Far East (1,240) (1,240) (1,241) (1,241) (1,242) (1,242)
Natural Gas (755) (755) (755) (756) (756) (757)
Electricity (485) (485) (485) (485) (486) (486)
California 537 538 539 539 540 541
Natural Gas 438 439 439 440 441 442
Electricity 99 99 99 99 99 100
(114) (115) (117) (118) (120) (121)
Latin America (62) (64) (65) (67) (68) (70)
Far East (94) (94) (94) (94) (94) (94)
California 43 43 43 43 43 43
Changes In Incremental OpEx (US $/d) (16,914) (17,063) (17,217) (17,375) (17,537) (17,703)
Latin America (6,365) (6,513) (6,665) (6,822) (6,982) (7,147)
Far East (13,735) (13,741) (13,747) (13,754) (13,760) (13,767)
California 3,186 3,191 3,195 3,200 3,206 3,211
Changes in Freight Costs (US $/d) (18,784) (18,880) (18,979) (19,081) (19,185) (19,292)
Latin America (1,023) (1,077) (1,133) (1,190) (1,249) (1,309)
Far East (14,809) (14,816) (14,823) (14,830) (14,837) (14,844)
California (17,411) (17,621) (17,836) (18,057) (18,285) (18,518)
USGC 14,460 14,634 14,813 14,996 15,185 15,379
Change in Emissions based upon Refinery Average
Energy Mix (Tons CO2 Equivalents/d)
20292025 2026 2027 2028 2030

Contractor’s Report to CalRecycle 14
Appendix 2: Methodology
Initial Assumptions
The volumes and descriptions of all products of the rerefining operations in California were
provided to Solomon by the Life Cycle Assessment team at UC Santa Barbara. Solomon
reviewed the information and determined the market effects based on this scenario analysis. The
data for the refinery results is an average using data from all refineries in a specific region. If a
specific refining process was involved, the average is for all refineries in the region that operate
that specific process.
Volume Expansion
The analysis has been conducted on a volume basis rather than a mass basis. The total reduction
of crude input is lower than the total volume of rerefined products because many refining
processes change the density of the oil, thus creating a volume expansion across the refinery
when higher density feeds are refined into lower density products such as gasoline and diesel fuel.
The values used in the analysis are based on the average expansion of the regional refineries.
Operating Expense
The volumes of rerefined products are small compared to the total throughput of the average
refineries in the various regions. Accordingly, and changes in operations were considered
incremental, the only changes in cost would be based on changing variable costs. The largest
variable cost is energy. Fixed costs such as personnel are not included in the analysis.
Energy Consumption
Reductions in energy consumption due to reduced crude throughput are based on the average
consumption for the refineries in the region. Because the reductions are incremental, only
purchased utilities were reduced. It is assumed that any energy derived from refinery-produced
streams would continue to be utilized and the reduction would come out of purchases from third
parties. In all cases, purchased electricity and natural gas are reduced.
Refinery-Produced Fuel
Solomon collects refinery-produced fuel data separately from energy consumed. It is reported as a
product and also reported as energy consumed, ultimately netting to zero. In the case of the
California refineries, the production of additional fuel gas by the coker and catalytic cracking
units is shown as a reduction in consumption of natural gas that would be backed into the market.
It is beyond the scope of this project to analyze the gas markets.
Emissions
The greenhouse gas emissions are reported in tons of CO2 equivalents per day. The calculations
are based on the average energy mix of the regions’ refineries. This may not coincide with the
assumptions of reducing incremental sources of energy.

Contractor’s Report to CalRecycle 15
Freight
The changes in freight are based on average 2012 Worldscale Association (London) Limited and
Worldscale Association (NYC) Inc. (Worldscale) rates for 30,000 dead weight ton (DWT) clean
product tankers between ports in the regions.