Embed Size (px)
Citation preview
Research and Analytics Division, Value Ideas Investment Services Pvt. Ltd., Mumbai
October 2016
INITIATING COVERAGE 10/25/2016
CMP INR 284
(BSE 25th Oct 16)
Market Cap: INR 3,004 Mn
Face value 10
52 week high/low 299/128
Free Float M cap INR 811 Mn
Average Volume 54,228 (1 month BSE average)
Promoters 73%
Institutions 0%
Non Institutions 27%
Industry: Transportation – Logistics BSE: 536264
HIGHLIGHTS
Tiger Logistics India Ltd. incorporated in 2000, is a third party
logistics services provider. Its business covers international freight
forwarding, supply chain management, project logistics and cold
chain logistics. Company is also customs house agent. The
company has global presence with 16 domestic and 2 international
offices.
Increasing presence in the international market with Multi
Industry exposure to drive long term growth
In last few years, Tiger has strongly expanded its footprint in
domestic market. Now, with pan India presence, it has started
focusing on International markets and recently incorporated
subsidiaries in Singapore and Dubai. Large clientele network in
multiple industries, Strong balance sheet and promoter’s extensive
experience; all will aid in achieving long term growth plans.
Revenue to grow at 30% CAGR; EBITDA margins to improve
Company’s revenue is expected to grow at 30% CAGR over 2017-19
with strong volume growth. Company’s EBITDA margins expanded
by 80bps in FY16 to 5.3% primarily due to drop in ocean freight
charges. Considering globally low fuel pries along with operating
leverage, we estimate company’s EBITDA margins to further
improve by 80 bps in FY18 to 6.1%.
Key Risk: Logistics industry is fragmented and highly
competitive with low pricing power
Logistic industry is fragmented in nature with many small
regional and national players. In such competitive business,
impact of fluctuating fuel prices, margins and high working
capital days are key monitor-able.
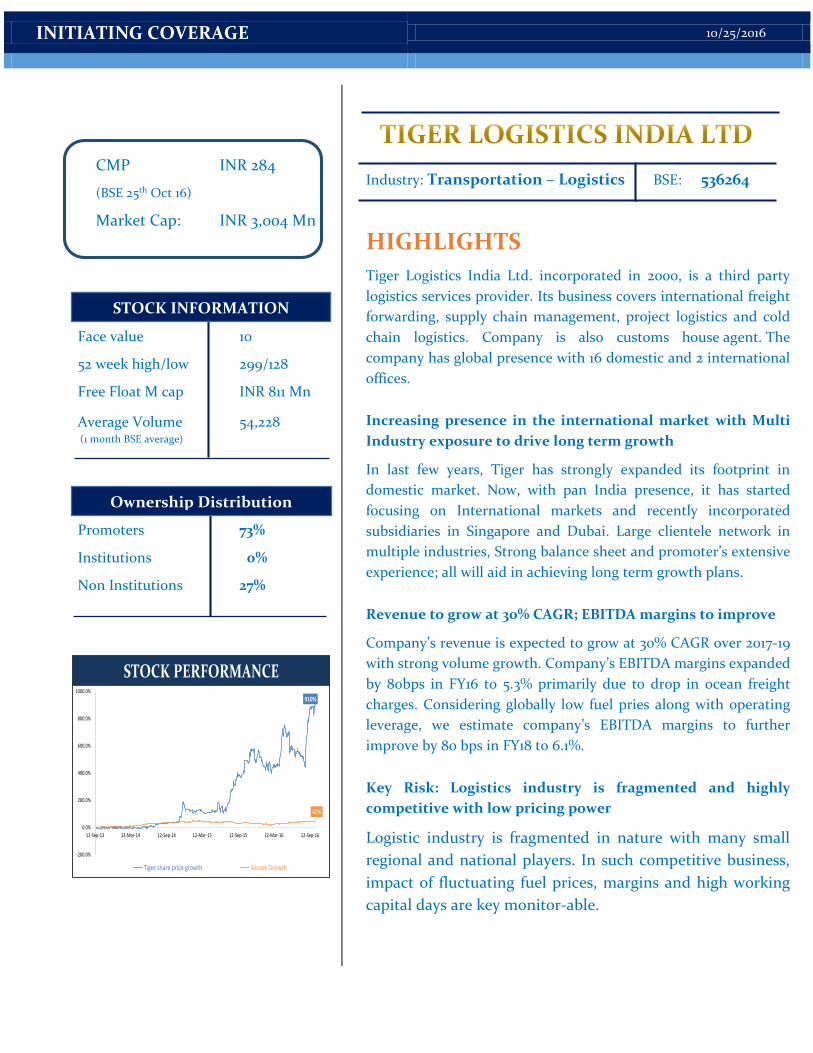
910%
42%
-200.0%
0.0%
200.0%
400.0%
600.0%
800.0%
1000.0%
12-Sep-13 12-Mar-14 12-Sep-14 12-Mar-15 12-Sep-15 12-Mar-16 12-Sep-16
Tiger share price growth Sensex Growth
STOCK PERFORMANCE
STOCK INFORMATION STOCK INFORMATION
Ownership Distribution
INITIATING COVERAGE 10/25/2016
BUSINESS DESCRIPTION
Tiger Logistics (India) Ltd. (Tiger Logistics) was incorporated as a private limited company
in 2000. It was converted into a public company in May 2013. Tiger Logistics is a third party
logistics provider; offers intercontinental air and ocean freight, and logistics and supply
chain services. Company is engaged as International freight forwarder, Custom Clearance
Agent, Transporter, Custom consultant and Project transportation specialist,
Warehousing, shipping, clearing & forwarding businesses.
Tiger logistics have a Multi-modal transport operator’s licence and is a registered Custom
House Agent. Tiger has become a 14th Indian company to migrate from SME platform to
Main Board of BSE Limited.
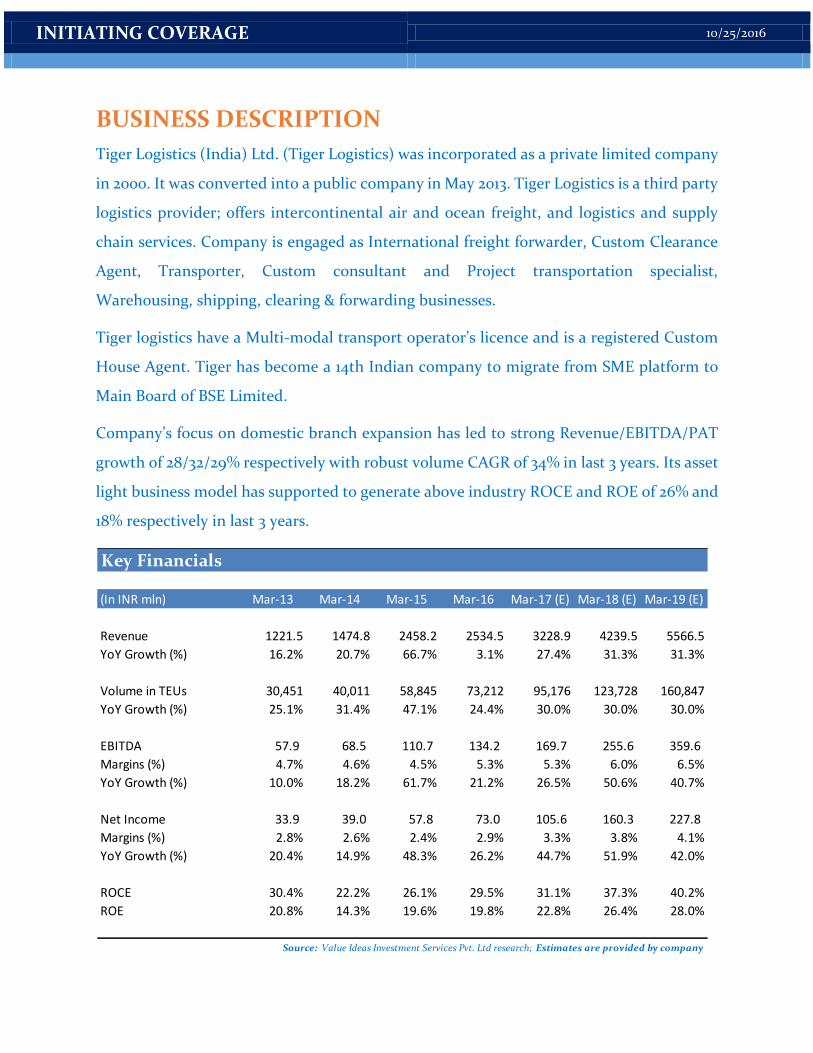
Company’s focus on domestic branch expansion has led to strong Revenue/EBITDA/PAT
growth of 28/32/29% respectively with robust volume CAGR of 34% in last 3 years. Its asset
light business model has supported to generate above industry ROCE and ROE of 26% and
18% respectively in last 3 years.
Key Financials
(In INR mln) Mar-13 Mar-14 Mar-15 Mar-16 Mar-17 (E) Mar-18 (E) Mar-19 (E)
Revenue 1221.5 1474.8 2458.2 2534.5 3228.9 4239.5 5566.5
YoY Growth (%) 16.2% 20.7% 66.7% 3.1% 27.4% 31.3% 31.3%
Volume in TEUs 30,451 40,011 58,845 73,212 95,176 123,728 160,847
YoY Growth (%) 25.1% 31.4% 47.1% 24.4% 30.0% 30.0% 30.0%
EBITDA 57.9 68.5 110.7 134.2 169.7 255.6 359.6
Margins (%) 4.7% 4.6% 4.5% 5.3% 5.3% 6.0% 6.5%
YoY Growth (%) 10.0% 18.2% 61.7% 21.2% 26.5% 50.6% 40.7%
Net Income 33.9 39.0 57.8 73.0 105.6 160.3 227.8
Margins (%) 2.8% 2.6% 2.4% 2.9% 3.3% 3.8% 4.1%
YoY Growth (%) 20.4% 14.9% 48.3% 26.2% 44.7% 51.9% 42.0%
ROCE 30.4% 22.2% 26.1% 29.5% 31.1% 37.3% 40.2%
ROE 20.8% 14.3% 19.6% 19.8% 22.8% 26.4% 28.0%
Source: Value Ideas Investment Services Pvt. Ltd research; Estimates are provided by company
INITIATING COVERAGE 10/25/2016
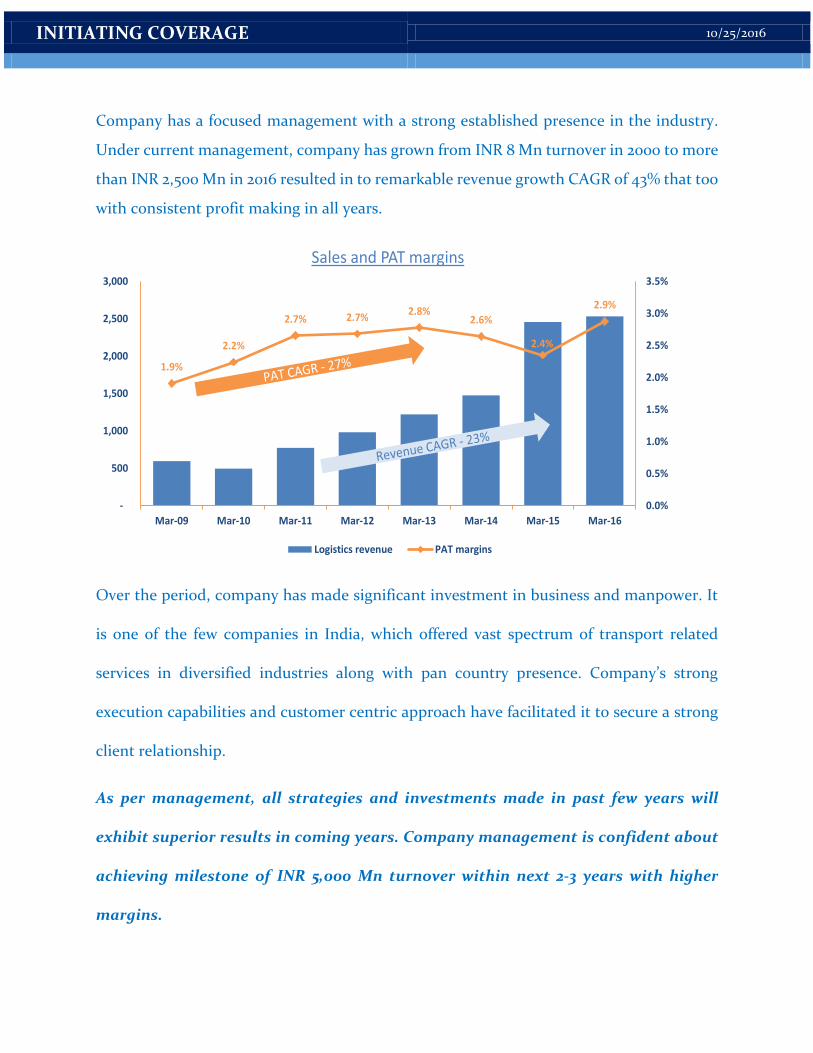
Company has a focused management with a strong established presence in the industry.
Under current management, company has grown from INR 8 Mn turnover in 2000 to more
than INR 2,500 Mn in 2016 resulted in to remarkable revenue growth CAGR of 43% that too
with consistent profit making in all years.
Over the period, company has made significant investment in business and manpower. It
is one of the few companies in India, which offered vast spectrum of transport related
services in diversified industries along with pan country presence. Company’s strong
execution capabilities and customer centric approach have facilitated it to secure a strong
client relationship.
As per management, all strategies and investments made in past few years will
exhibit superior results in coming years. Company management is confident about
achieving milestone of INR 5,000 Mn turnover within next 2-3 years with higher
margins.
1.9%
2.2%
2.7% 2.7%2.8%
2.6%
2.4%
2.9%
0.0%
0.5%
1.0%
1.5%
2.0%
2.5%
3.0%
3.5%
-
500
1,000
1,500
2,000
2,500
3,000
Mar-09 Mar-10 Mar-11 Mar-12 Mar-13 Mar-14 Mar-15 Mar-16
Sales and PAT margins
Logistics revenue PAT margins
INITIATING COVERAGE 10/25/2016
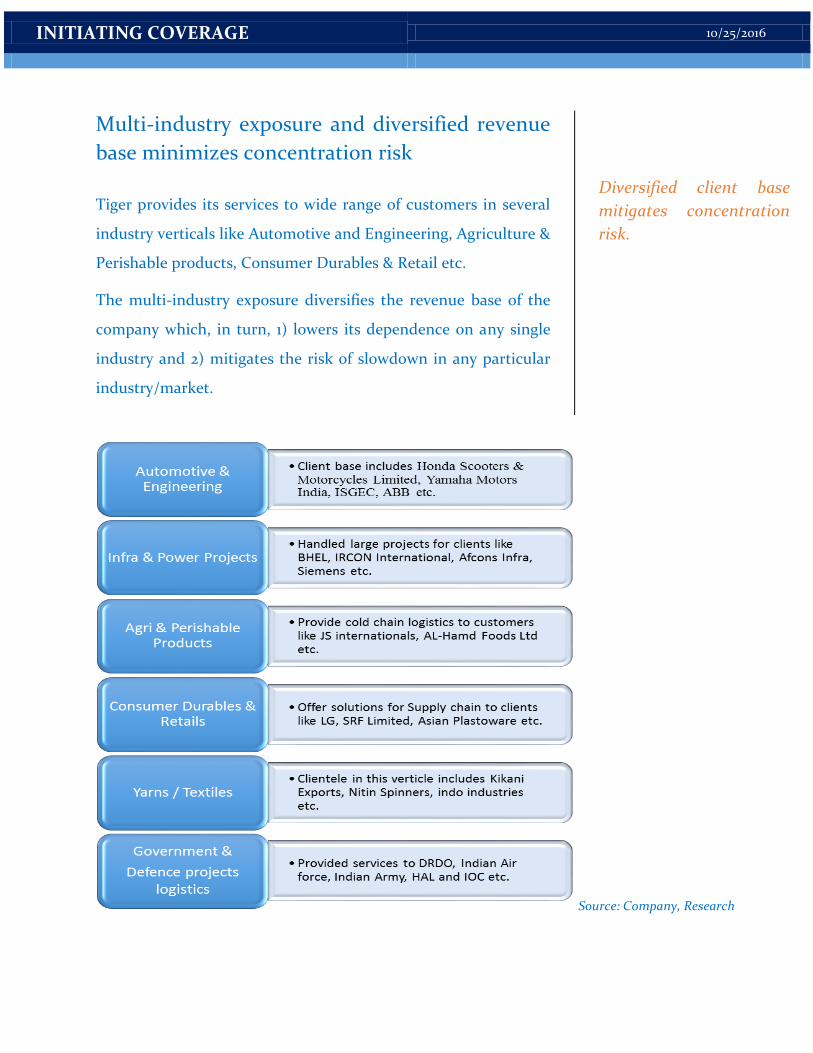
Multi-industry exposure and diversified revenue
base minimizes concentration risk
Tiger provides its services to wide range of customers in several
industry verticals like Automotive and Engineering, Agriculture &
Perishable products, Consumer Durables & Retail etc.
The multi-industry exposure diversifies the revenue base of the
company which, in turn, 1) lowers its dependence on any single
industry and 2) mitigates the risk of slowdown in any particular
industry/market.
Diversified client base
mitigates concentration
risk.
Source: Company, Research
INITIATING COVERAGE 10/25/2016
Increased presence in
International markets to
drive growth.
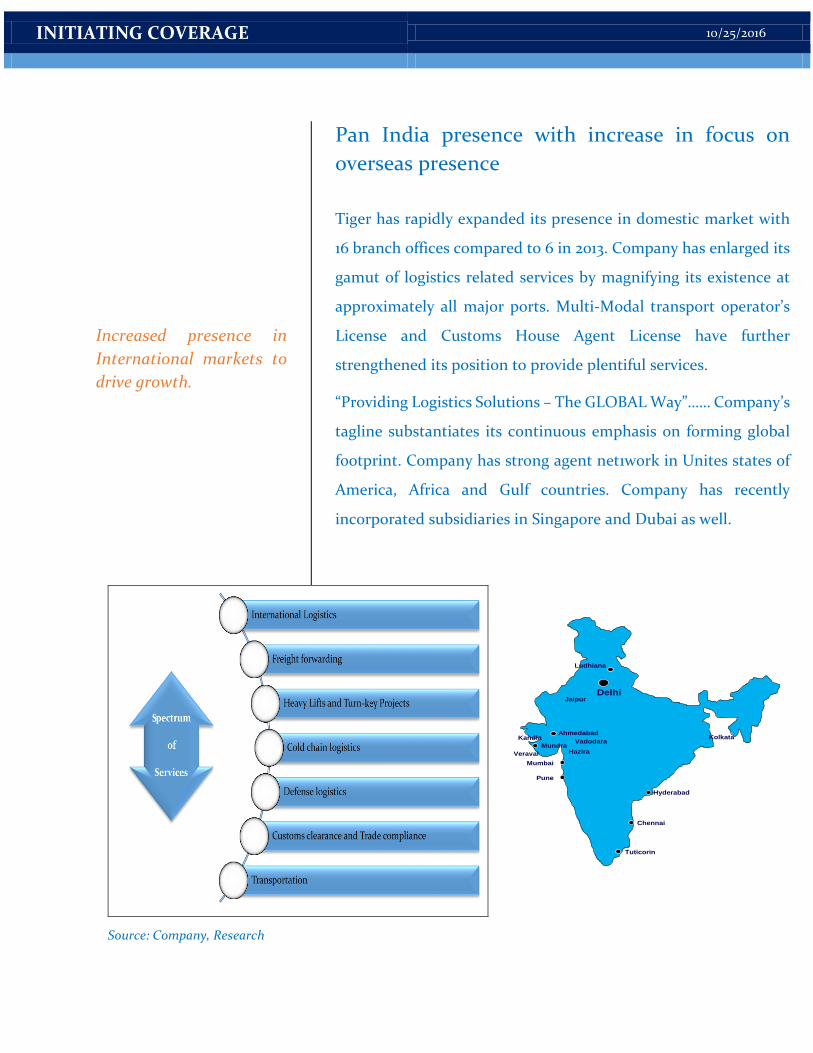
Pan India presence with increase in focus on
overseas presence
Tiger has rapidly expanded its presence in domestic market with
16 branch offices compared to 6 in 2013. Company has enlarged its
gamut of logistics related services by magnifying its existence at
approximately all major ports. Multi-Modal transport operator’s
License and Customs House Agent License have further
strengthened its position to provide plentiful services.
“Providing Logistics Solutions – The GLOBAL Way”…… Company’s
tagline substantiates its continuous emphasis on forming global
footprint. Company has strong agent net1work in Unites states of
America, Africa and Gulf countries. Company has recently
incorporated subsidiaries in Singapore and Dubai as well.
Source: Company, Research
Kolkata
Ludhiana
Delhi
Mumbai
Pune
Chennai
Hyderabad
Mundra
Jaipur
Ahmedabad
Veraval
Vadodara
Hazira
Tuticorin
Kandla
INITIATING COVERAGE 10/25/2016
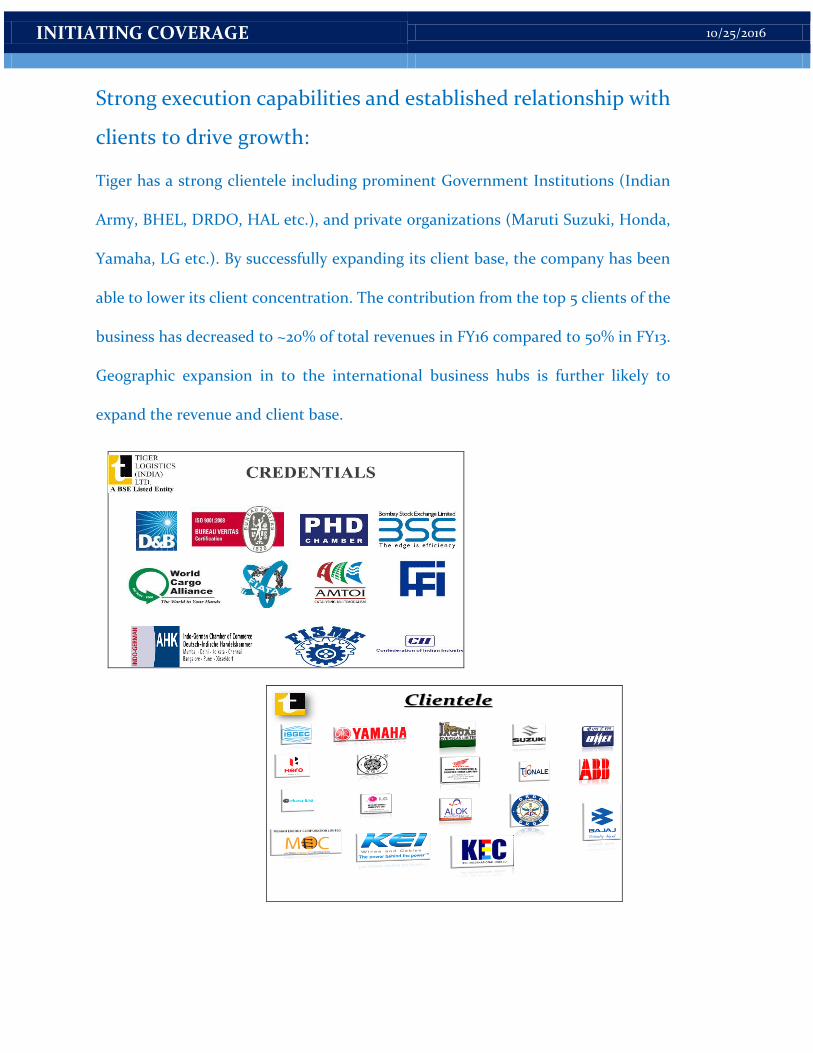
Strong execution capabilities and established relationship with
clients to drive growth:
Tiger has a strong clientele including prominent Government Institutions (Indian
Army, BHEL, DRDO, HAL etc.), and private organizations (Maruti Suzuki, Honda,
Yamaha, LG etc.). By successfully expanding its client base, the company has been
able to lower its client concentration. The contribution from the top 5 clients of the
business has decreased to ~20% of total revenues in FY16 compared to 50% in FY13.
Geographic expansion in to the international business hubs is further likely to
expand the revenue and client base.
Clientele
INITIATING COVERAGE 10/25/2016
LOGISTICS INDUSTRY
Overview:
The Indian logistics industry is valued at an estimated US$ 130bn and it has seen a
CAGR of over 16% over the last five years. The industry comprises freight and
passenger transportation via road, rail, air and water, as well as warehousing and
cold-storage. Growth of the Logistics business is directly correlated with economic
activity. Empirical evidence suggests that the Indian Logistics industry grows at 1.5-
2x the GDP.
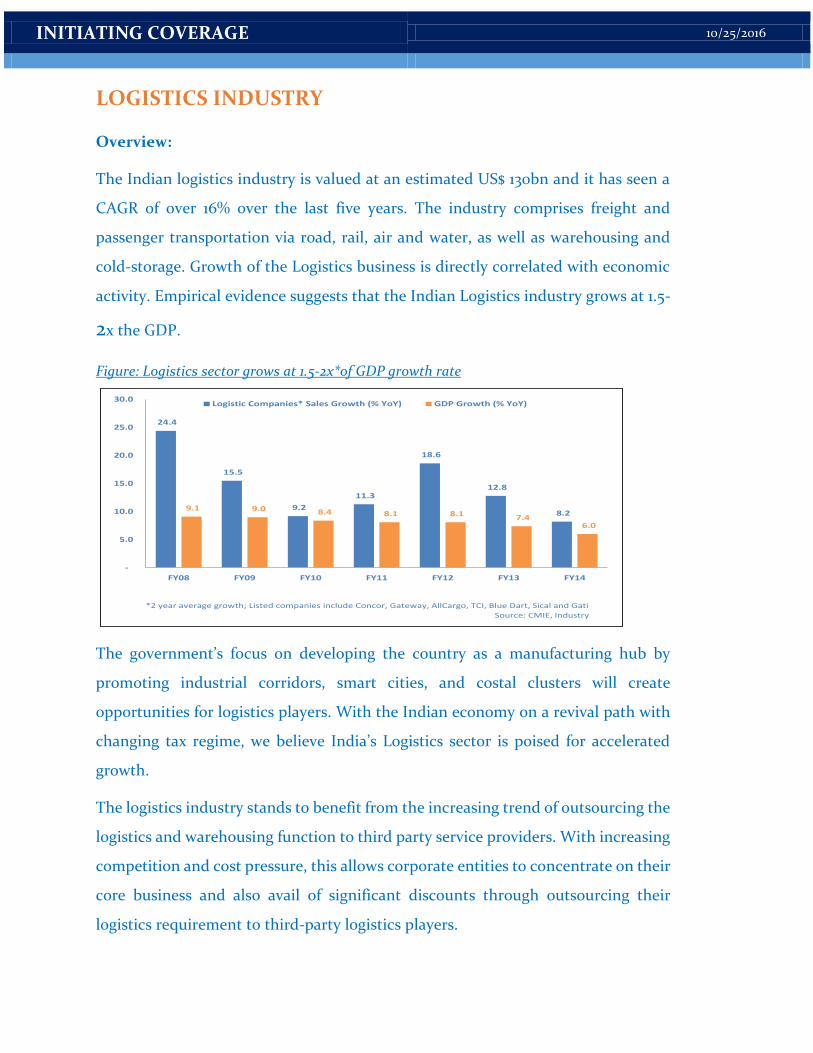
Figure: Logistics sector grows at 1.5-2x*of GDP growth rate
The government’s focus on developing the country as a manufacturing hub by
promoting industrial corridors, smart cities, and costal clusters will create
opportunities for logistics players. With the Indian economy on a revival path with
changing tax regime, we believe India’s Logistics sector is poised for accelerated
growth.
The logistics industry stands to benefit from the increasing trend of outsourcing the
logistics and warehousing function to third party service providers. With increasing
competition and cost pressure, this allows corporate entities to concentrate on their
core business and also avail of significant discounts through outsourcing their
logistics requirement to third‐party logistics players.
24.4
15.5
9.2
11.3
18.6
12.8
8.2 9.1 9.0 8.4 8.1 8.1 7.4
6.0
-
5.0
10.0
15.0
20.0
25.0
30.0
FY08 FY09 FY10 FY11 FY12 FY13 FY14
Logistic Companies* Sales Growth (% YoY) GDP Growth (% YoY)
*2 year average growth; Listed companies include Concor, Gateway, AllCargo, TCI, Blue Dart, Sical and Gati
Source: CMIE, Industry
INITIATING COVERAGE 10/25/2016
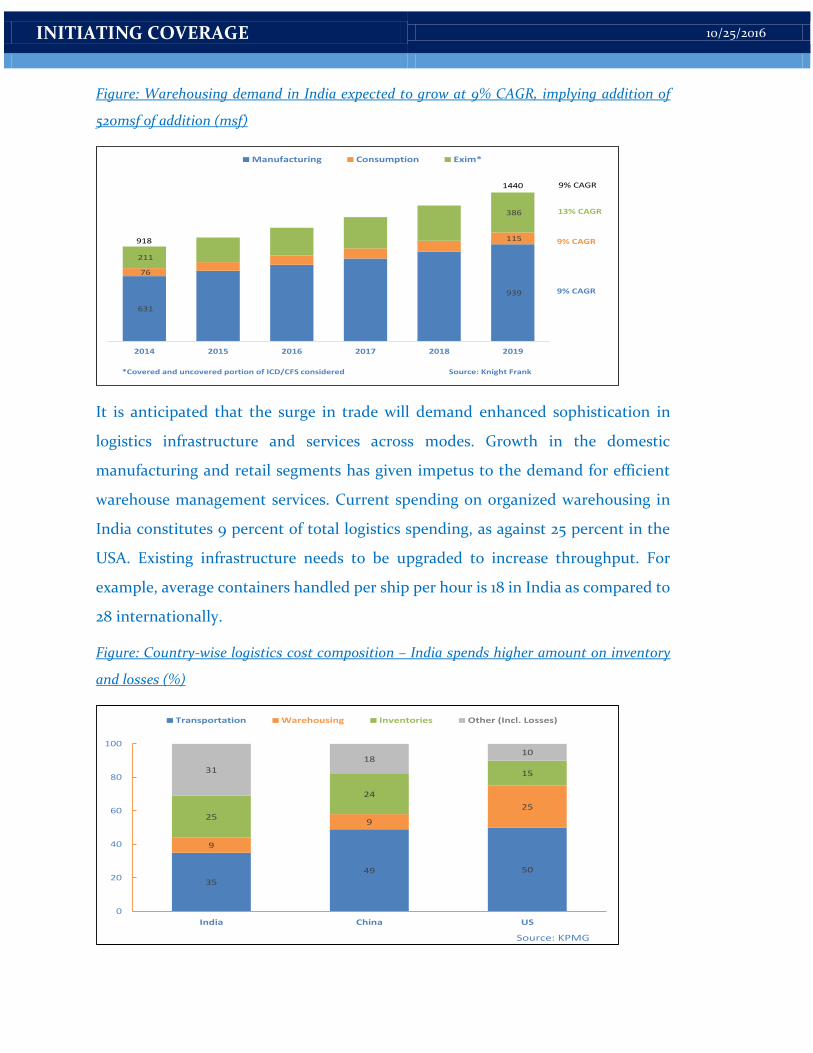
Figure: Warehousing demand in India expected to grow at 9% CAGR, implying addition of
520msf of addition (msf)
It is anticipated that the surge in trade will demand enhanced sophistication in
logistics infrastructure and services across modes. Growth in the domestic
manufacturing and retail segments has given impetus to the demand for efficient
warehouse management services. Current spending on organized warehousing in
India constitutes 9 percent of total logistics spending, as against 25 percent in the
USA. Existing infrastructure needs to be upgraded to increase throughput. For
example, average containers handled per ship per hour is 18 in India as compared to
28 internationally.
Figure: Country-wise logistics cost composition – India spends higher amount on inventory
and losses (%)
631
939
76
115
211
386
2014 2015 2016 2017 2018 2019
Manufacturing Consumption Exim*
13% CAGR
9% CAGR
9% CAGR
*Covered and uncovered portion of ICD/CFS considered Source: Knight Frank
918
1440 9% CAGR
35
49 50
9
9
2525
24
1531
1810
0
20
40
60
80
100
India China US
Transportation Warehousing Inventories Other (Incl. Losses)
Source: KPMG
INITIATING COVERAGE 10/25/2016
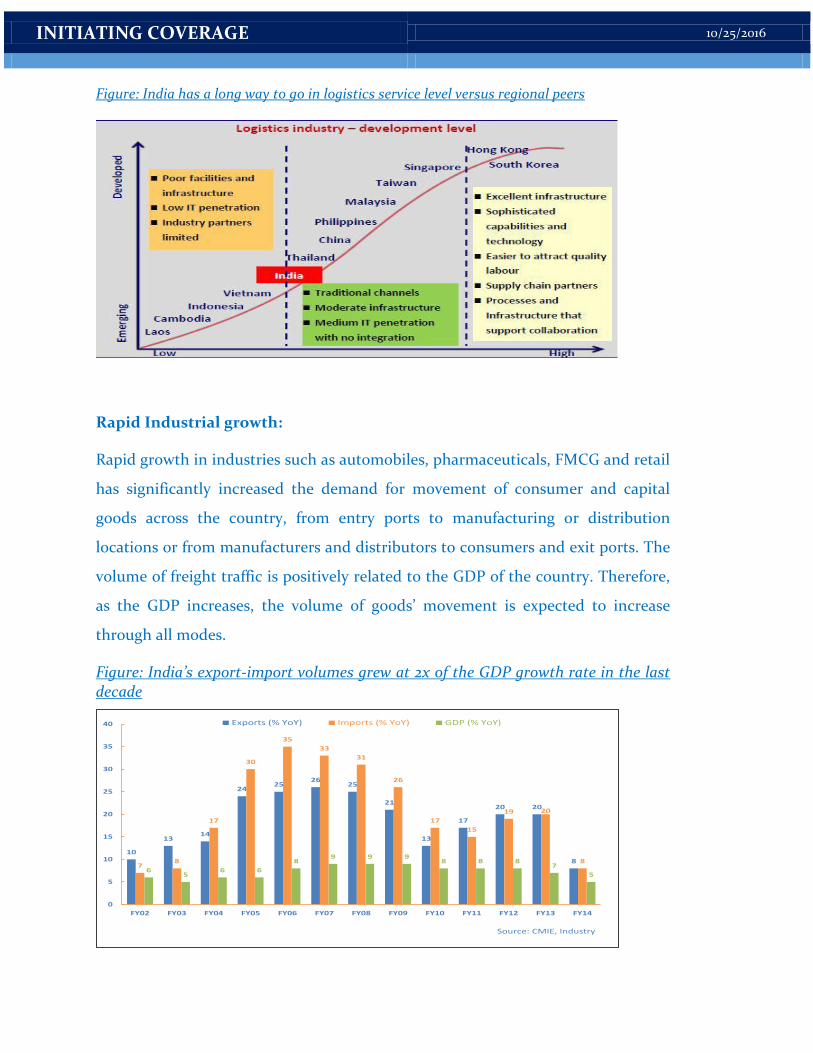
Figure: India has a long way to go in logistics service level versus regional peers
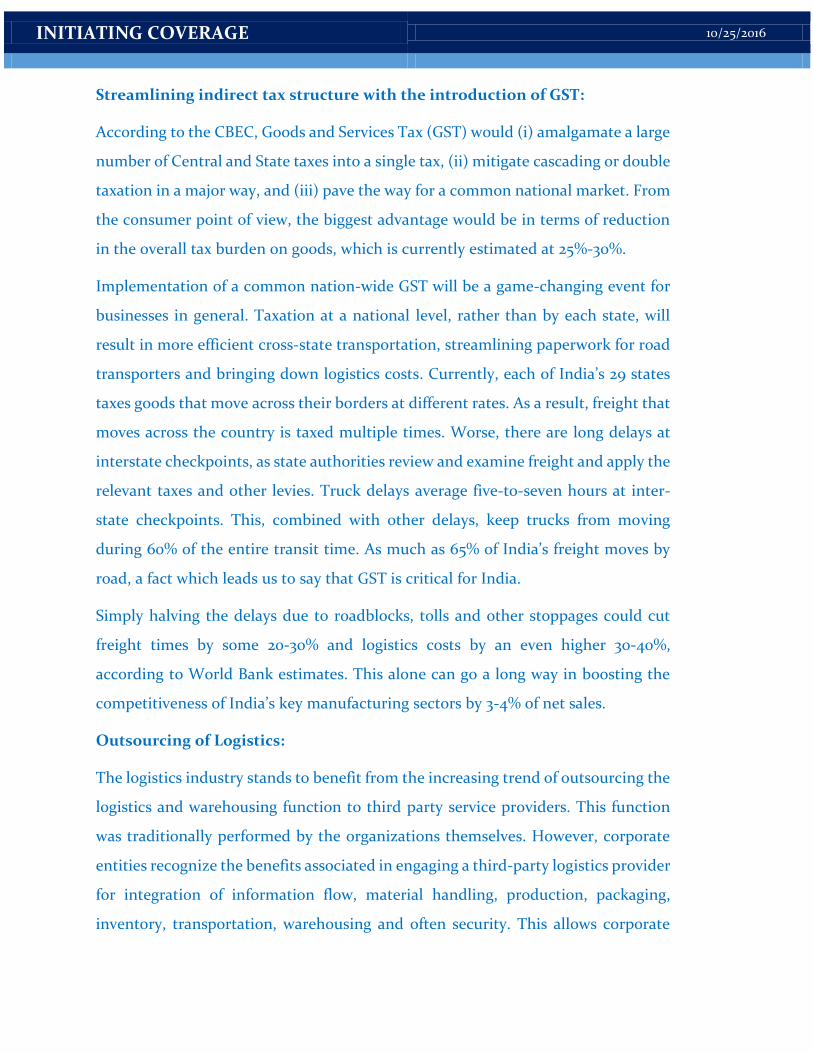
Rapid Industrial growth:
Rapid growth in industries such as automobiles, pharmaceuticals, FMCG and retail
has significantly increased the demand for movement of consumer and capital
goods across the country, from entry ports to manufacturing or distribution
locations or from manufacturers and distributors to consumers and exit ports. The
volume of freight traffic is positively related to the GDP of the country. Therefore,
as the GDP increases, the volume of goods’ movement is expected to increase
through all modes.
Figure: India’s export-import volumes grew at 2x of the GDP growth rate in the last decade
10
1314
2425
2625
21
13
17
20 20
87
8
17
30
35
33
31
26
17
15
19 20
8
65
6 6
89 9 9
8 8 87
5
0
5
10
15
20
25
30
35
40
FY02 FY03 FY04 FY05 FY06 FY07 FY08 FY09 FY10 FY11 FY12 FY13 FY14
Exports (% YoY) Imports (% YoY) GDP (% YoY)
Source: CMIE, Industry
INITIATING COVERAGE 10/25/2016
Streamlining indirect tax structure with the introduction of GST:
According to the CBEC, Goods and Services Tax (GST) would (i) amalgamate a large
number of Central and State taxes into a single tax, (ii) mitigate cascading or double
taxation in a major way, and (iii) pave the way for a common national market. From
the consumer point of view, the biggest advantage would be in terms of reduction
in the overall tax burden on goods, which is currently estimated at 25%-30%.
Implementation of a common nation-wide GST will be a game-changing event for
businesses in general. Taxation at a national level, rather than by each state, will
result in more efficient cross-state transportation, streamlining paperwork for road
transporters and bringing down logistics costs. Currently, each of India’s 29 states
taxes goods that move across their borders at different rates. As a result, freight that
moves across the country is taxed multiple times. Worse, there are long delays at
interstate checkpoints, as state authorities review and examine freight and apply the
relevant taxes and other levies. Truck delays average five-to-seven hours at inter-
state checkpoints. This, combined with other delays, keep trucks from moving
during 60% of the entire transit time. As much as 65% of India’s freight moves by
road, a fact which leads us to say that GST is critical for India.
Simply halving the delays due to roadblocks, tolls and other stoppages could cut
freight times by some 20-30% and logistics costs by an even higher 30-40%,
according to World Bank estimates. This alone can go a long way in boosting the
competitiveness of India’s key manufacturing sectors by 3-4% of net sales.
Outsourcing of Logistics:
The logistics industry stands to benefit from the increasing trend of outsourcing the
logistics and warehousing function to third party service providers. This function
was traditionally performed by the organizations themselves. However, corporate
entities recognize the benefits associated in engaging a third-party logistics provider
for integration of information flow, material handling, production, packaging,
inventory, transportation, warehousing and often security. This allows corporate
INITIATING COVERAGE 10/25/2016
entities to concentrate on their core business and also avail of significant discounts
through outsourcing.
According to ASSOCHAM, around 55 per cent of Indian companies outsourced
logistics services such as supply chain management and warehousing in 2009, as
compared to about 10-15 per cent in 1999. As per the industry estimates, the
increasing trend of outsourcing resulted in the growth of third-party logistics
market at a CAGR of about 22 per cent, during 2012-15.
MANAGEMENT AND CORPORATE GOVERNANCE
Strong and professional management driven by highly experienced
promoters:
Mr. Harpreet Singh Malhotra founded Tiger logistics in 2000 as private limited
company. Mr. Malhotra brings with him rich industry experience/competence,
which has helped Tiger to continuously deliver profitable growth over the years. He
had spearheaded the company from INR 8 Mn turnover in 2000 to more than INR
2500 Mn in 2016 (43% CAGR) that too with consistent profit making in all years. He
is supported by his capable and competent team, especially business heads of each
function/vertical.
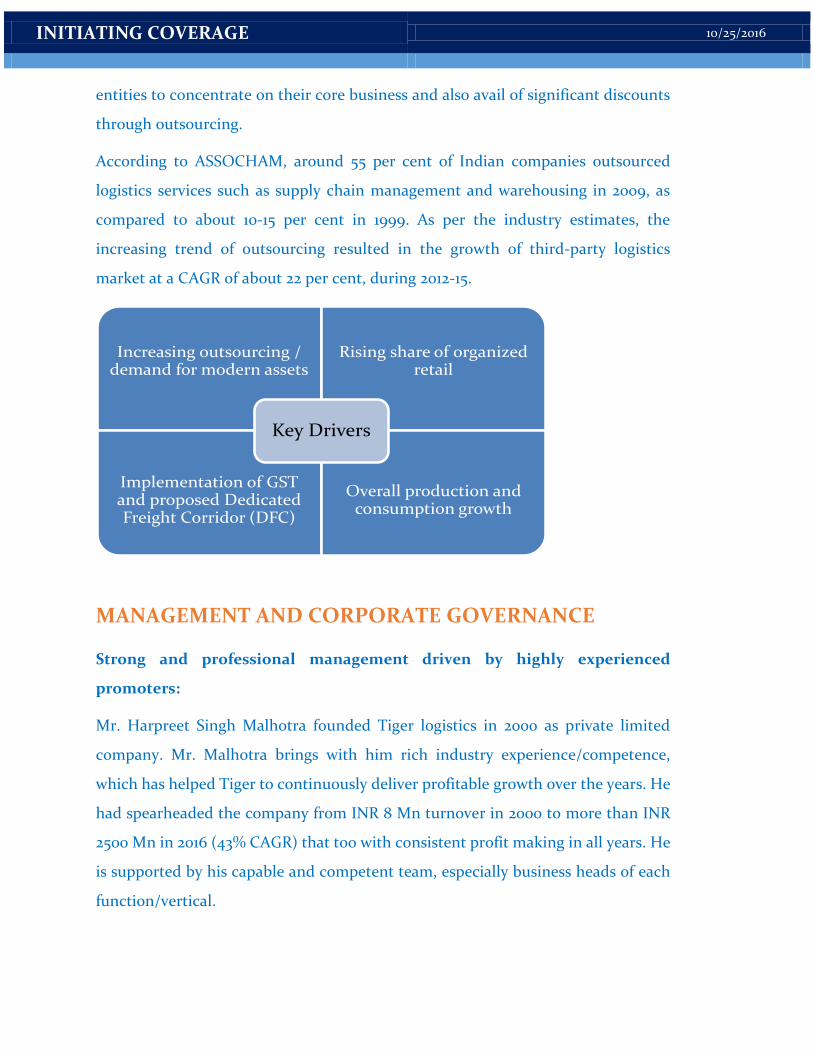
Increasing outsourcing / demand for modern assets
Rising share of organized retail
Implementation of GST and proposed Dedicated Freight Corridor (DFC)
Overall production and consumption growth
Key Drivers
INITIATING COVERAGE 10/25/2016
Tiger’s board consists of six directors, of whom three are independent. We believe
that the competence set and size of the board are appropriate in relation to the
current size of the company and its planned progress.
As Tiger is structured on asset light business model with service centric approach,
promoters and key managerial personnel are essential pillars of the business. Out of
total 300 employees currently, 70% employees have been working with company for
more than 10 years, which exhibits its committed and capable manpower.
ACCOLADES:
Company has won several awards at both national and international level. Some of
them are-
India’s Greatest Brand in the LOGISTICS arena for the year 2015-16.
World’s Greatest Brand, 2015—Asia & GCC in the service category - Logistics
sector
All India Maritime and Logistics Awards (MALA) In 2014
Best Logistics Service Provider of the year 2014
List of awards goes on and on. Indeed, company looks at each of these awards as
higher level of responsibility to create value for its stakeholders.
Group structure raises potential conflict of interest:
Some of the Group Entities i.e. Tiger Softech (India) Pvt. Ltd., Sun Warehousing &
Distribution Pvt. Ltd., Prithvi Shipping Pvt. Ltd. and Raina Transcontinental
Limited have similar business objects. Also, Company does not have any non-
compete agreement /arrangement with any of its group entities. Management is
aware of this situation and trying to address the issue in appropriate manner.
INITIATING COVERAGE 10/25/2016
RISKS/CONCERNS
Competition Risk:
Entry barriers are relatively low in domestic logistics space. Consequently,
industry is fragmented with several small and regional players. Since Tiger is
small player in highly competitive industry, it needs to offer ancillary aids
like longer credit period leading to higher working capital requirements.
Competition is further intensifying with emergence of start-ups in transport
industry with differentiated business models.
Negligible Pricing Power:
High level of competitive intensity in the business means negligible pricing
power of the company. Whatever little pricing power company enjoys, it is
because of its credibility in the eyes of its customers in terms of quality and
timely delivery/services.
Economic Risk:
The volume of freight traffic is positively related to the GDP of the country.
Slowdown in company’s key service sectors may adversely affect demand for
company’s services and consequently the revenue growth. However,
company’s multi industry exposure reduces this risk quite significantly.
INITIATING COVERAGE 10/25/2016
FINANCIAL PERFORMANCE
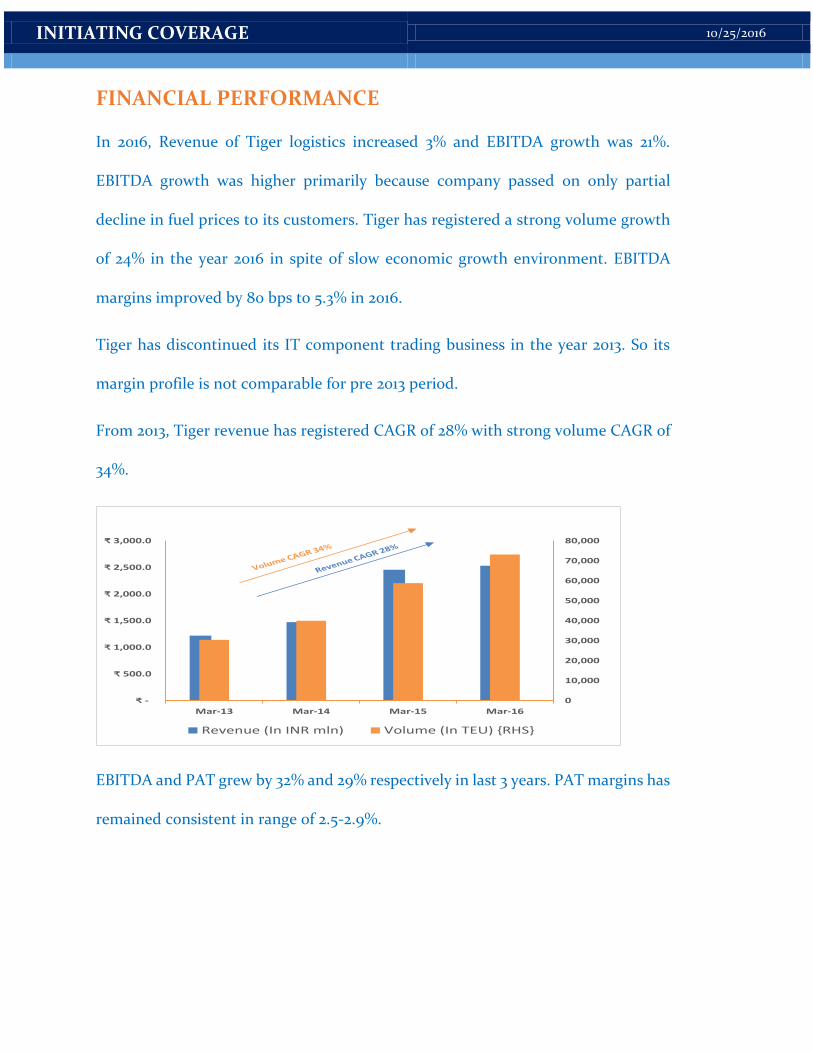
In 2016, Revenue of Tiger logistics increased 3% and EBITDA growth was 21%.
EBITDA growth was higher primarily because company passed on only partial
decline in fuel prices to its customers. Tiger has registered a strong volume growth
of 24% in the year 2016 in spite of slow economic growth environment. EBITDA
margins improved by 80 bps to 5.3% in 2016.
Tiger has discontinued its IT component trading business in the year 2013. So its
margin profile is not comparable for pre 2013 period.
From 2013, Tiger revenue has registered CAGR of 28% with strong volume CAGR of
34%.
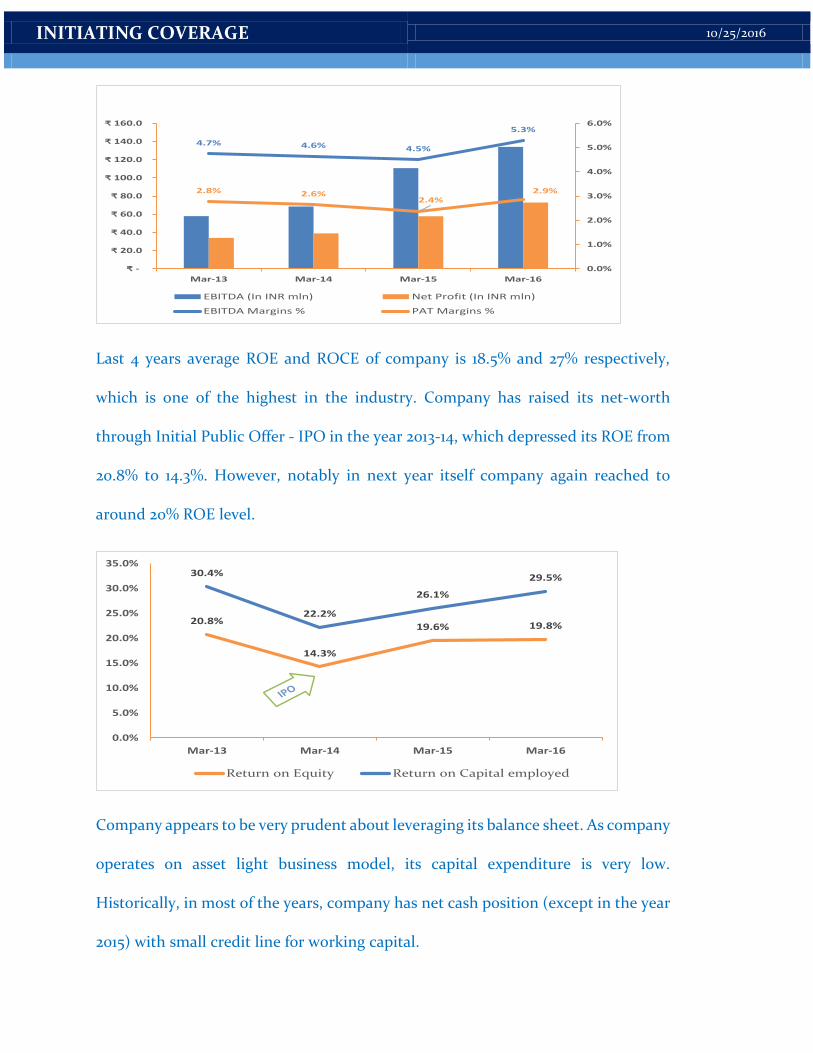
EBITDA and PAT grew by 32% and 29% respectively in last 3 years. PAT margins has
remained consistent in range of 2.5-2.9%.
0
10,000
20,000
30,000
40,000
50,000
60,000
70,000
80,000
₹ -
₹ 500.0
₹ 1,000.0
₹ 1,500.0
₹ 2,000.0
₹ 2,500.0
₹ 3,000.0
Mar-13 Mar-14 Mar-15 Mar-16
Revenue (In INR mln) Volume (In TEU) {RHS}
INITIATING COVERAGE 10/25/2016
Last 4 years average ROE and ROCE of company is 18.5% and 27% respectively,
which is one of the highest in the industry. Company has raised its net-worth
through Initial Public Offer - IPO in the year 2013-14, which depressed its ROE from
20.8% to 14.3%. However, notably in next year itself company again reached to
around 20% ROE level.
Company appears to be very prudent about leveraging its balance sheet. As company
operates on asset light business model, its capital expenditure is very low.
Historically, in most of the years, company has net cash position (except in the year
2015) with small credit line for working capital.
4.7% 4.6% 4.5%
5.3%
2.8% 2.6%2.4%
2.9%
0.0%
1.0%
2.0%
3.0%
4.0%
5.0%
6.0%
₹ -
₹ 20.0
₹ 40.0
₹ 60.0
₹ 80.0
₹ 100.0
₹ 120.0
₹ 140.0
₹ 160.0
Mar-13 Mar-14 Mar-15 Mar-16
EBITDA (In INR mln) Net Profit (In INR mln)
EBITDA Margins % PAT Margins %
20.8%
14.3%
19.6% 19.8%
30.4%
22.2%
26.1%
29.5%
0.0%
5.0%
10.0%
15.0%
20.0%
25.0%
30.0%
35.0%
Mar-13 Mar-14 Mar-15 Mar-16
Return on Equity Return on Capital employed
INITIATING COVERAGE 10/25/2016
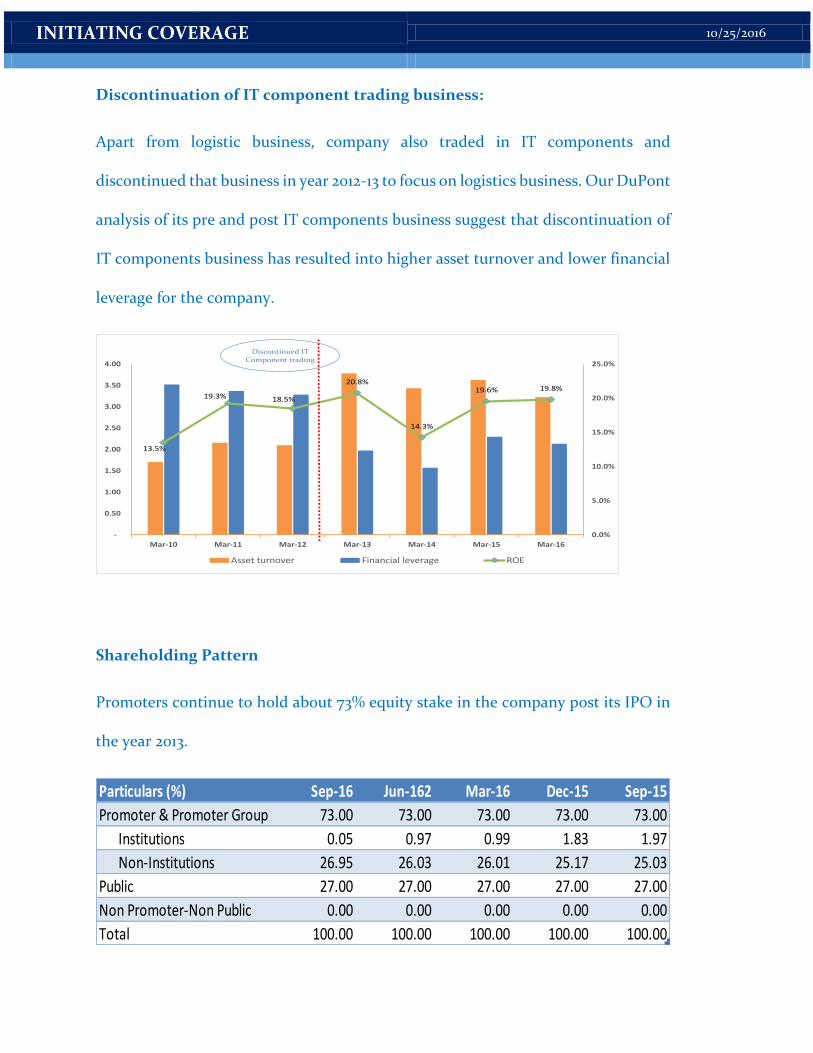
Discontinuation of IT component trading business:
Apart from logistic business, company also traded in IT components and
discontinued that business in year 2012-13 to focus on logistics business. Our DuPont
analysis of its pre and post IT components business suggest that discontinuation of
IT components business has resulted into higher asset turnover and lower financial
leverage for the company.
Shareholding Pattern
Promoters continue to hold about 73% equity stake in the company post its IPO in
the year 2013.
13.5%
19.3% 18.5%
20.8%
14.3%
19.6% 19.8%
0.0%
5.0%
10.0%
15.0%
20.0%
25.0%
-
0.50
1.00
1.50
2.00
2.50
3.00
3.50
4.00
Mar-10 Mar-11 Mar-12 Mar-13 Mar-14 Mar-15 Mar-16
Asset turnover Financial leverage ROE
Discontinued IT Component trading
Particulars (%) Sep-16 Jun-162 Mar-16 Dec-15 Sep-15
Promoter & Promoter Group 73.00 73.00 73.00 73.00 73.00
Institutions 0.05 0.97 0.99 1.83 1.97
Non-Institutions 26.95 26.03 26.01 25.17 25.03
Public 27.00 27.00 27.00 27.00 27.00
Non Promoter-Non Public 0.00 0.00 0.00 0.00 0.00
Total 100.00 100.00 100.00 100.00 100.00
INITIATING COVERAGE 10/25/2016
Increasing receivables in
working capital intensive
industry.
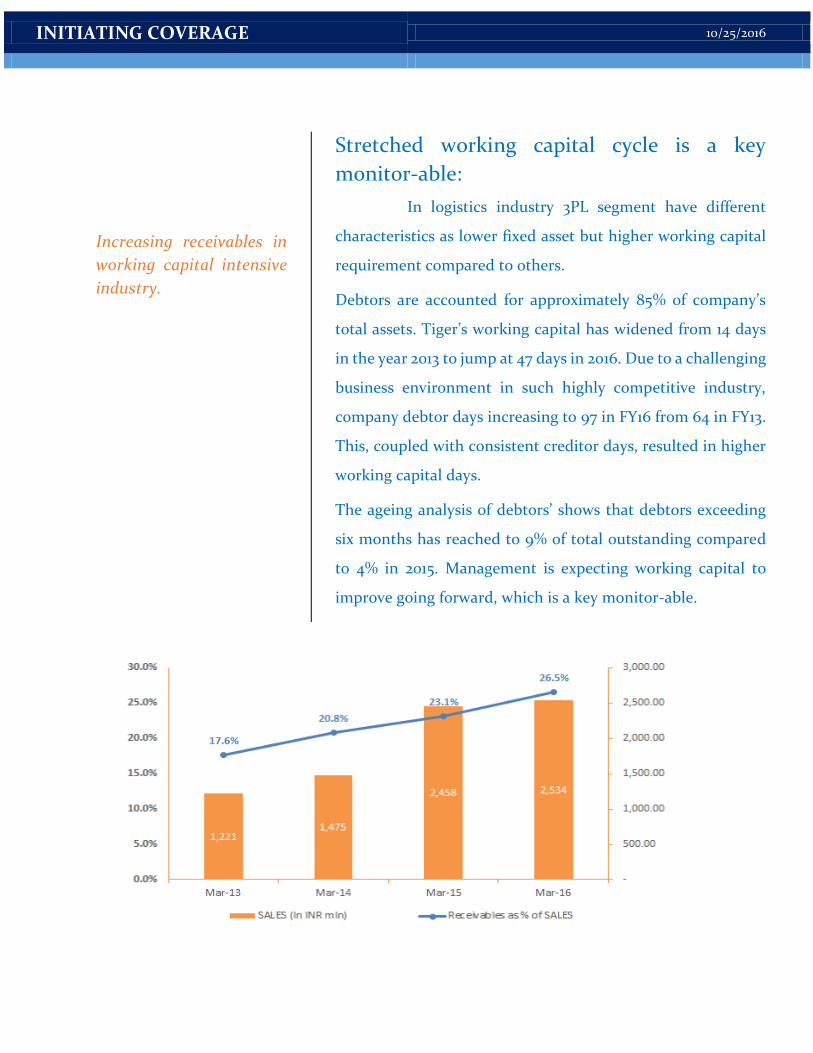
Stretched working capital cycle is a key
monitor-able:
In logistics industry 3PL segment have different
characteristics as lower fixed asset but higher working capital
requirement compared to others.
Debtors are accounted for approximately 85% of company’s
total assets. Tiger’s working capital has widened from 14 days
in the year 2013 to jump at 47 days in 2016. Due to a challenging
business environment in such highly competitive industry,
company debtor days increasing to 97 in FY16 from 64 in FY13.
This, coupled with consistent creditor days, resulted in higher
working capital days.
The ageing analysis of debtors’ shows that debtors exceeding
six months has reached to 9% of total outstanding compared
to 4% in 2015. Management is expecting working capital to
improve going forward, which is a key monitor-able.
INITIATING COVERAGE 10/25/2016
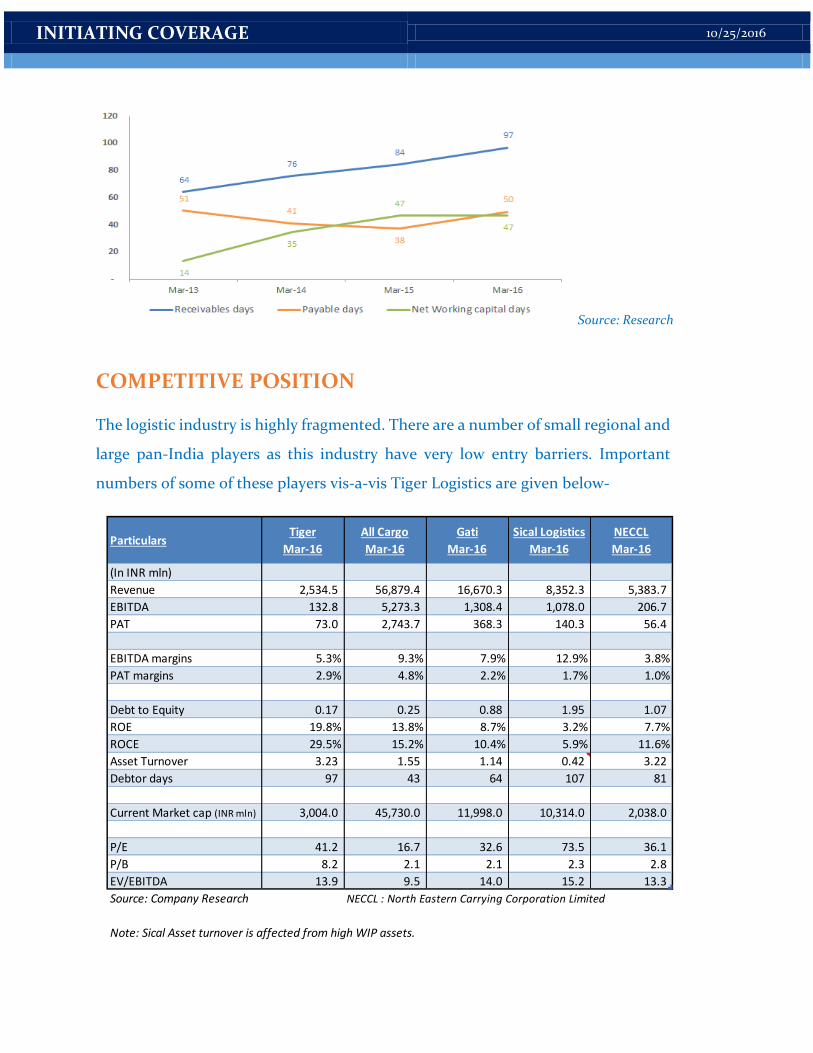
Source: Research
COMPETITIVE POSITION
The logistic industry is highly fragmented. There are a number of small regional and
large pan-India players as this industry have very low entry barriers. Important
numbers of some of these players vis-a-vis Tiger Logistics are given below-
ParticularsTiger
Mar-16
All Cargo
Mar-16
Gati
Mar-16
Sical Logistics
Mar-16
NECCL
Mar-16
(In INR mln)
Revenue 2,534.5 56,879.4 16,670.3 8,352.3 5,383.7
EBITDA 132.8 5,273.3 1,308.4 1,078.0 206.7
PAT 73.0 2,743.7 368.3 140.3 56.4
EBITDA margins 5.3% 9.3% 7.9% 12.9% 3.8%
PAT margins 2.9% 4.8% 2.2% 1.7% 1.0%
Debt to Equity 0.17 0.25 0.88 1.95 1.07
ROE 19.8% 13.8% 8.7% 3.2% 7.7%
ROCE 29.5% 15.2% 10.4% 5.9% 11.6%
Asset Turnover 3.23 1.55 1.14 0.42 3.22
Debtor days 97 43 64 107 81
Current Market cap (INR mln) 3,004.0 45,730.0 11,998.0 10,314.0 2,038.0
P/E 41.2 16.7 32.6 73.5 36.1
P/B 8.2 2.1 2.1 2.3 2.8
EV/EBITDA 13.9 9.5 14.0 15.2 13.3
Source: Company Research NECCL : North Eastern Carrying Corporation Limited
Note: Sical Asset turnover is affected from high WIP assets.
INITIATING COVERAGE 10/25/2016
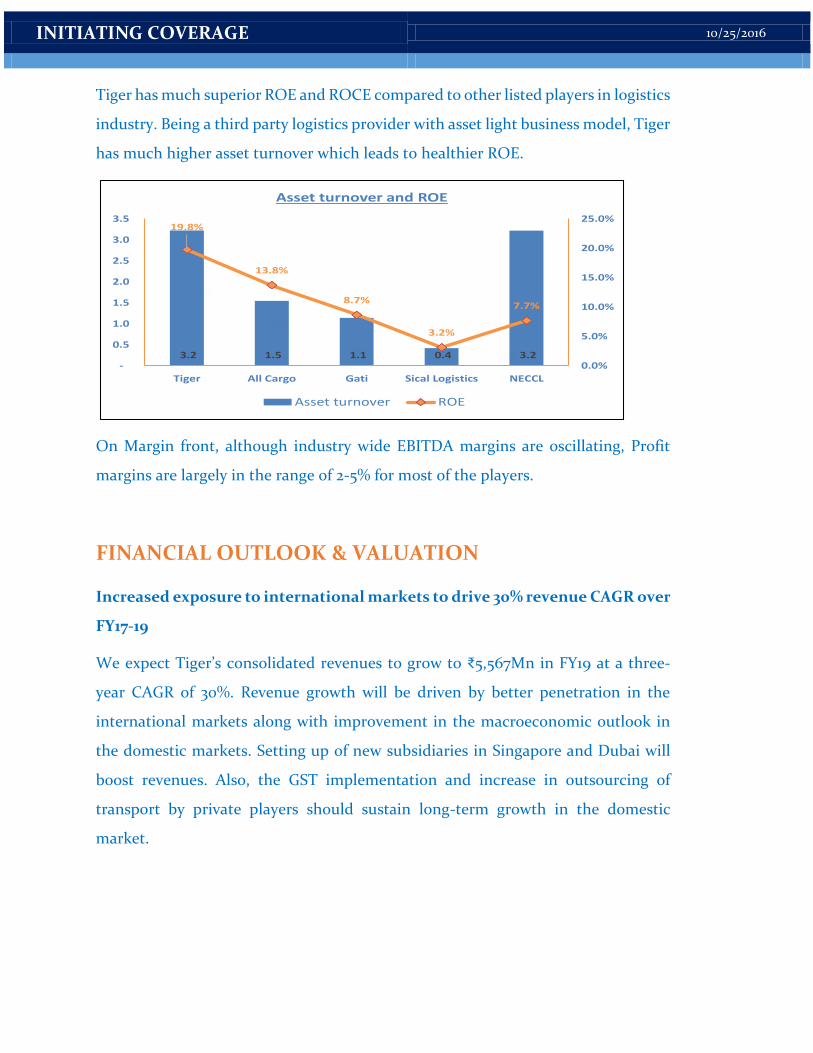
Tiger has much superior ROE and ROCE compared to other listed players in logistics
industry. Being a third party logistics provider with asset light business model, Tiger
has much higher asset turnover which leads to healthier ROE.
On Margin front, although industry wide EBITDA margins are oscillating, Profit
margins are largely in the range of 2-5% for most of the players.
FINANCIAL OUTLOOK & VALUATION
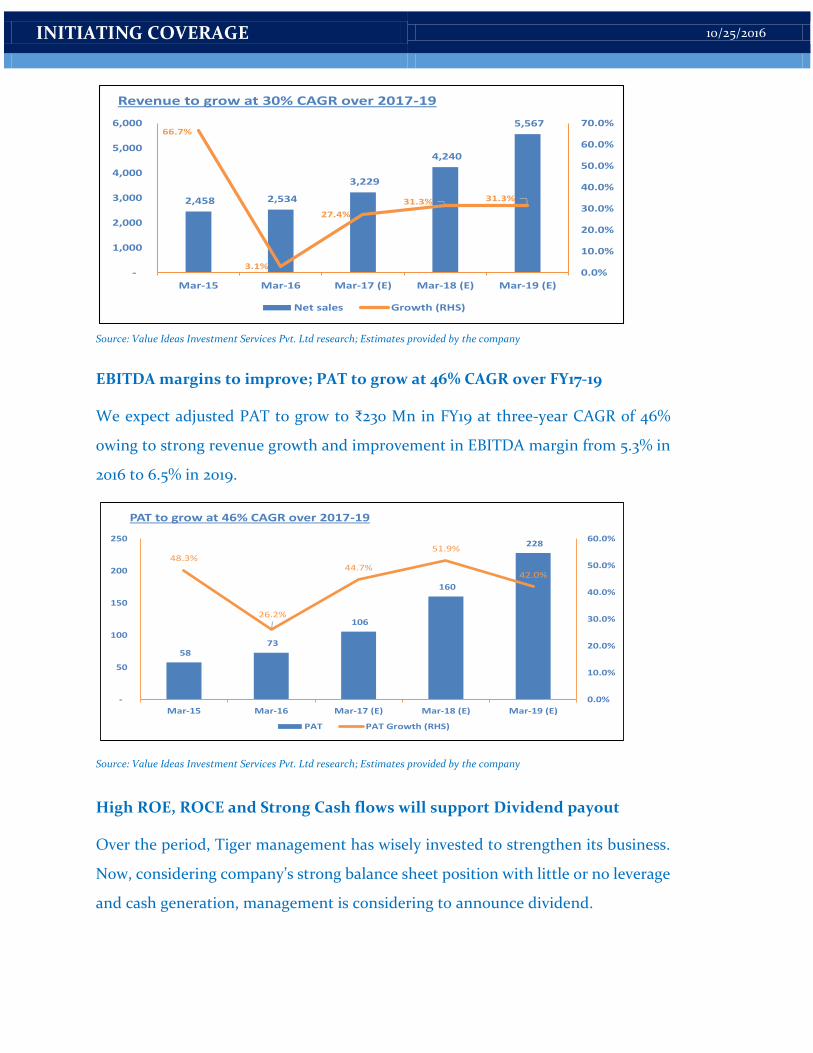
Increased exposure to international markets to drive 30% revenue CAGR over
FY17-19
We expect Tiger’s consolidated revenues to grow to ₹5,567Mn in FY19 at a three-
year CAGR of 30%. Revenue growth will be driven by better penetration in the
international markets along with improvement in the macroeconomic outlook in
the domestic markets. Setting up of new subsidiaries in Singapore and Dubai will
boost revenues. Also, the GST implementation and increase in outsourcing of
transport by private players should sustain long-term growth in the domestic
market.
3.2 1.5 1.1 0.4 3.2
19.8%
13.8%
8.7%
3.2%
7.7%
0.0%
5.0%
10.0%
15.0%
20.0%
25.0%
-
0.5
1.0
1.5
2.0
2.5
3.0
3.5
Tiger All Cargo Gati Sical Logistics NECCL
Asset turnover and ROE
Asset turnover ROE
INITIATING COVERAGE 10/25/2016
Source: Value Ideas Investment Services Pvt. Ltd research; Estimates provided by the company
EBITDA margins to improve; PAT to grow at 46% CAGR over FY17-19
We expect adjusted PAT to grow to ₹230 Mn in FY19 at three-year CAGR of 46%
owing to strong revenue growth and improvement in EBITDA margin from 5.3% in
2016 to 6.5% in 2019.
Source: Value Ideas Investment Services Pvt. Ltd research; Estimates provided by the company
High ROE, ROCE and Strong Cash flows will support Dividend payout
Over the period, Tiger management has wisely invested to strengthen its business.
Now, considering company’s strong balance sheet position with little or no leverage
and cash generation, management is considering to announce dividend.
2,458 2,534
3,229
4,240
5,567
0.0%
10.0%
20.0%
30.0%
40.0%
50.0%
60.0%
70.0%
-
1,000
2,000
3,000
4,000
5,000
6,000
Mar-15 Mar-16 Mar-17 (E) Mar-18 (E) Mar-19 (E)
Revenue to grow at 30% CAGR over 2017-19
Net sales Growth (RHS)
58 73
106
160
228
48.3%
26.2%
44.7%
51.9%
42.0%
0.0%
10.0%
20.0%
30.0%
40.0%
50.0%
60.0%
-
50
100
150
200
250
Mar-15 Mar-16 Mar-17 (E) Mar-18 (E) Mar-19 (E)
PAT to grow at 46% CAGR over 2017-19
PAT PAT Growth (RHS)
INITIATING COVERAGE 10/25/2016
We believe that, while dividend payout can be increased going forward, Tiger’s
shareholders could benefit more by investing in new businesses given the
management's investment track record. Management has also signaled about
Capital expenditure for expansion and capacity addition in domestic business, but
that will be only after achieving its INR 5,000 Mn revenue milestone.
VALUATIONS:
At the current market price (of INR 284) the company is trading at 28x its FY17E
consolidated EPS of INR 10 and 18.7x its FY18E consolidated EPS of INR 15.2.
Company got listed on BSE SME platform in 2013 and migrated to main board in
Feb. 2016. With improving fundamentals, focused management and strong growth
potential, company’s corresponding valuation multiples have drifted upward.
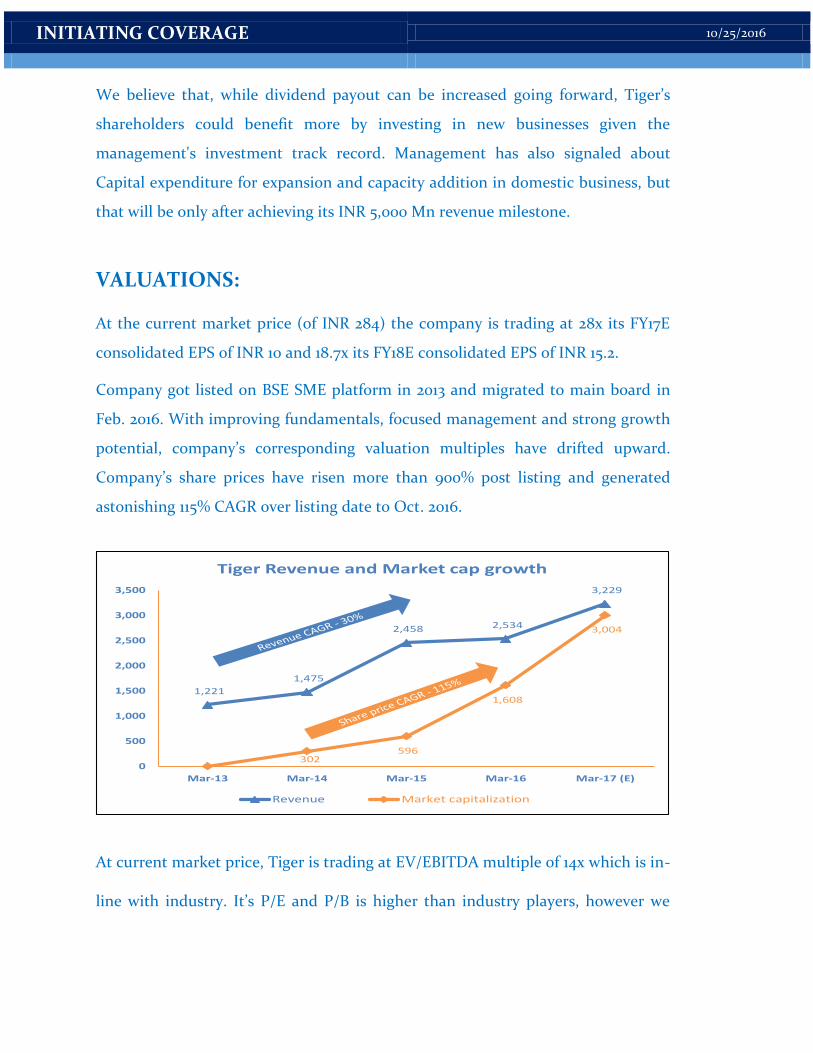
Company’s share prices have risen more than 900% post listing and generated
astonishing 115% CAGR over listing date to Oct. 2016.
At current market price, Tiger is trading at EV/EBITDA multiple of 14x which is in-
line with industry. It’s P/E and P/B is higher than industry players, however we
1,221
1,475
2,458 2,534
3,229
302 596
1,608
3,004
0
500
1,000
1,500
2,000
2,500
3,000
3,500
Mar-13 Mar-14 Mar-15 Mar-16 Mar-17 (E)
Tiger Revenue and Market cap growth
Revenue Market capitalization
INITIATING COVERAGE 10/25/2016
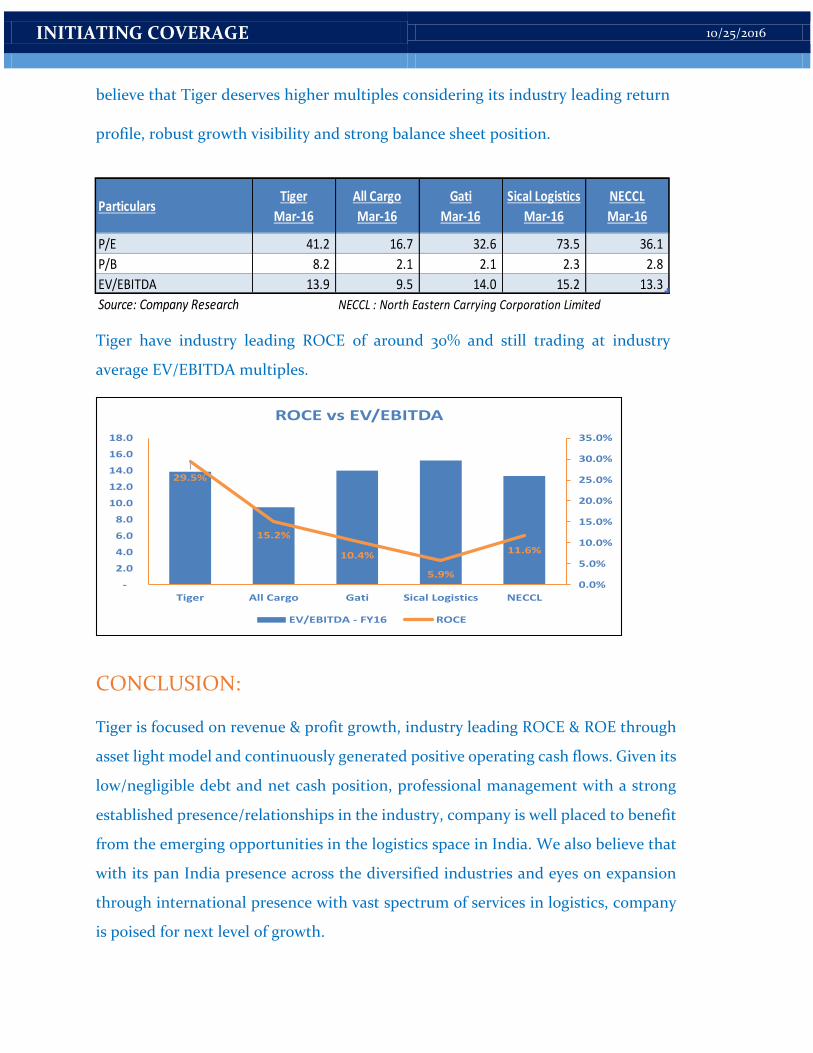
believe that Tiger deserves higher multiples considering its industry leading return
profile, robust growth visibility and strong balance sheet position.
Tiger have industry leading ROCE of around 30% and still trading at industry
average EV/EBITDA multiples.
CONCLUSION:
Tiger is focused on revenue & profit growth, industry leading ROCE & ROE through
asset light model and continuously generated positive operating cash flows. Given its
low/negligible debt and net cash position, professional management with a strong
established presence/relationships in the industry, company is well placed to benefit
from the emerging opportunities in the logistics space in India. We also believe that
with its pan India presence across the diversified industries and eyes on expansion
through international presence with vast spectrum of services in logistics, company
is poised for next level of growth.
ParticularsTiger
Mar-16
All Cargo
Mar-16
Gati
Mar-16
Sical Logistics
Mar-16
NECCL
Mar-16
P/E 41.2 16.7 32.6 73.5 36.1
P/B 8.2 2.1 2.1 2.3 2.8
EV/EBITDA 13.9 9.5 14.0 15.2 13.3
Source: Company Research NECCL : North Eastern Carrying Corporation Limited
29.5%
15.2%
10.4%
5.9%
11.6%
0.0%
5.0%
10.0%
15.0%
20.0%
25.0%
30.0%
35.0%
-
2.0
4.0
6.0
8.0
10.0
12.0
14.0
16.0
18.0
Tiger All Cargo Gati Sical Logistics NECCL
ROCE vs EV/EBITDA
EV/EBITDA - FY16 ROCE
INITIATING COVERAGE 10/25/2016
FINANCIALS
INCOME STATEMENT
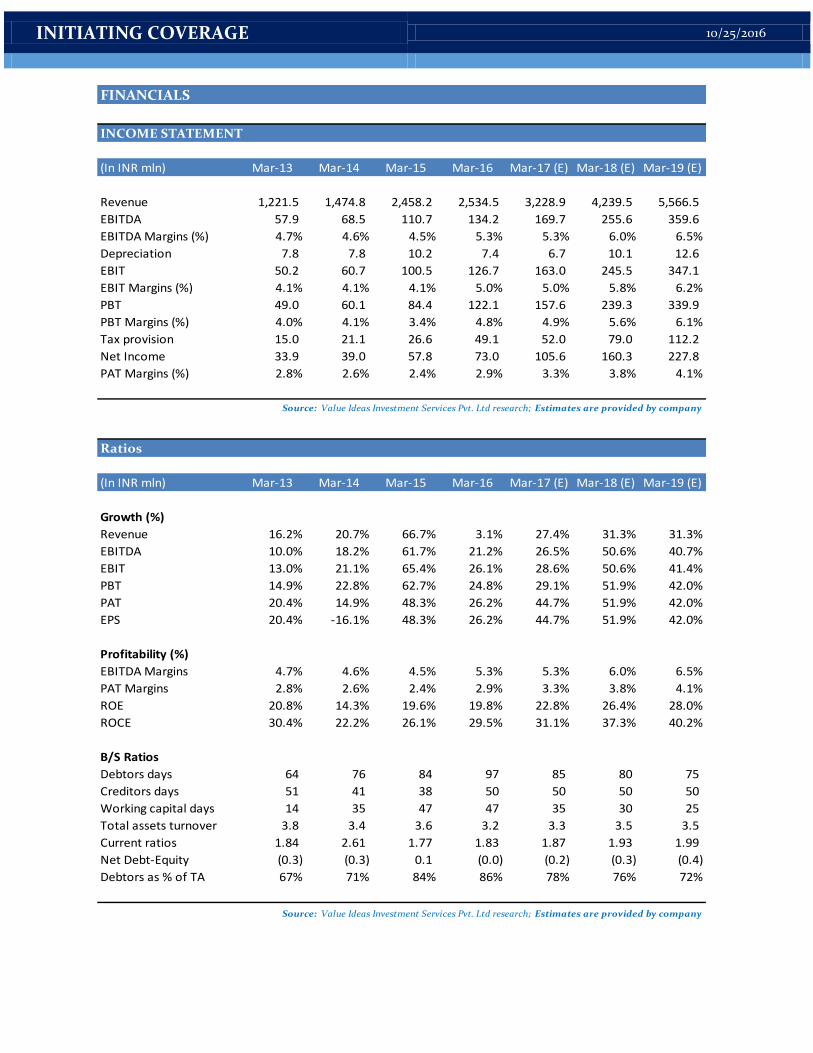
(In INR mln) Mar-13 Mar-14 Mar-15 Mar-16 Mar-17 (E) Mar-18 (E) Mar-19 (E)
Revenue 1,221.5 1,474.8 2,458.2 2,534.5 3,228.9 4,239.5 5,566.5
EBITDA 57.9 68.5 110.7 134.2 169.7 255.6 359.6
EBITDA Margins (%) 4.7% 4.6% 4.5% 5.3% 5.3% 6.0% 6.5%
Depreciation 7.8 7.8 10.2 7.4 6.7 10.1 12.6
EBIT 50.2 60.7 100.5 126.7 163.0 245.5 347.1
EBIT Margins (%) 4.1% 4.1% 4.1% 5.0% 5.0% 5.8% 6.2%
PBT 49.0 60.1 84.4 122.1 157.6 239.3 339.9
PBT Margins (%) 4.0% 4.1% 3.4% 4.8% 4.9% 5.6% 6.1%
Tax provision 15.0 21.1 26.6 49.1 52.0 79.0 112.2
Net Income 33.9 39.0 57.8 73.0 105.6 160.3 227.8
PAT Margins (%) 2.8% 2.6% 2.4% 2.9% 3.3% 3.8% 4.1%
Source: Value Ideas Investment Services Pvt. Ltd research; Estimates are provided by company
Ratios
(In INR mln) Mar-13 Mar-14 Mar-15 Mar-16 Mar-17 (E) Mar-18 (E) Mar-19 (E)
Growth (%)
Revenue 16.2% 20.7% 66.7% 3.1% 27.4% 31.3% 31.3%
EBITDA 10.0% 18.2% 61.7% 21.2% 26.5% 50.6% 40.7%
EBIT 13.0% 21.1% 65.4% 26.1% 28.6% 50.6% 41.4%
PBT 14.9% 22.8% 62.7% 24.8% 29.1% 51.9% 42.0%
PAT 20.4% 14.9% 48.3% 26.2% 44.7% 51.9% 42.0%
EPS 20.4% -16.1% 48.3% 26.2% 44.7% 51.9% 42.0%
Profitability (%)
EBITDA Margins 4.7% 4.6% 4.5% 5.3% 5.3% 6.0% 6.5%
PAT Margins 2.8% 2.6% 2.4% 2.9% 3.3% 3.8% 4.1%
ROE 20.8% 14.3% 19.6% 19.8% 22.8% 26.4% 28.0%
ROCE 30.4% 22.2% 26.1% 29.5% 31.1% 37.3% 40.2%
B/S Ratios
Debtors days 64 76 84 97 85 80 75
Creditors days 51 41 38 50 50 50 50
Working capital days 14 35 47 47 35 30 25
Total assets turnover 3.8 3.4 3.6 3.2 3.3 3.5 3.5
Current ratios 1.84 2.61 1.77 1.83 1.87 1.93 1.99
Net Debt-Equity (0.3) (0.3) 0.1 (0.0) (0.2) (0.3) (0.4)
Debtors as % of TA 67% 71% 84% 86% 78% 76% 72%
Source: Value Ideas Investment Services Pvt. Ltd research; Estimates are provided by company
INITIATING COVERAGE 10/25/2016
BALANCE SHEET
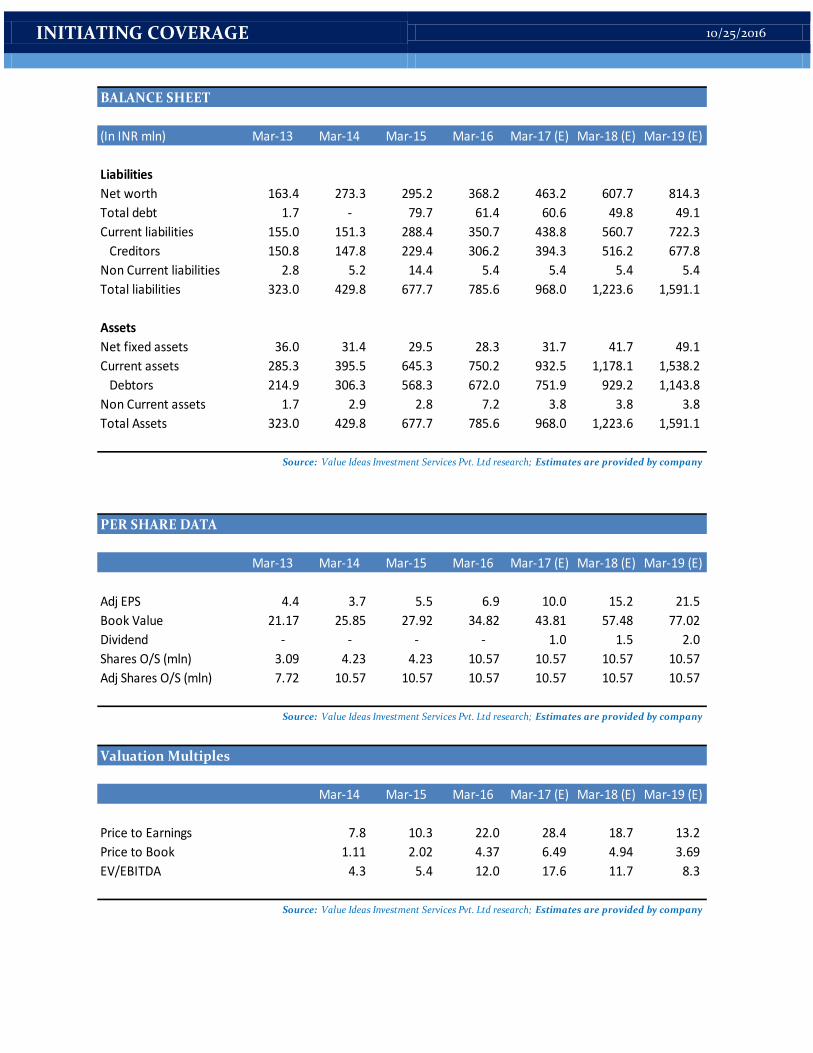
(In INR mln) Mar-13 Mar-14 Mar-15 Mar-16 Mar-17 (E) Mar-18 (E) Mar-19 (E)
Liabilities
Net worth 163.4 273.3 295.2 368.2 463.2 607.7 814.3
Total debt 1.7 - 79.7 61.4 60.6 49.8 49.1
Current liabilities 155.0 151.3 288.4 350.7 438.8 560.7 722.3
Creditors 150.8 147.8 229.4 306.2 394.3 516.2 677.8
Non Current liabilities 2.8 5.2 14.4 5.4 5.4 5.4 5.4
Total liabilities 323.0 429.8 677.7 785.6 968.0 1,223.6 1,591.1
Assets
Net fixed assets 36.0 31.4 29.5 28.3 31.7 41.7 49.1
Current assets 285.3 395.5 645.3 750.2 932.5 1,178.1 1,538.2
Debtors 214.9 306.3 568.3 672.0 751.9 929.2 1,143.8
Non Current assets 1.7 2.9 2.8 7.2 3.8 3.8 3.8
Total Assets 323.0 429.8 677.7 785.6 968.0 1,223.6 1,591.1
Source: Value Ideas Investment Services Pvt. Ltd research; Estimates are provided by company
PER SHARE DATA
Mar-13 Mar-14 Mar-15 Mar-16 Mar-17 (E) Mar-18 (E) Mar-19 (E)
Adj EPS 4.4 3.7 5.5 6.9 10.0 15.2 21.5
Book Value 21.17 25.85 27.92 34.82 43.81 57.48 77.02
Dividend - - - - 1.0 1.5 2.0
Shares O/S (mln) 3.09 4.23 4.23 10.57 10.57 10.57 10.57
Adj Shares O/S (mln) 7.72 10.57 10.57 10.57 10.57 10.57 10.57
Source: Value Ideas Investment Services Pvt. Ltd research; Estimates are provided by company
Valuation Multiples
Mar-14 Mar-15 Mar-16 Mar-17 (E) Mar-18 (E) Mar-19 (E)
Price to Earnings 7.8 10.3 22.0 28.4 18.7 13.2
Price to Book 1.11 2.02 4.37 6.49 4.94 3.69
EV/EBITDA 4.3 5.4 12.0 17.6 11.7 8.3
Source: Value Ideas Investment Services Pvt. Ltd research; Estimates are provided by company
INITIATING COVERAGE 10/25/2016
Abbreviations :
CAGR Compound Annual Growth Rate
CHA Custom House Agent
EBITDA Earnings Before Interest, Tax, Depreciation And Amortization
EPS Earnings Per Share
EV Enterprise Value
IPO Initial Public Offer
P/B Price To Book
P/E Price To Earnings
PAT Profit After Tax
ROCE Return On Capital Employed
ROE Return On Equity
3PL Third Party Logistics
INITIATING COVERAGE 10/25/2016
About us
SME Value Advisors (An offshoot of Value Ideas Investment Services Pvt. Ltd.) is a firm focused on partnering
with Emerging Corporates/SMEs helping them become better and more valuable by connecting right dots. Our research arm “Research and Analytics” is an independent research house with strong domain
knowledge on Indian economy, companies, industries and capital markets. With dedicated experienced team
of Research Analysts, we have been supporting Investment Bankers, Funds and Corporates on their research
requirements – Company Research, Industry Research, Valuations etc. Independent Equity Research (IER)
reports on SME companies is our initiative to help SMEs leverage their Stock Exchange listing to create value
for their stake holders. Analyst Disclosure
Team at Value Ideas Investment Services hereby affirms that there exists no conflict of interest that can bias the analysis in this report. As on date of this report, our team members involved in preparation of this report don’t possess any shares of this company (Tiger Logistics Ltd.). However, they reserve the right to buy/sell shares of this company in the secondary market. Disclaimer
This Independent Equity Research Report (SME IER Report) has been prepared by ‘Research and Analytics’ Division of Value Ideas Investment Services Pvt. Ltd. and is paid for by the Company itself (Tiger Logistics Ltd.). This Report is based on data publicly available, from sources considered reliable and also inputs from company management (together Data). We have relied upon and assumed, without any independent verification, the accuracy and completeness of all information provided by the company and third party database. This document also contains certain assumptions and forecasts, which the company considers reasonable at this time and which are subject to change. Value Ideas Investment Services Pvt. Ltd. does not guarantee the accuracy, adequacy or completeness of this Report and is not responsible for any errors or omissions or for the results obtained from the use of this Report.
Recipients should not construe any of the contents within this document as advice relating to business, financial, legal, taxation and/or investment matters and are advised to consult their own business, financial, legal, taxation and other advisors. This document is for information purpose only and does not constitute an invitation to subscribe for and/or purchase equity shares or other assets or securities of the Company and the information contained herein shall not form the basis of any contract. Value Ideas Investment Services Pvt. Ltd. especially states that, it has no financial liability whatsoever, to the subscribers / users of this Report.
This document is meant for the benefit and internal use of the recipient and does not carry any right of reproduction. Neither this document nor any of its contents maybe used for any purpose without the prior written approval of the company itself (Tiger Logistics Ltd.). Contact Details
Analytical contact Pramod Dangi, Vice President and Head Research - [email protected]
INITIATING COVERAGE 10/25/2016
Jinesh Mutha, Research Analyst - [email protected] Investor contact Garima Seth, Vice President [email protected] Business Development contact Manish Bansal, Director [email protected]
A glimpse of our capabilities
Value Ideas Investment Services Pvt. Ltd. Bajaj Bhavan, 111, 11th Floor Nariman Point Mumbai - 400 021, INDIA Contact persons – General Queries: Ms. Sheetal Shah; +91 9821464604 [email protected]