Embed Size (px)
Citation preview
LEGAL NOTICE
By accepting this report, you agree to hold all material, comments, opinions, and educational material contained herein confidential, not be distributed, reproduced or discussed by any means to anyone or on any website. You also agree to abide by all intellectual property rights where applicable, including but not limited to copyright and trade secret laws (below).
If you have received this report from someone or some source without being a paid subscriber, you may be eligible for a cash award if your assistance helps us win a damage award in connec-tion with individuals who have violated our copyright and/or trade secret rights. Please contact us at [email protected] or [email protected] if you have received this report without having paid for it.
Restrictions Against Reproduction: No part of this publication may be reproduced, stored in a retrieval system, or transmitted in any form or by any means, electronic, mechanical, photocopying, recording, scanning, or otherwise, except as permitted under Section 107 or 108 of the 1976 United States Copy-right Act, without the prior written permission of the copyright owner and the Publisher. Copyright © 2015, AVA Investment Analytics.
Restrictions Against Redistribution: This material has been officially declared as trade secret, and is used as a part of the investment research and trading algorithms offered by AVA Investment Research. No part of this publication and any conclusions made may be discussed or distributed according to federal trade secret laws as given by 18 U.S.C. § 1839. Copyright © 2015, AVA Investment Analytics.
Investing involves substantial risk. The authors, editors, publisher, nor any of their respective affiliates make any guarantees or other promise as to any results that may be obtained from using the newsletter or from any content contained from the associated website www.avaresearch.com. While historical infor-mation may be used as a tool to assist in the examination of the risk and merit of an investment, past performance should not be considered representative of future performance. No subscriber or any other reader of the publications released by AVA Investment Research either by email or that contained from the associated website www.avaresearch.com should make any investment decision without first consult-ing his or her personal financial advisor and performing his or her own research and due diligence, includ-ing carefully examining the prospectus and all other public filings of the issuer.
WE DO NOT WARRANT THE ACCURACY, COMPLETENESS, CURRENTNESS, MERCHANTABILITY, OR FITNESS FOR A PARTICULAR
PURPOSE OF THE INFORMATION AVAILABLE THROUGH THIS NEWSLETTER SERVICE.
V O L U M E 2
I N S I D E T H I S I S S U E :
D O L L A R - E U R O 3 8
O I L
M A R C H 1 , 2 0 1 5
Copyright © 2015. AVA Investment Analytics
Copyright © 2015. All Rights Reserved. AVA Investment Analytics. www.avaresearch.com
G O L D 3 0
C O M M O D I T I E S
S I L V E R 3 5
D O L L A R - Y E N 3 9
D O L L A R - F R A N C 4 0
N A T U R A L G A S
D O L L A R - R E A L 4 1
F O R E I G N C U R R E N C I E S
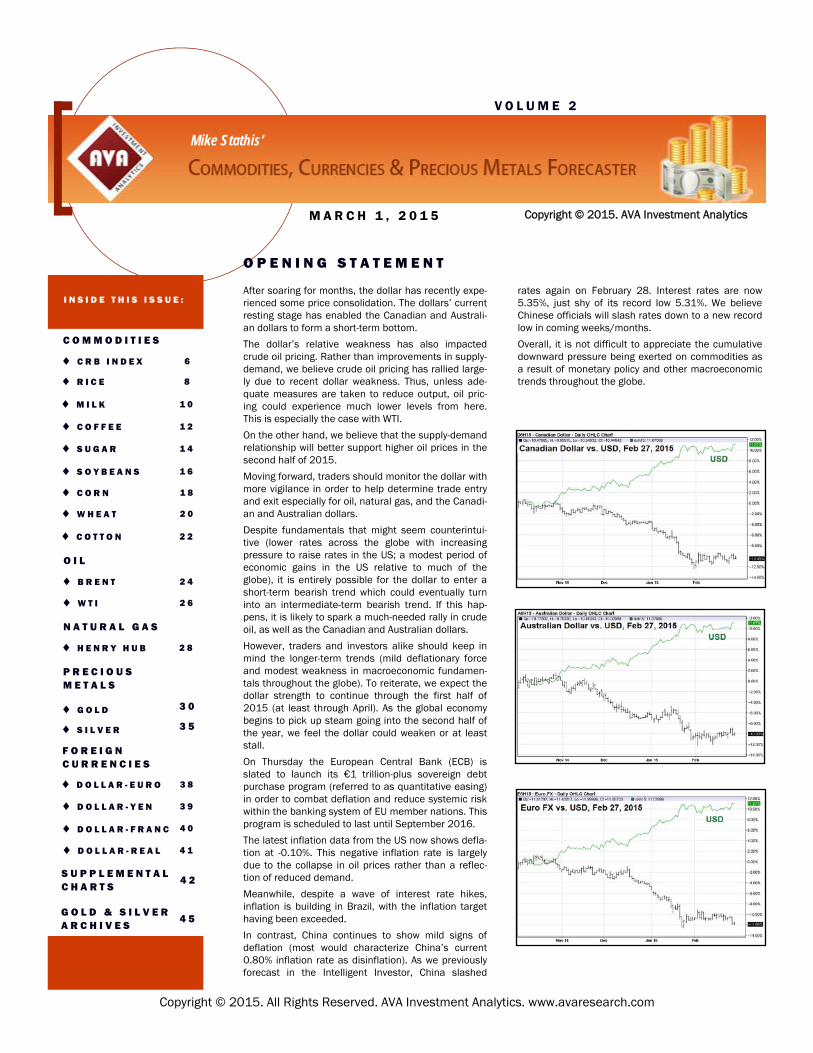
After soaring for months, the dollar has recently expe-rienced some price consolidation. The dollars’ current resting stage has enabled the Canadian and Australi-an dollars to form a short-term bottom.
The dollar’s relative weakness has also impacted crude oil pricing. Rather than improvements in supply-demand, we believe crude oil pricing has rallied large-ly due to recent dollar weakness. Thus, unless ade-quate measures are taken to reduce output, oil pric-ing could experience much lower levels from here. This is especially the case with WTI.
On the other hand, we believe that the supply-demand relationship will better support higher oil prices in the second half of 2015.
Moving forward, traders should monitor the dollar with more vigilance in order to help determine trade entry and exit especially for oil, natural gas, and the Canadi-an and Australian dollars.
Despite fundamentals that might seem counterintui-tive (lower rates across the globe with increasing pressure to raise rates in the US; a modest period of economic gains in the US relative to much of the globe), it is entirely possible for the dollar to enter a short-term bearish trend which could eventually turn into an intermediate-term bearish trend. If this hap-pens, it is likely to spark a much-needed rally in crude oil, as well as the Canadian and Australian dollars.
However, traders and investors alike should keep in mind the longer-term trends (mild deflationary force and modest weakness in macroeconomic fundamen-tals throughout the globe). To reiterate, we expect the dollar strength to continue through the first half of 2015 (at least through April). As the global economy begins to pick up steam going into the second half of the year, we feel the dollar could weaken or at least stall.
On Thursday the European Central Bank (ECB) is slated to launch its €1 trillion-plus sovereign debt purchase program (referred to as quantitative easing) in order to combat deflation and reduce systemic risk within the banking system of EU member nations. This program is scheduled to last until September 2016.
The latest inflation data from the US now shows defla-tion at -0.10%. This negative inflation rate is largely due to the collapse in oil prices rather than a reflec-tion of reduced demand.
Meanwhile, despite a wave of interest rate hikes, inflation is building in Brazil, with the inflation target having been exceeded.
In contrast, China continues to show mild signs of deflation (most would characterize China’s current 0.80% inflation rate as disinflation). As we previously forecast in the Intelligent Investor, China slashed
rates again on February 28. Interest rates are now 5.35%, just shy of its record low 5.31%. We believe Chinese officials will slash rates down to a new record low in coming weeks/months.
Overall, it is not difficult to appreciate the cumulative downward pressure being exerted on commodities as a result of monetary policy and other macroeconomic trends throughout the globe.
O P E N I N G S T A T E M E N T
R I C E 8
M I L K 1 0
C O F F E E 1 2
S U G A R 1 4
S O Y B E A N S 1 6
C O R N 1 8
W H E A T 2 0
C O T T O N 2 2
P R E C I O U S M E T A L S
C R B I N D E X 6
B R E N T 2 4
W T I 2 6
H E N R Y H U B 2 8
G O L D & S I L V E R A R C H I V E S
4 5
S U P P L E M E N T A L C H A R T S
4 2
Mike Stathis’
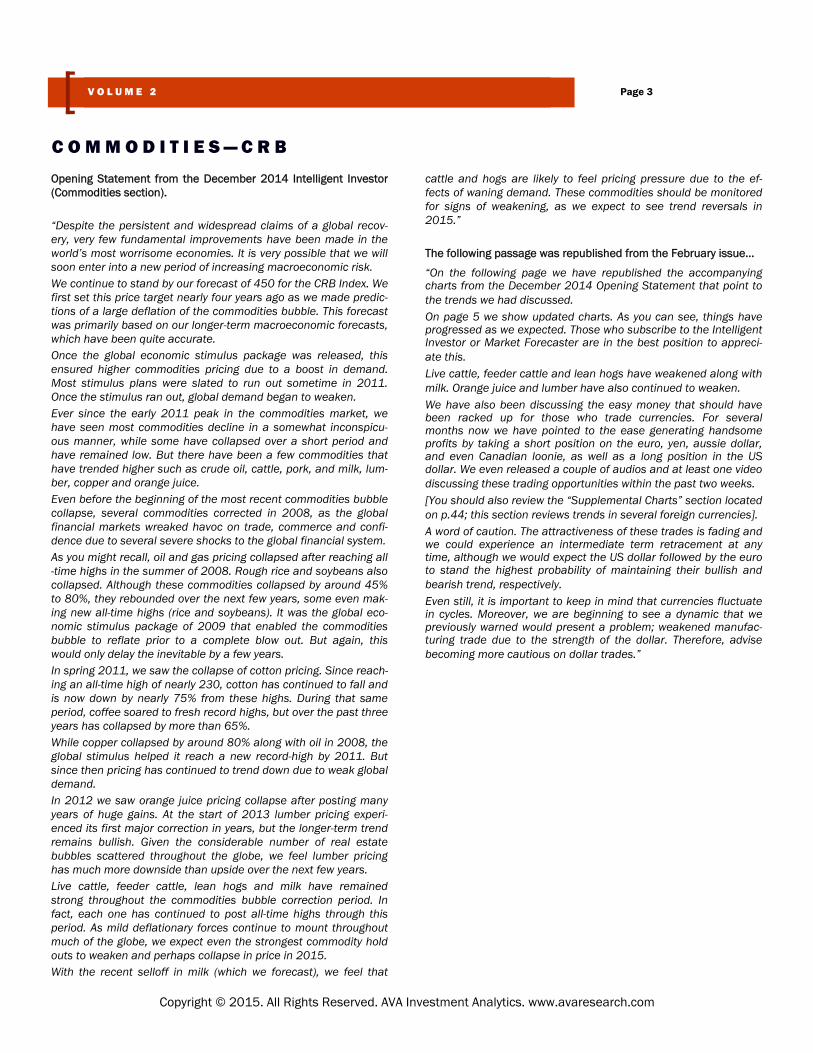
Opening Statement from the December 2014 Intelligent Investor (Commodities section). “Despite the persistent and widespread claims of a global recov-ery, very few fundamental improvements have been made in the world’s most worrisome economies. It is very possible that we will soon enter into a new period of increasing macroeconomic risk. We continue to stand by our forecast of 450 for the CRB Index. We first set this price target nearly four years ago as we made predic-tions of a large deflation of the commodities bubble. This forecast was primarily based on our longer-term macroeconomic forecasts, which have been quite accurate. Once the global economic stimulus package was released, this ensured higher commodities pricing due to a boost in demand. Most stimulus plans were slated to run out sometime in 2011. Once the stimulus ran out, global demand began to weaken. Ever since the early 2011 peak in the commodities market, we have seen most commodities decline in a somewhat inconspicu-ous manner, while some have collapsed over a short period and have remained low. But there have been a few commodities that have trended higher such as crude oil, cattle, pork, and milk, lum-ber, copper and orange juice. Even before the beginning of the most recent commodities bubble collapse, several commodities corrected in 2008, as the global financial markets wreaked havoc on trade, commerce and confi-dence due to several severe shocks to the global financial system. As you might recall, oil and gas pricing collapsed after reaching all-time highs in the summer of 2008. Rough rice and soybeans also collapsed. Although these commodities collapsed by around 45% to 80%, they rebounded over the next few years, some even mak-ing new all-time highs (rice and soybeans). It was the global eco-nomic stimulus package of 2009 that enabled the commodities bubble to reflate prior to a complete blow out. But again, this would only delay the inevitable by a few years. In spring 2011, we saw the collapse of cotton pricing. Since reach-ing an all-time high of nearly 230, cotton has continued to fall and is now down by nearly 75% from these highs. During that same period, coffee soared to fresh record highs, but over the past three years has collapsed by more than 65%. While copper collapsed by around 80% along with oil in 2008, the global stimulus helped it reach a new record-high by 2011. But since then pricing has continued to trend down due to weak global demand. In 2012 we saw orange juice pricing collapse after posting many years of huge gains. At the start of 2013 lumber pricing experi-enced its first major correction in years, but the longer-term trend remains bullish. Given the considerable number of real estate bubbles scattered throughout the globe, we feel lumber pricing has much more downside than upside over the next few years. Live cattle, feeder cattle, lean hogs and milk have remained strong throughout the commodities bubble correction period. In fact, each one has continued to post all-time highs through this period. As mild deflationary forces continue to mount throughout much of the globe, we expect even the strongest commodity hold outs to weaken and perhaps collapse in price in 2015. With the recent selloff in milk (which we forecast), we feel that
C O M M O D I T I E S — C R B
Page 3 V O L U M E 2
Copyright © 2015. All Rights Reserved. AVA Investment Analytics. www.avaresearch.com
cattle and hogs are likely to feel pricing pressure due to the ef-fects of waning demand. These commodities should be monitored for signs of weakening, as we expect to see trend reversals in 2015.” The following passage was republished from the February issue…
“On the following page we have republished the accompanying charts from the December 2014 Opening Statement that point to the trends we had discussed. On page 5 we show updated charts. As you can see, things have progressed as we expected. Those who subscribe to the Intelligent Investor or Market Forecaster are in the best position to appreci-ate this. Live cattle, feeder cattle and lean hogs have weakened along with milk. Orange juice and lumber have also continued to weaken. We have also been discussing the easy money that should have been racked up for those who trade currencies. For several months now we have pointed to the ease generating handsome profits by taking a short position on the euro, yen, aussie dollar, and even Canadian loonie, as well as a long position in the US dollar. We even released a couple of audios and at least one video discussing these trading opportunities within the past two weeks. [You should also review the “Supplemental Charts” section located on p.44; this section reviews trends in several foreign currencies]. A word of caution. The attractiveness of these trades is fading and we could experience an intermediate term retracement at any time, although we would expect the US dollar followed by the euro to stand the highest probability of maintaining their bullish and bearish trend, respectively. Even still, it is important to keep in mind that currencies fluctuate in cycles. Moreover, we are beginning to see a dynamic that we previously warned would present a problem; weakened manufac-turing trade due to the strength of the dollar. Therefore, advise becoming more cautious on dollar trades.”
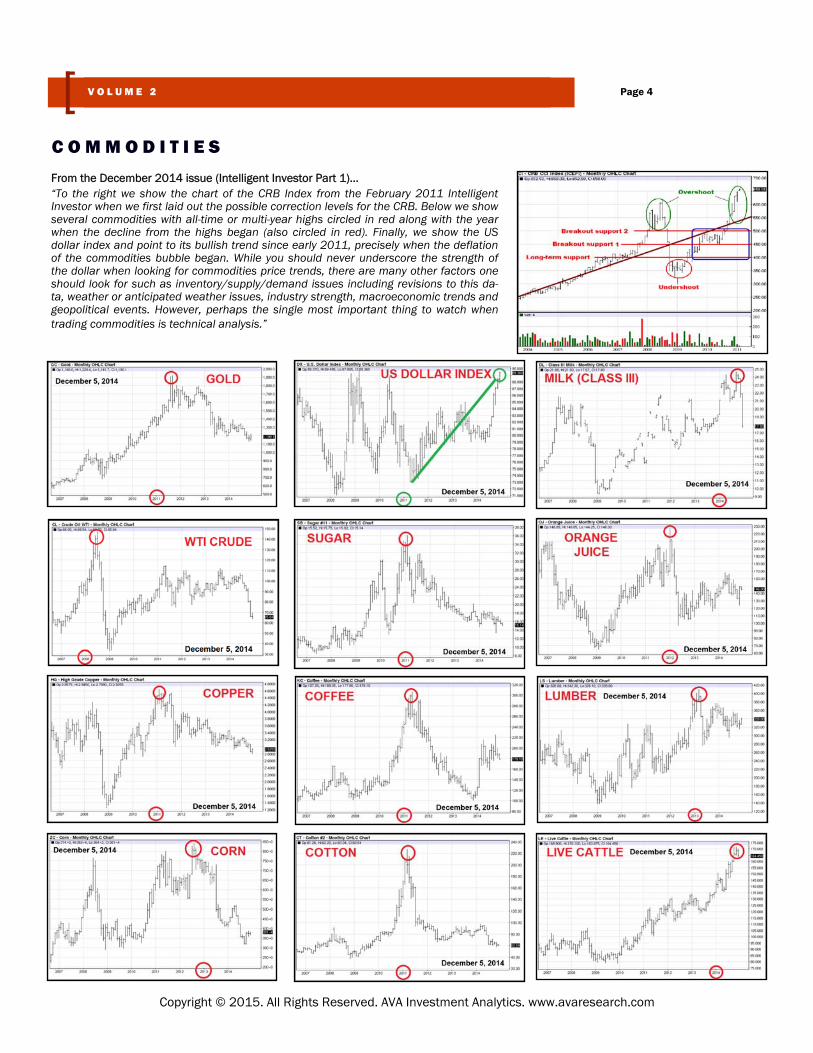
From the December 2014 issue (Intelligent Investor Part 1)… “To the right we show the chart of the CRB Index from the February 2011 Intelligent Investor when we first laid out the possible correction levels for the CRB. Below we show several commodities with all-time or multi-year highs circled in red along with the year when the decline from the highs began (also circled in red). Finally, we show the US dollar index and point to its bullish trend since early 2011, precisely when the deflation of the commodities bubble began. While you should never underscore the strength of the dollar when looking for commodities price trends, there are many other factors one should look for such as inventory/supply/demand issues including revisions to this da-ta, weather or anticipated weather issues, industry strength, macroeconomic trends and geopolitical events. However, perhaps the single most important thing to watch when trading commodities is technical analysis.”
C O M M O D I T I E S
Page 4 V O L U M E 2
Copyright © 2015. All Rights Reserved. AVA Investment Analytics. www.avaresearch.com
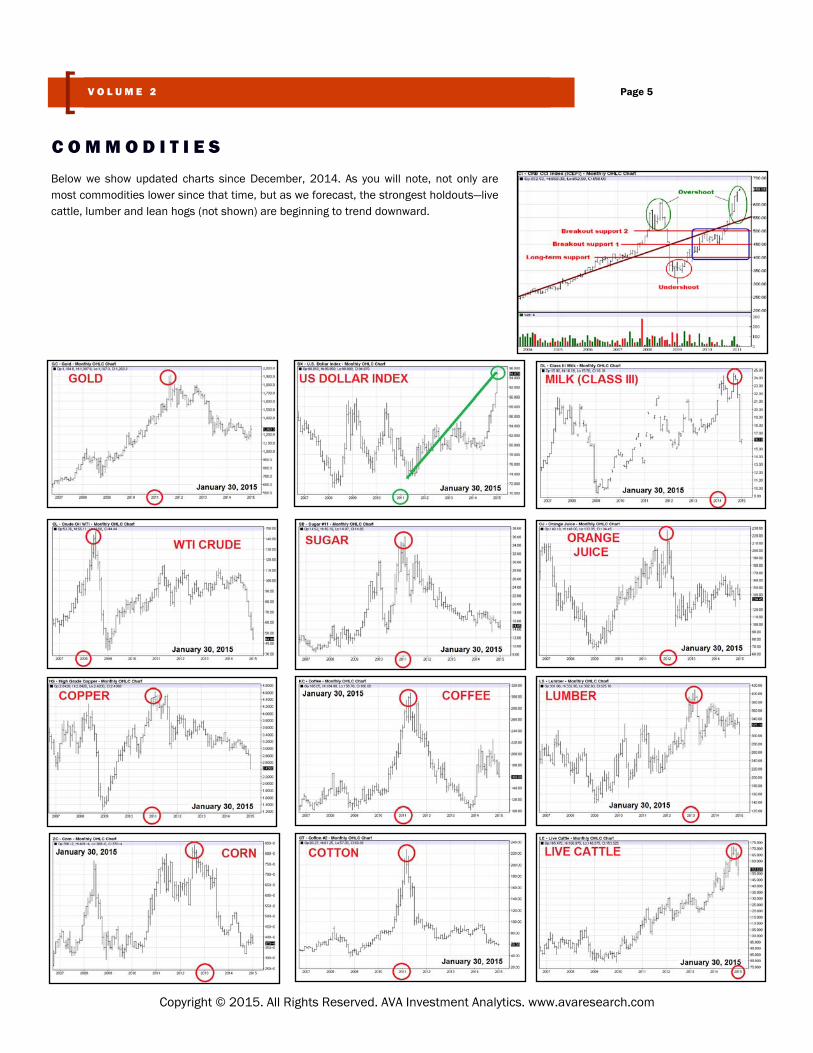
Below we show updated charts since December, 2014. As you will note, not only are most commodities lower since that time, but as we forecast, the strongest holdouts—live cattle, lumber and lean hogs (not shown) are beginning to trend downward.
C O M M O D I T I E S
Page 5 V O L U M E 2
Copyright © 2015. All Rights Reserved. AVA Investment Analytics. www.avaresearch.com
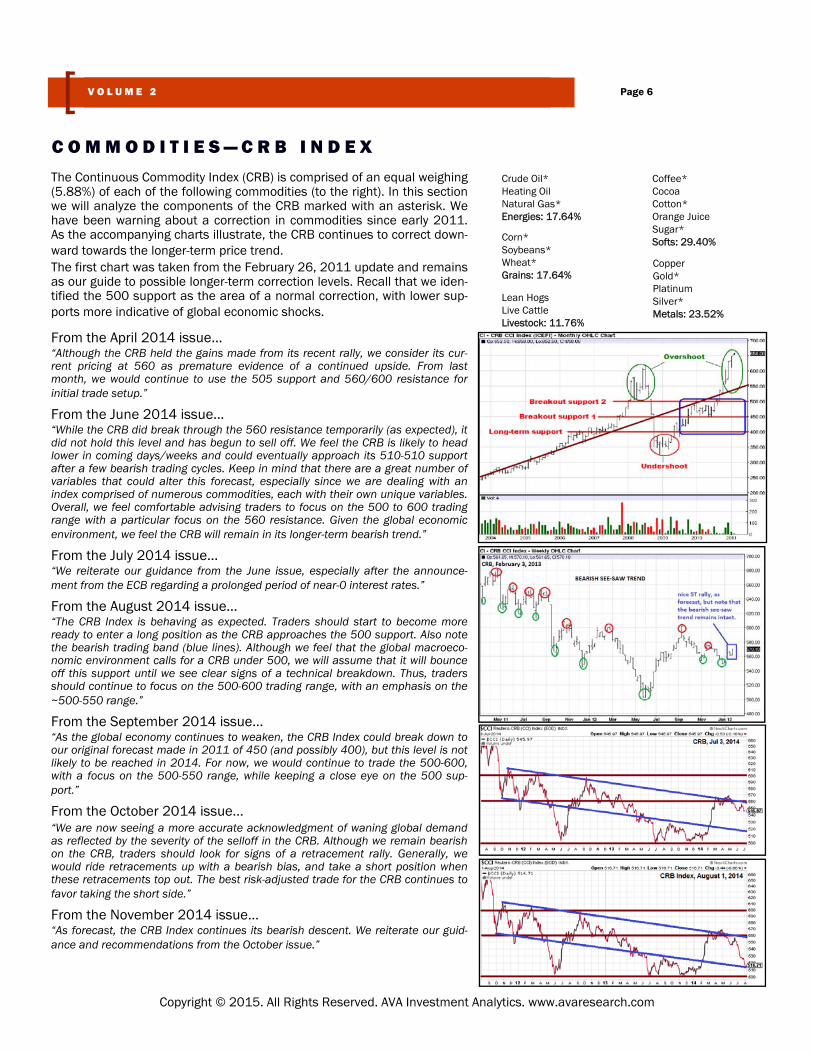
The Continuous Commodity Index (CRB) is comprised of an equal weighing (5.88%) of each of the following commodities (to the right). In this section we will analyze the components of the CRB marked with an asterisk. We have been warning about a correction in commodities since early 2011. As the accompanying charts illustrate, the CRB continues to correct down-ward towards the longer-term price trend. The first chart was taken from the February 26, 2011 update and remains as our guide to possible longer-term correction levels. Recall that we iden-tified the 500 support as the area of a normal correction, with lower sup-ports more indicative of global economic shocks.
From the April 2014 issue… “Although the CRB held the gains made from its recent rally, we consider its cur-rent pricing at 560 as premature evidence of a continued upside. From last month, we would continue to use the 505 support and 560/600 resistance for initial trade setup.”
From the June 2014 issue… “While the CRB did break through the 560 resistance temporarily (as expected), it did not hold this level and has begun to sell off. We feel the CRB is likely to head lower in coming days/weeks and could eventually approach its 510-510 support after a few bearish trading cycles. Keep in mind that there are a great number of variables that could alter this forecast, especially since we are dealing with an index comprised of numerous commodities, each with their own unique variables. Overall, we feel comfortable advising traders to focus on the 500 to 600 trading range with a particular focus on the 560 resistance. Given the global economic environment, we feel the CRB will remain in its longer-term bearish trend.”
From the July 2014 issue… “We reiterate our guidance from the June issue, especially after the announce-ment from the ECB regarding a prolonged period of near-0 interest rates.”
From the August 2014 issue… “The CRB Index is behaving as expected. Traders should start to become more ready to enter a long position as the CRB approaches the 500 support. Also note the bearish trading band (blue lines). Although we feel that the global macroeco-nomic environment calls for a CRB under 500, we will assume that it will bounce off this support until we see clear signs of a technical breakdown. Thus, traders should continue to focus on the 500-600 trading range, with an emphasis on the ~500-550 range.”
From the September 2014 issue… “As the global economy continues to weaken, the CRB Index could break down to our original forecast made in 2011 of 450 (and possibly 400), but this level is not likely to be reached in 2014. For now, we would continue to trade the 500-600, with a focus on the 500-550 range, while keeping a close eye on the 500 sup-port.”
From the October 2014 issue… “We are now seeing a more accurate acknowledgment of waning global demand as reflected by the severity of the selloff in the CRB. Although we remain bearish on the CRB, traders should look for signs of a retracement rally. Generally, we would ride retracements up with a bearish bias, and take a short position when these retracements top out. The best risk-adjusted trade for the CRB continues to favor taking the short side.”
From the November 2014 issue… “As forecast, the CRB Index continues its bearish descent. We reiterate our guid-ance and recommendations from the October issue.”
C O M M O D I T I E S — C R B I N D E X
Page 6 V O L U M E 2
Copyright © 2015. All Rights Reserved. AVA Investment Analytics. www.avaresearch.com
Crude Oil* Heating Oil Natural Gas* Energies: 17.64%
Lean Hogs Live Cattle Livestock: 11.76%
Coffee* Cocoa Cotton* Orange Juice Sugar* Softs: 29.40%
Copper Gold* Platinum Silver* Metals: 23.52%
Corn* Soybeans* Wheat* Grains: 17.64%
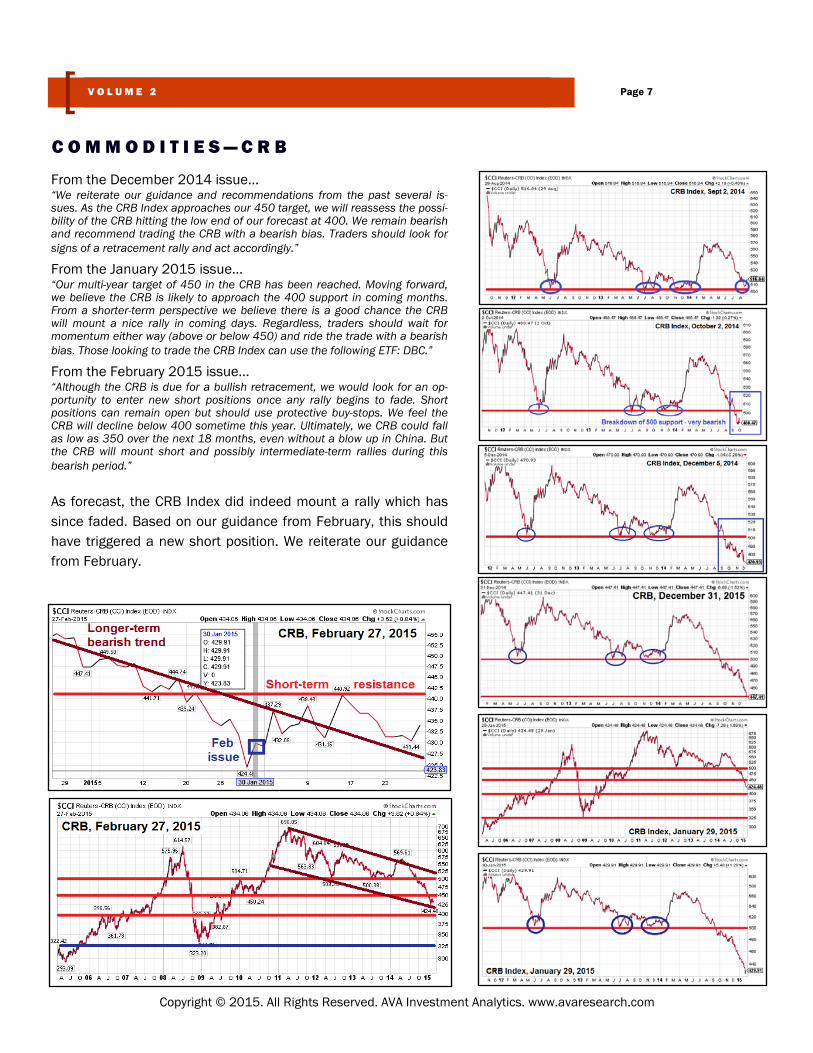
From the December 2014 issue… “We reiterate our guidance and recommendations from the past several is-sues. As the CRB Index approaches our 450 target, we will reassess the possi-bility of the CRB hitting the low end of our forecast at 400. We remain bearish and recommend trading the CRB with a bearish bias. Traders should look for signs of a retracement rally and act accordingly.”
From the January 2015 issue… “Our multi-year target of 450 in the CRB has been reached. Moving forward, we believe the CRB is likely to approach the 400 support in coming months. From a shorter-term perspective we believe there is a good chance the CRB will mount a nice rally in coming days. Regardless, traders should wait for momentum either way (above or below 450) and ride the trade with a bearish bias. Those looking to trade the CRB Index can use the following ETF: DBC.”
From the February 2015 issue… “Although the CRB is due for a bullish retracement, we would look for an op-portunity to enter new short positions once any rally begins to fade. Short positions can remain open but should use protective buy-stops. We feel the CRB will decline below 400 sometime this year. Ultimately, we CRB could fall as low as 350 over the next 18 months, even without a blow up in China. But the CRB will mount short and possibly intermediate-term rallies during this bearish period.”
As forecast, the CRB Index did indeed mount a rally which has since faded. Based on our guidance from February, this should have triggered a new short position. We reiterate our guidance from February.
C O M M O D I T I E S — C R B
Page 7 V O L U M E 2
Copyright © 2015. All Rights Reserved. AVA Investment Analytics. www.avaresearch.com

From the October 2014 issue… “Notice how rice rallied to just under 13 (upper support) after it declined to 12.2 (lower support), and has since resumed its bearish trend, just as we fore-cast in the September issue. We reiterate our guidance from the September issue.”
From the November 2014 issue… “As forecast, rice collapsed rapidly down to nearly 11.0, after breaking down from its lower support at 12. Traders should look for signs of a retracement rally and ride rice up if it turns. After this rally fades, traders should look to take another short position. The trend remains bearish, so long trades should exer-cise caution because we believe rice could decline under 10.”
From the December 2014 issue… “As forecast, rice rallied (immediately after the November issue was released), then sold off and rallied again and has since sold off. Notice how rice never hit the 13 resistance (as we pointed to in the chart). This confirmed the continuation of the bearish trend. We remain bearish on rice and we believe it could decline under 10 in coming months. However, we feel that over the longer term period there is more upside than downside. This is something to keep in mind as rice trends lower.”
C O M M O D I T I E S — R O U G H R I C E
Page 8 V O L U M E 2
Copyright © 2015. All Rights Reserved. AVA Investment Analytics. www.avaresearch.com
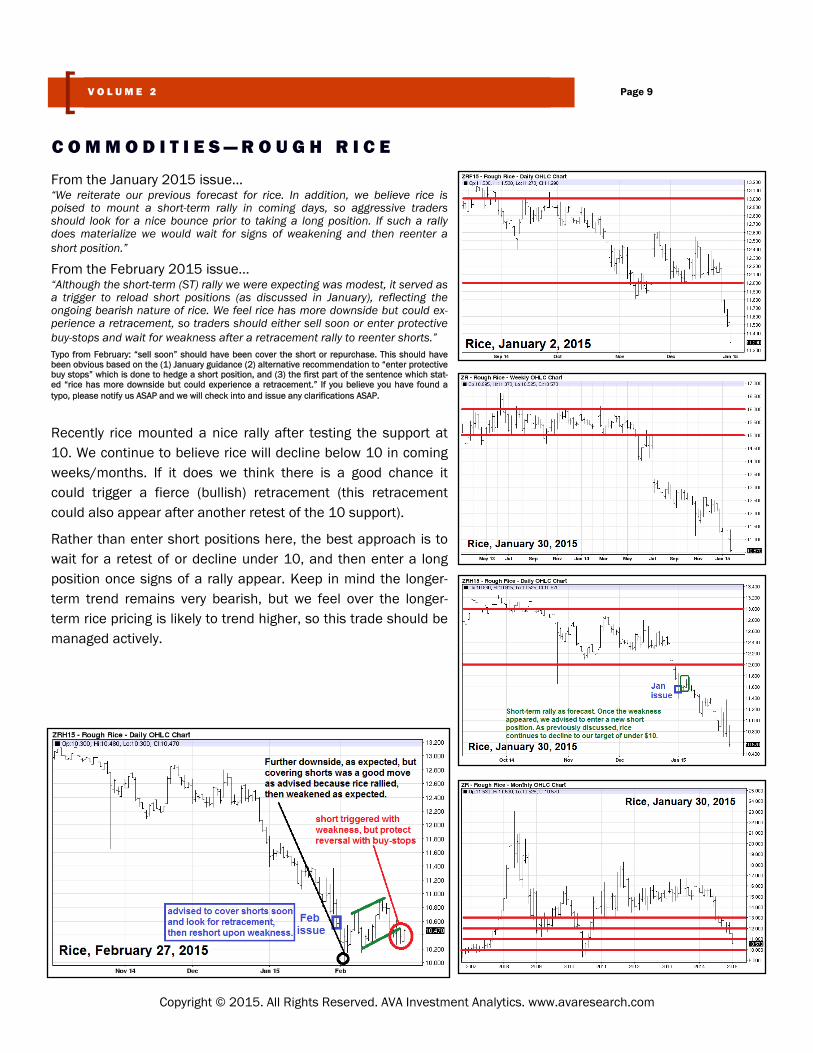
From the January 2015 issue… “We reiterate our previous forecast for rice. In addition, we believe rice is poised to mount a short-term rally in coming days, so aggressive traders should look for a nice bounce prior to taking a long position. If such a rally does materialize we would wait for signs of weakening and then reenter a short position.”
From the February 2015 issue… “Although the short-term (ST) rally we were expecting was modest, it served as a trigger to reload short positions (as discussed in January), reflecting the ongoing bearish nature of rice. We feel rice has more downside but could ex-perience a retracement, so traders should either sell soon or enter protective buy-stops and wait for weakness after a retracement rally to reenter shorts.” Typo from February: “sell soon” should have been cover the short or repurchase. This should have been obvious based on the (1) January guidance (2) alternative recommendation to “enter protective buy stops” which is done to hedge a short position, and (3) the first part of the sentence which stat-ed “rice has more downside but could experience a retracement.” If you believe you have found a typo, please notify us ASAP and we will check into and issue any clarifications ASAP.
Recently rice mounted a nice rally after testing the support at 10. We continue to believe rice will decline below 10 in coming weeks/months. If it does we think there is a good chance it could trigger a fierce (bullish) retracement (this retracement could also appear after another retest of the 10 support).
Rather than enter short positions here, the best approach is to wait for a retest of or decline under 10, and then enter a long position once signs of a rally appear. Keep in mind the longer-term trend remains very bearish, but we feel over the longer-term rice pricing is likely to trend higher, so this trade should be managed actively.
C O M M O D I T I E S — R O U G H R I C E
Page 9 V O L U M E 2
Copyright © 2015. All Rights Reserved. AVA Investment Analytics. www.avaresearch.com
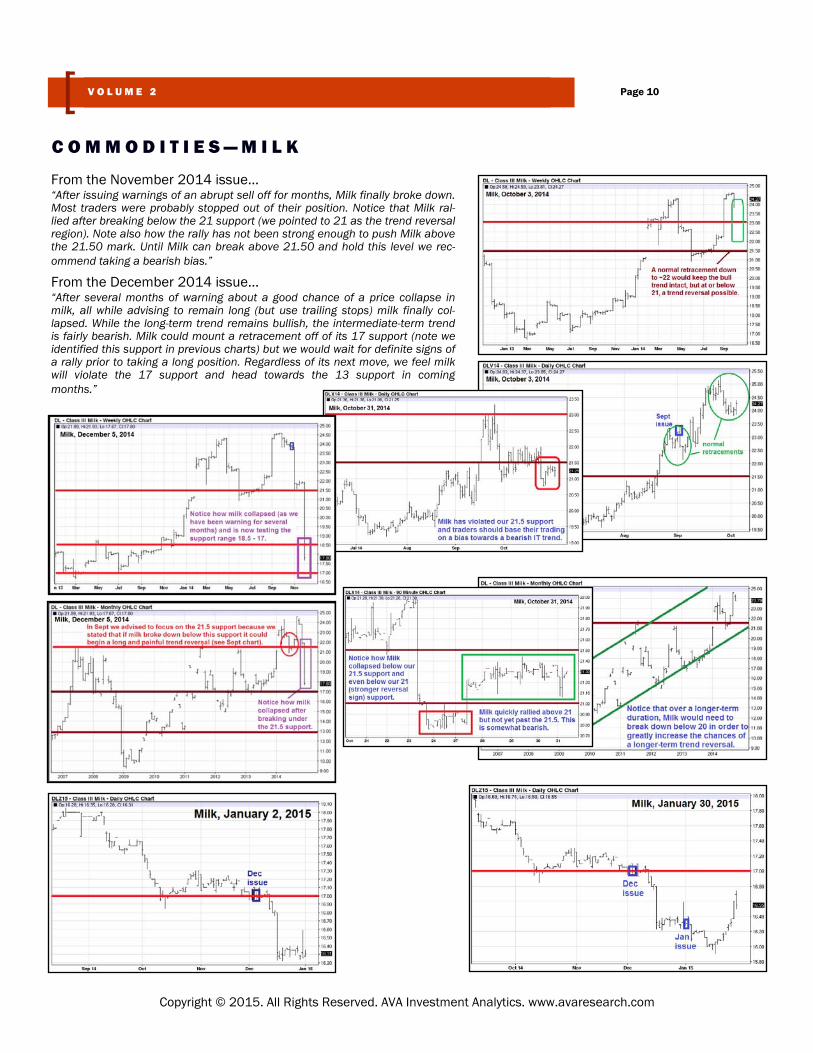
From the November 2014 issue… “After issuing warnings of an abrupt sell off for months, Milk finally broke down. Most traders were probably stopped out of their position. Notice that Milk ral-lied after breaking below the 21 support (we pointed to 21 as the trend reversal region). Note also how the rally has not been strong enough to push Milk above the 21.50 mark. Until Milk can break above 21.50 and hold this level we rec-ommend taking a bearish bias.”
From the December 2014 issue… “After several months of warning about a good chance of a price collapse in milk, all while advising to remain long (but use trailing stops) milk finally col-lapsed. While the long-term trend remains bullish, the intermediate-term trend is fairly bearish. Milk could mount a retracement off of its 17 support (note we identified this support in previous charts) but we would wait for definite signs of a rally prior to taking a long position. Regardless of its next move, we feel milk will violate the 17 support and head towards the 13 support in coming months.”
C O M M O D I T I E S — M I L K
Page 10 V O L U M E 2
Copyright © 2015. All Rights Reserved. AVA Investment Analytics. www.avaresearch.com
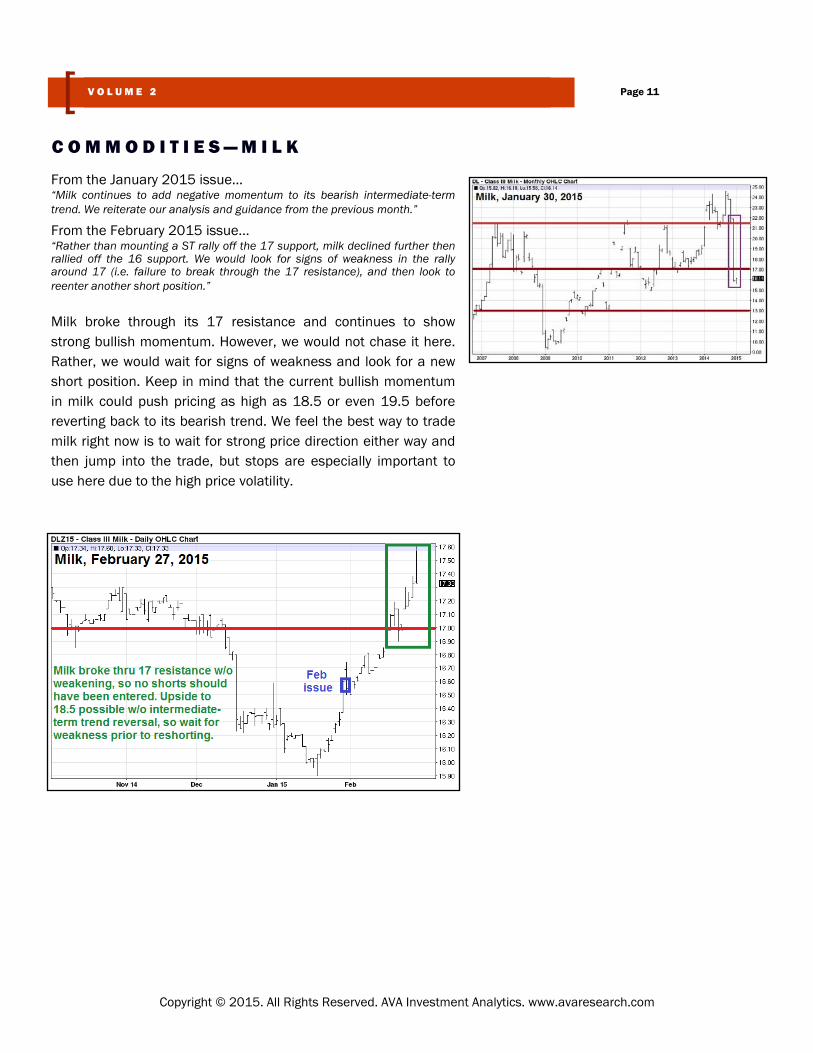
From the January 2015 issue… “Milk continues to add negative momentum to its bearish intermediate-term trend. We reiterate our analysis and guidance from the previous month.”
From the February 2015 issue… “Rather than mounting a ST rally off the 17 support, milk declined further then rallied off the 16 support. We would look for signs of weakness in the rally around 17 (i.e. failure to break through the 17 resistance), and then look to reenter another short position.”
Milk broke through its 17 resistance and continues to show strong bullish momentum. However, we would not chase it here. Rather, we would wait for signs of weakness and look for a new short position. Keep in mind that the current bullish momentum in milk could push pricing as high as 18.5 or even 19.5 before reverting back to its bearish trend. We feel the best way to trade milk right now is to wait for strong price direction either way and then jump into the trade, but stops are especially important to use here due to the high price volatility.
C O M M O D I T I E S — M I L K
Page 11 V O L U M E 2
Copyright © 2015. All Rights Reserved. AVA Investment Analytics. www.avaresearch.com
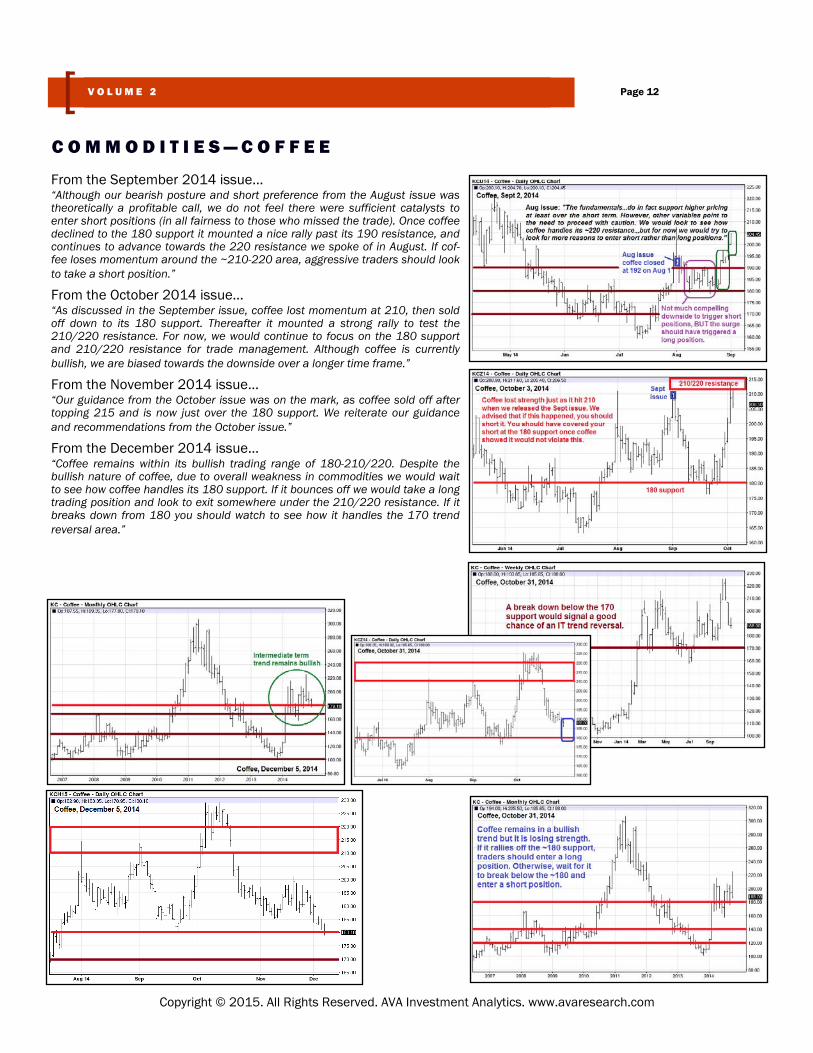
From the September 2014 issue… “Although our bearish posture and short preference from the August issue was theoretically a profitable call, we do not feel there were sufficient catalysts to enter short positions (in all fairness to those who missed the trade). Once coffee declined to the 180 support it mounted a nice rally past its 190 resistance, and continues to advance towards the 220 resistance we spoke of in August. If cof-fee loses momentum around the ~210-220 area, aggressive traders should look to take a short position.”
From the October 2014 issue… “As discussed in the September issue, coffee lost momentum at 210, then sold off down to its 180 support. Thereafter it mounted a strong rally to test the 210/220 resistance. For now, we would continue to focus on the 180 support and 210/220 resistance for trade management. Although coffee is currently bullish, we are biased towards the downside over a longer time frame.”
From the November 2014 issue… “Our guidance from the October issue was on the mark, as coffee sold off after topping 215 and is now just over the 180 support. We reiterate our guidance and recommendations from the October issue.”
From the December 2014 issue… “Coffee remains within its bullish trading range of 180-210/220. Despite the bullish nature of coffee, due to overall weakness in commodities we would wait to see how coffee handles its 180 support. If it bounces off we would take a long trading position and look to exit somewhere under the 210/220 resistance. If it breaks down from 180 you should watch to see how it handles the 170 trend reversal area.”
C O M M O D I T I E S — C O F F E E
Page 12 V O L U M E 2
Copyright © 2015. All Rights Reserved. AVA Investment Analytics. www.avaresearch.com

From the January 2015 issue… “Coffee broke down from its 180 support and has made a stronger case for more downside. We recommend more cautious traders to wait for a breakdown below the longer-term support at 160 prior to entering a short posi-tion. More aggressive traders who entered a short posi-tion once coffee broke below the 180 can keep this posi-tion open, but should (as always) use buy-stop orders to protect against a bullish retracement.”
From the February 2015 issue… “We reiterate our guidance from the January issue.”
Our guidance from the February issue was spot on for both aggressive and conservative traders. We would cover all shorts soon and wait for a bullish retracement, then reevalu-ate new shorting opportunities. We do not see many opportu-nities to enter long positions here without taking on a good deal of risk. At the same time, we see a fairly good chance of a bullish retracement but have no idea where it might head so we can not at this time recommend any long positions.
C O M M O D I T I E S — C O F F E E
Page 13 V O L U M E 2
Copyright © 2015. All Rights Reserved. AVA Investment Analytics. www.avaresearch.com
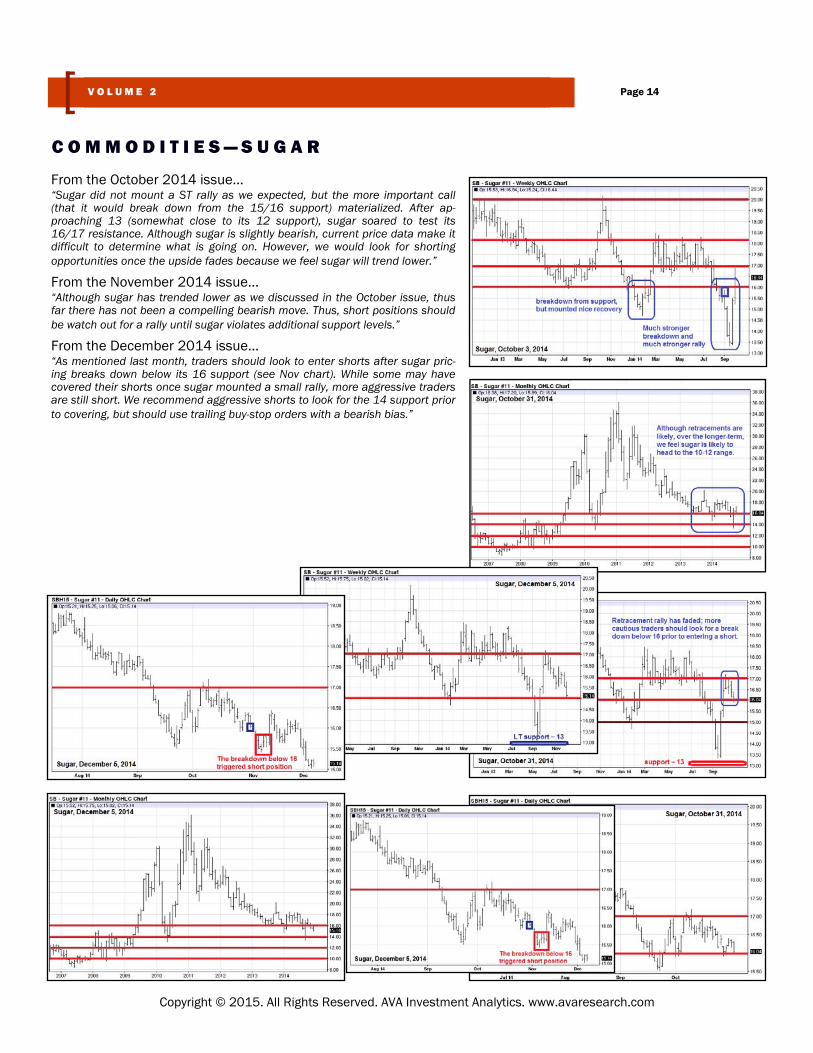
From the October 2014 issue… “Sugar did not mount a ST rally as we expected, but the more important call (that it would break down from the 15/16 support) materialized. After ap-proaching 13 (somewhat close to its 12 support), sugar soared to test its 16/17 resistance. Although sugar is slightly bearish, current price data make it difficult to determine what is going on. However, we would look for shorting opportunities once the upside fades because we feel sugar will trend lower.”
From the November 2014 issue… “Although sugar has trended lower as we discussed in the October issue, thus far there has not been a compelling bearish move. Thus, short positions should be watch out for a rally until sugar violates additional support levels.”
From the December 2014 issue… “As mentioned last month, traders should look to enter shorts after sugar pric-ing breaks down below its 16 support (see Nov chart). While some may have covered their shorts once sugar mounted a small rally, more aggressive traders are still short. We recommend aggressive shorts to look for the 14 support prior to covering, but should use trailing buy-stop orders with a bearish bias.”
C O M M O D I T I E S — S U G A R
Page 14 V O L U M E 2
Copyright © 2015. All Rights Reserved. AVA Investment Analytics. www.avaresearch.com
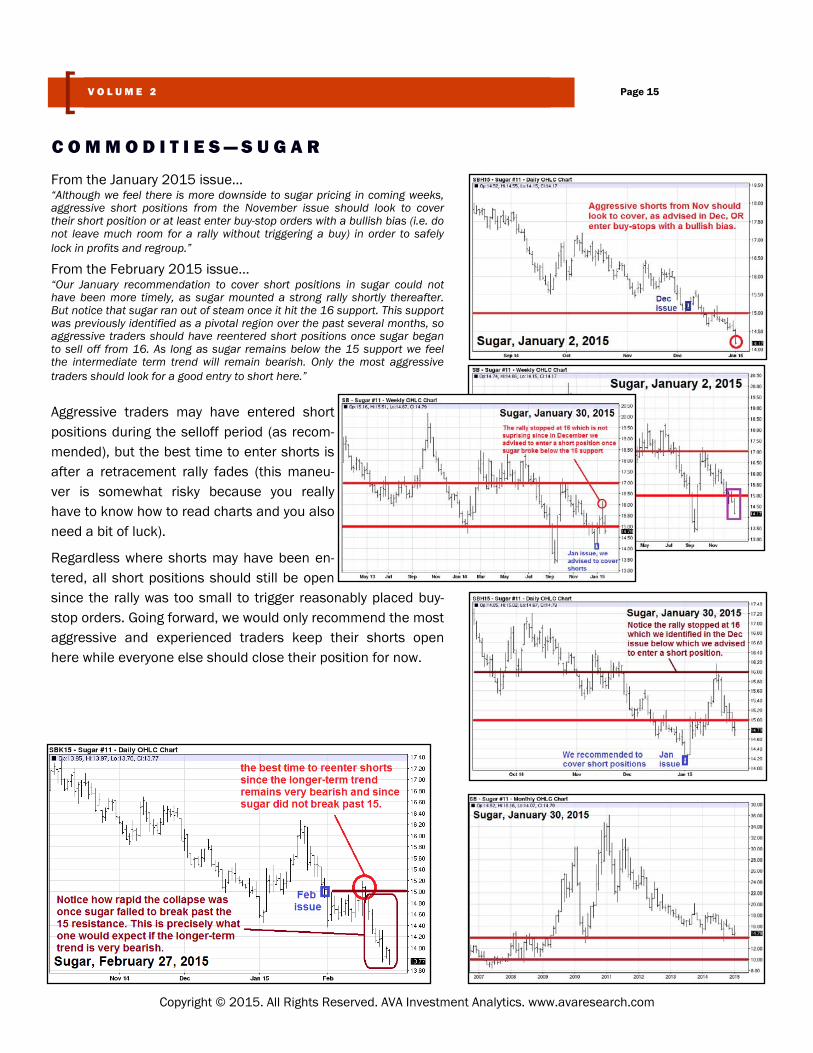
From the January 2015 issue… “Although we feel there is more downside to sugar pricing in coming weeks, aggressive short positions from the November issue should look to cover their short position or at least enter buy-stop orders with a bullish bias (i.e. do not leave much room for a rally without triggering a buy) in order to safely lock in profits and regroup.”
From the February 2015 issue… “Our January recommendation to cover short positions in sugar could not have been more timely, as sugar mounted a strong rally shortly thereafter. But notice that sugar ran out of steam once it hit the 16 support. This support was previously identified as a pivotal region over the past several months, so aggressive traders should have reentered short positions once sugar began to sell off from 16. As long as sugar remains below the 15 support we feel the intermediate term trend will remain bearish. Only the most aggressive traders should look for a good entry to short here.”
Aggressive traders may have entered short positions during the selloff period (as recom-mended), but the best time to enter shorts is after a retracement rally fades (this maneu-ver is somewhat risky because you really have to know how to read charts and you also need a bit of luck).
Regardless where shorts may have been en-tered, all short positions should still be open since the rally was too small to trigger reasonably placed buy-stop orders. Going forward, we would only recommend the most aggressive and experienced traders keep their shorts open here while everyone else should close their position for now.
C O M M O D I T I E S — S U G A R
Page 15 V O L U M E 2
Copyright © 2015. All Rights Reserved. AVA Investment Analytics. www.avaresearch.com
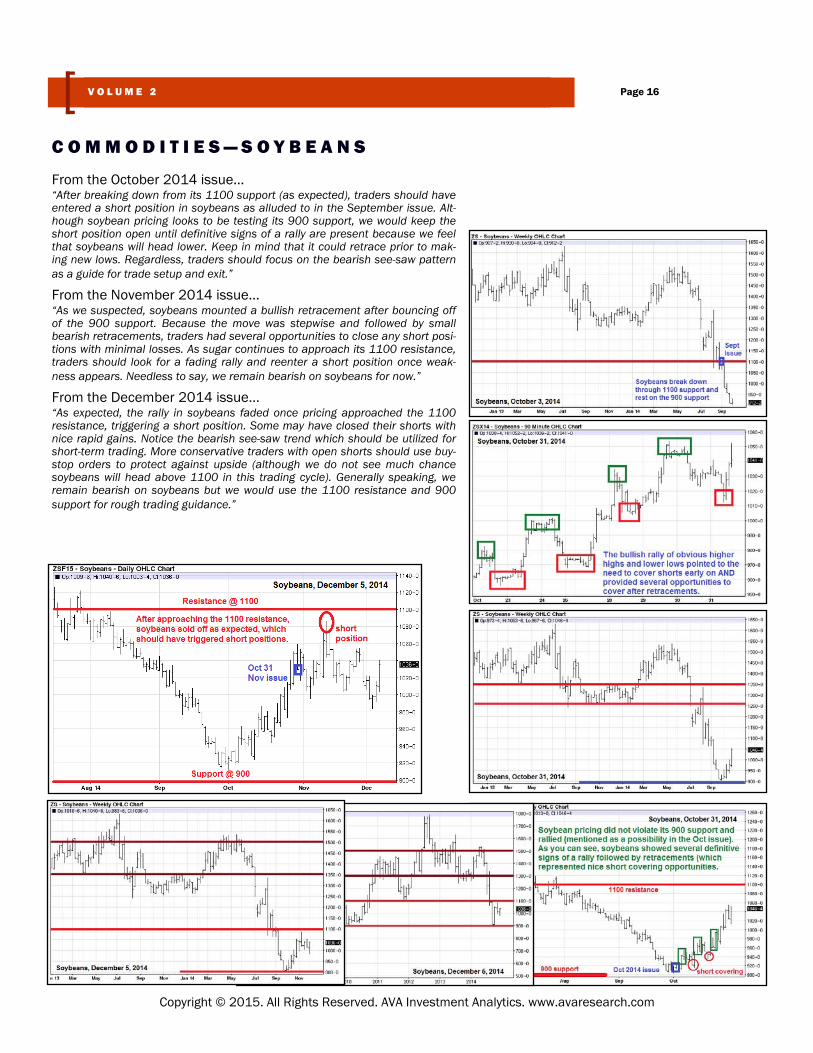
From the October 2014 issue… “After breaking down from its 1100 support (as expected), traders should have entered a short position in soybeans as alluded to in the September issue. Alt-hough soybean pricing looks to be testing its 900 support, we would keep the short position open until definitive signs of a rally are present because we feel that soybeans will head lower. Keep in mind that it could retrace prior to mak-ing new lows. Regardless, traders should focus on the bearish see-saw pattern as a guide for trade setup and exit.”
From the November 2014 issue… “As we suspected, soybeans mounted a bullish retracement after bouncing off of the 900 support. Because the move was stepwise and followed by small bearish retracements, traders had several opportunities to close any short posi-tions with minimal losses. As sugar continues to approach its 1100 resistance, traders should look for a fading rally and reenter a short position once weak-ness appears. Needless to say, we remain bearish on soybeans for now.”
From the December 2014 issue… “As expected, the rally in soybeans faded once pricing approached the 1100 resistance, triggering a short position. Some may have closed their shorts with nice rapid gains. Notice the bearish see-saw trend which should be utilized for short-term trading. More conservative traders with open shorts should use buy-stop orders to protect against upside (although we do not see much chance soybeans will head above 1100 in this trading cycle). Generally speaking, we remain bearish on soybeans but we would use the 1100 resistance and 900 support for rough trading guidance.”
C O M M O D I T I E S — S O Y B E A N S
Page 16 V O L U M E 2
Copyright © 2015. All Rights Reserved. AVA Investment Analytics. www.avaresearch.com
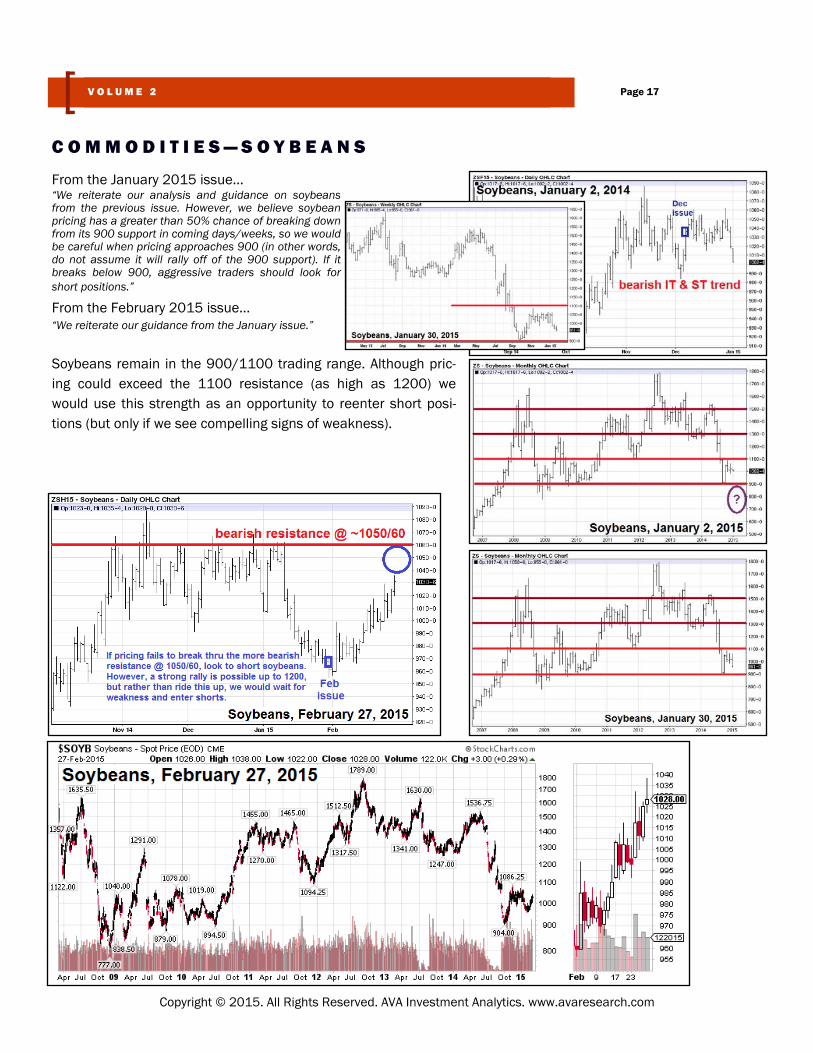
From the January 2015 issue… “We reiterate our analysis and guidance on soybeans from the previous issue. However, we believe soybean pricing has a greater than 50% chance of breaking down from its 900 support in coming days/weeks, so we would be careful when pricing approaches 900 (in other words, do not assume it will rally off of the 900 support). If it breaks below 900, aggressive traders should look for short positions.”
From the February 2015 issue… “We reiterate our guidance from the January issue.”
Soybeans remain in the 900/1100 trading range. Although pric-ing could exceed the 1100 resistance (as high as 1200) we would use this strength as an opportunity to reenter short posi-tions (but only if we see compelling signs of weakness).
C O M M O D I T I E S — S O Y B E A N S
Page 17 V O L U M E 2
Copyright © 2015. All Rights Reserved. AVA Investment Analytics. www.avaresearch.com

From the October 2014 issue… “By the time corn declined to 340 (or at worst, 335) traders should have reen-tered their short positions. Although it looks like a short-term bottom and possi-ble retracement could be in play, we would wait for more upside (using trailing buy limits). We feel corn will test its 300 support in coming weeks but the timing will depend on the magnitude and strength of any bullish retracements.”
From the November 2014 issue… “As suspected, corn did in fact bottom, then rallied. Alert traders should have been able to spot the upward momentum early on as shown in the chart. This rally has pushed corn to the upper resistance level. Thus, we would keep long orders open but recommend use of trailing stops. If corn breaks past the 380 it could rise to the mid-400s with little resistance. Notice the similarity between corn and soybean (previous page) price patterns.”
From the December 2014 issue… “Notice how corn has not yet broken past the 380 resistance we pointed to in the November issue. Again we would watch for a possible breakout and enter a long position once the breakout has been confirmed (over 380). In contrast, we would wait for a breakdown below 360 prior to entering a short position. Over the longer-term we feel there is more upside than downside to corn.”
C O M M O D I T I E S — C O R N
Page 18 V O L U M E 2
Copyright © 2015. All Rights Reserved. AVA Investment Analytics. www.avaresearch.com
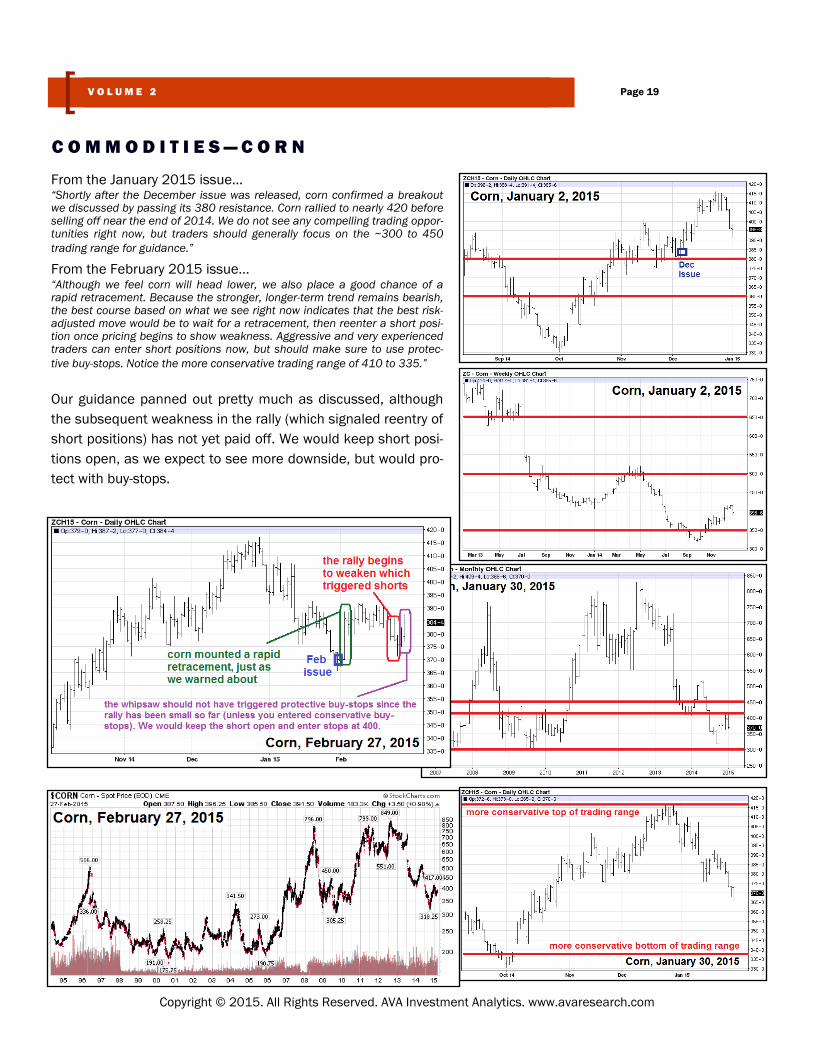
From the January 2015 issue… “Shortly after the December issue was released, corn confirmed a breakout we discussed by passing its 380 resistance. Corn rallied to nearly 420 before selling off near the end of 2014. We do not see any compelling trading oppor-tunities right now, but traders should generally focus on the ~300 to 450 trading range for guidance.”
From the February 2015 issue… “Although we feel corn will head lower, we also place a good chance of a rapid retracement. Because the stronger, longer-term trend remains bearish, the best course based on what we see right now indicates that the best risk-adjusted move would be to wait for a retracement, then reenter a short posi-tion once pricing begins to show weakness. Aggressive and very experienced traders can enter short positions now, but should make sure to use protec-tive buy-stops. Notice the more conservative trading range of 410 to 335.”
Our guidance panned out pretty much as discussed, although the subsequent weakness in the rally (which signaled reentry of short positions) has not yet paid off. We would keep short posi-tions open, as we expect to see more downside, but would pro-tect with buy-stops.
C O M M O D I T I E S — C O R N
Page 19 V O L U M E 2
Copyright © 2015. All Rights Reserved. AVA Investment Analytics. www.avaresearch.com
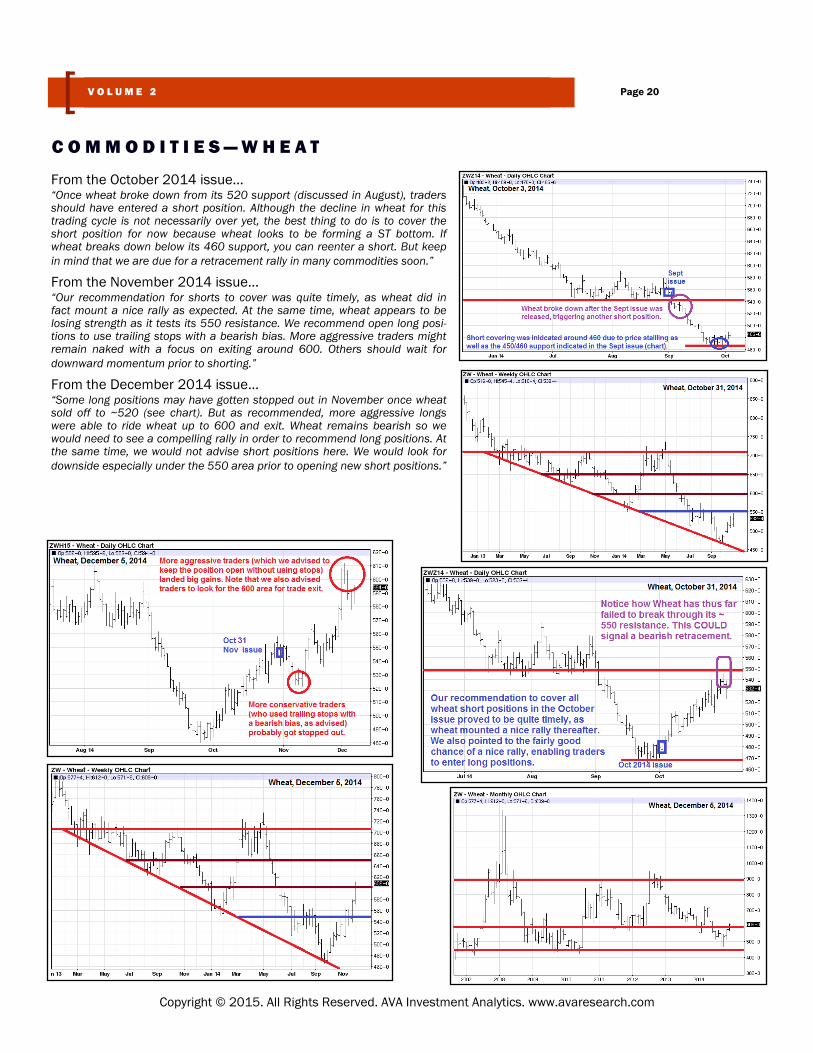
From the October 2014 issue… “Once wheat broke down from its 520 support (discussed in August), traders should have entered a short position. Although the decline in wheat for this trading cycle is not necessarily over yet, the best thing to do is to cover the short position for now because wheat looks to be forming a ST bottom. If wheat breaks down below its 460 support, you can reenter a short. But keep in mind that we are due for a retracement rally in many commodities soon.”
From the November 2014 issue… “Our recommendation for shorts to cover was quite timely, as wheat did in fact mount a nice rally as expected. At the same time, wheat appears to be losing strength as it tests its 550 resistance. We recommend open long posi-tions to use trailing stops with a bearish bias. More aggressive traders might remain naked with a focus on exiting around 600. Others should wait for downward momentum prior to shorting.”
From the December 2014 issue… “Some long positions may have gotten stopped out in November once wheat sold off to ~520 (see chart). But as recommended, more aggressive longs were able to ride wheat up to 600 and exit. Wheat remains bearish so we would need to see a compelling rally in order to recommend long positions. At the same time, we would not advise short positions here. We would look for downside especially under the 550 area prior to opening new short positions.”
C O M M O D I T I E S — W H E A T
Page 20 V O L U M E 2
Copyright © 2015. All Rights Reserved. AVA Investment Analytics. www.avaresearch.com

From the January 2015 issue… “Wheat never fell below 550 region we discussed in December, so traders should have been leaning towards a long position. After bouncing off its 570 support, wheat mounted a strong short-term rally which should have signaled a long position once it soared past 600. Although wheat blew past its 650 re-sistance and approached 680, it did not last long, so this weakness should have been a sign to exit the trade. Again, we want to look at the 560 support for trading guidance. Below 560 traders should look to enter short positions. If wheat bounces off its 560 support, traders should look to enter long positions.”
From the February 2015 issue… “Wheat pricing behaved as expected, with a strong selloff once it broke down from the 560 level. We would keep short positions open but use protective buy-stops. Upon a rally (if you get stopped out) you should look for weakness (as always you should make use of relevant support levels) then look to reenter a short position.”
Shorts probably got stopped out once wheat rallied. Those same traders may have reentered a short position once wheat sold off, but thus far this trade has not yielded much. Wheat looks to have bounced off its ST support at 490 (again) which is a bullish sign. More cautious traders should close their short positions and re-group when the price trend becomes more clear.
C O M M O D I T I E S — W H E A T
Page 21 V O L U M E 2
Copyright © 2015. All Rights Reserved. AVA Investment Analytics. www.avaresearch.com
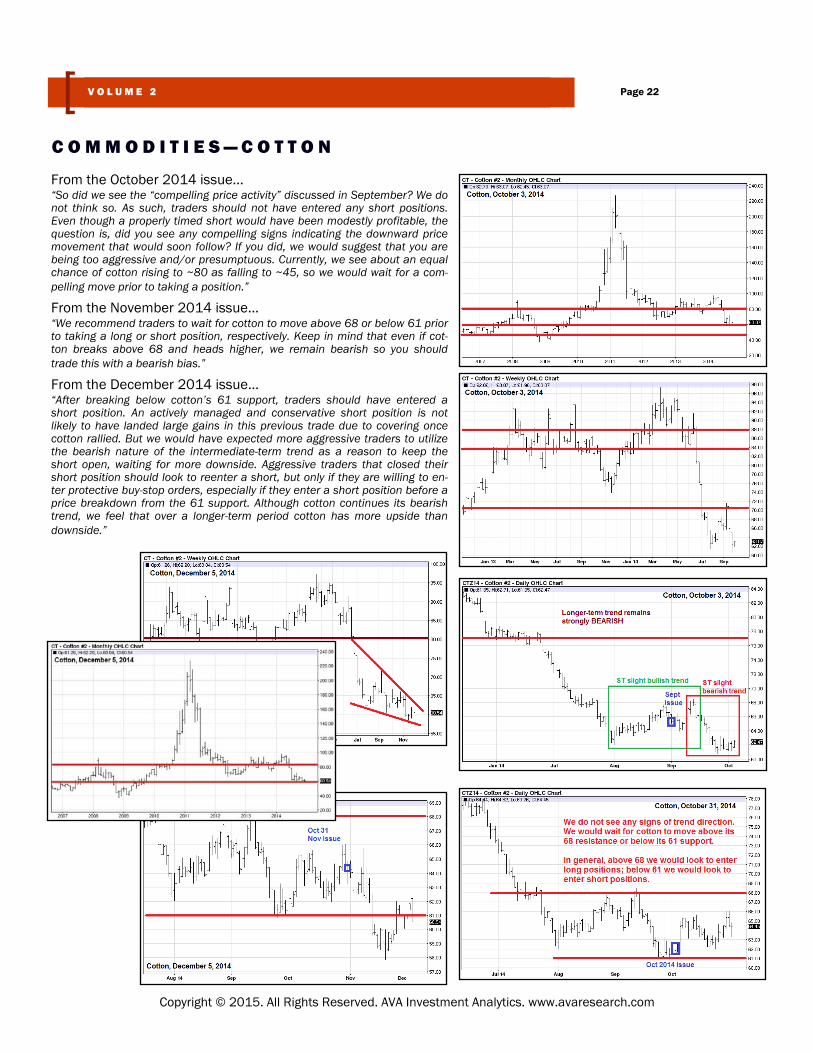
From the October 2014 issue… “So did we see the “compelling price activity” discussed in September? We do not think so. As such, traders should not have entered any short positions. Even though a properly timed short would have been modestly profitable, the question is, did you see any compelling signs indicating the downward price movement that would soon follow? If you did, we would suggest that you are being too aggressive and/or presumptuous. Currently, we see about an equal chance of cotton rising to ~80 as falling to ~45, so we would wait for a com-pelling move prior to taking a position.”
From the November 2014 issue… “We recommend traders to wait for cotton to move above 68 or below 61 prior to taking a long or short position, respectively. Keep in mind that even if cot-ton breaks above 68 and heads higher, we remain bearish so you should trade this with a bearish bias.”
From the December 2014 issue… “After breaking below cotton’s 61 support, traders should have entered a short position. An actively managed and conservative short position is not likely to have landed large gains in this previous trade due to covering once cotton rallied. But we would have expected more aggressive traders to utilize the bearish nature of the intermediate-term trend as a reason to keep the short open, waiting for more downside. Aggressive traders that closed their short position should look to reenter a short, but only if they are willing to en-ter protective buy-stop orders, especially if they enter a short position before a price breakdown from the 61 support. Although cotton continues its bearish trend, we feel that over a longer-term period cotton has more upside than downside.”
C O M M O D I T I E S — C O T T O N
Page 22 V O L U M E 2
Copyright © 2015. All Rights Reserved. AVA Investment Analytics. www.avaresearch.com
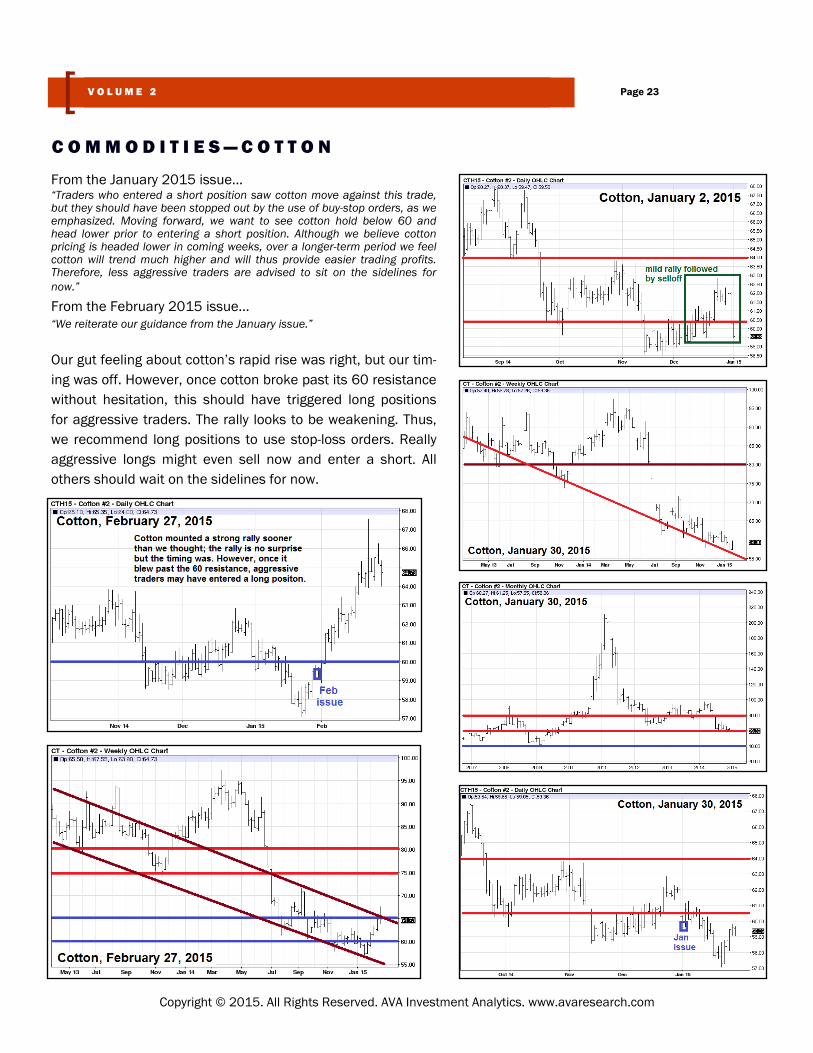
From the January 2015 issue… “Traders who entered a short position saw cotton move against this trade, but they should have been stopped out by the use of buy-stop orders, as we emphasized. Moving forward, we want to see cotton hold below 60 and head lower prior to entering a short position. Although we believe cotton pricing is headed lower in coming weeks, over a longer-term period we feel cotton will trend much higher and will thus provide easier trading profits. Therefore, less aggressive traders are advised to sit on the sidelines for now.” From the February 2015 issue… “We reiterate our guidance from the January issue.”
Our gut feeling about cotton’s rapid rise was right, but our tim-ing was off. However, once cotton broke past its 60 resistance without hesitation, this should have triggered long positions for aggressive traders. The rally looks to be weakening. Thus, we recommend long positions to use stop-loss orders. Really aggressive longs might even sell now and enter a short. All others should wait on the sidelines for now.
C O M M O D I T I E S — C O T T O N
Page 23 V O L U M E 2
Copyright © 2015. All Rights Reserved. AVA Investment Analytics. www.avaresearch.com
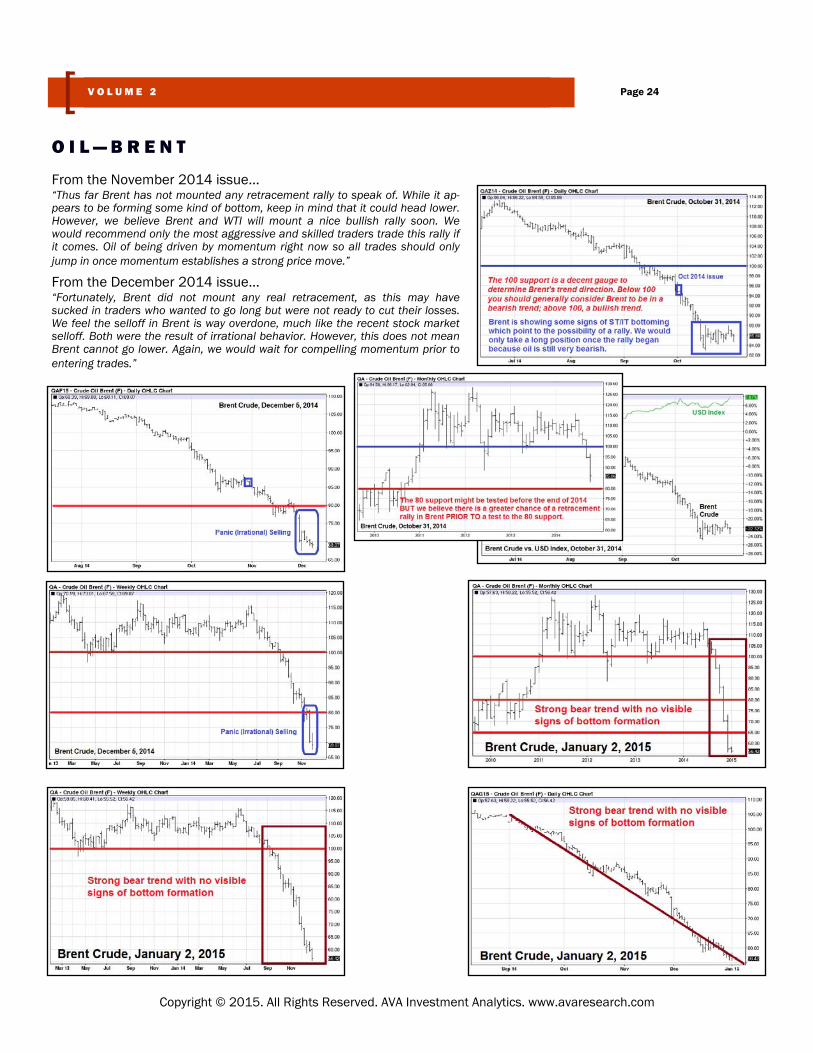
From the November 2014 issue… “Thus far Brent has not mounted any retracement rally to speak of. While it ap-pears to be forming some kind of bottom, keep in mind that it could head lower. However, we believe Brent and WTI will mount a nice bullish rally soon. We would recommend only the most aggressive and skilled traders trade this rally if it comes. Oil of being driven by momentum right now so all trades should only jump in once momentum establishes a strong price move.”
From the December 2014 issue… “Fortunately, Brent did not mount any real retracement, as this may have sucked in traders who wanted to go long but were not ready to cut their losses. We feel the selloff in Brent is way overdone, much like the recent stock market selloff. Both were the result of irrational behavior. However, this does not mean Brent cannot go lower. Again, we would wait for compelling momentum prior to entering trades.”
O I L — B R E N T
Page 24 V O L U M E 2
Copyright © 2015. All Rights Reserved. AVA Investment Analytics. www.avaresearch.com
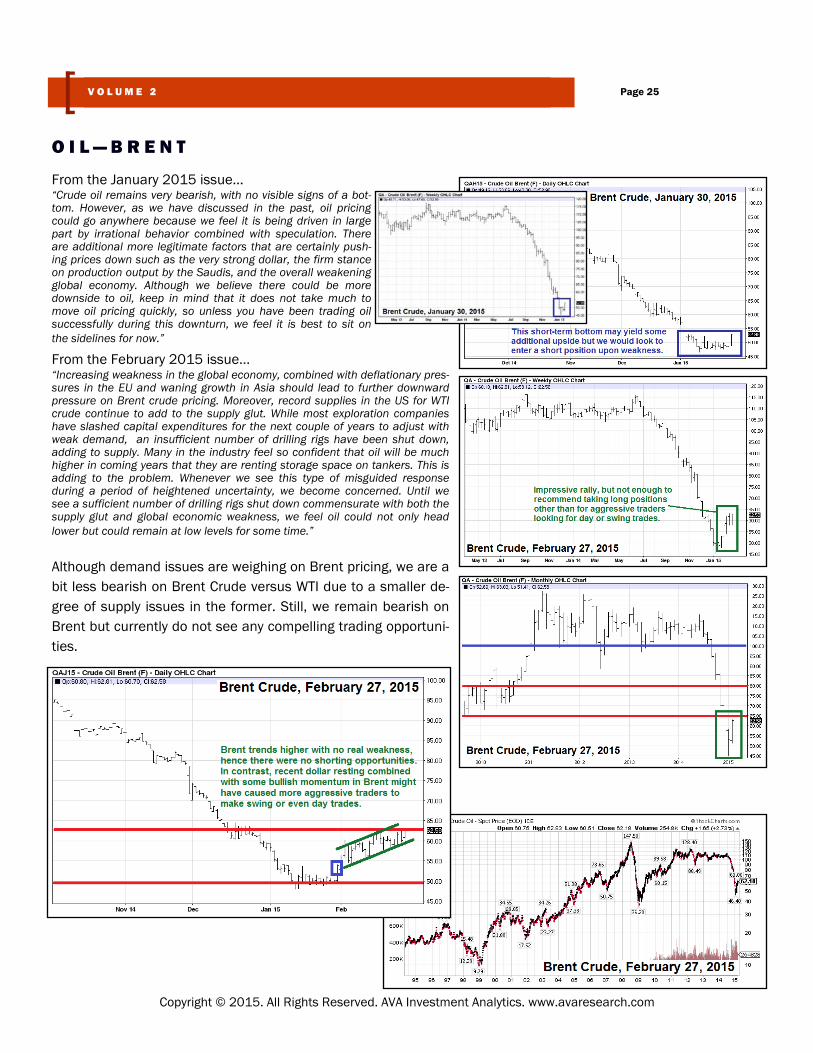
From the January 2015 issue… “Crude oil remains very bearish, with no visible signs of a bot-tom. However, as we have discussed in the past, oil pricing could go anywhere because we feel it is being driven in large part by irrational behavior combined with speculation. There are additional more legitimate factors that are certainly push-ing prices down such as the very strong dollar, the firm stance on production output by the Saudis, and the overall weakening global economy. Although we believe there could be more downside to oil, keep in mind that it does not take much to move oil pricing quickly, so unless you have been trading oil successfully during this downturn, we feel it is best to sit on the sidelines for now.”
From the February 2015 issue… “Increasing weakness in the global economy, combined with deflationary pres-sures in the EU and waning growth in Asia should lead to further downward pressure on Brent crude pricing. Moreover, record supplies in the US for WTI crude continue to add to the supply glut. While most exploration companies have slashed capital expenditures for the next couple of years to adjust with weak demand, an insufficient number of drilling rigs have been shut down, adding to supply. Many in the industry feel so confident that oil will be much higher in coming years that they are renting storage space on tankers. This is adding to the problem. Whenever we see this type of misguided response during a period of heightened uncertainty, we become concerned. Until we see a sufficient number of drilling rigs shut down commensurate with both the supply glut and global economic weakness, we feel oil could not only head lower but could remain at low levels for some time.”
Although demand issues are weighing on Brent pricing, we are a bit less bearish on Brent Crude versus WTI due to a smaller de-gree of supply issues in the former. Still, we remain bearish on Brent but currently do not see any compelling trading opportuni-ties.
O I L — B R E N T
Page 25 V O L U M E 2
Copyright © 2015. All Rights Reserved. AVA Investment Analytics. www.avaresearch.com
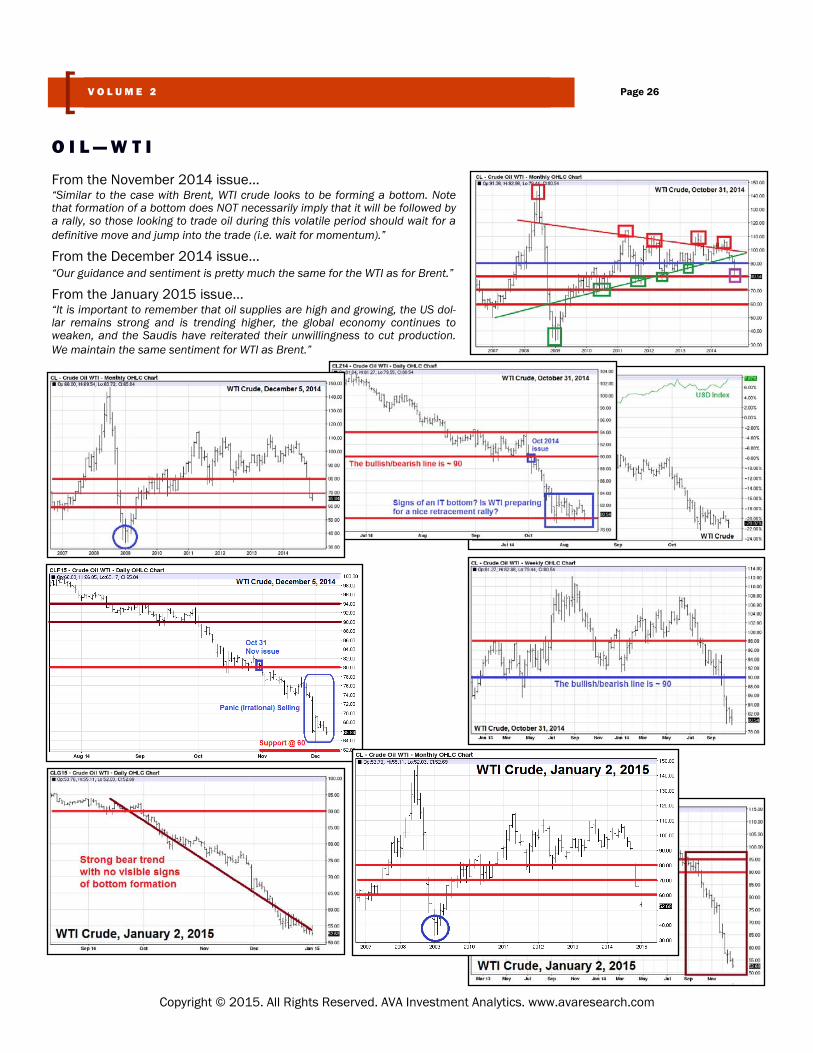
From the November 2014 issue… “Similar to the case with Brent, WTI crude looks to be forming a bottom. Note that formation of a bottom does NOT necessarily imply that it will be followed by a rally, so those looking to trade oil during this volatile period should wait for a definitive move and jump into the trade (i.e. wait for momentum).”
From the December 2014 issue… “Our guidance and sentiment is pretty much the same for the WTI as for Brent.”
From the January 2015 issue… “It is important to remember that oil supplies are high and growing, the US dol-lar remains strong and is trending higher, the global economy continues to weaken, and the Saudis have reiterated their unwillingness to cut production. We maintain the same sentiment for WTI as Brent.”
O I L — W T I
Page 26 V O L U M E 2
Copyright © 2015. All Rights Reserved. AVA Investment Analytics. www.avaresearch.com
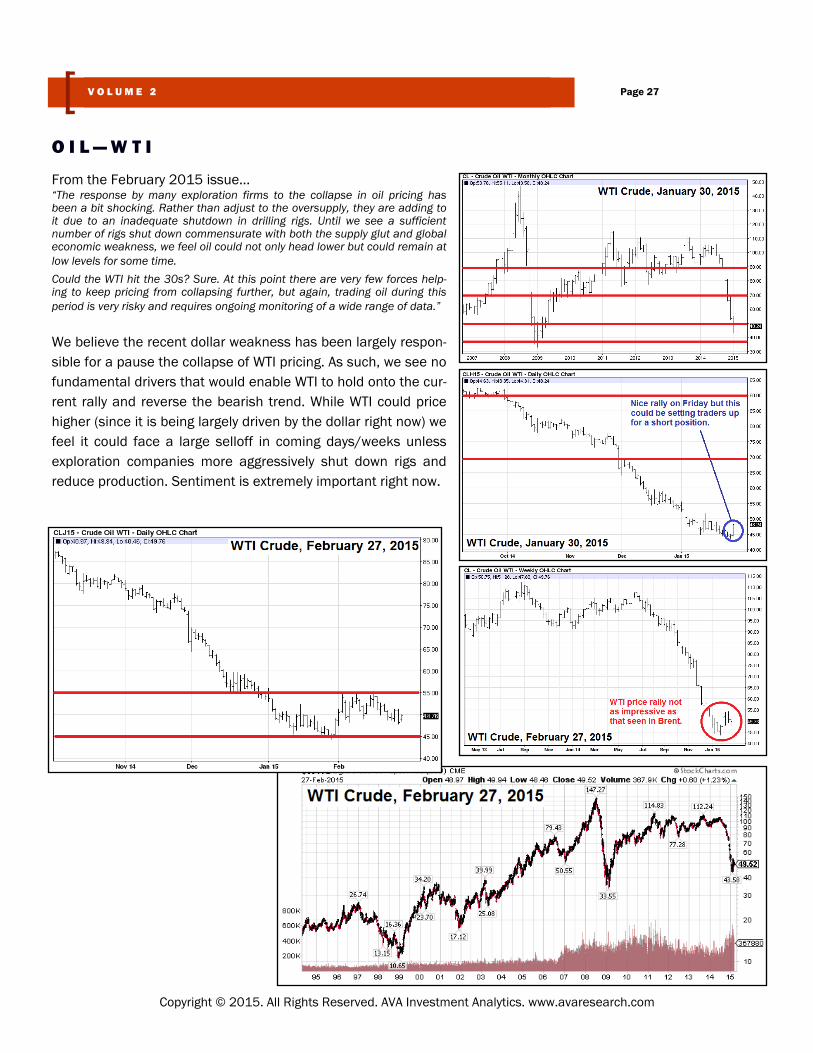
From the February 2015 issue… “The response by many exploration firms to the collapse in oil pricing has been a bit shocking. Rather than adjust to the oversupply, they are adding to it due to an inadequate shutdown in drilling rigs. Until we see a sufficient number of rigs shut down commensurate with both the supply glut and global economic weakness, we feel oil could not only head lower but could remain at low levels for some time.
Could the WTI hit the 30s? Sure. At this point there are very few forces help-ing to keep pricing from collapsing further, but again, trading oil during this period is very risky and requires ongoing monitoring of a wide range of data.”
We believe the recent dollar weakness has been largely respon-sible for a pause the collapse of WTI pricing. As such, we see no fundamental drivers that would enable WTI to hold onto the cur-rent rally and reverse the bearish trend. While WTI could price higher (since it is being largely driven by the dollar right now) we feel it could face a large selloff in coming days/weeks unless exploration companies more aggressively shut down rigs and reduce production. Sentiment is extremely important right now.
O I L — W T I
Page 27 V O L U M E 2
Copyright © 2015. All Rights Reserved. AVA Investment Analytics. www.avaresearch.com
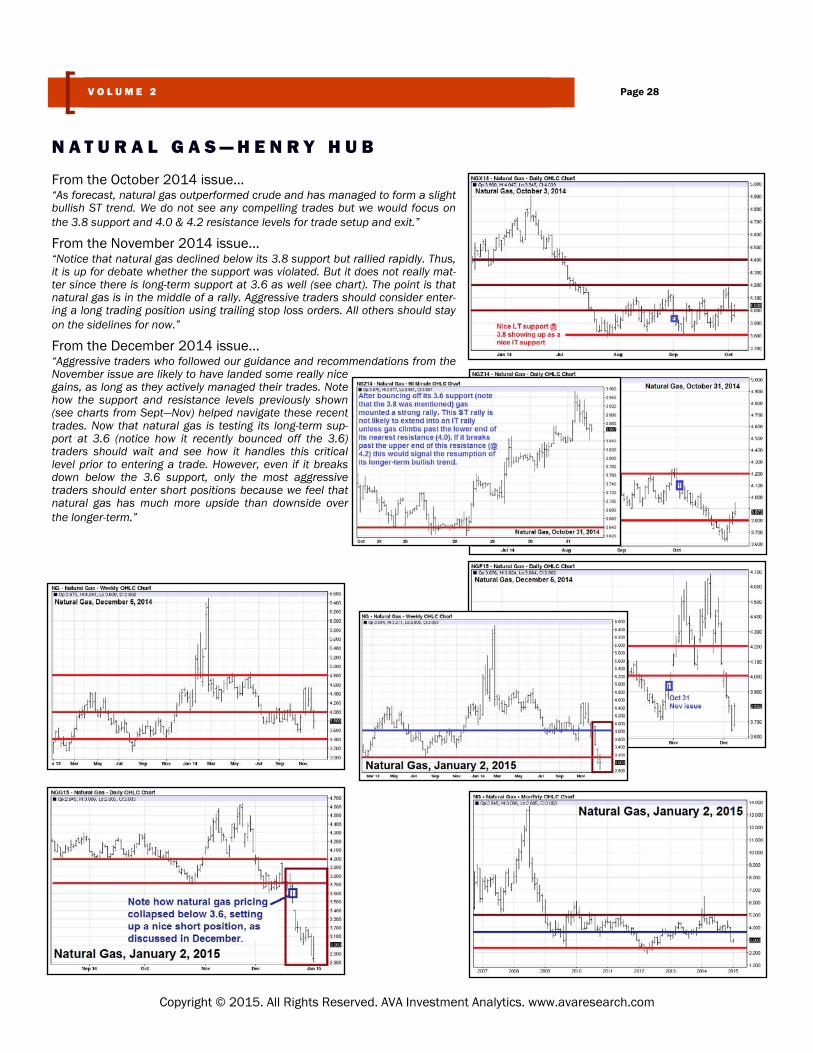
From the October 2014 issue… “As forecast, natural gas outperformed crude and has managed to form a slight bullish ST trend. We do not see any compelling trades but we would focus on the 3.8 support and 4.0 & 4.2 resistance levels for trade setup and exit.”
From the November 2014 issue… “Notice that natural gas declined below its 3.8 support but rallied rapidly. Thus, it is up for debate whether the support was violated. But it does not really mat-ter since there is long-term support at 3.6 as well (see chart). The point is that natural gas is in the middle of a rally. Aggressive traders should consider enter-ing a long trading position using trailing stop loss orders. All others should stay on the sidelines for now.”
From the December 2014 issue… “Aggressive traders who followed our guidance and recommendations from the November issue are likely to have landed some really nice gains, as long as they actively managed their trades. Note how the support and resistance levels previously shown (see charts from Sept—Nov) helped navigate these recent trades. Now that natural gas is testing its long-term sup-port at 3.6 (notice how it recently bounced off the 3.6) traders should wait and see how it handles this critical level prior to entering a trade. However, even if it breaks down below the 3.6 support, only the most aggressive traders should enter short positions because we feel that natural gas has much more upside than downside over the longer-term.”
N A T U R A L G A S — H E N R Y H U B
Page 28 V O L U M E 2
Copyright © 2015. All Rights Reserved. AVA Investment Analytics. www.avaresearch.com
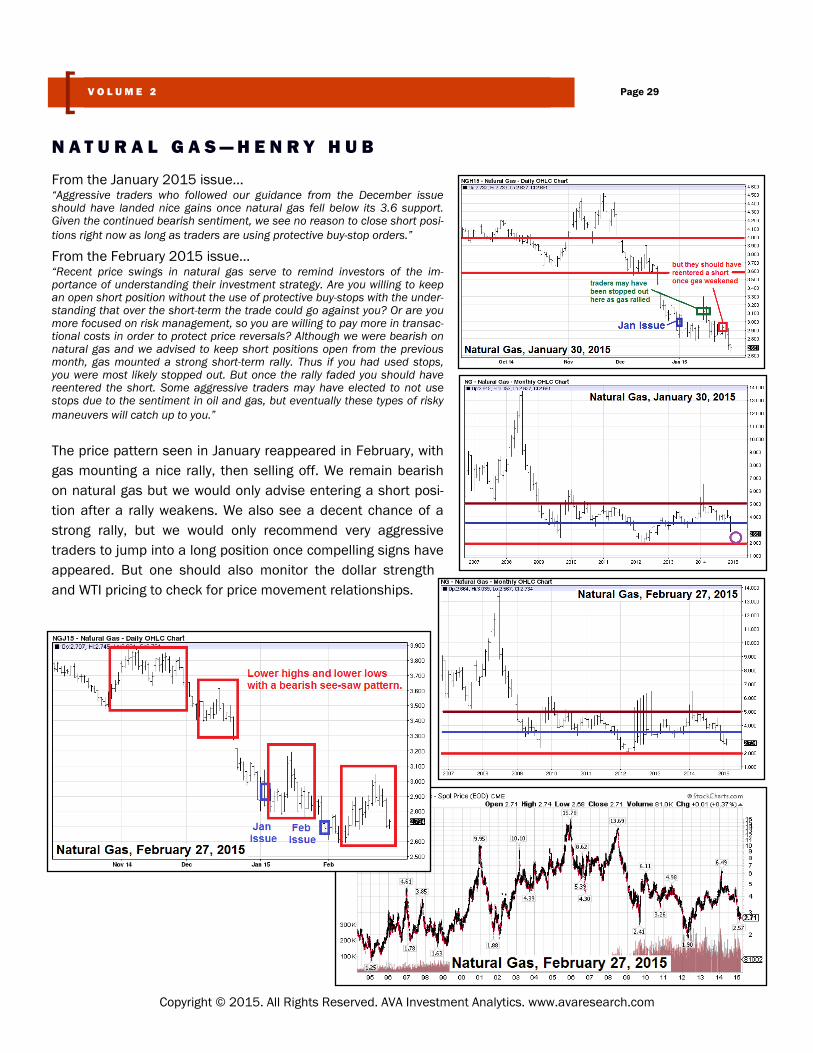
From the January 2015 issue… “Aggressive traders who followed our guidance from the December issue should have landed nice gains once natural gas fell below its 3.6 support. Given the continued bearish sentiment, we see no reason to close short posi-tions right now as long as traders are using protective buy-stop orders.”
From the February 2015 issue… “Recent price swings in natural gas serve to remind investors of the im-portance of understanding their investment strategy. Are you willing to keep an open short position without the use of protective buy-stops with the under-standing that over the short-term the trade could go against you? Or are you more focused on risk management, so you are willing to pay more in transac-tional costs in order to protect price reversals? Although we were bearish on natural gas and we advised to keep short positions open from the previous month, gas mounted a strong short-term rally. Thus if you had used stops, you were most likely stopped out. But once the rally faded you should have reentered the short. Some aggressive traders may have elected to not use stops due to the sentiment in oil and gas, but eventually these types of risky maneuvers will catch up to you.”
The price pattern seen in January reappeared in February, with gas mounting a nice rally, then selling off. We remain bearish on natural gas but we would only advise entering a short posi-tion after a rally weakens. We also see a decent chance of a strong rally, but we would only recommend very aggressive traders to jump into a long position once compelling signs have appeared. But one should also monitor the dollar strength and WTI pricing to check for price movement relationships.
N A T U R A L G A S — H E N R Y H U B
Page 29 V O L U M E 2
Copyright © 2015. All Rights Reserved. AVA Investment Analytics. www.avaresearch.com
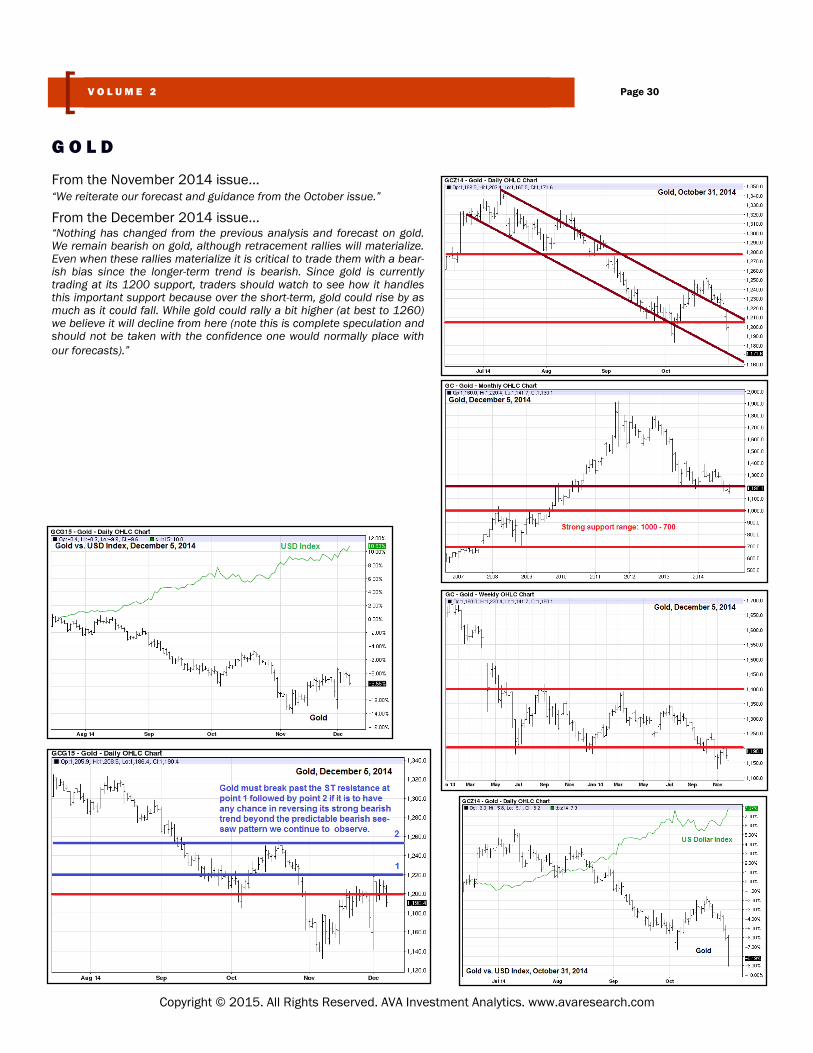
From the November 2014 issue… “We reiterate our forecast and guidance from the October issue.”
From the December 2014 issue… “Nothing has changed from the previous analysis and forecast on gold. We remain bearish on gold, although retracement rallies will materialize. Even when these rallies materialize it is critical to trade them with a bear-ish bias since the longer-term trend is bearish. Since gold is currently trading at its 1200 support, traders should watch to see how it handles this important support because over the short-term, gold could rise by as much as it could fall. While gold could rally a bit higher (at best to 1260) we believe it will decline from here (note this is complete speculation and should not be taken with the confidence one would normally place with our forecasts).”
G O L D
Page 30 V O L U M E 2
Copyright © 2015. All Rights Reserved. AVA Investment Analytics. www.avaresearch.com
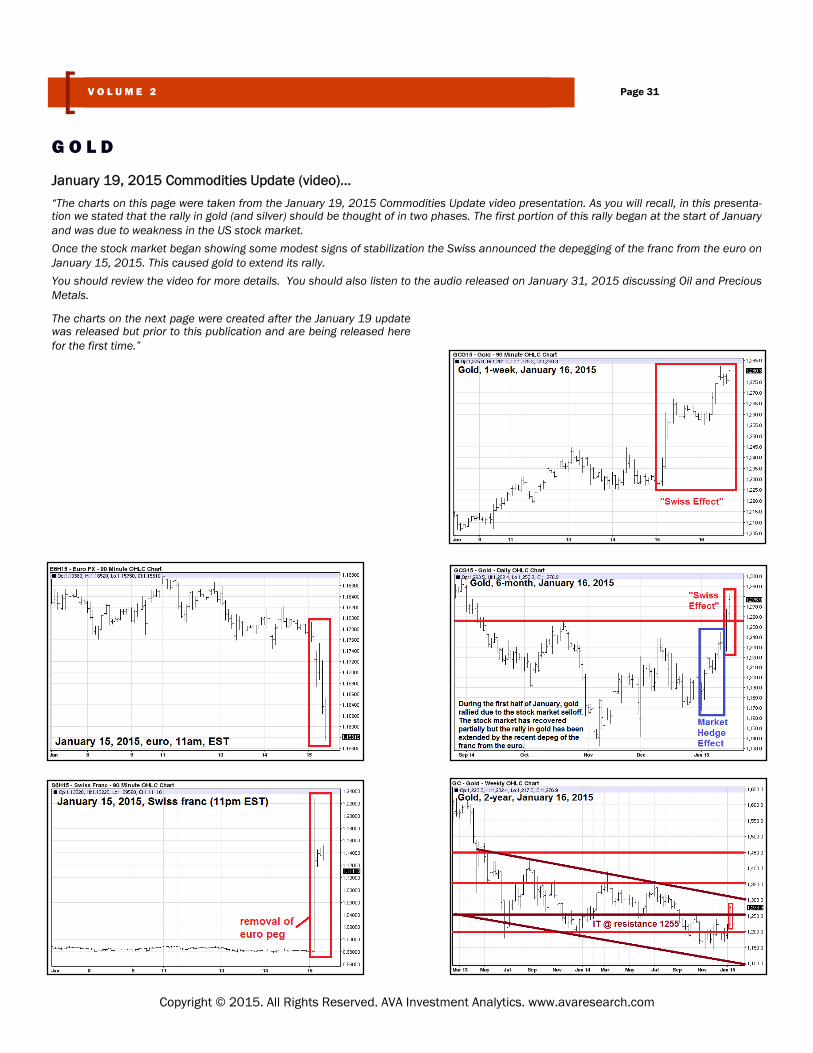
January 19, 2015 Commodities Update (video)…
“The charts on this page were taken from the January 19, 2015 Commodities Update video presentation. As you will recall, in this presenta-tion we stated that the rally in gold (and silver) should be thought of in two phases. The first portion of this rally began at the start of January and was due to weakness in the US stock market.
Once the stock market began showing some modest signs of stabilization the Swiss announced the depegging of the franc from the euro on January 15, 2015. This caused gold to extend its rally.
You should review the video for more details. You should also listen to the audio released on January 31, 2015 discussing Oil and Precious Metals.
G O L D
Page 31 V O L U M E 2
Copyright © 2015. All Rights Reserved. AVA Investment Analytics. www.avaresearch.com
The charts on the next page were created after the January 19 update was released but prior to this publication and are being released here for the first time.”
G O L D
Page 32 V O L U M E 2
Copyright © 2015. All Rights Reserved. AVA Investment Analytics. www.avaresearch.com

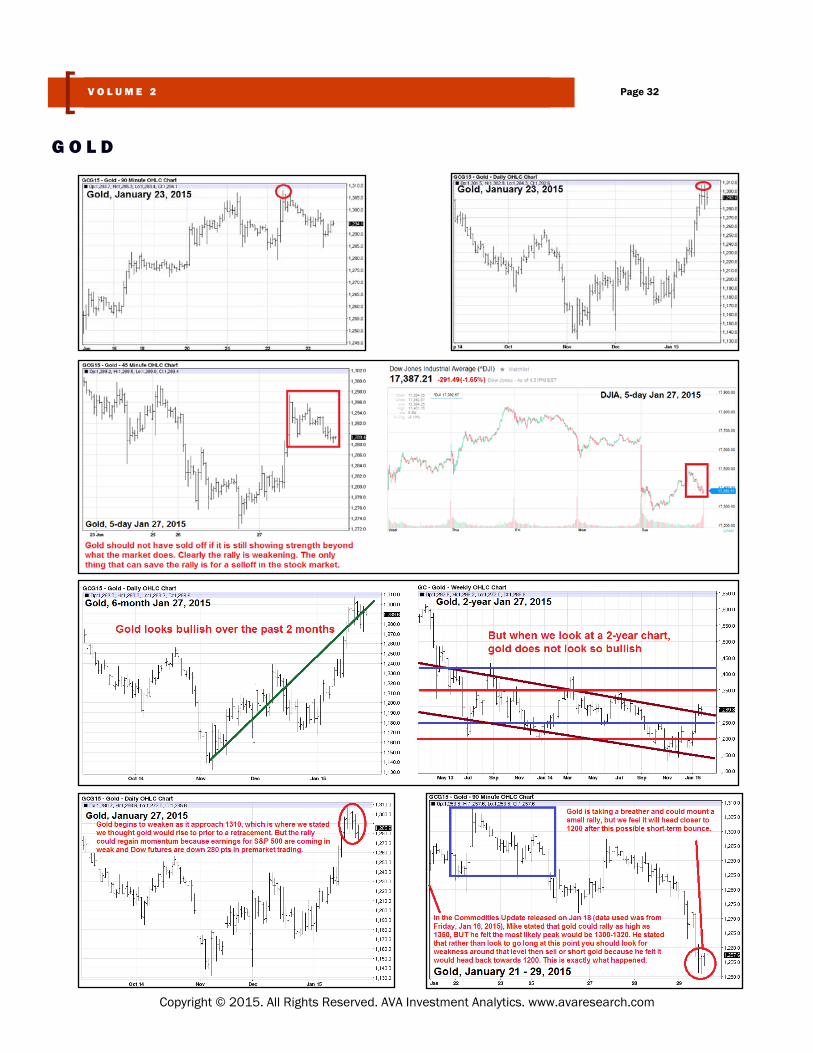
From the January 2015 issue… “The “speculative” analysis we provided in the December issue turned out to be quite accurate, as gold did in fact rally off its 1200 support, but did not exceed 1260. It rose to 1240 then sold off to lower levels as expected (relative to when the December issue was released). Although we remain bearish on gold, traders should continue to look for a bearish see-saw pattern when navigating trades. Currently gold is testing its 1200 support. We feel it will break down from this support in coming weeks. However, when trading gold, it is important to keep in mind the largest catalysts that can move gold (previously discussed).”
From the February 2015 issue… “As discussed in the January 19, 2015 Commodities Update video, in the Jan-uary issue we stated that gold had not yet confirmed a breakdown from the 1200 support. What that meant was that traders should have waited for a definitive move in either direction (the upside is usually favored until a break-down in support has been confirmed). No one could have foreseen the Swiss franc being suddenly unpegged from the euro, but active traders should have been able to jump into the trade.
[This trade would have been more difficult to catch if we had previously signaled that gold had confirmed a breakdown of its 1200 support because that would have meant that traders should be leaning towards entering a short position. But we did not recognize such a confirma-tion, so this should have helped alert traders jump into the rally early in the morning of Jan 15].
In the January 19 Update we discussed where we felt gold would head during this trading cycle. In short, we stated that although 1450 was theoretically possible, it was not likely unless some really significant wave of huge events materialized. We stated that the 1350 was possible but a bit “ambitious” for this cycle. Instead, we felt the most likely top would be between 1300 and 1320. We stated this was where we felt you should look for weakness, then sell and possibly even enter a short position once the weakness was con-firmed.
G O L D
Page 33 V O L U M E 2
Copyright © 2015. All Rights Reserved. AVA Investment Analytics. www.avaresearch.com
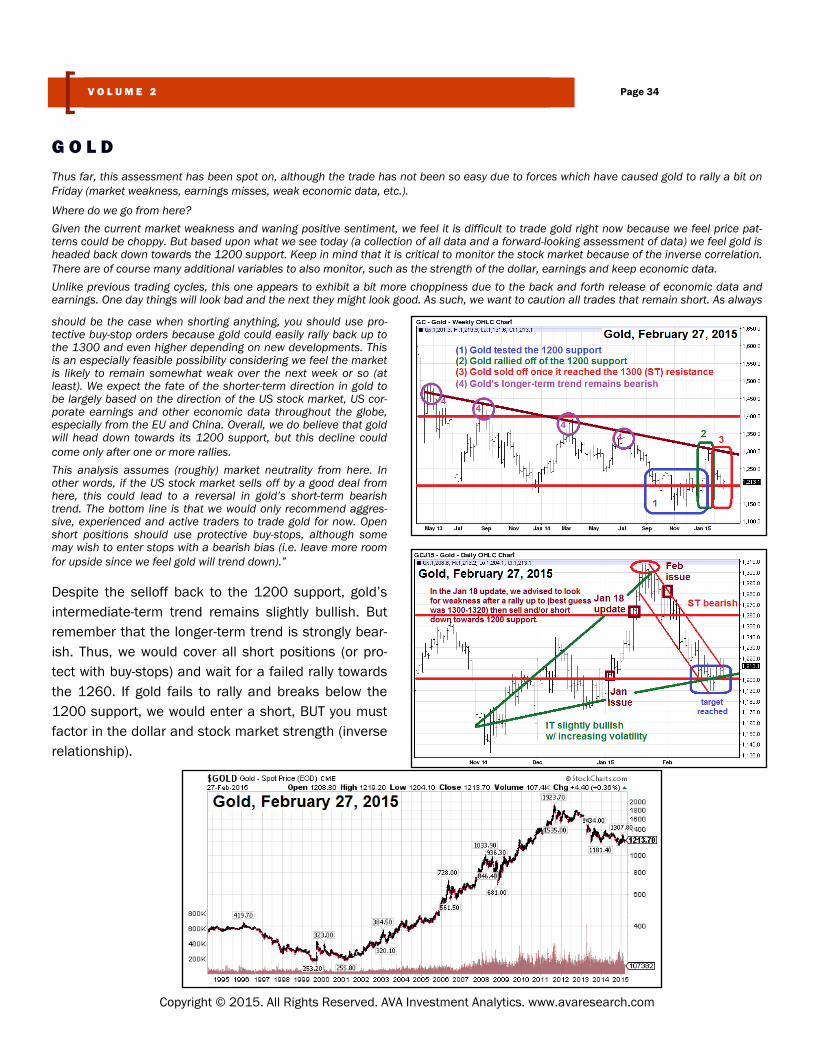
Thus far, this assessment has been spot on, although the trade has not been so easy due to forces which have caused gold to rally a bit on Friday (market weakness, earnings misses, weak economic data, etc.).
Where do we go from here?
Given the current market weakness and waning positive sentiment, we feel it is difficult to trade gold right now because we feel price pat-terns could be choppy. But based upon what we see today (a collection of all data and a forward-looking assessment of data) we feel gold is headed back down towards the 1200 support. Keep in mind that it is critical to monitor the stock market because of the inverse correlation. There are of course many additional variables to also monitor, such as the strength of the dollar, earnings and keep economic data.
Unlike previous trading cycles, this one appears to exhibit a bit more choppiness due to the back and forth release of economic data and earnings. One day things will look bad and the next they might look good. As such, we want to caution all trades that remain short. As always
G O L D
Page 34 V O L U M E 2
Copyright © 2015. All Rights Reserved. AVA Investment Analytics. www.avaresearch.com
should be the case when shorting anything, you should use pro-tective buy-stop orders because gold could easily rally back up to the 1300 and even higher depending on new developments. This is an especially feasible possibility considering we feel the market is likely to remain somewhat weak over the next week or so (at least). We expect the fate of the shorter-term direction in gold to be largely based on the direction of the US stock market, US cor-porate earnings and other economic data throughout the globe, especially from the EU and China. Overall, we do believe that gold will head down towards its 1200 support, but this decline could come only after one or more rallies.
This analysis assumes (roughly) market neutrality from here. In other words, if the US stock market sells off by a good deal from here, this could lead to a reversal in gold’s short-term bearish trend. The bottom line is that we would only recommend aggres-sive, experienced and active traders to trade gold for now. Open short positions should use protective buy-stops, although some may wish to enter stops with a bearish bias (i.e. leave more room for upside since we feel gold will trend down).”
Despite the selloff back to the 1200 support, gold’s intermediate-term trend remains slightly bullish. But remember that the longer-term trend is strongly bear-ish. Thus, we would cover all short positions (or pro-tect with buy-stops) and wait for a failed rally towards the 1260. If gold fails to rally and breaks below the 1200 support, we would enter a short, BUT you must factor in the dollar and stock market strength (inverse relationship).
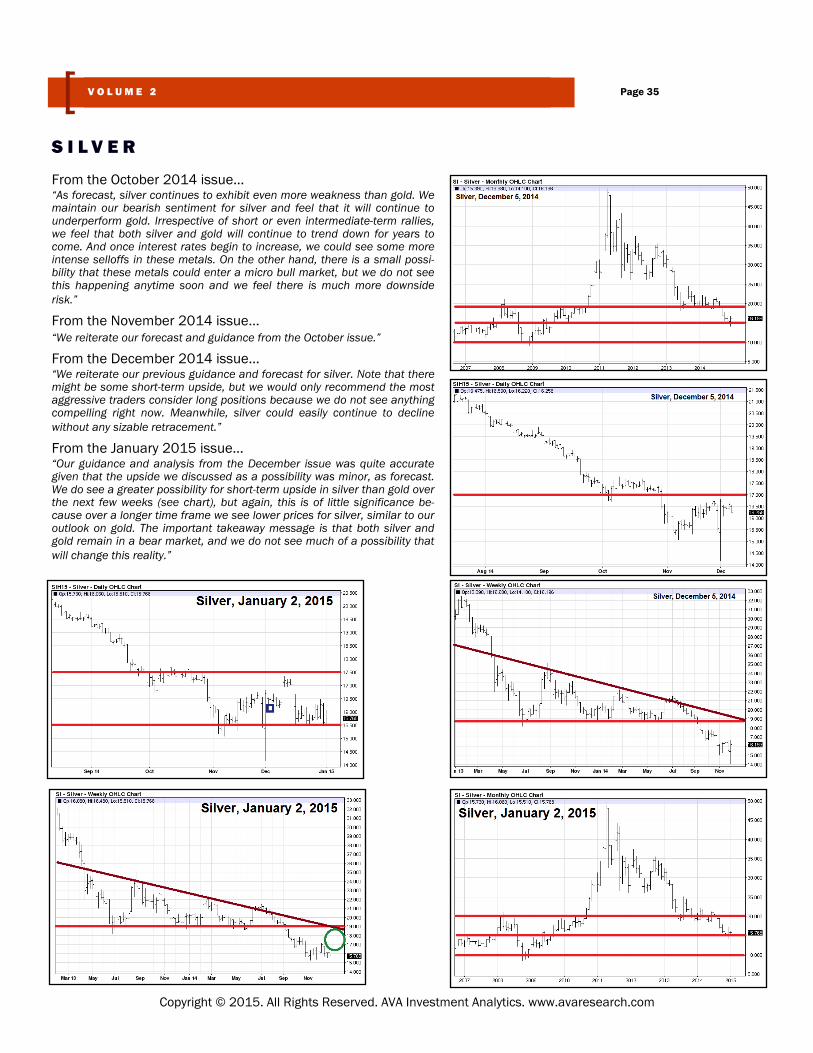
From the October 2014 issue… “As forecast, silver continues to exhibit even more weakness than gold. We maintain our bearish sentiment for silver and feel that it will continue to underperform gold. Irrespective of short or even intermediate-term rallies, we feel that both silver and gold will continue to trend down for years to come. And once interest rates begin to increase, we could see some more intense selloffs in these metals. On the other hand, there is a small possi-bility that these metals could enter a micro bull market, but we do not see this happening anytime soon and we feel there is much more downside risk.”
From the November 2014 issue… “We reiterate our forecast and guidance from the October issue.”
From the December 2014 issue… “We reiterate our previous guidance and forecast for silver. Note that there might be some short-term upside, but we would only recommend the most aggressive traders consider long positions because we do not see anything compelling right now. Meanwhile, silver could easily continue to decline without any sizable retracement.”
From the January 2015 issue… “Our guidance and analysis from the December issue was quite accurate given that the upside we discussed as a possibility was minor, as forecast. We do see a greater possibility for short-term upside in silver than gold over the next few weeks (see chart), but again, this is of little significance be-cause over a longer time frame we see lower prices for silver, similar to our outlook on gold. The important takeaway message is that both silver and gold remain in a bear market, and we do not see much of a possibility that will change this reality.”
S I L V E R
Page 35 V O L U M E 2
Copyright © 2015. All Rights Reserved. AVA Investment Analytics. www.avaresearch.com
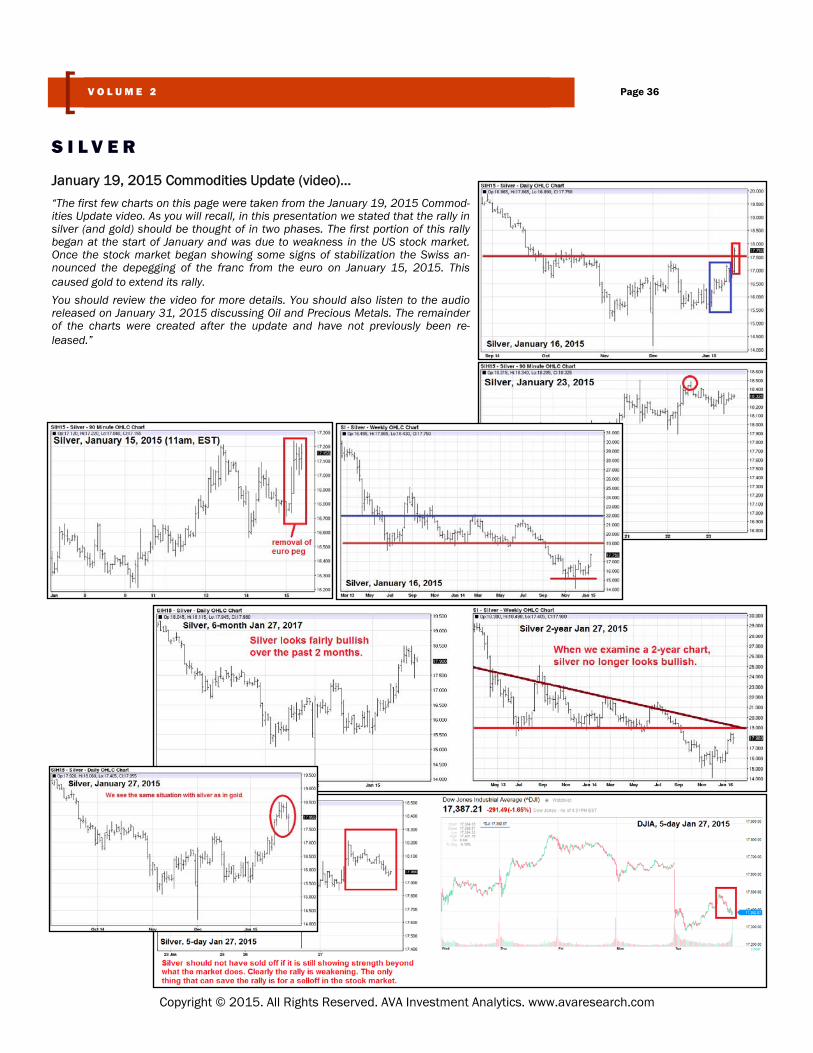
January 19, 2015 Commodities Update (video)…
“The first few charts on this page were taken from the January 19, 2015 Commod-ities Update video. As you will recall, in this presentation we stated that the rally in silver (and gold) should be thought of in two phases. The first portion of this rally began at the start of January and was due to weakness in the US stock market. Once the stock market began showing some signs of stabilization the Swiss an-nounced the depegging of the franc from the euro on January 15, 2015. This caused gold to extend its rally.
You should review the video for more details. You should also listen to the audio released on January 31, 2015 discussing Oil and Precious Metals. The remainder of the charts were created after the update and have not previously been re-leased.”
S I L V E R
Page 36 V O L U M E 2
Copyright © 2015. All Rights Reserved. AVA Investment Analytics. www.avaresearch.com

From the February 2015 issue… “In the January issue we discussed that gold had not yet confirmed a breakdown of its 1200 support. Although we did not specifically state a similar conclusion for silver, it was implied especially considering silver showed no signs of having broken through its 15.5 support.
[we often leave it to the reader to determine pricing for rallies and selloffs for silver by transposing such moves when they occur for gold onto silver].
As such, traders should have been looking for a rally off this support until silver broke down below the 15.5.
We even showed the potential upside on the 1-year chart (green circle). As it would turn out, this upside (shown as around 18.50 to 19.0) was precisely where silver topped off then began to reverse.
We share a similar analysis and guidance for silver as gold.”
Applying the guidance we laid out for gold, similar profits should have been made from the silver trade. Note there is a chance silver could retest the 19 resistance (perhaps a weak retest to around 18) but this would largely depend on the stock market. Assuming absence of substantial downside in the stock market, we feel silver will soon retest the 15.5 sup-port and could easily break below it, but we don’t see any compelling trades right now. We recommend short covering soon unless you see more downside (or enter buy-stops).
S I L V E R
Page 37 V O L U M E 2
Copyright © 2015. All Rights Reserved. AVA Investment Analytics. www.avaresearch.com
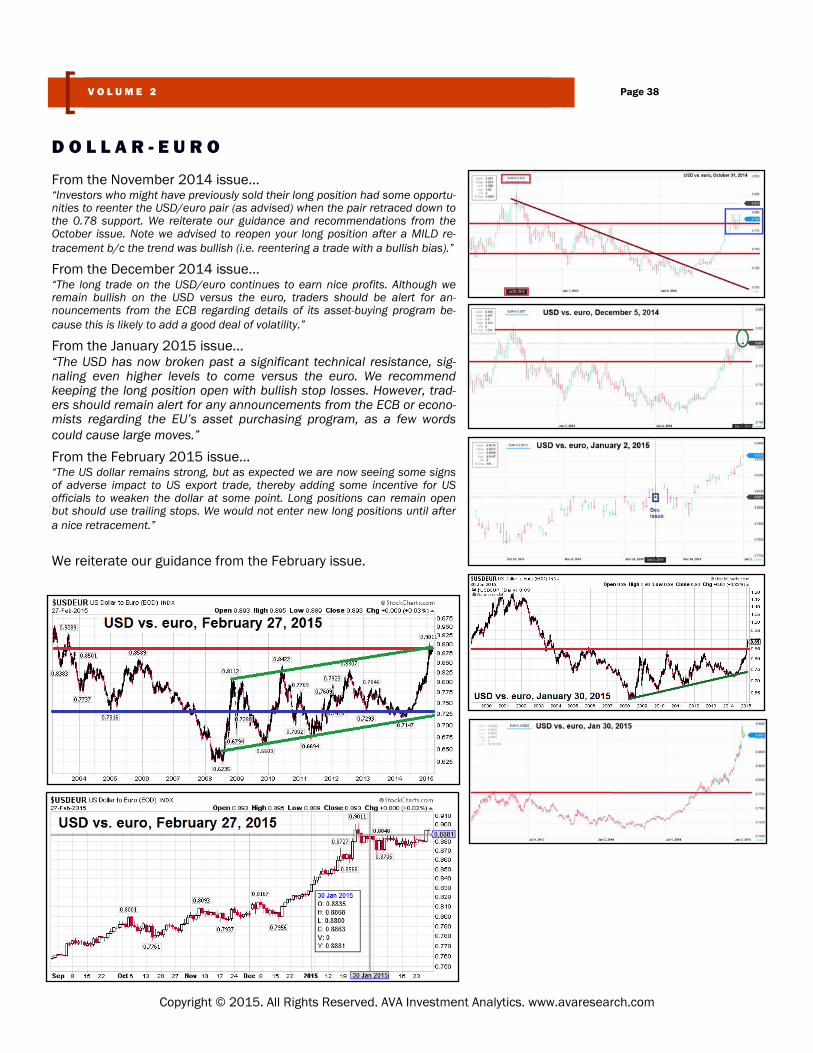
From the November 2014 issue… “Investors who might have previously sold their long position had some opportu-nities to reenter the USD/euro pair (as advised) when the pair retraced down to the 0.78 support. We reiterate our guidance and recommendations from the October issue. Note we advised to reopen your long position after a MILD re-tracement b/c the trend was bullish (i.e. reentering a trade with a bullish bias).”
From the December 2014 issue… “The long trade on the USD/euro continues to earn nice profits. Although we remain bullish on the USD versus the euro, traders should be alert for an-nouncements from the ECB regarding details of its asset-buying program be-cause this is likely to add a good deal of volatility.”
From the January 2015 issue… “The USD has now broken past a significant technical resistance, sig-naling even higher levels to come versus the euro. We recommend keeping the long position open with bullish stop losses. However, trad-ers should remain alert for any announcements from the ECB or econo-mists regarding the EU’s asset purchasing program, as a few words could cause large moves.”
From the February 2015 issue… “The US dollar remains strong, but as expected we are now seeing some signs of adverse impact to US export trade, thereby adding some incentive for US officials to weaken the dollar at some point. Long positions can remain open but should use trailing stops. We would not enter new long positions until after a nice retracement.”
We reiterate our guidance from the February issue.
D O L L A R - E U R O
Page 38 V O L U M E 2
Copyright © 2015. All Rights Reserved. AVA Investment Analytics. www.avaresearch.com
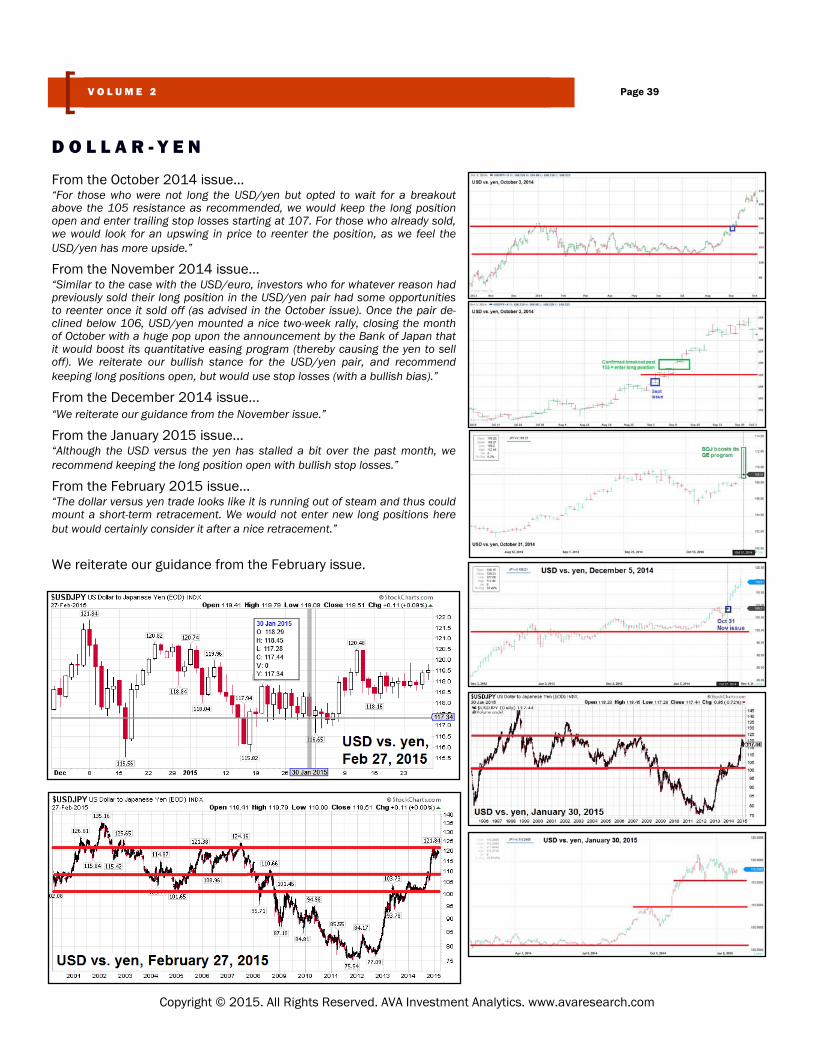
From the October 2014 issue… “For those who were not long the USD/yen but opted to wait for a breakout above the 105 resistance as recommended, we would keep the long position open and enter trailing stop losses starting at 107. For those who already sold, we would look for an upswing in price to reenter the position, as we feel the USD/yen has more upside.”
From the November 2014 issue… “Similar to the case with the USD/euro, investors who for whatever reason had previously sold their long position in the USD/yen pair had some opportunities to reenter once it sold off (as advised in the October issue). Once the pair de-clined below 106, USD/yen mounted a nice two-week rally, closing the month of October with a huge pop upon the announcement by the Bank of Japan that it would boost its quantitative easing program (thereby causing the yen to sell off). We reiterate our bullish stance for the USD/yen pair, and recommend keeping long positions open, but would use stop losses (with a bullish bias).”
From the December 2014 issue… “We reiterate our guidance from the November issue.”
From the January 2015 issue… “Although the USD versus the yen has stalled a bit over the past month, we recommend keeping the long position open with bullish stop losses.”
From the February 2015 issue… “The dollar versus yen trade looks like it is running out of steam and thus could mount a short-term retracement. We would not enter new long positions here but would certainly consider it after a nice retracement.”
We reiterate our guidance from the February issue.
D O L L A R - Y E N
Page 39 V O L U M E 2
Copyright © 2015. All Rights Reserved. AVA Investment Analytics. www.avaresearch.com
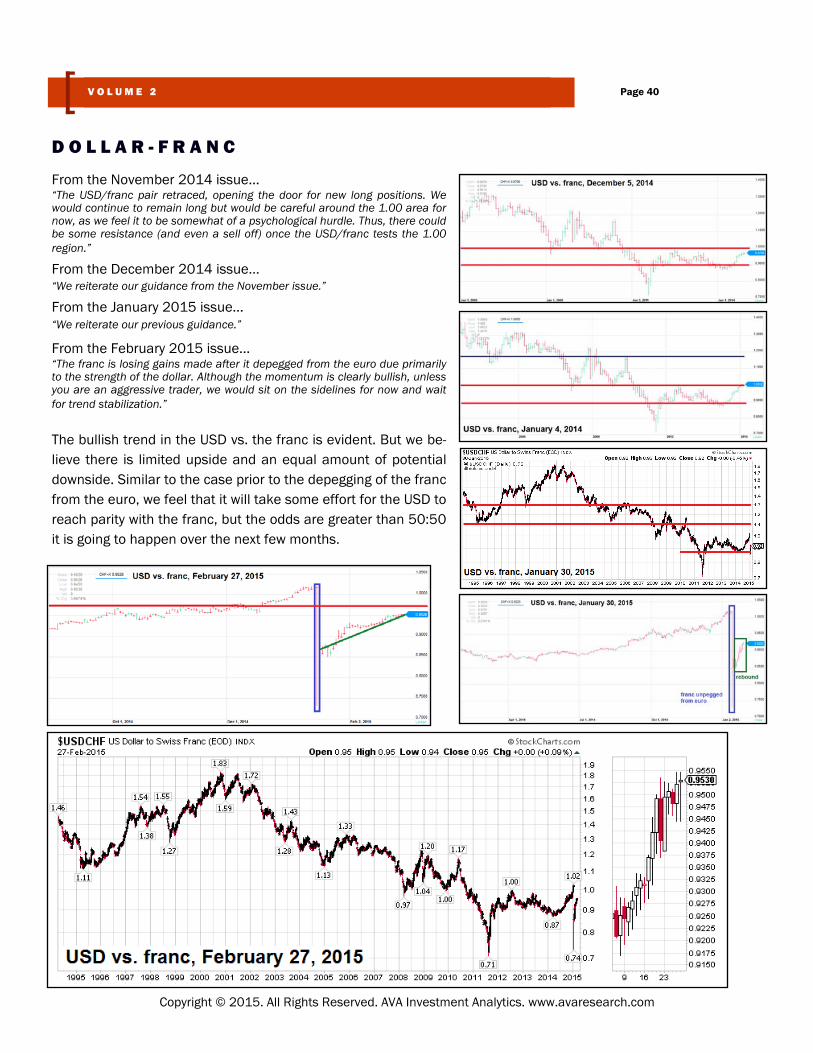
From the November 2014 issue… “The USD/franc pair retraced, opening the door for new long positions. We would continue to remain long but would be careful around the 1.00 area for now, as we feel it to be somewhat of a psychological hurdle. Thus, there could be some resistance (and even a sell off) once the USD/franc tests the 1.00 region.”
From the December 2014 issue… “We reiterate our guidance from the November issue.”
From the January 2015 issue… “We reiterate our previous guidance.”
From the February 2015 issue… “The franc is losing gains made after it depegged from the euro due primarily to the strength of the dollar. Although the momentum is clearly bullish, unless you are an aggressive trader, we would sit on the sidelines for now and wait for trend stabilization.”
The bullish trend in the USD vs. the franc is evident. But we be-lieve there is limited upside and an equal amount of potential downside. Similar to the case prior to the depegging of the franc from the euro, we feel that it will take some effort for the USD to reach parity with the franc, but the odds are greater than 50:50 it is going to happen over the next few months.
D O L L A R - F R A N C
Page 40 V O L U M E 2
Copyright © 2015. All Rights Reserved. AVA Investment Analytics. www.avaresearch.com
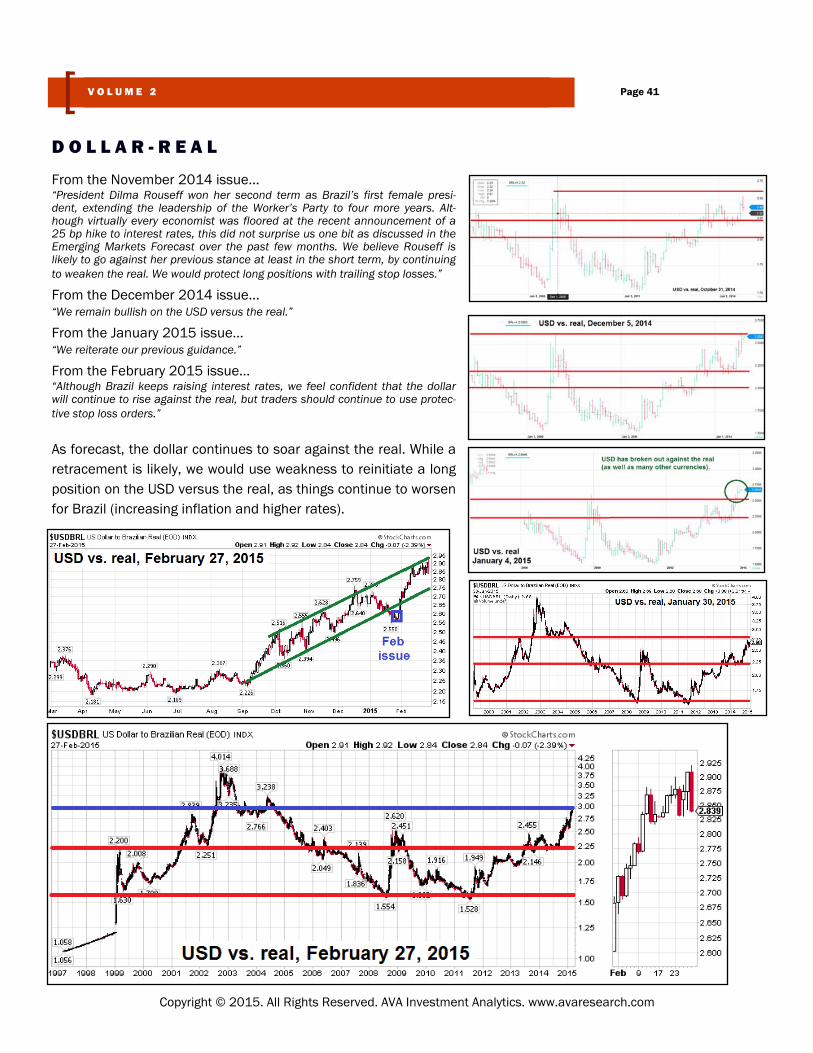
From the November 2014 issue… “President Dilma Rouseff won her second term as Brazil’s first female presi-dent, extending the leadership of the Worker’s Party to four more years. Alt-hough virtually every economist was floored at the recent announcement of a 25 bp hike to interest rates, this did not surprise us one bit as discussed in the Emerging Markets Forecast over the past few months. We believe Rouseff is likely to go against her previous stance at least in the short term, by continuing to weaken the real. We would protect long positions with trailing stop losses.”
From the December 2014 issue… “We remain bullish on the USD versus the real.”
From the January 2015 issue… “We reiterate our previous guidance.”
From the February 2015 issue… “Although Brazil keeps raising interest rates, we feel confident that the dollar will continue to rise against the real, but traders should continue to use protec-tive stop loss orders.”
As forecast, the dollar continues to soar against the real. While a retracement is likely, we would use weakness to reinitiate a long position on the USD versus the real, as things continue to worsen for Brazil (increasing inflation and higher rates).
D O L L A R - R E A L
Page 41 V O L U M E 2
Copyright © 2015. All Rights Reserved. AVA Investment Analytics. www.avaresearch.com
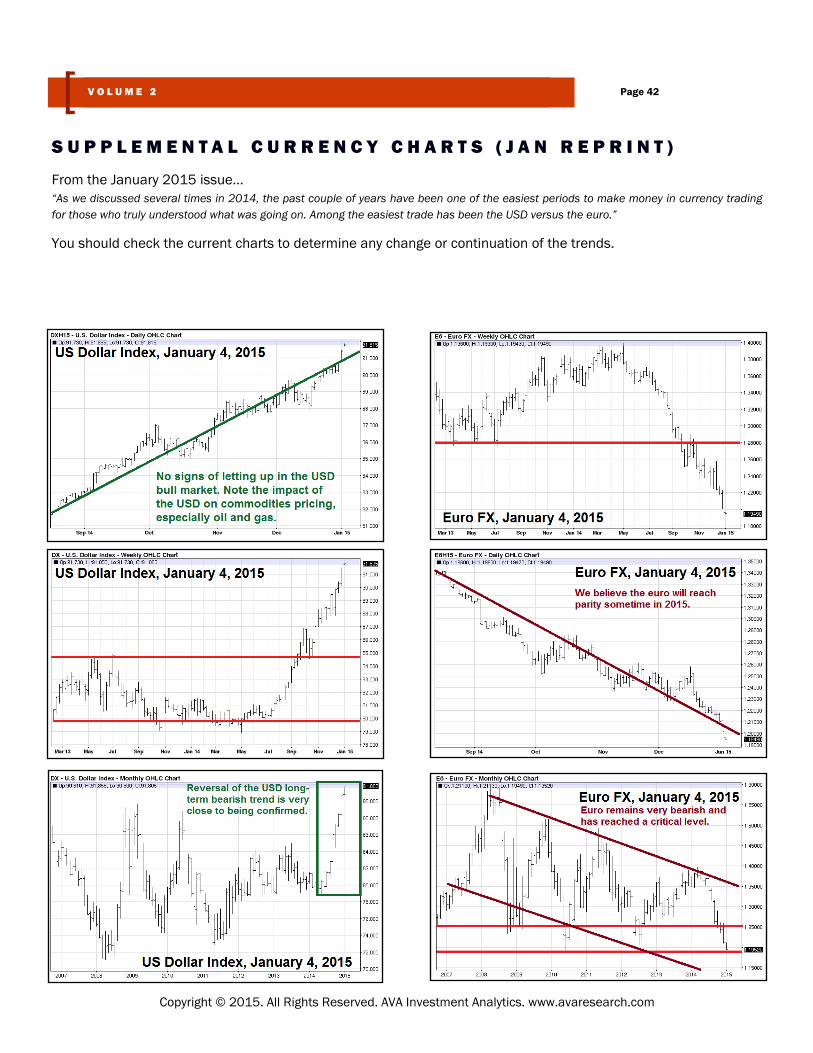
From the January 2015 issue… “As we discussed several times in 2014, the past couple of years have been one of the easiest periods to make money in currency trading for those who truly understood what was going on. Among the easiest trade has been the USD versus the euro.”
You should check the current charts to determine any change or continuation of the trends.
S U P P L E M E N T A L C U R R E N C Y C H A R T S ( J A N R E P R I N T )
Page 42 V O L U M E 2
Copyright © 2015. All Rights Reserved. AVA Investment Analytics. www.avaresearch.com
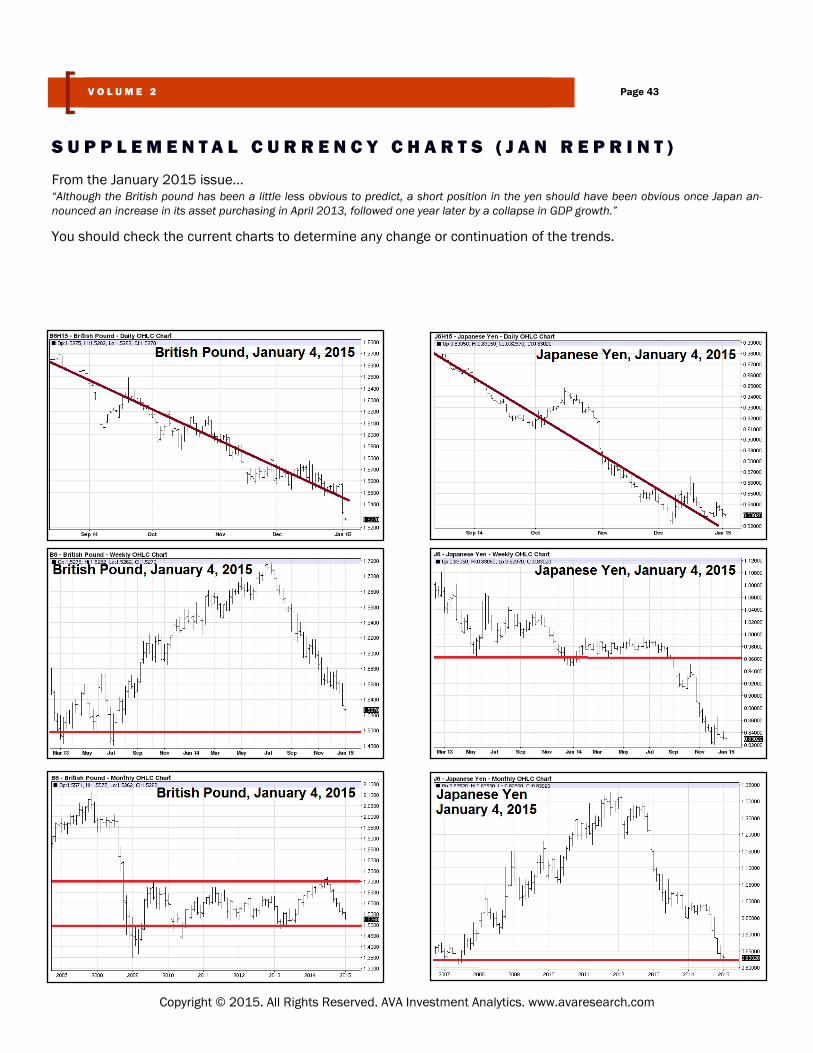
From the January 2015 issue… “Although the British pound has been a little less obvious to predict, a short position in the yen should have been obvious once Japan an-nounced an increase in its asset purchasing in April 2013, followed one year later by a collapse in GDP growth.”
You should check the current charts to determine any change or continuation of the trends.
S U P P L E M E N T A L C U R R E N C Y C H A R T S ( J A N R E P R I N T )
Page 43 V O L U M E 2
Copyright © 2015. All Rights Reserved. AVA Investment Analytics. www.avaresearch.com

From the January 2015 issue… “Shorting the Australian and Canadian dollars have also been easy money since 2013. By fall 2014, if you hadn’t taken large short positions in these currencies, you probably should never trade currencies.”
You should check the current charts to determine any change or continuation of the trends.
S U P P L E M E N T A L C U R R E N C Y C H A R T S ( J A N R E P R I N T )
Page 44 V O L U M E 2
Copyright © 2015. All Rights Reserved. AVA Investment Analytics. www.avaresearch.com
G O L D & S I L V E R
A N A L Y S I S & F O R E C A S T I N G A R C H I V E S
Page 45 V O L U M E 2
Copyright © 2015. All Rights Reserved. AVA Investment Analytics. www.avaresearch.com
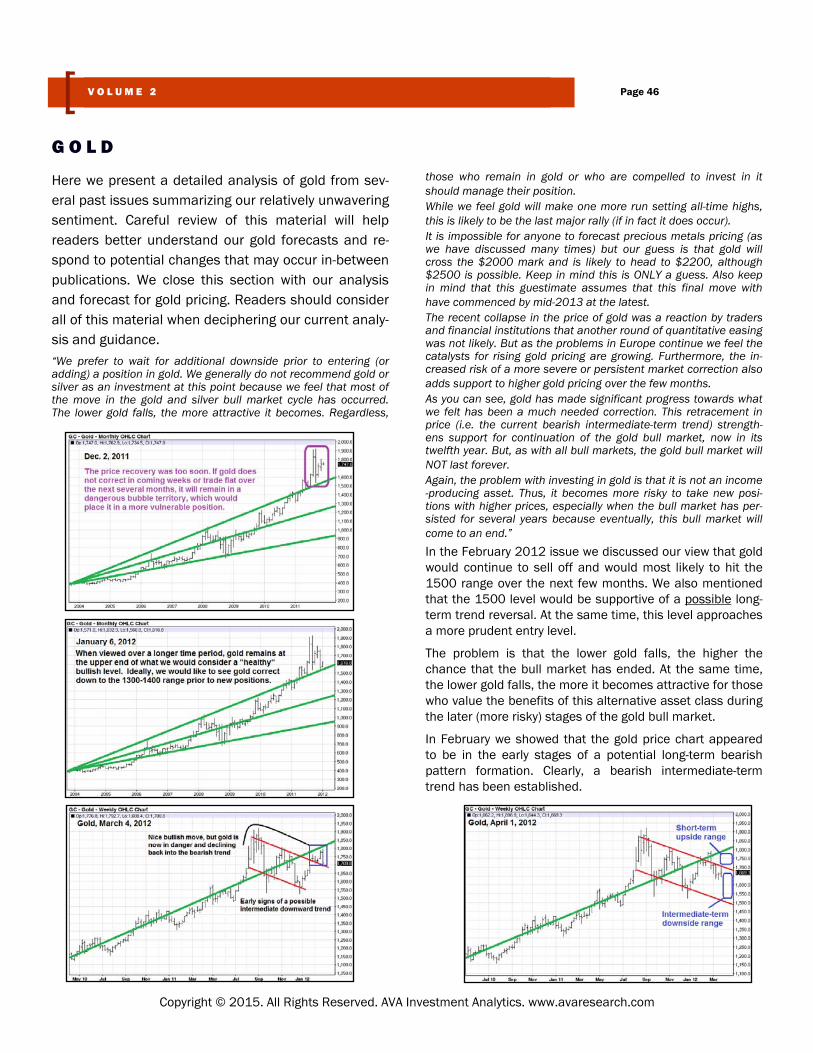
Here we present a detailed analysis of gold from sev-eral past issues summarizing our relatively unwavering sentiment. Careful review of this material will help readers better understand our gold forecasts and re-spond to potential changes that may occur in-between publications. We close this section with our analysis and forecast for gold pricing. Readers should consider all of this material when deciphering our current analy-sis and guidance. “We prefer to wait for additional downside prior to entering (or adding) a position in gold. We generally do not recommend gold or silver as an investment at this point because we feel that most of the move in the gold and silver bull market cycle has occurred. The lower gold falls, the more attractive it becomes. Regardless,
those who remain in gold or who are compelled to invest in it should manage their position. While we feel gold will make one more run setting all-time highs, this is likely to be the last major rally (if in fact it does occur). It is impossible for anyone to forecast precious metals pricing (as we have discussed many times) but our guess is that gold will cross the $2000 mark and is likely to head to $2200, although $2500 is possible. Keep in mind this is ONLY a guess. Also keep in mind that this guestimate assumes that this final move with have commenced by mid-2013 at the latest. The recent collapse in the price of gold was a reaction by traders and financial institutions that another round of quantitative easing was not likely. But as the problems in Europe continue we feel the catalysts for rising gold pricing are growing. Furthermore, the in-creased risk of a more severe or persistent market correction also adds support to higher gold pricing over the few months. As you can see, gold has made significant progress towards what we felt has been a much needed correction. This retracement in price (i.e. the current bearish intermediate-term trend) strength-ens support for continuation of the gold bull market, now in its twelfth year. But, as with all bull markets, the gold bull market will NOT last forever. Again, the problem with investing in gold is that it is not an income-producing asset. Thus, it becomes more risky to take new posi-tions with higher prices, especially when the bull market has per-sisted for several years because eventually, this bull market will come to an end.”
In the February 2012 issue we discussed our view that gold would continue to sell off and would most likely to hit the 1500 range over the next few months. We also mentioned that the 1500 level would be supportive of a possible long-term trend reversal. At the same time, this level approaches a more prudent entry level.
The problem is that the lower gold falls, the higher the chance that the bull market has ended. At the same time, the lower gold falls, the more it becomes attractive for those who value the benefits of this alternative asset class during the later (more risky) stages of the gold bull market.
In February we showed that the gold price chart appeared to be in the early stages of a potential long-term bearish pattern formation. Clearly, a bearish intermediate-term trend has been established.
G O L D
Page 46 V O L U M E 2
Copyright © 2015. All Rights Reserved. AVA Investment Analytics. www.avaresearch.com
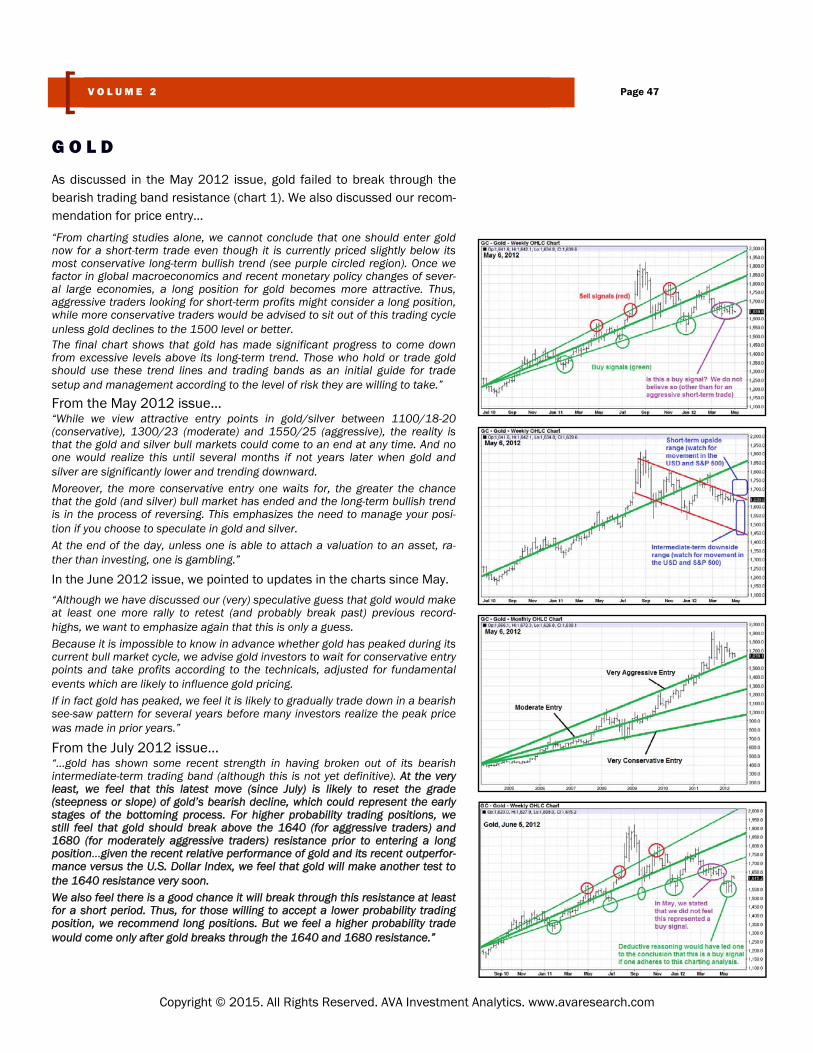
As discussed in the May 2012 issue, gold failed to break through the bearish trading band resistance (chart 1). We also discussed our recom-mendation for price entry…
“From charting studies alone, we cannot conclude that one should enter gold now for a short-term trade even though it is currently priced slightly below its most conservative long-term bullish trend (see purple circled region). Once we factor in global macroeconomics and recent monetary policy changes of sever-al large economies, a long position for gold becomes more attractive. Thus, aggressive traders looking for short-term profits might consider a long position, while more conservative traders would be advised to sit out of this trading cycle unless gold declines to the 1500 level or better. The final chart shows that gold has made significant progress to come down from excessive levels above its long-term trend. Those who hold or trade gold should use these trend lines and trading bands as an initial guide for trade setup and management according to the level of risk they are willing to take.”
From the May 2012 issue… “While we view attractive entry points in gold/silver between 1100/18-20 (conservative), 1300/23 (moderate) and 1550/25 (aggressive), the reality is that the gold and silver bull markets could come to an end at any time. And no one would realize this until several months if not years later when gold and silver are significantly lower and trending downward. Moreover, the more conservative entry one waits for, the greater the chance that the gold (and silver) bull market has ended and the long-term bullish trend is in the process of reversing. This emphasizes the need to manage your posi-tion if you choose to speculate in gold and silver. At the end of the day, unless one is able to attach a valuation to an asset, ra-ther than investing, one is gambling.” In the June 2012 issue, we pointed to updates in the charts since May.
“Although we have discussed our (very) speculative guess that gold would make at least one more rally to retest (and probably break past) previous record-highs, we want to emphasize again that this is only a guess. Because it is impossible to know in advance whether gold has peaked during its current bull market cycle, we advise gold investors to wait for conservative entry points and take profits according to the technicals, adjusted for fundamental events which are likely to influence gold pricing. If in fact gold has peaked, we feel it is likely to gradually trade down in a bearish see-saw pattern for several years before many investors realize the peak price was made in prior years.” From the July 2012 issue... “...gold has shown some recent strength in having broken out of its bearish intermediate-term trading band (although this is not yet definitive). At the very least, we feel that this latest move (since July) is likely to reset the grade (steepness or slope) of gold’s bearish decline, which could represent the early stages of the bottoming process. For higher probability trading positions, we still feel that gold should break above the 1640 (for aggressive traders) and 1680 (for moderately aggressive traders) resistance prior to entering a long position...given the recent relative performance of gold and its recent outperfor-mance versus the U.S. Dollar Index, we feel that gold will make another test to the 1640 resistance very soon. We also feel there is a good chance it will break through this resistance at least for a short period. Thus, for those willing to accept a lower probability trading position, we recommend long positions. But we feel a higher probability trade would come only after gold breaks through the 1640 and 1680 resistance.”
G O L D
Page 47 V O L U M E 2
Copyright © 2015. All Rights Reserved. AVA Investment Analytics. www.avaresearch.com
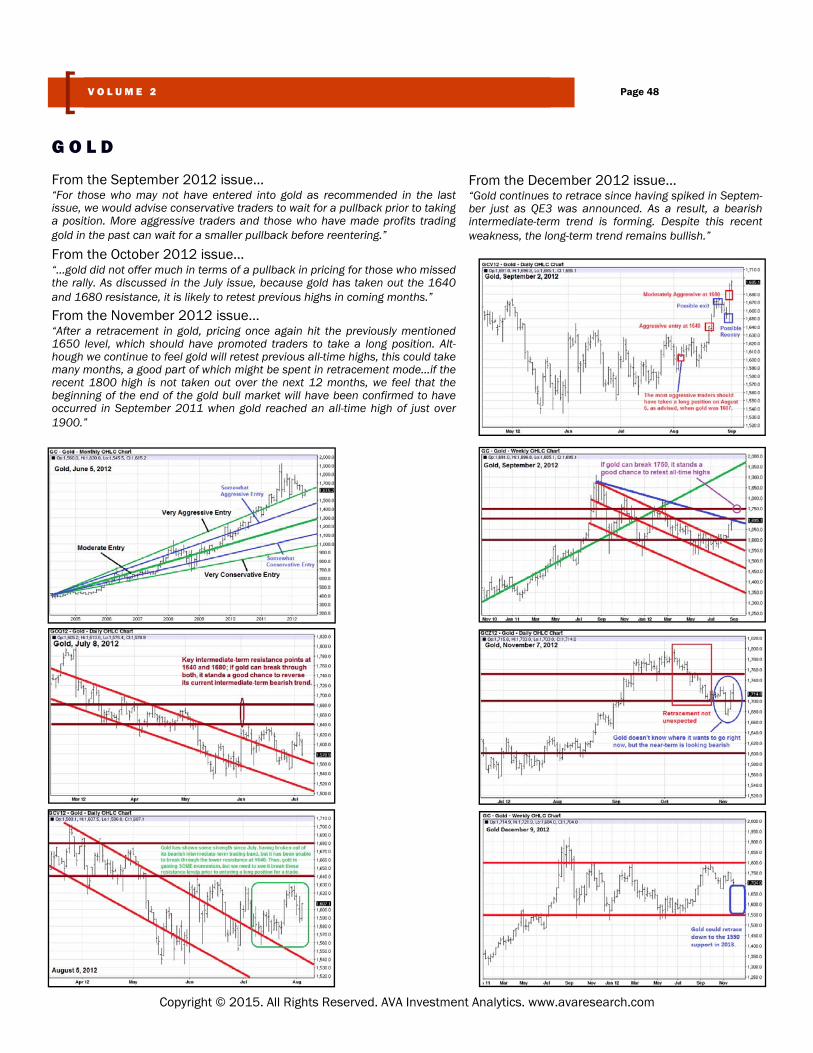
From the September 2012 issue… “For those who may not have entered into gold as recommended in the last issue, we would advise conservative traders to wait for a pullback prior to taking a position. More aggressive traders and those who have made profits trading gold in the past can wait for a smaller pullback before reentering.”
From the October 2012 issue… “...gold did not offer much in terms of a pullback in pricing for those who missed the rally. As discussed in the July issue, because gold has taken out the 1640 and 1680 resistance, it is likely to retest previous highs in coming months.”
From the November 2012 issue… “After a retracement in gold, pricing once again hit the previously mentioned 1650 level, which should have promoted traders to take a long position. Alt-hough we continue to feel gold will retest previous all-time highs, this could take many months, a good part of which might be spent in retracement mode...if the recent 1800 high is not taken out over the next 12 months, we feel that the beginning of the end of the gold bull market will have been confirmed to have occurred in September 2011 when gold reached an all-time high of just over 1900.”
From the December 2012 issue… “Gold continues to retrace since having spiked in Septem-ber just as QE3 was announced. As a result, a bearish intermediate-term trend is forming. Despite this recent weakness, the long-term trend remains bullish.”
G O L D
Page 48 V O L U M E 2
Copyright © 2015. All Rights Reserved. AVA Investment Analytics. www.avaresearch.com
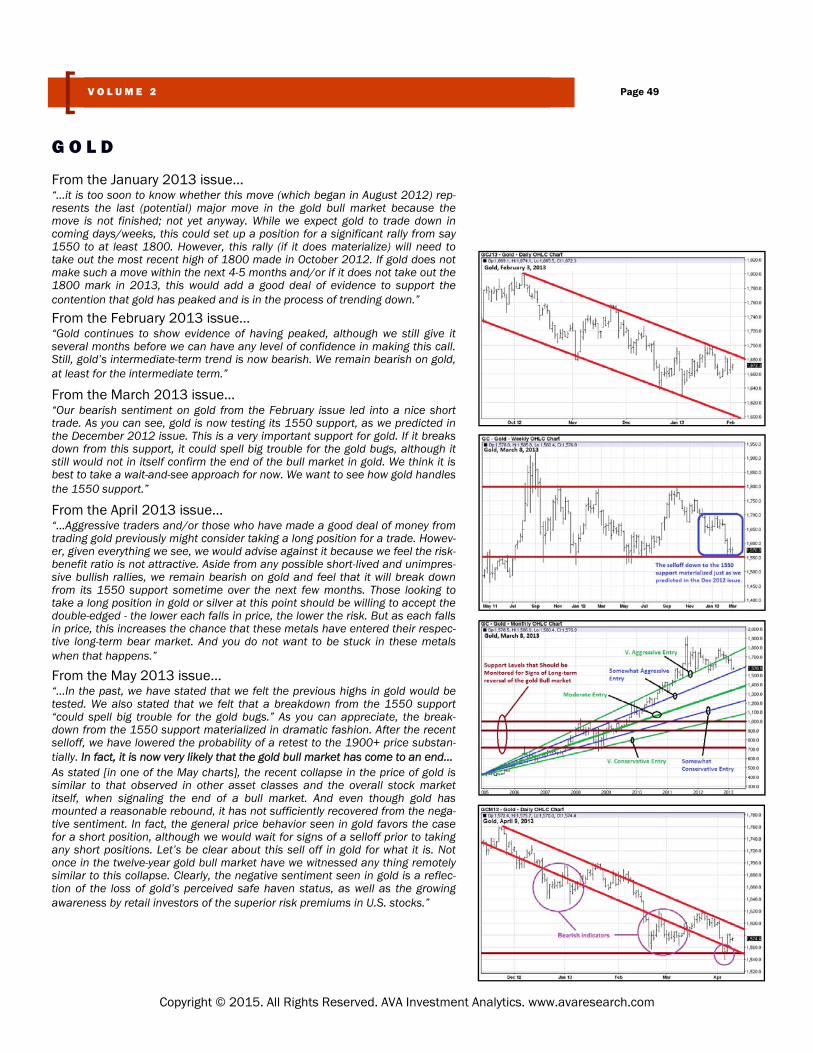
G O L D
Page 49 V O L U M E 2
Copyright © 2015. All Rights Reserved. AVA Investment Analytics. www.avaresearch.com
From the January 2013 issue… “...it is too soon to know whether this move (which began in August 2012) rep-resents the last (potential) major move in the gold bull market because the move is not finished; not yet anyway. While we expect gold to trade down in coming days/weeks, this could set up a position for a significant rally from say 1550 to at least 1800. However, this rally (if it does materialize) will need to take out the most recent high of 1800 made in October 2012. If gold does not make such a move within the next 4-5 months and/or if it does not take out the 1800 mark in 2013, this would add a good deal of evidence to support the contention that gold has peaked and is in the process of trending down.”
From the February 2013 issue… “Gold continues to show evidence of having peaked, although we still give it several months before we can have any level of confidence in making this call. Still, gold’s intermediate-term trend is now bearish. We remain bearish on gold, at least for the intermediate term.”
From the March 2013 issue… “Our bearish sentiment on gold from the February issue led into a nice short trade. As you can see, gold is now testing its 1550 support, as we predicted in the December 2012 issue. This is a very important support for gold. If it breaks down from this support, it could spell big trouble for the gold bugs, although it still would not in itself confirm the end of the bull market in gold. We think it is best to take a wait-and-see approach for now. We want to see how gold handles the 1550 support.”
From the April 2013 issue… “...Aggressive traders and/or those who have made a good deal of money from trading gold previously might consider taking a long position for a trade. Howev-er, given everything we see, we would advise against it because we feel the risk-benefit ratio is not attractive. Aside from any possible short-lived and unimpres-sive bullish rallies, we remain bearish on gold and feel that it will break down from its 1550 support sometime over the next few months. Those looking to take a long position in gold or silver at this point should be willing to accept the double-edged - the lower each falls in price, the lower the risk. But as each falls in price, this increases the chance that these metals have entered their respec-tive long-term bear market. And you do not want to be stuck in these metals when that happens.”
From the May 2013 issue… “...In the past, we have stated that we felt the previous highs in gold would be tested. We also stated that we felt that a breakdown from the 1550 support “could spell big trouble for the gold bugs.” As you can appreciate, the break-down from the 1550 support materialized in dramatic fashion. After the recent selloff, we have lowered the probability of a retest to the 1900+ price substan-tially. In fact, it is now very likely that the gold bull market has come to an end... As stated [in one of the May charts], the recent collapse in the price of gold is similar to that observed in other asset classes and the overall stock market itself, when signaling the end of a bull market. And even though gold has mounted a reasonable rebound, it has not sufficiently recovered from the nega-tive sentiment. In fact, the general price behavior seen in gold favors the case for a short position, although we would wait for signs of a selloff prior to taking any short positions. Let’s be clear about this sell off in gold for what it is. Not once in the twelve-year gold bull market have we witnessed any thing remotely similar to this collapse. Clearly, the negative sentiment seen in gold is a reflec-tion of the loss of gold’s perceived safe haven status, as well as the growing awareness by retail investors of the superior risk premiums in U.S. stocks.”
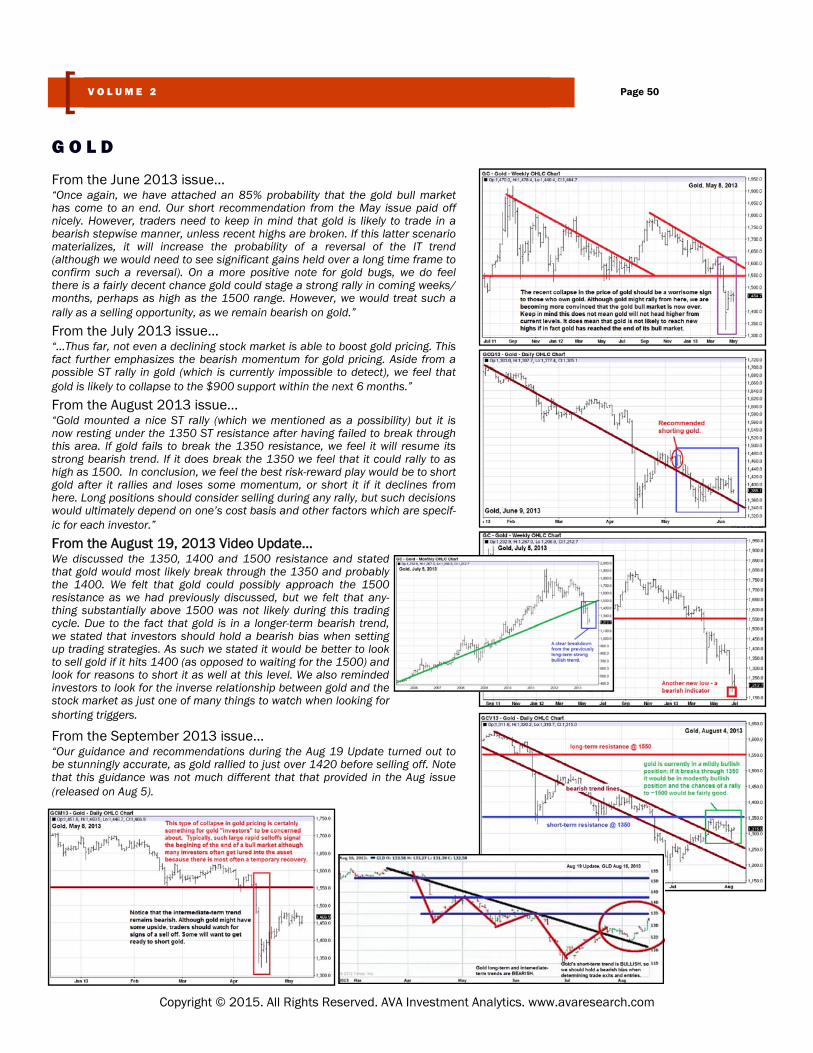
From the June 2013 issue… “Once again, we have attached an 85% probability that the gold bull market has come to an end. Our short recommendation from the May issue paid off nicely. However, traders need to keep in mind that gold is likely to trade in a bearish stepwise manner, unless recent highs are broken. If this latter scenario materializes, it will increase the probability of a reversal of the IT trend (although we would need to see significant gains held over a long time frame to confirm such a reversal). On a more positive note for gold bugs, we do feel there is a fairly decent chance gold could stage a strong rally in coming weeks/months, perhaps as high as the 1500 range. However, we would treat such a rally as a selling opportunity, as we remain bearish on gold.”
From the July 2013 issue… “…Thus far, not even a declining stock market is able to boost gold pricing. This fact further emphasizes the bearish momentum for gold pricing. Aside from a possible ST rally in gold (which is currently impossible to detect), we feel that gold is likely to collapse to the $900 support within the next 6 months.”
From the August 2013 issue… “Gold mounted a nice ST rally (which we mentioned as a possibility) but it is now resting under the 1350 ST resistance after having failed to break through this area. If gold fails to break the 1350 resistance, we feel it will resume its strong bearish trend. If it does break the 1350 we feel that it could rally to as high as 1500. In conclusion, we feel the best risk-reward play would be to short gold after it rallies and loses some momentum, or short it if it declines from here. Long positions should consider selling during any rally, but such decisions would ultimately depend on one’s cost basis and other factors which are specif-ic for each investor.” From the August 19, 2013 Video Update… We discussed the 1350, 1400 and 1500 resistance and stated that gold would most likely break through the 1350 and probably the 1400. We felt that gold could possibly approach the 1500 resistance as we had previously discussed, but we felt that any-thing substantially above 1500 was not likely during this trading cycle. Due to the fact that gold is in a longer-term bearish trend, we stated that investors should hold a bearish bias when setting up trading strategies. As such we stated it would be better to look to sell gold if it hits 1400 (as opposed to waiting for the 1500) and look for reasons to short it as well at this level. We also reminded investors to look for the inverse relationship between gold and the stock market as just one of many things to watch when looking for shorting triggers.
From the September 2013 issue… “Our guidance and recommendations during the Aug 19 Update turned out to be stunningly accurate, as gold rallied to just over 1420 before selling off. Note that this guidance was not much different that that provided in the Aug issue (released on Aug 5).
G O L D
Page 50 V O L U M E 2
Copyright © 2015. All Rights Reserved. AVA Investment Analytics. www.avaresearch.com
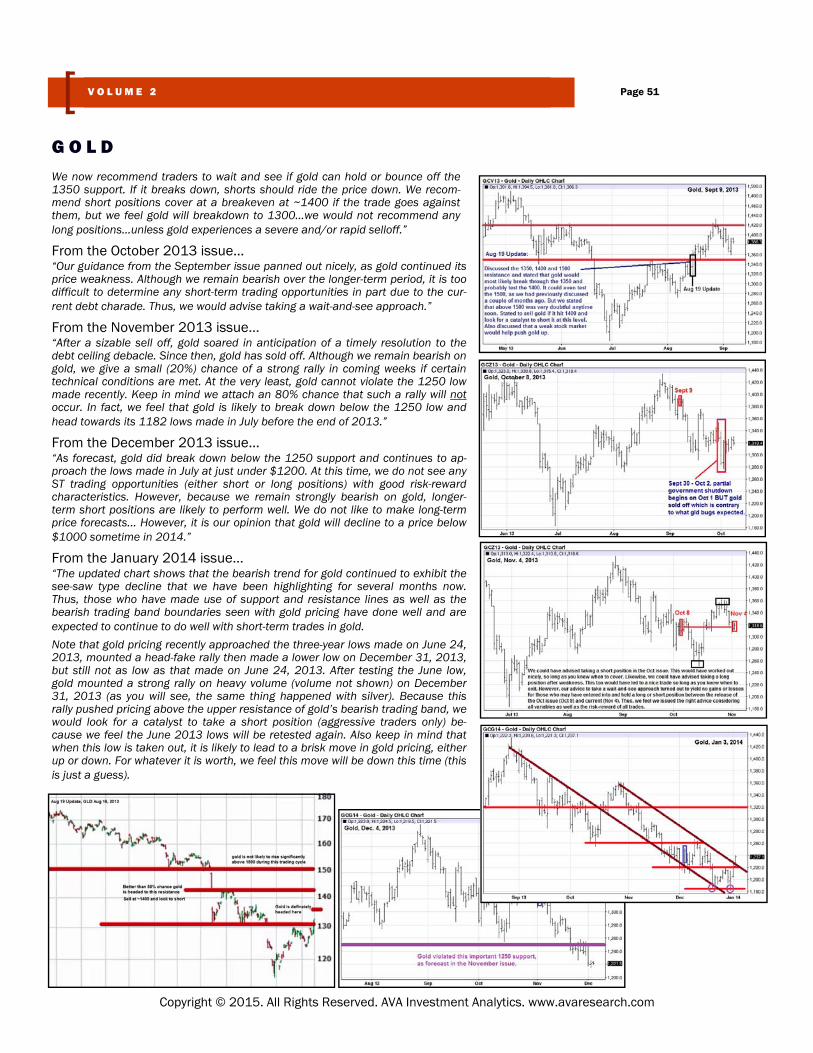
We now recommend traders to wait and see if gold can hold or bounce off the 1350 support. If it breaks down, shorts should ride the price down. We recom-mend short positions cover at a breakeven at ~1400 if the trade goes against them, but we feel gold will breakdown to 1300...we would not recommend any long positions...unless gold experiences a severe and/or rapid selloff.”
From the October 2013 issue… “Our guidance from the September issue panned out nicely, as gold continued its price weakness. Although we remain bearish over the longer-term period, it is too difficult to determine any short-term trading opportunities in part due to the cur-rent debt charade. Thus, we would advise taking a wait-and-see approach.”
From the November 2013 issue… “After a sizable sell off, gold soared in anticipation of a timely resolution to the debt ceiling debacle. Since then, gold has sold off. Although we remain bearish on gold, we give a small (20%) chance of a strong rally in coming weeks if certain technical conditions are met. At the very least, gold cannot violate the 1250 low made recently. Keep in mind we attach an 80% chance that such a rally will not occur. In fact, we feel that gold is likely to break down below the 1250 low and head towards its 1182 lows made in July before the end of 2013.”
From the December 2013 issue… “As forecast, gold did break down below the 1250 support and continues to ap-proach the lows made in July at just under $1200. At this time, we do not see any ST trading opportunities (either short or long positions) with good risk-reward characteristics. However, because we remain strongly bearish on gold, longer-term short positions are likely to perform well. We do not like to make long-term price forecasts... However, it is our opinion that gold will decline to a price below $1000 sometime in 2014.”
From the January 2014 issue… “The updated chart shows that the bearish trend for gold continued to exhibit the see-saw type decline that we have been highlighting for several months now. Thus, those who have made use of support and resistance lines as well as the bearish trading band boundaries seen with gold pricing have done well and are expected to continue to do well with short-term trades in gold.
Note that gold pricing recently approached the three-year lows made on June 24, 2013, mounted a head-fake rally then made a lower low on December 31, 2013, but still not as low as that made on June 24, 2013. After testing the June low, gold mounted a strong rally on heavy volume (volume not shown) on December 31, 2013 (as you will see, the same thing happened with silver). Because this rally pushed pricing above the upper resistance of gold’s bearish trading band, we would look for a catalyst to take a short position (aggressive traders only) be-cause we feel the June 2013 lows will be retested again. Also keep in mind that when this low is taken out, it is likely to lead to a brisk move in gold pricing, either up or down. For whatever it is worth, we feel this move will be down this time (this is just a guess).
G O L D
Page 51 V O L U M E 2
Copyright © 2015. All Rights Reserved. AVA Investment Analytics. www.avaresearch.com
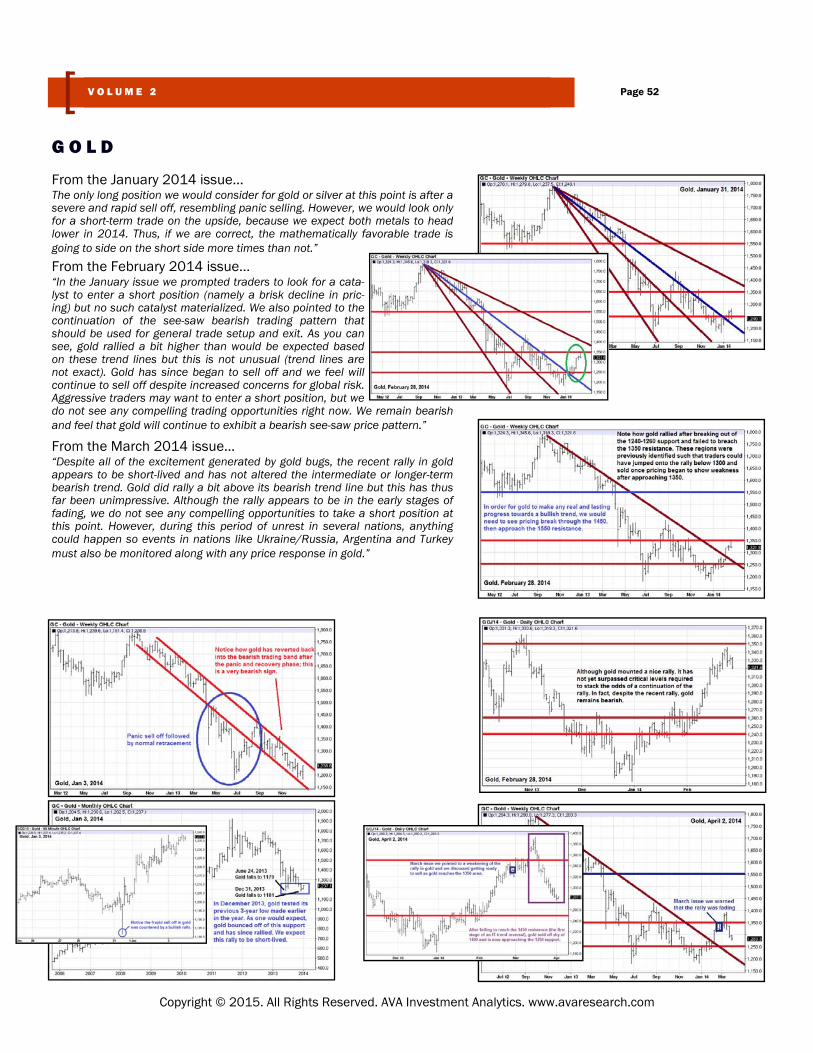
From the January 2014 issue… The only long position we would consider for gold or silver at this point is after a severe and rapid sell off, resembling panic selling. However, we would look only for a short-term trade on the upside, because we expect both metals to head lower in 2014. Thus, if we are correct, the mathematically favorable trade is going to side on the short side more times than not.” From the February 2014 issue… “In the January issue we prompted traders to look for a cata-lyst to enter a short position (namely a brisk decline in pric-ing) but no such catalyst materialized. We also pointed to the continuation of the see-saw bearish trading pattern that should be used for general trade setup and exit. As you can see, gold rallied a bit higher than would be expected based on these trend lines but this is not unusual (trend lines are not exact). Gold has since began to sell off and we feel will continue to sell off despite increased concerns for global risk. Aggressive traders may want to enter a short position, but we do not see any compelling trading opportunities right now. We remain bearish and feel that gold will continue to exhibit a bearish see-saw price pattern.”
From the March 2014 issue… “Despite all of the excitement generated by gold bugs, the recent rally in gold appears to be short-lived and has not altered the intermediate or longer-term bearish trend. Gold did rally a bit above its bearish trend line but this has thus far been unimpressive. Although the rally appears to be in the early stages of fading, we do not see any compelling opportunities to take a short position at this point. However, during this period of unrest in several nations, anything could happen so events in nations like Ukraine/Russia, Argentina and Turkey must also be monitored along with any price response in gold.”
G O L D
Page 52 V O L U M E 2
Copyright © 2015. All Rights Reserved. AVA Investment Analytics. www.avaresearch.com
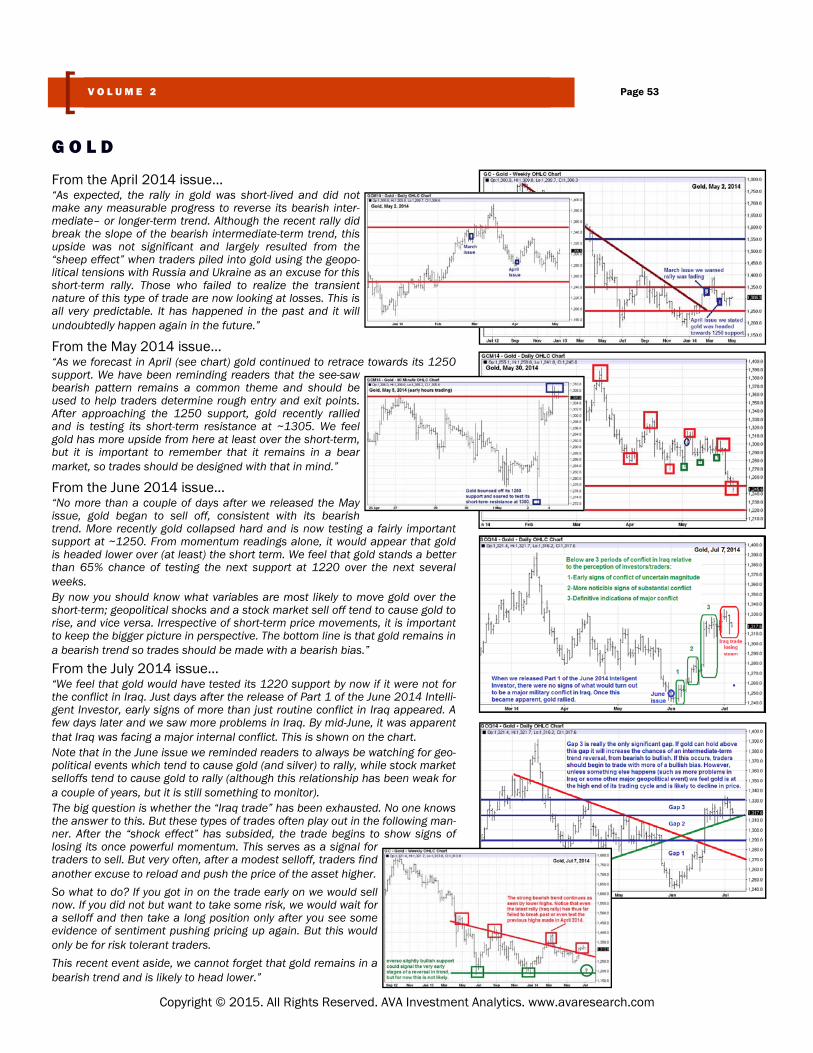
From the April 2014 issue… “As expected, the rally in gold was short-lived and did not make any measurable progress to reverse its bearish inter-mediate– or longer-term trend. Although the recent rally did break the slope of the bearish intermediate-term trend, this upside was not significant and largely resulted from the “sheep effect” when traders piled into gold using the geopo-litical tensions with Russia and Ukraine as an excuse for this short-term rally. Those who failed to realize the transient nature of this type of trade are now looking at losses. This is all very predictable. It has happened in the past and it will undoubtedly happen again in the future.”
From the May 2014 issue… “As we forecast in April (see chart) gold continued to retrace towards its 1250 support. We have been reminding readers that the see-saw bearish pattern remains a common theme and should be used to help traders determine rough entry and exit points. After approaching the 1250 support, gold recently rallied and is testing its short-term resistance at ~1305. We feel gold has more upside from here at least over the short-term, but it is important to remember that it remains in a bear market, so trades should be designed with that in mind.”
From the June 2014 issue… “No more than a couple of days after we released the May issue, gold began to sell off, consistent with its bearish trend. More recently gold collapsed hard and is now testing a fairly important support at ~1250. From momentum readings alone, it would appear that gold is headed lower over (at least) the short term. We feel that gold stands a better than 65% chance of testing the next support at 1220 over the next several weeks. By now you should know what variables are most likely to move gold over the short-term; geopolitical shocks and a stock market sell off tend to cause gold to rise, and vice versa. Irrespective of short-term price movements, it is important to keep the bigger picture in perspective. The bottom line is that gold remains in a bearish trend so trades should be made with a bearish bias.”
From the July 2014 issue… “We feel that gold would have tested its 1220 support by now if it were not for the conflict in Iraq. Just days after the release of Part 1 of the June 2014 Intelli-gent Investor, early signs of more than just routine conflict in Iraq appeared. A few days later and we saw more problems in Iraq. By mid-June, it was apparent that Iraq was facing a major internal conflict. This is shown on the chart. Note that in the June issue we reminded readers to always be watching for geo-political events which tend to cause gold (and silver) to rally, while stock market selloffs tend to cause gold to rally (although this relationship has been weak for a couple of years, but it is still something to monitor). The big question is whether the “Iraq trade” has been exhausted. No one knows the answer to this. But these types of trades often play out in the following man-ner. After the “shock effect” has subsided, the trade begins to show signs of losing its once powerful momentum. This serves as a signal for traders to sell. But very often, after a modest selloff, traders find another excuse to reload and push the price of the asset higher.
So what to do? If you got in on the trade early on we would sell now. If you did not but want to take some risk, we would wait for a selloff and then take a long position only after you see some evidence of sentiment pushing pricing up again. But this would only be for risk tolerant traders.
This recent event aside, we cannot forget that gold remains in a bearish trend and is likely to head lower.”
G O L D
Page 53 V O L U M E 2
Copyright © 2015. All Rights Reserved. AVA Investment Analytics. www.avaresearch.com
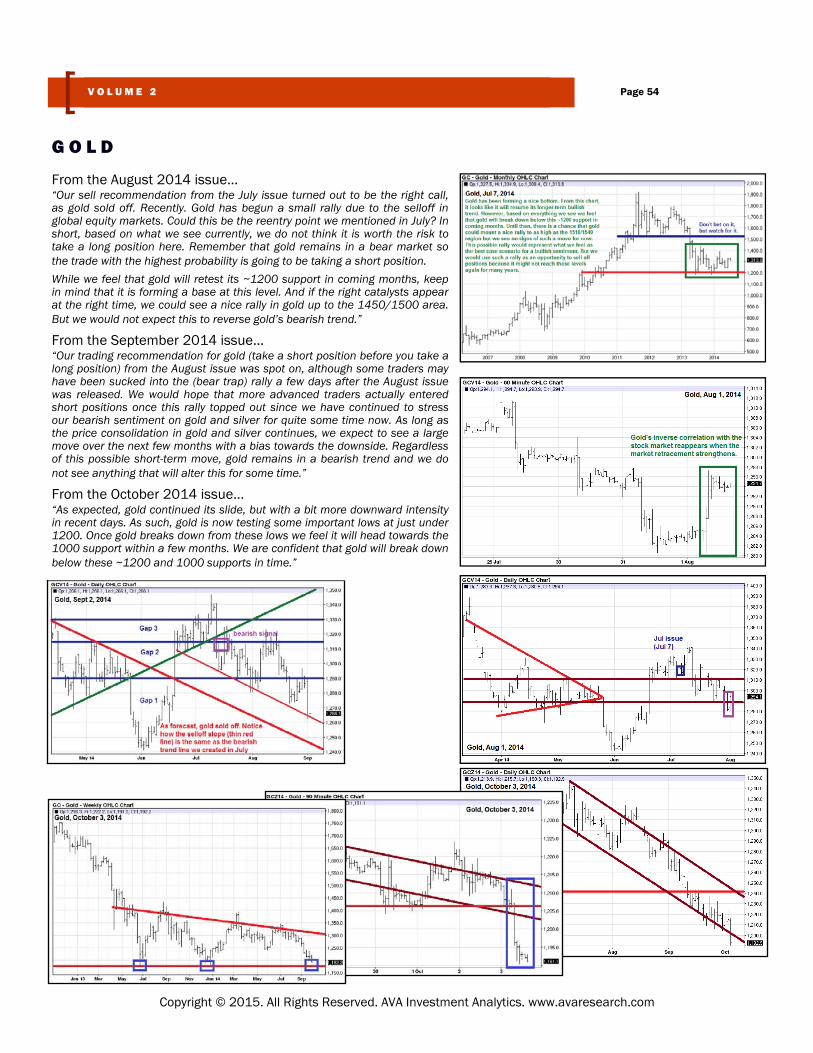
From the August 2014 issue… “Our sell recommendation from the July issue turned out to be the right call, as gold sold off. Recently. Gold has begun a small rally due to the selloff in global equity markets. Could this be the reentry point we mentioned in July? In short, based on what we see currently, we do not think it is worth the risk to take a long position here. Remember that gold remains in a bear market so the trade with the highest probability is going to be taking a short position.
While we feel that gold will retest its ~1200 support in coming months, keep in mind that it is forming a base at this level. And if the right catalysts appear at the right time, we could see a nice rally in gold up to the 1450/1500 area. But we would not expect this to reverse gold’s bearish trend.”
From the September 2014 issue… “Our trading recommendation for gold (take a short position before you take a long position) from the August issue was spot on, although some traders may have been sucked into the (bear trap) rally a few days after the August issue was released. We would hope that more advanced traders actually entered short positions once this rally topped out since we have continued to stress our bearish sentiment on gold and silver for quite some time now. As long as the price consolidation in gold and silver continues, we expect to see a large move over the next few months with a bias towards the downside. Regardless of this possible short-term move, gold remains in a bearish trend and we do not see anything that will alter this for some time.”
From the October 2014 issue… “As expected, gold continued its slide, but with a bit more downward intensity in recent days. As such, gold is now testing some important lows at just under 1200. Once gold breaks down from these lows we feel it will head towards the 1000 support within a few months. We are confident that gold will break down below these ~1200 and 1000 supports in time.”
G O L D
Page 54 V O L U M E 2
Copyright © 2015. All Rights Reserved. AVA Investment Analytics. www.avaresearch.com
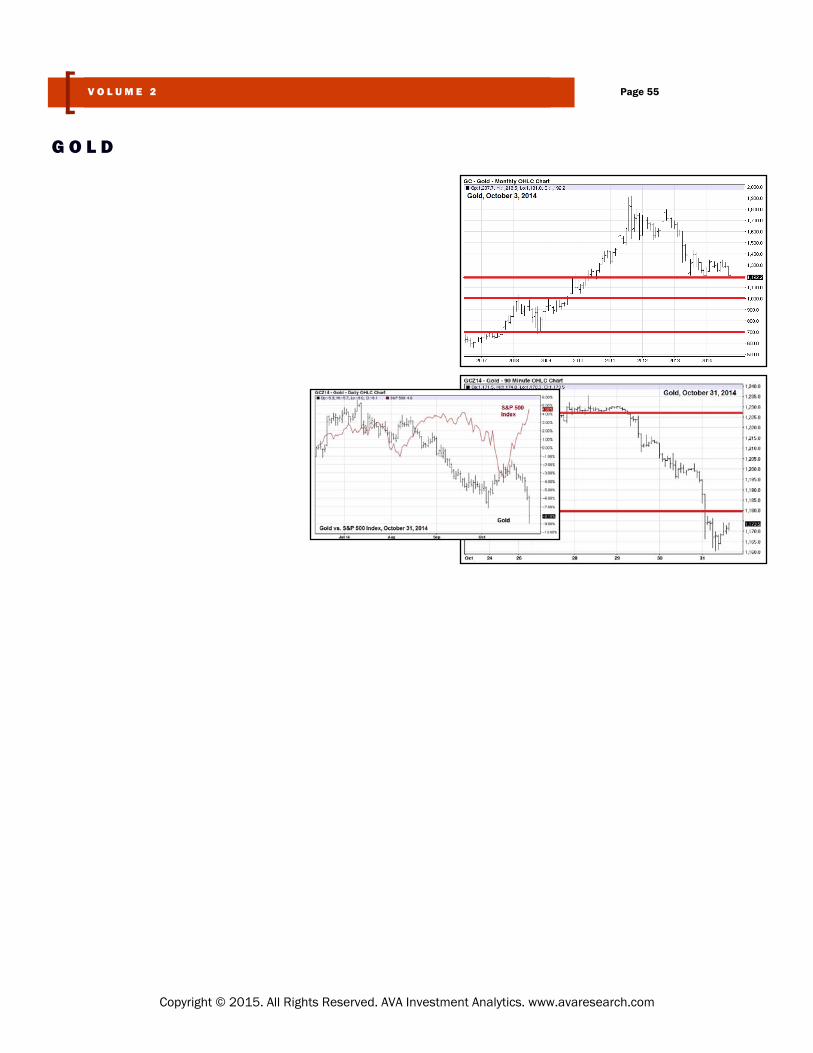
G O L D
Page 55 V O L U M E 2
Copyright © 2015. All Rights Reserved. AVA Investment Analytics. www.avaresearch.com
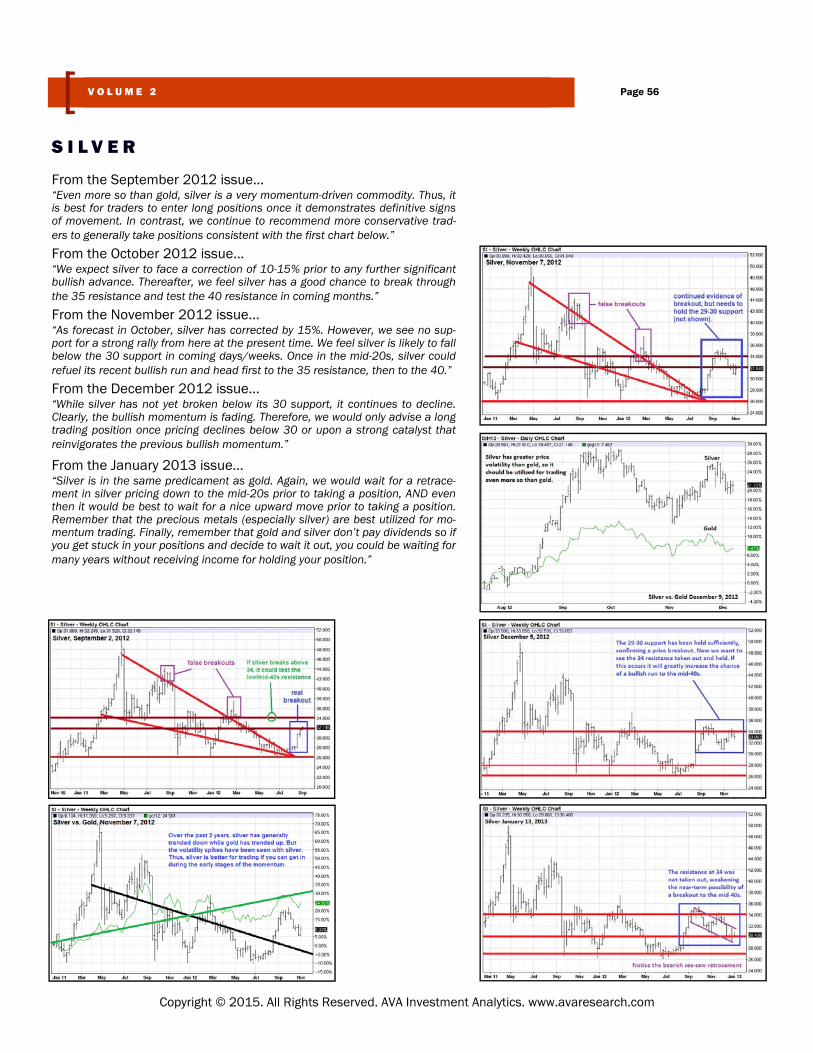
From the September 2012 issue… “Even more so than gold, silver is a very momentum-driven commodity. Thus, it is best for traders to enter long positions once it demonstrates definitive signs of movement. In contrast, we continue to recommend more conservative trad-ers to generally take positions consistent with the first chart below.”
From the October 2012 issue… “We expect silver to face a correction of 10-15% prior to any further significant bullish advance. Thereafter, we feel silver has a good chance to break through the 35 resistance and test the 40 resistance in coming months.”
From the November 2012 issue… “As forecast in October, silver has corrected by 15%. However, we see no sup-port for a strong rally from here at the present time. We feel silver is likely to fall below the 30 support in coming days/weeks. Once in the mid-20s, silver could refuel its recent bullish run and head first to the 35 resistance, then to the 40.”
From the December 2012 issue… “While silver has not yet broken below its 30 support, it continues to decline. Clearly, the bullish momentum is fading. Therefore, we would only advise a long trading position once pricing declines below 30 or upon a strong catalyst that reinvigorates the previous bullish momentum.”
From the January 2013 issue… “Silver is in the same predicament as gold. Again, we would wait for a retrace-ment in silver pricing down to the mid-20s prior to taking a position, AND even then it would be best to wait for a nice upward move prior to taking a position. Remember that the precious metals (especially silver) are best utilized for mo-mentum trading. Finally, remember that gold and silver don’t pay dividends so if you get stuck in your positions and decide to wait it out, you could be waiting for many years without receiving income for holding your position.”
S I L V E R
Page 56 V O L U M E 2
Copyright © 2015. All Rights Reserved. AVA Investment Analytics. www.avaresearch.com
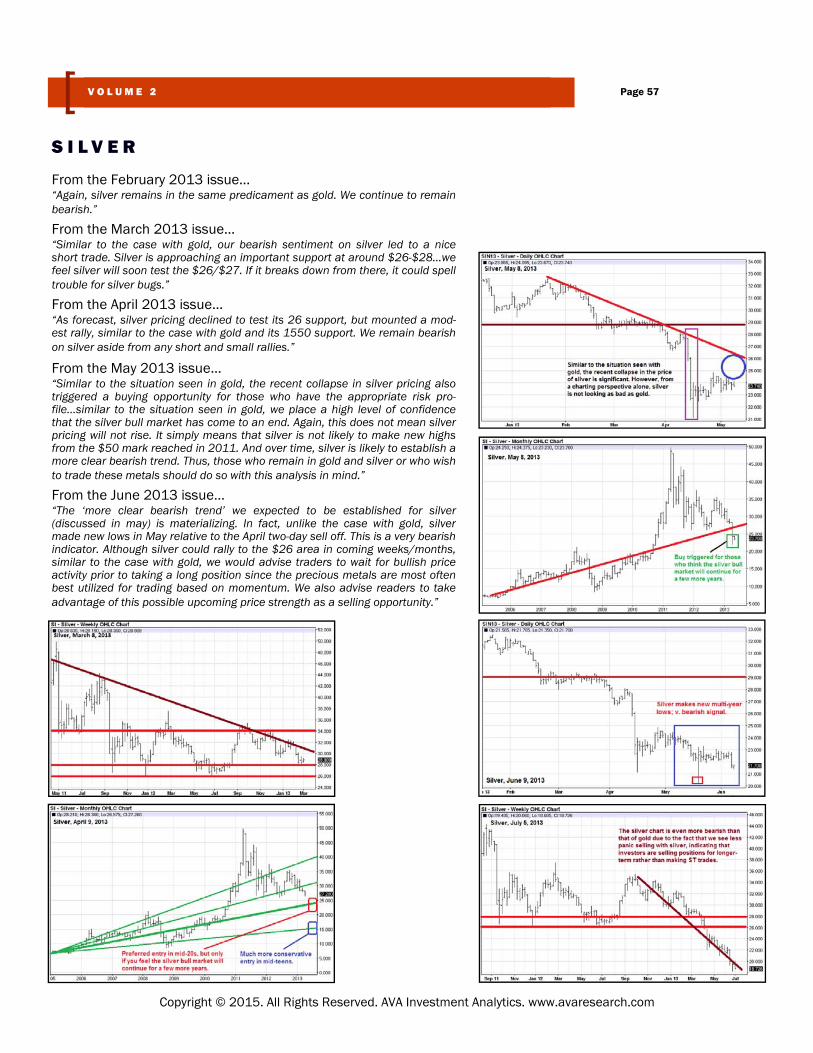
From the February 2013 issue… “Again, silver remains in the same predicament as gold. We continue to remain bearish.”
From the March 2013 issue… “Similar to the case with gold, our bearish sentiment on silver led to a nice short trade. Silver is approaching an important support at around $26-$28...we feel silver will soon test the $26/$27. If it breaks down from there, it could spell trouble for silver bugs.”
From the April 2013 issue… “As forecast, silver pricing declined to test its 26 support, but mounted a mod-est rally, similar to the case with gold and its 1550 support. We remain bearish on silver aside from any short and small rallies.”
From the May 2013 issue… “Similar to the situation seen in gold, the recent collapse in silver pricing also triggered a buying opportunity for those who have the appropriate risk pro-file...similar to the situation seen in gold, we place a high level of confidence that the silver bull market has come to an end. Again, this does not mean silver pricing will not rise. It simply means that silver is not likely to make new highs from the $50 mark reached in 2011. And over time, silver is likely to establish a more clear bearish trend. Thus, those who remain in gold and silver or who wish to trade these metals should do so with this analysis in mind.”
From the June 2013 issue… “The ‘more clear bearish trend’ we expected to be established for silver (discussed in may) is materializing. In fact, unlike the case with gold, silver made new lows in May relative to the April two-day sell off. This is a very bearish indicator. Although silver could rally to the $26 area in coming weeks/months, similar to the case with gold, we would advise traders to wait for bullish price activity prior to taking a long position since the precious metals are most often best utilized for trading based on momentum. We also advise readers to take advantage of this possible upcoming price strength as a selling opportunity.”
S I L V E R
Page 57 V O L U M E 2
Copyright © 2015. All Rights Reserved. AVA Investment Analytics. www.avaresearch.com
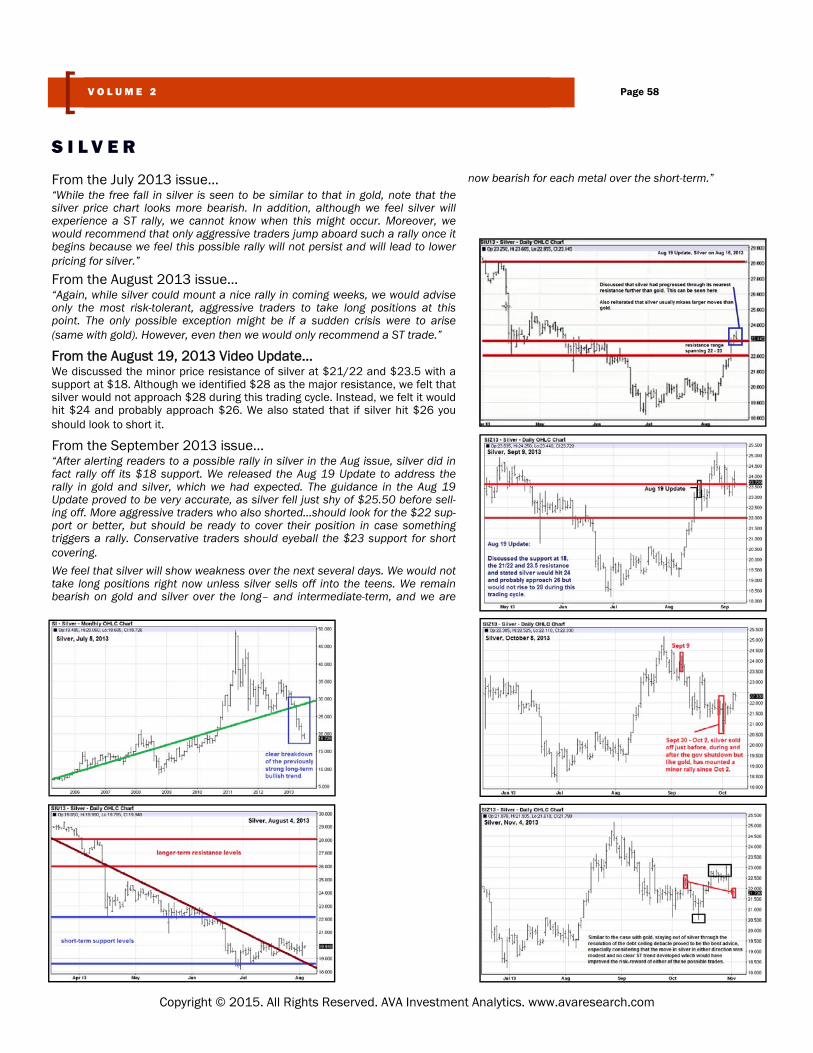
From the July 2013 issue… “While the free fall in silver is seen to be similar to that in gold, note that the silver price chart looks more bearish. In addition, although we feel silver will experience a ST rally, we cannot know when this might occur. Moreover, we would recommend that only aggressive traders jump aboard such a rally once it begins because we feel this possible rally will not persist and will lead to lower pricing for silver.”
From the August 2013 issue… “Again, while silver could mount a nice rally in coming weeks, we would advise only the most risk-tolerant, aggressive traders to take long positions at this point. The only possible exception might be if a sudden crisis were to arise (same with gold). However, even then we would only recommend a ST trade.”
From the August 19, 2013 Video Update… We discussed the minor price resistance of silver at $21/22 and $23.5 with a support at $18. Although we identified $28 as the major resistance, we felt that silver would not approach $28 during this trading cycle. Instead, we felt it would hit $24 and probably approach $26. We also stated that if silver hit $26 you should look to short it.
From the September 2013 issue… “After alerting readers to a possible rally in silver in the Aug issue, silver did in fact rally off its $18 support. We released the Aug 19 Update to address the rally in gold and silver, which we had expected. The guidance in the Aug 19 Update proved to be very accurate, as silver fell just shy of $25.50 before sell-ing off. More aggressive traders who also shorted...should look for the $22 sup-port or better, but should be ready to cover their position in case something triggers a rally. Conservative traders should eyeball the $23 support for short covering.
We feel that silver will show weakness over the next several days. We would not take long positions right now unless silver sells off into the teens. We remain bearish on gold and silver over the long– and intermediate-term, and we are
now bearish for each metal over the short-term.”
S I L V E R
Page 58 V O L U M E 2
Copyright © 2015. All Rights Reserved. AVA Investment Analytics. www.avaresearch.com
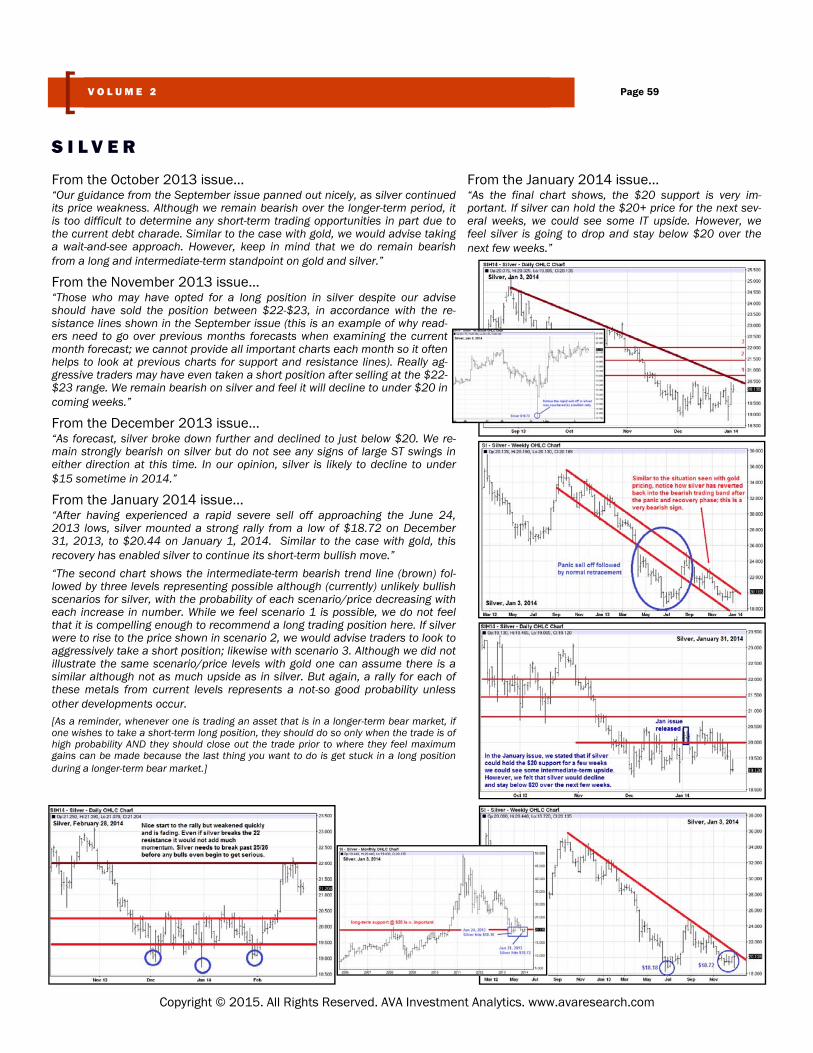
From the October 2013 issue… “Our guidance from the September issue panned out nicely, as silver continued its price weakness. Although we remain bearish over the longer-term period, it is too difficult to determine any short-term trading opportunities in part due to the current debt charade. Similar to the case with gold, we would advise taking a wait-and-see approach. However, keep in mind that we do remain bearish from a long and intermediate-term standpoint on gold and silver.”
From the November 2013 issue… “Those who may have opted for a long position in silver despite our advise should have sold the position between $22-$23, in accordance with the re-sistance lines shown in the September issue (this is an example of why read-ers need to go over previous months forecasts when examining the current month forecast; we cannot provide all important charts each month so it often helps to look at previous charts for support and resistance lines). Really ag-gressive traders may have even taken a short position after selling at the $22-$23 range. We remain bearish on silver and feel it will decline to under $20 in coming weeks.”
From the December 2013 issue… “As forecast, silver broke down further and declined to just below $20. We re-main strongly bearish on silver but do not see any signs of large ST swings in either direction at this time. In our opinion, silver is likely to decline to under $15 sometime in 2014.”
From the January 2014 issue… “After having experienced a rapid severe sell off approaching the June 24, 2013 lows, silver mounted a strong rally from a low of $18.72 on December 31, 2013, to $20.44 on January 1, 2014. Similar to the case with gold, this recovery has enabled silver to continue its short-term bullish move.”
“The second chart shows the intermediate-term bearish trend line (brown) fol-lowed by three levels representing possible although (currently) unlikely bullish scenarios for silver, with the probability of each scenario/price decreasing with each increase in number. While we feel scenario 1 is possible, we do not feel that it is compelling enough to recommend a long trading position here. If silver were to rise to the price shown in scenario 2, we would advise traders to look to aggressively take a short position; likewise with scenario 3. Although we did not illustrate the same scenario/price levels with gold one can assume there is a similar although not as much upside as in silver. But again, a rally for each of these metals from current levels represents a not-so good probability unless other developments occur.
[As a reminder, whenever one is trading an asset that is in a longer-term bear market, if one wishes to take a short-term long position, they should do so only when the trade is of high probability AND they should close out the trade prior to where they feel maximum gains can be made because the last thing you want to do is get stuck in a long position during a longer-term bear market.]
From the January 2014 issue… “As the final chart shows, the $20 support is very im-portant. If silver can hold the $20+ price for the next sev-eral weeks, we could see some IT upside. However, we feel silver is going to drop and stay below $20 over the next few weeks.”
S I L V E R
Page 59 V O L U M E 2
Copyright © 2015. All Rights Reserved. AVA Investment Analytics. www.avaresearch.com
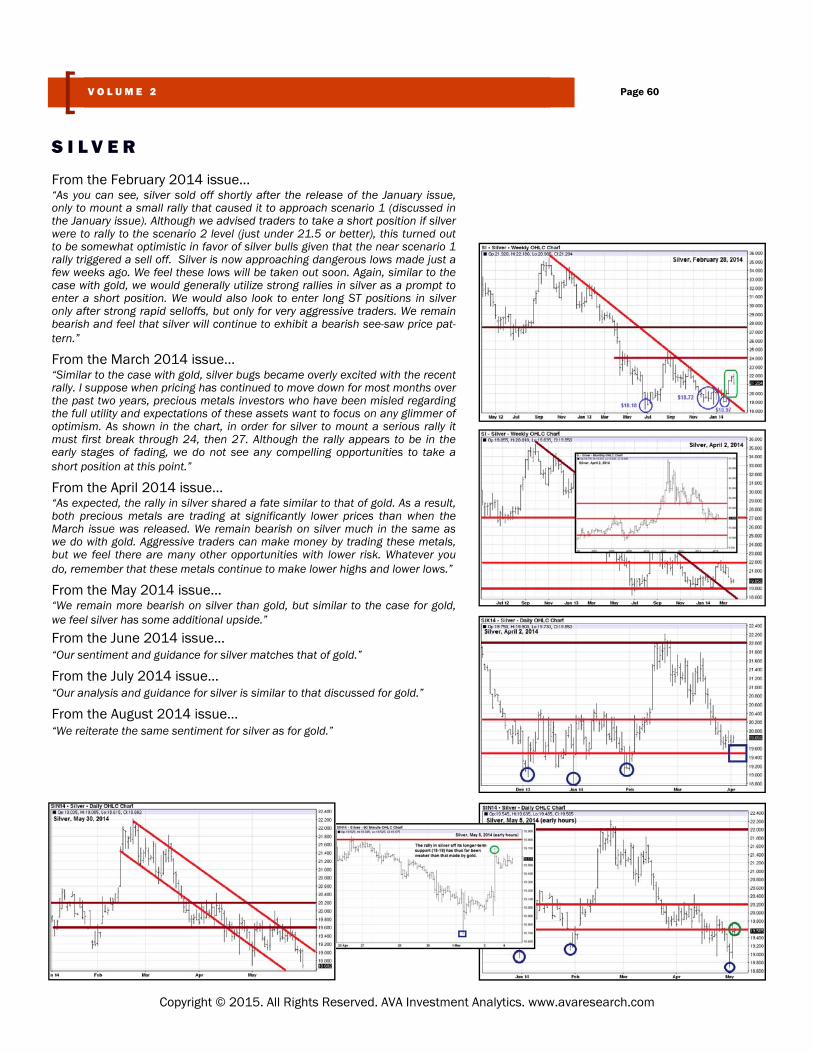
From the February 2014 issue… “As you can see, silver sold off shortly after the release of the January issue, only to mount a small rally that caused it to approach scenario 1 (discussed in the January issue). Although we advised traders to take a short position if silver were to rally to the scenario 2 level (just under 21.5 or better), this turned out to be somewhat optimistic in favor of silver bulls given that the near scenario 1 rally triggered a sell off. Silver is now approaching dangerous lows made just a few weeks ago. We feel these lows will be taken out soon. Again, similar to the case with gold, we would generally utilize strong rallies in silver as a prompt to enter a short position. We would also look to enter long ST positions in silver only after strong rapid selloffs, but only for very aggressive traders. We remain bearish and feel that silver will continue to exhibit a bearish see-saw price pat-tern.”
From the March 2014 issue… “Similar to the case with gold, silver bugs became overly excited with the recent rally. I suppose when pricing has continued to move down for most months over the past two years, precious metals investors who have been misled regarding the full utility and expectations of these assets want to focus on any glimmer of optimism. As shown in the chart, in order for silver to mount a serious rally it must first break through 24, then 27. Although the rally appears to be in the early stages of fading, we do not see any compelling opportunities to take a short position at this point.”
From the April 2014 issue… “As expected, the rally in silver shared a fate similar to that of gold. As a result, both precious metals are trading at significantly lower prices than when the March issue was released. We remain bearish on silver much in the same as we do with gold. Aggressive traders can make money by trading these metals, but we feel there are many other opportunities with lower risk. Whatever you do, remember that these metals continue to make lower highs and lower lows.”
From the May 2014 issue… “We remain more bearish on silver than gold, but similar to the case for gold, we feel silver has some additional upside.” From the June 2014 issue… “Our sentiment and guidance for silver matches that of gold.”
From the July 2014 issue… “Our analysis and guidance for silver is similar to that discussed for gold.”
From the August 2014 issue… “We reiterate the same sentiment for silver as for gold.”
S I L V E R
Page 60 V O L U M E 2
Copyright © 2015. All Rights Reserved. AVA Investment Analytics. www.avaresearch.com
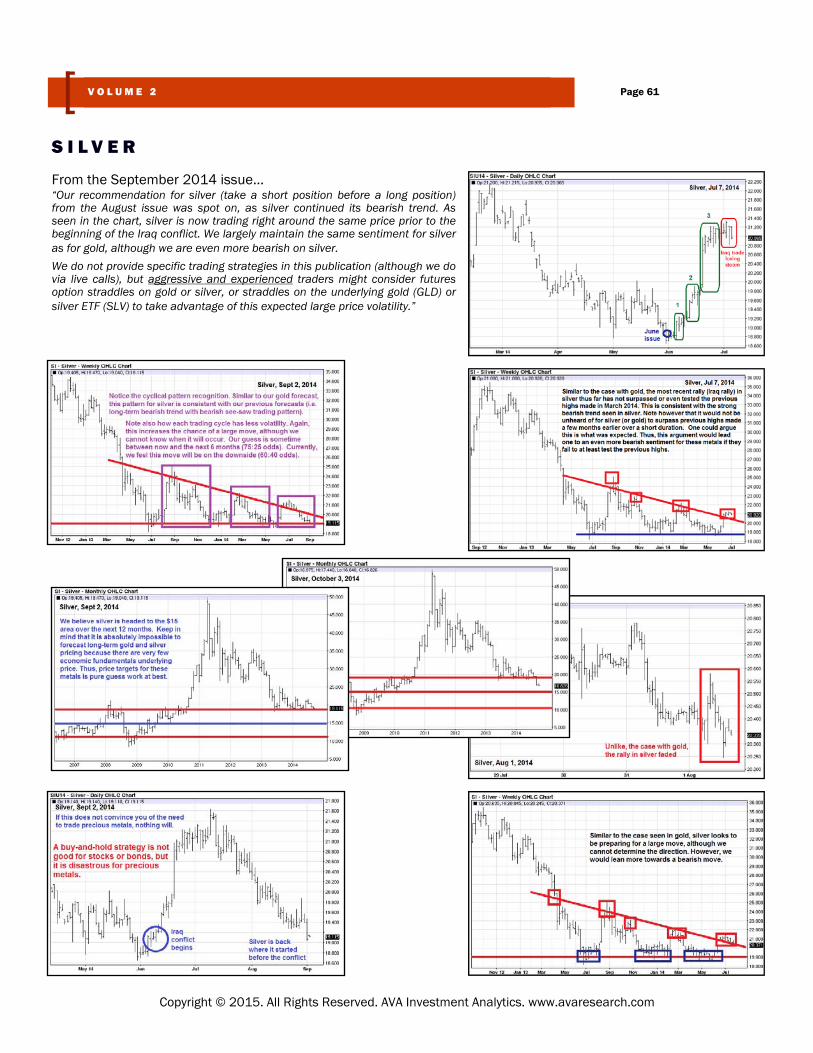
From the September 2014 issue… “Our recommendation for silver (take a short position before a long position) from the August issue was spot on, as silver continued its bearish trend. As seen in the chart, silver is now trading right around the same price prior to the beginning of the Iraq conflict. We largely maintain the same sentiment for silver as for gold, although we are even more bearish on silver.
We do not provide specific trading strategies in this publication (although we do via live calls), but aggressive and experienced traders might consider futures option straddles on gold or silver, or straddles on the underlying gold (GLD) or silver ETF (SLV) to take advantage of this expected large price volatility.”
S I L V E R
Page 61 V O L U M E 2
Copyright © 2015. All Rights Reserved. AVA Investment Analytics. www.avaresearch.com
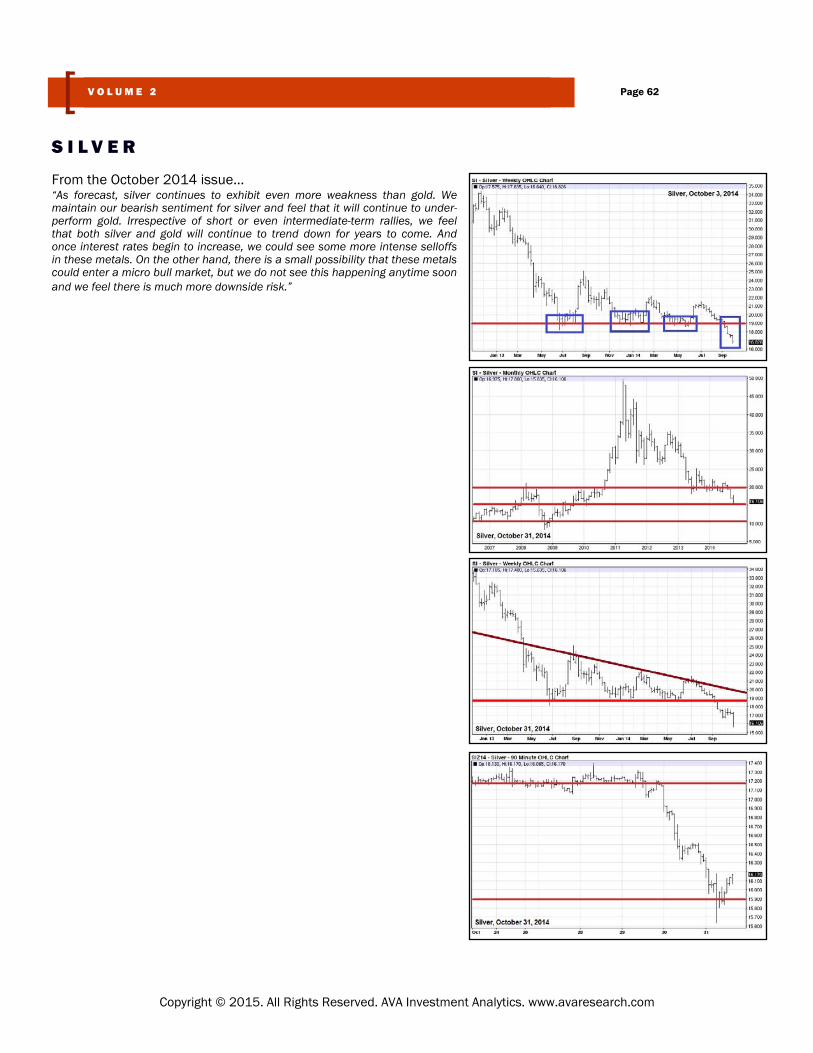
From the October 2014 issue… “As forecast, silver continues to exhibit even more weakness than gold. We maintain our bearish sentiment for silver and feel that it will continue to under-perform gold. Irrespective of short or even intermediate-term rallies, we feel that both silver and gold will continue to trend down for years to come. And once interest rates begin to increase, we could see some more intense selloffs in these metals. On the other hand, there is a small possibility that these metals could enter a micro bull market, but we do not see this happening anytime soon and we feel there is much more downside risk.”
S I L V E R
Page 62 V O L U M E 2
Copyright © 2015. All Rights Reserved. AVA Investment Analytics. www.avaresearch.com

A F I N A L W O R D O F C A U T I O N
Page 63 V O L U M E 2
One size does not fit all. You need to gauge your level of investment experience, financial re-sources, investment objectives, investment horizon and the time and effort you are willing to devote to the investment process with the decisions you make. There are no crystal balls and no blueprints for investing; not within this newsletter nor anywhere else.
Some of the opportunities I like simply may not be suitable for you because everyone is differ-ent. Ultimately, it is up to YOU to determine your own suitability and make your own decisions. I seek only to provide a general gauge in this newsletter.
If you want bogus claims of huge profits and other trash pitched by the other newsletters, I ad-vise you to look to them. But you will suffer major losses because they prey on greed and fear and they do not educate you so you can think for yourself.
The less experienced you are, the more conservative you should be. In fact, in my opinion, only the most experienced investors who are willing to devote a substantial amount of time to in-vesting should even been dealing with the current market.
A M U S T F O R A L L S E R I O U S I N V E S T O R S
D I S C L A I M E R S
This newsletter is intended to be used for educational purposes only. AVA Investment Analytics is strictly an investment publishing company providing invest-
ment and economic data, analysis and insights. We do not provide personalized financial advice. Accordingly, investors should always consult their registered
investment adviser prior to using any recommendations, strategies, investment and data, tax information, and other educational pieces from this newsletter
and the associated website www.avaresearch.com to ensure they are consistent with their investment objectives, risk tolerance, experience level, and capital
requirements.
This publication represents the viewpoints of the writers and editors, based upon their own experience as investors, business analysts, and consumers. How-
ever, each investor has different levels of investment risk tolerance, investment objectives, income needs, liquidity needs, and investment horizons. There-
fore, prior to any purchase or sale, it is strongly recommended that each investor consult his or her personal financial advisor, stock broker, or other profes-
sionally registered financial representative who is familiar with your financial personal life profile.
We are not a broker-dealer or investment advisor, as defined by the rules and regulations of the Securities and Exchange Commission. Therefore, WE CAN-
NOT AND WILL NOT PROVIDE ADVISE ON SPECIFIC STOCK OR SPECIFIC INVESTMENT STRATEGIES PERTAINING TO INDIVIDUAL ACCOUNTS. None of the materi-
al within this newsletter or any content on the associated website www.avaresearch.com should be taken to represent personalized financial advice.
All data and information presented in this publication has been taken from sources the authors and editors believe to be accurate and reliable. However,
neither the authors nor editors have independently verified or otherwise investigated all such information. The authors, editors, publishers nor any of their
respective affiliates guarantees the accuracy or completeness of any such information. There is a possibility of human or mechanical error as well as other
factors. Therefore, the reader of this newsletter and the related the content of the affiliated web site www.avaresearch.com and related digital publications,
alerts, and commentaries will not hold the officers, employees (authors, editors, and publisher), agents, directors, or owners of these articles, commentaries,
recommendations, and other educational pieces liable for any errors or omissions and all information and data is provided “as is” without warranty of any
kind. The authors, editors, publisher, officers, directors, agents, employees, and owners of this newsletter accepts no responsibility for any consequences of
any recommendations and by accessing the material herein, and by accessing the material in this publication, the user releases any claims of any form
against the authors, editors, publisher, officers, directors, agents, employees and owners of this newsletter and the content contained within the associated
website www.avaresearch.com. None of the information in this report or any opinions expressed should be taken to represent a solicitation or recommenda-
tion to buy or sale securities. Readers are expected to independently verify all information in this report and conduct their own due diligence prior to making
any securities transactions.
Investing involves substantial risk. The authors, editors, publisher, nor any of their respective affiliates make any guarantees or other promise as to any re-
sults that may be obtained from using the newsletter or from any content contained from the associated website www.avaresearch.com. While historical
information may be used as a tool to assist in the examination of the risk and merit of an investment, past performance should not be considered representa-
tive of future performance. No subscriber or any other reader of the publications released by AVA Investment Research either by email or that contained from
the associated website www.avaresearch.com should make any investment decision without first consulting his or her personal financial advisor and perform-
ing his or her own research and due diligence, including carefully examining the prospectus and all other public filings of the issuer.
We take no compensation from any of the companies or securities mentioned on this website.
WE DO NOT WARRANT THE ACCURACY, COMPLETENESS, CURRENTNESS, MERCHANTABILITY, OR FITNESS FOR A PARTICULAR PURPOSE OF THE INFOR-
MATION AVAILABLE THROUGH THE SERVICE. This publication been protected by all applicable copyright laws and any reproduction or transmission is prohib-
ited by law, except for personal use and when stated otherwise. Copyright © 2015, AVA Investment Analytics.
Restrictions Against Reproduction: No part of this publication may be reproduced, stored in a retrieval system, or transmitted in any form or
by any means, electronic, mechanical, photocopying, recording, scanning, or otherwise, except as permitted under Section 107 or 108 of the
1976 United States Copyright Act, without the prior written permission of the copyright owner and the Publisher. Any such violations are un-
lawful and violators will be prosecuted in accordance with these laws.
Restrictions Against Redistribution: This material has been officially declared as trade secret, and is used as a part of the investment re-
search and trading algorithms offered by AVA Investment Research. No part of this publication and any conclusions made may be discussed
or distributed according to federal trade secret laws as given by 18 U.S.C. § 1839.
Investment Intelligence
When it REALLY Matters