Embed Size (px)
Citation preview

Research ArticleA Fault Feature Extraction Method for Rolling Bearing Based onPulse Adaptive Time-Frequency Transform
Jinbao Yao1 Baoping Tang1 and Jie Zhao2
1State Key Lab of Mechanical Transmission Chongqing University Chongqing 400030 China2College of Mechanical Engineering Chengdu University Sichuan 610106 China
Correspondence should be addressed to Jinbao Yao jbyao2001163com
Received 18 December 2015 Revised 27 February 2016 Accepted 2 March 2016
Academic Editor Juan P Amezquita-Sanchez
Copyright copy 2016 Jinbao Yao et al This is an open access article distributed under the Creative Commons Attribution Licensewhich permits unrestricted use distribution and reproduction in any medium provided the original work is properly cited
Shock pulse method is a widely used technique for condition monitoring of rolling bearing However it may cause erroneousdiagnosis in the presence of strong background noise or other shock sources Aiming at overcoming the shortcoming a pulseadaptive time-frequency transform method is proposed to extract the fault features of the damaged rolling bearing The methodarranges the rolling bearing shock pulses extracted by shock pulse method in the order of time and takes the reciprocal of the timeinterval between the pulse at anymoment and the other pulse as all instantaneous frequency components in the moment And thenit visually displays the changing rule of each instantaneous frequency after plane transformation of the instantaneous frequencycomponents realizes the time-frequency transform of shock pulse sequence through time-frequency domain amplitude relevancyprocessing and highlights the fault feature frequencies by effective instantaneous frequency extraction so as to extract the faultfeatures of the damaged rolling bearing The results of simulation and application show that the proposed method can suppressthe noises well highlight the fault feature frequencies and avoid erroneous diagnosis so it is an effective fault feature extractionmethod for the rolling bearing with high time-frequency resolution
1 Introduction
As the most common part in the rotating machinery rollingbearing is most vulnerable to damage The condition of therolling bearing has a great effect on the working conditionof the whole machine Any defect in the rolling bearingmay impair the normal working order of the machinecausing vibration in the machine producing noises andeven resulting in fatal crashes Therefore it is necessary toperform fault diagnosis for defects in the rolling bearing Adamaged rolling bearing may produce regular shock pulsesand these components may be contained in the vibrationsignals Besides the shock modulation phenomenon maytake place However as the operating condition of the rollingbearing is quite complex in addition to the shock pulsecomponents representing the fault information the vibrationsignals produced by the rolling bearing always contain othersignal components such as noise rotation frequency and itsharmonic components which usually interfere with the faultdiagnosis of the rolling bearing Hence the key of the rolling
bearing fault diagnosis is to extract from the vibration signalsthe shock pulse representing the damage Considering thatthe shock modulation is an important feature when any faultarises in the rolling bearing the fault feature frequency canbe extracted by demodulating the vibration signals so as torealize the fault diagnosis of the rolling bearing So the studyon the vibration signal demodulation methods for the rollingbearing has for long become an attraction and also a difficultyin the area of rolling bearing fault diagnosis
Present vibration signal demodulation methods for therolling bearing mainly include the envelope demodulationmethod resonance demodulationmethod (RDM) and shockpulse method (SPM) The envelope demodulation methoduses a high frequency vibration sensor acquires the highfrequency vibration signals of the rolling bearing containingthe low frequency shock components by setting a certainhigh frequency filtering bandwidth and performs suchprocesses as envelope interception and capture demodu-lation and low-pass filtering so as to obtain the modu-lation frequency (rolling bearing fault feature frequency)
Hindawi Publishing CorporationShock and VibrationVolume 2016 Article ID 4135102 12 pageshttpdxdoiorg10115520164135102
2 Shock and Vibration
It mainly includes the generalized detection-filtering demod-ulationmethod [1] local mean decomposition demodulationmethod [2] wavelet analysis demodulation method [3ndash5]EMDEEMDdemodulationmethod [6] andHilbert demod-ulation method [7 8] Although the envelope demodulationmethods in question have produced some results in theapplication study on the rolling bearing fault diagnosis owingto their common limitations the demodulated low frequencyshock signals representing the fault information alwayscontain noise and information of other vibration sourcessuch as rotation axis and gear which may badly interferewith the rolling bearing fault diagnosis and the frequencydomain information of the demodulation wave containsthe frequency components that cannot be analyzed or maycause erroneous diagnosis In addition if the signal-to-noiseratio (SNR) of the shock signal is not raised the envelopedemodulation methods cannot be applied to the early faultdiagnosis of the rolling bearing Following the phenomenonthat the shock signal of wide range may arouse resonanceand the vibration signal rarely produces resonance [9] SPMand RDM both modulate the low frequency shock signalto high frequency one perform such processes as filteringand envelope demodulation and then diagnose the workingcondition of the rolling bearing Although both methodsabove solve the problems in the envelope demodulationmethod they still have their own problems due to differ-ences in the working principle RDM modulates the shocksignal to the resonance frequency of the mechanical systemstructure and employs the frequency domain information ofthe resonance demodulation wave to diagnose the workingcondition of the rolling bearing [10 11] It is able to accuratelydiagnose the faulty parts But as the resonance frequencyvaries with the different mechanical system structures it ishard for the method to select the filtering center frequencyand bandwidth And SPM modulates the shock signal to afixed high frequency and uses the amplitude information ofthe resonance demodulation wave to diagnose the workingcondition of the rolling bearing [12 13] Though the methoddoes not have the problem of RDM whose filtering centerfrequency and bandwidth can be hardly selected as itadopts the fixed filtering center frequency and bandwidthperforms the envelope detection which is characterized bynonlinear transformation and bases the diagnosis on theamplitude information of the resonance demodulation wavealone without any further analysis or processing it cannotarrive at desired diagnosis results in the presence of thestrong background noise or other shock sources To solvethe problems as mentioned the researchers proposed someimproved methods such as shock pulse frequency analysismethod [14] shock pulse time-frequency analysis methodand improved redundant lifting schememethod [15] but theyjust used the existing signal processingmethods for analyzingfrequency spectrum time-frequency spectrum and the likeSuch proposed methods are still not suitable for the rollingbearing fault diagnosis in the presence of strong backgroundnoise and they also lose the instantaneous time changefeature of the shock
For this reason by integrating the advantages of RDMand SPM this paper comes up with a pulse adaptive
Shock pulsesensor
Poorlubrication
Elementdamage
Band-passfiltering
Absolutevalue
processing
Envelopedetection
Pulseshaping
Statistical analysis of theamplitude information of
the pulse sequence
dBm = middot middot middot
dBc = middot middot middot
Figure 1 Block diagram of working principle of SPM
time-frequency transformmethod (PATFTM) Like SPM theproposed method uses the fixed filtering center frequencyand bandwidth and also like RDM it is able to furtherprocess the extracted shock pulse thus avoiding the problemexisting in SPM
The remainder of the paper is organized as followsthe working principle and diagnosis method of SPM areintroduced in Section 2 on the basis of SPM Section 3proposes the PATFTM through simulation and applicationanalysis PATFTM is validated in Section 4 and finally basedon the analysis results Section 5 draws the study conclusionsand makes suggestions for further studies in this regard
2 Shock Pulse Method
SPM was first proposed in the 1970s [16] for diagnosingthe failures in the rolling bearing with its working principleshown in Figure 1 The rolling bearing in service due tosuch reasons as poor lubrication surface roughness andelement damage may cause shock effect And together withthe mechanical and electrical tuning the dedicated shockpulse sensor may be driven to resonate at a fixed frequency(usually within the range of 20 kHzsim60 kHz) [17] so thatthe resonance signal amplitude acquired is obviously greater
Shock and Vibration 3
Pulses caused by roller bearing damagePulses caused by other shock sourcesPulses caused by noise wearout and poor lubrication
middot middot middot
t
x(t)
Figure 2 Schematic diagram of shock pulses extracted by SPM
than the vibration signal amplitude collected by a commonsensor Then the acquired resonance signals containing theamplitude modulation wave of the low frequency shockrandom interference and other shock sources are made toundergo such processes as band-pass filtering absolute valueprocessing envelope detection and pulse shaping to obtainthe pulse sequence And the amplitude information of thepulse sequence is statistically analyzed to finally diagnose theworking condition of the rolling bearing
After the pulse sequence is obtained the statistical analy-sis of the amplitude information of the pulse sequence is thecore of SPMThe statistical analysismeans that dB-MaximumValue (dBm) and dB-Carpet Value (dBc) two physicalquantities used for measuring the shock pulse amplitude aredefined recorded and analyzed and then according to thediagnosis rule of SPM the failures in the rolling bearing arediagnosed dBm denotes the strong pulse decibel value andcorresponds to the low frequency pulse sequence amplitudeIt is defined as the maximum shock peak value obtainedwith a single testing period and used for measuring theextent of damage of the rolling bearing component dBcdenotes the carpet decibel value and corresponds to the highfrequency pulse sequence amplitude It is defined as themeanvalue of lots of weak shock signals and used for measuringthe lubrication surface roughness and degree of wear Thediagnosis rule of SPM is described as follows if dBm and dBcboth are often very low this indicates that the bearing is welllubricated and free of damage if dBm and dBc both are oftenvery high this indicates that the bearing is poorly lubricatedif the periodic peak value occurs and dBm rises this indicatesthat the bearing is damaged [18]
The shock pulses extracted by SPM mainly consist ofthe pulses caused by such factors as rolling bearing damagewearout failure poor lubrication other shock sources andnoise as shown in Figure 2 SPM is well known for itssimplicity and practicality and carries out the fault diagnosisof the rolling bearing through the statistical analysis of thepulse sequence amplitude It is very accurate in diagnosingthe wearout failure poor lubrication and so forth and it isable to diagnose the damage in the rolling bearing Howeverit is not capable of performing further diagnosis of thebearing damage and in the presence of strong background
noise or other shock sources it cannot arrive at desireddiagnosis results [19]
Thus for the sake of solving the problems in SPMweeding out the pulse interference resulting from such factorsas wearout failure poor lubrication other shock sources andnoise extracting the pulses produced by the damage in therolling bearing and carrying out the further diagnosis of thedamage in the rolling bearing on the basis of SPM PATFTMis proposed
3 Pulse Adaptive Time-FrequencyTransform Method
The basic idea of PATFTM is transforming the shock pulsesequence of one-dimensional time domain extracted by SPMinto two-dimensional time-frequency domain weeding outthe interference from other factors through the effectiveinstantaneous frequency extraction highlighting the faultfeature representing the rolling bearing damage and finallyrealizing the fault diagnosis of the rolling bearing visually andeffectively
PATFTM mainly comprises such steps as amplitudethreshold processing shock pulse ordering instantaneousfrequency calculation instantaneous frequency plane trans-formation amplitude relevancy processing and effectiveinstantaneous frequency extraction as shown in Figure 3
In the following with the application on the shock pulsesequence as shown in Figure 2 these processes will bediscussed in detail
(a) Amplitude Threshold Processing In order to reduce theinfluences from such factors as background noise wearoutfailure and poor lubrication and raise the efficiency ofPATFTM the shock pulses extracted by SPM are made toexperience the amplitude threshold processing by setting thethreshold in which the shock pulses whose amplitude issmaller than the threshold are excluded and those whoseamplitude is greater than the threshold are retained Thethreshold setting principle is regarding the average amplitudemeasured when the bearing is well lubricated and freeof any damage as the threshold for amplitude thresholdprocessing Figure 4 shows the processing results of the shockpulse sequence as shown in Figure 2 through the amplitudethreshold processing
(b) Shock Pulse Ordering As a basic physical quantity ofcommunication signals pulse arrival time is widely used indeinterleaving of radar pulses [20 21] Considering thereis some similarity in regularity of pulse sequence betweenthe radar pulses and the shock pulses to some extent pulsearrival time is introduced into analyzing shock pulses Theshock pulses for which the amplitude threshold processinghas been performed as shown in Figure 4 are ranked in theorder of pulse arrival time 119905
119894 and the shock pulse sequence
119909(119905
119894) 119894 isin [1119873] is obtained as shown in Figure 5 Here 119894
denotes the serial number of the shock pulse in the sequence119894 isin [1119873] 119873 denotes the total number of the shock pulsesnamely the total length of the sequence 119905
119894denotes the arrival
4 Shock and Vibration
Pulse adaptive time-frequency transform method (PATFT)
Shock pulsemethod
Shock pulses Amplitude thresholdprocessing
Shock pulseordering
Instantaneousfrequency calculation
Instantaneousfrequency planetransformation
Amplitude relevancyprocessing
Effectiveinstantaneous
frequency extraction
Instantaneous faultfeature frequencies
Figure 3 Steps of PATFTM
Pulses caused by roller bearing damage
Threshold
Pulses caused by other shock sourcesPulses caused by noise wearout and poor lubrication
middot middot middot
t
x(t)
Figure 4 Schematic diagram of amplitude threshold processing
Pulses caused by roller bearing damagePulses caused by other shock sourcesPulses caused by noise wearout and poor lubrication
middot middot middot
t
x(t)
t1 t2 t3 t4 t5 t6 t7 t8 t9 t10 t11 t12 t13
x(t1)
x(t2)
x(t3)
x(t4)
x(t5)
x(t6)x(t7)
x(t8)
x(t9)
x(t12)
x(t11)
x(t10) x(t13)
Figure 5 Schematic diagram of shock pulse ordering
time of the 119894th shock pulse with s as its unit 119909(119905
119894) denotes the
amplitude of the 119894th shock pulse with ms2 as its unit
(c) Instantaneous Frequency Calculation The shock pulsesequence 119909(119905
119894) 119894 isin [1119873] contains the shock information
caused by all excitation sources including the rolling bearingdamage The sequence has relatively high internal relevancyand the rolling bearing fault feature cannot be accuratelyextracted by studying some pulse alone Thus this paperstudies the pulse arrival time 119905
119894and performs overall analysis
of a group of pulses to find the internal changing ruleof pulses obtain the instantaneous frequency components
contained in the moment 119905119894 and identify different excitation
sourcesConsidering that the pulse arrival times 119905
119894and 119905
119895corre-
spond to the pulse occurrence moment for the periodicalshock sequence if the shock at the moment 119905
119894is produced by
the damage in a rolling bearing and the shock at the moment119905
119895is generated by the same damage in the rolling bearing next
time or last time then |1(119905
119895minus119905
119894)|maybe used for representing
the feature frequency of the rolling bearing damageThus by reference to the feature frequency calculated
from the periodical shock sequence the instantaneous fre-quency component 119891
119894119895that may be contained in the moment
119905
119894in the shock pulse sequence 119909(119905
119894) 119894 isin [1119873] can be
calculated with the positive instantaneous frequency compo-nents expressed by (1) or the reverse instantaneous frequencycomponents expressed by (2)
119891
119894119895
=
1
119905
119895minus 119905
119894
119905
119895minus 119905
119894isin [
1
119891
119906
1
119891
119889
] 119894 isin [1119873] 119895 isin (119894119873]
0 Others
(1)
119891
119894119895
=
1
119905
119894minus 119905
119895
119905
119894minus 119905
119895isin [
1
119891
119906
1
119891
119889
] 119894 isin [1119873] 119895 isin (1 119894]
0 Others
(2)
where 119894 and 119895 denote the serial number of the 119894th shockpulse and the 119895th shock pulse respectively 119905
119894and 119905
119895denote
the arrival time of the 119894th shock pulse and the 119895th shockpulse respectively with s as the unit 119891
119889and 119891
119906denote the
lower limit and the upper limit of 119891119894119895(as the rolling bearing
fault feature frequency can be obtained through theoreticalcalculation and it tends to fall within a frequency range thelower limit 119891
119889and the upper limit 119891
119906of 119891119894119895can be defined in
advance to obtain the conditions for calculation terminationof 119891119894119895) with Hz as the unit
Taking the calculation of the positive and reverse instan-taneous frequency components of the pulse sequence asshown in Figure 5 at the moment 119905
6as an example formulas
(1) and (2) are used for the calculation and the resultsobtained are shown in Figure 6
Figure 6 clearly shows that the positive and reverseinstantaneous frequency components calculated with (1) and
Shock and Vibration 5
middot middot middot
tt1 t2 t3 t4 t5 t6 t7 t8 t9 t10 t11 t12 t13
x(t)Reverse instantaneousfrequency component
Positive instantaneousfrequency component
f61 = 1(t6 minus t1)
f62 = 1(t6 minus t2)f63 = middot middot middot
f64 = middot middot middot
f65 = middot middot middot
f613 = 1(t13 minus t6)f612 = 1(t12 minus t6)
f611 = middot middot middot
f610 = middot middot middot
f69 = middot middot middot
f68 = middot middot middot
f67 = middot middot middot
Figure 6 Schematic diagram of instantaneous frequency compo-nent calculation
(2) have the instantaneous time change feature and that allinstantaneous frequency components that may be containedin the shock pulse occurrence moment can be accurately andtimely captured
(d) Plane Transformation of Instantaneous Frequency With119894 as the row and 119895 as the column the positive andreverse instantaneous frequency components 119891
119894119895both can be
expressed by the matrix 119865 in
119865
=
[
[
[
[
[
[
[
[
[
[
[
[
[
[
[
[
[
[
[
[
[
[
[
[
0 119891
12sdot sdot sdot 119891
1119894sdot sdot sdot 119891
1119895sdot sdot sdot 119891
1119873minus1119891
1119873
119891
210 sdot sdot sdot 119891
2119894sdot sdot sdot 119891
2119895sdot sdot sdot 119891
2119873minus1119891
2119873
d
119891
1198941119891
1198942sdot sdot sdot 0 sdot sdot sdot 119891
119894119895sdot sdot sdot 119891
119894119873minus1119891
119894119873
d
119891
1198951119891
1198952sdot sdot sdot 119891
119895119894sdot sdot sdot 0 sdot sdot sdot 119891
119895119873minus1119891
119895119873
d
119891
119873minus11119891
119873minus12sdot sdot sdot 119891
119873minus1119894sdot sdot sdot 119891
119873minus1119895sdot sdot sdot 0 119891
119873minus1119873
119891
1198731119891
1198732sdot sdot sdot 119891
119873119894sdot sdot sdot 119891
119873119895sdot sdot sdot 119891
119873119873minus10
]
]
]
]
]
]
]
]
]
]
]
]
]
]
]
]
]
]
]
]
]
]
]
]
(3)
The elements 119891
119894119895(119894 = 119895) on the diagonal of the matrix 119865
all equal zeroThe elements 119891
119894119895(119894 isin [1119873] 119895 isin (119894119873]) above
the diagonal of the matrix 119865 correspond to the positiveinstantaneous frequency components and are bound by thecondition 119905
119894minus 119905
119895isin [1119891
119906 1119891
119889] With 119895 increasing most
elements above the diagonal are zero and the number ofthe nonzero elements is smaller than or equal to 119873 minus 119894 and119891
119894119901gt 119891
119894119902(119894 lt 119901 lt 119902 le 119873) is satisfied
The elements 119891
119894119895(119894 isin [1119873] 119895 isin (1 119894]) below
the diagonal of the matrix 119865 correspond to the reverseinstantaneous frequency components and are bound by thecondition 119905
119895minus 119905
119894isin [1119891
119906 1119891
119889] With 119895 decreasing most
elements below the diagonal are zero and the number ofthe nonzero elements is smaller than or equal to 119895 minus 1 and119891
119894119901lt 119891
119894119902(1 le 119901 lt 119902 lt 119894) is satisfied
The elements of the 119894th row above or below the diagonal ofthe matrix 119865 mean the instantaneous frequency components
ti
t1 t2 t3 t4 t5 t6 t7 t8 t9 t10 t11 t12 t13
fij
Figure 7 Schematic diagram of plane transformation of instanta-neous frequency
that may be contained in the vibration signal to which theshock pulse sequence 119909(119905
119894) 119894 isin [1119873] corresponds at the
moment 119905119894
If the elements above the diagonal of the matrix 119865 (pos-itive instantaneous frequency components) are processed bythe plane transformation method applied to the communi-cation domain [20 21] they will be displayed in the planecoordinateswith 119905
119894as horizontal coordinate and119891
119894119895as vertical
coordinate and the instantaneous frequency component 119891119894119895
of the shock pulse sequence 119909(119905
119894) 119894 isin [1119873] and its
changing rule will be shown with the arrival time 119905
119894in a
dynamic manner the process which is called the plane trans-formation of instantaneous frequency If the elements belowthe diagonal of thematrix119865 (reverse instantaneous frequencycomponents) are made to experience the transformationabove the process is called the reverse plane transformationof instantaneous frequency Figure 7 shows the results ofplane transformation of instantaneous frequency of all pulsesequences as shown in Figure 5
(e) Amplitude Relevancy Processing After the pulse sequencesextracted by SPM undergo the amplitude threshold process-ing shock pulse ordering instantaneous frequency calcula-tion and plane transformation of instantaneous frequencythe fault feature frequency has been extracted for qualitativefault diagnosis of the rolling bearing However as there isno amplitude information of all fault feature frequency com-ponents further quantitative diagnosis and trend predictioncannot be carried out for the rolling bearing fault Thus theinstantaneous frequency component 119891
119894119895needs to experience
the amplitude relevancy processingThe amplitude to which the instantaneous frequency
component 119891
119894119895corresponds is expressed as 119883(119905
119894 119891
119894119895) and
through (4) the instantaneous frequency component 119891119894119895can
be correlated with the amplitude 119883(119905
119894 119891
119894119895) as follows
119883(119905
119894 119891
119894119895) =
1003816
1003816
1003816
1003816
1003816
119909 (119905
119895)
1003816
1003816
1003816
1003816
1003816
119891
119894119895isin [119891
119889 119891
119906]
0 Others(4)
6 Shock and Vibration
If the amplitude is correlated with the positive instantaneousfrequency component then in the formula above 119891
119894119895=
1(119905
119895minus 119905
119894) 119894 isin [1119873] and 119895 isin [119894119873] while if the amplitude
is correlated with the reverse instantaneous frequency com-ponent then in the formula 119891
119894119895= 1(119905
119894minus 119905
119895) 119894 isin [1119873] and
119895 isin (1 119894]Like the time-frequency spectrum of the time-frequency
transformation the processing result obtained from ampli-tude relevancy processing may also be expressed by thetime-frequency spectrum that is the one-dimensional pulsesequence 119909(119905
119894) 119894 isin [1119873] is transformed into a two-
dimensional plane in which the amplitude 119883(119905
119894 119891
119894119895) is
expressed by the color space with the pulse arrival time 119905
119894
as horizontal coordinate and the instantaneous frequency 119891
119894119895
as vertical coordinate Figure 8 presents the time-frequencyspectrum after the Steps (a)ndash(e) above are applied to Figure 7
(f) Effective Instantaneous Frequency Extraction After theamplitude relevancy processing above the instantaneousfrequency components119891
119894119895extracted at the moment 119905
119894are not
all effective instantaneous frequencies that help to diagnosethe damage in the rolling bearing Instead they containnumerous ineffective instantaneous frequency componentsresulting from false interharmonic (see label A in Figure 8)cross-term interference (see label B in Figure 8) noiseinterference wearout failure and poor lubrication inference(see label C in Figure 8) and other shock sources (seelabel D in Figure 8) Hence it is necessary to weed out theineffective instantaneous frequency components caused bythese factors above so as to highlight and extract the effectiveinstantaneous frequency components
(1) False InterharmonicWeeding-OutThe false interharmonicmeans the ineffective false instantaneous frequency compo-nent of the fraction times effective instantaneous frequencycomponent produced by the reciprocal of the arrival timeinterval between several points on the pulse sequence withthe time interval of 119879
1 after the pulse sequence containing
the periodical sequence component with the time interval of119879
1experiences PATFTMThe ineffective instantaneous frequency caused by the
false interharmonic can be weeded out by following the falseinterharmonic criterion below
False interharmonic criterion taking the judgment as towhether the positive instantaneous frequency 119891
119894119895is a false
interharmonic as an example suppose that 120575
1and 120575
2are
minor tolerances if there is 119896 to make |119891
119894119895minus 119891
119894119896119898| lt 120575
1
(wherein 119891
119894119895= 0 0 lt 119894 lt 119896 lt 119895 lt 119873 and the variable
119898 is a positive integer and satisfies 1 lt 119898 lt 119895 minus 119896 whichis used to demonstrate that 119891
119894119895is an interharmonic of 119891
119894119896)
and |119908
119894119896minus 119908
119894119895| lt 120575
2(119908119894119895
and 119908
119894119896denote the pulse width
at the moments 119905
119895and 119905
119896 resp) then 119891
119894119895is an ineffective
instantaneous frequency that is usually produced by the falseinterharmonic
(2) Removal of Cross-Term Interference and Noise InterferenceThe cross-term interference means the ineffective instan-taneous frequency component derived from the reciprocalof the arrival time interval between the staggered pulses
ti
fijB C D F C
E C B A C B
f82 f72 f62 f103f93 f83
f32 f42 f52 f63 f73
A false interharmonicB cross-term interferenceC noise interference wearout failure
and poor lubrication inference
D other shock sources frequencyE fault feature frequencyF false interharmonic of other
shock sources frequency
t1 t2 t3 t4 t5 t6 t7 t8 t9 t10 t11 t12 t13
Figure 8 Schematic diagram of amplitude relevancy processing
comprising several effective instantaneous frequency compo-nents after the pulse sequence containing several effectiveinstantaneous frequency components experiences PATFTM
The noise interference means the ineffective instanta-neous frequency component comes from the reciprocal of thearrival time interval between the different noise pulses as wellas between the noise pulse and other pulses after the pulsesequence containing noise pulse experiences PATFTM
As the rolling bearing fault feature frequencies can becalculated ahead by defining the frequency domain band-width [119891
119889 119891
119906] of the instantaneous frequency component119891
119894119895
the ineffective instantaneous frequencies produced by thecross-term interface and noise interface which fall out of thefrequency domain bandwidth can be preliminarily removed
The ineffective instantaneous frequencies produced bythe cross-term interface and noise interface which fall withinthe frequency domain bandwidth can be weeded out byfollowing the cross-term and noise interference criterion
Cross-term and noise interference criterion suppose that120575
3is a minor tolerance if there is no 119896 to make |119891
119894119895minus 119891
119894119896| lt
120575
3(wherein 119891
119894119895= 0 0 lt 119896 lt 119894 lt 119895 lt 119873) then 119891
119894119895is an
ineffective instantaneous frequency that is usually producedby the cross-term and noise interference
This is because the positive instantaneous frequencycomponent and the reverse instantaneous frequency com-ponent are obtained from the same pulse sequence in thesame way while the only difference between them lies inthe direction of the calculation adopted in obtaining theinstantaneous frequency components As the shock pulseproduced by the cross-term and noise interference within thesame pulse sequence takes place at random (excluding thecross-term interference caused by several effective instanta-neous frequency components in which the commonmultiplerelationship exists) the instantaneous frequency components119891
119894119895and119891
119894119896produced by the cross-termandnoise interference
within the positive instantaneous frequency components
Shock and Vibration 7
ti
fij
Figure 9 Schematic diagram of extraction of effective instanta-neous frequency components
and the reverse instantaneous frequency components arenecessarily irrelevant and as a rule no 119896 is available formaking |119891
119894119895minus 119891
119894119896| lt 120575
3(wherein 119891
119894119895= 0 0 lt 119896 lt
119894 lt 119895 lt 119873) However for the shock pulse produced bythe rolling bearing damage within the same pulse sequenceits occurring rule remains unchanged within a short timeand a certain phase shift alone takes place Therefore thechanging rules of the instantaneous frequency components119891
119894119895and 119891
119894119896produced by the rolling bearing damage within
the positive instantaneous frequency components and thereverse instantaneous frequency components remain thesamewithin a short time and there is generally 119896 available formaking |119891
119894119895minus119891
119894119896| lt 120575
3(wherein119891
119894119895= 0 0 lt 119896 lt 119894 lt 119895 lt 119873)
Hence the cross-term and noise interference criterion maybe followed for weeding out the ineffective instantaneous fre-quencies without excluding those instantaneous frequencycomponents arising from the rolling bearing damage
(3) Removal of Wearout Failure and Poor Lubrication Interfer-ence The wearout failure and poor lubrication interferencemean the ineffective instantaneous frequency componentproduced by the arrival time interval between the differentshock pulses resulting fromwearout failure and poor lubrica-tion as well as between the shock pulse and other pulses afterthe pulse sequence containing the shock pulse arising fromwearout failure and poor lubrication experiences PATFTM
The removal process of thewearout failure andpoor lubri-cation interference is similar to that of the noise interferenceand so the description thereof is here omitted
(4) Removal of Other Shock Sources The ineffective instan-taneous frequency components produced by other shocksources if not falling within the set frequency domainbandwidth [119891
119889 119891
119906] may be directly removed Or else like the
rolling bearing damage they will produce the fault featurefrequencies of specific physical significance and may beweeded out by analyzing the fault feature frequencies
In general when the effective instantaneous frequencycomponents are extracted the smaller 120575
1 1205752 and 120575
3value
adopted leads to the greater time resolution and frequencyresolution of the time-frequency spectrum obtained Theresults of extraction of the effective instantaneous frequencycomponents from the time-frequency spectrum as shown inFigure 8 are shown in Figure 9
To sum up the process of the amplitude threshold pro-cessing shock pulse ordering instantaneous pulse ordering
plane transformation of instantaneous frequency amplituderelevancy processing and effective instantaneous frequencyextraction is referred to as PATFTM
After experiencing PATFTM the instantaneous fre-quency component 119891
119894119895and its amplitude 119883(119905
119894 119891
119894119895) directly
reflect the time change feature of the analyzed vibrationsignals and they can be used for real-time and quantitativefault diagnosis for the rolling bearing
In addition as the instantaneous frequency component119891
119894119895is indirectly calculated from the pulse arrival time
the maximum resolution of time and frequency of thetime-frequency spectrum obtained from PATFTM is nolonger bound by Heisenbergrsquos uncertainty principle [22] butdepends upon the measuring precision of the pulse arrivaltime 119905
119894
4 Simulation and Application Analysis
41 Analysis of Simulation Signals If any local damage comesinto existence in the inner ring outer ring or rolling elementsof the rolling bearing the signal demodulated by SPM (iethe envelope signal obtained after band-pass filtering) maycontain the periodical shock components Besides if thesesignals so demodulated also contain the strong backgroundnoise or other shock sources then SPM will cause anerroneous diagnosis However PATFTM can extract the faultfeature well and complete the fault diagnosis Therefore inthe following the simulation signal 119909(119905) as shown in (5)containing the signal components produced by the innerring damage strong background noise and other shocksources is made and then it is processed by SPM shockpulse frequency spectrum analysis method shock pulsetime-frequency analysis method and PATFTM respectivelyThe results of analysis are then compared to validate theeffectiveness of PATFTM
119909 (119905) = 119909
1 (119905) + 119909
2 (119905) + 119909
3 (119905) (5)
where 119909
1(119905) is the simulated shock signal caused by the inner
ring damage 1199092(119905) is the simulated shock signals caused by
other shock sources 1199093(119905) is the simulated Gaussian white
noise with the mean value being 0mmsdotsminus2 and the variancebeing 11 times 10
minus4mmsdotsminus2119909
1(119905) may be expressed as the following pulse shock
signals of periodical exponential attenuation with the periodbeing 119879
1
119909
1 (119905) =
119896=+infin
sum
119896=minusinfin
119860
1119890
minus1205721(119905minus119896119879
1) cos [2120587119891
1(119905 minus 119896119879
1) + 120593
1119896]
sdot 119880 (119905 minus 119896119879
1)
(6)
where 119860
1denotes the peak amplitude and equals
005mmsdotsminus2 120572
1denotes the damping factor and equals
001 119891
1denotes the resonance frequency and equals
30000Hz 1205931119896
denotes the initial phase falling within [0
∘
360
∘] 119880(119905) denotes the unit step function 119879
1denotes the
period of occurrence of shock and equals 00075 s
8 Shock and Vibration
119909
2(119905) may be expressed as the following pulse shock
signals of periodical exponential attenuation with the periodbeing 119879
2
119909
2 (119905) =
119896=+infin
sum
119896=minusinfin
119860
2119890
minus1205722(119905minus119896119879
2) cos [2120587119891
2(119905 minus 119896119879
2) + 120593
2119896]
sdot 119880 (119905 minus 119896119879
2)
(7)
where 119860
2denotes the peak amplitude and equals
007mmsdotsminus2 120572
2denotes the damping factor and equals
002 119891
2denotes the resonance frequency and equals
30000Hz 1205932119896
denotes the initial phase falling within [0
∘
360
∘] 119880(119905) denotes the unit step function 119879
2denotes the
period of occurrence of shock and equals 0005 sFigure 10(a) shows the time domain waveform of 119909(119905) It
indicates that both positive transition and negative transitiontake place in the sporadic high frequency fading signaland the initial phase changes with time No periodicalcomponent representing the fault feature can be seen inthe time domain waveform and thus the fault diagnosis isimpossible Figure 10(b) shows the amplitude spectrum of thesimulation signal 119909(119905)
Figure 10(c) shows the results of processing of the sim-ulation signal 119909(119905) by SPM As there is strong backgroundnoise the statistical values dBm and dBc are generally highas shown in the figure If based on this it is judged thatthe rolling bearing is not well lubricated it is obviously anerroneous diagnosis
Figure 10(d) shows the frequency spectrum obtainedafter the simulation signal 119909(119905) is processed by shock pulsefrequency spectrum analysis method As shown in the figurethe visible feature frequencies are seen around 13180Hzand at its multiple frequency (corresponding to the shocksignal with the period of 00075 s) and around 20020Hzand at its multiple frequency (corresponding to the shocksignal with the period of 0005 s) Based on this it canbe correctly judged that a fault happens However as thediscrete sampling and interception of the continuous signalcause the frequency spectrum leakage and barrier effectthe feature frequencies extracted by shock pulse frequencyspectrum analysis method have some errors Besides themethod cannot display the shock occurring time In additionthe method also produces the unwanted 6689Hz differencefrequency signal component
Figure 10(e) shows the time-frequency spectrumobtained after the simulation signal 119909(119905) is processed byshock pulse time-frequency analysis method with theshort-time Fourier transform being used and the 016 swide Gaussian window being selected As shown in thefigure within the time period analyzed the visible featurefrequencies are seen around 13180Hz and at its multiplefrequency (corresponding to the shock signal with theperiod of 00075 s) and around 20030Hz and at its multiplefrequency (corresponding to the shock signal with the periodof 0005 s) Based on this it can be correctly judged that afault happens In comparison with shock pulse frequencyspectrum analysis method time-frequency analysis methodcan analyze two dimensions that is time and frequency
at the same time However as the method is restricted bythe Heisenberg uncertainty principle a certain width ispresent in the feature lines as shown in Figure 10(e) and thehigh time resolution and frequency resolution cannot besimultaneously achieved Besides the instantaneous featurefrequencies extracted in this way have some resolutionerrors and the shock sequence causes too many feature lineswhich are thus not eye-striking enough
Figure 10(f) shows the time-frequency spectrumobtainedafter the simulation signal 119909(119905) is processed by PATFTM(the amplitude threshold is set to be 003mmsdotsminus2 119891
1198890Hz
119891
119906500Hz 120575
11 Hz 120575
2000005 s and 120575
30006mmsdotsminus2) The
visible feature frequencies are seen at 13330Hz and 20000Hz(corresponding to the shock signals with the periods of00075 s and 0005 s resp) and thus the shock occurringfrequency is accurately and clearly reflected Based on thisit can be correctly judged that a fault happens In contrastwith the shock pulse frequency spectrum analysis methodwhich makes errors in the extracted feature frequenciesdue to such problems as frequency spectrum leakage andbarrier effect and cannot supply high time resolution andfrequency resolution at the same time owing to its restrictionby the Heisenberg uncertainty principle the PATFTM mayby settingminor tolerances 120575
1 1205752 and 120575
3 make the extracted
instantaneous feature frequencies approach the theoreticalvalue (as shown in Figure 10(f)) and provide high time-frequency resolution
To sum up PATFTM is capable of extracting the featurefrequencies representing the rolling bearing damage effec-tively even in the presence of the strong background noiseand other shock sources and the feature frequency resolutionsupplied by the proposedmethod is higher than that by shockpulse frequency spectrum analysis method and shock pulsetime-frequency analysis method
To further validate the effectiveness of PATFTM andobtain the range of applicability of the method in the whitenoise environment on the basis of the simulation signal119909
1(119905) the simulation signals with different SNR (0 dB minus7 dB
minus10 dB and minus11 dB) are made and used to do a comparativeanalysis experiment with shock pulse time-frequency analy-sis method
In the experiment short-time Fourier transform witha 4096ms wide Gaussian window is used for shock pulsetime-frequency analysis method while the parameters of theamplitude threshold 119891
119889 119891119906 1205751 1205752 and 120575
3 are set the same
as the parameters adopted in Figure 10(f) for PATFTM Theexperimental results are shown in Figure 11
Figure 11(a) shows the time domain waveform of thesimulation signals with different SNR as above and Figures11(b) and 11(c) show the results of processing of these simula-tion signals by shock pulse time-frequency analysis methodand PATFTM The results show that with the decrease inSNR PATFTM receives little effect When SNR is minus10 dBthe method remains able to suppress noise and extract theinstantaneous feature frequencies with high time resolutionand frequency resolution However when SNR is minus7 dB thewhite noise will interfere with the performance of shock pulsetime-frequency analysis method Although the frequencyresolution of themethod can be improved through increasing
Shock and Vibration 9
Am
plitu
de (m
ms2)
02
01
0
minus01
minus02
Time (s)0 02 04 06 08 1
(a)
Am
plitu
de (m
ms2)
5
4
3
2
1
0
times10minus3
Frequency (kHz)0 20 40 60 80 100
(b)
Time (s)0 02 04 06 08 1
Am
plitu
de (m
ms2)
01
008
006
004
002
0
Zoom in
041 042 043
(c)
times10minus3
Am
plitu
de (m
ms2)
8
6
4
2
0
Frequency (Hz)5004003002001000
(d)
Time (s)0 02 04 06 08 1
Freq
uenc
y (H
z)
500
400
300
200
100
0
(e)
Time (s)0 02 04 06 08 1
Freq
uenc
y (H
z)
500
400
300
200
100
0
(f)
Figure 10 (a) The time domain waveform of 119909(119905) (b) the amplitude spectrum of 119909(119905) (c) the processing result of 119909(119905) by SPM (d) theprocessing result of 119909(119905) by shock pulse frequency spectrum analysis method (e) the processing result of 119909(119905) by shock pulse time-frequencyanalysis method (f) the processing result of 119909(119905) by PATFTM
the window width the time resolution of the method will belost
In conclusion the antinoise performance of the proposedmethod is much better than that of shock pulse time-frequency analysis method Compared with shock pulsetime-frequency analysis method PATFTM can effectivelysuppress noise and extract the instantaneous feature frequen-cies with high time resolution and frequency resolution
42 Analysis of Measured Data To further validate the feasi-bility of PATFTM themethod is employed for processing andanalyzing the measured data and the results of processingand analysis are then compared with those of SPM shock
pulse frequency spectrum analysis method and shock pulsetime-frequency analysis method Figure 12(a) shows the timedomain waveform of the acceleration signal acquired by theshock pulse sensor at the pedestal of the Timken 566 bearingwith a faulty inner ring Figure 12(b) shows the time domainwaveformof the envelope signal obtained aftermeasured datawas demodulated In the test the devicersquos rotation frequencyis 20417Hz With reference to the structural parameters ofthe bearing and through the theoretical calculation [11] thefault feature frequency of the cage rolling elements outerring and inner ring of the bearing is obtained that is089Hz 758Hz 1777Hz and 2306Hz respectively Figures12(c) 12(d) 12(e) and 12(f) show the results of processing
10 Shock and VibrationA
mpl
itude
(mm
s2)
02
01
0
minus01
minus02
Time (s)0 05 1
SNR = 0dB
SNR = minus7dB
SNR = minus10dB
SNR = minus11dB
Am
plitu
de (m
ms2)
02
01
0
minus01
minus02
Time (s)0 05 1
Am
plitu
de (m
ms2)
02
01
0
minus01
minus02
Time (s)0 05 1
Am
plitu
de (m
ms2)
02
01
0
minus01
minus02
Time (s)0 05 1
(a)
Time (s)0 05 1
Freq
uenc
y (H
z)
500
400
300
200
100
0
Time (s)0 05 1
Freq
uenc
y (H
z)
500
400
300
200
100
0
Time (s)0 05 1
Freq
uenc
y (H
z)
500
400
300
200
100
0
Time (s)
0 05 1
Freq
uenc
y (H
z)
500
400
300
200
100
0
(b)
Time (s)0 05 1
Freq
uenc
y (H
z)
500
400
300
200
100
0
Time (s)0 05 1
Freq
uenc
y (H
z)
500
400
300
200
100
0
Time (s)0 05 1
Freq
uenc
y (H
z)
500
400
300
200
100
0
Time (s)0 05 1
Freq
uenc
y (H
z)500
400
300
200
100
0
(c)
Figure 11 (a) The time domain waveforms of 1199091(119905) with different SNR (b) the processing results of 119909
1(119905) with different SNR by shock pulse
time-frequency analysis method (c) the processing results of 1199091(119905) with different SNR by PATFTM
of the signal as shown in Figure 12(a) by SPM shock pulsefrequency spectrum analysis method shock pulse time-frequency analysis method and PATFTM
As shown in Figure 12(c) the periodical peak value takesplace and the value is great So it can be judged that thebearing is damaged however which part of the bearing isdamaged cannot be further judged A series of 2225Hzharmonic frequencies and 2225Hz sideband frequencies asshown in Figure 12(d) are close to the fault feature frequencyof the inner ring obtained through theoretical calculationBased on this it can be judged that the inner ring of thebearing is damaged In the frequency spectrum as shown inboth Figures 12(e) and 12(f) the visible feature frequenciesarise around 2225Hz which are close to the fault featurefrequency of the inner ring obtained through theoretical
calculation So it can be judged that the inner ring of thebearing is damaged However with the almost same timeresolution Figure 12(f) can highlight the feature frequenciesbetter than Figure 12(e) does as well as with more accuratefault feature frequency extracted and higher resolution
To sum up PATFTM can be used for processing andanalyzing the measured data well and extracting the faultfeature frequencies representing the rolling bearing damagewith high time resolution and frequency resolution
5 Conclusions
(1) Conclusion of theoretical study analysis PATFTMperforms such processes as amplitude threshold processingshock pulse ordering instantaneous frequency calculation
Shock and Vibration 11
Am
plitu
de (m
ms2)
5
0
minus5
Time (s)0 02 04 06
(a)
Time (s)0 02 04 06
Am
plitu
de (m
ms
2 ) 4
2
0
(b)
Time (s)0 02 04 06
Am
plitu
de (m
ms
2 )
2
1
0
(c)
Frequency (Hz)
Am
plitu
de (m
ms
2 )
04
02
00 50 100 150
2225
22252225
(d)
Time (s)0 02 04 06
Freq
uenc
y (H
z)
150
100
50
0
2225
(e)
Time (s)0 02 04 06
Freq
uenc
y (H
z)
150
100
50
0
2225
(f)
Figure 12 (a) The time domain waveform of the measured data (b) the time domain waveform of the envelope signal of the measured data(c) the processing result of the measured data by SPM (d) The processing result of the measured data by shock pulse frequency spectrumanalysis method (e) the processing result of the measured data by shock pulse time-frequency analysis method (f) the processing result ofthe measured data by PATFTM
plane transformation of instantaneous frequency andamplitude relevancy processing to the shock pulses extractedby SPM and transforms the shock pulse sequence ofone-dimensional time domain into the two-dimensionaltime-frequency domain Through the extraction of theeffective instantaneous frequencies it excludes the influencesfrom other interference factors and highlights and extractsthe fault feature representing the rolling bearing damageThe results of theoretical analysis show that the maximumtime and frequency resolution of PATFTM is no longerrestricted by the Heisenberg uncertainty principle butdepends upon the measuring precision of the pulse arrivaltime PATFTM can obtain the time-frequency spectrumwiththe high time and frequency resolution and by extracting theeffective instantaneous frequencies it can greatly suppressthe noises accurately extract the feature frequencies
and complete the rolling bearing fault diagnosis asdesired
(2) Conclusion of simulation experiment analysis theresults of the comparative simulation experiment in whichthe simulation signal produced by the inner ring damagestrong background noise and other shock sources is madeshow that PATFTM is able to effectively extract the featurefrequencies representing the rolling bearing damage evenin the presence of the strong background noise and othershock sources and the feature frequency resolution suppliedby the method is higher than that by shock pulse frequencyspectrum analysis method and shock pulse time-frequencyanalysis method The results of the simulation experimentin which the simulation signals with different SNR are madeshow that PATFTM is little affected by noises and that whenthe SNR is minus10 dB the method can still suppress noises well
12 Shock and Vibration
and extract the instantaneous feature frequencies with hightime resolution and frequency resolution
(3) Conclusion of measured data analysis the results ofmeasured data analysis show that PATFTM can effectivelyextract the fault feature representing the rolling bearingdamage and the extracted fault feature frequency accordswith the theoretically calculated fault feature frequency Inaddition the same conclusion as that drawn in the simulationexperiment is reached that is the resolution of the featurefrequencies extracted by PATFTM is superior to that by shockpulse frequency spectrum analysis method and shock pulsetime-frequency analysis method
To sum up the results of simulation and applicationanalysis come in agreement with the results of theoreticalanalysis and they both show that PATFTM can effectivelysuppress noises highlight the feature frequencies and avoiderroneous diagnosis Thus it is an effective method forextracting the rolling bearing fault features with high timeand frequency resolution
However in the presence of strong background noisealthough PATFTM is able to accurately diagnose the rollingbearing damage it cannot qualitatively diagnose the wearoutfailure and poor lubrication in the rolling bearing For thisreason PATFTM needs to be further studied and perfected
Competing Interests
The authors declare no competing interests
Acknowledgments
This work was supported in study design by the NationalNatural Science Foundation of China (Grant no 51275546)and the Natural Science Foundation Project of ChongqingCSTC (Grant no CQ cstc2011jjjq70001)
References
[1] F Zhang and K Ding ldquoResearch on the three algorithmsand limitations of generalized detection-filtering demodulationanalysisrdquo Journal of Vibration Engineering vol 15 no 2 pp 243ndash248 2002
[2] Y B Li M Q Xu H Y Zhao Y Wei and W Huang ldquoA newrotating machinery fault diagnosis method based on improvedlocalmeandecompositionrdquoDigital Signal Processing vol 46 pp201ndash214 2015
[3] C T Yiakopoulos and I A Antoniadis ldquoWavelet based demod-ulation of vibration signals generated by defects in rollingelement bearingsrdquo Shock and Vibration vol 9 no 6 pp 293ndash306 2002
[4] R Yan R X Gao and X Chen ldquoWavelets for fault diagnosis ofrotary machines a review with applicationsrdquo Signal Processingvol 96 15 pages 2014
[5] H C Wang J Chen and G M Dong ldquoFeature extraction ofrolling bearingrsquos early weak fault based on EEMD and tunableQ-factor wavelet transformrdquo Mechanical Systems and SignalProcessing vol 48 no 1-2 pp 103ndash119 2014
[6] M Zhao J Lin X Xu and X Li ldquoMulti-Fault detection ofrolling element bearings under harsh working condition using
imf-based adaptive envelope order analysisrdquo Sensors vol 14 no11 pp 20320ndash20346 2014
[7] Y-T Sheen ldquoOn the study of applying Morlet wavelet tothe Hilbert transform for the envelope detection of bearingvibrationsrdquo Mechanical Systems and Signal Processing vol 23no 5 pp 1518ndash1527 2009
[8] Y Qin J X Wang and B P Tang ldquoMulticomponent demodu-lation based on iterated Hilbert transform and its applicationrdquoJournal of Mechanical Engineering vol 45 no 8 pp 37ndash442009
[9] J R Stack R G Harley and T G Habetler ldquoAn amplitudemodulation detector for fault diagnosis in rolling elementbearingsrdquo IEEE Transactions on Industrial Electronics vol 51no 5 pp 1097ndash1102 2004
[10] I Moumene and N Ouelaa ldquoApplication of the wavelets mul-tiresolution analysis and the high-frequency resonance tech-nique for gears and bearings faults diagnosisrdquoThe InternationalJournal of Advanced Manufacturing Technology vol 83 no 5pp 1315ndash1339 2016
[11] S Patidar and P K Soni ldquoAn overview on vibration analysistechniques for the diagnosis of rolling element bearing faultsrdquoInternational Journal of Engineering Trends and Technology vol4 no 5 pp 1803ndash1809 2013
[12] R Yang J Kang J Zhao J Li and H Li ldquoA case study ofbearing condition monitoring using SPMrdquo in Proceedings of thePrognostics and System Health Management Conference (PHMrsquo14) pp 695ndash698 Zhangjiajie China August 2014
[13] N Tandon G S Yadava and K M Ramakrishna ldquoA compari-son of some condition monitoring techniques for the detectionof defect in induction motor ball bearingsrdquoMechanical Systemsand Signal Processing vol 21 no 1 pp 244ndash256 2007
[14] H Q Sang ldquoApplication on bearing detection in coal mineproductionrdquo Shanxi Coking Coal Science amp Technology vol 34pp 14ndash16 2010
[15] L Zhen H Zhengjia Z Yanyang and C Xuefeng ldquoBear-ing condition monitoring based on shock pulse method andimproved redundant lifting schemerdquoMathematics and Comput-ers in Simulation vol 79 no 3 pp 318ndash338 2008
[16] D E Butler ldquoThe Shock-pulse method for the detection ofdamaged rolling bearingsrdquo Non-Destructive Testing vol 6 no2 pp 92ndash95 1973
[17] V Barzdaitis V Zemaitis K Zebelys Z Pocius and P MazeikaldquoCondition monitoring of roller bearings using different diag-nostic methodsrdquo Diagnostyka vol 30 no 1 pp 53ndash60 2004
[18] Y Zhang L Y Lv and S T Wan ldquoThe shock pulse methodapplied on fault diagnosis of rolling bearingrdquo Petro-ChemicalEquipment Technology vol 28 no 4 pp 60ndash64 2007
[19] J Yan ldquoResearch on diagnosing the fault in rolling bearingbased on shock pulse methodrdquo Compressor Blower amp FanTechnology vol 2 pp 78ndash80 2009
[20] W-H Yang and M-G Gao ldquoDeinterleaving of pulse signalbased on plane transformationrdquo Transaction of Beijing Instituteof Technology vol 25 no 2 pp 151ndash154 2005
[21] A W Atarsquoa and S N Abdullah ldquoDeinterleaving of radarsignals and PRF identification algorithmsrdquo IET Radar Sonarand Navigation vol 1 no 5 pp 340ndash347 2007
[22] R Parhizkar Y Barbotin andMVetterli ldquoSequences withmin-imal time-frequency uncertaintyrdquo Applied and ComputationalHarmonic Analysis vol 38 no 3 pp 452ndash468 2015
International Journal of
AerospaceEngineeringHindawi Publishing Corporationhttpwwwhindawicom Volume 2014
RoboticsJournal of
Hindawi Publishing Corporationhttpwwwhindawicom Volume 2014
Hindawi Publishing Corporationhttpwwwhindawicom Volume 2014
Active and Passive Electronic Components
Control Scienceand Engineering
Journal of
Hindawi Publishing Corporationhttpwwwhindawicom Volume 2014
International Journal of
RotatingMachinery
Hindawi Publishing Corporationhttpwwwhindawicom Volume 2014
Hindawi Publishing Corporation httpwwwhindawicom
Journal ofEngineeringVolume 2014
Submit your manuscripts athttpwwwhindawicom
VLSI Design
Hindawi Publishing Corporationhttpwwwhindawicom Volume 2014
Hindawi Publishing Corporationhttpwwwhindawicom Volume 2014
Shock and Vibration
Hindawi Publishing Corporationhttpwwwhindawicom Volume 2014
Civil EngineeringAdvances in
Acoustics and VibrationAdvances in
Hindawi Publishing Corporationhttpwwwhindawicom Volume 2014
Hindawi Publishing Corporationhttpwwwhindawicom Volume 2014
Electrical and Computer Engineering
Journal of
Advances inOptoElectronics
Hindawi Publishing Corporation httpwwwhindawicom
Volume 2014
The Scientific World JournalHindawi Publishing Corporation httpwwwhindawicom Volume 2014
SensorsJournal of
Hindawi Publishing Corporationhttpwwwhindawicom Volume 2014
Modelling amp Simulation in EngineeringHindawi Publishing Corporation httpwwwhindawicom Volume 2014
Hindawi Publishing Corporationhttpwwwhindawicom Volume 2014
Chemical EngineeringInternational Journal of Antennas and
Propagation
International Journal of
Hindawi Publishing Corporationhttpwwwhindawicom Volume 2014
Hindawi Publishing Corporationhttpwwwhindawicom Volume 2014
Navigation and Observation
International Journal of
Hindawi Publishing Corporationhttpwwwhindawicom Volume 2014
DistributedSensor Networks
International Journal of
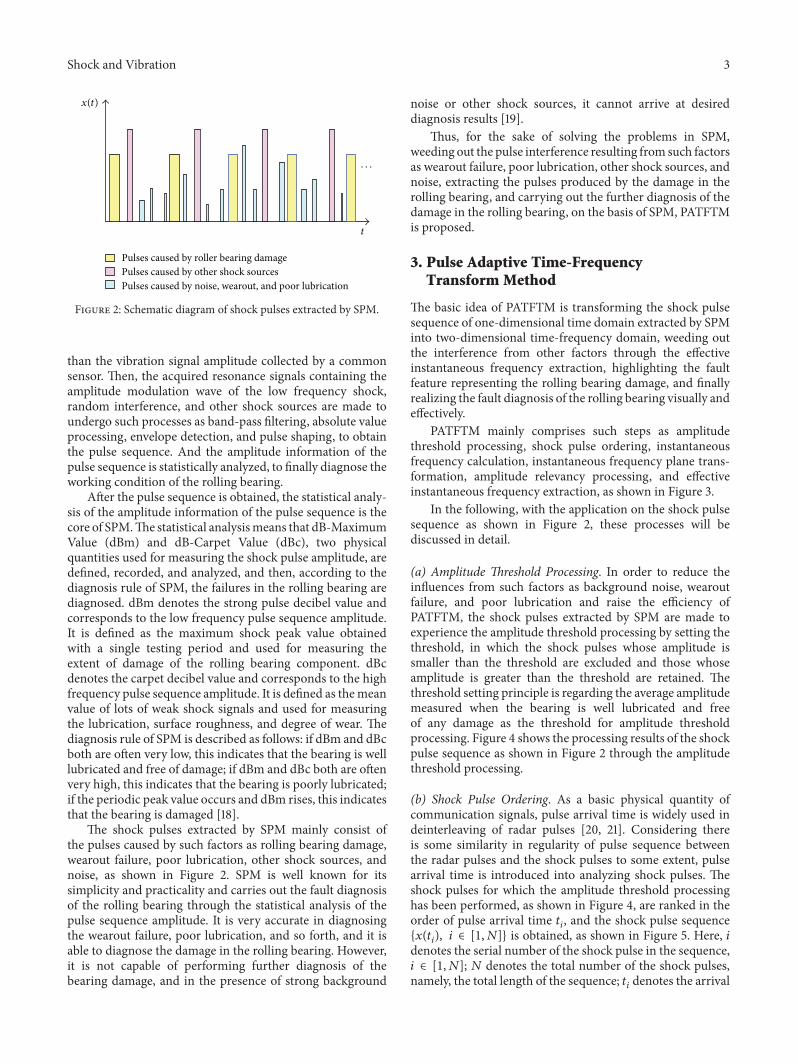
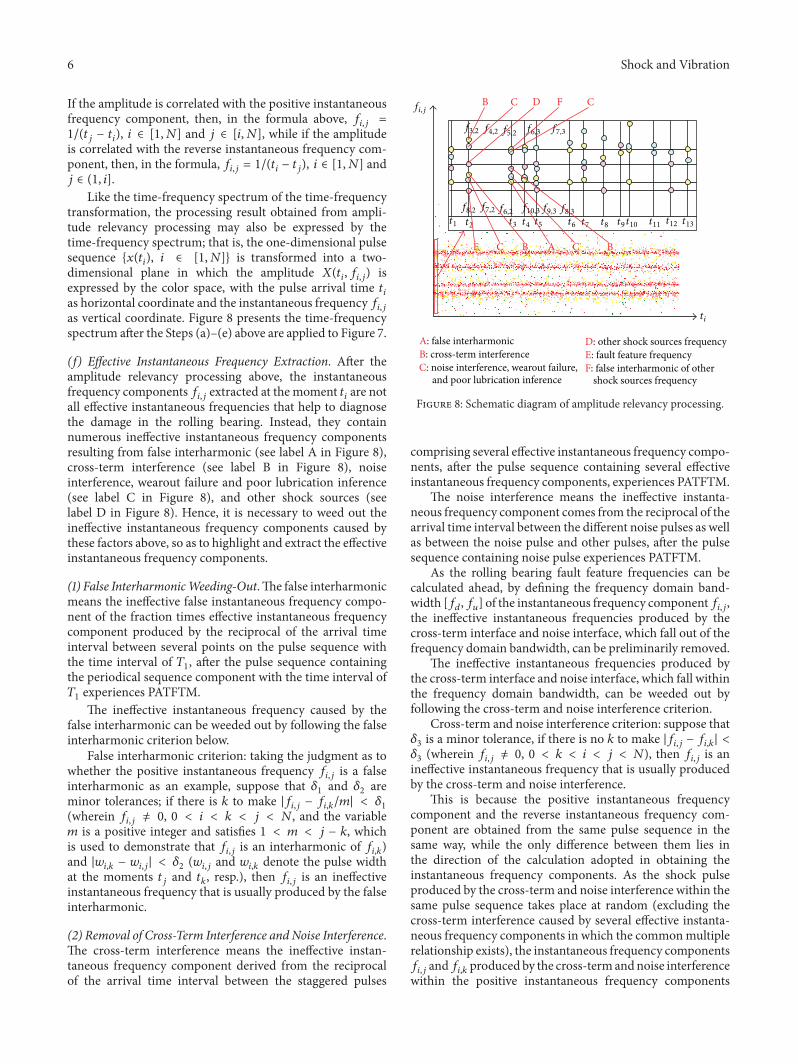
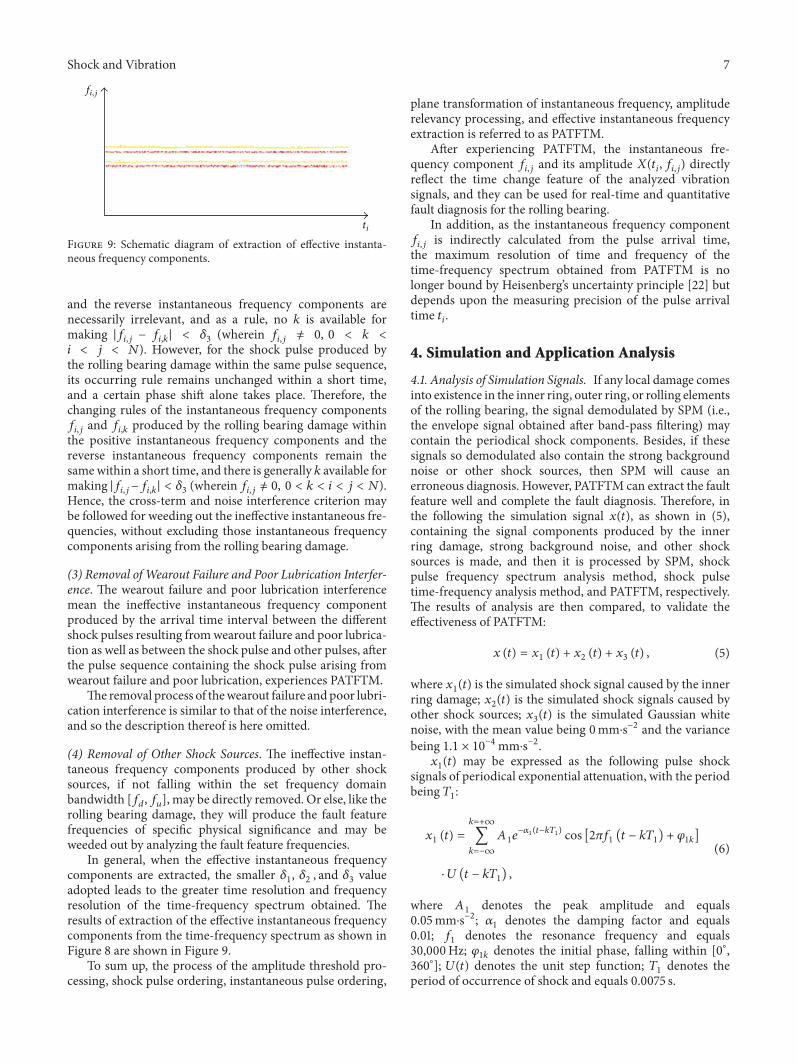

International Journal of
AerospaceEngineeringHindawi Publishing Corporationhttpwwwhindawicom Volume 2014
RoboticsJournal of
Hindawi Publishing Corporationhttpwwwhindawicom Volume 2014
Hindawi Publishing Corporationhttpwwwhindawicom Volume 2014
Active and Passive Electronic Components
Control Scienceand Engineering
Journal of
Hindawi Publishing Corporationhttpwwwhindawicom Volume 2014
International Journal of
RotatingMachinery
Hindawi Publishing Corporationhttpwwwhindawicom Volume 2014
Hindawi Publishing Corporation httpwwwhindawicom
Journal ofEngineeringVolume 2014
Submit your manuscripts athttpwwwhindawicom
VLSI Design
Hindawi Publishing Corporationhttpwwwhindawicom Volume 2014
Hindawi Publishing Corporationhttpwwwhindawicom Volume 2014
Shock and Vibration
Hindawi Publishing Corporationhttpwwwhindawicom Volume 2014
Civil EngineeringAdvances in
Acoustics and VibrationAdvances in
Hindawi Publishing Corporationhttpwwwhindawicom Volume 2014
Hindawi Publishing Corporationhttpwwwhindawicom Volume 2014
Electrical and Computer Engineering
Journal of
Advances inOptoElectronics
Hindawi Publishing Corporation httpwwwhindawicom
Volume 2014
The Scientific World JournalHindawi Publishing Corporation httpwwwhindawicom Volume 2014
SensorsJournal of
Hindawi Publishing Corporationhttpwwwhindawicom Volume 2014
Modelling amp Simulation in EngineeringHindawi Publishing Corporation httpwwwhindawicom Volume 2014
Hindawi Publishing Corporationhttpwwwhindawicom Volume 2014
Chemical EngineeringInternational Journal of Antennas and
Propagation
International Journal of
Hindawi Publishing Corporationhttpwwwhindawicom Volume 2014
Hindawi Publishing Corporationhttpwwwhindawicom Volume 2014
Navigation and Observation
International Journal of
Hindawi Publishing Corporationhttpwwwhindawicom Volume 2014
DistributedSensor Networks
International Journal of