Embed Size (px)
Citation preview
Vikas Chaurasia et al., International Journal of Computer Science and Mobile Computing, Vol.3 Issue.1, January- 2014, pg. 10-22
© 2014, IJCSMC All Rights Reserved 10
Available Online at www.ijcsmc.com
International Journal of Computer Science and Mobile Computing
A Monthly Journal of Computer Science and Information Technology
ISSN 2320–088X
IJCSMC, Vol. 3, Issue. 1, January 2014, pg.10 – 22
RESEARCH ARTICLE
Data Mining Techniques: To Predict and Resolve Breast Cancer Survivability
Vikas Chaurasia1, Saurabh Pal2 1Research Scholor, Sai Nath University, Ranchi, Jharkhand, India
2Head Dept. of MCA, VBS Purvanchal University, Jaunpur (U.P.), India
Abstract— Breast cancer is one of the deadliest disease, is the most common of all cancers and is the leading cause of cancer deaths in women worldwide, accounting for >1.6% of deaths and case fatality rates are highest in low-resource countries. The breast cancer risks are broadly classified into modifiable and non –modifiable factors. The non modifiable risk factors are age, gender, number of first degree relatives suffering from breast cancer, menstrual history, age at menarche and age at menopause. While the modifiable risk factors are BMI, age at first child birth, number of children, duration of breast feeding, alcohol, diet and number of abortions.
This paper presents a diagnosis system for detecting breast cancer based on RepTree, RBF Network and Simple Logistic. In test stage, 10-fold cross validation method was applied to the University Medical Centre, Institute of Oncology, Ljubljana, Yugoslavia database to evaluate the proposed system performances. The correct classification rate of proposed system is 74.5%. This research demonstrated that the Simple Logistic can be used for reducing the dimension of feature space and proposed Rep Tree and RBF Network model can be used to obtain fast automatic diagnostic systems for other diseases. Keywords— Breast cancer survivability; Rep Tree; RBF Network; Simple Logistic; Diagnostic systems
I. INTRODUCTION Cancer is a malignant cell which become a major cause of death and hardly prevented [1,
2]. India is a growing breast cancer epidemic with an increasing number of younger women becoming susceptible to the disease. A new global study estimates that by 2030, the number of new cases of breast cancer in India will increase from the current 115,000 to around 200,000 per year. According to Globocan data (International Agency for Research on Cancer), India is on top of the table with 1.85 million years of healthy life lost due to breast cancer. The study confirmed conclusions from earlier research: that breast cancer is now the second most common cancer diagnosed in Indian women after cervical cancer. Studies have also shown that Indian women develop breast cancer roughly a decade earlier than women in western countries. Poor survival may be largely explained by lack of or limited access to early detection services and treatment. In medical domains Data mining approaches is increasing rapidly due to the improvement effectiveness of these approaches to classification
Vikas Chaurasia et al., International Journal of Computer Science and Mobile Computing, Vol.3 Issue.1, January- 2014, pg. 10-22
© 2014, IJCSMC All Rights Reserved 11
and prediction systems, new and novel research directions are identified for further clinical and biological research. Generally cancer research is based upon statistical models did not reach to spread in medical because the user of these tools are not belongs to a medical profession. Data classification process using knowledge obtained from known data has been one of the most intensively studied subjects in statistics. There are many techniques to predict and classification breast cancer pattern. This paper empirically compares performance of three classical decision tree classifiers that are suitable for direct interpretability of their results.
This paper presents a new model that enhances the accuracy in identifying breast cancer patients. In this paper we investigated the generalization performance of RepTree, RBF Network and Simple Logistic in order to enhance the prediction models for decision-making system in the prognosis of breast cancer survivability.
A. About Breast Cancer
The body is made up of trillions of living cells. Normal body cells grow, divide into new cells, and die in an orderly way. During the early years of a person's life, normal cells divide faster to allow the person to grow. After the person becomes an adult, most cells divide only to replace worn-out, damaged, or dying cells. Cancer begins when cells in a part of the body start to grow out of control. There are many kinds of cancer, but they all start because of this out-of-control growth of abnormal cells.
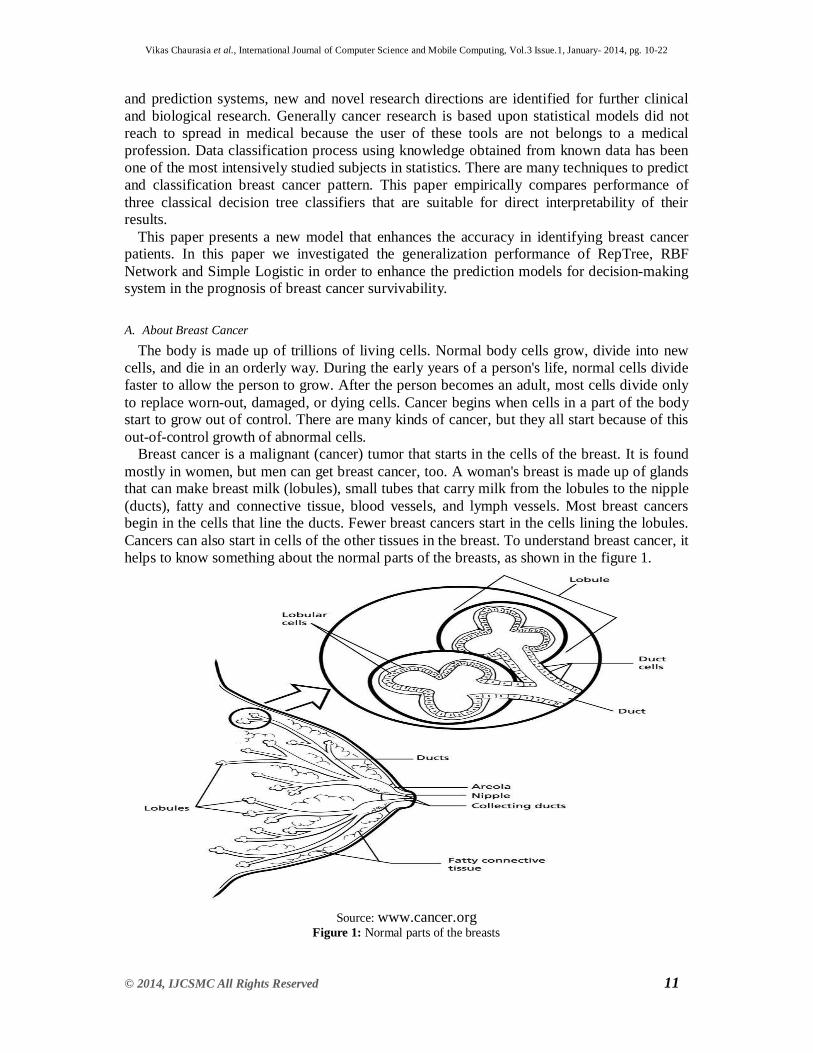
Breast cancer is a malignant (cancer) tumor that starts in the cells of the breast. It is found mostly in women, but men can get breast cancer, too. A woman's breast is made up of glands that can make breast milk (lobules), small tubes that carry milk from the lobules to the nipple (ducts), fatty and connective tissue, blood vessels, and lymph vessels. Most breast cancers begin in the cells that line the ducts. Fewer breast cancers start in the cells lining the lobules. Cancers can also start in cells of the other tissues in the breast. To understand breast cancer, it helps to know something about the normal parts of the breasts, as shown in the figure 1.
Source: www.cancer.org
Figure 1: Normal parts of the breasts
Vikas Chaurasia et al., International Journal of Computer Science and Mobile Computing, Vol.3 Issue.1, January- 2014, pg. 10-22
© 2014, IJCSMC All Rights Reserved 12
Most women have more than one known risk factor for breast cancer, yet will never get the disease. The most common risk factors for breast cancer is not only being female and growing older. There may be more than one cause of breast cancer [3].
These may be: • being a woman • getting older • having an inherited mutation in the BRCA1 or BRCA2 breast cancer gene • lobular carcinoma in situ (LCIS) • a personal history of breast or ovarian cancer • a family history of breast, ovarian or prostate cancer • having high breast density on a mammogram • having a previous biopsy showing atypical hyperplasia • starting menopause after age 55 • never having children • having your first child after age 35 • radiation exposure, frequent X-rays in youth • high bone density • being overweight after menopause or gaining weight as an adult • postmenopausal hormone use (current or recent use) of estrogen or estrogen plus progestin
B. Knowledge discovery in databases(KDD) and data mining
In now days huge amount of data being collected and stored in databases has increased due to the advancements of interest to researchers in machine learning, pattern recognition, databases, statistics, artificial intelligence, knowledge acquisition for expert systems, and data visualization.
Knowledge Discovery and Data Mining (KDD) is an interdisciplinary area focusing upon methodologies for extracting useful knowledge from data. The term Knowledge Discovery in Databases or KDD for short, refers to the broad process of finding knowledge in data, and emphasizes the "high-level" application of particular data mining methods. The unifying goal of the KDD process is to extract knowledge from data in the context of large databases. Applications of data mining have already been proven to provide benefits to many areas of medicine, including diagnosis, prognosis and treatment [4].
The remainder of this paper is organized as follows: The background section investigates provides the reader with the background information on breast cancer research, survivability analysis, commonly used prognosis factors and previously published relevant literature., the method section explains the proposed methodology for enhancing applied methods accuracy in diagnosing breast cancer patients, and the results section is followed by a conclusion section.
II. BACKGROUND
Many researchers have been applying various algorithms and techniques like Classification, Clustering, Regression, Artificial Intelligence, Neural Networks, Association Rules, Decision Trees, Genetic Algorithm, Nearest Neighbour method etc., to help health care professionals with improved accuracy in the diagnosis of breast cancer. In our study we have used the breast cancer database from the University Medical Centre, Institute of Oncology, Ljubljana, Yugoslavia. Thanks go to M. Zwitter and M. Soklic for providing the data.
This literature showed that there have been several studies on the survivability prediction problem of breast cancer. These studies have applied different approaches to the given problem and achieved high classification accuracies.
Vikas Chaurasia et al., International Journal of Computer Science and Mobile Computing, Vol.3 Issue.1, January- 2014, pg. 10-22
© 2014, IJCSMC All Rights Reserved 13
Delen et al. [5] had taken 202,932 breast cancer patients records, which then pre-classified into two groups of “survived” (93,273) and “not survived” (109,659). The results of predicting the survivability were in the range of 93% accuracy. Tan AC’s [6] used C4.5 decision tree, bagged decision tree on seven publicly available cancerous micro array data, and compared the prediction performance of these methods. Liu Ya-Qin’s [7] experimented on breast cancer data using C5 algorithm with bagging to predict breast cancer survivability. Jinyan LiHuiqing Liu’s [8] experimented on ovarian tumor data to diagnose cancer using C4.5 with and without bagging. Dong-Sheng Cao’s [9] proposed a new decision tree based ensemble method combined with feature selection method backward elimination strategy with bagging to find the structure activity relationships in the area of chemometrics related to pharmaceutical industry. My Chau Tu’s [10] proposed the use of bagging with C4.5 algorithm, bagging with Naïve bayes algorithm to diagnose the heart disease of a patient. My Chau Tu’s [11] used bagging algorithm to identify the warning signs of heart disease in patients and compared the results of decision tree induction with and without bagging. Tsirogiannis’s [12] applied bagging algorithm on medical databases using the classifiers neural networks, SVM’S and decision trees. Results exhibits improved accuracy of bagging than without bagging. Pan wen [13] conducted experiments on ECG data to identify abnormal high frequency electrocardiograph using decision tree algorithm C4.5 with bagging. Kaewchinporn C’s [14] presented a new classification algorithm TBWC combination of decision tree with bagging and clustering. This algorithm is experimented on two medical datasets: cardiocography1, cardiocography2 and other datasets not related to medical domain. Chaurasia and Pal [15, 20] conducted study on the prediction of heart attack risk levels from the heart disease database with data mining technique like Naïve Bayes, J48 decision tree and Bagging approaches and CART, ID3 and Decision Table. The outcome shows that bagging techniques performance is more accurate than Bayesian classification and J48.
III. METHODS
In this paper, we have investigated three data mining techniques: RepTree, RBF Network and Simple Logistic. In this paper, we used these algorithms to predict the survivability rate of breast cancer data set. We selected these three classification techniques to find the most suitable one for predicting cancer survivability rate. A. REPTree
REPTree is a fast decision tree learner which builds a decision/regression tree using information gain as the splitting criterion, and prunes it using reduced error pruning. It only sorts values for numeric attributes once. REPtree method is also based on C4.5 algorithm and can produce classification (discrete outcome) or regression trees (continuous outcome). REPTree is a fast decision tree learner used to build a decision or regression tree models [16]. It can deal with missing values utilizing splitting the corresponding instances into pieces. Moreover, it commonly combines with Bagging [17]. Few research studies have demonstrated the performance of REPTree because REPTree achieved lower accuracy. B. RBF Network
A radial basis function network is an artificial neural network that uses radial basis functions as activation functions. Radial Basis Functions are first introduced in the solution of the real multivariable interpolation problems. Broomhead and Lowe (1988), and Moody and Darken (1989) were the first to exploit the use of radial basis functions in the design of neural networks. The output of the network is a linear combination of radial basis functions of the inputs and neuron parameters. Radial basis function networks have many uses, including function approximation, time series prediction, classification, and system control. Radial

Vikas Chaurasia et al., International Journal of Computer Science and Mobile Computing, Vol.3 Issue.1, January- 2014, pg. 10-22
© 2014, IJCSMC All Rights Reserved 14
basis function (RBF) networks typically have three layers: an input layer, a hidden layer with a non-linear RBF activation function and a linear output layer, as shown in figure 2.
Figure 2: The structure of RBF neural network.
C. Simple Logistic Logistic regression is a very powerful modeling tool, is a generalization of linear
regression [18]. Logistic Regression is used to assess the likelihood of a disease or health condition as a function of a risk factor (and covariates). Both simple and multiple logistic regression, assess the association between independent variable(s) (Xi) -- sometimes called exposure or predictor variables — and a dichotomous dependent variable (Y) -- sometimes called the outcome or response variable. It is used primarily for predicting binary or multi-class dependent variables.
IV. BREAST CANCER DATASET
The data used in this study are provided by the University Medical Centre, Institute of Oncology, Ljubljana, Yugoslavia. My special thanks go to M. Zwitter and M. Soklic for providing the data for this research work. The data set has 10 attributes and total 286 rows, we restricted testing to these same attributes (see Table 1) and contain the following variables.
1. Age: patient’s age at the time of diagnosis; 2. Menopause: menopause status of the patient at the time of diagnosis; 3. Tumor size: tumor size (in mm); 4. Inv-nodes: range 0 - 39 of axillary lymph nodes showing breast cancer at the time of
histological examination; 5. Node caps: penetration of the tumor in the lymph node capsule or not; 6. Degree of malignancy: range 1-3 the histological grade of the tumor. That are
grade: 1 predominantly that consist of cancer cells, grade: 2 neoplastic that consist of usual characteristics of cancer cells, grade: 3 predominately that consist of cells that are highly affected;
7. Breast: breast cancer may occur in either breast; 8. Breast quadrant: if the nipple consider as a central point the breast may be divided
into four quadrants; 9. Irradiation: patient’s radiation (x-rays) therapy history.
Vikas Chaurasia et al., International Journal of Computer Science and Mobile Computing, Vol.3 Issue.1, January- 2014, pg. 10-22
© 2014, IJCSMC All Rights Reserved 15
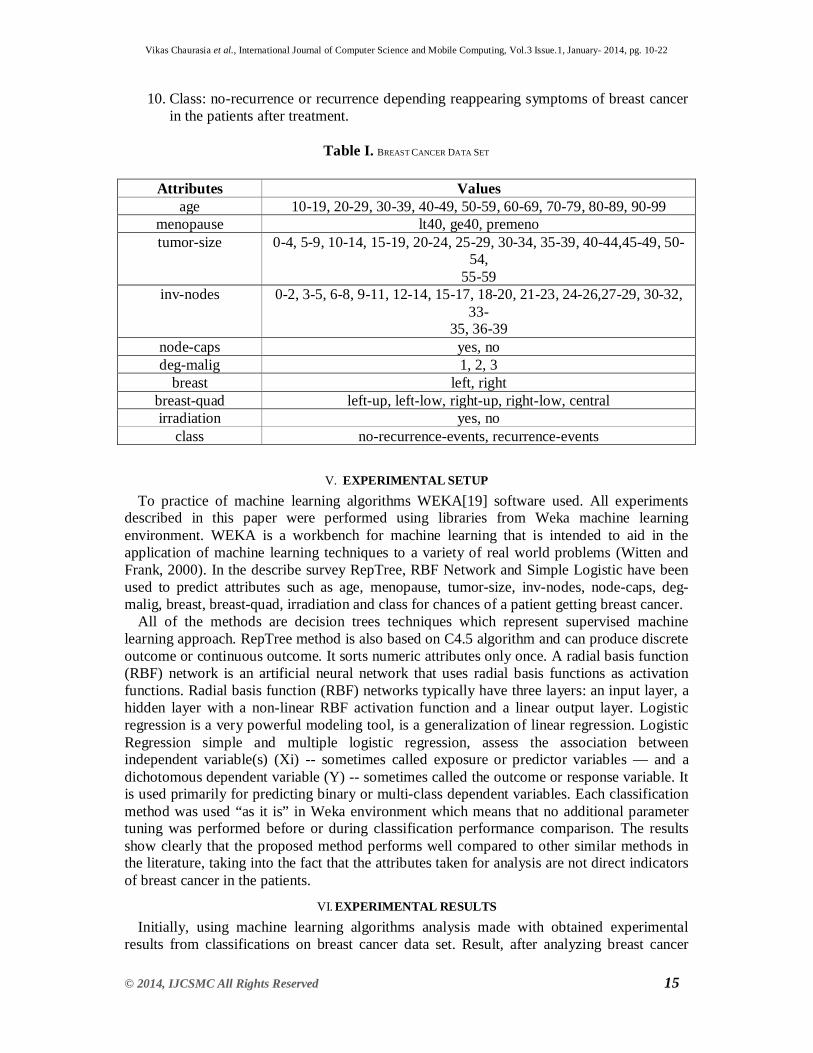
10. Class: no-recurrence or recurrence depending reappearing symptoms of breast cancer in the patients after treatment.
Table I. BREAST CANCER DATA SET
Attributes Values age 10-19, 20-29, 30-39, 40-49, 50-59, 60-69, 70-79, 80-89, 90-99
menopause lt40, ge40, premeno tumor-size 0-4, 5-9, 10-14, 15-19, 20-24, 25-29, 30-34, 35-39, 40-44,45-49, 50-
54, 55-59
inv-nodes 0-2, 3-5, 6-8, 9-11, 12-14, 15-17, 18-20, 21-23, 24-26,27-29, 30-32, 33-
35, 36-39 node-caps yes, no deg-malig 1, 2, 3
breast left, right breast-quad left-up, left-low, right-up, right-low, central irradiation yes, no
class no-recurrence-events, recurrence-events
V. EXPERIMENTAL SETUP
To practice of machine learning algorithms WEKA[19] software used. All experiments described in this paper were performed using libraries from Weka machine learning environment. WEKA is a workbench for machine learning that is intended to aid in the application of machine learning techniques to a variety of real world problems (Witten and Frank, 2000). In the describe survey RepTree, RBF Network and Simple Logistic have been used to predict attributes such as age, menopause, tumor-size, inv-nodes, node-caps, deg-malig, breast, breast-quad, irradiation and class for chances of a patient getting breast cancer.
All of the methods are decision trees techniques which represent supervised machine learning approach. RepTree method is also based on C4.5 algorithm and can produce discrete outcome or continuous outcome. It sorts numeric attributes only once. A radial basis function (RBF) network is an artificial neural network that uses radial basis functions as activation functions. Radial basis function (RBF) networks typically have three layers: an input layer, a hidden layer with a non-linear RBF activation function and a linear output layer. Logistic regression is a very powerful modeling tool, is a generalization of linear regression. Logistic Regression simple and multiple logistic regression, assess the association between independent variable(s) (Xi) -- sometimes called exposure or predictor variables — and a dichotomous dependent variable (Y) -- sometimes called the outcome or response variable. It is used primarily for predicting binary or multi-class dependent variables. Each classification method was used “as it is” in Weka environment which means that no additional parameter tuning was performed before or during classification performance comparison. The results show clearly that the proposed method performs well compared to other similar methods in the literature, taking into the fact that the attributes taken for analysis are not direct indicators of breast cancer in the patients.
VI. EXPERIMENTAL RESULTS
Initially, using machine learning algorithms analysis made with obtained experimental results from classifications on breast cancer data set. Result, after analyzing breast cancer

Vikas Chaurasia et al., International Journal of Computer Science and Mobile Computing, Vol.3 Issue.1, January- 2014, pg. 10-22
© 2014, IJCSMC All Rights Reserved 16
data set visually using different attributes and figure out the distribution of values as shown in figure 3.
Figure 3: Visual form of breast cancer survivals using all attributes.
In our experimental result section we have carried out some experiments in order to evaluate the performance of different algorithms for predicting breast cancer survivals in order to time to build a model, correctly classified instances, incorrectly classified instances and %accuracy (see Table II).
Table II: PERFORMANCE OF THE CLASSIFIERS
From above table we can conclude that Simple Logistic is more accurate classifier in comparison of others also it can be easily seen that it has highly classified correct instances as well as incorrectly classified instance than RepTree and RBF Network (see figure 4).
Evaluation Criteria Classifiers
RepTree RBF Network Simple Logistic
Timing to build model (in Sec) 0.02 0.41 0.62
Correctly classified instances 204 211 213
Incorrectly classified instances 82 75 73
Accuracy (%) 71.32% 73.77% 74.47%

Vikas Chaurasia et al., International Journal of Computer Science and Mobile Computing, Vol.3 Issue.1, January- 2014, pg. 10-22
© 2014, IJCSMC All Rights Reserved 17
Figure 4: comparative graph of different classifier showing at different evaluation criteria.
Kappa statistic, mean absolute error and root mean squared error will be in numeric value only. We also show the relative absolute error and root relative squared error in percentage for references and evaluation. The results of the simulation are shown in Tables III.
TABLE III: TRAINING AND SIMULATION ERROR Evaluation Criteria Classifiers
RepTree RBF Network
Simple Logistic
Kappa statistic(KS) 0.1734 0.3037 0.2846
Mean absolute error(MAE) 0.3809 0.3437 0.3614
Root mean squared error (RMSE) 0.4655 0.4282 0.4285
Relative absolute error (RAE) 91.03% 82.14% 86.36%
Root relative squared error (RRSE)
101.84% 93.687% 93.75%
Figures 5 are the graphical representations of the simulation result.

Vikas Chaurasia et al., International Journal of Computer Science and Mobile Computing, Vol.3 Issue.1, January- 2014, pg. 10-22
© 2014, IJCSMC All Rights Reserved 18
Figure 5: Comparison between Parameters
Once Predictive model is created, it is necessary to check how accurate it is, the accuracy of the predictive model is calculated based on the precision, recall values of classification matrix. Table IV below shows the TP rate, FP rate, precision, recall value for RepTree, RBF Network, Simple Logistic.
Table IV: COMPARISON OF ACCURACY MEASURES Classifier TP FP Precision Recall Class RepTree 0.92 0.776 0.737 0.92 no-recurrence-
events 0.224 0.08 0.543 0.224 recurrence-
events RBF Network 0.886 0.612 0.774 0.886 no-recurrence-
events 0.388 0.114 0.589 0.388 recurrence-
events Simple Logistic 0.925 0.682 0.762 0.925 no-recurrence-
events 0.318 0.075 0.643 0.318 recurrence-
events
The performance of the learning techniques is highly dependent on the nature of the training data. Confusion matrices are very useful for evaluating classifiers. The columns represent the predictions, and the rows represent the actual class. To evaluate the robustness of classifier, the usual methodology is to perform cross validation on the classifier.
TABLE 5: CONFUSION MATRIX Classifier no-recurrence-
events recurrence-
events Class
RepTree 185 16 no-recurrence-events
66 19 recurrence-events
RBF Network 178 23 no-recurrence-events
52 33 recurrence-events
Simple Logistic 186 15 no-recurrence-events
58 27 recurrence-events
Vikas Chaurasia et al., International Journal of Computer Science and Mobile Computing, Vol.3 Issue.1, January- 2014, pg. 10-22
© 2014, IJCSMC All Rights Reserved 19
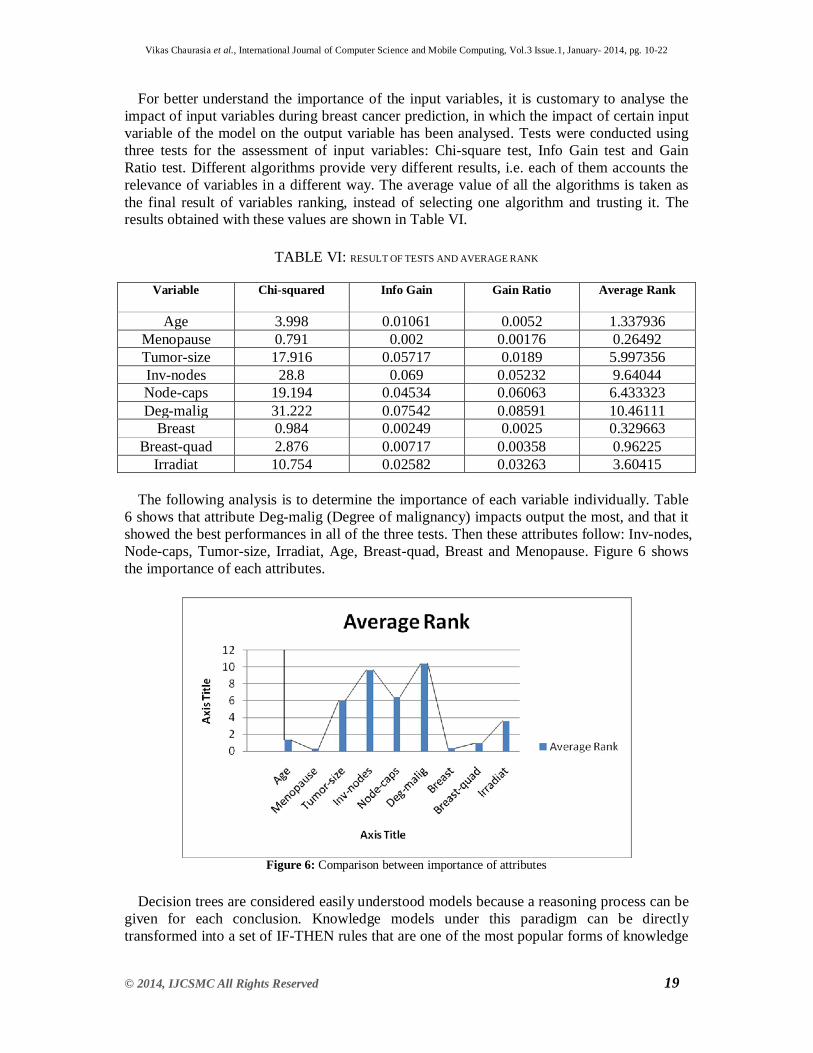
For better understand the importance of the input variables, it is customary to analyse the impact of input variables during breast cancer prediction, in which the impact of certain input variable of the model on the output variable has been analysed. Tests were conducted using three tests for the assessment of input variables: Chi-square test, Info Gain test and Gain Ratio test. Different algorithms provide very different results, i.e. each of them accounts the relevance of variables in a different way. The average value of all the algorithms is taken as the final result of variables ranking, instead of selecting one algorithm and trusting it. The results obtained with these values are shown in Table VI.
TABLE VI: RESULT OF TESTS AND AVERAGE RANK
Variable Chi-squared Info Gain Gain Ratio Average Rank
Age 3.998 0.01061 0.0052 1.337936 Menopause 0.791 0.002 0.00176 0.26492 Tumor-size 17.916 0.05717 0.0189 5.997356 Inv-nodes 28.8 0.069 0.05232 9.64044 Node-caps 19.194 0.04534 0.06063 6.433323 Deg-malig 31.222 0.07542 0.08591 10.46111
Breast 0.984 0.00249 0.0025 0.329663 Breast-quad 2.876 0.00717 0.00358 0.96225
Irradiat 10.754 0.02582 0.03263 3.60415
The following analysis is to determine the importance of each variable individually. Table 6 shows that attribute Deg-malig (Degree of malignancy) impacts output the most, and that it showed the best performances in all of the three tests. Then these attributes follow: Inv-nodes, Node-caps, Tumor-size, Irradiat, Age, Breast-quad, Breast and Menopause. Figure 6 shows the importance of each attributes.
Figure 6: Comparison between importance of attributes
Decision trees are considered easily understood models because a reasoning process can be
given for each conclusion. Knowledge models under this paradigm can be directly transformed into a set of IF-THEN rules that are one of the most popular forms of knowledge
Vikas Chaurasia et al., International Journal of Computer Science and Mobile Computing, Vol.3 Issue.1, January- 2014, pg. 10-22
© 2014, IJCSMC All Rights Reserved 20
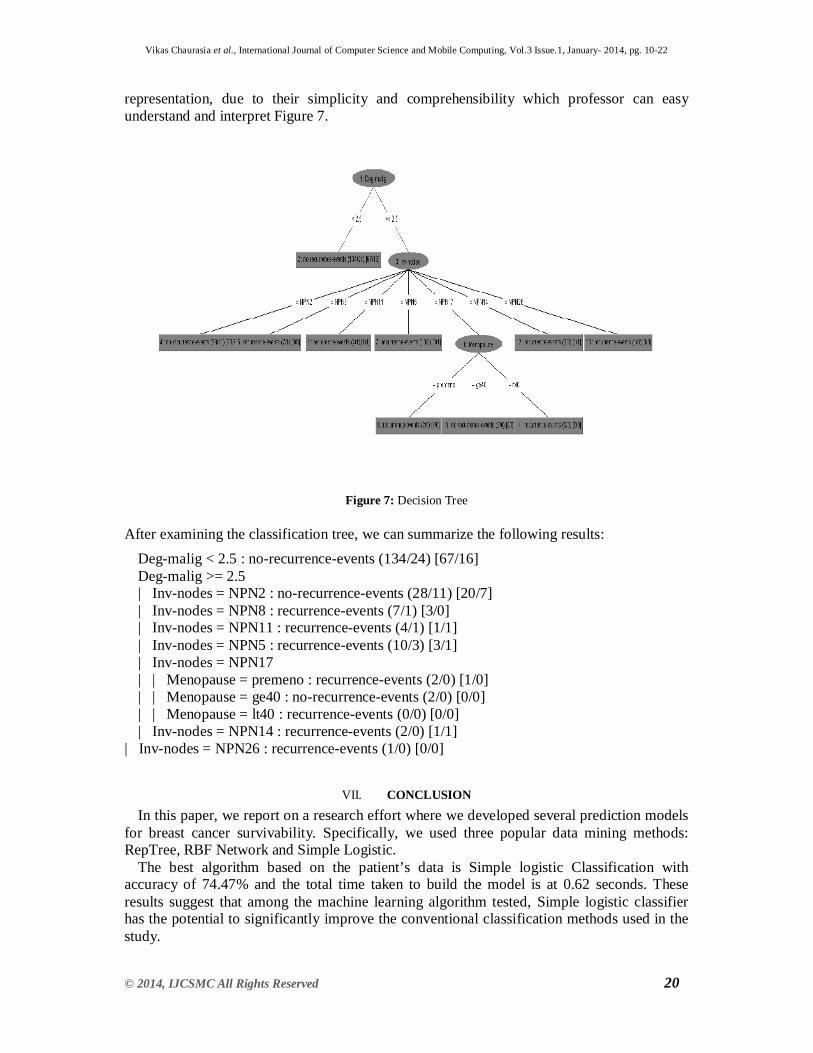
representation, due to their simplicity and comprehensibility which professor can easy understand and interpret Figure 7.
Figure 7: Decision Tree After examining the classification tree, we can summarize the following results:
Deg-malig < 2.5 : no-recurrence-events (134/24) [67/16] Deg-malig >= 2.5 | Inv-nodes = NPN2 : no-recurrence-events (28/11) [20/7] | Inv-nodes = NPN8 : recurrence-events (7/1) [3/0] | Inv-nodes = NPN11 : recurrence-events (4/1) [1/1] | Inv-nodes = NPN5 : recurrence-events (10/3) [3/1] | Inv-nodes = NPN17 | | Menopause = premeno : recurrence-events (2/0) [1/0] | | Menopause = ge40 : no-recurrence-events (2/0) [0/0] | | Menopause = lt40 : recurrence-events (0/0) [0/0] | Inv-nodes = NPN14 : recurrence-events (2/0) [1/1]
| Inv-nodes = NPN26 : recurrence-events (1/0) [0/0]
VII. CONCLUSION
In this paper, we report on a research effort where we developed several prediction models for breast cancer survivability. Specifically, we used three popular data mining methods: RepTree, RBF Network and Simple Logistic.
The best algorithm based on the patient’s data is Simple logistic Classification with accuracy of 74.47% and the total time taken to build the model is at 0.62 seconds. These results suggest that among the machine learning algorithm tested, Simple logistic classifier has the potential to significantly improve the conventional classification methods used in the study.
Vikas Chaurasia et al., International Journal of Computer Science and Mobile Computing, Vol.3 Issue.1, January- 2014, pg. 10-22
© 2014, IJCSMC All Rights Reserved 21
We also shows that the most important attributes for breast cancer survivals are Deg-malig (Degree of malignancy), Inv-nodes, Node-caps, Tumor-size, Irradiat, Age, Breast-quad, Breast and Menopause. These attributes were found using three tests for the assessment of input variables: Chi-square test, Info Gain test and Gain Ratio test.
REFERENCES [1] Delen D, Patil N. Knowledge extraction from prostate cancer data. The 39thAnnual Hawaii International
Conference on System Sciences; 2006; 1-10. [2] National Cancer Institute. Surveillance, Epidemiology, and End Results (SEER) Program Public-Use Data
(1973-2008). Cancer Statistics Branch; 2011. [3] www.komen.org/risk [4] Richards G, Rayward-Smith VJ, Sonksen PH, Carey S, Weng C. Data mining for indicators of early
mortality in a database of clinical records. Artif Intell Med 2001;22:215—31. [5] Delen D, Walker G, Kadam A. Predicting breast cancer survivability: a comparison of three data mining
methods. Artificial Intelligence in Medicine. 2005 Jun; 34(2):113-27. [6] Tan AC, Gilbert D. “Ensemble machine learning on gene expression data for cancer classification”, Appl
Bioinformatics. 2003;2(3 Suppl):S75-83. [7] Liu Ya-Qin, Wang Cheng, Zhang Lu,” Decision Tree Based Predictive Models for Breast Cancer
Survivability on Imbalanced Data” , 3rd International Conference on Bioinformatics and Biomedical Engineering , 2009.
[8] Jinyan LiHuiqing Liu, See-Kiong Ng and Limsoon Wong,” Discovery of significant rules for classifying cancer diagnosis data”, Bioinformatics 19(Suppl. 2)Oxford University Press 2003.
[9] Dong-Sheng Cao, Qing-Song Xu ,Yi-Zeng Liang, Xian Chen, “Automatic feature subset selection for decision tree-based ensemble methods in the prediction of bioactivity”, Chemometrics and Intelligent Laboratory Systems.
[10] My Chau Tu, Dongil Shin, Dongkyoo Shin ,“Effective Diagnosis of Heart Disease through Bagging Approach”, 2nd International Conference on Biomedical Engineering and Informatics,2009.
[11] My Chau Tu, Dongil Shin, Dongkyoo Shin, “A Comparative Study of Medical Data Classification Methods Based on Decision Tree and Bagging Algorithms” Eighth IEEE International Conference on Dependable, Autonomic and Secure Computing, 2009.
[12] Tsirogiannis, G.L, Frossyniotis, D, Stoitsis, J, Golemati, S, Stafylopatis, A Nikita,K.S,” Classification of Medical Data with a Robust Multi-Level Combination scheme”, IEEE international joint Conference on Neural Networks.
[13] Pan Wen, “Application of decision tree to identify a abnormal high frequency electrocardiograph”, China National Knowledge Infrastructure Journal, 2000.
[14] Kaewchinporn .C, Vongsuchoto. N, Srisawat. A ” A Combination of Decision Tree Learning and Clustering for Data Classification”, 2011 Eighth International Joint Conference on Computer Science and Software Engineering (JCSSE).
[15] V. Chauraisa and S. Pal, “Data Mining Approach to Detect Heart Diseases”, International Journal of Advanced Computer Science and Information Technology (IJACSIT),Vol. 2, No. 4,2013, pp 56-66.
[16] Witten IH, Frank E. Data mining: practical machine learning tools and techniques. 2 ed. San Francisco: Morgan Kaufmann; 2005.
[17] Witten IH, Frank E, Trigg L, Hall M, Holmes G, Cunningham SJ. Weka: Practical machine learning tools and techniques with java implementations. The International Workshop: Emerging Knowledge Engineering and Connectionist-Based Information Systems; 1999; 192-6.
[18] Hastie T, Tibshirani R, Friedman J. The elements of statistical learning. New York, NY: Springer-Verlag; 2001.
[19] Witten, I.H. and Frank, E.: Data Mining: Practical Machine Learning Tools and Techniques. Morgan Kaufmann Series in Data Management Systems, Morgan Kaufmann (2005).
[20] V. Chauraisa and S. Pal, “Early Prediction of Heart Diseases Using Data Mining Techniques”, Carib.j.SciTech,,Vol.1, pp. 208-217, 2013.

Vikas Chaurasia et al., International Journal of Computer Science and Mobile Computing, Vol.3 Issue.1, January- 2014, pg. 10-22
© 2014, IJCSMC All Rights Reserved 22
AUTHORS’ BIOGRAPHY
Vikas Chaurasia is M.Sc. (Math) and MCA from UNSIET VBS Purvanchal University, U.P., India. Since 2010 he has been working as lecturer in the department of Pharmacy. He is presently working as Lecturer in Department of Pharmacy, KHBS College of Pharmacy, Jaunpur, U.P, and India. His area of research includes Data Mining, Cloud Computing, Network Security, Web Technologies, and Artificial Intelligence.
Saurabh Pal received his M.Sc. (Computer Science) from Allahabad University, UP, India (1996) and obtained his Ph.D. degree from the Dr. R. M. L. Awadh University, Faizabad (2002). He then joined the Dept. of Computer Applications, VBS Purvanchal University, Jaunpur as Lecturer. At present, he is working as Head and Sr. Lecturer at Department of Computer Applications. Saurabh Pal has authored more than 40 numbers of research papers in international/national Conference/journals and also guides research scholars in Computer Science/Applications. He is an active
member of CSI, Society of Statistics and Computer Applications and working as reviewer and member of editorial board for more than 15 international journals. His research interests include Image Processing, Data Mining, Grid Computing and Artificial Intelligence.