Embed Size (px)
Citation preview

Hindawi Publishing CorporationEvidence-Based Complementary and Alternative MedicineVolume 2013, Article ID 738245, 10 pageshttp://dx.doi.org/10.1155/2013/738245
Research ArticleDifferences of Excess and Deficiency Zheng in Patients withChronic Hepatitis B by Urinary Metabonomics
Shujun Sun,1 Jianye Dai,1 Junwei Fang,1 Xiaojun Gou,2 Huijuan Cao,1 Ningning Zheng,1
Yang Wang,1 Wei Zhang,3 Yongyu Zhang,1 Wei Jia,4 and Yiyang Hu2
1 Center for Traditional Chinese Medicine and Systems Biology, Shanghai University of Traditional Chinese Medicine,Shanghai 201203, China
2 Institute of Liver Diseases, Shuguang Hospital, Key Laboratory of Liver and Kidney Diseases of Ministry of Education,Shanghai University of Traditional Chinese Medicine, Shanghai 201203, China
3 Liver Department, Longhua Hospital, Shanghai University of Traditional Chinese Medicine, Shanghai 201203, China4Department of Nutrition, University of North Carolina at Greensboro, North Carolina Research Campus, Kannapolis, NC 28081, USA
Correspondence should be addressed to Yongyu Zhang; [email protected] and Wei Jia; w [email protected]
Received 10 January 2013; Revised 25 March 2013; Accepted 25 March 2013
Academic Editor: William C. Cho
Copyright © 2013 Shujun Sun et al. This is an open access article distributed under the Creative Commons Attribution License,which permits unrestricted use, distribution, and reproduction in any medium, provided the original work is properly cited.
Traditional Chinese medicine (TCM) physicians stratify patients with the same disease into different subtypes in order to guidethe appropriate treatment, which is called Zheng (TCM syndrome) classification. Excess and deficiency ZHENG is a couple ofbasic ZHENGs of maladjusted body nature, reflecting the struggling state of human body and pathogenic factor and is importantand prevalently exists in the ZHENG classification of many diseases. The present work using chronic hepatitis B (CHB) as anentry point explored the substance connotation of excess and deficiency ZHENG with the metabonomic technology based on gaschromatography-mass spectrometry (GC-MS). The different substantial basis of two ZHENGs suggested that CHB patients couldbe categorized into two groups with diverse pathogenesis. The differential metabolites and disturbed pathways compared to not-obvious ZHENG characters patients (without ZHENG group/WZ) were selected in both of the two ZHENGs. The ROC analysisdemonstrated that five metabolites had a greater potential to be the clinic biomarkers of EZ or DZ. And excess ZHENG revealed ahigher level of immune function than deficiency ZHENG.We are eager to transform the concept of traditional excess and deficiencyZHENGs to modern therapeutic approaches, with the prospect to help to promote personalized medicine.
1. Introduction
As an important part of complementary and alternativemedicine [1], traditional Chinese medicine(TCM) plays animportant role in people’s healthcare and is gaining inpopularity [2] with its efficacy evidence increasing [3, 4].It performs treatment based on ZHENG (translated assyndrome or pattern) Classification which is called “bianzheng lun zhi.” Owing to the manifestationin different syn-dromes, patients with the same disease would be treateddifferently by TCM practitioners [3], which is called “tongbing yi zhi” in Chinese. And one TCM therapy or formulashould be specifically corresponded with a ZHENG, not adisease [5], and serious side effects could be caused by theabuse or misuse without any consideration of the ZHENG
Classification [6, 7]. To demonstrate the importance ofZHENG classification, many studies have been conducted[8, 9]. For example, it was demonstrated in our previousexperiment that if different ZHENGs of hepatitis-B-causedcirrhosis patients were treated by the same therapy, theywould display various responses [10]. Furthermore, in arecent report, a biomedical therapy showed different effectiverates for the rheumatoid arthritis patients with various TCMsyndromes [11], which indicated that ZHENG was a subtypeof the disease and would show some revelations for betterindividualized treatment in mainstream medicine.
ZHENG depicts a whole pathological state of a patientby the profiles of symptoms, pulse feelings, and tongueappearance [12]. However, scientists cannot explain it withthe mainstream medicine terminology. The introduction of
2 Evidence-Based Complementary and Alternative Medicine
systembiology including genomics, proteomics, andmetabo-nomics, facilitates the translation of TCM concepts intomainstream medicine based on biochemical, pathway orregulatory processes [13]. Lu et al. have built up themolecularnetworks of TCM cold and hot ZHENG in rheumatoidarthritis (RA) by network analysis [14]. Li et al. found thepotential biomarkers of “Kidney-Yang deficiency syndrome”and the related disturbed pathway with the method of urinemetabonomics [15].
Chronic hepatitis B (CHB) infection continues to be aglobal health problem [16]. As reported by World HealthOrganization (WHO) at 2012, an estimated 350 million peo-ple have been affected with CHB worldwide. About 600 000people died every year due to the consequences of hepatitis B(http://www.who.int/mediacentre/factsheets/fs204/en/index.html). And the cure of CHB is never an easy task andthere still remains further progress. TCM treatment guidedby “bian zheng lun zhi” or combination with Westerntreat-ment can get a higher effective response rate [17]. ExcessZHENG (EZ) and deficiency ZHENG (DZ) is a double ofbasic ZHENGs of maladjustment body nature, reflecting thestruggling state of human body and pathogenic factor. Butthe substantial basis or connotation of EZ and DZ is stillunknown. The present paper designed a urine metabonomicstudy based on GC-MS to classify EZ and DZ patients withCHB patients and to map the substantial connotation of thetwo TCM ZHENGs by comparing EZ/DZ groups with thewithout ZHENG group (WZ) which was made up of the not-obvious ZHENGcharacters CHBpatients. To our knowledge,this study is the first report of the classification of EZ and DZbased on CHB with urinary Metabonomics.
2. Materials and Methods
2.1. Chemicals and Drugs. N,O-Bis(trimethylsilyl)trifluoro-acetamide (BSTFA+TMCS 99 : 1) and urease were purchasedfrom Sigma Corporation of American. Methoxyamine hy-drochloride, heptane, methanol, ethanol, acetonitrile, ace-tone, chloroform and pyridine were analytical grade fromChina National Pharmaceutical Group Corporation inShanghai of China. L-2-Chlorophenylalanine and heptade-canoic acid (also provided by SigmaCorporation of America)were used as an internal quality standard.The ultrapure waterwas obtained from a Milli-Q system (Millipore, USA).
2.2. Subjects and Experiment Design. Three groups of CHBpatients with EZ, DZ, and WZ and healthy volunteers groupwere enrolled in the study from Shuguang hospital of China.The numbers of cases were 30, 23, 30, and 20, respectively.All enrolled objects of the study were aged 18–65.The clinicalstudy was approved by the local ethics committee and allof the recruited persons were given informed consent. Andthe study was performed in accordance with the principlescontained in theDeclaration ofHelsinki. Diagnostic standardof HB patients was referred to “The guideline of preventionand treatment for chronic hepatitis B” [18]. TCM ZHENGclassification was referred to as the viral hepatitis diagnosticstandard described by the Internal Medicine Hepatopathy
Committee of Chinese Traditional Medicine Association inDecember, 1991 [19]. All patients were diagnosed by juniorChinesemedical physicians and then identified by three chiefor deputy physicians; those who were consistently diagnosedas EZ orDZ by all of the physicians were enrolled in our study[20]. In addition, there is an exclusion criterion of CHB: (1)cases complicated with other hepatotropic virus hepatitis, (2)chronic severe hepatitis, (3) associated with serious primarydisease of heart, kidney, lung, endocrine, blood, metabolicand gastrointestinal; or psychotic patients, (4) pregnant orlactating women.
2.3. Sample Collection and Preparation. A complete physicalexamination was given; the health condition was recordedon a scale including the information obtained throughfour traditional examination methods: looking, listening andsmelling, asking, and touching at the patient’s entry into thestudy, and the urina sanguinis and vein blood were collectedfrom all enrolled subjects. Urine and blood samples werestored at –80∘C until GC-MS assay and the blood was utilizedto detect the indicators of main medicine such as ALT andAST.
All these urine samples were thawed in ice water bath andvortex-mixed before analysis. Each 1mL aliquot of standardmixture or urine sample was placed into a screw tube, 10mincentrifugation (12,000 rpm) was given, and aliquots of 150 𝜇Lsupernatant were transferred into another screw tube. Afteradding 70𝜇L of urease (4mg/mL) and vortex-mixing for 30 s,samples were conditioned at 37∘C for 15min to remove theurea. After the addition of 800𝜇L of methanol and 10𝜇L ofmyristic acid in methanol (1mg/mL) and mixing for 1min,the solution was centrifuged at 13,000 rpm for 10min. Thena 200𝜇L aliquot of supernatant was transferred into a GCvial and evaporated to dryness under N
2at 30∘C. 50 𝜇L of
methoxyamine in pyridine (15mg/mL) was added to the GCvial, vortex-mixed for 1min, and themethoximation reactionwas carried out for 90min rocking in a shaker at 30∘C, then50𝜇L of BSTFA plus 1% TMCS was added to the samples fortrimethylsilylation for another 1 h at 70∘C. At last, 30 𝜇L ofheptane containing external standard methyl myristate wasadded to the GC vial, and the solution was analyzed utilizingGC-MS after vortex for 30 s.
2.4. DataAcquisition. Onehundred and fifteen items of TCMsymptoms and 67 items of biochemistry indicators of allobjects were collected and recorded in the scales welldesigned before. and the list of 115 items of TCM symptomsand 67 items of biochemistry indicators could be found in theattachment with Supplementary Material available online athttp://dx.doi.org/10.1155/2013/738245.
All GC-MS analyses were performed by amass spectrom-eter 5975B (Agilent technologies, USA) coupled to an Agi-lent 6890 (Agilent technologies, USA) gas chromatographyinstrument. In the gas chromatographic system, a capillarycolumn (Agilent J&W DB-5ms Ultra Inert 30m× 0.25mm,film thickness 0.25𝜇m) was used. Helium carrier gas wasused at a constant flow rate of 1.0mL×min–1. One 𝜇L ofderivatized samples was injected into theGC/MS instrument,

Evidence-Based Complementary and Alternative Medicine 3
Table 1: Temperature program of column incubator in GC/MS.
Rate (∘C/min) Temperature (∘C) Hold time (min)70 2
2.5 160 05 240 16
and splitless injection mode was used. A programmed col-umn temperature was optimized to acquire a well separation,which was demonstrated in Table 1. The temperatures of theinjection port, the interface, and source temperature were setat 280∘C, 260∘C, and 230∘C, respectively. The measurementswere made with electron impact ionization (70 eV) in thefull scan mode (m/z 30–550). The solvent post time was setto 5min. The GC-MS operating condition was the same asthe previous experiment [10] except the column temperatureprogram.
2.5. Data Analysis. Information of biochemical indicatorsand TCM symptoms was extracted from the scales andformed an excel matrix, then were analyzed in Smica-p11.5 Software (Umetrics, Umea, Sweden) for the analysisof principal component analysis (PCA), partial least squaresdiscriminant analysis (PLS-DA), orthogonal projection tolatent structures (OPLS) and spss 17.0 (SPSS, Chicago, IL,USA) for Mann-Whitney U test.
As to the profiles obtained from GC-MS, wispy shifts inretention time between fingerprints occur due to experimen-tal variations and column aging. When the total ion currentchromatograms (TICs) were obtained, peak-alignment orwarping techniques are commonly applied to compensate forminor shifts in retention times. Thus, in the subsequentlydata processing, the same variable manifested synchronousinformation in every profile. So all the GC-MS raw filesafter being converted to CDF format via the software comingwith Agilent MSD workstation, were subsequently processedby the XCMS toolbox (http://metlin.scripps.edu/download/)using XCMS’s default settings with the following excep-tions: xcmsSet (full width at half maximum: fwhm= 5;S/N cutoff value: snthresh = 10, max = 15), group (bw= 5).The resulting table (CSV file) was exported into MicrosoftExcel (Microsoft Inc., USA), where normalization was per-formed prior to multivariate analyses. The resulting three-dimensional matrix involving peak index (RT-m/z pair),sample names (observations), and normalized peak areapercent was introduced into Simca-P 11.5 Software (Umetrics,Umea, Sweden) for the analysis of PCA, PLS-DA, and OPLS.Differential variables with VIP values [21] exceeding 1.5between two different groups could be generated from load-ings plot. Subsequently, those variables were further analyzedbyMann-WhitneyU test to confirm the changed metabolitesby SPSS 17.0 (SPSS, Chicago, IL, USA) with the thresholdof P value set at 0.05. Those variables, then, were identifiedby searching in NIST 2005 database and verified by stan-dards. Kyoto Encyclopedia of Genes and Genomes (KEGG)(http://www.genome.ad.jp/kegg/) andMetabolites BiologicalRole (MBRole) (http://csbg.cnb.csic.es/mbrole) were based to
Table 2: Automaticmodeling parameters for the classification of EZand DZ.
Model Amount of components 𝑅2
𝑋 𝑅2
𝑌 𝑄2
𝑌
PCA-X 1 0.111 0.0165PLS-DA 1 0.0592 0.507 0.0723OPLS 1 0.0592 0.508 0.0688𝑅
2
𝑋cum and 𝑅2𝑌cum represent the cumulative sum of squares (SS) of all the𝑋’s and 𝑌’s explained by all extracted components.𝑄
2
𝑌cum is an estimate of how well the model predicts the 𝑌’s.
Table 3: Clinical information from CHB-affected patients based onthe WM diagnostic approach.
Indexes Excess(𝑛 = 30)
Deficiency(𝑛 = 23) 𝑃
Systolic pressure(mmHg) 114.90 ± 10.51 113.88 ± 8.23 0.378
Diastolic pressure(mmHg) 75.69 ± 7.86 76.6 ± 5.87 0.112
Age (years) 40.39 ± 14.58 39.5 ± 11.8 0.809Gender (M/F) 31/7 25/9 0.277ALT (IU/L) 61.26 ± 47.43 50.8 ± 55.4 0.378AST (IU/L) 43.84 ± 19.6 45.96 ± 40.52 0.112HBsAb (IU/mL) 2.20 ± 10.03 7.16 ± 28.96 0.107TBIL (𝜇mol/L) 17.56 ± 7.57 17.43 ± 6.03 0.245DBIL (𝜇mol/L) 6.1 ± 4.17 4.82 ± 1.82 0.817IDBIL (𝜇mol/L) 11.45 ± 4.02 12.62 ± 4.92 0.062GGT (IU/L) 49.55 ± 64.39 29.52 ± 14.68 0.811ALP (IU/L) 94.71 ± 36.06 79.84 ± 20.81 0.489TP (g/mL) 76.77 ± 7.99 79.34 ± 5.52 0.921ALB (g/mL) 44.59 ± 4.4 45.99 ± 2.29 0.373
select the related pathway. Many references were searched togive the biochemical interpretation of changed metabolitesdisturbed pathways of EZ and DZ in CHB.
3. Results
3.1. ZHENG Classification
3.1.1. ZHENG Classification by Biochemical Indicators. Sixty-seven indicators of two groups of patients were analyzed byPCA, PLS-DA, and OPLS analyses attending to differentiateobjects of EZ and DZ. Automatic modeling parametersindicated the poor explanation and predication of themodelsas shown inTable 2,meaning that the twoZHENGs could notbe distinguished by profiles of biochemical indicators.
Table 3 showed us clinical information of two groups ofCHB-affected patients based on western medical diagnosticapproach. The commonly used indexes revealed no signif-icant difference between the ZHENG groups by analysis ofMann-Whitney U test. It was illustrated that classification ofEZ and DZ was irrelevant to these indexes.
4 Evidence-Based Complementary and Alternative Medicine
EZDZ
−6 −5 −4 −3 −2 −1 0 1 2 3 4 5 6
−6
−4
−2
0
2
4
𝑅
2
𝑋[1] = 0.0518867
𝑅
2
𝑋[2] = 0.0533197
SIMCA-P 11.5-2012/12/25 10:45:41
𝑡[2
]O
𝑡[1]P
Ellipse: hotelling T2 (0.95)
(a)
EZDZ
−10 0 10−20
−10
0
10
20
𝑅
2
𝑋[1] = 0.055044
𝑅
2
𝑋[3] = 0.132217
SIMCA-P 11.5-2012/12/25 10:55:21
𝑡[3
]O
𝑡[1]P
Ellipse: hotelling T2 (0.95)
(b)
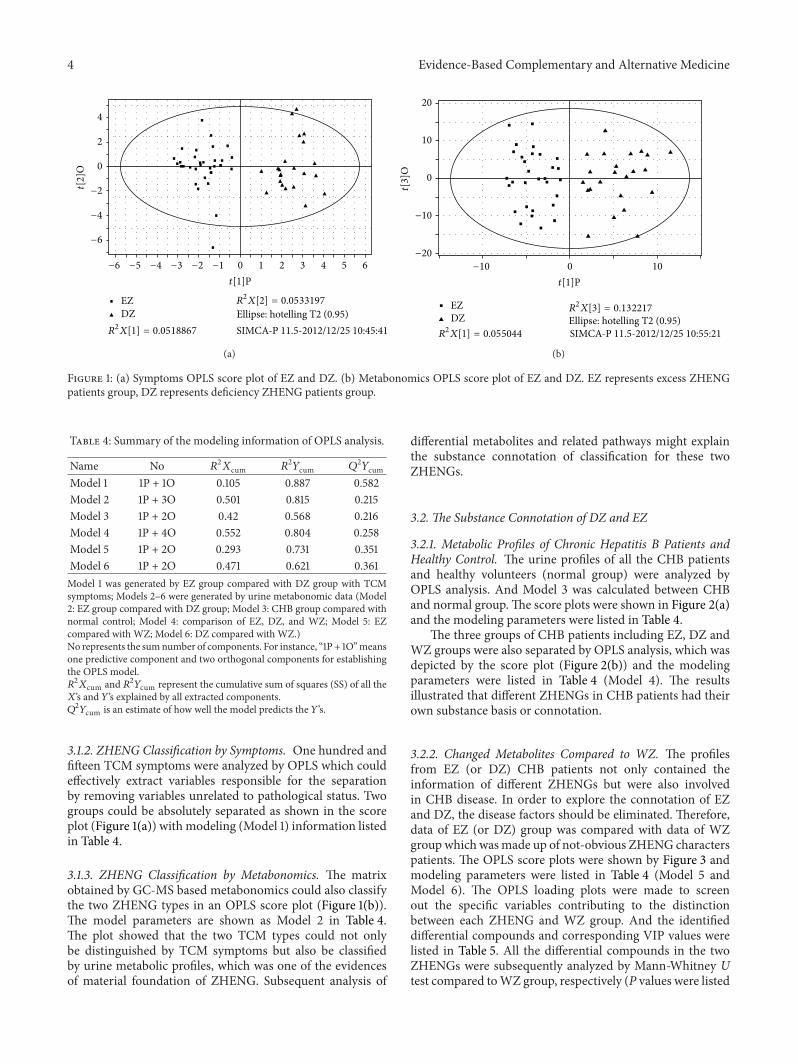
Figure 1: (a) Symptoms OPLS score plot of EZ and DZ. (b) Metabonomics OPLS score plot of EZ and DZ. EZ represents excess ZHENGpatients group, DZ represents deficiency ZHENG patients group.
Table 4: Summary of the modeling information of OPLS analysis.
Name No 𝑅2
𝑋cum 𝑅2
𝑌cum 𝑄2
𝑌cum
Model 1 1P + 1O 0.105 0.887 0.582Model 2 1P + 3O 0.501 0.815 0.215Model 3 1P + 2O 0.42 0.568 0.216Model 4 1P + 4O 0.552 0.804 0.258Model 5 1P + 2O 0.293 0.731 0.351Model 6 1P + 2O 0.471 0.621 0.361Model 1 was generated by EZ group compared with DZ group with TCMsymptoms; Models 2–6 were generated by urine metabonomic data (Model2: EZ group compared with DZ group; Model 3: CHB group compared withnormal control; Model 4: comparison of EZ, DZ, and WZ; Model 5: EZcompared with WZ; Model 6: DZ compared with WZ.)No represents the sumnumber of components. For instance, “1P + 1O”meansone predictive component and two orthogonal components for establishingthe OPLS model.𝑅
2
𝑋cum and 𝑅2𝑌cum represent the cumulative sum of squares (SS) of all the𝑋’s and 𝑌’s explained by all extracted components.𝑄
2
𝑌cum is an estimate of how well the model predicts the 𝑌’s.
3.1.2. ZHENG Classification by Symptoms. One hundred andfifteen TCM symptoms were analyzed by OPLS which couldeffectively extract variables responsible for the separationby removing variables unrelated to pathological status. Twogroups could be absolutely separated as shown in the scoreplot (Figure 1(a)) with modeling (Model 1) information listedin Table 4.
3.1.3. ZHENG Classification by Metabonomics. The matrixobtained by GC-MS based metabonomics could also classifythe two ZHENG types in an OPLS score plot (Figure 1(b)).The model parameters are shown as Model 2 in Table 4.The plot showed that the two TCM types could not onlybe distinguished by TCM symptoms but also be classifiedby urine metabolic profiles, which was one of the evidencesof material foundation of ZHENG. Subsequent analysis of
differential metabolites and related pathways might explainthe substance connotation of classification for these twoZHENGs.
3.2. The Substance Connotation of DZ and EZ
3.2.1. Metabolic Profiles of Chronic Hepatitis B Patients andHealthy Control. The urine profiles of all the CHB patientsand healthy volunteers (normal group) were analyzed byOPLS analysis. And Model 3 was calculated between CHBand normal group.The score plots were shown in Figure 2(a)and the modeling parameters were listed in Table 4.
The three groups of CHB patients including EZ, DZ andWZ groups were also separated by OPLS analysis, which wasdepicted by the score plot (Figure 2(b)) and the modelingparameters were listed in Table 4 (Model 4). The resultsillustrated that different ZHENGs in CHB patients had theirown substance basis or connotation.
3.2.2. Changed Metabolites Compared to WZ. The profilesfrom EZ (or DZ) CHB patients not only contained theinformation of different ZHENGs but were also involvedin CHB disease. In order to explore the connotation of EZand DZ, the disease factors should be eliminated. Therefore,data of EZ (or DZ) group was compared with data of WZgroup which wasmade up of not-obvious ZHENG characterspatients. The OPLS score plots were shown by Figure 3 andmodeling parameters were listed in Table 4 (Model 5 andModel 6). The OPLS loading plots were made to screenout the specific variables contributing to the distinctionbetween each ZHENG and WZ group. And the identifieddifferential compounds and corresponding VIP values werelisted in Table 5. All the differential compounds in the twoZHENGs were subsequently analyzed by Mann-Whitney Utest compared toWZ group, respectively (P values were listed

Evidence-Based Complementary and Alternative Medicine 5
CHBNormal
−12 −10 −8 −6 −4 −2 0 2 4 6 8 10
30
20
10
0
−10
−20
𝑅
2
𝑋[1] = 0.0339437
𝑅
2
𝑋[2] = 0.192985
Ellipse: hotellingSIMCA-P 11.5-2013/3/23 9:35:34
𝑡[1]P
𝑡[2
]O
(a)
−14 −12 −10 −8 −6 −4 −2 0 2 4 6 8 10 12
EZDZ
20
10
0
−10
−20
𝑅
2
𝑋[1] = 0.0503073
𝑅
2
𝑋[2] = 0.217178
Ellipse: hotellingSIMCA-P 11.5-2013/3/23 9:47:15
𝑡[2
]O
𝑡[1]P
Without Zheng
(b)
−12 −10 −8 −6 −4 −2 0 2 4 6 8 10 12
EZ
20
10
0
−10
𝑅
2
𝑋[1] = 0.0539503
𝑅
2
𝑋[2] = 0.109401
Ellipse: hotellingSIMCA-P 11.5-2013/3/23 9:40:33
𝑡[2
]O
𝑡[1]P
Without Zheng
(c)
−10 0 10
DZ
30
20
10
0
−10
−20
𝑅
2
𝑋[1] = 0.0782358
𝑅
2
𝑋[2] = 0.249203
Ellipse: hotellingSIMCA-P 11.5-2013/3/23 9:43:25
𝑡[2
]O
𝑡[1]P
Without Zheng
(d)
Figure 2: Metabonomics OPLS score plot, (a) CHB compared to normal group; (b) the comparison of EZ, DZ, andWZ; (c) EZ compared toWZ; (d) DZ compared toWZ. CHBmeans chronic hepatitis B group which includes excess ZHENG groupes, deficiency ZHENG group andWZ patients. EZ represents excess ZHENG patients groupes, DZ represents deficiency ZHENG patients group and WZ represents patientswith not-obvious ZHENG characters.
in Table 5) subsequently. The changing trend of differentialmetabolites was depicted by Figure 4.
3.2.3. Sensitivity and Specificity of Potential Markers forTCM Syndrome Classification. To determine the sensitivityand specificity of potential urine metabolic biomarkers ofdifferent TCM ZHENGs, ROC analysis was conducted. WZgroup and DZ (/EZ) group were put together and defined asthe non-EZ (/DZ) group, and so ROC analysis was carriedout for discriminating EZ/DZ group with non-EZ/DZ group.The area under the ROC curves (AUC) for the differentialmetabolites was listed in Table 5. Among all the metabolites,the AUC values of xylopyranoside, ribonic acid, uric acid,d-ribose, and cyclohexanone fell into the range of 0.7–0.9.
The ROC curves for classification of EZ/DZ group and non-EZ/DZ group were shown in Figure 5. It was suggested thatthe quantification of these five metabolites was more usefulto classify excess and deficiency ZHENGs.
4. Discussion
In present work, it was the first time to stratify the EZand DZ in CHB patients with the metabonomic technology.The results illustrate that the clinical biochemical indicatorscould not represent the characteristics of ZHENG. The clearseparation between two groups by TCM symptoms andmetabolic profiles illustrated that EZ and DZ had theirsubstance fundaments. In order to eliminate the disease

6 Evidence-Based Complementary and Alternative Medicine
−12 −10 −8 −6 −4 −2 0 2 4 6 8 10 12
20
10
0
−10
EZ
𝑡[1]P
𝑡[2
]O
Without Zheng(a)
−10 0 10
DZ
30
20
10
0
−10
−20
𝑡[2
]O
𝑡[1]P
Without Zheng
(b)
Figure 3: Metabonomics OPLS score plot, (a) EZ compared to WZ; (b) DZ compared to WZ.
0
0.5
1
1.5
2
Gly
cine
Prop
anoi
c aci
dEt
hani
mid
ic ac
idTh
iom
orph
olin
eBu
tane
dioi
c aci
dL-
Thre
onin
e2-
Prop
enam
ide
L-Ph
enyl
alan
ine
d-Ri
bose
Ribo
nic a
cid
Cyclo
hexa
none
Inos
itol
Buta
nedi
oic a
cid
D-G
luco
nic a
cid
Uric
acid
3-(3
,4-D
ihyd
roxy
phen
yl)la
ctic
1H-I
ndol
e-3-
acet
ic ac
idG
ulon
ic ac
idXy
loni
c aci
dM
alto
seG
alac
topy
rano
side
D-G
luco
seBu
tano
ic ac
idG
lyci
neL-
Ala
nine
Thio
mor
phol
ine
Buta
nedi
oic a
cid
Prop
aned
ioic
acid
Cyclo
hexa
neca
rbox
ylic
acid
d-Ri
bose
Xylo
pyra
nosid
eU
ric ac
idM
alto
seD
-Xyl
ose
Gal
acto
pyra
nose
Mal
tose
,62
Gal
acto
pyra
nosid
eD
-Glu
cose
WZDZ/WZEZ/WZ
FN
Ribi
tol
Figure 4: The differential metabolites level in EZ and DZ compared to WZ. All the differential metabolites were quantified by mean ranksobtained from Mann-Whitney U test firstly. Then the urinary metabolite relative levels of DZ and DZ were illustrated by fold change ofmean ranks (FN) calculated by the differential metabolites of CHB with excess or deficiency ZHENG/the differential metabolites of CHBwithout ZHENG.The former 22 metabolites were calculated from EZ compared toWZ, and the later 17 metabolites were calculated fromDZcompared to WZ.
factors and explore the connotation of ZHENG, EZ (or DZ)group was compared with WZ group. Consequently, 22 and17 differential metabolites from EZ and DZ were selected,respectively. The ROC curves of all the metabolites wereconducted and five of them showed a higher sensitivity andspecificity for the diagnosis of EZ or DZ (xylopyranoside forthe diagnosis of DZ and ribonic acid, uric acid, d-Riboseand cyclohexanone for the diagnosis of EZ). It was suggestedthat these five metabolites were more potential to become theclinic biomarker of EZ or DZ.
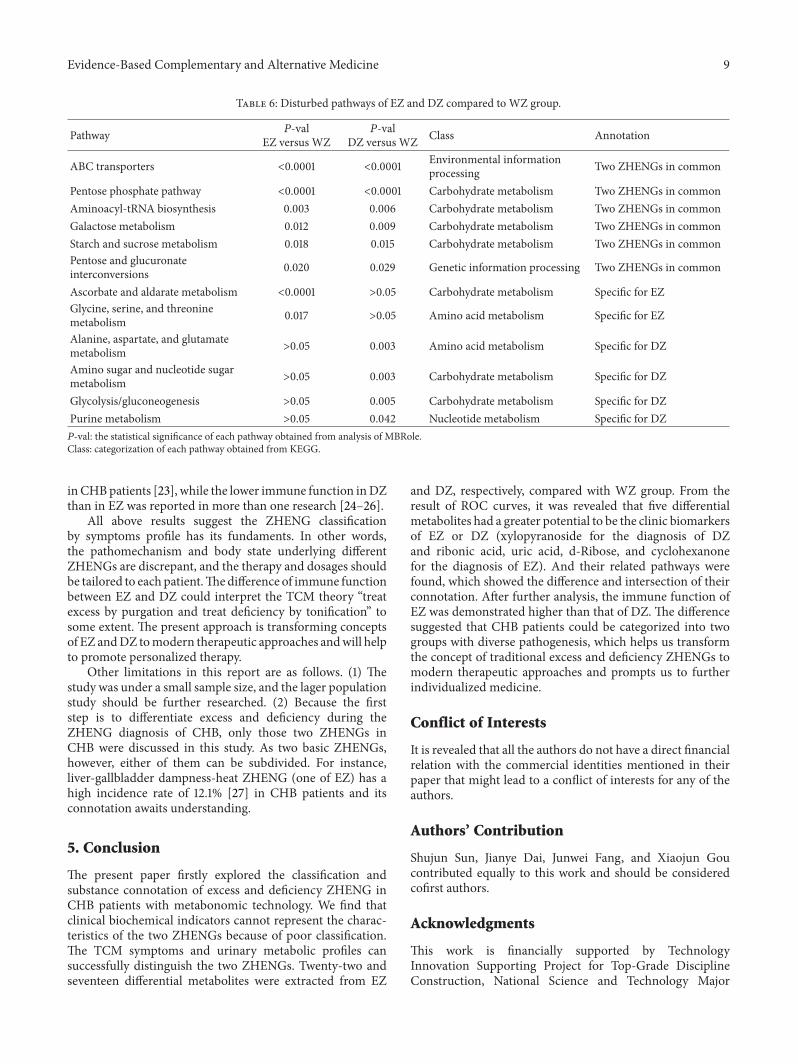
By searching in KEGG database and website of MBRole,the disturbed pathways in patients with either EZ or DZ wereextracted based on the differentialmetabolites andwere listedin Table 6. From the result, we could know that 6 pathwaysturned up imbalanced in both EZ, and DZ, 2 pathwayswere disturbed in EZ and 3 were disturbed in DZ with thesame disease background. While the 6 common disturbedpathways revealed difference between EZ and DZ, either. Forinstance, glycine, d-ribose, maltose, galactopyranoside, andd-glucose are four related differential metabolites of ABC

Evidence-Based Complementary and Alternative Medicine 7
10.80.60.40.20
Sens
itivi
ty
1
0.8
0.6
0.4
0.2
0Xylopyranoside
1− Specificity
(a)
10.80.60.40.20
Sens
itivi
ty
1
0.8
0.6
0.4
0.2
0Ribonic acid
1− Specificity
(b)
Uric acid
10.80.60.40.20
Sens
itivi
ty
1
0.8
0.6
0.4
0.2
0
Diagonal segments are produced by ties.
1− Specificity
(c)
10.80.60.40.20
Sens
itivi
ty
1
0.8
0.6
0.4
0.2
0d-Ribose
Diagonal segments are produced by ties.1− Specificity
(d)
10.80.60.40.20
Sens
itivi
ty
1
0.8
0.6
0.4
0.2
0Cyclohexanone
1− Specificity
(e)
Figure 5: ROC curves for classification of two different TCMZHENGs in CHB patients.The ROC curve of xylopyranoside (a) was generatedby DZ group compared with non-DZ group, and the area under the curve is 0.705. ROC curves of ribonic acid (b), uric acid (c), d-ribose(d), and Cyclohexanone (e) were generated by EZ group compared with non-EZ group, and the AUCs were 0.711, 0.726, 0.732, and 0.744,respectively.

8 Evidence-Based Complementary and Alternative Medicine
Table 5: Differential metabolites in EZ and DZ, respectively, compared to WZ group.
Group Changed metabolites VIP 𝑃(M-W) FNDZ/WZ FNEZ/WZ AUCROC
EZ Glycine 2.10 0.025 0.56 0.72 0.632EZ Propanoic acid 1.74 0.043 0.75 1.35 0.678EZ Ethanimidic acid 1.88 0.039 0.74 1.36 0.671EZ Thiomorpholine 2.08 0.021 0.50 0.71 0.588EZ Butanedioic acid 2.24 0.007 0.47 0.67 0.601EZ L-Threonine 1.64 0.049 0.97 1.34 0.618EZ 2-Propenamide 1.66 0.03 0.66 0.72 0.672EZ L-Phenylalanine 2.11 0.019 0.85 1.42 0.655EZ D-Ribose 1.86 0.005 0.74 1.52 0.732EZ Ribonic acid 1.70 0.01 0.71 1.47 0.711EZ Cyclohexanone 2.03 0.003 0.66 1.55 0.744EZ Inositol 1.71 0.014 0.92 1.45 0.649EZ Butanedioic acid 1.71 0.011 0.92 1.47 0.65EZ D-Gluconic acid 1.93 0.012 0.81 1.41 0.661EZ Uric acid 2.45 0.000 1.26 1.90 0.726EZ 3-(3,4-Dihydroxyphenyl)lactic acid 2.03 0.016 0.80 1.43 0.66EZ 1H-Indole-3-acetic acid 1.96 0.007 0.70 1.50 0.695EZ Gulonic acid 1.62 0.042 0.96 1.35 0.619EZ Xylonic acid 2.03 0.01 0.80 1.47 0.697EZ Maltose 2.08 0.01 0.47 0.68 0.577EZ Galactopyranoside 2.07 0.011 0.49 0.68 0.584EZ D-Glucose 2.5 0.001 0.46 0.61 0.617DZ Butanoic acid 1.55 0.02 0.52 0.84 0.655DZ Glycine 1.53 0.034 0.54 0.80 0.604DZ L-Alanine 1.91 0.01 0.50 0.73 0.639DZ Thiomorpholine 2.04 0.009 0.50 0.71 0.632DZ Butanedioic acid 1.92 0.003 0.47 0.67 0.641DZ Propanedioic acid 1.22 0.016 1.12 1.57 0.589DZ Cyclohexanecarboxylic acid 1.62 0.007 0.49 0.93 0.695DZ D-Ribose 1.51 0.006 1.18 1.22 0.675DZ Ribitol 1.42 0.006 1.18 1.22 0.675DZ Xylopyranoside 1.23 0.029 0.54 1.15 0.705DZ Uric acid 2.39 0.001 1.26 1.90 0.591DZ Maltose 1.41 0.034 0.54 0.89 0.646DZ D-Xylose 1.76 0.009 0.50 0.88 0.678DZ Galactopyranose 1.78 0.009 0.50 0.88 0.678DZ Maltose,62 1.71 0.011 0.50 0.82 0.654DZ Galactopyranoside 1.69 0.013 0.51 0.88 0.665DZ D-Glucose 2.04 0.003 0.46 0.61 0.658EZ represents excess ZHENG patients group, DZ represents deficiency ZHENG patients group.VIP means the variable importance in the project.𝑃(M-W) value was obtained fromMann-Whitney test (ZHENGs compared to WZ group).FNDZ/WZ or FNDZ/WZ is fold change of mean ranks calculated by the differential metabolites of CHB with excess or deficiency ZHENG/the differentialmetabolites of CHB without ZHENG.AUCROC means the area under the ROC curve.
transporters, and they are all differential for EZ and DZcompared with WZ group. Functions of ABC transportersinclude the transport of toxic compounds [22]. while frombar diagram of Figure 4, we could get that the content ofthem was higher in EZ than in DZ which might be one of themanifestations of vital Qi deficiency in patients with DZ. EZ
patients had a higher detoxified ability than DZ, whichmightcorrespond with the idea of “the vital Qi of EZ patient has notbeen deficient yet” in TCM theory.
In addition, successful clearance of the virus as well as theformation of liver diseases was largely driven by a complexinteraction between the virus and the host immune response
Evidence-Based Complementary and Alternative Medicine 9
Table 6: Disturbed pathways of EZ and DZ compared to WZ group.
Pathway 𝑃-valEZ versus WZ
𝑃-valDZ versus WZ Class Annotation
ABC transporters <0.0001 <0.0001 Environmental informationprocessing Two ZHENGs in common
Pentose phosphate pathway <0.0001 <0.0001 Carbohydrate metabolism Two ZHENGs in commonAminoacyl-tRNA biosynthesis 0.003 0.006 Carbohydrate metabolism Two ZHENGs in commonGalactose metabolism 0.012 0.009 Carbohydrate metabolism Two ZHENGs in commonStarch and sucrose metabolism 0.018 0.015 Carbohydrate metabolism Two ZHENGs in commonPentose and glucuronateinterconversions 0.020 0.029 Genetic information processing Two ZHENGs in common
Ascorbate and aldarate metabolism <0.0001 >0.05 Carbohydrate metabolism Specific for EZGlycine, serine, and threoninemetabolism 0.017 >0.05 Amino acid metabolism Specific for EZ
Alanine, aspartate, and glutamatemetabolism >0.05 0.003 Amino acid metabolism Specific for DZ
Amino sugar and nucleotide sugarmetabolism >0.05 0.003 Carbohydrate metabolism Specific for DZ
Glycolysis/gluconeogenesis >0.05 0.005 Carbohydrate metabolism Specific for DZPurine metabolism >0.05 0.042 Nucleotide metabolism Specific for DZ𝑃-val: the statistical significance of each pathway obtained from analysis of MBRole.Class: categorization of each pathway obtained from KEGG.
in CHBpatients [23], while the lower immune function inDZthan in EZ was reported in more than one research [24–26].
All above results suggest the ZHENG classificationby symptoms profile has its fundaments. In other words,the pathomechanism and body state underlying differentZHENGs are discrepant, and the therapy and dosages shouldbe tailored to each patient.Thedifference of immune functionbetween EZ and DZ could interpret the TCM theory “treatexcess by purgation and treat deficiency by tonification” tosome extent. The present approach is transforming conceptsof EZ andDZ tomodern therapeutic approaches andwill helpto promote personalized therapy.
Other limitations in this report are as follows. (1) Thestudy was under a small sample size, and the lager populationstudy should be further researched. (2) Because the firststep is to differentiate excess and deficiency during theZHENG diagnosis of CHB, only those two ZHENGs inCHB were discussed in this study. As two basic ZHENGs,however, either of them can be subdivided. For instance,liver-gallbladder dampness-heat ZHENG (one of EZ) has ahigh incidence rate of 12.1% [27] in CHB patients and itsconnotation awaits understanding.
5. Conclusion
The present paper firstly explored the classification andsubstance connotation of excess and deficiency ZHENG inCHB patients with metabonomic technology. We find thatclinical biochemical indicators cannot represent the charac-teristics of the two ZHENGs because of poor classification.The TCM symptoms and urinary metabolic profiles cansuccessfully distinguish the two ZHENGs. Twenty-two andseventeen differential metabolites were extracted from EZ
and DZ, respectively, compared with WZ group. From theresult of ROC curves, it was revealed that five differentialmetabolites had a greater potential to be the clinic biomarkersof EZ or DZ (xylopyranoside for the diagnosis of DZand ribonic acid, uric acid, d-Ribose, and cyclohexanonefor the diagnosis of EZ). And their related pathways werefound, which showed the difference and intersection of theirconnotation. After further analysis, the immune function ofEZ was demonstrated higher than that of DZ. The differencesuggested that CHB patients could be categorized into twogroups with diverse pathogenesis, which helps us transformthe concept of traditional excess and deficiency ZHENGs tomodern therapeutic approaches and prompts us to furtherindividualized medicine.
Conflict of Interests
It is revealed that all the authors do not have a direct financialrelation with the commercial identities mentioned in theirpaper that might lead to a conflict of interests for any of theauthors.
Authors’ Contribution
Shujun Sun, Jianye Dai, Junwei Fang, and Xiaojun Goucontributed equally to this work and should be consideredcofirst authors.
Acknowledgments
This work is financially supported by TechnologyInnovation Supporting Project for Top-Grade DisciplineConstruction, National Science and Technology Major

10 Evidence-Based Complementary and Alternative Medicine
Project (2009ZX10004-601, 2012ZX10005001-004, and2012ZX10005001-008), and Shanghai “085” Science andTechnology Innovation Supporting Project for Top-GradeDiscipline Construction.
References
[1] S. Kumar Pal, “Complementary and alternative medicine: anoverview,” Current Science, vol. 82, no. 5, pp. 518–524, 2002.
[2] F. Cheung, “Made in china,” Nature, vol. 480, pp. 82–83, 2011.[3] J. L. Tang, B. Y. Liu, and K. W. Ma, “Traditional Chinese med-
icine,”The Lancet, vol. 372, no. 9654, pp. 1938–1940, 2008.[4] F. Cheung, “Enter the clinic,” Nature, vol. 480, pp. 94–95, 2011.[5] W. Y. Jiang, “Therapeutic wisdom in traditional Chinese med-
icine: a perspective frommodern science,” Trends in Pharmaco-logical Sciences, vol. 26, no. 11, pp. 558–563, 2005.
[6] D. H. Zhou, “The research on modernization of Chinese herbalforms its side effect,” Research of Traditional Chinese Medicine,vol. 7, no. 1, pp. 47–48, 2001.
[7] A. Yukiharu, “The truth of the accident-somepatients died fromside effects of Xiao Chai Hu Tang,” Journal of Tianjin Universityof Traditional Chinese Medicine, vol. 21, no. 1, pp. 47–48, 2002(Chinese).
[8] H. Wei, W. Pasman, C. Rubingh, S. Wopereis, and M. Tienstra,“Urine metabolomics combined with the personalized diag-nosis guided by Chinese medicine reveals subtypes of pre-diabetes,” Molecular BioSystems, vol. 8, no. 5, pp. 1482–1491,2012.
[9] H. Van Wietmarschen, K. Yuan, C. Lu et al., “Systems biologyguided byChinesemedicine reveals newmarkers for sub-typingrheumatoid arthritis patients,” Journal of Clinical Rheumatology,vol. 15, no. 7, pp. 330–337, 2009.
[10] S. Sun, J. Dai, W. Wang, H. J. Cao, and J. W. Fang, “Metabo-nomic evaluation of ZHENG differentiation and treatmentby Fuzhenghuayu tablet in Hepatitis-B-caused Cirrhosis,”Evidence-Based Complementary and Alternative Medicine, vol.2012, Article ID 453503, 8 pages, 2012.
[11] Y. He, A. Lu, Y. Zha, and I. Tsang, “Differential effect on symp-toms treated with traditional Chinese medicine and westerncombination therapy in RA patients,”ComplementaryTherapiesin Medicine, vol. 16, no. 4, pp. 206–211, 2008.
[12] M. Jiang, C. Lu, C. Zhang, J. Yang, and A. Lu, “Syndrome differ-entiation in modern research of traditional Chinese medicine,”Journal of Ethnopharmacology, vol. 140, no. 3, pp. 634–642, 2012.
[13] J. van der Greef, “All systems go,” Nature, vol. 480, p. 87, 2011.[14] C. Lu, X. Y. Niu, C. H. Xiao, G. Chen, and Q. L. Zha, “Network-
based gene expression biomarkers for cold and heat patterns ofrheumatoid arthritis in traditional chinesemedicine,” Evidence-Based Complementary and Alternative Medicine, vol. 2012,Article ID 203043, 17 pages, 2012.
[15] X. Lu, Z. Xiong, J. Li, S. Zheng, T. Huo, and F. Li, “Metabonomicstudy on “Kidney-Yang Deficiency syndrome” and interventioneffects of Rhizoma Drynariae extracts in rats using ultraperformance liquid chromatography coupled with mass spec-trometry,” Talanta, vol. 83, no. 3, pp. 700–708, 2011.
[16] Y. F. Liaw, N. Leung, J. H. Kao, T. Piratvisuth, and E. Ganeet,“Asian-Pacific consensus statement on the management ofchronic hepatitis B: a 2008 update,” HepatolInt, vol. 2, pp. 263–283, 2008.
[17] J. Guo, X. Fang, and C. Li, “Clinical analysis of TCMdifferentialtreatment on severe chronic hepatitis B,” Chinese Archives ofTraditional ChineseMedicine, vol. 30, no. 10, pp. 2177–2179, 2012.
[18] Chinese Society of Hepatology and Chinese Society of Infec-tious Diseases, Guide To Prevention and Treatment of ChronicHepatitis B, 2005.
[19] “The standards of TCM differential syndromes of viral hepati-tis,” Defined in December 1991 by Internal Medicine Hepatopa-thy Committee of Chinese Traditional Medicine Association.
[20] T. Wu, M. Yang, H. F. Wei, S. H. He, and S. C. Wang,“Application of metabolomics in traditional chinese medicinedifferentiation of deficiency and excess syndromes in patientswith diabetes mellitus,” Evidence-Based Complementary andAlternativeMedicine, vol. 2012, Article ID968083, 11 pages, 2012.
[21] L. Eriksson, E. Johansson, and N. Kettaneh-Wold, Multi andMegavariate Data Analysis—Part. 1: Basic Principles and Appli-cations, Umetrics AB, Umea, Sweden, 2nd edition, 2001.
[22] P. Borst and R. Oude Elferink, “Mammalian ABC transportersin health and desease,” Biochemistry, vol. 71, pp. 537–592, 2002.
[23] J. Chang and S. R. Lewin, “Immunopathogenesis of hepatitis Bvirus infection,” Immunology andCell Biology, vol. 85, pp. 16–23,2007.
[24] Q. Li, Z. Guo, J. Liang, W. Zhang, and L. M. Xu, “Interleukin-10 genotype correlated to deficiency syndrome in hepatitisB cirrhosis,” Evidence-Based Complementary and AlternativeMedicine, vol. 2012, Article ID 298925, 6 pages, 2012.
[25] P. Li, Q. Chen, and L. Xiao, “The correlation between RBCimmune function and deficiency and excess syndromes inchronic hepatitis B,” Chinese Journal of Integrated Traditionaland Western Medicine on Liver Diseases, vol. 2, no. 3, pp. 28–29,1992 (Chinese).
[26] L. Zhou, J. Wei, Y. Liu, A. Cao, and X. Wang, “Studying thedifferent waist of 874 cases of the obese patients “xushi” syn-drome characteristics,” Liaoning Journal of Traditional ChineseMedicine, vol. 35, no. 11, pp. 1648–1649, 2008.
[27] H. Y. Wang, H. M. Li, B. Yang, and J. J. Xu, “The relationshipbetween distribution characteristics of TCM constitution andSyndromes in 141 patients with Fatty Liver,” Journal of BeijingUniversity of TCM, vol. 33, no. 7, pp. 500–502, 2010 (Chinese).

Submit your manuscripts athttp://www.hindawi.com
Stem CellsInternational
Hindawi Publishing Corporationhttp://www.hindawi.com Volume 2014
Hindawi Publishing Corporationhttp://www.hindawi.com Volume 2014
MEDIATORSINFLAMMATION
of
Hindawi Publishing Corporationhttp://www.hindawi.com Volume 2014
Behavioural Neurology
EndocrinologyInternational Journal of
Hindawi Publishing Corporationhttp://www.hindawi.com Volume 2014
Hindawi Publishing Corporationhttp://www.hindawi.com Volume 2014
Disease Markers
Hindawi Publishing Corporationhttp://www.hindawi.com Volume 2014
BioMed Research International
OncologyJournal of
Hindawi Publishing Corporationhttp://www.hindawi.com Volume 2014
Hindawi Publishing Corporationhttp://www.hindawi.com Volume 2014
Oxidative Medicine and Cellular Longevity
Hindawi Publishing Corporationhttp://www.hindawi.com Volume 2014
PPAR Research
The Scientific World JournalHindawi Publishing Corporation http://www.hindawi.com Volume 2014
Immunology ResearchHindawi Publishing Corporationhttp://www.hindawi.com Volume 2014
Journal of
ObesityJournal of
Hindawi Publishing Corporationhttp://www.hindawi.com Volume 2014
Hindawi Publishing Corporationhttp://www.hindawi.com Volume 2014
Computational and Mathematical Methods in Medicine
OphthalmologyJournal of
Hindawi Publishing Corporationhttp://www.hindawi.com Volume 2014
Diabetes ResearchJournal of
Hindawi Publishing Corporationhttp://www.hindawi.com Volume 2014
Hindawi Publishing Corporationhttp://www.hindawi.com Volume 2014
Research and TreatmentAIDS
Hindawi Publishing Corporationhttp://www.hindawi.com Volume 2014
Gastroenterology Research and Practice
Hindawi Publishing Corporationhttp://www.hindawi.com Volume 2014
Parkinson’s Disease
Evidence-Based Complementary and Alternative Medicine
Volume 2014Hindawi Publishing Corporationhttp://www.hindawi.com