Embed Size (px)
Citation preview
Research ArticleFast Distributed Dynamics of Semantic Networks viaSocial Media
Facundo Carrillo,1 Guillermo A. Cecchi,2 Mariano Sigman,3 and Diego Fernández Slezak1
1Laboratorio de Inteligencia Artificial Aplicada, Departamento de Computacion, Ciudad Universitaria, 1428 Buenos Aires, Argentina2Computational Biology Center, T. J. Watson Research Center, IBM, P.O. Box 218, Yorktown Heights, NY 10598, USA3Universidad Torcuato Di Tella, Avenida Figueroa Alcorta 7350, 1428 Buenos Aires, Argentina
Correspondence should be addressed to Diego Fernandez Slezak; [email protected]
Received 3 December 2014; Revised 1 April 2015; Accepted 20 April 2015
Academic Editor: Francesco Camastra
Copyright © 2015 Facundo Carrillo et al. This is an open access article distributed under the Creative Commons AttributionLicense, which permits unrestricted use, distribution, and reproduction in any medium, provided the original work is properlycited.
We investigate the dynamics of semantic organization using social media, a collective expression of human thought. We propose anovel, time-dependent semantic similarity measure (TSS), based on the social network Twitter.We show that TSS is consistent withstatic measures of similarity but provides high temporal resolution for the identification of real-world events and induced changesin the distributed structure of semantic relationships across the entire lexicon. Using TSS, we measured the evolution of a conceptand its movement along the semantic neighborhood, driven by specific news/events. Finally, we showed that particular events maytrigger a temporary reorganization of elements in the semantic network.
1. Introduction
Language has been studied from a wide variety of perspec-tives, including aesthetical, evolutionary, and mathematical[1]. An essential function of language is to convey meaning,endowing speakers, writers, listeners, and readers with theability to encode and decode behaviorally relevant informa-tion in auditory and visual tokens. Any attempt to quantifythe intuitive notion of meaning involves, in particular, acharacterization of the semantic similarity between words.Semantic quantification has in fact become a pressing issue inmachine learning and linguistics, with growing applicationsranging from automated recommendation and customerservice systems [2] to speech analysis in psychiatry [3].
An extensive body of literature has lent support to thehypothesis that frequency of cooccurrence of words andsemantic similarity between the corresponding concepts arecodetermined, including psychophysics of word association[4] and coextensivity of neural activation of associated words[5, 6]. Typically, subjects associate faster two related wordsthan unrelated ones, that is, if they belong to the samecategory [7]. This feature can be quantified by analysing text
databases looking for cooccurrence of words and definingsemantic spaces that may cluster words coming from thesame category [8]. This kind of approaches grows beyondcomputational capacity very easily, and so several dimension-ality reduction techniques have been applied to treat theseproblems (e.g., Latent Semantic Analysis [9] or topic models[10]).
A widely used computational correlate of this hypothesisis Latent Semantic Analysis and related measures, which esti-mate semantic similarity on a vector space defined by wordfrequencies [9]. Similarity, measured in the newly definedvector space, shows accordance with several experimentssuch as word synonyms [11], conceptual match betweentopic knowledge and text information [12], or measuring thecoherence of texts [13].
Frequencies have been evaluated from large text corpora[11] and, recently, from web-based document aggregation[14]. These methods have been very successful in providing astationary map of word similarity. However, the organizationof the lexicon changes dynamically both in the time scaleof human development [10, 15] and in the longer time scaleof cultural transformation [16, 17]. Our goal is to investigate
Hindawi Publishing CorporationComputational Intelligence and NeuroscienceVolume 2015, Article ID 712835, 9 pageshttp://dx.doi.org/10.1155/2015/712835
2 Computational Intelligence and Neuroscience
the dynamics of semantic organization, developing a con-sistent measure of word similarity computable in narrowtemporal windows.
In order to estimate semantic spaces in short periods oftimes, Latent Semantic Analysis [9], topic models [15], orWord2Vec [18] must recalculate the whole semantic space foreach time window. At each instant, a representative corpus oftext must be collected to train the corresponding semanticspace. Instead, we focus on estimating the semantic space bystudying the activity in the social network with a similaritymeasure computationally cheap to calculate.
To this aim we implemented a word cooccurrence mea-sure based on the social networking and microbloggingservice Twitter. There is growing interest in the analysis ofTwitter timelines (e.g., [19, 20]), driven by the ability of thiscorpus to identify with exquisite temporal resolution thecollective expression of human thought. The fundamentaldifference between previous studies and our work is that ouranalysis is not based on tracking the “trending topics” definedby a handful of words [21]. Instead we assume that semanticcontent is inherently distributed but with a structure that issubject to a “topic-driven” evolution and, possibly, its owninternal dynamics.
2. Methods
2.1. Twitter Semantic Similarity Algorithm. NormalizedGoogle distance proposes a method for measuring similaritybetween words analysing cooccurrence relative to theirindividual frequencies in the World Wide Web [22]. Currentimplementations fail because of accuracy of occurrenceestimation of queries. Moreover, Google corpus providesan almost-static database with no fine-grain temporalinformation. Based on these previous results, we developedTwitter Semantic Similarity (TSS), estimating similaritybetween words with a high-resolution temporal precision.
Twitter is an online platform for microblogging withmessages 140-character long, with more than 50 milliontweets per day. Twitter provides access to automatic crawlingof tweets, at a limited rate, approximately 180 queries every 15minutes, through the Twitter API (here we used Twitter APIversion 1.1). To search through Tweets database a search keymust be provided and optional parameters are available. Thesearch key is a string with up to 1,000 characters includingspaces. Each querymay return amaximumof 100 tweets, withtheir time stamps. Due to this limitation, it is not possible toretrieve every tweet containing a word, or bag of words, orall tweets framed in a period of time. Instead, we proposethe use of the provided time stamp of tweets to calculatethe velocity of production of tweets containing the word.Thus, we estimate the frequency of a word in Twitter fromits velocity of occurrence.
Considering the word𝑤 and the time stamp series {𝜏𝑖(𝑤)}
of 𝑁 tweets containing 𝑤 (any number of occurrences of 𝑤in the tweet), the frequency Φ(𝑤) may be estimated as theaverage time between tweets in this series. Formally,
Φ (𝑤) = (
∑𝑁−1
𝑖=1(𝜏𝑖+1 (𝑤) − 𝜏𝑖 (
𝑤))
𝑁 − 1
)
−1
. (1)
The size of the time stamp series, 𝑁, is an adjustableparameter that depends on the Twitter API, with a limit in100 tweets per query. We use 𝑁 = 30. Thus, for a word 𝑤,velocity is estimated as the mean of the difference betweenconsecutive time stamps of the last 30 tweets containing 𝑤.
We similarly estimate the frequency of cooccurrence oftwo words 𝑤
1and 𝑤
2, Φ(𝑤
1∧ 𝑤2), from the production of
tweets that contain both, regardless of their relative orderwithin the tweet. We define the TSS between two terms 𝑤
1
and 𝑤2as
TSS (𝑤1, 𝑤2) = (
Φ (𝑤1∧ 𝑤2)
max (Φ (𝑤1) , Φ (𝑤
2))
)
𝛼
(2)
with𝛼 being a scaling factor (we use𝛼 = 1/4 obtaining a goodscale). In the case that 𝑤
1and 𝑤
2are not present in Twitter,
we define TSS = 0.No preprocessing phase is needed; for example, search
terms may be one word, multiple words, or hashtags. Notethat terms may be surrounded by quotations marks, search-ing the multiple-word term in the Twitter API.
2.2. Common Semantic Categories. To evaluate the TSS algo-rithm, we defined three semantic categories containing a listof words. These categories were chosen as standard intuitivecategories from common objects or concepts of everyday life:
Fruits: apple, banana, blackberry, blueberry, cherry,coconut, grape, kiwi, lemon lime, mango, melon,watermelon, orange, tangerine, papaya, passion fruit,peach, pear, pineapple, pomelo, raspberry, and straw-berry.Animals: bull, cow, chicken, donkey, goat, horse, pig,rabbit, sheep, dolphin, shark, octopus, turtle, bird,eagle, mouse, owl, bear, bat, dog, cat, fly, ant, and tiger.Colors: blue, green, red, yellow, orange, black, white,pink, brown, fuchsia, grey, purple, violet, and golden.
2.3. GroupOrganization Performance Based on TSS. To studyglobal reorganization of semantic network, we implementeda performance value to quantify how TSS captures theWorld Cup group organization. We calculated the TSS valuebetween all combinations of the 32 qualified countries, thatis, the 32 × 32 symmetric similarity matrix of country pairs.For each country, we selected the three countries more TSS-similar to it and assigned a performance value at everyinstant. If the three countries belonged to the same WorldCup group we assigned a value of 1.0; if two of them belongedto the same group, we assigned a value of 2/3; if only one ofthem belonged to the same group, we assigned a value of 1/3;and if none belonged to the group 0 was assigned. We reportthe TSS performance as the mean value of the performancefor every country at each instant (Figure 3(b)).
2.4. Classifiers and Cross-Validation. In the machine learningliterature, a classifier is an algorithm that assigns labels to newincoming data based on a training dataset. A classifier hastwo implementation stages: (1) the training phase, consisting
Computational Intelligence and Neuroscience 3
in learning the underlying patterns of the data and its labels,with many techniques available for this pattern recognition;(2) a test phase, where new data, not used for training, islabeled based on trained classifier. For studying the commonsemantic categories we used 𝐾∗ [23] and for the reorganiza-tion of the countries network due to the World Cup draw, weused the Naive Bayes classifier [24].
To assess performance of classifier, cross-validation pro-vides a validation technique. 𝑘-fold cross-validation consistsof partitioning the training data into 𝑘 subsets of the samesize, using 𝑘 − 1 samples as training data and testing theremaining item.This process is repeated for the 𝑘 subsets, thatis, the 𝑘-fold. This process is repeated for the 𝑘 subsets, andclassifier performance is estimated as the average classifica-tion performance for all subsets.
3. Results
3.1. Stationary Semantic Organization via TSS. Our algo-rithm can compute a matrix of word similarity with atime resolution which varies between days and can go forcertain subset of the matrix of cooccurrences within therange of minutes. Before inquiring how concepts evolve intime for a specific set of experiments we verify that TwitterSemantic Similarity (TSS) as a stationary measure satisfies aseries of validations that a well-behaved measure of semanticsimilarity is expected to pass.
First, we validated that TSS yielded similar results to well-documented measures of word similarity: cosine distancebased on Latent SemanticAnalysis [9] and standardmeasuresbased on Wordnet [25].
To this aim we selected 102,000 pairs of words (chosenrandomly from the 1500more frequent nouns) and computedtheir similarity based onWordnet, LSA, andTSS. TSS showeda very strong correlation of word similarity to LSA (𝜌 =0.2199, 𝑝 = 0) and to several measures based on Wordnet:(1) shortest path that connects senses using hypernym andhyponym relation (𝜌 = 0.298, 𝑝 < 10−275); (2) information-theoretic definition by Lin [26] (𝜌 = 0.15, 𝑝 < 10−67); and(3) similarity based on information content by Resnik [27](𝜌 = 0.157, 𝑝 < 10−74).
Different algorithms of word similarity have been eval-uated using TOEFL synonym tests [11, 28]. We analyze ifTSS may discriminate synonyms from random pair of words.We selected 86 words from a TOEFL practice web page(TOEFL vocabulary words: http://toeflvocabulary.com/) andpaired them with one synonym and 25 no-synonym wordsobtained from the 100K pairs of most frequent nouns. Foreach of the 86 words (𝑤), we calculated the TSS and LSAvalue for all 26 options, obtaining 2 vectors 𝑑𝑤TSS, 𝑑
𝑤
LSA of 26components each. If we sort 𝑑𝑤 in increasing order, semanticmeasure should show the 𝑤-synonym words last in the list;that is, most similar words, higher similarity values, shouldbe the synonyms.Mean position of synonyms in 𝑑𝑤LSA showed⟨𝑑𝑤
LSA⟩ = 0.602 ± 0.328, in concordance with previous resultsthat state 60% of performance in TOEFL vocabulary exam[28].With this result, synonyms are close to themiddle in theordered list, and so TOEFL exam should fail. On the other
hand, for TSS we obtained that 𝑑𝑤TSS showed a higher value,⟨𝑑𝑤
TSS⟩ = 0.871 ± 0.204, which is significantly higher than thenull hypothesis (the uniform distribution over the interval)and the results obtained with LSA.
Second, we verified that typical and easily recognizablesemantic clusters are well described by TSS. To this aim wegenerated 1000 sets of 12 words belonging to three semanticcategories: fruits, animals, and colors (see methods for thecomplete list of words in each category). For each set, wecalculated the TSS similarity submatrix and run a 10-foldcross-validation 𝐾∗ classifier [23]. Performance for TSS wasvery well above chance (𝐾∗ classification of chance generatedgroups is approximately 0.3 ± 0.0001) with values of 0.6846 ±1.6458×10
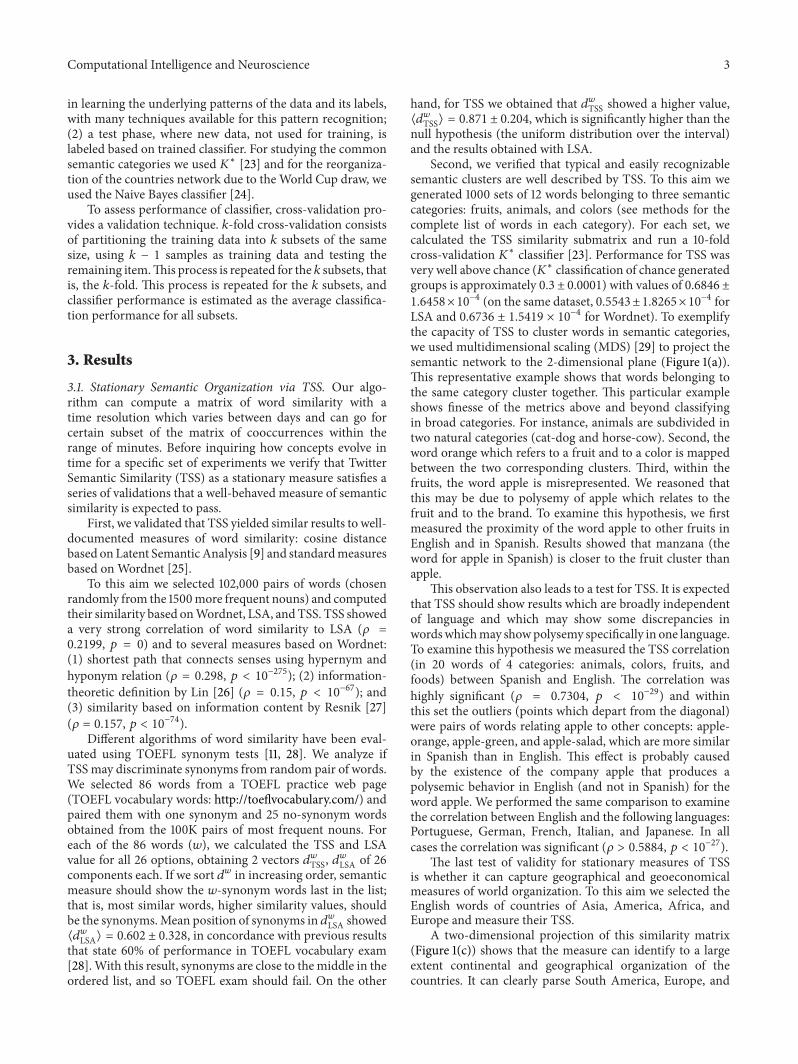
−4 (on the same dataset, 0.5543±1.8265×10⁻⁴ forLSA and 0.6736 ± 1.5419 × 10⁻⁴ for Wordnet). To exemplifythe capacity of TSS to cluster words in semantic categories,we used multidimensional scaling (MDS) [29] to project thesemantic network to the 2-dimensional plane (Figure 1(a)).This representative example shows that words belonging tothe same category cluster together. This particular exampleshows finesse of the metrics above and beyond classifyingin broad categories. For instance, animals are subdivided intwo natural categories (cat-dog and horse-cow). Second, theword orange which refers to a fruit and to a color is mappedbetween the two corresponding clusters. Third, within thefruits, the word apple is misrepresented. We reasoned thatthis may be due to polysemy of apple which relates to thefruit and to the brand. To examine this hypothesis, we firstmeasured the proximity of the word apple to other fruits inEnglish and in Spanish. Results showed that manzana (theword for apple in Spanish) is closer to the fruit cluster thanapple.
This observation also leads to a test for TSS. It is expectedthat TSS should show results which are broadly independentof language and which may show some discrepancies inwordswhichmay showpolysemy specifically in one language.To examine this hypothesis we measured the TSS correlation(in 20 words of 4 categories: animals, colors, fruits, andfoods) between Spanish and English. The correlation washighly significant (𝜌 = 0.7304, 𝑝 < 10−29) and withinthis set the outliers (points which depart from the diagonal)were pairs of words relating apple to other concepts: apple-orange, apple-green, and apple-salad, which are more similarin Spanish than in English. This effect is probably causedby the existence of the company apple that produces apolysemic behavior in English (and not in Spanish) for theword apple. We performed the same comparison to examinethe correlation between English and the following languages:Portuguese, German, French, Italian, and Japanese. In allcases the correlation was significant (𝜌 > 0.5884, 𝑝 < 10−27).
The last test of validity for stationary measures of TSSis whether it can capture geographical and geoeconomicalmeasures of world organization. To this aim we selected theEnglish words of countries of Asia, America, Africa, andEurope and measure their TSS.
A two-dimensional projection of this similarity matrix(Figure 1(c)) shows that the measure can identify to a largeextent continental and geographical organization of thecountries. It can clearly parse South America, Europe, and
4 Computational Intelligence and Neuroscience
Blue
CatDog
Horse
Green Orange
Cow
Yellow
AppleBanana
GrapeStrawberry
0.2 0.4 0.6 0.8 10
0.2
0.4
0.6
0.8
1
AnimalsColors
Fruits
Component 1
Com
pone
nt 2
(a)
0 0.125 0.25 0.375 0.50
0.125
0.25
0.375
0.5
Apple-saladApple-orange
Apple-green
TSS Spanish
TSS
Engl
ish
(b)
AfricaAmerica
AsiaEurope
Norway
Switzerland
Canada
USA.Netherlands
Finland
Ireland
Japan
EnglandItalySpain
South Korea
Portugal
ChilePeru
Uruguay
Iran
Croatia
0
0.3
0.6
0.9
1.2
South AfricaEgypt
Honduras
Cameroon
Ivory Coast
Brazil
Argentina
Costa RicaParaguayBolivia
Angola
MoroccoNigeria
China
India
Component 1
Com
pone
nt 2
0.1 0.2 0.3 0.4 0.5 0.6 0.7 0.8 0.9 1 1.1 1.2
(c)
Figure 1: Stationary semantic organization using TSS. Panel (a) shows the clustering of 3 groups of words in semantic categories. Conceptsbelonging to the same category group together, with the exception of apple, closer to the colors cluster instead of the fruits cluster. Panel (b)shows the multilingual property of TSS, comparing 190 pairs of concepts in English and Spanish with a strong linear correlation 𝜌 = 0.74,𝑝 < 10
−29. Outliers (points which depart from the diagonal) are signaled with arrows, corresponding to the polysemic behavior of word applein English. Panel (c) shows how TSS captures geographical and geoeconomical measures of world organization (diameter of points representseach country’s GPD per capita).
Asia, while the separation of North American countries (USand Canada) is less precise.
To quantify this observation we ran a classifier to seewhether TSS can be used to infer the continent to whicha country belongs. This was done in independent sets ofseventeen: five countries of Asia, Europe and South America,andCanada and theUS.We used 10-fold cross-validation and𝐾∗ classifier and we obtained a performance above 90%.The projection of the TSS of words referring to countries
alsomade evident an organization based on countries wealth.The wealthier countries were organized in the center of thegraph while more peripheral countries tended to be poorer(Figure 1(c)). To quantify this observation we performed alinear regression of Gross Domestic Product (GDP) as afunction of distance to the mass center of the 5 wealthiestcountries. Results showed a highly significant negative cor-relation (𝜌 = −0.58, 𝑝 < 10−4).
In summary TSS is a well-behaved measure of stationarysemantic similarity: (1) it covariates with well-documentedmeasures of semantic similarity; (2) it identifies naturalsemantic categories and outliers within these categories; (3)it is consistent across languages; and (4) it can identify withinthe same data more than one classification parameter (wealthand location in geographical data).
3.2. Dynamics of Semantic Organization. According to mostmodern views,mental concepts arise as an emergent propertyof their interrelationships. Thus, a concept is defined bywhom it relates to within the network [8, 9, 30–32]. Wordnet,LSA, NGD, and Word Association metrics have identifiedconsistent regularities in semantic networks which ought tobe emergent constructs ofmental activity of societies throughtime.However, it is expected that the organization of conceptsvaries through time; to the extent that language reflects
Computational Intelligence and Neuroscience 5
Water
Idea
Sky/heaven
Hot/warm
Food
Eyes
Night
Loss
Sun
State
SoulhDay
Light
Fire
0.52 0.57 0.62 0.67 0.720.1
0.225
0.35
0.475
0.6
G1G2
Light concept
Component 1
Com
pone
nt 2
Light concept in control period
1
2
(a)
Light conceptsCrisis concepts
Min temperature
Mea
n TS
S
0.12
0.15
0.18
0.21
0.24
10
18
26
1 2
(b)
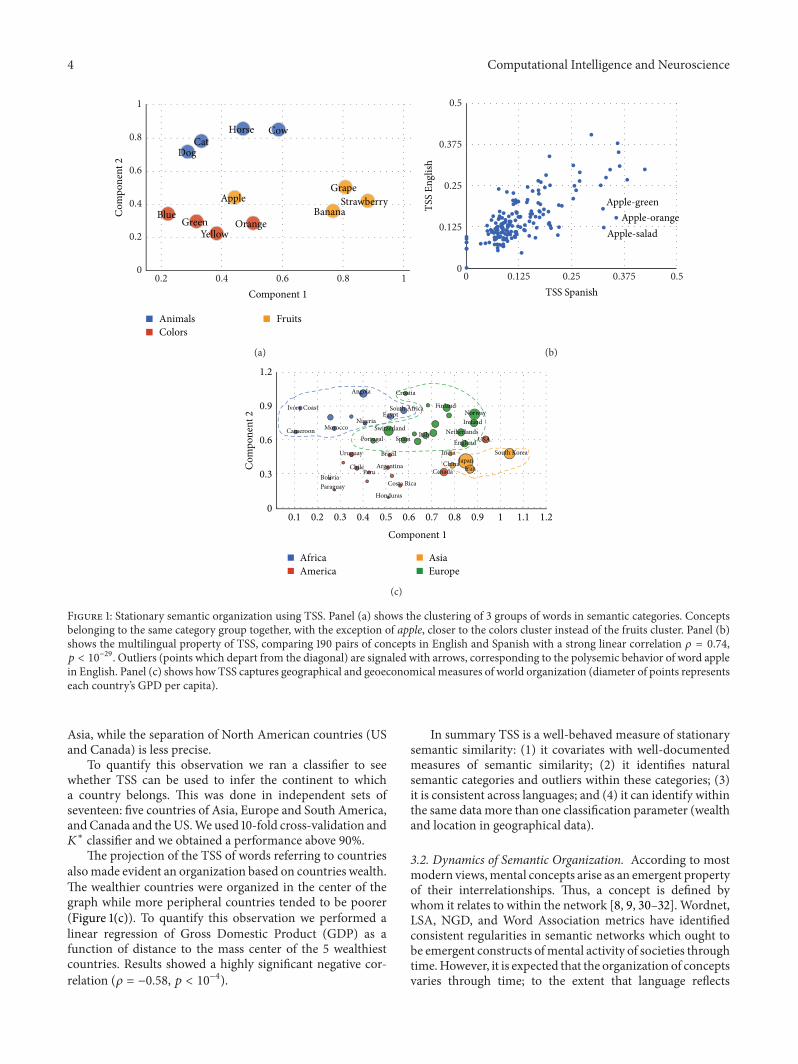
Figure 2: Evolution of the concept of light. Panel (a) shows the trajectory of the concept light around concepts commonly associated withlight (blue points) and concepts reflecting chaotic social scenario (red points). Crisis period starts at point (1) and finishes in point (2). Greypoints show the trajectory of light during the control period (3 months after crisis). Standard deviation around the two principal componentsof points in control trajectory is shown by the ellipse, showing that during crisis the light concept moves towards chaotic-associated words.Panel (b) shows the mean TSS of the concept of light for both groups (G1: light concepts, blue line; G2: crisis concepts, red line). Mean TSSbetween light and all words in G2 (chaos) showed a positive correlation with min temperature (black line).
thought, these changes should be reflected, specifically, in theuse of words [14, 16]. Here, we capitalize on the capacity ofTSS to identify rapid temporal fluctuations in word similarityto examine and validate this hypothesis.
3.2.1. Evolution of a Concept: What Do We Think WhenWe Think of Light? On December of 2013, temperatures inBuenos Aires rose to unusually high values and elevated thehome demand of energy which led to a major collapse ofthe service.This crisis was densely spread between December16 and 30 through a city with a population of more than 13million people and resulted inmajor riots, protests, picketing,and manifestations. During these days, the feeling was thatpeople in the city of Buenos Aires could hardly talk aboutmatters unrelated to heat, power supply, and political crisisand the relation between these concepts. We reasoned atthe time (while waiting for the power supply to come back)that this was a unique occasion to investigate in quantitativegrounds the drift of a concept. Specifically we hypothesizethat the concept “luz” (which in Spanish refers to light but alsogenerically to electricity and power supply) would transientlydrift from its static neighborhood of associated concepts(spark, lamp, lightning, soul, sun, idea, etc.) to a set ofwords which would reveal the political and social tension andconflict and struggle evoked. In other words, our hypothesisis that, during these days, when Buenos Aires people thoughtabout light they were not thinking in illumination, creativity,clarity, and so on but rather in conflict, tension, riots, and soon.
To examine this hypothesis we first defined two setsof words. One contains the concepts commonly associatedwith light: luminosity, candle, spark, bulb, and creativ-ity. These concepts were derived from wordassociation.org(http://wordassociation.org/search/). A second set was gen-erated by asking fifteen participants about the set of words
which they thought reflected a chaotic social scenario, fromwhich we derived the highest 15 words.
We then had two sets of words (defined prior to any TSSmeasurement) and we could examine the hypothesis that theconcept light should drift from a location close to Group1 (Common Light Conceptual Neighborhood) to Group 2during the crisis. We measured the location of the concept“light” within the semantic network 3 days before the crisisand up to 28 days after the start of crisis (Figure 2(a)). Thetrajectory shows a clear loop during the time of the crisiswhich departs from Group 1 words towards Group 2 words.As a control, we ran a second set of data more than onemonth after the crisis had been completed to measure typicalfluctuations of the concept in similar time windows. Resultsshowed that during this time the concept showed moderatefluctuations which on average were closer to G1 (and fartherfrom G2) than during the crisis (G1: 0.23, G2: 0.22, 𝑡-test𝑝 < 10
−3, df = 142).To quantify this result we measured the mean TSS of the
concept of light for both groups and the relation betweenthe position of the concept in the graph and temperature(Figure 2(b)). Global data of power collapse was not availableand since temperature correlates tightly with power demandthis was the best estimate we had of collapse in power supply.As hypothesized, the mean TSS between lights and all wordsin the G2 (chaos) showed a positive correlation with mintemperature (𝜌 = 0.5180, 𝑝 < 10−28). Conversely, themean TSS between light and all words in the G1 (typical lightword associations) showed a negative correlation with mintemperature (𝜌 = −0.1943, 𝑝 < 10−5).
3.2.2. Global Reorganization of the Semantic Network. In theprevious section we showed that a single concept may driftin the semantic network in response to major social events.Here we investigate the possibility that a cultural event may
6 Computational Intelligence and Neuroscience
HG F E D C B A
Qualified teams
0.9
0.8
0.7
0.6
0.5
0.4
0.3
0.2
0.1
0
0.9
0.8
0.7
0.6
0.5
0.4
0.3
0.2
0.1
0
Nonqualifiedteams
Just after the draw (D + 1) A week after the draw (D + 7)
Just before the draw (D − 1)3 days before the draw (D − 3)
(a)
0
0.25
0.5
0.75
1
3 D
ic
4 D
ic
5 D
ic
6 D
ic
7 D
ic
8 D
ic
9 D
ic
10 D
ic
11 D
ic
12 D
ic
13 D
ic
Groups classification
00.20.40.60.81
16:0
016
:20
16:4
017
:00
17:2
017
:40
18:0
018
:20
18:4
0
D − 3 D − 1 D + 7
D + 1
16hs
18hs
8hs
(b)
Figure 3: Reorganization of the semantic network caused by World Cup draw. Panel (a) shows the TSS between two sets of countries (32qualified teams and 32 nonqualified teams) in four instants: 3 days before the draw (D − 3), just before the draw (D − 1), just after the draw (D+ 1), and a week after the draw (D + 7). By normalizing matrix rows, panel shows internal structure within the concepts representing the 32countries revealing the outcome of the groups draw. Panel (b) shows the classifier performance predicting the groups conformation every twohours. Between D − 3 and D − 1 classifier shows poor performance, with a rapid rise between D − 1 and D + 1 (see overlay for a two-minuteresolution performance result), and the final decay after D + 1 until D + 7.
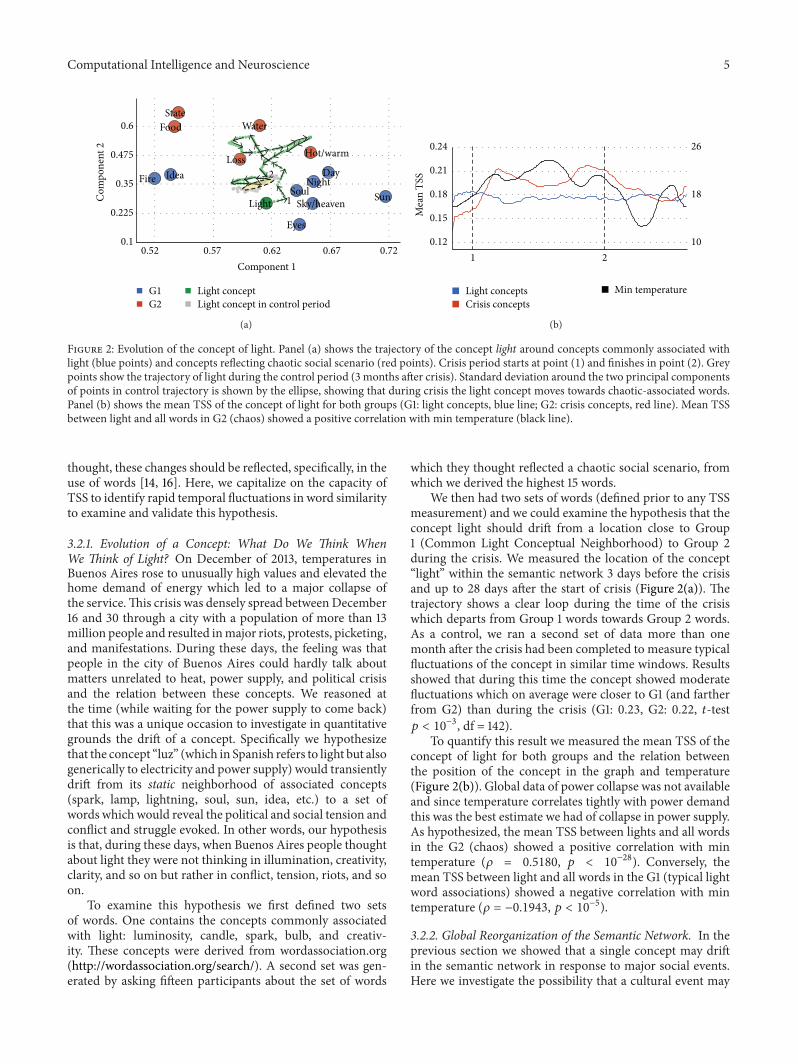
reorganize the entire network in a different set of clusters.To this aim we capitalize on the example of country wordsdescribed previously. This is a relatively simple domain ofsemantics, organized by reasonable principles of geography,culture, and economy. People may think of Sweden andNorway or Argentina and Uruguay as similar countries,revealing hence a sense of proximity in a semantic map. Thisintuition is testified by the results described in Figure 1(c) andthe analysis described above. However, temporary politicalor contemporary events may reorganize this representation.A war, an international conflict, or even love (as in themarriage of the prince of Holland to an Argentinean wife)may temporary relate semantically to countries which beforewere thought and conceived as distant.
On December 6, the draw for the Football World Cup2014 was held in Brazil. The World Cup is organized ineight groups of four national teams. The teams of each groupplay against each other to determine who will qualify tothe final rounds of the best sixteen. From December 3 toDecember 14, we recorded the high temporal resolution TSSbetween 64 countries: 32 qualified national teams (QT) and32 countries which did not participate trying to balancebetween continents, size, and population (Non-QT).The TSSthree days before the draw already shows that QT are slightlymore similar on average (⟨TSS
3Dic(QT)⟩ = 0.11 ± 0.0089,⟨TSS3Dic(Non-QT)⟩ = 0.07 ± 0.0085, 𝑡-test, 𝑝 < 10
−5, df =2046).
It must be noted that countries attending to the WorldCup do have socioeconomical, demographical, and geo-graphical similarities. However, the dynamic nature of theformation of this cluster becomes clear when one analyzesthe TSS matrix one hour before the draw. The similaritybetween the concepts representing the countries participat-ing in the World Cup increases revealing that a clear clustermatrix shows a first stage (⟨TSS
3Dic(QT)⟩ = 0.11 ± 0.0089,⟨TSS6Dic(QT)⟩ = 0.33± 0.0087, paired 𝑡-test, 𝑝 < 10
−200, df =1023).
An hour after the draw had been completed (it isimportant to bear in mind that a large fraction of the worldpopulation follows this draw in real time and with greatexpectation) the TSS matrix shows an internal structurewithin the concepts representing the 32 countries whichreveals the outcome of the groups.
To quantify the information we run a classifier which,for each country, sought to identify the three other countriesof its group based exclusively on TSS (see Methods forclassification method). We generated 10000 random distancematrixes of all countries, showing a classification level, thechance level, of 0.1471±0.0004. Before the draw (Figure 3(a)),classification showed a very low value (0.0329 ± 0.0034). Thisclassification is below chance level due to the geographicaldependence of TSS, as showed in Figure 1. It then rampsextremely rapidly to values close to 0.8 and fades downexponentially to values significantly above level previous to
Computational Intelligence and Neuroscience 7
EuropeAmerica
Spain
Italy
Greece
Chile
Uruguay
Colombia
0 0.3 0.6 0.9 1.20
0.3
0.6
0.9
1.2
Component 1
Com
pone
nt 2
Before draw (D − 1)
(a)
Spain
Group C
Group D
Group B
Italy
Greece
Chile
Uruguay
Colombia
0.6 0.615 0.63 0.645 0.660.48
0.5
0.52
0.54
0.56
Component 1
Com
pone
nt 2
EuropeAmerica
Just after the draw (D + 1)
(b)
SpainItaly
Greece
ChileUruguay
Colombia
0.633540.5136
0.63358 0.63362 0.63366
0.5138
0.514
0.5142
0.5144
Component 1
Com
pone
nt 2
EuropeAmerica
Week after the draw (D + 7)
(c)
Timeline Timeline
3
5
7
9
−2−1
012
Draw period Control period
Timeline
Qualified teamsNonqualified teams
D + 1
D − 3 D − 1 D + 7
Nor
mal
ized
nor
mTS
S m
atrix
nor
m
(d)
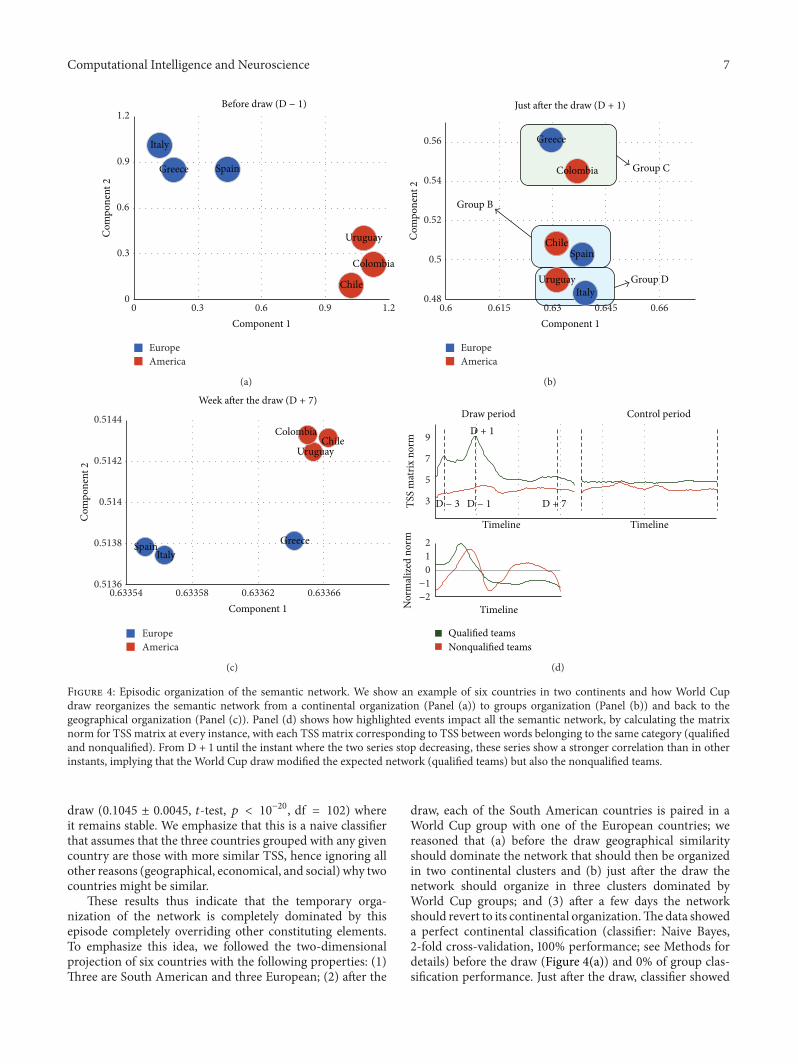
Figure 4: Episodic organization of the semantic network. We show an example of six countries in two continents and how World Cupdraw reorganizes the semantic network from a continental organization (Panel (a)) to groups organization (Panel (b)) and back to thegeographical organization (Panel (c)). Panel (d) shows how highlighted events impact all the semantic network, by calculating the matrixnorm for TSS matrix at every instance, with each TSS matrix corresponding to TSS between words belonging to the same category (qualifiedand nonqualified). From D + 1 until the instant where the two series stop decreasing, these series show a stronger correlation than in otherinstants, implying that the World Cup draw modified the expected network (qualified teams) but also the nonqualified teams.
draw (0.1045 ± 0.0045, 𝑡-test, 𝑝 < 10−20, df = 102) whereit remains stable. We emphasize that this is a naive classifierthat assumes that the three countries grouped with any givencountry are those with more similar TSS, hence ignoring allother reasons (geographical, economical, and social) why twocountries might be similar.
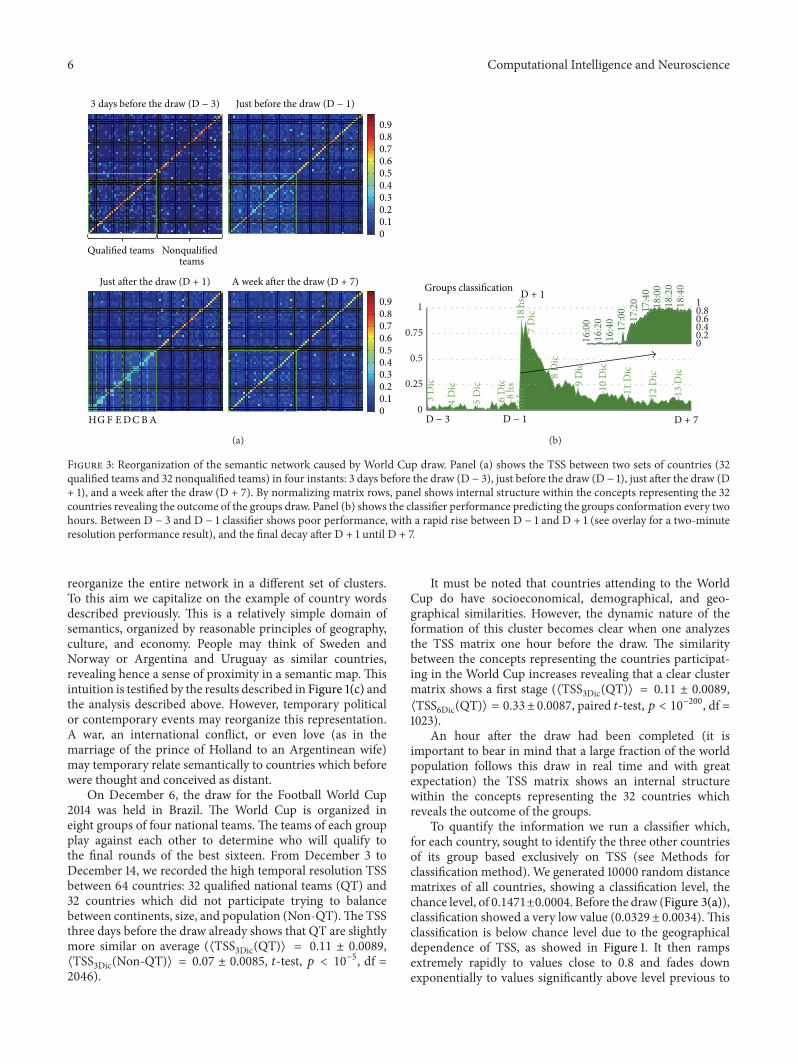
These results thus indicate that the temporary orga-nization of the network is completely dominated by thisepisode completely overriding other constituting elements.To emphasize this idea, we followed the two-dimensionalprojection of six countries with the following properties: (1)Three are South American and three European; (2) after the
draw, each of the South American countries is paired in aWorld Cup group with one of the European countries; wereasoned that (a) before the draw geographical similarityshould dominate the network that should then be organizedin two continental clusters and (b) just after the draw thenetwork should organize in three clusters dominated byWorld Cup groups; and (3) after a few days the networkshould revert to its continental organization.Thedata showeda perfect continental classification (classifier: Naive Bayes,2-fold cross-validation, 100% performance; see Methods fordetails) before the draw (Figure 4(a)) and 0% of group clas-sification performance. Just after the draw, classifier showed
8 Computational Intelligence and Neuroscience
a good performance of 83% of correct group classification(Figure 4(b), Naive Bayes, 2-fold cross-validation) and only16% of geographical classification performance. A weekafter the draw, the geographical classification shows 83% ofperformance (Figure 4(c)) while group classification showed0% performance.
Based on these results, we showed that the draw rear-ranges the qualified teams shifting from the geographic toWorld Cup’s groups organization. However, we hypothesizethat this highlighted event impacts all the semantic network,including the nonqualified teams subnetwork. To character-ize this phenomenon we calculated the matrix norm for TSSmatrix at every instance. Each TSS matrix corresponds to allTSS between words belonging to the same category (qualifiedand nonqualified) at a given time. From the time before thedraw (D − 3) until the draw, the qualified and nonqualifiedteams show a correlated behavior (Figure 4(d), 𝜌 = 0.50919,𝑝 < 10
−3). Starting from the instant just after the draw (D+ 1) until the instant where the two series stop decreasing,these series show a stronger correlation (𝜌 = 0.71126, 𝑝 <10−9). In the remaining time, the series are also correlated
(𝜌 = 0.42327, 𝑝 < 10−3).This shows that theWorld Cup drawmodified the expected network (qualified teams) but also thenonqualified teams. This behavior evidenced the distributedeffect on the network. During March 2014, the series for thequalified andnonqualified teamswere not correlated showingthat both subnetworks stabilize to a basal movement, notorchestrated by the particular event.
4. Conclusions
Many unsupervised algorithms explore semantic organiza-tion based on frequency of cooccurrence of words from largecorpora. Semantic spaces are computationally expensive tocalculate, prohibiting the estimation of semantic networks inshort periods of times. Instead, we study activity in the socialnetwork to drive a measure of the underlying semantic spaceand compare it with previous metrics.
With TSS, we have presented a measure of similarity withmany features that make it a valuable tool to study semanticstructures. We demonstrated that TSS is commensurablewith methods, for example, LSA, Wordnet, that assume astationary or slowly varying field of cooccurrences betweenthe elements of the lexicon. We validated TSS in several tests,such as categorization or synonym test, which yielded similarresults, and therefore it can be used to substitute them in casesthat do not involve a highly specialized semantic space (e.g., aprofessional field). Conversely, TSS allows defining semanticsusing more colloquial language expressions, and therefore itcan be thought of as a vernacular database, sensitive to slangand the emergence of neologisms [33].
However, the most remarkable feature of TSS is its abilityto detect rapid changes in the semantic network withoutrelying on specific topics and to connect those changeswith real-time events across the world. We quantified theeffect of these events on the semantic content of termsdirectly related to them, as well as the ripple effect acrossthe semantic web. This is particularly important, as thedefinition of TSS does not involve any explicit assumption
about the distributed nature of semantics, in contrapositionwith semantic indexing and graph-based methods such as[34, 35].
The idea that our beliefs are dynamic is both common-sensical and deeply rooted in psychology [36] and philosophyof language [37], as well as machine learning and artificialintelligence theories of relational learning [38]. With theadvent of social media, there is growing interest in thedynamics of information diffusion [39, 40]. Using TSS, weshowed that seemingly permanent lexical elements, such asterms designing countries, are affected semantically by thenews/event dynamics.While our results should be consideredlimited and preliminary, they are consistent with the notionthat language emerges from a complex web of dynamicallyinteracting elements. In this sense, we hope our work willcontribute to the development of a new formal paradigmto understand language, reflecting its nature as a socialconstruction [41].
Conflict of Interests
The authors declare that there is no conflict of interestsregarding the publication of this paper.
References
[1] D. Bickerton, More Than Nature Needs: Language, Mind, andEvolution, Harvard University Press, 2014.
[2] G. Adomavicius and A. Tuzhilin, “Toward the next generationof recommender systems: a survey of the state-of-the-art andpossible extensions,” IEEE Transactions on Knowledge and DataEngineering, vol. 17, no. 6, pp. 734–749, 2005.
[3] G. Bedi, G. A. Cecchi, D. F. Slezak, F. Carrillo, M. Sigman, andH. de Wit, “A window into the intoxicated mind? Speech as anindex of psychoactive drug effects,” Neuropsychopharmacology,2014.
[4] M. N. Jones andD. J. K.Mewhort, “Representing wordmeaningand order information in a composite holographic lexicon,”Psychological Review, vol. 114, no. 1, pp. 1–37, 2007.
[5] S. M. Polyn, V. S. Natu, J. D. Cohen, and K. A. Norman,“Category-specific cortical activity precedes retrieval duringmemory search,” Science, vol. 310, no. 5756, pp. 1963–1966, 2005.
[6] T. M. Mitchell, S. V. Shinkareva, A. Carlson et al., “Predictinghuman brain activity associated with the meanings of nouns,”Science, vol. 320, no. 5880, pp. 1191–1195, 2008.
[7] P. Cramer, Word Association, Academic Press, New York, NY,USA, 1968.
[8] K. W. Church and P. Hanks, “Word association norms, mutualinformation, and lexicography,” Computational Linguistics, vol.16, no. 1, pp. 22–29, 1990.
[9] S. Deerwester, S. T. Dumais, G. W. Furnas, T. K. Landauer, andR. Harshman, “Indexing by latent semantic analysis,” Journal ofthe American Society for Information Science, vol. 41, no. 6, pp.391–407, 1990.
[10] T. L. Griffiths, M. Steyvers, and J. B. Tenenbaum, “Topics insemantic representation,” Psychological Review, vol. 114, no. 2,pp. 211–244, 2007.
[11] T. K. Landauer and S. T. Dumais, “A solution to plato’s problem:The latent semantic analysis theory of acquisition, induction,
Computational Intelligence and Neuroscience 9
and representation of knowledge,” Psychological Review, vol.104, no. 2, pp. 211–240, 1997.
[12] M. B.W.Wolfe,M. E. Schreiner, B. Rehder et al., “Learning fromtext: matching readers and texts by latent semantic analysis,”Discourse Processes, vol. 25, no. 2-3, pp. 309–336, 1998.
[13] P. W. Foltz, W. Kintsch, and T. K. Landauer, “The measurementof textual coherence with latent semantic analysis,” DiscourseProcesses, vol. 25, no. 2-3, pp. 285–307, 1998.
[14] J.-B. Michel, Y. Kui Shen, A. Presser Aiden et al., “Quantitativeanalysis of culture using millions of digitized books,” Science,vol. 331, no. 6014, pp. 176–182, 2011.
[15] M. Steyvers and J. B. Tenenbaum, “The large-scale structure ofsemantic networks: statistical analyses and a model of semanticgrowth,” Cognitive Science, vol. 29, no. 1, pp. 41–78, 2005.
[16] C. G. Diuk, D. F. Slezak, I. Raskovsky, M. Sigman, and G. A.Cecchi, “A quantitative philology of introspection,” Frontiers inIntegrative Neuroscience, vol. 6, article 80, 2012.
[17] M. Pagel, Q. D. Atkinson, and A. Meade, “Frequency ofword-use predicts rates of lexical evolution throughout Indo-European history,” Nature, vol. 449, no. 7163, pp. 717–720, 2007.
[18] T. Mikolov, I. Sutskever, K. Chen, G. S. Corrado, and J. Dean,“Distributed representations of words and phrases and theircompositionality,” in Proceedings of the Advances in NeuralInformation Processing Systems, pp. 3111–3119, 2013.
[19] J. Bollen,H.Mao, andX. Zeng, “Twittermoodpredicts the stockmarket,” Journal of Computational Science, vol. 2, no. 1, pp. 1–8,2011.
[20] T. Sakaki, M. Okazaki, and Y. Matsuo, “Earthquake shakestwitter users: real-time event detection by social sensors,” inProceedings of the 19th International Conference on World WideWeb (WWW ’10), pp. 851–860, ACM, April 2010.
[21] A. Pak and P. Paroubek, “Twitter as a corpus for sentiment anal-ysis and opinionmining,” in Proceedings of the 7th InternationalConference on Language Resources and Evaluation (LREC ’10),N. Calzolari, K. Choukri, B. Maegaard et al., Eds., EuropeanLanguage Resources Association (ELRA), Valletta, Malta, May2010.
[22] R. L. Cilibrasi and P. M. B. Vitanyi, “The google similarity dis-tance,” IEEE Transactions on Knowledge and Data Engineering,vol. 19, no. 3, pp. 370–383, 2007.
[23] J. G. Cleary and L. E. Trigg, “K∗: an instance-based learnerusing an entropic distance measure,” in Proceedings of the 12thInternational Conference on Machine Learning, pp. 108–114,1995.
[24] A. McCallum and K. Nigam, “A comparison of event modelsfor naive bayes text classification,” in Proceedings of the AAAI-98 Workshop on Learning for Text Categorization, vol. 752, pp.41–48, Madison, Wis, USA, July 1998.
[25] G. A. Miller, “Wordnet: a lexical database for english,” Commu-nications of the ACM, vol. 38, no. 11, pp. 39–41, 1995.
[26] D. Lin, “An information-theoretic definition of similarity,” inProceedings of the 15th International Conference on MachineLearning (ICML ’98), pp. 296–304, 1998.
[27] P. Resnik, “Using information content to evaluate semanticsimilarity in a taxonomy,” inProceedings of the 14th InternationalJoint Conference on Artificial Intelligence (IJCAI ’95), vol. 1, pp.448–453, 1995.
[28] P. D. Turney, “Mining the web for synonyms: PMI-IR versusLSA on TOEFL,” inMachine Learning: ECML 2001, vol. 2167 ofLectureNotes inComputer Science, pp. 491–502, Springer, Berlin,Germany, 2001.
[29] J. B. Kruskal, “Multidimensional scaling by optimizing good-ness of fit to a nonmetric hypothesis,” Psychometrika, vol. 29,no. 1, pp. 1–27, 1964.
[30] M. Sigman and G. A. Cecchi, “Global organization of theWordnet lexicon,” Proceedings of the National Academy ofSciences of the United States of America, vol. 99, no. 3, pp. 1742–1747, 2002.
[31] T. Pedersen, S. Patwardhan, and J. Michelizzi, “WordNet sim-ilarity: measuring the relatedness of concepts,” in Proceedingsof the HLT-NAACL—Demonstrations ’04 Demonstration Papersat HLT-NAACL, pp. 38–41, Association for ComputationalLinguistics, 2004.
[32] F. Xu and J. B. Tenenbaum, “Word learning as Bayesianinference,” Psychological Review, vol. 114, no. 2, pp. 245–272,2007.
[33] M. Emms, “Dynamic EM in neologism evolution,” in IntelligentData Engineering and Automated Learning—IDEAL, vol. 8206of Lecture Notes in Computer Science, pp. 286–293, Springer,2013.
[34] T. K. Landauer, P. W. Foltz, and D. Laham, “An introduction tolatent semantic analysis,”Discourse Processes, vol. 25, no. 2-3, pp.259–284, 1998.
[35] T. Pedersen, S. Patwardhan, and J. Michelizzi, “Wordnet simi-larity: measuring the relatedness of concepts,” in Proceedings ofthe Demonstration Papers at (HLT-NAACL ’04), Association forComputational Linguistics, 2004.
[36] L.Wittgenstein,Philosophical Investigations, JohnWiley& Sons,2010.
[37] W. V. O. Quine and J. S. Ullian, The Web of Belief, RandomHouse, New York, NY, USA, 1978.
[38] C. Kemp, J. B. Tenenbaum, S. Niyogi, and T. L. Griffiths, “Aprobabilisticmodel of theory formation,”Cognition, vol. 114, no.2, pp. 165–196, 2010.
[39] J. Leskovec, L. Backstrom, and J. Kleinberg, “Meme-trackingand the dynamics of the news cycle,” in Proceedings of the15th ACM SIGKDD International Conference on KnowledgeDiscovery and Data Mining (KDD '09), pp. 497–505, ACM,Paris, France, July 2009.
[40] D. M. Romero, B. Meeder, and J. Kleinberg, “Differences in themechanics of information diffusion across topics: idioms, polit-ical hashtags, and complex contagion on twitter,” in Proceedingsof the 20th International Conference onWorldWideWeb (WWW’11), pp. 695–704, April 2011.
[41] J. R. Searle,The Construction of Social Reality, Free Press, 1997.

Submit your manuscripts athttp://www.hindawi.com
Computer Games Technology
International Journal of
Hindawi Publishing Corporationhttp://www.hindawi.com Volume 2014
Hindawi Publishing Corporationhttp://www.hindawi.com Volume 2014
Distributed Sensor Networks
International Journal of
Advances in
FuzzySystems
Hindawi Publishing Corporationhttp://www.hindawi.com
Volume 2014
International Journal of
ReconfigurableComputing
Hindawi Publishing Corporation http://www.hindawi.com Volume 2014
Hindawi Publishing Corporationhttp://www.hindawi.com Volume 2014
Applied Computational Intelligence and Soft Computing
Advances in
Artificial Intelligence
Hindawi Publishing Corporationhttp://www.hindawi.com Volume 2014
Advances inSoftware EngineeringHindawi Publishing Corporationhttp://www.hindawi.com Volume 2014
Hindawi Publishing Corporationhttp://www.hindawi.com Volume 2014
Electrical and Computer Engineering
Journal of
Journal of
Computer Networks and Communications
Hindawi Publishing Corporationhttp://www.hindawi.com Volume 2014
Hindawi Publishing Corporation
http://www.hindawi.com Volume 2014
Advances in
Multimedia
International Journal of
Biomedical Imaging
Hindawi Publishing Corporationhttp://www.hindawi.com Volume 2014
ArtificialNeural Systems
Advances in
Hindawi Publishing Corporationhttp://www.hindawi.com Volume 2014
RoboticsJournal of
Hindawi Publishing Corporationhttp://www.hindawi.com Volume 2014
Hindawi Publishing Corporationhttp://www.hindawi.com Volume 2014
Computational Intelligence and Neuroscience
Industrial EngineeringJournal of
Hindawi Publishing Corporationhttp://www.hindawi.com Volume 2014
Modelling & Simulation in EngineeringHindawi Publishing Corporation http://www.hindawi.com Volume 2014
The Scientific World JournalHindawi Publishing Corporation http://www.hindawi.com Volume 2014
Hindawi Publishing Corporationhttp://www.hindawi.com Volume 2014
Human-ComputerInteraction
Advances in
Computer EngineeringAdvances in
Hindawi Publishing Corporationhttp://www.hindawi.com Volume 2014