Embed Size (px)
Citation preview
Merler et al. BMC Medicine 2013, 11:252http://www.biomedcentral.com/1741-7015/11/252
RESEARCH ARTICLE Open Access
Containing the accidental laboratory escape ofpotential pandemic influenza virusesStefano Merler1, Marco Ajelli1, Laura Fumanelli1,2 and Alessandro Vespignani3,4,5*
Abstract
Background: The recent work on the modified H5N1 has stirred an intense debate on the risk associated with theaccidental release from biosafety laboratory of potential pandemic pathogens. Here, we assess the risk that theaccidental escape of a novel transmissible influenza strain would not be contained in the local community.
Methods: We develop here a detailed agent-based model that specifically considers laboratory workers andtheir contacts in microsimulations of the epidemic onset. We consider the following non-pharmaceuticalinterventions: isolation of the laboratory, laboratory workers’ household quarantine, contact tracing of cases andsubsequent household quarantine of identified secondary cases, and school and workplace closure both preventiveand reactive.
Results: Model simulations suggest that there is a non-negligible probability (5% to 15%), strongly dependent onreproduction number and probability of developing clinical symptoms, that the escape event is not detectedat all. We find that the containment depends on the timely implementation of non-pharmaceutical interventionsand contact tracing and it may be effective (>90% probability per event) only for pathogens with moderatetransmissibility (reproductive number no larger than R0 = 1.5). Containment depends on population density andstructure as well, with a probability of giving rise to a global event that is three to five times lower in rural areas.
Conclusions: Results suggest that controllability of escape events is not guaranteed and, given the rapid increaseof biosafety laboratories worldwide, this poses a serious threat to human health. Our findings may be relevant topolicy makers when designing adequate preparedness plans and may have important implications for determiningthe location of new biosafety laboratories worldwide.
Keywords: BSL Laboratory, Influenza, Agent-based model, Outbreak containment, Contact tracing
BackgroundThe risk associated with the accidental laboratory escapeof potential pandemic pathogens is under the magnifyinglens of research and policy making communities [1,2].The recent debate on the genetic manipulation of highlyvirulent influenza viruses [3,4] has made clear the neces-sity for quantitative risk/benefit assessment before star-ting research projects involving biosafety level (BSL) 3and 4 agents. According to data collected in 2010 and2011, the number of BSL 4 laboratories worldwide is 38[5], mostly concentrated in the US (10) and Europe (14).
* Correspondence: [email protected] for the Modeling of Biological and Socio-technical Systems,Northeastern University, Boston 02115, MA, USA4Computational Epidemiology Laboratory, Institute for Scientific Interchange(ISI), Torino, ItalyFull list of author information is available at the end of the article
© 2013 Merler et al.; licensee BioMed CentralCommons Attribution License (http://creativecreproduction in any medium, provided the or
The official number of BSL 3 facilities worldwide isunknown, since most laboratories where research on in-fectious diseases is carried out and many hospital labora-tories operate at safety level 3. Their number, however, isof the order of several thousands: there were 1,362 inthe US alone in 2008 [6]. According to data collected in2010, the number of US workers with approved accessto biological select agent and toxin (BSAT) was 10,639[7]. From 2004 to 2010, 639 release reports were re-ported to the Centers for Disease Control (CDC), 11 ofthem reporting laboratory-acquired infections that, how-ever, did not result in fatalities or secondary transmis-sion [7]. A list of recently reported laboratory-acquiredinfections is available (see [8]). A rigorous risk assess-ment is a scientific challenge per se [9-11]. Although theestimates of the probability of accidental escape are
Ltd. This is an open access article distributed under the terms of the Creativeommons.org/licenses/by/2.0), which permits unrestricted use, distribution, andiginal work is properly cited.
Merler et al. BMC Medicine 2013, 11:252 Page 2 of 11http://www.biomedcentral.com/1741-7015/11/252
relatively low (0.3% risk of release per lab per year[11]), the increased number of laboratories workingon BSL 3 and 4 agents gives rise to estimates projec-ting an appreciable combined escape risk of potentialpandemic pathogens (PPP) in a 10-year window [11].In addition, for PPP, the relatively small risk of re-lease has to be weighted against the size of the popu-lation that could be affected by such an event, therisk of severe or fatal cases and the likelihood of con-tainment before the event could escalate to globalproportions. Furthermore, the quantitative analysis ofthe post-release scenario is complicated by the diffe-rent social and environmental settings that apply tothe more than 1,500 BSL 3 and 4 laboratories aroundthe world [9].Here, we perform a quantitative analysis of (accidental)
post-release scenarios from a BSL facility, focusing onthe likelihood of containment of the accidental releaseevent. Although BSL 4 agents, such as Ebola virus andMarburg virus, are considered the most dangerous tohandle because of the often fatal outcome of the disease,they are unlikely to generate global risk because of theirinefficient mechanism of person-to-person transmissionand other features of the natural history of the induceddiseases [12,13]. It is therefore understood that themajor threat of a pandemic escalation is provided bymodified influenza viruses [10], and for this reason wefocused our work on the accidental release of novel in-fluenza strain in a densely populated area of Europe. Weused a highly detailed agent-based model that speci-fically considers laboratory workers and their householdin order to test the detailed implementation of non-pharmaceutical containment measures in the very earlystage of the release/outbreak scenario. The model al-lowed analysis of the progression of the epidemic at thelevel of single individual. We could therefore assess thelikelihood of containment as a function of a wide rangeof interventions, and provide a discussion of differentgeographical settings (for example, rural vs urban seed-ing) by analyzing the effects of population density andstructure. Differently from methods employed to esti-mate the probability of containing naturally emergingpathogens at the source, here we assumed that epi-demiological surveillance is presumably enhanced inareas where BSL laboratories are located, thus increasingthe likelihood of quickly detecting symptomatic cases.Moreover, we assumed that this makes it possible to putin place intervention measures (for example, socialdistancing measures and contact tracing) at the very be-ginning of the epidemic. A number of factors determinethe controllability of an outbreak, including the uncer-tainty in the efficacy of the containment policies re-corded in the literature. For this reason we performed avery extensive sensitivity analysis on the efficacy of
implemented policies and the disease natural history. Interms of specific interventions implemented, our analysisis inspired by the experience of an accidental release ofsevere acute respiratory syndrome (SARS) in August2003 from a laboratory in Singapore [14]: a total of 8household contacts, 2 community contacts, 32 hospitalcontacts, and 42 work contacts were identified, of whom25 were placed under home quarantine. Both labora-tories where the patient had worked were closed as aprecautionary measure. Specifically as regards contacttracing, its efficacy for tuberculosis (TB) is ascertained(large-scale studies tracing contacts of TB patients in theUS and Canada found high incidence rates of active TB(200 to 2,200 cases per 100,000 individuals) against 5 to10 per 100,000 in the general population [15-17]). Incontrast, contact tracing was performed in the case(described above) of accidental release of SARS and inanother case of SARS [18] (1,000 persons traced), but nosecondary infections were detected. The two most cri-tical quantities affecting the temporal pattern of spreadof influenza viruses, and containment probabilities aswell, are the generation time (the distribution of thetime interval between infection of a primary case and in-fection of a secondary case caused by the primary case),and the basic reproduction number R0. We analyzeddifferent scenarios by assuming transmissibility compar-able to that observed in past influenza pandemics, forexample, the 2009 H1N1 virus (namely R0 or effectivetransmissibility in the range 1.2 to 1.6 [19-24]) or 1918Spanish influenza (R0 = 1.8 or higher [25]), and genera-tion time distributions consistent with current estimatesfor influenza (in the range 2.5 to 4 days [23,26-29]). Be-yond these factors, intervention efficacy depends onprobability of developing clinical symptoms and lengthof the incubation period, as they affect, respectively, theprobability of detecting cases and the probability ofstopping the transmission chain through rapid identifica-tion of secondary cases. All these factors make influenzadifferent from other potential pandemic pathogens. Forinstance, SARS is characterized by a very long incuba-tion period (1 to 2 days for influenza, up to 10 days forSARS [30]) and by a low proportion of infections ge-nerated by asymptomatic infections (up to 50% for influ-enza, negligible for SARS [30]). The R0 of SARS wasestimated to be slightly larger than that of influenza,namely in the range 2 to 3 [30]. Smallpox, similar toSARS, is another potentially pandemic pathogen charac-terized by a low proportion of infections generated byasymptomatic infections [30], though characterized bya larger R0 (in the range of 5 to 10 [30]). In contrast,Marburg hemorrhagic fever is characterized by a lowR0 (about 1.5 [12]) and short incubation period (about2 days, with an overall generation time of 8 to10 days [12]).
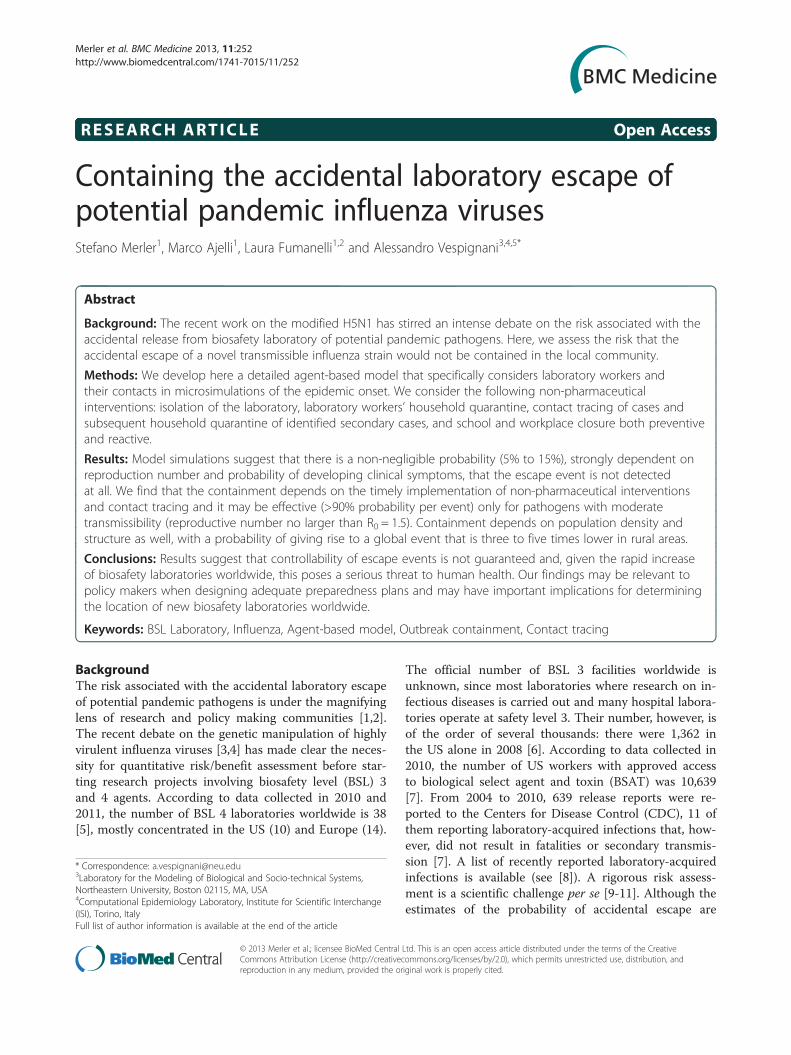
Figure 1 Doubling time. Average doubling time (dots) and 95% CI(vertical lines) as a function of R0. For each value of R0 results wereobtained by analyzing 100 uncontrolled (no intervention)simulated epidemics.
Merler et al. BMC Medicine 2013, 11:252 Page 3 of 11http://www.biomedcentral.com/1741-7015/11/252
MethodsIn order to provide a quantitative assessment of thecontainment likelihood and the detailed modeling ofinterventions we used a stochastic microsimulation mo-del structurally similar to the one used elsewhere (see[19,31]) to generate simulations of pandemic events. Themodel is a spatially explicit stochastic individual-basedmodel of influenza transmission with force of infectiondecreasing with the distance and explicit transmissionin households, schools and workplaces (see Additionalfile 1 for details). This model has been validated withdata from the H1N1 2009 pandemic [19] and comparedand tested against other large-scale computational approa-ches [32]. The model integrates highly detailed data oncountry-specific sociodemographic structures (for exam-ple, household size and composition, age structure, ratesof school attendance, and so on) available from the Sta-tistical Office of the European Commission [33]. Thesedata were used to generate highly detailed synthetic po-pulations. More specifically, census data on frequencies ofhousehold size and type, and age of household compo-nents by size were used to group individuals into house-holds. Data on rates of employment/inactivity and schoolattendance by age, structure of educational systems,school and workplace size allowed the assignment of indi-viduals to schools and workplaces or their tagging as in-active, according to their age. Following the availableestimates [34-37], the transmission model is paramete-rized so that 18% of transmission occurs through contactsmade at school, 30% within households, 19% in work-places and 33% in the general community. We made useof state of the art estimates of generation time for influ-enza viruses in the different settings [38], namely agedependent Weibull distributions (see Additional file 1for details on the natural history of the virus) with alatent period of 1 day, consistent with estimates ofgeneration time in the range 2.5 to 4 days [23,26-29].As it is nearly impossible to predict the reproductionnumber R0 of a modified influenza strain (typical valuesfor past influenza pandemics are in the range 1.3 to 2[23-26,39-44]) we analyzed scenarios with R0 varyingfrom 1.1 to 2.5, accounting for the possible largertransmissibility of the modified virus with respect topast influenza viruses. The resulting doubling time ofsimulations without intervention is shown in Figure 1.We considered containment successful if the diseasewas eliminated in less than 5 months and resulted inless than 1,000 cumulative cases. The rationale forthis choice is that, beyond the obvious requirement ofdisease elimination, epidemics should be characterizedby a relatively low, socially acceptable, cumulative numberof cases in a relatively short period of time; otherwisewe speak of outbreak. See Additional file 1 for me-thodological details.
Once the initial conditions for the outbreak were setthe model generated stochastic ensemble estimates ofthe unfolding of the epidemic. The infection transmis-sion chain can be analyzed at the level of each singleindividual and all the microscopic details of the progres-sion of the epidemic in the population can be accessedfor each stochastic realization of the escape event. Theescape events were identically initialized in a BSL facilityin the Netherlands (see Figure 2), by assuming 1 initialinfected worker (among 50 to 150 workers; results ob-tained by assuming a different number of initial in-fections are analyzed in Additional file 1). This is afundamental difference of the proposed method with re-spect to methods employed to estimate the probabilityof containing naturally emerging pathogens at the sourceor to analyze the potential effects of bioterrorist attacks:we assume to exactly know the starting point of the out-break. A second key difference from other studies is thefollowing: we assume that, if ascertained, initial in-fections generated by the first infected laboratory workerin the network of contacts comprising laboratory col-leagues and laboratory workers’ household membersmay generate an initial warning, and a set of medical/epidemiological analyses are conducted very early toidentify the origin of reported symptoms.We assumed the warning to be issued at the time Tw
corresponding to the first identification of one of the ini-tial cases. Two key parameters determine the efficacy ofsubsequent interventions: the first one is probability (Pc)of identifying initial infections, which is related to thevirus specific probability of developing clinical symptoms
Figure 2 Study area. The map shows population density of the Netherlands (colors from yellow to dark brown indicate increasing densities,from 1 to 3,500 inhabitants per km2), the location of the laboratory in a randomly chosen simulation (in Rotterdam, red point), the location of theworkers houses (blue points), the location of workplaces and schools attended by household members of laboratory workers (green). Blackconcentric circles indicate distances of 10 km, 20 km, 30 km from the laboratory. The inset shows the probability of commuting to (at) a certaindistance by laboratory workers.
Table 1 Model parameters regulating efficacy ofinterventions
Variable Description Reference (range)
Pc Infected close contactsdetection probability
0.6 (0.4 to 1)
Pg Infected random contactsdetection probability
Pc × 0.5 (0.1 to 1)
Pr Infected random contactsself-reporting probability
Pg × 0.8 (0.5 to 1)
Ti Delay from initial warningto intervention
3 (0 to 30) days
Tt Delay from case detectionto household quarantine
1 (0 to 4) days
Tp Duration of schools andworkplaces closure
21 (0, 7, 14, 21, 28) days
Dp Radius for schools andworkplaces closure
30 (0, 5, 10, 20, 30, 50, 50>) km
Fs Fraction of closed schools 0.9 (0 to 0.9)
Fw Fraction of closed workplaces 0 (0 to 0.5)
Merler et al. BMC Medicine 2013, 11:252 Page 4 of 11http://www.biomedcentral.com/1741-7015/11/252
and the probability of individuals to be actually con-cerned and report their health status. The second one isthe time (Ti) required to link the initial infections to anaccidental release of the modified influenza strain in thelaboratory (and not, for instance, to other circulatingseasonal influenza viruses) and to activate the contain-ment interventions.Once the PPP escape event has been detected we con-
sidered the following set of containment interventions:(i) isolation of the laboratory, (ii) laboratory workers’household quarantine, (iii) contact tracing of cases andsubsequent household quarantine of identified secondarycases, (iv) school and workplace closure both preventive,on a spatial basis, at the very beginning of the epidemic,and reactive during the entire epidemic.For contact tracing, we assumed that once one case is
detected, infected close contacts (that is household,school and workplace contacts) of the case are detectedwith probability Pc and can transmit the infection for acertain time (Tt) before isolation and household quaran-tine. Cases generated through random contacts in thegeneral population are detected with lower probability(Pg). We also assume that undetected cases may self-report their health status with a certain probability (Pr).Parameters characterizing interventions along with re-ference values and explored ranges are described inTable 1 (see also Additional file 1 for model details). De-tailed descriptions of the contact tracing procedure andinitial detection of the accidental release are shown inFigure 3A,B respectively. In the following we explore dif-ferent implementations of the containment interventionsand assess their effectiveness by generating stochasticscenario output (SSO) sets, providing for each point inspace and time, as given by the resolution of the model,
an ensemble of possible epidemic evolutions. We use asa benchmark SSO set the no intervention case, in whichthe epidemic is assumed to progress without externalintervention and a reference SSO set where all the abovecontainment measures are implemented according tothe reference value reported in Table 1.
Results and discussionBelow we discuss the likelihood that the escape of PPPvirus will spread into the local population and the ensu-ing outbreak will be contained by non-pharmaceuticalsinterventions that are likely the only ones to be availablein the early stage of the outbreak.
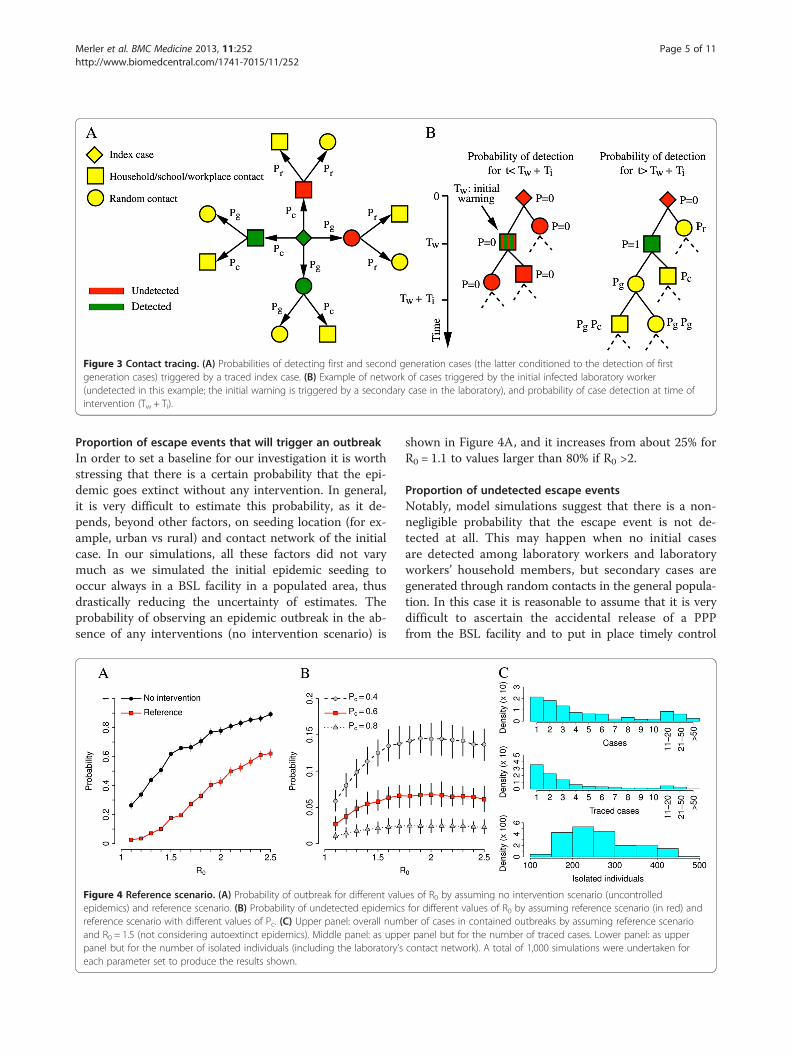
Figure 3 Contact tracing. (A) Probabilities of detecting first and second generation cases (the latter conditioned to the detection of firstgeneration cases) triggered by a traced index case. (B) Example of network of cases triggered by the initial infected laboratory worker(undetected in this example; the initial warning is triggered by a secondary case in the laboratory), and probability of case detection at time ofintervention (Tw + Ti).
Merler et al. BMC Medicine 2013, 11:252 Page 5 of 11http://www.biomedcentral.com/1741-7015/11/252
Proportion of escape events that will trigger an outbreakIn order to set a baseline for our investigation it is worthstressing that there is a certain probability that the epi-demic goes extinct without any intervention. In general,it is very difficult to estimate this probability, as it de-pends, beyond other factors, on seeding location (for ex-ample, urban vs rural) and contact network of the initialcase. In our simulations, all these factors did not varymuch as we simulated the initial epidemic seeding tooccur always in a BSL facility in a populated area, thusdrastically reducing the uncertainty of estimates. Theprobability of observing an epidemic outbreak in the ab-sence of any interventions (no intervention scenario) is
Figure 4 Reference scenario. (A) Probability of outbreak for different valuepidemics) and reference scenario. (B) Probability of undetected epidemicsreference scenario with different values of Pc. (C) Upper panel: overall numand R0 = 1.5 (not considering autoextinct epidemics). Middle panel: as upppanel but for the number of isolated individuals (including the laboratory’seach parameter set to produce the results shown.
shown in Figure 4A, and it increases from about 25% forR0 = 1.1 to values larger than 80% if R0 >2.
Proportion of undetected escape eventsNotably, model simulations suggest that there is a non-negligible probability that the escape event is not de-tected at all. This may happen when no initial casesare detected among laboratory workers and laboratoryworkers’ household members, but secondary cases aregenerated through random contacts in the general popula-tion. In this case it is reasonable to assume that it is verydifficult to ascertain the accidental release of a PPPfrom the BSL facility and to put in place timely control
es of R0 by assuming no intervention scenario (uncontrolledfor different values of R0 by assuming reference scenario (in red) andber of cases in contained outbreaks by assuming reference scenarioer panel but for the number of traced cases. Lower panel: as uppercontact network). A total of 1,000 simulations were undertaken for
Merler et al. BMC Medicine 2013, 11:252 Page 6 of 11http://www.biomedcentral.com/1741-7015/11/252
measures. As shown in Figure 4B, the probability of un-detected epidemics increases with R0 and it is strongly in-fluenced by the probability of detecting cases. If R0 >1.5, itmay be as high as 5% when Pc = 60% and 15% whenPc = 40%. In general, the probability of case detectionaffects the outcome of intervention options. As we note,to a large extent the detection probability depends on therate of asymptomatic cases and non-detectable transmis-sions. In the case of accidental release, the situation iseven worse because the probability of detecting casesaffects the probability of the timely implementation ofthe control and containment interventions. As shownin Additional file 1, this probability decreases and even-tually vanishes when the number of initial cases is largerthan 1.
Controllability of the escape eventBy assuming reference values for the parameters regula-ting the containment plan, the probability of observingan epidemic outbreak is drastically reduced for all valuesof R0. In particular, containment is likely to succeed forvalues of R0 below 1.5 (probability of outbreak less than10%, see Figure 4A). The SSO set indicates that for thosevalues of R0 the probability of outbreak is largely due tothe probability of not detecting the outbreak itself; whenthe accidental release of the PPP agent is detected in atimely manner, outbreaks are contained with probabilityclose to 100%. The resources required to contain epi-demic outbreaks with reference intervention may vary
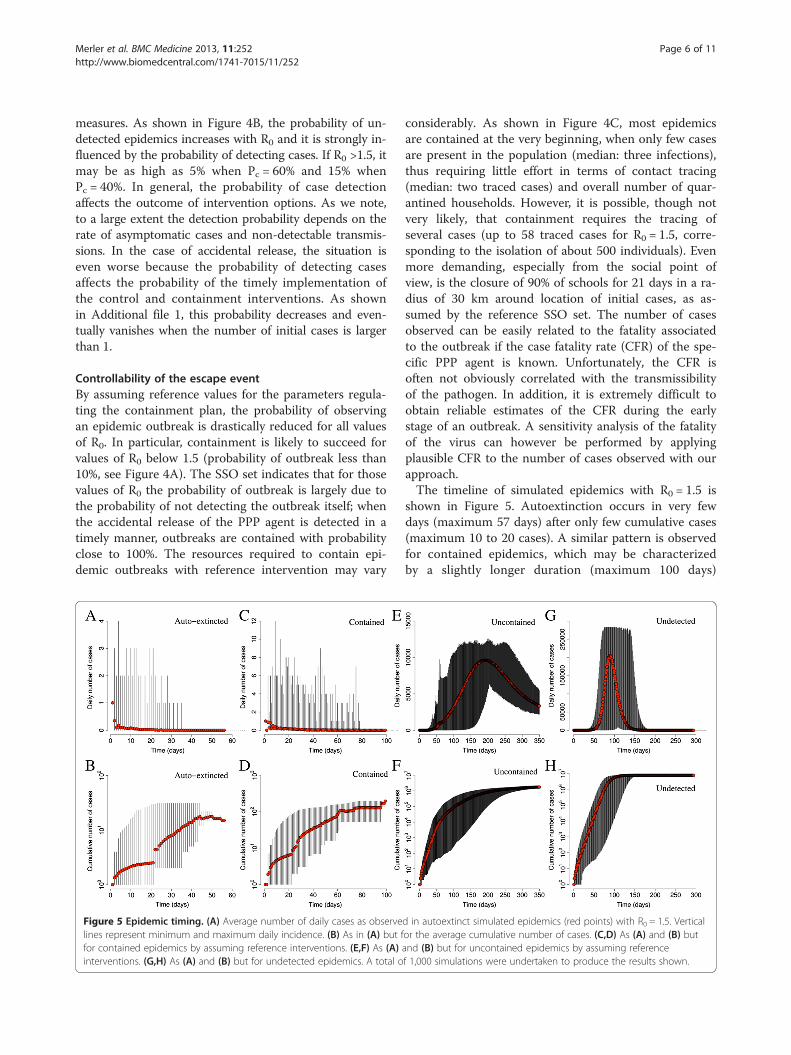
Figure 5 Epidemic timing. (A) Average number of daily cases as observelines represent minimum and maximum daily incidence. (B) As in (A) but ffor contained epidemics by assuming reference interventions. (E,F) As (A)interventions. (G,H) As (A) and (B) but for undetected epidemics. A total o
considerably. As shown in Figure 4C, most epidemicsare contained at the very beginning, when only few casesare present in the population (median: three infections),thus requiring little effort in terms of contact tracing(median: two traced cases) and overall number of quar-antined households. However, it is possible, though notvery likely, that containment requires the tracing ofseveral cases (up to 58 traced cases for R0 = 1.5, corre-sponding to the isolation of about 500 individuals). Evenmore demanding, especially from the social point ofview, is the closure of 90% of schools for 21 days in a ra-dius of 30 km around location of initial cases, as as-sumed by the reference SSO set. The number of casesobserved can be easily related to the fatality associatedto the outbreak if the case fatality rate (CFR) of the spe-cific PPP agent is known. Unfortunately, the CFR isoften not obviously correlated with the transmissibilityof the pathogen. In addition, it is extremely difficult toobtain reliable estimates of the CFR during the earlystage of an outbreak. A sensitivity analysis of the fatalityof the virus can however be performed by applyingplausible CFR to the number of cases observed with ourapproach.The timeline of simulated epidemics with R0 = 1.5 is
shown in Figure 5. Autoextinction occurs in very fewdays (maximum 57 days) after only few cumulative cases(maximum 10 to 20 cases). A similar pattern is observedfor contained epidemics, which may be characterizedby a slightly longer duration (maximum 100 days)
d in autoextinct simulated epidemics (red points) with R0 = 1.5. Verticalor the average cumulative number of cases. (C,D) As (A) and (B) butand (B) but for uncontained epidemics by assuming referencef 1,000 simulations were undertaken to produce the results shown.
Merler et al. BMC Medicine 2013, 11:252 Page 7 of 11http://www.biomedcentral.com/1741-7015/11/252
and slightly larger number of cases (maximum 100 to200). In both cases, incidence is always less than 20 dailycases. Uncontained epidemics result in long-lasting epi-demics (more than 1 year) and produce a large number ofcases in a short period of time (larger than 10,000 in5 months; peak incidence between 10,000 and 15,000 dailycases). Undetected epidemics are shorter (less than 1 year)but are characterized by a much larger number of cases(overall attack rate: 49.5% on average) and peak incidence(between 200,000 and 300,000 daily cases). In addition,these results show the mitigation efficacy of the proposedinterventions (specifically household quarantine and react-ive school closure on the basis of contact tracing proce-dures). Moreover, as only 2 different patterns may occur(either the disease quickly dies out after a very limitednumber of cases or it results in an epidemic outbreak,with many cases in the very first days), these results justifyour definition of contained epidemic (disease eliminationin less than 5 months and less than 1,000 cumulativecases), though many others are of course equivalent.
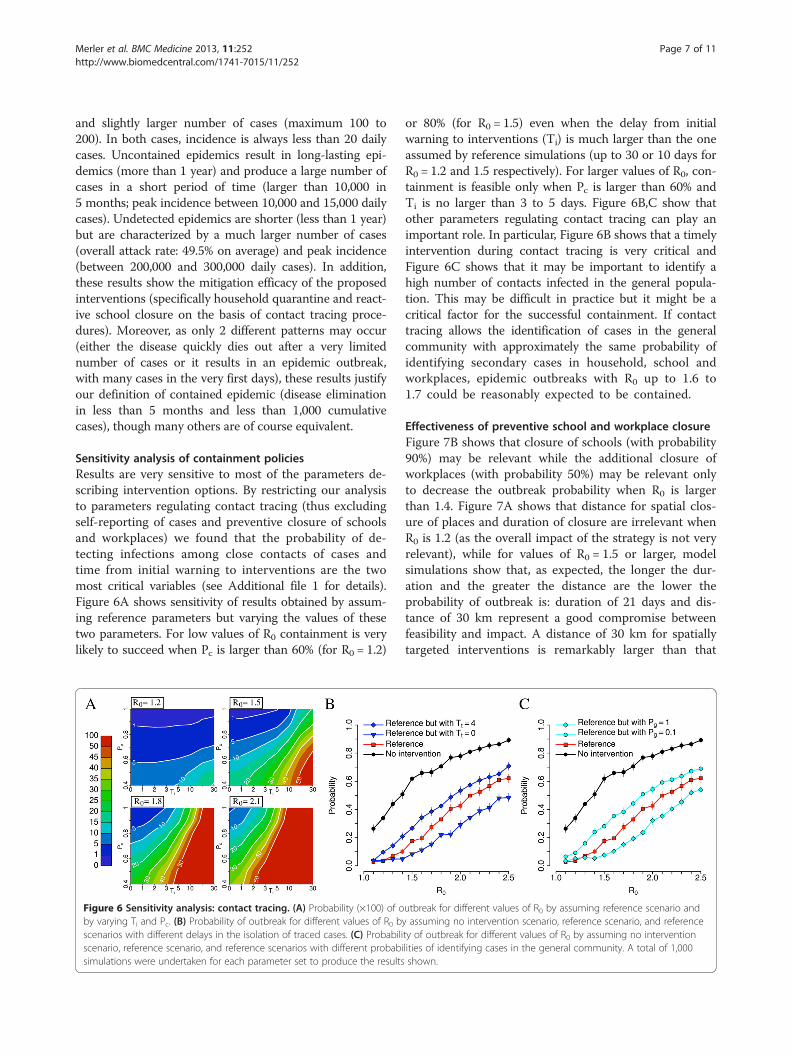
Sensitivity analysis of containment policiesResults are very sensitive to most of the parameters de-scribing intervention options. By restricting our analysisto parameters regulating contact tracing (thus excludingself-reporting of cases and preventive closure of schoolsand workplaces) we found that the probability of de-tecting infections among close contacts of cases andtime from initial warning to interventions are the twomost critical variables (see Additional file 1 for details).Figure 6A shows sensitivity of results obtained by assum-ing reference parameters but varying the values of thesetwo parameters. For low values of R0 containment is verylikely to succeed when Pc is larger than 60% (for R0 = 1.2)
Figure 6 Sensitivity analysis: contact tracing. (A) Probability (×100) of oby varying Ti and Pc. (B) Probability of outbreak for different values of R0 bscenarios with different delays in the isolation of traced cases. (C) Probabiliscenario, reference scenario, and reference scenarios with different probabisimulations were undertaken for each parameter set to produce the results
or 80% (for R0 = 1.5) even when the delay from initialwarning to interventions (Ti) is much larger than the oneassumed by reference simulations (up to 30 or 10 days forR0 = 1.2 and 1.5 respectively). For larger values of R0, con-tainment is feasible only when Pc is larger than 60% andTi is no larger than 3 to 5 days. Figure 6B,C show thatother parameters regulating contact tracing can play animportant role. In particular, Figure 6B shows that a timelyintervention during contact tracing is very critical andFigure 6C shows that it may be important to identify ahigh number of contacts infected in the general popula-tion. This may be difficult in practice but it might be acritical factor for the successful containment. If contacttracing allows the identification of cases in the generalcommunity with approximately the same probability ofidentifying secondary cases in household, school andworkplaces, epidemic outbreaks with R0 up to 1.6 to1.7 could be reasonably expected to be contained.
Effectiveness of preventive school and workplace closureFigure 7B shows that closure of schools (with probability90%) may be relevant while the additional closure ofworkplaces (with probability 50%) may be relevant onlyto decrease the outbreak probability when R0 is largerthan 1.4. Figure 7A shows that distance for spatial clos-ure of places and duration of closure are irrelevant whenR0 is 1.2 (as the overall impact of the strategy is not veryrelevant), while for values of R0 = 1.5 or larger, modelsimulations show that, as expected, the longer the dur-ation and the greater the distance are the lower theprobability of outbreak is: duration of 21 days and dis-tance of 30 km represent a good compromise betweenfeasibility and impact. A distance of 30 km for spatiallytargeted interventions is remarkably larger than that
utbreak for different values of R0 by assuming reference scenario andy assuming no intervention scenario, reference scenario, and referencety of outbreak for different values of R0 by assuming no interventionlities of identifying cases in the general community. A total of 1,000shown.
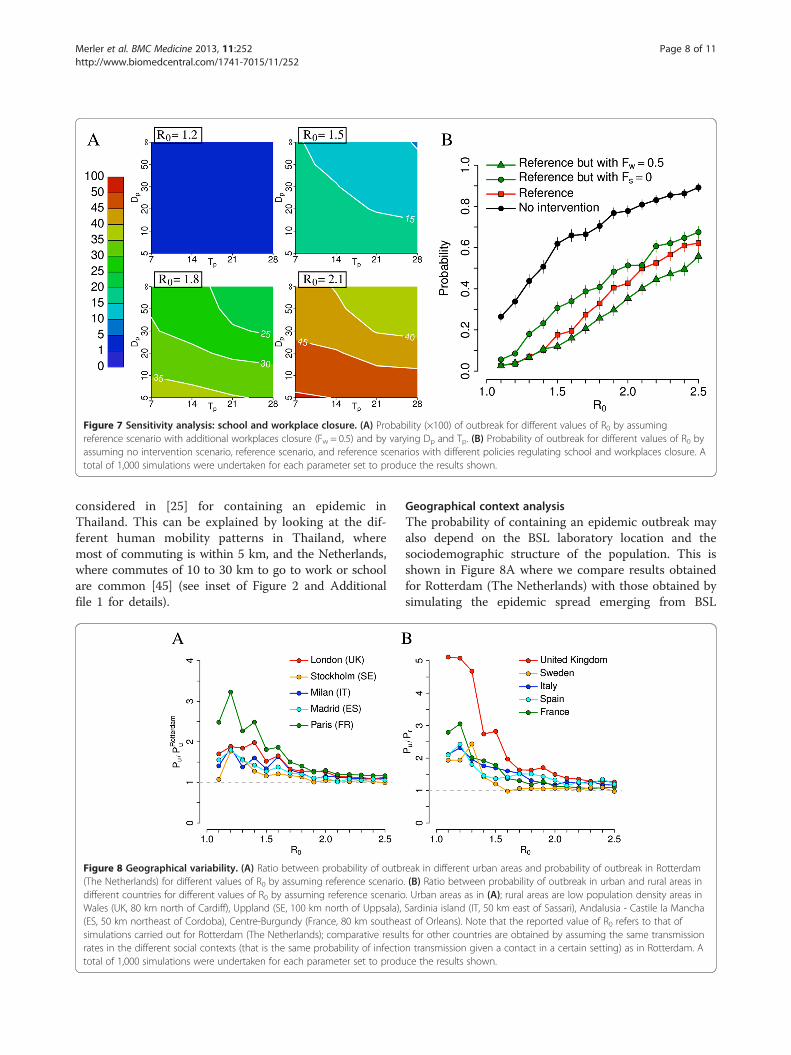
Figure 7 Sensitivity analysis: school and workplace closure. (A) Probability (×100) of outbreak for different values of R0 by assumingreference scenario with additional workplaces closure (Fw = 0.5) and by varying Dp and Tp. (B) Probability of outbreak for different values of R0 byassuming no intervention scenario, reference scenario, and reference scenarios with different policies regulating school and workplaces closure. Atotal of 1,000 simulations were undertaken for each parameter set to produce the results shown.
Merler et al. BMC Medicine 2013, 11:252 Page 8 of 11http://www.biomedcentral.com/1741-7015/11/252
considered in [25] for containing an epidemic inThailand. This can be explained by looking at the dif-ferent human mobility patterns in Thailand, wheremost of commuting is within 5 km, and the Netherlands,where commutes of 10 to 30 km to go to work or schoolare common [45] (see inset of Figure 2 and Additionalfile 1 for details).
Figure 8 Geographical variability. (A) Ratio between probability of outb(The Netherlands) for different values of R0 by assuming reference scenariodifferent countries for different values of R0 by assuming reference scenarioWales (UK, 80 km north of Cardiff), Uppland (SE, 100 km north of Uppsala),(ES, 50 km northeast of Cordoba), Centre-Burgundy (France, 80 km southeasimulations carried out for Rotterdam (The Netherlands); comparative resulrates in the different social contexts (that is the same probability of infectiototal of 1,000 simulations were undertaken for each parameter set to produ
Geographical context analysisThe probability of containing an epidemic outbreak mayalso depend on the BSL laboratory location and thesociodemographic structure of the population. This isshown in Figure 8A where we compare results obtainedfor Rotterdam (The Netherlands) with those obtained bysimulating the epidemic spread emerging from BSL
reak in different urban areas and probability of outbreak in Rotterdam. (B) Ratio between probability of outbreak in urban and rural areas in. Urban areas as in (A); rural areas are low population density areas inSardinia island (IT, 50 km east of Sassari), Andalusia - Castile la Manchast of Orleans). Note that the reported value of R0 refers to that ofts for other countries are obtained by assuming the same transmissionn transmission given a contact in a certain setting) as in Rotterdam. Ace the results shown.
Merler et al. BMC Medicine 2013, 11:252 Page 9 of 11http://www.biomedcentral.com/1741-7015/11/252
facilities in other urban areas of Europe. We found thatRotterdam likely represents the best case scenario amongthose analyzed in this paper: for instance, the probabilityof observing an epidemic outbreak in Paris, by assumingreference interventions, may be 200% to 300% larger thanthat estimated for the Netherlands if R0 <1.5. Differencesreduce drastically for larger values of R0. Without consi-dering control measures, the probability of observing anepidemic outbreak after virus escape is quite similar tothat in the Dutch scenario: slight differences can be ob-served for low values of R0. Such large differences may bedue to dissimilarities in sociodemographic characteristicsof French and Dutch populations because, despite ageneral similarity, some marked country-specific featuressuch as age structure and average household size exist.However, although quantitatively different, the generalpatterns obtained by varying Pc and Ti are the sameobserved in the Dutch case. Detailed results for Paris arediscussed in Additional file 1. We also found that theprobability of observing an epidemic outbreak when theBSL laboratory is located in a rural region is systematicallylower than that estimated for urban areas (see Figure 8B).For instance, given a BSL facility located in the UK, wefound that the probability of epidemic outbreak when thepathogen is accidentally released from a hypothetical BSLlaboratory in Wales (UK) may be three to five times lowerthan that estimated for a BSL laboratory in London ifR0 <1.5. These differences are ascribable to differencesin population density and sociodemographic structure,as discussed in [31]. These results are discussed indetail in Additional file 1.
Impact of additional interventionWe found that results are not very sensitive to the prob-ability of self-reporting (Pr) and to the initial set of inter-ventions on the initial network of contacts comprisinglaboratory workers and laboratory workers’ householdmembers. The reference scenario assumes the closure ofthe laboratory and the quarantine of the households oflaboratory workers. We explored the possibility of ex-tending these interventions and to preventively close allworkplaces and schools attended by relatives of labora-tory workers. We found that closing the laboratory isthe only intervention leading to a certain reduction ofthe outbreak probability. Additional interventions are oflittle impact. We report on these findings in Additionalfile 1.
ConclusionsOur results suggest that containment is likely to succeedby employing social distancing measures only if R0 is nolarger than 1.5. Containment could be feasible even forlarger values of R0 in cases of very timely interventionboth in recognizing the accidental release and during
contact tracing and high probability of detecting secon-dary cases in the same household, school or workplaceas a newly identified case. Overall, these results suggestthat success in containing an accidentally released po-tentially pandemic influenza virus by employing socialdistancing measures only is uncertain: containment pro-bability for a virus with transmissibility comparable tomany of the estimates for the 2009 H1N1 virus (namelyR0 or effective transmissibility in the range 1.2 to 1.6[19-24]) is reassuring, even though containment is notguaranteed. Should the transmissibility of the pathogenbe comparable to that of the 1918 Spanish influenza(R0 = 1.8 or higher [25]), containment success would beseriously compromised. A further relevant finding is thestrong impact of the BSL laboratory location. Rural areashave a fivefold increase in containment probability withrespect to densely populated urban areas. Similarly, weobserve differences according to the sociodemographicstructure of the geographical region. These results pro-vide data with potential use in defining policies for de-ciding the most appropriate location of BSL laboratories.Our simulations do not account for the possible use of
pharmaceutical interventions. While the availability ofan effective vaccine is highly questionable in case ofaccidental release of genetically manipulated influenzaviruses from BSL facilities, the use of antivirals at thevery beginning of the epidemic is an option that couldbe considered. If used for treatment of cases and pro-phylaxis of close contacts (for example, household andschool contacts) only, however, the benefit should not bevery different from that obtained by assuming householdquarantine and reactive school closure, as this paperdoes. Moreover, it requires a timely administration(within 2 days from symptoms onset [25,46-50]) to beeffective. Geographical targeting of a large fraction ofthe population is a completely different option thatcould be considered: on the one hand it could lead todrastically increasing the probability of containmentbut on the other hand also poses serious logisticalchallenges [25,47].The preventive immunization of laboratory workers
(see for instance the Special Immunization Program inthe US [51]) is another option not considered in thiswork. Although for diseases for which a vaccine is avail-able this is a measure to take into account (for instance,the incidence of hepatitis B virus (HBV) infection amonglaboratory workers in the UK has significantly droppedbecause of the availability of immunization [52]), thismeasure is highly questionable for genetically modifiedinfluenza viruses, not to speak of influenza viruses forwhich no vaccine is currently available, for example,A(H7N9).In summary, our results suggest that public health
authorities should be prepared to put in place a set of
Merler et al. BMC Medicine 2013, 11:252 Page 10 of 11http://www.biomedcentral.com/1741-7015/11/252
social distancing interventions, for example, contact tra-cing and closure of schools and workplaces on a geo-graphical basis. Moreover, as it is nearly impossible toget accurate estimates of R0 (as well as case fatality rate)for a new virus at the very beginning of the outbreak, inorder to maximally reduce the risk of a global pandemicthe possibility of timely targeting a large fraction of thepopulation with antivirals (as a prophylactic measure ona geographical basis) or establishing quarantine areasshould not be set aside, even though this calls for the de-velopment of detailed intervention plans and requirespublic health agencies to put in place containment effortshardly achievable in most places in the world. Where thepandemic pathogens are concerned, short generation timeand asymptomaticity are among the most critical factorsthat make accidental release of influenza viruses difficultto contain.Qualitatively, the results do not vary much by consid-
ering different seeding locations. However, containmentprobabilities are affected by several factors, including po-pulation density and sociodemographic structure. Thesefindings may have an important impact on policies: ourresults strongly suggest the location of new BSL facilitiesworldwide should be carefully chosen, for instance withpriority given to rural areas and, when this is not fea-sible, by taking into account density and structure ofthe population in urban areas. This may make thedifference, especially for pathogens with low to mode-rate transmissibility. Of course, these decisions shouldalso be based on other factors not considered in thisstudy, for example, population vulnerability to infec-tious agents, risk factors, structure of the health sys-tem, possibility of putting in place a rapid responseprogram. Simulated scenarios emerging from detailedmodels such as the one presented here may informquantitatively the process of identifying locations thatminimize risk. Finally, it is worth remarking that thepresented approach can be generally extended to otherpathogens that can be classified as dual use research ofconcern if we have the appropriate information on thepathogens, mechanism of transmission and natural historyof the disease.
Additional file
Additional file 1: Supporting material. Model details, additional results.
Competing interestsThe authors declare they have no competing interests.
Authors’ contributionsSM and AV conceived of the study. SM, MA and LF performed theexperiments. SM, MA, LF and AV analyzed results and wrote the manuscript.All authors read and approved the final manuscript.
AcknowledgementsWe acknowledge support from the DTRA-1-0910039 and NSF CMMI-1125095awards to AV, the Italian Ministry of Education, University and Research grantPRIN 2009 2009RNH97Z 001 to LF. The views and conclusions contained inthis document are those of the authors and should not be interpreted asrepresenting the official policies, either expressed or implied, of the DefenseThreat Reduction Agency or the US Government.
Author details1Bruno Kessler Foundation, Trento, Italy. 2Department of Mathematics,University of Trento, Trento, Italy. 3Laboratory for the Modeling of Biologicaland Socio-technical Systems, Northeastern University, Boston 02115, MA,USA. 4Computational Epidemiology Laboratory, Institute for ScientificInterchange (ISI), Torino, Italy. 5Institute for Quantitative Social Sciences atHarvard University, Cambridge, MA 02138, USA.
Received: 10 July 2013 Accepted: 7 November 2013Published: 28 November 2013
References1. Alberts B: H5N1. Science 2012, 336:1521.2. Fauci AS, Collins FS: Benefits and risks of influenza research: lessons
learned. Science 2012, 336:1522–1523.3. Herfst S, Schrauwen EJA, Linster M, Chutinimitkul S, de Wit E, Munster VJ,
Sorrell EM, Bestebroer TM, Burke DF, Smith DJ, Rimmelzwaan GF,Osterhaus ADME, Fouchier RAM: Airborne transmission of influenzaA/H5N1 virus between ferrets. Science 2012, 336:1534–1541.
4. Imai M, Watanabe T, Hatta M, Das SC, Ozawa M, Shinya K, Zhong G,Hanson A, Katsura H, Watanabe S, Li C, Kawakami E, Yamada S, Kiso M,Suzuki Y, Maher EA, Neumann G, Kawaoka Y: Experimental adaptation ofan influenza H5 HA confers respiratory droplet transmission to areassortant H5HA/H1N1 virus in ferrets. Nature 2012, 486:420–428.
5. Federation of American Scientists: Biosafety level 4 Labs and BSLinformation. http://www.fas.org/programs/bio/biosafetylevels.html.
6. United States Government Accountability Office: High-containmentLaboratories National Strategy for Oversight Is Needed. Report to CongressionalRequesters. Washington, DC: United States Government AccountabilityOffice; 2009.
7. Henkel RD, Miller T, Weyant RS: Monitoring select agent theft, loss andrelease reports in the United States - 2004–2010. Appl Biosaf 2012,17:171–180.
8. Belgian Biosafety Server: Laboratory-acquired infections: references.http://www.biosafety.be/CU/LAI/Recent_LAI.html.
9. Lipsitch M, Plotkin JB, Simonsen L, Bloom B: Evolution, safety, and highlypathogenic influenza viruses. Science 2012, 336:1529–1531.
10. Lipsitch M, Bloom BR: Rethinking biosafety in research on potentialpandemic pathogens. MBio 2012, 3:e0036012.
11. Klotz LC, Sylvester EJ: The unacceptable risks of a man-made pandemic.http://www.thebulletin.org/unacceptable-risks-man-made-pandemic.
12. Ajelli M, Merler S: Transmission potential and design of adequate controlmeasures for Marburg hemorrhagic fever. PLoS One 2012, 7:e50948.
13. Chowell G, Hengartner NW, Castillo-Chavez C, Fenimore PW, Hyman JM:The basic reproductive number of Ebola and the effects of publichealth measures: the cases of Congo and Uganda. J Theor Biol 2004,229:119–126.
14. Lim PL, Kurup A, Gopalakrishna G, Chan KP, Wong CW, Ng LC, Se-Thoe SY,Oon L, Bai X, Stanton LW, Ruan Y, Miller LD, Vega VB, James L, Ooi PL, KaiCS, Olsen SJ, Ang B, Leo YS: Laboratory-acquired severe acute respiratorysyndrome. N Engl J Med 2004, 350:1740–1745.
15. Moran-Mendoza O, Marion SA, Elwood K, Patrick DM, FitzGerald JM:Tuberculin skin test size and risk of tuberculosis development:alarge population-based study in contacts. Int J Tubercul Lung Dis 2007,11:1014–1020.
16. Davidow AL, Mangura BT, Wolman MS, Bur S, Reves R, Thompson V, Ford J,Reichler MR: Workplace contact investigation in the United States. Int JTubercul Lung Dis 2003, 7:S446–S452.
17. Marks SM, Taylor Z, Qualls NL, Shrestha-Kuwahara RJ, Wilce MA, Nguyen CH:Outcomes of contact investigation of infectious tuberculosis patients.Am J Respir Crit Care Med 2000, 162:2033–2038.
18. Goddard NL: SARS update: additional cases being investigated in Beijing,China. Euro Surveill 2004, 8:pii=2454.
Merler et al. BMC Medicine 2013, 11:252 Page 11 of 11http://www.biomedcentral.com/1741-7015/11/252
19. Merler S, Ajelli M, Pugliese A, Ferguson NM: Determinants of thespatiotemporal dynamics of the 2009 H1N1 pandemic in Europe:implications for real-time modelling. PLoS Comput Biol 2011, 7:e1002205.
20. Eames KT, Tilston NL, Brooks-Pollock E, Edmunds WJ: Measured dynamicsocial contact patterns explain the spread of H1N1v influenza. PLoS ComputBiol 2012, 8:e1002425.
21. Poletti P, Ajelli M, Merler S: The effect of risk perception on the 2009H1N1 pandemic influenza dynamics. PLoS One 2011, 6:e16460.
22. Dorigatti I, Cauchemez S, Pugliese A, Ferguson NM: A new approach tocharacterising infectious disease transmission dynamics from sentinelsurveillance: application to the Italian 2009–2010 A/H1N1 influenzapandemic. Epidemics 2012, 4:9–21.
23. Fraser C, Donnelly CA, Cauchemez S, Hanage WP, Van Kerkhove MD,Hollingsworth TD, Griffin J, Baggaley RF, Jenkins HE, Lyons EJ, Jombart T,Hinsley WR, Grassly NC, Balloux F, Ghani AC, Ferguson NM, Rambaut A,Pybus OG, Lopez-Gatell H, Alpuche-Aranda CM, Chapela IB, Zavala EP,Guevara DM, Checchi F, Garcia E, Hugonnet S, Roth C, WHO RapidPandemic Assessment Collaboration: Pandemic potential of a strain ofinfluenza A (H1N1): early findings. Science 2009, 324:1557–1561.
24. Balcan D, Hu H, Goncalves B, Bajardi P, Poletto C, Ramasco JJ, Paolotti D,Perra N, Tizzoni M, den Broeck, Colizza V, Vespignani A: Seasonaltransmission potential and activity peaks of the new influenza A(H1N1):a Monte Carlo likelihood analysis based on human mobility. BMC Med2009, 7:45.
25. Ferguson NM, Cummings DAT, Cauchemez S, Fraser C, Riley S, Meeyai A,Iamsirithaworn S, Burke DS: Strategies for containing an emerginginfluenza pandemic in Southeast Asia. Nature 2005, 437:209–214.
26. Yang Y, Sugimoto JD, Halloran ME, Basta NE, Chao DL, Matrajt L, Potter G,Kenah E, Longini IM: The transmissibility and control of pandemicinfluenza A (H1N1) virus. Science 2009, 326:729–733.
27. White LF, Wallinga J, Finelli L, Reed C, Riley S, Lipsitch M, Pagano M:Estimation of the reproductive number and the serial interval in earlyphase of the 2009 influenza A/H1N1 pandemic in the USA. InfluenzaOther Respir Viruses 2009, 3:267–276.
28. Lessler J, Reich NG, Cummings DA: Outbreak of 2009 pandemic influenzaA (H1N1) at a New York City school. N Engl J Med 2009, 361:2628–2636.
29. Cowling BJ, Chan KH, Fang VJ, Lau LL, So HC, Fung RO, Ma ES, Kwong AS,Chan CW, Tsui WW, Ngai HY, Chu DW, Lee PW, Chiu MC, Leung GM,Peiris JS: Comparative epidemiology of pandemic and seasonal influenzaA in households. N Engl J Med 2010, 362:2175–2184.
30. Anderson RM, Fraser C, Ghani AC, Donnelly CA, Riley S, Ferguson NM,Leung GM, Lam TH, Hedley AJ: Epidemiology, transmission dynamics andcontrol of SARS: the 2002–2003 epidemic. Philos Trans R Soc Lon B Biol Sci2004, 359:1091–1105.
31. Merler S, Ajelli M: The role of population heterogeneity and human mobilityin the spread of pandemic influenza. Proc R Soc B 2010, 277:557–565.
32. Ajelli M, Goncalves B, Balcan D, Colizza V, Hu H, Ramasco JJ, Merler S,Vespignani A: Comparing large-scale computational approaches toepidemic modeling: agent-based versus structured metapopulationmodels. BMC Infect Dis 2010, 10:190.
33. Statistical Office of the European Commission (Eurostat): Database bythemes 2011. http://epp.eurostat.ec.europa.eu/portal/page/portal/statistics/search_database.
34. Ferguson NM, Cummings DAT, Fraser C, Cajka JC, Cooley PC, Burke DS:Strategies for mitigating an influenza pandemic. Nature 2006, 442:448–452.
35. Cauchemez S, Valleron AJ, Boëlle PY, Flahault A, Ferguson NM: Estimatingthe impact of school closure on influenza transmission from Sentineldata. Nature 2008, 452:750–754.
36. Halloran ME, Ferguson NM, Eubank S, Longini IM Jr, Cummings DA, Lewis B,Xu S, Fraser C, Vullikanti A, Germann TC, Wagener D, Beckman R, Kadau K,Barrett C, Macken CA, Burke DS, Cooley P: Modeling targeted layeredcontainment of an influenza pandemic in the United States. Proc NatlAcad Sci USA 2008, 105:4639–4644.
37. Chao DL, Halloran ME, Obenchain VJ, Longini IM: FluTE, a publicly availablestochastic influenza epidemic simulation model. PLoS Comput Biol 2010,6:e1000656.
38. Cauchemez S, Bhattarai A, Marchbanks TL, Fagan RP, Ostroff S, Ferguson NM,Swerdlow D: Pennsylvania H1N1 working group: Role of socialnetworks in shaping disease transmission during a communityoutbreak of 2009 H1N1 pandemic influenza. Proc Natl Acad Sci USA2011, 108:2825–2830.
39. Mills CE, Robins JM, Lipsitch M: Transmissibility of 1918 pandemicinfluenza. Nature 2004, 432:904–906.
40. Viboud C, Tam T, Fleming D, Handel A, Miller MA, Simonsen L:Transmissibility and mortality impact of epidemic and pandemicinfluenza, with emphasis on the unusually deadly 1951 epidemic.Vaccine 2006, 24:6701–6707.
41. Pourbohloul B, Ahued A, Davoudi B, Meza R, Meyers LA, Skowronski DM,Villaseñor I, Galván F, Cravioto P, Earn DJ, Dushoff J, Fisman D, Edmunds WJ,Hupert N, Scarpino SV, Trujillo J, Lutzow M, Morales J, Contreras A,Chávez C, Patrick DM, Brunham RC: Initial human transmission dynamicsof the pandemic (H1N1) 2009 virus in North America. Influenza OtherRespir Viruses 2009, 3:215–222.
42. Chowell G, Echevarria-Zuno S, Viboud C, Simonsen L, Tamerius J, Miller MA,Borja-Aburto VH: Characterizing the epidemiology of the 2009 influenzaA/H1N1 pandemic in Mexico. PLoS Med 2011, 8:e1000436.
43. Chao DL, Matrajt L, Basta NE, Sugimoto JD, Dean B, Bagwell DA, Oiulfstad B,Halloran ME, Longini IM: Planning for the control of pandemic influenza A(H1N1) in Los Angeles County and the United States. Am J Epidemiol2011, 173:1121–1130.
44. Tizzoni M, Bajardi P, Poletto C, Ramasco JJ, Balcan D, Gonçalves B, Perra N,Colizza V, Vespignani A: Real-time numerical forecast of global epidemicspreading: case study of 2009 A/H1N1pdm. BMC Med 2012, 10:165.
45. Balcan D, Colizza V, Gonçalves B, Hu H, Ramasco JJ, Vespignani A:Multiscale mobility networks and the spatial spreading of infectiousdiseases. Proc Natl Acad Sci USA 2009, 106:21484–21489.
46. Longini IM, Halloran ME, Nizam A, Yang Y: Containing pandemic influenzawith antiviral agents. Am J Epidemiol 2004, 159:623–633.
47. Longini IM, Nizam A, Xu S, Ungchusak K, Hanshaoworakul W, CummingsDAT, Halloran ME: Containing pandemic influenza at the source. Science2005, 309:1083–1087.
48. Ciofi degli Atti ML, Merler S, Rizzo C, Ajelli M, Massari M, Manfredi P,Furlanello C, Scalia Tomba G, Iannelli M: Mitigation measures for pandemicinfluenza in Italy: an individual based model considering differentscenarios. PLoS One 2008, 3:e1790.
49. Merler S, Ajelli M, Rizzo C: Age-prioritized use of antivirals during aninfluenza pandemic. BMC Infect Dis 2009, 9:117.
50. Black AJ, House T, Keeling M, Ross J: Epidemiological consequences ofhousehold-based antiviral prophylaxis for pandemic influenza. J R SocInterface 2013, 10:20121019.
51. National Research Council: Protecting the Frontline in Biodefense Research:The Special Immunizations Program. Washington, DC: The NationalAcademies Press; 2011.
52. Weinstein R, Singh K: Laboratory-acquired infections. Clin Infect Dis 2009,49:142–147.
doi:10.1186/1741-7015-11-252Cite this article as: Merler et al.: Containing the accidental laboratoryescape of potential pandemic influenza viruses. BMC Medicine2013 11:252.
Submit your next manuscript to BioMed Centraland take full advantage of:
• Convenient online submission
• Thorough peer review
• No space constraints or color figure charges
• Immediate publication on acceptance
• Inclusion in PubMed, CAS, Scopus and Google Scholar
• Research which is freely available for redistribution
Submit your manuscript at www.biomedcentral.com/submit